UNITED STATES SECURITIES AND EXCHANGE COMMISSION
Washington, D.C. 20549
FORM N-CSR
CERTIFIED SHAREHOLDER REPORT OF REGISTERED MANAGEMENT
INVESTMENT COMPANIES
INVESTMENT COMPANIES
Investment Company Act file number: 811-06324
Exact name of registrant as specified in charter:
Delaware Group® Global & International Funds
Delaware Group® Global & International Funds
Address of principal executive offices:
2005 Market Street
Philadelphia, PA 19103
2005 Market Street
Philadelphia, PA 19103
Name and address of agent for service:
David F. Connor, Esq.
2005 Market Street
Philadelphia, PA 19103
David F. Connor, Esq.
2005 Market Street
Philadelphia, PA 19103
Registrant’s telephone number, including area code: (800) 523-1918
Date of fiscal year end: November 30
Date of reporting period: November 30, 2010
Item 1. Reports to Stockholders

Annual report Delaware International Value Equity Fund Delaware Emerging Markets Fund Delaware Global Value Fund November 30, 2010 International equity mutual funds |
This annual report is for the information of Delaware International Value Equity Fund, Delaware Emerging Markets Fund, and Delaware Global Value Fund shareholders, but it may be used with prospective investors when preceded or accompanied by a current prospectus for Delaware International Value Equity Fund, Delaware Emerging Markets Fund, and Delaware Global Value Fund. The figures in the annual report for Delaware International Value Equity Fund, Delaware Emerging Markets Fund, and Delaware Global Value Fund represent past results, which are not a guarantee of future results. The return and principal value of an investment in a Fund will fluctuate so that shares, when redeemed, may be worth more or less than their original cost. Current performance may be higher or lower than the performance data quoted. You should consider the investment objectives, risks, charges, and expenses of the Funds carefully before investing. The Delaware International Value Equity Fund, Delaware Emerging Markets Fund, and Delaware Global Value Fund prospectus contains this and other important information about the Funds. Prospectuses for all open-end funds in the Delaware Investments® Family of Funds are available from your financial advisor, online at www.delawareinvestments.com, or by phone at 800 523-1918. Please read the prospectus carefully before you invest or send money. |
You can obtain shareholder reports and prospectuses online instead of in the mail. Visit www.delawareinvestments.com/edelivery. |
Experience Delaware Investments
Delaware Investments is committed to the pursuit of consistently superior asset management and unparalleled client service. We believe in our investment processes, which seek to deliver consistent results, and in convenient services that help add value for our clients.
If you are interested in learning more about creating an investment plan, contact your financial advisor.
You can learn more about Delaware Investments or obtain a prospectus for Delaware International Funds at www.delawareinvestments.com.
| Manage your investments online |
|
Delaware Management Holdings, Inc., and its subsidiaries (collectively known by the marketing name of Delaware Investments) are wholly owned subsidiaries of Macquarie Group Limited, a global provider of banking, financial, advisory, investment and funds management services.
Investments in Delaware International Value Equity Fund, Delaware Emerging Markets Fund, and Delaware Global Value Fund are not and will not be deposits with or liabilities of Macquarie Bank Limited ABN 46 008 583 542 and its holding companies, including their subsidiaries or related companies (Macquarie Group), and are subject to investment risk, including possible delays in repayment and loss of income and capital invested. No Macquarie Group company guarantees or will guarantee the performance of the Funds, the repayment of capital from the Funds, or any particular rate of return.
Table of contents
| Portfolio management review | 1 |
| Performance summaries | 10 |
| Disclosure of Fund expenses | 20 |
| Country and sector allocations | 23 |
| Statements of net assets | 29 |
| Statements of operations | 50 |
| Statements of changes in net assets | 52 |
| Financial highlights | 58 |
| Notes to financial statements | 86 |
| Report of independent registered public accounting firm | 103 |
| Other Fund information | 104 |
| Board of trustees/directors and officers addendum | 106 |
| About the organization | 116 |
Unless otherwise noted, views expressed herein are current as of Nov. 30, 2010, and are subject to change.
Funds are not FDIC insured and are not guaranteed. It is possible to lose the principal amount invested.
Mutual fund advisory services provided by Delaware Management Company, a series of Delaware Management Business Trust, which is a registered investment advisor. Delaware Investments, a member of Macquarie Group, refers to Delaware Management Holdings, Inc. and its subsidiaries, including the Funds’ distributor, Delaware Distributors, L.P. Macquarie Group refers to Macquarie Group Limited and its subsidiaries and affiliates worldwide.
© 2011 Delaware Management Holdings, Inc.
All third-party trademarks cited are the property of their respective owners.
| Portfolio management review | |
| Delaware International Value Equity Fund | December 7, 2010 |
| Performance preview (for the year ended November 30, 2010) | |||||
| Delaware International Value Equity Fund (Class A shares) | 1-year return | + | 3.60% | ||
| MSCI EAFE Index (gross) | 1-year return | + | 1.55% | ||
| MSCI EAFE Index (net) | 1-year return | + | 1.11% | ||
Past performance does not guarantee future results. For complete, annualized performance for Delaware International Value Equity Fund, please see the table on page 10. The performance of Class A shares excludes the applicable sales charge and reflects the reinvestment of all distributions. Index performance returns do not reflect any management fees, transaction costs, or expenses. Indices are unmanaged and one cannot invest directly in an index. |
Developed international equity markets were modestly stronger over the Fund’s fiscal year as many investors struggled to forecast the strength and durability of an unusually tepid and uneven global economic recovery. General market strength coupled with relatively high volatility in much of Asia (including Japan) as well as in several European markets. Offsetting weakness was most apparent in the euro zone.
- Overall, the Fund’s fiscal year was a time of significant volatility as concerns about sovereign debt in Greece and other nations on the periphery of the euro zone triggered a steep selloff in the late spring and early summer. When the European Union and International Monetary Fund eventually came to Greece’s rescue, the bull market in equities resumed and subsequently accelerated after the U.S. Federal Reserve disclosed further plans to buy more Treasury debt.
- As the Fund’s fiscal year drew to a close, however, markets pulled back significantly as the euro zone coped with a reprise debt in Ireland. The potential for “contagion” — most notably in Portugal and Spain — sparked selling in late November 2010 and a return to the risk-averse mindset that characterized the earlier euro zone crisis. The ongoing liquidity and solvency problems in Europe were aftershocks of the 2008 – 09 global financial upheaval a nd represented a secular shift in excessive indebtedness from the private to the public sector. Around the same time that contagion was once again consuming investors’ attention, markets grew concerned about geopolitical unrest on the Korean peninsula and the potential for additional monetary tightening in China, where inflation had surpassed the government’s target range.
- Emerging market stocks rose sharply during the fiscal year on a rising tide of global liquidity. (Though the Fund invests primarily in developed markets, it held between 10% and 15% of its assets in emerging markets during the fiscal year.) Countries, companies, and currencies whose fortunes are closely tied to commodity prices were the prime beneficiaries of easy money policies world-wide amid robust demand for basic materials and precious metals, especially from China and India. The value of dollar-denominated commodities such as copper and gold also were boosted by apparent attempts by the Federal Reserve to weaken the U.S. dollar and thus “reflate” the U.S. economy.
1
Portfolio management review
Delaware International Value Equity Fund
Delaware International Value Equity Fund
Performance
Although the Fund’s relative performance benefited from certain sector allocations, including an underweight to financial companies and corresponding overweight positions in technology, industrial, and consumer discretionary stocks, individual security selection was the main source of the Fund’s outperformance during the period.
For example, the Fund benefited from its holding in Tomkins Plc., a U.K.-based engineering group that was bought in July for $4.4 billion by Canada’s largest private equity firm along with the Canadian Pension Plan Investment Board. Autoliv, a Swedish manufacturer of airbags and other automotive safety systems, also contributed to the Fund’s relative performance. The company enjoys a position in its industry that we consider to be dominant. It has outsized profit margins and a global revenue base. In addition, the Fund’s holdings in Bayerische Motoren Werke (BMW) did well, as the company benefited from the phasing out of European government support for lower-end automobiles, the timing of its new-model rollout, and the emergence of China as fast-growing consumer of high-end automobiles. As of this writing, we continue to hold Autoliv and BMW in the Fund, albeit at reduced levels.
Meanwhile, the Fund’s holdings in Toyota detracted from performance. Toyota’s competitive position was weakened by the strong yen at the same time that its sales were undercut by the well-publicized recall of several models due to sticking accelerator pedals. Though the Toyota brand has been tarnished, we continue to hold shares in the Fund because we believe the company has a strong competitive position and long-term earnings potential.
The French-domiciled cement manufacturer Lafarge also detracted from performance due to weak demand in North America and Europe, and rising competitive pressures in key Middle East and African markets. As one of the three largest players in the global cement industry, we continue to view Lafarge shares favorably, especially given the company’s pricing flexibility and management’s expertise in managing assets. Finally, the Italy-based defense contractor Finmeccanica detracted from Fund performance as well. Finmeccanica underperformed despite what we considered a healthy new-order book an d solid margins. We believe the company’s stock is being restrained by widespread investor skepticism over the latent impact of the euro zone’s sovereign debt crisis on future government spending.
Outlook
We believe that global economic growth rates in the early stages of the new expansion could lag previous recoveries. Unlike the typical business cycle, in which overinvestment leads to inflationary pressure, monetary tightening, and subsequent falloff in demand and compression of profits, the most recent downturn was essentially driven by credit. The expansion of financial leverage that fueled economic activity during much of the last 10 years, in our view, is unlikely to be repeated in the near term. While the magnitude and duration of the deleveraging process now under way is impossible to know, the inevitable unwinding of high government and household debt levels could remain a headwind on economic activity during the foreseeable future, especially in developed markets.
2
At the same time, and in sharp contrast to the 1990s, a number of emerging markets have worked to put their economic houses in sound working order. Demographic trends also are significantly more favorable in emerging markets than in their richer counterparts. Of course, those governments must deal with issues related to the unbalanced nature of global growth, which manifests itself in rapid inflows of money seeking higher returns in a low-yield world. Still, we value the higher level of corporate governance and transparency typically found in developed countries. We are therefore attracted to companies domiciled in developed countries that maintain significant market presence in the emerging world.
It is also important to note that below-trend economic growth in the United States, Europe, and Japan does not necessarily translate into unfavorable equity market conditions or poor corporate performance.
To that end earnings to us generally reflected that many international companies have performed well in recent quarters despite soggy economic conditions. Guided by painful memories of overinvestment during the dot-com mania of the mid- to late-1990s, many companies were more circumspect during the 2001–2007 expansion, choosing to conserve cash and minimize leverage. In general, this led to balance sheets that we considered to be in unusually pristine condition coming out of the financial crisis of 2008.
We believe the disconnect between weak macroeconomic conditions and strong corporate performance may be a fertile environment for the Fund’s bottom-up focus on individual company characteristics. As always, we continue to seek businesses that we believe generate high levels of free cash flow, are positioned to grow their earnings by expanding market share, and enjoy sufficient geographic diversity to exploit the world’s stronger secular growth trends where they exist.
3
| Portfolio management review | |
| Delaware Emerging Markets Fund | December 7, 2010 |
| Performance preview (for the year ended November 30, 2010) | |||||
| Delaware Emerging Markets Fund (Class A shares) | 1-year return | + | 15.42% | ||
| MSCI Emerging Markets Index (gross) | 1-year return | + | 15.65% | ||
| MSCI Emerging Markets Index (net) | 1-year return | + | 15.34% | ||
| Past performance does not guarantee future results. For complete, annualized performance for Delaware Emerging Markets Fund, please see the table on page 13. The performance of Class A shares excludes the applicable sales charge and reflects the reinvestment of all distributions. Index performance returns do not reflect any management fees, transaction costs, or expenses. Indices are unmanaged and one cannot invest directly in an index. |
Continuing a pattern of relative outperformance that began as world stock markets bottomed in March 2009, emerging equity markets soundly beat their developed-economy counterparts during the Fund’s fiscal year. The emerging market asset class benefited from rising commodity prices, abundant liquidity, historically low interest rates, a moderately weak dollar, large fund inflows, and a global economic recovery. Equity markets in Indonesia, Thailand, Malaysia, Argentina, Chile, Columbia, and Mexico were especially strong, while Chinese stocks were pressured by the government’s stop-and-start attempts to rein in a credit boom that continues to affect the real estate sector.
The MSCI Emerging Market Index soared between mid-May, when the Greek sovereign debt crisis was resolved, and early November, when a similar crisis flared in Ireland. During this period, the U.S. Federal Reserve announced plans to fend off deflation and potentially boost the pace of U.S. economic growth — by extension, bolstering the global economy — with a second round of quantitative easing, or buying of Treasury debt. Acting as leveraged plays on global growth, emerging markets responded with a robust rally. Prices corrected in November 2010, however, as a new sovereign debt crisis arose in the euro zone and Chinese inflation exceeded government targets. Investors also were unnerved by a North Korean artillery attack on a South Korean island.
Besides the traditionally “high-beta” nature of emerging markets (that is, their relatively higher volatility), which is generally a positive quality in a global bull market, there were three key factors for strong performance:
- Although emerging market stocks characteristically retained their elevated level of volatility, the group benefited from below-average levels of fiscal distress and above-average levels of economic growth relative to the developed world. In sharp contrast to the 1990s, when developed nations nursed several key emerging economies back to health following currency and fiscal crisis, emerging markets have functioned as the world’s economic lifeboat in the aftermath of the global financial crisis of 2008–2009.
- With relatively low levels of government and household debt, developing economies did not face the headwind of private and public sector deleveraging that continues to restrain growth and employment in the United States, Europe, and Japan. Banks in emerging markets also escaped the financial crisis in relatively pristine condition because the housing bubble — with the notable
4
exception of China — was mainly a developed-market phenomenon.
- Growth was particularly strong in China, India, and other developing economies in Asia. However, Chinese officials continued grappling with the consequences of unbalanced global economic activity, including rising domestic inflation and repeated calls from the U.S. that China allow its currency, the renminbi, to appreciate at a faster rate.
Performance
On an individual security level, the Malaysia-based property developer UEM Land Holdings contributed to the Fund’s relative performance. We believe the company’s key asset — a land bank in the Ishkandar Development Region of southern Johor — has good growth potential given its close proximity to land-strapped Singapore. The Malaysian and Singaporean governments formally pledged to cooperate in developing the region, and further progress has been made since that agreement was signed. Sise Cam, a Turkish conglomerate with operations in the flat glass and glass packaging sectors, was also a strong contributor to the Fund’s returns. The company has benefitted from the strong rebound in economic growth in Turkey due to its exposure to that country’s construction, auto manufacturing, and consumer sectors.
Conversely, the Fund’s holdings in Shanda Games detracted from performance after the company gave weak earnings guidance early in the Fund’s fiscal year. A provider and operator of online games, the subdued near-term outlook was caused in part by rising costs associated with the introduction of new features and enhancements to existing products and to a decline in per-user revenue. We remain optimistic about the company’s longer-term prospects, however, and used periods of weakness to add to the Fund’s holdings at what we viewed as favorable prices.
Cemex, the Mexico-based global cement company, performed poorly during the fiscal year largely due to the slower-than-expected economic recovery in key markets, particularly the U.S., as well as continued investor concerns about its high balance sheet leverage. The Fund’s holdings in China Unicom also lagged overall performance as many investors appeared to take a wait-and-see attitude toward the mobile telephone sector’s ongoing transition to new technologies.
Outlook
While we believe emerging markets are likely to retain their historically elevated level of volatility compared with stocks in developed nations, we also believe that the convergence of several secular trends has the potential to support prices going forward. In particular, the gradual evolution of large middle classes seems likely to have highly positive implications for economic growth, and for companies that benefit from increased consumer spending. In addition, we believe increased global trade should generally help most emerging markets, many of which retain significant competitive advantages over their higher-cost rivals in developed economies. We also expect further progress toward financial transparency, which could bolster investor confidence in the asset class. Finally, it appears to us that governments in most developing nations have learned from their past mistakes and are determined to keep their financial houses in sound work ing order.
5
Portfolio management review
Delaware Emerging Markets Fund
Delaware Emerging Markets Fund
Naturally, there are concerns as well. The powerful rally in emerging market stocks over the last 18 months has pushed overall valuations to levels above those found in developed markets. Although we believe emerging markets stocks are still not prohibitively expensive, they are no longer inexpensive. In addition, several countries — most notably China — face difficult choices in dealing with economic overheating and the rapid inflows of money seeking higher yields. Despite having made enormous progress in creating more flexible financial systems, defusing these troublesome issues will probably not be easy, especially given the likelihood of continued imbalances in the pace of economic growth between developed and emerging economies. Finally, tepid demand in rich countries, coupled with rising currencies in developing markets, could restrain export growth over the near term.
Despite these concerns, we believe the longer-term outlook appears favorable, both on a macroeconomic level and for individual companies (which we believe is especially important, given our bottom-up approach to stock selection). We remain committed to seeking high-quality business franchises with above-average growth potential whose shares trade at meaningful discounts to our estimates of their intrinsic value.
6
| Delaware Global Value Fund | December 7, 2010 |
| Performance preview (for the year ended November 30, 2010) | |||||
| Delaware Global Value Fund (Class A shares) | 1-year return | + | 4.53% | ||
| MSCI World Index (gross) | 1-year return | + | 6.52% | ||
| MSCI World Index (net) | 1-year return | + | 5.98% | ||
| Past performance does not guarantee future results. For complete, annualized performance for Delaware Global Value Fund, please see the table on page 16. The performance of Class A shares excludes the applicable sales charge and reflects the reinvestment of all distributions. Index performance returns do not reflect any management fees, transaction costs, or expenses. Indices are unmanaged and one cannot invest directly in an index. |
Global equity markets finished higher during the Fund’s fiscal year as solid returns in Asia, Canada, and the United Kingdom offset weakness in Italy, France, and Spain.
- Overall, the Fund’s fiscal year was a time of significant volatility as concerns about sovereign debt in Greece and other nations on the periphery of the euro zone triggered a steep selloff in the late spring and early summer. When the European Union and International Monetary Fund eventually came to Greece’s rescue, the bull market in equities resumed and subsequently accelerated after the U.S. Federal Reserve disclosed further plans to boost the American economy by buying Treasury debt.
- As the Fund’s fiscal year drew to a close, however, markets pulled back significantly as the euro zone coped with a reprise debt crisis in Ireland. The potential for contagion — most notably in Portugal and Spain — sparked selling in late November 2010 and a return to the risk-averse mindset that characterized the earlier euro zone crisis. The ongoing liquidity and solvency problems in Europe were aftershocks of the 2008–2009 global financial upheaval and represented a secular shift in excessive indebtedness from the private to the public sector. Around the same time that “contagion” was once again consuming investors’ attention, markets grew concerned about geopolitical unrest on the Korean peninsula and the potential for additional monetary tightening in China, where inflation had surpassed the government’s target range.
- Emerging market stocks rose sharply during the fiscal year on a rising tide of global liquidity. (Though the Fund invests primarily in developed markets, it held between 5% and 10% of its assets in emerging markets during the fiscal year.) Countries, companies, and currencies whose fortunes are closely tied to commodity prices were the prime beneficiaries of easy money policies world-wide amid robust demand for basic materials and precious metals, especially from China and India. The value of dollar- denominated commodities such as copper and gold also were boosted by apparent attempts by the Federal Reserve to weaken the U.S. dollar and thus “reflate” the U.S. economy.
Performance
As always, the Fund’s sector, industry, country, and region are a result of our focus on bottom-up stock picking, not top-down macroeconomic forecasting. Overall, sector allocation contributed to relative performance over the fiscal year, due to an overweight position in industrials and consumer
7
Portfolio management review
Delaware Global Value Fund
discretionary and an underweight position in financials. Although stock selection was strong in Canada and the U.K. it was offset by weaker stock selection in France, Italy and the United States. Country allocation was a net positive, especially in several Asian markets, while our overweight allocation to France detracted from Fund performance. In general, currency had a negative effect, due to the Fund’s overweight position in the euro and underweight exposure to the yen.
The Fund benefited from its holding in Tomkins Plc., a U.K.-based engineering group that was bought in July for $4.4 billion by Canada’s largest private equity firm along with the Canadian Pension Plan Investment Board. Autoliv, a Swedish manufacturer of airbags and other automotive safety systems, also contributed to the Fund’s relative performance. The company enjoys a dominant position in its industry, outsized profit margins, and a global revenue base. HTC benefited from faster-than-expected adoption of Android smartphon es in the market and from the arrival of the cell phone replacement cycle. The company has increased efforts to develop market awareness especially in the U.S., expand its scale of production, accelerate new product launches, and reduce costs and expenses.
ITG detracted from the Fund’s performance for the year. The company offers a broad range of security trading services for active institutional equity managers. We believe company management has handled the decrease in U.S. equity fund flows in 2010 well. Cost cutting and improved international operations have substantially reduced the impact from lower U.S. market volumes. In our view, ITG appears well positioned for a positive turn in U.S. fund flows with over 50% of the balance sheet in net cash.
UniCredit is one of the largest banking groups in Europe. Unicredit’s underperformance appears to have been due more to the lack of positive news than to specific, identifiable factors. We believe the stock suffered from an undeserved overreaction to the scare thrown into the European financial markets by Greece’s fiscal crisis during the period. Although UniCredit does not operate in Greece, it does have operations in other countries in Southeastern Europe (and Turkey). We believe Unicredit is diversified by both geography and product offerings. We continue to hold the bank in the Fund because we believe its process of capital strengthening is expected to be completed, its nonperforming loans have likely peaked, economic stabilization and growth opportunities are proceeding, and cost-cutting and efficiency measures are under way.
The French-domiciled cement manufacturer Lafarge also detracted from performance due to weak demand in North America and Europe, and rising competitive pressures in key Middle East and African markets. As one of the three largest players in the global cement industry, we continue to view LaFarge shares favorably, especially given the company’s pricing flexibility and management’s expertise in managing assets.
Outlook
We believe that global economic growth rates in the early stages of the new expansion could lag previous recoveries. Unlike the typical business cycle, in which overinvestment leads to inflationary pressure, monetary tightening, and subsequent falloff in demand and compression of profits, the most recent downturn was essentially driven by credit. The expansion of financial leverage that fueled economic activity during much of
8
the last 10 years, in our view, is unlikely to be repeated in the near term. While the magnitude and duration of the deleveraging process now under way is impossible to know, the inevitable unwinding of high government and household debt levels could remain a headwind on economic activity during the foreseeable future, especially in developed markets.
At the same time, and in sharp contrast to the 1990s, a number of emerging markets have worked to put their economic houses in sound working order. Demographic trends also are significantly more favorable in emerging markets than in their richer counterparts. Of course, those governments must deal with issues related to the unbalanced nature of global growth, which manifests itself in rapid inflows of money seeking higher returns in a low-yield world. Still, we value the higher level of corporate governance and transparency typically found in developed countries. We are therefore attracted to companies domiciled in developed countries that maintain significant market presence in the emerging world.
It is also important to note that below-trend economic growth in the United States, Europe, and Japan does not necessarily translate into unfavorable equity market conditions, or poor corporate performance. To that end, earnings to us generally reflected that many companies performed well despite soggy economic conditions. Guided by painful memories of overinvestment during the dot-com mania of the mid- to late- 1990s, many companies have been more circumspect during the 2001–2007 expansion, choosing to conserve cash and minimize leverage. In general, this led to balance sheets that were considered to be in unusually pristine condition coming out of the financial crisis of 2008.
We believe the disconnect between weak macroeconomic conditions and strong corporate performance has created a fertile environment for the Fund’s bottom-up focus on individual company characteristics. As always, we continue to seek businesses that have historically generated high levels of free cash flow, seem positioned to grow their earnings by expanding market share, and enjoy sufficient geographic diversity to potentially benefit from the world’s stronger secular growth trends where they exist.
9
| Performance summaries | |
| Delaware International Value Equity Fund | November 30, 2010 |
The performance data quoted represent past performance; past performance does not guarantee future results. Investment return and principal value will fluctuate so your shares, when redeemed, may be worth more or less than their original cost. Please obtain the performance data current for the most recent month end by calling 800 523-1918 or visiting our Web site at www.delawareinvestments.com/performance. Current performance may be lower or higher than the performance data quoted.
Carefully consider the Fund’s investment objectives, risk factors, charges, and expenses before investing. This and other information can be found in the Fund’s prospectus and, if available, its summary prospectus, which may be obtained by visiting www.delawareinvestments.com or calling 800 523-1918. Investors should read the prospectus and, if available, the summary prospectus carefully before investing.
| Fund performance | Average annual total returns through Nov. 30, 2010 | ||||||
| 1 year | 5 years | 10 years | Lifetime | ||||
| Class A (Est. Oct. 31, 1991) | |||||||
| Excluding sales charge | +3.60% | +1.28% | +4.77% | n/a | |||
| Including sales charge | -2.40% | +0.09% | +4.15% | n/a | |||
| Class B (Est. Sept. 6, 1994) | |||||||
| Excluding sales charge | +2.86% | +0.56% | +4.18% | n/a | |||
| Including sales charge | -1.14% | +0.28% | +4.18% | n/a | |||
| Class C (Est. Nov. 29, 1995) | |||||||
| Excluding sales charge | +2.87% | +0.58% | +4.04% | n/a | |||
| Including sales charge | +1.87% | +0.58% | +4.04% | n/a | |||
| Class R (Est. June 2, 2003) | |||||||
| Excluding sales charge | +3.32% | +1.09% | n/a | +7.31% | |||
| Including sales charge | +3.32% | +1.09% | n/a | +7.31% | |||
| Institutional Class (Est. Nov. 9, 1992) | |||||||
| Excluding sales charge | +3.93% | +1.58% | +5.08% | n/a | |||
| Including sales charge | +3.93% | +1.58% | +5.08% | n/a | |||
Returns reflect the reinvestment of all distributions and any applicable sales charges as noted in the following paragraphs.
Performance for Class B and C shares, excluding sales charges, assumes either that contingent deferred sales charges did not apply or that the investment was not redeemed.
Expense limitations were in effect for certain classes during the periods shown in the “Fund performance” chart and in the “Performance of a $10,000 investment” chart. The current expenses for each class are listed on the “Fund expense ratios” chart. (Note that all charts and graphs referred to in the “Performance summary” section of this report are found on pages 10 through 12.) Performance would have been lower had the expense limitations not been in effect.
10
The Fund offers Class A, B, C, R, and Institutional Class shares.
Class A shares are sold with a maximum front-end sales charge of up to 5.75%, and have an annual distribution and service fee of up to 0.30% of average daily net assets.
Class B shares may be purchased only through dividend reinvestment and certain permitted exchanges as described in the prospectus. Please see the prospectus for additional information on Class B purchase and sales charges. Class B shares have a contingent deferred sales charge that declines from 4.00% to zero depending on the period of time the shares are held.
Class B shares will automatically convert to Class A shares on a quarterly basis approximately eight years after purchase. They are also subject to an annual distribution and service fee of up to 1.00% of average daily net assets.
Ten-year performance figures for Class B shares reflect conversion to Class A shares after approximately eight years.
Class C shares are sold with a contingent deferred sales charge of 1.00% if redeemed during the first 12 months. They are also subject to an annual distribution and service fee of up to 1.00% of average daily net assets.
Class R shares are available only for certain retirement plan products. They are sold without a sales charge and have an annual distribution and service fee of up to 0.60% of average daily net assets, which has been limited contractually to 0.50% from March 30, 2010, through March 30, 2011.
Institutional Class shares are available without sales or asset-based distribution charges only to certain eligible institutional accounts.
International investments entail risks not ordinarily associated with U.S. investments including fluctuation in currency values, differences in accounting principles, or economic or political instability in other nations.
Investing in emerging markets can be riskier than investing in established foreign markets due to increased volatility and lower trading volume.
The “Fund performance” table and the “Performance of a $10,000 investment” graph do not reflect the deduction of taxes the shareholder would pay on Fund distributions or redemptions of Fund shares.
The Fund’s expense ratios, as described in the most recent prospectus, are disclosed in the following “Fund expense ratios” chart. Delaware Investments has agreed to reimburse certain expenses and/or waive certain fees in order to prevent total fund operating expenses (excluding any 12b-1 fees and certain other expenses) from exceeding 1.35% of the Fund’s average daily net assets from March 30, 2010, through March 30, 2011. Please see the most recent prospectus and any applicable supplement(s) for additional information on these fee waivers and/or reimbursements.
| Fund expense ratios | Class A | Class B | Class C | Class R | Institutional Class | ||||
| Total annual operating expenses | 1.78% | 2.48% | 2.48% | 2.08% | 1.48% | ||||
| (without fee waivers) | |||||||||
| Net expenses | 1.65% | 2.35% | 2.35% | 1.85% | 1.35% | ||||
| (including fee waivers, if any) | |||||||||
| Type of waiver | Contractual | Contractual | Contractual | Contractual | Contractual |
11
Performance summaries
Delaware International Value Equity Fund
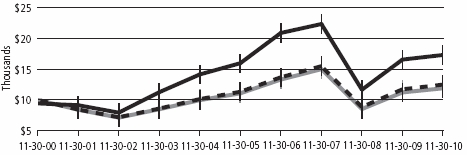
Performance of a $10,000 investment
Average annual total returns from Nov. 30, 2000, through Nov. 30, 2010

| For period beginning Nov. 30, 2000, through Nov. 30, 2010 | Starting value | Ending value | ||
| Delaware International Value Equity Fund — | ||||
| Class A Shares | $9,425 | $15,026 | ||
| MSCI EAFE Index (gross) | $10,000 | $14,082 | ||
| MSCI EAFE Index (net) | $10,000 | $13,513 | ||
The chart assumes $10,000 invested in the Fund on Nov. 30, 2000, and includes the effect of a 5.75% front-end sales charge and the reinvestment of all distributions. Please note additional details on these fees in the “Performance summary” section of this report, which includes pages 10 through 12.
The chart also assumes $10,000 invested in the MSCI EAFE Index as of Nov. 30, 2000.
The MSCI EAFE Index measures equity market performance across developed market countries in Europe, Australasia, and the Far East. Index “gross” return approximates the maximum possible dividend reinvestment. Index “net” return approximates the minimum possible dividend reinvestment, after deduction of withholding tax at the highest possible rate.
Index performance returns do not reflect any management fees, transaction costs or expenses. Indices are unmanaged and one cannot invest directly in an index. Past performance is not a guarantee of future results.
Performance of other Fund classes will vary due to different charges and expenses.
The “Fund performance” chart and the “Performance of a $10,000 investment” graph do not reflect the deduction of taxes shareholders would pay on Fund distributions or redemptions of Fund shares.
| Nasdaq symbols | CUSIPs | ||||
| Class A | DEGIX | 245914106 | |||
| Class B | DEIEX | 245914700 | |||
| Class C | DEGCX | 245914858 | |||
| Class R | DIVRX | 245914577 | |||
| Institutional Class | DEQIX | 245914403 |
12
| Delaware Emerging Markets Fund | November 30, 2010 |
The performance data quoted represent past performance; past performance does not guarantee future results. Investment return and principal value will fluctuate so your shares, when redeemed, may be worth more or less than their original cost. Please obtain the performance data current for the most recent month end by calling 800 523-1918 or visiting our Web site at www.delawareinvestments.com/performance. Current performance may be lower or higher than the performance data quoted.
Carefully consider the Fund’s investment objectives, risk factors, charges, and expenses before investing. This and other information can be found in the Fund’s prospectus and, if available, its summary prospectus, which may be obtained by visiting www.delawareinvestments.com or calling 800 523-1918. Investors should read the prospectus and, if available, the summary prospectus carefully before investing.
| Fund performance | Average annual total returns through Nov. 30, 2010 | ||||||
| 1 year | 5 years | 10 years | Lifetime | ||||
| Class A (Est. June 10, 1996) | |||||||
| Excluding sales charge | +15.42% | +12.38% | +18.28% | n/a | |||
| Including sales charge | +8.75% | +11.05% | +17.59% | n/a | |||
| Class B (Est. June 10, 1996) | |||||||
| Excluding sales charge | +14.47% | +11.54% | +17.58% | n/a | |||
| Including sales charge | +10.47% | +11.31% | +17.58% | n/a | |||
| Class C (Est. June 10, 1996) | |||||||
| Excluding sales charge | +14.51% | +11.54% | +17.42% | n/a | |||
| Including sales charge | +13.51% | +11.54% | +17.42% | n/a | |||
| Class R (Est. Aug. 31, 2009) | |||||||
| Excluding sales charge | +15.03% | n/a | n/a | +23.24% | |||
| Including sales charge | +15.03% | n/a | n/a | +23.24% | |||
| Institutional Class (Est. June 10, 1996) | |||||||
| Excluding sales charge | +15.69% | +12.66% | +18.59% | n/a | |||
| Including sales charge | +15.69% | +12.66% | +18.59% | n/a | |||
Returns reflect the reinvestment of all distributions and any applicable sales charges as noted in the following paragraphs.
Performance for Class B and C shares, excluding sales charges, assumes either that contingent deferred sales charges did not apply or that the investment was not redeemed.
Expense limitations were in effect for certain classes during the periods shown in the “Fund performance” chart and in the “Performance of a $10,000 investment” chart. The current expenses for each class are listed on the “Fund expense ratios” chart. (Note that all charts and graphs referred to in the “Performance summary” section of this report are found on pages 13 through 15.) Performance would have been lower had the expense limitations not been in effect.
The Fund offers Class A, B, C, R, and Institutional Class shares.
13
Performance summaries
Delaware Emerging Markets Fund
Class A shares are sold with a maximum front-end sales charge of up to 5.75%, and have an annual distribution and service fee of up to 0.30% of average daily net assets. This fee has been contractually limited to 0.25% of average daily net assets from March 30, 2010, through March 30, 2011.
Class B shares may be purchased only through dividend reinvestment and certain permitted exchanges as described in the prospectus. Please see the prospectus for additional information on Class B purchase and sales charges. Class B shares have a contingent deferred sales charge that declines from 4.00% to zero depending on the period of time the shares are held.
Class B shares will automatically convert to Class A shares on a quarterly basis approximately eight years after purchase. They are also subject to an annual distribution and service fee of up to 1.00% of average daily net assets.
Ten-year performance figures for Class B shares reflect conversion to Class A shares after approximately eight years.
Class C shares are sold with a contingent deferred sales charge of 1.00% if redeemed during the first 12 months. They are also subject to an annual distribution and service fee of up to 1.00% of average daily net assets.
Class R shares are available only for certain retirement plan products. They are sold without a sales charge and have an annual distribution and service fee of up to 0.60% of average daily net assets, which has been limited contractually to 0.50% from March 30, 2010, through March 30, 2011.
Institutional Class shares are available without sales or asset-based distribution charges only to certain eligible institutional accounts.
International investments entail risks not ordinarily associated with U.S. investments including fluctuation in currency values, differences in accounting principles, or economic or political instability in other nations. Investing in emerging markets can be riskier than investing in established foreign markets due to increased volatility and lower trading volume.
The “Fund performance” table and the “Performance of a $10,000 investment” graph do not reflect the deduction of taxes the shareholder would pay on Fund distributions or redemptions of Fund shares.
The Fund’s expense ratios, as described in the most recent prospectus, are disclosed in the following “Fund expense ratios” chart. Delaware Investments has agreed to reimburse certain expenses and/or waive certain fees in order to prevent total fund operating expenses (excluding any 12b-1 fees and certain other expenses) from exceeding 1.75% of the Fund’s average daily net assets from March 30, 2010, through March 30, 2011. Please see the most recent prospectus and any applicable supplement(s) for additional information on these fee waivers and/or reimbursements.
| Fund expense ratios | Class A | Class B | Class C | Class R | Institutional Class | ||||
| Total annual operating expenses | 1.98% | 2.68% | 2.68% | 2.28% | 1.68% | ||||
| (without fee waivers) | |||||||||
| Net expenses | 1.93% | 2.68% | 2.68% | 2.18% | 1.68% | ||||
| (including fee waivers, if any) | |||||||||
| Type of waiver | Contractual | Contractual | Contractual | Contractual | Contractual |
14
Performance of a $10,000 investment
Average annual total returns from Nov. 30, 2000, through Nov. 30, 2010

| For period beginning Nov. 30, 2000, through Nov. 30, 2010 | Starting value | Ending value | ||
| Delaware Emerging Markets Fund — Class A Shares | $9,425 | $50,530 | ||
| MSCI Emerging Markets Index (gross) | $10,000 | $43,009 | ||
| MSCI Emerging Markets Index (net) | $10,000 | $41,770 | ||
The chart assumes $10,000 invested in the Fund on Nov. 30, 2000, and includes the effect of a 5.75% front-end sales charge and the reinvestment of all distributions. Please note additional details on these fees in the “Performance summary” section of this report, which includes pages 13 through 15.
The chart also assumes $10,000 invested in the MSCI Emerging Markets Index as of Nov. 30, 2000.
The MSCI Emerging Markets Index measures equity market performance across emerging market countries worldwide. Index “gross” return approximates the maximum possible dividend reinvestment. Index “net” return approximates the minimum possible dividend reinvestment, after deduction of withholding tax at the highest possible rate.
Index performance returns do not reflect any management fees, transaction costs or expenses. Indices are unmanaged and one cannot invest directly in an index. Past performance is not a guarantee of future results.
Performance of other Fund classes will vary due to different charges and expenses.
The “Fund performance” chart and the “Performance of a $10,000 investment” graph do not reflect the deduction of taxes shareholders would pay on Fund distributions or redemptions of Fund shares.
| Nasdaq symbols | CUSIPs | ||||
| Class A | DEMAX | 245914841 | |||
| Class B | DEMBX | 245914833 | |||
| Class C | DEMCX | 245914825 | |||
| Class R | DEMRX | 245914569 | |||
| Institutional Class | DEMIX | 245914817 |
15
| Performance summaries | |
| Delaware Global Value Fund | November 30, 2010 |
The performance data quoted represent past performance; past performance does not guarantee future results. Investment return and principal value will fluctuate so your shares, when redeemed, may be worth more or less than their original cost. Please obtain the performance data current for the most recent month end by calling 800 523-1918 or visiting our Web site at www.delawareinvestments.com/performance. Current performance may be lower or higher than the performance data quoted.
Carefully consider the Fund’s investment objectives, risk factors, charges, and expenses before investing. This and other information can be found in the Fund’s prospectus and, if available, its summary prospectus, which may be obtained by visiting www.delawareinvestments.com or calling 800 523-1918. Investors should read the prospectus and, if available, the summary prospectus carefully before investing.
| Fund performance | Average annual total returns through Nov. 30, 2010 | ||||||
| 1 year | 5 years | 10 years | Lifetime | ||||
| Class A (Est. Dec. 19, 1997) | |||||||
| Excluding sales charge | +4.53% | +1.62% | +6.28% | n/a | |||
| Including sales charge | -1.47% | +0.43% | +5.65% | n/a | |||
| Class B (Est. Sept. 28, 2001) | |||||||
| Excluding sales charge | +3.70% | +0.90% | n/a | +7.34% | |||
| Including sales charge | -0.30% | +0.59% | n/a | +7.34% | |||
| Class C (Est. Sept. 28, 2001) | |||||||
| Excluding sales charge | +3.70% | +0.88% | n/a | +7.24% | |||
| Including sales charge | +2.70% | +0.88% | n/a | +7.24% | |||
| Institutional Class (Est. Dec. 19, 1997) | |||||||
| Excluding sales charge | +4.86% | +1.90% | +6.54% | n/a | |||
| Including sales charge | +4.86% | +1.90% | +6.54% | n/a | |||
Class R shares had not commenced operations as of Nov. 30, 2010.
Returns reflect the reinvestment of all distributions and any applicable sales charges as noted in the following paragraphs.
Performance for Class B and C shares, excluding sales charges, assumes either that contingent deferred sales charges did not apply or that the investment was not redeemed.
Expense limitations were in effect for certain classes during the periods shown in the “Fund performance” chart and in the “Performance of a $10,000 investment” chart. The current expenses for each class are listed on the “Fund expense ratios” chart. (Note that all charts and graphs referred to in the “Performance summary” section of this report are found on pages 16 through 18.) Performance would have been lower had the expense limitations not been in effect.
16
The Fund offers Class A, B, C, R, and Institutional Class shares.
Class A shares are sold with a maximum front-end sales charge of up to 5.75%, and have an annual distribution and service fee of up to 0.30% of average daily net assets. This fee has been contractually limited to 0.25% of average daily net assets from March 30, 2010, through March 30, 2011.
Class B shares may be purchased only through dividend reinvestment and certain permitted exchanges as described in the prospectus. Please see the prospectus for additional information on Class B purchase and sales charges. Class B shares have a contingent deferred sales charge that declines from 4.00% to zero depending on the period of time the shares are held.
Class B shares will automatically convert to Class A shares on a quarterly basis approximately eight years after purchase. They are also subject to an annual distribution and service fee of up to 1.00% of average daily net assets.
Lifetime performance figures for Class B shares reflect conversion to Class A shares after approximately eight years.
Class C shares are sold with a contingent deferred sales charge of 1.00% if redeemed during the first 12 months. They are also subject to an annual distribution and service fee of up to 1.00% of average daily net assets.
Class R shares are available only for certain retirement plan products. They are sold without a sales charge and have an annual distribution and service fee of up to 0.60% of average daily net assets, which has been limited contractually to 0.50% from March 30, 2010, through March 30, 2011.
Institutional Class shares are available without sales or asset-based distribution charges only to certain eligible institutional accounts.
International investments entail risks not ordinarily associated with U.S. investments including fluctuation in currency values, differences in accounting principles, or economic or political instability in other nations. Investing in emerging markets can be riskier than investing in established foreign markets due to increased volatility and lower trading volume.
The “Fund performance” table and the “Performance of a $10,000 investment” graph do not reflect the deduction of taxes the shareholder would pay on Fund distributions or redemptions of Fund shares.
The Fund’s expense ratios, as described in the most recent prospectus, are disclosed in the following “Fund expense ratios” chart. Delaware Investments has agreed to reimburse certain expenses and/or waive certain fees in order to prevent total fund operating expenses (excluding any 12b-1 fees and certain other expenses) from exceeding 1.30% of the Fund’s average daily net assets from March 30, 2010, through March 30, 2011. Please see the most recent prospectus and any applicable supplement(s) for additional information on these fee waivers and/or reimbursements.
| Fund expense ratios | Class A | Class B | Class C | Class R | Institutional Class | ||||
| Total annual operating expenses | 2.09% | 2.79% | 2.79% | 2.39% | 1.79% | ||||
| (without fee waivers) | |||||||||
| Net expenses | 1.55% | 2.30% | 2.30% | 1.80% | 1.30% | ||||
| (including fee waivers, if any) | |||||||||
| Type of waiver | Contractual | Contractual | Contractual | Contractual | Contractual |
17
Performance summaries
Delaware Global Value Fund
Delaware Global Value Fund
Performance of a $10,000 investment
Average annual total returns from Nov. 30, 2000, through Nov. 30, 2010
Average annual total returns from Nov. 30, 2000, through Nov. 30, 2010
| For period beginning Nov. 30, 2000, through Nov. 30, 2010 | Starting value | Ending value | ||
| Delaware Global Value Fund — Class A Shares | $9,425 | $17,322 | ||
| MSCI World Index (gross) | $10,000 | $12,494 | ||
| MSCI World Index (net) | $10,000 | $11,891 | ||
The chart assumes $10,000 invested in the Fund on Nov. 30, 2000, and includes the effect of a 5.75% front-end sales charge and the reinvestment of all distributions. Please note additional details on these fees in the “Performance summary” section of this report, which includes pages 16 through 18.
The chart also assumes $10,000 invested in the MSCI World Index as of Nov. 30, 2000.
The MSCI World Index is a free float-adjusted market capitalization weighted index designed to measure equity market performance across developed markets worldwide. Index “gross” return approximates the maximum possible dividend reinvestment. Index “net” return approximates the minimum possible dividend reinvestment, after deduction of withholding tax at the highest possible rate.
Index performance returns do not reflect any management fees, transaction costs or expenses. Indices are unmanaged and one cannot invest directly in an index. Past performance is not a guarantee of future results.
Performance of other Fund classes will vary due to different charges and expenses.
The “Fund performance” chart and the “Performance of a $10,000 investment” graph do not reflect the deduction of taxes shareholders would pay on Fund distributions or redemptions of Fund shares.
| Nasdaq symbols | CUSIPs | ||||||
| Class A | DABAX | 245914718 | |||||
| Class B | DABBX | 245914692 | |||||
| Class C | DABCX | 245914684 | |||||
| Institutional Class | DABIX | 245914676 | |||||
18
Disclosure of Fund expenses
For the six-month period from June 1, 2010 to November 30, 2010
For the six-month period from June 1, 2010 to November 30, 2010
As a shareholder of a Fund, you incur two types of costs: (1) transaction costs, including sales charges (loads) on purchase payments, reinvested dividends, or other distributions; redemption fees; and exchange fees; and (2) ongoing costs, including management fees; distribution and/or service (12b-1) fees; and other Fund expenses. These following examples are intended to help you understand your ongoing costs (in dollars) of investing in a Fund and to compare these costs with the ongoing costs of investing in other mutual funds.
The examples are based on an investment of $1,000 invested at the beginning of the period and held for the entire six-month period from June 1, 2010 to November 30, 2010.
Actual expenses
The first section of the tables shown, “Actual Fund return,” provides information about actual account values and actual expenses. You may use the information in this section of the table, together with the amount you invested, to estimate the expenses that you paid over the period. Simply divide your account value by $1,000 (for example, an $8,600 account value divided by $1,000 = 8.6), then multiply the result by the number in the first section under the heading entitled “Expenses Paid During Period” to estimate the expenses you paid on your account during this period.
Hypothetical example for comparison purposes
The second section of the tables shown, “Hypothetical 5% return,” provides information about hypothetical account values and hypothetical expenses based on the Funds’ actual expense ratios and an assumed rate of return of 5% per year before expenses, which is not the Funds’ actual return. The hypothetical account values and expenses may not be used to estimate the actual ending account balance or expenses you paid for the period. You may use this information to compare the ongoing costs of investing in each Fund and other funds. To do so, compare this 5% hypothetical example with the 5% hypothetical examples that appear in the shareholder reports of the other funds.
Please note that the expenses shown in the tables are meant to highlight your ongoing costs only and do not reflect any transactional costs, such as sales charges (loads), redemption fees, or exchange fees. Therefore, the second section of each table is useful in comparing ongoing costs only, and will not help you determine the relative total costs of owning different funds. In addition, if these transactional costs were included, your costs would have been higher. The Funds’ expenses shown in the tables reflect fee waivers in effect. The expenses shown in each table assume reinvestment of all dividends and distributions.
20
Delaware International Value Equity Fund
Expense analysis of an investment of $1,000
Expense analysis of an investment of $1,000
| Beginning | Ending | Expenses | ||||||||
| Account Value | Account Value | Annualized | Paid During Period | |||||||
| 6/1/10 | 11/30/10 | Expense Ratio | 6/1/10 to 11/30/10* | |||||||
| Actual Fund return | ||||||||||
| Class A | $ | 1,000.00 | $ | 1,135.40 | 1.65% | $ | 8.83 | |||
| Class B | 1,000.00 | 1,131.20 | 2.35% | 12.56 | ||||||
| Class C | 1,000.00 | 1,131.30 | 2.35% | 12.56 | ||||||
| Class R | 1,000.00 | 1,133.90 | 1.85% | 9.90 | ||||||
| Institutional Class | 1,000.00 | 1,136.90 | 1.35% | 7.23 | ||||||
| Hypothetical 5% return (5% return before expenses) | ||||||||||
| Class A | $ | 1,000.00 | $ | 1,016.80 | 1.65% | $ | 8.34 | |||
| Class B | 1,000.00 | 1,013.29 | 2.35% | 11.86 | ||||||
| Class C | 1,000.00 | 1,013.29 | 2.35% | 11.86 | ||||||
| Class R | 1,000.00 | 1,015.79 | 1.85% | 9.35 | ||||||
| Institutional Class | 1,000.00 | 1,018.30 | 1.35% | 6.83 | ||||||
Delaware Emerging Markets Fund
Expense analysis of an investment of $1,000
Expense analysis of an investment of $1,000
| Beginning | Ending | Expenses | ||||||||
| Account Value | Account Value | Annualized | Paid During Period | |||||||
| 6/1/10 | 11/30/10 | Expense Ratio | 6/1/10 to 11/30/10* | |||||||
| Actual Fund return | ||||||||||
| Class A | $ | 1,000.00 | $ | 1,180.30 | 1.86% | $ | 10.17 | |||
| Class B | 1,000.00 | 1,176.30 | 2.61% | 14.24 | ||||||
| Class C | 1,000.00 | 1,175.70 | 2.61% | 14.24 | ||||||
| Class R | 1,000.00 | 1,178.90 | 2.11% | 11.53 | ||||||
| Institutional Class | 1,000.00 | 1,181.50 | 1.61% | 8.80 | ||||||
| Hypothetical 5% return (5% return before expenses) | ||||||||||
| Class A | $ | 1,000.00 | $ | 1,015.74 | 1.86% | $ | 9.40 | |||
| Class B | 1,000.00 | 1,011.98 | 2.61% | 13.16 | ||||||
| Class C | 1,000.00 | 1,011.98 | 2.61% | 13.16 | ||||||
| Class R | 1,000.00 | 1,014.49 | 2.11% | 10.66 | ||||||
| Institutional Class | 1,000.00 | 1,017.00 | 1.61% | 8.14 | ||||||
21
Disclosure of Fund expenses
Delaware Global Value Fund
Expense analysis of an investment of $1,000
Expense analysis of an investment of $1,000
| Beginning | Ending | Expenses | ||||||||
| Account Value | Account Value | Annualized | Paid During Period | |||||||
| 6/1/10 | 11/30/10 | Expense Ratio | 6/1/10 to 11/30/10* | |||||||
| Actual Fund return | ||||||||||
| Class A | $ | 1,000.00 | $ | 1,114.10 | 1.55% | $ | 8.21 | |||
| Class B | 1,000.00 | 1,110.10 | 2.30% | 12.17 | ||||||
| Class C | 1,000.00 | 1,110.10 | 2.30% | 12.17 | ||||||
| Institutional Class | 1,000.00 | 1,116.50 | 1.30% | 6.90 | ||||||
| Hypothetical 5% return (5% return before expenses) | ||||||||||
| Class A | $ | 1,000.00 | $ | 1,017.30 | 1.55% | $ | 7.84 | |||
| Class B | 1,000.00 | 1,013.54 | 2.30% | 11.61 | ||||||
| Class C | 1,000.00 | 1,013.54 | 2.30% | 11.61 | ||||||
| Institutional Class | 1,000.00 | 1,018.55 | 1.30% | 6.58 | ||||||
*“Expenses Paid During Period” are equal to a Fund’s annualized expense ratio, multiplied by the average account value over the period, multiplied by 183/365 (to reflect the one-half year period).
22
| Country and sector allocations | |
| Delaware International Value Equity Fund | As of November 30, 2010 |
Sector designations may be different than the sector designations presented in other Fund materials. The sector designations may represent the investment manager’s internal sector classifications, which may result in the sector designations for one fund being different than another fund’s sector designations.
| Composition of Portfolio | Percentage of net assets | |
| Common Stock by Country | 99.27 | % |
| Australia | 1.72 | % |
| Brazil | 3.85 | % |
| Canada | 6.25 | % |
| China/Hong Kong | 12.15 | % |
| Finland | 1.53 | % |
| France | 19.61 | % |
| Germany | 6.42 | % |
| Italy | 6.05 | % |
| Japan | 11.25 | % |
| Luxembourg | 1.12 | % |
| Netherlands | 0.88 | % |
| Singapore | 1.61 | % |
| Spain | 3.92 | % |
| Sweden | 5.12 | % |
| Switzerland | 4.33 | % |
| Taiwan | 4.59 | % |
| United Kingdom | 8.87 | % |
| Discount Note | 0.02 | % |
| Securities Lending Collateral | 19.31 | % |
| Total Value of Securities | 118.60 | % |
| Obligation to Return Securities Lending Collateral | (19.78 | %) |
| Receivables and Other Assets Net of Liabilities | 1.18 | % |
| Total Net Assets | 100.00 | % |
23
Country and sector allocations
Delaware International Value Equity Fund
Delaware International Value Equity Fund
| Common Stock by Sector | Percentage of net assets | |
| Consumer Discretionary | 18.37 | % |
| Consumer Staples | 11.85 | % |
| Energy | 5.85 | % |
| Financials | 11.41 | % |
| Healthcare | 6.10 | % |
| Industrials | 18.82 | % |
| Information Technology | 12.20 | % |
| Materials | 6.93 | % |
| Telecommunication Services | 5.97 | % |
| Utilities | 1.77 | % |
| Total | 99.27 | %* |
* Only includes common stock.
24
| Delaware Emerging Markets Fund | As of November 30, 2010 |
Sector designations may be different than the sector designations presented in other Fund materials. The sector designations may represent the investment manager’s internal sector classifications, which may result in the sector designations for one fund being different than another fund’s sector designations.
| Composition of Portfolio | Percentage of net assets | |
| Common Stock by Country | 91.84 | % |
| Argentina | 1.97 | % |
| Australia | 0.31 | % |
| Brazil | 12.47 | % |
| China/Hong Kong | 17.30 | % |
| Hungary | 1.23 | % |
| India | 1.69 | % |
| Indonesia | 0.43 | % |
| Israel | 0.60 | % |
| Kingdom of Bahrain | 0.18 | % |
| Malaysia | 2.69 | % |
| Mexico | 3.92 | % |
| Peru | 0.58 | % |
| Philippines | 0.38 | % |
| Poland | 1.88 | % |
| Republic of Korea | 10.15 | % |
| Russia | 7.12 | % |
| South Africa | 6.76 | % |
| Taiwan | 6.23 | % |
| Thailand | 2.51 | % |
| Turkey | 2.31 | % |
| United Kingdom | 1.42 | % |
| United States | 9.71 | % |
| Participation Notes | 0.04 | % |
| Preferred Stock | 4.77 | % |
| Rights | 0.05 | % |
| Discount Note | 1.65 | % |
| Securities Lending Collateral | 16.28 | % |
| Total Value of Securities | 114.63 | % |
| Obligation to Return Securities Lending Collateral | (16.31 | %) |
| Receivables and Other Assets Net of Liabilities | 1.68 | % |
| Total Net Assets | 100.00 | % |
25
Country and sector allocations
Delaware Emerging Markets Fund
Delaware Emerging Markets Fund
| Commons Stock, Participation Notes, Preferred Stock and Rights by Sector | Percentage of net assets | |
| Consumer Discretionary | 4.15 | % |
| Consumer Staples | 9.22 | % |
| Energy | 15.25 | % |
| Financials | 15.93 | % |
| Industrials | 3.82 | % |
| Information Technology | 17.04 | % |
| Materials | 15.68 | % |
| Telecommunication Services | 11.16 | % |
| Utilities | 4.45 | % |
| Total | 96.70 | %* |
* Includes common stock, participation notes, preferred stock and rights.
26
| Delaware Global Value Fund | As of November 30, 2010 |
Sector designations may be different than the sector designations presented in other Fund materials. The sector designations may represent the investment manager’s internal sector classifications, which may result in the sector designations for one fund being different than another fund’s sector designations.
| Composition of Portfolio | Percentage of net assets | ||||
| Common Stock by Country | 99.96 | % | |||
| Australia | 0.97 | % | |||
| Brazil | 1.72 | % | |||
| Canada | 2.96 | % | |||
| China/Hong Kong | 6.77 | % | |||
| Finland | 0.72 | % | |||
| France | 10.60 | % | |||
| Germany | 3.26 | % | |||
| Italy | 3.19 | % | |||
| Japan | 5.36 | % | |||
| Luxembourg | 0.53 | % | |||
| Netherlands | 0.48 | % | |||
| Singapore | 0.90 | % | |||
| Spain | 2.45 | % | |||
| Sweden | 2.94 | % | |||
| Switzerland | 2.43 | % | |||
| Taiwan | 3.33 | % | |||
| United Kingdom | 4.21 | % | |||
| United States | 47.14 | % | |||
| Securities Lending Collateral | 13.36 | % | |||
| Total Value of Securities | 113.32 | % | |||
| Obligation to Return Securities Lending Collateral | (13.80 | %) | |||
| Receivables and Other Assets Net of Liabilities | 0.48 | % | |||
| Total Net Assets | 100.00 | % | |||
27
Country and sector allocations
Delaware Global Value Fund
Delaware Global Value Fund
| Common Stock by Sector | Percentage of net assets | ||||
| Consumer Discretionary | 17.36 | % | |||
| Consumer Staples | 9.60 | % | |||
| Energy | 5.71 | % | |||
| Financials | 15.27 | % | |||
| Healthcare | 6.28 | % | |||
| Industrials | 16.91 | % | |||
| Information Technology | 17.86 | % | |||
| Materials | 4.86 | % | |||
| Telecommunication Services | 5.40 | % | |||
| Utilities | 0.71 | % | |||
| Total | 99.96 | %* | |||
* Only includes common stock.
28
| Statements of net assets | |
| Delaware International Value Equity Fund | November 30, 2010 |
| Number of shares | Value (U.S. $) | |||||
| Common Stock – 99.27%Δ | ||||||
| Australia – 1.72% | ||||||
| Coca-Cola Amatil | 518,331 | $ | 5,527,948 | |||
| 5,527,948 | ||||||
| Brazil – 3.85% | ||||||
| Petroleo Brasileiro ADR | 181,400 | 5,311,392 | ||||
| * | Vale ADR | 223,800 | 7,089,984 | |||
| 12,401,376 | ||||||
| Canada – 6.25% | ||||||
| † | CGI Group Class A | 948,063 | 14,869,766 | |||
| * | TELUS | 115,750 | 5,254,700 | |||
| 20,124,466 | ||||||
| China/Hong Kong – 12.15% | ||||||
| * | Chaoda Modern Agriculture Holdings | 8,132,000 | 6,527,978 | |||
| CNOOC | 3,210,000 | 6,908,474 | ||||
| Esprit Holdings | 565,524 | 2,722,050 | ||||
| *† | Sohu.com | 116,100 | 8,060,823 | |||
| * | Techtronic Industries | 7,182,000 | 7,794,876 | |||
| Yue Yuen Industrial Holdings | 1,963,500 | 7,095,724 | ||||
| 39,109,925 | ||||||
| Finland – 1.53% | ||||||
| Nokia | 532,131 | 4,921,324 | ||||
| 4,921,324 | ||||||
| France – 19.61% | ||||||
| * | Alstom | 134,540 | 5,535,086 | |||
| * | AXA | 350,384 | 5,018,036 | |||
| Compagnie de Saint-Gobain | 123,286 | 5,513,627 | ||||
| * | Lafarge | 96,661 | 5,261,454 | |||
| * | PPR | 24,583 | 3,905,218 | |||
| * | Publicis Groupe | 76,675 | 3,425,808 | |||
| Sanofi-Aventis | 100,352 | 6,083,703 | ||||
| Teleperformance | 278,505 | 8,296,142 | ||||
| * | Total | 136,401 | 6,621,485 | |||
| Vallourec | 67,695 | 6,412,217 | ||||
| * | Vivendi | 291,174 | 7,090,320 | |||
| 63,163,096 | ||||||
29
Statements of net assets
Delaware International Value Equity Fund
Delaware International Value Equity Fund
| Number of shares | Value (U.S. $) | |||||
| Common Stock (continued) | ||||||
| Germany – 6.42% | ||||||
| Bayerische Motoren Werke | 100,675 | $ | 7,571,119 | |||
| Deutsche Post | 383,922 | 6,202,435 | ||||
| Metro | 96,106 | 6,885,151 | ||||
| 20,658,705 | ||||||
| Italy – 6.05% | ||||||
| Finmeccanica | 600,370 | 6,777,414 | ||||
| Parmalat | 2,822,533 | 7,020,771 | ||||
| UniCredit | 2,938,917 | 5,681,147 | ||||
| 19,479,332 | ||||||
| Japan – 11.25% | ||||||
| Asahi Glass | 565,900 | 6,292,701 | ||||
| * | Don Quijote | 238,900 | 6,884,342 | |||
| * | ITOCHU | 816,660 | 7,563,491 | |||
| * | Mitsubishi UFJ Financial Group | 1,357,357 | 6,436,337 | |||
| Toyota Motor | 233,600 | 9,055,547 | ||||
| 36,232,418 | ||||||
| Luxembourg – 1.12% | ||||||
| * | ArcelorMittal | 114,717 | 3,616,251 | |||
| 3,616,251 | ||||||
| Netherlands – 0.88% | ||||||
| Koninklijke Philips Electronics | 105,214 | 2,845,021 | ||||
| 2,845,021 | ||||||
| Singapore – 1.61% | ||||||
| Singapore Airlines | 443,873 | 5,179,621 | ||||
| 5,179,621 | ||||||
| Spain – 3.92% | ||||||
| Banco Santander | 620,945 | 5,919,840 | ||||
| Telefonica | 315,809 | 6,707,553 | ||||
| 12,627,393 | ||||||
| Sweden – 5.12% | ||||||
| * | Autoliv | 49,400 | 3,626,948 | |||
| * | Meda Class A | 875,294 | 6,551,105 | |||
| Nordea Bank | 632,463 | 6,311,108 | ||||
| 16,489,161 | ||||||
30
| Number of shares | Value (U.S. $) | |||||
| Common Stock (continued) | ||||||
| Switzerland – 4.33% | ||||||
| * | Aryzta | 163,735 | $ | 6,935,487 | ||
| Novartis | 131,570 | 7,006,631 | ||||
| 13,942,118 | ||||||
| Taiwan – 4.59% | ||||||
| Chunghwa Telecom ADR | 139,995 | 3,375,279 | ||||
| HTC | 412,800 | 11,419,090 | ||||
| 14,794,369 | ||||||
| United Kingdom – 8.87% | ||||||
| @ | Greggs | 772,850 | 5,277,516 | |||
| National Grid | 645,371 | 5,699,238 | ||||
| Rexam | 1,354,526 | 6,355,604 | ||||
| Standard Chartered | 273,464 | 7,365,612 | ||||
| Vodafone Group | 1,553,629 | 3,875,658 | ||||
| 28,573,628 | ||||||
| Total Common Stock (cost $324,658,109) | 319,686,152 | |||||
| Principal | ||||||
| amount (U.S. $) | ||||||
| ≠Discount Note – 0.02% | ||||||
| Federal Home Loan Bank 0.07% 12/1/10 | $59,000 | 59,000 | ||||
| Total Discount Note (cost $59,000) | 59,000 | |||||
| Total Value of Securities Before Securities | ||||||
| Lending Collateral – 99.29% (cost $324,717,109) | 319,745,152 | |||||
| Number of shares | ||||||
| Securities Lending Collateral** – 19.31% | ||||||
| Investment Companies | ||||||
| BNY Mellon SL DBT II Liquidating Fund | 1,311,229 | 1,274,252 | ||||
| Delaware Investments Collateral Fund No. 1 | 60,912,716 | 60,912,716 | ||||
| @†Mellon GSL Reinvestment Trust II | 1,475,413 | 0 | ||||
| Total Securities Lending Collateral | ||||||
| (cost $63,699,358) | 62,186,968 | |||||
31
Statements of net assets
Delaware International Value Equity Fund
Delaware International Value Equity Fund
| Total Value of Securities – 118.60% | |||||
| (cost $388,416,467) | $ | 381,932,120 | © | ||
| Obligation to Return Securities | |||||
| Lending Collateral** – (19.78%) | (63,699,358 | ) | |||
| Receivables and Other Assets | |||||
| Net of Liabilities – 1.18% | 3,814,687 | ||||
| Net Assets Applicable to 27,857,545 | |||||
| Shares Outstanding – 100.00% | $ | 322,047,449 | |||
| Net Asset Value – Delaware International Value Equity Fund | |||||
| Class A ($130,864,723 / 11,312,802 Shares) | $11.57 | ||||
| Net Asset Value – Delaware International Value Equity Fund | |||||
| Class B ($7,669,902 / 673,894 Shares) | $11.38 | ||||
| Net Asset Value – Delaware International Value Equity Fund | |||||
| Class C ($43,619,815 / 3,837,983 Shares) | $11.37 | ||||
| Net Asset Value – Delaware International Value Equity Fund | |||||
| Class R ($3,127,700 / 271,402 Shares) | $11.52 | ||||
| Net Asset Value – Delaware International Value Equity Fund | |||||
| Institutional Class ($136,765,309 / 11,761,464 Shares) | $11.63 | ||||
| Components of Net Assets at November 30, 2010: | |||||
| Shares of beneficial interest (unlimited authorization – no par) | $ | 528,016,660 | |||
| Undistributed net investment income | 2,917,518 | ||||
| Accumulated net realized loss on investments | (202,348,304 | ) | |||
| Net unrealized depreciation of investments and foreign currencies | (6,538,425 | ) | |||
| Total net assets | $ | 322,047,449 | |||
32
| Δ | Securities have been classified by country of origin. Classification by type of business has been presented on page 24 in “Country and sector allocations.” |
| * | Fully or partially on loan. |
| † | Non income producing security. |
| ≠ | The rate shown is the effective yield at the time of purchase. |
| ** | See Note 9 in “Notes to financial statements.” |
| @ | Illiquid security. At November 30, 2010, the aggregate amount of illiquid securities was $ 5,277,516, which represented 1.64% of the Fund’s net assets. See Note 10 in “Notes to financial statements.” |
| © | Includes $59,711,417 of securities loaned. |
ADR — American Depositary Receipts
| Net Asset Value and Offering Price Per Share – | |||
| Delaware International Value Equity Fund | |||
| Net asset value Class A (A) | $ | 11.57 | |
| Sales charge (5.75% of offering price) (B) | 0.71 | ||
| Offering price | $ | 12.28 |
| (A) | Net asset value per share, as illustrated, is the amount which would be paid upon redemption or repurchase of shares. |
| (B) | See the current prospectus for purchases of $50,000 or more. |
See accompanying Notes, which are an integral part of the financial statements.
33
| Statements of net assets | |
| Delaware Emerging Markets Fund | November 30, 2010 |
| Number of shares | Value (U.S. $) | |||||
| Common Stock – 91.84%Δ | ||||||
| Argentina – 1.97% | ||||||
| @† | Cresud ADR | 936,869 | $ | 17,622,506 | ||
| †# | Grupo Clarin Class B 144A GDR | 353,200 | 3,457,757 | |||
| @ | IRSA Inversiones y Representaciones ADR | 358,400 | 5,748,736 | |||
| @* | Pampa Energia ADR | 95,300 | 1,656,314 | |||
| 28,485,313 | ||||||
| Australia – 0.31% | ||||||
| @† | Alara Resources | 200,833 | 51,004 | |||
| * | Alumina ADR | 500,000 | 3,800,000 | |||
| †Strike Resources | 1,618,461 | 549,975 | ||||
| 4,400,979 | ||||||
| Brazil – 12.47% | ||||||
| @ | AES Tiete | 597,480 | 7,357,888 | |||
| Banco Bradesco ADR | 400,000 | 8,024,000 | ||||
| Banco Santander Brasil ADR | 1,450,000 | 18,922,500 | ||||
| * | Brasil Foods ADR | 710,000 | 10,820,400 | |||
| * | Braskem ADR | 161,000 | 3,456,670 | |||
| Centrais Eletricas Brasileiras | 1,791,671 | 23,495,441 | ||||
| Cyrela Brazil Realty Empreendimentos e Participacoes | 700,000 | 8,857,143 | ||||
| *† | Fibria Celulose ADR | 600,000 | 9,168,000 | |||
| † | Hypermarcas | 200,000 | 3,163,848 | |||
| Itau Unibanco Holding ADR | 329,200 | 7,680,236 | ||||
| Petroleo Brasileiro SA ADR | 1,250,000 | 40,550,000 | ||||
| * | Petroleo Brasileiro SP ADR | 1,000,000 | 29,280,000 | |||
| * | Tim Participacoes ADR | 170,000 | 5,467,200 | |||
| Triunfo Participacoes e Investmentos | 109,600 | 555,988 | ||||
| * | Vale ADR | 105,000 | 3,326,400 | |||
| 180,125,714 | ||||||
| China/Hong Kong – 17.30% | ||||||
| *† | 51job ADR | 118,300 | 6,002,542 | |||
| † | Alibaba.com | 4,178,500 | 6,935,800 | |||
| Bank of China Class H | 17,000,000 | 9,074,788 | ||||
| *† | Bitauto Holdings ADR | 102,988 | 1,323,396 | |||
| China Construction Bank Class H | 8,102,000 | 7,293,079 | ||||
| * | China Mobile ADR | 1,000,000 | 49,849,999 | |||
| * | China Petroleum & Chemical ADR | 60,000 | 5,570,400 | |||
| China Telecom | 7,234,000 | 3,621,030 | ||||
| * | China Unicom Hong Kong | 7,998,979 | 10,765,720 | |||
34
| Number of shares | Value (U.S. $) | |||||
| Common Stock (continued) | ||||||
| China/Hong Kong (continued) | ||||||
| * | China Unicom Hong Kong ADR | 628,200 | $ | 8,443,008 | ||
| * | CNOOC ADR | 70,000 | 15,070,999 | |||
| * | Datang International Power Generation | 8,998,862 | 3,223,308 | |||
| First Pacific | 5,045,002 | 4,352,613 | ||||
| Fosun International | 2,886,500 | 2,150,216 | ||||
| *† | Foxconn International Holdings | 9,500,000 | 6,684,299 | |||
| Franshion Properties China | 12,008,000 | 3,762,290 | ||||
| * | Guangshen Railway Class H | 7,000,000 | 2,832,549 | |||
| *† | Hollysys Automation Technologies | 188,400 | 2,564,124 | |||
| * | Huadian Power International | 15,000,000 | 3,030,493 | |||
| * | Huaneng Power International ADR | 370,727 | 7,978,045 | |||
| * | Industrial & Commercial Bank of China Class H | 14,000,000 | 10,850,714 | |||
| † | Leoch International Technology | 731,000 | 385,976 | |||
| * | PetroChina ADR | 100,000 | 12,284,000 | |||
| PetroChina Class H | 4,242,000 | 5,213,167 | ||||
| *† | Shanda Games ADR | 1,179,549 | 6,605,474 | |||
| *† | Shanda Interactive Entertainment ADR | 230,000 | 9,091,900 | |||
| Shanghai Forte Land | 11,740,900 | 3,593,736 | ||||
| *† | Sina | 160,000 | 10,243,200 | |||
| Sinotrans | 7,561,000 | 2,272,328 | ||||
| *† | Sohu.com | 175,000 | 12,150,250 | |||
| * | Tianjin Development Holdings | 6,832,900 | 5,085,604 | |||
| @† | Tom Group | 47,824,000 | 4,802,497 | |||
| Travelsky Technology | 4,849,400 | 5,118,934 | ||||
| † | Xueda Education Group ADR | 128,974 | 1,592,829 | |||
| 249,819,307 | ||||||
| Hungary – 1.23% | ||||||
| *† | OTP Bank | 780,000 | 17,780,053 | |||
| 17,780,053 | ||||||
| India – 1.69% | ||||||
| † | Coal India | 383,581 | 2,657,010 | |||
| † | Indiabulls Real Estate GDR | 102,021 | 341,933 | |||
| Oil India | 26,650 | 801,281 | ||||
| # | Reliance Industries 144A GDR | 288,124 | 12,475,768 | |||
| Steel Authority of India | 2,123,966 | 8,170,035 | ||||
| 24,446,027 | ||||||
35
Statements of net assets
Delaware Emerging Markets Fund
| Number of shares | Value (U.S. $) | |||||
| Common Stock (continued) | ||||||
| Indonesia – 0.43% | ||||||
| Gudang Garam | 284,500 | $ | 1,280,239 | |||
| Tambang Batubara Bukit Asam | 2,379,335 | 4,920,593 | ||||
| 6,200,832 | ||||||
| Israel – 0.60% | ||||||
| Israel Chemicals | 600,000 | 8,654,882 | ||||
| 8,654,882 | ||||||
| Kingdom of Bahrain – 0.18% | ||||||
| =# | Aluminum Bahrain 144A GDR | 221,400 | 2,623,590 | |||
| 2,623,590 | ||||||
| Malaysia – 2.69% | ||||||
| Eastern & Oriental | 4,877,550 | 1,784,831 | ||||
| @ | Hong Leong Bank | 2,549,908 | 7,377,496 | |||
| KLCC Property Holdings | 5,000,000 | 5,383,178 | ||||
| Media Prima | 2,218,400 | 1,681,794 | ||||
| Oriental Holdings | 2,599,980 | 4,432,285 | ||||
| † | Petronas Chemicals Group | 4,577,900 | 7,732,207 | |||
| † | UEM Land Holdings | 15,698,475 | 10,399,433 | |||
| 38,791,224 | ||||||
| Mexico – 3.92% | ||||||
| * | America Movil Series L ADR | 170,000 | 9,598,200 | |||
| *† | Cemex ADR | 1,965,000 | 17,763,600 | |||
| *† | Empresas ICA | 1,768,800 | 4,630,804 | |||
| Fomento Economico Mexicano ADR | 146,122 | 8,263,199 | ||||
| * | Grupo Televisa ADR | 700,000 | 16,310,000 | |||
| 56,565,803 | ||||||
| Peru – 0.58% | ||||||
| Compaigne Minas Buenaventura ADR | 166,400 | 8,426,496 | ||||
| 8,426,496 | ||||||
| Philippines – 0.38% | ||||||
| Philippine Long Distance Telephone ADR | 100,000 | 5,436,000 | ||||
| 5,436,000 | ||||||
| Poland – 1.88% | ||||||
| Polska Grupa Energetyczna | 1,256,389 | 9,116,652 | ||||
| † | Polski Koncern Naftowy Orlen | 500,000 | 6,962,709 | |||
| Powszechna Kasa Oszczednosci Bank Polski | 800,000 | 11,087,175 | ||||
| 27,166,536 | ||||||
36
| Number of shares | Value (U.S. $) | |||||
| Common Stock (continued) | ||||||
| Republic of Korea – 10.15% | ||||||
| CJ | 80,144 | $ | 5,492,175 | |||
| Hyundai Elevator | 40,821 | 3,029,268 | ||||
| * | KB Financial Group ADR | 550,000 | 25,322,000 | |||
| † | Korea Electric Power | 220,420 | 5,265,380 | |||
| *† | Korea Electric Power ADR | 255,400 | 3,041,814 | |||
| KT | 213,064 | 8,511,527 | ||||
| * | KT ADR | 150,000 | 3,051,000 | |||
| * | LG Display ADR | 302,400 | 5,152,896 | |||
| Lotte Chilsung Beverage | 17,000 | 12,140,760 | ||||
| Lotte Confectionery | 6,730 | 8,043,454 | ||||
| * | POSCO ADR | 95,000 | 9,351,800 | |||
| Samsung Electronics | 32,000 | 22,800,492 | ||||
| Samsung Life Insurance | 130,000 | 10,951,516 | ||||
| † | SK Communications | 171,609 | 2,270,862 | |||
| SK Holdings | 64,825 | 7,101,382 | ||||
| SK Telecom | 21,731 | 3,210,524 | ||||
| * | SK Telecom ADR | 660,438 | 11,874,675 | |||
| 146,611,525 | ||||||
| Russia – 7.12% | ||||||
| *†@ | Chelyabinsk Zink Plant GDR | 143,300 | 564,602 | |||
| =†@ | Enel OGK-5 GDR | 21,161 | 95,271 | |||
| * | Gazprom ADR | 1,650,000 | 36,696,000 | |||
| LUKOIL ADR | 150,000 | 8,221,500 | ||||
| MMC Norilsk Nickel ADR | 600,000 | 11,987,940 | ||||
| * | Mobile TeleSystems ADR | 249,750 | 5,237,258 | |||
| Rosneft Oil GDR | 1,300,000 | 8,580,000 | ||||
| @ | Sberbank | 6,226,817 | 19,801,278 | |||
| Surgutneftegaz ADR | 400,000 | 3,727,520 | ||||
| @=† | TGK-5 GDR | 8,771 | 19,355 | |||
| * | VTB Bank GDR | 1,232,482 | 7,838,586 | |||
| 102,769,310 | ||||||
| South Africa – 6.76% | ||||||
| † | Anglo Platinum | 100,000 | 9,331,025 | |||
| ArcelorMittal South Africa | 900,000 | 9,528,658 | ||||
| Blue Label Telecoms | 635,328 | 608,805 | ||||
| * | Gold Fields ADR | 431,300 | 7,198,397 | |||
| Impala Platinum Holdings | 280,000 | 7,991,751 | ||||
| JD Group | 723,137 | 5,556,004 | ||||
37
Statements of net assets
Delaware Emerging Markets Fund
| Number of shares | Value (U.S. $) | |||||
| Common Stock (continued) | ||||||
| South Africa (continued) | ||||||
| Sasol | 272,003 | $ | 12,102,665 | |||
| Standard Bank Group | 1,200,000 | 17,283,486 | ||||
| Sun International | 290,543 | 4,319,505 | ||||
| Tongaat Hulett | 377,000 | 5,630,894 | ||||
| Vodacom Group | 1,930,090 | 18,098,036 | ||||
| 97,649,226 | ||||||
| Taiwan – 6.23% | ||||||
| * | Chunghwa Telecom ADR | 400,000 | 9,644,000 | |||
| † | Evergreen Marine | 6,140,000 | 5,162,006 | |||
| Formosa Chemicals & Fibre | 3,007,002 | 8,903,337 | ||||
| HON HAI Precision Industry | 6,000,000 | 21,317,041 | ||||
| HTC | 425,250 | 11,763,488 | ||||
| President Chain Store | 1,407,372 | 5,674,645 | ||||
| Taiwan Semiconductor Manufacturing | 6,000,000 | 12,434,108 | ||||
| United Microelectronics | 18,000,000 | 8,820,578 | ||||
| † | Walsin Lihwa | 10,711,756 | 6,263,370 | |||
| 89,982,573 | ||||||
| Thailand – 2.51% | ||||||
| Bangkok Bank-Foreign | 1,999,949 | 9,717,285 | ||||
| @ | PTT Exploration & Production-Foreign | 1,131,800 | 6,255,522 | |||
| Siam Cement NVDR | 1,843,843 | 20,227,520 | ||||
| 36,200,327 | ||||||
| Turkey – 2.31% | ||||||
| @† | Alarko Gayrimenkul Yatirim Ortakligi | 97,776 | 1,031,749 | |||
| Alarko Holding | 1,970,440 | 4,453,303 | ||||
| † | Torunlar Gayrimenkul Yatirim Ortakligi | 1,408,698 | 5,713,089 | |||
| Turkcell Iletisim Hizmet | 715,275 | 4,879,128 | ||||
| Turkiye Is Bankasi Class C | 1,020,914 | 3,960,075 | ||||
| † | Turkiye Sise ve Cam Fabrikalari | 4,049,530 | 6,933,681 | |||
| Yazicilar Holding Class A | 832,584 | 6,389,352 | ||||
| 33,360,377 | ||||||
| United Kingdom – 1.42% | ||||||
| Anglo American | 200,000 | 8,771,806 | ||||
| Anglo American ADR | 450,000 | 9,883,080 | ||||
| †@ | Griffin Mining | 3,056,187 | 1,734,894 | |||
| † | Mwana Africa | 781,129 | 111,159 | |||
| 20,500,939 | ||||||
38
| Number of shares | Value (U.S. $) | |||||
| Common Stock (continued) | ||||||
| United States – 9.71% | ||||||
| Archer-Daniels-Midland | 850,000 | $ | 24,641,500 | |||
| * | Bunge | 500,000 | 30,410,000 | |||
| † | Google Class A | 32,000 | 17,782,720 | |||
| *† | MEMC Electronic Materials | 1,277,000 | 14,774,890 | |||
| † | Yahoo | 3,335,000 | 52,592,950 | |||
| 140,202,060 | ||||||
| Total Common Stock (cost $1,236,296,328) | 1,326,199,093 | |||||
| Participation Notes – 0.04% | ||||||
| =†#@ | Lehman Indian Oil CW 12 LEPO 144A | 172,132 | 78,214 | |||
| =†# | Lehman Oil & Natural Gas CW 12 LEPO 144A | 254,590 | 415,000 | |||
| Total Participation Notes (cost $8,559,056) | 493,214 | |||||
| Preferred Stock – 4.77%Δ | ||||||
| Brazil – 3.11% | ||||||
| † | Braskem Class A | 541,994 | 5,748,613 | |||
| Vale Class A 1.96% | 1,400,000 | 39,183,674 | ||||
| 44,932,287 | ||||||
| Republic of Korea – 1.08% | ||||||
| Samsung Electronics 2.02% | 31,362 | 15,646,024 | ||||
| 15,646,024 | ||||||
| Russia – 0.58% | ||||||
| @ | AK Transneft 0.61% | 6,500 | 8,352,500 | |||
| 8,352,500 | ||||||
| Total Preferred Stock (cost $42,991,146) | 68,930,811 | |||||
| Rights – 0.05%Δ | ||||||
| Brazil – 0.00% | ||||||
| @† | Hypermarcas | 200 | 16 | |||
| 16 | ||||||
| China – 0.05% | ||||||
| †@ | Bank of China | 1,700,000 | 306,504 | |||
| † | China Construction Bank | 567,140 | 192,090 | |||
| † | Industrial & Commercial Bank of China | 630,000 | 206,890 | |||
| 705,484 | ||||||
| Total Rights (cost $0) | 705,500 | |||||
39
Statements of net assets
Delaware Emerging Markets Fund
| Principal | |||||||||
| amount (U.S. $) | Value (U.S. $) | ||||||||
| ≠Discount Note – 1.65% | |||||||||
| Federal Home Loan Bank 0.07% 12/1/10 | $ | 23,823,062 | $ | 23,823,062 | |||||
| Total Discount Note (cost $23,823,062) | 23,823,062 | ||||||||
| Total Value of Securities Before Securities | |||||||||
| Lending Collateral – 98.35% (cost $1,311,669,592) | 1,420,151,680 | ||||||||
| Number of shares | |||||||||
| Securities Lending Collateral** – 16.28% | |||||||||
| Investment Companies | |||||||||
| BNY Mellon SL DBT II Liquidating Fund | 436,761 | 424,444 | |||||||
| Delaware Investments Collateral Fund No. 1 | 234,738,541 | 234,738,541 | |||||||
| @†Mellon GSL Reinvestment Trust II | 376,250 | 0 | |||||||
| Total Securities Lending Collateral | |||||||||
| (cost $235,551,552) | 235,162,985 | ||||||||
| Total Value of Securities – 114.63% | |||||||||
| (cost $1,547,221,144) | 1,655,314,665 | © | |||||||
| Obligation to Return Securities | |||||||||
| Lending Collateral** – (16.31%) | (235,551,552 | ) | |||||||
| Receivables and Other Assets | |||||||||
| Net of Liabilities – 1.68% | 24,249,034 | ||||||||
| Net Assets Applicable to 97,775,571 | |||||||||
| Shares Outstanding – 100.00% | $ | 1,444,012,147 | |||||||
| Net Asset Value – Delaware Emerging Markets Fund | |||||||||
| Class A ($546,275,301 / 36,761,109 Shares) | $14.86 | ||||||||
| Net Asset Value – Delaware Emerging Markets Fund | |||||||||
| Class B ($19,029,728 / 1,351,320 Shares) | $14.08 | ||||||||
| Net Asset Value – Delaware Emerging Markets Fund | |||||||||
| Class C ($222,956,732 / 15,868,295 Shares) | $14.05 | ||||||||
| Net Asset Value – Delaware Emerging Markets Fund | |||||||||
| Class R ($440,137 / 29,418 Shares) | $14.96 | ||||||||
| Net Asset Value – Delaware Emerging Markets Fund | |||||||||
| Institutional Class ($655,310,249 / 43,765,429 Shares) | $14.97 | ||||||||
40
| Components of Net Assets at November 30, 2010: | |||
| Shares of beneficial interest (unlimited authorization – no par) | $ | 1,331,308,102 | |
| Undistributed net investment income | 6,999,680 | ||
| Accumulated net realized loss on investments | (3,076,994 | ) | |
| Net unrealized appreciation of investments and foreign currencies | 108,781,359 | ||
| Total net assets | $ | 1,444,012,147 |
| Δ | Securities have been classified by country of origin. Classification by type of business has been presented on page 26 in “Country and sector allocations.” |
| @ | Illiquid security. At November 30, 2010, the aggregate amount of illiquid securities was $82,856,346, which represented 5.74% of the Fund’s net assets. See Note 10 in “Notes to financial statements.” |
| † | Non income producing security. |
| # | Security exempt from registration under Rule 144A of the Securities Act of 1933, as amended. At November 30, 2010, the aggregate amount of Rule 144A securities was $19,050,329, which represented 1.32% of the Fund’s net assets. See Note 10 in “Notes to financial statements.” |
| * | Fully or partially on loan. |
| = | Security is being fair valued in accordance with the Fund’s fair valuation policy. At November 30, 2010, the aggregate amount of fair valued securities was $3,231,430, which represented 0.22% of the Fund’s net assets. See Note 1 in “Notes to financial statements.” |
| ≠ | The rate shown is the effective yield at the time of purchase. |
| ** | See Note 9 in “Notes to financial statements.” |
| © | Includes $226,050,354 of securities loaned. |
Summary of abbreviations:
ADR — American Depositary Receipts
GDR — Global Depositary Receipts
GBP — British Pound Sterling
LEPO — Low Exercise Price Option
MNB — Mellon National Bank
NVDR — Non-Voting Depositary Receipts
USD — United States Dollar
ADR — American Depositary Receipts
GDR — Global Depositary Receipts
GBP — British Pound Sterling
LEPO — Low Exercise Price Option
MNB — Mellon National Bank
NVDR — Non-Voting Depositary Receipts
USD — United States Dollar
41
Statements of net assets
Delaware Emerging Markets Fund
| Net Asset Value and Offering Price Per Share – | ||
| Delaware Emerging Markets Fund | ||
| Net asset value Class A (A) | $ | 14.86 |
| Sales charge (5.75% of offering price) (B) | 0.91 | |
| Offering Price | $ | 15.77 |
| (A) | Net asset value per share, as illustrated, is the amount which would be paid upon redemption or repurchase of shares. | |
| (B) | See the current prospectus for purchases of $50,000 or more. |
1The following foreign currency exchange contract was outstanding at November 30, 2010:
| Foreign Currency Exchange Contract | ||||||||||
| Unrealized | ||||||||||
| Counterparty | Contract to Deliver | In Exchange For | Settlement Date | Depreciation | ||||||
| MNB | GBP 1,706,716 | USD 2,643,874 | 12/2/10 | $10,461 | ||||||
The use of foreign currency exchange contracts involves elements of market risk and risks in excess of the amount recognized in the financial statements. The notional values presented above represent the Fund’s total exposure in such contracts, whereas only the net unrealized appreciation (depreciation) is reflected in the Fund’s net assets.
1See Note 8 in “Notes to financial statements.”
See accompanying Notes, which are an integral part of the financial statements.
42
| Delaware Global Value Fund | November 30, 2010 |
| Number of shares | Value (U.S. $) | |||||
| Common Stock – 99.96%Δ | ||||||
| Australia – 0.97% | ||||||
| Coca-Cola Amatil | 30,673 | $ | 327,124 | |||
| 327,124 | ||||||
| Brazil – 1.72% | ||||||
| Petroleo Brasileiro ADR | 8,000 | 234,240 | ||||
| * | Vale ADR | 11,000 | 348,480 | |||
| 582,720 | ||||||
| Canada – 2.96% | ||||||
| † | CGI Group Class A | 41,207 | 646,305 | |||
| * | TELUS | 7,861 | 356,866 | |||
| 1,003,171 | ||||||
| China/Hong Kong – 6.77% | ||||||
| * | Chaoda Modern Agriculture Holdings | 442,000 | 354,816 | |||
| CNOOC | 226,000 | 486,391 | ||||
| Esprit Holdings | 36,949 | 177,848 | ||||
| *† | Sohu.com | 8,500 | 590,155 | |||
| Techtronic Industries | 162,500 | 176,367 | ||||
| Yue Yuen Industrial Holdings | 140,000 | 505,933 | ||||
| 2,291,510 | ||||||
| Finland – 0.72% | ||||||
| Nokia | 26,277 | 243,018 | ||||
| 243,018 | ||||||
| France – 10.60% | ||||||
| * | Alstom | 8,890 | 365,742 | |||
| * | AXA | 23,333 | 334,164 | |||
| Compagnie de Saint-Gobain | 6,092 | 272,448 | ||||
| * | Lafarge | 4,951 | 269,493 | |||
| * | PPR | 1,666 | 264,658 | |||
| * | Publicis Groupe | 4,847 | 216,562 | |||
| * | Sanofi-Aventis | 5,279 | 320,032 | |||
| Teleperformance | 14,742 | 439,138 | ||||
| * | Total | 8,891 | 431,607 | |||
| Vallourec | 3,465 | 328,212 | ||||
| Vivendi | 14,268 | 347,437 | ||||
| 3,589,493 | ||||||
43
Statements of net assets
Delaware Global Value Fund
| Number of shares | Value (U.S. $) | |||||
| Common Stock (continued) | ||||||
| Germany – 3.26% | ||||||
| Bayerische Motoren Werke | 5,364 | $ | 403,392 | |||
| Deutsche Post | 19,589 | 316,469 | ||||
| Metro | 5,340 | 382,564 | ||||
| 1,102,425 | ||||||
| Italy – 3.19% | ||||||
| Finmeccanica | 31,579 | 356,487 | ||||
| Parmalat | 147,668 | 367,309 | ||||
| UniCredit | 184,468 | 356,591 | ||||
| 1,080,387 | ||||||
| Japan – 5.36% | ||||||
| Asahi Glass | 28,500 | 316,915 | ||||
| Don Quijote | 11,500 | 331,394 | ||||
| ITOCHU | 39,853 | 369,098 | ||||
| Mitsubishi UFJ Financial Group | 52,554 | 249,201 | ||||
| Toyota Motor | 14,150 | 548,527 | ||||
| 1,815,135 | ||||||
| Luxembourg – 0.53% | ||||||
| * | ArcelorMittal | 5,702 | 179,746 | |||
| 179,746 | ||||||
| Netherlands – 0.48% | ||||||
| Koninklijke Philips Electronics | 5,971 | 161,458 | ||||
| 161,458 | ||||||
| Singapore – 0.90% | ||||||
| Singapore Airlines | 26,067 | 304,180 | ||||
| 304,180 | ||||||
| Spain – 2.45% | ||||||
| * | Banco Santander | 40,190 | 383,155 | |||
| Telefonica | 21,007 | 446,174 | ||||
| 829,329 | ||||||
| Sweden – 2.94% | ||||||
| * | Autoliv | 3,500 | 256,970 | |||
| Meda Class A | 59,477 | 445,154 | ||||
| Nordea Bank FDR | 29,381 | 291,900 | ||||
| 994,024 | ||||||
44
| Number of shares | Value (U.S. $) | ||||||
| Common Stock (continued) | |||||||
| Switzerland – 2.43% | |||||||
| Aryzta | 11,835 | $ | 501,307 | ||||
| Novartis | 6,023 | 320,749 | |||||
| 822,056 | |||||||
| Taiwan – 3.33% | |||||||
| Chunghwa Telecom ADR | 12,840 | 309,572 | |||||
| HTC | 29,600 | 818,811 | |||||
| 1,128,383 | |||||||
| United Kingdom – 4.21% | |||||||
| @ | Greggs | 30,344 | 207,208 | ||||
| National Grid | 27,174 | 239,972 | |||||
| Rexam | 63,779 | 299,259 | |||||
| Standard Chartered | 15,897 | 428,178 | |||||
| Vodafone Group | 100,804 | 251,464 | |||||
| 1,426,081 | |||||||
| United States – 47.14% | |||||||
| † | AGCO | 8,200 | 370,148 | ||||
| American Express | 14,400 | 622,368 | |||||
| † | Apollo Group Class A | 10,300 | 350,200 | ||||
| Archer-Daniels-Midland | 17,400 | 504,426 | |||||
| AT&T | 16,700 | 464,093 | |||||
| Ball | 8,300 | 546,804 | |||||
| † | CACI International Class A | 10,900 | 548,597 | ||||
| Carnival | 6,200 | 256,122 | |||||
| Caterpillar | 4,500 | 380,700 | |||||
| * | Chesapeake Energy | 17,500 | 369,600 | ||||
| Chevron | 5,100 | 412,947 | |||||
| Cintas | 17,500 | 468,038 | |||||
| † | Convergys | 38,900 | 501,421 | ||||
| Cooper Industries | 9,000 | 490,500 | |||||
| Corning | 22,300 | 393,818 | |||||
| † | Dell | 37,000 | 489,140 | ||||
| Discover Financial Services | 32,600 | 595,928 | |||||
| FedEx | 4,200 | 382,704 | |||||
| Goldman Sachs Group | 2,800 | 437,192 | |||||
| Intel | 20,100 | 424,512 | |||||
| International Business Machines | 5,700 | 806,321 | |||||
| † | Investment Technology Group | 32,500 | 477,750 | ||||
45
Statements of net assets
Delaware Global Value Fund
Delaware Global Value Fund
| Number of shares | Value (U.S. $) | |||||||
| Common Stock (continued) | ||||||||
| United States (continued) | ||||||||
| JPMorgan Chase | 13,100 | $ | 489,678 | |||||
| Lockheed Martin | 5,900 | 401,436 | ||||||
| Lowe’s | 19,600 | 444,920 | ||||||
| Microsoft | 23,200 | 584,872 | ||||||
| *† | Mylan | 27,100 | 530,212 | |||||
| Omnicom Group | 13,100 | 595,264 | ||||||
| Pfizer | 31,200 | 508,248 | ||||||
| Stanley Black & Decker | 6,822 | 406,114 | ||||||
| Travelers | 9,300 | 502,107 | ||||||
| Viacom Class B | 15,700 | 593,931 | ||||||
| Walgreen | 17,400 | 606,390 | ||||||
| 15,956,501 | ||||||||
| Total Common Stock (cost $31,722,033) | 33,836,741 | |||||||
| Total Value of Securities Before Securities | ||||||||
| Lending Collateral – 99.96% (cost $31,722,033) | 33,836,741 | |||||||
| Securities Lending Collateral** – 13.36% | ||||||||
| Investment Companies | ||||||||
| BNY Mellon SL DBT II Liquidating Fund | 164,649 | 160,006 | ||||||
| Delaware Investments Collateral Fund No. 1 | 4,363,363 | 4,363,363 | ||||||
| @†Mellon GSL Reinvestment Trust II | 142,101 | 0 | ||||||
| Total Securities Lending Collateral (cost $4,670,113) | 4,523,369 | |||||||
| Total Value of Securities – 113.32% | ||||||||
| (cost $36,392,146) | 38,360,110 | © | ||||||
| Obligation to Return Securities | ||||||||
| Lending Collateral** – (13.80%) | (4,670,113 | ) | ||||||
| Receivables and Other Assets | ||||||||
| Net of Liabilities – 0.48% | 160,172 | |||||||
| Net Assets Applicable to 4,097,179 | ||||||||
| Shares Outstanding – 100.00% | $ | 33,850,169 | ||||||
46
| Net Asset Value – Delaware Global Value Fund | ||||||||||
| Class A ($20,843,437 / 2,510,112 Shares) | $ | 8.30 | ||||||||
| Net Asset Value – Delaware Global Value Fund | ||||||||||
| Class B ($3,136,070 / 383,645 Shares) | $ | 8.17 | ||||||||
| Net Asset Value – Delaware Global Value Fund | ||||||||||
| Class C ($8,193,296 / 1,002,248 Shares) | $ | 8.17 | ||||||||
| Net Asset Value – Delaware Global Value Fund | ||||||||||
| Institutional Class ($1,677,366 / 201,174 Shares) | $ | 8.34 | ||||||||
| Components of Net Assets at November 30, 2010: | ||||||||||
| Shares of beneficial interest (unlimited authorization – no par) | $ | 61,764,519 | ||||||||
| Undistributed net investment income | 103,716 | |||||||||
| Accumulated net realized loss on investments | (29,989,429 | ) | ||||||||
| Net unrealized appreciation of investments and foreign currencies | 1,971,363 | |||||||||
| Total net assets | $ | 33,850,169 | ||||||||
| Δ | Securities have been classified by country of origin. Classification by type of business has been presented on page 28 in “Country and sector allocations.” |
| * | Fully or partially on loan. |
| † | Non income producing security. |
| ** | See Note 9 in “Notes to financial statements.” |
| @ | Illiquid security. At November 30, 2010, the aggregate amount of illiquid securities was $207,208, which represented 0.61% of the Fund’s net assets. See Note 10 in “Notes to financial statements.” |
| © | Includes $4,393,812 of securities loaned. |
Summary of abbreviations:
ADR — American Depositary Receipts
FDR — Fiduciary Depositary Receipt
USD — United States Dollar
ADR — American Depositary Receipts
FDR — Fiduciary Depositary Receipt
USD — United States Dollar
47
Statements of net assets
Delaware Global Value Fund
Delaware Global Value Fund
| Net Asset Value and Offering Price Per Share – | |||
| Delaware Global Value Fund | |||
| Net asset value Class A (A) | $ | 8.30 | |
| Sales charge (5.75% of offering price) (B) | 0.51 | ||
| Offering price | $ | 8.81 |
| (A) | Net asset value per share, as illustrated, is the amount which would be paid upon redemption or repurchase of shares. | |
| (B) | See the current prospectus for purchases of $50,000 or more. |
See accompanying Notes, which are an integral part of the financial statements.
48
| Statements of operations | |
| Delaware International Funds | Year Ended November 30, 2010 |
| Delaware | Delaware | Delaware | |||||||||||
| International | Emerging | Global | |||||||||||
| Value Equity | Markets | Value | |||||||||||
| Fund | Fund | Fund | |||||||||||
| Investment Income: | |||||||||||||
| Dividends | $ | 10,082,376 | $ | 29,167,636 | $ | 915,239 | |||||||
| Interest | 2,542 | 137,015 | — | ||||||||||
| Securities lending income | 513,157 | 384,104 | 33,631 | ||||||||||
| Foreign tax withheld | (980,436 | ) | (1,728,728 | ) | (62,583 | ) | |||||||
| 9,617,639 | 27,960,027 | 886,287 | |||||||||||
| Expenses: | |||||||||||||
| Management fees | 2,861,159 | 11,576,165 | 314,881 | ||||||||||
| Dividend disbursing and transfer agent | |||||||||||||
| fees and expenses | 1,288,547 | 1,996,760 | 169,957 | ||||||||||
| Distribution expenses – Class A | 419,141 | 1,350,547 | 67,102 | ||||||||||
| Distribution expenses – Class B | 89,588 | 191,781 | 35,811 | ||||||||||
| Distribution expenses – Class C | 483,038 | 1,877,649 | 94,144 | ||||||||||
| Distribution expenses – Class R | 17,974 | 704 | — | ||||||||||
| Custodian fees | 138,120 | 539,658 | 40,669 | ||||||||||
| Accounting and administration expenses | 133,500 | 375,091 | 14,694 | ||||||||||
| Registration fees | 75,516 | 266,898 | 55,443 | ||||||||||
| Reports and statements to shareholders | 52,085 | 158,743 | 12,836 | ||||||||||
| Legal fees | 38,938 | 88,921 | 4,306 | ||||||||||
| Audit and tax | 26,629 | 58,808 | 13,254 | ||||||||||
| Trustees’ fees | 20,401 | 53,839 | 2,359 | ||||||||||
| Insurance fees | 15,543 | 30,440 | 1,759 | ||||||||||
| Dues and services | 23,962 | 21,686 | 19,298 | ||||||||||
| Consulting fees | 4,676 | 11,845 | 535 | ||||||||||
| Pricing fees | 6,599 | 10,722 | 6,224 | ||||||||||
| Trustees’ expenses | 1,569 | 3,693 | 167 | ||||||||||
| 5,696,985 | 18,613,950 | 853,439 | |||||||||||
| Less fees waived | (146,912 | ) | — | (173,308 | ) | ||||||||
| Less waived distribution expenses – Class A | — | (225,477 | ) | (11,199 | ) | ||||||||
| Less waived distribution expenses – Class R | (2,967 | ) | (117 | ) | — | ||||||||
| Less expense paid indirectly | (1,582 | ) | (2,491 | ) | (286 | ) | |||||||
| Total operating expenses | 5,545,524 | 18,385,865 | 668,646 | ||||||||||
| Net Investment Income | 4,072,115 | 9,574,162 | 217,641 | ||||||||||
50
| Delaware | Delaware | Delaware | ||||||||||
| International | Emerging | Global | ||||||||||
| Value Equity | Markets | Value | ||||||||||
| Fund | Fund | Fund | ||||||||||
| Net Realized and Unrealized | ||||||||||||
| Gain (Loss) on Investments | ||||||||||||
| and Foreign Currencies: | ||||||||||||
| Net realized gain (loss) on: | ||||||||||||
| Investments | $ | 10,818,744 | $ | 16,671,773 | $ | 351,185 | ||||||
| Foreign currencies | (30,580 | ) | (1,009,082 | ) | (38,346 | ) | ||||||
| Foreign currency exchange contracts | (1,041,553 | ) | (1,215,860 | ) | (35,739 | ) | ||||||
| Net realized gain | 9,746,611 | 14,446,831 | 277,100 | |||||||||
| Net change in unrealized appreciation/ | ||||||||||||
| depreciation of investments | ||||||||||||
| and foreign currencies | (941,935 | ) | 106,045,960 | 964,932 | ||||||||
| Net Realized and Unrealized Gain on | ||||||||||||
| Investments and Foreign Currencies | 8,804,676 | 120,492,791 | 1,242,032 | |||||||||
| Net Increase in Net Assets Resulting | ||||||||||||
| from Operations | $ | 12,876,791 | $ | 130,066,953 | $ | 1,459,673 | ||||||
See accompanying Notes, which are an integral part of the financial statements.
51
Statements of changes in net assets
Delaware International Value Equity Fund
Delaware International Value Equity Fund
| Year Ended | ||||||||
| 11/30/10 | 11/30/09 | |||||||
| Increase (Decrease) in Net Assets from Operations: | ||||||||
| Net investment income | $ | 4,072,115 | $ | 8,313,361 | ||||
| Net realized gain (loss) on investments | ||||||||
| and foreign currencies | 9,746,611 | (116,077,253 | ) | |||||
| Net change in unrealized appreciation/depreciation | ||||||||
| of investments and foreign currencies | (941,935 | ) | 236,758,415 | |||||
| Net increase in net assets resulting from operations | 12,876,791 | 128,994,523 | ||||||
| Dividends and Distributions to Shareholders from: | ||||||||
| Net investment income: | ||||||||
| Class A | (3,100,163 | ) | (6,521,227 | ) | ||||
| Class B | (155,771 | ) | (300,650 | ) | ||||
| Class C | (795,505 | ) | (1,386,689 | ) | ||||
| Class R | (55,397 | ) | (43,071 | ) | ||||
| Institutional Class | (3,166,321 | ) | (5,973,195 | ) | ||||
| (7,273,157 | ) | (14,224,832 | ) | |||||
| Capital Share Transactions: | ||||||||
| Proceeds from shares sold: | ||||||||
| Class A | 11,233,986 | 18,572,918 | ||||||
| Class B | 173,613 | 200,347 | ||||||
| Class C | 2,896,279 | 3,618,349 | ||||||
| Class R | 752,628 | 1,584,095 | ||||||
| Institutional Class | 29,263,858 | 11,650,494 | ||||||
| Net asset value of shares issued upon reinvestment | ||||||||
| of dividends and distributions: | ||||||||
| Class A | 2,840,064 | 6,085,510 | ||||||
| Class B | 143,120 | 284,879 | ||||||
| Class C | 747,519 | 1,323,779 | ||||||
| Class R | 55,397 | 43,071 | ||||||
| Institutional Class | 3,117,321 | 5,951,192 | ||||||
| 51,223,785 | 49,314,634 | |||||||
52
| Year Ended | ||||||||
| 11/30/10 | 11/30/09 | |||||||
| Capital Share Transactions (continued): | ||||||||
| Cost of shares repurchased: | ||||||||
| Class A | $ | (39,399,111 | ) | $ | (98,071,991 | ) | ||
| Class B | (3,516,795 | ) | (4,365,200 | ) | ||||
| Class C | (14,708,670 | ) | (18,772,886 | ) | ||||
| Class R | (688,411 | ) | (609,984 | ) | ||||
| Institutional Class | (40,028,000 | ) | (66,873,100 | ) | ||||
| (98,340,987 | ) | (188,693,161 | ) | |||||
| Decrease in net assets derived from | ||||||||
| capital share transactions | (47,117,202 | ) | (139,378,527 | ) | ||||
| Net Decrease in Net Assets | (41,513,568 | ) | (24,608,836 | ) | ||||
| Net Assets: | ||||||||
| Beginning of year | 363,561,017 | 388,169,853 | ||||||
| End of year | $ | 322,047,449 | $ | 363,561,017 | ||||
| Undistributed net investment income | $ | 2,917,518 | $ | 7,190,693 | ||||
See accompanying Notes, which are an integral part of the financial statements.
53
Statements of changes in net assets
Delaware Emerging Markets Fund
Delaware Emerging Markets Fund
| Year Ended | ||||||||
| 11/30/10 | 11/30/09 | |||||||
| Increase (Decrease) in Net Assets from Operations: | ||||||||
| Net investment income | $ | 9,574,162 | $ | 1,432,648 | ||||
| Net realized gain (loss) on investments | ||||||||
| and foreign currencies | 14,446,831 | (18,905,848 | ) | |||||
| Net change in unrealized appreciation/depreciation | ||||||||
| of investments and foreign currencies | 106,045,960 | 297,426,411 | ||||||
| Net increase in net assets resulting from operations | 130,066,953 | 279,953,211 | ||||||
| Dividends and Distributions to Shareholders from: | ||||||||
| Net investment income: | ||||||||
| Class A | (157,722 | ) | (415,388 | ) | ||||
| Class R1,2 | — | — | ||||||
| Institutional Class | (360,097 | ) | (284,008 | ) | ||||
| Net realized gain on investments: | ||||||||
| Class A | — | (21,325,001 | ) | |||||
| Class B | — | (1,505,363 | ) | |||||
| Class C | — | (8,646,856 | ) | |||||
| Institutional Class | — | (4,583,103 | ) | |||||
| (517,819 | ) | (36,759,719 | ) | |||||
| Capital Share Transactions: | ||||||||
| Proceeds from shares sold: | ||||||||
| Class A | 282,988,286 | 132,947,076 | ||||||
| Class B | 687,127 | 574,995 | ||||||
| Class C | 76,058,758 | 41,236,063 | ||||||
| Class R2 | 443,415 | 181 | ||||||
| Institutional Class | 539,949,337 | 70,955,580 | ||||||
54
| Year Ended | |||||||
| 11/30/10 | 11/30/09 | ||||||
| Capital Share Transactions (continued): | |||||||
| Net asset value of shares issued upon reinvestment | |||||||
| of dividends and distributions: | |||||||
| Class A | $ | 143,191 | $ | 20,094,969 | |||
| Class B | — | 1,361,700 | |||||
| Class C | — | 8,062,548 | |||||
| Institutional Class | 278,887 | 4,749,439 | |||||
| 900,549,001 | 279,982,551 | ||||||
| Cost of shares repurchased: | |||||||
| Class A | (200,070,325 | ) | (103,792,285 | ) | |||
| Class B | (4,267,451 | ) | (4,455,109 | ) | |||
| Class C | (35,088,651 | ) | (28,667,770 | ) | |||
| Class R2 | (9,594 | ) | (1 | ) | |||
| Institutional Class | (72,557,094 | ) | (18,688,221 | ) | |||
| (311,993,115 | ) | (155,603,386 | ) | ||||
| Increase in net assets derived from | |||||||
| capital share transactions | 588,555,886 | 124,379,165 | |||||
| Net Increase in Net Assets | 718,105,020 | 367,572,657 | |||||
| Net Assets: | |||||||
| Beginning of year | 725,907,127 | 358,334,470 | |||||
| End of year | $ | 1,444,012,147 | $ | 725,907,127 | |||
| Undistributed net investment income | $ | 6,999,680 | $ | 210,988 | |||
| 1 For the year ended November 30, 2010, net investment income distributions of $0.005 per share was made by the Fund, which rounded to less than $1. |
| 2 Class R commenced operations on August 31, 2009. |
See accompanying Notes, which are an integral part of the financial statements.
55
Statements of changes in net assets
Delaware Global Value Fund
| Year Ended | |||||||
| 11/30/10 | 11/30/09 | ||||||
| Increase (Decrease) in Net Assets from Operations: | |||||||
| Net investment income | $ | 217,641 | $ | 514,005 | |||
| Net realized gain (loss) on investments | |||||||
| and foreign currencies | 277,100 | (12,531,289 | ) | ||||
| Net change in unrealized appreciation/depreciation | |||||||
| of investments and foreign currencies | 964,932 | 25,250,293 | |||||
| Net increase in net assets resulting from operations | 1,459,673 | 13,233,009 | |||||
| Dividends and Distributions to Shareholders from: | |||||||
| Net investment income: | |||||||
| Class A | (337,530 | ) | (609,676 | ) | |||
| Class B | (32,321 | ) | (65,574 | ) | |||
| Class C | (83,154 | ) | (183,443 | ) | |||
| Institutional Class | (22,003 | ) | (34,178 | ) | |||
| (475,008 | ) | (892,871 | ) | ||||
| Capital Share Transactions: | |||||||
| Proceeds from shares sold: | |||||||
| Class A | 2,566,972 | 3,258,853 | |||||
| Class B | 37,287 | 135,860 | |||||
| Class C | 519,598 | 875,982 | |||||
| Institutional Class | 701,393 | 190,696 | |||||
| Net asset value of shares issued upon reinvestment | |||||||
| of dividends and distributions: | |||||||
| Class A | 300,220 | 548,142 | |||||
| Class B | 26,324 | 55,280 | |||||
| Class C | 73,288 | 163,582 | |||||
| Institutional Class | 21,846 | 33,393 | |||||
| 4,246,928 | 5,261,788 | ||||||
56
| Year Ended | |||||||
| 11/30/10 | 11/30/09 | ||||||
| Capital Share Transactions (continued): | |||||||
| Cost of shares repurchased: | |||||||
| Class A | $ | (7,492,107 | ) | $ | (8,234,329 | ) | |
| Class B | (1,265,780 | ) | (1,313,679 | ) | |||
| Class C | (3,466,665 | ) | (4,856,945 | ) | |||
| Institutional Class | (469,771 | ) | (368,924 | ) | |||
| (12,694,323 | ) | (14,773,877 | ) | ||||
| Decrease in net assets derived from | |||||||
| capital share transactions | (8,447,395 | ) | (9,512,089 | ) | |||
| Net Increase (Decrease) in Net Assets | (7,462,730 | ) | 2,828,049 | ||||
| Net Assets: | |||||||
| Beginning of year | 41,312,899 | 38,484,850 | |||||
| End of year | $ | 33,850,169 | $ | 41,312,899 | |||
| Undistributed net investment income | $ | 103,716 | $ | 435,168 | |||
See accompanying Notes, which are an integral part of the financial statements.
57
Financial highlights
Delaware International Value Equity Fund Class A
Selected data for each share of the Fund outstanding throughout each period were as follows:
| Net asset value, beginning of period |
| Income (loss) from investment operations: |
| Net investment income1 |
| Net realized and unrealized gain (loss) on investments and foreign currencies |
| Total from investment operations |
| Less dividends and distributions from: |
| Net investment income |
| Net realized gain on investments |
| Total dividends and distributions |
| Net asset value, end of period |
| Total return2 |
| Ratios and supplemental data: |
| Net assets, end of period (000 omitted) |
| Ratio of expenses to average net assets |
| Ratio of expenses to average net assets |
| prior to fees waived and expense paid indirectly |
| Ratio of net investment income to average net assets |
| Ratio of net investment income to average net assets |
| prior to fees waived and expense paid indirectly |
| Portfolio turnover |
| 1 The average shares outstanding method has been applied for per share information. |
| 2 Total investment return is based on the change in net asset value of a share during the period and assumes reinvestment of dividends and distributions at net asset value and does not reflect the impact of a sales charge. Total investment return during some of the periods shown reflects a waiver by the manager. Performance would have been lower had the waiver not been in effect. |
See accompanying notes, which are an integral part of the financial statements.
58
| Year Ended | ||||||||||||||||
| 11/30/10 | 11/30/09 | 11/30/08 | 11/30/07 | 11/30/06 | ||||||||||||
| $11.400 | $8.120 | $16.750 | $16.010 | $18.130 | ||||||||||||
| 0.136 | 0.212 | 0.288 | 0.205 | 0.339 | ||||||||||||
| 0.266 | 3.375 | (7.995 | ) | 1.504 | 3.220 | |||||||||||
| 0.402 | 3.587 | (7.707 | ) | 1.709 | 3.559 | |||||||||||
| (0.232 | ) | (0.307 | ) | (0.204 | ) | (0.174 | ) | (0.412 | ) | |||||||
| — | — | (0.719 | ) | (0.795 | ) | (5.267 | ) | |||||||||
| (0.232 | ) | (0.307 | ) | (0.923 | ) | (0.969 | ) | (5.679 | ) | |||||||
| $11.570 | $11.400 | $8.120 | $16.750 | $16.010 | ||||||||||||
| 3.60% | 44.76% | (48.60% | ) | 11.24% | 23.57% | |||||||||||
| $130,865 | $154,721 | $178,072 | $472,533 | $472,803 | ||||||||||||
| 1.65% | 1.52% | 1.40% | 1.40% | 1.41% | ||||||||||||
| 1.69% | 1.78% | 1.49% | 1.40% | 1.43% | ||||||||||||
| 1.21% | 2.33% | 2.19% | 1.25% | 2.05% | ||||||||||||
| 1.17% | 2.07% | 2.10% | 1.25% | 2.03% | ||||||||||||
| 37% | 35% | 32% | 26% | 127% | ||||||||||||
59
Financial highlights
Delaware International Value Equity Fund Class B
Selected data for each share of the Fund outstanding throughout each period were as follows:
| Net asset value, beginning of period |
| Income (loss) from investment operations: |
| Net investment income1 |
| Net realized and unrealized gain (loss) on investments and foreign currencies |
| Total from investment operations |
| Less dividends and distributions from: |
| Net investment income |
| Net realized gain on investments |
| Total dividends and distributions |
| Net asset value, end of period |
| Total return2 |
| Ratios and supplemental data: |
| Net assets, end of period (000 omitted) |
| Ratio of expenses to average net assets |
| Ratio of expenses to average net assets |
| prior to fees waived and expense paid indirectly |
| Ratio of net investment income to average net assets |
| Ratio of net investment income to average net assets |
| prior to fees waived and expense paid indirectly |
| Portfolio turnover |
| 1 The average shares outstanding method has been applied for per share information. |
| 2 Total investment return is based on the change in net asset value of a share during the period and assumes reinvestment of dividends and distributions at net asset value and does not reflect the impact of a sales charge. Total investment return during some of the periods shown reflects a waiver by the manager. Performance would have been lower had the waiver not been in effect. |
See accompanying notes, which are an integral part of the financial statements.
60
| Year Ended | ||||||||||||||||
| 11/30/10 | 11/30/09 | 11/30/08 | 11/30/07 | 11/30/06 | ||||||||||||
| $11.230 | $7.980 | $16.470 | $15.750 | $17.910 | ||||||||||||
| 0.057 | 0.149 | 0.197 | 0.092 | 0.226 | ||||||||||||
| 0.260 | 3.322 | (7.876 | ) | 1.484 | 3.173 | |||||||||||
| 0.317 | 3.471 | (7.679 | ) | 1.576 | 3.399 | |||||||||||
| (0.167 | ) | (0.221 | ) | (0.092 | ) | (0.061 | ) | (0.292 | ) | |||||||
| — | — | (0.719 | ) | (0.795 | ) | (5.267 | ) | |||||||||
| (0.167 | ) | (0.221 | ) | (0.811 | ) | (0.856 | ) | (5.559 | ) | |||||||
| $11.380 | $11.230 | $7.980 | $16.470 | $15.750 | ||||||||||||
| 2.86% | 43.65% | (48.95% | ) | 10.48% | 22.70% | |||||||||||
| $7,670 | $10,796 | $11,227 | $34,520 | $39,834 | ||||||||||||
| 2.35% | 2.22% | 2.10% | 2.10% | 2.11% | ||||||||||||
| 2.39% | 2.48% | 2.19% | 2.10% | 2.13% | ||||||||||||
| 0.51% | 1.63% | 1.49% | 0.55% | 1.35% | ||||||||||||
| 0.47% | 1.37% | 1.40% | 0.55% | 1.33% | ||||||||||||
| 37% | 35% | 32% | 26% | 127% | ||||||||||||
61
Financial highlights
Delaware International Value Equity Fund Class C
Selected data for each share of the Fund outstanding throughout each period were as follows:
| Net asset value, beginning of period |
| Income (loss) from investment operations: |
| Net investment income1 |
| Net realized and unrealized gain (loss) on investments and foreign currencies |
| Total from investment operations |
| Less dividends and distributions from: |
| Net investment income |
| Net realized gain on investments |
| Total dividends and distributions |
| Net asset value, end of period |
| Total return2 |
| Ratios and supplemental data: |
| Net assets, end of period (000 omitted) |
| Ratio of expenses to average net assets |
| Ratio of expenses to average net assets |
| prior to fees waived and expense paid indirectly |
| Ratio of net investment income to average net assets |
| Ratio of net investment income to average net assets |
| prior to fees waived and expense paid indirectly |
| Portfolio turnover |
| 1 The average shares outstanding method has been applied for per share information. |
| 2 Total investment return is based on the change in net asset value of a share during the period and assumes reinvestment of dividends and distributions at net asset value and does not reflect the impact of a sales charge. Total investment return during some of the periods shown reflects a waiver by the manager. Performance would have been lower had the waiver not been in effect. |
See accompanying notes, which are an integral part of the financial statements.
62
| Year Ended | ||||||||||||||||
| 11/30/10 | 11/30/09 | 11/30/08 | 11/30/07 | 11/30/06 | ||||||||||||
| $11.220 | $7.960 | $16.450 | $15.730 | $17.890 | ||||||||||||
| 0.056 | 0.149 | 0.197 | 0.092 | 0.226 | ||||||||||||
| 0.261 | 3.332 | (7.876 | ) | 1.484 | 3.173 | |||||||||||
| 0.317 | 3.481 | (7.679 | ) | 1.576 | 3.399 | |||||||||||
| (0.167 | ) | (0.221 | ) | (0.092 | ) | (0.061 | ) | (0.292 | ) | |||||||
| — | — | (0.719 | ) | (0.795 | ) | (5.267 | ) | |||||||||
| (0.167 | ) | (0.221 | ) | (0.811 | ) | (0.856 | ) | (5.559 | ) | |||||||
| $11.370 | $11.220 | $7.960 | $16.450 | $15.730 | ||||||||||||
| 2.87% | 43.71% | (49.01% | ) | 10.50% | 22.73% | |||||||||||
| $43,620 | $54,235 | $51,420 | $144,106 | $144,298 | ||||||||||||
| 2.35% | 2.22% | 2.10% | 2.10% | 2.11% | ||||||||||||
| 2.39% | 2.48% | 2.19% | 2.10% | 2.13% | ||||||||||||
| 0.51% | 1.63% | 1.49% | 0.55% | 1.35% | ||||||||||||
| 0.47% | 1.37% | 1.40% | 0.55% | 1.33% | ||||||||||||
| 37% | 35% | 32% | 26% | 127% | ||||||||||||
63
Financial highlights
Delaware International Value Equity Fund Class R
Selected data for each share of the Fund outstanding throughout each period were as follows:
| Net asset value, beginning of period |
| Income (loss) from investment operations: |
| Net investment income1 |
| Net realized and unrealized gain (loss) on investments and foreign currencies |
| Total from investment operations |
| Less dividends and distributions from: |
| Net investment income |
| Net realized gain on investments |
| Total dividends and distributions |
| Net asset value, end of period |
| Total return2 |
| Ratios and supplemental data: |
| Net assets, end of period (000 omitted) |
| Ratio of expenses to average net assets |
| Ratio of expenses to average net assets |
| prior to fees waived and expense paid indirectly |
| Ratio of net investment income to average net assets |
| Ratio of net investment income to average net assets |
| prior to fees waived and expense paid indirectly |
| Portfolio turnover |
| 1 The average shares outstanding method has been applied for per share information. |
| 2 Total investment return is based on the change in net asset value of a share during the period and assumes reinvestment of dividends and distributions at net asset value. Total investment return during all of the periods shown reflects waivers by the manager and/or distributor. Performance would have been lower had the waivers not been in effect. |
See accompanying notes, which are an integral part of the financial statements.
64
| Year Ended | ||||||||||||||||
| 11/30/10 | 11/30/09 | 11/30/08 | 11/30/07 | 11/30/06 | ||||||||||||
| $11.360 | $8.080 | $16.670 | $15.930 | $18.050 | ||||||||||||
| 0.112 | 0.192 | 0.261 | 0.173 | 0.308 | ||||||||||||
| 0.259 | 3.370 | (7.960 | ) | 1.504 | 3.207 | |||||||||||
| 0.371 | 3.562 | (7.699 | ) | 1.677 | 3.515 | |||||||||||
| (0.211 | ) | (0.282 | ) | (0.172 | ) | (0.142 | ) | (0.368 | ) | |||||||
| — | — | (0.719 | ) | (0.795 | ) | (5.267 | ) | |||||||||
| (0.211 | ) | (0.282 | ) | (0.891 | ) | (0.937 | ) | (5.635 | ) | |||||||
| $11.520 | $11.360 | $8.080 | $16.670 | $15.930 | ||||||||||||
| 3.32% | 44.55% | (48.70% | ) | 11.07% | 23.33% | |||||||||||
| $3,127 | $2,985 | $1,259 | $3,076 | $4,575 | ||||||||||||
| 1.85% | 1.72% | 1.60% | 1.60% | 1.61% | ||||||||||||
| 1.99% | 2.08% | 1.79% | 1.70% | 1.73% | ||||||||||||
| 1.01% | 2.13% | 1.99% | 1.05% | 1.85% | ||||||||||||
| 0.87% | 1.77% | 1.80% | 0.95% | 1.73% | ||||||||||||
| 37% | 35% | 32% | 26% | 127% | ||||||||||||
65
Financial highlights
Delaware International Value Equity Fund Institutional Class
Delaware International Value Equity Fund Institutional Class
Selected data for each share of the Fund outstanding throughout each period were as follows:
| Net asset value, beginning of period |
| Income (loss) from investment operations: |
| Net investment income1 |
| Net realized and unrealized gain (loss) on investments and foreign currencies |
| Total from investment operations |
| Less dividends and distributions from: |
| Net investment income |
| Net realized gain on investments |
| Total dividends and distributions |
| Net asset value, end of period |
| Total return2 |
| Ratios and supplemental data: |
| Net assets, end of period (000 omitted) |
| Ratio of expenses to average net assets |
| Ratio of expenses to average net assets |
| prior to fees waived and expense paid indirectly |
| Ratio of net investment income to average net assets |
| Ratio of net investment income to average net assets |
| prior to fees waived and expense paid indirectly |
| Portfolio turnover |
1 The average shares outstanding method has been applied for per share information. |
2 Total investment return is based on the change in net asset value of a share during the period and assumes reinvestment of dividends and distributions at net asset value. Total investment return during some of the periods shown reflects a waiver by the manager. Performance would have been lower had the waiver not been in effect. |
See accompanying notes, which are an integral part of the financial statements.
66
| Year Ended | ||||||||||||||||
| 11/30/10 | 11/30/09 | 11/30/08 | 11/30/07 | 11/30/06 | ||||||||||||
| $11.450 | $8.170 | $16.850 | $16.100 | $18.210 | ||||||||||||
| 0.170 | 0.239 | 0.327 | 0.255 | 0.389 | ||||||||||||
| 0.270 | 3.385 | (8.034 | ) | 1.513 | 3.233 | |||||||||||
| 0.440 | 3.624 | (7.707 | ) | 1.768 | 3.622 | |||||||||||
| (0.260 | ) | (0.344 | ) | (0.254 | ) | (0.223 | ) | (0.465 | ) | |||||||
| — | — | (0.719 | ) | (0.795 | ) | (5.267 | ) | |||||||||
| (0.260 | ) | (0.344 | ) | (0.973 | ) | (1.018 | ) | (5.732 | ) | |||||||
| $11.630 | $11.450 | $8.170 | $16.850 | $16.100 | ||||||||||||
| 3.93% | 45.13% | (48.44% | ) | 11.59% | 23.93% | |||||||||||
| $136,765 | $140,824 | $146,192 | $399,014 | $355,347 | ||||||||||||
| 1.35% | 1.22% | 1.10% | 1.10% | 1.11% | ||||||||||||
| 1.39% | 1.48% | 1.19% | 1.10% | 1.13% | ||||||||||||
| 1.51% | 2.63% | 2.49% | 1.55% | 2.35% | ||||||||||||
| 1.47% | 2.37% | 2.40% | 1.55% | 2.33% | ||||||||||||
| 37% | 35% | 32% | 26% | 127% | ||||||||||||
67
Financial highlights
Delaware Emerging Markets Fund Class A
Delaware Emerging Markets Fund Class A
Selected data for each share of the Fund outstanding throughout each period were as follows:
| Net asset value, beginning of period |
| Income (loss) from investment operations: |
| Net investment income1 |
| Net realized and unrealized gain (loss) on investments and foreign currencies |
| Total from investment operations |
| Less dividends and distributions from: |
| Net investment income |
| Net realized gain on investments |
| Total dividends and distributions |
| Net asset value, end of period |
| Total return2 |
| Ratios and supplemental data: |
| Net assets, end of period (000 omitted) |
| Ratio of expenses to average net assets |
| Ratio of expenses to average net assets |
| prior to fees waived and expense paid indirectly |
| Ratio of net investment income to average net assets |
| Ratio of net investment income to average net assets |
| prior to fees waived and expense paid indirectly |
| Portfolio turnover |
1 The average shares outstanding method has been applied for per share information. |
2 Total investment return is based on the change in net asset value of a share during the period and assumes reinvestment of dividends and distributions at net asset value and does not reflect the impact of a sales charge. Total investment return during all of the periods shown reflects waivers by the manager and/or distributor. Performance would have been lower had the waivers not been in effect. |
See accompanying notes, which are an integral part of the financial statements.
68
| Year Ended | ||||||||||||||||
| 11/30/10 | 11/30/09 | 11/30/08 | 11/30/07 | 11/30/06 | ||||||||||||
| $12.880 | $7.940 | $22.760 | $21.280 | $17.950 | ||||||||||||
| 0.151 | 0.043 | 0.137 | 0.184 | 0.419 | ||||||||||||
| 1.834 | 5.736 | (9.242 | ) | 7.117 | 4.080 | |||||||||||
| 1.985 | 5.779 | (9.105 | ) | 7.301 | 4.499 | |||||||||||
| (0.005 | ) | (0.016 | ) | (0.234 | ) | (0.523 | ) | (0.269 | ) | |||||||
| — | (0.823 | ) | (5.481 | ) | (5.298 | ) | (0.900 | ) | ||||||||
| (0.005 | ) | (0.839 | ) | (5.715 | ) | (5.821 | ) | (1.169 | ) | |||||||
| $14.860 | $12.880 | $7.940 | $22.760 | $21.280 | ||||||||||||
| 15.42% | 79.84% | (53.37% | ) | 46.11% | 26.52% | |||||||||||
| $546,275 | $399,840 | $213,581 | $673,309 | $533,042 | ||||||||||||
| 1.85% | 1.91% | 1.83% | 1.97% | 1.94% | ||||||||||||
| 1.90% | 1.98% | 1.88% | 2.02% | 1.99% | ||||||||||||
| 1.10% | 0.45% | 0.94% | 0.97% | 2.23% | ||||||||||||
| 1.05% | 0.38% | 0.89% | 0.92% | 2.18% | ||||||||||||
| 27% | 37% | 37% | 108% | 46% | ||||||||||||
69
Financial highlights
Delaware Emerging Markets Fund Class B
Delaware Emerging Markets Fund Class B
Selected data for each share of the Fund outstanding throughout each period were as follows:
| Net asset value, beginning of period |
| Income (loss) from investment operations: |
| Net investment income (loss)1 |
| Net realized and unrealized gain (loss) on investments and foreign currencies |
| Total from investment operations |
| Less dividends and distributions from: |
| Net investment income |
| Net realized gain on investments |
| Total dividends and distributions |
| Net asset value, end of period |
| Total return2 |
| Ratios and supplemental data: |
| Net assets, end of period (000 omitted) |
| Ratio of expenses to average net assets |
| Ratio of expenses to average net assets |
| prior to fees waived and expense paid indirectly |
| Ratio of net investment income (loss) to average net assets |
| Ratio of net investment income (loss) to average net assets |
| prior to fees waived and expense paid indirectly |
| Portfolio turnover |
1 The average shares outstanding method has been applied for per share information. |
2 Total investment return is based on the change in net asset value of a share during the period and assumes reinvestment of dividends and distributions at net asset value and does not reflect the impact of a sales charge. Total investment return during some of the periods shown reflects a waiver by the manager. Performance would have been lower had the waiver not been in effect. |
See accompanying notes, which are an integral part of the financial statements.
70
| Year Ended | |||||||||||||||
| 11/30/10 | 11/30/09 | 11/30/08 | 11/30/07 | 11/30/06 | |||||||||||
| $12.300 | $7.640 | $22.120 | $20.830 | $17.600 | |||||||||||
| 0.046 | (0.025 | ) | 0.030 | 0.045 | 0.280 | ||||||||||
| 1.734 | 5.508 | (8.936 | ) | 6.926 | 3.998 | ||||||||||
| 1.780 | 5.483 | (8.906 | ) | 6.971 | 4.278 | ||||||||||
| — | — | (0.093 | ) | (0.383 | ) | (0.148 | ) | ||||||||
| — | (0.823 | ) | (5.481 | ) | (5.298 | ) | (0.900 | ) | |||||||
| — | (0.823 | ) | (5.574 | ) | (5.681 | ) | (1.048 | ) | |||||||
| $14.080 | $12.300 | $7.640 | $22.120 | $20.830 | |||||||||||
| 14.47% | 78.59% | (53.76% | ) | 44.97% | 25.59% | ||||||||||
| $19,030 | $20,022 | $14,620 | $45,978 | $37,944 | |||||||||||
| 2.60% | 2.66% | 2.58% | 2.72% | 2.69% | |||||||||||
| 2.60% | 2.68% | 2.58% | 2.72% | 2.69% | |||||||||||
| 0.35% | (0.30% | ) | 0.19% | 0.22% | 1.48% | ||||||||||
| 0.35% | (0.32% | ) | 0.19% | 0.22% | 1.48% | ||||||||||
| 27% | 37% | 37% | 108% | 46% | |||||||||||
71
Financial highlights
Delaware Emerging Markets Fund Class C
Delaware Emerging Markets Fund Class C
Selected data for each share of the Fund outstanding throughout each period were as follows:
| Net asset value, beginning of period |
| Income (loss) from investment operations: |
| Net investment income (loss)1 |
| Net realized and unrealized gain (loss) on investments and foreign currencies |
| Total from investment operations |
| Less dividends and distributions from: |
| Net investment income |
| Net realized gain on investments |
| Total dividends and distributions |
| Net asset value, end of period |
| Total return2 |
| Ratios and supplemental data: |
| Net assets, end of period (000 omitted) |
| Ratio of expenses to average net assets |
| Ratio of expenses to average net assets |
| prior to fees waived and expense paid indirectly |
| Ratio of net investment income (loss) to average net assets |
| Ratio of net investment income (loss) to average net assets |
| prior to fees waived and expense paid indirectly |
| Portfolio turnover |
1 The average shares outstanding method has been applied for per share information. |
2 Total investment return is based on the change in net asset value of a share during the period and assumes reinvestment of dividends and distributions at net asset value and does not reflect the impact of a sales charge. Total investment return during some of the periods shown reflects a waiver by the manager. Performance would have been lower had the waiver not been in effect. |
See accompanying notes, which are an integral part of the financial statements.
72
| Year Ended | |||||||||||||||
| 11/30/10 | 11/30/09 | 11/30/08 | 11/30/07 | 11/30/06 | |||||||||||
| $12.270 | $7.630 | $22.090 | $20.800 | $17.580 | |||||||||||
| 0.046 | (0.026 | ) | 0.031 | 0.045 | 0.280 | ||||||||||
| 1.734 | 5.489 | (8.917 | ) | 6.926 | 3.988 | ||||||||||
| 1.780 | 5.463 | (8.886 | ) | 6.971 | 4.268 | ||||||||||
| — | — | (0.093 | ) | (0.383 | ) | (0.148 | ) | ||||||||
| — | (0.823 | ) | (5.481 | ) | (5.298 | ) | (0.900 | ) | |||||||
| — | (0.823 | ) | (5.574 | ) | (5.681 | ) | (1.048 | ) | |||||||
| $14.050 | $12.270 | $7.630 | $22.090 | $20.800 | |||||||||||
| 14.51% | 78.68% | (53.75% | ) | 45.03% | 25.56% | ||||||||||
| $222,957 | $157,383 | $84,436 | $237,832 | $183,562 | |||||||||||
| 2.60% | 2.66% | 2.58% | 2.72% | 2.69% | |||||||||||
| 2.60% | 2.68% | 2.58% | 2.72% | 2.69% | |||||||||||
| 0.35% | (0.30% | ) | 0.19% | 0.22% | 1.48% | ||||||||||
| 0.35% | (0.32% | ) | 0.19% | 0.22% | 1.48% | ||||||||||
| 27% | 37% | 37% | 108% | 46% | |||||||||||
73
Financial highlights
Delaware Emerging Markets Fund Class R
Delaware Emerging Markets Fund Class R
Selected data for each share of the Fund outstanding throughout each period were as follows:
| Year Ended | 8/31/091 | |||||
| 11/30/10 | to 11/30/09 | |||||
| Net asset value, beginning of period | $13.010 | $11.520 | ||||
| Income (loss) from investment operations: | ||||||
| Net investment income (loss)2 | 0.123 | (0.030 | ) | |||
| Net realized and unrealized gain on investments | ||||||
| and foreign currencies | 1.832 | 1.520 | ||||
| Total from investment operations | 1.955 | 1.490 | ||||
| Less dividends and distributions from: | ||||||
| Net investment income | (0.005 | ) | — | |||
| Total dividends and distributions | (0.005 | ) | — | |||
| Net asset value, end of period | $14.960 | $13.010 | ||||
| Total return3 | 15.03% | 12.93% | ||||
| Ratios and supplemental data: | ||||||
| Net assets, end of period (000 omitted) | $440 | $— | 4 | |||
| Ratio of expenses to average net assets | 2.10% | 2.11% | ||||
| Ratio of expenses to average net assets | ||||||
| prior to fees waived and expense paid indirectly | 2.20% | 2.22% | ||||
| Ratio of net investment income (loss) to average net assets | 0.85% | (0.88% | ) | |||
| Ratio of net investment income (loss) to average net assets | ||||||
| prior to fees waived and expense paid indirectly | 0.75% | (0.99% | ) | |||
| Portfolio turnover | 27% | 37% | 5 | |||
1 Date of commencement of operations; ratios have been annualized and total return has not been annualized. |
2 The average shares outstanding method has been applied for per share information. |
3 Total investment return is based on the change in net asset value of a share during the period and assumes reinvestment of dividends and distributions at net asset value. Total investment return during all of the periods shown reflects waivers by the manager and/or distributor. Performance would have been lower had the waivers not been in effect. |
4 Net assets was less than $500. |
5 Portfolio turnover is representative of the Fund for the entire year. |
See accompanying notes, which are an integral part of the financial statements.
74
Financial highlights
Delaware Emerging Markets Fund Institutional Class
Delaware Emerging Markets Fund Institutional Class
Selected data for each share of the Fund outstanding throughout each period were as follows:
| Net asset value, beginning of period |
| Income (loss) from investment operations: |
| Net investment income1 |
| Net realized and unrealized gain (loss) on investments and foreign currencies |
| Total from investment operations |
| Less dividends and distributions from: |
| Net investment income |
| Net realized gain on investments |
| Total dividends and distributions |
| Net asset value, end of period |
| Total return2 |
| Ratios and supplemental data: |
| Net assets, end of period (000 omitted) |
| Ratio of expenses to average net assets |
| Ratio of expenses to average net assets |
| prior to fees waived and expense paid indirectly |
| Ratio of net investment income to average net assets |
| Ratio of net investment income to average net assets |
| prior to fees waived and expense paid indirectly |
| Portfolio turnover |
1 The average shares outstanding method has been applied for per share information.
2 Total investment return is based on the change in net asset value of a share during the period and assumes reinvestment of dividends and distributions at net asset value. Total investment return during some of the periods shown reflects a waiver by the manager. Performance would have been lower had the waiver not been in effect.
See accompanying notes, which are an integral part of the financial statements.
76
| Year Ended | |||||||||||||||
| 11/30/10 | 11/30/09 | 11/30/08 | 11/30/07 | 11/30/06 | |||||||||||
| $12.980 | $8.000 | $22.910 | $21.390 | $18.030 | |||||||||||
| 0.190 | 0.068 | 0.175 | 0.232 | 0.466 | |||||||||||
| 1.831 | 5.786 | (9.321 | ) | 7.157 | 4.104 | ||||||||||
| 2.021 | 5.854 | (9.146 | ) | 7.389 | 4.570 | ||||||||||
| (0.031 | ) | (0.051 | ) | (0.283 | ) | (0.571 | ) | (0.310 | ) | ||||||
| — | (0.823 | ) | (5.481 | ) | (5.298 | ) | (0.900 | ) | |||||||
| (0.031 | ) | (0.874 | ) | (5.764 | ) | (5.869 | ) | (1.210 | ) | ||||||
| $14.970 | $12.980 | $8.000 | $22.910 | $21.390 | |||||||||||
| 15.69% | 80.39% | (53.30% | ) | 46.49% | 26.87% | ||||||||||
| $655,310 | $148,662 | $45,697 | $110,327 | $112,964 | |||||||||||
| 1.60% | 1.66% | 1.58% | 1.72% | 1.69% | |||||||||||
| 1.60% | 1.68% | 1.58% | 1.72% | 1.69% | |||||||||||
| 1.35% | 0.70% | 1.19% | 1.22% | 2.48% | |||||||||||
| 1.35% | 0.68% | 1.19% | 1.22% | 2.48% | |||||||||||
| 27% | 37% | 37% | 108% | 46% | |||||||||||
77
Financial highlights
Delaware Global Value Fund Class A
Delaware Global Value Fund Class A
Selected data for each share of the Fund outstanding throughout each period were as follows:
| Net asset value, beginning of period |
| Income (loss) from investment operations: |
| Net investment income1 |
| Net realized and unrealized gain (loss) on investments and foreign currencies |
| Total from investment operations |
| Less dividends and distributions from: |
| Net investment income |
| Net realized gain on investments |
| Total dividends and distributions |
| Net asset value, end of period |
| Total return2 |
| Ratios and supplemental data: |
| Net assets, end of period (000 omitted) |
| Ratio of expenses to average net assets |
| Ratio of expenses to average net assets |
| prior to fees waived and expense paid indirectly |
| Ratio of net investment income to average net assets |
| Ratio of net investment income to average net assets |
| prior to fees waived and expense paid indirectly |
| Portfolio turnover |
1 The average shares outstanding method has been applied for per share information.
2 Total investment return is based on the change in net asset value of a share during the period and assumes reinvestment of dividends and distributions at net asset value and does not reflect the impact of a sales charge. Total investment return during all of the periods shown reflects waivers by the manager and distributor. Performance would have been lower had the waivers not been in effect.
See accompanying notes, which are an integral part of the financial statements.
78
| Year Ended | |||||||||||||||
| 11/30/10 | 11/30/09 | 11/30/08 | 11/30/07 | 11/30/06 | |||||||||||
| $8.050 | $5.790 | $11.850 | $13.260 | $11.660 | |||||||||||
| 0.067 | 0.106 | 0.172 | 0.145 | 0.111 | |||||||||||
| 0.293 | 2.315 | (5.554 | ) | 0.663 | 3.084 | ||||||||||
| 0.360 | 2.421 | (5.382 | ) | 0.808 | 3.195 | ||||||||||
| (0.110 | ) | (0.161 | ) | (0.138 | ) | (0.066 | ) | (0.238 | ) | ||||||
| — | — | (0.540 | ) | (2.152 | ) | (1.357 | ) | ||||||||
| (0.110 | ) | (0.161 | ) | (0.678 | ) | (2.218 | ) | (1.595 | ) | ||||||
| $8.300 | $8.050 | $5.790 | $11.850 | $13.260 | |||||||||||
| 4.53% | 42.14% | (48.12% | ) | 6.96% | 30.83% | ||||||||||
| $20,844 | $24,823 | $22,034 | $66,024 | $36,416 | |||||||||||
| 1.55% | 1.56% | 1.45% | 1.45% | 1.59% | |||||||||||
| 2.07% | 2.09% | 1.76% | 1.57% | 1.88% | |||||||||||
| 0.84% | 1.66% | 1.84% | 1.22% | 0.93% | |||||||||||
| 0.32% | 1.13% | 1.53% | 1.10% | 0.64% | |||||||||||
| 50% | 47% | 78% | 31% | 124% | |||||||||||
79
Financial highlights
Delaware Global Value Fund Class B
Delaware Global Value Fund Class B
Selected data for each share of the Fund outstanding throughout each period were as follows:
| Net asset value, beginning of period |
| Income (loss) from investment operations: |
| Net investment income1 |
| Net realized and unrealized gain (loss) on investments and foreign currencies |
| Total from investment operations |
| Less dividends and distributions from: |
| Net investment income |
| Net realized gain on investments |
| Total dividends and distributions |
| Net asset value, end of period |
| Total return2 |
| Ratios and supplemental data: |
| Net assets, end of period (000 omitted) |
| Ratio of expenses to average net assets |
| Ratio of expenses to average net assets |
| prior to fees waived and expense paid indirectly |
| Ratio of net investment income to average net assets |
| Ratio of net investment income (loss) to average net assets |
| prior to fees waived and expense paid indirectly |
| Portfolio turnover |
1 The average shares outstanding method has been applied for per share information.
2 Total investment return is based on the change in net asset value of a share during the period and assumes reinvestment of dividends and distributions at net asset value and does not reflect the impact of a sales charge. Total investment return during all of the periods shown reflects a waiver by the manager. Performance would have been lower had the waiver not been in effect.
See accompanying notes, which are an integral part of the financial statements.
80
| Year Ended | |||||||||||||||
| 11/30/10 | 11/30/09 | 11/30/08 | 11/30/07 | 11/30/06 | |||||||||||
| $7.940 | $5.680 | $11.640 | $13.070 | $11.510 | |||||||||||
| 0.007 | 0.059 | 0.104 | 0.057 | 0.022 | |||||||||||
| 0.285 | 2.297 | (5.474 | ) | 0.665 | 3.050 | ||||||||||
| 0.292 | 2.356 | (5.370 | ) | 0.722 | 3.072 | ||||||||||
| (0.062 | ) | (0.096 | ) | (0.050 | ) | — | (0.155 | ) | |||||||
| — | — | (0.540 | ) | (2.152 | ) | (1.357 | ) | ||||||||
| (0.062 | ) | (0.096 | ) | (0.590 | ) | (2.152 | ) | (1.512 | ) | ||||||
| $8.170 | $7.940 | $5.680 | $11.640 | $13.070 | |||||||||||
| 3.70% | 41.36% | (48.51% | ) | 6.08% | 29.95% | ||||||||||
| $3,136 | $4,255 | $4,103 | $10,893 | $7,453 | |||||||||||
| 2.30% | 2.31% | 2.20% | 2.20% | 2.34% | |||||||||||
| 2.77% | 2.79% | 2.46% | 2.27% | 2.58% | |||||||||||
| 0.09% | 0.91% | 1.09% | 0.47% | 0.18% | |||||||||||
| (0.38% | ) | 0.43% | 0.83% | 0.40% | (0.06% | ) | |||||||||
| 50% | 47% | 78% | 31% | 124% | |||||||||||
81
Financial highlights
Delaware Global Value Fund Class C
Delaware Global Value Fund Class C
Selected data for each share of the Fund outstanding throughout each period were as follows:
| Net asset value, beginning of period |
| Income (loss) from investment operations: |
| Net investment income1 |
| Net realized and unrealized gain (loss) on investments and foreign currencies |
| Total from investment operations |
| Less dividends and distributions from: |
| Net investment income |
| Net realized gain on investments |
| Total dividends and distributions |
| Net asset value, end of period |
| Total return2 |
| Ratios and supplemental data: |
| Net assets, end of period (000 omitted) |
| Ratio of expenses to average net assets |
| Ratio of expenses to average net assets |
| prior to fees waived and expense paid indirectly |
| Ratio of net investment income to average net assets |
| Ratio of net investment income (loss) to average net assets |
| prior to fees waived and expense paid indirectly |
| Portfolio turnover |
1 The average shares outstanding method has been applied for per share information.
2 Total investment return is based on the change in net asset value of a share during the period and assumes reinvestment of dividends and distributions at net asset value and does not reflect the impact of a sales charge. Total investment return during all of the periods shown reflects a waiver by the manager. Performance would have been lower had the waiver not been in effect.
See accompanying notes, which are an integral part of the financial statements.
82
| Year Ended | |||||||||||||||
| 11/30/10 | 11/30/09 | 11/30/08 | 11/30/07 | 11/30/06 | |||||||||||
| $7.940 | $5.690 | $11.650 | $13.090 | $11.520 | |||||||||||
| 0.007 | 0.059 | 0.102 | 0.057 | 0.022 | |||||||||||
| 0.285 | 2.287 | (5.472 | ) | 0.655 | 3.060 | ||||||||||
| 0.292 | 2.346 | (5.370 | ) | 0.712 | 3.082 | ||||||||||
| (0.062 | ) | (0.096 | ) | (0.050 | ) | — | (0.155 | ) | |||||||
| — | — | (0.540 | ) | (2.152 | ) | (1.357 | ) | ||||||||
| (0.062 | ) | (0.096 | ) | (0.590 | ) | (2.152 | ) | (1.512 | ) | ||||||
| $8.170 | $7.940 | $5.690 | $11.650 | $13.090 | |||||||||||
| 3.70% | 41.12% | (48.51% | ) | 6.17% | 29.92% | ||||||||||
| $8,193 | $10,845 | $11,260 | $39,463 | $17,545 | |||||||||||
| 2.30% | 2.31% | 2.20% | 2.20% | 2.34% | |||||||||||
| 2.77% | 2.79% | 2.46% | 2.27% | 2.58% | |||||||||||
| 0.09% | 0.91% | 1.09% | 0.47% | 0.18% | |||||||||||
| (0.38% | ) | 0.43% | 0.83% | 0.40% | (0.06% | ) | |||||||||
| 50% | 47% | 78% | 31% | 124% | |||||||||||
83
Financial highlights
Delaware Global Value Fund Institutional Class
Delaware Global Value Fund Institutional Class
Selected data for each share of the Fund outstanding throughout each period were as follows:
| Net asset value, beginning of period |
| Income (loss) from investment operations: |
| Net investment income1 |
| Net realized and unrealized gain (loss) on investments and foreign currencies |
| Total from investment operations |
| Less dividends and distributions from: |
| Net investment income |
| Net realized gain on investments |
| Total dividends and distributions |
| Net asset value, end of period |
| Total return2 |
| Ratios and supplemental data: |
| Net assets, end of period (000 omitted) |
| Ratio of expenses to average net assets |
| Ratio of expenses to average net assets |
| prior to fees waived and expense paid indirectly |
| Ratio of net investment income to average net assets |
| Ratio of net investment income to average net assets |
| prior to fees waived and expense paid indirectly |
| Portfolio turnover |
1 The average shares outstanding method has been applied for per share information.
2 Total investment return is based on the change in net asset value of a share during the period and assumes reinvestment of dividends and distributions at net asset value. Total investment return during all of the periods shown reflects a waiver by the manager. Performance would have been lower had the waiver not been in effect.
See accompanying notes, which are an integral part of the financial statements.
84
| Year Ended | |||||||||||||||
| 11/30/10 | 11/30/09 | 11/30/08 | 11/30/07 | 11/30/06 | |||||||||||
| $8.080 | $5.810 | $11.910 | $13.310 | $11.700 | |||||||||||
| 0.087 | 0.123 | 0.195 | 0.176 | 0.141 | |||||||||||
| 0.300 | 2.330 | (5.587 | ) | 0.673 | 3.092 | ||||||||||
| 0.387 | 2.453 | (5.392 | ) | 0.849 | 3.233 | ||||||||||
| (0.127 | ) | (0.183 | ) | (0.168 | ) | (0.097 | ) | (0.266 | ) | ||||||
| — | — | (0.540 | ) | (2.152 | ) | (1.357 | ) | ||||||||
| (0.127 | ) | (0.183 | ) | (0.708 | ) | (2.249 | ) | (1.623 | ) | ||||||
| $8.340 | $8.080 | $5.810 | $11.910 | $13.310 | |||||||||||
| 4.86% | 42.46% | (48.03% | ) | 7.12% | 31.24% | ||||||||||
| $1,677 | $1,390 | $1,088 | $2,398 | $5,193 | |||||||||||
| 1.30% | 1.31% | 1.20% | 1.20% | 1.34% | |||||||||||
| 1.77% | 1.79% | 1.46% | 1.27% | 1.58% | |||||||||||
| 1.09% | 1.91% | 2.09% | 1.47% | 1.18% | |||||||||||
| 0.62% | 1.43% | 1.83% | 1.40% | 0.94% | |||||||||||
| 50% | 47% | 78% | 31% | 124% | |||||||||||
85
| Notes to financial statements | |
| Delaware International Funds | November 30, 2010 |
Delaware Group® Global & International Funds (Trust) is organized as a Delaware statutory trust and offers five series: Delaware International Value Equity Fund, Delaware Emerging Markets Fund, Delaware Global Value Fund, Delaware Focus Global Growth Fund and Delaware Macquarie Global Infrastructure Fund. These financial statements and the related notes pertain to Delaware International Value Equity Fund, Delaware Emerging Markets Fund and Delaware Global Value Fund (each, a Fund or collectively the Funds). The Trust is an open-end investment company. Each Fund is considered diversified under the Investment Company Act of 1940, as amended, and offers Class A, Class B, Class C, Class R and Institutional Class shares. Class A shares are sold with a maximum front-end sales charge of up to 5.75%. Class A share purchases of $1,000,000 or more will incur a contingent deferred sales charge (CDSC) of 1% if redeemed during the first year and 0.50% during the second year, provided that Delaware Distributors, L.P. (DDLP) paid a financial advisor a commission on the purchase of those shares. Class B shares may be purchased only through dividend reinvestment and certain permitted exchanges. Prior to June 1, 2007, Class B shares were sold with a CDSC that declined from 4% to zero depending upon the period of time the shares were held. Class B shares will automatically convert to Class A shares on a quarterly basis approximately eight years after purchase. Class C shares are sold with a CDSC of 1%, if redeemed during the first 12 months. Class R and Institutional Class shares are not subject to a sales charge and are offered for sale exclusively to certain eligible investors. As of November 30, 2010, Delaware Global Value Fund has not commenced operations of its Class R s hares.
The investment objective of Delaware International Value Equity Fund is to seek long-term growth without undue risk to principal.
The investment objective of Delaware Emerging Markets Fund and Delaware Global Value Fund is to seek long-term capital appreciation.
1. Significant Accounting Policies
The following accounting policies are in accordance with U.S. generally accepted accounting principles (U.S. GAAP) and are consistently followed by the Funds.
Security Valuation — Equity securities, except those traded on the Nasdaq Stock Market, Inc. (Nasdaq), are valued at the last quoted sales price as of the time of the regular close of the New York Stock Exchange (NYSE) on the valuation date. Securities traded on the Nasdaq are valued in accordance with the Nasdaq Official Closing Price, which may not be the last sales price. If on a particular day an equity security does not trade, then the mean between the bid and ask prices will be used. Securities listed on a foreign exchange are valued at the last quoted sales price on the valuation date. Short-term debt securities are valued at market value. Inv estment company securities are valued at net asset value per share. Foreign currency exchange contracts are valued at the mean between the bid and ask prices. Interpolated values are derived when the settlement date of the contract is an interim date for which quotations are not available. Generally, other securities and assets for which market quotations are not readily available are valued at fair value as determined in good faith under the direction of each Fund’s Board of Trustees (Board). In determining whether market quotations are readily available or fair valuation will be used, various
86
factors will be taken into consideration, such as market closures, or suspension of trading in a security. The Funds may use fair value pricing more frequently for securities traded primarily in non-U.S. markets because, among other things, most foreign markets close well before each Fund value its securities generally as of 4:00 p.m. Eastern time. The earlier close of these foreign markets gives rise to the possibility that significant events, including broad market moves, government actions or pronouncements, aftermarket trading, or news events may have occurred in the interim. To account for this, the Funds may frequently value foreign securities using fair value prices based on third-party vendor modeling tools (international fair value pricing).
Federal Income Taxes — No provision for federal income taxes has been made as each Fund intends to continue to qualify for federal income tax purposes as a regulated investment company under Subchapter M of the Internal Revenue Code of 1986, as amended, and make the requisite distributions to shareholders. The Funds evaluate tax positions taken or expected to be taken in the course of preparing the Funds’ tax returns to determine whether the tax positions are “more-likely-than-not” of being sustained by the applicable tax authority. Tax positions not deemed to meet the more-likely-than-not threshold are recorded as a tax benefit or expense in the current year. Management has analyzed the Funds’ tax positions taken on federal income tax returns for all open tax years (November 30, 2007 – November 30, 2010), and has concluded that no provision for federal income tax is required in the Funds’ financial statements.
Class Accounting — Investment income, common expenses and realized and unrealized gain (loss) on investments are allocated to the various classes of the Funds on the basis of daily net assets of each class. Distribution expenses relating to a specific class are charged directly to that class.
Foreign Currency Transactions — Transactions denominated in foreign currencies are recorded at the prevailing exchange rates on the valuation date in accordance with each Fund’s prospectus. The value of all assets and liabilities denominated in foreign currencies is translated into U.S. dollars at the exchange rate of such currencies against the U.S. dollar daily. Transaction gains or losses resulting from changes in exchange rates during the reporting period or upon settlement of the foreign currency transaction are reported in operations for the current period. The Funds do not isolate that portion of realized gains and losses on investments which is due to changes in the foreign exchange rates from that which are due to changes in market prices. The changes are included with the net realized and unrealized gain or loss on investments. The Funds report certain foreign currency related transactions as components of realized gains (losses) for financial reporting purposes, whereas such components are treated as ordinary income (loss) for federal income tax purposes.
Use of Estimates — The preparation of financial statements in conformity with U.S. GAAP requires management to make estimates and assumptions that affect the reported amounts of assets and liabilities and disclosure of contingent assets and liabilities at the date of the financial statements and the reported amounts of revenues and expenses during the reporting period. Actual results could differ from those estimates and the differences could be material.
87
Notes to financial statements
Delaware International Funds
Delaware International Funds
1. Significant Accounting Policies (continued)
Other — Expenses directly attributable to the Funds are charged directly to the Funds. Other expenses common to various funds within the Delaware Investments® Family of Funds are generally allocated amongst such funds on the basis of average net assets. Management fees and some other expenses are paid monthly. Security transactions are recorded on the date the securities are purchased or sold (trade date) for the financial reporting purposes. Costs used in calculating realized gains and losses on the sale of investment securities are those of the specific securities sold. Dividend income is recorded on the ex-dividend date and interest income is recorded on the accrual basis. Taxable non-cash dividends are recorded as dividend income. Foreign dividends are also recorded on the ex-dividend date or as soon after the ex-dividend date that the Funds are aware of such dividends, net of all non-rebatable tax withholdings. Withholding taxes on foreign dividends have been recorded in accordance with each Fund’s understanding of the applicable country’s tax rules and rates. Each Fund declares and pays dividends from net investment income and distributions from net realized gain on investments, if any, annually. Dividends and distributions, if any, are recorded on the ex-dividend date.
The Funds may receive earnings credits from their custodian when positive cash balances are maintained, which are used to offset custody fees. There were no earnings credits for the year ended November 30, 2010.
The Funds receive earnings credits from their transfer agent when positive cash balances are maintained, which are used to offset transfer agent fees. The expense paid under this arrangement is included in dividend disbursing and transfer agent fees and expenses on the statements of operations with the corresponding expense offset shown as “expense paid indirectly.” For the year ended November 30, 2010, each Fund earned the following amounts under this agreement:
| Delaware International | Delaware Emerging | Delaware Global | |||
| Value Equity Fund | Markets Fund | Value Fund | |||
| $1,582 | $2,491 | $286 |
2. Investment Management, Administration Agreements and Other Transactions with Affiliates
In accordance with the terms of its respective Investment Management Agreement, each Fund pays Delaware Management Company (DMC), a series of Delaware Management Business Trust and the investment manager, an annual fee based on each Fund’s average daily net assets as follows:
| Delaware International | Delaware Emerging | Delaware Global | |||
| Value Equity Fund | Markets Fund | Value Fund | |||
| On the first $500 million | 0.85% | 1.25% | 0.85% | ||
| On the next $500 million | 0.80% | 1.20% | 0.80% | ||
| On the next $1.5 billion | 0.75% | 1.15% | 0.75% | ||
| In excess of $2.5 billion | 0.70% | 1.10% | 0.70% |
88
Effective March 30, 2010, DMC has contractually agreed to waive that portion, if any, of its management fee and reimburse each Fund to the extent necessary to ensure that total annual operating expenses, (excluding any 12b-1 plan expenses and certain other expenses), do not exceed specified percentages of average daily net assets through March 30, 2011 as shown below. These waivers and reimbursements may be terminated only by agreement of the Manager and the Funds. Prior to March 30, 2010, these waivers were voluntary.
| Delaware International | Delaware Emerging | Delaware Global | |||
| Value Equity Fund | Markets Fund | Value Fund | |||
| Contractual operating expense | |||||
| limitation as a percentage of | |||||
| average net assets effective as of | |||||
| March 30, 2010 | 1.35% | 1.75% | 1.30% |
Delaware Service Company, Inc. (DSC), an affiliate of DMC, provides fund accounting and financial administration oversight services to the Funds. For these services, the Funds pay DSC fees based on the aggregate daily net assets of the Delaware Investments® Family of Funds at the following annual rate: 0.0050% of the first $30 billion; 0.0045% of the next $10 billion; 0.0040% of the next $10 billion; and 0.0025% of aggregate average daily net assets in excess of $50 billion. The fees payable to DSC under the service agreement described above are allocated among all Funds in the Delaware Investments Family of Funds on a relative net asset value basis. For the year ended November 30, 2010, each Fund was charged for these services as follows:
| Delaware International | Delaware Emerging | Delaware Global | |||
| Value Equity Fund | Markets Fund | Value Fund | |||
| $16,807 | $47,237 | $1,850 |
DSC also provides dividend disbursing and transfer agency services. The Funds pay DSC a monthly fee based on the number of shareholder accounts for dividend disbursing and transfer agent services.
Pursuant to a distribution agreement and distribution plan, each Fund pays DDLP, the distributor and an affiliate of DMC, an annual distribution and service fee not to exceed 0.30% of the average daily net assets of the Class A shares, 1.00% of the average daily net assets of the Class B and Class C shares, and 0.60% of the average daily net assets of the Class R shares. Institutional Class shares pay no distribution and service expenses. DDLP has contracted to limit each Fund’s Class R shares’ 12b-1 fees through March 30, 2011 to no more than 0.50% of the Class R shares’ average daily net assets. For Delaware Emerging Markets Fund and Delaware Global Value Fund, DDLP has contracted to limit the Class A shares’ 12b-1 fees through March 30, 2011 to no more than 0.25% of the Class A shares’ average daily net assets.
89
Notes to financial statements
Delaware International Funds
Delaware International Funds
2. Investment Management, Administration Agreements and Other Transactions with Affiliates (continued)
At November 30, 2010, the Funds had liabilities payable to affiliates as follows:
| Delaware International | Delaware Emerging | Delaware Global | |||||||||||||
| Value Equity Fund | Markets Fund | Value Fund | |||||||||||||
| Investment management fee | |||||||||||||||
| payable to DMC | $ | 238,724 | $ | 1,418,923 | $ | 7,070 | |||||||||
| Dividend disbursing, transfer | |||||||||||||||
| agent and fund accounting | |||||||||||||||
| oversight fees, and other | |||||||||||||||
| expenses payable to DSC | 41,482 | 83,767 | 5,156 | ||||||||||||
| Distribution fees payable to DDLP | 80,949 | 318,461 | 14,313 | ||||||||||||
| Other expenses payable to DMC | |||||||||||||||
| and affiliates* | 20,055 | 54,217 | 4,505 | ||||||||||||
*DMC, as part of its administrative services, pays operating expenses on behalf of the Funds and is reimbursed on a periodic basis. Expenses include items such as printing of shareholder reports, fees for audit, legal and tax services, registration fees and trustees’ fees.
As provided in the investment management agreement, the Funds bear the cost of certain legal and tax services, including internal legal and tax services provided to the Funds by DMC and/or its affiliates’ employees. For the year ended November 30, 2010, the Funds were charged for internal legal and tax services provided by DMC and/or its affiliates’ employees as follows:
| Delaware International | Delaware Emerging | Delaware Global | |||
| Value Equity Fund | Markets Fund | Value Fund | |||
| $11,774 | $23,613 | $1,082 |
For the year ended November 30, 2010, DDLP earned commissions on sales of Class A shares for each Fund as follows:
| Delaware International | Delaware Emerging | Delaware Global | |||
| Value Equity Fund | Markets Fund | Value Fund | |||
| $9,762 | $158,666 | $3,576 |
For the year ended November 30, 2010, DDLP received gross CDSC commissions on redemptions of each Fund’s Class A, Class B and Class C shares, respectively, and these commissions were entirely used to offset up-front commissions previously paid by DDLP to broker/dealers on sales of those shares. The amounts received were as follows:
| Delaware International | Delaware Emerging | Delaware Global | ||||||||||||
| Value Equity Fund | Markets Fund | Value Fund | ||||||||||||
| Class A | $ | 0 | $ | 0 | $ | 0 | ||||||||
| Class B | 9,344 | 12,707 | 6,661 | |||||||||||
| Class C | 1,087 | 18,867 | 234 | |||||||||||
90
Trustees’ fees include expenses accrued by the Funds for each Trustee’s retainer and meeting fees. Certain officers of DMC, DSC and DDLP are officers and/or Trustees of the Trust. These officers and Trustees are paid no compensation by the Funds.
3. Investments
For year ended November 30, 2010, the Funds made purchases and sales of investment securities other than short-term investments as follows:
| Delaware International | Delaware Emerging | Delaware Global | |||||||||||||
| Value Equity Fund | Markets Fund | Value Fund | |||||||||||||
| Purchases | $ | 122,424,165 | $ | 804,839,841 | $ | 18,402,224 | |||||||||
| Sales | 179,401,163 | 254,880,089 | 27,320,824 | ||||||||||||
At November 30, 2010, the cost of investments and unrealized appreciation (depreciation) for federal income tax purposes for each Fund were as follows:
| Delaware International | Delaware Emerging | Delaware Global | |||||||||||||
| Value Equity Fund | Markets Fund | Value Fund | |||||||||||||
| Cost of investments | $ | 398,312,157 | $ | 1,551,339,375 | $ | 37,585,464 | |||||||||
| Aggregate unrealized appreciation | $ | 52,817,363 | $ | 215,660,519 | $ | 4,988,676 | |||||||||
| Aggregate unrealized depreciation | (69,197,400 | ) | (111,685,229 | ) | (4,214,030 | ) | |||||||||
| Net unrealized appreciation | |||||||||||||||
| (depreciation) | $ | (16,380,037 | ) | $ | 103,975,290 | $ | 774,646 | ||||||||
U.S. GAAP defines fair value as the price that each Fund would receive to sell an asset or pay to transfer a liability in an orderly transaction between market participants at the measurement date under current market conditions. A three level hierarchy for fair value measurements has been established based upon the transparency of inputs to the valuation of an asset or liability. Inputs may be observable or unobservable and refer broadly to the assumptions that market participants would use in pricing the asset or liability. Observable inputs reflect the assumptions market participants would use in pricing the asset or liability based on market data obtained from sources independent of the reporting entity. Unobservable inputs reflect the reporting entity’s own assumptions about the assumptions that market participants would use in pricing the asset or liability developed based on the best information available under the circumstanc es. Each Fund’s investment in its entirety is assigned a level based upon the observability of the inputs which are significant to the overall valuation. The three level hierarchy of inputs is summarized below.
| Level 1 – | inputs are quoted prices in active markets for identical investments (e.g., equity securities, open-end investment companies, futures contracts, options contracts) |
| Level 2 – | other observable inputs (including, but not limited to: quoted prices for similar assets or liabilities in markets that are active, quoted prices for identical or similar assets or liabilities in markets that are not active, inputs other than quoted prices that are observable for the assets or liabilities (such as interest rates, yield curves, volatilities, |
91
Notes to financial statements
Delaware International Funds
Delaware International Funds
3. Investments (continued)
| prepayment speeds, loss severities, credit risks and default rates) or other market-corroborated inputs) (e.g., debt securities, government securities, swap contracts, foreign currency exchange contracts, foreign securities utilizing international fair value pricing) | |
| Level 3 – | inputs are significant unobservable inputs (including each Fund’s own assumptions used to determine the fair value of investments) (e.g., broker-quoted securities, fair valued securities) |
The following table summarizes the valuation of Delaware International Value Equity Fund’s investments by fair value hierarchy levels as of November 30, 2010:
| Level 1 | Level 2 | Level 3 | Total | ||||||||||
| Common Stock | $ | 47,588,892 | $ | 272,097,260 | $ — | $ | 319,686,152 | ||||||
| Discount Note | — | 59,000 | — | 59,000 | |||||||||
| Securities Lending Collateral | — | 62,186,968 | — | 62,186,968 | |||||||||
| Total | $ | 47,588,892 | $ | 334,343,228 | $ — | $ | 381,932,120 | ||||||
The following is a reconciliation of investments in which significant unobservable inputs (Level 3) were used in determining fair value:
| Delaware International | ||||||
| Value Equity Fund | ||||||
| Securities Lending | ||||||
| Collateral | ||||||
| Balance as of 11/30/09 | $ | 66,047 | ||||
| Sales | (78,637 | ) | ||||
| Net change in unrealized appreciation/depreciation | 12,590 | |||||
| Balance as of 11/30/10 | $ | — | ||||
| Net change in unrealized appreciation/depreciation from | ||||||
| investments still held as of 11/30/10 | $ | (62,705 | ) | |||
The following table summarizes the valuation of Delaware Emerging Markets Fund’s investments by fair value hierarchy levels as of November 30, 2010:
| Level 1 | Level 2 | Level 3 | Total | |||||||||||
| Common Stock | $ | 760,699,837 | $ | 562,761,040 | $ | 2,738,216 | $ | 1,326,199,093 | ||||||
| Discount Note | — | 23,823,062 | — | 23,823,062 | ||||||||||
| Securities Lending Collateral | — | 235,162,985 | — | 235,162,985 | ||||||||||
| Other | 53,284,787 | 16,144,634 | 700,104 | 70,129,525 | ||||||||||
| Total | $ | 813,984,624 | $ | 837,891,721 | $ | 3,438,320 | $ | 1,655,314,665 | ||||||
| Foreign currency | ||||||||||||||
| exchange contract | $ | — | $ | (10,461 | ) | $ | — | �� | $ | (10,461 | ) | |||
92
The following is a reconciliation of investments in which significant unobservable inputs (Level 3) were used in determining fair value:
| Delaware Emerging Markets Fund | ||||||||||||||||
| Securities | ||||||||||||||||
| Common | Lending | |||||||||||||||
| Stock | Collateral | Other | Total | |||||||||||||
| Balance as of 11/30/09 | $ | 80,000 | $ | 16,843 | $ | 906,336 | $ | 1,003,179 | ||||||||
| Purchases | 2,650,158 | — | — | 2,650,158 | ||||||||||||
| Sales | — | (20,054 | ) | — | (20,054 | ) | ||||||||||
| Transfers into Level 3 | 105,237 | — | — | 105,237 | ||||||||||||
| Transfers out of Level 3 | — | — | (634,279 | ) | (634,279 | ) | ||||||||||
| Net change in unrealized | ||||||||||||||||
| appreciation/depreciation | (97,179 | ) | 3,211 | 428,047 | 334,079 | |||||||||||
| Balance as of 11/30/10 | $ | 2,738,216 | $ | — | $ | 700,104 | $ | 3,438,320 | ||||||||
| Net change in unrealized appreciation/ | ||||||||||||||||
| depreciation from investments still | ||||||||||||||||
| held as of 11/30/10 | $ | (97,179 | ) | $ | (15,991 | ) | $ | 241,304 | $ | 128,134 | ||||||
The following table summarizes the valuation of Delaware Global Value Fund’s investments by fair value hierarchy levels as of November 30, 2010:
| Level 1 | Level 2 | Level 3 | Total | ||||||||||
| Common stock | $ | 18,699,089 | $ | 15,137,652 | $ — | $ | 33,836,741 | ||||||
| Securities lending collateral | — | 4,523,369 | $ — | 4,523,369 | |||||||||
| Total | $ | 18,699,089 | $ | 19,661,021 | $ — | $ | 38,360,110 | ||||||
The following is a reconciliation of investments in which significant unobservable inputs (Level 3) were used in determining fair value:
| Delaware Global Value Fund | |||||
| Securities | |||||
| Lending | |||||
| Collateral | |||||
| Balance as of 11/30/09 | $ | 6,361 | |||
| Sales | (7,574 | ) | |||
| Net change in unrealized appreciation/depreciation | 1,213 | ||||
| Balance as of 11/30/10 | $ | — | |||
| Net change in unrealized appreciation/depreciation from | |||||
| investments still held as of 11/30/10 | $ | (6,039 | ) | ||
93
Notes to financial statements
Delaware International Funds
Delaware International Funds
3. Investments (continued)
In January 2010, the Financial Accounting Standards Board issued an Accounting Standards Update, Improving Disclosures about Fair Value Measurements, which introduced new disclosure requirements and clarified certain existing disclosure requirements around fair value measurements currently presented above. The new disclosures and clarifications of existing disclosures are generally effective for the Funds’ year ending November 30, 2011 and interim periods therein.
Utilizing international fair value pricing for a security could cause transfers from Level 1 investments to Level 2 investments in the hierarchy.
During the year ended November 30, 2010, transfers out of Level 3 investments into Level 2 investments were made in the amount of $634,279 for Delaware Emerging Markets Fund. This was due to the Fund’s pricing vendor being able to supply a matrix price for an investment that had been utilizing a broker quoted price. During the fiscal year ended November 30, 2010, Delaware Emerging Markets Fund had transfers out of Level 2 investments into Level 3 investments in the amount of $105,237 which was due to the Fund’s pricing vendor dropping coverage of a security. During the year ended November 30, 2010, there were no other transfers between Level 1 investments, Level 2 investments or Level 3 investment that had a material impact to the Funds.
4. Dividend and Distribution Information
Income and long-term capital gain distributions are determined in accordance with federal income tax regulations, which may differ from U.S. GAAP. Additionally, distributions from net gains on foreign currency transactions and net short-term gains on sales of investment securities are treated as ordinary income for federal income tax purposes. The tax character of dividends and distributions paid during the years ended November 30, 2010 and 2009 was as follows:
| Delaware International | Delaware Emerging | Delaware Global | |||||||||||||
| Value Equity Fund | Markets Fund | Value Fund | |||||||||||||
| Year Ended November 30, 2010: | |||||||||||||||
| Ordinary income | $ | 7,273,157 | $ | 517,819 | $ | 475,008 | |||||||||
| Year Ended November 30, 2009: | |||||||||||||||
| Ordinary income | $ | 14,224,832 | $ | 5,769,101 | $ | 892,871 | |||||||||
| Long-term capital gain | — | 30,990,618 | — | ||||||||||||
| Total | $ | 14,224,832 | $ | 36,759,719 | $ | 892,871 | |||||||||
94
5. Components of Net Assets on a Tax Basis
As of November 30, 2010, the components of net assets on a tax basis were as follows:
| Delaware International | Delaware Emerging | Delaware Global | ||||||||||||||||
| Value Equity Fund | Markets Fund | Value Fund | ||||||||||||||||
| Shares of beneficial interest | $ | 528,016,660 | $ | 1,331,308,102 | $ | 61,764,519 | ||||||||||||
| Undistributed ordinary income | 2,917,518 | 8,786,840 | 103,716 | |||||||||||||||
| Capital loss carryforwards | (192,452,614 | ) | (745,923 | ) | (28,796,111 | ) | ||||||||||||
| Unrealized appreciation | ||||||||||||||||||
| (depreciation) of investments | ||||||||||||||||||
| and foreign currencies | (16,434,115 | ) | 104,663,128 | 778,045 | ||||||||||||||
| Net assets | $ | 322,047,449 | $ | 1,444,012,147 | $ | 33,850,169 | ||||||||||||
The differences between book basis and tax basis components of net assets are primarily attributable to tax deferral of losses on wash sales and tax treatment of unrealized gain on investments on passive foreign investment companies.
For financial reporting purposes, capital accounts are adjusted to reflect the tax character of permanent book/tax differences. Reclassifications are primarily due to tax treatment of dividend and distributions, gain (loss) on foreign currency transactions, Indian taxes and passive foreign investment companies. Results of operations and net assets were not affected by these reclassifications. For the year ended November 30, 2010, the Funds recorded the following reclassifications:
| Delaware International | Delaware Emerging | Delaware Global | ||||||||||||||||
| Value Equity Fund | Markets Fund | Value Fund | ||||||||||||||||
| Undistributed net investment income | $ | (1,072,133 | ) | $ | (2,267,651 | ) | $ | (74,085 | ) | |||||||||
| Accumulated net realized gain (loss) | 1,072,133 | 2,259,853 | 74,085 | |||||||||||||||
| Paid-in capital | — | 7,798 | — | |||||||||||||||
For federal income tax purposes, capital loss carryforwards may be carried forward and applied against future capital gains. In 2010, the Funds utilized capital loss carryforwards as follows:
| Delaware International | Delaware Emerging | Delaware Global | |||
| Value Equity Fund | Markets Fund | Value Fund | |||
| $ 4,518,812 | $ 6,508,345 | $407,778 |
Capital loss carryforwards remaining at November 30, 2010, will expire as follows:
| Delaware International | Delaware Emerging | Delaware Global | ||||||||||||||
| Years of Expiration | Value Equity Fund | Markets Fund | Value Fund | |||||||||||||
| 2016 | $ | 79,163,033 | $ | — | $ | 16,253,434 | ||||||||||
| 2017 | 113,289,581 | 745,923 | 12,542,677 | |||||||||||||
| Total | $ | 192,452,614 | $ | 745,923 | $ | 28,796,111 | ||||||||||
95
Notes to financial statements
Delaware International Funds
Delaware International Funds
6. Capital Shares
Transactions in capital shares were as follows:
| Delaware International | Delaware Emerging | |||||||||||
| Value Equity Fund | Markets Fund | |||||||||||
| Year Ended | Year Ended | |||||||||||
| 11/30/10 | 11/30/09 | 11/30/10 | 11/30/09 | |||||||||
| Shares sold: | ||||||||||||
| Class A | 992,657 | 2,197,709 | 20,475,930 | 12,840,246 | ||||||||
| Class B | 15,606 | 21,758 | 52,787 | 55,355 | ||||||||
| Class C | 260,209 | 401,473 | 5,771,106 | 4,051,146 | ||||||||
| Class R* | 67,622 | 166,581 | 30,132 | 14 | ||||||||
| Institutional Class | 2,733,521 | 1,262,813 | 37,574,228 | 7,136,694 | ||||||||
| Shares issued upon reinvestment | ||||||||||||
| of dividends and distributions: | ||||||||||||
| Class A | 253,830 | 742,073 | 10,906 | 2,668,520 | ||||||||
| Class B | 12,905 | 35,040 | — | 188,080 | ||||||||
| Class C | 67,526 | 163,027 | — | 1,116,696 | ||||||||
| Class R* | 4,959 | 5,392 | — | — | ||||||||
| Institutional Class | 277,836 | 724,871 | 21,128 | 627,402 | ||||||||
| 4,686,671 | 5,720,737 | 63,936,217 | 28,684,153 | |||||||||
| Shares repurchased: | ||||||||||||
| Class A | (3,506,179 | ) | (11,299,318 | ) | (14,757,297 | ) | (11,392,369 | ) | ||||
| Class B | (315,580 | ) | (503,125 | ) | (329,599 | ) | (527,776 | ) | ||||
| Class C | (1,324,816 | ) | (2,185,490 | ) | (2,730,006 | ) | (3,407,744 | ) | ||||
| Class R* | (63,869 | ) | (65,226 | ) | (728 | ) | — | |||||
| Institutional Class | (3,545,593 | ) | (7,590,522 | ) | (5,287,207 | ) | (2,018,088 | ) | ||||
| (8,756,037 | ) | (21,643,681 | ) | (23,104,837 | ) | (17,345,977 | ) | |||||
| Net increase (decrease) | (4,069,366 | ) | (15,922,944 | ) | 40,831,380 | 11,338,176 | ||||||
*Delaware Emerging Markets Fund commenced operations of its Class R shares on August 31, 2009.
96
| Delaware Global | ||||||
| Value Fund | ||||||
| Year Ended | ||||||
| 11/30/10 | 11/30/09 | |||||
| Shares sold: | ||||||
| Class A | 320,269 | 523,493 | ||||
| Class B | 4,834 | 19,784 | ||||
| Class C | 64,941 | 142,949 | ||||
| Institutional Class | 85,786 | 31,791 | ||||
| Shares issued upon reinvestment | ||||||
| of dividends and distributions: | ||||||
| Class A | 37,574 | 94,020 | ||||
| Class B | 3,324 | 9,567 | ||||
| Class C | 9,254 | 28,301 | ||||
| Institutional Class | 2,731 | 5,727 | ||||
| 528,713 | 855,632 | |||||
| Shares repurchased: | ||||||
| Class A | (932,217 | ) | (1,341,180 | ) | ||
| Class B | (160,702 | ) | (215,484 | ) | ||
| Class C | (438,711 | ) | (784,752 | ) | ||
| Institutional Class | (59,463 | ) | (52,473 | ) | ||
| (1,591,093 | ) | (2,393,889 | ) | |||
| Net decrease | (1,062,380 | ) | (1,538,257 | ) | ||
97
Notes to financial statements
Delaware International Funds
Delaware International Funds
6. Capital Shares (continued)
For the years ended November 30, 2010 and 2009, the following shares and values were converted from Class B shares to Class A shares. The respective amounts are included in Class B redemptions and Class A subscriptions on page 96 and 97 and the statements of changes in net assets.
| Year Ended | Year Ended | |||||||||||||
| 11/30/10 | 11/30/09 | |||||||||||||
| Class B | Class A | Class B | Class A | |||||||||||
| Shares | Shares | Value | Shares | Shares | Value | |||||||||
| Delaware International | ||||||||||||||
| Value Equity Fund | 95,783 | 94,510 | $ | 1,065,389 | 129,987 | 128,348 | $ | 1,156,672 | ||||||
| Delaware Emerging | ||||||||||||||
| Markets Fund | 79,156 | 75,316 | 1,017,499 | 94,572 | 90,733 | 830,970 | ||||||||
| Delaware Global | ||||||||||||||
| Value Fund | 38,386 | 37,873 | 305,198 | 52,510 | 51,739 | 322,575 | ||||||||
7. Line of Credit
Each Fund, along with certain other funds in the Delaware Investments® Family of Funds (Participants), was a participant in a $35,000,000 revolving line of credit with The Bank of New York Mellon (BNY Mellon) to be used for temporary or emergency purposes as an additional source of liquidity to fund redemptions of investor shares. Under the agreement, the Participants were charged an annual commitment fee, which was allocated across the Participants on the basis of each Participant’s allocation of the entire facility. The Participants were permitted to borrow up to a maximum of one third of their net assets under the agreement. The agreement expired on November 16, 2010.
Effective as of November 16, 2010, the Funds along with the other Participants entered into an amendment to the agreement with BNY Mellon for a $50,000,000 revolving line of credit. The agreement as amended is to be used as described above and operates in substantially the same manner as the original agreement. The agreement as amended expires on November 15, 2011. The Funds had no amounts outstanding as of November 30, 2010 or at any time during the year then ended.
8. Derivatives
U.S. GAAP requires enhanced disclosures that enable investors to understand: 1) how and why an entity uses derivatives; 2) how they are accounted for; and 3) how they affect an entity’s results of operations and financial position.
Foreign Currency Exchange Contracts — Each Fund may enter into foreign currency exchange contracts as a way of managing foreign exchange rate risk. Each Fund may enter into these contracts to fix the U.S. dollar value of a security that it has agreed to buy or sell for the period between the date the trade was entered into and the date the security is delivered and paid for. Each Fund may also use these contracts to hedge the U.S. dollar value of securities it already owns
98
that are denominated in foreign currencies. The change in value is recorded as an unrealized gain or loss. When the contract is closed, a realized gain or loss is recorded equal to the difference between the value of the contract at the time it was opened and the value at the time it was closed.
The use of foreign currency exchange contracts does not eliminate fluctuations in the underlying prices of the securities, but does establish a rate of exchange that can be achieved in the future. Although foreign currency exchange contracts limit the risk of loss due to an unfavorable change in the value of the hedged currency, they also limit any potential gain that might result should the value of the currency change favorably. In addition, the Funds could be exposed to risks if the counterparties to the contracts are unable to meet the terms of their contracts. Each Fund’s maximum risk of loss from counterparty credit risk is the value of its currency exchanged with the counterparty. The risk is generally mitigated by having a netting arrangement between the Funds and the counterparty and by the posting of collateral by the counterparty to the Funds to cover each Fund’s exposure to the counterparty.
9. Securities Lending
Each Fund, along with other funds in the Delaware Investments® Family of Funds, may lend its securities pursuant to a security lending agreement (Lending Agreement) with BNY Mellon. With respect to each loan, if on any business day the aggregate market value of securities collateral plus cash collateral held is less than the aggregate market value of the securities which are the subject of such loan, the borrower will be notified to provide additional collateral by the end of the following business day which, together with the collateral already held, will be not less than the applicable collateral requirements for such security loan. If the aggregate market value of securities collateral and cash collateral held with respect to a security loan exceeds the a pplicable collateral requirement, upon the request of the borrower BNY Mellon must return enough collateral to the borrower by the end of the following business day to reduce the value of the remaining collateral to the applicable collateral requirement for such security loan. As a result of the foregoing, the value of the collateral held with respect to a loaned security may be temporarily more or less than the value of the security on loan.
Cash collateral received is generally invested in the Delaware Investments Collateral Fund No.1 (Collective Trust) established by BNY Mellon for the purpose of investment on behalf of funds managed by DMC that participate in BNY Mellon’s securities lending program. The Collective Trust may invest in U.S. government securities and high quality corporate debt, asset-backed and other money market securities and in repurchase agreements collateralized by such securities, provided that the Collective Trust will generally have a dollar-weighted average portfolio maturity of 60 days or less. The Collective Trust seeks to maintain a net asset value per unit of $1.00, but there can be no assurance that it will always be able to do so. The Funds may incur investment losses as a result of investing securities lending collateral in the Collective Trust or another collateral investment pool. This could occur if an investment in a collateral inves tment pool defaulted or if it were necessary to liquidate assets in the collateral investment pool to meet returns on outstanding security loans at a time when the collateral investment pool’s net asset value per unit was less than $1.00. Under those circumstances, the Funds may not receive an amount
99
Notes to financial statements
Delaware International Funds
Delaware International Funds
9. Securities Lending (continued)
from the collateral investment pool that is equal in amount to the collateral the Funds would be required to return to the borrower of the securities and the Funds would be required to make up this shortfall. Effective April 20, 2009, BNY Mellon transferred the assets of the Funds’ previous collateral investment pool other than cash and assets with a maturity of one business day or less to the BNY Mellon SL DBT II Liquidating Fund ( Liquidating Fund), effectively bifurcating the previous collateral investment pool. The Funds’ exposure to the Liquidating Fund is expected to decrease as the Liquidating Fund’s assets mature or are sold. In October 2008, BNY Mellon transferred certain distressed securities from the previous collateral investment pool into the Mellon GSL Reinvestment Trust II. The Funds can also accept U.S. government securities and letters of credit (non-cash collateral) in connection with securities loans. I n the event of default or bankruptcy by the lending agent, realization and/or retention of the collateral may be subject to legal proceedings. In the event the borrower fails to return loaned securities and the collateral received is insufficient to cover the value of the loaned securities and provided such collateral shortfall is not the result of investment losses, the lending agent has agreed to pay the amount of the shortfall to the Funds, or at the discretion of the lending agent, replace the loaned securities. The Funds continue to record dividends or interest, as applicable, on the securities loaned and are subject to change in value of the securities loaned that may occur during the term of the loan. The Funds have the right under the Lending Agreement to recover the securities from the borrower on demand. With respect to security loans collateralized by non-cash collateral, the Funds receive loan premiums paid by the borrower. With respect to security loans collateralized by cash collateral, the ear nings from the collateral investments are shared among the Funds, the security lending agent and the borrower. The Funds record security lending income net of allocations to the security lending agent and the borrower.
At November 30, 2010, the value of securities on loan and the value of invested collateral are presented below, for which cash collateral was received and invested in accordance with the Lending Agreement. Investments purchased with cash collateral are presented on the statements of net assets under the caption “Securities Lending Collateral.”
| Delaware International | Delaware Emerging | Delaware Global | |||||||||||||
| Value Equity Fund | Markets Fund | Value Fund | |||||||||||||
| Value of securities on loan | $ | 59,711,417 | $ | 226,050,354 | $ | 4,393,812 | |||||||||
| Value of invested collateral | $ | 62,186,968 | $ | 235,162,985 | $ | 4,523,369 | |||||||||
10. Credit and Market Risk
Some countries in which the Funds may invest require governmental approval for the repatriation of investment income, capital or the proceeds of sales of securities by foreign investors. In addition, if there is deterioration in a country’s balance of payments or for other reasons, a country may impose temporary restrictions on foreign capital remittances abroad.
100
The securities exchanges of certain foreign markets are substantially smaller, less liquid and more volatile than the major securities markets in the United States. Consequently, acquisition and disposition of securities by the Funds may be inhibited. In addition, a significant portion of the aggregate market value of equity securities listed on the major securities exchanges in emerging markets is held by a smaller number of investors. This may limit the number of shares available for acquisition or disposition by the Funds.
Each Fund may invest up to 15% of its net assets in illiquid securities, which may include securities with contractual restrictions on resale, securities exempt from registration under Rule 144A of the Securities Act of 1933, as amended, and other securities which may not be readily marketable. The relative illiquidity of these securities may impair each Fund from disposing of them in a timely manner and at a fair price when it is necessary or desirable to do so. While maintaining oversight, the Funds’ Board has delegated to DMC, the day-to-day functions of determining whether individual securities are liquid for purposes of the Funds’ limitation on investments in illiquid assets. Securities eligible for resale pursuant to Rule 144A, which are determined to be liquid, are not subject to the Funds’ limitation on investments in illiquid assets. Rule 144A and illiquid securities have been identified on the statements of net assets.
11. Contractual Obligations
The Funds enter into contracts in the normal course of business that contain a variety of indemnifications. Each Fund’s maximum exposure under these arrangements is unknown. However, the Funds have not had prior claims or losses pursuant to these contracts. Management has reviewed each Fund’s existing contracts and expects the risk of loss to be remote.
12. Subsequent Events
Management has determined no material events or transactions occurred subsequent to November 30, 2010 that would require recognition or disclosure in the Funds’ financial statements.
13. Tax Information (Unaudited)
The information set forth below is for each Fund’s fiscal year as required by federal income tax laws. Shareholders, however, must report distributions on a calendar year basis for income tax purposes, which may include distributions for portions of two fiscal years of a fund. Accordingly, the information needed by shareholders for income tax purposes will be sent to them in January of each year. Please consult your tax advisor for proper treatment of this information.
101
Notes to financial statements
Delaware International Funds
Delaware International Funds
13. Tax Information (Unaudited) (continued)
For the fiscal year ended November 30, 2010, each Fund designates distributions paid during the year as follows:
| (A) | |||||||
| Ordinary | |||||||
| Income | (B) | ||||||
| Distributions* | Qualifying | ||||||
| (Tax Basis) | Dividends1 | ||||||
| Delaware International Value Equity Fund | 100.00% | — | |||||
| Delaware Emerging Markets Fund | 100.00% | 2.35 | % | ||||
| Delaware Global Value Fund | 100.00% | — | |||||
| (A) | is based on a percentage of each Fund’s total distributions. |
| (B) | is based on a percentage of each Fund’s ordinary income distributions. |
1Qualifying dividends represent dividends which qualify for the corporate dividends received deduction.
*For the fiscal year ended November 30, 2010, certain dividends paid by the Funds may be subject to a maximum tax rate of 15%, as provided for by the Jobs and Growth Tax Relief Reconciliation Act of 2003. The Funds intend to designate the following amounts to be taxed at a maximum rate of 15%. Complete information will be computed and reported in conjunction with your 2009 or 2010 Form 1099-DIV.
| Delaware Emerging | Delaware Global | ||
| Markets Fund | Value Fund | ||
| $517,819 | $31,207 |
The Funds intend to pass through foreign tax credits in the maximum amounts as follows:
| Delaware International | Delaware Emerging | Delaware Global | |||
| Value Equity Fund | Markets Fund | Value Fund | |||
| $510,711 | $1,128,414 | $33,310 |
Complete information will be computed and reported in conjunction with your 2009 or 2010 Form 1099-DIV.
The gross foreign source income earned during the fiscal year 2010 by the Funds was as follows:
| Delaware International | Delaware Emerging | Delaware Global | |||
| Value Equity Fund | Markets Fund | Value Fund | |||
| $10,082,376 | $28,457,723 | $627,024 |
Complete information will be computed and reported in conjunction with your 2009 or 2010 Form 1099-DIV.
For the fiscal year ended November 30, 2010, certain dividends paid by the Funds have been determined to be interest related dividends and may be subject to relief from U.S. withholding for foreign shareholders, as provided by the American Jobs Creation Act of 2004. For the fiscal year ended November 30 2010, the Funds have designated maximum Qualified Interest Income distributions as follows:
| Delaware International | Delaware Emerging | ||
| Value Equity Fund | Markets Fund | ||
| $985 | $48,003 |
102
Report of independent
registered public accounting firm
registered public accounting firm
To the Board of Trustees of Delaware Group Global & International Funds
and the Shareholders of Delaware International Value Equity Fund,
Delaware Emerging Markets Fund and Delaware Global Value Fund:
and the Shareholders of Delaware International Value Equity Fund,
Delaware Emerging Markets Fund and Delaware Global Value Fund:
In our opinion, the accompanying statements of net assets and the related statements of operations and of changes in net assets and the financial highlights present fairly, in all material respects, the financial position of Delaware International Value Equity Fund, Delaware Emerging Markets Fund and Delaware Global Value Fund (three of the series constituting Delaware Group Global & International Funds, hereafter collectively referred to as the “Funds”) at November 30, 2010, and the results of each of their operations, the changes in each of their net assets and the financial highlights for the year then ended, in conformity with accounting principles generally accepted in the United States of America. These financial statements and financial highlights (hereafter referred to as “financial statements”) are the responsibility of the Funds’ management; our responsibility is to express an opinion on these fi nancial statements based on our audits. We conducted our audits of these financial statements in accordance with the standards of the Public Company Accounting Oversight Board (United States). Those standards require that we plan and perform the audit to obtain reasonable assurance about whether the financial statements are free of material misstatement. An audit includes examining, on a test basis, evidence supporting the amounts and disclosures in the financial statements, assessing the accounting principles used and significant estimates made by management, and evaluating the overall financial statement presentation. We believe that our audits, which included confirmation of securities at November 30, 2010 by correspondence with the custodian and brokers, provide a reasonable basis for our opinion. The statement of changes in net assets for the year ended November 30, 2009 and the financial highlights for each of the periods ended November 30, 2009 and prior were audited by other independent accountants w hose report dated January 21, 2010 expressed an unqualified opinion on those statements.
PricewaterhouseCoopers LLP
Philadelphia, Pennsylvania
January 19, 2011
Philadelphia, Pennsylvania
January 19, 2011
103
Other Fund information
(Unaudited)
Delaware International Funds
(Unaudited)
Delaware International Funds
Change in Independent Registered Public Accounting Firm
Due to independence matters under the Securities and Exchange Commission’s auditor independence rules relating to the January 4, 2010 acquisition of Delaware Investments (including DMC, DDLP and DSC) by Macquarie Group, Ernst & Young LLP (“E&Y”) has resigned as the independent registered public accounting firm for Delaware Group® Global & Interntional Fund (the “ Trust”) effective May 20, 2010. At a meeting held on May 20, 2010, the Board of Trustees of the Trust, upon recommendation of the Audit Committee, selected PricewaterhouseCoopers LLP (&# 8220;PwC”) to serve as the independent registered public accounting firm for the Trust for the fiscal year ending November 30, 2010. During the fiscal years ended November 30, 2009 and 2008, E&Y’s audit reports on the financial statements of Delaware International Value Equity Fund, Delaware Emerging Markets Fund and Delaware Global Value Fund (the “Funds”) did not contain any adverse opinion or disclaimer of opinion, nor were they qualified or modified as to uncertainty, audit scope, or accounting principles. In addition, there were no disagreements between the Trust and E&Y on accounting principles, financial statements disclosures or audit scope, which, if not resolved to the satisfaction of E&Y, would have caused them to make reference to the disagreement in their reports. Neither the Trust nor anyone on its behalf has consulted with PwC at any time prior to their selection with respect to the application of accounting principles to a specified transaction, either comp leted or proposed or the type of audit opinion that might be rendered on the Trust’s financial statements.
104
Board of trustees/directors and officers addendum
Delaware Investments® Family of Funds
Delaware Investments® Family of Funds
A mutual fund is governed by a Board of Trustees/Directors (“Trustees”), which has oversight responsibility for the management of a fund’s business affairs. Trustees establish procedures and oversee and review the performance of the investment manager, the distributor, and others who perform services for the fund. The independent fund trustees, in particular, are advocates
| Name, Address, | Position(s) | Length of | ||
| and Birth Date | Held with Fund(s) | Time Served | ||
| Interested Trustees | ||||
| Patrick P. Coyne1 | Chairman, President, | Chairman and Trustee | ||
| 2005 Market Street | Chief Executive Officer, | since August 16, 2006 | ||
| Philadelphia, PA 19103 | and Trustee | |||
| April 1963 | President and | |||
| Chief Executive Officer | ||||
| since August 1, 2006 | ||||
1 Patrick P. Coyne is considered to be an “Interested Trustee” because he is an executive officer of the Fund’s(s’) investment advisor.
106
for shareholder interests. Each trustee has served in that capacity since he or she was elected to or appointed to the Board of Trustees, and will continue to serve until his or her retirement or the election of a new trustee in his or her place. The following is a list of the Trustees and Officers with certain background and related information.
| Number of Portfolios in | ||||
| Principal Occupation(s) | Fund Complex Overseen | Other Directorships | ||
| During Past 5 Years | by Trustee or Officer | Held by Trustee or Officer | ||
| Patrick P. Coyne has served in | 78 | Director | ||
| various executive capacities | Kaydon Corp. | |||
| at different times at | ||||
| Delaware Investments.2 | Board of Governors Member | |||
| Investment Company | ||||
| Institute (ICI) | ||||
| Finance Committee Member | ||||
| St. John Vianney Roman | ||||
| Catholic Church | ||||
| Board of Trustees | ||||
| Agnes Irwin School | ||||
| Member of Investment | ||||
| Committee | ||||
| Cradle of Liberty Council, | ||||
| BSA | ||||
| (2007 – 2010) | ||||
| |
2 Delaware Investments is the marketing name for Delaware Management Holdings, Inc. and its subsidiaries, including the Fund’s(s’) investment advisor, principal underwriter, and its transfer agent.
107
Board of trustees/directors and officers addendum
Delaware Investments® Family of Funds
Delaware Investments® Family of Funds
| Name, Address, | Position(s) | Length of | ||
| and Birth Date | Held with Fund(s) | Time Served | ||
| Independent Trustees | ||||
| Thomas L. Bennett | Trustee | Since March 2005 | ||
| 2005 Market Street | ||||
| Philadelphia, PA 19103 | ||||
| October 1947 | ||||
| John A. Fry | Trustee | Since January 2001 | ||
| 2005 Market Street | ||||
| Philadelphia, PA 19103 | ||||
| May 1960 | ||||
| Anthony D. Knerr | Trustee | Since April 1990 | ||
| 2005 Market Street | ||||
| Philadelphia, PA 19103 | ||||
| December 1938 | ||||
| Lucinda S. Landreth | Trustee | Since March 2005 | ||
| 2005 Market Street | ||||
| Philadelphia, PA 19103 | ||||
| June 1947 | ||||
108
| Number of Portfolios in | ||||
| Principal Occupation(s) | Fund Complex Overseen | Other Directorships | ||
| During Past 5 Years | by Trustee or Officer | Held by Trustee or Officer | ||
| Private Investor | 78 | Director | ||
| (March 2004–Present) | Bryn Mawr Bank Corp. (BMTC) | |||
| Investment Manager | Chairman of Investment | |||
| Morgan Stanley & Co. | Committee | |||
| (January 1984–March 2004) | Pennsylvania Academy of | |||
| Fine Arts | ||||
| Investment Committee and | ||||
| Governance Committee | ||||
| Member | ||||
| Pennsylvania Horticultural | ||||
| Society | ||||
| President | 78 | Director | ||
| Drexel University | Community Health Systems | |||
| (August 2010–Present) | ||||
| Director — Ecore | ||||
| President | International | |||
| Franklin & Marshall College | (2009 – 2010) | |||
| (July 2002–July 2010) | ||||
| Director — Allied | ||||
| Executive Vice President | Barton Securities Holdings | |||
| University of Pennsylvania | (2005 – 2008) | |||
| (April 1995–June 2002) | ||||
| Founder and | 78 | None | ||
| Managing Director | ||||
| Anthony Knerr & Associates | ||||
| (Strategic Consulting) | ||||
| (1990–Present) | ||||
| Chief Investment Officer | 78 | None | ||
| Assurant, Inc. (Insurance) | ||||
| (2002–2004) | ||||
109
Board of trustees/directors and officers addendum
Delaware Investments® Family of Funds
Delaware Investments® Family of Funds
| Name, Address, | Position(s) | Length of | ||
| and Birth Date | Held with Fund(s) | Time Served | ||
| Independent Trustees (continued) | ||||
| Ann R. Leven | Trustee | Since October 1989 | ||
| 2005 Market Street | ||||
| Philadelphia, PA 19103 | ||||
| November 1940 | ||||
| | ||||
| Thomas F. Madison | Trustee | Since May 19973 | ||
| 2005 Market Street | ||||
| Philadelphia, PA 19103 | ||||
| February 1936 | ||||
| |
3 In 1997, several funds managed by Voyageur Fund Managers, Inc. (the “Voyageur Funds”) were incorporated into the Delaware Investments Family of Funds. Mr. Madison served as a director of the Voyageur Funds from 1993 until 1997.
110
| Number of Portfolios in | ||||
| Principal Occupation(s) | Fund Complex Overseen | Other Directorships | ||
| During Past 5 Years | by Trustee or Officer | Held by Trustee or Officer | ||
| Consultant | 78 | Director and Audit | ||
| ARL Associates | Committee Chair – | |||
| (Financial Planning) | Systemax Inc. | |||
| (1983–Present) | (2001 – 2009) | |||
| Director and Audit | ||||
| Committee Chairperson – | ||||
| Andy Warhol Foundation | ||||
| (1999 – 2007) | ||||
| President and | 78 | Director and Chair of | ||
| Chief Executive Officer | Compensation Committee, | |||
| MLM Partners, Inc. | Governance Committee | |||
| (Small Business Investing | Member | |||
| and Consulting) | CenterPoint Energy | |||
| (January 1993–Present) | ||||
| Lead Director and Chair of | ||||
| Audit and Governance | ||||
| Committees, Member of | ||||
| Compensation Committee | ||||
| Digital River, Inc. | ||||
| Director and Chair of | ||||
| Governance Committee, | ||||
| Audit Committee | ||||
| Member | ||||
| Rimage Corporation | ||||
| Director and Chair of | ||||
| Compensation Committee | ||||
| Spanlink Communications | ||||
| Lead Director and Member of | ||||
| Compensation and | ||||
| Governance Committees | ||||
| Valmont Industries, Inc. | ||||
| (1987 – 2010) | ||||
111
Board of trustees/directors and officers addendum
Delaware Investments® Family of Funds
Delaware Investments® Family of Funds
| Name, Address, | Position(s) | Length of | ||
| and Birth Date | Held with Fund(s) | Time Served | ||
| Independent Trustees (continued) | ||||
| Thomas F. Madison | ||||
| 2005 Market Street | ||||
| Philadelphia, PA 19103 | ||||
| February 1936 | ||||
| Janet L. Yeomans | Trustee | Since April 1999 | ||
| 2005 Market Street | ||||
| Philadelphia, PA 19103 | ||||
| July 1948 | ||||
| J. Richard Zecher | Trustee | Since March 2005 | ||
| 2005 Market Street | ||||
| Philadelphia, PA 19103 | ||||
| July 1940 | ||||
112
| Number of Portfolios in | ||||
| Principal Occupation(s) | Fund Complex Overseen | Other Directorships | ||
| During Past 5 Years | by Trustee or Officer | Held by Trustee or Officer | ||
| Director | ||||
| Banner Health | ||||
| (1996 – 2007) | ||||
| Vice President and Treasurer | 78 | Director | ||
| (January 2006–Present) | Okabena Company | |||
| Vice President — Mergers & Acquisitions | ||||
| (January 2003–January 2006), and | ||||
| Vice President | ||||
| (July 1995–January 2003) | ||||
| 3M Corporation | ||||
| Founder | 78 | Director and Audit | ||
| Investor Analytics | Committee Member | |||
| (Risk Management) | Investor Analytics | |||
| (May 1999–Present) | ||||
| Founder | Director | |||
| Sutton Asset Management | Oxigene, Inc. | |||
| (Hedge Fund) | (2003 – 2008) | |||
| (September 1996–Present) | ||||
113
Board of trustees/directors and officers addendum
Delaware Investments® Family of Funds
Delaware Investments® Family of Funds
| Name, Address, | Position(s) | Length of | ||
| and Birth Date | Held with Fund(s) | Time Served | ||
| Officers | ||||
| David F. Connor | Vice President, | Vice President since | ||
| 2005 Market Street | Deputy General | September 2000 | ||
| Philadelphia, PA 19103 | Counsel, and Secretary | and Secretary since | ||
| December 1963 | October 2005 | |||
| Daniel V. Geatens | Vice President | Treasurer | ||
| 2005 Market Street | and Treasurer | since October 2007 | ||
| Philadelphia, PA 19103 | ||||
| October 1972 | ||||
| David P. O’Connor | Senior Vice President, | Senior Vice President, | ||
| 2005 Market Street | General Counsel, | General Counsel, and | ||
| Philadelphia, PA 19103 | and Chief Legal Officer | Chief Legal Officer | ||
| February 1966 | since October 2005 | |||
| Richard Salus | Senior Vice President | Chief Financial Officer | ||
| 2005 Market Street | and Chief Financial Officer | since November 2006 | ||
| Philadelphia, PA 19103 | ||||
| October 1963 | ||||
The Statement of Additional Information for the Fund(s) includes additional information about the Trustees and Officers and is available, without charge, upon request by calling 800 523-1918.
114
| Number of Portfolios in | ||||
| Principal Occupation(s) | Fund Complex Overseen | Other Directorships | ||
| During Past 5 Years | by Trustee or Officer | Held by Trustee or Officer | ||
| David F. Connor has served as | 78 | None4 | ||
| Vice President and Deputy | ||||
| General Counsel of | ||||
| Delaware Investments | ||||
| since 2000. | ||||
| Daniel V. Geatens has served | 78 | None4 | ||
| in various capacities at | ||||
| different times at | ||||
| Delaware Investments. | ||||
| David P. O’Connor has served in | 78 | None4 | ||
| various executive and legal | ||||
| capacities at different times | ||||
| at Delaware Investments. | ||||
| Richard Salus has served in | 78 | None4 | ||
| various executive capacities | ||||
| at different times at | ||||
| Delaware Investments. | ||||
4 David F. Connor, Daniel V. Geatens, David P. O’Connor, and Richard Salus serve in similar capacities for the six portfolios of the Optimum Fund Trust, which have the same investment advisor, principal underwriter, and transfer agent as the registrant.
115
About the organization
| Board of trustees | |||
Patrick P. Coyne Chairman, President, and Chief Executive Officer Delaware Investments® Family of Funds Philadelphia, PA Thomas L. Bennett Private Investor Rosemont, PA John A. Fry President Drexel University Philadelphia, PA | Anthony D. Knerr Founder and Managing Director Anthony Knerr & Associates New York, NY Lucinda S. Landreth Former Chief Investment Officer Assurant, Inc. Philadelphia, PA | Ann R. Leven Consultant ARL Associates New York, NY Thomas F. Madison President and Chief Executive Officer MLM Partners, Inc. Minneapolis, MN | Janet L. Yeomans Vice President and Treasurer 3M Corporation St. Paul, MN J. Richard Zecher Founder Investor Analytics Scottsdale, AZ |
| Affiliated officers | |||
David F. Connor Vice President, Deputy General Counsel, and Secretary Delaware Investments Family of Funds Philadelphia, PA | Daniel V. Geatens Vice President and Treasurer Delaware Investments Family of Funds Philadelphia, PA | David P. O’Connor Senior Vice President, General Counsel, and Chief Legal Officer Delaware Investments Family of Funds Philadelphia, PA | Richard Salus Senior Vice President and Chief Financial Officer Delaware Investments Family of Funds Philadelphia, PA |
This annual report is for the information of Delaware International Value Equity Fund, Delaware Emerging Markets Fund, and Delaware Global Value Fund shareholders, but it may be used with prospective investors when preceded or accompanied by a current prospectus for Delaware International Value Equity Fund, Delaware Emerging Markets Fund, and Delaware Global Value Fund and the Delaware Investments Fund fact sheet for the most recently completed calendar quarter. These documents are available at www.delawareinvestments.com. The prospectus sets forth details about charges, expenses, investment objectives, and operating policies of the investment company. You should read the prospectus carefully before you invest. The figures in this report represent past results that are not a guarantee of future results. The return and principal value of an investment in the investment company will fluctuate so that shares, when redeemed, may be worth more or less than their original cost. |
Delaware Investments is the marketing name of Delaware Management Holdings, Inc. and its subsidiaries. Each Fund files its complete schedule of portfolio holdings with the Securities and Exchange Commission (SEC) for the first and third quarters of each fiscal year on Form N-Q. Each Fund’s Forms N-Q, as well as a description of the policies and procedures that each Fund uses to determine how to vote proxies (if any) relating to portfolio securities are available without charge (i) upon request, by calling 800 523-1918; and (ii) on the SEC’s Web site at www.sec.gov. In addition, a description of the policies and procedures that each Fund uses to determine how to vote proxies (if any) relating to portfolio securities and each Fund’s Schedule of Investments are available without charge on each Fund’s Web site at www.delawareinvestments.com. Each Fund’s Forms N-Q may be reviewed and copied at the SEC’s Public Reference Room in Washington, D.C.; information on the operation of the Public Reference Room may be obtained by calling 800 SEC-0330. Information (if any) regarding how each Fund voted proxies relating to portfolio securities during the most recently disclosed 12-month period ended June 30 is available without charge (i) through each Fund’s Web site at www.delawareinvestments.com; and (ii) on the SEC’s Web site at www.sec.gov. |
116
Annual report Delaware Focus Global Growth Fund November 30, 2010 International equity mutual fund |
This annual report is for the information of Delaware Focus Global Growth Fund shareholders, but it may be used with prospective investors when preceded or accompanied by a current prospectus for Delaware Focus Global Growth Fund. The figures in the annual report for Delaware Focus Global Growth Fund represent past results, which are not a guarantee of future results. The return and principal value of an investment in the Fund will fluctuate so that shares, when redeemed, may be worth more or less than their original cost. Current performance may be higher or lower than the performance data quoted. You should consider the investment objectives, risks, charges, and expenses of the Fund carefully before investing. The Delaware Focus Global Growth Fund prospectus contains this and other important information about the Fund. Prospectuses for all open-end funds in the Delaware Investments® Family of Funds are available from your financial advisor, online at www.delawareinvestments.com, or by phone at 800 523-1918. Please read the prospectus carefully before you invest or send money. |
You can obtain shareholder reports and prospectuses online instead of in the mail. Visit www.delawareinvestments.com/edelivery. |
Experience Delaware Investments
Delaware Investments is committed to the pursuit of consistently superior asset management and unparalleled client service. We believe in our investment processes, which seek to deliver consistent results, and in convenient services that help add value for our clients.
If you are interested in learning more about creating an investment plan, contact your financial advisor.
You can learn more about Delaware Investments or obtain a prospectus for Delaware Focus Global Growth Fund at www.delawareinvestments.com.
Manage your investments online
- 24-hour access to your account information
- Obtain share prices
- Check your account balance and recent transactions
- Request statements or literature
- Make purchases and redemptions
Delaware Management Holdings, Inc., and its subsidiaries (collectively known by the marketing name of Delaware Investments) are wholly owned subsidiaries of Macquarie Group Limited, a global provider of banking, financial, advisory, investment and funds management services.
Investments in Delaware Focus Global Growth Fund are not and will not be deposits with or liabilities of Macquarie Bank Limited ABN 46 008 583 542 and its holding companies, including their subsidiaries or related companies (Macquarie Group), and are subject to investment risk, including possible delays in repayment and loss of income and capital invested. No Macquarie Group company guarantees or will guarantee the performance of the Fund, the repayment of capital from the Fund, or any particular rate of return.
| Table of contents | |
| Portfolio management review | 1 |
| Performance summary | 4 |
| Disclosure of Fund expenses | 8 |
| Country and sector allocations | 10 |
| Statement of net assets | 11 |
| Statement of operations | 15 |
| Statements of changes in net assets | 16 |
| Financial highlights | 18 |
| Notes to financial statements | 20 |
| Report of independent registered | |
| public accounting firm | 30 |
| Other Fund information | 31 |
| Board of trustees/directors and | |
| officers addendum | 32 |
| About the organization | 42 |
Unless otherwise noted, views expressed herein are current as of Nov. 30, 2010, and are subject to change.
Funds are not FDIC insured and are not guaranteed. It is possible to lose the principal amount invested.
Mutual fund advisory services provided by Delaware Management Company, a series of Delaware Management Business Trust, which is a registered investment advisor. Delaware Investments, a member of Macquarie Group, refers to Delaware Management Holdings, Inc. and its subsidiaries, including the Fund’s distributor, Delaware Distributors, L.P. Macquarie Group refers to Macquarie Group Limited and its subsidiaries and affiliates worldwide.
© 2011 Delaware Management Holdings, Inc.
All third-party trademarks cited are the property of their respective owners.
Portfolio management review
| Delaware Focus Global Growth Fund | December 7, 2010 |
| Performance preview (for the year ended November 30, 2010) | ||||
| Delaware Focus Global Growth Fund (Class A shares) | 1-year return | +21.31% | ||
| MSCI World Index (Benchmark) (gross) | 1-year return | +6.52% | ||
| MSCI World Index (net) | 1-year return | +5.98% | ||
Past performance does not guarantee future results.
For complete, annualized performance for Delaware Focus Global Growth Fund, please see the table on page 4.
The performance of Class A shares excludes the applicable sales charge and reflects the reinvestment of all distributions. Index performance returns do not reflect any management fees, transaction costs, or expenses. Indices are unmanaged and one cannot invest directly in an index.
When the fiscal year began in December 2009, the economy seemed to have put the recession in the rearview mirror, though high unemployment continued to limit consumer activity. Generally speaking, analysts welcomed favorable corporate earnings, though they worried about real revenue growth. The Federal Reserve stayed creative with nontraditional, often controversial stimuli, prompting many analysts to wonder if the recovery were artificial. Global economic and political developments were affecting the domestic markets daily, and more than ever investors began to realize that “it’s a small world after all.”
Twelve months later, not much has changed. We believe domestic unemployment remains too high. Analysts still want to see greater signs of revenue growth within corporate earnings. The Fed just initiated another bond-buying program to stimulate growth, though economists and foreign leaders question its merits and fear a return of inflation. China has led the global recovery thus far, but is implementing tighter regulations to prevent its economy from overheating. Europe continues to struggle with a sovereign debt crisis that has brought controversial rescue plans and fears of so-called “contagion” across the globe.
We launched Delaware Focus Global Growth Fund in December 2008 to adapt the philosophies and processes from some of our domestic equity funds to a broader, unrestrained geography and to seek new opportunities across the globe. We maintain a bottom-up (stock by stock) philosophy in managing the Fund and believe solid stock selection is often the key driver to overall performance.
1
Portfolio management review
Delaware Focus Global Growth Fund
Delaware Focus Global Growth Fund
About the Fund
The key tenets of our investment philosophy are as follows:
- Concentration: Even though the Fund’s managers are now covering investment possibilities around the world, we believe that a concentrated portfolio of approximately 35-45 positions provides appropriate diversification for the Fund and may prove helpful in our pursuit of solid risk-adjusted returns.
- Long-term time horizon: In general, we invest for the long term and look to keep the Fund’s holdings through a full market cycle (roughly 3-5 years). We strive to select companies we feel have the potential to maintain a sustainable competitive advantage in their markets, have strong management teams, and the potential to be able to perform well in both good and bad markets.
- Cash metric valuation: We seek growth of a company’s intrinsic business value, measured by cash metrics such as free cash flow and return on capital. We look for companies that we feel can add value by employing efficient capital allocation methods, such as paying dividends, buying back shares, or reinvesting in the business.
Contributors
Because we stress the importance of individual stock selection over more macro-oriented country or sector allocations, many of the Fund’s holdings contributed so well to Fund performance (for the fiscal year ended Nov. 30, 2010). Additionally, strong showings within the Fund’s international holdings accounted for much of the Fund’s outperformance versus the benchmark.
Online travel company priceline.com was the Fund’s top contributor during the fiscal year. Its “name your own price” business strategy has proven even more successful as of late because it apparently has satisfied the current appetite among many consumers for value. In our view, an even more significant reason for the stock’s strong return is its rapidly growing European hotel-booking business, which was largely unaffected by sovereign crisis concerns.
Intuit is another domestic holding. It is best known for its consumer tax preparation software, such as TurboTax®, which we believe represents a stable core business with high margins. In recent years, more individuals have become “do-it-yourself” tax preparers as the company’s programs allow them to save on accountant fees. The company also increasingly markets business service products that target small- and medium-sized businesses. That product segment has grown dramatically for the company in recent times and greatly contributed to performance in terms of better-than-expected earnings during the fiscal year. Intuit’s share price climbed more than 50% during the Fund’s 12-month fiscal year.
Netherlands-based Core Laboratories was the Fund’s top-performing international holding. The company provides analytical software and other technologies to big energy companies to help them analyze the core of oil and natural gas wells and determine the most effective ways to extract natural resources. Given the company’s value proposition, which is to help energy exploration companies extract higher yields for both existing and future production fields, we view this holding as a “buffered business
2
model,” one we believe has the potential to perform well in both good and bad energy markets.
Detractors
The following holdings detracted from Fund performance.
Gilead Sciences was the Fund’s worst performer on both an absolute and relative basis. This domestic biopharmaceutical company has long been an industry leader in the development of HIV treatments. During the next few years, some of its key patents should be expiring and the market seems to be discounting its share price in anticipation of greater competition from generics. Gilead has struggled to find that next wave of growth from either internal product development or through acquisition. During the fiscal year, we sold the Fund’s position because of what we saw as a lack of progress.
Swiss pharmaceutical giant Roche was the Fund’s worst-performing international holding during the Fund’s fiscal year. The company continued to integrate Genentech’s operations into its business model, though the effect of the almost $50 billion acquisition from March 2009 has not come without growing pains. Many investors also discounted many healthcare-related holdings as the controversial U.S. reform bill gets implemented and many concerns remain about the government’s role in dictating prices globally. Finally, we believe Roche struggled a bit due to its geography, as Europe faced many challenges (such as continued sovereign debt stress) during the fiscal year.
Strayer Education (domiciled in the U.S.) was another poor performer in the Fund. The for-profit educational institute has struggled with the rest of the industry as consumer groups have raised concerns about lending practices and the government contemplates enhanced scrutiny and regulations. Many of its students qualify for government loans and some analysts fear that high default rates from non-credit-worthy borrowers may lead to another subprime-like debacle. The possibility of new regulations has led to greater uncertainty over the entire for-profit education industry, and related companies have therefore been hurt. We do not believe the government is likely to stand in the way of individuals accessing education. As long-term investors, we believe Strayer will likely be a survivor and may be poised to be an industry leader as reforms are implemented.
Fund positioning
Looking ahead, we still see legacy effects of the financial debacle and economic downturn that may hinder global growth in the future. The sovereign debt issues in Europe and ballooning deficits at home are reminders of the daily battles the markets may face. We do not anticipate a post-recessionary boom and think a flat to moderate growth cycle is more likely with ongoing shifts in investor sentiment. As bottom-up stock pickers, we do not anticipate taking on more cyclical risk based on forecasts and trends. Instead, we seek domestic and international companies with what we believe are secular growth characteristics, superior business models, and strong competitive positions that we feel have the potential to perform well in a variety of market environments.
3
| Performance summary | |
| Delaware Focus Global Growth Fund | November 30, 2010 |
The performance data quoted represent past performance; past performance does not guarantee future results. Investment return and principal value will fluctuate so your shares, when redeemed, may be worth more or less than their original cost. Please obtain the performance data current for the most recent month end by calling 800 523-1918 or visiting our Web site at www.delawareinvestments.com/performance. Current performance may be lower or higher than the performance data quoted.
Carefully consider the Fund’s investment objectives, risk factors, charges, and expenses before investing. This and other information can be found in the Fund’s prospectus and, if available, its summary prospectus, which may be obtained by visiting www.delawareinvestments.com or calling 800 523-1918. Investors should read the prospectus and, if available, the summary prospectus carefully before investing.
| Fund performance | Average annual total returns through Nov. 30, 2010 |
| 1 year | Lifetime | |||
| Class A (Est. Dec. 29, 2008) | ||||
| Excluding sales charge | +21.31% | +34.95% | ||
| Including sales charge | +14.34% | +30.85% | ||
| Institutional Class (Est. Dec. 29, 2008) | ||||
| Excluding sales charge | +21.31% | +34.95% | ||
| Including sales charge | +21.31% | +34.95% |
Class C and R shares had not commenced operations as of Nov. 30, 2010.
Returns reflect the reinvestment of all distributions and any applicable sales charges as noted in the following paragraphs.
Expense limitations were in effect for certain classes during the periods shown in the “Fund performance” chart and in the “Performance of a $10,000 investment” chart. The current expenses for each class are listed on the “Fund expense ratios” chart. (Note that all charts and graphs referred to in the “Performance summary” section of this report are found on pages 4 through 6.) Performance would have been lower had the expense limitations not been in effect.
The Fund offers Class A, Class C, Class R, and Institutional Class shares.
Class A shares are sold with a maximum front-end sales charge of up to 5.75%, and have an annual distribution and service fee of up to 0.30% of average daily net assets. This fee has been contractually limited to 0.25% of average daily net assets from Dec. 29, 2010, through March 29, 2012.
Class C shares are sold with a contingent deferred sales charge of 1.00% if redeemed during the first 12 months. They are also subject to an annual distribution and service fee of up to 1.00% of average daily net assets. Class R shares are available only for certain retirement plan products. They are sold without a sales charge and have an annual distribution and service fee of up to 0.60% of average daily net assets which has been contractually limited to 0.50% from
4
Dec. 29, 2010, through March 29, 2012. No Class C or R shares were available during the periods shown.
Institutional Class shares are available without sales or asset-based distribution charges only to certain eligible institutional accounts.
Investments in small and/or medium-sized companies typically exhibit greater risk and higher volatility than larger, more established companies.
International investments entail risks not ordinarily associated with U.S. investments including fluctuation in currency values, differences in accounting principles, or economic or political instability in other nations.
Instances of high double-digit returns are unusual, cannot be sustained, and were primarily achieved during favorable market conditions.
Because the Fund expects to hold a concentrated portfolio of a limited number of securities, the Fund’s risk is increased because each investment has a greater effect on the Fund’s overall performance.
Diversification may not protect against market risk.
The “Fund performance” table and the “Performance of a $10,000 investment” graph do not reflect the deduction of taxes the shareholder would pay on Fund distributions or redemptions of Fund shares.
The Fund’s expense ratios, as described in the most recent prospectus, are disclosed in the following “Fund expense ratios” chart.
| Fund expense ratios | Class A | Institutional Class | ||
| Total annual operating expenses (without fee waivers) | 2.54% | 2.24% | ||
| Net expenses (including fee waivers, if any) | 1.55% | 1.30% | ||
| Type of waiver | Contractual | Contractual |
5
Performance summary
Delaware Focus Global Growth Fund
Delaware Focus Global Growth Fund
Performance of a $10,000 investment
Average annual total returns from Dec. 29, 2008 (Fund’s inception), through Nov. 30, 2010
Average annual total returns from Dec. 29, 2008 (Fund’s inception), through Nov. 30, 2010

| For period beginning Dec. 29, 2008, through Nov. 30, 2010 | Starting value | Ending value | ||
| Delaware Focus Global Growth Fund — Class A Shares | $9,425 | $16,773 | ||
| MSCI World Index (gross) | $10,000 | $13,974 | ||
| MSCI World Index (net) | $10,000 | $13,822 | ||
The chart assumes $10,000 invested in the Fund on Dec. 29, 2008, and includes the effect of a 5.75% front-end sales charge and the reinvestment of all distributions. Please note additional details on these fees in the “Performance summary” section of this report, which includes pages 4 through 6.
The chart also assumes $10,000 invested in the MSCI World Index as of Dec. 29, 2008.
The MSCI World Index is a free float-adjusted market capitalization weighted index designed to measure equity market performance across developed markets worldwide. Index “gross” return approximates the maximum possible dividend reinvestment. Index “net” return approximates the minimum possible dividend reinvestment, after deduction of withholding tax at the highest possible rate.
Index performance returns do not reflect any management fees, transaction costs or expenses. Indices are unmanaged and one cannot invest directly in an index. Past performance is not a guarantee of future results.
Performance of other Fund classes will vary due to different charges and expenses.
The “Fund performance” chart and the “Performance of a $10,000 investment” graph do not reflect the deduction of taxes shareholders would pay on Fund distributions or redemptions of Fund shares.
| Nasdaq symbols | CUSIPs | ||||||
| Class A | DGGAX | 246118541 | |||||
| Class C | DGGCX | 246118533 | |||||
| Class R | DGGRX | 246118525 | |||||
| Institutional Class | DGGIX | 246118517 | |||||
6
Disclosure of Fund expenses
For the six-month period from June 1, 2010 to November 30, 2010
For the six-month period from June 1, 2010 to November 30, 2010
As a shareholder of the Fund, you incur two types of costs: (1) transaction costs, including sales charges (loads) on purchase payments, reinvested dividends, or other distributions; redemption fees; and exchange fees; and (2) ongoing costs, including management fees; distribution and/or service (12b-1) fees; and other Fund expenses. This example is intended to help you understand your ongoing costs (in dollars) of investing in the Fund and to compare these costs with the ongoing costs of investing in other mutual funds.
The example is based on an investment of $1,000 invested at the beginning of the period and held for the entire six-month period from June 1, 2010 to November 30, 2010.
Actual expenses
The first section of the table shown, “Actual Fund return,” provides information about actual account values and actual expenses. You may use the information in this section of the table, together with the amount you invested, to estimate the expenses that you paid over the period. Simply divide your account value by $1,000 (for example, an $8,600 account value divided by $1,000 = 8.6), then multiply the result by the number in the first section under the heading entitled “Expenses Paid During Period” to estimate the expenses you paid on your account during this period.
Hypothetical example for comparison purposes
The second section of the table shown, “Hypothetical 5% return,” provides information about hypothetical account values and hypothetical expenses based on the Fund’s actual expense ratio and an assumed rate of return of 5% per year before expenses, which is not the Fund’s actual return. The hypothetical account values and expenses may not be used to estimate the actual ending account balance or expenses you paid for the period. You may use this information to compare the ongoing costs of investing in the Fund and other funds. To do so, compare this 5% hypothetical example with the 5% hypothetical examples that appear in the shareholder reports of the other funds.
Please note that the expenses shown in the table are meant to highlight your ongoing costs only and do not reflect any transactional costs, such as sales charges (loads), redemption fees, or exchange fees. Therefore, the second section of the table is useful in comparing ongoing costs only, and will not help you determine the relative total costs of owning different funds. In addition, if these transactional costs were included, your costs would have been higher. The Fund’s expenses shown in the table reflect fee waivers in effect. The expenses shown in the table assume reinvestment of all dividends and distributions.
8
Delaware Focus Global Growth Fund
Expense analysis of an investment of $1,000
Expense analysis of an investment of $1,000
| Beginning | Ending | Expenses | |||||||||||||
| Account Value | Account Value | Annualized | Paid During Period | ||||||||||||
| 6/1/10 | 11/30/10 | Expense Ratio | 6/1/10 to 11/30/10* | ||||||||||||
| Actual Fund return | |||||||||||||||
| Class A | $ | 1,000.00 | $ | 1,201.40 | 1.20 | % | $ | 6.62 | |||||||
| Institutional Class | 1,000.00 | 1,201.40 | 1.20 | % | 6.62 | ||||||||||
| Hypothetical 5% return (5% return before expenses) | |||||||||||||||
| Class A | $ | 1,000.00 | $ | 1,019.05 | 1.20 | % | $ | 6.07 | |||||||
| Institutional Class | 1,000.00 | 1,019.05 | 1.20 | % | 6.07 | ||||||||||
*“Expenses Paid During Period” are equal to the Fund’s annualized expense ratio, multiplied by the average account value over the period, multiplied by 183/365 (to reflect the one-half year period).
9
| Country and sector allocations | ||
| Delaware Focus Global Growth Fund | As of November 30, 2010 | |
Sector designations may be different than the sector designations presented in other Fund materials. The sector designations may represent the investment manager’s internal sector classifications, which may result in the sector designations for one fund being different than another fund’s sector designations.
| Composition of Portfolio | Percentage of net assets | |||
| Common Stock by Country | 98.76 | % | ||
| Australia | 2.58 | % | ||
| Brazil | 6.18 | % | ||
| China | 2.41 | % | ||
| Denmark | 3.20 | % | ||
| France | 4.67 | % | ||
| India | 1.93 | % | ||
| Mexico | 2.53 | % | ||
| Netherlands | 2.68 | % | ||
| Singapore | 2.31 | % | ||
| Switzerland | 14.01 | % | ||
| Taiwan | 2.02 | % | ||
| United Kingdom | 5.71 | % | ||
| United States | 48.53 | % | ||
| Discount Note | 1.39 | % | ||
| Total Value of Securities | 100.15 | % | ||
| Liabilities Net of Receivables and Other Assets | (0.15 | %) | ||
| Total Net Assets | 100.00 | % | ||
| Common Stock by Sector | Percentage of net assets | |||
| Consumer Discretionary | 24.28 | % | ||
| Consumer Staples | 2.52 | % | ||
| Energy | 2.68 | % | ||
| Financials | 17.54 | % | ||
| Healthcare | 10.14 | % | ||
| Industrials | 12.22 | % | ||
| Information Technology | 20.90 | % | ||
| Materials | 5.71 | % | ||
| Telecommunication Services | 2.77 | % | ||
| Total | 98.76 | %* | ||
* Only includes common stock.
10
| Statement of net assets | |
| Delaware Focus Global Growth Fund | November 30, 2010 |
| Number of shares | Value (U.S. $) | |||||
| Common Stock – 98.76%Δ | ||||||
| Australia – 2.58% | ||||||
| BHP Billiton ADR | 2,250 | $ | 185,400 | |||
| 185,400 | ||||||
| Brazil – 6.18% | ||||||
| BM&F Bovespa | 34,575 | 263,093 | ||||
| Natura Cosmeticos | 6,750 | 181,364 | ||||
| 444,457 | ||||||
| China – 2.41% | ||||||
| † | Ctrip.com International ADR | 3,960 | 173,527 | |||
| 173,527 | ||||||
| Denmark – 3.20% | ||||||
| Novo Nordisk Class B | 2,318 | 230,034 | ||||
| 230,034 | ||||||
| France – 4.67% | ||||||
| Accor | 4,080 | 172,288 | ||||
| † | Edenred | 7,350 | 163,540 | |||
| 335,828 | ||||||
| India – 1.93% | ||||||
| Infosys Technologies ADR | 2,100 | 138,915 | ||||
| 138,915 | ||||||
| Mexico – 2.53% | ||||||
| Grupo Televisa ADR | 7,800 | 181,740 | ||||
| 181,740 | ||||||
| Netherlands – 2.68% | ||||||
| Core Laboratories | 2,250 | 192,600 | ||||
| 192,600 | ||||||
| Singapore – 2.31% | ||||||
| Singapore Exchange | 25,500 | 166,403 | ||||
| 166,403 | ||||||
11
Statement of net assets
Delaware Focus Global Growth Fund
Delaware Focus Global Growth Fund
| Number of shares | Value (U.S. $) | ||||
| Common Stock (continued) | |||||
| Switzerland – 14.01% | |||||
| Julius Baer Group | 4,483 | $ | 170,043 | ||
| Kuehne & Nagel International | 1,872 | 240,091 | |||
| Roche Holding | 960 | 131,642 | |||
| SGS | 147 | 240,742 | |||
| Syngenta ADR | 4,050 | 225,626 | |||
| 1,008,144 | |||||
| Taiwan – 2.02% | |||||
| Taiwan Semiconductor Manufacturing ADR | 13,500 | 145,125 | |||
| 145,125 | |||||
| United Kingdom – 5.71% | |||||
| Compass Group | 20,370 | 176,296 | |||
| Intertek Group | 8,307 | 234,580 | |||
| 410,876 | |||||
| United States – 48.53% | |||||
| Allergan | 3,300 | 218,691 | |||
| † | Apple | 960 | 298,703 | ||
| † | Crown Castle International | 4,800 | 199,392 | ||
| † | Google Class A | 270 | 150,042 | ||
| † | IntercontinentalExchange | 1,875 | 211,313 | ||
| † | Intuit | 4,200 | 188,538 | ||
| MasterCard Class A | 1,125 | 266,658 | |||
| † | MSCI Class A | 5,400 | 183,924 | ||
| NIKE Class B | 2,025 | 174,413 | |||
| Perrigo | 2,475 | 149,094 | |||
| † | priceline.com | 660 | 260,073 | ||
| QUALCOMM | 4,800 | 224,352 | |||
| Staples | 6,900 | 151,869 | |||
| Strayer Education | 1,740 | 236,414 | |||
| † | Teradata | 4,200 | 172,578 | ||
| Thomson Reuters | 6,035 | 219,882 | |||
| † | Verisign | 5,400 | 185,275 | ||
| 3,491,211 | |||||
| Total Common Stock (cost $4,949,773) | 7,104,260 | ||||
12
| Principal amount (U.S. $) | Value (U.S. $) | |||||||
| ≠Discount Note – 1.39% | ||||||||
| Federal Home Loan Bank 0.07% 12/1/10 | $100,000 | $ | 100,000 | |||||
| Total Discount Note (cost $100,000) | 100,000 | |||||||
| Total Value of Securities – 100.15% | ||||||||
| (cost $5,049,773) | 7,204,260 | |||||||
| Liabilities Net of Receivables and | ||||||||
| Other Assets – (0.15%) | (10,576 | ) | ||||||
| Net Assets Applicable to 524,436 | ||||||||
| Shares Outstanding – 100.00% | $ | 7,193,684 | ||||||
| Net Asset Value – Delaware Focus Global Growth Fund | ||||||||
| Class A ($2,413,097 / 175,929 Shares) | $13.72 | |||||||
| Net Asset Value – Delaware Focus Global Growth Fund | ||||||||
| Institutional Class ($4,780,587 / 348,507 Shares) | $13.72 | |||||||
| Components of Net Assets at November 30, 2010: | ||||||||
| Shares of beneficial interest (unlimited authorization – no par) | $ | 4,822,158 | ||||||
| Undistributed net investment income | 4,240 | |||||||
| Accumulated net realized gain on investments | 212,364 | |||||||
| Net unrealized appreciation of investments and foreign currencies | 2,154,922 | |||||||
| Total net assets | $ | 7,193,684 | ||||||
| Δ | Securities have been classified by country of origin. Classification by type of business has been presented on page 10 in “Country and sector allocations.” |
| † | Non income producing security. |
| ≠ | The rate shown is the effective yield at the time of purchase. |
ADR — American Depositary Receipts
13
Statement of net assets
Delaware Focus Global Growth Fund
Delaware Focus Global Growth Fund
| Net Asset Value and Offering Price Per Share – | |||
| Delaware Focus Global Growth Fund | |||
| Net asset value Class A (A) | $ | 13.72 | |
| Sales charge (5.75% of offering price) (B) | 0.84 | ||
| Offering price | $ | 14.56 |
| (A) | Net asset value per share, as illustrated, is the amount which would be paid upon redemption or repurchase of shares. |
| (B) | See the current prospectus for purchases of $50,000 or more. |
See accompanying notes, which are an integral part of the financial statements.
14
| Statement of operations | |
| Delaware Focus Global Growth Fund | Year Ended November 30, 2010 |
| Investment Income: | ||||||||
| Dividends | $ | 85,030 | ||||||
| Foreign tax withheld | (6,666 | ) | $ | 78,364 | ||||
| Expenses: | ||||||||
| Management fees | 47,496 | |||||||
| Reports and statements to shareholders | 13,846 | |||||||
| Audit and tax | 11,136 | |||||||
| Distribution expenses – Class A | 7,406 | |||||||
| Dividend disbursing and transfer agent fees and expenses | 6,874 | |||||||
| Pricing fees | 4,677 | |||||||
| Custodian fees | 4,345 | |||||||
| Dues and services | 2,528 | |||||||
| Accounting and administration expenses | 2,215 | |||||||
| Registration fees | 2,168 | |||||||
| Legal fees | 1,265 | |||||||
| Trustees’ fees | 319 | |||||||
| Insurance fees | 226 | |||||||
| Consulting fees | 86 | |||||||
| Trustees’ expenses | 24 | 104,611 | ||||||
| Less fees waived | (30,145 | ) | ||||||
| Less waived distribution expenses – Class A | (7,406 | ) | ||||||
| Total operating expenses | 67,060 | |||||||
| Net Investment Income | 11,304 | |||||||
| Net Realized and Unrealized Gain (Loss) on Investments | ||||||||
| and Foreign Currencies: | ||||||||
| Net realized gain (loss) on: | ||||||||
| Investments | 212,492 | |||||||
| Foreign currencies | (206 | ) | ||||||
| Foreign currency exchange contracts | (6,745 | ) | ||||||
| Net realized gain | 205,541 | |||||||
| Unrealized appreciation/depreciation of | ||||||||
| investments and foreign currencies | 920,455 | |||||||
| Net Realized and Unrealized Gain on Investments | ||||||||
| and Foreign Currencies | 1,125,996 | |||||||
| Net Increase in Net Assets Resulting from Operations | $ | 1,137,300 |
See accompanying notes, which are an integral part of the financial statements.
15
Statements of changes in net assets
Delaware Focus Global Growth Fund
Delaware Focus Global Growth Fund
| Year | 12/29/08* | |||||||
| Ended | to | |||||||
| 11/30/10 | 11/30/09 | |||||||
| Increase in Net Assets from Operations: | ||||||||
| Net investment income | $ | 11,304 | $ | 20,932 | ||||
| Net realized gain on investments and foreign currencies | 205,541 | 442,814 | ||||||
| Unrealized appreciation/depreciation of | ||||||||
| investments and foreign currencies | 920,455 | 1,234,467 | ||||||
| Net increase in net assets resulting from operations | 1,137,300 | 1,698,213 | ||||||
| Dividends and Distributions to Shareholders from: | ||||||||
| Net investment income: | ||||||||
| Class A | (5,410 | ) | — | |||||
| Institutional Class | (5,056 | ) | — | |||||
| Net realized gain on investments: | ||||||||
| Class A | (234,429 | ) | — | |||||
| Institutional Class | (219,092 | ) | — | |||||
| (463,987 | ) | — | ||||||
| Capital Share Transactions: | ||||||||
| Proceeds from shares sold: | ||||||||
| Class A | 2,501 | 1,734,088 | ||||||
| Institutional Class | 1,775,510 | 2,000,026 | ||||||
| Net asset value of shares issued upon reinvestment | ||||||||
| of dividends and distributions: | ||||||||
| Class A | 171,593 | — | ||||||
| Institutional Class | 224,148 | — | ||||||
| 2,173,752 | 3,734,114 | |||||||
| Cost of shares repurchased: | ||||||||
| Class A | (485,708 | ) | — | |||||
| Institutional Class | — | (600,000 | ) | |||||
| (485,708 | ) | (600,000 | ) | |||||
| Increase in net assets derived from capital share transactions | 1,688,044 | 3,134,114 | ||||||
| Net Increase in Net Assets | 2,361,357 | 4,832,327 | ||||||
| Net Assets: | ||||||||
| Beginning of year | 4,832,327 | — | ||||||
| End of year (including undistributed net investment | ||||||||
| income of $4,240 and $10,353 respectively) | $ | 7,193,684 | $ | 4,832,327 | ||||
*Date of commencement of operations.
See accompanying notes, which are an integral part of the financial statements.
16
Financial highlights
Delaware Focus Global Growth Fund
Delaware Focus Global Growth Fund
Selected data for each share of the Fund outstanding throughout each period were as follows:
| Net asset value, beginning of period |
| Income from investment operations: |
| Net investment income2 |
| Net realized and unrealized gain on investments and foreign currencies |
| Total from investment operations |
| Less dividends and distributions from: |
| Net investment income |
| Net realized gain on investments |
| Total dividends and distributions |
| Net asset value, end of period |
| Total return3 |
| Ratios and supplemental data: |
| Net assets, end of period (000 omitted) |
| Ratio of expenses to average net assets |
| Ratio of expenses to average net assets |
| prior to fees waived |
| Ratio of net investment income to average net assets |
| Ratio of net investment loss to average net assets |
| prior to fees waived |
| Portfolio turnover |
1 Date of commencement of operations; ratios and portfolio turnover have been annualized and total return has not been annualized.
2 The average shares outstanding method has been applied for per share information.
3 Total investment return is based on the change in net asset value of a share during the period and assumes reinvestment of dividends and distributions at net asset value and does not reflect the impact of a sales charge. Total investment return during all the periods shown reflects waivers by the manager and, for Class A shares, distributor. Performance would have been lower had the waivers not been in effect.
See accompanying notes, which are an integral part of the financial statements.
18
| Class A | Institutional Class | |||||||||||
| Year | 12/29/081 | Year | 12/29/081 | |||||||||
| Ended | to | Ended | to | |||||||||
| 11/30/10 | 11/30/09 | 11/30/10 | 11/30/09 | |||||||||
| $12.470 | $8.500 | $12.470 | $8.500 | |||||||||
| 0.025 | 0.050 | 0.025 | 0.050 | |||||||||
| 2.422 | 3.920 | 2.422 | 3.920 | |||||||||
| 2.447 | 3.970 | 2.447 | 3.970 | |||||||||
| (0.027 | ) | — | (0.027 | ) | — | |||||||
| (1.170 | ) | — | (1.170 | ) | — | |||||||
| (1.197 | ) | — | (1.197 | ) | — | |||||||
| $13.720 | $12.470 | $13.720 | $12.470 | |||||||||
| 21.31% | 46.71% | 21.31% | 46.71% | |||||||||
| $2,413 | $2,498 | $4,781 | $2,334 | |||||||||
| 1.20% | 1.20% | 1.20% | 1.20% | |||||||||
| 2.04% | 2.54% | 1.74% | 2.24% | |||||||||
| 0.20% | 0.52% | 0.20% | 0.52% | |||||||||
| (0.64% | ) | (0.82% | ) | (0.34% | ) | (0.52% | ) | |||||
| 30% | 45% | 30% | 45% | |||||||||
19
| Notes to financial statements | ||
| Delaware Focus Global Growth Fund | November 30, 2010 | |
Delaware Group® Global & International Funds (Trust) is organized as a Delaware statutory trust and offers five series: Delaware Focus Global Growth Fund, Delaware International Value Equity Fund, Delaware Emerging Markets Fund, Delaware Global Value Fund and Delaware Macquarie Global Infrastructure Fund. These financial statements and the related notes pertain to the Delaware Focus Global Growth Fund (Fund). The Trust is an open-end investment company. The Fund is considered diversified under the Investment Company Act of 1940, as amended, and offers Class A, Class C, Class R and Institutional Class shares. Class A shares are sold with a maximum front-end sales charge of up to 5.75%. Class A share purchases of $1,000,000 or more will incur a contingent deferred sales charge (CDSC) if redeemed during the first two years, provided that Delaware Distributors, L.P. (DDLP) paid a financial advisor a commission on the purchase of those shares. Class C shares are sold with a CDSC of 1%, if redeemed during the first twelve months. Class R and Institutional Class shares are not subject to a sales charge and are offered for sale exclusively to certain eligible investors. As of November 30, 2010, Class C and Class R had not commenced operations.
The investment objective of the Fund is to seek long-term capital appreciation.
1. Significant Accounting Policies
The following accounting policies are in accordance with U.S. generally accepted accounting principles (U.S. GAAP) and are consistently followed by the Fund.
Security Valuation — Equity securities, except those traded on the Nasdaq Stock Market, Inc. (Nasdaq), are valued at the last quoted sales price as of the time of the regular close of the New York Stock Exchange (NYSE) on the valuation date. Securities traded on the Nasdaq are valued in accordance with the Nasdaq Official Closing Price, which may not be the last sales price. If on a particular day an equity security does not trade, then the mean between the bid and ask prices will be used. Securities listed on a foreign exchange are valued at the last quoted sales price on the valuation date. Short-term debt securities are valued at market value. Foreign currency exchange contracts are valued at the mean between the bid and ask prices. Interpolated values are derived when the settlement date of the contract is an interim date for which quotations are not available. Generally, other securities and assets for which market quotations are not readily available are valued at fair value as determined in good faith under the direction of the Fund’s Board of Trustees (Board). In determining whether market quotations are readily available or fair valuation will be used, various factors will be taken into consideration, such as market closures, or suspension of trading in a security. The Fund may use fair value pricing more frequently for securities traded primarily in non-U.S. markets because, among other things, most foreign markets close well before the Fund values its securities generally as of 4:00 p.m. Eastern time. The earlier close of these foreign markets gives rise to the possibility that significant events, including broad market moves, government actions or pronouncements, aftermarket trading, or news events may have occurred in the interim. To account for this, the Fund may frequently value foreign securities using fair value prices based on third-party vendor modeling tools (international fair value pricing).
20
Federal Income Taxes — No provision for federal income taxes has been made as the Fund intends to continue to qualify for federal income tax purposes as a regulated investment company under Subchapter M of the Internal Revenue Code of 1986, as amended, and make the requisite distributions to shareholders. The Fund evaluates tax positions taken or expected to be taken in the course of preparing the Fund’s tax returns to determine whether the tax positions are “more-likely-than-not” of being sustained by the applicable tax authority. Tax positions not deemed to meet the more-likely-than-not threshold are recorded as a tax benefit or expense in the current year. Management has analyzed the Fund’s tax positions for all open tax years (November 30, 2009 – November 30, 2010), and has concluded tha t no provision for federal income tax is required in the Fund’s financial statements.
Class Accounting — Investment income, common expenses and realized and unrealized gain (loss) on investments are allocated to the various classes of the Fund on the basis of daily net assets of each class. Distribution expenses relating to a specific class are charged directly to that class.
Foreign Currency Transactions — Transactions denominated in foreign currencies are recorded at the prevailing exchange rates on the valuation date in accordance with the Fund’s prospectus. The value of all assets and liabilities denominated in foreign currencies is translated into U.S. dollars at the exchange rate of such currencies against the U.S. dollar daily. Transaction gains or losses resulting from changes in exchange rates during the reporting period or upon settlement of the foreign currency transaction are reported in operations for the current period. The Fund does not isolate that portion of realized gains and losses on investments which is due to changes in foreign exchange rates from that which are due to changes in market prices. Such changes are included with the net realized and unrealized gain or loss on investments. The Fund reports certain foreign currency related transactions as components of realized gains (losses) for financial reporting purposes, whereas such components are treated as ordinary income (loss) for federal income tax purposes.
Use of Estimates — The preparation of financial statements in conformity with U.S. GAAP requires management to make estimates and assumptions that affect the reported amounts of assets and liabilities and disclosure of contingent assets and liabilities at the date of the financial statements and the reported amounts of revenues and expenses during the reporting period. Actual results could differ from those estimates and the differences could be material.
Other — Expenses directly attributable to the Fund are charged directly to the Fund. Other expenses common to various funds within the Delaware Investments® Family of Funds are generally allocated amongst such funds on the basis of average net assets. Management fees and some other expenses are paid monthly. Security transactions are recorded on the date the securities are purchased or sold (trade date) for financial reporting purposes. Costs used in calculating realized gains and losses on the sale of investment securities are those of the specific securities sold. Dividend income is recorded on the ex-dividend date and interest income is recorded on the accrual basis. Foreign dividends are also recorded on the ex-dividend date or as soon after the ex-di vidend date that the Fund is aware of such dividends, net of all non-rebatable
21
Notes to financial statements
Delaware Focus Global Growth Fund
Delaware Focus Global Growth Fund
1. Significant Accounting Policies (continued)
tax withholdings. Withholding taxes on foreign dividends have been recorded in accordance with the Fund’s understanding of the applicable country’s tax rules and rates. The Fund declares and pays dividends from net investment income and distributions from net realized gain on investments, if any, annually. Dividends and distributions, if any, are recorded on the ex-dividend date.
The Fund may receive earnings credits from its custodian when positive cash balances are maintained, which are used to offset custody fees. There were no earnings credits for the year ended November 30, 2010.
The Fund may receive earnings credits from its transfer agent when positive cash balances are maintained, which may be used to offset transfer agent fees. There were no earnings credits for the year ended November 30, 2010.
2. Investment Management, Administration Agreements and Other Transactions with Affiliates
In accordance with the terms of its investment management agreement, the Fund pays Delaware Management Company (DMC), a series of Delaware Management Business Trust and the investment manager, an annual fee which is calculated daily at the rate of 0.85% on the first $500 million of average daily net assets of the Fund, 0.80% on the next $500 million, 0.75% on the next $1.5 billion, and 0.70% on average daily net assets in excess of $2.5 billion.
DMC has voluntarily agreed to waive that portion, if any, of its management fee and reimburse the Fund to the extent necessary to ensure that total annual operating expenses (excluding any 12b-1 plan expenses, taxes, interest, inverse floater program expenses, brokerage fees, certain insurance costs, and nonroutine expenses or costs, including, but not limited to, those relating to reorganizations, litigation, conducting shareholder meetings, and liquidations (collectively, nonroutine expenses)) do not exceed 1.20% of average daily net assets of the Fund through December 28, 2010. For purposes of this waiver and reimbursement, nonroutine expenses may also include such additional costs and expenses, as may be agreed upon from time to time by the Fund’s Board and DMC. Effective, December 29, 2010, DMC has contractually agreed to waive that portion, if any, of its management fee and reimburse the Fund to the extent necessary to ensure t hat total annual operating expenses do not exceed 1.30% of average daily net assets of the Fund through March 31, 2012.
Delaware Service Company, Inc. (DSC), an affiliate of DMC, provides fund accounting and financial administration oversight services to the Fund. For these services, the Fund pays DSC fees based on the aggregate daily net assets of the Delaware Investments® Family of Funds at the following annual rate: 0.0050% of the first $30 billion; 0.0045% of the next $10 billion; 0.0040% of the next $10 billion; and 0.0025% of aggregate average daily net assets in excess of $50 billion. The fees payable to DSC under the service agreement described above are allocated among all Funds in the Delaware Investments® Family of Funds on a relative net asset value basis. For the year ended November 30, 2010, the Fund was charged $279 for these services.
22
DSC also provides dividend disbursing and transfer agency services. The Fund pays DSC a monthly fee based on the number of shareholder accounts for dividend disbursing and transfer agent services.
Pursuant to a distribution agreement and distribution plan, the Fund pays DDLP, the distributor and an affiliate of DMC, an annual distribution and service fee not to exceed 0.30% of the average daily net assets of the Class A shares, 1.00% of the average daily net assets of the Class C shares and 0.60% of the average daily net assets of Class R shares. Institutional Class shares pay no distribution and service expenses. DDLP has voluntarily agreed to waive all distribution and service fees through December 28, 2010. Effective, December 29, 2010, DDLP has contracted to waive distribution and service fees through March 30, 2012 in order to prevent distribution and service fees of Class A and Class R shares from exceeding 0.25% and 0.50%, respectively, of average daily net assets.
At November 30, 2010, the Fund had receivables due from or liabilities payable to affiliates as follows:
| Investment management fee payable to DMC | $ | 3,219 |
| Dividend disbursing, transfer agent and fund accounting | ||
| oversight fees and other expenses payable to DSC | 42 | |
| Other expenses payable to DMC and affiliates* | 899 |
*DMC, as part of its administrative services, pays operating expenses on behalf of the Fund and is reimbursed on a periodic basis. Such Expenses include items such as printing of shareholder reports, fees for audit, legal and tax services, registration fees and trustees’ fees.
As provided in the investment management agreement, the Fund bears the cost of certain legal and tax services, including internal legal and tax services provided to the Fund by DMC and/or its affiliates’ employees. For the year ended November 30, 2010, the Fund was charged $207 for internal legal and tax services provided by DMC and/or its affiliates’ employees.
Trustees’ fees include expenses accrued by the Fund for each Trustee’s retainer and meeting fees. Certain officers of DMC, DSC and DDLP are officers and/or Trustees of the Trust. These officers and Trustees are paid no compensation by the Fund.
3. Investments
For the year ended November 30, 2010, the Fund made purchases of $2,811,246 and sales of $1,655,403 of investment securities other than short-term investments.
At November 30, 2010, the cost of investments for federal income tax purposes was $5,049,891. At November 30, 2010, the net unrealized appreciation was $2,154,369, of which $2,239,861 related to unrealized appreciation of investments and $85,492 related to unrealized depreciation of investments.
U.S. GAAP defines fair value as the price that the Fund would receive to sell an asset or pay to transfer a liability in an orderly transaction between market participants at the measurement
23
Notes to financial statements
Delaware Focus Global Growth Fund
Delaware Focus Global Growth Fund
3. Investments (continued)
date under current market conditions. A three level hierarchy for fair value measurements has been established based upon the transparency of inputs to the valuation of an asset or liability. Inputs may be observable or unobservable and refer broadly to the assumptions that market participants would use in pricing the asset or liability. Observable inputs reflect the assumptions market participants would use in pricing the asset or liability based on market data obtained from sources independent of the reporting entity. Unobservable inputs reflect the reporting entity’s own assumptions about the assumptions that market participants would use in pricing the asset or liability developed based on the best information available under the circumstances. The Fund’s investment in its entirety is assigned a level based upon the observability of the inputs which are significant to the overall valuation. The three level hierarchy of inpu ts is summarized below.
| Level 1 | – | inputs are quoted prices in active markets for identical investments (e.g., equity securities, open-end investment companies, futures contracts, options contracts) | ||
| Level 2 | – | other observable inputs (including, but not limited to: quoted prices for similar assets or liabilities in markets that are active, quoted prices for identical or similar assets or liabilities in markets that are not active, inputs other than quoted prices that are observable for the assets or liabilities (such as interest rates, yield curves, volatilities, prepayment speeds, loss severities, credit risks and default rates) or other market-corroborated inputs) (e.g., debt securities, government securities, swap contracts, foreign currency exchange contracts, foreign securities utilizing international fair value pricing) | ||
| Level 3 | – | inputs are significant unobservable inputs (including the Fund’s own assumptions used to determine the fair value of investments) (e.g., broker-quoted securities, fair valued securities) The following table summarizes the valuation of the Fund’s investments by fair value hierarchy levels as of November 30, 2010: |
| Level 1 | Level 2 | Total | ||||||
| Common Stock | $ | 5,178,601 | $ | 1,925,659 | $ | 7,104,260 | ||
| Discount Note | — | 100,000 | 100,000 | |||||
| Total | $ | 5,178,601 | $ | 2,025,659 | $ | 7,204,260 | ||
There were no Level 3 securities at the beginning or end of the year.
In January 2010, the Financial Accounting Standards Board issued an Accounting Standards Update, Improving Disclosures about Fair Value Measurements, which introduces new disclosure requirements and clarified certain existing disclosure requirements around fair value measurements currently presented above. The new disclosures and clarifications of existing disclosures are generally effective for the Fund’s year ending November 30, 2011 and interim periods therein. Utilizing international far value pricing could cause transfers from
24
Level 1 investments to Level 2 investments in the hierarchy. During the fiscal year ended November 30, 2010, there were no transfers between Level 1 investments, Level 2 investments or Level 3 investments that had a material impact to the Fund.
4. Dividend and Distribution Information
Income and long-term capital gain distributions are determined in accordance with federal income tax regulations, which may differ from U.S. GAAP. Additionally, distributions from net gains on foreign currency transactions and net short-term gains on sales of investment securities are treated as ordinary income for federal income tax purposes. There were no dividends and distributions paid during the period December 29, 2008 through November 30, 2009. The tax character of dividends and distributions paid during the year ended November 30, 2010 was as follows:
| Year Ended | ||
| 11/30/10 | ||
| Ordinary income | $463,987 |
5. Components of Net Assets on a Tax Basis
As of November 30, 2010, the components of net assets on a tax basis were as follows:
| Shares of beneficial interest | $ | 4,822,158 |
| Undistributed ordinary income | 85,591 | |
| Undistributed long-term capital gain | 131,131 | |
| Unrealized appreciation of investments and foreign currencies | 2,154,804 | |
| Net assets | $ | 7,193,684 |
The differences between book basis and tax basis components of net assets are primarily attributable to tax deferral of losses on wash sales.
For financial reporting purposes, capital accounts are adjusted to reflect the tax character of permanent book/tax differences. Reclassifications are primarily due to tax treatment of gain (loss) on foreign currency transactions. Results of operations and net assets were not affected by these reclassifications. For the year ended November 30, 2010, the Fund recorded the following reclassifications.
| Undistributed net investment income | $ | (6,951 | ) |
| Accumulated net realized gain | 6,951 |
25
Notes to financial statements
Delaware Focus Global Growth Fund
Delaware Focus Global Growth Fund
6. Capital Shares
Transactions in capital shares were as follows:
| Year | 12/29/08* | ||||
| Ended | to | ||||
| 11/30/10 | 11/30/09 | ||||
| Shares sold: | |||||
| Class A | 211 | 200,366 | |||
| Institutional Class | 142,041 | 235,297 | |||
| Shares issued upon reinvestment of dividends and distributions: | |||||
| Class A | 14,704 | — | |||
| Institutional Class | 19,207 | — | |||
| 176,163 | 435,663 | ||||
| Shares repurchased: | |||||
| Class A | (39,352 | ) | — | ||
| Institutional Class | — | (48,038 | ) | ||
| (39,352 | ) | (48,038 | ) | ||
| Net increase | 136,811 | 387,625 | |||
*Date of commencement of operations.
7. Line of Credit
The Fund, along with certain other funds in the Delaware Investments® Family of Funds (Participants), was a participant in a $35,000,000 revolving line of credit with The Bank of New York Mellon (BNY Mellon) to be used for temporary or emergency purposes as an additional source of liquidity to fund redemptions of investor shares. Under the agreement, the Participants were charged an annual commitment fee, which was allocated across the Participants on the basis of each Participant’s allocation of the entire facility. The Participants were permitted to borrow up to a maximum of one third of their net assets under the agreement. The line of credit expired on November 16, 2010.
Effective as of November 16, 2010, the Fund along with the other Participants entered into an amendment to the agreement with BNY Mellon for a $50,000,000 revolving line of credit. The agreement as amended is to be used as described above and operates in substantially the same manner as the original agreement. The new line of credit under the agreement as amended expires on November 15, 2011. The Fund had no amounts outstanding as of November 30, 2010, or at any time during the year then ended.
8. Derivatives
U.S. GAAP requires enhanced disclosures that enable investors to understand: 1) how and why an entity uses derivatives, 2) how they are accounted for, and 3) how they affect an entity’s results of operations and financial position.
26
Foreign Currency Exchange Contracts — The Fund may enter into foreign currency exchange contracts as a way of managing foreign exchange rate risk. The Fund may enter into these contracts to fix the U.S. dollar value of a security that it has agreed to buy or sell for the period between the date the trade was entered into and the date the security is delivered and paid for. The Fund may also use these contracts to hedge the U.S. dollar value of securities it already owns that are denominated in foreign currencies. The change in value is recorded as an unrealized gain or loss. When the contract is closed, a realized gain or loss is recorded equal to the difference between the value of the contract at the time it was opened and the value at the time it was closed.
The use of foreign currency exchange contracts does not eliminate fluctuations in the underlying prices of the securities, but does establish a rate of exchange that can be achieved in the future. Although foreign currency exchange contracts limit the risk of loss due to an unfavorable change in the value of hedged currency, they also limit any potential gain that might result should the value of the currency change favorably. In addition, the Fund could be exposed to risks if the counterparties to the contracts are unable to meet the terms of their contracts. The Fund’s maximum risk of loss from counterparty credit risk is the value of their currency exchanged with the counterparty. The risk is generally mitigated by having a netting arrangement between the Funds and the counterparty and by the posting of collateral by the counterparty to the Fund to cover the Fund’s exposure to the counterparty. No foreign currency excha nge contracts were outstanding at November 30, 2010.
9. Securities Lending
The Fund, along with other funds in the Delaware Investments® Family of Funds, may lend its securities pursuant to a security lending agreement (Lending Agreement) with BNY Mellon. With respect to each loan, if on any business day the aggregate market value of securities collateral plus cash collateral held is less than the aggregate market value of the securities which are the subject of such loan, the borrower will be notified to provide additional collateral by the end of the following business day which, together with the collateral already held, will be not less than the applicable collateral requirements for such security loan. If the aggregate market value of securities collateral and cash collateral held with respect to a security loan exceeds the applicable collateral requirement, upon request of the borrower BNY Mellon must return enough collateral to the borrower by the end of the following business day to reduce the value of the remaining collateral to the applicable collateral requirement for such security loan. As a result of the foregoing, the value of the collateral held with respect to a loaned security may be temporarily more or less than the value of the security on loan. Cash collateral received is generally invested in the Delaware Investments Collateral Fund No.1 (Collective Trust) established by BNY Mellon for the purpose of investment on behalf of funds managed by DMC that participate in BNY Mellon’s securities lending program. The Collective Trust may invest in U.S. government securities and high quality corporate debt, asset-backed and other money market securities and in repurchase agreement collateralized by such securities, provided that the Collective Trust will generally have a dollar-weighted average portfolio maturity of 60 days or less. The Collective Trust seeks to maintain a net asset value per unit of $1.00, but there can be no assura nce that it will always
27
Notes to financial statements
Delaware Focus Global Growth Fund
Delaware Focus Global Growth Fund
9. Securities Lending (continued)
be able to do so. The Fund may incur investment losses as a result of investing securities lending collateral in the Collective Trust. This could occur if an investment in the Collective Trust defaulted or if it were necessary to liquidate assets in the Collective Trust to meet returns on outstanding security loans at a time when the Collective Trust’s net asset value per unit was less than $1.00. Under those circumstances, the Fund may not receive an amount from the Collective Trust that is equal in amount to the collateral the Fund would be required to return to the borrower of the securities and the Fund would be required to make up for this shortfall. The Fund can also accept U.S. government securities and letters of credit (non-cash collateral) in connection with securities loans. In the event of default or bankruptcy by the lending agent, realization and/ or retention of the collateral may be subject to legal proceedings. In th e event the borrower fails to return loaned securities and the collateral received is insufficient to cover the value of the loaned securities and provided such collateral shortfall is not the result of investment losses, the lending agent has agreed to pay the amount of the shortfall to the Fund, or at the discretion of the lending agent, replace the loaned securities. The Fund continues to record dividends or interest, as applicable, on the securities loaned and is subject to change in value of the securities loaned that may occur during the term of the loan. The Fund has the right under the Lending Agreement to recover the securities from the borrower on demand. With respect to security loans collateralized by non-cash collateral, the Fund receives loan premiums paid by the borrower. With respect to security loans collateralized by cash collateral, the earnings from the collateral investments are shared among the Fund, the security lending agent and the borrower. The Fund records security lending income n et of allocations to the security lending agent and the borrower. The Fund had no securities out on loan as of November 30, 2010.
10. Credit and Market Risk
Some countries in which the Fund may invest require governmental approval for the repatriation of investment income, capital or the proceeds of sales of securities by foreign investors. In addition, if there is deterioration in a country’s balance of payments or for other reasons, a country may impose temporary restrictions on foreign capital remittances abroad.
The securities exchanges of certain foreign markets are substantially smaller, less liquid, and more volatile than the major securities markets in the United States. Consequently, acquisition and disposition of securities by the Fund may be inhibited. In addition, a significant portion of the aggregate market value of equity securities listed on the major securities exchanges in emerging markets are held by a smaller number of investors. This may limit the number of shares available for acquisition or disposition by the Fund.
The Fund may invest up to 15% of its net assets in illiquid securities, which may include securities with contractual restrictions on resale, securities exempt from registration under Rule 144A of the Securities Act of 1933, as amended, and other securities which may not be readily marketable. The relative illiquidity of these securities may impair the Fund from disposing of them in a timely manner and at a fair price when it is necessary or desirable to do so. While maintaining oversight,
28
the Fund’s Board has delegated to DMC the day-to-day functions of determining whether individual securities are liquid for purposes of the Fund’s limitation on investments in illiquid assets. Securities eligible for resale pursuant to Rule 144A, which are determined to be liquid, are not subject to the Fund’s 15% limit on investments in illiquid securities. As of November 30, 2010, there were no Rule 144A securities and no securities have been determined to be illiquid under the Fund’s Liquidity Procedures.
11. Contractual Obligations
The Fund enters into contracts in the normal course of business that contain a variety of indemnifications. The Fund’s maximum exposure under these arrangements is unknown. However, the Fund has not had prior claims or losses pursuant to these contracts. Management has reviewed the Fund’s existing contracts and expects the risk of loss to be remote.
12. Subsequent Events
Management has determined no material events or transactions occurred subsequent to November 30, 2010 that would require recognition or disclosure in the Fund’s financial statements.
13. Tax Information (Unaudited)
The information set forth below is for the Fund’s fiscal year as required by federal laws. Shareholders, however, must report distributions on a calendar year basis for income tax purposes, which may include distributions for portions of two fiscal years of a fund. Accordingly, the information needed by shareholders for income tax purposes will be sent to them in January of each year. Please consult your tax advisor for proper treatment of this information.
For the fiscal year ended November 30, 2010, the Fund designates distributions paid during the year as follows:
| (A) Ordinary Income Distribution (Tax Basis) | 100 | % |
| (B) Qualifying Dividend1 | 3 | % |
| (A) is based on a percentage of the Fund’s total distributions. |
| (B) is based on a percentage of the Fund’s ordinary income distributions. |
| 1Qualifying dividends represent dividends which qualify for the corporate dividends received deduction. |
| *For the fiscal year ended November 30, 2010, certain dividends paid by the Fund may be subject to a maximum tax rate of 15%, as provided for by the Jobs and Growth Tax Relief Reconciliation Act of 2003. The Fund intends to designate up to a maximum amount of $14,269 to be taxed at a maximum rate of 15%. Complete information will be computed and reported in conjunction with your 2009 or 2010 Form 1099-DIV. |
29
Report of independent
registered public accounting firm
registered public accounting firm
To the Board of Trustees of Delaware Group Global & International Funds
and the Shareholders of Delaware Focus Global Growth Fund:
and the Shareholders of Delaware Focus Global Growth Fund:
In our opinion, the accompanying statement of net assets and the related statements of operations and of changes in net assets and the financial highlights present fairly, in all material respects, the financial position of Delaware Focus Global Growth Fund (one of the series constituting Delaware Group Global & International Funds, hereafter referred to as the “Fund”) at November 30, 2010, and the results of its operations, the changes in its net assets and the financial highlights for the year then ended, in conformity with accounting principles generally accepted in the United States of America. These financial statements and financial highlights (hereafter referred to as “financial statements”) are the responsibility of the Fund’s management; our responsibility is to express an opinion on these financial statements based on our audit. We conducted our audit of these financial statements in accordance w ith the standards of the Public Company Accounting Oversight Board (United States). Those standards require that we plan and perform the audit to obtain reasonable assurance about whether the financial statements are free of material misstatement. An audit includes examining, on a test basis, evidence supporting the amounts and disclosures in the financial statements, assessing the accounting principles used and significant estimates made by management, and evaluating the overall financial statement presentation. We believe that our audit, which included confirmation of securities at November 30, 2010 by correspondence with the custodian, provides a reasonable basis for our opinion. The statement of changes in net assets and the financial highlights for the period December 29, 2008 (commencement of operations) through November 30, 2009 were audited by other independent accountants whose report dated January 21, 2010 expressed an unqualified opinion on those statements.
PricewaterhouseCoopers LLP
Philadelphia, Pennsylvania
January 19, 2011
Philadelphia, Pennsylvania
January 19, 2011
30
Other Fund information
(Unaudited)
Delaware Focus Global Growth Fund
(Unaudited)
Delaware Focus Global Growth Fund
Change in Independent Registered Public Accounting Firm
Due to independence matters under the Securities and Exchange Commission’s auditor independence rules relating to the January 4, 2010 acquisition of Delaware Investments (including DMC, DDLP and DSC) by Macquarie Group, Ernst & Young LLP (“E&Y”) has resigned as the independent registered public accounting firm for Delaware Group® Global & International Funds (the “Trust”) effective May 20, 2010. At a meeting held on May 20, 2010, the Board of Trustees of the Trust, upon recommendation of the Audit Committee, selected PricewaterhouseCoopers LLC (“PwC”) to serve as the independent registered public accounting firm for the Trust for the fiscal year ending November 30, 2010. During the fiscal year ended November 30, 2009, E&Y’s audit report on the financial statements of the Delaware Focus Global Growth Fund (the & #8220;Fund”) did not contain any adverse opinion or disclaimer of opinion, nor were they qualified or modified as to uncertainty, audit scope, or accounting principles. In addition, there were no disagreements between the Trust and E&Y on accounting principles, financial statements disclosures or audit scope, which, if not resolved to the satisfaction of E&Y, would have caused them to make reference to the disagreement in their reports. Because the Fund launched on December 29, 2008, E&Y did not issue an audit report for the fiscal year ended November 30, 2008. Neither the Trust nor anyone on its behalf has consulted with PwC at any time prior to their selection with respect to the application of accounting principles to a specified transaction, either completed or proposed or the type of audit opinion that might be rendered on the Fund’s financial statements.
31
Board of trustees/directors and officers addendum
Delaware Investments® Family of Funds
Delaware Investments® Family of Funds
A mutual fund is governed by a Board of Trustees/Directors (“Trustees”), which has oversight responsibility for the management of a fund’s business affairs. Trustees establish procedures and oversee and review the performance of the investment manager, the distributor, and others who perform services for the fund. The independent fund trustees, in particular, are advocates
| Name, Address, | Position(s) | Length of | ||
| and Birth Date | Held with Fund(s) | Time Served | ||
| Interested Trustees | ||||
| Patrick P. Coyne1 | Chairman, President, | Chairman and Trustee | ||
| 2005 Market Street | Chief Executive Officer, | since August 16, 2006 | ||
| Philadelphia, PA 19103 | and Trustee | |||
| April 1963 | President and | |||
| Chief Executive Officer | ||||
| since August 1, 2006 | ||||
1 Patrick P. Coyne is considered to be an “Interested Trustee” because he is an executive officer of the Fund’s(s’) investment advisor.
32
for shareholder interests. Each trustee has served in that capacity since he or she was elected to or appointed to the Board of Trustees, and will continue to serve until his or her retirement or the election of a new trustee in his or her place. The following is a list of the Trustees and Officers with certain background and related information.
| Number of Portfolios in | ||||
| Principal Occupation(s) | Fund Complex Overseen | Other Directorships | ||
| During Past 5 Years | by Trustee or Officer | Held by Trustee or Officer | ||
| Patrick P. Coyne has served in | 78 | Director | ||
| various executive capacities | Kaydon Corp. | |||
| at different times at | ||||
| Delaware Investments.2 | Board of Governors Member | |||
| Investment Company | ||||
| Institute (ICI) | ||||
| Finance Committee Member | ||||
| St. John Vianney Roman | ||||
| Catholic Church | ||||
| Board of Trustees | ||||
| Agnes Irwin School | ||||
| Member of Investment | ||||
| Committee | ||||
| Cradle of Liberty Council, | ||||
| BSA | ||||
| (2007 – 2010) | ||||
2 Delaware Investments is the marketing name for Delaware Management Holdings, Inc. and its subsidiaries, including the Fund’s(s’) investment advisor, principal underwriter, and its transfer agent.
33
Board of trustees/directors and officers addendum
Delaware Investments® Family of Funds
Delaware Investments® Family of Funds
| Name, Address, | Position(s) | Length of | ||
| and Birth Date | Held with Fund(s) | Time Served | ||
| Independent Trustees | ||||
| Thomas L. Bennett | Trustee | Since March 2005 | ||
| 2005 Market Street | ||||
| Philadelphia, PA 19103 | ||||
| October 1947 | ||||
| John A. Fry | Trustee | Since January 2001 | ||
| 2005 Market Street | ||||
| Philadelphia, PA 19103 | ||||
| May 1960 | ||||
| Anthony D. Knerr | Trustee | Since April 1990 | ||
| 2005 Market Street | ||||
| Philadelphia, PA 19103 | ||||
| December 1938 | ||||
| Lucinda S. Landreth | Trustee | Since March 2005 | ||
| 2005 Market Street | ||||
| Philadelphia, PA 19103 | ||||
| June 1947 | ||||
34
| Number of Portfolios in | ||||
| Principal Occupation(s) | Fund Complex Overseen | Other Directorships | ||
| During Past 5 Years | by Trustee or Officer | Held by Trustee or Officer | ||
| Private Investor | 78 | Director | ||
| (March 2004–Present) | Bryn Mawr Bank Corp. (BMTC) | |||
| Investment Manager | Chairman of Investment | |||
| Morgan Stanley & Co. | Committee | |||
| (January 1984–March 2004) | Pennsylvania Academy of | |||
| Fine Arts | ||||
| Investment Committee and | ||||
| Governance Committee | ||||
| Member | ||||
| Pennsylvania Horticultural | ||||
| Society | ||||
| President | 78 | Director | ||
| Drexel University | Community Health Systems | |||
| (August 2010–Present) | ||||
| Director — Ecore | ||||
| President | International | |||
| Franklin & Marshall College | (2009 – 2010) | |||
| (July 2002–July 2010) | ||||
| Director — Allied | ||||
| Executive Vice President | Barton Securities Holdings | |||
| University of Pennsylvania | (2005 – 2008) | |||
| (April 1995–June 2002) | ||||
| Founder and | 78 | None | ||
| Managing Director | ||||
| Anthony Knerr & Associates | ||||
| (Strategic Consulting) | ||||
| (1990–Present) | ||||
| Chief Investment Officer | 78 | None | ||
| Assurant, Inc. (Insurance) | ||||
| (2002–2004) | ||||
35
Board of trustees/directors and officers addendum
Delaware Investments® Family of Funds
Delaware Investments® Family of Funds
| Name, Address, | Position(s) | Length of | ||
| and Birth Date | Held with Fund(s) | Time Served | ||
| Independent Trustees (continued) | ||||
| Ann R. Leven | Trustee | Since October 1989 | ||
| 2005 Market Street | ||||
| Philadelphia, PA 19103 | ||||
| November 1940 | ||||
| | ||||
| Thomas F. Madison | Trustee | Since May 19973 | ||
| 2005 Market Street | ||||
| Philadelphia, PA 19103 | ||||
| February 1936 | ||||
| |
3 In 1997, several funds managed by Voyageur Fund Managers, Inc. (the “Voyageur Funds”) were incorporated into the Delaware Investments Family of Funds. Mr. Madison served as a director of the Voyageur Funds from 1993 until 1997.
36
| Number of Portfolios in | ||||
| Principal Occupation(s) | Fund Complex Overseen | Other Directorships | ||
| During Past 5 Years | by Trustee or Officer | Held by Trustee or Officer | ||
| Consultant | 78 | Director and Audit | ||
| ARL Associates | Committee Chair – | |||
| (Financial Planning) | Systemax Inc. | |||
| (1983–Present) | (2001 – 2009) | |||
| Director and Audit | ||||
| Committee Chairperson – | ||||
| Andy Warhol Foundation | ||||
| (1999 – 2007) | ||||
| President and | 78 | Director and Chair of | ||
| Chief Executive Officer | Compensation Committee, | |||
| MLM Partners, Inc. | Governance Committee | |||
| (Small Business Investing | Member | |||
| and Consulting) | CenterPoint Energy | |||
| (January 1993–Present) | ||||
| Lead Director and Chair of | ||||
| Audit and Governance | ||||
| Committees, Member of | ||||
| Compensation Committee | ||||
| Digital River, Inc. | ||||
| Director and Chair of | ||||
| Governance Committee, | ||||
| Audit Committee | ||||
| Member | ||||
| Rimage Corporation | ||||
| Director and Chair of | ||||
| Compensation Committee | ||||
| Spanlink Communications | ||||
| Lead Director and Member of | ||||
| Compensation and | ||||
| Governance Committees | ||||
| Valmont Industries, Inc. | ||||
| (1987 – 2010) | ||||
37
Board of trustees/directors and officers addendum
Delaware Investments® Family of Funds
Delaware Investments® Family of Funds
| Name, Address, | Position(s) | Length of | ||
| and Birth Date | Held with Fund(s) | Time Served | ||
| Independent Trustees (continued) | ||||
| Thomas F. Madison | ||||
| 2005 Market Street | ||||
| Philadelphia, PA 19103 | ||||
| February 1936 | ||||
| Janet L. Yeomans | Trustee | Since April 1999 | ||
| 2005 Market Street | ||||
| Philadelphia, PA 19103 | ||||
| July 1948 | ||||
| J. Richard Zecher | Trustee | Since March 2005 | ||
| 2005 Market Street | ||||
| Philadelphia, PA 19103 | ||||
| July 1940 | ||||
38
| Number of Portfolios in | ||||
| Principal Occupation(s) | Fund Complex Overseen | Other Directorships | ||
| During Past 5 Years | by Trustee or Officer | Held by Trustee or Officer | ||
| Director | ||||
| Banner Health | ||||
| (1996 – 2007) | ||||
| Vice President and Treasurer | 78 | Director | ||
| (January 2006–Present) | Okabena Company | |||
| Vice President — Mergers & Acquisitions | ||||
| (January 2003–January 2006), and | ||||
| Vice President | ||||
| (July 1995–January 2003) | ||||
| 3M Corporation | ||||
| Founder | 78 | Director and Audit | ||
| Investor Analytics | Committee Member | |||
| (Risk Management) | Investor Analytics | |||
| (May 1999–Present) | ||||
| Founder | Director | |||
| Sutton Asset Management | Oxigene, Inc. | |||
| (Hedge Fund) | (2003 – 2008) | |||
| (September 1996–Present) | ||||
39
Board of trustees/directors and officers addendum
Delaware Investments® Family of Funds
Delaware Investments® Family of Funds
| Name, Address, | Position(s) | Length of | ||
| and Birth Date | Held with Fund(s) | Time Served | ||
| Officers | ||||
| David F. Connor | Vice President, | Vice President since | ||
| 2005 Market Street | Deputy General | September 2000 | ||
| Philadelphia, PA 19103 | Counsel, and Secretary | and Secretary since | ||
| December 1963 | October 2005 | |||
| Daniel V. Geatens | Vice President | Treasurer | ||
| 2005 Market Street | and Treasurer | since October 2007 | ||
| Philadelphia, PA 19103 | ||||
| October 1972 | ||||
| David P. O’Connor | Senior Vice President, | Senior Vice President, | ||
| 2005 Market Street | General Counsel, | General Counsel, and | ||
| Philadelphia, PA 19103 | and Chief Legal Officer | Chief Legal Officer | ||
| February 1966 | since October 2005 | |||
| Richard Salus | Senior Vice President | Chief Financial Officer | ||
| 2005 Market Street | and Chief Financial Officer | since November 2006 | ||
| Philadelphia, PA 19103 | ||||
| October 1963 | ||||
The Statement of Additional Information for the Fund(s) includes additional information about the Trustees and Officers and is available, without charge, upon request by calling 800 523-1918.
40
| Number of Portfolios in | ||||
| Principal Occupation(s) | Fund Complex Overseen | Other Directorships | ||
| During Past 5 Years | by Trustee or Officer | Held by Trustee or Officer | ||
| David F. Connor has served as | 78 | None4 | ||
| Vice President and Deputy | ||||
| General Counsel of | ||||
| Delaware Investments | ||||
| since 2000. | ||||
| Daniel V. Geatens has served | 78 | None4 | ||
| in various capacities at | ||||
| different times at | ||||
| Delaware Investments. | ||||
| David P. O’Connor has served in | 78 | None4 | ||
| various executive and legal | ||||
| capacities at different times | ||||
| at Delaware Investments. | ||||
| Richard Salus has served in | 78 | None4 | ||
| various executive capacities | ||||
| at different times at | ||||
| Delaware Investments. | ||||
4 David F. Connor, Daniel V. Geatens, David P. O’Connor, and Richard Salus serve in similar capacities for the six portfolios of the Optimum Fund Trust, which have the same investment advisor, principal underwriter, and transfer agent as the registrant.
41
About the organization
| Board of trustees | |||
Patrick P. Coyne Chairman, President, and Chief Executive Officer Delaware Investments® Family of Funds Philadelphia, PA Thomas L. Bennett Private Investor Rosemont, PA John A. Fry President Drexel University Philadelphia, PA | Anthony D. Knerr Founder and Managing Director Anthony Knerr & Associates New York, NY Lucinda S. Landreth Former Chief Investment Officer Assurant, Inc. Philadelphia, PA | Ann R. Leven Consultant ARL Associates New York, NY Thomas F. Madison President and Chief Executive Officer MLM Partners, Inc. Minneapolis, MN | Janet L. Yeomans Vice President and Treasurer 3M Corporation St. Paul, MN J. Richard Zecher Founder Investor Analytics Scottsdale, AZ |
| Affiliated officers | |||
David F. Connor Vice President, Deputy General Counsel, and Secretary Delaware Investments Family of Funds Philadelphia, PA | Daniel V. Geatens Vice President and Treasurer Delaware Investments Family of Funds Philadelphia, PA | David P. O’Connor Senior Vice President, General Counsel, and Chief Legal Officer Delaware Investments Family of Funds Philadelphia, PA | Richard Salus Senior Vice President and Chief Financial Officer Delaware Investments Family of Funds Philadelphia, PA |
This annual report is for the information of Delaware Focus Global Growth Fund shareholders, but it may be used with prospective investors when preceded or accompanied by a current prospectus for Delaware Focus Global Growth Fund and the Delaware Investments Fund fact sheet for the most recently completed calendar quarter. These documents are available at www.delawareinvestments.com. The prospectus sets forth details about charges, expenses, investment objectives, and operating policies of the investment company. You should read the prospectus carefully before you invest. The figures in this report represent past results that are not a guarantee of future results. The return and principal value of an investment in the investment company will fluctuate so that shares, when redeemed, may be worth more or less than their original cost. |
Delaware Investments is the marketing name of Delaware Management Holdings, Inc. and its subsidiaries. The Fund files its complete schedule of portfolio holdings with the Securities and Exchange Commission (SEC) for the first and third quarters of each fiscal year on Form N-Q. The Fund’s Forms N-Q, as well as a description of the policies and procedures that the Fund uses to determine how to vote proxies (if any) relating to portfolio securities are available without charge (i) upon request, by calling 800 523-1918; and (ii) on the SEC’s Web site at www.sec.gov. In addition, a description of the policies and procedures that the Fund uses to determine how to vote proxies (if any) relating to portfolio securities and the Fund’s Schedule of Investments are available without charge on the Fund’s Web site at www.delawareinvestments.com. The Fund’s Forms N-Q may be reviewed and copied at the SEC’s Public Reference Room in Washington, D.C.; information on the operation of the Public Reference Room may be obtaine d by calling 800 SEC-0330. Information (if any) regarding how the Fund voted proxies relating to portfolio securities during the most recently disclosed 12-month period ended June 30 is available without charge (i) through the Fund’s Web site at www.delawareinvestments.com; and (ii) on the SEC’s Web site at www.sec.gov. |
42
Annual report Delaware Macquarie Global Infrastructure Fund November 30, 2010 International equity mutual fund |
This annual report is for the information of Delaware Macquarie Global Infrastructure Fund shareholders, but it may be used with prospective investors when preceded or accompanied by a current prospectus for Delaware Macquarie Global Infrastructure Fund. The figures in the annual report for Delaware Macquarie Global Infrastructure Fund represent past results, which are not a guarantee of future results. The return and principal value of an investment in the Fund will fluctuate so that shares, when redeemed, may be worth more or less than their original cost. Current performance may be higher or lower than the performance data quoted. You should consider the investment objectives, risks, charges, and expenses of the Fund carefully before investing. The Delaware Macquarie Global Infrastructure Fund prospectus contains this and other important information about the Fund. Prospectuses for all open-end funds in the Delaware Investments® Family of Funds are available from your financial advisor, online at www.delawareinvestments.com, or by phone at 800 523-1918. Please read the prospectus carefully before you invest or send money. |
You can obtain shareholder reports and prospectuses online instead of in the mail. Visit www.delawareinvestments.com/edelivery. |
Experience Delaware Investments
Delaware Investments is committed to the pursuit of consistently superior asset management and unparalleled client service. We believe in our investment processes, which seek to deliver consistent results, and in convenient services that help add value for our clients.
If you are interested in learning more about creating an investment plan, contact your financial advisor.
You can learn more about Delaware Investments or obtain a prospectus for Delaware Macquarie Global Infrastructure Fund at www.delawareinvestments.com.
| Manage your investments online |
|
Delaware Management Holdings, Inc., and its subsidiaries (collectively known by the marketing name of Delaware Investments) are wholly owned subsidiaries of Macquarie Group Limited, a global provider of banking, financial, advisory, investment and funds management services.
Investments in Delaware Macquarie Global Infrastructure Fund are not and will not be deposits with or liabilities of Macquarie Bank Limited ABN 46 008 583 542 and its holding companies, including their subsidiaries or related companies (Macquarie Group), and are subject to investment risk, including possible delays in repayment and loss of income and capital invested. No Macquarie Group company guarantees or will guarantee the performance of the Fund, the repayment of capital from the Fund, or any particular rate of return.
| Table of contents | |
| Portfolio management review | 1 |
| Performance summary | 4 |
| Disclosure of Fund expenses | 8 |
| Country and sector allocations | 10 |
| Statement of net assets | 11 |
| Statement of assets and liabilities | 16 |
| Statement of operations | 17 |
| Statement of changes in net assets | 18 |
| Financial highlights | 20 |
| Notes to financial statements | 24 |
| Report of independent registered | |
| public accounting firm | 34 |
| Other Fund information | 35 |
| Board of trustees/directors and | |
| officers addendum | 36 |
| About the organization | 46 |
Unless otherwise noted, views expressed herein are current as of Nov. 30, 2010, and are subject to change.
Funds are not FDIC insured and are not guaranteed. It is possible to lose the principal amount invested.
Mutual fund advisory services provided by Delaware Management Company, a series of Delaware Management Business Trust, which is a registered investment advisor. Delaware Investments, a member of Macquarie Group, refers to Delaware Management Holdings, Inc. and its subsidiaries, including the Fund’s distributor, Delaware Distributors, L.P. Macquarie Group refers to Macquarie Group Limited and its subsidiaries and affiliates worldwide.
© 2011 Delaware Management Holdings, Inc.
All third-party trademarks cited are the property of their respective owners.
| Portfolio management review | ||
| Delaware Macquarie Global Infrastructure Fund | December 7, 2010 | |
| Performance preview (for the period ended November 30, 2010) | |
| Delaware Macquarie Global Infrastructure Fund (Class A shares) | |
| return since Jan. 19, 2010 (Fund’s inception) | +0.63% |
| S&P Global Infrastructure Index (benchmark) | |
| return since Jan. 19, 2010 | –2.41% |
Past performance does not guarantee future results.
For complete, annualized performance for Delaware Macquarie Global Infrastructure Fund, please see the table on page 4.
The performance of Class A shares excludes the applicable sales charge and reflects the reinvestment of all distributions.
Index performance returns do not reflect any management fees, transaction costs, or expenses. Indices are unmanaged and one cannot invest directly in an index.
Macquarie Capital Investment Management LLC, an affiliate of Delaware Distributors, L.P., is the Fund’s sub-adviser. The sub-adviser, subject to supervision by DMBT, is responsible for the investment management of the Fund’s assets.
For the fiscal period that began with the Fund’s inception of Class A shares on Jan. 19, 2010, and ended Nov. 30, 2010, Delaware Macquarie Global Infrastructure Fund (Class A shares) returned +0.63% at net asset value and -5.13% at maximum offer price (both returns assume reinvestment of all distributions). The Fund’s benchmark, the S&P Global Infrastructure Index, fell by 2.41% for the same period (index return is calculated gross of taxes on dividends). For the Fund’s complete annualized performance information, please see the table on page 4.
After a slow start, infrastructure stocks rebound
Performance for infrastructure securities generally trended negatively for the first several months of the Fund’s fiscal period, amid continued global economic weakness. By June 2010, however, infrastructure stocks outperformed global equities (as measured by indices such as the MSCI World Index), led by more defensive sectors of the investment universe.
Infrastructure securities posted performance that was generally in line with broader global equity markets as we moved into the third calendar quarter of 2010. Higher-quality
In a potential environment of moderate global growth, we believe infrastructure stocks may offer compelling inflation-protection characteristics. While past performance does not guarantee future returns, the higher yields and more predictable cash flows often generated by many infrastructure-related companies have historically provided some downside protection during uncertain economic periods, particularly when compared with the broader global equity markets.
1
Portfolio management review
Delaware Macquarie Global Infrastructure Fund
Delaware Macquarie Global Infrastructure Fund
issues (based on measurable factors that describe each company’s health) tended to outperform riskier ones, as forecasts for prolonged economic softness prompted many investors to focus on individual company fundamentals.
Infrastructure stocks ended the Fund’s reporting period on a positive note, as many investors appeared to be increasingly drawn to the sector’s traditionally defensive characteristics, especially in light of the continued economic uncertainty and volatility that characterized the fiscal period. Investors were also generally attracted to the relatively high dividend yields generated by some infrastructure stocks.
Fund performance relative to the S&P Global Infrastructure Index
From a sector perspective, holdings in oil-and-gas-storage-and-transportation stocks delivered relatively strong performance and played a major role in the Fund’s returns for its reporting period. North American companies such as Enterprise Products Partners and Magellan Midstream Partners led performance. In our view, these companies demonstrated strong operations, stable cash flows, and reliable dividend streams.
Collectively, the Fund’s holdings in the water utility sector represented another notable contribution to performance. Regulated United Kingdom water stocks in particular were favored for their defensive qualities. Severn Trent, a British public utility, was among the sector’s top performers, posting strong results and generally exceeding market expectations.
The airport services group, fueled largely by continued growth in air traffic, posted positive performance. According to data released by the International Air Transport Association (IATA), passenger and freight traffic rose sharply in 2010, exceeding industry expectations. This translated to notable performance by airport stocks such as Flughafen Zuerich (Zurich Airport) and Aeroports de Paris. These positive performers were offset partially by Beijing Capital International Airport, which fell based largely on speculation about a reduction in the company’s aeronautical charges.
Early in the Fund’s fiscal period, holdings in several southern European stocks in the highways-and-railtracks sector suffered due to market fallout stemming from the sovereign debt crisis in Greece. As the period progressed, however, the Fund’s overweight position in this sector, together with stock performance, resulted in favorable performance versus the index. The Fund benefited from its overweighting in Intoll Group, which was taken over at a material premium. The Fund’s position in Chinese toll road operator Jiangsu Expressway also made a positive contribution, as did the underweight in Brisa-Autoestradas de Portugal. These positive performers were offset somewhat by the overweight in Atlantia in Italy, which detracted from relative performance.
In the electric utilities sector, the positive effects of the Fund’s underweight position compared with the benchmark, together with the positive effects of stock selection, contributed to relative performance. This sector’s underperformance within the Fund’s benchmark index was partly explained by large-capitalization European companies, which suffered from sluggish equity markets and emerging regulatory risk. The Fund’s underweight in Iberdrola made a notable contribution, as did the underweight in
2
Tokyo Electric Power, Asia’s largest electricity producer, which fell sharply due to a large capital raising.
The Fund was more heavily invested in the gas utilities and industrial conglomerates sectors compared with the Fund’s benchmark index, which detracted from relative performance. Chinese gas stocks underperformed broader infrastructure markets due to uncertainty about tariff increases. The Fund’s overweight position in Beijing Enterprises, for instance, detracted from the Fund’s relative performance. We remain positive on the Chinese gas sector, however. The International Energy Agency recently forecast that China’s natural gas consumption could reach 140 billion cubic meters in 2015, double the 2007 level, to become the second-largest natural gas consumer after the U.S. The Fund’s overweight in Toky o Gas was a detractor (partly due to some contagion from Tokyo Electric Power’s capital raising), while Gas Natural was adversely affected by the ongoing sovereign credit crisis in Europe.
The Fund’s only stock in the railroads sector was Asciano, which operates railways as well as ports. The company’s stock was weak for the fiscal period as investors’ worries about global economic growth led to concerns that container volumes would be adversely affected. Despite this concern, the major container ports in Australia recorded healthy growth, with record volumes at the company’s key ports in Sydney and Melbourne. Growth in coal volumes, coupled with the company’s expansion into Queensland, also benefited the stock’s rail business.
A focus on fundamentally sound stocks across sectors
We remain generally optimistic about the long-term prospects for infrastructure investments. Significant long-term growth trends that generally support infrastructure have emerged in recent years as economies such as China, Brazil, and India invest billions in infrastructure in order to keep pace with rapid industrialization. At the same time, current indications are that developed economies are poised to overhaul old infrastructure systems in dire need of repair.
With mounting debt levels, cash-strapped governments around the world are seeking capital to finance infrastructure initiatives and improvements — which has the potential to provide attractive opportunities for private sector investors. In Great Britain, for example, the government recently sold the company that operates the high-speed rail line between London and the English Channel. It also established Infrastructure U.K., a governmental body dedicated to encouraging private sector investment in infrastructure and improving long-term planning of infrastructure-related projects. An increased focus on infrastructure spending has also taken hold in the United States. In September 2010, for instance, President Obama sought congressional approval for an infrastructure bank as part of a six-year plan to rebuild roads, rail lines, and airport runways across the country. (As of the end of the Fund’s reporting period, the President co ntinued expressing his support to establish such a bank.)
Generally speaking, we believe the underlying fundamentals for infrastructure companies remain strong, marked by solid operations and healthy cash flow generation. With that in mind, we aim to continue seeking what we view as high-quality companies. That is, companies that we feel have strong balance sheets, robust operations, and sound management teams.
3
| Performance summary | |
| Delaware Macquarie Global Infrastructure Fund | November 30, 2010 |
The performance data quoted represent past performance; past performance does not guarantee future results. Investment return and principal value will fluctuate so your shares, when redeemed, may be worth more or less than their original cost. Please obtain the performance data current for the most recent month end by calling 800 523-1918 or visiting our Web site at www.delawareinvestments.com/performance. Current performance may be lower or higher than the performance data quoted.
Carefully consider the Fund’s investment objectives, risk factors, charges, and expenses before investing. This and other information can be found in the Fund’s prospectus and, if available, its summary prospectus, which may be obtained by visiting www.delawareinvestments.com or calling 800 523-1918. Investors should read the prospectus and, if available, the summary prospectus carefully before investing.
| Fund performance | Average annual total returns through Nov. 30, 2010 | ||
| Lifetime | |||
| Class A (Est. Jan. 19, 2010) | |||
| Excluding sales charge | +0.63% | ||
| Including sales charge | -5.13% | ||
| Class C (Est. Jan. 19, 2010) | |||
| Excluding sales charge | +0.04% | ||
| Including sales charge | -0.95% | ||
| Class R (Est. Jan. 19, 2010) | |||
| Excluding sales charge | +0.45% | ||
| Including sales charge | +0.45% | ||
| Institutional Class (Est. Dec. 31, 2009) | |||
| Excluding sales charge | +3.53% | ||
| Including sales charge | +3.53% | ||
Returns reflect the reinvestment of all distributions and any applicable sales charges as noted in the following paragraphs.
Performance for Class C shares, excluding sales charges, assumes either that contingent deferred sales charges did not apply or that the investment was not redeemed.
Expense limitations were in effect for certain classes during the periods shown in the “Fund performance” chart and in the “Performance of a $10,000 investment” chart. The current expenses for each class are listed on the “Fund expense ratios” chart. (Note that all charts and graphs referred to in the “Performance summary” section of this report are found on pages 4 through 6.) Performance would have been lower had the expense limitations not been in effect.
The Fund offers Class A, C, R, and Institutional Class shares.
Class A shares are sold with a maximum front-end sales charge of up to 5.75%, and have an annual distribution and service fee of up to 0.30% of average daily net assets. This fee has been contractually limited to 0.25% of average daily net assets from Dec. 31, 2009, through March 30, 2011.
4
Class C shares are sold with a contingent deferred sales charge of 1.00% if redeemed during the first 12 months. They are also subject to an annual distribution and service fee of up to 1.00% of average daily net assets.
Class R shares are available only for certain retirement plan products. They are sold without a sales charge and have an annual distribution and service fee of up to 0.60% of average daily net assets, which has been limited contractually to 0.50% from Dec. 31, 2009, through March 30, 2011.
Institutional Class shares are available without sales or asset-based distribution charges only to certain eligible institutional accounts.
International investments entail risks not ordinarily associated with U.S. investments including fluctuation in currency values, differences in accounting principles, or economic or political instability in other nations. Investing in emerging markets can be riskier than investing in established foreign markets due to increased volatility and lower trading volume.
If and when the Fund invests in forward foreign currency contracts or uses other investments to hedge against currency risks, the Fund will be subject to special risks, including counterparty risk.
Narrowly focused investments may exhibit higher volatility than investments in multiple industry sectors. Because the Fund concentrates its investments in securities issued by companies principally engaged in the infrastructure industry, the Fund has greater exposure to the potential adverse economic, regulatory, political, and other changes affecting such entities.
“Nondiversified” Funds may allocate more of their net assets to investments in single securities than “diversified” Funds. Resulting adverse effects may subject these Funds to greater risks and volatility.
The “Fund performance” table and the “Performance of a $10,000 investment” graph do not reflect the deduction of taxes the shareholder would pay on Fund distributions or redemptions of Fund shares.
The Fund’s expense ratios, as described in the most recent prospectus, are disclosed in the following “Fund expense ratios” chart. Delaware Investments has agreed to reimburse certain expenses and/or waive certain fees in order to prevent total fund operating expenses (excluding any 12b-1 plan and certain other expenses) from exceeding 1.20% of the Fund’s average daily net assets from March 30, 2010, through March 30, 2011. Please see the most recent prospectus and any applicable supplement(s) for additional information on these fee waivers and/or reimbursements.
| Fund expense ratios | Class A | Class C | Class R | Institutional Class | |||
| Total annual operating expenses | 9.63% | 10.33% | 9.93% | 9.33% | |||
| (without fee waivers) | |||||||
| Net expenses | 1.45% | 2.20% | 1.70% | 1.20% | |||
| (including fee waivers, if any) | |||||||
| Type of waiver | Contractual | Contractual | Contractual | Contractual |
5
Performance summary
Delaware Macquarie Global Infrastructure Fund
Delaware Macquarie Global Infrastructure Fund
Performance of a $10,000 investment
Average annual total returns from Jan. 19, 2010 (inception of the Fund’s Class A shares), through Nov. 30, 2010
Average annual total returns from Jan. 19, 2010 (inception of the Fund’s Class A shares), through Nov. 30, 2010
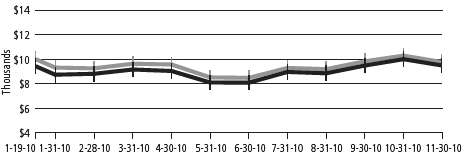
| For period beginning Jan. 19, 2010, through Nov. 30, 2010 | Starting value | Ending value | |||
| S&P Global Infrastructure Index | $10,000 | $9,759 | |||
| Delaware Macquarie Global Infrastructure Fund — Class A shares | $9,425 | $9,484 | |||
The chart assumes $10,000 invested in the Fund on Jan. 19, 2010, and includes the effect of a 5.75% front-end sales charge and the reinvestment of all distributions. Please note additional details on these fees in the “Performance summary” section of this report, which includes pages 4 through 6.
The chart also assumes $10,000 invested in the S&P Global Infrastructure Index as of Jan. 19, 2010.
The S&P Global Infrastructure Index provides liquid and tradable exposure to 75 companies from around the world that represent the listed infrastructure universe. The index has balanced weights across three diversified infrastructure clusters: transportation, utilities, and energy.
Index performance returns do not reflect any management fees, transaction costs or expenses. Indices are unmanaged and one cannot invest directly in an index. Past performance is not a guarantee of future results.
Performance of other Fund classes will vary due to different charges and expenses.
The “Fund performance” chart and the “Performance of a $10,000 investment” graph do not reflect the deduction of taxes shareholders would pay on Fund distributions or redemptions of Fund shares.
| Nasdaq symbols | CUSIPs | ||||||
| Class A | DMGAX | 245914551 | |||||
| Class C | DMGCX | 245914544 | |||||
| Class R | DMGRX | 245914528 | |||||
| Institutional Class | DMGIX | 245914536 | |||||
6
Disclosure of Fund expenses
For the six-month period from June 1, 2010 to November 30, 2010
For the six-month period from June 1, 2010 to November 30, 2010
As a shareholder of the Fund, you incur two types of costs: (1) transaction costs, including sales charges (loads) on purchase payments, reinvested dividends, or other distributions; redemption fees; and exchange fees; and (2) ongoing costs, including management fees; distribution and/or service (12b-1) fees; and other Fund expenses. This example is intended to help you understand your ongoing costs (in dollars) of investing in the Fund and to compare these costs with the ongoing costs of investing in other mutual funds.
The example is based on an investment of $1,000 invested at the beginning of the period and held for the entire six-month period from June 1, 2010 to November 30, 2010.
Actual expenses
The first section of the table shown, “Actual Fund return,” provides information about actual account values and actual expenses. You may use the information in this section of the table, together with the amount you invested, to estimate the expenses that you paid over the period. Simply divide your account value by $1,000 (for example, an $8,600 account value divided by $1,000 = 8.6), then multiply the result by the number in the first section under the heading entitled “Expenses Paid During Period” to estimate the expenses you paid on your account during this period.
Hypothetical example for comparison purposes
The second section of the table shown, “Hypothetical 5% return,” provides information about hypothetical account values and hypothetical expenses based on the Fund’s actual expense ratio and an assumed rate of return of 5% per year before expenses, which is not the Fund’s actual return. The hypothetical account values and expenses may not be used to estimate the actual ending account balance or expenses you paid for the period. You may use this information to compare the ongoing costs of investing in the Fund and other funds. To do so, compare this 5% hypothetical example with the 5% hypothetical examples that appear in the shareholder reports of the other funds.
Please note that the expenses shown in the table are meant to highlight your ongoing costs only and do not reflect any transactional costs, such as sales charges (loads), redemption fees, or exchange fees. Therefore, the second section of the table is useful in comparing ongoing costs only, and will not help you determine the relative total costs of owning different funds. In addition, if these transactional costs were included, your costs would have been higher. The Fund’s expenses shown in the table reflect fee waivers in effect. The expenses shown in the table assume reinvestment of all dividends and distributions.
8
Delaware Macquarie Global Infrastructure Fund
Expense analysis of an investment of $1,000
Expense analysis of an investment of $1,000
| Beginning | Ending | Expenses | ||||||||||
| Account Value | Account Value | Annualized | Paid During Period | |||||||||
| 6/1/10 | 11/30/10 | Expense Ratio | 6/1/10 to 11/30/10* | |||||||||
| Actual Fund return | ||||||||||||
| Class A | $ | 1,000.00 | $ | 1,170.90 | 1.45% | $ | 7.89 | |||||
| Class C | 1,000.00 | 1,167.60 | 2.20% | 11.95 | ||||||||
| Class R | 1,000.00 | 1,170.80 | 1.70% | 9.25 | ||||||||
| Institutional Class | 1,000.00 | 1,172.20 | 1.20% | 6.53 | ||||||||
| Hypothetical 5% return (5% return before expenses) | ||||||||||||
| Class A | $ | 1,000.00 | $ | 1,017.80 | 1.45% | $ | 7.33 | |||||
| Class C | 1,000.00 | 1,014.04 | 2.20% | 11.11 | ||||||||
| Class R | 1,000.00 | 1,016.55 | 1.70% | 8.59 | ||||||||
| Institutional Class | 1,000.00 | 1,019.05 | 1.20% | 6.07 | ||||||||
*“Expenses Paid During Period” are equal to the Fund’s annualized expense ratio, multiplied by the average account value over the period, multiplied by 183/365 (to reflect the one-half year period).
9
| Country and sector allocations | |
| Delaware Macquarie Global Infrastructure Fund | As of November 30, 2010 |
Sector designations may be different than the sector designations presented in other Fund materials. The sector designations may represent the investment manager’s internal sector classifications, which may result in the sector designations for one fund being different than another fund’s sector designations.
| Composition of Portfolio | Percentage of net assets | |||
| Common Stock by Country | 91.23 | % | ||
| Australia | 9.20 | % | ||
| Brazil | 2.19 | % | ||
| Canada | 7.77 | % | ||
| China | 10.35 | % | ||
| France | 9.68 | % | ||
| Germany | 4.81 | % | ||
| Italy | 6.32 | % | ||
| Japan | 4.07 | % | ||
| Luxembourg | 1.23 | % | ||
| Mexico | 1.04 | % | ||
| Netherlands | 0.63 | % | ||
| New Zealand | 0.33 | % | ||
| Portugal | 0.36 | % | ||
| Republic of Korea | 1.18 | % | ||
| Spain | 3.56 | % | ||
| Switzerland | 1.57 | % | ||
| United Kingdom | 5.14 | % | ||
| United States | 21.80 | % | ||
| U.S. Master Limited Partnership | 0.97 | % | ||
| Discount Note | 4.86 | % | ||
| Total Value of Securities | 97.06 | % | ||
| Receivables and Other Assets Net of Liabilities | 2.94 | % | ||
| Total Net Assets | 100.00 | % | ||
| Common Stock and Limited Partnerships by Sector² | Percentage of net assets | |||
| Consumer Discretionary | 1.23 | % | ||
| Energy | 17.36 | % | ||
| Financials | 1.57 | % | ||
| Industrials | 39.73 | % | ||
| Utilities | 32.31 | % | ||
| Total | 92.20 | % | ||
²Narrow industries are utilized for compliance purposes for diversification whereas broad sectors are used for financial reporting.
10
| Statement of net assets | |
| Delaware Macquarie Global Infrastructure Fund | November 30, 2010 |
| Number of shares | Value (U.S. $) | |||||
| Common Stock – 91.23%Δ | ||||||
| Australia – 9.20% | ||||||
| † | Asciano | 34,188 | $ | 52,996 | ||
| MAp Group | 11,265 | 32,792 | ||||
| # | Spark Infrastructure Group 144A | 58,680 | 62,690 | |||
| Transurban Group | 22,992 | 114,491 | ||||
| 262,969 | ||||||
| Brazil – 2.19% | ||||||
| Energias do Brasil | 2,000 | 42,682 | ||||
| † | LLX Logistica | 2,400 | 11,895 | |||
| Ultrapar Participacoes ADR | 135 | 7,987 | ||||
| 62,564 | ||||||
| Canada – 7.77% | ||||||
| Enbridge | 1,872 | 104,205 | ||||
| TransaCanada | 3,336 | 117,645 | ||||
| 221,850 | ||||||
| *China – 10.35% | ||||||
| Beijing Capital International Airport | 26,200 | 14,301 | ||||
| Beijing Enterprises Holdings | 8,000 | 50,325 | ||||
| † | China Longyuan Power Group | 25,000 | 23,143 | |||
| China Merchants Holdings International | 16,397 | 64,522 | ||||
| COSCO Pacific | 8,000 | 12,621 | ||||
| Dalian Port PDA | 72,000 | 31,535 | ||||
| Jiangsu Expressway | 44,300 | 48,147 | ||||
| Zhejiang Expressway | 54,500 | 51,242 | ||||
| 295,836 | ||||||
| France – 9.68% | ||||||
| Aeroports de Paris | 1,165 | 89,113 | ||||
| EDF | 580 | 24,151 | ||||
| GDF Suez | 2,642 | 87,332 | ||||
| Groupe Eurotunnel | 2,162 | 18,448 | ||||
| Vinci | 1,188 | 57,471 | ||||
| 276,515 | ||||||
| Germany – 4.81% | ||||||
| E.ON | 2,568 | 74,002 | ||||
| Fraport | 120 | 7,045 | ||||
| Hamburger Hafen und Logistik | 1,398 | 56,261 | ||||
| 137,308 | ||||||
11
Statement of net assets
Delaware Macquarie Global Infrastructure Fund
Delaware Macquarie Global Infrastructure Fund
| Number of shares | Value (U.S. $) | ||||
| Common Stock (continued) | |||||
| Italy – 6.32% | |||||
| Atlantia | 8,214 | $ | 160,765 | ||
| Enel | 2,484 | 11,671 | |||
| † | Enel Green Power | 4,107 | 8,104 | ||
| 180,540 | |||||
| Japan – 4.07% | |||||
| Japan Airport Terminal | 300 | 4,417 | |||
| Kamigumi | 4,460 | 34,392 | |||
| Tokyo Electric Power | 700 | 16,314 | |||
| Tokyo Gas | 14,000 | 61,060 | |||
| 116,183 | |||||
| Luxembourg – 1.23% | |||||
| SES FDR | 1,516 | 35,032 | |||
| 35,032 | |||||
| Mexico – 1.04 % | |||||
| Grupo Aeroportuario del Pacifico ADR | 376 | 14,341 | |||
| Grupo Aeroportuario del Sureste ADR | 300 | 15,513 | |||
| 29,854 | |||||
| Netherlands – 0.63% | |||||
| Koninklijke Vopak | 392 | 17,992 | |||
| 17,992 | |||||
| New Zealand – 0.33% | |||||
| Auckland International Airport | 6,096 | 9,417 | |||
| 9,417 | |||||
| Portugal – 0.36% | |||||
| Brisa Auto-Estradas de Portugal | 1,628 | 10,406 | |||
| 10,406 | |||||
| Republic of Korea – 1.18% | |||||
| † | Korea Electric Power ADR | 2,828 | 33,681 | ||
| 33,681 | |||||
| Spain – 3.56% | |||||
| Abertis Infraestructuras | 6,395 | 101,575 | |||
| 101,575 | |||||
| Switzerland – 1.57% | |||||
| Flughafen Zuerich | 124 | 44,908 | |||
| 44,908 | |||||
12
| Number of shares | Value (U.S. $) | |||||
| Common Stock (continued) | ||||||
| United Kingdom – 5.14% | ||||||
| National Grid | 12,100 | $ | 106,856 | |||
| Scottish & Southern Energy | 1,154 | 20,149 | ||||
| Severn Trent | 881 | 19,817 | ||||
| 146,822 | ||||||
| United States – 21.80% | ||||||
| American Electric Power | 1,830 | 65,148 | ||||
| † | Corrections Corporation of America | 2,200 | 53,130 | |||
| Dominion Resources | 1,130 | 46,929 | ||||
| El Paso | 2,400 | 32,376 | ||||
| Entergy | 275 | 19,591 | ||||
| ITC Holdings | 324 | 19,618 | ||||
| NextEra Energy | 680 | 34,422 | ||||
| PG&E | 2,060 | 96,675 | ||||
| Public Service Enterprise Group | 490 | 15,107 | ||||
| Southern | 900 | 33,948 | ||||
| Southern Union | 1,286 | 30,362 | ||||
| Spectra Energy | 3,740 | 88,899 | ||||
| Williams | 3,800 | 86,678 | ||||
| 622,883 | ||||||
| Total Common Stock (cost $2,548,397) | 2,606,335 | |||||
| U.S. Master Limited Partnership – 0.97% | ||||||
| Enterprise Products Partners | 325 | 13,676 | ||||
| Magellan Midstream Partners | 250 | 14,000 | ||||
| Total U.S. Master Limited Partnership (cost $21,565) | 27,676 | |||||
| Principal | ||||||
| amount (U.S. $) | ||||||
| ≠Discount Note – 4.86% | ||||||
| Federal Home Loan Bank 0.07% 12/1/10 | $139,000 | 139,000 | ||||
| Total Discount Note (cost $139,000) | 139,000 | |||||
13
Statement of net assets
Delaware Macquarie Global Infrastructure Fund
Delaware Macquarie Global Infrastructure Fund
| Total Value of Securities – 97.06% | ||||
| (cost $2,708,962) | $ | 2,773,011 | ||
| Receivables and Other Assets | ||||
| Net of Liabilities – 2.94% | 83,898 | |||
| Net Assets Applicable to 329,492 | ||||
| Shares Outstanding – 100.00% | $ | 2,856,909 | ||
| Net Asset Value – Delaware Macquarie Global Infrastructure Fund | ||||
| Class A ($666,851 / 76,917 Shares) | $8.67 | |||
| Net Asset Value – Delaware Macquarie Global Infrastructure Fund | ||||
| Class C ($114,016 / 13,172 Shares) | $8.66 | |||
| Net Asset Value – Delaware Macquarie Global Infrastructure Fund | ||||
| Class R ($5,044 / 582 Shares) | $8.67 | |||
| Net Asset Value – Delaware Macquarie Global Infrastructure Fund | ||||
| Institutional Class ($2,070,998 / 238,821 Shares) | $8.67 | |||
| Components of Net Assets at November 30, 2010: | ||||
| Shares of beneficial interest (unlimited authorization – no par) | $ | 2,792,247 | ||
| Undistributed net investment income | 7,807 | |||
| Accumulated net realized loss on investments | (7,685 | ) | ||
| Net unrealized appreciation of investments and foreign currencies | 64,540 | |||
| Total net assets | $ | 2,856,909 | ||
| Δ | Securities have been classified by country of origin. Classification by type of business has been presented on page 10 in “Country and sector allocations”. |
| † | Non income producing security. |
| # | Security exempt from registration under Rule 144A of the Securities Act of 1933, as amended. At November 30, 2010, the aggregate amount of Rule 144A securities was $62,690, which represented 2.19% of the Fund’s net assets. See Note 10 in “Notes to financial statements.” |
| * | Securities listed and traded on the Hong Kong Stock Exchange. |
| ≠ | The rate shown is the effective yield at the time of purchase. |
14
| Summary of Abbreviations: | ||
| ADR — American Depository Receipts | ||
| AUD — Australian Dollar | ||
| EUR — European Monetary Unit | ||
| FDR — Fiduciary Depositary Receipts | ||
| HKD — Hong Kong Dollar | ||
| MNB — Mellon National Bank | ||
| USD — United States Dollar | ||
| Net Asset Value and Offering Price Per Share – | ||
| Delaware Macquarie Global Infrastructure Fund | ||
| Net asset value Class A (A) | $ | 8.67 |
| Sales charge (5.75% of offering price) (B) | 0.53 | |
| Offering price | $ | 9.20 |
| (A) | Net asset value per share, as illustrated, is the amount which would be paid upon redemption or repurchase of shares. | |
| (B) | See the current prospectus for purchases of $50,000 or more. |
1The following foreign currency exchange contracts were outstanding at November 30, 2010:
Foreign Currency Exchange Contracts
| Unrealized | ||||||||||||||||||||
| Appreciation | ||||||||||||||||||||
| Counterparty | Contracts to Receive (Deliver) | In Exchange For | Settlement Date | (Depreciation) | ||||||||||||||||
| MNB | AUD | (33,496 | ) | USD | 32,059 | 12/3/10 | $ | (29 | ) | |||||||||||
| MNB | EUR | (2,189 | ) | USD | 2,867 | 12/2/10 | 26 | |||||||||||||
| MNB | EUR | (3,825 | ) | USD | 4,984 | 12/3/10 | 19 | |||||||||||||
| MNB | EUR | (42,600 | ) | USD | 55,816 | 12/29/10 | 520 | |||||||||||||
| MNB | HKD | 18,994 | USD | (2,445 | ) | 12/2/10 | 1 | |||||||||||||
| $ | 537 | |||||||||||||||||||
The use of foreign currency exchange contracts involves elements of market risk and risks in excess of the amounts recognized in the financial statements. The notional values presented above represent the Fund’s total exposure in such contracts, whereas only the net unrealized appreciation (depreciation) is reflected in the Fund’s net assets.
1See Note 8 in “Notes to financial statements.”
See accompanying notes, which are an integral part of the financial statements.
15
| Statement of assets and liabilities | ||
| Delaware Macquarie Global Infrastructure Fund | November 30, 2010 | |
| Assets: | ||
| Investments, at value | $ | 2,634,011 |
| Short-term investments, at value | 139,000 | |
| Cash & foreign currencies | 619 | |
| Receivables for securities sold | 78,224 | |
| Dividends and interest receivable | 6,515 | |
| Receivables for fund shares sold | 200 | |
| Foreign currency contracts, at value | 537 | |
| Due from manager and affiliates | 72,705 | |
| Total assets | 2,931,811 | |
| Liabilities: | ||
| Payables for securities purchased | 48,795 | |
| Other accrued expenses | 26,107 | |
| Total liabilities | 74,902 | |
| Total Net Assets | $ | 2,856,909 |
| Investments, at cost | $ | 2,569,962 |
| Short-term investments, at cost | 139,000 | |
| Foreign currencies, at cost | 69 | |
See accompanying notes, which are an integral part of the financial statements.
16
| Statement of operations | |
| Delaware Macquarie Global Infrastructure Fund | December 31, 2009* to November 30, 2010 |
| Investment Income: | ||||||||
| Dividends | $ | 83,501 | ||||||
| Foreign tax withheld | (6,655 | ) | $ | 76,846 | ||||
| Expenses: | ||||||||
| Registration fees | 92,577 | |||||||
| Legal fees | 60,400 | |||||||
| Reports and statements to shareholders | 31,885 | |||||||
| Management fees | 19,962 | |||||||
| Dividend disbursing and transfer agent fees and expenses | 17,396 | |||||||
| Custodian fees | 11,957 | |||||||
| Audit and tax | 11,053 | |||||||
| Dues and services | 7,370 | |||||||
| Pricing fees | 6,038 | |||||||
| Distribution expenses – Class A | 1,088 | |||||||
| Distribution expenses – Class C | 581 | |||||||
| Distribution expenses – Class R | 25 | |||||||
| Accounting and administration expenses | 879 | |||||||
| Trustees’ fees | 126 | |||||||
| Insurance fees | 61 | |||||||
| Consulting fees | 33 | |||||||
| Trustees’ expenses | 6 | 261,437 | ||||||
| Less fees waived | (233,121 | ) | ||||||
| Less waived distribution expenses – Class A | (182 | ) | ||||||
| Less waived distribution expenses – Class R | (4 | ) | ||||||
| Less expense paid indirectly | (3 | ) | ||||||
| Total operating expenses | 28,127 | |||||||
| Net Investment Income | 48,719 | |||||||
| Net Realized and Unrealized Gain (Loss) on Investments | ||||||||
| and Foreign Currencies: | ||||||||
| Net realized gain (loss) on: | ||||||||
| Investments | (7,685 | ) | ||||||
| Foreign currencies | (7,633 | ) | ||||||
| Foreign currency exchange contracts | 1,541 | |||||||
| Net realized loss | (13,777 | ) | ||||||
| Unrealized appreciation/depreciation of investments | ||||||||
| and foreign currencies | 64,540 | |||||||
| Net Realized and Unrealized Gain on Investments | ||||||||
| and Foreign Currencies | 50,763 | |||||||
| Net Increase in Net Assets Resulting from Operations | $ | 99,482 | ||||||
*Date of commencement of operations for the Institutional Class. Class A, Class C, and Class R commenced operations on January 19, 2010.
See accompanying notes, which are an integral part of the financial statements.
17
Statement of changes in net assets
Delaware Macquarie Global Infrastructure Fund
Delaware Macquarie Global Infrastructure Fund
| 12/31/09* | ||||
| to | ||||
| 11/30/10 | ||||
| Increase (Decrease) in Net Assets from Operations: | ||||
| Net investment income | $ | 48,719 | ||
| Net realized loss on investments and foreign currencies | (13,777 | ) | ||
| Unrealized appreciation/depreciation of investments and foreign currencies | 64,540 | |||
| Net increase in net assets resulting from operations | 99,482 | |||
| Dividends and Distributions to Shareholders from: | ||||
| Net investment income: | ||||
| Class A | (6,212 | ) | ||
| Class C | (724 | ) | ||
| Class R | (51 | ) | ||
| Institutional Class | (27,833 | ) | ||
| (34,820 | ) | |||
| Capital Share Transactions: | ||||
| Proceeds from shares sold: | ||||
| Class A | 816,198 | |||
| Class C | 107,355 | |||
| Class R | 5,020 | |||
| Institutional Class | 2,000,020 | |||
| Net asset value of shares issued upon reinvestment of dividends and distributions: | ||||
| Class A | 6,038 | |||
| Class C | 724 | |||
| Class R | 51 | |||
| Institutional Class | 27,833 | |||
| 2,963,239 | ||||
| Cost of shares repurchased: | ||||
| Class A | (168,354 | ) | ||
| Class C | (2,638 | ) | ||
| (170,992 | ) | |||
| Increase in net assets derived from capital share transactions | 2,792,247 | |||
| Net Increase in Net Assets | 2,856,909 | |||
| Net Assets: | ||||
| Beginning of period | — | |||
| End of period (including undistributed net investment income of $7,807) | $ | 2,856,909 | ||
*Date of commencement of operations for the Institutional Class. Class A, Class C, and Class R commenced operations on January 19, 2010.
See accompanying notes, which are an integral part of the financial statements.
18
Financial highlights
Delaware Macquarie Global Infrastructure Fund Class A
Delaware Macquarie Global Infrastructure Fund Class A
Selected data for each share of the Fund outstanding throughout the period was as follows:
| 1/19/101 | ||||
| to | ||||
| 11/30/10 | ||||
| Net asset value, beginning of period | $8.730 | |||
| Income (loss) from investment operations: | ||||
| Net investment income2 | 0.155 | |||
| Net realized and unrealized loss on investments and foreign currencies | (0.111 | ) | ||
| Total from investment operations | 0.044 | |||
| Less dividends and distributions from: | ||||
| Net investment income | (0.104 | ) | ||
| Total dividends and distributions | (0.104 | ) | ||
| Net asset value, end of period | $8.670 | |||
| Total return3 | 0.63% | |||
| Ratios and supplemental data: | ||||
| Net assets, end of period (000 omitted) | $667 | |||
| Ratio of expenses to average net assets | 1.45% | |||
| Ratio of expenses to average net assets | ||||
| prior to fees waived and expense paid indirectly | 12.24% | |||
| Ratio of net investment income to average net assets | 2.15% | |||
| Ratio of net investment loss to average net assets | ||||
| prior to fees waived and expense paid indirectly | (8.64% | ) | ||
| Portfolio turnover | 87% | 4 | ||
1 Date of commencement of operations; ratios have been annualized and total return has not been annualized.
2 The average shares outstanding method has been applied for per share information.
3Total investment return is based on the change in net asset value of a share during the period and assumes reinvestment of dividends and distributions at net asset value and does not reflect the impact of a sales charge. Total investment return during the period reflects waivers by the manager and distributor. Performance would have been lower had the waivers not been in effect.
4 Portfolio turnover is representative of the Fund for the period December 31, 2009 through November 30, 2010.
See accompanying notes, which are an integral part of the financial statements.
20
Delaware Macquarie Global Infrastructure Fund Class C
Selected data for each share of the Fund outstanding throughout the period was as follows:
| 1/19/101 | ||||
| to | ||||
| 11/30/10 | ||||
| Net asset value, beginning of period | $8.730 | |||
| Income (loss) from investment operations: | ||||
| Net investment income2 | 0.102 | |||
| Net realized and unrealized loss on investments and foreign currencies | (0.106 | ) | ||
| Total from investment operations | (0.004 | ) | ||
| Less dividends and distributions from: | ||||
| Net investment income | (0.066 | ) | ||
| Total dividends and distributions | (0.066 | ) | ||
| Net asset value, end of period | $8.660 | |||
| Total return3 | 0.04% | |||
| Ratios and supplemental data: | ||||
| Net assets, end of period (000 omitted) | $114 | |||
| Ratio of expenses to average net assets | 2.20% | |||
| Ratio of expenses to average net assets | ||||
| prior to fees waived and expense paid indirectly | 12.94% | |||
| Ratio of net investment income to average net assets | 1.40% | |||
| Ratio of net investment loss to average net assets | ||||
| prior to fees waived and expense paid indirectly | (9.34% | ) | ||
| Portfolio turnover | 87% | 4 | ||
1 Date of commencement of operations; ratios have been annualized and total return has not been annualized.
2 The average shares outstanding method has been applied for per share information.
3 Total investment return is based on the change in net asset value of a share during the period and assumes reinvestment of dividends and distributions at net asset value and does not reflect the impact of a sales charge. Total investment return during the period reflects a waiver by the manager. Performance would have been lower had the waiver not been in effect.
4 Portfolio turnover is representative of the Fund for the period December 31, 2009 through November 30, 2010.
See accompanying notes, which are an integral part of the financial statements.
21
Financial highlights
Delaware Macquarie Global Infrastructure Fund Class R
Delaware Macquarie Global Infrastructure Fund Class R
Selected data for each share of the Fund outstanding throughout the period was as follows:
| 1/19/101 | ||||
| to | ||||
| 11/30/10 | ||||
| Net asset value, beginning of period | $8.730 | |||
| Income (loss) from investment operations: | ||||
| Net investment income2 | 0.137 | |||
| Net realized and unrealized loss on investments and foreign currencies | (0.108 | ) | ||
| Total from investment operations | 0.029 | |||
| Less dividends and distributions from: | ||||
| Net investment income | (0.089 | ) | ||
| Total dividends and distributions | (0.089 | ) | ||
| Net asset value, end of period | $8.670 | |||
| Total return3 | 0.45% | |||
| Ratios and supplemental data: | ||||
| Net assets, end of period (000 omitted) | $5 | |||
| Ratio of expenses to average net assets | 1.70% | |||
| Ratio of expenses to average net assets | ||||
| prior to fees waived and expense paid indirectly | 12.54% | |||
| Ratio of net investment income to average net assets | 1.90% | |||
| Ratio of net investment loss to average net assets | ||||
| prior to fees waived and expense paid indirectly | (8.94% | ) | ||
| Portfolio turnover | 87% | 4 | ||
1 Date of commencement of operations; ratios have been annualized and total return has not been annualized.
2 The average shares outstanding method has been applied for per share information.
3 Total investment return is based on the change in net asset value of a share during the period and assumes reinvestment of dividends and distributions at net asset value. Total investment return during the period reflects waivers by the manager and distributor. Performance would have been lower had the waivers not been in effect.
4 Portfolio turnover is representative of the Fund for the period December 31, 2009 through November 30, 2010.
See accompanying notes, which are an integral part of the financial statements.
22
Delaware Macquarie Global Infrastructure Fund Institutional Class
Selected data for each share of the Fund outstanding throughout the period was as follows:
| 12/31/091 | ||||
| to | ||||
| 11/30/10 | ||||
| Net asset value, beginning of period | $8.500 | |||
| Income from investment operations: | ||||
| Net investment income2 | 0.170 | |||
| Net realized and unrealized gain on investments and foreign currencies | 0.118 | |||
| Total from investment operations | 0.288 | |||
| Less dividends and distributions from: | ||||
| Net investment income | (0.118 | ) | ||
| Total dividends and distributions | (0.118 | ) | ||
| Net asset value, end of period | $8.670 | |||
| Total return3 | 3.53% | |||
| Ratios and supplemental data: | ||||
| Net assets, end of period (000 omitted) | $2,071 | |||
| Ratio of expenses to average net assets | 1.20% | |||
| Ratio of expenses to average net assets | ||||
| prior to fees waived and expense paid indirectly | 11.66% | |||
| Ratio of net investment income to average net assets | 2.23% | |||
| Ratio of net investment loss to average net assets | ||||
| prior to fees waived and expense paid indirectly | (8.23% | ) | ||
| Portfolio turnover | 87% | |||
1 Date of commencement of operations; ratios have been annualized and total return has not been annualized. |
2 The average shares outstanding method has been applied for per share information. |
3 Total investment return is based on the change in net asset value of a share during the period and assumes reinvestment of dividends and distributions at net asset value. Total investment return during the period reflects a waiver by the manager. Performance would have been lower had the waiver not been in effect. |
See accompanying notes, which are an integral part of the financial statements.
23
| Notes to financial statements | |
| Delaware Macquarie Global Infrastructure Fund | November 30, 2010 |
Delaware Group® Global & International Funds (Trust) is organized as a Delaware statutory trust and offers five series: Delaware International Value Equity Fund, Delaware Emerging Markets Fund, Delaware Global Value Fund, Delaware Focus Global Growth Fund and Delaware Macquarie Global Infrastructure Fund. These financial statements and the related notes pertain to Delaware Macquarie Global Infrastructure Fund (Fund). The Trust is an open-end investment company. The Fund is considered non-diversified under the Investment Company Act of 1940, as amended, and offers Class A, Class C, Class R and Institutional Class shares. Class A shares are sold with a maximum front-end sales charge of up to 5.75%. Class A share purchases of $1,000,000 or more will incur a contingent deferred sales charge (CDSC) of 1% if redeemed during the first year and 0.50% during the second year, provided that Delaware Distributors, L.P. (DDLP) paid a financial advisor a commission on the purchase of those shares. Class C shares are sold with a CDSC of 1%, if redeemed during the first 12 months. Class R and Institutional Class shares are not subject to a sales charge and are offered for sale exclusively to certain eligible investors.
The investment objective of the Fund is to seek long-term capital appreciation and current income.
1. Significant Accounting Policies
The following accounting policies are in accordance with U.S. generally accepted accounting principles (U.S. GAAP) and are consistently followed by the Fund.
Security Valuation — Equity securities, except those traded on the Nasdaq Stock Market, Inc. (Nasdaq), are valued at the last quoted sales price as of the time of the regular close of the New York Stock Exchange (NYSE) on the valuation date. Securities traded on the Nasdaq are valued in accordance with the Nasdaq Official Closing Price, which may not be the last sales price. If on a particular day an equity security does not trade, then the mean between the bid and ask prices will be used. Securities listed on a foreign exchange are valued at the last quoted sales price on the valuation date. Short-term debt securities are valued at market value. Foreign currency exchange contracts are valued at the mean between the bid and ask prices. Interpolated values are derived when the settlement date of the contract is an interim date for which quotations are not available. Generally, other securities and assets for which market quotations are not readily available are valued at fair value as determined in good faith under the direction of the Fund’s Board of Trustees (Board). In determining whether market quotations are readily available or fair valuation will be used, various factors will be taken into consideration, such as market closures or suspension of trading in a security. The Fund may use fair value pricing more frequently for securities traded primarily in non-U.S. markets because, among other things, most foreign markets close well before the Fund values its securities generally as of 4:00 p.m. Eastern Time. The earlier close of these foreign markets gives rise to the possibility that significant events, including broad market moves, government actions or pronouncements, aftermarket trading, or news events may have occurred in the interim. To account for this, the Fund may frequently value foreign securities using fair value prices based on third-party vendor modeling tools (international fair value pricing).
24
Federal Income Taxes — No provision for federal income taxes has been made as the Fund intends to qualify for federal income tax purposes as a regulated investment company under Subchapter M of the Internal Revenue Code of 1986, as amended, and make the requisite distributions to shareholders. The Fund evaluates tax positions taken or expected to be taken in the course of preparing the Fund’s tax return to determine whether the tax positions are “more-likely-than-not” of being sustained by the applicable tax authority. Tax positions not deemed to meet the more-likely-than-not threshold would be recorded as a tax benefit or expense in the current year. Management has analyzed the Fund’s tax positions taken on federal income tax return for the open tax year November 30, 2010, and has concluded that no provision for federal income tax is required in the Fund’s financial statements.
Class Accounting — Investment income, common expenses and realized and unrealized gain (loss) on investments are allocated to the various classes of the Fund on the basis of daily net assets of each class. Distribution expenses relating to a specific class are charged directly to that class.
Foreign Currency Transactions — Transactions denominated in foreign currencies are recorded at the prevailing exchange rates on the valuation date in accordance with the Fund’s prospectus. The value of all assets and liabilities denominated in foreign currencies is translated into U.S. dollars at the exchange rate of such currencies against the U.S. dollar daily. Transaction gains or losses resulting from changes in exchange rates during the reporting period or upon settlement of the foreign currency transaction are reported in operations for the current period. The Fund does not isolate that portion of realized gains and losses on investments which is due to changes in foreign exchange rates from that which are due to changes in market prices. The changes are included with the net realized and unrealized gain or l oss on investments. The Fund reports certain foreign currency related transactions as components of realized gains (losses) for financial reporting purposes, whereas such components are treated as ordinary income (loss) for federal income tax purposes.
Use of Estimates — The preparation of financial statements in conformity with U.S. GAAP requires management to make estimates and assumptions that affect the reported amounts of assets and liabilities and disclosure of contingent assets and liabilities at the date of the financial statements and the reported amounts of revenues and expenses during the reporting period. Actual results could differ from those estimates and the differences could be material.
Other — Expenses directly attributable to the Fund are charged directly to the Fund. Other expenses common to various funds within the Delaware Investments® Family of Funds are generally allocated amongst such funds on the basis of average net assets. Management fees and some other expenses are paid monthly. Security transactions are recorded on the date the securities are purchased or sold (trade date) for financial reporting purposes. Costs used in calculating realized gains and losses on the sale of investment securities are those of the specific securities sold. Dividend income is recorded on the ex-dividend date and interest income is recorded on the accrual basis. Foreign dividends are also recorded on the ex-dividend date or as soon after the ex-dividend date that the Fund is aware of such dividends, net of all non-rebatable
25
Notes to financial statements
Delaware Macquarie Global Infrastructure Fund
Delaware Macquarie Global Infrastructure Fund
1. Significant Accounting Policies (continued)
tax withholdings. Withholding taxes on foreign dividends have been recorded in accordance with the Fund’s understanding of the applicable country’s tax rules and rates. The Fund declares and pays dividends from net investment income quarterly and distributions from net realized gain on investments, if any, annually. Dividends and distributions, if any, are recorded on the ex-dividend date.
The Fund may receive earnings credits from its custodian when positive cash balances are maintained, which are used to offset custody fees. There were no earnings credits for the period December 31, 2009 through November 30, 2010.
The Fund receives earnings credits from its transfer agent when positive cash balances are maintained, which may be used to offset transfer agent fees. The expense paid under this arrangement is included in dividend disbursing and transfer agent fees and expenses on the statement of operations with the corresponding expense offset shown as “expense paid indirectly.” For the period December 31, 2009 through November 30, 2010, the Fund earned $3 under this agreement.
| 2. | Investment Management, Administration Agreements and Other Transactions with Affiliates |
In accordance with the terms of its investment management agreement, the Fund pays Delaware Management Company (DMC), a series of Delaware Management Business Trust and the investment manager, an annual fee which is calculated daily at the rate of 0.90% on the first $500 million of average daily net assets of the Fund, 0.85% on the next $500 million, 0.80% on the next $1.5 billion and 0.75% on average daily net assets in excess of $2.5 billion.
DMC, on behalf of the Fund, has entered into an investment sub-advisory agreement with Macquarie Capital Investment Management LLC (MCIM), which is an affiliate of DMC. Both DMC and MCIM are wholly owned subsidiaries of Macquarie. For its sub-advisory services, MCIM receives an asset-based fee from DMC. Such sub-advisory fee is paid by DMC, and not from the assets of the Fund.
Effective March 30, 2010, DMC has contractually agreed to waive that portion, if any, of its management fee and reimburse the Fund to the extent necessary to ensure that total annual operating expenses (excluding any 12b-1 plan expenses, and certain other expenses) do not exceed 1.20% of average daily net assets of the Fund through March 30, 2011. For purposes of this waiver and reimbursement, nonroutine expenses may also include such additional costs and expenses as may be agreed upon from time to time by the Fund’s Board and DMC. Prior to March 30, 2010, the expense limitation was voluntary. This expense waiver and reimbursement applies only to expenses paid directly by the Fund.
Delaware Service Company, Inc. (DSC), an affiliate of DMC, provides fund accounting and financial administration oversight services to the Fund. For these services, the Fund pay DSC fees based on the aggregate daily net assets of the Delaware Investments® Family of Funds at the
26
following annual rate: 0.0050% of the first $30 billion; 0.0045% of the next $10 billion; 0.0040% of the next $10 billion; and 0.0025% of aggregate average daily net assets in excess of $50 billion. The fees payable to DSC under the service agreement described above are allocated among all Funds in the Delaware Investments® Family of Funds on a relative net asset value basis. For the period December 31, 2009 through November 30, 2010, the Fund was charged $111 for these services.
DSC also provides dividend disbursing and transfer agency services. The Fund pays DSC a monthly fee based on the number of shareholder accounts for dividend disbursing and transfer agent services.
Pursuant to a distribution agreement and distribution plan, the Fund pays DDLP, the distributor and an affiliate of DMC, an annual distribution and service fee not to exceed 0.30% of the average daily net assets of the Class A shares, 1.00% of the average daily net assets of the Class C shares and 0.60% of the average daily net assets of Class R shares. Institutional Class shares pay no distribution and service expenses. DDLP has contracted to limit the Class A and Class R shares’ 12b-1 fees through March 30, 2011 to no more than 0.25% and 0.50%, respectively, of each Classes’ average daily net assets.
At November 30, 2010, the Fund had receivables due from or liabilities payable to affiliates as follows:
| Receivable from DMC under expense limitation agreement | $ | 74,344 | |
| Dividend disbursing, transfer agent and fund accounting | |||
| oversight fees and other expenses payable to DSC | (97 | ) | |
| Distribution fees payable to DDLP | (218 | ) | |
| Other expenses payable to DMC and affiliates* | (1,324 | ) |
*DMC, as part of its administrative services, pays operating expenses on behalf of the Fund and is reimbursed on a periodic basis. Expenses include items such as printing of shareholder reports, fees for audit, legal and tax services, registration fees and trustees’ fees.
As provided in the investment management agreement, the Fund bears the cost of certain legal and tax services, including internal legal and tax services provided to the Fund by DMC and/or its affiliates’ employees. For the period December 31, 2009 through November 30, 2010, the Fund was charged $95 for internal legal and tax services provided by DMC and/or its affiliates’ employees.
For the period January 19, 2010 through November 30, 2010, DDLP earned $890 for commissions on sales of the Fund’s Class A shares. For the period January 19, 2010 to November 30, 2010, DDLP received gross CDSC commissions of $0 and $25 on redemptions of the Fund’s Class A and Class C shares, respectively, and these commissions were entirely used to offset up-front commissions previously paid by DDLP to broker/dealers on sales of those shares.
Trustees’ fees include expenses accrued by the Fund for each Trustee’s retainer and meeting fees. Certain officers of DMC, DSC and DDLP are officers and/or Trustees of the Trust. These officers and Trustees are paid no compensation by the Fund.
27
Notes to financial statements
Delaware Macquarie Global Infrastructure Fund
Delaware Macquarie Global Infrastructure Fund
3. Investments
For the period December 31, 2009 through November 30, 2010, the Fund made purchases of $ 4,633,119 and sales of $2,039,140 of investment securities other than short-term investments.
At November 30, 2010, the cost of investments for federal income tax purposes was $2,736,546. At November 30, 2010, net unrealized appreciation was $36,465, of which $173,430 related to unrealized appreciation of investments and $136,965 related to unrealized depreciation of investments.
U.S. GAAP defines fair value as the price that the Fund would receive to sell an asset or pay to transfer a liability in an orderly transaction between market participants at the measurement date under current market conditions. A three level hierarchy for fair value measurements has been established based upon the transparency of inputs to the valuation of an asset or liability. Inputs may be observable or unobservable and refer broadly to the assumptions that market participants would use in pricing the asset or liability. Observable inputs reflect the assumptions market participants would use in pricing the asset or liability based on market data obtained from sources independent of the reporting entity. Unobservable inputs reflect the reporting entity’s own assumptions about the assumptions that market participants would use in pricing the asset or liability developed based on the best information available under the circumstance s. The Fund’s investment in its entirety is assigned a level based upon the observability of the inputs which are significant to the overall valuation. The three level hierarchy of inputs is summarized below.
| Level 1 | – | inputs are quoted prices in active markets for identical investments (e.g., equity securities, open-end investment companies, futures contracts, options contracts) |
| Level 2 | – | other observable inputs (including, but not limited to: quoted prices for similar assets or liabilities in markets that are active, quoted prices for identical or similar assets or liabilities in markets that are not active, inputs other than quoted prices that are observable for the assets or liabilities (such as interest rates, yield curves, volatilities, prepayment speeds, loss severities, credit risks and default rates) or other market-corroborated inputs) (e.g., debt securities, government securities, swap contracts, foreign currency exchange contracts, foreign securities utilizing international fair value pricing) |
| Level 3 | – | inputs are significant unobservable inputs (including the Fund’s own assumptions used to determine the fair value of investments) (e.g., broker-quoted securities, fair valued securities) |
The following table summarizes the valuation of the Fund’s investments by fair value hierarchy levels as of November 30, 2010:
| Level 1 | Level 2 | Total | |||||||
| Common Stock | $ | 970,834 | $ | 1,635,501 | $ | 2,606,335 | |||
| U.S. Master Limited Partnership | 27,676 | — | 27,676 | ||||||
| Discount Note | — | 139,000 | 139,000 | ||||||
| Total | $ | 998,510 | $ | 1,774,501 | $ | 2,773,011 | |||
| Foreign Currency Exchange Contracts | $ | — | $ | 537 | $ | 537 | |||
28
There were no Level 3 securities at the end of the period.
In January 2010, the Financial Accounting Standards Board issued an Accounting Standards Update, Improving Disclosures about Fair Value Measurements, which introduced new disclosure requirements and clarified certain existing disclosure requirements around fair value measurements currently presented above. The new disclosures and clarifications of existing disclosures are generally effective for the Fund’s year ending November 30, 2011 and interim periods therein. Utilizing international fair value pricing for a security could cause transfers from Level 1 investments to Level 2 investments in the hierarchy. During the period ended November 30, 2010, there were no transfers between Level 1 investments, Level 2 investments or Level 3 investments that had a material impact to the Fund.
4. Dividend and Distribution Information
Income and long-term capital gain distributions are determined in accordance with federal income tax regulations, which may differ from U.S. GAAP. Additionally, distributions from net gains on foreign currency transactions and net short-term gains on sales of investment securities are treated as ordinary income for federal income tax purposes. The tax character of dividends and distributions paid during the period December 31, 2009 through November 30, 2010 was as follows:
| 12/31/09* | |
| to | |
| 11/30/10 | |
| Ordinary income | $34,820 |
| *Date of commencement of operations. |
5. Components of Net Assets on a Tax Basis
As of November 30, 2010, the components of net assets on a tax basis were as follows:
| Shares of beneficial interest | $ | 2,792,247 |
| Undistributed ordinary income | 28,242 | |
| Unrealized appreciation of investments and foreign currencies | 36,420 | |
| Net assets | $ | 2,856,909 |
The differences between book basis and tax basis components of net assets are primarily attributable to tax deferral of losses on wash sales and mark-to-market on foreign currency contracts.
For financial reporting purposes, capital accounts are adjusted to reflect the tax character of permanent book/tax differences. Reclassifications are primarily due to tax treatment of gain (loss) on foreign currency transactions. Results of operations and net assets were not affected by these reclassifications. For the period December 31, 2009 through November 30, 2010, the Fund recorded the following reclassifications:
| Undistributed net investment income | $ | (6,092 | ) |
| Accumulated net realized loss | 6,092 |
29
Notes to financial statements
Delaware Macquarie Global Infrastructure Fund
Delaware Macquarie Global Infrastructure Fund
6. Capital Shares
Transactions in capital shares were as follows:
| 12/31/09* | ||
| to | ||
| 11/30/10 | ||
| Shares sold: | ||
| Class A | 96,703 | |
| Class C | 13,370 | |
| Class R | 575 | |
| Institutional Class | 235,296 | |
| Shares issued upon reinvestment of dividends and distributions: | ||
| Class A | 770 | |
| Class C | 93 | |
| Class R | 7 | |
| Institutional Class | 3,525 | |
| 350,339 | ||
| Shares repurchased: | ||
| Class A | (20,556 | ) |
| Class C | (291 | ) |
| (20,847 | ) | |
| Net increase | 329,492 | |
*Date of commencement of operations for the Institutional Class. Class A, Class C, and Class R commenced operations on January 19, 2010.
7. Line of Credit
The Fund, along with certain other funds in the Delaware Investments® Family of Funds (Participants), was a participant in a $35,000,000 revolving line of credit with The Bank of New York Mellon (BNY Mellon) to be used for temporary or emergency purposes as an additional source of liquidity to fund redemptions of investor shares. Under the agreement, the Participants were charged an annual commitment fee, which was allocated across the Participants on the basis of each Participant’s allocation of the entire facility. The Participants were permitted to borrow up to a maximum of one third of their net assets under the agreement. The line of credit expired on November 16, 2010.
Effective as of November 16, 2010, the Fund along with the other Participants entered into an amendment to the agreement with BNY Mellon for a $50,000,000 revolving line of credit. The agreement as amended is to be used as described above and operates in substantially the same manner as the original agreement. The new line of credit under the agreement as amended expires on November 15, 2011. The Fund had no amounts outstanding as of November 30, 2010 or at any time during the period then ended.
30
8. Derivatives
U.S. GAAP requires enhanced disclosures that enable investors to understand: 1) how and why an entity uses derivatives, 2) how they are accounted for, and 3) how they affect an entity’s results of operations and financial position.
Foreign Currency Exchange Contracts — The Fund may enter into foreign currency exchange contracts as a way of managing foreign exchange rate risk. The Fund may enter into these contracts to fix the U.S. dollar value of a security that it has agreed to buy or sell for the period between the date the trade was entered into and the date the security is delivered and paid for. The Fund may also use these contracts to hedge the U.S. dollar value of securities it already owns that are denominated in foreign currencies. The change in value is recorded as an unrealized gain or loss. When the contract is closed, a realized gain or loss is recorded equal to the difference between the value of the contract at the time it was opened and the value at the time it was closed.
The use of foreign currency exchange contracts does not eliminate fluctuations in the underlying prices of the securities, but does establish a rate of exchange that can be achieved in the future. Although foreign currency exchange contracts limit the risk of loss due to an unfavorable change in the value of the hedged currency, they also limit any potential gain that might result should the value of the currency change favorably. In addition, the Fund could be exposed to risks if the counterparties to the contracts are unable to meet the terms of their contracts. The Fund’s maximum risk of loss from counterparty credit risk is the value of its currency exchanged with the counterparty. The risk is generally mitigated by having a netting arrangement between the Fund and the counterparty and by the posting of collateral by the counterparty to the Fund to cover the Fund’s exposure to the counterparty.
9. Securities Lending
The Fund, along with other funds in the Delaware Investments® Family of Funds, may lend its securities pursuant to a security lending agreement (Lending Agreement) with BNY Mellon. With respect to each loan, if on any business day the aggregate market value of securities collateral plus cash collateral held is less than the aggregate market value of the securities which are the subject of such loan, the borrower will be notified to provide additional collateral by the end of the following business day which, together with the collateral already held, will be not less than the applicable collateral requirements for such security loan. If the aggregate market value of securities collateral and cash collateral held with respect to a security loan exceeds the ap plicable collateral requirement, upon the request of the borrower BNY Mellon must return enough collateral to the borrower by the end of the following business day to reduce the value of the remaining collateral to the applicable collateral requirement for such security loan. As a result of the foregoing, the value of the collateral held with respect to a loaned security may be temporarily more or less than the value of the security on loan.
Cash collateral received is generally invested in the Delaware Investments Collateral Fund No. 1 (Collective Trust) established by BNY Mellon for the purpose of investment on behalf of funds managed by DMC that participate in BNY Mellon’s securities lending program. The Collective Trust may invest in U.S. government securities and high quality corporate debt, asset-backed and
31
Notes to financial statements
Delaware Macquarie Global Infrastructure Fund
Delaware Macquarie Global Infrastructure Fund
9. Securities Lending (continued)
other money market securities and in repurchase agreements collateralized by such securities, provided that the Collective Trust will generally have a dollar-weighted average portfolio maturity of 60 days or less. The Collective Trust seeks to maintain a net asset value per unit of $1.00, but there can be no assurance that it will always be able to do so. The Fund may incur investment losses as a result of investing securities lending collateral in the Collective Trust. This could occur if an investment in the Collective Trust defaulted or if it were necessary to liquidate assets in the Collective Trust to meet returns on outstanding security loans at a time when the Collective Trust’s net asset value per unit was less than $1.00. Under those circumstances, the Fund may not receive an amount from the Collective Trust that is equal in amount to the collateral the Fund would be required to return to the borrower of the securities and t he Fund would be required to make up this shortfall. The Fund can also accept U.S. government securities and letters of credit (non-cash collateral) in connection with securities loans. In the event of default or bankruptcy by the lending agent, realization and/or retention of the collateral may be subject to legal proceedings. In the event the borrower fails to return loaned securities and the collateral received is insufficient to cover the value of the loaned securities and provided such collateral shortfall is not the result of investment losses, the lending agent has agreed to pay the amount of the shortfall to the Fund, or at the discretion of the lending agent, replace the loaned securities. The Fund continues to record dividends or interest, as applicable, on the securities loaned and is subject to change in value of the securities loaned that may occur during the term of the loan. The Fund has the right under the Lending Agreement to recover the securities from the borrower on demand. With respect t o security loans collateralized by non-cash collateral, the Fund receives loan premiums paid by the borrower. With respect to security loans collateralized by cash collateral, the earnings from the collateral investments are shared among the Fund, the security lending agent and the borrower. The Fund records security lending income net of allocations to the security lending agent and the borrower. The Fund had no securities out on loan as of November 30, 2010.
10. Credit and Market Risk
Some countries in which the Fund may invest require governmental approval for the repatriation of investment income, capital or the proceeds of sales of securities by foreign investors. In addition, if there is deterioration in a country’s balance of payments or for other reasons, a country may impose temporary restrictions on foreign capital remittances abroad.
The securities exchanges of certain foreign markets are substantially smaller, less liquid and more volatile than the major securities markets in the United States. Consequently, acquisition and disposition of securities by the Fund may be inhibited. In addition, a significant portion of the aggregate market value of equity securities listed on the major securities exchanges in emerging markets is held by a smaller number of investors. This may limit the number of shares available for acquisition or disposition by the Fund.
Because the Fund concentrates its investments in securities issued by companies principally engaged in the infrastructure industry, the Fund has greater exposure to the potential adverse economic, regulatory, political, and other changes affecting such entities.
32
The Fund may invest up to 15% of its net assets in illiquid securities, which may include securities with contractual restrictions on resale, securities exempt from registration under Rule 144A of the Securities Act of 1933, as amended, and other securities which may not be readily marketable. The relative illiquidity of these securities may impair the Fund from disposing of them in a timely manner and at a fair price when it is necessary or desirable to do so. While maintaining oversight, the Fund’s Board has delegated to DMC, the day-to-day functions of determining whether individual securities are liquid for purposes of the Fund’s limitation on investments in illiquid assets. Securities eligible for resale pursuant to Rule 144A, which are determined to be liquid, are not subject to the Fund’s 15% limit on investments in illiquid securities. As of November 30, 2010, no securities have been determined to be illiquid unde r the Fund’s Liquidity Procedures. Rule 144A securities have been identified on the statement of net assets.
11. Contractual Obligations
The Fund enters into contracts in the normal course of business that contain a variety of indemnifications. The Fund’s maximum exposure under these arrangements is unknown. However, the Fund has not had prior claims or losses pursuant to these contracts. Management has reviewed the Fund’s existing contracts and expects the risk of loss to be remote.
12. Subsequent Events
Management has determined no material events or transactions occurred subsequent to November 30, 2010 that would require recognition or disclosure in the Fund’s financial statements.
13. Tax Information (Unaudited)
The information set forth below is for the Fund’s fiscal year as required by federal income tax laws. Shareholders, however, must report distributions on a calendar year basis for income tax purposes, which may include distributions for portions of two fiscal years of a fund. Accordingly, the information needed by shareholders for income tax purposes will be sent to them in January of each year. Please consult your tax advisor for proper treatment of this information.
For the fiscal year ended November 30, 2010, the Fund designates distributions paid during the year as follows:
| (A) Ordinary Income Distributions* (Tax Basis) | 100% |
| (B) Qualifying Dividends1 | 25% |
(A) is based on a percentage of the Fund’s total distributions.
(B) is based on a percentage of the Fund’s ordinary income distributions.
(B) is based on a percentage of the Fund’s ordinary income distributions.
1Qualifying dividends represent dividends which qualify for the corporate dividends received deduction.
*For the fiscal year ended November 30, 2010, certain dividends paid by the Fund may be subject to a maximum tax rate of 15%, as provided for by the Jobs and Growth Tax Relief Reconciliation Act of 2003. The Fund intends to designate the $16,760 to be taxed at a maximum rate of 15%. Complete information will be computed and reported in conjunction with your 2010 Form 1099-DIV.
The Fund intends to pass through foreign tax credits in the maximum amount of $4,948. The gross foreign source income earned during the fiscal year 2010 by the Fund was $63,937.
33
Report of independent
registered public accounting firm
registered public accounting firm
To the Board of Trustees of Delaware Group Global & International Funds
and the Shareholders of Delaware Macquarie Global Infrastructure Fund:
and the Shareholders of Delaware Macquarie Global Infrastructure Fund:
In our opinion, the accompanying statement of net assets and statement of assets and liabilities and the related statements of operations and of changes in net assets and the financial highlights present fairly, in all material respects, the financial position of Delaware Macquarie Global Infrastructure Fund (one of the series constituting Delaware Group Global & International Funds, hereafter referred to as the “Fund”) at November 30, 2010, and the results of its operations, the changes in its net assets and the financial highlights for the period December 31, 2009 (commencement of operations) through November 30, 2010, in conformity with accounting principles generally accepted in the United States of America. These financial statements and financial highlights (hereafter referred to as “financial statements”) are the responsibility of the Fund’s management; our responsibility is to express an opinion on these financial statements based on our audit. We conducted our audit of these financial statements in accordance with the standards of the Public Company Accounting Oversight Board (United States). Those standards require that we plan and perform the audit to obtain reasonable assurance about whether the financial statements are free of material misstatement. An audit includes examining, on a test basis, evidence supporting the amounts and disclosures in the financial statements, assessing the accounting principles used and significant estimates made by management, and evaluating the overall financial statement presentation. We believe that our audit, which included confirmation of securities at November 30, 2010 by correspondence with the custodian and broker, provides a reasonable basis for our opinion.
PricewaterhouseCoopers LLP
Philadelphia, Pennsylvania
January 19, 2011
34
Other Fund information
(Unaudited)
Delaware Macquarie Global Infrastructure Fund
(Unaudited)
Delaware Macquarie Global Infrastructure Fund
Change in Independent Registered Public Accounting Firm
Due to independence matters under the Securities and Exchange Commission’s auditor independence rules relating to the January 4, 2010 acquisition of Delaware Investments (including DMC, DDLP and DSC) by Macquarie Group, Ernst & Young LLP (“E&Y”) has resigned as the independent registered public accounting firm for Delaware Group® Global & International Funds (the “Trust”) effective May 20, 2010. At a meeting held on May 20, 2010, the Board of Trustees of the Fund, upon recommendation of the Audit Committee, selected PricewaterhouseCoopers LLP (“PwC”) to serve as the independent regist ered public accounting firm for the Trust for the fiscal year ending November 30, 2010. During the fiscal years ended November 30, 2009 and 2008, E&Y’s audit reports on the financial statements of the Fund did not contain any adverse opinion or disclaimer of opinion, nor were they qualified or modified as to uncertainty, audit scope, or accounting principles. In addition, there were no disagreements between the Trust and E&Y on accounting principles, financial statements disclosures or audit scope, which, if not resolved to the satisfaction of E&Y, would have caused them to make reference to the disagreement in their reports. Neither the Trust nor anyone on its behalf has consulted with PwC at any time prior to their selection with respect to the application of accounting principles to a specified transaction, either completed or proposed or the type of audit opinion that might be rendered on the Trust’s financial statements.
35
Board of trustees/directors and officers addendum
Delaware Investments® Family of Funds
Delaware Investments® Family of Funds
A mutual fund is governed by a Board of Trustees/Directors (“Trustees”), which has oversight responsibility for the management of a fund’s business affairs. Trustees establish procedures and oversee and review the performance of the investment manager, the distributor, and others who perform services for the fund. The independent fund trustees, in particular, are advocates
| Name, Address, | Position(s) | Length of | ||
| and Birth Date | Held with Fund(s) | Time Served | ||
| Interested Trustees | ||||
| Patrick P. Coyne1 | Chairman, President, | Chairman and Trustee | ||
| 2005 Market Street | Chief Executive Officer, | since August 16, 2006 | ||
| Philadelphia, PA 19103 | and Trustee | |||
| April 1963 | President and | |||
| Chief Executive Officer | ||||
| since August 1, 2006 | ||||
1 Patrick P. Coyne is considered to be an “Interested Trustee” because he is an executive officer of the Fund’s(s’) investment advisor.
36
for shareholder interests. Each trustee has served in that capacity since he or she was elected to or appointed to the Board of Trustees, and will continue to serve until his or her retirement or the election of a new trustee in his or her place. The following is a list of the Trustees and Officers with certain background and related information.
| Number of Portfolios in | ||||
| Principal Occupation(s) | Fund Complex Overseen | Other Directorships | ||
| During Past 5 Years | by Trustee or Officer | Held by Trustee or Officer | ||
| Patrick P. Coyne has served in | 78 | Director | ||
| various executive capacities | Kaydon Corp. | |||
| at different times at | ||||
| Delaware Investments.2 | Board of Governors Member | |||
| Investment Company | ||||
| Institute (ICI) | ||||
| Finance Committee Member | ||||
| St. John Vianney Roman | ||||
| Catholic Church | ||||
| Board of Trustees | ||||
| Agnes Irwin School | ||||
| Member of Investment | ||||
| Committee | ||||
| Cradle of Liberty Council, | ||||
| BSA | ||||
| (2007 – 2010) | ||||
2 Delaware Investments is the marketing name for Delaware Management Holdings, Inc. and its subsidiaries, including the Fund’s(s’) investment advisor, principal underwriter, and its transfer agent.
37
Board of trustees/directors and officers addendum
Delaware Investments® Family of Funds
Delaware Investments® Family of Funds
| Name, Address, | Position(s) | Length of | ||
| and Birth Date | Held with Fund(s) | Time Served | ||
| Independent Trustees | ||||
| Thomas L. Bennett | Trustee | Since March 2005 | ||
| 2005 Market Street | ||||
| Philadelphia, PA 19103 | ||||
| October 1947 | ||||
| John A. Fry | Trustee | Since January 2001 | ||
| 2005 Market Street | ||||
| Philadelphia, PA 19103 | ||||
| May 1960 | ||||
| Anthony D. Knerr | Trustee | Since April 1990 | ||
| 2005 Market Street | ||||
| Philadelphia, PA 19103 | ||||
| December 1938 | ||||
| Lucinda S. Landreth | Trustee | Since March 2005 | ||
| 2005 Market Street | ||||
| Philadelphia, PA 19103 | ||||
| June 1947 | ||||
38
| Number of Portfolios in | ||||
| Principal Occupation(s) | Fund Complex Overseen | Other Directorships | ||
| During Past 5 Years | by Trustee or Officer | Held by Trustee or Officer | ||
| Private Investor | 78 | Director | ||
| (March 2004–Present) | Bryn Mawr Bank Corp. (BMTC) | |||
| Investment Manager | Chairman of Investment | |||
| Morgan Stanley & Co. | Committee | |||
| (January 1984–March 2004) | Pennsylvania Academy of | |||
| Fine Arts | ||||
| Investment Committee and | ||||
| Governance Committee | ||||
| Member | ||||
| Pennsylvania Horticultural | ||||
| Society | ||||
| President | 78 | Director | ||
| Drexel University | Community Health Systems | |||
| (August 2010–Present) | ||||
| Director — Ecore | ||||
| President | International | |||
| Franklin & Marshall College | (2009 – 2010) | |||
| (July 2002–July 2010) | ||||
| Director — Allied | ||||
| Executive Vice President | Barton Securities Holdings | |||
| University of Pennsylvania | (2005 – 2008) | |||
| (April 1995–June 2002) | ||||
| Founder and | 78 | None | ||
| Managing Director | ||||
| Anthony Knerr & Associates | ||||
| (Strategic Consulting) | ||||
| (1990–Present) | ||||
| Chief Investment Officer | 78 | None | ||
| Assurant, Inc. (Insurance) | ||||
| (2002–2004) | ||||
39
Board of trustees/directors and officers addendum
Delaware Investments® Family of Funds
Delaware Investments® Family of Funds
| Name, Address, | Position(s) | Length of | ||
| and Birth Date | Held with Fund(s) | Time Served | ||
| Independent Trustees (continued) | ||||
| Ann R. Leven | Trustee | Since October 1989 | ||
| 2005 Market Street | ||||
| Philadelphia, PA 19103 | ||||
| November 1940 | ||||
| | ||||
| Thomas F. Madison | Trustee | Since May 19973 | ||
| 2005 Market Street | ||||
| Philadelphia, PA 19103 | ||||
| February 1936 | ||||
| |
3 In 1997, several funds managed by Voyageur Fund Managers, Inc. (the “Voyageur Funds”) were incorporated into the Delaware Investments Family of Funds. Mr. Madison served as a director of the Voyageur Funds from 1993 until 1997.
40
| Number of Portfolios in | ||||
| Principal Occupation(s) | Fund Complex Overseen | Other Directorships | ||
| During Past 5 Years | by Trustee or Officer | Held by Trustee or Officer | ||
| Consultant | 78 | Director and Audit | ||
| ARL Associates | Committee Chair – | |||
| (Financial Planning) | Systemax Inc. | |||
| (1983–Present) | (2001 – 2009) | |||
| Director and Audit | ||||
| Committee Chairperson – | ||||
| Andy Warhol Foundation | ||||
| (1999 – 2007) | ||||
| President and | 78 | Director and Chair of | ||
| Chief Executive Officer | Compensation Committee, | |||
| MLM Partners, Inc. | Governance Committee | |||
| (Small Business Investing | Member | |||
| and Consulting) | CenterPoint Energy | |||
| (January 1993–Present) | ||||
| Lead Director and Chair of | ||||
| Audit and Governance | ||||
| Committees, Member of | ||||
| Compensation Committee | ||||
| Digital River, Inc. | ||||
| Director and Chair of | ||||
| Governance Committee, | ||||
| Audit Committee | ||||
| Member | ||||
| Rimage Corporation | ||||
| Director and Chair of | ||||
| Compensation Committee | ||||
| Spanlink Communications | ||||
| Lead Director and Member of | ||||
| Compensation and | ||||
| Governance Committees | ||||
| Valmont Industries, Inc. | ||||
| (1987 – 2010) | ||||
41
Board of trustees/directors and officers addendum
Delaware Investments® Family of Funds
Delaware Investments® Family of Funds
| Name, Address, | Position(s) | Length of | ||
| and Birth Date | Held with Fund(s) | Time Served | ||
| Independent Trustees (continued) | ||||
| Thomas F. Madison | ||||
| 2005 Market Street | ||||
| Philadelphia, PA 19103 | ||||
| February 1936 | ||||
| Janet L. Yeomans | Trustee | Since April 1999 | ||
| 2005 Market Street | ||||
| Philadelphia, PA 19103 | ||||
| July 1948 | ||||
| J. Richard Zecher | Trustee | Since March 2005 | ||
| 2005 Market Street | ||||
| Philadelphia, PA 19103 | ||||
| July 1940 | ||||
42
| Number of Portfolios in | ||||
| Principal Occupation(s) | Fund Complex Overseen | Other Directorships | ||
| During Past 5 Years | by Trustee or Officer | Held by Trustee or Officer | ||
| Director | ||||
| Banner Health | ||||
| (1996 – 2007) | ||||
| Vice President and Treasurer | 78 | Director | ||
| (January 2006–Present) | Okabena Company | |||
| Vice President — Mergers & Acquisitions | ||||
| (January 2003–January 2006), and | ||||
| Vice President | ||||
| (July 1995–January 2003) | ||||
| 3M Corporation | ||||
| Founder | 78 | Director and Audit | ||
| Investor Analytics | Committee Member | |||
| (Risk Management) | Investor Analytics | |||
| (May 1999–Present) | ||||
| Founder | Director | |||
| Sutton Asset Management | Oxigene, Inc. | |||
| (Hedge Fund) | (2003 – 2008) | |||
| (September 1996–Present) | ||||
43
Board of trustees/directors and officers addendum
Delaware Investments® Family of Funds
Delaware Investments® Family of Funds
| Name, Address, | Position(s) | Length of | ||
| and Birth Date | Held with Fund(s) | Time Served | ||
| Officers | ||||
| David F. Connor | Vice President, | Vice President since | ||
| 2005 Market Street | Deputy General | September 2000 | ||
| Philadelphia, PA 19103 | Counsel, and Secretary | and Secretary since | ||
| December 1963 | October 2005 | |||
| Daniel V. Geatens | Vice President | Treasurer | ||
| 2005 Market Street | and Treasurer | since October 2007 | ||
| Philadelphia, PA 19103 | ||||
| October 1972 | ||||
| David P. O’Connor | Senior Vice President, | Senior Vice President, | ||
| 2005 Market Street | General Counsel, | General Counsel, and | ||
| Philadelphia, PA 19103 | and Chief Legal Officer | Chief Legal Officer | ||
| February 1966 | since October 2005 | |||
| Richard Salus | Senior Vice President | Chief Financial Officer | ||
| 2005 Market Street | and Chief Financial Officer | since November 2006 | ||
| Philadelphia, PA 19103 | ||||
| October 1963 | ||||
The Statement of Additional Information for the Fund(s) includes additional information about the Trustees and Officers and is available, without charge, upon request by calling 800 523-1918.
44
| Number of Portfolios in | ||||
| Principal Occupation(s) | Fund Complex Overseen | Other Directorships | ||
| During Past 5 Years | by Trustee or Officer | Held by Trustee or Officer | ||
| David F. Connor has served as | 78 | None4 | ||
| Vice President and Deputy | ||||
| General Counsel of | ||||
| Delaware Investments | ||||
| since 2000. | ||||
| Daniel V. Geatens has served | 78 | None4 | ||
| in various capacities at | ||||
| different times at | ||||
| Delaware Investments. | ||||
| David P. O’Connor has served in | 78 | None4 | ||
| various executive and legal | ||||
| capacities at different times | ||||
| at Delaware Investments. | ||||
| Richard Salus has served in | 78 | None4 | ||
| various executive capacities | ||||
| at different times at | ||||
| Delaware Investments. | ||||
4 David F. Connor, Daniel V. Geatens, David P. O’Connor, and Richard Salus serve in similar capacities for the six portfolios of the Optimum Fund Trust, which have the same investment advisor, principal underwriter, and transfer agent as the registrant.
45
About the organization
| Board of trustees | |||
Patrick P. Coyne Chairman, President, and Chief Executive Officer Delaware Investments® Family of Funds Philadelphia, PA Thomas L. Bennett Private Investor Rosemont, PA John A. Fry President Drexel University Philadelphia, PA | Anthony D. Knerr Founder and Managing Director Anthony Knerr & Associates New York, NY Lucinda S. Landreth Former Chief Investment Officer Assurant, Inc. Philadelphia, PA | Ann R. Leven Consultant ARL Associates New York, NY Thomas F. Madison President and Chief Executive Officer MLM Partners, Inc. Minneapolis, MN | Janet L. Yeomans Vice President and Treasurer 3M Corporation St. Paul, MN J. Richard Zecher Founder Investor Analytics Scottsdale, AZ |
| Affiliated officers | |||
David F. Connor Vice President, Deputy General Counsel, and Secretary Delaware Investments Family of Funds Philadelphia, PA | Daniel V. Geatens Vice President and Treasurer Delaware Investments Family of Funds Philadelphia, PA | David P. O’Connor Senior Vice President, General Counsel, and Chief Legal Officer Delaware Investments Family of Funds Philadelphia, PA | Richard Salus Senior Vice President and Chief Financial Officer Delaware Investments Family of Funds Philadelphia, PA |
This annual report is for the information of Delaware Macquarie Global Infrastructure Fund shareholders, but it may be used with prospective investors when preceded or accompanied by a current prospectus for Delaware Macquarie Global Infrastructure Fund and the Delaware Investments Fund fact sheet for the most recently completed calendar quarter. These documents are available at www.delawareinvestments.com. The prospectus sets forth details about charges, expenses, investment objectives, and operating policies of the investment company. You should read the prospectus carefully before you invest. The figures in this report represent past results that are not a guarantee of future results. The return and principal value of an investment in the investment company will fluctuate so that shares, when redeemed, may be worth more or less than their original cost. |
Delaware Investments is the marketing name of Delaware Management Holdings, Inc. and its subsidiaries. The Fund files its complete schedule of portfolio holdings with the Securities and Exchange Commission (SEC) for the first and third quarters of each fiscal year on Form N-Q. The Fund’s Forms N-Q, as well as a description of the policies and procedures that the Fund uses to determine how to vote proxies (if any) relating to portfolio securities are available without charge (i) upon request, by calling 800 523-1918; and (ii) on the SEC’s Web site at www.sec.gov. In addition, a description of the policies and procedures that the Fund uses to determine how to vote proxies (if any) relating to portfolio securities and the Fund’s Schedule of Investments are available without charge on the Fund’s Web site at www.delawareinvestments.com. The Fund’s Forms N-Q may be reviewed and copied at the SEC’s Public Reference Room in Washington, D.C.; information on the operation of the Public Reference Room may be obtaine d by calling 800 SEC-0330. Information (if any) regarding how the Fund voted proxies relating to portfolio securities during the most recently disclosed 12-month period ended June 30 is available without charge (i) through the Fund’s Web site at www.delawareinvestments.com; and (ii) on the SEC’s Web site at www.sec.gov. |
46
Item 2. Code of Ethics
The registrant has adopted a code of ethics that applies to the registrant’s principal executive officer, principal financial officer, principal accounting officer or controller, or persons performing similar functions, regardless of whether these individuals are employed by the registrant or a third party. A copy of the registrant’s Code of Business Ethics has been posted on the Delaware Investments Internet Web site at www.delawareinvestments.com. Any amendments to the Code of Business Ethics, and information on any waiver from its provisions granted by the registrant, will also be posted on this Web site within five business days of such amendment or waiver and will remain on the Web site for at least 12 months.
Item 3. Audit Committee Financial Expert
The registrant’s Board of Trustees/Directors has determined that each member of the registrant’s Audit Committee is an audit committee financial expert, as defined below. For purposes of this item, an “audit committee financial expert” is a person who has the following attributes:
a. An understanding of generally accepted accounting principles and financial statements;
b. The ability to assess the general application of such principles in connection with the accounting for estimates, accruals, and reserves;
c. Experience preparing, auditing, analyzing, or evaluating financial statements that present a breadth and level of complexity of accounting issues that are generally comparable to the breadth and complexity of issues that can reasonably be expected to be raised by the registrant’s financial statements, or experience actively supervising one or more persons engaged in such activities;
d. An understanding of internal controls and procedures for financial reporting; and
e. An understanding of audit committee functions.
An “audit committee financial expert” shall have acquired such attributes through:
a. Education and experience as a principal financial officer, principal accounting officer, controller, public accountant, or auditor or experience in one or more positions that involve the performance of similar functions;
b. Experience actively supervising a principal financial officer, principal accounting officer, controller, public accountant, auditor, or person performing similar functions;
c. Experience overseeing or assessing the performance of companies or public accountants with respect to the preparation, auditing, or evaluation of financial statements; or
d. Other relevant experience.
The registrant’s Board of Trustees/Directors has also determined that each member of the registrant’s Audit Committee is independent. In order to be “independent” for purposes of this item, the Audit Committee member may not: (i) other than in his or her capacity as a member of the Board of Trustees/Directors or any committee thereof, accept directly or indirectly any consulting, advisory or other compensatory fee from the issuer; or (ii) be an “interested person” of the registrant as defined in Section 2(a)(19) of the Investment Company Act of 1940.
The names of the audit committee financial experts on the registrant’s Audit Committee are set forth below:
John A. Fry
Thomas F. Madison
Janet L. Yeomans
Thomas F. Madison
Janet L. Yeomans
Item 4. Principal Accountant Fees and Services
(a) Audit fees.
The aggregate fees billed for services provided to the registrant by its independent auditors for the audit of the registrant’s annual financial statements and for services normally provided by the independent auditors in connection with statutory and regulatory filings or engagements were $94,300 for the fiscal year ended November 30, 2010.
The aggregate fees billed for services provided to the registrant by its independent auditors for the audit of the registrant’s annual financial statements and for services normally provided by the independent auditors in connection with statutory and regulatory filings or engagements were $85,414 for the fiscal year ended November 30, 2009.
(b) Audit-related fees.
The aggregate fees billed by the registrant’s independent auditors for services relating to the performance of the audit of the registrant’s financial statements and not reported under paragraph (a) of this Item were $0 for the fiscal year ended November 30, 2010.
The aggregate fees billed by the registrant’s independent auditors for services relating to the performance of the audit of the financial statements of the registrant’s investment adviser and other service providers under common control with the adviser and that relate directly to the operations or financial reporting of the registrant were $84,000 for the registrant’s fiscal year ended November 30, 2010. The percentage of these fees relating to services approved by the registrant’s Audit Committee pursuant to the de minimis exception from the pre-approval requirement in Rule 2-01(c)(7)(i)(C) of Regulation S-X was 0%. These audit-related services were as follows: audit procedures performed on Delaware Investments for its consolidation into Macquarie’s financial statements as of March 31, 2010.
The aggregate fees billed by the registrant’s independent auditors for services relating to the performance of the audit of the registrant’s financial statements and not reported under paragraph (a) of this Item were $0 for the fiscal year ended November 30, 2009.
The aggregate fees billed by the registrant’s independent auditors for services relating to the performance of the audit of the financial statements of the registrant’s investment adviser and other service providers under common control with the adviser and that relate directly to the operations or financial reporting of the registrant were $19,074 for the registrant’s fiscal year ended November 30, 2009. The percentage of these fees relating to services approved by the registrant’s Audit Committee pursuant to the de minimis exception from the pre-approval requirement in Rule 2-01(c)(7)(i)(C) of Regulation S-X was 0%. These audit-related services were as follows: issuance of report concerning transfer agent’s system of internal accounting control pursuant to Rule 17Ad-13 of the Securities Exchange Act.
(c) Tax fees.
The aggregate fees billed by the registrant’s independent auditors for tax-related services provided to the registrant were $17,250 for the fiscal year ended November 30, 2010. The percentage of these fees relating to services approved by the registrant’s Audit Committee pursuant to the de minimis exception from the pre-approval requirement in Rule 2-01(c)(7)(i)(C) of Regulation S-X was 0%. These tax-related services were as follows: review of income tax returns and review of annua l excise distribution calculations.
The aggregate fees billed by the registrant’s independent auditors for tax-related services provided to the registrant’s investment adviser and other service providers under common control with the adviser and that relate directly to the operations or financial reporting of the registrant were $10,000 for the registrant’s fiscal year ended November 30, 2010. The percentage of these fees relating to services approved by the registrant’s Audit Committee pursuant to the de minimis exception from the pre-approval requirement in Rule 2-01(c)(7)(i)(C) of Regulation S-X was 0%. These tax-related services were as follows: state and local tax services.
The aggregate fees billed by the registrant’s independent auditors for tax-related services provided to the registrant were $0 for the fiscal year ended November 30, 2009.
The aggregate fees billed by the registrant’s independent auditors for tax-related services provided to the registrant’s adviser and other service providers under common control with the adviser and that relate directly to the operations or financial reporting of the registrant were $0 for the registrant’s fiscal year ended November, 2009.
(d) All other fees.
The aggregate fees billed for all services provided by the independent auditors to the registrant other than those set forth in paragraphs (a), (b) and (c) of this Item were $0 for the fiscal year ended November 30, 2010.
The aggregate fees billed for all services other than those set forth in paragraphs (b) and (c) of this Item provided by the registrant’s independent auditors to the registrant’s adviser and other service providers under common control with the adviser and that relate directly to the operations or financial reporting of the registrant were $0 for the registrant’s fiscal year ended November 30, 2010.
The aggregate fees billed for all services provided by the independent auditors to the registrant other than those set forth in paragraphs (a), (b) and (c) of this Item were $0 for the fiscal year ended November 30, 2009.
The aggregate fees billed for all services other than those set forth in paragraphs (b) and (c) of this Item provided by the registrant’s independent auditors to the registrant’s adviser and other service providers under common control with the adviser and that relate directly to the operations or financial reporting of the registrant were $0 for the registrant’s fiscal year ended November 30, 2009.
(e) The registrant’s Audit Committee has established pre-approval policies and procedures as permitted by Rule 2-01(c)(7)(i)(B) of Regulation S-X (the “Pre-Approval Policy”) with respect to services provided by the registrant’s independent auditors. Pursuant to the Pre-Approval Policy, the Audit Committee has pre-approved the services set forth in the table below with respect to the registrant up to the specified fee limits. Certain fee limits are based on aggregate fees to the registrant and other registrants within the Delaware Investments Family of Funds.
| Service | Range of Fees |
| Audit Services | |
| Statutory audits or financial audits for new Funds | up to $25,000 per Fund |
| Services associated with SEC registration statements (e.g., Form N-1A, Form N-14, etc.), periodic reports and other documents filed with the SEC or other documents issued in connection with securities offerings (e.g., comfort letters for closed-end Fund offerings, consents), and assistance in responding to SEC comment letters | up to $10,000 per Fund |
| Consultations by Fund management as to the accounting or disclosure treatment of transactions or events and/or the actual or potential impact of final or proposed rules, standards or interpretations by the SEC, FASB, or other regulatory or standard-setting bodies (Note: Under SEC rules, some consultations may be considered “audit-related services” rather than “audit services”) | up to $25,000 in the aggregate |
| Audit-Related Services | |
| Consultations by Fund management as to the accounting or disclosure treatment of transactions or events and /or the actual or potential impact of final or proposed rules, standards or interpretations by the SEC, FASB, or other regulatory or standard-setting bodies (Note: Under SEC rules, some consultations may be considered “audit services” rather than “audit-related services”) | up to $25,000 in the aggregate |
| Tax Services | |
| U.S. federal, state and local and international tax planning and advice (e.g., consulting on statutory, regulatory or administrative developments, evaluation of Funds’ tax compliance function, etc.) | up to $25,000 in the aggregate |
| U.S. federal, state and local tax compliance (e.g., excise distribution reviews, etc.) | up to $5,000 per Fund |
| Review of federal, state, local and international income, franchise and other tax returns | up to $5,000 per Fund |
Under the Pre-Approval Policy, the Audit Committee has also pre-approved the services set forth in the table below with respect to the registrant’s investment adviser and other entities controlling, controlled by or under common control with the investment adviser that provide ongoing services to the registrant (the “Control Affiliates”) up to the specified fee limit. This fee limit is based on aggregate fees to the investment adviser and its Control Affiliates.
| Service | Range of Fees |
| Non-Audit Services | |
| Services associated with periodic reports and other documents filed with the SEC and assistance in responding to SEC comment letters | up to $10,000 in the aggregate |
The Pre-Approval Policy requires the registrant’s independent auditors to report to the Audit Committee at each of its regular meetings regarding all services initiated since the last such report was rendered, including those services authorized by the Pre-Approval Policy.
(f) Not applicable.
(g) The aggregate non-audit fees billed by the registrant’s independent auditors for services rendered to the registrant and to its investment adviser and other service providers under common control with the adviser were $0 and $238,286 for the registrant’s fiscal years ended November 30, 2010 and November 30, 2009, respectively.
(h) In connection with its selection of the independent auditors, the registrant’s Audit Committee has considered the independent auditors’ provision of non-audit services to the registrant’s investment adviser and other service providers under common control with the adviser that were not required to be pre-approved pursuant to Rule 2-01(c)(7)(ii) of Regulation S-X. The Audit Committee has determined that the independent auditors’ provision of these services is compatible with maintaining the auditors’ independence.
Item 5. Audit Committee of Listed Registrants
Not applicable.
Item 6. Investments
(a) Included as part of report to shareholders filed under Item 1 of this Form N-CSR.
(b) Divestment of securities in accordance with Section 13(c) of the Investment Company Act of 1940.
Not applicable.
Item 7. Disclosure of Proxy Voting Policies and Procedures for Closed-End Management Investment Companies
Not applicable.
Item 8. Portfolio Managers of Closed-End Management Investment Companies
Not applicable.
Item 9. Purchases of Equity Securities by Closed-End Management Investment Company and Affiliated Purchasers
Not applicable.
Item 10. Submission of Matters to a Vote of Security Holders
Not applicable.
Item 11. Controls and Procedures
The registrant’s principal executive officer and principal financial officer have evaluated the registrant’s disclosure controls and procedures within 90 days of the filing of this report and have concluded that they are effective in providing reasonable assurance that the information required to be disclosed by the registrant in its reports or statements filed under the Securities Exchange Act of 1934 is recorded, processed, summarized and reported within the time periods specified in the rules and forms of the Securities and Exchange Commission.
There were no significant changes in the registrant’s internal control over financial reporting that occurred during the second fiscal quarter of the period covered by the report to stockholders included herein (i.e., the registrant’s fourth fiscal quarter) that have materially affected, or are reasonably likely to materially affect, the registrant’s internal control over financial reporting.
Item 12. Exhibits
(a) (1) Code of Ethics
Not applicable.
(2) Certifications of Principal Executive Officer and Principal Financial Officer pursuant to Rule 30a-2 under the Investment Company Act of 1940 are attached hereto as Exhibit 99.CERT.
(3) Written solicitations to purchase securities pursuant to Rule 23c-1 under the Securities Exchange Act of 1934.
Not applicable.
(b) Certifications pursuant to Section 906 of the Sarbanes-Oxley Act of 2002 are furnished herewith as Exhibit 99.906CERT.
SIGNATURES
Pursuant to the requirements of the Securities Exchange Act of 1934 and the Investment Company Act of 1940, the registrant has duly caused this report to be signed on its behalf, by the undersigned, thereunto duly authorized.
Name of Registrant: Delaware Group® Global & International Funds
| PATRICK P. COYNE | |
| By: | Patrick P. Coyne |
| Title: | Chief Executive Officer |
| Date: | January 28, 2011 |
Pursuant to the requirements of the Securities Exchange Act of 1934 and the Investment Company Act of 1940, this report has been signed below by the following persons on behalf of the registrant and in the capacities and on the dates indicated.
| PATRICK P. COYNE | |
| By: | Patrick P. Coyne |
| Title: | Chief Executive Officer |
| Date: | January 28, 2011 |
| RICHARD SALUS | |
| By: | Richard Salus |
| Title: | Chief Financial Officer |
| Date: | January 28, 2011 |