UNITED STATES SECURITIES AND EXCHANGE COMMISSION
Washington, D.C. 20549
FORM N-CSR
CERTIFIED SHAREHOLDER REPORT OF REGISTERED MANAGEMENT
INVESTMENT COMPANIES
| Investment Company Act file number: | 811-06324 |
| |
| Exact name of registrant as specified in charter: | Delaware Group® Global & International Funds |
| |
| Address of principal executive offices: | 2005 Market Street |
| Philadelphia, PA 19103 |
| |
| Name and address of agent for service: | David F. Connor, Esq. |
| 2005 Market Street |
| Philadelphia, PA 19103 |
| |
| Registrant’s telephone number, including area code: | (800) 523-1918 |
| |
| Date of fiscal year end: | November 30 |
| |
| Date of reporting period: | November 30, 2012 |
Item 1. Reports to Stockholders

Annual report Delaware Emerging Markets Fund
Delaware Global Value Fund
Delaware International Value Equity Fund November 30, 2012 Global / international equity mutual funds |
Carefully consider the Funds’ investment objectives, risk factors, charges, and expenses before investing. This and other information can be found in the Funds’ prospectuses and, if available, their summary prospectuses, which may be obtained by visiting delawareinvestments.com or calling 800 523-1918. Investors should read the prospectus and, if available, the summary prospectus carefully before investing. |
You can obtain shareholder reports and prospectuses online instead of in the mail.
Visit delawareinvestments.com/edelivery. |
Experience Delaware Investments
Delaware Investments is committed to the pursuit of consistently superior asset management and unparalleled client service. We believe in our investment processes, which seek to deliver consistent results, and in convenient services that help add value for our clients.
If you are interested in learning more about creating an investment plan, contact your financial advisor.
You can learn more about Delaware Investments or obtain a prospectus for Delaware International Value Equity Fund, Delaware Emerging Markets Fund, and Delaware Global Value Fund at delawareinvestments.com.
Manage your investments online
- 24-hour access to your account information
- Obtain share prices
- Check your account balance and recent transactions
- Request statements or literature
- Make purchases and redemptions
Delaware Management Holdings, Inc. and its subsidiaries (collectively known by the marketing name of Delaware Investments) are wholly owned subsidiaries of Macquarie Group Limited, a global provider of banking, financial, advisory, investment and funds management services.
Investments in Delaware International Value Equity Fund, Delaware Emerging Markets Fund, and Delaware Global Value Fund are not and will not be deposits with or liabilities of Macquarie Bank Limited ABN 46 008 583 542 and its holding companies, including their subsidiaries or related companies (Macquarie Group), and are subject to investment risk, including possible delays in repayment and loss of income and capital invested. No Macquarie Group company guarantees or will guarantee the performance of the Funds, the repayment of capital from the Funds, or any particular rate of return.
| Table of contents | |
| Portfolio management review | 1 |
| Performance summaries | 10 |
| Disclosure of Fund expenses | 20 |
| Security type/country and sector allocations | 23 |
| Statements of net assets | 29 |
| Statements of operations | 50 |
| Statements of changes in net assets | 52 |
| Financial highlights | 58 |
| Notes to financial statements | 86 |
| Report of independent registered | |
| public accounting firm | 102 |
| Other Fund information | 103 |
| Board of trustees/directors and | |
| officers addendum | 110 |
| About the organization | 118 |
Unless otherwise noted, views expressed herein are current as of Nov. 30 2012, and subject to change.
Funds are not FDIC insured and are not guaranteed. It is possible to lose the principal amount invested.
Mutual fund advisory services provided by Delaware Management Company, a series of Delaware Management Business Trust, which is a registered investment advisor. Delaware Investments, a member of Macquarie Group, refers to Delaware Management Holdings, Inc. and its subsidiaries, including the Funds’ distributor, Delaware Distributors, L.P. Macquarie Group refers to Macquarie Group Limited and its subsidiaries and affiliates worldwide.
© 2013 Delaware Management Holdings, Inc.
All third-party marks cited are the property of their respective owners.
| Portfolio management review | |
| Delaware International Value Equity Fund | December 11, 2012 |
| Performance preview (for the year ended November 30, 2012) | | | |
| Delaware International Value Equity Fund (Class A shares) | 1-year return | | +10.25 | % |
| MSCI EAFE Index (gross) | 1-year return | | +13.16 | % |
| MSCI EAFE Index (net) | 1-year return | | +12.60 | % |
Past performance does not guarantee future results.
For complete, annualized performance for Delaware International Value Equity Fund, please see the table on page 10.
The performance of Class A shares excludes the applicable sales charge and reflects the reinvestment of all distributions.
Index performance returns do not reflect any management fees, transaction costs, or expenses. Indices are unmanaged and one cannot invest directly in an index.
International equity markets managed solid gains during the Fund’s fiscal year ended Nov. 30, 2012, despite a volatile set of economic and political circumstances. The euro zone in particular lurched from one crisis to another, triggering sharp shifts in investor sentiment and risk aversion. While not as dramatic as the troubles in Europe, the United States nonetheless remained trapped in a slow-growth holding pattern, even as the United Kingdom and Japan flirted with outright recession. Emerging markets countries were not immune to the malaise as China’s struggles to emerge from a growth slowdown adversely affected these countries’ economies.
Unlike most business cycles, when recurrent macroeconomic patterns and company-specific issues affect stock prices, equity markets remained deeply dependent on policy interventions, especially by central banks. As the Fund’s fiscal year began, stocks were slumping amid fears about the future of the European Monetary Union. Those worries soon dissipated, however, when the new president of the European Central Bank (ECB), Mario Draghi, initiated the first of two longer-term funding operations designed to relieve stresses on governments and banks.
After a strong rally stalled and stocks sustained an even more severe downturn during the spring and early summer of 2012, Draghi again calmed the equity waters by proclaiming that the ECB would do whatever it takes to save the euro. Indeed, the broad consensus among policy makers and investors that the euro must be saved supported investor sentiment amid turbulent economic and credit conditions. The U.S. Federal Reserve also did its part, launching a third round of quantitative easing that was open-ended with regard to time. Cash infusions by global central banks mostly overcame the negative impact of continued fiscal imbalances and political dysfunction in many countries, helping international stocks to close the fiscal year near their highs for this period.
Fund performance
For the fiscal year ended Nov. 30, 2012, Delaware International Value Equity Fund (Class A shares) returned +10.25% at net asset value and +3.94% at maximum offer price (both figures reflect all distributions reinvested). The Fund’s benchmark, the MSCI EAFE Index (net), returned +12.60% for the same period. For complete, annualized performance of Delaware International Value Equity Fund, please see the table on page 10.
1
Portfolio management review
Delaware International Value Equity Fund
The unusually policy-driven characteristics of the world economic and political environment played a large role in the Fund’s relative performance. For example, risk-averse investors took refuge in so-called “safe-haven” sectors such as consumer staples and healthcare. Those sectors outperformed their more cyclical, higher-risk counterparts, even during periods when the economic skies seemed to brighten. The sustained demand for perceived safe-haven assets caused valuations within the group to reach levels that we deemed overvalued, given our emphasis on companies whose shares trade below estimates of intrinsic value. Similarly, we remain concerned about the lack of transparency within the financial sector, and continue to hold an underweight position in the sector relative to the benchmark. Our underweight exposure to financials, as well as adverse stock selection in the financial and consumer staples sectors, detracted from performance. Stock selection was an overall contributor to relative performance, particularly within the industrial, consumer discretionary, utility, materials, and energy sectors.
On a regional basis, positive allocation to Japan and the U.K. was more than offset by exposure to Canada and emerging markets. Strong stock selection in the Asia-Pacific region and Japan more than offset adverse stock selection in the U.K. and the Europe ex-eurozone region.
The Fund benefited from paring back exposure to several nonfinancial areas of the euro zone, while still maintaining an allocation to companies in which we maintain a high degree of conviction.
The Fund also benefited from adding several new positions, such as the Danish brewer Carlsberg and the Norwegian offshore energy service business Subsea 7, each of which generated positive relative performance. Techtronic Industries was the Fund’s top performer, climbing approximately 120% during the fiscal year. The company is a Hong Kong-domiciled leader in power tools whose shares were once selling at a steep discount to Black & Decker, its primary competitor. As a major player in the American home improvement market, Techtronic benefited from the recent firming in U.S. housing prices. Though we remain overweight the stock, we nonetheless trimmed the position as it rallied. Our holdings in the French outsourcing company Teleperformance was also a strong contributor. Importantly, the lackluster French market represents only a small portion of the company’s revenues, the bulk of which come from staffing product support centers worldwide for a variety of industries, including telecommunications and banking. We used a broad selloff in the euro zone market to increase exposure to the stock, a move that was rewarded when Teleperformance shares climbed more than 80% during the Fund’s fiscal year. With its strong balance sheet and numerous competitive advantages, we view Teleperformance as a classic example of how market turbulence caused by macroeconomic factors has the potential to create profitable opportunities at the company level.
Not all of our stocks performed well. The Fund’s position in the U.K. supermarket retailer Tesco lagged the benchmark,
2
especially early in the Fund’s fiscal year after management provided earnings guidance that fell short of consensus expectations. Its share price has since stabilized and has begun to inch higher, and we continue to hold the stock. The French wireless provider Vivendi also detracted from relative performance; revenues were severely undermined by the emergence of a fourth competitor. The increased competition sparked a price war in the wireless sector, and we have since exited the position.
Another key player in the wireless space, Nokia, also sharply underperformed — declining more than 57% — as it continued to lose market share to aggressive rivals Samsung and Apple. Given the lack of a clear breakthrough with rollout of its new Windows 8 Smartphone and an alarming falloff in Nokia’s older, lower-margin legacy platform, we decided to liquidate our Nokia position.
As the Fund’s fiscal year ended, the Fund’s largest country allocations were to France, Japan, the U.K., Canada, and Switzerland. Relative to the MSCI EAFE Index, our positions in France and Canada each represented a meaningful overweight while Fund exposures to the U.K., Australia, and Germany were underweights. We emphasize, however, that these allocations are the result of our bottom-up stock selection process. The Fund remains focused on risk management and on our stock selection process that seeks to identify strong businesses whose shares appear attractively priced relative to traditional valuation metrics, regardless of where they are domiciled.
3
| Portfolio management review | | |
| Delaware Emerging Markets Fund | | December 11, 2012 |
| Performance preview (for the year ended November 30, 2012) | | | |
| Delaware Emerging Markets Fund (Class A shares) | 1-year return | | +5.67 | % |
| MSCI Emerging Markets Index (gross) | 1-year return | | +11.73 | % |
| MSCI Emerging Markets Index (net) | 1-year return | | +11.35 | % |
Past performance does not guarantee future results.
For complete, annualized performance for Delaware Emerging Markets Fund, please see the table on page 13.
The performance of Class A shares excludes the applicable sales charge and reflects the reinvestment of all distributions.
Index performance returns do not reflect any management fees, transaction costs, or expenses. Indices are unmanaged and one cannot invest directly in an index.
Emerging markets posted solid overall gains during the Fund’s fiscal year ended Nov. 30, 2012, although the asset class mostly lagged its developed-market counterparts. In a clear reflection of the unsettled global economic and political environment, however, volatility was elevated and returns from individual markets were highly variable. Equity markets in Mexico, Singapore, Thailand, Hong Kong, and India generally performed strongly, while larger developing markets, such as Brazil and China, declined during this period.
As the Fund’s fiscal year began, many investors were shedding risk world-wide amid indications that the 17-country euro zone was on the verge of breaking apart. The failure of the single currency experiment might have triggered a synchronized global recession with highly destabilizing implications for emerging markets. However, after the European Central Bank (ECB) launched the first of two loan programs intended to give governments and banks more breathing room, emerging-market stocks climbed strongly. In early March, another bout of risk aversion and worry focused on slowing growth in the United States, upon which many developing nations depend for customers. China was also a cause for concern, as authorities dealing with a once-a-decade leadership change struggled to restart a slumping economy without triggering inflation or creating a property bubble.
Emerging-market stocks bottomed and began to rally in June 2012 as it became apparent to many that global economic conditions had grown sufficiently dire as to make additional central bank easing inevitable. Although this bull run lost steam in the fall, the combination of abundant liquidity and signs of economic progress in the U.S. helped most emerging markets close the Fund’s fiscal year near their September highs.
Fund performance
For the fiscal year ended Nov. 30, 2012, Delaware Emerging Markets Fund (Class A shares)returned +5.67% at net asset value and -0.43% at maximum offer price (both returns assume reinvestment of all distributions). The Fund’s benchmark, the MSCI Emerging Markets Index (net), advanced by 11.35% for the same period. For complete, annualized performance of Delaware Emerging Markets Fund, please see the table on page 13.
4
With regard to country allocations, the Fund benefited from its positioning in South Korea, Mexico, and Thailand while its allocation in China, Brazil, and South Africa mostly detracted from relative performance. Among individual companies Yahoo! was a contributor to Fund performance. Although Yahoo! shares languished for much of the fiscal year due to investor dissatisfaction with management’s inability to unlock the value of its Chinese internet assets, Yahoo! stock climbed significantly beginning in September 2012 after CEO Carol Bartz was replaced by veteran Google executive Marissa Ann Mayer. The Mexican cement producer Cemex also generated strong outperformance for the Fund on the basis of improved financials and signs of recovery in the U.S. housing market. Finally, the Fund’s position in Hon Hai Precision Industry, a Taiwanese producer of business and consumer electronic goods, contributed to relative performance due to strong end-user demand, especially after the unprecedented monetary easing moves by the ECB in the summer of 2012 seemed to allay fears of a meltdown in the key European export market.
Meanwhile, U.S.-based Avon Products detracted from performance. The company has been the focus of a lengthy Securities and Exchange Commission investigation into foreign bribery charges, as its earnings have consistently fallen short of consensus expectations. Petroleo Brasileiro SA also underperformed; the large Brazil-based integrated oil and gas producer suffered from flat diesel and gasoline prices in its domestic market, tight refining margins, and declining overall output due to heightened maintenance standards the Brazilian government imposed. Lastly, the Argentinian integrated energy company YPF detracted from the Fund’s relative performance after the government nationalized the business in an attempt to increase investment in energy resources. After plunging sharply lower from late January through mid-June 2012, the company’s shares traded roughly flat over the remainder of the fiscal year and are currently valued at only about four times its estimated 2012 earnings.
The Fund’s portfolio turnover remained relatively low — reflecting our investment philosophy that favors companies with long-term franchise sustainability, we nonetheless made several notable transactions.
During the second quarter of 2012, we liquidated the Fund’s position in the OTP Bank, Hungary’s leading banking franchise, because of our concern about the economic outlook for Hungary and the countries where it does business. Unemployment in Hungary is 10% and gross domestic product is expected to fall.
Also in the second quarter, we sold our stake in the Chinese advertising company Focus Media Holdings, due to the economic slowdown in China. We also liquidated the Fund’s position in U.S.-based Archer Daniels Midland after management lowered forward earnings guidance due to flagging demand for its agrochemical products.
Later in the Fund’s fiscal year, we eliminated the Fund’s holdings in Jiayuan.com International, an online Chinese dating service, because of rising competition in this sector. Finally, we liquidated the Fund’s stake in the Malaysian conglomerate Oriental Holdings after the company’s share price attained our estimate of intrinsic value.
5
Portfolio management review
Delaware Emerging Markets Fund
As the fiscal year ended, the Fund’s largest country allocations were in South Korea, Brazil, China, the U.S., Russia, Mexico, Taiwan, South Africa, India, and Thailand. The size of our South Korean and Brazilian holdings represent a large overweight in the MSCI Emerging Markets Index; conversely, we are significantly underweight in Taiwan, South Africa, and India, and maintained a close-to-neutral weighting in China and Russia.
6
| Delaware Global Value Fund | December 11, 2012 |
| Performance preview (for the year ended November 30, 2012) | | | |
| Delaware Global Value Fund (Class A shares) | 1-year return | | +9.65 | % |
| MSCI World Index (gross) | 1-year return | | +14.31 | % |
| MSCI World Index (net) | 1-year return | | +13.62 | % |
Past performance does not guarantee future results.
For complete, annualized performance for Delaware Global Value Fund, please see the table on page 16.
The performance of Class A shares excludes the applicable sales charge and reflects the reinvestment of all distributions.
Index performance returns do not reflect any management fees, transaction costs, or expenses. Indices are unmanaged and one cannot invest directly in an index.
Global equity markets managed solid gains during the Fund’s fiscal year ended Nov. 30, 2012, despite a volatile set of economic and political circumstances. The euro zone in particular lurched from one crisis to another, triggering sharp shifts in investor sentiment and risk aversion. While not as dramatic as the troubles in Europe, the United States nonetheless remained trapped in a slow-growth holding pattern, even as the United Kingdom and Japan flirted with outright recession. Emerging markets were not immune to the malaise as China’s struggles to emerge from a growth slowdown adversely affected these countries’ economies.
Unlike most business cycles, when recurrent macroeconomic patterns and company-specific issues affect stock prices, equity markets remained deeply dependent on policy interventions, especially by central banks. As the Fund’s fiscal year began, stocks were slumping amid fears that Europe’s experiment with monetary union was about to end badly. Those worries soon dissipated, however, when the new president of the European Central Bank (ECB), Mario Draghi, initiated the first of two longer-term funding operations designed to relieve stresses on governments and banks.
After a strong rally stalled and stocks sustained an even more severe downturn during the spring and early summer of 2012, Draghi again calmed the equity waters by proclaiming that the ECB would do “whatever it takes” to save the euro. Indeed, the broad consensus among policy makers and investors that the euro must be saved supported investor sentiment amid turbulent economic and credit conditions. The U.S. Federal Reserve also did its part, launching a third round of quantitative easing, dubbed “QE Infinity” for its open-ended nature. Cash infusions by global central banks mostly overcame the negative impact of continued fiscal imbalances and political dysfunction in many countries, helping international stocks to close the fiscal year near their highs for this period.
Fund performance
For the fiscal year ended Nov. 30, 2012, Delaware Global Value Fund (Class A shares) returned +9.65% at net asset value and +3.31% at maximum offer price (both figures reflect all distributions reinvested). The Fund’s benchmark, the MSCI World Index (net), returned +13.62% for the same period. For complete, annualized performance of Delaware Global Value Fund, please see the table on page 16.
7
Portfolio management review
Delaware Global Value Fund
The unusually policy-driven characteristics of the world economic and political environment played a large role in the Fund’s relative performance. For example, risk-averse investors took refuge in so-called “safe-haven” sectors such as consumer staples and healthcare. Those sectors outperformed their more cyclical, higher-risk counterparts, even during periods when the economic skies seemed to brighten. The sustained demand for perceived safe-haven assets caused valuations within the group to reach levels that we deemed overvalued, given our emphasis on companies whose shares trade below estimates of intrinsic value. Similarly, we remain concerned about the lack of transparency within the financial sector, and continue to hold an underweight position in the sector relative to the benchmark.
Adverse stock selection detracted from the Fund’s relative returns. Strong stock selection in the consumer discretionary, industrials, and utilities sectors was more than offset by weak stock selection in information technology, consumer staples, materials, and financials. Overall sector allocation was positive helped by the energy, consumer discretionary, information technology, utilities, and healthcare sectors, which had a positive effect and offset adverse allocation to the financials, materials, and telecommunication sectors.
The Fund benefited from an underweight exposure to the struggling Japanese equity market and an overweight exposure to the Europe ex-eurozone region, but those gains were offset by an exposure to emerging markets and an underweight allocation to Asia-Pacific stocks (excluding Japan). Strong stock selection in the Asia-Pacific region and Japan more than offset adverse stock selection in the U.S. the U.K., and the Europe ex-eurozone region.
The Fund also benefited from adding several new positions, such as the Danish brewer Carlsberg and the Norwegian offshore energy service business Subsea 7, each of which generated positive relative performance. Techtronic Industries was the Fund’s top performer, climbing approximately 120% during the fiscal year. The company is a Hong Kong-domiciled leader in power tools whose shares were once selling at a steep discount to Black & Decker, its primary competitor. As a major player in the American home improvement market, Techtronic benefited from the recent firming in U.S. housing prices. Following its strong outperformance, we exited the position in late November. Our holdings in the French outsourcing company Teleperformance was also a strong contributor. Importantly, the lackluster French market represents only a small portion of the company’s revenues, the bulk of which come from staffing product support centers worldwide for a variety of industries, including telecommunications and banking. We used a broad selloff in the euro-zone market to increase exposure to the stock, a move that was rewarded when Teleperformance shares climbed more than 80% during the Fund’s fiscal year. With its strong balance sheet and numerous competitive advantages, we view Teleperformance as a classic example of how market turbulence caused by macroeconomic factors has the potential to create profitable opportunities at the company level.
8
Naturally, not all of our stock selections performed well. The Fund’s position in the U.K. supermarket retailer Tesco lagged the benchmark, especially early in the Fund’s fiscal year after management provided earnings guidance that fell short of consensus expectations. A major player in the wireless space, Nokia, also sharply underperformed, declining more than 57% as it continued to lose market share to aggressive rivals Samsung and Apple. Lacking a clear breakthrough from the rollout of its new Windows8 smartphone — in combination with an alarming falloff in Nokia’s older, lower-margin legacy platform — we decided to liquidate the position. Newmont Mining underperformed due to a decline in net income from lower volumes and higher cash costs. The decline was also driven by higher cash taxes and negative working capital, specifically, higher inventories and stockpiles. However, we have learned from other gold mining stocks that we hold that it is not necessarily a bad thing to have a good stockpile on hand to keep operations running smoothly quarter to quarter.
As the Fund’s fiscal year ended, the Fund’s largest country allocations were to the U.S., France, Japan, and the U.K. Relative to the MSCI EAFE Index, our positions in France represented a meaningful overweight. The Fund’s exposure to consumer discretionary stocks relative to the benchmark remains a significant overweight. We emphasize, however, that these allocations are the result of our bottom-up stock selection process. The Fund remains focused on risk management and on our stock selection process that identifies what we view as strong businesses whose shares appear to be attractively priced relative to traditional valuation metrics, regardless of where they are domiciled.
9
Performance summaries
| Delaware International Value Equity Fund | November 30, 2012 |
The performance data quoted represent past performance; past performance does not guarantee future results. Investment return and principal value will fluctuate so your shares, when redeemed, may be worth more or less than their original cost. Please obtain the performance data current for the most recent month end by calling 800 523-1918 or visiting our website at delawareinvestments.com/performance. Current performance may be lower or higher than the performance data quoted.
| Fund performance1,2 | Average annual total returns through November 30, 2012 |
| | | | | | | | | Lifetime | |
| | | | | | | | (if less than | |
| | 1 year | | 5 years | | 10 years | | 10 years) | |
| Class A (Est. Oct. 31, 1991) | | | | | | | | | |
| Excluding sales charge | | +10.25% | | -4.41% | | +6.83% | | n/a | |
| Including sales charge | | +3.94% | | -5.54% | | +6.20% | | n/a | |
| Class B (Est. Sept. 6, 1994) | | | | | | | | | |
| Excluding sales charge | | +9.53% | | -5.09% | | +6.23% | | n/a | |
| Including sales charge | | +5.53% | | -5.48% | | +6.23% | | n/a | |
| Class C (Est. Nov. 29, 1995) | | | | | | | | | |
| Excluding sales charge | | +9.53% | | -5.08% | | +6.10% | | n/a | |
| Including sales charge | | +8.53% | | -5.08% | | +6.10% | | n/a | |
| Class R (Est. June 2, 2003) | | | | | | | | | |
| Excluding sales charge | | +10.13% | | -4.59% | | n/a | | +6.01% | |
| Including sales charge | | +10.13% | | -4.59% | | n/a | | +6.01% | |
| Institutional Class (Est. Nov. 9, 1992) | | | | | | | | | |
| Excluding sales charge | | +10.59% | | -4.13% | | +7.15% | | n/a | |
| Including sales charge | | +10.59% | | -4.13% | | +7.15% | | n/a | |
1 Returns reflect the reinvestment of all distributions and are presented both with and without the applicable sales charges described below. Returns do not reflect the deduction of taxes the shareholder would pay on Fund distributions or redemptions of Fund shares.
Expense limitations were in effect for certain classes during some or all of the periods shown in the “Fund performance” chart. The current expenses for each class are listed on the “Fund expense ratios” table on page 11. Performance would have been lower had expense limitations not been in effect.
Class A shares are sold with a maximum front-end sales charge of 5.75%, and have an annual distribution and service fee of 0.30% of average daily net assets. This fee has been contractually limited to 0.25% of average daily net assets from March 29, 2012 through March 29, 2013. Performance for Class A shares, excluding sales charges, assumes that no front-end sales charge applied.
Class B shares may be purchased only through dividend reinvestment and certain permitted exchanges as described in the prospectus. Please see the prospectus for additional information on Class B shares. Class B shares
10
have a contingent deferred sales charge that declines from 4.00% to zero depending on the period of time the shares are held. They are also subject to an annual distribution and service fee of 1.00% of average daily net assets. Class B shares will automatically convert to Class A shares on a quarterly basis approximately eight years after purchase. Ten-year and lifetime performance figures for Class B shares reflect conversion to Class A shares after approximately eight years.
Class C shares are sold with a contingent deferred sales charge of 1.00% if redeemed during the first 12 months. They are also subject to an annual distribution and service fee of 1.00% of average daily net assets.
Performance for Class B and C shares, excluding sales charges, assumes either that contingent deferred sales charges did not apply or that the investment was not redeemed.
Class R shares are available only for certain retirement plan products. They are sold without a sales charge and have an annual distribution and service fee of 0.60% of average daily net assets, which has been limited contractually to 0.50% from March 29, 2012 through March 29, 2013.
Institutional Class shares are available without sales or asset-based distribution charges only to certain eligible institutional accounts.
The “Fund performance” table and the “Performance of a $10,000 investment” graph do not reflect the deduction of taxes the shareholder would pay on Fund distributions or redemptions of Fund shares.
International investments entail risks not ordinarily associated with U.S. investments including fluctuation in currency values, differences in accounting principles, or economic or political instability in other nations.
Investing in emerging markets can be riskier than investing in established foreign markets due to increased volatility and lower trading volume.
2 The Fund’s expense ratios, as described in the most recent prospectus, are disclosed in the following “Fund expense ratios” table. Delaware Investments has agreed to reimburse certain expenses and/or waive certain fees in order to prevent total fund operating expenses (excluding certain fees and expenses) from exceeding 1.21% of the Fund’s average daily net assets from March 29, 2012 through March 29, 2013. Please see the most recent prospectus and any applicable supplement(s) for additional information on these fee waivers and/or reimbursements.
| Fund expense ratios | | Class A | | Class B | | Class C | | Class R | | Institutional Class |
| Total annual operating expenses | | | | | | | | | | |
| (without fee waivers) | | 1.59% | | 2.29% | | 2.29% | | 1.89% | | 1.29% |
| Net expenses | | | | | | | | | | |
| (including fee waivers, if any) | | 1.46% | | 2.21% | | 2.21% | | 1.71% | | 1.21% |
| Type of waiver | | Contractual | | Contractual | | Contractual | | Contractual | | Contractual |
11
Performance summaries
Delaware International Value Equity Fund
Performance of a $10,000 investment1
Average annual total returns from Nov. 30, 2002, through Nov. 30, 2012
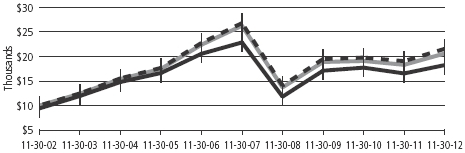
| For period beginning Nov. 30, 2002, through Nov. 30, 2012 | Starting value | Ending value |
| | MSCI EAFE Index (gross) | $10,000 | $21,566 |
| | MSCI EAFE Index (net) | $10,000 | $20,618 |
| | Delaware International Value Equity Fund —
Class A Shares | $9,425 | $18,249 |
1 The “Performance of a $10,000 investment” graph assumes $10,000 invested in Class A shares of the Fund on Nov. 30, 2002, and includes the effect of a 5.75% front-end sales charge and the reinvestment of all distributions. The graph does not reflect the deduction of taxes the shareholders would pay on Fund distributions or redemptions of Fund shares. Expense limitations were in effect for some or all of the periods shown. Performance would have been lower had expense limitations not been in effect. Current expenses are listed in the “Fund expense ratios” table on page 11. Please note additional details on pages 10 through 12.
The chart also assumes $10,000 invested in the MSCI EAFE Index as of Nov. 30, 2002. The MSCI EAFE Index measures equity market performance across developed market countries in Europe, Australasia, and the Far East. Index “gross” return approximates the maximum possible dividend reinvestment. Index “net” return approximates the minimum possible dividend reinvestment, after deduction of withholding tax at the highest possible rate.
Index performance returns do not reflect any management fees, transaction costs, or expenses. Indices are unmanaged and one cannot invest directly in an index. Past performance is not a guarantee of future results.
Performance of other Fund classes will vary due to different charges and expenses.
| | Nasdaq symbols | | CUSIPs | |
| Class A | | | DEGIX | | | 245914106 | |
| Class B | | | DEIEX | | | 245914700 | |
| Class C | | | DEGCX | | | 245914858 | |
| Class R | | | DIVRX | | | 245914577 | |
| Institutional Class | | | DEQIX | | | 245914403 | |
12
| Delaware Emerging Markets Fund | November 30, 2012 |
The performance data quoted represent past performance; past performance does not guarantee future results. Investment return and principal value will fluctuate so your shares, when redeemed, may be worth more or less than their original cost. Please obtain the performance data current for the most recent month end by calling 800 523-1918 or visiting our website at delawareinvestments.com/performance. Current performance may be lower or higher than the performance data quoted.
| Fund performance1,2 | Average annual total returns through November 30, 2012 |
| | | | | | | | Lifetime | |
| | | | | | | | | (if less than | |
| | | 1 year | | 5 years | | 10 years | | 10 years) | |
| Class A (Est. June 10, 1996) | | | | | | | | | |
| Excluding sales charge | | +5.67% | | -1.98% | | +16.14% | | n/a | |
| Including sales charge | | -0.43% | | -3.14% | | +15.46% | | n/a | |
| Class B (Est. June 10, 1996) | | | | | | | | | |
| Excluding sales charge | | +4.84% | | -2.70% | | +15.45% | | n/a | |
| Including sales charge | | +0.84% | | -3.00% | | +15.45% | | n/a | |
| Class C (Est. June 10, 1996) | | | | | | | | | |
| Excluding sales charge | | +4.85% | | -2.71% | | +15.29% | | n/a | |
| Including sales charge | | +3.85% | | -2.71% | | +15.29% | | n/a | |
| Class R (Est. Aug. 31, 2009) | | | | | | | | | |
| Excluding sales charge | | +5.41% | | n/a | | n/a | | +5.93% | |
| Including sales charge | | +5.41% | | n/a | | n/a | | +5.93% | |
| Institutional Class (Est. June 10, 1996) | | | | | | | | | |
| Excluding sales charge | | +5.86% | | -1.75% | | +16.43% | | n/a | |
| Including sales charge | | +5.86% | | -1.75% | | +16.43% | | n/a | |
1 Returns reflect the reinvestment of all distributions and are presented both with and without the applicable sales charges described below. Returns do not reflect the deduction of taxes the shareholder would pay on Fund distributions or redemptions of Fund shares.
Expense limitations were in effect for certain classes during some or all of the periods shown in the “Fund performance” chart. The current expenses for each class are listed on the “Fund expense ratios” table on page 14. Performance would have been lower had expense limitations not been in effect.
Class A shares are sold with a maximum front-end sales charge of 5.75%, and have an annual distribution and service fee of 0.30% of average daily net assets. This fee has been contractually limited to 0.25% of average daily net assets from March 29, 2012 through March 29, 2013. Performance for Class A shares, excluding sales charges, assumes that no front-end sales charge applied.
Class B shares may be purchased only through dividend reinvestment and certain permitted exchanges as described in the prospectus. Please see the prospectus for additional information on Class B shares. Class B shares have a contingent deferred sales charge that
13
Performance summaries
Delaware Emerging Markets Fund
declines from 4.00% to zero depending on the period of time the shares are held. They are also subject to an annual distribution and service fee of 1.00% of average daily net assets. Class B shares will automatically convert to Class A shares on a quarterly basis approximately eight years after purchase. Ten-year and lifetime performance figures for Class B shares reflect conversion to Class A shares after approximately eight years.
Class C shares are sold with a contingent deferred sales charge of 1.00% if redeemed during the first 12 months. They are also subject to an annual distribution and service fee of 1.00% of average daily net assets.
Performance for Class B and C shares, excluding sales charges, assumes either that contingent deferred sales charges did not apply or that the investment was not redeemed.
Class R shares are available only for certain retirement plan products. They are sold without a sales charge and have an annual distribution and service fee of 0.60% of average daily net assets, which has been limited contractually to 0.50% from March 29, 2012 through March 29, 2013.
Institutional Class shares are available without sales or asset-based distribution charges only to certain eligible institutional accounts.
The “Fund performance” table and the “Performance of a $10,000 investment” graph do not reflect the deduction of taxes the shareholder would pay on Fund distributions or redemptions of Fund shares.
International investments entail risks not ordinarily associated with U.S. investments including fluctuation in currency values, differences in accounting principles, or economic or political instability in other nations.
Investing in emerging markets can be riskier than investing in established foreign markets due to increased volatility and lower trading volume.
Investments in small and/or medium-sized companies typically exhibit greater risk and higher volatility than larger, more established companies.
2 The Fund’s expense ratios, as described in the most recent prospectus, are disclosed in the following “Fund expense ratios” table.
| Fund expense ratios | | Class A | | Class B | | Class C | | Class R | | Institutional Class |
| Total annual operating expenses | | 1.83% | | 2.53% | | 2.53% | | 2.13% | | 1.53% |
| (without fee waivers) | | | | | | | | | | |
| Net expenses | | 1.78% | | 2.53% | | 2.53% | | 2.03% | | 1.53% |
| (including fee waivers, if any) | | | | | | | | | | |
| Type of waiver | | Contractual | | n/a | | n/a | | Contractual | | n/a |
14
Performance of a $10,000 investment1
Average annual total returns from Nov. 30, 2002, through Nov. 30, 2012
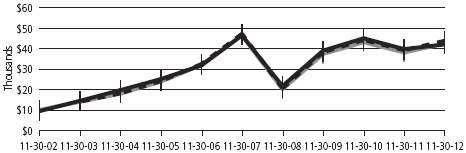
| For period beginning Nov. 30, 2002, through Nov. 30, 2012 | Starting value | Ending value |
| | MSCI Emerging Markets Index (gross) | $10,000 | $43,868 |
| | MSCI Emerging Markets Index (net) | $10,000 | $42,509 |
| | Delaware Emerging Markets Fund — Class A Shares | $9,425 | $42,077 |
1 The “Performance of a $10,000 investment” graph assumes $10,000 invested in Class A shares of the Fund on Nov. 30, 2002, and includes the effect of a 5.75% front-end sales charge and the reinvestment of all distributions. The graph does not reflect the deduction of taxes the shareholders would pay on Fund distributions or redemptions of Fund shares. Expense limitations were in effect for some or all of the periods shown. Performance would have been lower had expense limitations not been in effect. Current expenses are listed in the “Fund expense ratios” table on page 14. Please note additional details on pages 13 through 15.
The chart also assumes $10,000 invested in the MSCI Emerging Markets Index as of Nov. 30, 2002. The MSCI Emerging Markets Index measures equity market performance across emerging market countries worldwide. Index “gross” return approximates the maximum possible dividend reinvestment. Index “net” return approximates the minimum possible dividend reinvestment, after deduction of withholding tax at the highest possible rate.
Index performance returns do not reflect any management fees, transaction costs, or expenses. Indices are unmanaged and one cannot invest directly in an index. Past performance is not a guarantee of future results.
Performance of other Fund classes will vary due to different charges and expenses.
| | Nasdaq symbols | | CUSIPs | |
| Class A | | | DEMAX | | | 245914841 | |
| Class B | | | DEMBX | | | 245914833 | |
| Class C | | | DEMCX | | | 245914825 | |
| Class R | | | DEMRX | | | 245914569 | |
| Institutional Class | | | DEMIX | | | 245914817 | |
15
Performance summaries
| Delaware Global Value Fund | November 30, 2012 |
The performance data quoted represent past performance; past performance does not guarantee future results. Investment return and principal value will fluctuate so your shares, when redeemed, may be worth more or less than their original cost. Please obtain the performance data current for the most recent month end by calling 800 523-1918 or visiting our website at delawareinvestments.com/performance. Current performance may be lower or higher than the performance data quoted.
| Fund performance1,2 | | Average annual total returns through November 30, 2012 |
| | | 1 year | | 5 years | | 10 years | |
| Class A (Est. Dec. 19, 1997) | | | | | | | | |
| Excluding sales charge | | | +9.65% | | -3.11% | | +9.19% | |
| Including sales charge | | | +3.31% | | -4.24% | | +8.55% | |
| Class B (Est. Sept. 28, 2001) | | | | | | | | |
| Excluding sales charge | | | +8.82% | | -3.81% | | +8.54% | |
| Including sales charge | | | +4.82% | | -4.21% | | +8.54% | |
| Class C (Est. Sept. 28, 2001) | | | | | | | | |
| Excluding sales charge | | | +8.94% | | -3.82% | | +8.39% | |
| Including sales charge | | | +7.94% | | -3.82% | | +8.39% | |
| Institutional Class (Est. Dec. 19, 1997) | | | | | | | | |
| Excluding sales charge | | | +10.03% | | -2.85% | | +9.49% | |
| Including sales charge | | | +10.03% | | -2.85% | | +9.49% | |
1 Returns reflect the reinvestment of all distributions and are presented both with and without the applicable sales charges described below. Returns do not reflect the deduction of taxes the shareholder would pay on Fund distributions or redemptions of Fund shares.
Expense limitations were in effect for certain classes during some or all of the periods shown in the “Fund performance” chart. The current expenses for each class are listed on the “Fund expense ratios” table on page 17. Performance would have been lower had expense limitations not been in effect.
Class A shares are sold with a maximum front-end sales charge of 5.75%, and have an annual distribution and service fee of 0.30% of average daily net assets. This fee has been contractually limited to 0.25% of average daily net assets from March 29, 2012 through March 29, 2013. Performance for Class A shares, excluding sales charges, assumes that no front-end sales charge applied.
Class B shares may be purchased only through dividend reinvestment and certain permitted exchanges as described in the prospectus. Please see the prospectus for additional information on Class B shares. Class B shares have a contingent deferred sales charge that declines from 4.00% to zero depending on the period of time the shares are held. They are also subject to an annual distribution and service fee of 1.00% of average daily net assets. Class B shares will automatically convert to Class A shares on a quarterly basis
16
approximately eight years after purchase. Ten-year and lifetime performance figures for Class B shares reflect conversion to Class A shares after approximately eight years.
Class C shares are sold with a contingent deferred sales charge of 1.00% if redeemed during the first 12 months. They are also subject to an annual distribution and service fee of 1.00% of average daily net assets.
Performance for Class B and C shares, excluding sales charges, assumes either that contingent deferred sales charges did not apply or that the investment was not redeemed.
Institutional Class shares are available without sales or asset-based distribution charges only to certain eligible institutional accounts.
The “Fund performance” table and the “Performance of a $10,000 investment” graph do not reflect the deduction of taxes the shareholder would pay on Fund distributions or redemptions of Fund shares.
International investments entail risks not ordinarily associated with U.S. investments including fluctuation in currency values, differences in accounting principles, or economic or political instability in other nations.
Investing in emerging markets can be riskier than investing in established foreign markets due to increased volatility and lower trading volume.
Investments in small and/or medium-sized companies typically exhibit greater risk and higher volatility than larger, more established companies.
2 The Fund’s expense ratios, as described in the most recent prospectus, are disclosed in the following “Fund expense ratios” table. Delaware Investments has agreed to reimburse certain expenses and/or waive certain fees in order to prevent total fund operating expenses (excluding certain fees and expenses) from exceeding 1.30% of the Fund’s average daily net assets from March 29, 2012 through March 29, 2013. Please see the most recent prospectus and any applicable supplement(s) for additional information on these fee waivers and/or reimbursements.
| Fund expense ratios | | Class A | | Class B | | Class C | | Institutional Class |
| Total annual operating expenses | | 1.88% | | 2.58% | | 2.58% | | 1.58% |
| (without fee waivers) | | | | | | | | |
| Net expenses | | 1.55% | | 2.30% | | 2.30% | | 1.30% |
| (including fee waivers, if any) | | | | | | | | |
| Type of waiver | | Contractual | | Contractual | | Contractual | | Contractual |
17
Performance summaries
Delaware Global Value Fund
Performance of a $10,000 investment1
Average annual total returns from Nov. 30, 2002, through Nov. 30, 2012
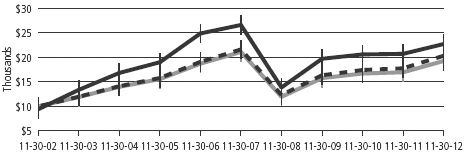
| For period beginning Nov. 30, 2002, through Nov. 30, 2012 | Starting value | Ending value |
| | Delaware Global Value Fund — Class A Shares | $9,425 | $22,711 |
| | MSCI World Index (gross) | $10,000 | $20,314 |
| | MSCI World Index (net) | $10,000 | $19,262 |
1 The “Performance of a $10,000 investment” graph assumes $10,000 invested in Class A shares of the Fund on Nov. 30, 2002, and includes the effect of a 5.75% front-end sales charge and the reinvestment of all distributions. The graph does not reflect the deduction of taxes the shareholders would pay on Fund distributions or redemptions of Fund shares. Expense limitations were in effect for some or all of the periods shown. Performance would have been lower had expense limitations not been in effect. Current expenses are listed in the “Fund expense ratios” table on page 17. Please note additional details on pages 16 through 18.
The chart also assumes $10,000 invested in the MSCI World Index as of Nov. 30, 2002. The MSCI World Index is a free float-adjusted market capitalization weighted index designed to measure equity market performance across developed markets worldwide. Index “gross” return approximates the maximum possible dividend reinvestment. Index “net” return approximates the minimum possible dividend reinvestment, after deduction of withholding tax at the highest possible rate.
Index performance returns do not reflect any management fees, transaction costs, or expenses. Indices are unmanaged and one cannot invest directly in an index. Past performance is not a guarantee of future results.
Performance of other Fund classes will vary due to different charges and expenses.
| | Nasdaq symbols | | CUSIPs | |
| Class A | | | DABAX | | | 245914718 | |
| Class B | | | DABBX | | | 245914692 | |
| Class C | | | DABCX | | | 245914684 | |
| Institutional Class | | | DABIX | | | 245914676 | |
18
Disclosure of Fund expenses
For the six-month period from June 1, 2012 to November 30, 2012 (Unaudited)
As a shareholder of a Fund, you incur two types of costs: (1) transaction costs, including sales charges (loads) on purchase payments, reinvested dividends, or other distributions; redemption fees; and exchange fees; and (2) ongoing costs, including management fees; distribution and/or service (12b-1) fees; and other Fund expenses. These following examples are intended to help you understand your ongoing costs (in dollars) of investing in a Fund and to compare these costs with the ongoing costs of investing in other mutual funds.
The examples are based on an investment of $1,000 invested at the beginning of the period and held for the entire six-month period from June 1, 2012 to November 30, 2012.
Actual expenses
The first section of the tables shown, “Actual Fund return,” provides information about actual account values and actual expenses. You may use the information in this section of the table, together with the amount you invested, to estimate the expenses that you paid over the period. Simply divide your account value by $1,000 (for example, an $8,600 account value divided by $1,000 = 8.6), then multiply the result by the number in the first section under the heading entitled “Expenses Paid During Period” to estimate the expenses you paid on your account during this period.
Hypothetical example for comparison purposes
The second section of the tables shown, “Hypothetical 5% return,” provides information about hypothetical account values and hypothetical expenses based on the Funds’ actual expense ratios and an assumed rate of return of 5% per year before expenses, which is not the Funds’ actual return. The hypothetical account values and expenses may not be used to estimate the actual ending account balance or expenses you paid for the period. You may use this information to compare the ongoing costs of investing in a Fund and other funds. To do so, compare this 5% hypothetical example with the 5% hypothetical examples that appear in the shareholder reports of the other funds.
Please note that the expenses shown in the tables are meant to highlight your ongoing costs only and do not reflect any transactional costs, such as sales charges (loads), redemption fees, or exchange fees. Therefore, the second section of each table is useful in comparing ongoing costs only, and will not help you determine the relative total costs of owning different funds. In addition, if these transactional costs were included, your costs would have been higher. The Funds’ expenses shown in the tables reflect fee waivers in effect. The expenses shown in each table assume reinvestment of all dividends and distributions.
20
Delaware International Value Equity Fund
Expense analysis of an investment of $1,000
| Beginning
Account Value
6/1/12 | | Ending
Account Value
11/30/12 | | Annualized
Expense Ratio | | Expenses
Paid During Period
6/1/12 to 11/30/12* |
| Actual Fund return† | | | | | | | | | | | | | | | | | | | |
| Class A | | $ | 1,000.00 | | | | $ | 1,140.70 | | | | 1.39 | % | | | | $ | 7.44 | |
| Class B | | | 1,000.00 | | | | | 1,135.50 | | | | 2.13 | % | | | | | 11.37 | |
| Class C | | | 1,000.00 | | | | | 1,136.70 | | | | 2.13 | % | | | | | 11.38 | |
| Class R | | | 1,000.00 | | | | | 1,139.00 | | | | 1.63 | % | | | | | 8.72 | |
| Institutional Class | | | 1,000.00 | | | | | 1,142.20 | | | | 1.13 | % | | | | | 6.05 | |
| Hypothetical 5% return (5% return before expenses) | | | | | | | | | | | |
| Class A | | $ | 1,000.00 | | | | $ | 1,018.05 | | | | 1.39 | % | | | | $ | 7.01 | |
| Class B | | | 1,000.00 | | | | | 1,014.35 | | | | 2.13 | % | | | | | 10.73 | |
| Class C | | | 1,000.00 | | | | | 1,014.35 | | | | 2.13 | % | | | | | 10.73 | |
| Class R | | | 1,000.00 | | | | | 1,016.85 | | | | 1.63 | % | | | | | 8.22 | |
| Institutional Class | | | 1,000.00 | | | | | 1,019.35 | | | | 1.13 | % | | | | | 5.70 | |
Delaware Emerging Markets Fund
Expense analysis of an investment of $1,000
| Beginning
Account Value
6/1/12 | | Ending
Account Value
11/30/12 | | Annualized
Expense Ratio | | Expenses
Paid During Period
6/1/12 to 11/30/12* |
| Actual Fund return† | | | | | | | | | | | | | | | | | | | |
| Class A | | $ | 1,000.00 | | | | $ | 1,151.90 | | | | 1.71 | % | | | | $ | 9.20 | |
| Class B | | | 1,000.00 | | | | | 1,147.30 | | | | 2.46 | % | | | | | 13.21 | |
| Class C | | | 1,000.00 | | | | | 1,147.70 | | | | 2.46 | % | | | | | 13.21 | |
| Class R | | | 1,000.00 | | | | | 1,149.60 | | | | 1.96 | % | | | | | 10.53 | |
| Institutional Class | | | 1,000.00 | | | | | 1,152.50 | | | | 1.46 | % | | | | | 7.86 | |
| Hypothetical 5% return (5% return before expenses) | | | | | | | | | | | | | | | | | | | |
| Class A | | $ | 1,000.00 | | | | $ | 1,016.45 | | | | 1.71 | % | | | | $ | 8.62 | |
| Class B | | | 1,000.00 | | | | | 1,012.70 | | | | 2.46 | % | | | | | 12.38 | |
| Class C | | | 1,000.00 | | | | | 1,012.70 | | | | 2.46 | % | | | | | 12.38 | |
| Class R | | | 1,000.00 | | | | | 1,015.20 | | | | 1.96 | % | | | | | 9.87 | |
| Institutional Class | | | 1,000.00 | | | | | 1,017.70 | | | | 1.46 | % | | | | | 7.36 | |
21
Disclosure of Fund expenses
Delaware Global Value Fund
Expense analysis of an investment of $1,000
| Beginning
Account Value
6/1/12 | | Ending
Account Value
11/30/12 | | Annualized
Expense Ratio | | Expenses
Paid During Period
6/1/12 to 11/30/12* |
| Actual Fund return† | | | | | | | | | | | | | | | | | | | |
| Class A | | $ | 1,000.00 | | | | $ | 1,115.10 | | | | 1.55 | % | | | | $ | 8.20 | |
| Class B | | | 1,000.00 | | | | | 1,110.60 | | | | 2.30 | % | | | | | 12.14 | |
| Class C | | | 1,000.00 | | | | | 1,111.80 | | | | 2.30 | % | | | | | 12.14 | |
| Institutional Class | | | 1,000.00 | | | | | 1,117.30 | | | | 1.30 | % | | | | | 6.88 | |
| Hypothetical 5% return (5% return before expenses) |
| Class A | | $ | 1,000.00 | | | | $ | 1,017.25 | | | | 1.55 | % | | | | $ | 7.82 | |
| Class B | | | 1,000.00 | | | | | 1,013.50 | | | | 2.30 | % | | | | | 11.58 | |
| Class C | | | 1,000.00 | | | | | 1,013.50 | | | | 2.30 | % | | | | | 11.58 | |
| Institutional Class | | | 1,000.00 | | | | | 1,018.50 | | | | 1.30 | % | | | | | 6.56 | |
*“Expenses Paid During Period” are equal to the relevant Fund’s annualized expense ratio, multiplied by the average account value over the period, multiplied by 183/366 (to reflect the one-half year period). |
| |
†Because actual returns reflect only the most recent six-month period, the returns shown may differ significantly from fiscal year returns. |
22
| Security type/country and sector allocations |
Delaware International Value Equity Fund | As of November 30, 2012 (Unaudited) |
Sector designations may be different than the sector designations presented in other Fund materials. The sector designations may represent the investment manager’s internal sector classifications, which may result in the sector designations for one fund being different than another fund’s sector designations.
| Security type/country | Percentage of net assets |
| Common Stock by Country | | 99.33 | % | |
| Australia | | 1.52 | % | |
| Canada | | 9.26 | % | |
| China/Hong Kong | | 6.58 | % | |
| Denmark | | 1.85 | % | |
| France | | 19.95 | % | |
| Germany | | 3.77 | % | |
| Israel | | 4.10 | % | |
| Japan | | 17.53 | % | |
| Netherlands | | 1.97 | % | |
| Norway | | 2.38 | % | |
| Panama | | 1.92 | % | |
| Republic of Korea | | 1.51 | % | |
| Russia | | 1.45 | % | |
| Sweden | | 3.27 | % | |
| Switzerland | | 8.42 | % | |
| United Kingdom | | 13.85 | % | |
| Short-Term Investments | | 1.35 | % | |
| Securities Lending Collateral | | 6.14 | % | |
| Total Value of Securities | | 106.82 | % | |
| Obligation to Return Securities Lending Collateral | | (6.77 | %) | |
| Other Liabilities Net of Receivables and Other Assets | | (0.05 | %) | |
| Total Net Assets | | 100.00 | % | |
23
Security type/country and sector allocations
Delaware International Value Equity Fund
| Common Stock by Sector | Percentage of net assets |
| Consumer Discretionary | | 20.07 | % | |
| Consumer Staples | | 11.06 | % | |
| Energy | | 9.40 | % | |
| Financials | | 9.59 | % | |
| Healthcare | | 10.70 | % | |
| Industrials | | 17.23 | % | |
| Information Technology | | 3.51 | % | |
| Materials | | 11.56 | % | |
| Telecommunication Services | | 4.16 | % | |
| Utilities | | 2.05 | % | |
| Total | | 99.33 | % | |
24
| Delaware Emerging Market Fund | As of November 30, 2012 (Unaudited) |
Sector designations may be different than the sector designations presented in other Fund materials. The sector designations may represent the investment manager’s internal sector classifications, which may result in the sector designations for one fund being different than another fund’s sector designations.
| Security type/country | Percentage of net assets |
| Common Stock by Country | | 95.77 | % | |
| Argentina | | 1.56 | % | |
| Australia | | 0.11 | % | |
| Brazil | | 15.24 | % | |
| China/Hong Kong | | 17.44 | % | |
| India | | 2.34 | % | |
| Kingdom of Bahrain | | 0.08 | % | |
| Malaysia | | 1.60 | % | |
| Mexico | | 5.58 | % | |
| Poland | | 0.85 | % | |
| Republic of Korea | | 20.62 | % | |
| Russia | | 6.98 | % | |
| South Africa | | 4.27 | % | |
| Taiwan | | 5.02 | % | |
| Thailand | | 1.94 | % | |
| Turkey | | 1.38 | % | |
| United Kingdom | | 0.08 | % | |
| United States | | 10.68 | % | |
| Participation Notes | | 0.00 | % | |
| Preferred Stock | | 3.60 | % | |
| Securities Lending Collateral | | 10.46 | % | |
| Total Value of Securities | | 109.83 | % | |
| Obligation to Return Securities Lending Collateral | | (10.48 | %) | |
| Receivables and Other Assets Net of Other Liabilities | | 0.65 | % | |
| Total Net Assets | | 100.00 | % | |
25
Security type/country and sector allocations
Delaware Emerging Market Fund
| Commons Stock, Participation Notes and Preferred Stock by Sector | Percentage of net assets |
| Consumer Discretionary | | 4.49 | % | |
| Consumer Staples | | 15.67 | % | |
| Energy | | 15.30 | % | |
| Financials | | 13.76 | % | |
| Industrials | | 5.44 | % | |
| Information Technology | | 23.28 | % | |
| Materials | | 8.17 | % | |
| Telecommunication Services | | 11.82 | % | |
| Utilities | | 1.44 | % | |
| Total | | 99.37 | % | |
26
| Delaware Global Value Fund | As of November 30, 2012 (Unaudited) |
Sector designations may be different than the sector designations presented in other Fund materials. The sector designations may represent the investment manager’s internal sector classifications, which may result in the sector designations for one fund being different than another fund’s sector designations.
| Sector type/country | | Percentage of net assets |
| Common Stock by Country | | 100.03 | % |
| Canada | | 4.56 | % |
| China/Hong Kong | | 3.35 | % |
| Denmark | | 1.88 | % |
| France | | 10.20 | % |
| Germany | | 1.11 | % |
| Israel | | 2.36 | % |
| Japan | | 9.85 | % |
| Netherlands | | 1.48 | % |
| Norway | | 1.65 | % |
| Panama | | 1.62 | % |
| Russia | | 1.27 | % |
| Switzerland | | 4.39 | % |
| United Kingdom | | 8.61 | % |
| United States | | 47.70 | % |
| Short-Term Investments | | 1.50 | % |
| Securities Lending Collateral | | 2.34 | % |
| Total Value of Securities | | 103.87 | % |
| Obligation to Return Securities Lending Collateral | | (2.89 | %) |
| Other Liabilities Net of Receivables and Other Assets | | (0.98 | %) |
| Total Net Assets | | 100.00 | % |
27
Security type/country and sector allocations
Delaware Global Value Fund
| Common Stock by Sector | | Percentage of net assets |
| Consumer Discretionary | | 20.52 | % |
| Consumer Staples | | 6.07 | % |
| Energy | | 9.03 | % |
| Financials | | 16.81 | % |
| Healthcare | | 12.34 | % |
| Industrials | | 14.53 | % |
| Information Technology | | 6.73 | % |
| Materials | | 8.45 | % |
| Telecommunication Services | | 4.20 | % |
| Utilities | | 1.35 | % |
| Total | | 100.03 | % |
28
| Statements of net assets | |
| Delaware International Value Equity Fund | November 30, 2012 |
| | | | Number of shares | | Value (U.S. $) |
| ΔCommon Stock – 99.33% | | | | | | | |
| Australia – 1.52% | | | | | | | |
| | Coca-Cola Amatil | | | 251,725 | | | $ | 3,609,847 |
| | | | | | | | 3,609,847 |
| Canada – 9.26% | | | | | | | |
| † | AuRico Gold | | | 653,441 | | | | 5,163,851 |
| † | CGI Group Class A | | | 362,509 | | | | 8,320,537 |
| Yamana Gold | | | 449,401 | | | | 8,469,107 |
| | | | | | | | 21,953,495 |
| China/Hong Kong – 6.58% | | | | | | | |
| CNOOC | | | 2,377,000 | | | | 5,085,115 |
| Techtronic Industries | | | 1,964,000 | | | | 3,867,080 |
| Yue Yuen Industrial Holdings | | | 1,895,000 | | | | 6,638,441 |
| | | | | | | | 15,590,636 |
| Denmark – 1.85% | | | | | | | |
| Carlsberg Class B | | | 45,129 | | | | 4,393,868 |
| | | | | | | | 4,393,868 |
| France – 19.95% | | | | | | | |
| Alstom | | | 103,257 | | | | 3,758,130 |
| AXA | | | 344,137 | | | | 5,655,014 |
| Cie de Saint-Gobain | | | 61,483 | | | | 2,453,225 |
| Lafarge | | | 52,121 | | | | 3,027,999 |
| PPR | | | 30,282 | | | | 5,647,559 |
| Publicis Groupe | | | 55,775 | | | | 3,155,048 |
| Sanofi | | | 80,078 | | | | 7,150,626 |
| Teleperformance | | | 271,059 | | | | 9,433,590 |
| * | Total | | | 140,094 | | | | 7,010,116 |
| | | | | | | | 47,291,307 |
| Germany – 3.77% | | | | | | | |
| Bayerische Motoren Werke | | | 46,666 | | | | 4,138,551 |
| Deutsche Post | | | 230,690 | | | | 4,788,381 |
| | | | | | | | 8,926,932 |
| Israel – 4.10% | | | | | | | |
| Teva Pharmaceutical Industries ADR | | | 240,800 | | | | 9,716,280 |
| | | | | | | | 9,716,280 |
| Japan – 17.53% | | | | | | | |
| Don Quijote | | | 154,700 | | | | 6,015,329 |
| East Japan Railway | | | 88,744 | | | | 5,824,750 |
29
Statements of net assets
Delaware International Value Equity Fund
| | | | Number of shares | | | Value (U.S. $) |
| ΔCommon Stock (continued) | | | | | | | |
| Japan (continued) | | | | | | | |
| ITOCHU | | | 535,660 | | | $ | 5,354,975 |
| KDDI | | | 46,700 | | | | 3,456,112 |
| | Mitsubishi UFJ Financial Group | | | 1,394,057 | | | | 6,376,215 |
| Nitori Holdings | | | 48,697 | | | | 3,621,627 |
| Sumitomo Rubber Industries | | | 214,583 | | | | 2,530,478 |
| Toyota Motor | | | 195,400 | | | | 8,380,213 |
| | | | | | | | 41,559,699 |
| Netherlands – 1.97% | | | | | | | |
| Koninklijke Philips Electronics | | | 181,139 | | | | 4,678,625 |
| | | | | | | | 4,678,625 |
| Norway – 2.38% | | | | | | | |
| * | Subsea 7 | | | 246,603 | | | | 5,637,361 |
| | | | | | | | 5,637,361 |
| Panama – 1.92% | | | | | | | |
| Copa Holdings Class A | | | 48,100 | | | | 4,561,804 |
| | | | | | | | 4,561,804 |
| Republic of Korea – 1.51% | | | | | | | |
| Hyundai Home Shopping Network | | | 31,876 | | | | 3,577,768 |
| | | | | | | | 3,577,768 |
| Russia – 1.45% | | | | | | | |
| Mobile Telesystems ADR | | | 196,600 | | | | 3,426,738 |
| | | | | | | | 3,426,738 |
| Sweden – 3.27% | | | | | | | |
| * | Meda Class A | | | 175,781 | | | | 1,809,846 |
| Nordea Bank | | | 649,589 | | | | 5,946,141 |
| | | | | | | | 7,755,987 |
| Switzerland – 8.42% | | | | | | | |
| *† | Aryzta | | | 172,496 | | | | 8,720,662 |
| Novartis | | | 108,275 | | | | 6,700,735 |
| Transocean | | | 98,400 | | | | 4,546,080 |
| | | | | | | | 19,967,477 |
| United Kingdom – 13.85% | | | | | | | |
| Greggs | | | 477,265 | | | | 3,676,323 |
| * | National Grid | | | 429,655 | | | | 4,852,869 |
| Rexam | | | 899,515 | | | | 6,307,753 |
30
| | | | Number of shares | | Value (U.S. $) |
| ΔCommon Stock (continued) | | | | | | |
| United Kingdom (continued) | | | | | | |
| Rio Tinto | | | 89,384 | | $ | 4,429,957 |
| Standard Chartered | | | 204,090 | | | 4,757,451 |
| TESCO | | | 1,116,340 | | | 5,814,375 |
| Vodafone Group | | | 1,156,828 | | | 2,986,680 |
| | | | | | | 32,825,408 |
| Total Common Stock (cost $221,170,556) | | | | | | 235,473,232 |
| | | | Principal | | |
| | | amount (U.S. $) | | |
| Short-Term Investments – 1.35% | | | | | |
| ≠Discount Notes – 0.69% | | | | | |
| Federal Home Loan Bank | | | | | |
| 0.10% 1/18/13 | | $ | 327,903 | | 327,878 |
| 0.10% 1/23/13 | | | 257,848 | | 257,826 |
| 0.13% 2/6/13 | | | 862,902 | | 862,793 |
| 0.135% 2/15/13 | | | 189,838 | | 189,811 |
| | | | | | 1,638,308 |
| Repurchase Agreements – 0.66% | | | | | |
| Bank of America 0.19%, dated 11/30/12, to | | | | | |
| be repurchased on 12/3/12, repurchase price | | | | | |
| $557,276 (collateralized by U.S. government | | | | | |
| obligations 0.00%-0.25% 1/3/13-11/30/14; | | | | | |
| market value $568,412) | | | 557,267 | | 557,267 |
| BNP Paribas 0.20%, dated 11/30/12, to be | | | | | |
| repurchased on 12/3/12, repurchase price | | | | | |
| $997,750 (collateralized by U.S. government | | | | | |
| obligations 0.25%-2.50% 3/31/14-11/30/17; | | | | | |
| market value $1,018,446) | | | 997,733 | | 997,733 |
| | | | | | 1,555,000 |
| Total Short-Term Investments (cost $3,193,147) | | | | | 3,193,308 |
| |
| Total Value of Securities Before Securities | | | | | |
| Lending Collateral – 100.68% (cost $224,363,703) | | | | | 238,666,540 |
31
Statements of net assets
Delaware International Value Equity Fund
| | | | Number of shares | | | Value (U.S. $) | |
| **Securities Lending Collateral – 6.14% | | | | | | | | |
| Investment Companies | | | | | | | | |
| Delaware Investments Collateral Fund No. 1 | | | 14,562,511 | | | $ | 14,562,511 | |
| @†Mellon GSL Reinvestment Trust II | | | 1,475,413 | | | | 0 | |
| Total Securities Lending Collateral | | | | | | | | |
| (cost $16,037,924) | | | | | | | 14,562,511 | |
| |
| Total Value of Securities – 106.82% | | | | | | | | |
| (cost $240,401,627) | | | | | | | 253,229,051 | © |
| **Obligation to Return Securities | | | | | | | | |
| Lending Collateral – (6.77%) | | | | | | | (16,037,924 | ) |
| Other Liabilities Net of Receivables and | | | | | | | | |
| Other Assets – (0.05%) | | | | | | | (127,381 | ) |
| Net Assets Applicable to 20,462,311 | | | | | | | | |
| Shares Outstanding – 100.00% | | | | | | $ | 237,063,746 | |
| | | | | | | | | | |
| Net Asset Value – Delaware International Value Equity Fund | | | | | | | | |
| Class A ($93,439,555 / 8,062,222 Shares) | | | | | | | | $11.59 | |
| Net Asset Value – Delaware International Value Equity Fund | | | | | | | | |
| Class B ($3,008,655 / 263,901 Shares) | | | | | | | | $11.40 | |
| Net Asset Value – Delaware International Value Equity Fund | | | | | | | | |
| Class C ($30,510,088 / 2,679,958 Shares) | | | | | | | | $11.38 | |
| Net Asset Value – Delaware International Value Equity Fund | | | | | | | | |
| Class R ($2,288,088 / 198,190 Shares) | | | | | | | | $11.54 | |
| Net Asset Value – Delaware International Value Equity Fund | | | | | | | | |
| Institutional Class ($107,817,360 / 9,258,040 Shares) | | | | | | | | $11.65 | |
| |
| Components of Net Assets at November 30, 2012: | | | | | | | | |
| Shares of beneficial interest (unlimited authorization – no par) | | | | | | $ | 440,419,603 | |
| Undistributed net investment income | | | | | | | 2,975,693 | |
| Accumulated net realized loss on investments and derivatives | | | | | | | (219,147,711 | ) |
| Net unrealized appreciation of investments and derivatives | | | | | | | 12,816,161 | |
| Total net assets | | | | | | $ | 237,063,746 | |
32
| | |
| | |
| Δ | Securities have been classified by country of origin. Classification by type of business has been presented on page 24 in “Security type/country and sector allocations.” |
| † | Non income producing security. |
| * | Fully or partially on loan. |
| ≠ | The rate shown is the effective yield at the time of purchase. |
| ** | See Note 9 in “Notes to financial statements” for additional information on securities lending collateral. |
| @ | Illiquid security. At November 30, 2012, the aggregate value of illiquid securities was $0, which represented 0.00% of the Fund’s net assets. See Note 10 in “Notes to financial statements.” |
| © | Includes $15,191,362 of securities loaned. |
| Net Asset Value and Offering Price Per Share – | | | |
| Delaware International Value Equity Fund | | | |
| Net asset value Class A (A) | | $ | 11.59 |
| Sales charge (5.75% of offering price) (B) | | | 0.71 |
| Offering price | | $ | 12.30 |
| (A) | Net asset value per share, as illustrated, is the amount which would be paid upon redemption or repurchase of shares. |
| (B) | See the current prospectus for purchases of $50,000 or more. |
The following foreign currency exchange contracts were outstanding at November 30, 2012:1
Foreign Currency Exchange Contracts
| | | | | | | | | | | | | | | | | Unrealized |
| | | | | | | | | | | | | | | | Appreciation |
| Counterparty | | | Contract to Receive (Deliver) | | In Exchange For | | Settlement Date | | (Depreciation) |
| MNB | | | EUR | | (1,371,542 | ) | | | USD | | 1,786,296 | | | 12/4/12 | | | $ | 2,457 | | |
| MNB | | | EUR | | 2,196,765 | | | | USD | | (2,861,067 | ) | | 12/5/12 | | | | (3,903 | ) | |
| MNB | | | GBP | | (482,978 | ) | | | USD | | 772,475 | | | 12/5/12 | | | | (1,299 | ) | |
| | | | | | | | | | | | | | | | | $ | (2,745 | ) | |
The use of foreign currency exchange contracts involves elements of market risk and risks in excess of the amount recognized in the financial statements. The foreign currency exchange contracts presented above represent the Fund’s total exposure in such contracts, whereas only the net unrealized appreciation (depreciation) is reflected in the Fund’s net assets.
1See Note 8 in “Notes to financial statements.”
33
Statements of net assets
Delaware International Value Equity Fund
Summary of abbreviations:
ADR — American Depositary Receipt
EUR — European Monetary Unit
GBP — British Pound
MNB — Mellon National Bank
USD — United States Dollar
See accompanying notes, which are an integral part of the financial statements.
34
| Delaware Emerging Markets Fund | November 30, 2012 |
| | | | Number of shares | | Value (U.S. $) |
| ΔCommon Stock – 95.77% | | | | | | | |
| Argentina – 1.56% | | | | | | | |
| @* | Cresud ADR | | | 1,442,769 | | | $ | 12,378,958 |
| # | Grupo Clarin Class B GDR 144A | | | 353,200 | | | | 1,022,973 |
| @ | IRSA Inversiones y Representaciones ADR | | | 867,000 | | | | 6,181,710 |
| @†* | Pampa Energia ADR | | | 95,300 | | | | 300,195 |
| YPF ADR | | | 800,000 | | | | 9,096,000 |
| | | | | | | | 28,979,836 |
| Australia – 0.11% | | | | | | | |
| * | Alumina ADR | | | 500,000 | | | | 1,960,000 |
| | | | | | | | 1,960,000 |
| Brazil – 15.24% | | | | | | | |
| AES Tiete | | | 597,480 | | | | 5,608,105 |
| † | B2W Cia Global Do Varejo | | | 1,117,800 | | | | 8,006,339 |
| Banco Santander Brasil ADR | | | 2,150,000 | | | | 14,383,500 |
| *† | Brasil Foods ADR | | | 1,450,000 | | | | 26,607,500 |
| * | Braskem ADR | | | 161,000 | | | | 2,096,220 |
| Centrais Eletricas Brasileiras | | | 2,140,204 | | | | 7,664,698 |
| * | Cia Brasileira de Distribuicao Grupo | | | | | | | |
| Pao de Acucar ADR | | | 400,000 | | | | 17,312,000 |
| * | Cia Siderurgica Nacional ADR | | | 935,600 | | | | 4,518,948 |
| *† | Fibria Celulose ADR | | | 3,800,000 | | | | 38,418,000 |
| @ | Gerdau | | | 2,764,900 | | | | 19,169,594 |
| *† | Gol Linhas Aereas Inteligentes ADR | | | 2,732,300 | | | | 13,142,363 |
| † | Hypermarcas | | | 4,000,000 | | | | 28,837,601 |
| Itau Unibanco Holding ADR | | | 1,700,000 | | | | 25,755,000 |
| Petroleo Brasileiro SA ADR | | | 3,400,000 | | | | 61,098,000 |
| Tim Participacoes ADR | | | 568,604 | | | | 10,081,349 |
| | | | | | | | 282,699,217 |
| China/Hong Kong – 17.44% | | | | | | | |
| † | Baidu ADR | | | 100,000 | | | | 9,631,000 |
| Bank of China | | | 30,000,000 | | | | 12,657,738 |
| @† | Bitauto Holdings ADR | | | 205,400 | | | | 1,359,748 |
| China Construction Bank | | | 28,000,000 | | | | 21,460,091 |
| @* | China Huiyuan Juice Group | | | 9,998,000 | | | | 3,547,586 |
| * | China Mengniu Dairy | | | 4,860,000 | | | | 13,607,649 |
| China Mobile ADR | | | 440,000 | | | | 25,044,800 |
| China Petroleum & Chemical | | | 12,166,500 | | | | 12,904,006 |
| * | China Unicom Hong Kong ADR | | | 1,088,334 | | | | 16,901,827 |
35
Statements of net assets
Delaware Emerging Market Fund
| | | | Number of shares | | Value (U.S. $) |
| ΔCommon Stock (continued) | | | | | | | |
| China/Hong Kong (continued) | | | | | | | |
| * | CNOOC ADR | | | 144,000 | | | $ | 30,695,040 |
| First Pacific | | | 4,071,002 | | | | 4,275,755 |
| Fosun International | | | 2,886,500 | | | | 1,709,509 |
| *† | Foxconn International Holdings | | | 14,370,000 | | | | 7,268,251 |
| @* | Guangshen Railway | | | 11,000,000 | | | | 3,647,648 |
| †* | Hollysys Automation Technologies | | | 550,000 | | | | 5,973,000 |
| *† | Huadian Power International | | | 19,166,000 | | | | 5,712,557 |
| Industrial & Commercial Bank of China | | | 20,000,000 | | | | 13,496,426 |
| Kunlun Energy | | | 10,000,000 | | | | 20,360,765 |
| @ | Shanda Games ADR | | | 2,122,400 | | | | 6,579,440 |
| † | Sina | | | 350,000 | | | | 15,932,000 |
| @ | Sinotrans | | | 15,326,332 | | | | 2,353,273 |
| *† | Sohu.com | | | 780,000 | | | | 31,067,400 |
| @† | Tianjin Development Holdings | | | 15,559,550 | | | | 7,528,620 |
| @† | Tom Group | | | 47,638,000 | | | | 5,224,678 |
| @ | Travelsky Technology | | | 8,999,100 | | | | 4,563,297 |
| @* | Uni-President China Holdings | | | 30,469,000 | | | | 39,942,845 |
| | | | | | | | 323,444,949 |
| India – 2.34% | | | | | | | |
| Coal India | | | 383,581 | | | | 2,591,018 |
| † | Indiabulls Real Estate GDR | | | 102,021 | | | | 128,853 |
| # | Reliance Industries 144A GDR | | | 1,370,003 | | | | 40,319,189 |
| Steel Authority of India | | | 226,417 | | | | 337,132 |
| | | | | | | | 43,376,192 |
| Kingdom of Bahrain – 0.08% | | | | | | | |
| @# | Aluminum Bahrain 144A GDR | | | 221,400 | | | | 1,403,388 |
| | | | | | | | 1,403,388 |
| Malaysia – 1.60% | | | | | | | |
| Hong Leong Bank | | | 3,059,889 | | | | 14,757,126 |
| @† | UEM Land Holdings | | | 21,535,575 | | | | 14,948,618 |
| | | | | | | | 29,705,744 |
| Mexico – 5.58% | | | | | | | |
| Cemex ADR | | | 3,300,000 | | | | 29,370,000 |
| † | Empresas ICA | | | 4,500,000 | | | | 10,250,918 |
| Fomento Economico Mexicano ADR | | | 146,122 | | | | 14,331,646 |
| Grupo Televisa ADR | | | 2,090,000 | | | | 49,470,300 |
| | | | | | | | 103,422,864 |
36
| | | Number of shares | | Value (U.S. $) |
| ΔCommon Stock (continued) | | | | | | |
| Poland – 0.85% | | | | | | |
| Jastrzebska Spolka Weglowa | | 254,155 | | | $ | 7,050,679 |
| † | Polski Koncern Naftowy Orlen | | 600,000 | | | | 8,698,410 |
| | | | | | | 15,749,089 |
| Republic of Korea – 20.62% | | | | | | |
| @ | KB Financial Group ADR | | 1,006,900 | | | | 33,096,803 |
| @ | KCC | | 118,000 | | | | 31,175,982 |
| † | Korea Electric Power ADR | | 600,000 | | | | 7,362,000 |
| * | KT ADR | | 1,700,000 | | | | 29,257,000 |
| *† | LG Display ADR | | 1,000,000 | | | | 15,880,000 |
| LG Electronics | | 233,877 | | | | 16,484,818 |
| LG Uplus | | 1,840,040 | | | | 12,697,551 |
| | Lotte Chilsung Beverage | | 23,000 | | | | 30,170,901 |
| Lotte Confectionery | | 10,719 | | | | 14,516,447 |
| Samsung Electronics | | 85,055 | | | | 110,473,283 |
| Samsung Life Insurance | | 250,000 | | | | 21,478,060 |
| † | SK Communications | | 171,609 | | | | 1,249,218 |
| SK Telecom | | 69,471 | | | | 9,658,555 |
| SK Telecom ADR | | 3,204,700 | | | | 48,935,769 |
| | | | | | | 382,436,387 |
| Russia – 6.98% | | | | | | |
| @† | Chelyabinsk Zink Plant GDR | | 143,300 | | | | 380,103 |
| @† | Enel OGK-5 GDR | | 21,161 | | | | 57,158 |
| =#† | Etalon Group GDR 144A | | 1,616,300 | | | | 7,677,425 |
| Gazprom ADR | | 2,600,000 | | | | 23,114,000 |
| LUKOIL ADR | | 170,000 | | | | 10,698,100 |
| LUKOIL ADR (London International Exchange) | | 167,328 | | | | 10,533,298 |
| † | MegaFon GDR | | 900,000 | | | | 18,945,000 |
| Mobile Telesystems ADR | | 1,100,000 | | | | 19,173,000 |
| * | Rosneft GDR | | 2,194,500 | | | | 17,117,100 |
| = | Sberbank | | 5,944,801 | | | | 17,606,123 |
| Surgutneftegas ADR | | 500,000 | | | | 4,212,500 |
| @† | TGK-5 GDR | | 8,771 | | | | 3,995 |
| | | | | | | 129,517,802 |
| South Africa – 4.27% | | | | | | |
| * | Anglo American Platinum | | 80,000 | | | | 3,520,632 |
| * | ArcelorMittal South Africa | | 1,300,000 | | | | 4,532,954 |
| * | Impala Platinum Holdings | | 500,000 | | | | 8,135,134 |
37
Statements of net assets
Delaware Emerging Market Fund
| | | Number of shares | | Value (U.S. $) |
| ΔCommon Stock (continued) | | | | | | |
| South Africa (continued) | | | | | | |
| Sasol | | 400,000 | | | $ | 16,856,290 |
| Standard Bank Group | | 1,630,442 | | | | 19,283,722 |
| Sun International | | 290,543 | | | | 3,001,690 |
| @ | Tongaat Hulett | | 827,113 | | | | 11,815,302 |
| * | Vodacom Group | | 900,000 | | | | 12,046,634 |
| | | | | | | 79,192,358 |
| Taiwan – 5.02% | | | | | | |
| Hon Hai Precision Industry | | 15,381,000 | | | | 49,320,805 |
| Taiwan Semiconductor Manufacturing | | 7,000,000 | | | | 23,770,858 |
| United Microelectronics | | 43,000,000 | | | | 16,643,730 |
| Walsin Lihwa | | 10,711,756 | | | | 3,361,129 |
| | | | | | | 93,096,522 |
| Thailand – 1.94% | | | | | | |
| Airports of Thailand-Foreign | | 7,000,000 | | | | 21,422,758 |
| Bangkok Bank-Foreign | | 2,300,000 | | | | 14,452,222 |
| | | | | | | 35,874,980 |
| Turkey – 1.38% | | | | | | |
| Alarko Gayrimenkul Yatirim Ortakligi | | 97,555 | | | | 1,121,667 |
| Alarko Holding | | 250,000 | | | | 579,086 |
| † | Turkcell Iletisim Hizmet ADR | | 1,085,000 | | | | 16,437,750 |
| * | Turkiye Sise ve Cam Fabrikalari | | 5,100,968 | | | | 7,506,040 |
| | | | | | | 25,644,543 |
| United Kingdom – 0.08% | | | | | | |
| @† | Griffin Mining | | 3,056,187 | | | | 1,439,517 |
| | | | | | | | 1,439,517 |
| United States – 10.68% | | | | | | |
| Avon Products | | 6,450,000 | | | | 89,977,500 |
| MEMC Electronic Materials | | 3,600,000 | | | | 10,548,000 |
| Yahoo | | 5,200,000 | | | | 97,604,000 |
| | | | | | | 198,129,500 |
| Total Common Stock (cost $1,996,634,389) | | | | | | 1,776,072,888 |
| | |
| Participation Notes – 0.00% | | | | | | |
| @=#† | Lehman Indian Oil CW 12 LEPO 144A | | 172,132 | | | | 0 |
| =#† | Lehman Oil & Natural Gas CW 12 LEPO 144A | | 254,590 | | | | 0 |
| Total Participation Notes (cost $8,559,056) | | | | | | 0 |
38
| | | Number of shares | | Value (U.S. $) | |
| ΔPreferred Stock – 3.60% | | | | | | | |
| Brazil – 1.48% | | | | | | | |
| Braskem Class A 4.50% | | 541,994 | | | $ | 3,496,408 | |
| Vale Class A 6.09% | | 1,400,000 | | | | 24,053,182 | |
| | | | | | | 27,549,590 | |
| Republic of Korea – 1.29% | | | | | | | |
| Samsung Electronics 0.65% | | 31,362 | | | | 23,872,783 | |
| | | | | | | 23,872,783 | |
| Russia – 0.83% | | | | | | | |
| = | AK Transneft 1.04% | | 7,239 | | | | 15,361,954 | |
| | | | | | | 15,361,954 | |
| Total Preferred Stock (cost $44,018,833) | | | | | | 66,784,327 | |
| | |
| Total Value of Securities Before Securities | | | | | | | |
| Lending Collateral – 99.37% | | | | | | | |
| (cost $2,049,212,278) | | | | | | 1,842,857,215 | |
| | |
| **Securities Lending Collateral – 10.46% | | | | | | | |
| Investment Companies | | | | | | | |
| Delaware Investments Collateral Fund No. 1 | | 194,014,141 | | | | 194,014,141 | |
| †@Mellon GSL Reinvestment Trust II | | 376,250 | | | | 0 | |
| Total Securities Lending Collateral | | | | | | | |
| (cost $194,390,391) | | | | | | 194,014,141 | |
| |
| Total Value of Securities – 109.83% | | | | | | | |
| (cost $2,243,602,669) | | | | | | 2,036,871,356 | © |
| **Obligation to Return Securities | | | | | | | |
| Lending Collateral – (10.48%) | | | | | | (194,390,391 | ) |
| Receivables and Other Assets | | | | | | | |
| Net of Other Liabilities – 0.65% | | | | | | 12,005,696 | « |
| Net Assets Applicable to 137,406,532 | | | | | | | |
| Shares Outstanding – 100.00% | | | | | $ | 1,854,486,661 | |
39
Statements of net assets
Delaware Emerging Market Fund
| | | | |
| Net Asset Value – Delaware Emerging Markets Fund | | | |
| Class A ($470,669,711 / 34,862,277 Shares) | | | $13.50 | |
| Net Asset Value – Delaware Emerging Markets Fund | | | |
| Class B ($9,020,735 / 706,588 Shares) | | | $12.77 | |
| Net Asset Value – Delaware Emerging Markets Fund | | | |
| Class C ($155,040,121 / 12,171,410 Shares) | | | $12.74 | |
| Net Asset Value – Delaware Emerging Markets Fund | | | |
| Class R ($2,691,275 / 197,895 Shares) | | | $13.60 | |
| Net Asset Value – Delaware Emerging Markets Fund | | | |
| Institutional Class ($1,217,064,819 / 89,468,362 Shares) | | | $13.60 | |
| |
| Components of Net Assets at November 30, 2012: | | | |
| Shares of beneficial interest (unlimited authorization – no par) | $ | 2,103,944,720 | |
| Undistributed net investment income | | 5,121,019 | |
| Accumulated net realized loss on investments and derivatives | | (47,594,827 | ) |
| Net unrealized depreciation of investments and derivatives | | (206,984,251 | ) |
| Total net assets | $ | 1,854,486,661 | |
| Δ | Securities have been classified by country of origin. Classification by type of business has been presented on page 26 in “Security type/country and sector allocations.” |
| @ | Illiquid security. At November 30, 2012, the aggregate value of illiquid securities was $207,098,458, which represented 11.17% of the Fund’s net assets. See Note 10 in “Notes to financial statements.” |
| * | Fully or partially on loan. |
| # | Security exempt from registration under Rule 144A of the Securities Act of 1933, as amended. At November 30, 2012, the aggregate value of Rule 144A securities was $50,422,975, which represented 2.72% of the Fund’s net assets. See Note 10 in “Notes to financial statements.” |
| † | Non income producing security. |
| = | Security is being fair valued in accordance with the Fund’s fair valuation policy. At November 30, 2012, the aggregate value of fair valued securities was $40,645,502, which represented 2.19% of the Fund’s net assets. See Note 1 in “Notes to financial statements.” |
| ** | See Note 9 in “Notes to financial statements” for additional information on securities lending collateral. |
| © | Includes $185,582,524 of securities loaned. |
| « | Includes foreign currency valued at $16,307 with a cost of $18,193. |
40
| | | | |
| Net Asset Value and Offering Price Per Share – | | | |
| Delaware Emerging Markets Fund | | | |
| Net asset value Class A (A) | | $ | 13.50 |
| Sales charge (5.75% of offering price) (B) | | | 0.82 |
| Offering Price | | $ | 14.32 |
| (A) | Net asset value per share, as illustrated, is the amount which would be paid upon redemption or repurchase of shares. |
| (B) | See the current prospectus for purchases of $50,000 or more. |
The following foreign currency exchange contracts were outstanding at November 30, 2012:1
Foreign Currency Exchange Contracts
| | | | | | | | Unrealized |
| | | | | | | | Appreciation |
| Counterparty | | Contracts to Receive (Deliver) | | In Exchange For | | Settlement Date | | (Depreciation) |
| MNB | | KRW | (5,231,649,360 | ) | | USD | 4,827,133 | | 12/3/12 | | | $ | (5,108 | ) | |
| MNB | | MYR | (1,347,116 | ) | | USD | 441,750 | | 12/4/12 | | | | (1,288 | ) | |
| MNB | | MYR | (1,730,416 | ) | | USD | 568,842 | | 12/5/12 | | | | (213 | ) | |
| MNB | | TRY | (338,660 | ) | | USD | 189,301 | | 12/3/12 | | | | (107 | ) | |
| MNB | | TRY | (409,609 | ) | | USD | 229,114 | | 12/4/12 | | | | 53 | | |
| MNB | | ZAR | (129,481 | ) | | USD | 14,576 | | 12/5/12 | | | | 23 | | |
| | | | | | | | | | | | $ | (6,640 | ) | |
The use of foreign currency exchange contracts involves elements of market risk and risks in excess of the amounts recognized in the financial statements. The foreign currency exchange contracts presented above represent the Fund’s total exposure in such contracts, whereas only the net unrealized appreciation (depreciation) is reflected in the Fund’s net assets.
1See Note 8 in “Notes to financial statements.”
41
Statements of net assets
Delaware Emerging Market Fund
Summary of abbreviations:
ADR — American Depositary Receipt
GDR — Global Depositary Receipt
KRW — South Korean Won
LEPO — Low Exercise Price Option
MNB — Mellon National Bank
MYR — Malaysian Ringgit
TRY — Turkish Lira
USD — United States Dollar
ZAR — South African Rand
See accompanying notes, which are an integral part of the financial statements.
42
| Delaware Global Value Fund | November 30, 2012 |
| | | Number of shares | | Value (U.S. $) |
| ΔCommon Stock – 100.03% | | | | | | |
| Canada – 4.56% | | | | | | |
| † | AuRico Gold | | 82,095 | | | $ | 648,760 |
| † | CGI Group Class A | | 22,764 | | | | 522,494 |
| | | | | | | 1,171,254 |
| China/Hong Kong – 3.35% | | | | | | |
| CNOOC | | 231,000 | | | | 494,178 |
| Yue Yuen Industrial Holdings | | 104,500 | | | | 366,078 |
| | | | | | | 860,256 |
| Denmark – 1.88% | | | | | | |
| Carlsberg Class B | | 4,949 | | | | 481,847 |
| | | | | | | 481,847 |
| France – 10.20% | | | | | | |
| | Alstom | | 6,313 | | | | 229,767 |
| AXA | | 27,404 | | | | 450,315 |
| Lafarge | | 5,477 | | | | 318,189 |
| PPR | | 1,477 | | | | 275,459 |
| Sanofi | | 2,945 | | | | 262,976 |
| Teleperformance | | 16,296 | | | | 567,145 |
| Total | | 10,323 | | | | 516,549 |
| | | | | | | 2,620,400 |
| Germany – 1.11% | | | | | | |
| Bayerische Motoren Werke | | 3,220 | | | | 285,564 |
| | | | | | | 285,564 |
| Israel – 2.36% | | | | | | |
| Teva Pharmaceutical Industries ADR | | 15,000 | | | | 605,250 |
| | | | | | | 605,250 |
| Japan – 9.85% | | | | | | |
| Don Quijote | | 6,400 | | | | 248,857 |
| East Japan Railway | | 6,800 | | | | 446,320 |
| ITOCHU | | 41,853 | | | | 418,403 |
| KDDI | | 5,921 | | | | 438,194 |
| Mitsubishi UFJ Financial Group | | 55,354 | | | | 253,181 |
| Nitori Holdings | | 4,657 | | | | 346,344 |
| Toyota Motor | | 8,850 | | | | 379,554 |
| | | | | | | 2,530,853 |
43
Statements of net assets
Delaware Global Value Fund
| | | Number of shares | | Value (U.S. $) |
| ΔCommon Stock (continued) | | | | | | |
| Netherlands – 1.48% | | | | | | |
| Koninklijke Philips Electronics | | 14,734 | | | $ | 380,563 |
| | | | | | | 380,563 |
| Norway – 1.65% | | | | | | |
| * | Subsea 7 | | 18,569 | | | | 424,489 |
| | | | | | | 424,489 |
| Panama – 1.62% | | | | | | |
| | Copa Holdings Class A | | 4,400 | | | | 417,296 |
| | | | | | | 417,296 |
| Russia – 1.27% | | | | | | |
| Mobile Telesystems ADR | | 18,700 | | | | 325,941 |
| | | | | | | 325,941 |
| Switzerland – 4.39% | | | | | | |
| † | Aryzta | | 13,011 | | | | 657,781 |
| Transocean | | 10,200 | | | | 471,240 |
| | | | | | | 1,129,021 |
| United Kingdom – 8.61% | | | | | | |
| Greggs | | 54,625 | | | | 420,771 |
| * | National Grid | | 30,790 | | | | 347,767 |
| Rexam | | 24,202 | | | | 169,714 |
| Rio Tinto | | 9,091 | | | | 450,559 |
| Standard Chartered | | 21,855 | | | | 509,452 |
| Vodafone Group | | 121,917 | | | | 314,763 |
| | | | | | | 2,213,026 |
| United States – 47.70% | | | | | | |
| † | AGCO | | 10,000 | | | | 461,500 |
| American Express | | 8,600 | | | | 480,740 |
| Carnival | | 12,800 | | | | 494,848 |
| Caterpillar | | 4,900 | | | | 417,676 |
| Chevron | | 3,900 | | | | 412,191 |
| Cintas | | 9,500 | | | | 393,680 |
| † | Delphi Automotive | | 14,700 | | | | 499,653 |
| Goldman Sachs Group | | 4,700 | | | | 553,613 |
| International Business Machines | | 2,400 | | | | 456,168 |
| Johnson & Johnson | | 11,700 | | | | 815,841 |
| JPMorgan Chase | | 18,300 | | | | 751,764 |
| Lowe’s | | 12,900 | | | | 465,561 |
44
| | | | Number of shares | | Value (U.S. $) |
| ΔCommon Stock (continued) | | | | | | | | |
| United States (continued) | | | | | | | | |
| Microsoft | | | | 28,200 | | | $ | 750,684 |
| † | Mylan | | | | 29,300 | | | | 796,374 |
| Newmont Mining | | | | 12,400 | | | | 583,916 |
| Omnicom Group | | | | 5,400 | | | | 268,596 |
| Pfizer | | | | 27,600 | | | | 690,552 |
| Rent-A-Center | | | | 14,100 | | | | 490,116 |
| Time Warner | | | | 14,500 | | | | 685,850 |
| Travelers | | | | 10,400 | | | | 736,528 |
| Viacom Class B | | | | 9,000 | | | | 464,490 |
| | Wells Fargo | | | | 17,700 | | | | 584,277 |
| | | | | | | | | 12,254,618 |
| Total Common Stock (cost $23,809,342) | | | | | | | | 25,700,378 |
| |
| | Principal | | | |
| | amount (U.S. $) | | | |
| Short-Term Investments – 1.50% | | | | | | | | |
| ≠Discount Notes – 0.37% | | | | | | | | |
| Federal Home Loan Bank | | | | | | | | |
| 0.10% 1/18/13 | | | $ | 11,829 | | | | 11,828 |
| 0.10% 1/23/13 | | | | 45,916 | | | | 45,912 |
| 0.13% 2/6/13 | | | | 31,130 | | | | 31,126 |
| 0.135% 2/15/13 | | | | 6,848 | | | | 6,848 |
| | | | | | | | | 95,714 |
| Repurchase Agreements – 1.13% | | | | | | | | |
| Bank of America 0.19%, dated 11/30/12, to be | | | | | | | | |
| repurchased on 12/3/12, repurchase price | | | | | | | | |
| $103,929 (collateralized by U.S. government | | | | | | | | |
| obligations 0.00%-0.25% 1/3/13-11/30/14; | | | | | | | | |
| market value $106,006) | | | | 103,928 | | | | 103,928 |
| BNP Paribas 0.20%, dated 11/30/12, to be repurchased | | | | | | | | |
| on 12/3/12, repurchase price $186,075 (collateralized | | | | | | | | |
| by U.S. government obligations 0.25%-2.50% | | | | | | | | |
| 3/31/14-11/30/17; market value $189,935) | | | | 186,072 | | | | 186,072 |
| | | | | | | | | 290,000 |
| Total Short-Term Investments (cost $385,706) | | | | | | | | 385,714 |
| |
| Total Value of Securities Before Securities | | | | | | | | |
| Lending Collateral – 101.53% (cost $24,195,048) | | | | | | | | 26,086,092 |
45
Statements of net assets
Delaware Global Value Fund
| | | Number of shares | | Value (U.S. $) | |
| **Securities Lending Collateral – 2.34% | | | | | | | |
| Investment Companies | | | | | | | |
| Delaware Investments Collateral Fund No. 1 | | 600,854 | | | $ | 600,854 | |
| @†Mellon GSL Reinvestment Trust II | | 142,101 | | | | 0 | |
| Total Securities Lending Collateral (cost $742,955) | | | | | | 600,854 | |
| | | | | | | | |
| Total Value of Securities – 103.87% | | | | | | | |
| (cost $24,938,003) | | | | | | 26,686,946 | © |
| | | | | | | | | |
| **Obligation to Return Securities | | | | | | | |
| Lending Collateral – (2.89%) | | | | | | (742,955 | ) |
| Other Liabilities Net of Receivables and | | | | | | | |
| Other Assets – (0.98%) | | | | | | (252,382 | ) |
| Net Assets Applicable to 2,865,700 Shares | | | | | | | |
| Outstanding – 100.00% | | | | | $ | 25,691,609 | |
| | | | | | | | | |
| Net Asset Value – Delaware Global Value Fund | | | | | | | |
| Class A ($16,479,042 / 1,829,036 Shares) | | | | | | | $9.01 | |
| Net Asset Value – Delaware Global Value Fund | | | | | | | |
| Class B ($1,402,777 / 158,621 Shares) | | | | | | | $8.84 | |
| Net Asset Value – Delaware Global Value Fund | | | | | | | |
| Class C ($5,877,564 / 664,448 Shares) | | | | | | | $8.85 | |
| Net Asset Value – Delaware Global Value Fund | | | | | | | |
| Institutional Class ($1,932,226 / 213,595 Shares) | | | | | | | $9.05 | |
| | | | | | | | | |
| Components of Net Assets at November 30, 2012: | | | | | | | |
| Shares of beneficial interest (unlimited authorization – no par) | | | | | $ | 51,126,833 | |
| Undistributed net investment income | | | | | | 226,953 | |
| Accumulated net realized loss on investments and derivatives | | | | | | (27,409,636 | ) |
| Net unrealized appreciation of investments and derivatives | | | | | | 1,747,459 | |
| Total net assets | | | | | $ | 25,691,609 | |
46
| |
| Δ | Securities have been classified by country of origin. Classification by type of business has been presented on page 28 in “Security type/country and sector allocations.” |
| † | Non income producing security. |
| * | Fully or partially on loan. |
| ≠ | The rate shown is the effective yield at the time of purchase. |
| ** | See Note 9 in “Notes to financial statements” for additional information on securities lending collateral. |
| @ | Illiquid security. At November 30, 2012, the aggregate value of illiquid securities was $0, which represented 0.00% of the Fund’s net assets. See Note 10 in “Notes to financial statements.” |
| © | Includes $700,448 of securities loaned. |
| Net Asset Value and Offering Price Per Share – | | | |
| Delaware Global Value Fund | | | |
| Net asset value Class A (A) | | $ | 9.01 |
| Sales charge (5.75% of offering price) (B) | | | 0.55 |
| Offering price | | $ | 9.56 |
| (A) | Net asset value per share, as illustrated, is the amount which would be paid upon redemption or repurchase of shares. |
| (B) | See the current prospectus for purchases of $50,000 or more. |
The following foreign currency exchange contracts were outstanding at November 30, 2012:1
Foreign Currency Exchange Contract
| | | | | | | | | | | | Unrealized |
| | Contract to | | | | | | | | Appreciation |
| Counterparty | | | Receive (Deliver) | | In Exchange For | | Settlement Date | | (Depreciation) |
| MNB | | EUR | 131,898 | | | USD | (171,784 | ) | | 12/5/12 | | | $ | (235 | ) | |
| MNB | | GBP | (53,686 | ) | | USD | 85,866 | | | 12/5/12 | | | | (144 | ) | |
| | | | | | | | | | | | | $ | (379 | ) | |
The use of foreign currency exchange contracts involves elements of market risk and risks in excess of the amount recognized in the financial statements. The foreign currency exchange contracts presented above represent the Fund’s total exposure in such contracts, whereas only the net unrealized appreciation (depreciation) is reflected in the Fund’s net assets.
1See Note 8 in “Notes to financial statements.”
47
Statements of net assets
Delaware Global Value Fund
Summary of abbreviations:
ADR — American Depositary Receipt
EUR — European Monetary Unit
GBP — British Pound
MNB — Mellon National Bank
USD — United States Dollar
See accompanying notes, which are an integral part of the financial statements.
48
| Statements of operations | |
| Delaware International Funds | Year Ended November 30, 2012 |
| | Delaware | | Delaware | | Delaware |
| | International | | Emerging | | Global |
| | Value Equity | | Markets | | Value |
| | Fund | | Fund | | Fund |
| Investment Income: | | | | | | | | | | | | |
| Dividends | | $ | 7,013,520 | | | $ | 51,115,259 | | | $ | 729,771 | |
| Securities lending income | | | 223,991 | | | | 1,900,547 | | | | 10,315 | |
| Interest | | | 7,050 | | | | 910,931 | | | | 454 | |
| Foreign tax withheld | | | (547,385 | ) | | | (4,192,956 | ) | | | (33,011 | ) |
| | | 6,697,176 | | | | 49,733,781 | | | | 707,529 | |
| |
| Expenses: | | | | | | | | | | | | |
| Management fees | | | 1,924,108 | | | | 25,740,510 | | | | 228,891 | |
| Distribution expenses – Class A | | | 292,996 | | | | 1,520,245 | | | | 51,442 | |
| Distribution expenses – Class B | | | 36,930 | | | | 108,883 | | | | 17,788 | |
| Distribution expenses – Class C | | | 313,350 | | | | 1,737,264 | | | | 62,294 | |
| Distribution expenses – Class R | | | 13,436 | | | | 12,506 | | | | — | |
| Dividend disbursing and transfer agent | | | | | | | | | | | | |
| fees and expenses | | | 439,160 | | | | 2,565,820 | | | | 57,457 | |
| Accounting and administration expenses | | | 88,430 | | | | 849,535 | | | | 10,520 | |
| Custodian fees | | | 86,849 | | | | 1,386,198 | | | | 15,898 | |
| Registration fees | | | 68,325 | | | | 103,009 | | | | 52,008 | |
| Reports and statements to shareholders | | | 35,461 | | | | 391,436 | | | | 10,856 | |
| Audit and tax | | | 21,252 | | | | 124,476 | | | | 16,273 | |
| Legal fees | | | 15,870 | | | | 173,447 | | | | 2,214 | |
| Dues and services | | | 10,486 | | | | 20,023 | | | | 8,102 | |
| Trustees’ fees | | | 10,401 | | | | 100,907 | | | | 1,240 | |
| Insurance fees | | | 4,594 | | | | 46,399 | | | | 581 | |
| Pricing fees | | | 3,831 | | | | 5,761 | | | | 3,364 | |
| Consulting fees | | | 1,813 | | | | 18,468 | | | | 229 | |
| Trustees’ expenses | | | 701 | | | | 6,813 | | | | 85 | |
| | | | 3,367,993 | | | | 34,911,700 | | | | 539,242 | |
| Less fees waived | | | (8,007 | ) | | | — | | | | (57,252 | ) |
| Less waived distribution expenses – Class A | | | (31,856 | ) | | | (253,374 | ) | | | (8,573 | ) |
| Less waived distribution expenses – Class R | | | (2,239 | ) | | | (2,084 | ) | | | — | |
| Less expense paid indirectly | | | (890 | ) | | | (4,835 | ) | | | (160 | ) |
| Total operating expenses | | | 3,325,001 | | | | 34,651,407 | | | | 473,257 | |
| Net Investment Income | | | 3,372,175 | | | | 15,082,374 | | | | 234,272 | |
50
| | Delaware | | Delaware | | Delaware |
| | International | | Emerging | | Global |
| | Value Equity | | Markets | | Value |
| | Fund | | Fund | | Fund |
| Net Realized and Unrealized | | | | | | | | | | | | |
| Gain (Loss): | | | | | | | | | | | | |
| Net realized gain (loss) on: | | | | | | | | | | | | |
| Investments | | $ | (8,261,107 | ) | | $ | (38,382,610 | ) | | $ | 1,732,779 | |
| Foreign currencies | | | (231,248 | ) | | | (1,147,882 | ) | | | (12,075 | ) |
| Foreign currency exchange contracts | | | (155,787 | ) | | | (928,056 | ) | | | (13,910 | ) |
| Net realized gain (loss) | | | (8,648,142 | ) | | | (40,458,548 | ) | | | 1,706,794 | |
| Net change in unrealized | | | | | | | | | | | | |
| appreciation (depreciation) of: | | | | | | | | | | | | |
| Investments | | | 27,360,557 | | | | 145,551,227 | | | | 447,958 | |
| Foreign currencies | | | 14,203 | | | | (485,906 | ) | | | (1,053 | ) |
| Foreign currency exchange contracts | | | (2,485 | ) | | | (6,640 | ) | | | (364 | ) |
| Net change in unrealized | | | | | | | | | | | | |
| appreciation (depreciation) | | | 27,372,275 | | | | 145,058,681 | | | | 446,541 | |
| Net Realized and Unrealized Gain | | | 18,724,133 | | | | 104,600,133 | | | | 2,153,335 | |
| |
| Net Increase in Net Assets Resulting | | | | | | | | | | | | |
| from Operations | | $ | 22,096,308 | | | $ | 119,682,507 | | | $ | 2,387,607 | |
See accompanying notes, which are an integral part of the financial statements.
51
Statements of changes in net assets
Delaware International Value Equity Fund
| | Year Ended |
| | 11/30/12 | | 11/30/11 |
| Increase (Decrease) in Net Assets from Operations: | | | | | | | | |
| Net investment income | | $ | 3,372,175 | | | $ | 5,189,743 | |
| Net realized loss | | | (8,648,142 | ) | | | (9,566,805 | ) |
| Net change in unrealized appreciation (depreciation) | | | 27,372,275 | | | | (8,017,689 | ) |
| Net increase (decrease) in net assets resulting | | | | | | | | |
| from operations | | | 22,096,308 | | | | (12,394,751 | ) |
| |
| Dividends and Distributions to Shareholders from: | | | | | | | | |
| Net investment income: | | | | | | | | |
| Class A | | | (1,835,892 | ) | | | (1,173,093 | ) |
| Class B | | | (44,972 | ) | | | (17,757 | ) |
| Class C | | | (336,690 | ) | | | (105,750 | ) |
| Class R | | | (36,492 | ) | | | (21,894 | ) |
| Institutional Class | | | (1,910,330 | ) | | | (1,605,333 | ) |
| | | | (4,164,376 | ) | | | (2,923,827 | ) |
| |
| Capital Share Transactions: | | | | | | | | |
| Proceeds from shares sold: | | | | | | | | |
| Class A | | | 12,137,244 | | | | 19,883,118 | |
| Class B | | | 43,440 | | | | 139,537 | |
| Class C | | | 2,150,430 | | | | 2,041,545 | |
| Class R | | | 589,934 | | | | 828,070 | |
| Institutional Class | | | 41,627,804 | | | | 33,455,671 | |
| |
| Net asset value of shares issued upon reinvestment | | | | | | | | |
| of dividends and distributions: | | | | | | | | |
| Class A | | | 1,753,383 | | | | 1,101,145 | |
| Class B | | | 43,418 | | | | 16,437 | |
| Class C | | | 322,306 | | | | 100,812 | |
| Class R | | | 36,492 | | | | 21,894 | |
| Institutional Class | | | 1,827,621 | | | | 1,572,059 | |
| | | 60,532,072 | | | | 59,160,288 | |
52
| Year Ended |
| 11/30/12 | | 11/30/11 |
| Capital Share Transactions (continued): | | | | | | | |
| Cost of shares redeemed: | | | | | | | |
| Class A | $ | (31,365,263 | ) | | $ | (41,504,707 | ) |
| Class B | | (2,061,939 | ) | | | (2,897,352 | ) |
| Class C | | (7,591,728 | ) | | | (10,434,111 | ) |
| Class R | | (828,313 | ) | | | (1,552,056 | ) |
| Institutional Class | | (33,252,271 | ) | | | (75,801,677 | ) |
| | | (75,099,514 | ) | | | (132,189,903 | ) |
| Decrease in net assets derived from | | | | | | | |
| capital share transactions | | (14,567,442 | ) | | | (73,029,615 | ) |
| Net Increase (Decrease) in Net Assets | | 3,364,490 | | | | (88,348,193 | ) |
| |
| Net Assets: | | | | | | | |
| Beginning of year | | 233,699,256 | | | | 322,047,449 | |
| End of year | $ | 237,063,746 | | | $ | 233,699,256 | |
| |
| Undistributed net investment income | $ | 2,975,693 | | | $ | 4,148,092 | |
See accompanying notes, which are an integral part of the financial statements.
53
Statements of changes in net assets
Delaware Emerging Markets Fund
| Year Ended |
| 11/30/12 | | 11/30/11 |
| Increase (Decrease) in Net Assets from Operations: | | | | | | | |
| Net investment income | $ | 15,082,374 | | | $ | 16,469,321 | |
| Net realized gain (loss) | | (40,458,548 | ) | | | 22,896,221 | |
| Net change in unrealized appreciation (depreciation) | | 145,058,681 | | | | (460,824,291 | ) |
| Net increase (decrease) in net assets resulting | | | | | | | |
| from operations | | 119,682,507 | | | | (421,458,749 | ) |
| |
| Dividends and Distributions to Shareholders from: | | | | | | | |
| Net investment income: | | | | | | | |
| Class A | | (5,190,178 | ) | | | (3,194,266 | ) |
| Class B | | (27,163 | ) | | | — | |
| Class C | | (395,824 | ) | | | — | |
| Class R | | (11,209 | ) | | | (1,746 | ) |
| Institutional Class | | (20,800,480 | ) | | | (5,624,704 | ) |
| |
| Net realized gain: | | | | | | | |
| Class A | | (5,549,636 | ) | | | — | |
| Class B | | (144,971 | ) | | | — | |
| Class C | | (2,116,135 | ) | | | — | |
| Class R | | (16,575 | ) | | | — | |
| Institutional Class | | (17,312,975 | ) | | | — | |
| | | (51,565,146 | ) | | | (8,820,716 | ) |
| |
| Capital Share Transactions: | | | | | | | |
| Proceeds from shares sold: | | | | | | | |
| Class A | | 124,754,308 | | | | 343,273,465 | |
| Class B | | 33,542 | | | | 257,018 | |
| Class C | | 17,529,258 | | | | 63,603,869 | |
| Class R | | 2,606,649 | | | | 2,058,526 | |
| Institutional Class | | 571,758,270 | | | | 1,787,746,622 | |
| |
| Net asset value of shares issued upon reinvestment | | | | | | | |
| of dividends and distributions: | | | | | | | |
| Class A | | 9,750,742 | | | | 2,906,300 | |
| Class B | | 151,045 | | | | — | |
| Class C | | 2,357,110 | | | | — | |
| Class R | | 27,784 | | | | 1,745 | |
| Institutional Class | | 16,511,120 | | | | 2,798,475 | |
| | 745,479,828 | | | | 2,202,646,020 | |
54
| | Year Ended |
| | 11/30/12 | | 11/30/11 |
| Capital Share Transactions (continued): | | | | | | | | |
| Cost of shares redeemed: | | | | | | | | |
| Class A | | $ | (220,711,872 | ) | | $ | (260,791,880 | ) |
| Class B | | | (4,887,729 | ) | | | (4,125,996 | ) |
| Class C | | | (63,877,104 | ) | | | (61,422,877 | ) |
| Class R | | | (1,517,199 | ) | | | (763,330 | ) |
| Institutional Class | | | (1,091,975,122 | ) | | | (465,416,121 | ) |
| | | | (1,382,969,026 | ) | | | (792,520,204 | ) |
| Increase (Decrease) in net assets derived from | | | | | | | | |
| capital share transactions | | | (637,489,198 | ) | | | 1,410,125,816 | |
| Net Increase (Decrease) in Net Assets | | | (569,371,837 | ) | | | 979,846,351 | |
| |
| Net Assets: | | | | | | | | |
| Beginning of year | | | 2,423,858,498 | | | | 1,444,012,147 | |
| End of year | | $ | 1,854,486,661 | | | $ | 2,423,858,498 | |
| |
| Undistributed net investment income | | $ | 5,121,019 | | | $ | 14,021,994 | |
See accompanying notes, which are an integral part of the financial statements.
55
Statements of changes in net assets
Delaware Global Value Fund
| | Year Ended |
| | 11/30/12 | | 11/30/11 |
| Increase (Decrease) in Net Assets from Operations: | | | | | | | | |
| Net investment income | | $ | 234,272 | | | $ | 301,876 | |
| Net realized gain | | | 1,706,794 | | | | 813,083 | |
| Net change in unrealized appreciation (depreciation) | | | 446,541 | | �� | | (670,445 | ) |
| Net increase in net assets resulting | | | | | | | | |
| from operations | | | 2,387,607 | | | | 444,514 | |
| |
| Dividends and Distributions to Shareholders from: | | | | | | | | |
| Net investment income: | | | | | | | | |
| Class A | | | (196,665 | ) | | | (94,193 | ) |
| Class B | | | (7,253 | ) | | | — | |
| Class C | | | (20,812 | ) | | | — | |
| Institutional Class | | | (22,654 | ) | | | (11,418 | ) |
| | | (247,384 | ) | | | (105,611 | ) |
| |
| Capital Share Transactions: | | | | | | | | |
| Proceeds from shares sold: | | | | | | | | |
| Class A | | | 1,517,979 | | | | 3,344,875 | |
| Class B | | | 654 | | | | 42,034 | |
| Class C | | | 451,134 | | | | 841,540 | |
| Institutional Class | | | 361,033 | | | | 454,434 | |
| |
| Net asset value of shares issued upon reinvestment | | | | | | | | |
| of dividends and distributions: | | | | | | | | |
| Class A | | | 180,112 | | | | 82,808 | |
| Class B | | | 5,392 | | | | — | |
| Class C | | | 18,172 | | | | — | |
| Institutional Class | | | 21,769 | | | | 10,965 | |
| | | 2,556,245 | | | | 4,776,656 | |
56
| | Year Ended |
| | 11/30/12 | | 11/30/11 |
| Capital Share Transactions (continued): | | | | | | | | |
| Cost of shares redeemed: | | | | | | | | |
| Class A | | $ | (4,555,099 | ) | | $ | (6,467,989 | ) |
| Class B | | | (1,136,796 | ) | | | (870,342 | ) |
| Class C | | | (1,817,189 | ) | | | (2,396,490 | ) |
| Institutional Class | | | (280,080 | ) | | | (446,602 | ) |
| | | | (7,789,164 | ) | | | (10,181,423 | ) |
| Decrease in net assets derived from | | | | | | | | |
| capital share transactions | | | (5,232,919 | ) | | | (5,404,767 | ) |
| Net Decrease in Net Assets | | | (3,092,696 | ) | | | (5,065,864 | ) |
| |
| Net Assets: | | | | | | | | |
| Beginning of year | | | 28,784,305 | | | | 33,850,169 | |
| End of year | | $ | 25,691,609 | | | $ | 28,784,305 | |
| |
| Undistributed net investment income | | $ | 226,953 | | | $ | 245,163 | |
See accompanying notes, which are an integral part of the financial statements.
57
Financial highlights
Delaware International Value Equity Fund Class A
Selected data for each share of the Fund outstanding throughout each period were as follows:
| Net asset value, beginning of period |
| |
| Income (loss) from investment operations: |
| Net investment income1 |
| Net realized and unrealized gain (loss) |
| Total from investment operations |
| |
| Less dividends and distributions from: |
| Net investment income |
| Net realized gain |
| Total dividends and distributions |
| |
| Net asset value, end of period |
| |
| Total return2 |
| |
| Ratios and supplemental data: |
| Net assets, end of period (000 omitted) |
| Ratio of expenses to average net assets |
| Ratio of expenses to average net assets |
| prior to fees waived |
| Ratio of net investment income to average net assets |
| Ratio of net investment income to average net assets |
| prior to fees waived |
| Portfolio turnover |
| 1 The average shares outstanding method has been applied for per share information. |
| 2 Total investment return is based on the change in net asset value of a share during the period and assumes reinvestment of dividends and distributions at net asset value and does not reflect the impact of a sales charge. Total investment return during some of the periods shown reflects waivers by the manager and/or distributor. Performance would have been lower had the waivers not been in effect. |
See accompanying notes, which are an integral part of the financial statements.
58
| | Year Ended |
| | 11/30/12 | | 11/30/11 | | 11/30/10 | | 11/30/09 | | 11/30/08 | |
| | $10.710 | | | $11.570 | | | $11.400 | | | $8.120 | | | $16.750 | | |
| | | | |
| | | | |
| | 0.164 | | | 0.211 | | | 0.136 | | | 0.212 | | | 0.288 | | |
| | 0.909 | | | (0.966 | ) | | 0.266 | | | 3.375 | | | (7.995 | ) | |
| | 1.073 | | | (0.755 | ) | | 0.402 | | | 3.587 | | | (7.707 | ) | |
| | | | |
| | | | |
| | (0.193 | ) | | (0.105 | ) | | (0.232 | ) | | (0.307 | ) | | (0.204 | ) | |
| | — | | | — | | | — | | | — | | | (0.719 | ) | |
| | (0.193 | ) | | (0.105 | ) | | (0.232 | ) | | (0.307 | ) | | (0.923 | ) | |
| | | | |
| | $11.590 | | | $10.710 | | | $11.570 | | | $11.400 | | | $8.120 | | |
| | | | |
| | 10.25% | | | (6.64% | ) | | 3.60% | | | 44.76% | | | (48.60% | ) | |
| | | | |
| | | | |
| | $93,440 | | | $103,418 | | | $130,865 | | | $154,721 | | | $178,072 | | |
| | 1.47% | | | 1.59% | | | 1.65% | | | 1.52% | | | 1.40% | | |
| | | | |
| | 1.50% | | | 1.59% | | | 1.69% | | | 1.78% | | | 1.49% | | |
| | 1.49% | | | 1.70% | | | 1.21% | | | 2.33% | | | 2.19% | | |
| | | | |
| | 1.46% | | | 1.70% | | | 1.17% | | | 2.07% | | | 2.10% | | |
| | 34% | | | 42% | | | 37% | | | 35% | | | 32% | | |
59
Financial highlights
Delaware International Value Equity Fund Class B
Selected data for each share of the Fund outstanding throughout each period were as follows:
| Net asset value, beginning of period |
| |
| Income (loss) from investment operations: |
| Net investment income1 |
| Net realized and unrealized gain (loss) |
| Total from investment operations |
| |
| Less dividends and distributions from: |
| Net investment income |
| Net realized gain |
| Total dividends and distributions |
| |
| Net asset value, end of period |
| |
| Total return2 |
| |
| Ratios and supplemental data: |
| Net assets, end of period (000 omitted) |
| Ratio of expenses to average net assets |
| Ratio of expenses to average net assets |
| prior to fees waived |
| Ratio of net investment income to average net assets |
| Ratio of net investment income to average net assets |
| prior to fees waived |
| Portfolio turnover |
| 1 The average shares outstanding method has been applied for per share information. |
| 2 Total investment return is based on the change in net asset value of a share during the period and assumes reinvestment of dividends and distributions at net asset value and does not reflect the impact of a sales charge. Total investment return during some of the periods shown reflects a waiver by the manager. Performance would have been lower had the waiver not been in effect. |
See accompanying notes, which are an integral part of the financial statements.
60
| | Year Ended |
| | 11/30/12 | | 11/30/11 | | 11/30/10 | | 11/30/09 | | 11/30/08 | |
| | $10.520 | | | $11.380 | | | $11.230 | | | $7.980 | | | $16.470 | | |
| | | | |
| | | | |
| | 0.083 | | | 0.123 | | | 0.057 | | | 0.149 | | | 0.197 | | |
| | 0.906 | | | (0.955 | ) | | 0.260 | | | 3.322 | | | (7.876 | ) | |
| | 0.989 | | | (0.832 | ) | | 0.317 | | | 3.471 | | | (7.679 | ) | |
| | | | |
| | | | |
| | (0.109 | ) | | (0.028 | ) | | (0.167 | ) | | (0.221 | ) | | (0.092 | ) | |
| | — | | | — | | | — | | | — | | | (0.719 | ) | |
| | (0.109 | ) | | (0.028 | ) | | (0.167 | ) | | (0.221 | ) | | (0.811 | ) | |
| | | | |
| | $11.400 | | | $10.520 | | | $11.380 | | | $11.230 | | | $7.980 | | |
| | | | |
| | 9.53% | | | (7.35% | ) | | 2.86% | | | 43.65% | | | (48.95% | ) | |
| | | | |
| | | | |
| | $3,009 | | | $4,703 | | | $7,670 | | | $10,796 | | | $11,227 | | |
| | 2.20% | | | 2.29% | | | 2.35% | | | 2.22% | | | 2.10% | | |
| | | | |
| | 2.20% | | | 2.29% | | | 2.39% | | | 2.48% | | | 2.19% | | |
| | 0.76% | | | 1.00% | | | 0.51% | | | 1.63% | | | 1.49% | | |
| | | | |
| | 0.76% | | | 1.00% | | | 0.47% | | | 1.37% | | | 1.40% | | |
| | 34% | | | 42% | | | 37% | | | 35% | | | 32% | | |
61
Financial highlights
Delaware International Value Equity Fund Class C
Selected data for each share of the Fund outstanding throughout each period were as follows:
| Net asset value, beginning of period |
| |
| Income (loss) from investment operations: |
| Net investment income1 |
| Net realized and unrealized gain (loss) |
| Total from investment operations |
| |
| Less dividends and distributions from: |
| Net investment income |
| Net realized gain |
| Total dividends and distributions |
| |
| Net asset value, end of period |
| |
| Total return2 |
| |
| Ratios and supplemental data: |
| Net assets, end of period (000 omitted) |
| Ratio of expenses to average net assets |
| Ratio of expenses to average net assets |
| prior to fees waived |
| Ratio of net investment income to average net assets |
| Ratio of net investment income to average net assets |
| prior to fees waived |
| Portfolio turnover |
| 1 The average shares outstanding method has been applied for per share information. |
| 2 Total investment return is based on the change in net asset value of a share during the period and assumes reinvestment of dividends and distributions at net asset value and does not reflect the impact of a sales charge. Total investment return during some of the periods shown reflects a waiver by the manager. Performance would have been lower had the waiver not been in effect. |
See accompanying notes, which are an integral part of the financial statements.
62
| | Year Ended |
| | 11/30/12 | | 11/30/11 | | 11/30/10 | | 11/30/09 | | 11/30/08 | |
| | $10.510 | | | $11.370 | | | $11.220 | | | $7.960 | | | $16.450 | | |
| | | | |
| | | | |
| | 0.083 | | | 0.122 | | | 0.056 | | | 0.149 | | | 0.197 | | |
| | 0.896 | | | (0.954 | ) | | 0.261 | | | 3.332 | | | (7.876 | ) | |
| | 0.979 | | | (0.832 | ) | | 0.317 | | | 3.481 | | | (7.679 | ) | |
| | | | |
| | | | |
| | (0.109 | ) | | (0.028 | ) | | (0.167 | ) | | (0.221 | ) | | (0.092 | ) | |
| | — | | | — | | | — | | | — | | | (0.719 | ) | |
| | (0.109 | ) | | (0.028 | ) | | (0.167 | ) | | (0.221 | ) | | (0.811 | ) | |
| | | | |
| | $11.380 | | | $10.510 | | | $11.370 | | | $11.220 | | | $7.960 | | |
| | | | |
| | 9.53% | | | (7.35% | ) | | 2.87% | | | 43.71% | | | (49.01% | ) | |
| | | | |
| | | | |
| | $30,510 | | | $33,164 | | | $43,620 | | | $54,235 | | | $51,420 | | |
| | 2.20% | | | 2.29% | | | 2.35% | | | 2.22% | | | 2.10% | | |
| | | | |
| | 2.20% | | | 2.29% | | | 2.39% | | | 2.48% | | | 2.19% | | |
| | 0.76% | | | 1.00% | | | 0.51% | | | 1.63% | | | 1.49% | | |
| | | | |
| | 0.76% | | | 1.00% | | | 0.47% | | | 1.37% | | | 1.40% | | |
| | 34% | | | 42% | | | 37% | | | 35% | | | 32% | | |
63
Financial highlights
Delaware International Value Equity Fund Class R
Selected data for each share of the Fund outstanding throughout each period were as follows:
| Net asset value, beginning of period |
| |
| Income (loss) from investment operations: |
| Net investment income1 |
| Net realized and unrealized gain (loss) |
| Total from investment operations |
| |
| Less dividends and distributions from: |
| Net investment income |
| Net realized gain |
| Total dividends and distributions |
| |
| Net asset value, end of period |
| |
| Total return2 |
| |
| Ratios and supplemental data: |
| Net assets, end of period (000 omitted) |
| Ratio of expenses to average net assets |
| Ratio of expenses to average net assets |
| prior to fees waived |
| Ratio of net investment income to average net assets |
| Ratio of net investment income to average net assets |
| prior to fees waived |
| Portfolio turnover |
| 1 The average shares outstanding method has been applied for per share information. |
| 2 Total investment return is based on the change in net asset value of a share during the period and assumes reinvestment of dividends and distributions at net asset value. Total investment return during some of the periods shown reflects waivers by the manager and/or distributor. Performance would have been lower had the waivers not been in effect. |
See accompanying notes, which are an integral part of the financial statements.
64
| | Year Ended |
| | 11/30/12 | | 11/30/11 | | 11/30/10 | | 11/30/09 | | 11/30/08 | |
| | $10.660 | | | $11.520 | | | $11.360 | | | $8.080 | | | $16.670 | | |
| | | | |
| | | | |
| | 0.138 | | | 0.186 | | | 0.112 | | | 0.192 | | | 0.261 | | |
| | 0.911 | | | (0.965 | ) | | 0.259 | | | 3.370 | | | (7.960 | ) | |
| | 1.049 | | | (0.779 | ) | | 0.371 | | | 3.562 | | | (7.699 | ) | |
| | | | |
| | | | |
| | (0.169 | ) | | (0.081 | ) | | (0.211 | ) | | (0.282 | ) | | (0.172 | ) | |
| | — | | | — | | | — | | | — | | | (0.719 | ) | |
| | (0.169 | ) | | (0.081 | ) | | (0.211 | ) | | (0.282 | ) | | (0.891 | ) | |
| | | | |
| | $11.540 | | | $10.660 | | | $11.520 | | | $11.360 | | | $8.080 | | |
| | | | |
| | 10.13% | | | (6.85% | ) | | 3.32% | | | 44.55% | | | (48.70% | ) | |
| | | | |
| | | | |
| | $2,288 | | | $2,321 | | | $3,127 | | | $2,985 | | | $1,259 | | |
| | 1.70% | | | 1.79% | | | 1.85% | | | 1.72% | | | 1.60% | | |
| | | | |
| | 1.80% | | | 1.89% | | | 1.99% | | | 2.08% | | | 1.79% | | |
| | 1.26% | | | 1.50% | | | 1.01% | | | 2.13% | | | 1.99% | | |
| | | | |
| | 1.16% | | | 1.40% | | | 0.87% | | | 1.77% | | | 1.80% | | |
| | 34% | | | 42% | | | 37% | | | 35% | | | 32% | | |
65
Financial highlights
Delaware International Value Equity Fund Institutional Class
Selected data for each share of the Fund outstanding throughout each period were as follows:
| Net asset value, beginning of period |
| |
| Income (loss) from investment operations: |
| Net investment income1 |
| Net realized and unrealized gain (loss) |
| Total from investment operations |
| |
| Less dividends and distributions from: |
| Net investment income |
| Net realized gain |
| Total dividends and distributions |
| |
| Net asset value, end of period |
| |
| Total return2 |
| |
| Ratios and supplemental data: |
| Net assets, end of period (000 omitted) |
| Ratio of expenses to average net assets |
| Ratio of expenses to average net assets |
| prior to fees waived |
| Ratio of net investment income to average net assets |
| Ratio of net investment income to average net assets |
| prior to fees waived |
| Portfolio turnover |
| 1 The average shares outstanding method has been applied for per share information. |
| 2 Total investment return is based on the change in net asset value of a share during the period and assumes reinvestment of dividends and distributions at net asset value. Total investment return during some of the periods shown reflects a waiver by the manager. Performance would have been lower had the waiver not been in effect. |
See accompanying notes, which are an integral part of the financial statements.
66
| | Year Ended |
| | 11/30/12 | | 11/30/11 | | 11/30/10 | | 11/30/09 | | 11/30/08 | |
| | $10.770 | | | $11.630 | | | $11.450 | | | $8.170 | | | $16.850 | | |
| | | | |
| | | | |
| | 0.194 | | | 0.250 | | | 0.170 | | | 0.239 | | | 0.327 | | |
| | 0.916 | | | (0.972 | ) | | 0.270 | | | 3.385 | | | (8.034 | ) | |
| | 1.110 | | | (0.722 | ) | | 0.440 | | | 3.624 | | | (7.707 | ) | |
| | | | |
| | | | |
| | (0.230 | ) | | (0.138 | ) | | (0.260 | ) | | (0.344 | ) | | (0.254 | ) | |
| | — | | | — | | | — | | | — | | | (0.719 | ) | |
| | (0.230 | ) | | (0.138 | ) | | (0.260 | ) | | (0.344 | ) | | (0.973 | ) | |
| | | | |
| | $11.650 | | | $10.770 | | | $11.630 | | | $11.450 | | | $8.170 | | |
| | | | |
| | 10.59% | | | (6.36% | ) | | 3.93% | | | 45.13% | | | (48.44% | ) | |
| | | | |
| | | | |
| | $107,817 | | | $90,093 | | | $136,765 | | | $140,824 | | | $146,192 | | |
| | 1.20% | | | 1.29% | | | 1.35% | | | 1.22% | | | 1.10% | | |
| | | | |
| | 1.20% | | | 1.29% | | | 1.39% | | | 1.48% | | | 1.19% | | |
| | 1.76% | | | 2.00% | | | 1.51% | | | 2.63% | | | 2.49% | | |
| | | | |
| | 1.76% | | | 2.00% | | | 1.47% | | | 2.37% | | | 2.40% | | |
| | 34% | | | 42% | | | 37% | | | 35% | | | 32% | | |
67
Financial highlights
Delaware Emerging Markets Fund Class A
Selected data for each share of the Fund outstanding throughout each period were as follows:
| Net asset value, beginning of period |
| |
| Income (loss) from investment operations: |
| Net investment income1 |
| Net realized and unrealized gain (loss) |
| Total from investment operations |
| |
| Less dividends and distributions from: |
| Net investment income |
| Net realized gain |
| Total dividends and distributions |
| |
| Net asset value, end of period |
| |
| Total return2 |
| |
| Ratios and supplemental data: |
| Net assets, end of period (000 omitted) |
| Ratio of expenses to average net assets |
| Ratio of expenses to average net assets |
| to fees waived |
| Ratio of net investment income to average net assets |
| Ratio of net investment income to average net assets |
| prior to fees waived |
| Portfolio turnover |
| 1 The average shares outstanding method has been applied for per share information. |
| 2 Total investment return is based on the change in net asset value of a share during the period and assumes reinvestment of dividends and distributions at net asset value and does not reflect the impact of a sales charge. Total investment return during some of the periods shown reflects waivers by the manager and/or distributor. Performance would have been lower had the waivers not been in effect. |
See accompanying notes, which are an integral part of the financial statements.
68
| | Year Ended | | |
| | 11/30/12 | | 11/30/11 | | 11/30/10 | | 11/30/09 | | 11/30/08 | |
| | $13.050 | | | $14.860 | | | $12.880 | | | $7.940 | | | $22.760 | | |
| | | | |
| | | | |
| | 0.077 | | | 0.094 | | | 0.151 | | | 0.043 | | | 0.137 | | |
| | 0.642 | | | (1.819 | ) | | 1.834 | | | 5.736 | | | (9.242 | ) | |
| | 0.719 | | | (1.725 | ) | | 1.985 | | | 5.779 | | | (9.105 | ) | |
| | | | |
| | | | |
| | (0.130 | ) | | (0.085 | ) | | (0.005 | ) | | (0.016 | ) | | (0.234 | ) | |
| | (0.139 | ) | | — | | | — | | | (0.823 | ) | | (5.481 | ) | |
| | (0.269 | ) | | (0.085 | ) | | (0.005 | ) | | (0.839 | ) | | (5.715 | ) | |
| | | | |
| | $13.500 | | | $13.050 | | | $14.860 | | | $12.880 | | | $7.940 | | |
| | | | |
| | 5.67% | | | (11.70% | ) | | 15.42% | | | 79.84% | | | (53.37% | ) | |
| | | | |
| | | | |
| | $470,670 | | | $542,207 | | | $546,275 | | | $399,840 | | | $213,581 | | |
| | 1.70% | | | 1.78% | | | 1.85% | | | 1.91% | | | 1.83% | | |
| | | | |
| | 1.75% | | | 1.83% | | | 1.90% | | | 1.98% | | | 1.88% | | |
| | 0.59% | | | 0.63% | | | 1.10% | | | 0.45% | | | 0.94% | | |
| | | | |
| | 0.54% | | | 0.58% | | | 1.05% | | | 0.38% | | | 0.89% | | |
| | 15% | | | 19% | | | 27% | | | 37% | | | 37% | | |
69
Financial highlights
Delaware Emerging Markets Fund Class B
Selected data for each share of the Fund outstanding throughout each period were as follows:
| Net asset value, beginning of period |
| |
| Income (loss) from investment operations: |
| Net investment income (loss)1 |
| Net realized and unrealized gain (loss) |
| Total from investment operations |
| |
| Less dividends and distributions from: |
| Net investment income |
| Net realized gain |
| Total dividends and distributions |
| |
| Net asset value, end of period |
| |
| Total return2 |
| |
| Ratios and supplemental data: |
| Net assets, end of period (000 omitted) |
| Ratio of expenses to average net assets |
| Ratio of expenses to average net assets |
| to fees waived |
| Ratio of net investment income (loss) to average net assets |
| Ratio of net investment income (loss) to average net assets |
| prior to fees waived |
| Portfolio turnover |
| 1 The average shares outstanding method has been applied for per share information. |
| 2 Total investment return is based on the change in net asset value of a share during the period and assumes reinvestment of dividends and distributions at net asset value and does not reflect the impact of a sales charge. Total investment return during some of the periods shown reflects a waiver by the manager. Performance would have been lower had the waiver not been in effect. |
See accompanying notes, which are an integral part of the financial statements.
70
| | Year Ended | |
| | 11/30/12 | | 11/30/11 | | 11/30/10 | | 11/30/09 | | 11/30/08 | |
| | $12.340 | | | $14.080 | | | $12.300 | | $7.640 | | | $22.120 | | |
| | | | |
| | | | |
| | (0.020 | ) | | (0.018 | ) | | 0.046 | | (0.025 | ) | | 0.030 | | |
| | 0.615 | | | (1.722 | ) | | 1.734 | | 5.508 | | | (8.936 | ) | |
| | 0.595 | | | (1.740 | ) | | 1.780 | | 5.483 | | | (8.906 | ) | |
| | | | | |
| | | | |
| | (0.026 | ) | | — | | | — | | — | | | (0.093 | ) | |
| | (0.139 | ) | | — | | | — | | (0.823 | ) | | (5.481 | ) | |
| | (0.165 | ) | | — | | | — | | (0.823 | ) | | (5.574 | ) | |
| | | | | |
| | $12.770 | | | $12.340 | | | $14.080 | | $12.300 | | | $7.640 | | |
| | | | |
| | 4.84% | | | (12.36% | ) | | 14.47% | | 78.59% | | | (53.76% | ) | |
| | | | | |
| | | | |
| | $9,021 | | | $13,359 | | | $19,030 | | $20,022 | | | $14,620 | | |
| | 2.45% | | | 2.53% | | | 2.60% | | 2.66% | | | 2.58% | | |
| | | | | |
| | 2.45% | | | 2.53% | | | 2.60% | | 2.68% | | | 2.58% | | |
| | (0.16% | ) | | (0.12% | ) | | 0.35% | | (0.30% | ) | | 0.19% | | |
| | | | | |
| | (0.16% | ) | | (0.12% | ) | | 0.35% | | (0.32% | ) | | 0.19% | | |
| | 15% | | | 19% | | | 27% | | 37% | | | 37% | | |
71
Financial highlights
Delaware Emerging Markets Fund Class C
Selected data for each share of the Fund outstanding throughout each period were as follows:
| Net asset value, beginning of period |
| |
| Income (loss) from investment operations: |
| Net investment income (loss)1 |
| Net realized and unrealized gain (loss) |
| Total from investment operations |
| |
| Less dividends and distributions from: |
| Net investment income |
| Net realized gain |
| Total dividends and distributions |
| |
| Net asset value, end of period |
| |
| Total return2 |
| |
| Ratios and supplemental data: |
| Net assets, end of period (000 omitted) |
| Ratio of expenses to average net assets |
| Ratio of expenses to average net assets |
| to fees waived |
| Ratio of net investment income (loss) to average net assets |
| Ratio of net investment income (loss) to average net assets |
| prior to fees waived |
| Portfolio turnover |
| 1 The average shares outstanding method has been applied for per share information. |
| 2 Total investment return is based on the change in net asset value of a share during the period and assumes reinvestment of dividends and distributions at net asset value and does not reflect the impact of a sales charge. Total investment return during some of the periods shown reflects a waiver by the manager. Performance would have been lower had the waiver not been in effect. |
See accompanying notes, which are an integral part of the financial statements.
72
| | Year Ended | |
| | 11/30/12 | | 11/30/11 | | 11/30/10 | | 11/30/09 | | 11/30/08 | |
| | $12.320 | | | $14.050 | | | $12.270 | | $7.630 | | | $22.090 | | |
| | | | |
| | | | |
| | (0.020 | ) | | (0.017 | ) | | 0.046 | | (0.026 | ) | | 0.031 | | |
| | 0.605 | | | (1.713 | ) | | 1.734 | | 5.489 | | | (8.917 | ) | |
| | 0.585 | | | (1.730 | ) | | 1.780 | | 5.463 | | | (8.886 | ) | |
| | | | |
| | | | |
| | (0.026 | ) | | — | | | — | | — | | | (0.093 | ) | |
| | (0.139 | ) | | — | | | — | | (0.823 | ) | | (5.481 | ) | |
| | (0.165 | ) | | — | | | — | | (0.823 | ) | | (5.574 | ) | |
| | | | |
| | $12.740 | | | $12.320 | | | $14.050 | | $12.270 | | | $7.630 | | |
| | | | |
| | 4.85% | | | (12.31% | ) | | 14.51% | | 78.68% | | | (53.75% | ) | |
| | | | |
| | | | |
| | $155,040 | | | $194,124 | | | $222,957 | | $157,383 | | | $84,436 | | |
| | 2.45% | | | 2.53% | | | 2.60% | | 2.66% | | | 2.58% | | |
| | | | |
| | 2.45% | | | 2.53% | | | 2.60% | | 2.68% | | | 2.58% | | |
| | (0.16% | ) | | (0.12% | ) | | 0.35% | | (0.30% | ) | | 0.19% | | |
| | | | |
| | (0.16% | ) | | (0.12% | ) | | 0.35% | | (0.32% | ) | | 0.19% | | |
| | 15% | | | 19% | | | 27% | | 37% | | | 37% | | |
73
Financial highlights
Delaware Emerging Markets Fund Class R
Selected data for each share of the Fund outstanding throughout each period were as follows:
| Net asset value, beginning of period |
| |
| Income (loss) from investment operations: |
| Net investment income (loss)2 |
| Net realized and unrealized gain (loss) |
| Total from investment operations |
| |
| Less dividends and distributions from: |
| Net investment income |
| Net realized gain |
| Total dividends and distributions |
| |
| Net asset value, end of period |
| |
| Total return3 |
| |
| Ratios and supplemental data: |
| Net assets, end of period (000 omitted) |
| Ratio of expenses to average net assets |
| Ratio of expenses to average net assets |
| prior to fees waived |
| Ratio of net investment income (loss) to average net assets |
| Ratio of net investment income (loss) to average net assets |
| prior to fees waived |
| Portfolio turnover |
| 1 Date of commencement of operations; ratios have been annualized and total return has not been annualized. |
| 2 The average shares outstanding method has been applied for per share information. |
| 3 Total investment return is based on the change in net asset value of a share during the period and assumes reinvestment of dividends and distributions at net asset value. Total investment return during some of the periods shown reflects waivers by the manager and/or distributor. Performance would have been lower had the waivers not been in effect. |
See accompanying notes, which are an integral part of the financial statements.
74
| | | | | | | | | | | | 8/31/091 | |
| | Year Ended | | to | |
| | 11/30/12 | | 11/30/11 | | 11/30/10 | | | 11/30/09 | |
| | $13.140 | | | $14.960 | | | $13.010 | | | | $11.520 | | |
| | | | |
| | | | |
| | 0.044 | | | 0.056 | | | 0.123 | | | | (0.030 | ) | |
| | 0.649 | | | (1.833 | ) | | 1.832 | | | | 1.520 | | |
| | 0.693 | | | (1.777 | ) | | 1.955 | | | | 1.490 | | |
| | | | |
| | | | |
| | (0.094 | ) | | (0.043 | ) | | (0.005 | ) | | | — | | |
| | (0.139 | ) | | — | | | — | | | | — | | |
| | (0.233 | ) | | (0.043 | ) | | (0.005 | ) | | | — | | |
| | | | |
| | $13.600 | | | $13.140 | | | $14.960 | | | | $13.010 | | |
| | | | |
| | 5.41% | | | (11.93% | ) | | 15.03% | | | | 12.93% | | |
| | | | |
| | | | |
| | $2,691 | | | $1,500 | | | $440 | | | | $— | 4 | |
| | 1.95% | | | 2.03% | | | 2.10% | | | | 2.11% | | |
| | | | |
| | 2.05% | | | 2.13% | | | 2.20% | | | | 2.22% | | |
| | 0.34% | | | 0.38% | | | 0.85% | | | | (0.88% | ) | |
| | | | |
| | 0.24% | | | 0.28% | | | 0.75% | | | | (0.99% | ) | |
| | 15% | | | 19% | | | 27% | | | | 37% | 5 | |
| 4 Net assets were less than $500. |
| 5 Portfolio turnover is representative of the Fund for the entire year. |
75
Financial highlights
Delaware Emerging Markets Fund Institutional Class
Selected data for each share of the Fund outstanding throughout each period were as follows:
| Net asset value, beginning of period |
| |
| Income (loss) from investment operations: |
| Net investment income1 |
| Net realized and unrealized gain (loss) |
| Total from investment operations |
| |
| Less dividends and distributions from: |
| Net investment income |
| Net realized gain |
| Total dividends and distributions |
| |
| Net asset value, end of period |
| |
| Total return2 |
| |
| Ratios and supplemental data: |
| Net assets, end of period (000 omitted) |
| Ratio of expenses to average net assets |
| Ratio of expenses to average net assets |
| to fees waived |
| Ratio of net investment income to average net assets |
| Ratio of net investment income to average net assets |
| prior to fees waived |
| Portfolio turnover |
| 1 The average shares outstanding method has been applied for per share information. |
| 2 Total investment return is based on the change in net asset value of a share during the period and assumes reinvestment of dividends and distributions at net asset value. Total investment return during some of the periods shown reflects a waiver by the manager. Performance would have been lower had the waiver not been in effect. |
See accompanying notes, which are an integral part of the financial statements.
76
| | Year Ended | |
| | 11/30/12 | | 11/30/11 | | 11/30/10 | | 11/30/09 | | 11/30/08 | |
| | $13.160 | | | $14.970 | | | $12.980 | | | $8.000 | | | $22.910 | | |
| | | | |
| | | | |
| | 0.111 | | | 0.131 | | | 0.190 | | | 0.068 | | | 0.175 | | |
| | 0.635 | | | (1.821 | ) | | 1.831 | | | 5.786 | | | (9.321 | ) | |
| | 0.746 | | | (1.690 | ) | | 2.021 | | | 5.854 | | | (9.146 | ) | |
| | | | |
| | | | |
| | (0.167 | ) | | (0.120 | ) | | (0.031 | ) | | (0.051 | ) | | (0.283 | ) | |
| | (0.139 | ) | | — | | | — | | | (0.823 | ) | | (5.481 | ) | |
| | (0.306 | ) | | (0.120 | ) | | (0.031 | ) | | (0.874 | ) | | (5.764 | ) | |
| | | | |
| | $13.600 | | | $13.160 | | | $14.970 | | | $12.980 | | | $8.000 | | |
| | | | |
| | 5.86% | | | (11.42% | ) | | 15.69% | | | 80.39% | | | (53.30% | ) | |
| | | | |
| | | | |
| | $1,217,065 | | | $1,672,668 | | | $655,310 | | | $148,662 | | | $45,697 | | |
| | 1.45% | | | 1.53% | | | 1.60% | | | 1.66% | | | 1.58% | | |
| | | | |
| | 1.45% | | | 1.53% | | | 1.60% | | | 1.68% | | | 1.58% | | |
| | 0.84% | | | 0.88% | | | 1.35% | | | 0.70% | | | 1.19% | | |
| | | | |
| | 0.84% | | | 0.88% | | | 1.35% | | | 0.68% | | | 1.19% | | |
| | 15% | | | 19% | | | 27% | | | 37% | | | 37% | | |
77
Financial highlights
Delaware Global Value Fund Class A
Selected data for each share of the Fund outstanding throughout each period were as follows:
| Net asset value, beginning of period |
| |
| Income (loss) from investment operations: |
| Net investment income1 |
| Net realized and unrealized gain (loss) |
| Total from investment operations |
| |
| Less dividends and distributions from: |
| Net investment income |
| Net realized gain |
| Total dividends and distributions |
| |
| Net asset value, end of period |
| |
| Total return2 |
| |
| Ratios and supplemental data: |
| Net assets, end of period (000 omitted) |
| Ratio of expenses to average net assets |
| Ratio of expenses to average net assets |
| to fees waived |
| Ratio of net investment income to average net assets |
| Ratio of net investment income to average net assets |
| prior to fees waived |
| Portfolio turnover |
| 1 The average shares outstanding method has been applied for per share information. |
| 2 Total investment return is based on the change in net asset value of a share during the period and assumes reinvestment of dividends and distributions at net asset value and does not reflect the impact of a sales charge. Total investment return during all of the periods shown reflects waivers by the manager and distributor. Performance would have been lower had the waivers not been in effect. |
See accompanying notes, which are an integral part of the financial statements.
78
| | Year Ended | |
| | 11/30/12 | | 11/30/11 | | 11/30/10 | | 11/30/09 | | 11/30/08 | |
| | $8.310 | | | $8.300 | | | $8.050 | | | $5.790 | | | $11.850 | | |
| | | | |
| | | | |
| | 0.093 | | | 0.101 | | | 0.067 | | | 0.106 | | | 0.172 | | |
| | 0.699 | | | (0.053 | ) | | 0.293 | | | 2.315 | | | (5.554 | ) | |
| | 0.792 | | | 0.048 | | | 0.360 | | | 2.421 | | | (5.382 | ) | |
| | | | |
| | | | |
| | (0.092 | ) | | (0.038 | ) | | (0.110 | ) | | (0.161 | ) | | (0.138 | ) | |
| | — | | | — | | | — | | | — | | | (0.540 | ) | |
| | (0.092 | ) | | (0.038 | ) | | (0.110 | ) | | (0.161 | ) | | (0.678 | ) | |
| | | | |
| | $9.010 | | | $8.310 | | | $8.300 | | | $8.050 | | | $5.790 | | |
| | | | |
| | 9.65% | | | 0.55% | | | 4.53% | | | 42.14% | | | (48.12% | ) | |
| | | | |
| | | | |
| | $16,479 | | | $17,989 | | | $20,844 | | | $24,823 | | | $22,034 | | |
| | 1.55% | | | 1.55% | | | 1.55% | | | 1.56% | | | 1.45% | | |
| | | | |
| | 1.81% | | | 1.88% | | | 2.07% | | | 2.09% | | | 1.76% | | |
| | 1.08% | | | 1.12% | | | 0.84% | | | 1.66% | | | 1.84% | | |
| | | | |
| | 0.82% | | | 0.79% | | | 0.32% | | | 1.13% | | | 1.53% | | |
| | 69% | | | 40% | | | 50% | | | 47% | | | 78% | | |
79
Financial highlights
Delaware Global Value Fund Class B
Selected data for each share of the Fund outstanding throughout each period were as follows:
| Net asset value, beginning of period |
| |
| Income (loss) from investment operations: |
| Net investment income1 |
| Net realized and unrealized gain (loss) |
| Total from investment operations |
| |
| Less dividends and distributions from: |
| Net investment income |
| Net realized gain |
| Total dividends and distributions |
| |
| Net asset value, end of period |
| |
| Total return2 |
| |
| Ratios and supplemental data: |
| Net assets, end of period (000 omitted) |
| Ratio of expenses to average net assets |
| Ratio of expenses to average net assets |
| to fees waived |
| Ratio of net investment income to average net assets |
| Ratio of net investment income (loss) to average net assets |
| prior to fees waived |
| Portfolio turnover |
| 1 The average shares outstanding method has been applied for per share information. |
| 2 Total investment return is based on the change in net asset value of a share during the period and assumes reinvestment of dividends and distributions at net asset value and does not reflect the impact of a sales charge. Total investment return during all of the periods shown reflects a waiver by the manager. Performance would have been lower had the waiver not been in effect. |
See accompanying notes, which are an integral part of the financial statements.
80
| | Year Ended | |
| | 11/30/12 | | 11/30/11 | | 11/30/10 | | 11/30/09 | | 11/30/08 | |
| | $8.150 | | | $8.170 | | | $7.940 | | | $5.680 | | | $11.640 | | |
| | | | |
| | | | |
| | 0.027 | | | 0.033 | | | 0.007 | | | 0.059 | | | 0.104 | | |
| | 0.689 | | | (0.053 | ) | | 0.285 | | | 2.297 | | | (5.474 | ) | |
| | 0.716 | | | (0.020 | ) | | 0.292 | | | 2.356 | | | (5.370 | ) | |
| | | | |
| | | | |
| | (0.026 | ) | | — | | | (0.062 | ) | | (0.096 | ) | | (0.050 | ) | |
| | — | | | — | | | — | | | — | | | (0.540 | ) | |
| | (0.026 | ) | | — | | | (0.062 | ) | | (0.096 | ) | | (0.590 | ) | |
| | | | |
| | $8.840 | | | $8.150 | | | $8.170 | | | $7.940 | | | $5.680 | | |
| | | | |
| | 8.82% | | | (0.24% | ) | | 3.70% | | | 41.36% | | | (48.51% | ) | |
| | | | |
| | | | |
| | $1,403 | | | $2,365 | | | $3,136 | | | $4,255 | | | $4,103 | | |
| | 2.30% | | | 2.30% | | | 2.30% | | | 2.31% | | | 2.20% | | |
| | | | |
| | 2.51% | | | 2.58% | | | 2.77% | | | 2.79% | | | 2.46% | | |
| | 0.33% | | | 0.37% | | | 0.09% | | | 0.91% | | | 1.09% | | |
| | | | |
| | 0.12% | | | 0.09% | | | (0.38% | ) | | 0.43% | | | 0.83% | | |
| | 69% | | | 40% | | | 50% | | | 47% | | | 78% | | |
81
Financial highlights
Delaware Global Value Fund Class C
Selected data for each share of the Fund outstanding throughout each period were as follows:
| Net asset value, beginning of period |
| |
| Income (loss) from investment operations: |
| Net investment income1 |
| Net realized and unrealized gain (loss) |
| Total from investment operations |
| |
| Less dividends and distributions from: |
| Net investment income |
| Net realized gain |
| Total dividends and distributions |
| |
| Net asset value, end of period |
| |
| Total return2 |
| |
| Ratios and supplemental data: |
| Net assets, end of period (000 omitted) |
| Ratio of expenses to average net assets |
| Ratio of expenses to average net assets |
| to fees waived |
| Ratio of net investment income to average net assets |
| Ratio of net investment income (loss) to average net assets |
| prior to fees waived |
| Portfolio turnover |
| 1 The average shares outstanding method has been applied for per share information. |
| 2 Total investment return is based on the change in net asset value of a share during the period and assumes reinvestment of dividends and distributions at net asset value and does not reflect the impact of a sales charge. Total investment return during all of the periods shown reflects a waiver by the manager. Performance would have been lower had the waiver not been in effect. |
See accompanying notes, which are an integral part of the financial statements.
82
| | Year Ended | |
| | 11/30/12 | | 11/30/11 | | 11/30/10 | | 11/30/09 | | 11/30/08 | |
| | $8.150 | | | $8.170 | | | $7.940 | | | $5.690 | | | $11.650 | | |
| | | | |
| | | | |
| | 0.028 | | | 0.033 | | | 0.007 | | | 0.059 | | | 0.102 | | |
| | 0.698 | | | (0.053 | ) | | 0.285 | | | 2.287 | | | (5.472 | ) | |
| | 0.726 | | | (0.020 | ) | | 0.292 | | | 2.346 | | | (5.370 | ) | |
| | | | |
| | | | |
| | (0.026 | ) | | — | | | (0.062 | ) | | (0.096 | ) | | (0.050 | ) | |
| | — | | | — | | | — | | | — | | | (0.540 | ) | |
| | (0.026 | ) | | — | | | (0.062 | ) | | (0.096 | ) | | (0.590 | ) | |
| | | | |
| | $8.850 | | | $8.150 | | | $8.170 | | | $7.940 | | | $5.690 | | |
| | | | |
| | 8.94% | | | (0.24% | ) | | 3.70% | | | 41.12% | | | (48.51% | ) | |
| | | | |
| | | | |
| | $5,878 | | | $6,745 | | | $8,193 | | | $10,845 | | | $11,260 | | |
| | 2.30% | | | 2.30% | | | 2.30% | | | 2.31% | | | 2.20% | | |
| | | | |
| | 2.51% | | | 2.58% | | | 2.77% | | | 2.79% | | | 2.46% | | |
| | 0.33% | | | 0.37% | | | 0.09% | | | 0.91% | | | 1.09% | | |
| | | | |
| | 0.12% | | | 0.09% | | | (0.38% | ) | | 0.43% | | | 0.83% | | |
| | 69% | | | 40% | | | 50% | | | 47% | | | 78% | | |
83
Financial highlights
Delaware Global Value Fund Institutional Class
Selected data for each share of the Fund outstanding throughout each period were as follows:
| Net asset value, beginning of period |
| |
| Income (loss) from investment operations: |
| Net investment income1 |
| Net realized and unrealized gain (loss) |
| Total from investment operations |
| |
| Less dividends and distributions from: |
| Net investment income |
| Net realized gain |
| Total dividends and distributions |
| |
| Net asset value, end of period |
| |
| Total return2 |
| |
| Ratios and supplemental data: |
| Net assets, end of period (000 omitted) |
| Ratio of expenses to average net assets |
| Ratio of expenses to average net assets |
| to fees waived |
| Ratio of net investment income to average net assets |
| Ratio of net investment income to average net assets |
| prior to fees waived |
| Portfolio turnover |
| 1 The average shares outstanding method has been applied for per share information. |
| 2 Total investment return is based on the change in net asset value of a share during the period and assumes reinvestment of dividends and distributions at net asset value. Total investment return during all of the periods shown reflects a waiver by the manager. Performance would have been lower had the waiver not been in effect. |
See accompanying notes, which are an integral part of the financial statements.
84
| | Year Ended | |
| | 11/30/12 | | 11/30/11 | | 11/30/10 | | 11/30/09 | | 11/30/08 | |
| | $8.340 | | | $8.340 | | | $8.080 | | | $5.810 | | | $11.910 | | |
| | | | |
| | | | |
| | 0.115 | | | 0.124 | | | 0.087 | | | 0.123 | | | 0.195 | | |
| | 0.709 | | | (0.066 | ) | | 0.300 | | | 2.330 | | | (5.587 | ) | |
| | 0.824 | | | 0.058 | | | 0.387 | | | 2.453 | | | (5.392 | ) | |
| | | | |
| | | | |
| | (0.114 | ) | | (0.058 | ) | | (0.127 | ) | | (0.183 | ) | | (0.168 | ) | |
| | — | | | — | | | — | | | — | | | (0.540 | ) | |
| | (0.114 | ) | | (0.058 | ) | | (0.127 | ) | | (0.183 | ) | | (0.708 | ) | |
| | | | |
| | $9.050 | | | $8.340 | | | $8.340 | | | $8.080 | | | $5.810 | | |
| | | | |
| | 10.03% | | | 0.65% | | | 4.86% | | | 42.46% | | | (48.03% | ) | |
| | | | |
| | | | |
| | $1,932 | | | $1,685 | | | $1,677 | | | $1,390 | | | $1,088 | | |
| | 1.30% | | | 1.30% | | | 1.30% | | | 1.31% | | | 1.20% | | |
| | | | |
| | 1.51% | | | 1.58% | | | 1.77% | | | 1.79% | | | 1.46% | | |
| | 1.33% | | | 1.37% | | | 1.09% | | | 1.91% | | | 2.09% | | |
| | | | |
| | 1.12% | | | 1.09% | | | 0.62% | | | 1.43% | | | 1.83% | | |
| | 69% | | | 40% | | | 50% | | | 47% | | | 78% | | |
85
| Notes to financial statements | |
| Delaware International Funds | November 30, 2012 |
Delaware Group® Global & International Funds (Trust) is organized as a Delaware statutory trust and offers five series: Delaware International Value Equity Fund, Delaware Emerging Markets Fund, Delaware Global Value Fund, Delaware Focus Global Growth Fund, and Delaware Macquarie Global Infrastructure Fund. These financial statements and the related notes pertain to Delaware International Value Equity Fund, Delaware Emerging Markets Fund, and Delaware Global Value Fund (each, a Fund or collectively, the Funds). The Trust is an open-end investment company. Each Fund is considered diversified under the Investment Company Act of 1940, as amended, and offers Class A, Class B, Class C, Class R, and Institutional Class shares. As of November 30, 2012, Delaware Global Value Fund has not commenced operations of its Class R shares. Class A shares are sold with a maximum front-end sales charge of 5.75%. Class A share purchases of $1,000,000 or more will incur a contingent deferred sales charge (CDSC) of 1% if redeemed during the first year and 0.50% during the second year, provided that Delaware Distributors, L.P.(DDLP) paid a financial advisor a commission on the purchase of those shares. Class B shares may be purchased only through dividend reinvestment and certain permitted exchanges. Prior to June 1, 2007, Class B shares were sold with a CDSC that declined from 4% to zero depending upon the period of time the shares were held. Class B shares will automatically convert to Class A shares on a quarterly basis approximately eight years after purchase. Class C shares are sold with a CDSC of 1%, if redeemed during the first twelve months. Class R and Institutional Class shares are not subject to a sales charge and are offered for sale exclusively to certain eligible investors.
The investment objective of Delaware International Value Equity Fund is to seek long-term growth without undue risk to principal.
The investment objective of Delaware Emerging Markets Fund and Delaware Global Value Fund is to seek long-term capital appreciation.
1. Significant Accounting Policies
The following accounting policies are in accordance with U.S. generally accepted accounting principles (U.S. GAAP) and are consistently followed by the Funds.
Security Valuation — Equity securities, except those traded on the Nasdaq Stock Market, Inc. (Nasdaq), are valued at the last quoted sales price as of the time of the regular close of the New York Stock Exchange (NYSE) on the valuation date. Securities traded on the Nasdaq are valued in accordance with the Nasdaq Official Closing Price, which may not be the last sales price. If on a particular day an equity security does not trade, then the mean between the bid and ask prices will be used, which approximates fair value. Securities listed on a foreign exchange are normally valued at the last quoted sales price on the valuation date. Investment company securities are valued at net asset value per share, as reported by the underlying investment company. U.S. government and agency securities are valued at the mean between the bid and ask prices, which approximates fair value. Valuations for fixed income securities utilize matrix systems, which reflect such factors as security prices, yields, maturities, and ratings, and are supplemented by dealer and exchange quotations. Foreign currency exchange contracts are valued at the mean between the bid and ask prices, which approximates fair value. Interpolated values are derived when the settlement
86
date of the contract is an interim date for which quotations are not available. Generally, other securities and assets for which market quotations are not readily available are valued at fair value as determined in good faith under the direction of each Fund’s Board of Trustees (Board). In determining whether market quotations are readily available or fair valuation will be used, various factors will be taken into consideration, such as market closures, or suspension of trading in a security. Each Fund may use fair value pricing more frequently for securities traded primarily in non-U.S. markets because, among other things, most foreign markets close well before each Fund values its securities, generally as of 4:00 p.m. Eastern time. The earlier close of these foreign markets gives rise to the possibility that significant events, including broad market moves, government actions or pronouncements, aftermarket trading, or news events may have occurred in the interim. To account for this, the Funds may frequently value foreign securities using fair value prices based on third-party vendor modeling tools (international fair value pricing).
Federal & Foreign Income Taxes — No provision for federal income taxes has been made as each Fund intends to continue to qualify for federal income tax purposes as a regulated investment company under Subchapter M of the Internal Revenue Code of 1986, as amended, and make the requisite distributions to shareholders. The Funds evaluate tax positions taken or expected to be taken in the course of preparing the Funds’ tax returns to determine whether the tax positions are “more likely-than-not” of being sustained by the applicable tax authority. Tax positions not deemed to meet the “more-likely-than-not” threshold are recorded as a tax benefit or expense in the current year. Management has analyzed the Funds’ tax positions taken for all open federal income tax years (November 30, 2009 – November 30, 2012), and has concluded that no provision for federal income tax is required in the Funds’ financial statements. In regards to foreign taxes, the Funds only have open tax years in certain foreign countries they invest in back to the inception of the Funds.
Class Accounting — Investment income, common expenses and realized and unrealized gain (loss) on investments are allocated to the various classes of the Funds on the basis of daily net assets of each class. Distribution expenses relating to a specific class are charged directly to that class.
Repurchase Agreements — Each Fund may purchase certain U.S. government securities subject to the counterparty’s agreement to repurchase them at an agreed upon date and price. The counterparty will be required on a daily basis to maintain the value of the collateral subject to the agreement at not less than the repurchase price (including accrued interest). The agreements are conditioned upon the collateral being deposited under the Federal Reserve book-entry system with each Fund’s custodian or a third-party sub-custodian. In the event of default or bankruptcy by the other party to the agreement, retention of the collateral may be subject to legal proceedings. All open repurchase agreements as of the date of this report were entered into on November 30, 2012.
Foreign Currency Transactions — Transactions denominated in foreign currencies are recorded at the prevailing exchange rates on the valuation date in accordance with each Fund’s prospectus. The value of all assets and liabilities denominated in foreign currencies is translated into U.S. dollars at the exchange rate of such currencies against the U.S. dollar daily. Transaction
87
Notes to financial statements
Delaware International Funds
1. Significant Accounting Policies (continued)
gains or losses resulting from changes in exchange rates during the reporting period or upon settlement of the foreign currency transaction are reported in operations for the current period. The Funds generally do not isolate that portion of realized gains and losses on investments which is due to changes in foreign exchange rates from that which is due to changes in market prices. The changes are included with the net realized and unrealized gain or loss on investments. The Funds report certain foreign currency related transactions as components of realized gains (losses) for financial reporting purposes, whereas such components are treated as ordinary income (loss) for federal income tax purposes.
Use of Estimates — The preparation of financial statements in conformity with U.S. GAAP requires management to make estimates and assumptions that affect the fair value of investments, the reported amounts of assets and liabilities and disclosure of contingent assets and liabilities at the date of the financial statements and the reported amounts of revenues and expenses during the reporting period. Actual results could differ from those estimates and the differences could be material.
Other — Expenses directly attributable to the Funds are charged directly to the Funds. Other expenses common to various funds within the Delaware Investments® Family of Funds are generally allocated among such funds on the basis of average net assets. Management fees and some other expenses are paid monthly. Security transactions are recorded on the date the securities are purchased or sold (trade date) for financial reporting purposes. Costs used in calculating realized gains and losses on the sale of investment securities are those of the specific securities sold. Dividend income is recorded on the ex-dividend date and interest income is recorded on the accrual basis. Taxable non-cash dividends are recorded as dividend income. Foreign dividends are also recorded on the ex-dividend date or as soon after the ex-dividend date that the Funds are aware of such dividends, net of all non-rebatable tax withholdings. Withholding taxes on foreign dividends have been recorded in accordance with each Fund’s understanding of the applicable country’s tax rules and rates. Each Fund declares and pays dividends from net investment income and distributions from net realized gain on investments, if any, annually. The Funds may distribute income dividends and capital gains more frequently, if necessary for tax purposes. Dividends and distributions, if any, are recorded on the ex-dividend date.
The Funds may receive earnings credits from their custodian when positive cash balances are maintained, which are used to offset custody fees. There were no earnings credits for the year ended November 30, 2012.
The Funds receive earnings credits from their transfer agent when positive cash balances are maintained, which are used to offset transfer agent fees. The expense paid under this arrangement is included in dividend disbursing and transfer agent fees and expenses on the statements of
88
operations with the corresponding expense offset shown as “expense paid indirectly.” For the year ended November 30, 2012, each Fund earned the following amounts under this agreement:
| Delaware International | | Delaware Emerging | | Delaware Global |
| | Value Equity Fund | | Markets Fund | | Value Fund |
| $890 | | $4,835 | | $160 |
2. Investment Management, Administration Agreements and Other Transactions with Affiliates
In accordance with the terms of its respective Investment Management Agreement, each Fund pays Delaware Management Company (DMC), a series of Delaware Management Business Trust and the investment manager, an annual fee based on each Fund’s average daily net assets as follows:
| Delaware International | | Delaware Emerging | | Delaware Global |
| Value Equity Fund | | Markets Fund | | Value Fund |
| On the first $500 million | 0.85 | % | | 1.25 | % | | 0.85 | % |
| On the next $500 million | 0.80 | % | | 1.20 | % | | 0.80 | % |
| On the next $1.5 billion | 0.75 | % | | 1.15 | % | | 0.75 | % |
| In excess of $2.5 billion | 0.70 | % | | 1.10 | % | | 0.70 | % |
Effective March 29, 2012, DMC has contractually agreed to waive that portion, if any, of its management fee and reimburse each Fund to the extent necessary to ensure that total annual operating expenses, (excluding any 12b-1 fees, taxes, interest, short sale and dividend interest expenses, brokerage fees, certain insurance costs, and nonroutine expenses or costs, including, but not limited to, those relating to reorganizations, litigation, conducting shareholder meetings, and liquidations) do not exceed specified percentages of average daily net assets through March 29, 2013 as shown below. These waivers and reimbursements may be terminated only by agreement of the Manager and the Funds and apply only to expenses paid directly by the Funds.
| Delaware International | | Delaware Emerging | | Delaware Global |
| Value Equity Fund | | Markets Fund | | Value Fund |
| Effective March 29, 2012, operating | | | | | | | |
| expense limitation as a percentage | | | | | | | |
| of average daily net assets | | | | | | | |
| (per annum) | 1.21 | % | | None | | 1.30 | % |
| Through March 28, 2012, operating | | | | | | | |
| expense limitation as a percentage | | | | | | | |
| of average daily net assets | | | | | | | |
| (per annum) | 1.30 | % | | 1.60% | | 1.30 | % |
Delaware Service Company, Inc. (DSC), an affiliate of DMC, provides fund accounting and financial administration oversight services to the Funds. For these services, the Funds pay DSC fees based on the aggregate daily net assets of the Delaware Investments® Family of Funds at the following
89
Notes to financial statements
Delaware International Funds
2. Investment Management, Administration Agreements and Other Transactions with Affiliates (continued)
annual rate: 0.0050% of the first $30 billion; 0.0045% of the next $10 billion; 0.0040% of the next $10 billion; and 0.0025% of aggregate average daily net assets in excess of $50 billion. The fees payable to DSC under the service agreement described above are allocated among all Funds in the Delaware Investments® Family of Funds on a relative net asset value basis. For the year ended November 30, 2012, each Fund was charged for these services as follows:
| Delaware International | | Delaware Emerging | | Delaware Global |
| Value Equity Fund | | Markets Fund | | Value Fund |
| $11,090 | | $106,547 | | $1,319 |
DSC is also the transfer agent and dividend disbursing agent of the Funds. The Funds pay DSC a monthly asset-based fee for these services. Pursuant to a sub-transfer agency agreement between DSC and BNY Mellon Investment Servicing (US) Inc. (BNYMIS), BNYMIS provides certain sub-transfer agency services to the Funds. Sub-transfer agency fees are passed on to and paid directly by the Funds.
Pursuant to a distribution agreement and distribution plan, each Fund pays DDLP, the distributor and an affiliate of DMC, an annual distribution and service fee of 0.30% of the average daily net assets of the Class A shares, 1.00% of the average daily net assets of the Class B and Class C shares, and 0.60% of the average daily net assets of the Class R shares. Institutional Class shares pay no distribution and service expenses. DDLP has contracted to limit each Fund’s Class A shares’ and Class R shares’ 12b-1 fees through March 29, 2013 to no more than 0.25% and 0.50% of average daily net assets, respectively. Prior to March 29, 2012, Delaware International Value Equity Fund’s Class A shares 12b-1 fee had no waiver.
At November 30, 2012, the Funds had liabilities payable to affiliates as follows:
| Delaware International | | Delaware Emerging | | Delaware Global |
| Value Equity Fund | | Markets Fund | | Value Fund |
| Investment management fees | | | | | | | | | | | | | | |
| payable to DMC | | $ | 175,141 | | | | $ | 1,811,874 | | | | $ | 13,365 | |
| Dividend disbursing, transfer | | | | | | | | | | | | | | |
| agent and fund accounting | | | | | | | | | | | | | | |
| oversight fees, and other | | | | | | | | | | | | | | |
| expenses payable to DSC | | | 5,104 | | | | | 41,082 | | | | | 562 | |
| Distribution fees payable to DDLP | | | 47,157 | | | | | 233,630 | | | | | 9,246 | |
| Other expenses payable to DMC | | | | | | | | | | | | | | |
| and affiliates* | | | 6,482 | | | | | 41,664 | | | | | 545 | |
*DMC, as part of its administrative services, pays operating expenses on behalf of each Fund and is reimbursed on a periodic basis. Expenses include items such as printing of shareholder reports, fees for audit, legal and tax services, registration fees and trustees’ fees.
90
As provided in the investment management agreement, each Fund bears the cost of certain legal and tax services, including internal legal and tax services provided to the Funds by DMC and/or its affiliates’ employees. For the year ended November 30, 2012, each Fund was charged for internal legal and tax services provided by DMC and/or its affiliates’ employees as follows:
| Delaware International | | Delaware Emerging | | Delaware Global |
| Value Equity Fund | | Markets Fund | | Value Fund |
| $6,303 | | $61,867 | | $766 |
For the year ended November 30, 2012, DDLP earned commissions on sales of Class A shares for each Fund as follows:
| Delaware International | | Delaware Emerging | | Delaware Global |
| Value Equity Fund | | Markets Fund | | Value Fund |
| $6,651 | | $53,536 | | $2,340 |
For the year ended November 30, 2012, DDLP received gross CDSC commissions on redemptions of each Fund’s Class A, Class B and Class C shares, respectively, and these commissions were entirely used to offset up-front commissions previously paid by DDLP to broker/dealers on sales of those shares. The amounts received were as follows:
| Delaware International | | Delaware Emerging | | Delaware Global |
| Value Equity Fund | | Markets Fund | | Value Fund |
| Class A | | $ | 9 | | | | $ | 228 | | | | $ | 74 | |
| Class B | | | 689 | | | | | 1,775 | | | | | 1,853 | |
| Class C | | | 646 | | | | | 15,570 | | | | | 125 | |
Trustees’ fees include expenses accrued by the Funds for each Trustee’s retainer and meeting fees. Certain officers of DMC, DSC and DDLP are officers and/or Trustees of the Trust. These officers and Trustees are paid no compensation by the Funds.
3. Investments
For the year ended November 30, 2012, the Funds made purchases and sales of investment securities other than short-term investments as follows:
| Delaware International | | Delaware Emerging | | Delaware Global |
| Value Equity Fund | | Markets Fund | | Value Fund |
| Purchases | | $ | 76,507,372 | | | | $ | 321,949,186 | | | | $ | 18,352,024 | |
| Sales | | | 86,340,054 | | | | | 997,459,359 | | | | | 23,412,062 | |
91
Notes to financial statements
Delaware International Funds
3. Investments (continued)
At November 30, 2012, the cost of investments and unrealized appreciation (depreciation) for federal income tax purposes for each Fund were as follows:
| Delaware International | | Delaware Emerging | | Delaware Global |
| Value Equity Fund | | Markets Fund | | Value Fund |
| Cost of investments | | $ | 250,703,833 | | | | | $ | 2,259,882,002 | | | | | $ | 25,252,778 | | |
| Aggregate unrealized appreciation | | $ | 34,057,891 | | | | | $ | 259,322,031 | | | | | $ | 2,794,968 | | |
| Aggregate unrealized depreciation | | | (31,532,673 | ) | | | | | (482,332,677 | ) | | | | | (1,360,800 | ) | |
| Net unrealized appreciation (depreciation) | | $ | 2,525,218 | | | | | $ | (223,010,646 | ) | | | | $ | 1,434,168 | | |
U.S. GAAP defines fair value as the price that each Fund would receive to sell an asset or pay to transfer a liability in an orderly transaction between market participants at the measurement date under current market conditions. A three level hierarchy for fair value measurements has been established based upon the transparency of inputs to the valuation of an asset or liability. Inputs may be observable or unobservable and refer broadly to the assumptions that market participants would use in pricing the asset or liability. Observable inputs reflect the assumptions market participants would use in pricing the asset or liability based on market data obtained from sources independent of the reporting entity. Unobservable inputs reflect the reporting entity’s own assumptions about the assumptions that market participants would use in pricing the asset or liability developed based on the best information available under the circumstances. Each Fund’s investment in its entirety is assigned a level based upon the observability of the inputs which are significant to the overall valuation. The three level hierarchy of inputs is summarized below.
| Level 1 | – | inputs are quoted prices in active markets for identical investments (e.g., equity securities, open-end investment companies, futures contracts, exchange-traded options contracts) |
| | | |
| Level 2 | – | other observable inputs (including, but not limited to: quoted prices for similar assets or liabilities in markets that are active, quoted prices for identical or similar assets or liabilities in markets that are not active, inputs other than quoted prices that are observable for the assets or liabilities (such as interest rates, yield curves, volatilities, prepayment speeds, loss severities, credit risks and default rates) or other market-corroborated inputs) (e.g., debt securities, government securities, swap contracts, foreign currency exchange contracts, foreign securities utilizing international fair value pricing, broker-quoted securities, fair valued securities) |
| | | |
| Level 3 | – | inputs are significant unobservable inputs (including each Fund’s own assumptions used to determine the fair value of investments) (e.g., broker-quoted securities, fair valued securities) |
92
Level 3 investments are valued using significant unobservable inputs. Each Fund may also use an income-based valuation approach in which the anticipated future cash flows of the investment are discounted to calculate fair value. Discounts may also be applied due to the nature or duration of any restrictions on the disposition of the investments. Valuations may also be based upon current market prices of securities that are comparable in coupon, rating, maturity and industry. The derived value of a Level 3 investment may not represent the value which is received upon disposition and this could impact the results of operations.
The following tables summarize the valuation of each Fund’s investments by fair value hierarchy levels as of November 30, 2012:
| Delaware International Value Equity Fund |
| Level 1 | | Level 2 | | Level 3 | | Total |
| Common Stock | $ | 235,473,232 | | $ | — | | | | $ | — | | | $ | 235,473,232 | |
| Short-Term Investments | | — | | | 3,193,308 | | | | | — | | | | 3,193,308 | |
| Securities Lending Collateral | | — | | | 14,562,511 | | | | | — | | | | 14,562,511 | |
| Total | $ | 235,473,232 | | $ | 17,755,819 | | | | $ | — | | | $ | 253,229,051 | |
| |
| Foreign Currency | | | | | | | | | | | | | | | |
| Exchange Contracts | $ | — | | $ | (2,745 | ) | | | $ | — | | | $ | (2,745 | ) |
| | Delaware Emerging Markets Fund |
| | Level 1 | | Level 2 | | Level 3 | | Total |
| Common Stock | $ | 1,747,921,723 | | $ | 28,151,165 | | | | $ | — | | | $ | 1,776,072,888 | |
| Preferred Stock | | 51,422,373 | | | 15,361,954 | | | | | — | | | | 66,784,327 | |
| Securities Lending Collateral | | — | | | 194,014,141 | | | | | — | | | | 194,014,141 | |
| Total | $ | 1,799,344,096 | | $ | 237,527,260 | | | | $ | — | | | $ | 2,036,871,356 | |
| |
| Foreign Currency | | | | | | | | | | | | | | | |
| Exchange Contracts | $ | — | | $ | (6,640 | ) | | | $ | — | | | $ | (6,640 | ) |
| | Delaware Global Value Fund |
| | Level 1 | | Level 2 | | Level 3 | | Total |
| Common Stock | $ | 25,700,378 | | $ | — | | | | $ | — | | | $ | 25,700,378 | |
| Short-Term Investment | | — | | | 385,714 | | | | | — | | | | 385,714 | |
| Securities Lending Collateral | | — | | | 600,854 | | | | | — | | | | 600,854 | |
| Total | $ | 25,700,378 | | $ | 986,568 | | | | $ | — | | | $ | 26,686,946 | |
| |
| Foreign Currency | | | | | | | | | | | | | | | |
| Exchange Contracts | $ | — | | $ | (379 | ) | | | $ | — | | | $ | (379 | ) |
The securities deemed worthless on the statements of net assets have been included as Level 3 securities within the fair value hierarchy.
93
Notes to financial statements
Delaware International Funds
3. Investments (continued)
During the year ended November 30, 2012, the Funds had the following transfers that had a significant impact to the Funds.
| | Delaware International | | Delaware Emerging | | Delaware Global |
| | Value Equity Fund | | Markets Fund | | Value Fund |
| From Level 3 investments to Level 2 | | | | | | | | | | | | | |
| investments as a result of utilizing the | | | | | | | | | | | | | |
| price of a similar asset that had been | | | | | | | | | | | | | |
| utilizing an unobservable input | | | $ | — | | | | $ | 11,943,554 | | | $ | — |
| |
| From Level 1 investments to Level 2 | | | | | | | | | | | | | |
| investments as a result of utilizing | | | | | | | | | | | | | |
| a vendor price with observable | | | | | | | | | | | | | |
| inputs that had been using a | | | | | | | | | | | | | |
| quoted price in an active market | | | $ | — | | | | $ | 356,143 | | | $ | — |
| |
| From Level 1 investments to Level 2 | | | | | | | | | | | | | |
| investments as a result of utilizing | | | | | | | | | | | | | |
| the price of a similar asset with an | | | | | | | | | | | | | |
| observable input that had been using | | | | | | | | | | | | | |
| a quoted price in an active market | | | $ | — | | | | $ | 18,941,424 | | | $ | — |
This does not include transfers between Level 1 investments and Level 2 investments due to the Funds utilizing international fair value pricing during the year. In accordance with the fair valuation procedures described in Note 1, international fair value pricing uses other observable market-based inputs in place of the closing exchange price due to the events occurring after the close of the exchange or market on which the investment is principally traded causing a change in classification between levels. Each Fund’s policy is to recognize transfers between levels at the beginning of the reporting period.
A reconciliation of Level 3 investments is presented when the Funds have a significant amount of Level 3 investments at the beginning, interim or end of the period in relation to net assets.
Management has determined not to provide additional disclosure on Level 3 inputs under ASU No. 2011-04 since the Level 3 investments are not considered significant to the Funds’ net assets at the end of the period.
94
4. Dividend and Distribution Information
Income and long-term capital gain distributions are determined in accordance with federal income tax regulations, which may differ from U.S. GAAP. Additionally, distributions from net gains on foreign currency transactions and net short-term gains on sales of investment securities are treated as ordinary income for federal income tax purposes. The tax character of dividends and distributions paid during the years ended November 30, 2012 and 2011 was as follows:
| Delaware International | | Delaware Emerging | | Delaware Global |
| Value Equity Fund | | Markets Fund | | Value Fund |
| Year Ended November 30, 2012: | | | | | | | | | | | | | | |
| Ordinary income | | $ | 4,164,376 | | | | $ | 31,044,870 | | | | $ | 247,384 | |
| Long-term capital gain | | | — | | | | | 20,520,276 | | | | | — | |
| Total | | $ | 4,164,376 | | | | $ | 51,565,146 | | | | $ | 247,384 | |
| | | | | | | | | | | | | | | |
| Year Ended November 30, 2011: | | | | | | | | | | | | | | |
| Ordinary income | | $ | 2,923,827 | | | | $ | 8,820,716 | | | | $ | 105,611 | |
5. Components of Net Assets on a Tax Basis
As of November 30, 2012, the components of net assets on a tax basis were as follows:
| Delaware International | | Delaware Emerging | | Delaware Global |
| Value Equity Fund | | Markets Fund | | Value Fund |
| Shares of beneficial interest | | $ | 440,419,603 | | | | $ | 2,103,944,720 | | | $ | 51,126,833 | |
| Undistributed ordinary income | | | 3,130,106 | | | | | 16,448,082 | | | | 226,574 | |
| Capital loss carryforwards | | | (209,005,120 | ) | | | | (42,642,534 | ) | | | (27,094,861 | ) |
| Unrealized appreciation (depreciation) | | | 2,519,157 | | | | | (223,263,607 | ) | | | 1,433,063 | |
| Net assets | | $ | 237,063,746 | | | | $ | 1,854,486,661 | | | $ | 25,691,609 | |
The differences between book basis and tax basis components of net assets are primarily attributable to tax deferral of losses on wash sales, mark-to-market of foreign currency exchange contracts and tax recognition of unrealized gain on passive foreign investment companies.
For financial reporting purposes, capital accounts are adjusted to reflect the tax character of permanent book/tax differences. Reclassifications are primarily due to tax treatment of gain (loss) on foreign currency transactions, passive foreign investment companies, foreign tax capital gain and dividends and distributions. Results of operations and net assets were not affected by these reclassifications. For year ended November 30, 2012, the Funds recorded the following reclassifications:
| Delaware International | | Delaware Emerging | | Delaware Global |
| Value Equity Fund | | Markets Fund | | Value Fund |
| Undistributed net investment income | | $ | (380,198 | ) | | | | $ | 2,441,505 | | | | | $ | (5,098 | ) | |
| Accumulated net realized gain (loss) | | | 380,198 | | | | | | (2,441,505 | ) | | | | | 5,098 | | |
95
Notes to financial statements
Delaware International Funds
5. Components of Net Assets on a Tax Basis (continued)
For federal income tax purposes, capital loss carryforwards may be carried forward and applied against future capital gains.
In 2012, the Delaware Global Value Fund utilized capital loss carryforwards of $1,227,176.
Capital loss carryforwards remaining at November 30, 2012 will expire as follows:
| | Delaware International | | Delaware Emerging | | Delaware Global |
| Years of Expiration | | Value Equity Fund | | Markets Fund | | Value Fund |
| 2016 | | | $ | 79,163,033 | | | | $ | — | | | | $ | 14,552,184 | |
| 2017 | | | | 113,289,581 | | | | | — | | | | | 12,542,677 | |
| 2019 | | | | 8,738,476 | | | | | — | | | | | — | |
| Total | | | $ | 201,191,090 | | | | $ | — | | | | $ | 27,094,861 | |
On December 22, 2010, the Regulated Investment Company Modernization Act of 2010 (Act) was enacted, which changed various technical rules governing the tax treatment of regulated investment companies. The changes were generally effective for taxable years beginning after the date of enactment. Under the Act, the Funds are permitted to carry forward capital losses incurred in taxable years beginning after the date of enactment for an unlimited period. However, any losses incurred during those future taxable years will be required to be utilized prior to the losses incurred in pre-enactment taxable years, which carry an expiration date. As a result of this ordering rule, pre-enactment capital loss carryforwards may be more likely to expire unused. Additionally, post-enactment capital loss carryforwards will retain their character as either short-term or long-term capital losses rather than being considered all short-term as permitted under previous regulation.
Losses incurred that will be carried forward under the Act are as follows:
| Loss carryforward character |
| Short-term | | Long-term |
| Delaware International Value Equity Fund | $ | 7,814,030 | | $ | — |
| Delaware Emerging Markets Fund | | — | | | 42,642,534 |
| Delaware Global Value Fund | | — | | | — |
96
6. Capital Shares
Transactions in capital shares were as follows:
| Delaware International | | Delaware Emerging | | Delaware Global |
| Value Equity Fund | | Markets Fund | | Value Fund |
| Year Ended | | Year Ended | | Year Ended |
| 11/30/12 | | 11/30/11 | | 11/30/12 | | 11/30/11 | | 11/30/12 | | 11/30/11 |
| Shares sold: | | | | | | | | | | | | | | | | | |
| Class A | 1,103,699 | | | 1,571,995 | | | 9,494,061 | | | 22,435,480 | | | 174,039 | | | 360,351 | |
| Class B | 3,690 | | | 11,462 | | | 2,542 | | | 17,284 | | | 75 | | | 4,527 | |
| Class C | 198,823 | | | 165,866 | | | 1,391,450 | | | 4,282,005 | | | 52,396 | | | 95,296 | |
| Class R | 53,408 | | | 67,047 | | | 200,786 | | | 134,090 | | | — | | | — | |
| Institutional Class | 3,733,979 | | | 2,668,680 | | | 43,137,133 | | | 115,664,664 | | | 41,653 | | | 49,619 | |
| |
| Shares issued upon reinvestment of dividends and distributions: | | | | | | | | | | |
| Class A | 170,562 | | | 89,670 | | | 780,059 | | | 185,259 | | | 22,127 | | | 9,357 | |
| Class B | 4,265 | | | 1,352 | | | 12,693 | | | — | | | 670 | | | — | |
| Class C | 31,692 | | | 8,304 | | | 198,577 | | | — | | | 2,257 | | | — | |
| Class R | 3,557 | | | 1,786 | | | 2,202 | | | 110 | | | — | | | — | |
| Institutional Class | 177,439 | | | 127,602 | | | 1,314,579 | | | 177,343 | | | 2,671 | | | 1,237 | |
| | 5,481,114 | | | 4,713,764 | | | 56,534,082 | | | 142,896,235 | | | 295,888 | | | 520,387 | |
| |
| Shares redeemed: | | | | | | | | | | | | | | | | | |
| Class A | (2,872,149 | ) | | (3,314,357 | ) | | (16,946,365 | ) | | (17,847,326 | ) | | (532,141 | ) | | (714,809 | ) |
| Class B | (190,964 | ) | | (239,798 | ) | | (390,790 | ) | | (286,461 | ) | | (132,198 | ) | | (98,098 | ) |
| Class C | (706,114 | ) | | (856,596 | ) | | (5,178,887 | ) | | (4,390,030 | ) | | (217,452 | ) | | (270,297 | ) |
| Class R | (76,391 | ) | | (122,619 | ) | | (119,222 | ) | | (49,489 | ) | | — | | | — | |
| Institutional Class | (3,021,934 | ) | | (6,189,190 | ) | | (82,111,138 | ) | | (32,479,648 | ) | | (32,699 | ) | | (50,060 | ) |
| | (6,867,552 | ) | | (10,722,560 | ) | | (104,746,402 | ) | | (55,052,954 | ) | | (914,490 | ) | | (1,133,264 | ) |
| Net increase | | | | | | | | | | | | | | | | | |
| (decrease) | (1,386,438 | ) | | (6,008,796 | ) | | (48,212,320 | ) | | 87,843,281 | | | (618,602 | ) | | (612,877 | ) |
97
Notes to financial statements
Delaware International Funds
6. Capital Shares (continued)
For the year ended November 30, 2012 and the year ended November 30, 2011, the following Class B shares were converted to Class A shares. The amounts are included in Class B redemptions and Class A subscriptions in the tables above and the statements of changes in net assets.
| | Year Ended
11/30/12 | | Year Ended
11/30/11 |
| | Class B
Shares | | Class A
Shares | | Value | | Class B
Shares | | Class A
Shares | | Value |
Delaware International
Value Equity Fund | | 42,740 | | 42,165 | | $ | 460,366 | | 81,945 | | 80,709 | | $ | 986,737 |
Delaware Emerging
Markets Fund | | 95,904 | | 91,005 | | | 1,212,417 | | 50,416 | | 47,803 | | | 713,921 |
Delaware Global
Value Fund | | 63,630 | | 62,749 | | | 560,818 | | 17,503 | | 17,228 | | | 153,728 |
7. Line of Credit
Each Fund, along with certain other funds in the Delaware Investments® Family of Funds (Participants), was a participant in a $125,000,000 revolving line of credit to be used for temporary or emergency purposes as an additional source of liquidity to fund redemptions of investor shares. Under the agreement, the Participants were charged an annual commitment fee, which was allocated across the Participants on the basis of each Participant’s allocation of the entire facility. The Participants were permitted to borrow up to a maximum of one third of their net assets under the agreement. Each Participant was individually, and not jointly, liable for its particular advances, if any, under the line of credit. The line of credit under the agreement expired on November 13, 2012.
On November 13, 2012, each Fund, along with the other Participants, entered into an amendment to the agreement for a $125,000,000 revolving line of credit. The agreement is to be used as described above and operates in substantially the same manner as the original agreement. The line of credit available under the agreement expires on November 12, 2013. The Funds had no amounts outstanding as of November 30, 2012 or at any time during the year then ended.
8. Derivatives
U.S. GAAP requires disclosures that enable investors to understand: 1) how and why an entity uses derivatives; 2) how they are accounted for; and 3) how they affect an entity’s results of operations and financial position.
Foreign Currency Exchange Contracts — Each Fund may enter into foreign currency exchange contracts as a way of managing foreign exchange rate risk. Each Fund may enter into these contracts to fix the U.S. dollar value of a security that it has agreed to buy or sell for the period between the date the trade was entered into and the date the security is delivered and paid for. Each Fund may also use these contracts to hedge the U.S. dollar value of securities it already
98
owns that are denominated in foreign currencies. The change in value is recorded as an unrealized gain or loss. When the contract is closed, a realized gain or loss is recorded equal to the difference between the value of the contract at the time it was opened and the value at the time it was closed.
The use of foreign currency exchange contracts does not eliminate fluctuations in the underlying prices of the securities, but does establish a rate of exchange that can be achieved in the future. Although foreign currency exchange contracts limit the risk of loss due to an unfavorable change in the value of the hedged currency, they also limit any potential gain that might result should the value of the currency change favorably. In addition, the Funds could be exposed to risks if the counterparties to the contracts are unable to meet the terms of their contracts. The Funds’ maximum risk of loss from counterparty credit risk is the value of their currency exchanged with the counterparty. The risk is generally mitigated by having a netting arrangement between the Funds and the counterparty and by the posting of collateral by the counterparty to the Funds to cover the Funds’ exposure to the counterparty.
Derivatives Generally. The table below summarizes the average balance of derivative holdings by the Funds during the year ended November 30, 2012.
| | Long Derivative Volume |
| | Delaware International | | Delaware Emerging | | Delaware Global |
| | Value Equity Fund | | Markets Fund | | Value Fund |
| Foreign currency exchange contracts | | | | | | |
| (average cost) | | $748,025 | | $3,177,428 | | $86,297 |
| |
| | Short Derivative Volume |
| | Delaware International | | Delaware Emerging | | Delaware Global |
| | Value Equity Fund | | Markets Fund | | Value Fund |
| Foreign currency exchange contracts | | | | | | |
| (average cost) | | $746,812 | | $3,173,217 | | $86,212 |
9. Securities Lending
Each Fund, along with other funds in the Delaware Investments® Family of Funds, may lend its securities pursuant to a security lending agreement (Lending Agreement) with The Bank of New York Mellon (BNY Mellon). At the time a security is loaned, the borrower must post collateral equal to the required percentage of the market value of the loaned security, including any accrued interest. The required percentage is: (i) 102% with respect to U.S. securities and foreign securities that are denominated and payable in U.S. dollars; and (ii) 105% with respect to foreign securities. With respect to each loan, if on any business day the aggregate market value of securities collateral plus cash collateral held is less than the aggregate market value of the securities which are the subject of such loan, the borrower will be notified to provide additional collateral by the end of the following business day which, together with the collateral already held, will be not less than the applicable initial collateral requirements for such security loan. If the aggregate market value of securities collateral and cash collateral held with respect to a security loan exceeds the
99
Notes to financial statements
Delaware International Funds
9. Securities Lending (continued)
applicable initial collateral requirement, upon request of the borrower BNY Mellon must return enough collateral to the borrower by the end of the following business day to reduce the value of the remaining collateral to the applicable initial collateral requirement for such security loan. As a result of the foregoing, the value of the collateral held with respect to a loaned security may be temporarily more or less than the value of the security on loan.
Cash collateral received is generally invested in the Delaware Investments Collateral Fund No. 1 (Collective Trust) established by BNY Mellon for the purpose of investment on behalf of funds managed by DMC that participate in BNY Mellon’s securities lending program. The Collective Trust may invest in U.S. government securities and high quality corporate debt, asset-backed and other money market securities and in repurchase agreements collateralized by such securities, provided that the Collective Trust will generally have a dollar-weighted average portfolio maturity of 60 days or less. In October 2008, BNY Mellon transferred certain distressed securities from the Funds’ previous collateral investment pool into the Mellon GSL Reinvestment Trust II. The Funds can also accept U.S. government securities and letters of credit (non-cash collateral) in connection with securities loans. In the event of default or bankruptcy by the lending agent, realization and/or retention of the collateral may be subject to legal proceedings. In the event the borrower fails to return loaned securities and the collateral received is insufficient to cover the value of the loaned securities and provided such collateral shortfall is not the result of investment losses, the lending agent has agreed to pay the amount of the shortfall to the Funds or, at the discretion of the lending agent, replace the loaned securities. The Funds continue to record dividends or interest, as applicable, on the securities loaned and are subject to changes in value of the securities loaned that may occur during the term of the loan. The Funds have the right under the Lending Agreement to recover the securities from the borrower on demand. With respect to security loans collateralized by non-cash collateral, the Funds receive loan premiums paid by the borrower. With respect to security loans collateralized by cash collateral, the earnings from the collateral investments are shared among the Funds, the security lending agent and the borrower. The Funds record security lending income net of allocations to the security lending agent and the borrower.
The Collective Trust used for the investment of cash collateral received from borrowers of securities seeks to maintain a net asset value per unit of $1.00, but there can be no assurance that it will always be able to do so. The Funds may incur investment losses as a result of investing securities lending collateral in the Collective Trust or another collateral investment pool. This could occur if an investment in a collateral investment pool defaulted or if it were necessary to liquidate assets in the collateral investment pool to meet returns on outstanding security loans at a time when the collateral investment pool’s net asset value per unit was less than $1.00. Under those circumstances, the Funds may not receive an amount from the collateral investment pool that is equal in amount to the collateral the Funds would be required to return to the borrower of the securities and the Funds would be required to make up for this shortfall.
100
At November 30, 2012, the value of securities on loan and the value of invested collateral for each Fund are presented below, for which cash collateral was received and invested in accordance with the Lending Agreement. These investments are presented on the statements of net assets under the caption “Securities Lending Collateral”.
| | Delaware International
Value Equity Fund | | Delaware Emerging
Markets Fund | | Delaware Global
Value Fund |
| Value of securities on loan | | | $15,191,362 | | | | $185,582,524 | | | | $700,448 | |
| Value of invested collateral | | | 14,562,511 | | | | 194,014,141 | | | | 600,854 | |
10. Credit and Market Risk
Some countries in which the Funds may invest require governmental approval for the repatriation of investment income, capital or the proceeds of sales of securities by foreign investors. In addition, if there is deterioration in a country’s balance of payments or for other reasons, a country may impose temporary restrictions on foreign capital remittances abroad.
The securities exchanges of certain foreign markets are substantially smaller, less liquid and more volatile than the major securities markets in the United States. Consequently, acquisition and disposition of securities by the Funds may be inhibited. In addition, a significant portion of the aggregate market value of securities listed on the major securities exchanges in emerging markets is held by a smaller number of investors. This may limit the number of shares available for acquisition or disposition by the Funds.
Each Fund may invest up to 15% of its net assets in illiquid securities, which may include securities with contractual restrictions on resale, securities exempt from registration under Rule 144A of the Securities Act of 1933, as amended, and other securities which may not be readily marketable. The relative illiquidity of these securities may impair the Funds from disposing of them in a timely manner and at a fair price when it is necessary or desirable to do so. While maintaining oversight, the Funds’ Board has delegated to DMC, the day-to-day functions of determining whether individual securities are liquid for purposes of the Funds’ limitation on investments in illiquid securities. Securities eligible for resale pursuant to Rule 144A, which are determined to be liquid, are not subject to the Funds’ 15% limit on investments in illiquid securities. Rule 144A and illiquid securities have been identified on the statements of net assets.
11. Contractual Obligations
The Funds enter into contracts in the normal course of business that contain a variety of indemnifications. The Funds’ maximum exposure under these arrangements is unknown. However, the Funds have not had prior claims or losses pursuant to these contracts. Management has reviewed the Funds’ existing contracts and expects the risk of loss to be remote.
12. Subsequent Events
Management has determined that no material events or transactions occurred subsequent to November 30, 2012 that would require recognition or disclosure in the Funds’ financial statements.
101
Report of independent
registered public accounting firm
To the Board of Trustees of Delaware Group® Global & International Funds
and Shareholders of Delaware International Value Equity Fund,
Delaware Emerging Markets Fund, and Delaware Global Value Fund:
In our opinion, the accompanying statements of net assets and the related statements of operations and of changes in net assets and the financial highlights present fairly, in all material respects, the financial position of Delaware International Value Equity Fund, Delaware Emerging Markets Fund and Delaware Global Value Fund (three of the series constituting Delaware Group® Global and International Funds, hereafter collectively referred to as the “Funds”) at November 30, 2012, the results of each of their operations for the year then ended, the changes in each of their net assets for each of the two years in the period then ended and the financial highlights for each of the three years in the period then ended, in conformity with accounting principles generally accepted in the United States of America. These financial statements and financial highlights (hereafter referred to as “financial statements”) are the responsibility of the Funds’ management; our responsibility is to express an opinion on these financial statements based on our audits. We conducted our audits of these financial statements in accordance with the standards of the Public Company Accounting Oversight Board (United States). Those standards require that we plan and perform the audit to obtain reasonable assurance about whether the financial statements are free of material misstatement. An audit includes examining, on a test basis, evidence supporting the amounts and disclosures in the financial statements, assessing the accounting principles used and significant estimates made by management, and evaluating the overall financial statement presentation. We believe that our audits, which included confirmation of securities at November 30, 2012 by correspondence with the custodian and brokers, provide a reasonable basis for our opinion. The financial highlights for each of the periods ended November 30, 2009 and prior were audited by other independent accountants whose report dated January 21, 2010 expressed an unqualified opinion on those statements.
PricewaterhouseCoopers LLP
Philadelphia, Pennsylvania
January 15, 2013
102
Other Fund information
(Unaudited)
Delaware International Funds
Board Consideration of Delaware International Value Equity Fund,
Delaware Emerging Markets Fund and Delaware Global Value Fund
investment advisory agreement
At a meeting held on August 21-23, 2012 (the “Annual Meeting”), the Board of Trustees (the “Board”), including a majority of disinterested or independent Trustees, approved the renewal of the Investment Advisory Agreement for each of Delaware Emerging Markets Fund, Delaware Global Value Fund and Delaware International Value Equity Fund (each, a “Fund” and together, the “Funds”). In making its decision, the Board considered information furnished at regular quarterly Board meetings, including reports detailing Fund performance, investment strategies and expenses, as well as information prepared specifically in connection with the renewal of the investment advisory and sub-advisory contracts. Information furnished specifically in connection with the renewal of the Investment Advisory Agreements with Delaware Management Company (“DMC”) included materials provided by DMC and its affiliates (“Delaware Investments”) concerning, among other things, the nature, extent and quality of services provided to the Funds, the costs of such services to the Funds, economies of scale and the financial condition and profitability of Delaware Investments. In addition, in connection with the Annual Meeting, reports were provided in May 2012 and included independent historical and comparative reports provided by Lipper, Inc., an independent statistical compilation organization (“Lipper”). The Lipper reports compared each Fund’s investment performance and expenses with those of other comparable mutual funds. The Independent Trustees reviewed and discussed the Lipper reports with independent legal counsel to the Independent Trustees. The Board requested and received information regarding DMC’s policy with respect to advisory fee levels and its breakpoint philosophy; the structure of portfolio manager compensation; the investment manager’s profitability; comparative client fee information; and any constraints or limitations on the availability of securities in certain investment styles, which had in the past year inhibited, or which were likely in the future to inhibit, DMC’s ability to invest fully in accordance with Fund policies.
In considering information relating to the approval of each Fund’s advisory agreement, the Independent Trustees received assistance and advice from and met separately with independent legal counsel to the Independent Trustees. Although the Board gave attention to all information furnished, the following discussion identifies, under separate headings, the primary factors taken into account by the Board during its contract renewal considerations.
Nature, Extent and Quality of Service. The Board considered the services provided by Delaware Investments to the Funds and their shareholders. In reviewing the nature, extent and quality of services, the Board considered reports furnished to it throughout the year, which covered matters such as the relative performance of the Funds, compliance of portfolio managers with the investment policies, strategies and restrictions for the Funds, compliance by DMC and Delaware Distributors, L.P. (together, “Management”) personnel with the Code of Ethics adopted throughout the Delaware Investments Family of Funds complex and adherence to fair value pricing procedures as established by the Board. The Board was pleased with the current staffing of the Funds’ investment advisor and the emphasis placed on research in the investment process.
103
Other Fund information
(Unaudited)
Delaware International Funds
Board Consideration of Delaware International Value Equity Fund,
Delaware Emerging Markets Fund and Delaware Global Value Fund
investment advisory agreement (continued)
The Board recognized DMC’s receipt of several industry distinctions. The Board gave favorable consideration to DMC’s efforts to control expenditures while maintaining service levels committed to fund matters. The Board noted that in July 2011 Management implemented measures to reduce overall costs and improve transfer agent and shareholder servicing functions through outsourcing. The Board noted the benefits provided to Fund shareholders through each shareholder’s ability to exchange an investment in one Delaware Investments fund for the same class of shares in another Delaware Investments fund without a sales charge, to reinvest Fund dividends into additional shares of the same Fund or into additional shares of other Delaware Investments funds and the privilege to combine holdings in other Delaware Investments funds to obtain a reduced sales charge. The Board was satisfied with the nature, extent and quality of the overall services provided by Delaware Investments.
Investment Performance. The Board placed significant emphasis on the investment performance of the Funds in view of the importance of investment performance to shareholders. Although the Board gave appropriate consideration to performance reports and discussions with portfolio managers at Investment Committee meetings throughout the year, the Board gave particular weight to the Lipper reports furnished for the Annual Meeting. The Lipper reports prepared for each Fund showed the investment performance of its Class A shares in comparison to a group of similar funds as selected by Lipper (the “Performance Universe”). A fund with the best performance ranked first, and a fund with the poorest performance ranked last. The highest/best performing 25% of funds in the Performance Universe make up the first quartile; the next 25%, the second quartile; the next 25%, the third quartile; and the poorest/worst performing 25% of funds in the Performance Universe make up the fourth quartile. Comparative annualized performance for each Fund was shown for the past one-, three-, five- and ten-year periods, as applicable, ended March 31, 2012. The Board’s objective is that each Fund’s performance for the periods considered be at or above the median of its Performance Universe. The following paragraphs summarize the performance results for each Fund and the Board’s view of such performance.
Delaware Emerging Markets Fund — The Performance Universe for the Fund consisted of the Fund and all retail and institutional emerging markets funds as selected by Lipper. The Lipper report comparison showed that the Fund’s total return for the one-year period was in the fourth quartile of its Performance Universe. The report further showed that the Fund’s total return for the three-year period was in the third quartile and the Fund’s total return for the five- and ten-year periods was in the first quartile. The Fund’s short-term performance results were not in line with the Board’s objective. In evaluating the Fund’s performance, the Board considered the numerous investment and performance reports delivered by Management personnel to the Board’s Investments Committee. The Board was satisfied with the Fund’s longer term performance and believed that Management was taking action to improve Fund performance and to meet the Board’s performance objective.
104
Delaware Global Value Fund — The Performance Universe for the Fund consisted of the Fund and all retail and institutional global multi-cap value funds as selected by Lipper. The Lipper report comparison showed that the Fund’s total return for the one-year period was in the third quartile of its Performance Universe. The report further showed that the Fund’s total return for the three-, five- and ten-year periods was in the second quartile, fourth quartile and first quartile, respectively. The Board determined that the Fund’s performance results were mixed. In evaluating the Fund’s performance, the Board considered the numerous investment and performance reports delivered by Management personnel to the Board’s Investments Committee. The Board was satisfied that Management was taking action to improve Fund performance and to meet the Board’s performance objective.
Delaware International Value Equity Fund — The Performance Universe for the Fund consisted of the Fund and all retail and institutional international multi-cap value funds as selected by Lipper. The Lipper report comparison showed that the Fund’s total return for the one-year period was in the fourth quartile of its Performance Universe. The report further showed that the Fund’s total return for the three-, five- and ten-year periods was in the second quartile. The Board observed that, although the Fund’s one-year performance results were not in line with the Board’s objective, longer-term performance was satisfactory. In evaluating the Fund’s performance, the Board considered the numerous investment and performance reports delivered by Management personnel to the Board’s Investments Committee. The Board was satisfied that Management was taking action to improve short-term Fund performance and to meet the Board’s performance objective.
Comparative Expenses. The Board considered expense comparison data for the Delaware Investments Family of Funds. Management provided the Board with information on pricing levels and fee structures for each Fund as of its most recently completed fiscal year. The Board also focused on the comparative analysis of effective management fees and total expense ratios of each Fund versus effective management fees and expense ratios of a group of similar funds as selected by Lipper (the “Expense Group”). In reviewing comparative costs, each Fund’s contractual management fee and the actual management fee incurred by the Fund were compared with the contractual management fees (assuming all funds in the Expense Group were similar in size to the Fund) and actual management fees (as reported by each fund) within the Expense Group, taking into account any applicable breakpoints and fee waivers. Each Fund’s total expenses were also compared with those of its Expense Group. The Lipper total expenses, for comparative consistency, were shown by Lipper for Class A shares and comparative total expenses including 12b-1 and non 12b-1 service fees. The Board considered fees paid to Delaware Investments for non-management services. The Board’s objective is to limit each Fund’s total expense ratio to be competitive with that of the Expense Group. The following paragraphs summarize the expense results for each Fund and the Board’s view of such expenses.
105
Other Fund information
(Unaudited)
Delaware International Funds
Board Consideration of Delaware International Value Equity Fund,
Delaware Emerging Markets Fund and Delaware Global Value Fund
investment advisory agreement (continued)
Delaware Emerging Markets Fund — The expense comparisons for the Fund showed that its actual management fee and total expenses were in the quartile with the second highest expenses of its Expense Group. The Fund’s management fee and total expenses were not in line with the Board’s objective. In evaluating total expenses, the Board considered various initiatives implemented by Management, such as the outsourcing of certain transfer agency services, creating an opportunity for a reduction in expenses. The Board was satisfied with Management’s efforts to improve the Fund’s total expense ratio and bring it in line with the Board’s objective.
Delaware Global Value Fund — The expense comparisons for the Fund showed that its actual management fee was in the quartile with the lowest expenses of its Expense Group and its total expenses were in the quartile with the second highest expenses of its Expense Group. The Board gave favorable consideration to the Fund’s management fee, but noted that the Fund’s total expenses were not in line with the Board’s objective. In evaluating total expenses, the Board considered fee waivers in place through March 2013 and various initiatives implemented by Management, such as the outsourcing of certain transfer agency services, creating an opportunity for a reduction in expenses. The Board was satisfied with Management’s efforts to improve the Fund’s total expense ratio and bring it in line with the Board’s objective.
Delaware International Value Equity Fund — The expense comparisons for the Fund showed that its actual management fee was in the quartile with the second lowest expenses of its Expense Group and its total expenses were in the quartile with the highest expenses of its Expense Group. The Board gave favorable consideration to the Fund’s management fee, but noted that the Fund’s total expenses were not in line with the Board’s objective. In evaluating total expenses, the Board considered fee waivers in place through March 2013 and various initiatives implemented by Management, such as the outsourcing of certain transfer agency services, creating an opportunity for a reduction in expenses. The Board was satisfied with Management’s efforts to improve the Fund’s total expense ratio and bring it in line with the Board’s objective.
Management Profitability. The Board considered the level of profits realized by Delaware Investments in connection with the operation of the Funds. In this respect, the Board reviewed the Investment Management Profitability Analysis that addressed the overall profitability of Delaware Investments’ business in providing management and other services to each of the individual funds and the Delaware Investments Family of Funds as a whole. Specific attention was given to the methodology followed in allocating costs for the purpose of determining profitability. Management stated that the level of profits of Delaware Investments, to a certain extent, reflect recent operational cost savings and efficiencies initiated by Delaware Investments. The Board
106
considered Delaware Investments’ efforts to improve services provided to fund shareholders and to meet additional regulatory and compliance requirements resulting from recent industry-wide Securities and Exchange Commission initiatives. The Board also considered the extent to which Delaware Investments might derive ancillary benefits from fund operations, including the potential for procuring additional business as a result of the prestige and visibility associated with its role as service provider to the Delaware Investments Family of Funds and the benefits from allocation of fund brokerage to improve trading efficiencies. The Board found that the management fees were reasonable in light of the services rendered and the level of profitability of Delaware Investments.
Economies of Scale. The Trustees considered whether economies of scale are realized by Delaware Investments as each Fund’s assets increase and the extent to which any economies of scale are reflected in the level of management fees charged. The Trustees reviewed the standardized advisory fee pricing and structure, approved by the Board and shareholders, which includes breakpoints. Breakpoints in the advisory fee occur when the advisory fee rate is reduced on assets in excess of specified levels. Breakpoints result in a lower advisory fee than would otherwise be the case on all assets when the asset levels specified are exceeded. The Board noted that the fee under each Fund’s management contract fell within the standard structure. The Board also noted that Delaware Emerging Markets Fund’s assets exceeded the second breakpoint level. The Board believed that, given the extent to which economics of scale might be realized by the advisor and its affiliates, the schedule of fees under the Investment Advisory Agreement provides a sharing of benefits with the Fund and its shareholders. Although the Delaware Global Value Fund and Delaware International Value Equity Fund have not reached a size at which they can take advantage of breakpoints, the Board recognized that each Fund’s fee was structured so that when the Fund grows, economies of scale may be shared.
Tax Information (Unaudited)
The information set forth below is for the Funds’ fiscal year as required by federal income tax laws. Shareholders, however, must report distributions on a calendar year basis for income tax purposes, which may include distributions for portions of two fiscal years of a fund. Accordingly, the information needed by shareholders for income tax purposes will be sent to them in January of each year. Please consult your tax advisor for proper treatment of this information.
All designations are based on financial information available as of the date of this annual report and, accordingly are subject to change. For any and all items requiring designation, it is the intention of each Fund to designate the maximum amount permitted under the Internal Revenue Code and the regulations thereunder.
107
Other Fund information
(Unaudited)
Delaware International Funds
Board Consideration of Delaware International Value Equity Fund,
Delaware Emerging Markets Fund and Delaware Global Value Fund
investment advisory agreement (continued)
For the fiscal year ended November 30, 2012, each Fund designates distributions paid during the year as follows:
| | Long-Term | | Ordinary | | | | | | |
| | | Capital Gains | | Income | | Total | | (C) |
| | Distribution | | Distributions* | | Distribution | | Qualifying |
| | (Tax Basis) | | (Tax Basis) | | (Tax Basis) | | Dividends1 |
| Delaware International Value Equity Fund | | — | | | 100.00 | % | | 100.00 | % | | 0.48 | % |
| Delaware Emerging Markets Fund | | 39.79 | % | | 60.21 | % | | 100.00 | % | | 92.46 | % |
| Delaware Global Value Fund | | — | | | 100.00 | % | | 100.00 | % | | 100.00 | % |
(A) and (B) are based on a percentage of each Fund’s total distributions.
(C) is based on a percentage of each Fund’s ordinary income distributions.
1 Qualifying dividends represent dividends which qualify for the corporate dividends received deduction.
* For the fiscal year ended November 30, 2012, certain dividends paid by the Funds may be subject to a maximum tax rate of 15%, as provided for by the Jobs and Growth Tax Relief Reconciliation Act of 2003 and as extended by the Tax Relief, Unemployment Insurance Reauthorization and Jobs Creation Act of 2010. The Funds intend to designate the following amounts to be taxed at a maximum rate of 15%. Complete information will be computed and reported in conjunction with your 2012 Form 1099-DIV.
| | Delaware International | | Delaware Emerging | | Delaware Global |
| Value Equity Fund | | Markets Fund | | Value Fund |
| 5.86% | | 100.00% | | 100.00% |
The Funds intend to pass through foreign tax credits in the maximum amount as follows:
| | Delaware International | | Delaware Emerging | | Delaware Global |
| Value Equity Fund | | Markets Fund | | Value Fund |
| $219,524 | | $2,844,347 | | $14,872 |
The gross foreign source income earned during the fiscal year 2012 by the Funds was as follows:
| Delaware International | | Delaware Emerging | | Delaware Global |
| | Value Equity Fund | | Markets Fund | | Value Fund |
| $7,013,520 | | $45,989,009 | | $464,796 |
For the fiscal year ended November 30, 2012, certain dividends paid by the Emerging Markets Fund, has been determined to be interest related dividends and may be subject to relief from U.S. withholding for foreign shareholders, as provided by the American Jobs Creation Act of 2004 and as extended by the Tax Relief, Unemployment Insurance Reauthorization and Jobs Creation Act of 2010. For the fiscal year ended November 30 2012, the Fund has designated maximum Qualified Interest Income distributions of $343,067 and Qualified Short-Term Capital gain of $4,218,271.
108
Board of trustees/directors and officers addendum
Delaware Investments® Family of Funds
A mutual fund is governed by a Board of Trustees/Directors (“Trustees”), which has oversight responsibility for the management of a fund’s business affairs. Trustees establish procedures and oversee and review the performance of the investment manager, the distributor, and others who perform services for the fund. The independent fund trustees, in particular, are advocates
| Name, Address, | | Position(s) | | Length of |
| and Birth Date | | Held with Fund(s) | | Time Served |
| Interested Trustees | | | | |
| | | | | |
| Patrick P. Coyne1 | | Chairman, President, | | Chairman and Trustee |
| 2005 Market Street | | Chief Executive Officer, | | since August 16, 2006 |
| Philadelphia, PA 19103 | | and Trustee | | |
| April 1963 | | | | President and |
| | | | Chief Executive Officer |
| | | | since August 1, 2006 |
| | | | | |
| Independent Trustees | | | | |
| | | | | |
| Thomas L. Bennett | | Trustee | | Since March 2005 |
| 2005 Market Street | | | | |
| Philadelphia, PA 19103 | | | | |
| October 1947 | | | | |
| | | | | |
| John A. Fry | | Trustee | | Since January 2001 |
| 2005 Market Street | | | | |
| Philadelphia, PA 19103 | | | | |
| May 1960 | | | | |
| | | | | |
| | | | | |
| | | | | |
| | | | | |
| | | | | |
| | | | | |
| | | | | |
| | | | | |
| | | | | |
| | | | | |
| | | | | |
1 Patrick P. Coyne is considered to be an “Interested Trustee” because he is an executive officer of the Fund’s(s’) investment advisor.
110
for shareholder interests. Each trustee has served in that capacity since he or she was elected to or appointed to the Board of Trustees, and will continue to serve until his or her retirement or the election of a new trustee in his or her place. The following is a list of the Trustees and Officers with certain background and related information.
| | Number of Portfolios in | | |
| Principal Occupation(s) | | Fund Complex Overseen | | Other Directorships |
| During Past 5 Years | | by Trustee or Officer | | Held by Trustee or Officer |
| | | | |
| | | | | |
| Patrick P. Coyne has served in | | 71 | | Director and Audit |
| various executive capacities | | | | Committee Member |
| at different times at | | | | Kaydon Corp. |
| Delaware Investments.2 | | | | |
| | | | Board of Governors Member |
| | | | Investment Company |
| | | | Institute (ICI) |
| | | | |
| | | | | |
| | | | | |
| Private Investor | | 71 | | Director |
| (March 2004–Present) | | | | Bryn Mawr Bank Corp. (BMTC) |
| | | | (2007–2011) |
| | | | |
| President | | 71 | | Board of Governors Member — |
| Drexel University | | | | NASDAQ OMX PHLX LLC |
| (August 2010–Present) | | | | |
| | | | | Director and Audit |
| President | | | | Committee Member |
| Franklin & Marshall College | | | | Community Health Systems |
| (July 2002–July 2010) | | | | |
| | | | Director — Ecore |
| | | | International |
| | | | (2009–2010) |
| | | | |
| | | | Director — Allied |
| | | | Barton Securities Holdings |
| | | | (2005–2008) |
| | | | |
2 Delaware Investments is the marketing name for Delaware Management Holdings, Inc. and its subsidiaries, including the Fund’s(s’) investment advisor, principal underwriter, and its transfer agent.
111
Board of trustees/directors and officers addendum
Delaware Investments® Family of Funds
| Name, Address, | | Position(s) | | Length of |
| and Birth Date | | Held with Fund(s) | | Time Served |
| Independent Trustees (continued) | | | | |
| | | | | |
| Anthony D. Knerr | | Trustee | | Since April 1990 |
| 2005 Market Street | | | | |
| Philadelphia, PA 19103 | | | | |
| December 1938 | | | | |
| | | | | |
| Lucinda S. Landreth | | Trustee | | Since March 2005 |
| 2005 Market Street | | | | |
| Philadelphia, PA 19103 | | | | |
| June 1947 | | | | |
| | | | | |
| Frances A. Sevilla-Sacasa | | Trustee | | Since September 2011 |
| 2005 Market Street | | | | |
| Philadelphia, PA 19103 | | | | |
| January 1956 | | | | |
| | | | | |
| | | | | |
| | | | | |
| | | | | |
| | | | | |
| | | | | |
| | | | | |
| | | | | |
| | | | | |
| | | | | |
| | | | | |
| | | | | |
| | | | | |
| | | | | |
| Janet L. Yeomans | | Trustee | | Since April 1999 |
| 2005 Market Street | | | | |
| Philadelphia, PA 19103 | | | | |
| July 1948 | | | | |
| | | | | |
| | | | | |
| | | | | |
| | | | | |
| | | | | |
| | | | | |
| | | | | |
112
| | Number of Portfolios in | | |
| Principal Occupation(s) | | Fund Complex Overseen | | Other Directorships |
| During Past 5 Years | | by Trustee or Officer | | Held by Trustee or Officer |
| | | | | |
| | | | | |
| Managing Director | | 71 | | None |
| Anthony Knerr & Associates | | | | |
| (Strategic Consulting) | | | | |
| (1990–Present) | | | | |
| | | | | |
| Private Investor | | 71 | | None |
| (2004–Present) | | | | |
| | | | | |
| | | | | |
| | | | | |
| Chief Executive Officer — | | 71 | | Trust Manager — Camden |
| Banco Itaú Europa | | | | Property Trust |
| International | | | | (since August 2011) |
| (since April 2012) | | | | |
| | | | | |
| Executive Advisor to Dean | | | | |
| (August 2011–March 2012) | | | | |
| and Interim Dean | | | | |
| (January 2011–July 2011) — | | | | |
| University of Miami School of | | | | |
| Business Administration | | | | |
| | | | | |
| President — U.S. Trust, | | | | |
| Bank of America Private | | | | |
| Wealth Management | | | | |
| (Private Banking) | | | | |
| (July 2007–December 2008) | | | | |
| | | | | |
| Vice President and Treasurer | | 71 | | Director, Audit |
| (January 2006–July 2012) | | | | Committee Member and |
| Vice President — Mergers & Acquisitions | | | | Investment Committee |
| (January 2003–January 2006), and | | | | Member |
| Vice President and Treasurer | | | | Okabena Company |
| (July 1995–January 2003) | | | | |
| 3M Corporation | | | | Chair — 3M |
| | | | Investment Management |
| | | | Company |
| | | | (January 2005–July 2012) |
| | | | |
113
Board of trustees/directors and officers addendum
Delaware Investments® Family of Funds
| Name, Address, | | Position(s) | | Length of |
| and Birth Date | | Held with Fund(s) | | Time Served |
| Independent Trustees (continued) | | | | |
| | | | | |
| J. Richard Zecher | | Trustee | | Since March 2005 |
| 2005 Market Street | | | | |
| Philadelphia, PA 19103 | | | | |
| July 1940 | | | | |
| | | | | |
| | | | | |
| | | | | |
| | | | | |
| | | | | |
114
| | Number of Portfolios in | | |
| Principal Occupation(s) | | Fund Complex Overseen | | Other Directorships |
| During Past 5 Years | | by Trustee or Officer | | Held by Trustee or Officer |
| | | | |
| | | | | |
| Founder | | 71 | | Director and Compensation |
| Investor Analytics | | | | Committee Member |
| (Risk Management) | | | | Investor Analytics |
| (May 1999–Present) | | | | |
| | | | | Director |
| Founder | | | | Oxigene, Inc. |
| P/E Investments | | | | (2003–2008) |
| (Hedge Fund) | | | | |
| (September 1996–Present) | | | | |
115
Board of trustees/directors and officers addendum
Delaware Investments® Family of Funds
| Name, Address, | | Position(s) | | Length of |
| and Birth Date | | Held with Fund(s) | | Time Served |
| Officers | | | | |
| | | | | |
| David F. Connor | | Vice President, | | Vice President since |
| 2005 Market Street | | Deputy General | | September 2000 |
| Philadelphia, PA 19103 | | Counsel, and Secretary | | and Secretary since |
| December 1963 | | | | October 2005 |
| | | | |
| Daniel V. Geatens | | Vice President | | Treasurer |
| 2005 Market Street | | and Treasurer | | since October 2007 |
| Philadelphia, PA 19103 | | | | |
| October 1972 | | | | |
| | | | | |
| David P. O’Connor | | Executive Vice President, | | Executive Vice President |
| 2005 Market Street | | General Counsel | | since February 2012; |
| Philadelphia, PA 19103 | | and Chief Legal Officer | | Senior Vice President |
| February 1966 | | | | October 2005– |
| | | | February 2012; |
| | | | General Counsel and |
| | | | Chief Legal Officer |
| | | | since October 2005 |
| | | | | |
| Richard Salus | | Senior Vice President | | Chief Financial Officer |
| 2005 Market Street | | and Chief Financial Officer | | since November 2006 |
| Philadelphia, PA 19103 | | | | |
| October 1963 | | | | |
| | | | | |
The Statement of Additional Information for the Fund(s) includes additional information about the Trustees and Officers and is available, without charge, upon request by calling 800 523-1918.
116
| | Number of Portfolios in | | |
| Principal Occupation(s) | | Fund Complex Overseen | | Other Directorships |
| During Past 5 Years | | by Trustee or Officer | | Held by Trustee or Officer |
| | | | | |
| | | | | |
| David F. Connor has served as | | 71 | | None3 |
| Vice President and Deputy | | | | |
| General Counsel of | | | | |
| Delaware Investments | | | | |
| since 2000. | | | | |
| | | | | |
| Daniel V. Geatens has served | | 71 | | None3 |
| in various capacities at | | | | |
| different times at | | | | |
| Delaware Investments. | | | | |
| | | | | |
| David P. O’Connor has served in | | 71 | | None3 |
| various executive and legal | | | | |
| capacities at different times | | | | |
| at Delaware Investments. | | | | |
| | | | | |
| | | | | |
| | | | | |
| | | | | |
| | | | | |
| Richard Salus has served in | | 71 | | None3 |
| various executive capacities | | | | |
| at different times at | | | | |
| Delaware Investments. | | | | |
| | | | | |
3 David F. Connor, Daniel V. Geatens, David P. O’Connor, and Richard Salus serve in similar capacities for the six portfolios of the Optimum Fund Trust, which have the same investment advisor, principal underwriter, and transfer agent as the registrant.
117
About the organization
| Board of trustees | | | |
Patrick P. Coyne
Chairman, President, and
Chief Executive Officer
Delaware Investments®
Family of Funds
Philadelphia, PA
Thomas L. Bennett
Private Investor
Rosemont, PA | John A. Fry
President
Drexel University
Philadelphia, PA
Anthony D. Knerr
Founder and Managing
Director
Anthony Knerr &
Associates
New York, NY | Lucinda S. Landreth
Former Chief Investment
Officer
Assurant, Inc.
Philadelphia, PA
Frances A.
Sevilla-Sacasa
Chief Executive Officer
Banco Itaú Europa
International
Miami, FL | Janet L. Yeomans
Former Vice President and
Treasurer
3M Corporation
St. Paul, MN
J. Richard Zecher
Founder
Investor Analytics
Scottsdale, AZ |
| | | | |
| Affiliated officers | | | |
David F. Connor
Vice President, Deputy
General Counsel, and
Secretary
Delaware Investments
Family of Funds
Philadelphia, PA | Daniel V. Geatens
Vice President and
Treasurer
Delaware Investments
Family of Funds
Philadelphia, PA | David P. O’Connor
Executive Vice President,
General Counsel,
and Chief Legal Officer
Delaware Investments
Family of Funds
Philadelphia, PA | Richard Salus
Senior Vice President and
Chief Financial Officer
Delaware Investments
Family of Funds
Philadelphia, PA |
| This annual report is for the information of Delaware International Value Equity Fund, Delaware Emerging Markets Fund, and Delaware Global Value Fund shareholders, but it may be used with prospective investors when preceded or accompanied by the Delaware Investments® Fund fact sheet for the most recently completed calendar quarter. These documents are available at delawareinvestments.com. |
| Delaware Investments is the marketing name of Delaware Management Holdings, Inc. and its subsidiaries. |
Each Fund files its complete schedule of portfolio holdings with the Securities and Exchange Commission (SEC) for the first and third quarters of each fiscal year on Form N-Q. Each Fund’s Forms N-Q, as well as a description of the policies and procedures that each Fund uses to determine how to vote proxies (if any) relating to portfolio securities are available without charge (i) upon request, by calling 800 523-1918; and (ii) on the SEC’s website at sec.gov. In addition, a description of the policies and procedures that each Fund uses to determine how to vote proxies (if any) relating to portfolio securities and each Fund’s Schedule of Investments are available without charge on each Fund’s website at delawareinvestments.com. Each Fund’s Forms N-Q may be reviewed and copied at the SEC’s Public Reference Room in Washington, D.C.; information on the operation of the Public Reference Room may be obtained by calling 800 SEC-0330.
Information (if any) regarding how each Fund voted proxies relating to portfolio securities during the most recently disclosed 12-month period ended June 30 is available without charge (i) through each Fund’s website at delawareinvestments.com; and (ii) on the SEC’s website at sec.gov.
118
Annual report Delaware Focus Global Growth Fund November 30, 2012 Global / international equity mutual fund |
Carefully consider the Fund’s investment objectives, risk factors, charges, and expenses before investing. This and other information can be found in the Fund’s prospectus and, if available, its summary prospectus, which may be obtained by visiting delawareinvestments.com or calling 800 523-1918. Investors should read the prospectus and, if available, the summary prospectus carefully before investing. |
You can obtain shareholder reports and prospectuses online instead of in the mail.
Visit delawareinvestments.com/edelivery. |
Experience Delaware Investments
Delaware Investments is committed to the pursuit of consistently superior asset management and unparalleled client service. We believe in our investment processes, which seek to deliver consistent results, and in convenient services that help add value for our clients.
If you are interested in learning more about creating an investment plan, contact your financial advisor.
You can learn more about Delaware Investments or obtain a prospectus for Delaware Focus Global Growth Fund at delawareinvestments.com.
Manage your investments online
- 24-hour access to your account information
- Obtain share prices
- Check your account balance and recent transactions
- Request statements or literature
- Make purchases and redemptions
Delaware Management Holdings, Inc. and its subsidiaries (collectively known by the marketing name of Delaware Investments) are wholly owned subsidiaries of Macquarie Group Limited, a global provider of banking, financial, advisory, investment and funds management services.
Investments in Delaware Focus Global Growth Fund are not and will not be deposits with or liabilities of Macquarie Bank Limited ABN 46 008 583 542 and its holding companies, including their subsidiaries or related companies (Macquarie Group), and are subject to investment risk, including possible delays in repayment and loss of income and capital invested. No Macquarie Group company guarantees or will guarantee the performance of the Fund, the repayment of capital from the Fund, or any particular rate of return.
| Table of contents | |
| Portfolio management review | 1 |
| Performance summary | 4 |
| Disclosure of Fund expenses | 8 |
| Security type/country and sector allocations | 10 |
| Statement of net assets | 11 |
| Statement of operations | 16 |
| Statements of changes in net assets | 18 |
| Financial highlights | 20 |
| Notes to financial statements | 26 |
| Report of independent registered | |
| public accounting firm | 37 |
| Other Fund information | 38 |
| Board of trustees/directors and | |
| officers addendum | 42 |
| About the organization | 50 |
Unless otherwise noted, views expressed herein are current as of Nov. 30, 2012, and subject to change.
Funds are not FDIC insured and are not guaranteed. It is possible to lose the principal amount invested.
Mutual fund advisory services provided by Delaware Management Company, a series of Delaware Management Business Trust, which is a registered investment advisor. Delaware Investments, a member of Macquarie Group, refers to Delaware Management Holdings, Inc. and its subsidiaries, including the Fund’s distributor, Delaware Distributors, L.P. Macquarie Group refers to Macquarie Group Limited and its subsidiaries and affiliates worldwide.
© 2013 Delaware Management Holdings, Inc.
All third-party marks cited are the property of their respective owners.
| Portfolio management review | |
| Delaware Focus Global Growth Fund | December 11, 2012 |
| Performance preview (for the year ended November 30, 2012) | | |
| Delaware Focus Global Growth Fund (Class A shares) | 1-year return | | +15.49% |
| MSCI World Index (gross) | 1-year return | | +14.31% |
| MSCI World Index (net) | 1-year return | | +13.62% |
Past performance does not guarantee future results.
For complete, annualized performance for Delaware Focus Global Growth Fund, please see the table on page 4.
The performance of Class A shares excludes the applicable sales charge and reflects the reinvestment of all distributions.
Index performance returns do not reflect any management fees, transaction costs, or expenses. Indices are unmanaged and one cannot invest directly in an index.
Early in the Fund’s fiscal year, the U.S. economy seemed to be poised for significant growth as investors were generally encouraged by positive reports about labor markets, manufacturing, and consumer demand. With those favorable tailwinds, U.S. equity markets rose in the fall and winter of 2011. In Europe, economic conditions slowed, as the euro zone initiated additional austerity measures. Nevertheless, international stocks (both developed and emerging markets) also managed to post gains during those months.
The spring and early summer months of 2012, however, featured renewed volatility caused primarily by political and economic uncertainty. The basis of this uncertainty covered a wide range of issues (or potential issues), including: speculation about Greece’s potential exit from the euro; continuing evidence of deterioration within Spain’s banking sector; uncertainty surrounding upcoming political policies and elections in countries across the euro zone and in the United States; as well as a slowing global growth environment, along with persistently high rates of unemployment in the U.S.
Due to this uncertainty, domestic and international equity markets retreated between April and May. Sentiment seemed to improve once again in June as European leaders signaled a more comprehensive approach to stabilizing banks and sovereign credits. In the fall, toward the end of the Fund’s fiscal year, domestic stock performance received a boost from the latest bond-buying programs by the Fed and the European Central Bank, along with the Chinese government’s impending stimulus. The U.S. economy was able to maintain moderate growth, thanks, in considerable part, to an improvement in the housing sector and a positive report about manufacturing.
Fund performance
For the fiscal year ended Nov. 30, 2012, Delaware Focus Global Growth Fund Class A shares returned +15.49% at net asset value and +8.83% at maximum offer price (both figures reflect all distributions reinvested). For the same period, the Fund’s benchmark, the MSCI World Index returned +13.62 (net). Complete annualized performance for Delaware Focus Global Growth Fund is shown in the table on page 4.
1
Portfolio management review
Delaware Focus Global Growth Fund
As is typical of our long-term experience, stock selection drove a significant portion of Fund performance (as opposed to strictly geographical or sector influences).
Crown Castle International, which operates and leases wireless towers throughout the U.S. for firms such as Verizon and AT&T, was one of the Fund’s top contributors. The company has consistently generated solid earnings from enhanced wireless demand each quarter during the past two years. Wireless has been one of the few relatively strong growth areas in the past few years as consumers transmit more data via cellular networks on smartphones and tablets. Perceptions about the company improved during the fiscal year when conjecture about possible consolidation among the telecom companies that purchase and lease Crown Castle’s wireless towers did not occur because mergers could have slowed, or even reduced, corporate plans for infrastructure spending.
Apple was another leading contributor during the Fund’s fiscal year as the company continued to report relatively strong earnings. Investors were generally encouraged that Apple customers seem likely to stick with the iOS ecosystem across product generations, rather than abandon it for the next “hot” device. Investors also seemed pleased to see the company continuing to return capital to shareholders in the form of dividends, and other capital allocation decisions. While the stock has experienced some recent declines, we still feel Apple to be one of the best risk-reward tradeoffs in the portfolio.
Intertek Group, a third-party testing, inspection, and certification service provider worldwide, was another leading contributor during the Fund’s fiscal year. The company continued to benefit from the secular growth of global economic trade as it relates to the increased compliance with industrial standards and regulatory requirements. Additionally, the company reported attractive earnings, revenues, and future guidance as well as make progress in its integration of a recent acquisition.
VeriFone Systems was one of the Fund’s largest detractors from performance. The stock has been hampered by investor concerns that emerging technologies in mobile payment solutions (for example, paying for goods and services via smartphones) will threaten this industry leader in payment terminals. In addition, the company is increasing its capital investment in new business areas which is creating investor concerns about the long term growth trajectory and profitability of the company. We believe the competitive issues are overdone in the stock and believe new market segmentation and investment spending are reasonable in the context of a large available market opportunity. We continue to own the stock.
Polycom was one of the Fund’s largest detractors from performance. The company, which we believe may have grown too quickly given its infrastructure as well as the size of its personnel, continued to work through key personnel changes during much of the fiscal year. These changes were happening within a generally difficult environment in technology spending and during a specific industry transformation from primarily hardware solutions in videoconferencing to an increasing portion of systems driven by software. Despite the slower sales
2
environment at the close of the Fund’s fiscal year, we continued to maintain a relatively small position in Polycom due to our belief that videoconferencing is now a vital part of conducting business for many large corporate entities and that the demand for the company’s product could bounce back as the economy improves.
Ctrip.com International also lagged during the fiscal year. The company reported a string of disappointing quarterly earnings and future projections due to margin pressures. These pressures were partly driven by their response to a competitor’s aggressive pricing tactics in the hotel booking business. While this competitive response by Ctrip.com may make strategic sense in the long term, it increased our concern that the company’s competitive position was not as strong as originally estimated. Furthermore, margin pressure brought by higher labor costs and investment spending for growth initiatives created further headwinds and challenges to our original stock thesis. Therefore, we exited our position in the stock during the Fund’s fiscal year.
Regardless of the economic outcome, we remain consistent in our long-term investment philosophy: We want to own what we view as strong secular-growth companies with solid business models and competitive positions that we believe can grow market share and have the potential to deliver shareholder value in a variety of market environments.
3
| Performance summary | |
| Delaware Focus Global Growth Fund | November 30, 2012 |
The performance data quoted represent past performance; past performance does not guarantee future results. Investment return and principal value will fluctuate so your shares, when redeemed, may be worth more or less than their original cost. Please obtain the performance data current for the most recent month end by calling 800 523-1918 or visiting our website at delawareinvestments.com/performance. Current performance may be lower or higher than the performance data quoted.
| Fund performance1,2 | Average annual total returns through November 30, 2012 |
| | | | | | Lifetime | |
| | | | | | (if less than | |
| | 1 year | | 3 years | | 10 years) | |
| Class A (Est. Dec. 29, 2008) | | | | | | | |
| Excluding sales charge | | +15.49% | | +13.47% | | +21.45% | |
| Including sales charge | | +8.83% | | +11.26% | | +19.63% | |
| Class C (Est. Dec. 29, 2010) | | | | | | | |
| Excluding sales charge | | +14.66% | | n/a | | +6.02% | |
| Including sales charge | | +13.66% | | n/a | | +6.02% | |
| Class R (Est. Dec. 29, 2010) | | | | | | | |
| Excluding sales charge | | +15.17% | | n/a | | +6.51% | |
| Including sales charge | | +15.17% | | n/a | | +6.51% | |
| Institutional Class (Est. Dec. 29, 2008) | | | | | | | |
| Excluding sales charge | | +15.75% | | +13.64% | | +21.59% | |
| Including sales charge | | +15.75% | | +13.64% | | +21.59% | |
1 Returns reflect the reinvestment of all distributions and are presented both with and without the applicable sales charges described below. Returns do not reflect the deduction of taxes the shareholder would pay on Fund distributions or redemptions of Fund shares.
Expense limitations were in effect for certain classes during some or all of the periods shown in the “Fund performance” chart. The current expenses for each class are listed on the “Fund expense ratios” table on page 5. Performance would have been lower had expense limitations not been in effect.
Class A shares are sold with a maximum front-end sales charge of 5.75%, and have an annual distribution and service fee of 0.30% of average daily net assets. This fee has been contractually limited to 0.25% of average daily net assets from March 29, 2012 through March 29, 2013. Performance for Class A shares, excluding sales charges, assumes that no front-end sales charge applied.
Class C shares are sold with a contingent deferred sales charge of 1.00% if redeemed during the first 12 months. They are also subject to an annual distribution and service fee of 1.00% of average daily net assets.
4
Performance for Class C shares, excluding sales charges, assumes either that contingent deferred sales charges did not apply or that the investment was not redeemed.
Class R shares are available only for certain retirement plan products. They are sold without a sales charge and have an annual distribution and service fee of 0.60% of average daily net assets, which has been limited contractually to 0.50% from March 29, 2012 through March 29, 2013.
Institutional Class shares are available without sales or asset-based distribution charges only to certain eligible institutional accounts.
The “Fund performance” table and the “Performance of a $10,000 investment” graph do not reflect the deduction of taxes the shareholder would pay on Fund distributions or redemptions of Fund shares.
Investments in small and/or medium-sized companies typically exhibit greater risk and higher volatility than larger, more established companies.
International investments entail risks not ordinarily associated with U.S. investments including fluctuation in currency values, differences in accounting principles, or economic or political instability in other nations.
Investing in emerging markets can be riskier than investing in established foreign markets due to increased volatility and lower trading volume.
2 The Fund’s expense ratios, as described in the most recent prospectus, are disclosed in the following “Fund expense ratios” table. Delaware Investments has agreed to reimburse certain expenses and/or waive certain fees in order to prevent total fund operating expenses (excluding certain fees and expenses) from exceeding 1.30% of the Fund’s average daily net assets from March 29, 2012 through March 29, 2013. Please see the most recent prospectus and any applicable supplement(s) for additional information on these fee waivers and/or reimbursements.
| Fund expense ratios | | Class A | | Class C | | Class R | | Institutional Class |
| Total annual operating expenses | | 2.77% | | 3.47% | | 3.07% | | 2.47% |
| (without fee waivers) | | | | | | | | |
| Net expenses | | 1.55% | | 2.30% | | 1.80% | | 1.30% |
| (including fee waivers, if any) | | | | | | | | |
| Type of waiver | | Contractual | | Contractual | | Contractual | | Contractual |
5
Performance summary
Delaware Focus Global Growth Fund
Performance of a $10,000 investment1
Average annual total returns from Dec. 29, 2008 (Fund’s inception), through Nov. 30, 2012
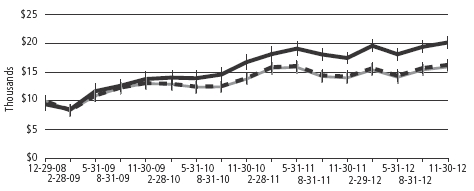
| For period beginning Dec. 29, 2008, through Nov. 30, 2012 | Starting value | Ending value |
| | Delaware Focus Global Growth Fund — Class A shares | $9,425 | $20,202 |
| | MSCI World Index (gross) | $10,000 | $16,296 |
| | MSCI World Index (net) | $10,000 | $15,935 |
1 The “Performance of a $10,000 investment” graph assumes $10,000 invested in Class A shares of the Fund on Dec. 29, 2008, and includes the effect of a 5.75% front-end sales charge and the reinvestment of all distributions. The graph does not reflect the deduction of taxes the shareholders would pay on Fund distributions or redemptions of Fund shares. Expense limitations were in effect for some or all of the periods shown. Performance would have been lower had expense limitations not been in effect. Current expenses are listed in the “Fund expense ratios” table on page 5. Please note additional details on pages 4 through 6.
The chart also assumes $10,000 invested in the MSCI World Index as of Dec. 29, 2008. The MSCI World Index is a free float-adjusted market capitalization weighted index designed to measure equity market performance across developed markets worldwide. Index “gross” return approximates the maximum possible dividend reinvestment. Index “net” return approximates the minimum possible dividend reinvestment, after deduction of withholding tax at the highest possible rate.
Index performance returns do not reflect any management fees, transaction costs, or expenses. Indices are unmanaged and one cannot invest directly in an index. Past performance is not a guarantee of future results.
Performance of other Fund classes will vary due to different charges and expenses.
| | | Nasdaq symbols | | CUSIPs | |
| Class A | | DGGAX | | 246118541 | |
| Class C | | DGGCX | | 246118533 | |
| Class R | | DGGRX | | 246118525 | |
| Institutional Class | | DGGIX | | 246118517 | |
6
Disclosure of Fund expenses
For the six-month period from June 1, 2012 to November 30, 2012 (Unaudited)
As a shareholder of the Fund, you incur two types of costs: (1) transaction costs, including sales charges (loads) on purchase payments, reinvested dividends, or other distributions; redemption fees; and exchange fees; and (2) ongoing costs, including management fees; distribution and/or service (12b-1) fees; and other Fund expenses. This example is intended to help you understand your ongoing costs (in dollars) of investing in the Fund and to compare these costs with the ongoing costs of investing in other mutual funds.
The example is based on an investment of $1,000 invested at the beginning of the period and held for the entire six-month period from June 1, 2012 to November 30, 2012.
Actual expenses
The first section of the table shown, “Actual Fund return,” provides information about actual account values and actual expenses. You may use the information in this section of the table, together with the amount you invested, to estimate the expenses that you paid over the period. Simply divide your account value by $1,000 (for example, an $8,600 account value divided by $1,000 = 8.6), then multiply the result by the number in the first section under the heading entitled “Expenses Paid During Period” to estimate the expenses you paid on your account during this period.
Hypothetical example for comparison purposes
The second section of the table shown, “Hypothetical 5% return,” provides information about hypothetical account values and hypothetical expenses based on the Fund’s actual expense ratio and an assumed rate of return of 5% per year before expenses, which is not the Fund’s actual return. The hypothetical account values and expenses may not be used to estimate the actual ending account balance or expenses you paid for the period. You may use this information to compare the ongoing costs of investing in the Fund and other funds. To do so, compare this 5% hypothetical example with the 5% hypothetical examples that appear in the shareholder reports of the other funds.
Please note that the expenses shown in the table are meant to highlight your ongoing costs only and do not reflect any transactional costs, such as sales charges (loads), redemption fees, or exchange fees. Therefore, the second section of the table is useful in comparing ongoing costs only, and will not help you determine the relative total costs of owning different funds. In addition, if these transactional costs were included, your costs would have been higher. The Fund’s expenses shown in the table reflect fee waivers in effect. The expenses shown in the table assume reinvestment of all dividends and distributions.
8
Delaware Focus Global Growth Fund
Expense analysis of an investment of $1,000
| | Beginning | | Ending | | | | | | | Expenses |
| | Account Value | | Account Value | | Annualized | | Paid During Period |
| | 6/1/12 | | 11/30/12 | | Expense Ratio | | 6/1/12 to 11/30/12* |
| Actual Fund return† | | | | | | | | | | | | | | | | | | |
| Class A | | $ | 1,000.00 | | | $ | 1,113.40 | | | | 1.53 | % | | | | $ | 8.08 | |
| Class C | | | 1,000.00 | | | | 1,109.80 | | | | 2.28 | % | | | | | 12.03 | |
| Class R | | | 1,000.00 | | | | 1,111.80 | | | | 1.78 | % | | | | | 9.40 | |
| Institutional Class | | | 1,000.00 | | | | 1,114.50 | | | | 1.28 | % | | | | | 6.77 | |
| Hypothetical 5% return (5% return before expenses) | | | | | | | | | | | |
| Class A | | $ | 1,000.00 | | | $ | 1,017.35 | | | | 1.53 | % | | | | $ | 7.72 | |
| Class C | | | 1,000.00 | | | | 1,013.60 | | | | 2.28 | % | | | | | 11.48 | |
| Class R | | | 1,000.00 | | | | 1,016.10 | | | | 1.78 | % | | | | | 8.97 | |
| Institutional Class | | | 1,000.00 | | | | 1,018.60 | | | | 1.28 | % | | | | | 6.46 | |
*“Expenses Paid During Period” are equal to the Fund’s annualized expense ratio, multiplied by the average account value over the period, multiplied by 183/366 (to reflect the one-half year period).
†Because actual returns reflect only the most recent six-month period, the returns shown may differ significantly from fiscal year returns.
9
| Security type/country and sector allocations |
| Delaware Focus Global Growth Fund | As of November 30, 2012 (Unaudited) |
Sector designations may be different than the sector designations presented in other Fund materials. The sector designations may represent the investment manager’s internal sector classifications, which may result in the sector designations for one fund being different than another fund’s sector designations.
| Security type/country | Percentage of net assets |
| Common Stock | 97.99 | % |
| Australia | 2.03 | % |
| Brazil | 2.91 | % |
| Denmark | 2.39 | % |
| Finland | 4.90 | % |
| France | 7.11 | % |
| Ireland | 2.82 | % |
| Netherlands | 1.97 | % |
| Spain | 2.70 | % |
| Switzerland | 12.00 | % |
| Taiwan | 2.59 | % |
| United Kingdom | 12.09 | % |
| United States | 44.48 | % |
| Short-Term Investments | 1.29 | % |
| Total Value of Securities | 99.28 | % |
| Receivables and Other Assets Net of Liabilities | 0.72 | % |
| Total Net Assets | 100.00 | % |
| |
| Common stock by sector² | | |
| Consumer Discretionary | 15.10 | % |
| Consumer Staples | 2.53 | % |
| Energy | 1.98 | % |
| Financials | 9.92 | % |
| Healthcare | 8.86 | % |
| Industrials | 20.70 | % |
| Information Technology | 29.15 | % |
| Materials | 6.68 | % |
| Telecommunication Services | 3.07 | % |
| Total | 97.99 | % |
²Narrow industries are utilized for compliance purposes for diversification whereas broad sectors are used for financial reporting.
10
| Statement of net assets | |
| Delaware Focus Global Growth Fund | November 30, 2012 |
| | | | Number of shares | | Value (U.S. $) |
| ΔCommon Stock – 97.99% | | | | | |
| Australia – 2.03% | | | | | |
| BHP Billiton ADR | | 8,480 | | $ | 610,899 |
| | | | | | | 610,899 |
| Brazil – 2.91% | | | | | |
| BM&F Bovespa | | 145,595 | | | 875,165 |
| | | | | | 875,165 |
| Denmark – 2.39% | | | | | |
| Novo Nordisk Class B | | 4,525 | | | 718,630 |
| | | | | | 718,630 |
| Finland – 4.90% | | | | | |
| Kone Class B | | 11,075 | | | 829,647 |
| Outotec | | 12,220 | | | 644,609 |
| | | | | | 1,474,256 |
| France – 7.11% | | | | | |
| Danone | | 12,015 | | | 762,163 |
| Edenred | | 24,440 | | | 744,574 |
| LVMH Moet Hennessy Louis Vuitton | | 3,617 | | | 634,582 |
| | | | | | 2,141,319 |
| Ireland – 2.82% | | | | | |
| Experian | | 51,084 | | | 848,698 |
| | | | | | 848,698 |
| Netherlands – 1.97% | | | | | |
| Core Laboratories | | 5,760 | | | 594,317 |
| | | | | | 594,317 |
| Spain – 2.70% | | | | | |
| Inditex | | 5,925 | | | 812,187 |
| | | | | | 812,187 |
| Switzerland – 12.00% | | | | | |
| † | Givaudan | | 555 | | | 557,276 |
| Kuehne & Nagel International | | 5,565 | | | 670,178 |
| Roche Holding | | 3,511 | | | 691,061 |
| SGS | | 380 | | | 852,509 |
| Syngenta | | 2,100 | | | 841,858 |
| | | | | | 3,612,882 |
11
Statement of net assets
Delaware Focus Global Growth Fund
| | | | Number of shares | | Value (U.S. $) |
| ΔCommon Stock (continued) | | | | | |
| Taiwan – 2.59% | | | | | |
| Taiwan Semiconductor Manufacturing ADR | | 45,134 | | $ | 779,464 |
| | | | | | 779,464 |
| United Kingdom – 12.09% | | | | | |
| Admiral Group | | 40,441 | | | 725,006 |
| Aggreko | | 21,880 | | | 782,404 |
| Compass Group | | 62,261 | | | 719,186 |
| Intertek Group | | 17,350 | | | 858,909 |
| Pearson | | 29,475 | | | 556,274 |
| | | | | | 3,641,779 |
| United States – 44.48% | | | | | |
| † | Adobe Systems | | 17,660 | | | 611,213 |
| Allergan | | 7,765 | | | 720,204 |
| Apple | | 2,200 | | | 1,287,615 |
| † | BMC Software | | 15,705 | | | 643,277 |
| † | Crown Castle International | | 13,700 | | | 925,023 |
| † | Google Class A | | 1,175 | | | 820,585 |
| † | IntercontinentalExchange | | 5,050 | | | 667,358 |
| Intuit | | 12,140 | | | 727,307 |
| MasterCard Class A | | 2,095 | | | 1,023,784 |
| † | MSCI Class A | | 24,835 | | | 720,215 |
| † | NeuStar Class A | | 7,775 | | | 312,555 |
| NIKE Class B | | 5,930 | | | 578,056 |
| Perrigo | | 5,205 | | | 538,718 |
| † | Polycom | | 29,125 | | | 304,648 |
| † | priceline.com | | 1,160 | | | 769,266 |
| QUALCOMM | | 13,845 | | | 880,819 |
| † | Sally Beauty Holdings | | 18,825 | | | 477,214 |
| † | Teradata | | 8,550 | | | 508,554 |
| † | VeriFone Systems | | 28,790 | | | 874,929 |
| | | | | | 13,391,340 |
| Total Common Stock (cost $24,102,035) | | | | | 29,500,936 |
12
| | | | Principal amount (U.S. $) | Value (U.S. $) |
| Short-Term Investments – 1.29% | | | | | | |
| ≠Discount Notes – 0.32% | | | | | | |
| Federal Home Loan Bank | | | | | | |
| 0.10% 1/18/13 | | $ | 4,664 | | $ | 4,664 |
| | 0.10% 1/23/13 | | | 77,252 | | | 77,245 |
| 0.13% 2/6/13 | | | 12,274 | | | 12,273 |
| 0.135% 2/15/13 | | | 2,700 | | | 2,700 |
| | | | | | | 96,882 |
| Repurchase Agreements – 0.97% | | | | | | |
| Bank of America 0.19%, dated 11/30/12, | | | | | | |
| to be repurchased on 12/3/12, repurchase | | | | | | |
| price $104,646 (collateralized by U.S. | | | | | | |
| government obligations 0.00%-0.25% | | | | | | |
| 1/3/13-11/30/14; market value $106,737) | | | 104,644 | | | 104,644 |
| BNP Paribas 0.20%, dated 11/30/12, | | | | | | |
| to be repurchased on 12/3/12, repurchase | | | | | | |
| price $187,359 (collateralized by U.S. | | | | | | |
| government obligations 0.25%-2.50% | | | | | | |
| 3/31/14-11/30/17; market value $191,245) | | | 187,356 | | | 187,356 |
| | | | | | | 292,000 |
| Total Short-Term Investments (cost $388,875) | | | | | | 388,882 |
| |
| Total Value of Securities – 99.28% | | | | | | |
| (cost $24,490,910) | | | | | | 29,889,818 |
| Receivables and Other Assets | | | | | | |
| Net of Liabilities – 0.72% | | | | | | 216,777 |
| Net Assets Applicable to 1,892,087 | | | | | | |
| Shares Outstanding – 100.00% | | | | | $ | 30,106,595 |
| |
| Net Asset Value – Delaware Focus Global Growth Fund | | | | | | |
| Class A ($16,753,014 / 1,053,943 Shares) | | | | | | | $15.90 |
| Net Asset Value – Delaware Focus Global Growth Fund | | | | | | |
| Class C ($1,593,748 / 101,735 Shares) | | | | | | | $15.67 |
| Net Asset Value – Delaware Focus Global Growth Fund | | | | | | |
| Class R ($60,854 / 3,849 Shares) | | | | | | | $15.81 |
| Net Asset Value – Delaware Focus Global Growth Fund | | | | | | |
| Institutional Class ($11,698,979 / 732,560 Shares) | | | | | | | $15.97 |
13
Statement of net assets
Delaware Focus Global Growth Fund
| | | | |
| Components of Net Assets at November 30, 2012: | | | |
| Shares of beneficial interest (unlimited authorization – no par) | $ | 25,605,459 | |
| Accumulated net realized loss on investments | | (897,327 | ) |
| Net unrealized appreciation of investments and derivatives | | 5,398,463 | |
| Total net assets | $ | 30,106,595 | |
| Δ | Securities have been classified by country of origin. Classification by type of business has been presented on page 10 in “Security type/country and sector allocations.” |
| † | Non income producing security. |
| ≠ | The rate shown is the effective yield at time of purchase. |
| Net Asset Value and Offering Price Per Share – | | |
| Delaware Focus Global Growth Fund | | |
| Net asset value Class A (A) | $ | 15.90 |
| Sales charge (5.75% of offering price) (B) | | 0.97 |
| Offering price | $ | 16.87 |
| (A) | Net asset value per share, as illustrated, is the amount which would be paid upon redemption or repurchase of shares. |
| (B) | See the current prospectus for purchases of $50,000 or more. |
The following foreign currency exchange contract was outstanding at November 30, 2012:1
Foreign Currency Exchange Contract
| | | | | | | | Unrealized |
| | | | | | | | Appreciation |
| Counterparty | | | Contracts to Receive (Deliver) | | In Exchange For | | Settlement Date | | (Depreciation) |
| MNB | | DKK (182,526) | | USD 31,536 | | 12/3/12 | | $(286) |
The use of foreign currency exchange contracts involves elements of market risk and risks in excess of the amounts recognized in the financial statements. The foreign currency exchange contracts presented above represent the Fund’s total exposure in such contracts, whereas only the net unrealized appreciation (depreciation) is reflected in the Fund’s net assets.
1See Note 8 in ”Notes to financial statements.”
Summary of abbreviations:
ADR — American Depositary Receipt
DKK — Danish Krone
MNB — Mellon National Bank
USD — United States Dollar
See accompanying notes, which are an integral part of the financial statements.
14
| Statement of operations | |
| Delaware Focus Global Growth Fund | Year Ended November 30, 2012 |
| Investment Income: | | | | | | | | |
| Dividends | | $ | 382,450 | | | | | |
| Interest | | | 991 | | | | | |
| Foreign tax withheld | | | (29,476 | ) | | $ | 353,965 | |
| |
| Expenses: | | | | | | | | |
| Management fees | | | 196,504 | | | | | |
| Registration fees | | | 57,097 | | | | | |
| Distribution expenses – Class A | | | 39,750 | | | | | |
| Distribution expenses – Class C | | | 4,571 | | | | | |
| Distribution expenses – Class R | | | 57 | | | | | |
| Dividend disbursing and transfer agent fees and expenses | | | 22,462 | | | | | |
| Custodian fees | | | 14,221 | | | | | |
| Reports and statements to shareholders | | | 12,561 | | | | | |
| Audit and tax | | | 11,776 | | | | | |
| Accounting and administration expenses | | | 9,026 | | | | | |
| Dues and services | | | 8,554 | | | | | |
| Pricing fees | | | 2,644 | | | | | |
| Legal fees | | | 1,626 | | | | | |
| Trustees’ fees | | | 1,024 | | | | | |
| Insurance fees | | | 312 | | | | | |
| Consulting fees | | | 237 | | | | | |
| Trustees’ expenses | | | 64 | | | | 382,486 | |
| Less fees waived | | | | | | | (38,229 | ) |
| Less waived distribution expenses – Class A | | | | | | | (6,625 | ) |
| Less waived distribution expenses – Class R | | | | | | | (9 | ) |
| Less expense paid indirectly | | | | | | | (10 | ) |
| Total operating expenses | | | | | | | 337,613 | |
| Net Investment Income | | | | | | | 16,352 | |
16
| Net Realized and Unrealized Gain (Loss) | | | |
| Net realized gain (loss) on: | | | |
| Investments | $ | (893,380 | ) |
| Foreign currencies | | 2,440 | |
| Foreign currency exchange contracts | | (28,620 | ) |
| Net realized loss | | (919,560 | ) |
| Net change in unrealized appreciation (depreciation) of: | | | |
| Investments | | 3,451,430 | |
| Foreign currencies | | 473 | |
| Foreign currency exchange contracts | | (286 | ) |
| Net change in unrealized appreciation (depreciation) | | 3,451,617 | |
| Net Realized and Unrealized Gain | | 2,532,057 | |
| |
| Net Increase in Net Assets Resulting from Operations | $ | 2,548,409 | |
See accompanying notes, which are an integral part of the financial statements.
17
Statements of changes in net assets
Delaware Focus Global Growth Fund
| Year Ended |
| 11/30/12 | | 11/30/11* |
| Increase (Decrease) in Net Assets from Operations: | | | | | | | |
| Net investment income | $ | 16,352 | | | $ | 15,050 | |
| Net realized gain (loss) | | (919,560 | ) | | | 81,640 | |
| Net change in unrealized appreciation (depreciation) | | 3,451,617 | | | | (208,076 | ) |
| Net increase (decrease) in net assets resulting from operations | | 2,548,409 | | | | (111,386 | ) |
| |
| Dividends and Distributions to Shareholders from: | | | | | | | |
| Net investment income: | | | | | | | |
| Class A | | — | | | | (4,926 | ) |
| Institutional Class | | — | | | | (9,758 | ) |
| |
| Net realized gain on investments: | | | | | | | |
| Class A | | (58,730 | ) | | | (71,427 | ) |
| Class C | | (620 | ) | | | — | |
| Class R | | (40 | ) | | | — | |
| Institutional Class | | (58,539 | ) | | | (141,494 | ) |
| | | (117,929 | ) | | | (227,605 | ) |
| |
| Capital Share Transactions: | | | | | | | |
| Proceeds from shares sold: | | | | | | | |
| Class A | | 16,702,069 | | | | 6,470,517 | |
| Class C | | 1,594,021 | | | | 70,629 | |
| Class R | | 53,677 | | | | 5,042 | |
| Institutional Class | | 4,334,407 | | | | 2,877,749 | |
| |
| Net asset value of shares issued upon reinvestment | | | | | | | |
| of dividends and distributions: | | | | | | | |
| Class A | | 52,125 | | | | 51,610 | |
| Class C | | 620 | | | | — | |
| Class R | | 40 | | | | — | |
| Institutional Class | | 58,081 | | | | 151,251 | |
| | | 22,795,040 | | | | 9,626,798 | |
18
| Year Ended |
| 11/30/12 | | 11/30/11* |
| Capital Share Transactions (continued): | | | | | | | |
| Cost of shares redeemed: | | | | | | | |
| Class A | $ | (9,425,460 | ) | | $ | (290,472 | ) |
| Class C | | (119,997 | ) | | | — | |
| Institutional Class | | (1,226,332 | ) | | | (538,155 | ) |
| | | (10,771,789 | ) | | | (828,627 | ) |
| Increase in net assets derived from capital share transactions | | 12,023,251 | | | | 8,798,171 | |
| Net Increase in Net Assets | | 14,453,731 | | | | 8,459,180 | |
| |
| Net Assets: | | | | | | | |
| Beginning of year | | 15,652,864 | | | | 7,193,684 | |
| End of year (There was no undistributed net investment | | | | | | | |
| income at either year end.) | $ | 30,106,595 | | | $ | 15,652,864 | |
*Class C and Class R commenced operations on December 29, 2010.
See accompanying notes, which are an integral part of the financial statements.
19
Financial highlights
Delaware Focus Global Growth Fund Class A
Selected data for each share of the Fund outstanding throughout each period were as follows:
| Net asset value, beginning of period |
| |
| Income (loss) from investment operations: |
| Net investment income (loss)2 |
| Net realized and unrealized gain |
| Total from investment operations |
| |
| Less dividends and distributions from: |
| Net investment income |
| Net realized gain |
| Total dividends and distributions |
| |
| Net asset value, end of period |
| |
| Total return3 |
| |
| Ratios and supplemental data: |
| Net assets, end of period (000 omitted) |
| Ratio of expenses to average net assets |
| Ratio of expenses to average net assets |
| prior to fees waived |
| Ratio of net investment income (loss) to average net assets |
| Ratio of net investment loss to average net assets |
| prior to fees waived |
| Portfolio turnover |
| 1 Date of commencement of operations; ratios and portfolio turnover have been annualized and total return has not been annualized. |
| 2 The average shares outstanding method has been applied for per share information. |
| 3 Total investment return is based on the change in net asset value of a share during the period and assumes reinvestment of dividends and distributions at net asset value and does not reflect the impact of a sales charge. Total investment return during all of the periods shown reflects waivers by the manager and distributor. Performance would have been lower had the waivers not been in effect. |
See accompanying notes, which are an integral part of the financial statements.
20
| | | | | | | | | | | | 12/29/081 | |
| | Year Ended | | | to | |
| | 11/30/12 | | 11/30/11 | | 11/30/10 | | | 11/30/09 | |
| | $13.880 | | | $13.720 | | | $12.470 | | | | $8.500 | | |
| | |
| | |
| | (0.002 | ) | | — | | | 0.025 | | | | 0.050 | | |
| | 2.133 | | | 0.594 | | | 2.422 | | | | 3.920 | | |
| | 2.131 | | | 0.594 | | | 2.447 | | | | 3.970 | | |
| | |
| | |
| | — | | | (0.028 | ) | | (0.027 | ) | | | — | | |
| | (0.111 | ) | | (0.406 | ) | | (1.170 | ) | | | — | | |
| | (0.111 | ) | | (0.434 | ) | | (1.197 | ) | | | — | | |
| | |
| | $15.900 | | | $13.880 | | | $13.720 | | | | $12.470 | | |
| | |
| | 15.49% | | | 4.28% | | | 21.31% | | | | 46.71% | | |
| | |
| | |
| | $16,753 | | | $8,244 | | | $2,413 | | | | $2,498 | | |
| | 1.55% | | | 1.51% | | | 1.20% | | | | 1.20% | | |
| | |
| | 1.76% | | | 2.78% | | | 2.04% | | | | 2.54% | | |
| | (0.02% | ) | | 0.00% | | | 0.20% | | | | 0.52% | | |
| | |
| | (0.23% | ) | | (1.27% | ) | | (0.64% | ) | | | (0.82% | ) | |
| | 37% | | | 18% | | | 30% | | | | 45% | | |
21
Financial highlights
Delaware Focus Global Growth Fund Class C
Selected data for each share of the Fund outstanding throughout each period was as follows:
| Year | | 12/29/101 |
| Ended | | to |
| 11/30/12 | | 11/30/11 |
| Net asset value, beginning of period | $ | 13.780 | | | $ | 14.120 | |
| |
| Income (loss) from investment operations: | | | | | | | |
| Net investment loss2 | | (0.113 | ) | | | (0.108 | ) |
| Net realized and unrealized gain (loss) | | 2.114 | | | | (0.232 | ) |
| Total from investment operations | | 2.001 | | | | (0.340 | ) |
| |
| Less dividends and distributions from: | | | | | | | |
| Net realized gain | | (0.111 | ) | | | — | |
| Total dividends and distributions | | (0.111 | ) | | | — | |
| |
| Net asset value, end of period | $ | 15.670 | | | $ | 13.780 | |
| |
| Total return3 | | 14.66% | | | | (2.41% | ) |
| |
| Ratios and supplemental data: | | | | | | | |
| Net assets, end of period (000 omitted) | $ | 1,594 | | | $ | 68 | |
| Ratio of expenses to average net assets | | 2.30% | | | | 2.30% | |
| Ratio of expenses to average net assets | | | | | | | |
| prior to fees waived | | 2.46% | | | | 3.52% | |
| Ratio of net investment loss to average net assets | | (0.77% | ) | | | (0.85% | ) |
| Ratio of net investment loss to average net assets | | | | | | | |
| prior to fees waived | | (0.93% | ) | | | (2.07% | ) |
| Portfolio turnover | | 37% | | | | 18% | 4 |
| 1 Date of commencement of operations; ratios have been annualized and total return has not been annualized. |
| 2 The average shares outstanding method has been applied for per share information. |
| 3 Total investment return is based on the change in net asset value of a share during the period and assumes reinvestment of dividends and distributions at net asset value and does not reflect the impact of a sales charge. Total investment return during all of the periods shown reflect a waiver by the manager. Performance would have been lower had the waiver not been in effect. |
| 4 Portfolio turnover is representative of the Fund for the entire period from December 1, 2010 through November 30, 2011. |
See accompanying notes, which are an integral part of the financial statements.
22
Delaware Focus Global Growth Fund Class R
Selected data for each share of the Fund outstanding throughout each period was as follows:
| Year | | 12/29/101 |
| Ended | | to |
| 11/30/12 | | 11/30/11 |
| Net asset value, beginning of period | $ | 13.840 | | | $ | 14.120 | |
| |
| Income (loss) from investment operations: | | | | | | | |
| Net investment loss2 | | (0.040 | ) | | | (0.043 | ) |
| Net realized and unrealized gain (loss) | | 2.121 | | | | (0.237 | ) |
| Total from investment operations | | 2.081 | | | | (0.280 | ) |
| |
| Less dividends and distributions from: | | | | | | | |
| Net realized gain | | (0.111 | ) | | | — | |
| Total dividends and distributions | | (0.111 | ) | | | — | |
| |
| Net asset value, end of period | $ | 15.810 | | | $ | 13.840 | |
| |
| Total return3 | | 15.17% | | | | (1.98% | ) |
| |
| Ratios and supplemental data: | | | | | | | |
| Net assets, end of period (000 omitted) | $ | 61 | | | $ | 5 | |
| Ratio of expenses to average net assets | | 1.80% | | | | 1.80% | |
| Ratio of expenses to average net assets | | | | | | | |
| prior to fees waived | | 2.06% | | | | 3.12% | |
| Ratio of net investment loss to average net assets | | (0.27% | ) | | | (0.35% | ) |
| Ratio of net investment loss to average net assets | | | | | | | |
| prior to fees waived | | (0.53% | ) | | | (1.67% | ) |
| Portfolio turnover | | 37% | | | | 18% | 4 |
| 1 Date of commencement of operations; ratios have been annualized and total return has not been annualized. |
| 2 The average shares outstanding method has been applied for per share information. |
| 3 Total investment return is based on the change in net asset value of a share during the period and assumes reinvestment of dividends and distributions at net asset value. Total investment return during all of the periods shown reflect waivers by the manager and distributor. Performance would have been lower had the waivers not been in effect. |
| 4 Portfolio turnover is representative of the Fund for the entire period from December 1, 2010 through November 30, 2011. |
See accompanying notes, which are an integral part of the financial statements.
23
Financial highlights
Delaware Focus Global Growth Fund Institutional Class
Selected data for each share of the Fund outstanding throughout each period were as follows:
| Net asset value, beginning of period |
| |
| Income from investment operations: |
| Net investment income2 |
| Net realized and unrealized gain |
| Total from investment operations |
| |
| Less dividends and distributions from: |
| Net investment income |
| Net realized gain |
| Total dividends and distributions |
| |
| Net asset value, end of period |
| |
| Total return3 |
| |
| Ratios and supplemental data: |
| Net assets, end of period (000 omitted) |
| Ratio of expenses to average net assets |
| Ratio of expenses to average net assets |
| prior to fees waived |
| Ratio of net investment income to average net assets |
| Ratio of net investment income (loss) to average net assets |
| prior to fees waived |
| Portfolio turnover |
| 1 Date of commencement of operations; ratios and portfolio turnover have been annualized and total return has not been annualized. |
| 2 The average shares outstanding method has been applied for per share information. |
| 3 Total investment return is based on the change in net asset value of a share during the period and assumes reinvestment of dividends and distributions at net asset value. Total investment return during all of the periods shown reflects a waiver by the manager. Performance would have been lower had the waiver not been in effect. |
See accompanying notes, which are an integral part of the financial statements.
24
| | | | | | | | | | | | 12/29/081 | |
| Year Ended | | to | |
| | 11/30/12 | | 11/30/11 | | 11/30/10 | | | 11/30/09 | |
| | $13.910 | | | $13.720 | | | $12.470 | | | | $ 8.500 | | |
| | | | |
| | | | |
| | 0.035 | | | 0.038 | | | 0.025 | | | | 0.050 | | |
| | 2.136 | | | 0.586 | | | 2.422 | | | | 3.920 | | |
| | 2.171 | | | 0.624 | | | 2.447 | | | | 3.970 | | |
| | | | |
| | | | |
| | — | | | (0.028 | ) | | (0.027 | ) | | | — | | |
| | (0.111 | ) | | (0.406 | ) | | (1.170 | ) | | | — | | |
| | (0.111 | ) | | (0.434 | ) | | (1.197 | ) | | | — | | |
| | | | |
| | $15.970 | | | $13.910 | | | $13.720 | | | | $12.470 | | |
| | | | |
| | 15.75% | | | 4.51% | | | 21.31% | | | | 46.71% | | |
| | | | |
| | | | |
| | $11,699 | | | $7,336 | | | $4,781 | | | | $2,334 | | |
| | 1.30% | | | 1.28% | | | 1.20% | | | | 1.20% | | |
| | | | |
| | 1.46% | | | 2.47% | | | 1.74% | | | | 2.24% | | |
| | 0.23% | | | 0.27% | | | 0.20% | | | | 0.52% | | |
| | | | |
| | 0.07% | | | (0.92% | ) | | (0.34% | ) | | | (0.52% | ) | |
| | 37% | | | 18% | | | 30% | | | | 45% | | |
25
| Notes to financial statements | |
| Delaware Focus Global Growth Fund | November 30, 2012 |
Delaware Group® Global & International Funds (Trust) is organized as a Delaware statutory trust and offers five series: Delaware Focus Global Growth Fund, Delaware International Value Equity Fund, Delaware Emerging Markets Fund, Delaware Global Value Fund, and Delaware Macquarie Global Infrastructure Fund. These financial statements and the related notes pertain to the Delaware Focus Global Growth Fund (Fund). The Trust is an open-end investment company. The Fund is considered diversified under the Investment Company Act of 1940, as amended, and offers Class A, Class C, Class R, and Institutional Class shares. Class A shares are sold with a maximum front-end sales charge of 5.75%. Class A share purchases of $1,000,000 or more will incur a contingent deferred sales charge (CDSC) of 1%, if redeemed during the first year and 0.50% during the second year, provided that Delaware Distributors, L.P. (DDLP) paid a financial advisor a commission on the purchase of those shares. Class C shares are sold with a CDSC of 1%, if redeemed during the first twelve months. Class R and Institutional Class shares are not subject to a sales charge and are offered for sale exclusively to certain eligible investors.
The investment objective of the Fund is to seek long-term capital appreciation.
1. Significant Accounting Policies
The following accounting policies are in accordance with U.S. generally accepted accounting principles (U.S. GAAP) and are consistently followed by the Fund.
Security Valuation — Equity securities, except those traded on the Nasdaq Stock Market, Inc. (Nasdaq), are valued at the last quoted sales price as of the time of the regular close of the New York Stock Exchange (NYSE) on the valuation date. Securities traded on the Nasdaq are valued in accordance with the Nasdaq Official Closing Price, which may not be the last sales price. If on a particular day an equity security does not trade, then the mean between the bid and ask prices will be used, which approximates fair value. Securities listed on a foreign exchange are valued at the last quoted sales price on the valuation date. Foreign currency exchange contracts are valued at the mean between the bid and ask prices, which approximates fair value. Interpolated values are derived when the settlement date of the contract is an interim date for which quotations are not available. U.S. government and agency securities are valued at the mean between the bid and ask prices, which approximates fair value. Generally, other securities and assets for which market quotations are not readily available are valued at fair value as determined in good faith under the direction of the Fund’s Board of Trustees (Board). In determining whether market quotations are readily available or fair valuation will be used, various factors will be taken into consideration, such as market closures or suspension of trading in a security. The Fund may use fair value pricing more frequently for securities traded primarily in non-U.S. markets because, among other things, most foreign markets close well before the Fund values its securities, generally as of 4:00 p.m. Eastern time. The earlier close of these foreign markets gives rise to the possibility that significant events, including broad market moves, government actions or pronouncements, aftermarket trading, or news events may have occurred in the interim. To account for this, the Fund may frequently value foreign securities using fair value prices based on third-party vendor modeling tools (international fair value pricing).
26
Federal & Foreign Income Taxes — No provision for federal income taxes has been made as the Fund intends to continue to qualify for federal income tax purposes as a regulated investment company under Subchapter M of the Internal Revenue Code of 1986, as amended, and make the requisite distributions to shareholders. The Fund evaluates tax positions taken or expected to be taken in the course of preparing the Fund’s tax returns to determine whether the tax positions are “more-likely-than-not” of being sustained by the applicable tax authority. Tax positions not deemed to meet the more-likely-than-not threshold are recorded as a tax benefit or expense in the current year. Management has analyzed the Fund’s tax positions taken for all open federal income tax years (November 30, 2009 – November 30, 2012), and has concluded that no provision for federal income tax is required in the Fund’s financial statements. In regards to foreign taxes, the Fund only has open tax years in certain foreign countries it invests in back to the inception of the Fund.
Class Accounting — Investment income, common expenses and realized and unrealized gain (loss) on investments are allocated to the various classes of the Fund on the basis of daily net assets of each class. Distribution expenses relating to a specific class are charged directly to that class.
Foreign Currency Transactions — Transactions denominated in foreign currencies are recorded at the prevailing exchange rates on the valuation date in accordance with the Fund’s prospectus. The value of all assets and liabilities denominated in foreign currencies is translated into U.S. dollars at the exchange rate of such currencies against the U.S. dollar daily. Transaction gains or losses resulting from changes in exchange rates during the reporting period or upon settlement of the foreign currency transaction are reported in operations for the current period. The Fund generally does not isolate that portion of realized gains and losses on investments, which is due to changes in foreign exchange rates from that which is due to changes in market prices. The Fund reports certain foreign currency related transactions as components of realized gains (losses) for financial reporting purposes, whereas such components are treated as ordinary income (loss) for federal income tax purposes.
Repurchase Agreements — The Fund may purchase certain U.S. government securities subject to the counterparty’s agreement to repurchase them at an agreed upon date and price. The counterparty will be required on a daily basis to maintain the value of the collateral subject to the agreement at not less than the repurchase price (including accrued interest). The agreements are conditioned upon the collateral being deposited under the Federal Reserve book-entry system with the Fund’s custodian or a third party sub-custodian. In the event of default or bankruptcy by the other party to the agreement, retention of the collateral may be subject to legal proceedings. All open repurchase agreements as of the date of this report were entered into on November 30, 2012.
Use of Estimates — The preparation of financial statements in conformity with U.S. GAAP requires management to make estimates and assumptions that affect the fair value of investments, the reported amounts of assets and liabilities and disclosure of contingent assets and liabilities at the date of the financial statements and the reported amounts of revenues and expenses during the reporting period. Actual results could differ from those estimates and the differences could be material.
27
Notes to financial statements
Delaware Focus Global Growth Fund
1. Significant Accounting Policies (continued)
Other — Expenses directly attributable to the Fund are charged directly to the Fund. Other expenses common to various funds within the Delaware Investments® Family of Funds are generally allocated amongst such funds on the basis of average net assets. Management fees and some other expenses are paid monthly. Security transactions are recorded on the date the securities are purchased or sold (trade date) for financial reporting purposes. Costs used in calculating realized gains and losses on the sale of investment securities are those of the specific securities sold. Dividend income is recorded on the ex-dividend date and interest income is recorded on the accrual basis. Foreign dividends are also recorded on the ex-dividend date or as soon after the ex-dividend date that the Fund is aware of such dividends, net of all non-rebatable tax withholdings. Withholding taxes on foreign dividends have been recorded in accordance with the Fund’s understanding of the applicable country’s tax rules and rates. The Fund declares and pays dividends from net investment income and distributions from net realized gain on investments, if any, annually. The Fund may distribute income dividends and capital gains more frequently, if necessary for tax purposes. Dividends and distributions, if any, are recorded on the ex-dividend date.
The Fund may receive earnings credits from its custodian when positive cash balances are maintained, which are used to offset custody fees. There were no earnings credits for the year ended November 30, 2012.
The Fund receives earnings credits from its transfer agent when positive cash balances are maintained, which are used to offset transfer agent fees. The expense paid under this arrangement is included in dividend disbursing and transfer agent fees and expenses on the statement of operations with the corresponding expense offset shown as “expense paid indirectly.” For the year ended November 30, 2012, the Fund earned $10 under this agreement.
2. Investment Management, Administration Agreements and Other Transactions with Affiliates
In accordance with the terms of its investment management agreement, the Fund pays Delaware Management Company (DMC), a series of Delaware Management Business Trust and the investment manager, an annual fee which is calculated daily at the rate of 0.85% on the first $500 million of average daily net assets of the Fund, 0.80% on the next $500 million, 0.75% on the next $1.5 billion and 0.70% on the average daily net assets in excess of $2.5 billion.
DMC had contractually agreed to waive that portion, if any, of its management fee and reimburse the Fund to the extent necessary to ensure that total annual operating expenses (excluding any 12b-1 plan expenses and certain other expenses) do not exceed 1.30% of average daily net assets of the Fund through March 29, 2013. This expense waiver and reimbursement applies only to expenses paid directly by the Fund.
Delaware Service Company, Inc. (DSC), an affiliate of DMC, provides fund accounting and financial administration oversight services to the Fund. For these services, the Fund pays DSC fees based on the aggregate daily net assets of the Delaware Investments® Family of Funds at the following
28
annual rate: 0.0050% of the first $30 billion; 0.0045% of the next $10 billion; 0.0040% of the next $10 billion; and 0.0025% of aggregate average daily net assets in excess of $50 billion. The fees payable to DSC under the service agreement described above are allocated among all Funds in the Delaware Investments® Family of Funds on a relative net asset value basis. For the year ended November 30, 2012, the Fund was charged $1,132 for these services.
DSC is also the transfer agent and dividend disbursing agent of the Fund. The Fund pays DSC a monthly asset-based fee for these services. Pursuant to a sub-transfer agency agreement between DSC and BNY Mellon Investment Servicing (US) Inc. (BNYMIS), BNYMIS provides certain sub-transfer agency services to the Fund. Sub-transfer agency fees are passed on to and paid directly by the Fund.
Pursuant to a distribution agreement and distribution plan, the Fund pays DDLP, the distributor and an affiliate of DMC, an annual distribution and service fee of 0.30% of the average daily net assets of the Class A shares, 1.00% of the average daily net assets of Class C shares, and 0.60% of the average daily net assets of Class R shares. Institutional Class shares pay no distribution and service expenses. DDLP has contracted to waive distribution and service fees through March 29, 2013 in order to prevent distribution and service fees of Class A and Class R shares from exceeding 0.25% and 0.50% respectively, of average daily net assets.
At November 30, 2012, the Fund had liabilities payable to affiliates as follows:
| Investment management fee payable to DMC | $ | 16,350 |
| Dividend disbursing, transfer agent and fund accounting | | |
| oversight fees and other expenses payable to DSC | | 663 |
| Distribution fees payable to DDLP | | 4,547 |
| Other expenses payable to DMC and affiliates* | | 1,090 |
*DMC, as part of its administrative services, pays operating expenses on behalf of the Fund and is reimbursed on a periodic basis. Expenses include items such as printing of shareholder reports, fees for audit, legal and tax services, registration fees and trustees’ fees.
As provided in the investment management agreement, the Fund bears the cost of certain legal and tax services, including internal legal and tax services provided to the Fund by DMC and/or its affiliates’ employees. For the year ended November 30, 2012, the Fund was charged $ 623 for internal legal and tax services provided by DMC and/or its affiliates’ employees.
For the year ended November 30, 2012, DDLP earned $12,885 for commissions on sales of the Fund’s Class A shares.
Trustees’ fees include expenses accrued by the Fund for each Trustee’s retainer and meeting fees. Certain officers of DMC, DSC and DDLP are officers and/or Trustees of the Trust. These officers and Trustees are paid no compensation by the Fund.
29
Notes to financial statements
Delaware Focus Global Growth Fund
3. Investments
For the year ended November 30, 2012, the Fund made purchases of $19,585,004 and sales of $8,221,020 of investment securities other than short-term investments.
At November 30, 2012, the cost of investments for federal income tax purposes was $24,789,503. At November 30, 2012, the net unrealized appreciation was $5,100,315, of which $6,057,284 related to unrealized appreciation of investments and $956,969 related to unrealized depreciation of investments.
U.S. GAAP defines fair value as the price that the Fund would receive to sell an asset or pay to transfer a liability in an orderly transaction between market participants at the measurement date under current market conditions. A three level hierarchy for fair value measurements has been established based upon the transparency of inputs to the valuation of an asset or liability. Inputs may be observable or unobservable and refer broadly to the assumptions that market participants would use in pricing the asset or liability. Observable inputs reflect the assumptions market participants would use in pricing the asset or liability based on market data obtained from sources independent of the reporting entity. Unobservable inputs reflect the reporting entity’s own assumptions about the assumptions that market participants would use in pricing the asset or liability developed based on the best information available under the circumstances. The Fund’s investment in its entirety is assigned a level based upon the observability of the inputs which are significant to the overall valuation. The three level hierarchy of inputs is summarized below.
| Level 1 – | inputs are quoted prices in active markets for identical investments (e.g., equity securities, open-end investment companies, futures contracts, exchange-traded options contracts) |
| |
| Level 2 – | other observable inputs (including, but not limited to: quoted prices for similar assets or liabilities in markets that are active, quoted prices for identical or similar assets or liabilities in markets that are not active, inputs other than quoted prices that are observable for the assets or liabilities (such as interest rates, yield curves, volatilities, prepayment speeds, loss severities, credit risks and default rates) or other market-corroborated inputs) (e.g., debt securities, government securities, swap contracts, foreign currency exchange contracts, foreign securities utilizing international fair value pricing, broker-quoted securities, fair valued securities) |
| |
| Level 3 – | inputs are significant unobservable inputs (including the Fund’s own assumptions used to determine the fair value of investments) (e.g., broker-quoted securities, fair valued securities) |
30
Level 3 investments are valued using significant unobservable inputs. The Fund may also use an income-based valuation approach in which the anticipated future cash flows of the investment are discounted to calculate fair value. Discounts may also be applied due to the nature or duration of any restrictions on the disposition of the investments. Valuations may also be based upon current market prices of securities that are comparable in coupon, rating, maturity and industry. The derived value of a Level 3 investment may not represent the value which is received upon disposition and this could impact the results of operations.
The following table summarizes the valuation of the Fund’s investments by fair value hierarchy levels as of November 30, 2012:
| | Level 1 | | Level 2 | | Total |
| Common Stock | | $ | 29,500,936 | | $ | — | | $ | 29,500,936 |
| Short-Term Investments | | | — | | | 388,882 | | | 388,882 |
| Total | | $ | 29,500,936 | | $ | 388,882 | | $ | 29,889,818 |
During the year ended November 30, 2012, there were no transfers between Level 1 investments, Level 2 investments or Level 3 investments that had a significant impact to the Fund. This does not include transfers between Level 1 investments and Level 2 investments due to the Fund utilizing international fair value pricing during the year. International fair value pricing uses other observable market-based inputs in place of the closing exchange price due to the events occurring after the close of the exchange or market on which the investment is principally traded in accordance with the fair valuation procedures described in Note 1, causing a change in classification between levels. The Fund’s policy is to recognize transfers between levels at the beginning of the reporting period.
4. Dividend and Distribution Information
Income and long-term capital gain distributions are determined in accordance with federal income tax regulations, which may differ from U.S. GAAP. Additionally, distributions from net gains on foreign currency transactions and net short-term gains on sales of investment securities are treated as ordinary income for federal income tax purposes. The tax character of dividends and distributions paid during the years ended November 30, 2012 and the year ended November 30, 2011 was as follows:
| | Year Ended |
| | 11/30/12 | | 11/30/11 |
| Ordinary income | | $ | — | | $ | 85,591 |
| Long-term capital gain | | | 117,929 | | | 142,014 |
| | $ | 117,929 | | $ | 227,605 |
31
Notes to financial statements
Delaware Focus Global Growth Fund
5. Components of Net Assets on a Tax Basis
As of November 30, 2012, the components of net assets on a tax basis were as follows:
| Shares of beneficial interest | $ | 25,605,459 | |
| Capital loss carryforwards | | (598,734 | ) |
| Unrealized appreciation | | 5,099,870 | |
| Net assets | $ | 30,106,595 | |
The differences between book basis and tax basis components of net assets are primarily attributable to tax deferral of losses on wash sales.
For financial reporting purposes, capital accounts are adjusted to reflect the tax character of permanent book/tax differences. Reclassifications are primarily due to tax treatment of gain (loss) on foreign currency transactions and tax treatment of dividends and distributions. Results of operations and net assets were not affected by these reclassifications. For the year ended November 30, 2012, the Fund recorded the following reclassifications:
| Paid-in capital | | $ | (20,646 | ) |
| Undistributed net investment income | | | (16,352 | ) |
| Accumulated net realized loss | | | 36,998 | |
On December 22, 2010, the Regulated Investment Company Modernization Act of 2010 (the Act) was enacted, which changed various technical rules governing the tax treatment of regulated investment companies. The changes were generally effective for taxable years beginning after the date of enactment. Under the Act, the Fund is permitted to carry forward capital losses incurred in taxable years beginning after the date of enactment for an unlimited period. However, any losses incurred during those future taxable years will be required to be utilized prior to the losses incurred in pre-enactment taxable years, which carry an expiration date. As a result of this ordering rule, pre-enactment capital loss carryforwards may be more likely to expire unused. Additionally, post-enactment capital loss carryforwards will retain their character as either short-term or long-term capital losses rather than being considered all short-term as permitted under previous regulation.
Losses incurred that will be carried forward under the Act are as follows:
| Loss carryforward character |
| Short-term | | Long-term |
| $328,634 | | $270,100 |
32
6. Capital Shares
Transactions in capital shares were as follows:
| | Year Ended |
| | 11/30/12 | | 11/30/11* |
| Shares sold: | | | | | | |
| Class A | | 1,093,726 | | | 435,652 | |
| Class C | | 104,911 | | | 4,923 | |
| Class R | | 3,487 | | | 359 | |
| Institutional Class | | 282,896 | | | 207,834 | |
| |
| Shares issued upon reinvestment of dividends and distributions: | | | | | | |
| Class A | | 3,856 | | | 3,663 | |
| Class C | | 46 | | | — | |
| Class R | | 3 | | | — | |
| Institutional Class | | 4,317 | | | 10,734 | |
| | | 1,493,242 | | | 663,165 | |
| Shares redeemed: | | | | | | |
| Class A | | (637,633 | ) | | (21,250 | ) |
| Class C | | (8,145 | ) | | — | |
| Institutional Class | | (82,033 | ) | | (39,695 | ) |
| | (727,811 | ) | | (60,945 | ) |
| Net increase | | 765,431 | | | 602,220 | |
*Class C and Class R commenced operations on December 29, 2010.
7. Line of Credit
The Fund, along with certain other funds in the Delaware Investments® Family of Funds (Participants), was a participant in a $125,000,000 revolving line of credit to be used for temporary or emergency purposes as an additional source of liquidity to fund redemptions of investor shares. Under the agreement, the Participants were charged an annual commitment fee, which was allocated across the Participants on the basis of each Participant’s allocation of the entire facility. The Participants were permitted to borrow up to a maximum of one third of their net assets under the agreement. Each Participant was individually, and not jointly, liable for its particular advances, if any, under the line of credit. The line of credit available under the agreement expired on November 13, 2012.
On November 13, 2012, the Fund, along with the other Participants, entered into an amendment to the agreement for a $125,000,000 revolving line of credit. The agreement is to be used as described above and operates in substantially the same manner as the original agreement. The line of credit available under the agreement expires on November 12, 2013. The Fund had no amounts outstanding as of November 30, 2012 or at any time during the year then ended.
33
Notes to financial statements
Delaware Focus Global Growth Fund
8. Derivatives
U.S. GAAP requires disclosures that enable investors to understand: 1) how and why an entity uses derivatives; 2) how they are accounted for; and 3) how they affect an entity’s results of operations and financial position.
Foreign Currency Exchange Contracts — The Fund enters into foreign currency exchange contracts as a way of managing foreign exchange rate risk. The Fund may enter into these contracts to fix the U.S. dollar value of a security that it has agreed to buy or sell for the period between the date the trade was entered into and the date the security is delivered and paid for. The Fund may also use these contracts to hedge the U.S. dollar value of securities it already owns that are denominated in foreign currencies. The change in value is recorded as an unrealized gain or loss. When the contract is closed, a realized gain or loss is recorded equal to the difference between the value of the contract at the time it was opened and the value at the time it was closed.
The use of foreign currency exchange contracts does not eliminate fluctuations in the underlying prices of the securities, but does establish a rate of exchange that can be achieved in the future. Although foreign currency exchange contracts limit the risk of loss due to an unfavorable change in the value of the hedged currency, they also limit any potential gain that might result should the value of the currency change favorably. In addition, the Fund could be exposed to risks if the counterparties to the contracts are unable to meet the terms of their contracts. The Fund’s maximum risk of loss from counterparty credit risk is the value of its currency exchanged with the counterparty. The risk is generally mitigated by having a netting arrangement between the Fund and the counterparty and by the posting of collateral by the counterparty to the Fund to cover the Fund’s exposure to the counterparty.
Derivatives Generally. The table below summarizes the average daily balance of derivative holdings by the Fund during the year ended November 30, 2012.
| | Long | | Short |
| | Derivative | | Derivative |
| | | Volume | | Volume |
| Foreign currency exchange contracts (average cost) | | $(66,280) | | $17,729 |
9. Securities Lending
The Fund, along with other funds in the Delaware Investments® Family of Funds, may lend its securities pursuant to a security lending agreement (Lending Agreement) with The Bank of New York Mellon (BNY Mellon). At the time a security is loaned, the borrower must post collateral equal to the required percentage of the market value of the loaned security, including any accrued interest. The required percentage is: (i) 102% with respect to U.S. securities and foreign securities that are denominated and payable in U.S. dollars; and (ii) 105% with respect to foreign securities. With respect to each loan, if on any business day the aggregate market value of securities collateral plus cash collateral held is less than the aggregate market value of the securities which are the subject of
34
such loan, the borrower will be notified to provide additional collateral by the end of the following business day which, together with the collateral already held, will be not less than the applicable initial collateral requirements for such security loan. If the aggregate market value of securities collateral and cash collateral held with respect to a security loan exceeds the applicable initial collateral requirement, upon the request of the borrower BNY Mellon must return enough collateral to the borrower by the end of the following business day to reduce the value of the remaining collateral to the applicable initial collateral requirement for such security loan. As a result of the foregoing, the value of the collateral held with respect to a loaned security may be temporarily more or less than the value of the security on loan.
Cash collateral received is generally invested in the Delaware Investments Collateral Fund No. 1 (Collective Trust) established by BNY Mellon for the purpose of investment on behalf of funds managed by DMC that participate in BNY Mellon’s securities lending program. The Collective Trust may invest in U.S. government securities and high quality corporate debt, asset-backed and other money market securities and in repurchase agreements collateralized by such securities, provided that the Collective Trust will generally have a dollar-weighted average portfolio maturity of 60 days or less. The Fund can also accept U.S. government securities and letters of credit (noncash collateral) in connection with securities loans. In the event of default or bankruptcy by the lending agent, realization and/or retention of the collateral may be subject to legal proceedings. In the event the borrower fails to return loaned securities and the collateral received is insufficient to cover the value of the loaned securities and provided such collateral shortfall is not the result of investment losses, the lending agent has agreed to pay the amount of the shortfall to the Fund, or at the discretion of the lending agent, replace the loaned securities. The Fund continues to record dividends or interest, as applicable, on the securities loaned and is subject to changes in value of the securities loaned that may occur during the term of the loan. The Fund has the right under the Lending Agreement to recover the securities from the borrower on demand. With respect to security loans collateralized by non-cash collateral, the Fund receives loan premiums paid by the borrower. With respect to security loans collateralized by cash collateral, the earnings from the collateral investments are shared among the Fund, the security lending agent and the borrower. The Fund records security lending income net of allocations to the security lending agent and the borrower.
The Collective Trust used for the investment of cash collateral received from borrowers of securities seeks to maintain a net asset value per unit of $1.00, but there can be no assurance that it will always be able to do so. The Fund may incur investment losses as a result of investing securities lending collateral in the Collective Trust. This could occur if an investment in the Collective Trust defaulted or if it were necessary to liquidate assets in the Collective Trust to meet returns on outstanding security loans at a time when the Collective Trust net asset value per unit was less than $1.00. Under those circumstances, the Fund may not receive an amount from the Collective Trust that is equal in amount to the collateral the Fund would be required to return to the borrower of the securities and the Fund would be required to make up for this shortfall.
The Fund had no securities out on loan as of November 30, 2012.
35
Notes to financial statements
Delaware Focus Global Growth Fund
10. Credit and Market Risk
Some countries in which the Fund may invest require governmental approval for the repatriation of investment income, capital or the proceeds of sales of securities by foreign investors. In addition, if there is deterioration in a country’s balance of payments or for other reasons, a country may impose temporary restrictions on foreign capital remittances abroad.
The securities exchanges of certain foreign markets are substantially smaller, less liquid and more volatile than the major securities markets in the United States. Consequently, acquisition and disposition of securities by the Fund may be inhibited. In addition, a significant portion of the aggregate market value of equity securities listed on the major securities exchanges in emerging markets are held by a smaller number of investors. This may limit the number of shares available for acquisition or disposition by the Fund.
The Fund may invest up to 15% of its net assets in illiquid securities, which may include securities with contractual restrictions on resale, securities exempt from registration under Rule 144A of the Securities Act of 1933, as amended, and other securities which may not be readily marketable. The relative illiquidity of these securities may impair the Fund from disposing of them in a timely manner and at a fair price when it is necessary or desirable to do so. While maintaining oversight, the Fund’s Board has delegated to DMC the day-to-day functions of determining whether individual securities are liquid for purposes of the Fund’s limitation on investments in illiquid securities. Securities eligible for resale pursuant to Rule 144A, which are determined to be liquid, are not subject to the Fund’s 15% limit on investments in illiquid securities. As of November 30, 2012, there were no Rule 144A securities and no securities have been determined to be illiquid under the Fund’s Liquidity Procedures.
11. Contractual Obligations
The Fund enters into contracts in the normal course of business that contain a variety of indemnifications. The Fund’s maximum exposure under these arrangements is unknown. However, the Fund has not had prior claims or losses pursuant to these contracts. Management has reviewed the Fund’s existing contracts and expects the risk of loss to be remote.
12. Subsequent Events
Management has determined that no material events or transactions occurred subsequent to November 30, 2012 that would require recognition or disclosure in the Fund’s financial statements.
36
Report of independent
registered public accounting firm
To the Board of Trustees of Delaware Group® Global & International Funds
and Shareholders of Delaware Focus Global Growth Fund:
In our opinion, the accompanying statement of net assets and the related statements of operations and of changes in net assets and the financial highlights present fairly, in all material respects, the financial position of Delaware Focus Global Growth Fund (one of the series constituting Delaware Group Global & International Funds, hereafter referred to as the “Fund”) at November 30, 2012, the results of its operations for the year then ended, the changes in its net assets for each of the two years in the period then ended and the financial highlights for each of the prior three periods, in conformity with accounting principles generally accepted in the United States of America. These financial statements and financial highlights (hereafter referred to as “financial statements”) are the responsibility of the Fund’s management; our responsibility is to express an opinion on these financial statements based on our audits. We conducted our audits of these financial statements in accordance with the standards of the Public Company Accounting Oversight Board (United States). Those standards require that we plan and perform the audit to obtain reasonable assurance about whether the financial statements are free of material misstatement. An audit includes examining, on a test basis, evidence supporting the amounts and disclosures in the financial statements, assessing the accounting principles used and significant estimates made by management, and evaluating the overall financial statement presentation. We believe that our audits, which included confirmation of securities at November 30, 2012 by correspondence with the custodian and brokers, provide a reasonable basis for our opinion. The financial highlights for the period December 29, 2008 (commencement of operations) through November 30, 2009 were audited by other independent accountants whose report dated January 21, 2010 expressed an unqualified opinion on those statements.
PricewaterhouseCoopers LLP
Philadelphia, Pennsylvania
January 15, 2013
37
Other Fund information
(Unaudited)
Delaware Focus Global Growth Fund
Board Consideration of Delaware Focus Global Growth Fund investment advisory agreement
At a meeting held on August 21-23, 2012 (the “Annual Meeting”), the Board of Trustees (the “Board”), including a majority of disinterested or independent Trustees, approved the renewal of the Investment Advisory Agreement for Delaware Focus Global Growth Fund (the “Fund”). In making its decision, the Board considered information furnished at regular quarterly Board meetings, including reports detailing Fund performance, investment strategies and expenses, as well as information prepared specifically in connection with the renewal of the investment advisory and sub-advisory contracts. Information furnished specifically in connection with the renewal of the Investment Advisory Agreement with Delaware Management Company (“DMC”) included materials provided by DMC and its affiliates (“Delaware Investments”) concerning, among other things, the nature, extent and quality of services provided to the Fund, the costs of such services to the Fund, economies of scale and the financial condition and profitability of Delaware Investments. In addition, in connection with the Annual Meeting, reports were provided in May 2012 and included independent historical and comparative reports provided by Lipper, Inc., an independent statistical compilation organization (“Lipper”). The Lipper reports compared the Fund’s investment performance and expenses with those of other comparable mutual funds. The Independent Trustees reviewed and discussed the Lipper reports with independent legal counsel to the Independent Trustees. The Board requested and received information regarding DMC’s policy with respect to advisory fee levels and its breakpoint philosophy; the structure of portfolio manager compensation; the investment manager’s profitability; comparative client fee information; and any constraints or limitations on the availability of securities in certain investment styles, which had in the past year inhibited, or which were likely in the future to inhibit, DMC’s ability to invest fully in accordance with Fund policies.
In considering information relating to the approval of the Fund’s advisory agreement, the Independent Trustees received assistance and advice from and met separately with independent legal counsel to the Independent Trustees. Although the Board gave attention to all information furnished, the following discussion identifies, under separate headings, the primary factors taken into account by the Board during its contract renewal considerations.
Nature, Extent and Quality of Service. The Board considered the services provided by Delaware Investments to the Fund and its shareholders. In reviewing the nature, extent and quality of services, the Board considered reports furnished to it throughout the year, which covered matters such as the relative performance of the Fund, compliance of portfolio managers with the investment policies, strategies and restrictions for the Fund, compliance by DMC and Delaware Distributors, L.P. (together, “Management”) personnel with the Code of Ethics adopted throughout the Delaware Investments® Family of Funds complex and adherence to fair value pricing procedures as established by the Board. The Board was pleased with the current staffing of the Fund’s investment advisor and the emphasis placed on research in the investment process. The Board recognized DMC’s receipt of several industry distinctions. The Board gave favorable consideration to DMC’s efforts to control expenditures while maintaining service levels committed to fund matters. The Board noted that in
38
July 2011 Management implemented measures to reduce overall costs and improve transfer agent and shareholder servicing functions through outsourcing. The Board noted the benefits provided to Fund shareholders through each shareholder’s ability to exchange an investment in one Delaware Investments® fund for the same class of shares in another Delaware Investments fund without a sales charge, to reinvest Fund dividends into additional shares of the Fund or into additional shares of other Delaware Investments funds and the privilege to combine holdings in other Delaware Investments funds to obtain a reduced sales charge. The Board was satisfied with the nature, extent and quality of the overall services provided by Delaware Investments.
Investment Performance. The Board placed significant emphasis on the investment performance of the Fund in view of the importance of investment performance to shareholders. Although the Board gave appropriate consideration to performance reports and discussions with portfolio managers at Investment Committee meetings throughout the year, the Board gave particular weight to the Lipper reports furnished for the Annual Meeting. The Lipper reports prepared for the Fund showed the investment performance of its Class A shares in comparison to a group of similar funds as selected by Lipper (the “Performance Universe”). A fund with the best performance ranked first, and a fund with the poorest performance ranked last. The highest/best performing 25% of funds in the Performance Universe make up the first quartile; the next 25%, the second quartile; the next 25%, the third quartile; and the poorest/worst performing 25% of funds in the Performance Universe make up the fourth quartile. Comparative annualized performance for the Fund was shown for the past one-, three-, five- and ten-year periods, as applicable, ended March 31, 2012. The Board’s objective is that the Fund’s performance for the periods considered be at or above the median of its Performance Universe. The following paragraph summarizes the performance results for the Fund and the Board’s view of such performance.
The Performance Universe for the Fund consisted of the Fund and all retail and institutional global multi-cap growth funds as selected by Lipper. The Lipper report comparison showed that the Fund’s total return for the one- and three-year periods was in the first quartile of its Performance Universe. The Board was satisfied with performance.
Comparative Expenses. The Board considered expense comparison data for the Delaware Investments Family of Funds. Management provided the Board with information on pricing levels and fee structures for the Fund as of its most recently completed fiscal year. The Board also focused on the comparative analysis of effective management fees and total expense ratios of the Fund versus effective management fees and expense ratios of a group of similar funds as selected by Lipper (the “Expense Group”). In reviewing comparative costs, the Fund’s contractual management fee and the actual management fee incurred by the Fund were compared with the contractual management fees (assuming all funds in the Expense Group were similar in size to the Fund) and actual management fees (as reported by each fund) within the Expense Group, taking into account any applicable breakpoints and fee waivers. The Fund’s total expenses were also compared with those of its Expense Group. The Lipper total expenses, for comparative consistency, were shown by Lipper for Class A shares and comparative total expenses including 12b-1 and non 12b-1 service
39
Other Fund information
(Unaudited)
Delaware Focus Global Growth Fund
Board Consideration of Delaware Focus Global Growth Fund investment advisory agreement (continued)
fees. The Board considered fees paid to Delaware Investments for non-management services. The Board’s objective is to limit the Fund’s total expense ratio to be competitive with that of the Expense Group. The following paragraph summarizes the expense results for the Fund and the Board’s view of such expenses.
The expense comparisons for the Fund showed that its contractual management fee was in the quartile with the lowest expenses of its Expense Group and its total expenses were in the quartile with the second lowest expenses of its Expense Group. The Board was satisfied with the management fee and total expenses of the Fund in comparison to those of its Expense Group as shown in the Lipper report.
Management Profitability. The Board considered the level of profits realized by Delaware Investments in connection with the operation of the Fund. In this respect, the Board reviewed the Investment Management Profitability Analysis that addressed the overall profitability of Delaware Investments’ business in providing management and other services to each of the individual funds and the Delaware Investments® Family of Funds as a whole. Specific attention was given to the methodology followed in allocating costs for the purpose of determining profitability. Management stated that the level of profits of Delaware Investments, to a certain extent, reflect recent operational cost savings and efficiencies initiated by Delaware Investments. The Board considered Delaware Investments’ efforts to improve services provided to fund shareholders and to meet additional regulatory and compliance requirements resulting from recent industry-wide Securities and Exchange Commission initiatives. The Board also considered the extent to which Delaware Investments might derive ancillary benefits from fund operations, including the potential for procuring additional business as a result of the prestige and visibility associated with its role as service provider to the Delaware Investments Family of Funds and the benefits from allocation of fund brokerage to improve trading efficiencies. The Board found that the management fees were reasonable in light of the services rendered and the level of profitability of Delaware Investments.
Economies of Scale. The Trustees considered whether economies of scale are realized by Delaware Investments as the Fund’s assets increase and the extent to which any economies of scale are reflected in the level of management fees charged. The Trustees reviewed the standardized advisory fee pricing and structure, approved by the Board and shareholders, which includes breakpoints. Breakpoints in the advisory fee occur when the advisory fee rate is reduced on assets in excess of specified levels. Breakpoints result in a lower advisory fee than would otherwise be the case on all assets when the asset levels specified are exceeded. The Board noted that the fee under the Fund’s management contract fell within the standard structure. Although the Fund has not reached a size at which it can take advantage of breakpoints, the Board recognized that the fee was structured so that when the Fund grows, economies of scale may be shared.
40
Tax Information (Unaudited)
The information set forth below is for the Fund’s fiscal year as required by federal income tax laws. Shareholders, however, must report distributions on a calendar year basis for income tax purposes, which may include distributions for portions of two fiscal years of a fund. Accordingly, the information needed by shareholders for income tax purposes will be sent to them in January of each year. Please consult your tax advisor for proper treatment of this information.
All designations are based on financial information available as of the date of this annual report and, accordingly are subject to change. For any and all items requiring designation, it is the intention of the Fund to designate the maximum amount permitted under the Internal Revenue Code and the regulations thereunder.
For the fiscal year ended November 30, 2012, the Fund designates distributions paid during the year as follows:
| (A) Long-Term Capital Gain Distribution (Tax Basis)* | | 100.00% |
| (B) Qualifying Dividends1 | | 100.00% |
| (A) | is based on a percentage of the Fund’s total distributions. |
| (B) | is based on a percentage of the Fund’s total distributions. |
1Qualifying dividends represent dividends which qualify for the corporate dividends received deduction. |
*For the fiscal year ended November 30, 2012, certain dividends paid by the Fund may be subject to a maximum tax rate of 15%, as provided for by the Jobs and Growth Tax Relief Reconciliation Act of 2003 and as extended by the Tax Relief, Unemployment Insurance Reauthorization and Jobs Creation Act of 2010. The Fund intends to designate up to 100% to be taxed at a maximum rate of 15%. Complete information will be computed and reported in conjunction with your 2012 Form 1099-DIV. |
The Fund intends to pass through foreign tax credits in the maximum amount of $17,496. The gross foreign source income earned during the fiscal year 2012 was $342,615. Complete information will be computed and reported in conjunction with your 2012 Form 1099-DIV.
41
Board of trustees/directors and officers addendum
Delaware Investments® Family of Funds
A mutual fund is governed by a Board of Trustees/Directors (“Trustees”), which has oversight responsibility for the management of a fund’s business affairs. Trustees establish procedures and oversee and review the performance of the investment manager, the distributor, and others who perform services for the fund. The independent fund trustees, in particular, are advocates
| Name, Address, | | Position(s) | | Length of |
| and Birth Date | | Held with Fund(s) | | Time Served |
| Interested Trustees | | | | |
| | | | | |
| Patrick P. Coyne1 | | Chairman, President, | | Chairman and Trustee |
| 2005 Market Street | | Chief Executive Officer, | | since August 16, 2006 |
| Philadelphia, PA 19103 | | and Trustee | | |
| April 1963 | | | | President and |
| | | | Chief Executive Officer |
| | | | since August 1, 2006 |
| | | | | |
| Independent Trustees | | | | |
| | | | | |
| Thomas L. Bennett | | Trustee | | Since March 2005 |
| 2005 Market Street | | | | |
| Philadelphia, PA 19103 | | | | |
| October 1947 | | | | |
| | | | | |
| John A. Fry | | Trustee | | Since January 2001 |
| 2005 Market Street | | | | |
| Philadelphia, PA 19103 | | | | |
| May 1960 | | | | |
| | | | | |
| | | | | |
| | | | | |
| | | | | |
| | | | | |
| | | | | |
| | | | | |
| | | | | |
| | | | | |
| | | | | |
| | | | | |
1 Patrick P. Coyne is considered to be an “Interested Trustee” because he is an executive officer of the Fund’s(s’) investment advisor.
42
for shareholder interests. Each trustee has served in that capacity since he or she was elected to or appointed to the Board of Trustees, and will continue to serve until his or her retirement or the election of a new trustee in his or her place. The following is a list of the Trustees and Officers with certain background and related information.
| | Number of Portfolios in | | |
| Principal Occupation(s) | | Fund Complex Overseen | | Other Directorships |
| During Past 5 Years | | by Trustee or Officer | | Held by Trustee or Officer |
| | | | |
| | | | | |
| Patrick P. Coyne has served in | | 71 | | Director and Audit |
| various executive capacities | | | | Committee Member |
| at different times at | | | | Kaydon Corp. |
| Delaware Investments.2 | | | | |
| | | | Board of Governors Member |
| | | | Investment Company |
| | | | Institute (ICI) |
| | | | |
| | | | | |
| | | | | |
| Private Investor | | 71 | | Director |
| (March 2004–Present) | | | | Bryn Mawr Bank Corp. (BMTC) |
| | | | (2007–2011) |
| | | | |
| President | | 71 | | Board of Governors Member — |
| Drexel University | | | | NASDAQ OMX PHLX LLC |
| (August 2010–Present) | | | | |
| | | | | Director and Audit |
| President | | | | Committee Member |
| Franklin & Marshall College | | | | Community Health Systems |
| (July 2002–July 2010) | | | | |
| | | | Director — Ecore |
| | | | International |
| | | | (2009–2010) |
| | | | |
| | | | Director — Allied |
| | | | Barton Securities Holdings |
| | | | (2005–2008) |
| | | | |
2 Delaware Investments is the marketing name for Delaware Management Holdings, Inc. and its subsidiaries, including the Fund’s(s’) investment advisor, principal underwriter, and its transfer agent.
43
Board of trustees/directors and officers addendum
Delaware Investments® Family of Funds
| Name, Address, | | Position(s) | | Length of |
| and Birth Date | | Held with Fund(s) | | Time Served |
| Independent Trustees (continued) | | | | |
| | | | | |
| Anthony D. Knerr | | Trustee | | Since April 1990 |
| 2005 Market Street | | | | |
| Philadelphia, PA 19103 | | | | |
| December 1938 | | | | |
| | | | | |
| Lucinda S. Landreth | | Trustee | | Since March 2005 |
| 2005 Market Street | | | | |
| Philadelphia, PA 19103 | | | | |
| June 1947 | | | | |
| | | | | |
| Frances A. Sevilla-Sacasa | | Trustee | | Since September 2011 |
| 2005 Market Street | | | | |
| Philadelphia, PA 19103 | | | | |
| January 1956 | | | | |
| | | | | |
| | | | | |
| | | | | |
| | | | | |
| | | | | |
| | | | | |
| | | | | |
| | | | | |
| | | | | |
| | | | | |
| | | | | |
| | | | | |
| | | | | |
| | | | | |
| Janet L. Yeomans | | Trustee | | Since April 1999 |
| 2005 Market Street | | | | |
| Philadelphia, PA 19103 | | | | |
| July 1948 | | | | |
| | | | | |
| | | | | |
| | | | | |
| | | | | |
| | | | | |
| | | | | |
| | | | | |
44
| | Number of Portfolios in | | |
| Principal Occupation(s) | | Fund Complex Overseen | | Other Directorships |
| During Past 5 Years | | by Trustee or Officer | | Held by Trustee or Officer |
| | | | | |
| | | | | |
| Managing Director | | 71 | | None |
| Anthony Knerr & Associates | | | | |
| (Strategic Consulting) | | | | |
| (1990–Present) | | | | |
| | | | | |
| Private Investor | | 71 | | None |
| (2004–Present) | | | | |
| | | | | |
| | | | | |
| | | | | |
| Chief Executive Officer — | | 71 | | Trust Manager — Camden |
| Banco Itaú Europa | | | | Property Trust |
| International | | | | (since August 2011) |
| (since April 2012) | | | | |
| | | | | |
| Executive Advisor to Dean | | | | |
| (August 2011–March 2012) | | | | |
| and Interim Dean | | | | |
| (January 2011–July 2011) — | | | | |
| University of Miami School of | | | | |
| Business Administration | | | | |
| | | | | |
| President — U.S. Trust, | | | | |
| Bank of America Private | | | | |
| Wealth Management | | | | |
| (Private Banking) | | | | |
| (July 2007–December 2008) | | | | |
| | | | | |
| Vice President and Treasurer | | 71 | | Director, Audit |
| (January 2006–July 2012) | | | | Committee Member and |
| Vice President — Mergers & Acquisitions | | | | Investment Committee |
| (January 2003–January 2006), and | | | | Member |
| Vice President and Treasurer | | | | Okabena Company |
| (July 1995–January 2003) | | | | |
| 3M Corporation | | | | Chair — 3M |
| | | | Investment Management |
| | | | Company |
| | | | (January 2005–July 2012) |
| | | | |
45
Board of trustees/directors and officers addendum
Delaware Investments® Family of Funds
| Name, Address, | | Position(s) | | Length of |
| and Birth Date | | Held with Fund(s) | | Time Served |
| Independent Trustees (continued) | | | | |
| | | | | |
| J. Richard Zecher | | Trustee | | Since March 2005 |
| 2005 Market Street | | | | |
| Philadelphia, PA 19103 | | | | |
| July 1940 | | | | |
| | | | | |
| | | | | |
| | | | | |
| | | | | |
| | | | | |
46
| | Number of Portfolios in | | |
| Principal Occupation(s) | | Fund Complex Overseen | | Other Directorships |
| During Past 5 Years | | by Trustee or Officer | | Held by Trustee or Officer |
| | | | |
| | | | | |
| Founder | | 71 | | Director and Compensation |
| Investor Analytics | | | | Committee Member |
| (Risk Management) | | | | Investor Analytics |
| (May 1999–Present) | | | | |
| | | | | Director |
| Founder | | | | Oxigene, Inc. |
| P/E Investments | | | | (2003–2008) |
| (Hedge Fund) | | | | |
| (September 1996–Present) | | | | |
47
Board of trustees/directors and officers addendum
Delaware Investments® Family of Funds
| Name, Address, | | Position(s) | | Length of |
| and Birth Date | | Held with Fund(s) | | Time Served |
| Officers | | | | |
| | | | | |
| David F. Connor | | Vice President, | | Vice President since |
| 2005 Market Street | | Deputy General | | September 2000 |
| Philadelphia, PA 19103 | | Counsel, and Secretary | | and Secretary since |
| December 1963 | | | | October 2005 |
| | | | |
| Daniel V. Geatens | | Vice President | | Treasurer |
| 2005 Market Street | | and Treasurer | | since October 2007 |
| Philadelphia, PA 19103 | | | | |
| October 1972 | | | | |
| | | | | |
| David P. O’Connor | | Executive Vice President, | | Executive Vice President |
| 2005 Market Street | | General Counsel | | since February 2012; |
| Philadelphia, PA 19103 | | and Chief Legal Officer | | Senior Vice President |
| February 1966 | | | | October 2005– |
| | | | February 2012; |
| | | | General Counsel and |
| | | | Chief Legal Officer |
| | | | since October 2005 |
| | | | | |
| Richard Salus | | Senior Vice President | | Chief Financial Officer |
| 2005 Market Street | | and Chief Financial Officer | | since November 2006 |
| Philadelphia, PA 19103 | | | | |
| October 1963 | | | | |
| | | | | |
The Statement of Additional Information for the Fund(s) includes additional information about the Trustees and Officers and is available, without charge, upon request by calling 800 523-1918.
48
| | Number of Portfolios in | | |
| Principal Occupation(s) | | Fund Complex Overseen | | Other Directorships |
| During Past 5 Years | | by Trustee or Officer | | Held by Trustee or Officer |
| | | | | |
| | | | | |
| David F. Connor has served as | | 71 | | None3 |
| Vice President and Deputy | | | | |
| General Counsel of | | | | |
| Delaware Investments | | | | |
| since 2000. | | | | |
| | | | | |
| Daniel V. Geatens has served | | 71 | | None3 |
| in various capacities at | | | | |
| different times at | | | | |
| Delaware Investments. | | | | |
| | | | | |
| David P. O’Connor has served in | | 71 | | None3 |
| various executive and legal | | | | |
| capacities at different times | | | | |
| at Delaware Investments. | | | | |
| | | | | |
| | | | | |
| | | | | |
| | | | | |
| | | | | |
| Richard Salus has served in | | 71 | | None3 |
| various executive capacities | | | | |
| at different times at | | | | |
| Delaware Investments. | | | | |
| | | | | |
3 David F. Connor, Daniel V. Geatens, David P. O’Connor, and Richard Salus serve in similar capacities for the six portfolios of the Optimum Fund Trust, which have the same investment advisor, principal underwriter, and transfer agent as the registrant.
49
About the organization
| Board of trustees | | | |
Patrick P. Coyne
Chairman, President, and
Chief Executive Officer
Delaware Investments®
Family of Funds
Philadelphia, PA
Thomas L. Bennett
Private Investor
Rosemont, PA | John A. Fry
President
Drexel University
Philadelphia, PA
Anthony D. Knerr
Founder and Managing
Director
Anthony Knerr &
Associates
New York, NY | Lucinda S. Landreth
Former Chief Investment
Officer
Assurant, Inc.
Philadelphia, PA
Frances A.
Sevilla-Sacasa
Chief Executive Officer
Banco Itaú Europa
International
Miami, FL | Janet L. Yeomans
Former Vice President and
Treasurer
3M Corporation
St. Paul, MN
J. Richard Zecher
Founder
Investor Analytics
Scottsdale, AZ |
| | | | |
| Affiliated officers | | | |
David F. Connor
Vice President, Deputy
General Counsel, and
Secretary
Delaware Investments
Family of Funds
Philadelphia, PA | Daniel V. Geatens
Vice President and
Treasurer
Delaware Investments
Family of Funds
Philadelphia, PA | David P. O’Connor
Executive Vice President,
General Counsel,
and Chief Legal Officer
Delaware Investments
Family of Funds
Philadelphia, PA | Richard Salus
Senior Vice President and
Chief Financial Officer
Delaware Investments
Family of Funds
Philadelphia, PA |
This annual report is for the information of Delaware Focus Global Growth Fund shareholders, but it may be used with prospective investors when preceded or accompanied by the Delaware Investments Fund fact sheet for the most recently completed calendar quarter. These documents are available at delawareinvestments.com. |
Delaware Investments is the marketing name of Delaware Management Holdings, Inc. and its subsidiaries. |
The Fund files its complete schedule of portfolio holdings with the Securities and Exchange Commission (SEC) for the first and third quarters of each fiscal year on Form N-Q. The Fund’s Forms N-Q, as well as a description of the policies and procedures that the Fund uses to determine how to vote proxies (if any) relating to portfolio securities are available without charge (i) upon request, by calling 800 523-1918; and (ii) on the SEC’s website at sec.gov. In addition, a description of the policies and procedures that the Fund uses to determine how to vote proxies (if any) relating to portfolio securities and the Fund’s Schedule of Investments are available without charge on the Fund’s website at delawareinvestments.com. The Fund’s Forms N-Q may be reviewed and copied at the SEC’s Public Reference Room in Washington, D.C.; information on the operation of the Public Reference Room may be obtained by calling 800 SEC-0330.
Information (if any) regarding how the Fund voted proxies relating to portfolio securities during the most recently disclosed 12-month period ended June 30 is available without charge (i) through the Fund’s website at delawareinvestments.com; and (ii) on the SEC’s website at sec.gov.
50
Annual report Delaware Macquarie Global Infrastructure Fund
November 30, 2012 Alternative / specialty mutual fund |
Carefully consider the Fund’s investment objectives, risk factors, charges, and expenses before investing. This and other information can be found in the Fund’s prospectus and, if available, its summary prospectus, which may be obtained by visiting delawareinvestments.com or calling 800 523-1918. Investors should read the prospectus and, if available, the summary prospectus carefully before investing. |
You can obtain shareholder reports and prospectuses online instead of in the mail.
Visit delawareinvestments.com/edelivery. |
Experience Delaware Investments
Delaware Investments is committed to the pursuit of consistently superior asset management and unparalleled client service. We believe in our investment processes, which seek to deliver consistent results, and in convenient services that help add value for our clients.
If you are interested in learning more about creating an investment plan, contact your financial advisor.
You can learn more about Delaware Investments or obtain a prospectus for Delaware Macquarie Global Infrastructure Fund at delawareinvestments.com.
Manage your investments online
- 24-hour access to your account information
- Obtain share prices
- Check your account balance and recent transactions
- Request statements or literature
- Make purchases and redemptions
Delaware Management Holdings, Inc. and its subsidiaries (collectively known by the marketing name of Delaware Investments) are wholly owned subsidiaries of Macquarie Group Limited, a global provider of banking, financial, advisory, investment and funds management services.
Investments in Delaware Macquarie Global Infrastructure Fund are not and will not be deposits with or liabilities of Macquarie Bank Limited ABN 46 008 583 542 and its holding companies, including their subsidiaries or related companies (Macquarie Group), and are subject to investment risk, including possible delays in repayment and loss of income and capital invested. No Macquarie Group company guarantees or will guarantee the performance of the Fund, the repayment of capital from the Fund, or any particular rate of return.
| Table of contents | |
| Portfolio management review | 1 |
| Performance summary | 4 |
| Disclosure of Fund expenses | 8 |
| Security type/country and sector allocations | 10 |
| Statement of net assets | 11 |
| Statement of operations | 16 |
| Statements of changes in net assets | 18 |
| Financial highlights | 20 |
| Notes to financial statements | 28 |
| Report of independent registered | |
| public accounting firm | 39 |
| Other Fund information | 40 |
| Board of trustees/directors and | |
| officers addendum | 46 |
| About the organization | 54 |
Unless otherwise noted, views expressed herein are current as of Nov. 30, 2012, and subject to change.
Funds are not FDIC insured and are not guaranteed. It is possible to lose the principal amount invested.
Mutual fund advisory services provided by Delaware Management Company, a series of Delaware Management Business Trust, which is a registered investment advisor. Delaware Investments, a member of Macquarie Group, refers to Delaware Management Holdings, Inc. and its subsidiaries, including the Fund’s distributor, Delaware Distributors, L.P. Macquarie Group refers to Macquarie Group Limited and its subsidiaries and affiliates worldwide.
© 2013 Delaware Management Holdings, Inc.
All third-party marks cited are the property of their respective owners.
| Portfolio management review |
| Delaware Macquarie Global Infrastructure Fund | | December 11, 2012 |
| Performance preview (for the year ended November 30, 2012) |
| Delaware Macquarie Global Infrastructure Fund (Class A shares) | | 1-year return | | +11.52 | % |
| S&P Global Infrastructure Index (benchmark) | | 1-year return | | +9.80 | % |
Past performance does not guarantee future results.
For complete, annualized performance for Delaware Macquarie Global Infrastructure Fund, please see the table on page 4. The performance of Class A shares excludes the applicable sales charge and reflects the reinvestment of all distributions. Index performance returns do not reflect any management fees, transaction costs, or expenses. Indices are unmanaged and one cannot invest directly in an index.
As the Fund’s fiscal year got under way in December 2011, global securities markets were weathering unusually high levels of uncertainty. The European sovereign debt crisis continued casting a shadow across the global investment landscape, and economic indicators were generally soft across significant geographic regions around the world. All major asset classes were feeling some degree of pressure, leaving investors with few traditional opportunities for growth or yield.
During the first few months of 2012, the European crisis maintained a strong presence, with little relief until the second half of the year, when the European Central Bank expressed a long-term commitment to support the euro zone through aggressive policy action. By this point, U.S. officials had also stated their commitment to long-term policy efforts, aiming to stimulate financial markets and support economic growth. Notably, central bankers on both sides of the Atlantic did not put a definite termination date on their respective monetary initiatives; by voting for such open-ended programs, they contributed to the positive sentiment that supported equity markets through the end of October 2012.
Support began to wane in November 2012, however, as security markets felt the collective weight of circumstances that included (1) possible ramifications of a presidential election in the United States, (2) uncertainty about the U.S. “fiscal cliff” and deficit, and (3) continued economic frailty in the euro zone, with little sign of credible relief on the horizon.
Throughout the shifts in market sentiment during the Fund’s fiscal year, global infrastructure assets (as measured by major indices that include the S&P Global Infrastructure Index) generally followed the same performance trajectories as traditional equity asset classes, though not always to the same degree. For the year as a whole, infrastructure equities posted a positive rate of return, though they trailed the strong advances posted by broader equity markets.
Fund performance
For the fiscal year ended Nov. 30, 2012, Delaware Macquarie Global Infrastructure Fund (Class A shares) returned +11.52% at net asset value and +5.07% at maximum offer price (both returns assume reinvestment of all distributions). The Fund’s benchmark, the S&P Global Infrastructure Index, advanced by 9.80% for the same period. For the Fund’s complete annualized performance information, please see the table on page 4.
When comparing the Fund’s overall results against the benchmark, the positive effects of the Fund’s weights within
1
Portfolio management review
Delaware Macquarie Global Infrastructure Fund
specific infrastructure sectors, as well as the generally positive effects of security selection across sectors, help to explain the Fund’s outperformance. The electric utilities sector offers a good example: the Fund benefited from being underweight in this relatively weak sector, and its holdings outperformed benchmark constituents.
At the individual security level, the Fund benefited from not holding Japan-based Kansai Electric Power, an index constituent that underperformed sharply as it faced a number of headwinds. The Fund’s overweight to the Australian firm Spark Infrastructure Group also made a positive contribution, as the company benefited from a number of catalysts including the internalization of its management and its attractive yield.
The Fund benefited from opportunistic and highly selective investments in other electrical utility companies such as Spain-based Iberdrola, which generates and distributes electricity in Europe and North America. The Fund’s position in Iberdrola generated a return of more than 19%, despite the notable headwind of a complicated political environment in the euro zone. As the Fund’s fiscal year drew to a close, Iberdrola faced a number of headwinds including weak demand and prices (and the Fund had an underweight allocation versus the index).
Corrections Corporation of America advanced by more than 60%. Its shares began the fiscal year in a mild soft patch, but investor sentiment changed shortly thereafter, as budget officials in California reaffirmed their intent to spend on projects that the company was involved in. Investors also generally responded positively to (1) news that the company would initiate a quarterly dividend, and (2) expectations that the company may restructure itself as a potentially more tax-efficient (and higher yielding) real estate investment trust.
The positive results noted above were somewhat offset by negative results in sectors that included marine ports and services. Germany-based Hamburger Hafen und Logistik was among the prominent detractors from the Fund’s relative performance. Near the midpoint of the Fund’s fiscal year, the company reported slightly weaker-than-expected earnings while simultaneously downgrading its financial outlook. Despite a few periods of subtle price support that followed, the stock trended downward as the Fund’s fiscal year came to a close. Singapore-based Hutchison Port Holdings Trust likewise had a negative effect on the Fund’s performance relative to its benchmark index, owing to the Fund’s comparatively light allocation to the stock (amounting to less than 50% of the stock’s weight within the benchmark index). In absolute terms, Hutchison’s shares posted an outsized return for the fiscal year, thereby amplifying the negative effects of the Fund’s underweight. The same circumstances applied to the Fund’s holdings in Netherlands-based Koninklijke Vopak: the shares posted a healthy return for the fiscal year, but the Fund’s allocation was 30% smaller than the stock’s weight within the benchmark index.
A continued focus on quality holdings, disciplined research
We believe that markets are providing compelling opportunities for potential new additions to the Fund’s portfolio.
As always, we remain faithful to our long-held investment process, which is steadfast despite the inevitable swings in securities
2
prices. As has been our long-standing practice, we continue emphasizing bottom-up, company-by-company research as we seek to identify fundamental long-term value within the infrastructure asset class. We focus on designing a portfolio of holdings that we believe may provide investors with a competitive, risk-aware allocation to infrastructure assets.
3
| Performance summary | |
| Delaware Macquarie Global Infrastructure Fund | November 30, 2012 |
The performance data quoted represent past performance; past performance does not guarantee future results. Investment return and principal value will fluctuate so your shares, when redeemed, may be worth more or less than their original cost. Please obtain the performance data current for the most recent month end by calling 800 523-1918 or visiting our website at delawareinvestments.com/performance. Current performance may be lower or higher than the performance data quoted.
| Fund performance1,2 | Average annual total returns through November 30, 2012 |
| | | | Lifetime |
| | | | (if less than |
| | 1 year | | 10 years) |
| Class A (Est. Jan. 19, 2010) | | | | | | |
| Excluding sales charge | | +11.52% | | | +5.56% | |
| Including sales charge | | +5.07% | | | +3.41% | |
| Class C (Est. Jan. 19, 2010) | | | | | | |
| Excluding sales charge | | +10.75% | | | +4.77% | |
| Including sales charge | | +9.75% | | | +4.77% | |
| Class R (Est. Jan. 19, 2010) | | | | | | |
| Excluding sales charge | | +11.24% | | | +5.27% | |
| Including sales charge | | +11.24% | | | +5.27% | |
| Institutional Class (Est. Dec. 31, 2009) | | | | | | |
| Excluding sales charge | | +11.91% | | | +6.68% | |
| Including sales charge | | +11.91% | | | +6.68% | |
1 Returns reflect the reinvestment of all distributions and are presented both with and without the applicable sales charges described below. Returns do not reflect the deduction of taxes the shareholder would pay on Fund distributions or redemptions of Fund shares.
Expense limitations were in effect for certain classes during some or all of the periods shown in the “Fund performance” chart. The current expenses for each class are listed on the “Fund expense ratios” table on page 5. Performance would have been lower had expense limitations not been in effect.
Class A shares are sold with a maximum front-end sales charge of 5.75%, and have an annual distribution and service fee of 0.30% of average daily net assets. This fee has been contractually limited to 0.25% of average daily net assets from March 29, 2012 through March 29, 2013. Performance for Class A shares, excluding sales charges, assumes that no front-end sales charge applied.
Class C shares are sold with a contingent deferred sales charge of 1.00% if redeemed during the first 12 months. They are also subject to an annual distribution and service fee of 1.00% of average daily net assets.
Performance for Class C shares, excluding sales charges, assumes either that contingent deferred sales charges did not apply or that the investment was not redeemed.
Class R shares are available only for certain retirement plan products. They are sold without a sales charge and have an annual
4
distribution and service fee of 0.60% of average daily net assets, which has been limited contractually to 0.50% from March 29, 2012 through March 29, 2013.
Institutional Class shares are available without sales or asset-based distribution charges only to certain eligible institutional accounts.
The “Fund performance” table and the “Performance of a $10,000 investment” graph do not reflect the deduction of taxes the shareholder would pay on Fund distributions or redemptions of Fund shares.
Narrowly focused investments may exhibit higher volatility than investments in multiple industry sectors. Because the Fund concentrates its investments in securities issued by companies principally engaged in the infrastructure industry, the Fund has greater exposure to the potential adverse economic, regulatory, political, and other changes affecting such entities.
International investments entail risks not ordinarily associated with U.S. investments including fluctuation in currency values, differences in accounting principles, or economic or political instability in other nations.
Investing in emerging markets can be riskier than investing in established foreign markets due to increased volatility and lower trading volume.
“Nondiversified” Funds may allocate more of their net assets to investments in single securities than “diversified” Funds. Resulting adverse effects may subject these Funds to greater risks and volatility.
2 The Fund’s expense ratios, as described in the most recent prospectus, are disclosed in the following “Fund expense ratios” table. Delaware Investments has agreed to reimburse certain expenses and/or waive certain fees in order to prevent total fund operating expenses (excluding certain fees and expenses) from exceeding 1.20% of the Fund’s average daily net assets from March 29, 2012 through March 29, 2013. Please see the most recent prospectus and any applicable supplement(s) for additional information on these fee waivers and/or reimbursements.
| Fund expense ratios | | Class A | | Class C | | Class R | | Institutional Class |
| Total annual operating expenses | | 2.53% | | 3.23% | | 2.83% | | 2.23% |
| (without fee waivers) | | | | | | | | |
| Net expenses | | 1.45% | | 2.20% | | 1.70% | | 1.20% |
| (including fee waivers, if any) | | | | | | | | |
| Type of waiver | | Contractual | | Contractual | | Contractual | | Contractual |
5
Performance summary
Delaware Macquarie Global Infrastructure Fund
Performance of a $10,000 investment1
Average annual total returns from Jan. 19, 2010 (Fund’s inception) through Nov. 30, 2012
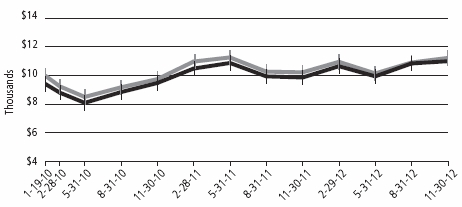
| For period beginning Jan. 19, 2010, through Nov. 30, 2012 | Starting value | Ending value |
| | S&P Global Infrastructure Index (gross) | $10,000 | $11,234 |
| | Delaware Macquarie Global Infrastructure Fund —
Class A shares | $9,425 | $11,005 |
1The “Performance of a $10,000 investment” graph assumes $10,000 invested in Class A shares of the Fund on Jan. 19, 2010, and includes the effect of a 5.75% front-end sales charge and the reinvestment of all distributions. The graph does not reflect the deduction of taxes the shareholders would pay on Fund distributions or redemptions of Fund shares. Expense limitations were in effect for some or all of the periods shown. Performance would have been lower had expense limitations not been in effect. Current expenses are listed in the “Fund expense ratios” table on page 5. Please note additional details on pages 4 through 6.
The chart also assumes $10,000 invested in the S&P Global Infrastructure Index as of Jan. 19, 2010. The S&P Global Infrastructure Index is composed of 75 of the largest publicly listed companies in the global infrastructure industry. The index has balanced weights across three distinct infrastructure clusters: transportation, utilities, and energy.
Index performance returns do not reflect any management fees, transaction costs, or expenses. Indices are unmanaged and one cannot invest directly in an index. Past performance is not a guarantee of future results.
Performance of other Fund classes will vary due to different charges and expenses.
| | Nasdaq symbols | | CUSIPs | |
| Class A | | | DMGAX | | | 245914551 | |
| Class C | | | DMGCX | | | 245914544 | |
| Class R | | | DMGRX | | | 245914528 | |
| Institutional Class | | | DMGIX | | | 245914536 | |
6
Disclosure of Fund expenses
For the six-month period from June 1, 2012 to November 30, 2012 (Unaudited)
As a shareholder of the Fund, you incur two types of costs: (1) transaction costs, including sales charges (loads) on purchase payments, reinvested dividends, or other distributions; redemption fees; and exchange fees; and (2) ongoing costs, including management fees; distribution and/or service (12b-1) fees; and other Fund expenses. This example is intended to help you understand your ongoing costs (in dollars) of investing in the Fund and to compare these costs with the ongoing costs of investing in other mutual funds.
The example is based on an investment of $1,000 invested at the beginning of the period and held for the entire six-month period from June 1, 2012 to November 30, 2012.
Actual expenses
The first section of the table shown, “Actual Fund return,” provides information about actual account values and actual expenses. You may use the information in this section of the table, together with the amount you invested, to estimate the expenses that you paid over the period. Simply divide your account value by $1,000 (for example, an $8,600 account value divided by $1,000 = 8.6), then multiply the result by the number in the first section under the heading entitled “Expenses Paid During Period” to estimate the expenses you paid on your account during this period.
Hypothetical example for comparison purposes
The second section of the table shown, “Hypothetical 5% return,” provides information about hypothetical account values and hypothetical expenses based on the Fund’s actual expense ratio and an assumed rate of return of 5% per year before expenses, which is not the Fund’s actual return. The hypothetical account values and expenses may not be used to estimate the actual ending account balance or expenses you paid for the period. You may use this information to compare the ongoing costs of investing in the Fund and other funds. To do so, compare this 5% hypothetical example with the 5% hypothetical examples that appear in the shareholder reports of the other funds.
Please note that the expenses shown in the table are meant to highlight your ongoing costs only and do not reflect any transactional costs, such as sales charges (loads), redemption fees, or exchange fees. Therefore, the second section of the table is useful in comparing ongoing costs only, and will not help you determine the relative total costs of owning different funds. In addition, if these transactional costs were included, your costs would have been higher. The Fund’s expenses shown in the table(s) reflect fee waivers in effect. The expenses shown in the table assume reinvestment of all dividends and distributions.
8
Delaware Macquarie Global Infrastructure Fund
Expense analysis of an investment of $1,000
| | Beginning | | Ending | | | | | | | Expenses |
| | Account Value | | Account Value | | Annualized | | Paid During Period |
| | | 6/1/12 | | 11/30/12 | | Expense Ratio | | 6/1/12 to 11/30/12* |
| Actual Fund return† | | | | | | | | | | | | | | | | | | |
| Class A | | $ | 1,000.00 | | | $ | 1,106.00 | | | | 1.45 | % | | | | $ | 7.63 | |
| Class C | | | 1,000.00 | | | | 1,101.10 | | | | 2.20 | % | | | | | 11.56 | |
| Class R | | | 1,000.00 | | | | 1,104.00 | | | | 1.70 | % | | | | | 8.94 | |
| Institutional Class | | | 1,000.00 | | | | 1,106.80 | | | | 1.20 | % | | | | | 6.32 | |
| Hypothetical 5% return (5% return before expenses) | | | | | | | | | | | |
| Class A | | $ | 1,000.00 | | | $ | 1,017.75 | | | | 1.45 | % | | | | $ | 7.31 | |
| Class C | | | 1,000.00 | | | | 1,014.00 | | | | 2.20 | % | | | | | 11.08 | |
| Class R | | | 1,000.00 | | | | 1,016.50 | | | | 1.70 | % | | | | | 8.57 | |
| Institutional Class | | | 1,000.00 | | | | 1,019.00 | | | | 1.20 | % | | | | | 6.06 | |
*“Expenses Paid During Period” are equal to the Fund’s annualized expense ratio, multiplied by the average account value over the period, multiplied by 183/366 (to reflect the one-half year period).
†Because actual returns reflect only the most recent six-month period, the returns shown may differ significantly from fiscal year returns.
9
| Security type/country and sector allocations | |
| Delaware Macquarie Global Infrastructure Fund | As of November 30, 2012 (Unaudited) |
Sector designations may be different than the sector designations presented in other Fund materials. The sector designations may represent the investment manager’s internal sector classifications, which may result in the sector designations for one fund being different than another fund’s sector designations.
| Security type/country | Percentage of net assets |
| Common Stock | 94.29 | % |
| Australia | 11.09 | % |
| Brazil | 2.82 | % |
| Canada | 7.95 | % |
| Chile | 0.33 | % |
| China | 8.33 | % |
| France | 9.10 | % |
| Germany | 5.40 | % |
| Italy | 3.24 | % |
| Japan | 4.02 | % |
| Mexico | 0.43 | % |
| Netherlands | 1.95 | % |
| Singapore | 1.12 | % |
| Spain | 4.36 | % |
| Switzerland | 1.60 | % |
| United Kingdom | 8.14 | % |
| United States | 24.41 | % |
| U.S. Master Limited Partnerships | 2.53 | % |
| Short-Term Investments | 2.51 | % |
| Total Value of Securities | 99.33 | % |
| Receivables and Other Assets Net of Liabilities | 0.67 | % |
| Total Net Assets | 100.00 | % |
| |
| Common stock and limited partnerships by sector² | Percentage of net assets |
| Consumer Discretionary | 0.74 | % |
| Energy | 17.76 | % |
| Industrials | 44.15 | % |
| Telecommunication Services | 0.41 | % |
| Utilities | 33.76 | % |
| Total | 96.82 | % |
| ² | Narrow industries are utilized for compliance purposes for diversification whereas broad sectors are used for financial reporting. |
10
| Statement of net assets | |
| Delaware Macquarie Global Infrastructure Fund | November 30, 2012 |
| | | Number of shares | Value (U.S. $) |
| ΔCommon Stock – 94.29% | | | | |
| Australia – 11.09% | | | | |
| Asciano | 152,214 | | $ | 691,066 |
| Australian Infrastructure Fund | 132,288 | | | 434,917 |
| Sydney Airport | 99,632 | | | 369,150 |
| Transurban Group | 395,951 | | | 2,566,308 |
| | | | | 4,061,441 |
| Brazil – 2.82% | | | | |
| Energias do Brasil | 74,400 | | | 422,137 |
| † | LLX Logistica | 224,000 | | | 226,506 |
| Transmissora Alianca de Energia Eletrica | 12,300 | | | 385,797 |
| | | | | 1,034,440 |
| Canada – 7.95% | | | | |
| Enbridge | 38,019 | | | 1,539,361 |
| TransCanada | 29,655 | | | 1,372,665 |
| | | | | 2,912,026 |
| Chile – 0.33% | | | | |
| Enersis ADR | 7,100 | | | 120,345 |
| | | | | 120,345 |
| ¨China – 8.33% | | | | |
| Beijing Enterprises Holdings | 137,000 | | | 882,964 |
| China Merchants Holdings International | 216,587 | | | 656,731 |
| COSCO Pacific | 266,835 | | | 376,658 |
| Dalian Port PDA | 1,526,000 | | | 336,696 |
| Jiangsu Expressway | 622,300 | | | 556,442 |
| Zhejiang Expressway | 316,000 | | | 240,969 |
| | | | | 3,050,460 |
| France – 9.10% | | | | |
| Aeroports de Paris | 6,561 | | | 506,257 |
| Eutelsat Communications | 8,807 | | | 272,432 |
| GDF Suez | 39,349 | | | 885,078 |
| Groupe Eurotunnel | 145,604 | | | 1,098,129 |
| Vinci | 12,965 | | | 572,031 |
| | | | | 3,333,927 |
| Germany – 5.40% | | | | |
| E.ON | 39,710 | | | 715,281 |
| Fraport Frankfurt Airport Services Worldwide | 16,707 | | | 926,603 |
| Hamburger Hafen und Logistik | 14,980 | | | 338,017 |
| | | | | 1,979,901 |
11
Statement of net assets
Delaware Macquarie Global Infrastructure Fund
| | | Number of shares | Value (U.S. $) |
| ΔCommon Stock (continued) | | | | |
| Italy – 3.24% | | | | |
| Atlantia | 63,774 | | $ | 1,089,019 |
| SIAS | 11,358 | | | 97,788 |
| | | | | 1,186,807 |
| Japan – 4.02% | | | | |
| Japan Airport Terminal | 14,139 | | | 159,359 |
| Kamigumi | 33,000 | | | 255,032 |
| Osaka Gas | 86,000 | | | 338,053 |
| Tokyo Gas | 76,000 | | | 373,430 |
| West Japan Railway | 8,693 | | | 347,509 |
| | | | | 1,473,383 |
| Mexico – 0.43% | | | | |
| † | OHL Mexico | 86,731 | | | 157,467 |
| | | | | 157,467 |
| Netherlands – 1.95% | | | | |
| Koninklijke Vopak | 9,645 | | | 712,614 |
| | | | | 712,614 |
| Singapore – 1.12% | | | | |
| Hutchison Port Holdings Trust | 528,000 | | | 409,200 |
| | | | | 409,200 |
| Spain – 4.36% | | | | |
| Abertis Infraestructuras | 80,575 | | | 1,177,336 |
| Iberdrola | 57,775 | | | 287,032 |
| Red Electrica | 2,853 | | | 132,204 |
| | | | | 1,596,572 |
| Switzerland – 1.60% | | | | |
| Flughafen Zuerich | 1,329 | | | 587,273 |
| | | | | 587,273 |
| United Kingdom – 8.14% | | | | |
| Centrica | 136,631 | | | 713,384 |
| National Grid | 85,163 | | | 961,900 |
| Severn Trent | 21,690 | | | 561,205 |
| SSE | 25,447 | | | 580,953 |
| United Utilities Group | 15,228 | | | 166,264 |
| | | | | 2,983,706 |
12
| | | Number of shares | Value (U.S. $) |
| ΔCommon Stock (continued) | | | | |
| United States – 24.41% | | | | |
| American Electric Power | 4,567 | | $ | 194,783 |
| American Water Works | 11,925 | | | 455,177 |
| Corrections Corporation of America | 11,879 | | | 402,698 |
| † | Crown Castle International | 2,200 | | | 148,544 |
| Dominion Resources | 11,430 | | | 584,187 |
| Duke Energy | 19,033 | | | 1,214,686 |
| Exelon | 23,500 | | | 710,170 |
| ITC Holdings | 2,687 | | | 211,064 |
| Kinder Morgan | 19,773 | | | 668,525 |
| NextEra Energy | 6,030 | | | 414,321 |
| NiSource | 7,100 | | | 171,607 |
| PG&E | 17,860 | | | 731,367 |
| Southern | 23,800 | | | 1,036,490 |
| Spectra Energy | 36,940 | | | 1,032,473 |
| Williams | 29,400 | | | 965,496 |
| | | | | 8,941,588 |
| Total Common Stock (cost $33,918,347) | | | | 34,541,150 |
| |
| U.S. Master Limited Partnerships – 2.53% | | | | |
| El Paso Pipeline Partners | 5,995 | | | 223,793 |
| Enbridge Energy Partners | 4,500 | | | 130,590 |
| Enterprise Products Partners | 7,065 | | | 366,179 |
| Magellan Midstream Partners | 2,550 | | | 113,424 |
| Williams Partners | 1,810 | | | 92,147 |
| Total U.S. Master Limited Partnerships (cost $874,954) | | | | 926,133 |
| |
| | Principal | | | |
| | amount (U.S. $) | | | |
| Short-Term Investments – 2.51% | | | | |
| Repurchase Agreements – 2.51% | | | | |
| Bank of America 0.19%, dated 11/30/12, to be repurchased | | | |
| on 12/3/12, repurchase price $330,065 (collateralized | | | | |
| by U.S. government obligations 0.00%-0.25% | | | | |
| 1/3/13-11/30/14; market value $336,661) | $330,060 | | | 330,060 |
13
Statement of net assets
Delaware Macquarie Global Infrastructure Fund
| Principal | | | | |
| amount (U.S. $) | | Value (U.S. $) | |
| Short-Term Investments (continued) | | | | | |
| Repurchase Agreements (continued) | | | | | |
| BNP Paribas 0.20%, dated 11/30/12, to be repurchased on | | | | | |
| 12/3/12, repurchase price $590,950 (collateralized by U.S. | | | | | |
| government obligations 0.25%-2.50% 3/31/14-11/30/17; | | | | | |
| market value $603,208) | $590,940 | | $ | 590,940 | |
| Total Short-Term Investments (cost $921,000) | | | | 921,000 | |
| |
| Total Value of Securities – 99.33% (cost $35,714,301) | | | | 36,388,283 | |
| Receivables and Other Assets | | | | | |
| Net of Liabilities – 0.67% | | | | 245,472 | « |
| Net Assets Applicable to 3,862,332 | | | | | |
| Shares Outstanding – 100.00% | | | $ | 36,633,755 | |
| |
| Net Asset Value – Delaware Macquarie Global Infrastructure Fund | | | | |
| Class A ($3,403,710 / 358,850 Shares) | | | | | $9.49 | |
| Net Asset Value – Delaware Macquarie Global Infrastructure Fund | | | | |
| Class C ($773,849 / 81,665 Shares) | | | | | $9.48 | |
| Net Asset Value – Delaware Macquarie Global Infrastructure Fund | | | | |
| Class R ($5,817 / 613.6 Shares) | | | | | $9.48 | |
| Net Asset Value – Delaware Macquarie Global Infrastructure Fund | | | | |
| Institutional Class ($32,450,379 / 3,421,203 Shares) | | | | | $9.49 | |
| |
| Components of Net Assets at November 30, 2012: | | | | | |
| Shares of beneficial interest (unlimited authorization – no par) | | | $ | 35,458,635 | |
| Undistributed net investment income | | | | 194,219 | |
| Accumulated net realized gain on investments and derivatives | | | | 308,236 | |
| Net unrealized appreciation of investments and derivatives | | | | 672,665 | |
| Total net assets | | | $ | 36,633,755 | |
| Δ | Securities have been classified by country of origin. Classification by type of business has been presented on page 10 in “Security type/country and sector allocations.” |
| † | Non income producing security. |
| o | Securities listed and traded on the Hong Kong Stock Exchange. |
| « | Includes foreign currency valued at $(5,130) with a cost of $(5,168). |
14
| | | |
| Net Asset Value and Offering Price Per Share – | | |
| Delaware Macquarie Global Infrastructure Fund | | |
| Net asset value Class A (A) | $ | 9.49 |
| Sales charge (5.75% of offering price) (B) | | 0.58 |
| Offering price | $ | 10.07 |
| (A) | Net asset value per share, as illustrated, is the amount which would be paid upon redemption or repurchase of shares. |
| (B) | See the current prospectus for purchases of $50,000 or more. |
The following foreign currency exchange contracts were outstanding at November 30, 2012:1
Foreign Currency Exchange Contracts
| | | | | | | | | | | | | | Unrealized |
| | | | | | | | | | | | | | Appreciation |
| Counterparty | | Contracts to Receive (Deliver) | | In Exchange For | | Settlement Date | | (Depreciation) |
| MNB | | | CAD | 150,652 | | | | USD | (152,041 | ) | | 12/3/12 | | | $(390 | ) |
| MNB | | | EUR | (2,288 | ) | | | USD | 2,973 | | | 12/3/12 | | | (2 | ) |
| MNB | | | MXN | (35,355 | ) | | | USD | 2,728 | | | 12/3/12 | | | (5 | ) |
| | | | | | | | | | | | | | | $(397 | ) |
The use of foreign currency exchange contracts involves elements of market risk and risks in excess of the amounts recognized in the financial statements. The foreign currency exchange contracts presented above represent the Fund’s total exposure in such contracts, whereas only the net unrealized appreciation (depreciation) is reflected in the Fund’s net assets.
1See Note 8 in “Notes to financial statements.”
Summary of abbreviations:
ADR — American Depositary Receipt
CAD — Canadian Dollar
EUR — European Monetary Unit
MNB — Mellon National Bank
MXN — Mexican Peso
USD — United States Dollar
See accompanying notes, which are an integral part of the financial statements.
15
| Statement of operations | |
| Delaware Macquarie Global Infrastructure Fund | Year Ended November 30, 2012 |
| Investment Income: | | | | | | | |
| Dividends | $ | 1,268,623 | | | | | |
| Interest | | 2,795 | | | | | |
| Foreign tax withheld | | (82,571 | ) | | $ | 1,188,847 | |
| |
| Expenses: | | | | | | | |
| Management fees | | 284,033 | | | | | |
| Registration fees | | 57,033 | | | | | |
| Dividend disbursing and transfer agent fees and expenses | | 47,989 | | | | | |
| Custodian fees | | 27,453 | | | | | |
| Reports and statements to shareholders | | 21,535 | | | | | |
| Audit and tax | | 14,814 | | | | | |
| Distribution expenses – Class A | | 6,233 | | | | | |
| Distribution expenses – Class C | | 6,613 | | | | | |
| Distribution expenses – Class R | | 33 | | | | | |
| Accounting and administration expenses | | 12,323 | | | | | |
| Dues and services | | 8,554 | | | | | |
| Pricing fees | | 3,460 | | | | | |
| Legal fees | | 2,282 | | | | | |
| Trustees’ fees | | 1,424 | | | | | |
| Insurance fees | | 361 | | | | | |
| Consulting fees | | 307 | | | | | |
| Trustees’ expenses | | 81 | | | | 494,528 | |
| Less fees waived | | | | | | (103,553 | ) |
| Less waived distribution expenses – Class A | | | | | | (1,039 | ) |
| Less waived distribution expenses – Class R | | | | | | (5 | ) |
| Less expense paid indirectly | | | | | | (65 | ) |
| Total operating expenses | | | | | | 389,866 | |
| Net Investment Income | | | | | | 798,981 | |
16
| Net Realized and Unrealized Gain (Loss): | | | |
| Net realized gain (loss) on: | | | |
| Investments | $ | 424,081 | |
| Foreign currencies | | 96,376 | |
| Foreign currency exchange contracts | | (64,410 | ) |
| Net realized gain | | 456,047 | |
| Net change in unrealized appreciation (depreciation) of: | | | |
| Investments | | 1,812,168 | |
| Foreign currencies | | (895 | ) |
| Foreign currency exchange contracts | | 82 | |
| Net change in unrealized appreciation (depreciation) | | 1,811,355 | |
| Net Realized and Unrealized Gain | | 2,267,402 | |
| |
| Net Increase in Net Assets Resulting from Operations | $ | 3,066,383 | |
See accompanying notes, which are an integral part of the financial statements.
17
Statements of changes in net assets
Delaware Macquarie Global Infrastructure Fund
| Year Ended |
| 11/30/12 | | 11/30/11 |
| Increase (Decrease) in Net Assets from Operations: | | | | | | | |
| Net investment income | $ | 798,981 | | | $ | 341,168 | |
| Net realized gain | | 456,047 | | | | 99,108 | |
| Net change in unrealized appreciation (depreciation) | | 1,811,355 | | | | (1,203,230 | ) |
| Net increase (decrease) in net assets resulting from operations | | 3,066,383 | | | | (762,954 | ) |
| |
| Dividends and Distributions to Shareholders from: | | | | | | | |
| Net investment income: | | | | | | | |
| Class A | | (43,147 | ) | | | (20,230 | ) |
| Class C | | (8,410 | ) | | | (3,307 | ) |
| Class R | | (100 | ) | | | (85 | ) |
| Institutional Class | | (645,464 | ) | | | (197,000 | ) |
| |
| Net realized gain on investments: | | | | | | | |
| Class A | | (16,155 | ) | | | (4,796 | ) |
| Class C | | (6,274 | ) | | | (806 | ) |
| Class R | | (65 | ) | | | (35 | ) |
| Institutional Class | | (232,714 | ) | | | (14,568 | ) |
| | | (952,329 | ) | | | (240,827 | ) |
| |
| Capital Share Transactions: | | | | | | | |
| Proceeds from shares sold: | | | | | | | |
| Class A | | 2,398,182 | | | | 950,921 | |
| Class C | | 366,040 | | | | 430,926 | |
| Class R | | — | | | | 4 | |
| Institutional Class | | 23,337,850 | | | | 18,990,254 | |
| |
| Net asset value of shares issued upon reinvestment | | | | | | | |
| of dividends and distributions: | | | | | | | |
| Class A | | 54,212 | | | | 24,679 | |
| Class C | | 13,575 | | | | 4,073 | |
| Class R | | 164 | | | | 120 | |
| Institutional Class | | 872,544 | | | | 210,391 | |
| | 27,042,567 | | | | 20,611,368 | |
18
| Year Ended |
| 11/30/12 | | 11/30/11 |
| Capital Share Transactions (continued): | | | | | | | |
| Cost of shares redeemed: | | | | | | | |
| Class A | $ | (481,592 | ) | | $ | (305,655 | ) |
| Class C | | (158,424 | ) | | | (21,208 | ) |
| Institutional Class | | (12,005,946 | ) | | | (2,014,537 | ) |
| | | (12,645,962 | ) | | | (2,341,400 | ) |
| Increase in net assets derived from capital share transactions | | 14,396,605 | | | | 18,269,968 | |
| Net Increase in Net Assets | | 16,510,659 | | | | 17,266,187 | |
| |
| Net Assets: | | | | | | | |
| Beginning of year | | 20,123,096 | | | | 2,856,909 | |
| End of year (including undistributed net investment | | | | | | | |
| income of $194,219 and $60,651,respectively) | $ | 36,633,755 | | | $ | 20,123,096 | |
See accompanying notes, which are an integral part of the financial statements.
19
Financial highlights
Delaware Macquarie Global Infrastructure Fund Class A
Selected data for each share of the Fund outstanding throughout each period were as follows:
| Net asset value, beginning of period |
| |
| Income (loss) from investment operations: |
| Net investment income2 |
| Net realized and unrealized gain (loss) |
| Total from investment operations |
| |
| Less dividends and distributions from: |
| Net investment income |
| Net realized gain |
| Total dividends and distributions |
| |
| Net asset value, end of period |
| |
| Total return3 |
| |
| Ratios and supplemental data: |
| Net assets, end of period (000 omitted) |
| Ratio of expenses to average net assets |
| Ratio of expenses to average net assets |
| prior to fees waived |
| Ratio of net investment income to average net assets |
| Ratio of net investment income (loss) to average net assets |
| prior to fees waived |
| Portfolio turnover |
| 1 Date of commencement of operations; ratios have been annualized and total return has not been annualized. |
| 2 The average shares outstanding method has been applied for per share information. |
| 3 Total investment return is based on the change in net asset value of a share during the period and assumes reinvestment of dividends and distributions at net asset value and does not reflect the impact of a sales charge. Total investment return during all of the periods shown reflect waivers by the manager and distributor. Performance would have been lower had the waivers not been in effect. |
See accompanying notes, which are an integral part of the financial statements.
20
| | | | | | | | | 1/19/101 | |
| | Year Ended | | | to | |
| | 11/30/12 | | 11/30/11 | | | 11/30/10 | |
| | $8.790 | | | $8.670 | | | | $8.730 | | |
| | |
| | |
| | 0.215 | | | 0.245 | | | | 0.155 | | |
| | 0.783 | | | 0.102 | | | | (0.111 | ) | |
| | 0.998 | | | 0.347 | | | | 0.044 | | |
| | |
| | |
| | (0.189 | ) | | (0.166 | ) | | | (0.104 | ) | |
| | (0.109 | ) | | (0.061 | ) | | | — | | |
| | (0.298 | ) | | (0.227 | ) | | | (0.104 | ) | |
| | |
| | $9.490 | | | $8.790 | | | | $8.670 | | |
| | |
| | 11.52% | | | 4.05% | | | | 0.63% | | |
| | |
| | |
| | $3,404 | | | $1,298 | | | | $667 | | |
| | 1.45% | | | 1.45% | | | | 1.45% | | |
| | | |
| | 1.83% | | | 2.53% | | | | 12.24% | | |
| | 2.32% | | | 2.70% | | | | 2.15% | | |
| | |
| | 1.94% | | | 1.62% | | | | (8.64% | ) | |
| | 65% | | | 33% | | | | 87% | 4 | |
4 Portfolio turnover is representative of the Fund for the period December 31, 2009 through November 30, 2010. |
21
Financial highlights
Delaware Macquarie Global Infrastructure Fund Class C
Selected data for each share of the Fund outstanding throughout each period were as follows:
| Net asset value, beginning of period |
| |
| Income (loss) from investment operations: |
| Net investment income2 |
| Net realized and unrealized gain (loss) |
| Total from investment operations |
| |
| Less dividends and distributions from: |
| Net investment income |
| Net realized gain |
| Total dividends and distributions |
| |
| Net asset value, end of period |
| |
| Total return3 |
| |
| Ratios and supplemental data: |
| Net assets, end of period (000 omitted) |
| Ratio of expenses to average net assets |
| Ratio of expenses to average net assets |
| prior to fees waived |
| Ratio of net investment income to average net assets |
| Ratio of net investment income (loss) to average net assets |
| prior to fees waived |
| Portfolio turnover |
1 Date of commencement of operations; ratios have been annualized and total return has not been annualized. |
2 The average shares outstanding method has been applied for per share information. |
3 Total investment return is based on the change in net asset value of a share during the period and assumes reinvestment of dividends and distributions at net asset value and does not reflect the impact of a sales charge. Total investment return during all of the periods shown reflect a waiver by the manager. Performance would have been lower had the waiver not been in effect. |
See accompanying notes, which are an integral part of the financial statements.
22
| | | | | | | | | 1/19/101 | |
| | Year Ended | | | to | |
| | 11/30/12 | | 11/30/11 | | | 11/30/10 | |
| | | $8.780 | | | $8.660 | | | | $8.730 | | |
| | |
| | |
| | 0.145 | | | 0.177 | | | | 0.102 | | |
| | 0.779 | | | 0.102 | | | | (0.106 | ) | |
| | 0.924 | | | 0.279 | | | | (0.004 | ) | |
| | |
| | |
| | (0.115 | ) | | (0.098 | ) | | | (0.066 | ) | |
| | (0.109 | ) | | (0.061 | ) | | | — | | |
| | (0.224 | ) | | (0.159 | ) | | | (0.066 | ) | |
| | |
| | $9.480 | | | $8.780 | | | | $8.660 | | |
| | |
| | 10.75% | | | 3.15% | | | | 0.04% | | |
| | |
| | |
| | $774 | | | $503 | | | | $114 | | |
| | 2.20% | | | 2.20% | | | | 2.20% | | |
| | |
| | 2.53% | | | 3.23% | | | | 12.94% | | |
| | 1.57% | | | 1.95% | | | | 1.40% | | |
| | |
| | 1.24% | | | 0.92% | | | | (9.34% | ) | |
| | 65% | | | 33% | | | | 87% | 4 | |
4 Portfolio turnover is representative of the Fund for the period December 31, 2009 through November 30, 2010. |
23
Financial highlights
Delaware Macquarie Global Infrastructure Fund Class R
Selected data for each share of the Fund outstanding throughout each period were as follows:
| Net asset value, beginning of period |
| |
| Income (loss) from investment operations: |
| Net investment income2 |
| Net realized and unrealized gain (loss) |
| Total from investment operations |
| |
| Less dividends and distributions from: |
| Net investment income |
| Net realized gain |
| Total dividends and distributions |
| |
| Net asset value, end of period |
| |
| Total return3 |
| |
| Ratios and supplemental data: |
| Net assets, end of period (000 omitted) |
| Ratio of expenses to average net assets |
| Ratio of expenses to average net assets |
| prior to fees waived |
| Ratio of net investment income to average net assets |
| Ratio of net investment income (loss) to average net assets |
| prior to fees waived |
| Portfolio turnover |
1 Date of commencement of operations; ratios have been annualized and total return has not been annualized. |
2 The average shares outstanding method has been applied for per share information. |
3 Total investment return is based on the change in net asset value of a share during the period and assumes reinvestment of dividends and distributions at net asset value. Total investment return during all of the periods shown reflect waivers by the manager and distributor. Performance would have been lower had the waivers not been in effect. |
See accompanying notes, which are an integral part of the financial statements.
24
| | | | | | | | | 1/19/101 | |
| | Year Ended | | | to | |
| | 11/30/12 | | 11/30/11 | | | | 11/30/10 | |
| | $8.790 | | | $8.670 | | | | $8.730 | | |
| | |
| | |
| | 0.190 | | | 0.223 | | | | 0.137 | | |
| | 0.774 | | | 0.103 | | | | (0.108 | ) | |
| | 0.964 | | | 0.326 | | | | 0.029 | | |
| | |
| | |
| | (0.165 | ) | | (0.145 | ) | | | (0.089 | ) | |
| | (0.109 | ) | | (0.061 | ) | | | — | | |
| | (0.274 | ) | | (0.206 | ) | | | (0.089 | ) | |
| | |
| | $9.480 | | | $8.790 | | | | $8.670 | | |
| | |
| | 11.24% | | | 3.69% | | | | 0.45% | | |
| | |
| | |
| | | $6 | | | $5 | | | | $5 | | |
| | | 1.70% | | | 1.70% | | | | 1.70% | | |
| | | |
| | | 2.13% | | | 2.83% | | | | 12.54% | | |
| | | 2.07% | | | 2.45% | | | | 1.90% | | |
| | | |
| | | 1.64% | | | 1.32% | | | | (8.94% | ) | |
| | | 65% | | | 33% | | | | 87% | 4 | |
4 Portfolio turnover is representative of the Fund for the period December 31, 2009 through November 30, 2010. |
25
Financial highlights
Delaware Macquarie Global Infrastructure Fund Institutional Class
Selected data for each share of the Fund outstanding throughout each period were as follows:
| Net asset value, beginning of period |
| |
| Income from investment operations: |
| Net investment income2 |
| Net realized and unrealized gain |
| Total from investment operations |
| |
| Less dividends and distributions from: |
| Net investment income |
| Net realized gain |
| Total dividends and distributions |
| |
| Net asset value, end of period |
| |
| Total return3 |
| |
| Ratios and supplemental data: |
| Net assets, end of period (000 omitted) |
| Ratio of expenses to average net assets |
| Ratio of expenses to average net assets |
| prior to fees waived |
| Ratio of net investment income to average net assets |
| Ratio of net investment income (loss) to average net assets |
| prior to fees waived |
| Portfolio turnover |
1 Date of commencement of operations; ratios have been annualized and total return has not been annualized. |
2 The average shares outstanding method has been applied for per share information. |
3 Total investment return is based on the change in net asset value of a share during the period and assumes reinvestment of dividends and distributions at net asset value. Total investment return during all of the periods shown reflect a waiver by the manager. Performance would have been lower had the waiver not been in effect. |
See accompanying notes, which are an integral part of the financial statements.
26
| | | | | | | | | 12/31/091 | |
| | Year Ended | | | to | |
| | 11/30/12 | | 11/30/11 | | | 11/30/10 | |
| | | $8.790 | | | $8.670 | | | | $8.500 | | |
| | | |
| | | |
| | 0.237 | | | 0.266 | | | | 0.170 | | |
| | 0.782 | | | 0.106 | | | | 0.118 | | |
| | 1.019 | | | 0.372 | | | | 0.288 | | |
| | | |
| | | |
| | (0.210 | ) | | (0.191 | ) | | | (0.118 | ) | |
| | (0.109 | ) | | (0.061 | ) | | | — | | |
| | (0.319 | ) | | (0.252 | ) | | | (0.118 | ) | |
| | | |
| | $9.490 | | | $8.790 | | | | $8.670 | | |
| | | |
| | 11.91% | | | 4.22% | | | | 3.53% | | |
| | | |
| | | |
| | $32,450 | | | $18,317 | | | | $2,071 | | |
| | 1.20% | | | 1.20% | | | | 1.20% | | |
| | | |
| | 1.53% | | | 2.23% | | | | 11.66% | | |
| | 2.57% | | | 2.95% | | | | 2.23% | | |
| | | |
| | 2.24% | | | 1.92% | | | | (8.23% | ) | |
| | 65% | | | 33% | | | | 87% | | |
27
Notes to financial statements
Delaware Macquarie Global Infrastructure Fund | November 30, 2012 |
Delaware Group® Global & International Funds (Trust) is organized as a Delaware statutory trust and offers five series: Delaware International Value Equity Fund, Delaware Emerging Markets Fund, Delaware Global Value Fund, Delaware Focus Global Growth Fund, and Delaware Macquarie Global Infrastructure Fund. These financial statements and the related notes pertain to Delaware Macquarie Global Infrastructure Fund (Fund). The Trust is an open-end investment company. The Fund is considered non-diversified under the Investment Company Act of 1940, as amended, and offers Class A, Class C, Class R, and Institutional Class shares. Class A shares are sold with a maximum front-end sales charge of 5.75%. Class A share purchases of $1,000,000 or more will incur a contingent deferred sales charge (CDSC) of 1% if redeemed during the first year and 0.50% during the second year, provided that Delaware Distributors, L.P. (DDLP) paid a financial advisor a commission on the purchase of those shares. Class C shares are sold with a CDSC of 1%, if redeemed during the first twelve months. Class R and Institutional Class shares are not subject to a sales charge and are offered for sale exclusively to certain eligible investors.
The investment objective of the Fund is to seek long-term capital appreciation and current income.
1. Significant Accounting Policies
The following accounting policies are in accordance with U.S. generally accepted accounting principles (U.S. GAAP) and are consistently followed by the Fund.
Security Valuation — Equity securities, except those traded on the Nasdaq Stock Market, Inc. (Nasdaq), are valued at the last quoted sales price as of the time of the regular close of the New York Stock Exchange (NYSE) on the valuation date. Securities traded on the Nasdaq are valued in accordance with the Nasdaq Official Closing Price, which may not be the last sales price. If on a particular day an equity security does not trade, then the mean between the bid and ask prices will be used, which approximates fair value. Securities listed on a foreign exchange are normally valued at the last quoted sales price on the valuation date. Foreign currency exchange contracts are valued at the mean between the bid and ask prices, which approximates fair value. Interpolated values are derived when the settlement date of the contract is an interim date for which quotations are not available. Generally, other securities and assets for which market quotations are not readily available are valued at fair value as determined in good faith under the direction of the Fund’s Board of Trustees (Board). In determining whether market quotations are readily available or fair valuation will be used, various factors will be taken into consideration, such as market closures or suspension of trading in a security. The Fund may use fair value pricing more frequently for securities traded primarily in non-U.S. markets because, among other things, most foreign markets close well before the Fund values its securities, generally as of 4:00 p.m. Eastern time. The earlier close of these foreign markets gives rise to the possibility that significant events, including broad market moves, government actions or pronouncements, aftermarket trading, or news events may have occurred in the interim. To account for this, the Fund may frequently value foreign securities using fair value prices based on third-party vendor modeling tools (international fair value pricing).
28
Federal & Foreign Income Taxes — No provision for federal income taxes has been made as the Fund intends to continue to qualify for federal income tax purposes as a regulated investment company under Subchapter M of the Internal Revenue Code of 1986, as amended, and make the requisite distributions to shareholders. The Fund evaluates tax positions taken or expected to be taken in the course of preparing the Fund’s tax returns to determine whether the tax positions are “more-likely-than-not” of being sustained by the applicable tax authority. Tax positions not deemed to meet the “more-likely-than-not” threshold are recorded as a tax benefit or expense in the current year. Management has analyzed the Fund’s tax positions taken on federal income tax returns for all open federal income tax years (November 30, 2009 – November 30, 2012), and has concluded that no provision for federal income tax is required in the Fund’s financial statements. In regards to foreign taxes, the Fund only has open tax years in certain foreign countries it invests in back to the inception of the Fund.
Class Accounting — Investment income, common expenses and realized and unrealized gain (loss) on investments are allocated to the various classes of the Fund on the basis of daily net assets of each class. Distribution expenses relating to a specific class are charged directly to that class.
Repurchase Agreements — The Fund may purchase certain U.S. government securities subject to the counterparty’s agreement to repurchase them at an agreed upon date and price. The counterparty will be required on a daily basis to maintain the value of the collateral subject to the agreement at not less than the repurchase price (including accrued interest). The agreements are conditioned upon the collateral being deposited under the Federal Reserve book-entry system with the Fund’s custodian or a third-party sub-custodian. In the event of default or bankruptcy by the other party to the agreement, retention of the collateral may be subject to legal proceedings. All open repurchase agreements as of the date of this report were entered into on November 30, 2012.
Foreign Currency Transactions — Transactions denominated in foreign currencies are recorded at the prevailing exchange rates on the valuation date in accordance with the Fund’s prospectus. The value of all assets and liabilities denominated in foreign currencies is translated into U.S. dollars at the exchange rate of such currencies against the U.S. dollar daily. Transaction gains or losses resulting from changes in exchange rates during the reporting period or upon settlement of the foreign currency transaction are reported in operations for the current period. The Fund generally does not isolate that portion of realized gains and losses on investments which is due to changes in foreign exchange rates from that which is due to changes in market prices. The Fund reports certain foreign currency related transactions as components of realized gains (losses) for financial reporting purposes, whereas such components are treated as ordinary income (loss) for federal income tax purposes.
Use of Estimates — The preparation of financial statements in conformity with U.S. GAAP requires management to make estimates and assumptions that affect the fair value of investments, the reported amounts of assets and liabilities and disclosure of contingent assets and liabilities at the date of the financial statements and the reported amounts of revenues and expenses during the reporting period. Actual results could differ from those estimates and the differences could be material.
29
Notes to financial statements
Delaware Macquarie Global Infrastructure Fund
1. Significant Accounting Policies (continued)
Other — Expenses directly attributable to the Fund are charged directly to the Fund. Other expenses common to various funds within the Delaware Investments® Family of Funds are generally allocated amongst such funds on the basis of average net assets. Management fees and some other expenses are paid monthly. Security transactions are recorded on the date the securities are purchased or sold (trade date) for financial reporting purposes. Costs used in calculating realized gains and losses on the sale of investment securities are those of the specific securities sold. Dividend income is recorded on the ex-dividend date and interest income is recorded on the accrual basis. Foreign dividends are also recorded on the ex-dividend date or as soon after the ex-dividend date that the Fund is aware of such dividends, net of all non-rebatable tax withholdings. Withholding taxes on foreign dividends have been recorded in accordance with the Fund’s understanding of the applicable country’s tax rules and rates. The Fund declares and pays dividends from net investment income quarterly and distributions from net realized gain on investments, if any, annually. The Fund may distribute income dividends and capital gains more frequently, if necessary for tax purposes. Dividends and distributions, if any, are recorded on the ex-dividend date.
The Fund may receive earnings credits from its custodian when positive cash balances are maintained, which are used to offset custody fees. There were no earnings credits for the year ended November 30, 2012.
The Fund receives earnings credits from its transfer agent when positive cash balances are maintained, which are used to offset transfer agent fees. The expense paid under this arrangement is included in dividend disbursing and transfer agent fees and expenses on the statement of operations with the corresponding expense offset shown as “expense paid indirectly.” For the year ended November 30, 2012, the Fund earned $65 under this agreement.
2. Investment Management, Administration Agreements and Other Transactions with Affiliates
In accordance with the terms of its investment management agreement, the Fund pays Delaware Management Company (DMC), a series of Delaware Management Business Trust and the investment manager, an annual fee which is calculated daily at the rate of 0.90% on the first $500 million of average daily net assets of the Fund, 0.85% on the next $500 million, 0.80% on the next $1.5 billion and 0.75% on average daily net assets in excess of $2.5 billion.
DMC, on behalf of the Fund, has entered into an investment sub-advisory agreement with Macquarie Capital Investment Management LLC (MCIM), which is an affiliate of DMC. Both DMC and MCIM are wholly owned subsidiaries of Macquarie Group Limited. For its sub-advisory services, MCIM receives an asset-based fee from DMC. Such sub-advisory fee is paid by DMC, and not from the assets of the Fund.
30
DMC has contractually agreed to waive that portion, if any, of its management fee and reimburse the Fund to the extent necessary to ensure that total annual operating expenses (excluding any 12b-1 plan expenses and certain other expenses) do not exceed 1.20% of average daily net assets of the Fund through March 29, 2013. For purposes of this waiver and reimbursement, nonroutine expenses may also include such additional costs and expenses as may be agreed upon from time to time by the Fund’s Board and DMC. This expense waiver and reimbursement applies only to expenses paid directly by the Fund.
Delaware Service Company, Inc. (DSC), an affiliate of DMC, provides fund accounting and financial administration oversight services to the Fund. For these services, the Fund pays DSC fees based on the aggregate daily net assets of the Delaware Investments® Family of Funds at the following annual rate: 0.0050% of the first $30 billion; 0.0045% of the next $10 billion; 0.0040% of the next $10 billion; and 0.0025% of aggregate average daily net assets in excess of $50 billion. The fees payable to DSC under the service agreement described above are allocated among all Funds in the Delaware Investments® Family of Funds on a relative net asset value basis. For the year ended November 30, 2012, the Fund was charged $1,545 for these services.
DSC is also the transfer agent and dividend disbursing agent of the Fund. The Fund pays DSC a monthly asset-based fee for these services. Pursuant to a sub-transfer agency agreement between DSC and BNY Mellon Investment Servicing (US) Inc. (BNYMIS), BNYMIS provides certain sub-transfer agency services to the Fund. Sub-transfer agency fees are passed on to and paid directly by the Fund.
Pursuant to a distribution agreement and distribution plan, the Fund pays DDLP, the distributor and an affiliate of DMC, an annual distribution and service fee of 0.30% of the average daily net assets of the Class A shares, 1.00% of the average daily net assets of the Class C shares and 0.60% of the average daily net assets of Class R shares. Institutional Class shares pay no distribution and service expenses. DDLP has contracted to waive distribution and service fees through March 29, 2013 to prevent distribution and service fees of Class A and Class R shares from exceeding 0.25% and 0.50%, respectively, of average daily net assets.
At November 30, 2012, the Fund had liabilities payable to affiliates as follows:
| Investment management fee payable to DMC | $ | 20,340 |
| Dividend disbursing, transfer agent and fund accounting | | |
| oversight fees and other expenses payable to DSC | | 803 |
| Distribution fees payable to DDLP | | 1,239 |
| Other expenses payable to DMC and affiliates* | | 4,029 |
*DMC, as part of its administrative services, pays operating expenses on behalf of the Fund and is reimbursed on a periodic basis. Expenses include items such as printing of shareholder reports, fees for audit, legal and tax services, registration fees and trustees’ fees.
31
Notes to financial statements
Delaware Macquarie Global Infrastructure Fund
2. Investment Management, Administration Agreements and Other Transactions with Affiliates (continued)
As provided in the investment management agreement, the Fund bears the cost of certain legal and tax services, including internal legal and tax services provided to the Fund by DMC and/or its affiliates’ employees. For the year ended November 30, 2012, the Fund was charged $827 for internal legal and tax services provided by DMC and/or its affiliates’ employees.
For the year ended November 30, 2012, DDLP earned $5,605 for commissions on sales of the Fund’s Class A shares.
Trustees’ fees include expenses accrued by the Fund for each Trustee’s retainer and meeting fees. Certain officers of DMC, DSC and DDLP are officers and/or Trustees of the Trust. These officers and Trustees are paid no compensation by the Fund.
3. Investments
For the year ended November 30, 2012, the Fund made purchases of $ 33,097,307 and sales of $ 19,464,964 investment securities other than short-term investments.
At November 30, 2012, the cost of investments for federal income tax purposes was $36,298,322. At November 30, 2012, net unrealized appreciation was $89,961, of which $2,212,693 related to unrealized appreciation of investments and $2,122,732 related to unrealized depreciation of investments.
U.S. GAAP defines fair value as the price that the Fund would receive to sell an asset or pay to transfer a liability in an orderly transaction between market participants at the measurement date under current market conditions. A three level hierarchy for fair value measurements has been established based upon the transparency of inputs to the valuation of an asset or liability. Inputs may be observable or unobservable and refer broadly to the assumptions that market participants would use in pricing the asset or liability. Observable inputs reflect the assumptions market participants would use in pricing the asset or liability based on market data obtained from sources independent of the reporting entity. Unobservable inputs reflect the reporting entity’s own assumptions about the assumptions that market participants would use in pricing the asset or liability developed based on the best information available under the circumstances. The Fund’s investment in its entirety is assigned a level based upon the observability of the inputs which are significant to the overall valuation. The three level hierarchy of inputs is summarized below.
| Level 1 – | inputs are quoted prices in active markets for identical investments (e.g., equity securities, open-end investment companies, futures contracts, exchange-traded options contracts) |
32
| Level 2 – | other observable inputs (including, but not limited to: quoted prices for similar assets or liabilities in markets that are active, quoted prices for identical or similar assets or liabilities in markets that are not active, inputs other than quoted prices that are observable for the assets or liabilities (such as interest rates, yield curves, volatilities, prepayment speeds, loss severities, credit risks and default rates) or other market-corroborated inputs) (e.g., debt securities, government securities, swap contracts, foreign currency exchange contracts, foreign securities utilizing international fair value pricing, broker-quoted securities, fair valued securities) |
| |
| Level 3 – | inputs are significant unobservable inputs (including the Fund’s own assumptions used to determine the fair value of investments) (e.g., broker-quoted securities, fair valued securities) |
Level 3 investments are valued using significant unobservable inputs. The Fund may also use an income-based valuation approach in which the anticipated future cash flows of the investment are discounted to calculate fair value. Discounts may also be applied due to the nature or duration of any restrictions on the disposition of the investments. Valuations may also be based upon current market prices of securities that are comparable in coupon, rating, maturity and industry. The derived value of a Level 3 investment may not represent the value which is received upon disposition and this could impact the results of operations.
The following table summarizes the valuation of the Fund’s investments by fair value hierarchy levels as of November 30, 2012:
| | Level 1 | | Level 2 | | Total |
| Common Stock | | $ | 34,541,150 | | $ | — | | | $ | 34,541,150 | |
| U.S. Master Limited Partnerships | | | 926,133 | | | — | | | | 926,133 | |
| Short-Term Investments | | | — | | | 921,000 | | | | 921,000 | |
| Total | | $ | 35,467,283 | | $ | 921,000 | | | $ | 36,388,283 | |
| |
| Foreign Currency Exchange Contracts | | $ | — | | $ | (397 | ) | | $ | (397 | ) |
During the year ended November 30, 2012, there were no transfers between Level 1 investments, Level 2 investments or Level 3 that had a significant impact to the Fund. This does not include transfers between Level 1 investments and Level 2 investments due to the Fund utilizing international fair value pricing during the year. International fair value pricing uses other observable market-based inputs in place of the closing exchange price due to the events occurring after the close of the exchange or market on which the investment is principally traded in accordance with the fair valuation procedures described in Note 1, causing a change in classification between levels. The Fund’s policy is to recognize transfers between levels at the beginning of the reporting period.
33
Notes to financial statements
Delaware Macquarie Global Infrastructure Fund
4. Dividend and Distribution Information
Income and long-term capital gain distributions are determined in accordance with federal income tax regulations, which may differ from U.S. GAAP. Additionally, distributions from net gains on foreign currency transactions and net short-term gains on sales of investment securities are treated as ordinary income for federal income tax purposes. The tax character of dividends and distributions paid during the year ended November 30, 2012 and the year ended November 30, 2011 was as follows:
| | Year | | Year |
| | Ended | | Ended |
| | | 11/30/12 | | 11/30/11 |
| Ordinary income | | $ | 802,482 | | $ | 240,827 |
| Long-term capital gain | | | 149,847 | | | — |
| Total | | $ | 952,329 | | $ | 240,827 |
5. Components of Net Assets on a Tax Basis
As of November 30, 2012, the components of net assets on a tax basis were as follows:
| Shares of beneficial interest | | $ | 35,458,635 |
| Undistributed ordinary income | | | 959,619 |
| Undistributed long-term capital gain | | | 126,857 |
| Unrealized appreciation | | | 88,644 |
| Net assets | | $ | 36,633,755 |
The differences between book basis and tax basis components of net assets are primarily attributable to tax deferral of losses on wash sales and tax treatment of partnership income.
For financial reporting purposes, capital accounts are adjusted to reflect the tax character of permanent book/tax differences. Reclassifications are primarily due to tax treatment of gain (loss) on foreign currency transaction and partnership income. Results of operations and net assets were not affected by these reclassifications. For the year ended November 30, 2012, the Fund recorded the following reclassifications:
| Undistributed net investment income | | $ | 31,708 | |
| Accumulated net realized gain | | | (31,708 | ) |
34
6. Capital Shares
Transactions in capital shares were as follows:
| | Year Ended |
| | 11/30/12 | | 11/30/11 |
| Shares sold: | | | | | | |
| Class A | | 257,581 | | | 101,879 | |
| Class C | | 39,736 | | | 45,925 | |
| Institutional Class | | 2,541,855 | | | 2,050,346 | |
| |
| Shares issued upon reinvestment of dividends and distributions: | | | | | | |
| Class A | | 6,112 | | | 2,697 | |
| Class C | | 1,541 | | | 439 | |
| Class R | | 19 | | | 13 | |
| Institutional Class | | 98,342 | | | 23,049 | |
| | 2,945,186 | | | 2,224,348 | |
| |
| Shares redeemed: | | | | | | |
| Class A | | (52,430 | ) | | (33,906 | ) |
| Class C | | (16,883 | ) | | (2,265 | ) |
| Institutional Class | | (1,302,057 | ) | | (229,153 | ) |
| | | (1,371,370 | ) | | (265,324 | ) |
| Net increase | | 1,573,816 | | | 1,959,024 | |
7. Line of Credit
The Fund, along with certain other funds in the Delaware Investments® Family of Funds (Participants), was a participant in a $125,000,000 revolving line of credit to be used for temporary or emergency purposes as an additional source of liquidity to fund redemptions of investor shares. Under the agreement, the Participants were charged an annual commitment fee, which was allocated across the Participants on the basis of each Participant’s allocation of the entire facility. The Participants were permitted to borrow up to a maximum of one third of their net assets under the agreement. Each Participant was individually, and not jointly, liable for its particular advances, if any, under the line of credit. The line of credit under the agreement expired on November 13, 2012.
On November 13, 2012, the Fund, along with the other Participants, entered into an amendment to the agreement for a $125,000,000 revolving line of credit. The agreement is to be used as described above and operates in substantially the same manner as the original agreement. The line of credit available under the agreement expires on November 12, 2013. The Fund had no amounts outstanding as of November 30, 2012 or at any time during the year then ended.
35
Notes to financial statements
Delaware Macquarie Global Infrastructure Fund
8. Derivatives
U.S. GAAP requires disclosures that enable investors to understand: 1) how and why an entity uses derivatives; 2) how they are accounted for; and 3) how they affect an entity’s results of operations and financial position.
Foreign Currency Exchange Contracts — The Fund enters into foreign currency exchange contracts as a way of managing foreign exchange rate risk. The Fund may enter into these contracts to fix the U.S. dollar value of a security that it has agreed to buy or sell for the period between the date the trade was entered into and the date the security is delivered and paid for. The Fund may also use these contracts to hedge the U.S. dollar value of securities it already owns that are denominated in foreign currencies. The change in value is recorded as an unrealized gain or loss. When the contract is closed, a realized gain or loss is recorded equal to the difference between the value of the contract at the time it was opened and the value at the time it was closed.
The use of foreign currency exchange contracts does not eliminate fluctuations in the underlying prices of the securities, but does establish a rate of exchange that can be achieved in the future. Although foreign currency exchange contracts limit the risk of loss due to an unfavorable change in the value of the hedged currency, they also limit any potential gain that might result should the value of the currency change favorably. In addition, the Fund could be exposed to risks if the counterparties to the contracts are unable to meet the terms of their contracts. The Fund’s maximum risk of loss from counterparty credit risk is the value of its currency exchanged with the counterparty. The risk is generally mitigated by having a netting arrangement between the Fund and the counterparty and by the posting of collateral by the counterparty to the Fund to cover the Fund’s exposure to the counterparty.
Derivatives Generally. The table below summarizes the average daily balance of derivative holdings by the Fund during the year ended November 30, 2012.
| | Long | | Short |
| | Derivative | | Derivative |
| | Volume | | Volume |
| Foreign currency exchange contracts (average cost) | | $66,532 | | $29,553 |
9. Securities Lending
The Fund, along with other funds in the Delaware Investments® Family of Funds, may lend its securities pursuant to a security lending agreement (Lending Agreement) with The Bank of New York Mellon (BNY Mellon). At the time a security is loaned, the borrower must post collateral equal to the required percentage of the market value of the loaned security, including any accrued interest. The required percentage is: (i) 102% with respect to U.S. securities and foreign securities that are denominated and payable in U.S. dollars; and (ii) 105% with respect to foreign securities. With respect to each loan, if on any business day the aggregate market value of securities collateral plus cash collateral held is less than the aggregate market value of the securities which are the subject of such loan, the borrower will be notified to provide additional collateral by the end of the
36
following business day which, together with the collateral already held, will be not less than the applicable initial collateral requirements for such security loan. If the aggregate market value of securities collateral and cash collateral held with respect to a security loan exceeds the applicable initial collateral requirement, upon the request of the borrower BNY Mellon must return enough collateral to the borrower by the end of the following business day to reduce the value of the remaining collateral to the applicable initial collateral requirement for such security loan. As a result of the foregoing, the value of the collateral held with respect to a loaned security may be temporarily more or less than the value of the security on loan.
Cash collateral received is generally invested in the Delaware Investments Collateral Fund No. 1 (Collective Trust) established by BNY Mellon for the purpose of investment on behalf of funds managed by DMC that participate in BNY Mellon’s securities lending program. The Collective Trust may invest in U.S. government securities and high quality corporate debt, asset-backed and other money market securities and in repurchase agreements collateralized by such securities, provided that the Collective Trust will generally have a dollar-weighted average portfolio maturity of 60 days or less. The Fund can also accept U.S. government securities and letters of credit (noncash collateral) in connection with securities loans. In the event of default or bankruptcy by the lending agent, realization and/or retention of the collateral may be subject to legal proceedings. In the event the borrower fails to return loaned securities and the collateral received is insufficient to cover the value of the loaned securities and provided such collateral shortfall is not the result of investment losses, the lending agent has agreed to pay the amount of the shortfall to the Fund, or at the discretion of the lending agent, replace the loaned securities. The Fund continues to record dividends or interest, as applicable, on the securities loaned and is subject to changes in value of the securities loaned that may occur during the term of the loan. The Fund has the right under the Lending Agreement to recover the securities from the borrower on demand. With respect to security loans collateralized by non-cash collateral, the Fund receives loan premiums paid by the borrower. With respect to security loans collateralized by cash collateral, the earnings from the collateral investments are shared among the Fund, the security lending agent and the borrower. The Fund records security lending income net of allocations to the security lending agent and the borrower.
The Collective Trust used for the investment of cash collateral received from borrowers of securities seeks to maintain a net asset value per unit of $1.00, but there can be no assurance that it will always be able to do so. The Fund may incur investment losses as a result of investing securities lending collateral in the Collective Trust. This could occur if an investment in the Collective Trust defaulted or if it were necessary to liquidate assets in the Collective Trust to meet returns on outstanding security loans at a time when the Collective Trust net asset value per unit was less than $1.00. Under those circumstances, the Fund may not receive an amount from the Collective Trust that is equal in amount to the collateral the Fund would be required to return to the borrower of the securities and the Fund would be required to make up for this shortfall.
The Fund had no securities out on loan as of November 30, 2012.
37
Notes to financial statements
Delaware Macquarie Global Infrastructure Fund
10. Credit and Market Risk
Some countries in which the Fund may invest require governmental approval for the repatriation of investment income, capital or the proceeds of sales of securities by foreign investors. In addition, if there is deterioration in a country’s balance of payments or for other reasons, a country may impose temporary restrictions on foreign capital remittances abroad.
The securities exchanges of certain foreign markets are substantially smaller, less liquid and more volatile than the major securities markets in the United States. Consequently, acquisition and disposition of securities by the Fund may be inhibited. In addition, a significant portion of the aggregate market value of equity securities listed on the major securities exchanges in emerging markets is held by a smaller number of investors. This may limit the number of shares available for acquisition or disposition by the Fund.
Because the Fund concentrates its investments in securities issued by companies principally engaged in the infrastructure industry, the Fund has greater exposure to the potential adverse economic, regulatory, political, and other changes affecting such entities.
The Fund may invest up to 15% of its net assets in illiquid securities, which may include securities with contractual restrictions on resale, securities exempt from registration under Rule 144A of the Securities Act of 1933, as amended, and other securities which may not be readily marketable. The relative illiquidity of these securities may impair the Fund from disposing of them in a timely manner and at a fair price when it is necessary or desirable to do so. While maintaining oversight, the Fund’s Board has delegated to DMC, the day-to-day functions of determining whether individual securities are liquid for purposes of the Fund’s limitation on investments in illiquid securities. Securities eligible for resale pursuant to Rule 144A, which are determined to be liquid, are not subject to the Fund’s 15% limit on investments in illiquid securities. As of November 30, 2012, there were no Rule 144A securities and no securities have been determined to be illiquid under the Fund’s liquidity Procedures.
11. Contractual Obligations
The Fund enters into contracts in the normal course of business that contain a variety of indemnifications. The Fund’s maximum exposure under these arrangements is unknown. However, the Fund has not had prior claims or losses pursuant to these contracts. Management has reviewed the Fund’s existing contracts and expects the risk of loss to be remote.
12. Subsequent Events
Management has determined that no material events or transactions occurred subsequent to November 30, 2012 that would require recognition or disclosure in the Fund’s financial statements.
38
Report of independent
registered public accounting firm
To the Board of Trustees of Delaware Group® Global & International Funds
and the Shareholders of Delaware Macquarie Global Infrastructure Fund:
In our opinion, the accompanying statement of net assets and related statements of operations and of changes in net assets and the financial highlights present fairly, in all material respects, the financial position of Delaware Macquarie Global Infrastructure Fund (one of the series constituting Delaware Group Global & International Funds, hereafter referred to as the “Fund”) at November 30, 2012, the results of its operations for the year then ended, the changes in its net assets for each of the two years in the period then ended and the financial highlights for each of the periods presented, in conformity with accounting principles generally accepted in the United States of America. These financial statements and financial highlights (hereafter referred to as “financial statements”) are the responsibility of the Fund’s management; our responsibility is to express an opinion on these financial statements based on our audits. We conducted our audits of these financial statements in accordance with the standards of the Public Company Accounting Oversight Board (United States). Those standards require that we plan and perform the audit to obtain reasonable assurance about whether the financial statements are free of material misstatement. An audit includes examining, on a test basis, evidence supporting the amounts and disclosures in the financial statements, assessing the accounting principles used and significant estimates made by management, and evaluating the overall financial statement presentation. We believe that our audits, which included confirmation of securities at November 30, 2012 by correspondence with the custodian and brokers, provide a reasonable basis for our opinion.
PricewaterhouseCoopers LLP
Philadelphia, Pennsylvania
January 15, 2013
39
Other Fund information
(Unaudited)
Delaware Macquarie Global Infrastructure Fund
Board Consideration of Delaware Macquarie Global Infrastructure Fund investment advisory agreement
At a meeting held on August 21-23, 2012 (the “Annual Meeting”), the Board of Trustees (the “Board”), including a majority of disinterested or independent Trustees, approved the renewal of the Investment Advisory Agreement and Investment Sub-Advisory Agreement for Delaware Macquarie Global Infrastructure Fund (the “Fund”). In making its decision, the Board considered information furnished at regular quarterly Board meetings, including reports detailing Fund performance, investment strategies and expenses, as well as information prepared specifically in connection with the renewal of the investment advisory and sub-advisory contracts. Information furnished specifically in connection with the renewal of the Investment Advisory Agreement with Delaware Management Company (“DMC”) and Sub-Advisory Agreement with Macquarie Capital Investment Management LLC (“MCIM”) included materials provided by DMC and its affiliates (“Delaware Investments”) and MCIM, as applicable, concerning, among other things, the nature, extent and quality of services provided to the Fund, the costs of such services to the Fund, economies of scale and the financial condition and profitability of Delaware Investments. In addition, in connection with the Annual Meeting, reports were provided in May 2012 and included independent historical and comparative reports provided by Lipper, Inc., an independent statistical compilation organization (“Lipper”). The Lipper reports compared the Fund’s investment performance and expenses with those of other comparable mutual funds. The Independent Trustees reviewed and discussed the Lipper reports with independent legal counsel to the Independent Trustees. The Board requested and received information regarding DMC’s policy with respect to advisory fee levels and its breakpoint philosophy; the structure of portfolio manager compensation; the investment manager’s profitability; comparative client fee information; and any constraints or limitations on the availability of securities in certain investment styles, which had in the past year inhibited, or which were likely in the future to inhibit, DMC’s or MCIM’s ability to invest fully in accordance with Fund policies.
In considering information relating to the approval of the Fund’s advisory and sub-advisory agreements, the Independent Trustees received assistance and advice from and met separately with independent legal counsel to the Independent Trustees. Although the Board gave attention to all information furnished, the following discussion identifies, under separate headings, the primary factors taken into account by the Board during its contract renewal considerations.
Nature, Extent And Quality of Service. The Board considered the services provided by Delaware Investments to the Fund and its shareholders. In reviewing the nature, extent and quality of services, the Board considered reports furnished to it throughout the year, which covered matters such as the relative performance of the Fund, compliance of portfolio managers with the investment policies, strategies and restrictions for the Fund, compliance by DMC and Delaware Distributors, L.P. (together, “Management”) personnel with the Code of Ethics adopted throughout the Delaware Investments Family of Funds complex and adherence to fair value pricing procedures as established by the Board. The Board was pleased with the current staffing of the Fund’s investment advisor and the emphasis placed on research in the investment process.
40
The Board recognized DMC’s receipt of several industry distinctions. The Board gave favorable consideration to DMC’s efforts to control expenditures while maintaining service levels committed to fund matters. The Board noted that in July 2011 Management implemented measures to reduce overall costs and improve transfer agent and shareholder servicing functions through outsourcing. The Board noted the benefits provided to Fund shareholders through each shareholder’s ability to exchange an investment in one Delaware Investments fund for the same class of shares in another Delaware Investments fund without a sales charge, to reinvest Fund dividends into additional shares of the Fund or into additional shares of other Delaware Investments funds and the privilege to combine holdings in other Delaware Investments funds to obtain a reduced sales charge. The Board was satisfied with the nature, extent and quality of the overall services provided by Delaware Investments.
Nature, Extent And Quality of Service. The Board considered the services provided by MCIM, under the terms of the sub-advisory agreement between DMC and MCIM, to the Fund and its shareholders. In reviewing the nature, extent and quality of services, the Board noted that reports furnished to it throughout the year at regular Board Meetings covering matters such as relative performance of the Fund, compliance of portfolio managers with the investment policies, strategies and restrictions for the Fund, the compliance of MCIM personnel with the Code of Ethics and adherence to fair value pricing procedures as established by the Board. The Board was pleased with the current staffing of MCIM and the emphasis placed on research in the investment process. The Board was satisfied with the nature, extent and quality of the overall services proposed to be provided by MCIM.
Investment Performance. The Board placed significant emphasis on the investment performance of the Fund in view of the importance of investment performance to shareholders. Although the Board gave appropriate consideration to performance reports and discussions with portfolio managers at Investment Committee meetings throughout the year, the Board gave particular weight to the Lipper reports furnished for the Annual Meeting. The Lipper reports prepared for the Fund showed the investment performance of its Class A shares in comparison to a group of similar funds as selected by Lipper (the “Performance Universe”). A fund with the best performance ranked first, and a fund with the poorest performance ranked last. The highest/best performing 25% of funds in the Performance Universe make up the first quartile; the next 25%, the second quartile; the next 25%, the third quartile; and the poorest/ worst performing 25% of funds in the Performance Universe make up the fourth quartile. Comparative annualized performance for the Fund was shown for the past one-, three-, five- and ten-year periods, as applicable, ended March 31, 2012. The Board’s objective is that the Fund’s performance for the periods considered be at or above the median of its Performance Universe. The following paragraph summarizes the performance results for the Fund and the Board’s view of such performance.
The Performance Universe for the Fund consisted of the Fund and all retail and institutional specialty and miscellaneous funds as selected by Lipper. The Lipper report comparison showed that the Fund’s total return for the one-year period was in the third quartile of its Performance
41
Other Fund information
(Unaudited)
Delaware Macquarie Global Infrastructure Fund
Board Consideration of Delaware Macquarie Global Infrastructure Fund investment advisory agreement (continued)
Universe. The Fund’s performance results were not in line with the Board’s objective. In evaluating the Fund’s performance, the Board considered the Fund’s recent inception. The Board also considered the numerous investment and performance reports delivered by Management personnel to the Board’s Investments Committee. The Board was satisfied that Management was taking action to improve Fund performance and meet the Board’s performance objective.
Comparative Expenses. The Board considered expense comparison data for the Delaware Investments Family of Funds. Management provided the Board with information on pricing levels and fee structures for the Fund as of its most recently completed fiscal year. The Board also focused on the comparative analysis of effective management fees and total expense ratios of the Fund versus effective management fees and expense ratios of a group of similar funds as selected by Lipper (the “Expense Group”). In reviewing comparative costs, the Fund’s contractual management fee and the actual management fee incurred by the Fund were compared with the contractual management fees (assuming all funds in the Expense Group were similar in size to the Fund) and actual management fees (as reported by each fund) within the Expense Group, taking into account any applicable breakpoints and fee waivers. The Fund’s total expenses were also compared with those of its Expense Group. The Lipper total expenses, for comparative consistency, were shown by Lipper for Class A shares and comparative total expenses including 12b-1 and non 12b-1 service fees. The Board considered fees paid to Delaware Investments for non-management services. The Board’s objective is to limit the Fund’s total expense ratio to be competitive with that of the Expense Group. The following paragraph summarizes the expense results for the Fund and the Board’s view of such expenses.
The expense comparisons for the Fund showed that its contractual management fee and total expenses were in the quartile with the second lowest expenses of its Expense Group. The Board was satisfied with the management fee and total expenses of the Fund in comparison to those of its Expense Group as shown in the Lipper report.
Management Profitability. The Board considered the level of profits realized by Delaware Investments in connection with the operation of the Fund. In this respect, the Board reviewed the Investment Management Profitability Analysis that addressed the overall profitability of Delaware Investments’ business in providing management and other services to each of the individual funds and the Delaware Investments Family of Funds as a whole. Specific attention was given to the methodology followed in allocating costs for the purpose of determining profitability. Management stated that the level of profits of Delaware Investments, to a certain extent, reflect recent operational cost savings and efficiencies initiated by Delaware Investments. The Board considered Delaware Investments’ efforts to improve services provided to fund shareholders and to meet additional regulatory and compliance requirements resulting from recent industry-wide Securities and Exchange Commission initiatives. The Board also considered the extent to which Delaware Investments might derive ancillary benefits from fund operations, including
42
the potential for procuring additional business as a result of the prestige and visibility associated with its role as service provider to the Delaware Investments Family of Funds and the benefits from allocation of fund brokerage to improve trading efficiencies. The Board found that the management fees were reasonable in light of the services rendered and the level of profitability of Delaware Investments.
Management Profitability. The Board considered the level of profits realized by MCIM in connection with the operation of the Fund. In this respect, the Board reviewed the pro forma profitability analysis that addressed the overall profitability of MCIM in providing management and other services to the Fund. Specific attention was given to the methodology followed in allocating costs for the purpose of determining profitability. The Board also considered the extent to which MCIM might derive ancillary benefits from Fund operations, including the potential for procuring additional business as a result of the prestige and visibility associated with its role as service provider to the Delaware Investments Family of Funds and the benefits from allocation of fund brokerage to improve trading efficiencies. The Board found that the management fees were reasonable in light of the services rendered and the level of profitability of MCIM.
Economies of Scale. The Trustees considered whether economies of scale are realized by Delaware Investments as the Fund’s assets increase and the extent to which any economies of scale are reflected in the level of management fees charged. The Trustees reviewed the standardized advisory fee pricing and structure, approved by the Board and shareholders, which includes breakpoints. Breakpoints in the advisory fee occur when the advisory fee rate is reduced on assets in excess of specified levels. Breakpoints result in a lower advisory fee than would otherwise be the case on all assets when the asset levels specified are exceeded. The Board noted that the fee under the Fund’s management contract did not fall within the standard structure. Management explained that, due to the unique nature of the infrastructure industry, the Fund’s pricing structure should fall between the standard fees for international equity funds and special international equity funds. Although the Fund has not reached a size at which it can take advantage of breakpoints, the Board recognized that the fee was structured so that when the Fund grows, economies of scale may be shared.
Tax Information
The information set forth below is for the Fund’s fiscal year as required by federal laws. Shareholders, however, must report distributions on a calendar year basis for income tax purposes, which may include distributions for portions of two fiscal years of a fund. Accordingly, the information needed by shareholders for income tax purposes will be sent to them in January of each year. Please consult your tax advisor for proper treatment of this information. All designations are based on financial information available as of the date of this annual report and, accordingly are subject to change. For any and all items requiring designation, it is the intention of the Fund to designate the maximum amount permitted under the Internal Revenue Code and the regulations thereunder.
43
Other Fund information
(Unaudited)
Delaware Macquarie Global Infrastructure Fund
Tax Information (continued)
For the fiscal year ended November 30, 2012, the Fund designates distributions paid during the year as follows:
| (A) | Long-Term Capital Gains Distributions (Tax Basis) | 16 | % |
| (B) | Ordinary Income Distributions* (Tax Basis) | 84 | % |
| Total Distributions (Tax Basis) | 100 | % |
| (C) | Qualifying Dividends1 | 32 | % |
(A) and (B) are based on a percentage of the Fund’s total distributions.
(C) is based on a percentage of the Fund’s ordinary income distributions.
1Qualifying dividends represent dividends which qualify for the corporate dividends received deduction.
*For the fiscal year ended November 30, 2012, certain dividends paid by the Fund may be subject to a maximum tax rate of 15%, as provided for by the Jobs and Growth Tax Relief Reconciliation Act of 2003 and as extended by the Tax Relief, Unemployment Insurance Reauthorization and Jobs Creation Act of 2010. The Fund intends to designate up to 74% to be taxed at a maximum rate of 15%. Complete information will be computed and reported in conjunction with your 2012 Form 1099-DIV.
For the fiscal year ended November 30, 2012, certain interest income paid by the Fund, determined to be Short-Term Capital Gains may be subject to relief from U.S. withholding for foreign shareholders, as provided by the American Jobs Creation Act of 2004. For the fiscal year ended November 30, 2012, the Fund has designated a maximum distribution of 12% of Short-Term Capital Gains.
The Fund intends to pass through foreign tax credits in the maximum amount of $57,676. The gross foreign source income earned during the fiscal year 2012 by the Fund was $936,614.
44
Board of trustees/directors and officers addendum
Delaware Investments® Family of Funds
A mutual fund is governed by a Board of Trustees/Directors (“Trustees”), which has oversight responsibility for the management of a fund’s business affairs. Trustees establish procedures and oversee and review the performance of the investment manager, the distributor, and others who perform services for the fund. The independent fund trustees, in particular, are advocates
| Name, Address, | | Position(s) | | Length of |
| and Birth Date | | Held with Fund(s) | | Time Served |
| Interested Trustees | | | | |
| | | | | |
| Patrick P. Coyne1 | | Chairman, President, | | Chairman and Trustee |
| 2005 Market Street | | Chief Executive Officer, | | since August 16, 2006 |
| Philadelphia, PA 19103 | | and Trustee | | |
| April 1963 | | | | President and |
| | | | Chief Executive Officer |
| | | | since August 1, 2006 |
| |
| Independent Trustees | | | | |
| | | | | |
| Thomas L. Bennett | | Trustee | | Since March 2005 |
| 2005 Market Street | | | | |
| Philadelphia, PA 19103 | | | | |
| October 1947 | | | | |
| | | | | |
| John A. Fry | | Trustee | | Since January 2001 |
| 2005 Market Street | | | | |
| Philadelphia, PA 19103 | | | | |
| May 1960 | | | | |
| | | | |
1 Patrick P. Coyne is considered to be an “Interested Trustee” because he is an executive officer of the Fund’s(s’) investment advisor.
46
for shareholder interests. Each trustee has served in that capacity since he or she was elected to or appointed to the Board of Trustees, and will continue to serve until his or her retirement or the election of a new trustee in his or her place. The following is a list of the Trustees and Officers with certain background and related information.
| | Number of Portfolios in | | |
| Principal Occupation(s) | | Fund Complex Overseen | | Other Directorships |
| During Past 5 Years | | by Trustee or Officer | | Held by Trustee or Officer |
| |
| |
| Patrick P. Coyne has served in | | 71 | | Director and Audit |
| various executive capacities | | | | Committee Member |
| at different times at | | | | Kaydon Corp. |
| Delaware Investments.2 | | | | |
| | | | Board of Governors Member |
| | | | Investment Company |
| | | | Institute (ICI) |
| | | | |
| |
| |
| Private Investor | | 71 | | Director |
| (March 2004–Present) | | | | Bryn Mawr Bank Corp. (BMTC) |
| | | | (2007–2011) |
| |
| President | | 71 | | Board of Governors Member — |
| Drexel University | | | | NASDAQ OMX PHLX LLC |
| (August 2010–Present) | | | | |
| | | | Director and Audit |
| President | | | | Committee Member |
| Franklin & Marshall College | | | | Community Health Systems |
| (July 2002–July 2010) | | | | |
| | | | Director — Ecore |
| | | | International |
| | | | (2009–2010) |
| |
| | | | Director — Allied |
| | | | Barton Securities Holdings |
| | | | (2005–2008) |
| | | | |
2 Delaware Investments is the marketing name for Delaware Management Holdings, Inc. and its subsidiaries, including the Fund’s(s’) investment advisor, principal underwriter, and its transfer agent.
47
Board of trustees/directors and officers addendum
Delaware Investments® Family of Funds
| Name, Address, | | Position(s) | | Length of |
| and Birth Date | | Held with Fund(s) | | Time Served |
| Independent Trustees (continued) | | | | |
| | | | | |
| Anthony D. Knerr | | Trustee | | Since April 1990 |
| 2005 Market Street | | | | |
| Philadelphia, PA 19103 | | | | |
| December 1938 | | | | |
| | | | | |
| Lucinda S. Landreth | | Trustee | | Since March 2005 |
| 2005 Market Street | | | | |
| Philadelphia, PA 19103 | | | | |
| June 1947 | | | | |
| | | | | |
| Frances A. Sevilla-Sacasa | | Trustee | | Since September 2011 |
| 2005 Market Street | | | | |
| Philadelphia, PA 19103 | | | | |
| January 1956 | | | | |
|
| |
| |
| |
| |
| Janet L. Yeomans | | Trustee | | Since April 1999 |
| 2005 Market Street | | | | |
| Philadelphia, PA 19103 | | | | |
| July 1948 | | | | |
| | | | |
48
| | Number of Portfolios in | | |
| Principal Occupation(s) | | Fund Complex Overseen | | Other Directorships |
| During Past 5 Years | | by Trustee or Officer | | Held by Trustee or Officer |
| |
| |
| Managing Director | | 71 | | None |
| Anthony Knerr & Associates | | | | |
| (Strategic Consulting) | | | | |
| (1990–Present) | | | | |
| | | | | |
| Private Investor | | 71 | | None |
| (2004–Present) | | | | |
| |
| |
| Chief Executive Officer — | | 71 | | Trust Manager — Camden |
| Banco Itaú Europa | | | | Property Trust |
| International | | | | (since August 2011) |
| (since April 2012) | | | | |
| |
| Executive Advisor to Dean | | | | |
| (August 2011–March 2012) | | | | |
| and Interim Dean | | | | |
| (January 2011–July 2011) — | | | | |
| University of Miami School of | | | | |
| Business Administration | | | | |
| |
| President — U.S. Trust, | | | | |
| Bank of America Private | | | | |
| Wealth Management | | | | |
| (Private Banking) | | | | |
| (July 2007–December 2008) | | | | |
| |
| Vice President and Treasurer | | 71 | | Director, Audit |
| (January 2006–July 2012) | | | | Committee Member and |
| Vice President — Mergers & Acquisitions | | | | Investment Committee |
| (January 2003–January 2006), and | | | | Member |
| Vice President and Treasurer | | | | Okabena Company |
| (July 1995–January 2003) | | | | |
| 3M Corporation | | | | Chair — 3M |
| | | | Investment Management |
| | | | Company |
| | | | (January 2005–July 2012) |
| | | | | |
49
Board of trustees/directors and officers addendum
Delaware Investments® Family of Funds
| Name, Address, | | Position(s) | | Length of |
| and Birth Date | | Held with Fund(s) | | Time Served |
| Independent Trustees (continued) | | | | |
| | | | | |
| J. Richard Zecher | | Trustee | | Since March 2005 |
| 2005 Market Street | | | | |
| Philadelphia, PA 19103 | | | | |
| July 1940 | | | | |
| | | | |
50
| | Number of Portfolios in | | |
| Principal Occupation(s) | | Fund Complex Overseen | | Other Directorships |
| During Past 5 Years | | by Trustee or Officer | | Held by Trustee or Officer |
| |
| |
| Founder | | 71 | | Director and Compensation |
| Investor Analytics | | | | Committee Member |
| (Risk Management) | | | | Investor Analytics |
| (May 1999–Present) | | | | |
| | | | | Director |
| Founder | | | | Oxigene, Inc. |
| P/E Investments | | | | (2003–2008) |
| (Hedge Fund) | | | | |
| (September 1996–Present) | | | | |
| | | | |
51
Board of trustees/directors and officers addendum
Delaware Investments® Family of Funds
| Name, Address, | | Position(s) | | Length of |
| and Birth Date | | Held with Fund(s) | | Time Served |
| Officers | | | | |
| | | | | |
| David F. Connor | | Vice President, | | Vice President since |
| 2005 Market Street | | Deputy General | | September 2000 |
| Philadelphia, PA 19103 | | Counsel, and Secretary | | and Secretary since |
| December 1963 | | | | October 2005 |
| |
| Daniel V. Geatens | | Vice President | | Treasurer |
| 2005 Market Street | | and Treasurer | | since October 2007 |
| Philadelphia, PA 19103 | | | | |
| October 1972 | | | | |
| | | | | |
| David P. O’Connor | | Executive Vice President, | | Executive Vice President |
| 2005 Market Street | | General Counsel | | since February 2012; |
| Philadelphia, PA 19103 | | and Chief Legal Officer | | Senior Vice President |
| February 1966 | | | | October 2005– |
| | | | February 2012; |
| | | | General Counsel and |
| | | | Chief Legal Officer |
| | | | since October 2005 |
| | | | | |
| Richard Salus | | Senior Vice President | | Chief Financial Officer |
| 2005 Market Street | | and Chief Financial Officer | | since November 2006 |
| Philadelphia, PA 19103 | | | | |
| October 1963 | | | | |
| | | | | |
The Statement of Additional Information for the Fund(s) includes additional information about the Trustees and Officers and is available, without charge, upon request by calling 800 523-1918.
52
| Number of Portfolios in | |
| Principal Occupation(s) | Fund Complex Overseen | Other Directorships |
| During Past 5 Years | by Trustee or Officer | Held by Trustee or Officer |
| |
| |
| David F. Connor has served as | 71 | None3 |
| Vice President and Deputy | | |
| General Counsel of | | |
| Delaware Investments | | |
| since 2000. | | |
| | | |
| Daniel V. Geatens has served | 71 | None3 |
| in various capacities at | | |
| different times at | | |
| Delaware Investments. | | |
| | | |
| David P. O’Connor has served in | 71 | None3 |
| various executive and legal | | |
| capacities at different times | | |
| at Delaware Investments. | | |
| |
| |
| |
| |
| Richard Salus has served in | 71 | None3 |
| various executive capacities | | |
| at different times at | | |
| Delaware Investments. | | |
| | | |
3 David F. Connor, Daniel V. Geatens, David P. O’Connor, and Richard Salus serve in similar capacities for the six portfolios of the Optimum Fund Trust, which have the same investment advisor, principal underwriter, and transfer agent as the registrant.
53
About the organization
| Board of trustees | | | |
Patrick P. Coyne
Chairman, President, and
Chief Executive Officer
Delaware Investments®
Family of Funds
Philadelphia, PA Thomas L. Bennett
Private Investor
Rosemont, PA | John A. Fry
President
Drexel University
Philadelphia, PA Anthony D. Knerr
Founder and Managing
Director
Anthony Knerr &
Associates
New York, NY | Lucinda S. Landreth
Former Chief Investment
Officer
Assurant, Inc.
Philadelphia, PA Frances A.
Sevilla-Sacasa
Chief Executive Officer
Banco Itaú Europa
International
Miami, FL | Janet L. Yeomans
Former Vice President and
Treasurer
3M Corporation
St. Paul, MN J. Richard Zecher
Founder
Investor Analytics
Scottsdale, AZ |
| | | | |
Affiliated officers | | | |
David F. Connor
Vice President, Deputy
General Counsel, and
Secretary
Delaware Investments
Family of Funds
Philadelphia, PA | Daniel V. Geatens
Vice President and
Treasurer
Delaware Investments
Family of Funds
Philadelphia, PA | David P. O’Connor
Executive Vice President,
General Counsel,
and Chief Legal Officer
Delaware Investments
Family of Funds
Philadelphia, PA | Richard Salus
Senior Vice President and
Chief Financial Officer
Delaware Investments
Family of Funds
Philadelphia, PA |
| | | | |
This annual report is for the information of Delaware Macquarie Global Infrastructure Fund shareholders, but it may be used with prospective investors when preceded or accompanied by the Delaware Investments Fund fact sheet for the most recently completed calendar quarter. These documents are available at delawareinvestments.com. |
Delaware Investments is the marketing name of Delaware Management Holdings, Inc. and its subsidiaries. |
The Fund files its complete schedule of portfolio holdings with the Securities and Exchange Commission (SEC) for the first and third quarters of each fiscal year on Form N-Q. The Fund’s Forms N-Q, as well as a description of the policies and procedures that the Fund uses to determine how to vote proxies (if any) relating to portfolio securities are available without charge (i) upon request, by calling 800 523-1918; and (ii) on the SEC’s website at sec.gov. In addition, a description of the policies and procedures that the Fund uses to determine how to vote proxies (if any) relating to portfolio securities and the Fund’s Schedule of Investments are available without charge on the Fund’s website at delawareinvestments.com. The Fund’s Forms N-Q may be reviewed and copied at the SEC’s Public Reference Room in Washington, D.C.; information on the operation of the Public Reference Room may be obtained by calling 800 SEC-0330.
Information (if any) regarding how the Fund voted proxies relating to portfolio securities during the most recently disclosed 12-month period ended June 30 is available without charge (i) through the Fund’s website at delawareinvestments.com; and (ii) on the SEC’s website at sec.gov.
54
Item 2. Code of Ethics
The registrant has adopted a code of ethics that applies to the registrant’s principal executive officer, principal financial officer, principal accounting officer or controller, or persons performing similar functions, regardless of whether these individuals are employed by the registrant or a third party. A copy of the registrant’s Code of Business Ethics has been posted on the Delaware Investments Internet Web site at www.delawareinvestments.com. Any amendments to the Code of Business Ethics, and information on any waiver from its provisions granted by the registrant, will also be posted on this Web site within five business days of such amendment or waiver and will remain on the Web site for at least 12 months.
Item 3. Audit Committee Financial Expert
The registrant’s Board of Trustees/Directors has determined that certain members of the registrant’s Audit Committee are audit committee financial experts, as defined below. For purposes of this item, an “audit committee financial expert” is a person who has the following attributes:
a. An understanding of generally accepted accounting principles and financial statements;
b. The ability to assess the general application of such principles in connection with the accounting for estimates, accruals, and reserves;
c. Experience preparing, auditing, analyzing, or evaluating financial statements that present a breadth and level of complexity of accounting issues that are generally comparable to the breadth and complexity of issues that can reasonably be expected to be raised by the registrant’s financial statements, or experience actively supervising one or more persons engaged in such activities;
d. An understanding of internal controls and procedures for financial reporting; and
e. An understanding of audit committee functions.
An “audit committee financial expert” shall have acquired such attributes through:
a. Education and experience as a principal financial officer, principal accounting officer, controller, public accountant, or auditor or experience in one or more positions that involve the performance of similar functions;
b. Experience actively supervising a principal financial officer, principal accounting officer, controller, public accountant, auditor, or person performing similar functions;
c. Experience overseeing or assessing the performance of companies or public accountants with respect to the preparation, auditing, or evaluation of financial statements; or
d. Other relevant experience.
The registrant’s Board of Trustees/Directors has also determined that each member of the registrant’s Audit Committee is independent. In order to be “independent” for purposes of this item, the Audit Committee member may not: (i) other than in his or her capacity as a member of the Board of Trustees/Directors or any committee thereof, accept directly or indirectly any consulting, advisory or other compensatory fee from the issuer; or (ii) be an “interested person” of the registrant as defined in Section 2(a)(19) of the Investment Company Act of 1940.
The names of the audit committee financial experts on the registrant’s Audit Committee are set forth below:
Thomas L. Bennett1
John A. Fry
Frances A. Sevilla-Sacasa
Janet L. Yeomans
Item 4. Principal Accountant Fees and Services
(a) Audit fees.
The aggregate fees billed for services provided to the registrant by its independent auditors for the audit of the registrant’s annual financial statements and for services normally provided by the independent auditors in connection with statutory and regulatory filings or engagements were $109,890 for the fiscal year ended November 30, 2012.
The aggregate fees billed for services provided to the registrant by its independent auditors for the audit of the registrant’s annual financial statements and for services normally provided by the independent auditors in connection with statutory and regulatory filings or engagements were $139,570 for the fiscal year ended November 30, 2011.
(b) Audit-related fees.
The aggregate fees billed by the registrant’s independent auditors for services relating to the performance of the audit of the registrant’s financial statements and not reported under paragraph (a) of this Item were $0 for the fiscal year ended November 30, 2012.
The aggregate fees billed by the registrant’s independent auditors for services relating to the performance of the audit of the financial statements of the registrant’s investment adviser and other service providers under common control with the adviser and that relate directly to the operations or financial reporting of the registrant were $685,000 for the registrant’s fiscal year ended November 30, 2012. The percentage of these fees relating to services approved by the registrant’s Audit Committee pursuant to the de minimis exception from the pre-approval requirement in Rule 2-01(c)(7)(i)(C) of Regulation S-X was 0%. These audit-related services were as follows: year-end audit procedures; group reporting and subsidiary statutory audits.
____________________
1 The instructions to Form N-CSR require disclosure on the relevant experience of persons who qualify as audit committee financial experts based on “other relevant experience.” The Board of Trustees/Directors has determined that Mr. Bennett qualifies as an audit committee financial expert by virtue of: his education and Chartered Financial Analyst designation; his experience as a credit analyst, portfolio manager and the manager of other credit analysts and portfolio managers; and his prior service on the audit committees of public companies.
The aggregate fees billed by the registrant’s independent auditors for services relating to the performance of the audit of the registrant’s financial statements and not reported under paragraph (a) of this Item were $0 for the fiscal year ended November 30, 2011.
The aggregate fees billed by the registrant’s independent auditors for services relating to the performance of the audit of the financial statements of the registrant’s investment adviser and other service providers under common control with the adviser and that relate directly to the operations or financial reporting of the registrant were $593,000 for the registrant’s fiscal year ended November 30, 2011. The percentage of these fees relating to services approved by the registrant’s Audit Committee pursuant to the de minimis exception from the pre-approval requirement in Rule 2-01(c)(7)(i)(C) of Regulation S-X was 0%. These audit-related services were as follows: year-end audit procedures; reporting up and subsidiary statutory audits.
(c) Tax fees.
The aggregate fees billed by the registrant’s independent auditors for tax-related services provided to the registrant were $21,990 for the fiscal year ended November 30, 2012. The percentage of these fees relating to services approved by the registrant’s Audit Committee pursuant to the de minimis exception from the pre-approval requirement in Rule 2-01(c)(7)(i)(C) of Regulation S-X was 0%. These tax-related services were as follows: review of income tax returns and review of annual excise distribution calculations.
The aggregate fees billed by the registrant’s independent auditors for tax-related services provided to the registrant’s investment adviser and other service providers under common control with the adviser and that relate directly to the operations or financial reporting of the registrant were $0 for the registrant’s fiscal year ended November 30, 2012.
The aggregate fees billed by the registrant’s independent auditors for tax-related services provided to the registrant were $27,350 for the fiscal year ended November 30, 2011. The percentage of these fees relating to services approved by the registrant’s Audit Committee pursuant to the de minimis exception from the pre-approval requirement in Rule 2-01(c)(7)(i)(C) of Regulation S-X was 0%. These tax-related services were as follows: review of income tax returns and review of annual excise distribution calculations.
The aggregate fees billed by the registrant’s independent auditors for tax-related services provided to the registrant’s investment adviser and other service providers under common control with the adviser and that relate directly to the operations or financial reporting of the registrant were $0 for the registrant’s fiscal year ended November 30, 2011.
(d) All other fees.
The aggregate fees billed for all services provided by the independent auditors to the registrant other than those set forth in paragraphs (a), (b) and (c) of this Item were $0 for the fiscal year ended November 30, 2012.
The aggregate fees billed for all services other than those set forth in paragraphs (b) and (c) of this Item provided by the registrant’s independent auditors to the registrant’s adviser and other service providers under common control with the adviser and that relate directly to the operations or financial reporting of the registrant were $0 for the registrant’s fiscal year ended November 30, 2012. The percentage of these fees relating to services approved by the registrant’s Audit Committee pursuant to the de minimis exception from the pre-approval requirement in Rule 2-01(c)(7)(i)(C) of Regulation S-X was 0%.
The aggregate fees billed for all services provided by the independent auditors to the registrant other than those set forth in paragraphs (a), (b) and (c) of this Item were $0 for the fiscal year ended November 30, 2011.
The aggregate fees billed for all services other than those set forth in paragraphs (b) and (c) of this Item provided by the registrant’s independent auditors to the registrant’s adviser and other service providers under common control with the adviser and that relate directly to the operations or financial reporting of the registrant were $25,000 for the registrant’s fiscal year ended November 30, 2011. The percentage of these fees relating to services approved by the registrant’s Audit Committee pursuant to the de minimis exception from the pre-approval requirement in Rule 2-01(c)(7)(i)(C) of Regulation S-X was 0%. These other services were as follows: attest examination of management's assertion to the controls in place at the transfer agent to be in compliance with Rule 17ad-13(a)(3) of the Securities Exchange Act of 1934.
(e) The registrant’s Audit Committee has established pre-approval policies and procedures as permitted by Rule 2-01(c)(7)(i)(B) of Regulation S-X (the “Pre-Approval Policy”) with respect to services provided by the registrant’s independent auditors. Pursuant to the Pre-Approval Policy, the Audit Committee has pre-approved the services set forth in the table below with respect to the registrant up to the specified fee limits. Certain fee limits are based on aggregate fees to the registrant and other registrants within the Delaware Investments Family of Funds.
| Service | Range of Fees |
| Audit Services | |
| Statutory audits or financial audits for new Funds | up to $25,000 per Fund |
| Services associated with SEC registration statements (e.g., Form N-1A, Form N-14, etc.), periodic reports and other documents filed with the SEC or other documents issued in connection with securities offerings (e.g., comfort letters for closed-end Fund offerings, consents), and assistance in responding to SEC comment letters | up to $10,000 per Fund |
| Consultations by Fund management as to the accounting or disclosure treatment of transactions or events and/or the actual or potential impact of final or proposed rules, standards or interpretations by the SEC, FASB, or other regulatory or standard-setting bodies (Note: Under SEC rules, some consultations may be considered “audit-related services” rather than “audit services”) | up to $25,000 in the aggregate |
| Audit-Related Services | |
| Consultations by Fund management as to the accounting or disclosure treatment of transactions or events and /or the actual or potential impact of final or proposed rules, standards or interpretations by the SEC, FASB, or other regulatory or standard-setting bodies (Note: Under SEC rules, some consultations may be considered “audit services” rather than “audit-related services”) | up to $25,000 in the aggregate |
| Tax Services | |
| U.S. federal, state and local and international tax planning and advice (e.g., consulting on statutory, regulatory or administrative developments, evaluation of Funds’ tax compliance function, etc.) | up to $25,000 in the aggregate |
| U.S. federal, state and local tax compliance (e.g., excise distribution reviews, etc.) | up to $5,000 per Fund |
| Review of federal, state, local and international income, franchise and other tax returns | up to $5,000 per Fund |
Under the Pre-Approval Policy, the Audit Committee has also pre-approved the services set forth in the table below with respect to the registrant’s investment adviser and other entities controlling, controlled by or under common control with the investment adviser that provide ongoing services to the registrant (the “Control Affiliates”) up to the specified fee limit. This fee limit is based on aggregate fees to the investment adviser and its Control Affiliates.
| Service | Range of Fees |
| Non-Audit Services | |
| Services associated with periodic reports and other documents filed with the SEC and assistance in responding to SEC comment letters | up to $10,000 in the aggregate |
The Pre-Approval Policy requires the registrant’s independent auditors to report to the Audit Committee at each of its regular meetings regarding all services initiated since the last such report was rendered, including those services authorized by the Pre-Approval Policy.
(f) Not applicable.
(g) The aggregate non-audit fees billed by the registrant’s independent auditors for services rendered to the registrant and to its investment adviser and other service providers under common control with the adviser were $10,867,923 and $5,228,766 for the registrant’s fiscal years ended November 30, 2012 and November 30, 2011, respectively.
(h) In connection with its selection of the independent auditors, the registrant’s Audit Committee has considered the independent auditors’ provision of non-audit services to the registrant’s investment adviser and other service providers under common control with the adviser that were not required to be pre-approved pursuant to Rule 2-01(c)(7)(ii) of Regulation S-X. The Audit Committee has determined that the independent auditors’ provision of these services is compatible with maintaining the auditors’ independence.
Item 5. Audit Committee of Listed Registrants
Not applicable.
Item 6. Investments
(a) Included as part of report to shareholders filed under Item 1 of this Form N-CSR.
(b) Divestment of securities in accordance with Section 13(c) of the Investment Company Act of 1940.
Not applicable.
Item 7. Disclosure of Proxy Voting Policies and Procedures for Closed-End Management Investment Companies
Not applicable.
Item 8. Portfolio Managers of Closed-End Management Investment Companies
Not applicable.
Item 9. Purchases of Equity Securities by Closed-End Management Investment Company and Affiliated Purchasers
Not applicable.
Item 10. Submission of Matters to a Vote of Security Holders
Not applicable.
Item 11. Controls and Procedures
The registrant’s principal executive officer and principal financial officer have evaluated the registrant’s disclosure controls and procedures within 90 days of the filing of this report and have concluded that they are effective in providing reasonable assurance that the information required to be disclosed by the registrant in its reports or statements filed under the Securities Exchange Act of 1934 is recorded, processed, summarized and reported within the time periods specified in the rules and forms of the Securities and Exchange Commission.
There were no significant changes in the registrant’s internal control over financial reporting that occurred during the second fiscal quarter of the period covered by the report to stockholders included herein (i.e., the registrant’s fourth fiscal quarter) that have materially affected, or are reasonably likely to materially affect, the registrant’s internal control over financial reporting.
Item 12. Exhibits
(a) (1) Code of Ethics
Not applicable.
(2) Certifications of Principal Executive Officer and Principal Financial Officer pursuant to Rule 30a-2 under the Investment Company Act of 1940 are attached hereto as Exhibit 99.CERT.
(3) Written solicitations to purchase securities pursuant to Rule 23c-1 under the Securities Exchange Act of 1934.
Not applicable.
(b) Certifications pursuant to Section 906 of the Sarbanes-Oxley Act of 2002 are furnished herewith as Exhibit 99.906CERT.
SIGNATURES
Pursuant to the requirements of the Securities Exchange Act of 1934 and the Investment Company Act of 1940, the registrant has duly caused this report to be signed on its behalf, by the undersigned, thereunto duly authorized.
Name of Registrant: DELAWARE GROUP® GLOBAL & INTERNATIONAL FUNDS
| /s/ PATRICK P. COYNE |
| By: | Patrick P. Coyne |
| Title: | Chief Executive Officer |
| Date: | February 1, 2013 |
Pursuant to the requirements of the Securities Exchange Act of 1934 and the Investment Company Act of 1940, this report has been signed below by the following persons on behalf of the registrant and in the capacities and on the dates indicated.
| /s/ PATRICK P. COYNE |
| By: | Patrick P. Coyne |
| Title: | Chief Executive Officer |
| Date: | February 1, 2013 |
| /s/ RICHARD SALUS |
| By: | Richard Salus |
| Title: | Chief Financial Officer |
| Date: | February 1, 2013 |