UNITED STATES SECURITIES AND EXCHANGE COMMISSION
Washington, D.C. 20549
FORM N-CSR
CERTIFIED SHAREHOLDER REPORT OF REGISTERED MANAGEMENT
INVESTMENT COMPANIES
| Investment Company Act file number: | 811-06324 | |
| Exact name of registrant as specified in charter: | Delaware Group® Global & International Funds | |
| Address of principal executive offices: | 2005 Market Street | |
| Philadelphia, PA 19103 | ||
| Name and address of agent for service: | David F. Connor, Esq. | |
| 2005 Market Street | ||
| Philadelphia, PA 19103 | ||
| Registrant’s telephone number, including area code: | (800) 523-1918 | |
| Date of fiscal year end: | November 30 | |
| Date of reporting period: | November 30, 2014 |
Item 1. Reports to Stockholders
Table of Contents

Annual report
Global / international equity funds
Delaware Emerging Markets Fund
Delaware Global Value Fund
Delaware International Value Equity Fund
November 30, 2014
Carefully consider the Funds’ investment objectives, risk factors, charges, and expenses before investing. This and other information can be found in the Funds’ prospectuses and their summary prospectuses, which may be obtained by visiting delawareinvestments.com or calling 800 523-1918. Investors should read the prospectus and the summary prospectus carefully before investing.
You can obtain shareholder reports and prospectuses online instead of in the mail.
Visit delawareinvestments.com/edelivery.
Table of Contents
Experience Delaware Investments
Delaware Investments is committed to the pursuit of consistently superior asset management and unparalleled client service. We believe in our investment processes, which seek to deliver consistent results, and in convenient services that help add value for our clients.
If you are interested in learning more about creating an investment plan, contact your financial advisor.
You can learn more about Delaware Investments or obtain a prospectus for Delaware Emerging Markets Fund, Delaware Global Value Fund, and Delaware International Value Equity Fund at delawareinvestments.com.
Manage your investments online
| • | 24-hour access to your account information |
| • | Obtain share prices |
| • | Check your account balance and recent transactions |
| • | Request statements or literature |
| • | Make purchases and redemptions |
Delaware Management Holdings, Inc. and its subsidiaries (collectively known by the marketing name of Delaware Investments) are wholly owned subsidiaries of Macquarie Group Limited, a global provider of banking, financial, advisory, investment and funds management services.
Investments in Delaware Emerging Markets Fund, Delaware Global Value Fund, and Delaware International Value Equity Fund are not and will not be deposits with or liabilities of Macquarie Bank Limited ABN 46 008 583 542 and its holding companies, including their subsidiaries or related companies (Macquarie Group), and are subject to investment risk, including possible delays in repayment and loss of income and capital invested. No Macquarie Group company guarantees or will guarantee the performance of the Funds, the repayment of capital from the Funds, or any particular rate of return.
| 1 | ||||
| 10 | ||||
| 22 | ||||
| 25 | ||||
| 31 | ||||
| 46 | ||||
| 50 | ||||
| 52 | ||||
| 58 | ||||
| 80 | ||||
| 99 | ||||
| 100 | ||||
| 106 | ||||
| 114 |
Unless otherwise noted, views expressed herein are current as of Nov. 30, 2014, and subject to change for events occurring after such date.
Funds are not FDIC insured and are not guaranteed. It is possible to lose the principal amount invested. Mutual fund advisory services provided by Delaware Management Company, a series of Delaware Management Business Trust, which is a registered investment advisor. Delaware Investments, a member of Macquarie Group, refers to Delaware Management Holdings, Inc. and its subsidiaries, including the Fund’s distributor, Delaware Distributors, L.P. Macquarie Group refers to Macquarie Group Limited and its subsidiaries and affiliates worldwide.
© 2015 Delaware Management Holdings, Inc.
All third-party marks cited are the property of their respective owners.
Table of Contents
| Portfolio management review | ||
| Delaware Emerging Markets Fund | December 9, 2014 | |
Performance preview (for the year ended November 30, 2014)
Delaware Emerging Markets Fund (Class A shares) | 1-year return | -0.20% | ||||||
MSCI Emerging Markets Index (Gross) | 1-year return | +1.40% | ||||||
MSCI Emerging Markets Index (Net) | 1-year return | +1.06% |
Past performance does not guarantee future results.
For complete, annualized performance for Delaware Emerging Markets Fund, please see the table on page 10.
The performance of Class A shares excludes the applicable sales charge and reflects the reinvestment of all distributions. For a description of the index, please see page 12.
Index performance returns do not reflect any management fees, transaction costs, or expenses. Indices are unmanaged and one cannot invest directly in an index
Emerging market equities rose slightly during the fiscal year ended Nov. 30, 2014, although performance across countries varied significantly. Economic conditions in most emerging markets were soft. China, in particular, experienced a pronounced slowdown in growth, which weighed on Chinese equities and also on global commodity prices, such as iron ore and petrochemicals.
Elections drove market performance in India and Brazil. Indian equities rallied, as a better-than-expected showing from the Bharatiya Janata Party during the general election fueled optimism for growth-oriented reforms. Brazilian equities, meanwhile, were volatile, and declined sharply in recent months on news of the re-election of incumbent president Dilma Rousseff, disappointing investors who had hoped for a change in leadership and policies.
In Russia, equities declined as tensions with Ukraine led to economic sanctions from the United States and the European Union (EU), fund outflows, and currency depreciation.
Fund performance
For the fiscal year ended Nov. 30, 2014, Delaware Emerging Markets Fund (Class A shares) returned -0.20% at net asset value and -5.93% at maximum offer price (both figures reflect all distributions reinvested). For the same period, the Fund’s benchmark, the MSCI Emerging Markets Index (net), returned +1.06%. For complete,
annualized performance for Delaware Emerging Markets Fund, please see the table on page 10.
Among countries, South Korea, Israel, and the U.S. contributed to performance. In South Korea, the Fund’s overweight positions in wireless telecommunications operator SK Telecom and paints and building materials manufacturer KCC helped bolster performance. Shares of SK Telecom rose as subscribers upgraded to higher-value 4G LTE services and as new regulations raised expectations for less intense competition in the sector. Shares of KCC rose as its core building materials business benefited from a recovery in the domestic housing market. The Fund’s underweight position in Hyundai Motor was also favorable after investors reacted negatively to the company’s purchase of high-priced land.
In Israel, the Fund’s overweight position in global generic drug manufacturer Teva Pharmaceutical Industries contributed to performance. Shares rose in response to positive news about U.S. approval of a higher-dosage version of its drug Copaxone. Additionally, Teva’s relatively defensive business provided stability amid volatility in broader emerging markets.
Finally, within the U.S., shares of renewable energy solution provider SunEdison rose as the company increased its targets for solar project completions. Yahoo! outperformed on rising
1
Table of Contents
| Portfolio management review | ||
| Delaware Emerging Markets Fund | ||
valuation expectations for Alibaba Group, in which Yahoo! holds a significant stake.
In China, the Fund’s large overweight position in internet search provider Baidu contributed positively to performance. The company has maintained its dominance in the search market and demonstrated strong growth in its mobile search business. However, the Fund’s positions in online media company SINA and internet company Sohu.com detracted from performance, offsetting Baidu’s contribution. SINA has faced regulatory challenges regarding content on its video site, while Sohu.com’s gaming business slowed as key games reached maturity.
In Russia, the Fund’s overweight position detracted from overall relative performance. Economic sanctions from the U.S. and EU not only affected the share prices of companies specifically named, including Russia’s largest bank Sberbank and integrated oil company Rosneft, but also contributed broadly to fund outflows from the country in general. As a result, the Fund’s investments in Yandex, Russia’s largest local language search-engine provider, and X5 Retail Group, the nation’s leading food retailer, also underperformed despite what we view as each company’s strong fundamental business performance.
In India, sector positioning somewhat hindered overall relative performance, particularly with regard to the Fund’s underweight positions in the industrials, financials, and healthcare sectors.
Among sectors, healthcare contributed the most to the Fund’s performance, primarily due to a position in Teva Pharmaceutical. The industrials sector was also positive due to the Fund’s holdings in KCC in South Korea and airport operator Airports of Thailand. Shares of Airports of Thailand rose as Thai tourism benefited from a more stable political environment following the country’s military coup.
The technology sector detracted from performance, mainly due to the Fund’s positions in SINA and Sohu.com. The Fund’s underweight position in the financials sector also dragged on performance, particularly in China.
We remain positive about emerging market economies. We believe urbanization, technology, and policy reforms represent the critical drivers for income and consumption growth, and we believe potential economic growth in emerging markets may exceed growth in developed markets. Furthermore, we believe that valuations for emerging market equities may prove inexpensive if we are correct about these economies’ long-term growth potential.
Over the short term, we believe that equity markets may remain volatile. Key factors to monitor include the following:
• Policy reforms in China, India, and Brazil that may stimulate or hinder growth.
• Economic conditions in China, including the health of the property and banking sectors.
• Geopolitical tensions in the Middle East, Russia, and China.
• Movements in U.S. interest rates, which have the potential to affect fund flows and currencies.
We recognize that emerging markets consist of many different countries at different stages of development, each with its own unique set of circumstances. Moreover, we believe that individual company fundamentals and valuations matter more than macroeconomics and politics in determining long-term investment performance. In this vein, our strategy is to construct a portfolio on a stock-by-stock basis, with the objective of investing in companies with what we view as sustainable franchises that trade at significant discounts to our estimate of their intrinsic value.
2
Table of Contents
| Delaware Global Value Fund | December 9, 2014 | |
Performance preview (for the year ended November 30, 2014)
Delaware Global Value Fund (Class A shares) | 1-year return | +4.57% | ||||||
MSCI World Index (Gross) | 1-year return | +9.50% | ||||||
MSCI World Index (Net) | 1-year return | +8.91% |
Past performance does not guarantee future results.
For complete, annualized performance for Delaware Global Value Fund, please see the table on page 13.
The performance of Class A shares excludes the applicable sales charge and reflects the reinvestment of all distributions. For a description of the index, please see page 15.
Index performance returns do not reflect any management fees, transaction costs, or expenses. Indices are unmanaged and one cannot invest directly in an index.
Global equity markets offered mixed results during the fiscal year ended Nov. 30, 2014 with the U.S. economy consistently improving throughout the period, particularly when compared to other international equity markets.
The U.S. Federal Reserve ended its quantitative easing program in October, and prepared investors for a likely rise in short-term interest rates in 2015. The finish of the Fed’s tapering of stimulatory bond purchases approached without a corresponding slowing of economic growth or an alarmingly abrupt increase in interest rates. Equity market performance in the United States demonstrated a greater level of resilience than other international markets with the S&P 500® Index returning 16.86% for the fiscal year.
Japan’s economy continued to struggle in 2014. Although Prime Minister Shinzo Abe’s economic stimulus package, dubbed “Abenomics,” was developed to battle two decades of deflation and stagnant growth, the program continued to face difficulties. These challenges included the effect of yen depreciation on energy and raw material import costs, aging demographics, a declining population, and the highest debt to gross domestic product ratio in the developed world. In October, the Bank of Japan increased the annual target for enlarging the monetary base by 80 trillion yen with the hope that the move could potentially increase exports and stimulate inflation. Although the Japanese recovery appears stagnant
in the short term, there has been strong performance in some areas.
Among euro-zone investors, confidence in the region’s nascent recovery to surpass stall-speed clearly waned as disappointing economic data emerged in the third quarter of 2014 from Italy, France, and Germany, among others. As eyes turned to the European Central Bank in anticipation of stimulatory intervention, currency markets produced the most pronounced depreciation of the euro since 2012 (source: Thomson Reuters). Equity market performance skewed away from cyclical segments such as industrial and consumer stocks, leaving healthcare as the region’s sole source of positive returns.
Within emerging markets, China’s 10-year growth trajectory appeared to be waning. Much of China’s growth has been driven by excess investment in real estate, infrastructure, and industrials funded by debt. Many investors now question how much growth potential remains within the nation. In addition to weakening in China, other developments within emerging markets include the continued appreciation of the U.S. dollar, ongoing conflict in Ukraine, the depreciation of the Russian ruble, and overt conflict in Iraq and Syria. Though their relative significance is subject to interpretation, their collective impact seemed to adversely affect sentiment associated with emerging market stocks as risky assets. This
3
Table of Contents
| Portfolio management review | ||
| Delaware Global Value Fund | ||
sentiment also correlated with the pronounced weakening of commodity prices and associated stocks, especially in the energy sector.
Fund performance
For the fiscal year ended Nov. 30, 2014, Delaware Global Value Fund (Class A shares) returned +4.57% at net asset value and -1.47% at maximum offer price (both figures reflect Class A shares with all distributions reinvested). For the same period, the Fund’s benchmark MSCI World Index (net) returned +8.91%. For complete, annualized performance for Delaware Global Value Fund, please see the table on page 13.
On a regional basis, positive stock selection in the U.S. and Japan was more than offset by adverse stock selection in Canada, Russia, and the United Kingdom. From a sector perspective, strong stock selection in consumer discretionary and industrials was more than offset by weak stock selection in energy, materials, telecommunications, and consumer staples.
During the fiscal year, the largest detractors from the Fund’s relative performance during the fiscal year included the following:
• Mobile Telesystems: Mounting tensions between Russia and Ukraine, coupled with U.S.-and European Union-imposed sanctions on Russia, led to a dramatic decline in the value of the Russian ruble. These factors had an adverse effect on the company’s stock price, despite what we view as its strong operational performance and a healthy competitive position.
• Standard Chartered: Asia had been the growth engine of the U.K.-listed bank for the past decade, but recently the region was responsible for the bank’s second profit warning of the year, sending shares to a five-year low. We continue to hold the company’s shares in the Fund, as valuations are at a decade low, the absolute level of nonperforming loans remains low, and the bank’s Asian international trade and wealth management
franchises remain intact – and therefore appear positioned to benefit from any recovery in the region. There is also considerable scope for cost-cutting and rationalization, and the bank is now actively spoken of as a possible takeover target.
• Yamana Gold: The Toronto-based mining company suffered largely due to dramatic fluctuations in the price of gold. Yamana has operations and development projects in South and Central America. The company has indicated it is focused on growing profitably through the careful management of costs. Through the development of several new mines, the expansion of key producing assets and the acquisitions, Yamana’s gold output appears poised to rise in 2015.
• Halliburton: The stock price of this U.S. oil field service company retreated dramatically in conjunction with falling oil prices and the proposed merger with Baker Hughes. However, we believe that the proposed merger may create a more valuable entity that has the potential to more effectively compete internationally.
• Saipem: The company faced worsening market conditions driven by lower oil prices and shrinking exploration and production budgets, with new order intake expected to slow down. On a positive note, lower margin legacy contracts are drawing down. From a longer-term perspective, as the company progresses towards margin improvement and it maintains its competitiveness, we will continue to carefully monitor the stock as weakened market conditions may alter the pace of the recovery.
During the fiscal year, the largest contributors to the Fund’s performance during the fiscal year included the following:
• American Airlines Group: The company recently emerged from bankruptcy and merged with U.S. Airways. We believe American Airlines has a solid route structure, which may provide strong earnings growth. We also think the company could potentially benefit from an
4
Table of Contents
improved operating mix, adjusted cost structure, and lower oil prices.
• Mylan: The U.S. domiciled global generic and specialty pharmaceutical company posted recent results which showed both generic and specialty sales performing well with every geographic region posting positive growth.
• Apple: The consumer electronics manufacturer realized particularly strong gains during the Fund’s fiscal year. Recent quarterly sales growth for Apple was also positive in every region, primarily driven by China.
• Teva Pharmaceuticals Industries: The Israeli generic drug manufacturer saw strong gains after the introduction of a new formulation of its multiple sclerosis treatment drug, Copaxone, which is patent protected through 2030. This should help insulate Teva from generic competition. The company has also benefited from a strong cost-cutting program and a new management structure.
• Time Warner: This consumer discretionary stock also contributed strongly to the Fund’s relative return. In terms of revenue, Time Warner is currently the third largest television network and film TV and entertainment company in the world. Time Warner owns, what we consider, high-quality content and has pricing power in its Networks business. Combined with cost cutting and share buybacks, this has led, in our view, to impressive earnings growth.
We believe that successful value investing requires both a sharp attention to developing valuation disparities across industries and regions and a clear-eyed view to the varying levels of secular growth and cyclical mean reversion that may justify those disparities. Through the course of the fiscal year, we considered there to be attractive valuations to be found in both Europe and Japan, but with the caveats that European cyclical recovery and Japanese structural
improvements would likely be needed to support the expansion of those valuation metrics. The U.S., by contrast, after enjoying a longer and stronger market up-cycle has the most richly valued of the world’s major markets (source: MSCI). While this general pattern remains intact, the market’s performance in the interim has been far from uniform and has been complicated significantly by shifts in currency exchange rates.
The euro-zone’s weak overall returns mask considerable variation across the region, and though returns in U.S. dollars in the two largest markets, France and Germany, were down, local investors saw a moderate gain and therefore valuations changed little. Japan’s returns in yen put that country at the top of major market rankings for local-currency performance, but the index-level gain was actually outpaced by improvements in underlying fundamentals, which brought valuation levels down slightly. This pattern was not replicated in the U.S., where rising valuations accompanied the strong market gains.
For U.S. optimists, though these valuations appear well above historic median levels, they are still well below prior peaks and may reflect the greater stability and secular growth prospects this country enjoys versus many other developed as well as emerging markets. As global stock pickers, what we find intriguing is this: In an interconnected global market, domicile does not limit opportunity. If a European multinational trades at a recessionary valuation multiple but has competitive positions in the world’s strongest growth markets, that company’s investors should, in the long term, enjoy the benefits of both valuation and strong fundamentals. As global equity managers taking a contrarian approach to bottom-up stock selection, we strive to use the uncertainty of macroeconomic and valuation cycles to bring to light potential opportunities at the company level, because we believe it is there that close analysis is most critical to performance.
5
Table of Contents
| Portfolio management review | ||
| Delaware International Value Equity Fund | December 9, 2014 | |
Performance preview (for the year ended November 30, 2014)
Delaware International Value Equity Fund (Class A shares) | 1-year return | -4.13% | ||||||
MSCI EAFE Index (Gross) | 1-year return | +0.41% | ||||||
MSCI EAFE Index (Net) | 1-year return | -0.02% |
Past performance does not guarantee future results.
For complete, annualized performance for Delaware International Value Equity Fund, please see the table on page 17.
The performance of Class A shares excludes the applicable sales charge and reflects the reinvestment of all distributions. For a description of the index, please see page 19.
Index performance returns do not reflect any management fees, transaction costs, or expenses. Indices are unmanaged and one cannot invest directly in an index.
Global equity markets offered mixed results during the fiscal year ended Nov. 30, 2014 with the U.S. economy consistently improving throughout the period, particularly when compared to other international equity markets.
The U.S. Federal Reserve ended its quantitative easing program in October, and prepared investors for a likely rise in short-term interest rates in 2015. The finish of the Fed’s tapering of stimulatory bond purchases approached without a corresponding slowing of economic growth or an alarmingly abrupt increase in interest rates. Equity market performance in the United States demonstrated a greater level of resilience than other international markets with the S&P 500 Index returning 16.86% for the fiscal year.
Japan’s economy continued to struggle in 2014. Although Prime Minister Shinzo Abe’s economic stimulus package, dubbed “Abenomics” was developed to battle two decades of deflation and stagnant growth, the program continued to face difficulties. These challenges included the effect of yen depreciation on energy and raw material import costs, aging demographics, a declining population, and the highest debt to gross domestic product ratio in the developed world. In October, the Bank of Japan increased the annual target for enlarging the monetary base by 80 trillion yen with the hope that the move could potentially increase exports and stimulate inflation.
Although the Japanese recovery appears stagnant in the short term, there has been strong performance in some areas.
Among euro-zone investors, confidence in the region’s nascent recovery to surpass stall-speed clearly waned as disappointing economic data emerged in the third quarter of 2014 from Italy, France, and Germany, among others. As eyes turned to the European Central Bank in anticipation of stimulatory intervention, currency markets produced the most pronounced depreciation of the euro since 2012 (source: Thomson Reuters). Equity market performance skewed away from cyclical segments such as industrial and consumer stocks, leaving health care as the region’s sole source of positive returns.
Within emerging markets, China’s 10-year growth trajectory appears to be waning. Much of China’s growth has been driven by excess investment in real estate, infrastructure, and industrials funded by debt. Many investors now question how much growth potential remains within the nation. In addition to weakening in China, other developments within emerging markets include the continued appreciation of the U.S. dollar, ongoing conflict in Ukraine, the depreciation of the Russian ruble, and overt conflict in Iraq and Syria. Though their relative significance is subject to
6
Table of Contents
interpretation, their collective impact seemed to adversely affect sentiment associated with emerging market stocks as risky assets. This sentiment also correlated with the pronounced weakening of commodity prices and associated stocks, especially in the energy sector.
Fund performance
For the fiscal year ended Nov. 30, 2014, Delaware International Value Equity Fund (Class A shares) returned -4.13% at net asset value and -9.64% at maximum offer price (both figures reflect Class A shares with all distributions reinvested). For the same period, the Fund’s benchmark MSCI EAFE Index (net) returned -0.02%. For complete, annualized performance for Delaware International Value Equity Fund, please see the table on page 17.
From a regional standpoint, positive contributions to relative return came primarily from stocks in Israel and Switzerland but were more than offset by adverse stock selection in stocks chiefly in the United Kingdom and Russia. From a sector perspective, detractors to return came primarily from stocks in energy, consumer staples and telecommunications, which more than offset contributions from stocks in the consumer discretionary and healthcare sectors.
During the fiscal year, the largest detractors from the Fund’s relative performance included the following:
• Standard Chartered: Asia had been the growth engine of the U.K.-listed bank for the past decade, but recently the region was responsible for the bank’s second profit warning of the year, sending shares to a five-year low. We continue to hold the company’s shares in the Fund, as valuations are at a decade low, the absolute level of non-performing loans remains low and the bank’s Asian international trade and wealth management franchises remain intact – and therefore appear positioned to benefit from any recovery in the region. There is also considerable scope for cost-
cutting and rationalization, and the bank is now actively spoken of as a possible takeover target.
• Tesco: The company’s share price worsened during the fiscal year, as its competitive industry position was undermined by aggressively low-cost competition. Although we believe the company may have the resources to recover eventually, we chose to exit the position due to its eroding competitive position.
• Mobile Telesystems: Mounting tensions between Russia and Ukraine, coupled with U.S.-and European Union-imposed sanctions on Russia led to a dramatic decline in the value of the Russian ruble. These factors had an adverse effect on the company’s stock price, despite what we view as its strong operational performance and a healthy competitive position.
• Saipem: The company faced worsening market conditions driven by lower oil prices and shrinking exploration and production budgets with new order intake expected to slow down. On a positive note, lower margin legacy contracts are drawing down. From a longer-term perspective, as the company progresses towards margin improvement and if it maintains its competitiveness, we will continue to carefully monitor the stock as weakened market conditions may alter the pace of the recovery.
• Subsea 7: This subsea engineering, construction, and services company serves the offshore energy industry. Although the company’s recent results were above consensus, the stock price did not react strongly largely due to uncertainty regarding the award time of large contracts and a falling book-bill ratio. Subsea 7 is planning to change the organizational structure of the business to better align it to the company’s strategic priorities. The oil services industry is entering a challenging time – we think thoughtful reorganizations to address a changing industry could potentially help address rising costs and execution risks.
7
Table of Contents
| Performance management review | ||
| Delaware International Value Equity Fund | ||
During the fiscal year, the largest contributors to the Fund’s relative performance included the following:
• Teva Pharmaceutical Industries: The Israeli generic drug manufacturer saw strong gains after the introduction of a new formulation of its multiple sclerosis treatment drug, Copaxone, which is patent protected through 2030. This should help insulate Teva from generic competition. The company has also benefited from a strong cost-cutting program and a new management structure.
• Aryzta: This Swiss-based company became the largest bakery in the world after acquiring more bakeries in Germany and North America in the first half of 2014. Recently reported third-quarter revenues rose year-on-year nearly 17%. Management successfully completed its three-year “Aryzta Transformation Initiative,” which helped boost operating margins to 11.8%. This was the sixth consecutive year of margin expansion.
• Novartis: The Swiss-based pharmaceuticals group is expected to complete its transformation to a more focused business mix in 2015, and its three core areas have performed well this year.
• Teleperformance: Based in France, this company is a global leader in customer service, technical support, and call-center services. The price of its shares were strengthened by its solid sales performance. Recent results included consolidated organic growth and what we believe was a sharp pick-up in organic growth for the Ibero-Latam region.
• Bank Rakyat Indonesia Persero: This is the largest bank by loans and second largest by assets and deposits in Indonesia. Micro loans, small commercial loans, and consumer loans make up the biggest portion of the company’s loan book. We like Bank Rakyat Indonesia Persero because of its entrenched microfinancing, business, and above average return on equity.
We believe that successful value investing requires both a sharp attention to developing valuation disparities across industries and regions and a clear-eyed view to the varying levels of secular growth and cyclical mean reversion that may justify those disparities. Through the course of the fiscal year, we considered there to be attractive valuations in both Europe and Japan, but with the caveats that European cyclical recovery and Japanese structural improvements would likely be needed to support the expansion of those valuation metrics. The U.S., by contrast, after enjoying a longer and stronger market up-cycle, has the most richly valued of the world’s major markets (source: MSCI). While this general pattern remains intact, the market’s performance in the interim has been far from uniform and has been complicated significantly by shifts in currency exchange rates.
The euro-zone’s weak overall returns mask considerable variation across the region, and though returns in U.S. dollars in the two largest markets, France and Germany, were down, local investors saw a moderate gain and therefore valuations changed little. Japan’s returns in yen put that country at the top of major market rankings for local-currency performance, but the index-level gain was actually outpaced by improvements in underlying fundamentals, which brought valuation levels down slightly. This pattern was not replicated in the U.S., where rising valuations accompanied the strong market gains.
For U.S. optimists, though these valuations appear well above historic median levels, they are still well below prior peaks and may reflect the greater stability and secular growth prospects this country enjoys versus many other developed as well as emerging markets. As global stock pickers, what we find intriguing is this: In an interconnected global market, domicile does not limit opportunity. If a European multinational trades at a recessionary valuation multiple but has competitive positions in the world’s strongest
8
Table of Contents
growth markets, that company’s investors should, in the long term, enjoy the benefits of both valuation and strong fundamentals. As global equity managers taking a contrarian approach to bottom-up stock selection, we strive to use the uncertainty of macroeconomic and valuation cycles to bring to light potential opportunities at the company level, because we believe it is there that close analysis is most critical to performance.
9
Table of Contents
Delaware Emerging Markets Fund | November 30, 2014 |
The performance data quoted represent past performance; past performance does not guarantee future results. Investment return and principal value will fluctuate so your shares, when redeemed, may be worth more or less than their original cost. Please obtain the performance data current for the most recent month end by calling 800 523-1918 or visiting our website at delawareinvestments.com/performance. Current performance may be lower or higher than the performance data quoted.
Fund and benchmark performance1,2 | Average annual total returns through November 30, 2014 | |||||||
| 1 year | 5 years | 10 years | Lifetime | |||||
Class A (Est. June 10, 1996) | ||||||||
Excluding sales charge | -0.20% | +5.42% | +9.93% | n/a | ||||
Including sales charge | -5.93% | +4.17% | +9.28% | n/a | ||||
Class C (Est. June 10, 1996) | ||||||||
Excluding sales charge | -0.97% | +4.63% | +9.11% | n/a | ||||
Including sales charge | -1.96% | +4.63% | +9.11% | n/a | ||||
Class R (Est. Aug. 31, 2009) | ||||||||
Excluding sales charge | -0.44% | +5.14% | n/a | +7.35% | ||||
Including sales charge | -0.44% | +5.14% | n/a | +7.35% | ||||
Institutional Class (Est. June 10, 1996) | ||||||||
Excluding sales charge | +0.04% | +5.69% | +10.20% | n/a | ||||
Including sales charge | +0.04% | +5.69% | +10.20% | n/a | ||||
MCSI Emerging Markets Index (Gross) | +1.40% | +3.88% | +9.81% | n/a | ||||
MCSI Emerging Markets Index (Net) | +1.06% | +3.54% | +9.45% | n/a | ||||
1 Returns reflect the reinvestment of all distributions and are presented both with and without the applicable sales charges described below. Returns do not reflect the deduction of taxes the shareholder would pay on Fund distributions or redemptions of Fund shares.
Expense limitations were in effect for certain classes during some or all of the periods shown in the “Fund and benchmark performance” table. Expenses for each class are listed on the “Fund expense ratios” table on page 11. Performance would have been lower had expense limitations not been in effect.
Class A shares are sold with a maximum front-end sales charge of 5.75%, and have an annual distribution and service fee of 0.25% of average
daily net assets. Performance for Class A shares, excluding sales charges, assumes that no front-end sales charge applied.
Class C shares are sold with a contingent deferred sales charge of 1.00% if redeemed during the first
12 months. They are also subject to an annual distribution and service fee of 1.00% of average daily net assets. Performance for C shares, excluding sales charges, assumes either that contingent deferred sales charges did not apply or that the investment was not redeemed.
Class R shares are available only for certain retirement plan products. They are sold without a sales charge and have an annual distribution and service fee of 0.50% of average daily net assets.
10
Table of Contents
Institutional Class shares are available without sales or asset-based distribution charges only to certain eligible institutional accounts.
The “Fund and benchmark performance” table does not reflect the deduction of taxes the shareholder would pay on Fund distributions or redemptions of Fund shares.
International investments entail risks not ordinarily associated with U.S. investments including
fluctuation in currency values, differences in accounting principles, or economic or political instability in other nations.
Investing in emerging markets can be riskier than investing in established foreign markets due to increased volatility and lower trading volume.
2The Fund’s expense ratios, as described in the most recent prospectus, are disclosed in the following “Fund expense ratios” table.
Fund expense ratios | Class A | Class C | Class R | Institutional Class | ||||
Total annual operating expenses (without fee waivers) | 1.71% | 2.46% | 1.96% | 1.46% | ||||
Net expenses (including fee waivers, if any) | 1.71% | 2.46% | 1.96% | 1.46% | ||||
Type of waiver | n/a | n/a | n/a | n/a |
11
Table of Contents
| Performance summaries | ||
| Delaware Emerging Markets Fund | ||
Performance of a $10,000 investment1
Average annual total returns from Nov. 30, 2004, through Nov. 30, 2014
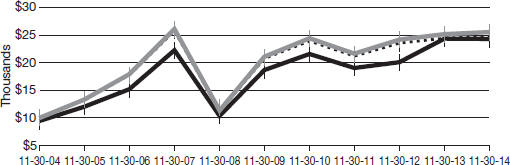
| For the period beginning Nov. 30, 2004, through Nov. 30, 2014 | Starting value | Ending value | ||||||||
| MSCI Emerging Markets Index (gross) | $10,000 | $25,485 | |||||||
| MSCI Emerging Markets Index (net) | $10,000 | $24,676 | |||||||
 | Delaware Emerging Markets Fund — Class A shares | $9,425 | $24,286 | |||||||


1 The “Performance of a $10,000 investment” graph assumes $10,000 invested in Class A shares of the Fund on Nov. 30, 2004, and includes the effect of a 5.75% front-end sales charge and the reinvestment of all distributions. The graph does not reflect the deduction of taxes the shareholders would pay on Fund distributions or redemptions of Fund shares. Expense limitations were in effect for some or all of the periods shown. Performance would have been lower had expense limitations not been in effect. Expenses are listed in the “Fund expense ratios” table on page 11. Please note additional details on pages 10 through 12.
The graph also assumes $10,000 invested in the MSCI Emerging Markets Index as of
Nov. 30, 2004. The MSCI Emerging Markets Index measures equity market performance across emerging market countries worldwide. Index “gross” return approximates the maximum possible dividend reinvestment. Index “net” return approximates the minimum possible dividend reinvestment, after deduction of withholding tax at the highest possible rate.
Index performance returns do not reflect any management fees, transaction costs, or expenses. Indices are unmanaged and one cannot invest directly in an index. Past performance is not a guarantee of future results.
Performance of other Fund classes will vary due to different charges and expenses.
| Nasdaq symbols | CUSIPs | |||||||
Class A | DEMAX | 245914841 | ||||||
Class C | DEMCX | 245914825 | ||||||
Class R | DEMRX | 245914569 | ||||||
Institutional Class | DEMIX | 245914817 | ||||||
12
Table of Contents
| Delaware Global Value Fund | November 30, 2014 |
The performance data quoted represent past performance; past performance does not guarantee future results. Investment return and principal value will fluctuate so your shares, when redeemed, may be worth more or less than their original cost. Please obtain the performance data current for the most recent month end by calling 800 523-1918 or visiting our website at delawareinvestments.com/performance. Current performance may be lower or higher than the performance data quoted.
Fund and benchmark performance1,2 | Average annual total returns through November 30, 2014 | |||||
| 1 year | 5 years | 10 years | ||||
Class A (Est. Dec. 19, 1997) | ||||||
Excluding sales charge | +4.57% | +8.79% | +5.97% | |||
Including sales charge | -1.47% | +7.51% | +5.34% | |||
Class C (Est. Sept. 28, 2001) | ||||||
Excluding sales charge | +3.80% | +7.98% | +5.18% | |||
Including sales charge | +2.80% | +7.98% | +5.18% | |||
Institutional Class (Est. Dec. 19, 1997) | ||||||
Excluding sales charge | +4.88% | +9.07% | +6.24% | |||
Including sales charge | +4.88% | +9.07% | +6.24% | |||
MCSI World Index (Gross) | +9.50% | +11.57% | +7.18% | |||
MCSI World Index (Net) | +8.91% | +10.96% | +6.60% | |||
1 Returns reflect the reinvestment of all distributions and are presented both with and without the applicable sales charges described below. Returns do not reflect the deduction of taxes the shareholder would pay on Fund distributions or redemptions of Fund shares.
Expense limitations were in effect for certain classes during some or all of the periods shown in the “Fund and benchmark performance” table. Expenses for each class are listed on the “Fund expense ratios” table on page 14. Performance would have been lower had expense limitations not been in effect.
Class A shares are sold with a maximum front-end sales charge of 5.75%, and have an annual distribution and service fee of 0.25% of average daily net assets. Performance for Class A shares, excluding sales charges, assumes that no front-end sales charge applied.
Class C shares are sold with a contingent deferred sales charge of 1.00% if redeemed during the first 12 months. They are also subject to an annual distribution and service fee of 1.00% of average daily net assets. Performance for Class C shares, excluding sales charges, assumes either that contingent deferred sales charges did not apply or that the investment was not redeemed.
Institutional Class shares are available without sales or asset-based distribution charges only to certain eligible institutional accounts.
The “Fund and benchmark performance” table does not reflect the deduction of taxes the shareholder would pay on Fund distributions or redemptions of Fund shares.
13
Table of Contents
| Performance summaries | ||
| Delaware Global Value Fund | ||
International investments entail risks not ordinarily associated with U.S. investments including fluctuation in currency values, differences in accounting principles, or economic or political instability in other nations.
Investing in emerging markets can be riskier than investing in established foreign markets due to increased volatility and lower trading volume.
Investments in small and/or medium-sized companies typically exhibit greater risk and higher volatility than larger, more established companies.
2The Fund’s expense ratios, as described in the most recent prospectus, are disclosed in the following “Fund expense ratios” table. Delaware Management Company has agreed to reimburse certain expenses and/or waive certain fees in order to prevent total fund operating expenses (excluding any 12b-1 fees, taxes, interest, short sale and dividend interest expenses, brokerage fees, certain insurance costs, acquired fund fees and expenses, and nonroutine expenses or costs, including, but not limited to, those relating to reorganizations, litigation, conducting shareholder meetings, and liquidations (collectively nonroutine expenses)) from exceeding 1.30% of the Fund’s average daily net assets during the period from Dec. 1. 2013 through Nov. 30, 2014.* Please see the most recent prospectus and any applicable supplement(s) for additional information on these fee waivers and/or reimbursements.
| Fund expense ratios | Class A | Class C | Institutional Class | |||
Total annual operating expenses (without fee waivers) | 1.78% | 2.53% | 1.53% | |||
Net expenses (including fee waivers, if any) | 1.55% | 2.30% | 1.30% | |||
Type of waiver | Contractual | Contractual | Contractual |
*The contractual waiver period is from March 29, 2013 through March 30, 2015.
14
Table of Contents
Performance of a $10,000 investment1
Average annual total returns from Nov. 30, 2004, through Nov. 30, 2014
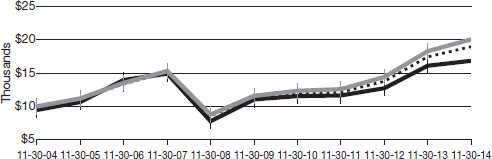
| For the period beginning Nov. 30, 2004, through Nov. 30, 2014 | Starting value | Ending value | ||||||
| $10,000 | $20,010 | ||||||
| $10,000 | $18,947 | ||||||
| $9,425 | $16,823 | ||||||
1 The “Performance of a $10,000 investment” graph assumes $10,000 invested in Class A shares of the Fund on Nov. 30, 2004, and includes the effect of a 5.75% front-end sales charge and the reinvestment of all distributions. The graph does not reflect the deduction of taxes the shareholders would pay on Fund distributions or redemptions of Fund shares. Expense limitations were in effect for some or all of the periods shown. Performance would have been lower had expense limitations not been in effect. Expenses are listed in the “Fund expense ratios” table on page 14. Please note additional details on pages 13 through 16.
The graph also assumes $10,000 invested in the MSCI World Index as of Nov. 30, 2004. The MSCI World Index is a free float-adjusted market capitalization weighted index designed to measure equity market performance across developed markets worldwide. Index “gross” return approximates the maximum possible dividend reinvestment. Index “net” return approximates the minimum possible dividend reinvestment, after
deduction of withholding tax at the highest possible rate.
The S&P 500 Index, mentioned on page 3, measures the performance of 500 mostly large-cap stocks weighted by market value, and is often used to represent performance of the U.S. stock market.
Index performance returns do not reflect any management fees, transaction costs, or expenses. Indices are unmanaged and one cannot invest directly in an index. Past performance is not a guarantee of future results.
Performance of other Fund classes will vary due to different charges and expenses.
15
Table of Contents
| Performance summaries | ||
| Delaware Global Value Fund | ||
| Nasdaq symbols | CUSIPs | |||||||
Class A | DABAX | 245914718 | ||||||
Class C | DABCX | 245914684 | ||||||
Institutional Class | DABIX | 245914676 | ||||||
16
Table of Contents
| Performance summaries | ||
| Delaware International Value Equity Fund | November 30, 2014 | |
The performance data quoted represent past performance; past performance does not guarantee future results. Investment return and principal value will fluctuate so your shares, when redeemed, may be worth more or less than their original cost. Please obtain the performance data current for the most recent month end by calling 800 523-1918 or visiting our website at delawareinvestments.com/performance. Current performance may be lower or higher than the performance data quoted.
| Fund and benchmark performance1,2 | Average annual total returns through November 30, 2014 | |||||
| 1 year | 5 years | 10 years | ||||
Class A (Est. Oct. 31, 1991) | ||||||
Excluding sales charge | -4.13% | +4.97% | +3.95% | |||
Including sales charge | -9.64% | +3.72% | +3.33% | |||
Class C (Est. Nov. 29, 1995) | ||||||
Excluding sales charge | -4.80% | +4.20% | +3.21% | |||
Including sales charge | -5.75% | +4.20% | +3.21% | |||
Class R (Est. June 2, 2003) | ||||||
Excluding sales charge | -4.37% | +4.72% | +3.73% | |||
Including sales charge | -4.37% | +4.72% | +3.73% | |||
Institutional Class (Est. Nov. 9, 1992) | ||||||
Excluding sales charge | -3.88% | +5.26% | +4.24% | |||
Including sales charge | -3.88% | +5.26% | +4.24% | |||
MCSI EAFE Index (Gross) | +0.41% | +6.86% | +5.73% | |||
MCSI EAFE Index (Net) | -0.02% | +6.38% | +5.25% | |||
1 Returns reflect the reinvestment of all distributions and are presented both with and without the applicable sales charges described below. Returns do not reflect the deduction of taxes the shareholder would pay on Fund distributions or redemptions of Fund shares.
Expense limitations were in effect for certain classes during some or all of the periods shown in the “Fund and benchmark performance” table. Expenses for each class are listed on the “Fund expense ratios” table on page 18. Performance would have been lower had expense limitations not been in effect.
Class A shares are sold with a maximum front-end sales charge of 5.75%, and have an annual
distribution and service fee of 0.25% of average daily net assets. Performance for Class A shares, excluding sales charges, assumes that no front-end sales charge applied.
Class C shares are sold with a contingent deferred sales charge of 1.00% if redeemed during the first 12 months. They are also subject to an annual distribution and service fee of 1.00% of average daily net assets. Performance for Class C shares, excluding sales charges, assumes either that contingent deferred sales charges did not apply or that the investment was not redeemed.
Class R shares are available only for certain retirement plan products. They are sold without a
17
Table of Contents
| Performance summaries | ||
| Delaware International Value Equity Fund | ||
sales charge and have an annual distribution and service fee of 0.50% of average daily net assets.
Institutional Class shares are available without sales or asset-based distribution charges only to certain eligible institutional accounts.
The “Fund and benchmark performance” table does not reflect the deduction of taxes the shareholder would pay on Fund distributions or redemptions of Fund shares.
International investments entail risks not ordinarily associated with U.S. investments including fluctuation in currency values, differences in accounting principles, or economic or political instability in other nations.
Investing in emerging markets can be riskier than investing in established foreign markets due to increased volatility and lower trading volume.
2The Fund’s expense ratios, as described in the most recent prospectus, are disclosed in the following “Fund expense ratios” table. Delaware Management Company has agreed to reimburse certain expenses and/or waive certain fees in order to prevent total fund operating expenses (excluding any 12b-1 fees, taxes, interest, short sale and dividend interest expenses, brokerage fees, certain insurance costs, acquired fund fees and expenses, and nonroutine expenses or costs, including, but not limited to, those relating to reorganizations, litigation, conducting shareholder meetings, and liquidations (collectively nonroutine expenses)) from exceeding 1.21% of the Fund’s average daily net assets during the period from Dec. 1, 2013 through Nov. 30, 2014.* Please see the most recent prospectus and any applicable supplement(s) for additional information on these fee waivers and/or reimbursements.
| Fund expense ratios | Class A | Class C | Class R | Institutional Class | ||||
Total annual operating expenses (without fee waivers) | 1.47% | 2.22% | 1.72% | 1.22% | ||||
Net expenses (including fee waivers, if any) | 1.46% | 2.21% | 1.71% | 1.21% | ||||
Type of waiver | Contractual | Contractual | Contractual | Contractual |
*The contractual waiver period is from March 29, 2013 through March 30, 2015.
18
Table of Contents
Performance of a $10,000 investment1
Average annual total returns from Nov. 30, 2004, through Nov. 30, 2014
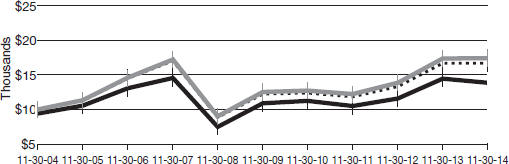
For the period beginning Nov. 30, 2004, through Nov. 30, 2014 | Starting value | Ending value | ||||||||
| MSCI EAFE Index (gross) | $10,000 | $17,457 | |||||||
| MSCI EAFE Index (net) | $10,000 | $16,681 | |||||||
| Delaware International Value Equity Fund — Class A shares | $9,425 | $13,878 | |||||||
1 The “Performance of a $10,000 investment” graph assumes $10,000 invested in Class A shares of the Fund on Nov. 30, 2004, and includes the effect of a 5.75% front-end sales charge and the reinvestment of all distributions. The graph does not reflect the deduction of taxes the shareholders would pay on Fund distributions or redemptions of Fund shares. Expense limitations were in effect for some or all of the periods shown. Performance would have been lower had expense limitations not been in effect. Current expenses are listed in the “Fund expense ratios” table on page 18. Please note additional details on pages 17 through 20.
The graph also assumes $10,000 invested in the MSCI EAFE Index as of Nov. 30, 2004. The MSCI EAFE Index measures equity market performance across developed market countries in Europe, Australasia, and the Far East. Index “gross” return approximates the maximum possible dividend reinvestment. Index “net” return approximates the minimum possible dividend reinvestment, after
deduction of withholding tax at the highest possible rate.
The S&P 500 Index, mentioned on page 6, measures the performance of 500 mostly large-cap stocks weighted by market value, and is often used to represent performance of the U.S. stock market.
Index performance returns do not reflect any management fees, transaction costs, or expenses. Indices are unmanaged and one cannot invest directly in an index. Past performance is not a guarantee of future results.
Performance of other Fund classes will vary due to different charges and expenses.
19
Table of Contents
Performance summaries
Delaware International Value Equity Fund
| Nasdaq symbols | CUSIPs | |||||||
Class A | DEGIX | 245914106 | ||||||
Class C | DEGCX | 245914858 | ||||||
Class R | DIVRX | 245914577 | ||||||
Institutional Class | DEQIX | 245914403 |
20
Table of Contents
This page intentionally left blank.
Table of Contents
For the six-month period from June 1, 2014 to November 30, 2014 (Unaudited)
As a shareholder of a Fund, you incur two types of costs: (1) transaction costs, including sales charges (loads) on purchase payments, reinvested dividends, or other distributions; redemption fees; and exchange fees; and (2) ongoing costs, including management fees; distribution and/or service (12b-1) fees; and other Fund expenses. These following examples are intended to help you understand your ongoing costs (in dollars) of investing in a Fund and to compare these costs with the ongoing costs of investing in other mutual funds.
The examples are based on an investment of $1,000 invested at the beginning of the period and held for the entire six-month period from June 1, 2014 to Nov. 30, 2014.
Actual expenses
The first section of the tables shown, “Actual Fund return,” provides information about actual account values and actual expenses. You may use the information in this section of the table, together with the amount you invested, to estimate the expenses that you paid over the period. Simply divide your account value by $1,000 (for example, an $8,600 account value divided by $1,000 = 8.6), then multiply the result by the number in the first section under the heading entitled “Expenses Paid During Period” to estimate the expenses you paid on your account during this period.
Hypothetical example for comparison purposes
The second section of the tables shown, “Hypothetical 5% return,” provides information about hypothetical account values and hypothetical expenses based on the Funds’ actual expense ratios and an assumed rate of return of 5% per year before expenses, which is not the Funds’ actual return. The hypothetical account values and expenses may not be used to estimate the actual ending account balance or expenses you paid for the period. You may use this information to compare the ongoing costs of investing in the Fund and other funds. To do so, compare this 5% hypothetical example with the 5% hypothetical examples that appear in the shareholder reports of the other funds.
Please note that the expenses shown in the tables are meant to highlight your ongoing costs only and do not reflect any transactional costs, such as sales charges (loads), redemption fees, or exchange fees. Therefore, the second section of each table is useful in comparing ongoing costs only, and will not help you determine the relative total costs of owning different funds. In addition, if these transactional costs were included, your costs would have been higher. The Funds’ expenses shown in the tables reflect fee waivers in effect. The expenses shown in each table assume reinvestment of all dividends and distributions.
22
Table of Contents
Delaware Emerging Markets Fund
Expense analysis of an investment of $1,000
| Beginning Account Value 6/1/14 | Ending Account Value 11/30/14 | Annualized Expense Ratio | Expenses Paid During Period 6/1/14 to 11/30/14* | |||||
Actual Fund return† | ||||||||
Class A | $1,000.00 | $971.60 | 1.70% | $8.40 | ||||
Class C | 1,000.00 | 968.00 | 2.45% | 12.09 | ||||
Class R | 1,000.00 | 970.60 | 1.95% | 9.63 | ||||
Institutional Class | 1,000.00 | 973.00 | 1.45% | 7.17 | ||||
Hypothetical 5% return (5% return before expenses) | ||||||||
Class A | $1,000.00 | $1,016.55 | 1.70% | $8.59 | ||||
Class C | 1,000.00 | 1,012.78 | 2.45% | 12.36 | ||||
Class R | 1,000.00 | 1,015.29 | 1.95% | 9.85 | ||||
Institutional Class | 1,000.00 | 1,017.80 | 1.45% | 7.33 | ||||
Delaware Global Value Fund Expense analysis of an investment of $1,000
| ||||||||
| Beginning Account Value 6/1/14 | Ending Account Value 11/30/14 | Annualized Expense Ratio | Expenses Paid During Period 6/1/14 to 11/30/14* | |||||
Actual Fund return† | ||||||||
Class A | $1,000.00 | $997.40 | 1.55% | $7.76 | ||||
Class C | 1,000.00 | 993.90 | 2.30% | 11.50 | ||||
Institutional Class | 1,000.00 | 999.20 | 1.30% | 6.52 | ||||
Hypothetical 5% return (5% return before expenses) | ||||||||
Class A | $1,000.00 | $1,017.30 | 1.55% | $7.84 | ||||
Class C | 1,000.00 | 1,013.54 | 2.30% | 11.61 | ||||
Institutional Class | 1,000.00 | 1,018.55 | 1.30% | 6.58 | ||||
23
Table of Contents
Disclosure of Fund expenses
For the six-month period from June 1, 2014 to November 30, 2014 (Unaudited)
Delaware International Value Equity Fund
Expense analysis of an investment of $1,000
| Beginning Account Value 6/1/14 | Ending Account Value 11/30/14 | Annualized Expense Ratio | Expenses Paid During Period 6/1/14 to 11/30/14* | |||||
Actual Fund return† | ||||||||
Class A | $1,000.00 | $922.30 | 1.43% | $6.89 | ||||
Class C | 1,000.00 | 919.00 | 2.18% | 10.49 | ||||
Class R | 1,000.00 | 920.70 | 1.68% | 8.09 | ||||
Institutional Class | 1,000.00 | 923.30 | 1.18% | 5.69 | ||||
Hypothetical 5% return (5% return before expenses) | ||||||||
Class A | $1,000.00 | $1,017.90 | 1.43% | $7.23 | ||||
Class C | 1,000.00 | 1,014.14 | 2.18% | 11.01 | ||||
Class R | 1,000.00 | 1,016.65 | 1.68% | 8.49 | ||||
Institutional Class | 1,000.00 | 1,019.15 | 1.18% | 5.97 | ||||
| * | “Expenses Paid During Period” are equal to the relevant Fund’s annualized expense ratio, multiplied by the average account value over the period, multiplied by 183/365 (to reflect the one-half year period). |
| † | Because actual returns reflect only the most recent six-month period, the returns shown may differ significantly from fiscal year returns. |
24
Table of Contents
| Security type / country and sector allocations | ||
Delaware Emerging Markets Fund | As of November 30, 2014 (Unaudited) | |
Sector designations may be different than the sector designations presented in other Fund materials. The sector designations may represent the investment manager’s internal sector classifications, which may result in the sector designations for one fund being different than another fund’s sector designations.
Security type / country | Percentage of net assets | |||||
Common Stock by Country | 94.65 | % | ||||
Argentina | 3.36 | % | ||||
Bahrain | 0.05 | % | ||||
Brazil | 15.21 | % | ||||
Canada | 0.02 | % | ||||
Chile | 0.85 | % | ||||
China/Hong Kong | 20.71 | % | ||||
Cyprus | 0.35 | % | ||||
France | 0.50 | % | ||||
India | 7.32 | % | ||||
Israel | 2.39 | % | ||||
Malaysia | 0.71 | % | ||||
Mexico | 6.39 | % | ||||
Peru | 0.42 | % | ||||
Poland | 0.73 | % | ||||
Republic of Korea | 19.73 | % | ||||
Russia | 6.00 | % | ||||
South Africa | 1.41 | % | ||||
Taiwan | 4.46 | % | ||||
Thailand | 1.55 | % | ||||
Turkey | 1.42 | % | ||||
United Kingdom | 0.06 | % | ||||
United States | 1.01 | % | ||||
Preferred Stock | 1.67 | % | ||||
Exchange-Traded Funds | 2.83 | % | ||||
Participation Notes | 0.00 | % | ||||
Short-Term Investments | 1.26 | % | ||||
Total Value of Securities | 100.41 | % | ||||
Liabilities Net of Receivables and Other Assets | (0.41 | %) | ||||
Total Net Assets | 100.00 | % | ||||
25
Table of Contents
| Security type / country and sector allocations | ||
| Delaware Emerging Markets Fund | ||
Common stock, participation notes and preferred stock by sector² | Percentage of net assets | |||||
Consumer Discretionary | 6.53 | % | ||||
Consumer Staples | 8.31 | % | ||||
Energy | 16.16 | % | ||||
Financials | 11.91 | % | ||||
Healthcare | 2.78 | % | ||||
Industrials | 5.78 | % | ||||
Information Technology* | 25.12 | % | ||||
Materials | 4.44 | % | ||||
Telecommunication Service | 14.97 | % | ||||
Utilities | 0.32 | % | ||||
Total | 96.32 | % | ||||
| ² | Narrow industries are utilized for compliance purposes for diversification whereas broad sectors are used for financial reporting. |
* To monitor compliance with the Fund’s concentration guidelines as described in the Fund’s Prospectus and Statement of Additional Information, the Information Technology sector (as disclosed herein for financial reporting purposes) is divided into various sub-categories or “industries,” in this case, electronics, internet, semiconductors, and software. As of Nov. 30, 2014, such amounts, as a percentage of total net assets, were 1.83%, 14.04%, 8.86%, and 0.39%, respectively. The percentage in any such single industry will comply with the Fund’s concentration policy even if the percentage in the “Information Technology sector” for financial reporting purposes may exceed 25%.
26
Table of Contents
| Delaware Global Value Fund | As of November 30, 2014 (Unaudited) | |
Sector designations may be different than the sector designations presented in other Fund materials. The sector designations may represent the investment manager’s internal sector classifications, which may result in the sector designations for one fund being different than another fund’s sector designations.
Security type / country | Percentage of net assets | |||||
Common Stock by Country | 97.59 | % | ||||
Australia | 1.27 | % | ||||
Canada | 5.55 | % | ||||
France | 6.27 | % | ||||
Germany | 0.76 | % | ||||
Indonesia | 1.24 | % | ||||
Israel | 2.98 | % | ||||
Italy | 2.71 | % | ||||
Japan | 9.78 | % | ||||
Netherlands | 3.36 | % | ||||
Russia | 1.21 | % | ||||
Sweden | 2.13 | % | ||||
Switzerland | 2.64 | % | ||||
United Kingdom | 6.16 | % | ||||
United States | 51.53 | % | ||||
Short-Term Investments | 2.43 | % | ||||
Securities Lending Collateral | 0.46 | % | ||||
Total Value of Securities | 100.48 | % | ||||
Obligation to Return Securities Lending Collateral | (0.46 | %) | ||||
Liabilities Net of Receivables and Other Assets | (0.02 | %) | ||||
Total Net Assets | 100.00 | % | ||||
27
Table of Contents
| Security type / country and sector allocations | ||
| Delaware Global Value Fund | ||
Common stock by sector | Percentage of net assets | |||||
Consumer Discretionary | 15.42 | % | ||||
Consumer Staples | 3.91 | % | ||||
Energy | 6.24 | % | ||||
Financials | 23.01 | % | ||||
Healthcare | 12.04 | % | ||||
Industrials | 16.48 | % | ||||
Information Technology | 13.20 | % | ||||
Materials | 1.57 | % | ||||
Telecommunication Services | 5.04 | % | ||||
Utilities | 0.68 | % | ||||
Total | 97.59 | % | ||||
28
Table of Contents
| Delaware International Value Equity Fund | As of November 30, 2014 (Unaudited) |
Sector designations may be different than the sector designations presented in other Fund materials. The sector designations may represent the investment manager’s internal sector classifications, which may result in the sector designations for one fund being different than another fund’s sector designations.
Security type / country | Percentage of net assets | |||||
Common Stock by Country | 98.33 | % | ||||
Australia | 1.39 | % | ||||
Canada | 8.17 | % | ||||
China/Hong Kong | 5.46 | % | ||||
Denmark | 2.02 | % | ||||
France | 20.04 | % | ||||
Germany | 4.96 | % | ||||
Indonesia | 1.38 | % | ||||
Israel | 4.71 | % | ||||
Italy | 3.14 | % | ||||
Japan | 18.32 | % | ||||
Netherlands | 4.60 | % | ||||
Norway | 0.19 | % | ||||
Russia | 1.43 | % | ||||
Sweden | 5.58 | % | ||||
Switzerland | 7.29 | % | ||||
United Kingdom | 9.65 | % | ||||
Short-Term Investments | 1.43 | % | ||||
Securities Lending Collateral | 3.83 | % | ||||
Total Value of Securities | 103.59 | % | ||||
Obligation to Return Securities Lending Collateral | (3.83 | %) | ||||
Receivables and Other Assets Net of Liabilities | 0.24 | % | ||||
Total Net Assets | 100.00 | % | ||||
29
Table of Contents
| Security type / country and sector allocations | ||
| Delaware International Value Equity Fund | ||
Common stock by sector | Percentage of net assets | |||||
Consumer Discretionary | 15.44 | % | ||||
Consumer Staples | 6.40 | % | ||||
Energy | 6.20 | % | ||||
Financials | 18.69 | % | ||||
Healthcare | 13.76 | % | ||||
Industrials | 14.55 | % | ||||
Information Technology | 9.66 | % | ||||
Materials | 6.13 | % | ||||
Telecommunication Services | 6.21 | % | ||||
Utilities | 1.29 | % | ||||
Total | 98.33 | % | ||||
30
Table of Contents
| Schedules of investments | ||
| Delaware Emerging Markets Fund | November 30, 2014 | |
| Number of shares | Value (U.S. $) | |||||||
| ||||||||
Common Stock – 94.65%D | ||||||||
| ||||||||
Argentina – 3.36% | ||||||||
Arcos Dorados Holdings Class A @ | 3,864,818 | $ | 25,546,447 | |||||
Cresud ADR @ | 1,442,769 | 17,010,246 | ||||||
Grupo Clarin Class B GDR 144A #@= | 353,200 | 4,100,234 | ||||||
IRSA Inversiones y Representaciones ADR @ | 867,000 | 15,302,550 | ||||||
MercadoLibre | 198,000 | 27,906,120 | ||||||
Pampa Energia ADR † | 95,300 | 1,073,078 | ||||||
YPF ADR | 400,000 | 13,376,000 | ||||||
|
| |||||||
| 104,314,675 | ||||||||
|
| |||||||
Bahrain – 0.05% | ||||||||
Aluminum Bahrain ADR 144A #@ | 221,400 | 1,585,423 | ||||||
|
| |||||||
| 1,585,423 | ||||||||
|
| |||||||
Brazil – 15.21% | ||||||||
AES Tiete | 597,480 | 3,723,407 | ||||||
America Latina Logistica | 5,000,000 | 11,847,926 | ||||||
B2W Cia Digital @† | 5,402,365 | 59,964,283 | ||||||
Banco Santander Brasil ADR | 4,615,300 | 26,861,046 | ||||||
Brasil Foods ADR | 1,500,000 | 39,015,000 | ||||||
Braskem ADR | 321,033 | 4,812,285 | ||||||
Centrais Eletricas Brasileiras | 2,140,204 | 5,088,078 | ||||||
Cia Siderurgica Nacional ADR | 1,200,000 | 2,796,000 | ||||||
Fibria Celulose ADR † | 888,900 | 10,497,909 | ||||||
Gerdau @ | 2,764,900 | 9,741,293 | ||||||
Gol Linhas Aereas Inteligentes ADR | 4,800,000 | 27,600,000 | ||||||
Hypermarcas † | 5,200,000 | 35,263,168 | ||||||
Itau Unibanco Holding ADR | 4,100,000 | 61,746,000 | ||||||
Petroleo Brasileiro ADR | 8,900,000 | 86,508,000 | ||||||
Telefonica Brasil ADR | 1,470,363 | 30,230,663 | ||||||
Tim Participacoes ADR | 2,300,000 | 56,005,000 | ||||||
|
| |||||||
| 471,700,058 | ||||||||
|
| |||||||
Canada – 0.02% | ||||||||
Gran Tierra Energy † | 134,900 | 515,318 | ||||||
|
| |||||||
| 515,318 | ||||||||
|
| |||||||
Chile – 0.85% | ||||||||
Sociedad Quimica y Minera de Chile ADR | 1,049,534 | 26,448,257 | ||||||
|
| |||||||
| 26,448,257 | ||||||||
|
| |||||||
China/Hong Kong – 20.71% | ||||||||
Baidu ADR † | 600,000 | 147,066,000 | ||||||
China Mengniu Dairy | 4,060,000 | 16,465,332 | ||||||
China Mobile | 3,500,000 | 43,124,347 | ||||||
China Mobile ADR | 852,800 | 52,634,816 | ||||||
China Petroleum & Chemical | 38,000,000 | 31,115,811 | ||||||
31
Table of Contents
Schedules of investments |
Delaware Emerging Markets Fund |
| Number of shares | Value (U.S. $) | |||||||
| ||||||||
Common StockD (continued) | ||||||||
| ||||||||
China/Hong Kong (continued) | ||||||||
China Telecom | 15,044,000 | $ | 9,117,693 | |||||
CNOOC ADR | 100,000 | 14,393,000 | ||||||
Fosun International | 2,886,500 | 3,524,888 | ||||||
Guangshen Railway | 11,000,000 | 4,751,834 | ||||||
Hollysys Automation Technologies † | 550,000 | 14,030,500 | ||||||
Kunlun Energy | 12,000,000 | 12,982,759 | ||||||
PetroChina Class H | 36,000,000 | 39,041,122 | ||||||
Qunar Cayman Islands ADR † | 236,682 | 6,172,667 | ||||||
Shanda Games ADR @† | 1,768,490 | 11,583,609 | ||||||
SINA † | 1,600,000 | 60,720,000 | ||||||
Sinofert Holdings † | 7,324,000 | 1,274,987 | ||||||
Sinotrans | 15,326,332 | 11,561,599 | ||||||
Sohu.com @† | 1,550,000 | 78,445,500 | ||||||
Tianjin Development Holdings @ | 15,559,550 | 12,199,005 | ||||||
Tom Group † | 5,428,000 | 1,154,908 | ||||||
Travelsky Technology | 572,000 | 641,710 | ||||||
Uni-President China Holdings @ | 46,917,600 | 41,321,901 | ||||||
Weibo ADR † | 58,939 | 1,057,955 | ||||||
Youku Tudou ADR † | 1,500,000 | 27,750,000 | ||||||
|
| |||||||
| 642,131,943 | ||||||||
|
| |||||||
Cyprus – 0.35% | ||||||||
QIWI ADR | 385,284 | 10,726,307 | ||||||
|
| |||||||
| 10,726,307 | ||||||||
|
| |||||||
France – 0.50% | ||||||||
Sanofi ADR | 250,000 | 12,072,500 | ||||||
Vallourec | 99,235 | 3,293,205 | ||||||
|
| |||||||
| 15,365,705 | ||||||||
|
| |||||||
India – 7.32% | ||||||||
ICICI Bank | 1,100,000 | 31,021,379 | ||||||
Indiabulls Infrastructure and Power GDR † | 300,961 | 16,974 | ||||||
Indiabulls Real Estate GDR † | 102,021 | 134,362 | ||||||
Reliance Capital | 1,800,000 | 15,204,951 | ||||||
Reliance Communications † | 10,114,849 | 16,738,848 | ||||||
Reliance Industries | 6,400,000 | 102,013,181 | ||||||
Reliance Industries GDR 144A # | 1,451,526 | 46,231,103 | ||||||
Tata Chemicals | 2,198,589 | 15,451,264 | ||||||
|
| |||||||
| 226,812,062 | ||||||||
|
| |||||||
Israel – 2.39% | ||||||||
Teva Pharmaceutical Industries ADR | 1,300,000 | 74,074,000 | ||||||
|
| |||||||
| 74,074,000 | ||||||||
|
| |||||||
32
Table of Contents
| Number of shares | Value (U.S. $) | |||||||
| ||||||||
Common StockD (continued) |
| |||||||
Malaysia – 0.71% | ||||||||
Hong Leong Bank @ | 3,059,889 | $ | 12,936,116 | |||||
UEM Sunrise @ | 17,000,000 | 9,046,563 | ||||||
|
| |||||||
| 21,982,679 | ||||||||
|
| |||||||
Mexico – 6.39% | ||||||||
America Movil Series L ADR | 1,600,000 | 37,936,000 | ||||||
Cemex ADR † | 2,600,000 | 32,526,000 | ||||||
Empresas ICA † | 4,500,000 | 6,604,384 | ||||||
Fomento Economico Mexicano ADR | 146,122 | 14,179,679 | ||||||
Grupo Financiero Santander Mexico Class B ADR | 2,000,000 | 22,860,000 | ||||||
Grupo Lala | 2,724,000 | 5,647,482 | ||||||
Grupo Televisa ADR | 2,100,000 | 78,435,000 | ||||||
|
| |||||||
| 198,188,545 | ||||||||
|
| |||||||
Peru – 0.42% | ||||||||
Cia de Minas Buenaventura ADR | 1,400,000 | 12,950,000 | ||||||
|
| |||||||
| 12,950,000 | ||||||||
|
| |||||||
Poland – 0.73% | ||||||||
Jastrzebska Spolka Weglowa † | 254,155 | 1,579,260 | ||||||
Orange Polska | 7,500,000 | 21,160,993 | ||||||
|
| |||||||
| 22,740,253 | ||||||||
|
| |||||||
Republic of Korea – 19.73% | ||||||||
Daum Communications | 60,000 | 7,907,645 | ||||||
E-Mart | 90,000 | 17,788,159 | ||||||
Hite Jinro | 680,000 | 15,425,389 | ||||||
Hyundai Motor | 58,500 | 9,407,511 | ||||||
KB Financial Group ADR | 1,138,755 | 39,776,712 | ||||||
KCC @ | 118,000 | 58,411,643 | ||||||
KT ADR | 1,366,539 | 20,170,116 | ||||||
LG Display ADR † | 21,331 | 326,791 | ||||||
LG Electronics | 250,000 | 14,284,431 | ||||||
LG Uplus | 1,840,040 | 17,935,885 | ||||||
Lotte Chilsung Beverage @ | 21,718 | 31,998,491 | ||||||
Lotte Confectionery @ | 10,226 | 18,282,041 | ||||||
Samsung Electronics | 130,513 | 150,903,091 | ||||||
Samsung Life Insurance | 500,000 | 54,801,905 | ||||||
Shinhan Financial Group | 400,000 | 17,824,095 | ||||||
SK Innovation | 594,923 | 45,804,421 | ||||||
SK Telecom ADR | 3,204,700 | 90,789,151 | ||||||
|
| |||||||
| 611,837,477 | ||||||||
|
| |||||||
Russia – 6.00% | ||||||||
Chelyabinsk Zinc Plant GDR @† | 143,300 | 590,898 | ||||||
33
Table of Contents
Schedules of investments
Delaware Emerging Markets Fund
| Number of shares | Value (U.S. $) | |||||||
| ||||||||
Common StockD (continued) |
| |||||||
Russia (continued) | ||||||||
Enel OGK-5 GDR | 21,161 | $ | 18,135 | |||||
Etalon Group GDR 144A #@= | 1,616,300 | 4,590,292 | ||||||
Gazprom ADR | 4,000,000 | 23,380,000 | ||||||
LUKOIL ADR | 170,000 | 7,777,500 | ||||||
LUKOIL ADR (London International Exchange) | 99,144 | 4,614,162 | ||||||
MegaFon GDR | 450,000 | 9,292,500 | ||||||
Mobile Telesystems ADR | 1,100,000 | 13,442,000 | ||||||
Rosneft GDR | 7,730,000 | 36,601,550 | ||||||
Sberbank of Russia @= | 12,000,000 | 17,207,502 | ||||||
Sberbank of Russia ADR | 1,400,000 | 8,611,400 | ||||||
Surgutneftegas ADR | 500,000 | 2,942,500 | ||||||
TGK-5 =† | 35,084,000 | 895 | ||||||
X5 Retail Group GDR † | 526,952 | 9,274,355 | ||||||
Yandex Class A † | 1,915,000 | 47,721,800 | ||||||
|
| |||||||
| 186,065,489 | ||||||||
|
| |||||||
South Africa – 1.41% | ||||||||
Sasol | 400,000 | 16,676,143 | ||||||
Sun International | 290,543 | 3,215,757 | ||||||
Tongaat Hulett @ | 838,307 | 13,099,091 | ||||||
Vodacom Group | 900,000 | 10,800,325 | ||||||
|
| |||||||
| 43,791,316 | ||||||||
|
| |||||||
Taiwan – 4.46% | ||||||||
Hon Hai Precision Industry | 13,552,000 | 42,400,542 | ||||||
MediaTek | 3,000,000 | 44,995,646 | ||||||
Taiwan Semiconductor Manufacturing | 7,000,000 | 31,948,521 | ||||||
United Microelectronics | 43,000,000 | 19,070,735 | ||||||
|
| |||||||
| 138,415,444 | ||||||||
|
| |||||||
Thailand – 1.55% | ||||||||
Airports of Thailand-Foreign | 4,000,000 | 33,840,536 | ||||||
Bangkok Bank-Foreign | 2,300,000 | 14,138,770 | ||||||
|
| |||||||
| 47,979,306 | ||||||||
|
| |||||||
Turkey – 1.42% | ||||||||
Turk Telekomunikasyon | 951,192 | 3,042,649 | ||||||
Turkcell Iletisim Hizmetleri ADR † | 2,000,000 | 31,740,000 | ||||||
Turkiye Sise ve Cam Fabrikalari | 5,781,095 | 9,194,118 | ||||||
|
| |||||||
| 43,976,767 | ||||||||
|
| |||||||
United Kingdom – 0.06% | ||||||||
Griffin Mining @† | 3,056,187 | 1,708,915 | ||||||
|
| |||||||
| 1,708,915 | ||||||||
|
| |||||||
United States – 1.01% | ||||||||
SunEdison † | 251,600 | 5,447,140 | ||||||
34
Table of Contents
| Number of shares | Value (U.S. $) | |||||||
| ||||||||
Common StockD (continued) |
| |||||||
United States (continued) | ||||||||
Yahoo † | 500,000 | $ | 25,870,000 | |||||
|
| |||||||
| 31,317,140 | ||||||||
|
| |||||||
Total Common Stock (cost $2,877,877,269) | 2,934,627,079 | |||||||
|
| |||||||
| ||||||||
Preferred Stock – 1.67%D |
| |||||||
Brazil – 0.40% | ||||||||
Braskem Class A 3.14% | 1,049,994 | 7,914,291 | ||||||
Usinas Siderurgicas de Minas Gerais SA† | 2,132,600 | 4,313,656 | ||||||
|
| |||||||
| 12,227,947 | ||||||||
|
| |||||||
Republic of Korea – 0.72% | ||||||||
Samsung Electronics 1.39% | 23,662 | 22,299,378 | ||||||
|
| |||||||
| 22,299,378 | ||||||||
|
| |||||||
Russia – 0.55% | ||||||||
AK Transneft=† | 7,239 | 17,125,906 | ||||||
|
| |||||||
| 17,125,906 | ||||||||
|
| |||||||
Total Preferred Stock (cost $31,297,871) | 51,653,231 | |||||||
|
| |||||||
| ||||||||
Exchange-Traded Funds – 2.83% |
| |||||||
iShares MSCI Emerging Markets | 1,700,000 | 70,550,000 | ||||||
iShares MSCI Turkey | 300,500 | 17,332,840 | ||||||
|
| |||||||
Total Exchange-Traded Funds (cost $84,714,326) | 87,882,840 | |||||||
|
| |||||||
| ||||||||
Participation Notes – 0.00% |
| |||||||
Lehman Indian Oil | ||||||||
CW 12 LEPO 144A 0.00% 11/5/12 #= | 172,132 | 0 | ||||||
Lehman Oil & Natural Gas | ||||||||
CW 12 LEPO 144A 0.00% 10/30/12 #= | 254,590 | 0 | ||||||
|
| |||||||
Total Participation Notes (cost $8,559,056) | 0 | |||||||
|
| |||||||
35
Table of Contents
Schedules of investments
Delaware Emerging Markets Fund
| Principal amount° | Value (U.S. $) | |||||||
| ||||||||
Short-Term Investments – 1.26% |
| |||||||
Repurchase Agreements – 1.26% | ||||||||
Bank of America Merrill Lynch | ||||||||
0.05%, dated 11/28/14, to be repurchased on 12/1/14, repurchase price $13,790,466 (collateralized by U.S. government obligations 0.00%–1.375% | ||||||||
4/15/16–2/15/43 market value $14,066,218) | 13,790,408 | $ | 13,790,408 | |||||
Bank of Montreal | ||||||||
0.08%, dated 11/28/14, to be repurchased on 12/1/14, repurchase price $4,596,833 (collateralized by U.S. government obligations 0.25%–11.25% | ||||||||
11/30/14–2/15/22 market value $4,688,743) | 4,596,803 | 4,596,803 | ||||||
BNP Paribas | ||||||||
0.09%, dated 11/28/14, to be repurchased on 12/1/14, repurchase price $20,725,944 (collateralized by U.S. government obligations 0.00%–3.625% | ||||||||
12/26/14–2/15/21 market value $21,140,307) | 20,725,789 | 20,725,789 | ||||||
|
| |||||||
Total Short-Term Investments (cost $39,113,000) | 39,113,000 | |||||||
|
| |||||||
Total Value of Securities – 100.41% | $ | 3,113,276,150 | ||||||
|
| |||||||
| # | Security exempt from registration under Rule 144A of the Securities Act of 1933, as amended. At Nov. 30, 2014, the aggregate value of Rule 144A securities was $56,507,052, which represents 1.82% of the Fund’s net assets. See Note 11 in “Notes to financial statements.” |
| @ | Illiquid security. At Nov. 30, 2014, the aggregate value of illiquid securities was $444,672,043, which represents 14.34% of the Fund’s net assets. See Note 11 in “Notes to financial statements.” |
| = | Security is being fair valued in accordance with the Fund’s fair valuation policy. At November 30, 2014, the aggregate value of fair valued securities was $43,024,829, which represents 1.39% of the Fund’s net assets. See Note 1 in “Notes to financial statements.” |
| ° | Principal amount shown is stated in U.S. dollars unless noted that the security is denominated in another currency. |
| † | Non-income-producing security. |
| D | Securities have been classified by country of origin. Aggregate classification by business sectors has been presented on page 24 in “Security type / country and sector allocations.” |
36
Table of Contents
The following foreign currency exchange contracts were outstanding at Nov. 30, 2014:1
Foreign Currency Exchange Contracts
Counterparty | Contracts to Receive (Deliver) | In Exchange | Settlement Date | Unrealized Appreciation (Depreciation) | ||||||||||||||
BNYM | BRL | (117,508 | ) | USD | 45,662 | 12/1/14 | $ | (96 | ) | |||||||||
BNYM | KRW | (8,868,454,189 | ) | USD | 8,023,692 | 12/1/14 | 57,454 | |||||||||||
|
| |||||||||||||||||
| $ | 57,358 | |||||||||||||||||
|
| |||||||||||||||||
The use of foreign currency exchange contracts involves elements of market risk and risks in excess of the amounts disclosed in the financial statements. The foreign currency exchange contracts presented above represents the Fund’s total exposure in such contracts, whereas only the net unrealized appreciation (depreciation) is reflected in the Fund’s net assets.
1See Note 8 in “Notes to financial statements.”
Summary of abbreviations:
ADR – American Depositary Receipt
BNYM – Bank of New York Mellon
BRL – Brazilian Real
GDR – Global Depositary Receipt
KRW – South Korean Won
LEPO – Low Exercise Price Option
USD – United States Dollar
See accompanying notes, which are an integral part of the financial statements.
37
Table of Contents
| Schedules of investments | ||||
Delaware Global Value Fund | November 30, 2014 |
| Number of shares | Value (U.S. $) | |||||||
| ||||||||
Common Stock – 97.59%D | ||||||||
| ||||||||
Australia – 1.27% | ||||||||
Coca–Cola Amatil | 40,341 | $ | 313,889 | |||||
|
| |||||||
| 313,889 | ||||||||
|
| |||||||
Canada – 5.55% | ||||||||
CGI Group Class A † | 20,043 | 730,430 | ||||||
Suncor Energy | 6,900 | 217,853 | ||||||
WestJet Airlines @ | 10,802 | 305,067 | ||||||
Yamana Gold | 32,202 | 116,284 | ||||||
|
| |||||||
| 1,369,634 | ||||||||
|
| |||||||
France – 6.27% | ||||||||
AXA | 17,429 | 421,136 | ||||||
Sanofi * | 5,571 | 539,834 | ||||||
Total | 5,240 | 293,400 | ||||||
Vinci * | 5,379 | 291,041 | ||||||
|
| |||||||
| 1,545,411 | ||||||||
|
| |||||||
Germany – 0.76% | ||||||||
Stada Arzneimittel | 5,227 | 188,392 | ||||||
|
| |||||||
| 188,392 | ||||||||
|
| |||||||
Indonesia – 1.24% | ||||||||
Bank Rakyat Indonesia Persero | 322,931 | 304,964 | ||||||
|
| |||||||
| 304,964 | ||||||||
|
| |||||||
Israel – 2.98% | ||||||||
Teva Pharmaceutical Industries ADR | 12,900 | 735,042 | ||||||
|
| |||||||
| 735,042 | ||||||||
|
| |||||||
Italy – 2.71% | ||||||||
Saipem † | 15,858 | 227,162 | ||||||
UniCredit | 59,687 | 441,615 | ||||||
|
| |||||||
| 668,777 | ||||||||
|
| |||||||
Japan – 9.78% | ||||||||
East Japan Railway | 5,100 | 382,328 | ||||||
ITOCHU | 26,653 | 306,775 | ||||||
Mitsubishi UFJ Financial Group | 35,854 | 207,366 | ||||||
Nippon Telegraph & Telephone | 7,868 | 421,045 | ||||||
Nitori Holdings | 6,514 | 361,157 | ||||||
Sumitomo Rubber Industries | 26,400 | 402,184 | ||||||
Toyota Motor | 5,350 | 329,709 | ||||||
|
| |||||||
| 2,410,564 | ||||||||
|
| |||||||
Netherlands – 3.36% | ||||||||
ING Groep CVA † | 37,271 | 546,423 | ||||||
Koninklijke Philips | 9,377 | 283,059 | ||||||
|
| |||||||
| 829,482 | ||||||||
|
| |||||||
38
Table of Contents
| Number of shares | Value (U.S. $) | |||||||
| ||||||||
Common StockD (continued) | ||||||||
| ||||||||
Russia – 1.21% | ||||||||
Mobile Telesystems ADR | 24,400 | $ | 298,168 | |||||
|
| |||||||
| 298,168 | ||||||||
|
| |||||||
Sweden – 2.13% | ||||||||
Tele2 Class B | 40,468 | 523,976 | ||||||
|
| |||||||
| 523,976 | ||||||||
|
| |||||||
Switzerland – 2.64% | ||||||||
Aryzta † | 8,155 | 651,150 | ||||||
|
| |||||||
| 651,150 | ||||||||
|
| |||||||
United Kingdom – 6.16% | ||||||||
Meggitt | 47,588 | 374,395 | ||||||
National Grid | 11,467 | 166,800 | ||||||
Playtech | 21,254 | 213,423 | ||||||
Rio Tinto | 5,782 | 270,630 | ||||||
Standard Chartered | 33,626 | 492,862 | ||||||
|
| |||||||
| 1,518,110 | ||||||||
|
| |||||||
United States – 51.53% | ||||||||
American Airlines Group | 11,300 | 548,389 | ||||||
American Express | 2,600 | 240,292 | ||||||
Apple | 8,400 | 999,012 | ||||||
Caterpillar | 6,100 | 613,660 | ||||||
Cintas | 5,800 | 424,270 | ||||||
Delphi Automotive | 6,000 | 437,700 | ||||||
Goldman Sachs Group | 3,700 | 697,117 | ||||||
Halliburton | 11,500 | 485,300 | ||||||
International Business Machines | 1,700 | 275,689 | ||||||
Johnson & Johnson | 4,700 | 508,775 | ||||||
JPMorgan Chase | 9,400 | 565,504 | ||||||
Lowe’s | 8,800 | 561,704 | ||||||
Mylan † | 9,500 | 556,795 | ||||||
NASDAQ OMX Group | 14,100 | 633,231 | ||||||
National Oilwell Varco | 4,700 | 315,088 | ||||||
Omnicom Group | 5,500 | 424,985 | ||||||
Oracle | 14,800 | 627,668 | ||||||
Pfizer | 14,100 | 439,215 | ||||||
Target | 4,000 | 296,000 | ||||||
Time Warner | 6,200 | 527,744 | ||||||
Travelers | 4,900 | 511,805 | ||||||
Viacom Class B | 6,100 | 461,343 | ||||||
Wells Fargo | 11,200 | 610,176 | ||||||
39
Table of Contents
Schedules of investments
Delaware Global Value Fund
Number of shares | Value (U.S. $) | |||||||
| ||||||||
Common StockD (continued) | ||||||||
| ||||||||
United States (continued) | ||||||||
WESCO International *† | 6,500 | $ | 535,535 | |||||
Western Union | 22,000 | 408,760 | ||||||
|
| |||||||
| 12,705,757 | ||||||||
|
| |||||||
Total Common Stock (cost $20,088,547) | 24,063,316 | |||||||
|
| |||||||
| Principal amount° | ||||||||
| ||||||||
Short-Term Investments – 2.43% | ||||||||
| ||||||||
Discount Notes – 1.13%≠ | ||||||||
Federal Home Loan Bank | ||||||||
0.065% 1/14/15 | 40,513 | 40,511 | ||||||
0.065% 1/21/15 | 23,110 | 23,110 | ||||||
0.065% 2/25/15 | 53,592 | 53,587 | ||||||
0.065% 3/5/15 | 57,672 | 57,664 | ||||||
0.067% 1/16/15 | 27,147 | 27,146 | ||||||
0.08% 2/20/15 | 77,515 | 77,508 | ||||||
|
| |||||||
| 279,526 | ||||||||
|
| |||||||
Repurchase Agreements – 1.30% | ||||||||
Bank of America Merrill Lynch | 113,178 | 113,178 | ||||||
Bank of Montreal | 37,726 | 37,726 | ||||||
BNP Paribas | 170,096 | 170,096 | ||||||
|
| |||||||
| 321,000 | ||||||||
|
| |||||||
Total Short-Term Investments (cost $600,510) | 600,526 | |||||||
|
| |||||||
Total Value of Securities Before Securities Lending Collateral – 100.02% | ||||||||
(cost $20,689,057) | 24,663,842 | |||||||
|
| |||||||
40
Table of Contents
| Number of shares | Value (U.S. $) | |||||||
| ||||||||
Securities Lending Collateral – 0.46%** | ||||||||
| ||||||||
Investment Company | ||||||||
Delaware Investments ® Collateral Fund No. 1 | 113,900 | $ | 113,900 | |||||
|
| |||||||
Total Securities Lending Collateral (cost $113,900) | 113,900 | |||||||
|
| |||||||
Total Value of Securities – 100.48% | ||||||||
(cost $20,802,957) | $ | 24,777,742n | ||||||
|
| |||||||
| * | Fully or partially on loan. |
| ** | See Note 10 in “Notes to financial statements” for additional information on securities lending collateral and non-cash collateral. |
| @ | Illiquid security. At Nov. 30, 2014, the aggregate value of illiquid securities was $305,067, which represents 1.24% of the Fund’s net assets. See Note 11 in “Notes to financial statements.” |
| ≠ | The rate shown is the effective yield at the time of purchase. |
| n | Includes $208,274 of securities loaned. |
| ° | Principal amount shown is stated in U.S. dollars unless noted that the security is denominated in another currency. |
| † | Non-income-producing security. |
| D | Securities have been classified by country of origin. Aggregate classification by business sectors has been presented on page 26 in “Security type / country and sector allocations.” |
| Summary of abbreviations: |
ADR – American Depositary Receipt |
CVA – Dutch Certificate |
See accompanying notes, which are an integral part of the financial statements.
41
Table of Contents
| Schedules of investments | ||
| Delaware International Value Equity Fund | November 30, 2014 | |
Number of shares | Value (U.S. $) | |||||||
| ||||||||
Common Stock – 98.33%D | ||||||||
| ||||||||
Australia – 1.39% | ||||||||
Coca-Cola Amatil | 512,592 | $ | 3,988,418 | |||||
|
| |||||||
| 3,988,418 | ||||||||
|
| |||||||
Canada – 8.17% | ||||||||
AuRico Gold | 504,629 | 1,689,892 | ||||||
CGI Group Class A † | 358,673 | 13,071,164 | ||||||
Suncor Energy | 123,800 | 3,908,733 | ||||||
WestJet Airlines @ | 125,790 | 3,552,520 | ||||||
Yamana Gold | 337,972 | 1,220,446 | ||||||
|
| |||||||
| 23,442,755 | ||||||||
|
| |||||||
China/Hong Kong – 5.46% | ||||||||
CNOOC | 3,422,000 | 5,003,995 | ||||||
Techtronic Industries | 1,272,500 | 4,069,427 | ||||||
Yue Yuen Industrial Holdings | 1,836,500 | 6,583,541 | ||||||
|
| |||||||
| 15,656,963 | ||||||||
|
| |||||||
Denmark – 2.02% | ||||||||
Carlsberg Class B | 64,908 | 5,784,118 | ||||||
|
| |||||||
| 5,784,118 | ||||||||
|
| |||||||
France – 20.04% | ||||||||
AXA * | 417,639 | 10,091,385 | ||||||
Kering * | 20,890 | 4,318,376 | ||||||
Lafarge * | 73,547 | 5,233,852 | ||||||
Publicis Groupe * | 69,360 | 5,098,176 | ||||||
Rexel | 166,285 | 3,081,485 | ||||||
Sanofi | 97,184 | 9,417,194 | ||||||
Teleperformance * | 129,854 | 9,074,390 | ||||||
Total * | 88,329 | 4,945,744 | ||||||
Vinci | 114,896 | 6,216,656 | ||||||
|
| |||||||
| 57,477,258 | ||||||||
|
| |||||||
Germany – 4.96% | ||||||||
Bayerische Motoren Werke * | 24,765 | 2,834,017 | ||||||
Deutsche Post * | 216,011 | 7,181,967 | ||||||
Stada Arzneimittel | 117,037 | 4,218,267 | ||||||
|
| |||||||
| 14,234,251 | ||||||||
|
| |||||||
Indonesia – 1.38% | ||||||||
Bank Rakyat Indonesia Persero | 4,204,800 | 3,970,855 | ||||||
|
| |||||||
| 3,970,855 | ||||||||
|
| |||||||
Israel – 4.71% | ||||||||
Teva Pharmaceutical Industries ADR | 237,300 | 13,521,354 | ||||||
|
| |||||||
| 13,521,354 | ||||||||
|
| |||||||
42
Table of Contents
| Number of shares | Value (U.S. $) | |||||||
| ||||||||
Common StockD (continued) | ||||||||
| ||||||||
Italy – 3.14% | ||||||||
Saipem † | 237,211 | $ | 3,397,993 | |||||
UniCredit | 758,947 | 5,615,335 | ||||||
|
| |||||||
| 9,013,328 | ||||||||
|
| |||||||
Japan – 18.32% | ||||||||
East Japan Railway | 84,644 | 6,345,447 | ||||||
ITOCHU | 652,160 | 7,506,324 | ||||||
Mitsubishi UFJ Financial Group | 1,691,857 | 9,785,058 | ||||||
Nippon Telegraph & Telephone | 140,828 | 7,536,220 | ||||||
Nitori Holdings | 126,694 | 7,024,322 | ||||||
Sumitomo Rubber Industries | 319,000 | 4,859,724 | ||||||
Toyota Motor | 154,200 | 9,503,023 | ||||||
|
| |||||||
| 52,560,118 | ||||||||
|
| |||||||
Netherlands – 4.60% | ||||||||
ING Groep CVA † | 450,111 | 6,598,987 | ||||||
Koninklijke Philips * | 218,107 | 6,583,900 | ||||||
|
| |||||||
| 13,182,887 | ||||||||
|
| |||||||
Norway – 0.19% | ||||||||
Subsea 7 * | 53,510 | 531,783 | ||||||
|
| |||||||
| 531,783 | ||||||||
|
| |||||||
Russia – 1.43% | ||||||||
Mobile Telesystems ADR | 335,400 | 4,098,588 | ||||||
|
| |||||||
| 4,098,588 | ||||||||
|
| |||||||
Sweden – 5.58% | ||||||||
Nordea Bank | 788,333 | 9,847,819 | ||||||
Tele2 Class B | 476,503 | 6,169,720 | ||||||
|
| |||||||
| 16,017,539 | ||||||||
|
| |||||||
Switzerland – 7.29% | ||||||||
Aryzta *† | 107,679 | 8,597,816 | ||||||
Novartis | 127,242 | 12,320,968 | ||||||
|
| |||||||
| 20,918,784 | ||||||||
|
| |||||||
United Kingdom – 9.65% | ||||||||
Meggitt | 551,776 | 4,341,055 | ||||||
National Grid | 254,976 | 3,708,914 | ||||||
Playtech | 247,389 | 2,484,162 | ||||||
Rexam | 661,915 | 4,683,703 | ||||||
Rio Tinto | 101,454 | 4,748,625 | ||||||
Standard Chartered | 526,455 | 7,716,346 | ||||||
|
| |||||||
| 27,682,805 | ||||||||
|
| |||||||
Total Common Stock (cost $256,113,503) | 282,081,804 | |||||||
|
| |||||||
43
Table of Contents
| Schedules of investments | ||
| Delaware International Value Equity Fund | ||
| Principal amount° | Value (U.S. $) | |||||||
| ||||||||
Short-Term Investments – 1.43% | ||||||||
| ||||||||
Discount Notes – 0.18%≠ | ||||||||
Federal Home Loan Bank | ||||||||
0.065% 1/21/15 | 45,268 | $ | 45,266 | |||||
0.065% 2/25/15 | 152,054 | 152,040 | ||||||
0.065% 3/5/15 | 112,967 | 112,950 | ||||||
0.08% 2/20/15 | 193,396 | 193,378 | ||||||
|
| |||||||
| 503,634 | ||||||||
|
| |||||||
Repurchase Agreements – 1.16% | ||||||||
Bank of America Merrill Lynch | 1,176,908 | 1,176,908 | ||||||
Bank of Montreal | 392,302 | 392,302 | ||||||
BNP Paribas | 1,768,790 | 1,768,790 | ||||||
|
| |||||||
| 3,338,000 | ||||||||
|
| |||||||
U.S. Treasury Obligation – 0.09%≠ | ||||||||
U.S. Treasury Bill 0.005% 12/26/14 | 257,434 | 257,427 | ||||||
|
| |||||||
| 257,427 | ||||||||
|
| |||||||
Total Short-Term Investments (cost $4,099,035) | 4,099,061 | |||||||
|
| |||||||
Total Value of Securities Before Securities Lending Collateral – 99.76% | 286,180,865 | |||||||
|
| |||||||
| Number of shares | Value (U.S. $) | |||||||
| ||||||||
Securities Lending Collateral – 3.83%** | ||||||||
| ||||||||
Investment Company | 10,984,633 | $ | 10,984,633 | |||||
|
| |||||||
Total Securities Lending Collateral (cost $10,984,633) | 10,984,633 | |||||||
|
| |||||||
Total Value of Securities – 103.59% | $ | 297,165,498n | ||||||
|
| |||||||
| * | Fully or partially on loan. |
| ** | See Note 10 in “Notes to financial statements” for additional information on securities lending collateral. |
44
Table of Contents
| @ | Illiquid security. At Nov. 30, 2014, the aggregate value of illiquid securities was $3,552,520, which represents 1.24% of the Fund’s net assets. See Note 11 in “Notes to financial statements.” |
| ≠ | The rate shown is the effective yield at the time of purchase. |
| n | Includes $10,474,045 of securities loaned. |
| ° | Principal amount shown is stated in U.S. dollars unless noted that the security is denominated in another currency. |
| † | Non-income-producing security. |
| D | Securities have been classified by country of origin. Aggregate classification by business sectors has been presented on page 28 in “Security type / country and sector allocations.” |
Summary of abbreviations: |
ADR – American Depositary Receipt |
CVA – Dutch Certificate |
See accompanying notes, which are an integral part of the financial statements.
45
Table of Contents
| Statements of assets and liabilities | November 30, 2014 | |
Delaware Emerging Markets Fund | Delaware Global Value Fund | Delaware International Value Equity Fund | ||||||||||
Assets: | ||||||||||||
Investments, at value1,2 | $ | 3,074,163,150 | $ | 24,063,316 | $ | 282,081,804 | ||||||
Short-term investments, at value3 | 39,113,000 | 600,526 | 4,099,061 | |||||||||
Short-term investments held as collateral for loaned securities, at value4 | — | 113,900 | 10,984,633 | |||||||||
Foreign currencies, at value5 | 23,841,181 | 1,800 | 26,460 | |||||||||
Cash | — | 4,546 | 86,433 | |||||||||
Receivable for securities sold | 7,245,264 | — | — | |||||||||
Receivable for fund shares sold | 7,084,243 | 3,608 | 792,070 | |||||||||
Dividends and interest receivable | 1,382,173 | 66,275 | 665,488 | |||||||||
Securities lending income receivable | — | 219 | 1,316 | |||||||||
Unrealized gain on foreign currency exchange contracts | 57,454 | — | — | |||||||||
|
|
|
|
|
| |||||||
Total assets | 3,152,886,465 | 24,854,190 | 298,737,265 | |||||||||
|
|
|
|
|
| |||||||
Liabilities: | ||||||||||||
Cash overdraft | 13,795,870 | — | — | |||||||||
Payable for securities purchased | 24,867,914 | — | — | |||||||||
Payable for fund shares redeemed | 2,966,710 | 6,868 | 328,422 | |||||||||
Obligation to return securities lending collateral | — | 113,900 | 10,984,633 | |||||||||
Investment management fees payable | 2,975,047 | 13,799 | 198,511 | |||||||||
Other accrued expenses | 1,534,284 | 50,611 | 295,311 | |||||||||
Distribution fees payable | 257,043 | 7,810 | 39,675 | |||||||||
Other affiliates payable | 191,567 | 2,367 | 16,964 | |||||||||
Trustees’ fees and expenses payable | 18,120 | 141 | 1,636 | |||||||||
Unrealized loss on foreign currency exchange contracts | 96 | — | — | |||||||||
Deferred capital gain tax | 5,781,842 | — | — | |||||||||
|
|
|
|
|
| |||||||
Total liabilities | 52,388,493 | 195,496 | 11,865,152 | |||||||||
|
|
|
|
|
| |||||||
Total Net Assets | $ | 3,100,497,972 | $ | 24,658,694 | $ | 286,872,113 | ||||||
|
|
|
|
|
| |||||||
46
Table of Contents
Delaware Emerging Markets Fund | Delaware Global Value Fund | Delaware International Value Equity Fund | ||||||||||
Net Assets Consist of: | ||||||||||||
Paid-in capital | $ | 3,000,106,072 | $ | 43,425,499 | $ | 447,609,019 | ||||||
Undistributed (distributions in excess of) net investment income | (25,078,807 | ) | 89,666 | 5,825,327 | ||||||||
Accumulated net realized gain (loss) on investments | 59,582,526 | (22,828,363 | ) | (192,485,823 | ) | |||||||
Net unrealized appreciation of investments | 65,888,181 | 3,971,892 | 25,923,590 | |||||||||
|
|
|
|
|
| |||||||
Total Net Assets | $ | 3,100,497,972 | $ | 24,658,694 | $ | 286,872,113 | ||||||
|
|
|
|
|
| |||||||
47
Table of Contents
| Statements of assets and liabilities | ||
Delaware Emerging Markets Fund | Delaware Global Value Fund | Delaware International Value Equity Fund | ||||||||||
Net Asset Value | ||||||||||||
Class A: | ||||||||||||
Net assets | $ | 423,619,736 | $ | 16,949,750 | $ | 74,118,284 | ||||||
Shares of beneficial interest outstanding, unlimited authorization, no par | 26,338,195 | 1,446,931 | 5,476,695 | |||||||||
Net asset value per share | $ | 16.08 | $ | 11.71 | $ | 13.53 | ||||||
Sales charge | 5.75 | % | 5.75 | % | 5.75 | % | ||||||
Offering price per share, equal to net asset value per share / (1 – sales charge) | $ | 17.06 | $ | 12.42 | $ | 14.36 | ||||||
Class C: | ||||||||||||
Net assets | $ | 198,428,477 | $ | 5,361,445 | $ | 28,609,301 | ||||||
Shares of beneficial interest outstanding, unlimited authorization, no par | 13,102,612 | 466,962 | 2,155,544 | |||||||||
Net asset value per share | $ | 15.14 | $ | 11.48 | $ | 13.27 | ||||||
Class R: | ||||||||||||
Net assets | $ | 14,172,815 | $ | — | $ | 2,317,027 | ||||||
Shares of beneficial interest outstanding, unlimited authorization, no par | 874,837 | — | 171,961 | |||||||||
Net asset value per share | $ | 16.20 | $ | — | $ | 13.47 | ||||||
Institutional Class: | ||||||||||||
Net assets | $ | 2,464,276,944 | $ | 2,347,499 | $ | 181,827,501 | ||||||
Shares of beneficial interest outstanding, unlimited authorization, no par | 151,987,015 | 199,481 | 13,366,938 | |||||||||
Net asset value per share | $ | 16.21 | $ | 11.77 | $ | 13.60 | ||||||
| ||||||||||||
1Investments, at cost | $ | 3,002,448,522 | $ | 20,088,547 | $ | 256,113,503 | ||||||
2Including securities on loan | — | 208,274 | 10,474,045 | |||||||||
3Short-term investments, at cost | 39,113,000 | 600,510 | 4,099,035 | |||||||||
4Short-term investments held as collateral for loaned securities, at cost | — | 113,900 | 10,984,633 | |||||||||
5Foreign currencies, at cost | 24,041,560 | 1,796 | 26,436 | |||||||||
See accompanying notes, which are an integral part of the financial statements.
48
Table of Contents
This page intentionally left blank.
Table of Contents
| Statements of operations | ||
| Delaware International Funds | Year ended November 30, 2014 | |
Delaware Fund | Delaware Fund | Delaware International Value Equity Fund | ||||||||||
Investment Income: | ||||||||||||
Dividends | $53,383,661 | $574,940 | $10,987,183 | |||||||||
Interest | 5,393 | 243 | 2,643 | |||||||||
Securities lending income | — | 3,068 | 122,108 | |||||||||
Foreign tax withheld | (4,139,119 | ) | (32,555 | ) | (792,909 | ) | ||||||
|
|
|
|
|
| |||||||
| 49,249,935 | 545,696 | 10,319,025 | ||||||||||
|
|
|
|
|
| |||||||
Expenses: | ||||||||||||
Management fees | 34,119,749 | 217,960 | 2,662,250 | |||||||||
Distribution expenses — Class A | 1,226,681 | 42,044 | 234,597 | |||||||||
Distribution expenses — Class B | 11,344 | 8,457 | 10,602 | |||||||||
Distribution expenses — Class C | 1,916,257 | 57,158 | 319,658 | |||||||||
Distribution expenses — Class R | 49,747 | — | 13,564 | |||||||||
Dividend disbursing and transfer agent fees and expenses | 4,061,287 | 44,882 | 565,686 | |||||||||
Custodian fees | 1,329,142 | 11,209 | 78,148 | |||||||||
Accounting and administration expenses | 970,603 | 8,663 | 105,853 | |||||||||
Registration fees | 542,021 | 56,264 | 69,622 | |||||||||
Reports and statements to shareholders | 449,862 | 9,736 | 61,336 | |||||||||
Legal fees | 252,805 | 1,879 | 23,709 | |||||||||
Trustees’ fees and expenses | 134,610 | 1,199 | 14,691 | |||||||||
Audit and tax | 49,028 | 34,383 | 45,099 | |||||||||
Other | 93,904 | 12,504 | 22,744 | |||||||||
|
|
|
|
|
| |||||||
| 45,207,040 | 506,338 | 4,227,559 | ||||||||||
Less expenses waived | — | (65,164 | ) | — | ||||||||
Less waived distribution expenses — Class B | (6,321 | ) | (4,293 | ) | (7,924 | ) | ||||||
Less expense paid indirectly | (1,622 | ) | (56 | ) | (203 | ) | ||||||
|
|
|
|
|
| |||||||
Total operating expenses | 45,199,097 | 436,825 | 4,219,432 | |||||||||
|
|
|
|
|
| |||||||
Net Investment Income | 4,050,838 | 108,871 | 6,099,593 | |||||||||
|
|
|
|
|
| |||||||
50
Table of Contents
| Delaware | Delaware | Delaware | ||||||||||
| Emerging | Global | International | ||||||||||
| Markets | Value | Value Equity | ||||||||||
| Fund | Fund | Fund | ||||||||||
Net Realized and Unrealized Gain (Loss): | ||||||||||||
Net realized gain (loss) on: | ||||||||||||
Investments | 68,816,055 | 3,025,648 | 12,377,940 | |||||||||
Foreign currencies | 614,905 | (8,645 | ) | 10,087 | ||||||||
Foreign currency exchange contracts | (1,607,578 | ) | (9,876 | ) | (265,406 | ) | ||||||
|
|
|
|
|
| |||||||
Net realized gain | 67,823,382 | 3,007,127 | 12,122,621 | |||||||||
|
|
|
|
|
| |||||||
Net change in unrealized appreciation (depreciation) of: | ||||||||||||
Investments | (92,775,505 | ) | (1,979,577 | ) | (29,046,394 | ) | ||||||
Foreign currencies | (92,791 | ) | (2,617 | ) | (43,494 | ) | ||||||
Foreign currency exchange contracts | 58,120 | — | — | |||||||||
Deferred capital gain tax | (5,573,858 | ) | — | — | ||||||||
|
|
|
|
|
| |||||||
Net change in unrealized appreciation (depreciation) | (98,384,034 | ) | (1,982,194 | ) | (29,089,888 | ) | ||||||
|
|
|
|
|
| |||||||
Net Realized and Unrealized Gain (Loss) | (30,560,652 | ) | 1,024,933 | (16,967,267 | ) | |||||||
|
|
|
|
|
| |||||||
Net Increase (Decrease) in Net Assets Resulting from Operations | $(26,509,814 | ) | $1,133,804 | $(10,867,674 | ) | |||||||
|
|
|
|
|
| |||||||
See accompanying notes, which are an integral part of the financial statements.
51
Table of Contents
Statements of changes in net assets
Delaware Emerging Markets Fund
| Year ended | ||||||||
| 11/30/14 | 11/30/13 | |||||||
Increase (Decrease) in Net Assets from Operations: | ||||||||
Net investment income | $ | 4,050,838 | $ | 6,527,938 | ||||
Net realized gain | 67,823,382 | 40,261,888 | ||||||
Net change in unrealized appreciation (depreciation) | (98,384,034 | ) | 368,988,155 | |||||
|
|
|
| |||||
Net increase (decrease) in net assets resulting from operations | (26,509,814 | ) | 415,777,981 | |||||
|
|
|
| |||||
Dividends and Distributions to Shareholders from: | ||||||||
Net investment income: | ||||||||
Class A | (3,652,148 | ) | (3,756,687 | ) | ||||
Class B | (1,305 | ) | (9,878 | ) | ||||
Class C | (142,676 | ) | (202,361 | ) | ||||
Class R | (26,825 | ) | (14,827 | ) | ||||
Institutional Class | (18,983,668 | ) | (12,627,833 | ) | ||||
|
|
|
| |||||
| (22,806,622 | ) | (16,611,586 | ) | |||||
|
|
|
| |||||
Capital Share Transactions: | ||||||||
Proceeds from shares sold: | ||||||||
Class A | 236,965,336 | 248,382,050 | ||||||
Class B | 5,365 | 7,492 | ||||||
Class C | 59,258,608 | 37,157,276 | ||||||
Class R | 12,425,595 | 2,834,307 | ||||||
Institutional Class | 1,326,279,522 | 1,440,898,568 | ||||||
Net asset value of shares issued upon reinvestment of dividends and distributions: | ||||||||
Class A | 3,427,396 | 3,590,383 | ||||||
Class B | 1,061 | 8,043 | ||||||
Class C | 135,639 | 189,656 | ||||||
Class R | 26,766 | 14,769 | ||||||
Institutional Class | 11,594,662 | 8,041,584 | ||||||
|
|
|
| |||||
| 1,650,119,950 | 1,741,124,128 | |||||||
|
|
|
| |||||
52
Table of Contents
| Year ended | ||||||||
| 11/30/14 | 11/30/13 | |||||||
Capital Share Transactions (continued): | ||||||||
Cost of shares redeemed: | ||||||||
Class A | $ | (317,613,494 | ) | $ | (320,545,792 | ) | ||
Class B | (2,060,969 | ) | (8,006,639 | ) | ||||
Class C | (38,048,822 | ) | (41,708,637 | ) | ||||
Class R | (3,376,234 | ) | (933,175 | ) | ||||
Institutional Class | (800,152,351 | ) | (962,636,613 | ) | ||||
|
|
|
| |||||
| (1,161,251,870 | ) | (1,333,830,856 | ) | |||||
|
|
|
| |||||
Increase in net assets derived from capital share transactions | 488,868,080 | 407,293,272 | ||||||
|
|
|
| |||||
Net Increase in Net Assets | 439,551,644 | 806,459,667 | ||||||
Net Assets: | ||||||||
Beginning of year | 2,660,946,328 | 1,854,486,661 | ||||||
|
|
|
| |||||
End of year | $ | 3,100,497,972 | $ | 2,660,946,328 | ||||
|
|
|
| |||||
Distributions in excess of net investment income | $ | (25,078,807 | ) | $ | (6,879,582 | ) | ||
|
|
|
| |||||
See accompanying notes, which are an integral part of the financial statements.
53
Table of Contents
Statements of changes in net assets
Delaware Global Value Fund
| Year ended | ||||||||
| 11/30/14 | 11/30/13 | |||||||
Increase (Decrease) in Net Assets from Operations: | ||||||||
Net investment income | $ | 108,871 | $ | 141,043 | ||||
Net realized gain | 3,007,127 | 1,547,386 | ||||||
Net change in unrealized appreciation (depreciation) | (1,982,194 | ) | 4,206,627 | |||||
|
|
|
| |||||
Net increase in net assets resulting from operations | 1,133,804 | 5,895,056 | ||||||
|
|
|
| |||||
Dividends and Distributions to Shareholders from: | ||||||||
Net investment income: | ||||||||
Class A | (106,910 | ) | (179,934 | ) | ||||
Class B | — | (5,593 | ) | |||||
Class C | — | (24,308 | ) | |||||
Institutional Class | (17,636 | ) | (26,060 | ) | ||||
|
|
|
| |||||
| (124,546 | ) | (235,895 | ) | |||||
|
|
|
| |||||
Capital Share Transactions: | ||||||||
Proceeds from shares sold: | ||||||||
Class A | 2,248,966 | 1,321,476 | ||||||
Class B | 345 | 10 | ||||||
Class C | 487,839 | 605,566 | ||||||
Institutional Class | 573,978 | 252,233 | ||||||
Net asset value of shares issued upon reinvestment of dividends and distributions: | ||||||||
Class A | 101,819 | 172,168 | ||||||
Class B | — | 5,375 | ||||||
Class C | — | 21,422 | ||||||
Institutional Class | 16,383 | 24,937 | ||||||
|
|
|
| |||||
| 3,429,330 | 2,403,187 | |||||||
|
|
|
| |||||
54
Table of Contents
| Year ended | ||||||||
| 11/30/14 | 11/30/13 | |||||||
Capital Share Transactions (continued): | ||||||||
Cost of shares redeemed: | ||||||||
Class A | $ | (3,013,577 | ) | $ | (4,655,816 | ) | ||
Class B | (1,229,702 | ) | (505,668 | ) | ||||
Class C | (1,220,397 | ) | (1,911,528 | ) | ||||
Institutional Class | (452,307 | ) | (544,856 | ) | ||||
|
|
|
| |||||
| (5,915,983 | ) | (7,617,868 | ) | |||||
|
|
|
| |||||
Decrease in net assets derived from capital share transactions | (2,486,653 | ) | (5,214,681 | ) | ||||
|
|
|
| |||||
Net Increase (Decrease) in Net Assets | (1,477,395 | ) | 444,480 | |||||
Net Assets: | ||||||||
Beginning of year | 26,136,089 | 25,691,609 | ||||||
|
|
|
| |||||
End of year | $ | 24,658,694 | $ | 26,136,089 | ||||
|
|
|
| |||||
Undistributed net investment income | $ | 89,666 | $ | 123,862 | ||||
|
|
|
| |||||
See accompanying notes, which are an integral part of the financial statements.
55
Table of Contents
Statements of changes in net assets
Delaware International Value Equity Fund
| Year ended | ||||||||
| 11/30/14 | 11/30/13 | |||||||
Increase (Decrease) in Net Assets from Operations: | ||||||||
Net investment income | $ | 6,099,593 | $ | 3,684,064 | ||||
Net realized gain | 12,122,621 | 14,164,599 | ||||||
Net change in unrealized appreciation (depreciation) | (29,089,888 | ) | 42,197,317 | |||||
|
|
|
| |||||
Net increase (decrease) in net assets resulting from operations | (10,867,674 | ) | 60,045,980 | |||||
|
|
|
| |||||
Dividends and Distributions to Shareholders from: | ||||||||
Net investment income: | ||||||||
Class A | (1,058,838 | ) | (1,225,107 | ) | ||||
Class B | (6,962 | ) | (16,953 | ) | ||||
Class C | (120,167 | ) | (193,459 | ) | ||||
Class R | (23,230 | ) | (25,179 | ) | ||||
Institutional Class | (2,208,546 | ) | (1,680,914 | ) | ||||
|
|
|
| |||||
| (3,417,743 | ) | (3,141,612 | ) | |||||
|
|
|
| |||||
Capital Share Transactions: | ||||||||
Proceeds from shares sold: | ||||||||
Class A | 14,927,742 | 12,714,093 | ||||||
Class B | 1,215 | 7,448 | ||||||
Class C | 2,398,591 | 3,099,303 | ||||||
Class R | 322,591 | 841,843 | ||||||
Institutional Class | 72,579,330 | 66,706,496 | ||||||
Net asset value of shares issued upon reinvestment of dividends and distributions: | ||||||||
Class A | 1,033,504 | 1,192,834 | ||||||
Class B | 6,879 | 16,649 | ||||||
Class C | 116,294 | 187,429 | ||||||
Class R | 23,229 | 25,179 | ||||||
Institutional Class | 2,190,119 | 1,662,153 | ||||||
|
|
|
| |||||
| 93,599,494 | 86,453,427 | |||||||
|
|
|
| |||||
56
Table of Contents
| Year ended | ||||||||
| 11/30/14 | 11/30/13 | |||||||
Capital Share Transactions (continued): | ||||||||
Cost of shares redeemed: | ||||||||
Class A | $ | (42,480,531 | ) | $ | (23,394,194 | ) | ||
Class B | (1,991,338 | ) | (1,542,365 | ) | ||||
Class C | (5,900,316 | ) | (6,812,238 | ) | ||||
Class R | (819,860 | ) | (792,688 | ) | ||||
Institutional Class | (62,606,876 | ) | (26,523,099 | ) | ||||
|
|
|
| |||||
| (113,798,921 | ) | (59,064,584 | ) | |||||
|
|
|
| |||||
Increase (decrease) in net assets derived from capital share transactions | (20,199,427 | ) | 27,388,843 | |||||
|
|
|
| |||||
Net Increase (Decrease) in Net Assets | (34,484,844 | ) | 84,293,211 | |||||
Net Assets: | ||||||||
Beginning of year | 321,356,957 | 237,063,746 | ||||||
|
|
|
| |||||
End of year | $ | 286,872,113 | $ | 321,356,957 | ||||
|
|
|
| |||||
Undistributed net investment income | $ | 5,825,327 | $ | 3,398,796 | ||||
|
|
|
| |||||
See accompanying notes, which are an integral part of the financial statements.
57
Table of Contents
Delaware Emerging Markets Fund Class A
Selected data for each share of the Fund outstanding throughout each period were as follows:
Net asset value, beginning of period |
Income (loss) from investment operations: |
Net investment income1 |
Net realized and unrealized gain (loss) |
Total from investment operations. |
Less dividends and distributions from: |
Net investment income |
Net realized gain |
Total dividends and distributions |
Net asset value, end of period |
Total return2 |
Ratios and supplemental data: |
Net assets, end of period (000 omitted) |
Ratio of expenses to average net assets |
Ratio of expenses to average net assets prior to fees waived |
Ratio of net investment income to average net assets |
Ratio of net investment income to average net assets prior to fees waived |
Portfolio turnover |
| 1 | The average shares outstanding method has been applied for per share information. |
| 2 | Total investment return is based on the change in net asset value of a share during the period and assumes reinvestment of dividends and distributions at net asset value and does not reflect the impact of a sales charge. Total investment return during some of the periods shown reflects a waiver by the distributor. Performance would have been lower had the waiver not been in effect. |
See accompanying notes, which are an integral part of the financial statements.
58
Table of Contents
| Year ended | ||||||||||||||||||||||||||||
|
| |||||||||||||||||||||||||||
| 11/30/14 | 11/30/13 | 11/30/12 | 11/30/11 | 11/30/10 | ||||||||||||||||||||||||
| ||||||||||||||||||||||||||||
| $ | 16.230 | $ | 13.500 | $ | 13.050 | $ | 14.860 | $ | 12.880 | |||||||||||||||||||
| ||||||||||||||||||||||||||||
| 0.008 | 0.023 | 0.077 | 0.094 | 0.151 | ||||||||||||||||||||||||
| (0.041 | ) | 2.816 | 0.642 | (1.819 | ) | 1.834 | ||||||||||||||||||||||
|
|
|
|
|
|
|
|
|
| |||||||||||||||||||
| (0.033 | ) | 2.839 | 0.719 | (1.725 | ) | 1.985 | ||||||||||||||||||||||
|
|
|
|
|
|
|
|
|
| |||||||||||||||||||
| ||||||||||||||||||||||||||||
| (0.117 | ) | (0.109 | ) | (0.130 | ) | (0.085 | ) | (0.005 | ) | |||||||||||||||||||
| — | — | (0.139 | ) | — | — | |||||||||||||||||||||||
|
|
|
|
|
|
|
|
|
| |||||||||||||||||||
| (0.117 | ) | (0.109 | ) | (0.269 | ) | (0.085 | ) | (0.005 | ) | |||||||||||||||||||
|
|
|
|
|
|
|
|
|
| |||||||||||||||||||
| $ | 16.080 | $ | 16.230 | $ | 13.500 | $ | 13.050 | $ | 14.860 | |||||||||||||||||||
|
|
|
|
|
|
|
|
|
| |||||||||||||||||||
| (0.20% | ) | 21.16% | 5.67% | (11.70% | ) | 15.42% | ||||||||||||||||||||||
| ||||||||||||||||||||||||||||
| $ | 423,620 | $ | 498,686 | $ | 470,670 | $ | 542,207 | $ | 546,275 | |||||||||||||||||||
| 1.69% | 1.71% | 1.70% | 1.78% | 1.85% | ||||||||||||||||||||||||
| 1.69% | 1.75% | 1.75% | 1.83% | 1.90% | ||||||||||||||||||||||||
| 0.01% | 0.16% | 0.59% | 0.63% | 1.10% | ||||||||||||||||||||||||
| 0.01% | 0.12% | 0.54% | 0.58% | 1.05% | ||||||||||||||||||||||||
| 26% | 24% | 15% | 19% | 27% | ||||||||||||||||||||||||
59
Table of Contents
Financial highlights
Delaware Emerging Markets Fund Class C
Selected data for each share of the Fund outstanding throughout each period were as follows:
Net asset value, beginning of period |
Income (loss) from investment operations: |
| Net investment income (loss)1 |
| Net realized and unrealized gain (loss) |
| Total from investment operations |
Less dividends and distributions from: |
| Net investment income |
| Net realized gain |
| Total dividends and distributions |
Net asset value, end of period |
Total return2 |
Ratios and supplemental data: |
| Net assets, end of period (000 omitted) |
| Ratio of expenses to average net assets |
| Ratio of net investment income (loss) to average net assets |
| Portfolio turnover |
| 1 | The average shares outstanding method has been applied for per share information. |
| 2 | Total investment return is based on the change in net asset value of a share during the period and assumes reinvestment of dividends and distributions at net asset value and does not reflect the impact of a sales charge. |
See accompanying notes, which are an integral part of the financial statements.
60
Table of Contents
| Year ended | ||||||||||||||||||||||||||||
|
| |||||||||||||||||||||||||||
| 11/30/14 | 11/30/13 | 11/30/12 | 11/30/11 | 11/30/10 | ||||||||||||||||||||||||
| ||||||||||||||||||||||||||||
| $ | 15.300 | $ | 12.740 | $ | 12.320 | $ | 14.050 | $ | 12.270 | |||||||||||||||||||
| ||||||||||||||||||||||||||||
| (0.116 | ) | (0.083 | ) | (0.020 | ) | (0.017 | ) | 0.046 | ||||||||||||||||||||
| (0.032 | ) | 2.660 | 0.605 | (1.713 | ) | 1.734 | ||||||||||||||||||||||
|
|
|
|
|
|
|
|
|
| |||||||||||||||||||
| (0.148 | ) | 2.577 | 0.585 | (1.730 | ) | 1.780 | ||||||||||||||||||||||
|
|
|
|
|
|
|
|
|
| |||||||||||||||||||
| ||||||||||||||||||||||||||||
| (0.012 | ) | (0.017 | ) | (0.026 | ) | — | — | |||||||||||||||||||||
| — | — | (0.139 | ) | — | — | |||||||||||||||||||||||
|
|
|
|
|
|
|
|
|
| |||||||||||||||||||
| (0.012 | ) | (0.017 | ) | (0.165 | ) | — | — | |||||||||||||||||||||
|
|
|
|
|
|
|
|
|
| |||||||||||||||||||
| $ | 15.140 | $ | 15.300 | $ | 12.740 | $ | 12.320 | $ | 14.050 | |||||||||||||||||||
|
|
|
|
|
|
|
|
|
| |||||||||||||||||||
| (0.97% | ) | 20.25% | 4.85% | (12.31% | ) | 14.51% | ||||||||||||||||||||||
| ||||||||||||||||||||||||||||
| $ | 198,428 | $ | 180,168 | $ | 155,040 | $ | 194,124 | $ | 222,957 | |||||||||||||||||||
| 2.44% | 2.46% | 2.45% | 2.53% | 2.60% | ||||||||||||||||||||||||
| (0.74% | ) | (0.59% | ) | (0.16% | ) | (0.12% | ) | 0.35% | ||||||||||||||||||||
| 26% | 24% | 15% | 19% | 27% | ||||||||||||||||||||||||
61
Table of Contents
Financial highlights
Delaware Emerging Markets Fund Class R
Selected data for each share of the Fund outstanding throughout each period were as follows:
Net asset value, beginning of period |
Income (loss) from investment operations: |
Net investment income (loss)1 |
Net realized and unrealized gain (loss) |
Total from investment operations |
Less dividends and distributions from: |
Net investment income |
Net realized gain |
Total dividends and distributions |
Net asset value, end of period |
Total return2 |
Ratios and supplemental data: |
Net assets, end of period (000 omitted) |
Ratio of expenses to average net assets |
Ratio of expenses to average net assets prior to fees waived |
Ratio of net investment income (loss) to average net assets |
Ratio of net investment income (loss) to average net assets prior to fees waived |
Portfolio turnover |
| 1 | The average shares outstanding method has been applied for per share information. |
| 2 | Total investment return is based on the change in net asset value of a share during the period and assumes reinvestment of dividends and distributions at net asset value. Total investment return during some of the periods shown reflects a waiver by the distributor. Performance would have been lower had the waiver not been in effect. |
See accompanying notes, which are an integral part of the financial statements.
62
Table of Contents
| Year ended | ||||||||||||||||||||||||||||
|
| |||||||||||||||||||||||||||
| 11/30/14 | 11/30/13 | 11/30/12 | 11/30/11 | 11/30/10 | ||||||||||||||||||||||||
| ||||||||||||||||||||||||||||
| $ | 16.350 | $ | 13.600 | $ | 13.140 | $ | 14.960 | $ | 13.010 | |||||||||||||||||||
| ||||||||||||||||||||||||||||
| (0.055 | ) | (0.014 | ) | 0.044 | 0.056 | 0.123 | ||||||||||||||||||||||
| (0.018 | ) | 2.839 | 0.649 | (1.833 | ) | 1.832 | ||||||||||||||||||||||
|
|
|
|
|
|
|
|
|
| |||||||||||||||||||
| (0.073 | ) | 2.825 | 0.693 | (1.777 | ) | 1.955 | ||||||||||||||||||||||
|
|
|
|
|
|
|
|
|
| |||||||||||||||||||
| ||||||||||||||||||||||||||||
| (0.077 | ) | (0.075 | ) | (0.094 | ) | (0.043 | ) | (0.005 | ) | |||||||||||||||||||
| — | — | (0.139 | ) | — | — | |||||||||||||||||||||||
|
|
|
|
|
|
|
|
|
| |||||||||||||||||||
| (0.077 | ) | (0.075 | ) | (0.233 | ) | (0.043 | ) | (0.005 | ) | |||||||||||||||||||
|
|
|
|
|
|
|
|
|
| |||||||||||||||||||
| $ | 16.200 | $ | 16.350 | $ | 13.600 | $ | 13.140 | $ | 14.960 | |||||||||||||||||||
|
|
|
|
|
|
|
|
|
| |||||||||||||||||||
| ||||||||||||||||||||||||||||
| (0.44% | ) | 20.86% | 5.41% | (11.93% | ) | 15.03% | ||||||||||||||||||||||
| $ | 14,173 | $ | 5,282 | $ | 2,691 | $ | 1,500 | $ | 440 | |||||||||||||||||||
| 1.94% | 1.96% | 1.95% | 2.03% | 2.10% | ||||||||||||||||||||||||
| 1.94% | 2.04% | 2.05% | 2.13% | 2.20% | ||||||||||||||||||||||||
| (0.24% | ) | (0.09% | ) | 0.34% | 0.38% | 0.85% | ||||||||||||||||||||||
| (0.24% | ) | (0.17% | ) | 0.24% | 0.28% | 0.75% | ||||||||||||||||||||||
| 26% | 24% | 15% | 19% | 27% | ||||||||||||||||||||||||
63
Table of Contents
Financial highlights
Delaware Emerging Markets Fund Institutional Class
Selected data for each share of the Fund outstanding throughout each period were as follows:
Net asset value, beginning of period |
Income (loss) from investment operations: |
Net investment income1 |
Net realized and unrealized gain (loss) |
Total from investment operations |
Less dividends and distributions from: |
Net investment income |
Net realized gain |
Total dividends and distributions |
Net asset value, end of period |
Total return2 |
Ratios and supplemental data: |
Net assets, end of period (000 omitted) |
Ratio of expenses to average net assets |
Ratio of net investment income to average net assets |
Portfolio turnover |
| 1 | The average shares outstanding method has been applied for per share information. |
| 2 | Total investment return is based on the change in net asset value of a share during the period and assumes reinvestment of dividends and distributions at net asset value. |
See accompanying notes, which are an integral part of the financial statements.
64
Table of Contents
| Year ended | ||||||||||||||||||||||||||||
| 11/30/14 | 11/30/13 | 11/30/12 | 11/30/11 | 11/30/10 | ||||||||||||||||||||||||
| $ | 16.360 | $ | 13.600 | $ | 13.160 | $ | 14.970 | $ | 12.980 | |||||||||||||||||||
| 0.039 | 0.061 | 0.111 | 0.131 | 0.190 | ||||||||||||||||||||||||
| (0.035 | ) | 2.841 | 0.635 | (1.821 | ) | 1.831 | ||||||||||||||||||||||
|
|
|
|
|
|
|
|
|
| |||||||||||||||||||
| 0.004 | 2.902 | 0.746 | (1.690 | ) | 2.021 | |||||||||||||||||||||||
|
|
|
|
|
|
|
|
|
| |||||||||||||||||||
| (0.154 | ) | (0.142 | ) | (0.167 | ) | (0.120 | ) | (0.031 | ) | |||||||||||||||||||
| — | — | (0.139 | ) | — | — | |||||||||||||||||||||||
|
|
|
|
|
|
|
|
|
| |||||||||||||||||||
| (0.154 | ) | (0.142 | ) | (0.306 | ) | (0.120 | ) | (0.031 | ) | |||||||||||||||||||
|
|
|
|
|
|
|
|
|
| |||||||||||||||||||
| $ | 16.210 | $ | 16.360 | $ | 13.600 | $ | 13.160 | $ | 14.970 | |||||||||||||||||||
|
|
|
|
|
|
|
|
|
| |||||||||||||||||||
| 0.04% | 21.50% | 5.86% | (11.42% | ) | 15.69% | |||||||||||||||||||||||
| $ | 2,464,277 | $ | 1,974,807 | $ | 1,217,065 | $ | 1,672,668 | $ | 655,310 | |||||||||||||||||||
| 1.44% | 1.46% | 1.45% | 1.53% | 1.60% | ||||||||||||||||||||||||
| 0.26% | 0.41% | 0.84% | 0.88% | 1.35% | ||||||||||||||||||||||||
|
| 26%
|
|
| 24%
|
|
| 15%
|
|
| 19%
|
|
| 27%
|
| ||||||||||||||
65
Table of Contents
Financial highlights
Delaware Global Value Fund Class A
Selected data for each share of the Fund outstanding throughout each period were as follows:
Net asset value, beginning of period |
Income (loss) from investment operations: |
Net investment income1 |
Net realized and unrealized gain (loss) |
Total from investment operations |
Less dividends and distributions from: |
Net investment income |
Total dividends and distributions |
Net asset value, end of period |
Total return2 |
Ratios and supplemental data: |
Net assets, end of period (000 omitted) |
Ratio of expenses to average net assets |
Ratio of expenses to average net assets prior to fees waived |
Ratio of net investment income to average net assets |
Ratio of net investment income to average net assets prior to fees waived |
Portfolio turnover |
| 1 | The average shares outstanding method has been applied for per share information. |
| 2 | Total investment return is based on the change in net asset value of a share during the period and assumes reinvestment of dividends and distributions at net asset value and does not reflect the impact of a sales charge. Total investment return during all of the periods shown reflects waivers by the manager and/or distributor. Performance would have been lower had the waivers not been in effect. |
See accompanying notes, which are an integral part of the financial statements.
66
Table of Contents
| Year ended | ||||||||||||||||||||||||||||
| 11/30/14 | 11/30/13 | 11/30/12 | 11/30/11 | 11/30/10 | ||||||||||||||||||||||||
| $ | 11.270 | $ | 9.010 | $ | 8.310 | $ | 8.300 | $ | 8.050 | |||||||||||||||||||
| 0.067 | 0.075 | 0.093 | 0.101 | 0.067 | ||||||||||||||||||||||||
| 0.444 | 2.286 | 0.699 | (0.053 | ) | 0.293 | |||||||||||||||||||||||
|
|
|
|
|
|
|
|
|
| |||||||||||||||||||
| 0.511 | 2.361 | 0.792 | 0.048 | 0.360 | ||||||||||||||||||||||||
|
|
|
|
|
|
|
|
|
| |||||||||||||||||||
| (0.071 | ) | (0.101 | ) | (0.092 | ) | (0.038 | ) | (0.110 | ) | |||||||||||||||||||
|
|
|
|
|
|
|
|
|
| |||||||||||||||||||
| (0.071 | ) | (0.101 | ) | (0.092 | ) | (0.038 | ) | (0.110 | ) | |||||||||||||||||||
|
|
|
|
|
|
|
|
|
| |||||||||||||||||||
| $ | 11.710 | $ | 11.270 | $ | 9.010 | $ | 8.310 | $ | 8.300 | |||||||||||||||||||
|
|
|
|
|
|
|
|
|
| |||||||||||||||||||
| 4.57% | 26.46% | 9.65% | 0.55% | 4.53% | ||||||||||||||||||||||||
| $ | 16,950 | $ | 16,951 | $ | 16,479 | $ | 17,989 | $ | 20,844 | |||||||||||||||||||
| 1.55% | 1.55% | 1.55% | 1.55% | 1.55% | ||||||||||||||||||||||||
| 1.80% | 1.82% | 1.81% | 1.88% | 2.07% | ||||||||||||||||||||||||
| 0.58% | 0.75% | 1.08% | 1.12% | 0.84% | ||||||||||||||||||||||||
| 0.32% | 0.48% | 0.82% | 0.79% | 0.32% | ||||||||||||||||||||||||
|
| 43%
|
|
| 27%
|
|
| 69%
|
|
| 40%
|
|
| 50%
|
| ||||||||||||||
67
Table of Contents
Financial highlights
Delaware Global Value Fund Class C
Selected data for each share of the Fund outstanding throughout each period were as follows:
Net asset value, beginning of period |
Income (loss) from investment operations: |
Net investment income (loss)1 |
Net realized and unrealized gain (loss) |
Total from investment operations |
Less dividends and distributions from: |
Net investment income |
Total dividends and distributions |
Net asset value, end of period |
Total return2 |
Ratios and supplemental data: |
Net assets, end of period (000 omitted) |
Ratio of expenses to average net assets |
Ratio of expenses to average net assets prior to fees waived |
Ratio of net investment income (loss) to average net assets |
Ratio of net investment income (loss) to average net assets prior to fees waived |
Portfolio turnover |
| 1 | The average shares outstanding method has been applied for per share information. |
| 2 | Total investment return is based on the change in net asset value of a share during the period and assumes reinvestment of dividends and distributions at net asset value and does not reflect the impact of a sales charge. Total investment return during all of the periods shown reflects a waiver by the manager. Performance would have been lower had the waiver not been in effect. |
| 3 | Amount is less than (0.01%). |
See accompanying notes, which are an integral part of the financial statements.
68
Table of Contents
| Year ended | ||||||||||||||||||||||||||||
|
| |||||||||||||||||||||||||||
| 11/30/14 | 11/30/13 | 11/30/12 | 11/30/11 | 11/30/10 | ||||||||||||||||||||||||
| ||||||||||||||||||||||||||||
| $ | 11.060 | $ | 8.850 | $ | 8.150 | $ | 8.170 | $ | 7.940 | |||||||||||||||||||
| (0.020 | ) | (0.001 | ) | 0.028 | 0.033 | 0.007 | ||||||||||||||||||||||
| 0.440 | 2.248 | 0.698 | (0.053 | ) | 0.285 | |||||||||||||||||||||||
|
|
|
|
|
|
|
|
|
| |||||||||||||||||||
| 0.420 | 2.247 | 0.726 | (0.020 | ) | 0.292 | |||||||||||||||||||||||
|
|
|
|
|
|
|
|
|
| |||||||||||||||||||
| — | (0.037 | ) | (0.026 | ) | — | (0.062 | ) | |||||||||||||||||||||
|
|
|
|
|
|
|
|
|
| |||||||||||||||||||
| — | (0.037 | ) | (0.026 | ) | — | (0.062 | ) | |||||||||||||||||||||
|
|
|
|
|
|
|
|
|
| |||||||||||||||||||
| $ | 11.480 | $ | 11.060 | $ | 8.850 | $ | 8.150 | $ | 8.170 | |||||||||||||||||||
|
|
|
|
|
|
|
|
|
| |||||||||||||||||||
| 3.80% | 25.48% | 8.94% | (0.24% | ) | 3.70% | |||||||||||||||||||||||
| $ | 5,361 | $ | 5,882 | $ | 5,878 | $ | 6,745 | $ | 8,193 | |||||||||||||||||||
| 2.30% | 2.30% | 2.30% | 2.30% | 2.30% | ||||||||||||||||||||||||
| 2.55% | 2.53% | 2.51% | 2.58% | 2.77% | ||||||||||||||||||||||||
| (0.17% | ) | 0.00% | 3 | 0.33% | 0.37% | 0.09% | ||||||||||||||||||||||
| (0.43% | ) | (0.23% | ) | 0.12% | 0.09% | (0.38% | ) | |||||||||||||||||||||
| 43% | 27% | 69% | 40% | 50% | ||||||||||||||||||||||||
69
Table of Contents
Financial highlights
Delaware Global Value Fund Institutional Class
Selected data for each share of the Fund outstanding throughout each period were as follows:
Net asset value, beginning of period |
Income (loss) from investment operations: |
Net investment income1 |
Net realized and unrealized gain (loss) |
Total from investment operations |
Less dividends and distributions from: |
Net investment income |
Total dividends and distributions |
Net asset value, end of period |
Total return2 |
Ratios and supplemental data: |
Net assets, end of period (000 omitted) |
Ratio of expenses to average net assets |
Ratio of expenses to average net assets prior to fees waived |
Ratio of net investment income to average net assets |
Ratio of net investment income to average net assets prior to fees waived |
Portfolio turnover |
| 1 | The average shares outstanding method has been applied for per share information. |
| 2 | Total investment return is based on the change in net asset value of a share during the period and assumes reinvestment of dividends and distributions at net asset value. Total investment return during all of the periods shown reflects a waiver by the manager. Performance would have been lower had the waiver not been in effect. |
See accompanying notes, which are an integral part of the financial statements.
70
Table of Contents
| Year ended | ||||||||||||||||||||||||||||
|
| |||||||||||||||||||||||||||
| 11/30/14 | 11/30/13 | 11/30/12 | 11/30/11 | 11/30/10 | ||||||||||||||||||||||||
| ||||||||||||||||||||||||||||
| $ | 11.320 | $ | 9.050 | $ | 8.340 | $ | 8.340 | $ | 8.080 | |||||||||||||||||||
| 0.096 | 0.101 | 0.115 | 0.124 | 0.087 | ||||||||||||||||||||||||
| 0.451 | 2.291 | 0.709 | (0.066 | ) | 0.300 | |||||||||||||||||||||||
|
|
|
|
|
|
|
|
|
| |||||||||||||||||||
| 0.547 | 2.392 | 0.824 | 0.058 | 0.387 | ||||||||||||||||||||||||
|
|
|
|
|
|
|
|
|
| |||||||||||||||||||
| (0.097 | ) | (0.122 | ) | (0.114 | ) | (0.058 | ) | (0.127 | ) | |||||||||||||||||||
|
|
|
|
|
|
|
|
|
| |||||||||||||||||||
| (0.097 | ) | (0.122 | ) | (0.114 | ) | (0.058 | ) | (0.127 | ) | |||||||||||||||||||
|
|
|
|
|
|
|
|
|
| |||||||||||||||||||
| $ | 11.770 | $ | 11.320 | $ | 9.050 | $ | 8.340 | $ | 8.340 | |||||||||||||||||||
|
|
|
|
|
|
|
|
|
| |||||||||||||||||||
| 4.88% | 26.75% | 10.03% | 0.65% | 4.86% | ||||||||||||||||||||||||
| $ | 2,348 | $ | 2,112 | $ | 1,932 | $ | 1,685 | $ | 1,677 | |||||||||||||||||||
| 1.30% | 1.30% | 1.30% | 1.30% | 1.30% | ||||||||||||||||||||||||
| 1.55% | 1.53% | 1.51% | 1.58% | 1.77% | ||||||||||||||||||||||||
| 0.83% | 1.00% | 1.33% | 1.37% | 1.09% | ||||||||||||||||||||||||
| 0.57% | 0.77% | 1.12% | 1.09% | 0.62% | ||||||||||||||||||||||||
| 43% | 27% | 69% | 40% | 50% | ||||||||||||||||||||||||
71
Table of Contents
Financial highlights
Delaware International Value Equity Fund Class A
Selected data for each share of the Fund outstanding throughout each period were as follows:
Net asset value, beginning of period |
Income (loss) from investment operations: |
Net investment income1 |
Net realized and unrealized gain (loss) |
Total from investment operations |
Less dividends and distributions from: |
Net investment income |
Total dividends and distributions |
Net asset value, end of period |
Total return2 |
Ratios and supplemental data: |
Net assets, end of period (000 omitted) |
Ratio of expenses to average net assets |
Ratio of expenses to average net assets prior to fees waived |
Ratio of net investment income to average net assets |
Ratio of net investment income to average net assets prior to fees waived |
Portfolio turnover |
| 1 | The average shares outstanding method has been applied for per share information. |
| 2 | Total investment return is based on the change in net asset value of a share during the period and assumes reinvestment of dividends and distributions at net asset value and does not reflect the impact of a sales charge. Total investment return during some of the periods shown reflects waivers by the manager and/or distributor. Performance would have been lower had the waivers not been in effect. |
See accompanying notes, which are an integral part of the financial statements.
72
Table of Contents
| Year ended | ||||||||||||||||||||||||||||
|
| |||||||||||||||||||||||||||
| 11/30/14 | 11/30/13 | 11/30/12 | 11/30/11 | 11/30/10 | ||||||||||||||||||||||||
| ||||||||||||||||||||||||||||
| $ | 14.260 | $ | 11.590 | $ | 10.710 | $ | 11.570 | $ | 11.400 | |||||||||||||||||||
| ||||||||||||||||||||||||||||
| 0.272 | 0.169 | 0.164 | 0.211 | 0.136 | ||||||||||||||||||||||||
| (0.857 | ) | 2.654 | 0.909 | (0.966 | ) | 0.266 | ||||||||||||||||||||||
|
|
|
|
|
|
|
|
|
| |||||||||||||||||||
| (0.585 | ) | 2.823 | 1.073 | (0.755 | ) | 0.402 | ||||||||||||||||||||||
|
|
|
|
|
|
|
|
|
| |||||||||||||||||||
| ||||||||||||||||||||||||||||
| (0.145 | ) | (0.153 | ) | (0.193 | ) | (0.105 | ) | (0.232 | ) | |||||||||||||||||||
|
|
|
|
|
|
|
|
|
| |||||||||||||||||||
| (0.145 | ) | (0.153 | ) | (0.193 | ) | (0.105 | ) | (0.232 | ) | |||||||||||||||||||
|
|
|
|
|
|
|
|
|
| |||||||||||||||||||
| $ | 13.530 | $ | 14.260 | $ | 11.590 | $ | 10.710 | $ | 11.570 | |||||||||||||||||||
|
|
|
|
|
|
|
|
|
| |||||||||||||||||||
| (4.13% | ) | 24.64% | 10.25% | (6.64% | ) | 3.60% | ||||||||||||||||||||||
| ||||||||||||||||||||||||||||
| $ | 74,118 | $ | 104,289 | $ | 93,440 | $ | 103,418 | $ | 130,865 | |||||||||||||||||||
| 1.42% | 1.45% | 1.47% | 1.59% | 1.65% | ||||||||||||||||||||||||
| 1.42% | 1.51% | 1.50% | 1.59% | 1.69% | ||||||||||||||||||||||||
| 1.85% | 1.31% | 1.49% | 1.70% | 1.21% | ||||||||||||||||||||||||
| 1.85% | 1.25% | 1.46% | 1.70% | 1.17% | ||||||||||||||||||||||||
| 26% | 30% | 34% | 42% | 37% | ||||||||||||||||||||||||
73
Table of Contents
Financial highlights
Delaware International Value Equity Fund Class C
Selected data for each share of the Fund outstanding throughout each period were as follows:
Net asset value, beginning of period |
Income (loss) from investment operations: |
Net investment income1 |
Net realized and unrealized gain (loss) |
Total from investment operations |
Less dividends and distributions from: |
Net investment income |
Total dividends and distributions |
Net asset value, end of period |
Total return2 |
Ratios and supplemental data: |
Net assets, end of period (000 omitted) |
Ratio of expenses to average net assets |
Ratio of expenses to average net assets prior to fees waived |
Ratio of net investment income to average net assets |
Ratio of net investment income to average net assets prior to fees waived |
Portfolio turnover |
| 1 | The average shares outstanding method has been applied for per share information. |
| 2 | Total investment return is based on the change in net asset value of a share during the period and assumes reinvestment of dividends and distributions at net asset value and does not reflect the impact of a sales charge. Total investment return during some of the periods shown reflects a waiver by the manager. Performance would have been lower had the waiver not been in effect. |
See accompanying notes, which are an integral part of the financial statements.
74
Table of Contents
| Year ended | ||||||||||||||||||||||||||||
|
| |||||||||||||||||||||||||||
| 11/30/14 | 11/30/13 | 11/30/12 | 11/30/11 | 11/30/10 | ||||||||||||||||||||||||
| ||||||||||||||||||||||||||||
| $ | 13.990 | $ | 11.380 | $ | 10.510 | $ | 11.370 | $ | 11.220 | |||||||||||||||||||
| ||||||||||||||||||||||||||||
| 0.158 | 0.071 | 0.083 | 0.122 | 0.056 | ||||||||||||||||||||||||
| (0.828 | ) | 2.612 | 0.896 | (0.954 | ) | 0.261 | ||||||||||||||||||||||
|
|
|
|
|
|
|
|
|
| |||||||||||||||||||
| (0.670 | ) | 2.683 | 0.979 | (0.832 | ) | 0.317 | ||||||||||||||||||||||
|
|
|
|
|
|
|
|
|
| |||||||||||||||||||
| ||||||||||||||||||||||||||||
| (0.050 | ) | (0.073 | ) | (0.109 | ) | (0.028 | ) | (0.167 | ) | |||||||||||||||||||
|
|
|
|
|
|
|
|
|
| |||||||||||||||||||
| (0.050 | ) | (0.073 | ) | (0.109 | ) | (0.028 | ) | (0.167 | ) | |||||||||||||||||||
|
|
|
|
|
|
|
|
|
| |||||||||||||||||||
| $ | 13.270 | $ | 13.990 | $ | 11.380 | $ | 10.510 | $ | 11.370 | |||||||||||||||||||
|
|
|
|
|
|
|
|
|
| |||||||||||||||||||
| (4.80% | ) | 23.60% | 9.53% | (7.35% | ) | 2.87% | ||||||||||||||||||||||
| ||||||||||||||||||||||||||||
| $ | 28,609 | $ | 33,566 | $ | 30,510 | $ | 33,164 | $ | 43,620 | |||||||||||||||||||
| 2.17% | 2.20% | 2.20% | 2.29% | 2.35% | ||||||||||||||||||||||||
| 2.17% | 2.22% | 2.20% | 2.29% | 2.39% | ||||||||||||||||||||||||
| 1.10% | 0.56% | 0.76% | 1.00% | 0.51% | ||||||||||||||||||||||||
| 1.10% | 0.54% | 0.76% | 1.00% | 0.47% | ||||||||||||||||||||||||
| 26% | 30% | 34% | 42% | 37% | ||||||||||||||||||||||||
75
Table of Contents
Financial highlights
Delaware International Value Equity Fund Class R
Selected data for each share of the Fund outstanding throughout each period were as follows:
Net asset value, beginning of period |
Income (loss) from investment operations: |
Net investment income1 |
Net realized and unrealized gain (loss) |
Total from investment operations. |
Less dividends and distributions from: |
Net investment income |
Total dividends and distributions |
Net asset value, end of period |
Total return2 |
Ratios and supplemental data: |
Net assets, end of period (000 omitted) |
Ratio of expenses to average net assets |
Ratio of expenses to average net assets prior to fees waived |
Ratio of net investment income to average net assets |
Ratio of net investment income to average net assets prior to fees waived |
Portfolio turnover |
| 1 | The average shares outstanding method has been applied for per share information. |
| 2 | Total investment return is based on the change in net asset value of a share during the period and assumes reinvestment of dividends and distributions at net asset value. Total investment return during some of the periods shown reflects waivers by the manager and/or distributor. Performance would have been lower had the waivers not been in effect. |
See accompanying notes, which are an integral part of the financial statements.
76
Table of Contents
| Year ended | ||||||||||||||||||||||||||||
|
| |||||||||||||||||||||||||||
| 11/30/14 | 11/30/13 | 11/30/12 | 11/30/11 | 11/30/10 | ||||||||||||||||||||||||
| ||||||||||||||||||||||||||||
| $ | 14.200 | $ | 11.540 | $ | 10.660 | $ | 11.520 | $ | 11.360 | |||||||||||||||||||
| ||||||||||||||||||||||||||||
| 0.233 | 0.136 | 0.138 | 0.186 | 0.112 | ||||||||||||||||||||||||
| (0.851 | ) | 2.651 | 0.911 | (0.965 | ) | 0.259 | ||||||||||||||||||||||
|
|
|
|
|
|
|
|
|
| |||||||||||||||||||
| (0.618 | ) | 2.787 | 1.049 | (0.779 | ) | 0.371 | ||||||||||||||||||||||
|
|
|
|
|
|
|
|
|
| |||||||||||||||||||
| ||||||||||||||||||||||||||||
| (0.112 | ) | (0.127 | ) | (0.169 | ) | (0.081 | ) | (0.211 | ) | |||||||||||||||||||
|
|
|
|
|
|
|
|
|
| |||||||||||||||||||
| (0.112 | ) | (0.127 | ) | (0.169 | ) | (0.081 | ) | (0.211 | ) | |||||||||||||||||||
|
|
|
|
|
|
|
|
|
| |||||||||||||||||||
| $ | 13.470 | $ | 14.200 | $ | 11.540 | $ | 10.660 | $ | 11.520 | |||||||||||||||||||
|
|
|
|
|
|
|
|
|
| |||||||||||||||||||
| (4.37% | ) | 24.28% | 10.13% | (6.85% | ) | 3.32% | ||||||||||||||||||||||
| ||||||||||||||||||||||||||||
| $ | 2,317 | $ | 2,898 | $ | 2,288 | $ | 2,321 | $ | 3,127 | |||||||||||||||||||
| 1.67% | 1.70% | 1.70% | 1.79% | 1.85% | ||||||||||||||||||||||||
| 1.67% | 1.80% | 1.80% | 1.89% | 1.99% | ||||||||||||||||||||||||
| 1.60% | 1.06% | 1.26% | 1.50% | 1.01% | ||||||||||||||||||||||||
| 1.60% | 0.96% | 1.16% | 1.40% | 0.87% | ||||||||||||||||||||||||
| 26% | 30% | 34% | 42% | 37% | ||||||||||||||||||||||||
| ||||||||||||||||||||||||||||
77
Table of Contents
Financial highlights
Delaware International Value Equity Fund Institutional Class
Selected data for each share of the Fund outstanding throughout each period were as follows:
Net asset value, beginning of period |
Income (loss) from investment operations: |
Net investment income1 |
Net realized and unrealized gain (loss) |
Total from investment operations |
Less dividends and distributions from: |
Net investment income |
Total dividends and distributions |
Net asset value, end of period |
Total return2 |
Ratios and supplemental data: |
Net assets, end of period (000 omitted) |
Ratio of expenses to average net assets |
Ratio of expenses to average net assets prior to fees waived |
Ratio of net investment income to average net assets |
Ratio of net investment income to average net assets prior to fees waived |
Portfolio turnover |
| 1 | The average shares outstanding method has been applied for per share information. |
| 2 | Total investment return is based on the change in net asset value of a share during the period and assumes reinvestment of dividends and distributions at net asset value. Total investment return during some of the periods shown reflects a waiver by the manager. Performance would have been lower had the waiver not been in effect. |
See accompanying notes, which are an integral part of the financial statements.
78
Table of Contents
| Year ended | ||||||||||||||||||||||||||||
|
| |||||||||||||||||||||||||||
| 11/30/14 | 11/30/13 | 11/30/12 | 11/30/11 | 11/30/10 | ||||||||||||||||||||||||
| ||||||||||||||||||||||||||||
| $ | 14.330 | $ | 11.650 | $ | 10.770 | $ | 11.630 | $ | 11.450 | |||||||||||||||||||
| ||||||||||||||||||||||||||||
| 0.300 | 0.203 | 0.194 | 0.250 | 0.170 | ||||||||||||||||||||||||
| (0.852 | ) | 2.659 | 0.916 | (0.972 | ) | 0.270 | ||||||||||||||||||||||
|
|
|
|
|
|
|
|
|
| |||||||||||||||||||
| (0.552 | ) | 2.862 | 1.110 | (0.722 | ) | 0.440 | ||||||||||||||||||||||
|
|
|
|
|
|
|
|
|
| |||||||||||||||||||
| ||||||||||||||||||||||||||||
| (0.178 | ) | (0.182 | ) | (0.230 | ) | (0.138 | ) | (0.260 | ) | |||||||||||||||||||
|
| �� |
|
|
|
|
|
|
| |||||||||||||||||||
| (0.178 | ) | (0.182 | ) | (0.230 | ) | (0.138 | ) | (0.260 | ) | |||||||||||||||||||
|
|
|
|
|
|
|
|
|
| |||||||||||||||||||
| $ | 13.600 | $ | 14.330 | $ | 11.650 | $ | 10.770 | $ | 11.630 | |||||||||||||||||||
|
|
|
|
|
|
|
|
|
| |||||||||||||||||||
| ||||||||||||||||||||||||||||
| (3.88% | ) | 24.91% | 10.59% | (6.36% | ) | 3.93% | ||||||||||||||||||||||
| $ | 181,828 | $ | 178,614 | $ | 107,817 | $ | 90,093 | $ | 136,765 | |||||||||||||||||||
| 1.17% | 1.20% | 1.20% | 1.29% | 1.35% | ||||||||||||||||||||||||
| 1.17% | 1.22% | 1.20% | 1.29% | 1.39% | ||||||||||||||||||||||||
| 2.10% | 1.56% | 1.76% | 2.00% | 1.51% | ||||||||||||||||||||||||
| 2.10% | 1.54% | 1.76% | 2.00% | 1.47% | ||||||||||||||||||||||||
| 26% | 30% | 34% | 42% | 37% | ||||||||||||||||||||||||
79
Table of Contents
| Notes to financial statements | ||||
| Delaware International Funds | November 30, 2014 |
Delaware Group® Global & International Funds (Trust) is organized as a Delaware statutory trust and offers four series: Delaware Emerging Markets Fund, Delaware Focus Global Growth Fund, Delaware Global Value Fund, and Delaware International Value Equity Fund. These financial statements and the related notes pertain to Delaware Emerging Markets Fund, Delaware Global Value Fund, and Delaware International Value Equity Fund (each, a Fund or collectively, the Funds). The Trust is an open-end investment company. Each Fund is considered diversified under the Investment Company Act of 1940, as amended, and offers Class A, Class C, Class R, and Institutional Class shares. As of Nov. 30, 2014, Delaware Global Value Fund has not commenced operations of its Class R shares. Class A shares are sold with a maximum front-end sales charge of 5.75%. Class A share purchases of $1,000,000 or more will incur a contingent deferred sales charge (CDSC) of 1.00% if redeemed during the first year and 0.50% during the second year, provided that Delaware Distributors, L.P. (DDLP) paid a financial advisor a commission on the purchase of those shares. Between June 1, 2007 and Sept. 25, 2014, Class B shares could be purchased only through dividend reinvestment and certain permitted exchanges. Prior to June 1, 2007, Class B shares were sold with a CDSC that declined from 4.00% to zero depending upon the period of time the shares were held. Class B shares automatically converted to Class A shares on a quarterly basis approximately eight years after purchase. Effective Sept. 25, 2014, all remaining shares of Class B were converted to Class A shares. Class C shares are sold with a CDSC of 1.00%, if redeemed during the first 12 months. Class R and Institutional Class shares are not subject to a sales charge and are offered for sale exclusively to certain eligible investors.
The investment objective of Delaware Emerging Markets Fund and Delaware Global Value Fund is to seek long-term capital appreciation.
The investment objective of Delaware International Value Equity Fund is to seek long-term growth without undue risk to principal.
1. Significant Accounting Policies
The following accounting policies are in accordance with U.S. generally accepted accounting principles (U.S. GAAP) and are consistently followed by the Funds.
Security Valuation – Equity securities and exchange-traded funds (ETFs), except those traded on the Nasdaq Stock Market, Inc. (Nasdaq), are valued at the last quoted sales price as of the time of the regular close of the New York Stock Exchange on the valuation date. Securities and ETFs traded on the Nasdaq are valued in accordance with the Nasdaq Official Closing Price, which may not be the last sales price. If, on a particular day, an equity security or ETF does not trade, then the mean between the bid and ask prices will be used, which approximates fair value. Securities listed on a foreign exchange are normally valued at the last quoted sales price on the valuation date. Open-end investment company securities are valued at net asset value per share, as reported by the underlying investment company. U.S. government and agency securities are valued at the mean between the bid and ask prices, which approximates fair value. Foreign currency exchange contracts and foreign cross currency exchange contracts are valued at the mean between the bid and ask prices, which approximates fair value. Interpolated values are derived when the settlement date of the contract is an interim date for which quotations are not available. Generally, other securities and assets for which market quotations are not readily available are valued at fair value as determined in good faith under the direction of each Fund’s Board of Trustees (Board). In determining whether market quotations are readily available or fair
80
Table of Contents
valuation will be used, various factors will be taken into consideration, such as market closures or suspension of trading in a security. Each Fund may use fair value pricing more frequently for securities traded primarily in non-U.S. markets because, among other things, most foreign markets close well before each Fund values its securities, generally as of 4:00 p.m. Eastern time. The earlier close of these foreign markets gives rise to the possibility that significant events, including broad market moves, government actions or pronouncements, aftermarket trading, or news events may have occurred in the interim. Whenever such a significant event occurs, the Funds may value foreign securities using fair value prices based on third-party vendor modeling tools (international fair value pricing).
Federal and Foreign Income Taxes – No provision for federal income taxes has been made as each Fund intends to continue to qualify for federal income tax purposes as a regulated investment company under Subchapter M of the Internal Revenue Code of 1986, as amended, and make the requisite distributions to shareholders. Each Fund evaluates tax positions taken or expected to be taken in the course of preparing each Fund’s tax returns to determine whether the tax positions are “more likely-than-not” of being sustained by the applicable tax authority. Tax positions not deemed to meet the “more-likely-than-not” threshold are recorded as a tax benefit or expense in the current year. Management has analyzed each Fund’s tax positions taken for all open federal income tax years (Nov. 30, 2011 – Nov. 30, 2014), and has concluded that no provision for federal income tax is required in each Fund’s financial statements. In regards to foreign taxes only, each Fund has open tax years in certain foreign countries in which it invests that may date back to the inception of each Fund.
Class Accounting – Investment income, common expenses, and realized and unrealized gain (loss) on investments are allocated to the various classes of each Fund on the basis of daily net assets of each class. Distribution expenses relating to a specific class are charged directly to that class.
Repurchase Agreements – Each Fund may purchase certain U.S. government securities subject to the counterparty’s agreement to repurchase them at an agreed upon date and price. The counterparty will be required on a daily basis to maintain the value of the collateral subject to the agreement at not less than the repurchase price (including accrued interest). The agreements are conditioned upon the collateral being deposited under the Federal Reserve book-entry system with each Fund’s custodian or a third-party sub-custodian. In the event of default or bankruptcy by the other party to the agreement, retention of the collateral may be subject to legal proceedings. All open repurchase agreements as of the date of this report were entered into on Nov. 28, 2014.
Foreign Currency Transactions – Transactions denominated in foreign currencies are recorded at the prevailing exchange rates on the valuation date in accordance with each Fund’s prospectus. The value of all assets and liabilities denominated in foreign currencies is translated daily into U.S. dollars at the exchange rate of such currencies against the U.S. dollar. Transaction gains or losses resulting from changes in exchange rates during the reporting period or upon settlement of the foreign currency transaction are reported in operations for the current period. The Funds generally do not bifurcate that portion of realized gains and losses on investments which is due to changes in foreign exchange rates from that which is due to changes in market prices. The changes are included in the “Statements of operations” under “Net realized and unrealized gain or loss on investments.” Each Fund reports certain
81
Table of Contents
| Notes to financial statements | ||
| Delaware International Funds | ||
1. Significant Accounting Policies (continued)
foreign currency related transactions as components of realized gains (losses) for financial reporting purposes, whereas such components are treated as ordinary income (loss) for federal income tax purposes.
Use of Estimates – The preparation of financial statements in conformity with U.S. GAAP requires management to make estimates and assumptions that affect the fair value of investments, the reported amounts of assets and liabilities and disclosure of contingent assets and liabilities at the date of the financial statements, and the reported amounts of revenues and expenses during the reporting period. Actual results could differ from those estimates and the differences could be material.
Other – Expenses directly attributable to each Fund are charged directly to the Fund. Other expenses common to various funds within the Delaware Investments® Family of Funds are generally allocated among such funds on the basis of average net assets. Management fees and some other expenses are paid monthly. Security transactions are recorded on the date the securities are purchased or sold (trade date) for financial reporting purposes. Costs used in calculating realized gains and losses on the sale of investment securities are those of the specific securities sold. Dividend income is recorded on the ex-dividend date and interest income is recorded on the accrual basis. Taxable non-cash dividends are recorded as dividend income. Foreign dividends are also recorded on the ex-dividend date or as soon after the ex-dividend date that a Fund is aware of such dividends, net of all tax withholdings, a portion of which may be reclaimable. Withholding taxes and reclaims on foreign dividends have been recorded in accordance with each Fund’s understanding of the applicable country’s tax rules and rates. Each Fund may pay foreign capital gains taxes on certain foreign securities held, which are reported as components of realized losses for financial reporting purposes, whereas such components are treated as ordinary loss for federal income tax purposes. Each Fund declares and pays dividends from net investment income and distributions from net realized gain on investments, if any, annually. Each Fund may distribute more frequently, if necessary for tax purposes. Dividends and distributions, if any, are recorded on the ex-dividend date.
Each Fund may receive earnings credits from its custodian when positive cash balances are maintained, which may be used to offset custody fees. There were no earnings credits for the year ended Nov. 30, 2014.
Each Fund may receive earnings credits from its transfer agent when positive cash balances are maintained, which may be used to offset transfer agent fees. If the amount earned is greater than one dollar, the expense paid under this arrangement is included on the “Statements of operations” under “Dividend disbursing and transfer agent fees and expenses” with the corresponding expense offset shown under “Less expense paid indirectly.” For the year ended Nov. 30, 2014, each Fund earned the following amounts under this agreement:
Delaware Emerging Markets Fund | Delaware Global Value Fund | Delaware International Value Equity Fund | ||
| $1,622 | $56 | $203 |
During the year ended Nov. 30, 2014, Delaware Emerging Markets Fund frequently maintained a negative cash balance with its custodian, which is considered a form of borrowing or leverage. If that Fund
82
Table of Contents
maintains a negative cash balance and the Fund’s investments decrease in value, the Fund’s losses will be greater than if the Fund did not maintain a negative cash balance. Each Fund is required to pay interest to the custodian on negative cash balances. During the year ended Nov. 30, 2014, Delaware Emerging Markets Fund had an average outstanding overdraft balance equal to 0.54% of its average net assets.
2. Investment Management, Administration Agreements and Other Transactions with Affiliates
In accordance with the terms of its respective Investment Management Agreement, each Fund pays Delaware Management Company (DMC), a series of Delaware Management Business Trust and the investment manager, an annual fee based on each Fund’s average daily net assets as follows:
| Delaware Emerging Markets Fund | Delaware Global Value Fund | Delaware International Value Equity Fund | ||||
On the first $500 million | 1.25% | 0.85% | 0.85% | |||
On the next $500 million | 1.20% | 0.80% | 0.80% | |||
On the next $1.5 billion | 1.15% | 0.75% | 0.75% | |||
In excess of $2.5 billion | 1.10% | 0.70% | 0.70% |
DMC has contractually agreed to waive all or a portion, if any, of its management fee and reimburse each Fund to the extent necessary to ensure that total annual operating expenses, (excluding any 12b-1 fees, taxes, interest, short sale and dividend interest expenses, brokerage fees, certain insurance costs, acquired fund fees and expenses, and nonroutine expenses or costs, including, but not limited to, those relating to reorganizations, litigation, conducting shareholder meetings, and liquidations) (collectively nonroutine expenses) do not exceed specified percentages of average daily net assets of each Fund from Dec. 1, 2013 through Nov. 30, 2014* as shown below. These waivers and reimbursements may be terminated only by agreement of the Funds’ Board and DMC and apply only to expenses paid directly by the Funds.
| Delaware Emerging Markets Fund | Delaware Global Value Fund | Delaware International Value Equity Fund | ||||
| Operating expense limitation as a percentage of average daily net assets (per annum) | None | 1.30% | 1.21% |
Effective Nov. 1, 2014, Delaware Investments Fund Services Company (DIFSC), an affiliate of DMC, provides fund accounting and financial administration oversight services to each Fund. Prior to this time, Delaware Service Company, Inc. (DSC), an affiliate of DMC, provided fund accounting and financial administration oversight services to each Fund. For these services, each Fund pays DIFSC fees based on the aggregate daily net assets of the Delaware Investments® Family of Funds at the following annual rate: 0.0050% of the first $30 billion; 0.0045% of the next $10 billion; 0.0040% of the next $10 billion; and 0.0025% of aggregate average daily net assets in excess of $50 billion. The fees payable to DIFSC under the service agreement described above are allocated among all funds in the
83
Table of Contents
| Notes to financial statements | ||
| Delaware International Funds | ||
2. Investment Management, Administration Agreements and Other Transactions with Affiliates (continued)
Delaware Investments® Family of Funds on a relative net asset value basis. These amounts are included in the “Statements of operations” under “Accounting and administration expenses.” For the year ended Nov. 30, 2014, each Fund was charged for these services as follows:
Delaware Emerging | Delaware Global Value Fund | Delaware International Value Equity Fund | ||
| $139,930 | $1,229 | $15,019 |
Effective Nov. 1, 2014, DIFSC is the transfer agent and dividend disbursing agent of each Fund. Prior to this time, DSC was the transfer agent and dividend disbursing agent of each Fund. Each Fund pays DIFSC fees based on the aggregate daily net assets of the retail funds within the Delaware Investments Family of Funds at the following annual rate: 0.025% of the first $20 billion; 0.020% of the next $5 billion; 0.015% of the next $5 billion; and 0.013% on average daily net assets in excess of $30 billion. These amounts are included in the “Statements of operations” under “Dividend disbursing and transfer agent fees and expenses.” For the year ended Nov. 30, 2014, each Fund was charged for these services as follows:
Delaware Emerging | Delaware Global Value Fund | Delaware International Value Equity Fund | ||
| $630,264 | $5,543 | $67,727 |
Pursuant to a sub-transfer agency agreement between DIFSC and BNY Mellon Investment Servicing (US) Inc. (BNYMIS), BNYMIS provides certain sub-transfer agency services to the Funds. Sub-transfer agency fees are passed on to and paid directly by each Fund.
Pursuant to a distribution agreement and distribution plan, each Fund pays DDLP, the distributor and an affiliate of DMC, an annual distribution and service fee of 0.25% of the average daily net assets of the Class A shares, 1.00% of the average daily net assets of the Class B and Class C shares, and 0.50% of the average daily net assets of the Class R shares. Institutional Class shares pay no distribution and service expenses. DDLP contracted to limit each Fund’s Class B shares’ 12b-1 fees from Dec. 1, 2013 through Sept. 25, 2014** to 0.25% of average daily net assets.
As provided in the investment management agreement, each Fund bears a portion of the cost of certain resources shared with DMC, including the cost of internal personnel of DMC and/or its affiliates that provide legal, tax, and regulatory reporting services to each Fund. These amounts are included in the “Statements of operations” under “Legal Fees.” For the year ended Nov. 30, 2014, each Fund was charged for internal legal, tax, and regulatory reporting services provided by DMC and/or its affiliates’ employees as follows:
Delaware Emerging | Delaware Global Value Fund | Delaware International Value Equity Fund | ||
| $80,822 | $715 | $8,807 |
For the year ended Nov. 30, 2014, DDLP earned commissions on sales of Class A shares for each Fund as follows:
84
Table of Contents
Delaware Emerging | Delaware Global Value Fund | Delaware International Value Equity Fund | ||
| $127,771 | $2,615 | $6,352 |
For the year ended Nov. 30, 2014, DDLP received gross CDSC commissions on redemptions of each Fund’s Class A and Class C shares, and these commissions were entirely used to offset upfront commissions previously paid by DDLP to broker/dealers on sales of those shares. The amounts received were as follows:
| Delaware Emerging Markets Fund | Delaware Global Value Fund | Delaware International Value Equity Fund | ||||
Class A | $ 2 | $26 | $ — | |||
Class C | 2,067 | 53 | 246 |
Trustees’ fees include expenses accrued by each Fund for each Trustee’s retainer and meeting fees. Certain officers of DMC, DIFSC, and DDLP are officers and/or Trustees of the Trust. These officers and Trustees are paid no compensation by the Funds.
| * | The contractual period is from March 29, 2013 through March 30, 2015. |
| ** | The contractual waiver period was Feb. 1, 2014 through Sept. 25, 2015 for Delaware Emerging Markets Fund, March 1, 2014 through Sept. 25, 2015 for Delaware Global Value Fund, and Nov. 27, 2013 through Sept. 25, 2015 for Delaware International Value Equity Fund. DDLP did not waive Class B shares’ 12b-1 fees for Delaware Emerging Markets Fund and Delaware Global Value Fund prior to Feb. 1, 2014 and March 1, 2014, respectively. |
3. Investments
For the year ended Nov. 30, 2014, each Fund made purchases and sales of investment securities other than short-term investments as follows:
| Delaware Emerging Markets Fund | Delaware Global Value Fund | Delaware International Value Equity Fund | ||||||||||
Purchases | $1,182,234,971 | $10,934,644 | $78,782,041 | |||||||||
Sales | 764,368,834 | 13,829,038 | 97,909,537 | |||||||||
At Nov. 30, 2014, the cost of investments and unrealized appreciation (depreciation) for federal income tax purposes for each Fund were as follows:
| Delaware Emerging Markets Fund | Delaware Global Value Fund | Delaware International Value Equity Fund | ||||||||||
Cost of investments | $ | 3,086,082,200 | $ | 20,886,771 | $ | 279,513,781 | ||||||
|
|
|
|
|
| |||||||
Aggregate unrealized appreciation | $ | 602,773,106 | $ | 5,906,559 | $ | 59,129,120 | ||||||
Aggregate unrealized depreciation | (575,579,156 | ) | (2,015,588 | ) | (41,477,403 | ) | ||||||
|
|
|
|
|
| |||||||
Net unrealized appreciation | $ | 27,193,950 | $ | 3,890,971 | $ | 17,651,717 | ||||||
|
|
|
|
|
| |||||||
85
Table of Contents
| Notes to financial statements | ||
| Delaware International Funds | ||
3. Investments (continued)
U.S. GAAP defines fair value as the price that each Fund would receive to sell an asset or pay to transfer a liability in an orderly transaction between market participants at the measurement date under current market conditions. A three-level hierarchy for fair value measurements has been established based upon the transparency of inputs to the valuation of an asset or liability. Inputs may be observable or unobservable and refer broadly to the assumptions that market participants would use in pricing the asset or liability. Observable inputs reflect the assumptions market participants would use in pricing the asset or liability based on market data obtained from sources independent of the reporting entity. Unobservable inputs reflect the reporting entity’s own assumptions about the assumptions that market participants would use in pricing the asset or liability based on the best information available under the circumstances. Each Fund’s investment in its entirety is assigned a level based upon the observability of the inputs which are significant to the overall valuation. The three-level hierarchy of inputs is summarized below.
| Level 1 – | Inputs are quoted prices in active markets for identical investments. (Examples: equity securities, open-end investment companies, futures contracts, exchange-traded options contracts) | |
| Level 2 – | Other observable inputs, including, but not limited to: quoted prices for similar assets or liabilities in markets that are active, quoted prices for identical or similar assets or liabilities in markets that are not active, inputs other than quoted prices that are observable for the assets or liabilities (such as interest rates, yield curves, volatilities, prepayment speeds, loss severities, credit risks, and default rates), or other market-corroborated inputs. (Examples: debt securities, government securities, swap contracts, foreign currency exchange contracts, foreign securities utilizing international fair value pricing, broker-quoted securities, fair valued securities) | |
| Level 3 – | Significant unobservable inputs, including each Fund’s own assumptions used to determine the fair value of investments. (Examples: broker-quoted securities, fair valued securities) | |
Level 3 investments are valued using significant unobservable inputs. Each Fund may also use an income-based valuation approach in which the anticipated future cash flows of the investment are discounted to calculate fair value. Discounts may also be applied due to the nature or duration of any restrictions on the disposition of the investments. Valuations may also be based upon current market prices of securities that are comparable in coupon, rating, maturity, and industry. The derived value of a Level 3 investment may not represent the value which is received upon disposition and this could impact the results of operations.
86
Table of Contents
The following tables summarize the valuation of each Fund’s investments by fair value hierarchy levels as
of Nov. 30, 2014:
| Delaware Emerging Markets Fund | ||||||||||||||||
| Level 1 | Level 2 | Level 3 | Total | |||||||||||||
Common Stock | ||||||||||||||||
Argentina | $ | 100,214,441 | $ | 4,100,234 | $ | — | $ | 104,314,675 | ||||||||
Bahrain | — | 1,585,423 | — | 1,585,423 | ||||||||||||
Brazil | 471,700,058 | — | — | 471,700,058 | ||||||||||||
Canada | 515,318 | — | — | 515,318 | ||||||||||||
Chile | 26,448,257 | — | — | 26,448,257 | ||||||||||||
China/Hong Kong | 642,131,943 | — | — | 642,131,943 | ||||||||||||
Cyprus | 10,726,307 | — | — | 10,726,307 | ||||||||||||
France | 15,365,705 | — | — | 15,365,705 | ||||||||||||
India | 226,795,088 | 16,974 | — | 226,812,062 | ||||||||||||
Israel | 74,074,000 | — | — | 74,074,000 | ||||||||||||
Malaysia | 21,982,679 | — | — | 21,982,679 | ||||||||||||
Mexico | 198,188,545 | — | — | 198,188,545 | ||||||||||||
Peru | 12,950,000 | — | — | 12,950,000 | ||||||||||||
Poland | 22,740,253 | — | — | 22,740,253 | ||||||||||||
Republic of Korea | 611,837,477 | — | — | 611,837,477 | ||||||||||||
Russia | 163,657,767 | 22,406,827 | 895 | 186,065,489 | ||||||||||||
South Africa | 43,791,316 | — | — | 43,791,316 | ||||||||||||
Taiwan | 138,415,444 | — | — | 138,415,444 | ||||||||||||
Thailand | 47,979,306 | — | — | 47,979,306 | ||||||||||||
Turkey | 43,976,767 | — | — | 43,976,767 | ||||||||||||
United Kingdom | 1,708,915 | — | — | 1,708,915 | ||||||||||||
United States | 31,317,140 | — | — | 31,317,140 | ||||||||||||
Preferred Stock1 | 34,527,325 | 17,125,906 | — | 51,653,231 | ||||||||||||
Exchange-Traded Funds | 87,882,840 | — | — | 87,882,840 | ||||||||||||
Participation Notes | — | — | — | — | ||||||||||||
Short-Term Investments | — | 39,113,000 | — | 39,113,000 | ||||||||||||
|
|
|
|
|
|
|
| |||||||||
Total | $ | 3,028,926,891 | $ | 84,348,364 | $ | 895 | $ | 3,113,276,150 | ||||||||
|
|
|
|
|
|
|
| |||||||||
Foreign Currency Exchange Contracts | $ | — | $ | 57,358 | $ | — | $ | 57,358 | ||||||||
1Security type is valued across multiple levels. The amounts attributed to Level 1 investments and Level 2 investments represent 66.84% and 33.16%, respectively, of the total market value of this security type. Level 1 investments represent exchange traded investments and Level 2 investments represent investments with observable inputs.
87
Table of Contents
| Notes to financial statements | ||
| Delaware International Funds | ||
3. Investments (continued)
| Delaware Global Value Fund | ||||||||||||
| Level 1 | Level 2 | Total | ||||||||||
Common Stock | $ | 24,063,316 | $ | — | $ | 24,063,316 | ||||||
Short-Term Investments | — | 600,526 | 600,526 | |||||||||
Securities Lending Collateral | — | 113,900 | 113,900 | |||||||||
|
|
|
|
|
| |||||||
Total | $ | 24,063,316 | $ | 714,426 | $ | 24,777,742 | ||||||
|
|
|
|
|
| |||||||
| Delaware International Value Equity Fund | ||||||||||||
| Level 1 | Level 2 | Total | ||||||||||
Common Stock | $ | 282,081,804 | $ | — | $ | 282,081,804 | ||||||
Short-Term Investments | — | 4,099,061 | 4,099,061 | |||||||||
Securities Lending Collateral | — | 10,984,633 | 10,984,633 | |||||||||
|
|
|
|
|
| |||||||
Total | $ | 282,081,804 | $ | 15,083,694 | $ | 297,165,498 | ||||||
|
|
|
|
|
| |||||||
The securities that have been deemed worthless on the “Schedules of investments” are considered to be Level 3 securities in these tables.
During the year ended Nov. 30, 2014, there were no transfers between Level 1 investments, Level 2 investments, or Level 3 investments that had a significant impact to each Fund. This does not include transfers between Level 1 investments and Level 2 investments due to each Fund utilizing international fair value pricing during the period. In accordance with the fair valuation procedures described in Note 1, international fair value pricing of securities in each Fund occurs when market volatility exceeds an established rolling threshold. If the threshold is exceeded on a given date, then prices of international securities (those that traded on exchanges that close at a different time than the time that each Fund’s net asset value is determined) will be established using a separate pricing feed from a third party vendor designed to establish a price for each such security as of the time that each Fund’s net asset value is determined. Further, international fair value pricing uses other observable market-based inputs in place of the closing exchange price due to the events occurring after the close of the exchange or market on which the investment is principally traded, causing a change in classification between levels. Each Fund’s policy is to recognize transfers at the beginning of the reporting period.
A reconciliation of Level 3 investments is presented when a Fund has a significant amount of Level 3 investments at the beginning, interim or end of the period in relation to the Fund’s net assets. Management has determined not to provide additional disclosure on Level 3 inputs under ASU No. 2011-04 since the Level 3 investments are not considered significant to any Fund’s net assets at the end of the year.
At Nov. 30, 2014, Delaware Global Value Fund and Delaware International Value Equity Fund had no Level 3 investments.
4. Dividend and Distribution Information
Income and long-term capital gain distributions are determined in accordance with federal income tax regulations, which may differ from U.S. GAAP. Additionally, distributions from net gains on foreign
88
Table of Contents
currency transactions and net short-term gains on sales of investment securities are treated as ordinary income for federal income tax purposes. The tax character of dividends and distributions paid during the years ended Nov. 30, 2014 and 2013 was as follows:
| Delaware Emerging Markets Fund | Delaware Global Value Fund | Delaware International Value Equity Fund | |||||||||||||
Year ended Nov. 30, 2014 | |||||||||||||||
Ordinary income | $ | 22,806,622 | $ | 124,546 | $ | 3,417,743 | |||||||||
Year ended Nov. 30, 2013 | |||||||||||||||
Ordinary income | $ | 16,611,586 | $ | 235,895 | $ | 3,141,612 | |||||||||
5. Components of Net Assets on a Tax Basis
As of Nov. 30, 2014, the components of net assets on a tax basis were as follows:
| Delaware Emerging Markets Fund | Delaware Global Value Fund | Delaware International Value Equity Fund | |||||||||||||
Shares of beneficial interest | $ | 3,000,106,072 | $ | 43,425,499 | $ | 447,609,019 | |||||||||
Undistributed ordinary income | 26,327,278 | 89,666 | 5,825,327 | ||||||||||||
Undistributed long-term capital gains | 52,697,119 | — | — | ||||||||||||
Capital loss carryforwards | — | (22,744,549 | ) | (184,169,213 | ) | ||||||||||
Unrealized appreciation | 21,367,503 | 3,888,078 | 17,606,980 | ||||||||||||
|
|
|
|
|
| ||||||||||
Net assets | $ | 3,100,497,972 | $ | 24,658,694 | $ | 286,872,113 | |||||||||
|
|
|
|
|
| ||||||||||
The differences between book basis and tax basis components of net assets are primarily attributable to tax deferral of losses on wash sales, and tax recognition of unrealized gain on passive foreign investment companies.
For financial reporting purposes, capital accounts are adjusted to reflect the tax character of permanent book/tax differences. Reclassifications are primarily due to tax treatment of gain (loss) on foreign currency transactions and passive foreign investment companies. Results of operations and net assets were not affected by these reclassifications. For year ended Nov. 30, 2014, the Funds recorded the following reclassifications:
| Delaware Emerging Markets Fund | Delaware Global Value Fund | Delaware International Value Equity Fund | |||||||||||||
Undistributed (distributions in excess of) net investment income | $ | 556,559 | $ | (18,521 | ) | $ | (255,319 | ) | |||||||
Accumulated net realized gain (loss) on investments | (556,559 | ) | 18,521 | 255,319 | |||||||||||
89
Table of Contents
| Notes to financial statements | ||
| Delaware International Funds | ||
For federal income tax purposes, capital loss carryforwards may be carried forward and applied against future capital gains.
In 2014, the Funds utilized capital loss carryforwards as follows:
Delaware Emerging Markets Fund | $ | 2,500,841 | ||
Delaware Global Value Fund | 2,951,170 | |||
Delaware International Value Equity Fund | 12,091,867 |
Capital loss carryforwards remaining at Nov. 30, 2014 will expire as follows:
| Delaware Emerging Markets Fund | Delaware Global Value Fund | Delaware International Value Equity Fund | |||||||||||||
Year of expiration | |||||||||||||||
2016 | $ | — | $ | 10,201,872 | $ | 62,141,156 | |||||||||
2017 | — | 12,542,677 | 113,289,581 | ||||||||||||
2019 | — | — | 8,738,476 | ||||||||||||
|
|
|
|
|
| ||||||||||
Total | $ | — | $ | 22,744,549 | $ | 184,169,213 | |||||||||
|
|
|
|
|
| ||||||||||
On Dec. 22, 2010, the Regulated Investment Company Modernization Act of 2010 (Act) was enacted, which changed various technical rules governing the tax treatment of regulated investment companies. The changes were generally effective for taxable years beginning after the date of enactment. Under the Act, each Fund is permitted to carry forward capital losses incurred in taxable years beginning after the date of enactment for an unlimited period. However, any losses incurred during those future taxable years will be required to be utilized prior to the losses incurred in pre-enactment taxable years, which carry an expiration date. As a result of this ordering rule, pre-enactment capital loss carryforwards may be more likely to expire unused. Additionally, post-enactment capital loss carryforwards will retain their character as either short-term or long-term capital losses rather than being considered all short-term as permitted under previous regulation. At Nov. 30, 2014, there were no capital loss carryforwards incurred by the Funds that will be carried forward under the Act.
90
Table of Contents
6. Capital Shares
Transactions in capital shares were as follows:
| Delaware Emerging Markets Fund | Delaware Global Value Fund | Delaware International Value Equity Fund | ||||||||||||||||||||||
| Year | Year | Year | Year | Year | Year | |||||||||||||||||||
| ended | ended | ended | ended | ended | ended | |||||||||||||||||||
| 11/30/14 | 11/30/13 | 11/30/14 | 11/30/13 | 11/30/14 | 11/30/13 | |||||||||||||||||||
Shares sold: | ||||||||||||||||||||||||
Class A | 14,505,685 | 16,348,836 | 194,985 | 130,210 | 1,055,634 | 994,776 | ||||||||||||||||||
Class B | 355 | 544 | 31 | 1 | 79 | 645 | ||||||||||||||||||
Class C | 3,815,185 | 2,588,286 | 43,147 | 58,690 | 173,347 | 244,425 | ||||||||||||||||||
Class R | 754,384 | 187,053 | — | — | 23,034 | 65,326 | ||||||||||||||||||
Institutional Class | 79,899,892 | 95,634,359 | 50,382 | 24,558 | 5,094,493 | 5,115,636 | ||||||||||||||||||
Shares issued upon reinvestment of dividends and distributions: | ||||||||||||||||||||||||
Class A | 215,559 | 255,543 | 9,148 | 18,817 | 74,353 | 101,865 | ||||||||||||||||||
Class B | 70 | 602 | — | 595 | 501 | 1,436 | ||||||||||||||||||
Class C | 8,995 | 14,228 | — | 2,370 | 8,470 | 16,185 | ||||||||||||||||||
Class R | 1,668 | 1,041 | — | — | 1,675 | 2,154 | ||||||||||||||||||
Institutional Class | 725,120 | 569,518 | 1,468 | 2,719 | 157,110 | 141,580 | ||||||||||||||||||
|
|
|
|
|
|
|
|
|
|
|
| |||||||||||||
| 99,926,913 | 115,600,010 | 299,161 | 237,960 | 6,588,696 | 6,684,028 | |||||||||||||||||||
|
|
|
|
|
|
|
|
|
|
|
| |||||||||||||
Shares redeemed: | ||||||||||||||||||||||||
Class A | (19,101,339 | ) | (20,748,366 | ) | (261,755 | ) | (473,510 | ) | (2,968,656 | ) | (1,843,499 | ) | ||||||||||||
Class B | (131,085 | ) | (577,074 | ) | (107,762 | ) | (51,486 | ) | (142,571 | ) | (123,991 | ) | ||||||||||||
Class C | (2,496,978 | ) | (2,998,514 | ) | (108,186 | ) | (193,507 | ) | (425,165 | ) | (541,676 | ) | ||||||||||||
Class R | (204,237 | ) | (62,967 | ) | — | — | (56,904 | ) | (61,514 | ) | ||||||||||||||
Institutional Class | (49,342,853 | ) | (64,967,383 | ) | (39,041 | ) | (54,200 | ) | (4,352,143 | ) | (2,047,778 | ) | ||||||||||||
|
|
|
|
|
|
|
|
|
|
|
| |||||||||||||
| (71,276,492 | ) | (89,354,304 | ) | (516,744 | ) | (772,703 | ) | (7,945,439 | ) | (4,618,458 | ) | |||||||||||||
|
|
|
|
|
|
|
|
|
|
|
| |||||||||||||
Net increase (decrease) | 28,650,421 | 26,245,706 | (217,583 | ) | (534,743 | ) | (1,356,743 | ) | 2,065,570 | |||||||||||||||
|
|
|
|
|
|
|
|
|
|
|
| |||||||||||||
91
Table of Contents
| Notes to financial statements | ||
Delaware International Funds
6. Capital Shares (continued) | ||
For the years ended Nov. 30, 2014 and 2013, the following shares and values were converted from Class B to Class A. The respective amounts are included in Class B redemptions and Class A subscriptions in the tables on the previous page and the “Statements of changes in net assets.”
| Year ended | Year ended | |||||||||||||||||||||||
| 11/30/14 | 11/30/13 | |||||||||||||||||||||||
| Class B | Class A | Class B | Class A | |||||||||||||||||||||
| Shares | Shares | Value | Shares | Shares | Value | |||||||||||||||||||
Delaware Emerging Markets Fund | 33,015 | 31,318 | $ | 521,580 | 87,273 | 82,711 | $ | 1,201,688 | ||||||||||||||||
Delaware Global Value Fund | 31,991 | 31,514 | 366,688 | 16,543 | 16,289 | 162,112 | ||||||||||||||||||
Delaware International Value Equity Fund | 46,482 | 45,935 | 647,640 | 32,628 | 32,166 | 404,244 | ||||||||||||||||||
For each Fund, certain shareholders may exchange shares of one class of shares for shares of another class in the same Fund. For the year ended Nov. 30, 2014, exchange transactions were as follows:
| Exchange Redemptions | Exchange Subscriptions | |||||||||||||||||||||||
| Institutional | Institutional | |||||||||||||||||||||||
| Class A | Class C | Class | Class A | Class | ||||||||||||||||||||
| Shares | Shares | Shares | Shares | Shares | Value | |||||||||||||||||||
Delaware Emerging Markets Fund | 1,347,933 | 5,305 | 1,478 | 1,490 | 1,343,519 | $ | 23,106,103 | |||||||||||||||||
Delaware International Value Equity Fund | 1,514 | 22,900 | — | — | 23,877 | 326,209 | ||||||||||||||||||
These exchange transactions are included as subscriptions and redemptions in the tables on the previous page and the “Statements of changes in net assets.” For the year ended Nov. 30, 2014, Delaware Global Value Fund had no exchange transactions.
7. Line of Credit
Each Fund, along with certain other funds in the Delaware Investments® Family of Funds (Participants), was a participant in a $225,000,000 revolving line of credit intended to be used for temporary or emergency purposes as an additional source of liquidity to fund redemptions of investor shares. Under the agreement, the Participants were charged an annual commitment fee of 0.08%, which was allocated across the Participants on the basis of each Participant’s allocation of the entire facility. The Participants were permitted to borrow up to a maximum of one third of their net assets under the agreement. Each Participant was individually, and not jointly, liable for its particular advances, if any, under the line of credit. The line of credit available under the agreement expired on Nov. 10, 2014.
On Nov. 10, 2014, each Fund, along with the other Participants, entered into an amendment to the agreement for a $275,000,000 revolving line of credit. The line of credit is to be used as described above and operates in substantially the same manner as the original agreement. The line of credit available under the agreement expires on Nov. 9, 2015.
92
Table of Contents
The Funds had no amounts outstanding as of Nov. 30, 2014 or at any time during the year then ended.
8. Derivatives
U.S. GAAP requires disclosures that enable investors to understand: (1) how and why an entity uses derivatives; (2) how they are accounted for; and (3) how they affect an entity’s results of operations and financial position.
Foreign Currency Exchange Contracts – Each Fund may enter into foreign currency exchange contracts and foreign cross currency exchange contracts as a way of managing foreign exchange rate risk. Each Fund may enter into these contracts to fix the U.S. dollar value of a security that it has agreed to buy or sell for the period between the date the trade was entered into and the date the security is delivered and paid for. Each Fund may also use these contracts to hedge the U.S. dollar value of securities it already owns that are denominated in foreign currencies. In addition, each Fund may enter into these contracts to facilitate or expedite the settlement of portfolio transactions. The change in value is recorded as an unrealized gain or loss. When the contract is closed, a realized gain or loss is recorded equal to the difference between the value of the contract at the time it was opened and the value at the time it was closed.
The use of foreign currency exchange contracts and foreign cross currency exchange contracts does not eliminate fluctuations in the underlying prices of the securities, but does establish a rate of exchange that can be achieved in the future. Although foreign currency exchange contracts and foreign cross currency exchange contracts limit the risk of loss due to an unfavorable change in the value of the hedged currency, they also limit any potential gain that might result should the value of the currency change favorably. In addition, each Fund could be exposed to risks if the counterparties to the contracts are unable to meet the terms of their contracts. Each Fund’s maximum risk of loss from counterparty credit risk is the value of its currency exchanged with the counterparty. The risk is generally mitigated by having a netting arrangement between each Fund and the counterparty and by the posting of collateral by the counterparty to the Fund to cover the Fund’s exposure to the counterparty.
During the year ended Nov. 30, 2014, Delaware Emerging Markets Fund entered into foreign currency exchange contracts and foreign cross currency exchange contracts to facilitate or expedite the settlement of portfolio transactions. Delaware Global Value Fund and Delaware International Value Equity Fund entered into foreign currency exchange contracts and foreign cross currency contracts in order to fix the U.S. dollar value of a security between trade date and settlement date.
At Nov. 30, 2014, the Funds had foreign currency risk, which is disclosed in the “Statements of assets and liabilities” and “Statements of operations.”
93
Table of Contents
| Notes to financial statements | ||
| Delaware International Funds | ||
8. Derivatives (continued)
Derivatives Generally. The table below summarizes the average balance of derivative holdings by each Fund during the year ended Nov. 30, 2014.
Long Derivative Volume | |||||||||||||||
| Delaware Emerging Markets Fund | Delaware Global Value Fund | Delaware International Value Equity Fund | |||||||||||||
Foreign currency exchange contracts (average cost) | $ | 2,298,934 | $ | 30,330 | $ | 409,549 | |||||||||
Short Derivative Volume | |||||||||||||||
| Delaware Emerging Markets Fund | Delaware Global Value Fund | Delaware International Value Equity Fund | |||||||||||||
Foreign currency exchange contracts (average cost) | $ | 1,428,324 | $ | 38,282 | $ | 508,388 | |||||||||
9. Offsetting
In December 2011, the Financial Accounting Standards Board (FASB) issued guidance that expands disclosure requirements on the offsetting of certain assets and liabilities. The disclosures are required for investments and derivative financial instruments subject to master netting or similar agreements which are eligible for offset in the “Statements of assets and liabilities” and require an entity to disclose both gross and net information about such investments and transactions in the financial statements. In January 2013, the FASB issued guidance that clarifies which investments and transactions are subject to the offsetting disclosure requirements. The scope of the disclosure requirements for offsetting is limited to derivative instruments, repurchase agreements and reverse repurchase agreements, and securities borrowing. The guidance is effective for financial statements with fiscal years beginning on or after Jan. 1, 2013, and interim periods within those fiscal years. The Funds adopted the disclosure provisions on offsetting during the current reporting period.
In order to better define their contractual rights and to secure rights that will help each Fund mitigate its counterparty risk, the Funds entered into an International Swaps and Derivatives Association, Inc. Master Agreement (ISDA Master Agreement) or a similar agreement with each of their derivative contract counterparties. An ISDA Master Agreement is a bilateral agreement between each Fund and a counterparty that governs certain over-the-counter (OTC) derivatives and foreign exchange contracts and typically contains, among other things, collateral posting items and netting provisions in the event of a default and/or termination event. Under an ISDA Master Agreement, each Fund may, under certain circumstances, offset with the counterparty certain derivative financial instrument’s payables and/or receivables with collateral held and/or posted and create one single net payment. The provisions of the ISDA Master Agreement typically permit a single net payment in the event of default (close-out) including the bankruptcy or insolvency of the counterparty. However, bankruptcy or insolvency laws of a particular jurisdiction may impose restrictions on or prohibitions against the right of offset in bankruptcy, insolvency, or other events.
94
Table of Contents
For financial reporting purposes, the Funds do not offset derivative assets and derivative liabilities that are subject to netting arrangements in the “Statements of assets and liabilities.”
At Nov. 30, 2014, the Funds had the following assets and liabilities subject to offsetting provisions:
Offsetting of Financial Assets and Liabilities and Derivative Assets and Liabilities
| Delaware Emerging Markets Fund | ||||||||||||
Counterparty | Gross Value of Derivative Asset | Gross Value of Derivative Liability | Net Position | |||||||||
BNY Mellon | $57,454 | $(96) | $57,358 | |||||||||
|
|
|
|
|
| |||||||
Counterparty | Net Position | Fair Value of Non-Cash Collateral Received | Cash Collateral Received | Fair Value of Non-Cash Collateral Pledged | Cash Collateral Pledged | Net Amount(a) | ||||||||||||||||||
BNY Mellon | $57,358 | $ — | $ — | $ — | $ — | $57,358 | ||||||||||||||||||
|
|
|
|
|
|
|
|
|
|
|
| |||||||||||||
Master Repurchase Agreements Counterparty | Repurchase Agreements | Fair Value of Non - Cash Collateral Received | Cash Collateral Received | Net Amount(a) | ||||||||||||
Bank of America Merrill Lynch | $13,790,408 | $(13,790,408) | $ — | $ — | ||||||||||||
Bank of Montreal | 4,596,803 | (4,596,803) | — | — | ||||||||||||
BNP Paribas | 20,725,789 | (20,725,789) | — | |||||||||||||
|
|
|
|
|
|
|
| |||||||||
Total | $39,113,000 | $(39,113,000) | $ — | $ — | ||||||||||||
|
|
|
|
|
|
|
| |||||||||
| Delaware Global Value Fund | ||||||||||||||||
Master Repurchase Agreements Counterparty | Repurchase Agreements | Fair Value of Non-Cash Collateral Received | Cash Collateral Received | Net Amount(a) | ||||||||||||
Bank of America Merrill Lynch | $113,178 | $(113,178) | $ — | $ — | ||||||||||||
Bank of Montreal | 37,726 | (37,726) | — | — | ||||||||||||
BNP Paribas | 170,096 | (170,096) | — | — | ||||||||||||
|
|
|
|
|
|
|
| |||||||||
Total | $321,000 | $(321,000) | — | $ — | ||||||||||||
|
|
|
|
|
|
|
| |||||||||
95
Table of Contents
| Notes to financial statements | ||
| Delaware International Funds | ||
9. Offsetting (continued)
| Delaware International Value Equity Fund | ||||||||
Master Repurchase Agreements Counterparty | Repurchase | Fair Value of Non-Cash | Cash Collateral Received | Net Amount(a) | ||||
Bank of America Merrill Lynch | $1,176,908 | $(1,176,908) | $— | $— | ||||
Bank of Montreal | 392,302 | (392,302) | — | — | ||||
BNP Paribas | 1,768,790 | (1,768,790) | — | — | ||||
|
|
|
| |||||
Total | $3,338,000 | $(3,338,000) | $— | $— | ||||
|
|
|
| |||||
(a)Net amount represents the receivable/(payable) that would be due from/(to) the counterparty in the event of default.
10. Securities Lending
Each Fund, along with other funds in the Delaware Investments® Family of Funds, may lend its securities pursuant to a security lending agreement (Lending Agreement) with The Bank of New York Mellon (BNY Mellon). At the time a security is loaned, the borrower must post collateral equal to the required percentage of the market value of the loaned security, including any accrued interest. The required percentage is: (1) 102% with respect to U.S. securities and foreign securities that are denominated and payable in U.S. dollars; and (2) 105% with respect to foreign securities. With respect to each loan, if on any business day the aggregate market value of securities collateral plus cash collateral held is less than the aggregate market value of the securities which are the subject of such loan, the borrower will be notified to provide additional collateral by the end of the following business day which, together with the collateral already held, will be not less than the applicable initial collateral requirements for such security loan. If the aggregate market value of securities collateral and cash collateral held with respect to a security loan exceeds the applicable initial collateral requirement, upon the request of the borrower, BNY Mellon must return enough collateral to the borrower by the end of the following business day to reduce the value of the remaining collateral to the applicable initial collateral requirement for such security loan. As a result of the foregoing, the value of the collateral held with respect to a loaned security on any particular day may be more or less than the value of security on loan.
Cash collateral received is generally invested in the Delaware Investments Collateral Fund No. 1 (Collective Trust) established by BNY Mellon for the purpose of investment on behalf of funds managed by DMC that participate in BNY Mellon’s securities lending program. The Collective Trust may invest in U.S. government securities and high-quality corporate debt, asset-backed and other money market securities and in repurchase agreements collateralized by such securities, provided that the Collective Trust will generally have a dollar-weighted average portfolio maturity of 60 days or less. Each Fund can also accept U.S. government securities and letters of credit (non-cash collateral) in connection with securities loans. In the event of default or bankruptcy by the lending agent, realization and/or retention of the collateral may be subject to legal proceedings. In the event the borrower fails to return loaned securities and the collateral received is insufficient to cover the value of the loaned securities and provided such collateral shortfall is not the result of investment losses, the lending agent has agreed to pay the amount of the shortfall to each Fund or, at the discretion of the lending agent, replace the loaned securities. Each Fund continues to record dividends or interest, as applicable, on the securities loaned
96
Table of Contents
and is subject to changes in value of the securities loaned that may occur during the term of the loan. Each Fund has the right under the Lending Agreement to recover the securities from the borrower on demand. With respect to security loans collateralized by non-cash collateral, each Fund receives loan premiums paid by the borrower. With respect to security loans collateralized by cash collateral, the earnings from the collateral investments are shared among each Fund, the security lending agent and the borrower. Each Fund records security lending income net of allocations to the security lending agent and the borrower.
The Collective Trust used for the investment of cash collateral received from borrowers of securities seeks to maintain a net asset value per unit of $1.00, but there can be no assurance that it will always be able to do so. Each Fund may incur investment losses as a result of investing securities lending collateral in the Collective Trust or another collateral investment pool. This could occur if an investment in a collateral investment pool defaulted or if it were necessary to liquidate assets in the collateral investment pool to meet returns on outstanding security loans at a time when the collateral investment pool’s net asset value per unit was less than $1.00. Under those circumstances, each Fund may not receive an amount from the collateral investment pool that is equal in amount to the collateral each Fund would be required to return to the borrower of the securities and each Fund would be required to make up for this shortfall.
At Nov. 30, 2014, the values of securities on loan and the values of invested collateral for each Fund are presented below, for which cash collateral was received and invested in accordance with the Lending Agreement. These investments are presented on the “Schedules of investments” under the caption “Securities Lending Collateral.”
Delaware Emerging | Delaware Global Value Fund | Delaware International | ||||
Values of securities on loan | $— | $208,274 | $10,474,045 | |||
Value of non-cash collateral | — | 145,613 | — | |||
Values of invested collateral | — | 113,900 | 10,984,633 |
11. Credit and Market Risk
Some countries in which the Funds may invest require governmental approval for the repatriation of investment income, capital, or the proceeds of sales of securities by foreign investors. In addition, if there is deterioration in a country’s balance of payments or for other reasons, a country may impose temporary restrictions on foreign capital remittances abroad.
The securities exchanges of certain foreign markets are substantially smaller, less liquid, and more volatile than the major securities markets in the United States. Consequently, acquisition and disposition of securities by each Fund may be inhibited. In addition, a significant portion of the aggregate market value of equity securities listed on the major securities exchanges in emerging markets is held by a smaller number of investors. This may limit the number of shares available for acquisition or disposition by each Fund.
97
Table of Contents
| Notes to financial statements | ||
| Delaware International Funds | ||
11. Credit and Market Risk (continued)
Each Fund may invest up to 15% of its net assets in illiquid securities, which may include securities with contractual restrictions on resale, securities exempt from registration under Rule 144A of the Securities Act of 1933, as amended, and other securities which may not be readily marketable. The relative illiquidity of these securities may impair each Fund from disposing of them in a timely manner and at a fair price when it is necessary or desirable to do so. While maintaining oversight, the Funds’ Board has delegated to DMC the day-to-day functions of determining whether individual securities are liquid for purposes of each Fund’s limitation on investments in illiquid securities. Securities eligible for resale pursuant to Rule 144A, which are determined to be liquid, are not subject to the Funds’ 15% limit on investments in illiquid securities. Rule 144A and illiquid securities have been identified on the “Schedules of investments.”
12. Contractual Obligations
Each Fund enters into contracts in the normal course of business that contain a variety of indemnifications. Each Fund’s maximum exposure under these arrangements is unknown. However, the Funds have not had prior claims or losses pursuant to these contracts. Management has reviewed each Fund’s existing contracts and expects the risk of loss to be remote.
13. Recent Accounting Pronouncements
In June 2014, the FASB issued guidance to improve the financial reporting of reverse repurchase agreements and similar transactions. The guidance includes expanded disclosure requirements for entities that enter into reverse repurchase agreements and similar transactions accounted for as secured borrowings. The guidance is effective for financial statements with fiscal years beginning on or after Dec. 15, 2014 and interim periods within those fiscal years. Management is evaluating the impact, if any, of this guidance on the Funds’ financial statement disclosures.
14. Subsequent Events
Management has determined that no material events or transactions occurred subsequent to Nov. 30, 2014 that would require recognition or disclosure in the Funds’ financial statements.
98
Table of Contents
Registered Public Accounting Firm
To the Board of Trustees of Delaware Group® Global & International Funds
and Shareholders of Delaware Emerging Markets Fund,
Delaware Global Value Fund and Delaware International Value Equity Fund:
In our opinion, the accompanying statements of assets and liabilities, including the schedules of investments, and the related statements of operations and of changes in net assets and the financial highlights present fairly, in all material respects, the financial position of Delaware Emerging Markets Fund, Delaware Global Value Fund and Delaware International Value Equity Fund (three of the series constituting Delaware Group® Global & International Funds, hereafter collectively referred to as the “Funds”) at November 30, 2014, the results of each of their operations for the year then ended, the changes in each of their net assets for each of the two years in the period then ended and the financial highlights for each of the five years in the period then ended, in conformity with accounting principles generally accepted in the United States of America. These financial statements and financial highlights (hereafter referred to as “financial statements”) are the responsibility of the Funds’ management. Our responsibility is to express an opinion on these financial statements based on our audits. We conducted our audits of these financial statements in accordance with the standards of the Public Company Accounting Oversight Board (United States). Those standards require that we plan and perform the audit to obtain reasonable assurance about whether the financial statements are free of material misstatement. An audit includes examining, on a test basis, evidence supporting the amounts and disclosures in the financial statements, assessing the accounting principles used and significant estimates made by management, and evaluating the overall financial statement presentation. We believe that our audits, which included confirmation of securities at November 30, 2014 by correspondence with the custodian and brokers, and the application of alternative auditing procedures where confirmations of security purchases had not been received, provide a reasonable basis for our opinion.
PricewaterhouseCoopers LLP
Philadelphia, Pennsylvania
January 22, 2015
99
Table of Contents
Other Fund information (Unaudited)
Delaware International Funds
Board Consideration of Delaware Emerging Markets Fund, Delaware Global Value Fund, and Delaware International Value Equity Fund Investment Management Agreements
At a meeting held on Aug. 19–21, 2014 (the “Annual Meeting”), the Board of Trustees (the “Board”), including a majority of disinterested or independent Trustees, approved the renewal of the Investment Management Agreements for Delaware Emerging Markets Fund, Delaware Global Value Fund, and Delaware International Value Equity Fund (each, a “Fund” and together, the “Funds”). In making its decision, the Board considered information furnished at regular quarterly Board meetings, including reports detailing Fund performance, investment strategies and expenses, as well as information prepared specifically in connection with the renewal of the investment advisory and sub-advisory contracts. Information furnished specifically in connection with the renewal of the Investment Management Agreements with Delaware Management Company (“DMC”) included materials provided by DMC and its affiliates (“Delaware Investments”) concerning, among other things, the nature, extent and quality of services provided to the Funds, the costs of such services to the Funds, economies of scale and the financial condition and profitability of Delaware Investments. In addition, in connection with the Annual Meeting, reports were provided to the Trustees in May 2014 and included reports provided by Lipper, Inc., an independent statistical compilation organization (“Lipper”). The Lipper reports compared each Fund’s investment performance and expenses with those of other comparable mutual funds. The Independent Trustees reviewed and discussed the Lipper reports with independent legal counsel to the Independent Trustees. The Board requested and received information regarding DMC’s policy with respect to advisory fee levels and its breakpoint philosophy; the structure of portfolio manager compensation; the investment manager’s profitability; comparative client fee information; and any constraints or limitations on the availability of securities for certain investment styles, which had in the past year inhibited, or which were likely in the future to inhibit, DMC’s ability to invest fully in accordance with Fund policies.
In considering information relating to the approval of each Fund’s advisory agreement, the Independent Trustees received assistance and advice from and met separately with independent legal counsel to the Independent Trustees. Although the Board gave attention to all information furnished, the following discussion identifies, under separate headings, the primary factors taken into account by the Board during its contract renewal considerations.
Nature, Extent, and Quality of Service. The Board considered the services provided by Delaware Investments to each Fund and its shareholders. In reviewing the nature, extent and quality of services, the Board considered reports furnished to it throughout the year, which covered matters such as the relative performance of the Funds, compliance of portfolio managers with the investment policies, strategies and restrictions for the Funds, compliance by DMC and Delaware Distributors, L.P. (together, “Management”) personnel with the Code of Ethics adopted throughout the Delaware Investments® Family of Funds complex and adherence to fair value pricing procedures as established by the Board. The Board was pleased with the current staffing of the Funds’ investment manager and the emphasis placed on research in the investment process. The Board recognized DMC’s receipt of several industry distinctions. The Board gave favorable consideration to DMC’s efforts to control expenditures while maintaining service levels committed to Fund matters. The Board noted that, in the third and fourth quarters of 2013, Management reduced the maximum 12b-1 fee for certain funds; and in November 2013 Management negotiated a substantial reduction in fees for fund accounting services
100
Table of Contents
provided to the Funds. The Board noted the benefits provided to Fund shareholders through each shareholder’s ability to exchange an investment in one Delaware Investments® fund for the same class of shares in another Delaware Investments fund without a sales charge, to reinvest Fund dividends into additional shares of the same Fund or into additional shares of other Delaware Investments funds and the privilege to combine holdings in other Delaware Investments funds to obtain a reduced sales charge. The Board was satisfied with the nature, extent and quality of the overall services provided by Delaware Investments.
Investment Performance. The Board placed significant emphasis on the investment performance of the Funds in view of the importance of investment performance to shareholders. Although the Board gave appropriate consideration to performance reports and discussions with portfolio managers at Investment Committee meetings throughout the year, the Board gave particular weight to the Lipper reports furnished for the Annual Meeting. The Lipper reports prepared for each Fund showed the investment performance of its Class A shares in comparison to a group of similar funds as selected by Lipper (the “Performance Universe”). A fund with the best performance ranked first, and a fund with the poorest performance ranked last. The highest/best performing 25% of funds in the Performance Universe make up the first quartile; the next 25%, the second quartile; the next 25%, the third quartile; and the poorest/ worst performing 25% of funds in the Performance Universe make up the fourth quartile. Comparative annualized performance for each Fund was shown for the past 1-, 3-, 5-, and 10-year periods, to the extent applicable, ended March 31, 2014. The Board’s objective is that each Fund’s performance for the periods considered be at or above the median of its Performance Universe. The following paragraphs summarize the performance results for the Funds and the Board’s view of such performance.
Delaware Emerging Markets Fund – The Performance Universe for the Fund consisted of the Fund and all retail and institutional emerging markets funds as selected by Lipper. The Lipper report comparison showed that the Fund’s total return for the 1-, 3-, 5-, and 10-year periods was in the first quartile of its Performance Universe. The Board was extremely satisfied with performance.
Delaware Global Value Fund – The Performance Universe for the Fund consisted of the Fund and all retail and institutional global multi-cap value funds as selected by Lipper. The Lipper report comparison showed that the Fund’s total return for the 1- and 3-year periods was in the third quartile of its Performance Universe. The report further showed that the Fund’s total return for the 5- and 10-year periods was in the second quartile and first quartile, respectively, of its Performance Universe. The Board determined that the Fund’s performance results were mixed, but tended toward above median, which was acceptable.
Delaware International Value Equity Fund – Lipper currently classifies the Fund as an international multi-cap value fund. However, because of the nature of the portfolio, Management believes that it would be more appropriate to include the Fund in the multi-cap core category. Accordingly, the Lipper report prepared for the Fund compares the Fund’s performance to two separate Performance Universes – one consisting of the Fund and all retail and institutional multi-cap core funds. and the other consisting of the Fund and all retail and institutional multi-cap value funds. When compared to other multi-cap core funds, the Lipper report comparison showed that the Fund’s total return for the 1-, 5-, and 10-year periods was in the third quartile of its Performance Universe. The report further showed that the Fund’s total return for the three-year period was in the fourth quartile of its Performance Universe. When compared to other
101
Table of Contents
Other Fund information (Unaudited)
Delaware International Funds
multi-cap value funds, the Lipper report comparison showed that the Fund’s total return for the one- and three-year periods was in the fourth quartile of its Performance Universe. The report further showed that the Fund’s total return for the 5- and 10-year periods was in the third quartile of its Performance Universe. The Board observed that the Fund’s performance results were not in line with the Board’s objective. In evaluating the Fund’s performance, the Board considered investment policy changes implemented in May 2014. The Board also considered the numerous investment and performance reports delivered by Management personnel to the Board’s Investments Committee. The Board was satisfied that Management was taking action to improve Fund performance and to meet the Board’s performance objective.
Comparative Expenses. The Board considered expense comparison data for the Delaware Investments® Family of Funds. Management provided the Board with information on pricing levels and fee structures for each Fund as of its most recently completed fiscal year. The Board also focused on the comparative analysis of effective management fees and total expense ratios of each Fund versus effective management fees and expense ratios of a group of similar funds as selected by Lipper (the “Expense Group”). In reviewing comparative costs, each Fund’s contractual management fee and the actual management fee incurred by the Fund were compared with the contractual management fees (assuming all funds in the Expense Group were similar in size to the Fund) and actual management fees (as reported by each fund) within the Expense Group, taking into account any applicable breakpoints and fee waivers. Each Fund’s total expenses were also compared with those of its Expense Group. The Lipper total expenses, for comparative consistency, were shown by Lipper for Class A shares and comparative total expenses including 12b-1 and non 12b-1 service fees. The Board considered fees paid to Delaware Investments for non-management services. The Board’s objective is to limit each Fund’s total expense ratio to be competitive with that of the Expense Group. The following paragraphs summarize the expense results for the Funds and the Board’s view of such expenses.
Delaware Emerging Markets Fund – The expense comparisons for the Fund showed that its actual management fee was in the quartile with the highest expenses of its Expense Group and its total expenses were in the quartile with the second highest expenses of its Expense Group. The Board noted that the Fund’s management fee and total expenses were not in line with the Board’s objective. In evaluating total expenses, the Board considered various initiatives implemented by Management, such as the outsourcing of certain transfer agency services and a negotiation of lower fees for fund accounting services, which had created an opportunity for a further reduction in expenses. The Board was satisfied with Management’s efforts to improve the Fund’s total expense ratio and to bring it in line with the Board’s objective.
Delaware Global Value Fund – The expense comparisons for the Fund showed that its actual management fee and total expenses were in the quartile with the second lowest expenses of its Expense Group. The Board was satisfied with the management fee and total expenses of the Fund in comparison to its Expense Group as shown in the Lipper report.
Delaware International Value Equity Fund – When compared to other international multi-cap core and multi-cap value funds, the expense comparisons for the Fund showed that its actual management fee was in the quartile with the second highest expenses of its Expense Group and its total expenses were in
102
Table of Contents
the quartile with the second lowest expenses of its Expense Group. The Board was satisfied with the total expenses of the Fund in comparison to those of both Expense Groups as shown in the Lipper report.
Management Profitability. The Board considered the level of profits realized by Delaware Investments in connection with the operation of the Funds. In this respect, the Board reviewed the Investment Management Profitability Analysis that addressed the overall profitability of Delaware Investments’ business in providing management and other services to each of the individual funds and the Delaware Investments® Family of Funds as a whole. Specific attention was given to the methodology followed in allocating costs for the purpose of determining profitability. Management stated that the level of profits of Delaware Investments, to a certain extent, reflects recent operational cost savings and efficiencies initiated by Delaware Investments. The Board considered Delaware Investments’ efforts to improve services provided to fund shareholders and to meet additional regulatory and compliance requirements resulting from recent industry-wide Securities and Exchange Commission initiatives. The Board also considered the extent to which Delaware Investments might derive ancillary benefits from fund operations, including the potential for procuring additional business as a result of the prestige and visibility associated with its role as service provider to the Delaware Investments Family of Funds and the benefits from allocation of fund brokerage to improve trading efficiencies. The Board found that the management fees were reasonable in light of the services rendered and the level of profitability of Delaware Investments.
Economies of Scale. The Trustees considered whether economies of scale are realized by Delaware Investments as each Fund’s assets increase and the extent to which any economies of scale are reflected in the level of management fees charged. The Trustees reviewed the standardized advisory fee pricing and structure, approved by the Board and shareholders, which includes breakpoints. Breakpoints in the advisory fee occur when the advisory fee rate is reduced on assets in excess of specified levels. Breakpoints result in a lower advisory fee than would otherwise be the case on all assets when the asset levels specified are exceeded. The Board noted that the fee under each Fund’s management contract fell within the standard structure. Although the Funds have not reached a size at which they can take advantage of breakpoints, the Board recognized that the fees were structured so that when the Funds grow, economies of scale may be shared.
103
Table of Contents
Other Fund information (Unaudited)
Delaware International Funds
Tax Information (Unaudited)
The information set forth below is for each Fund’s fiscal year as required by federal income tax laws. Shareholders, however, must report distributions on a calendar year basis for income tax purposes, which may include distributions for portions of two fiscal years of a fund. Accordingly, the information needed by shareholders for income tax purposes will be sent to them in January of each year. Please consult your tax advisor for proper treatment of this information.
All reporting is based on financial information available as of the date of this annual report and, accordingly is subject to change. For any and all items requiring reporting, it is the intention of each Fund to report the maximum amount permitted under the Internal Revenue Code and the regulations thereunder.
For the fiscal year ended Nov. 30, 2014, each Fund reports distributions paid during the year as follows:
(A) Long-Term | (B) Ordinary | Total Distribution (Tax Basis) | (C) Qualifying | |||||||||||
Delaware Emerging Markets Fund | — | 100.00% | 100.00% | 2.86% | ||||||||||
Delaware Global Value Fund | — | 100.00% | 100.00% | 100.00% | ||||||||||
Delaware International Value Equity Fund | — | 100.00% | 100.00% | 2.55% | ||||||||||
(A) and (B) are based on a percentage of each Fund’s total distributions.
(C) is based on a percentage of each Fund’s ordinary income distributions.
1 Qualifying dividends represent dividends which qualify for the corporate dividends received deduction.
| * | For the fiscal year ended Nov. 30, 2014, certain dividends paid by each Fund may be subject to a maximum tax rate of 20%. The percentage of dividends paid by each Fund from ordinary income reported as dividend income is listed below. Complete information will be computed and reported in conjunction with your 2014 Form 1099-DIV. |
Delaware Emerging Markets Fund | Delaware Global Value Fund | Delaware International Value Equity Fund | ||
| 100.00% | 100.00% | 100.00% |
104
Table of Contents
Each Fund intends to pass through foreign tax credits in the maximum amount as follows:
Delaware Emerging Markets Fund | Delaware Global Value Fund | Delaware International Value Equity Fund | ||
$2,986,275 | $ — | $458,072 |
The gross foreign source income earned during the fiscal year 2014 by each Fund was as follows:
Delaware Emerging Markets Fund | Delaware Global Value Fund | Delaware International Value Equity Fund | ||
$53,118,141 | $ — | $9,901,156 |
For the fiscal year ended Nov. 30, 2014, certain dividends paid by the Delaware Emerging Markets Fund and the Delaware International Value Equity Fund, have been determined to be interest related dividends and may be subject to relief from U.S. withholding for foreign shareholders, as provided by the American Jobs Creation Act of 2004, and by the Tax Relief Unemployment Insurance Reauthorization and Job Creations Act of 2010, and as extended by the American Taxpayer Relief Act of 2012. For the fiscal year ended Nov. 30, 2014, the Funds have reported maximum Qualified Interest Income distributions of $1,566 and $1,638, respectively. In addition, Delaware Emerging Markets Fund has reported $11,590,885 of Qualified Short-Term Capital Gains.
105
Table of Contents
Board of trustees / directors and officers addendum
Delaware Investments® Family of Funds
A mutual fund is governed by a Board of Trustees / Directors (“Trustees”), which has oversight responsibility for the management of a fund’s business affairs. Trustees establish procedures and oversee and review the performance of the investment manager, the distributor, and others who perform services for the fund. The independent fund trustees, in particular, are advocates
Name, Address, and Birth Date | Position(s) Held with Fund(s) | Length of Time Served | ||
Interested Trustee | ||||
| Patrick P. Coyne1 | Chairman, President, | Chairman and Trustee | ||
| 2005 Market Street | Chief Executive Officer, | since Aug. 16, 2006 | ||
| Philadelphia, PA 19103 | and Trustee | |||
| April 1963 | President and | |||
| Chief Executive Officer | ||||
since Aug. 1, 2006
| ||||
Independent Trustees | ||||
| Thomas L. Bennett | Trustee | Since March 2005 | ||
| 2005 Market Street | ||||
| Philadelphia, PA 19103 | ||||
October 1947
| ||||
| Joseph W. Chow | Trustee | Since January 2013 | ||
| 2005 Market Street | ||||
| Philadelphia, PA 19103 | ||||
January 1953
| ||||
| John A. Fry | Trustee | Since January 2001 | ||
| 2005 Market Street | ||||
| Philadelphia, PA 19103 | ||||
May 1960
|
| 1 | Patrick P.Coyne is considered to be an “Interested Trustee“ because he is an executive officer of the Fund’s(s’) investment advisor. |
106
Table of Contents
for shareholder interests. Each trustee has served in that capacity since he or she was elected to or appointed to the Board of Trustees, and will continue to serve until his or her retirement or the election of a new trustee in his or her place. The following is a list of the Trustees and Officers with certain background and related information.
Principal Occupation(s) During the Past Five Years | Number of Portfolios in Fund Complex Overseen by Trustee or Officer | Other Directorships Held by Trustee or Officer | ||
| ||||
| Patrick P. Coyne has served in | 65 | Board of Governors Member | ||
| various executive capacities | Investment Company | |||
| at different times at | Institute (ICI) | |||
| Delaware Investments.2 | ||||
| Director and Audit | ||||
| Committee Member | ||||
| Kaydon Corp. | ||||
| (2007–2013) | ||||
| ||||
| Private Investor | 65 | Director | ||
| (March 2004–Present) | Bryn Mawr Bank Corp. (BMTC) | |||
(2007–2011)
| ||||
| Executive Vice President | 65 | Director and Audit Committee | ||
| (Emerging Economies | Member — Hercules | |||
| Strategies, Risk and | Technology Growth | |||
| Corporate Administration) | Capital, Inc. | |||
| State Street Corporation | (2004-2014) | |||
(July 2004–March 2011)
| ||||
| President | 65 | Director — | ||
| Drexel University | Hershey Trust Company | |||
| (August 2010–Present) | ||||
| Director, Audit Committee, | ||||
| President | and Governance | |||
| Franklin & Marshall College | Committee Member | |||
(July 2002–July 2010)
| Community Health Systems
|
| 2 | Delaware Investments is the marketing name for Delaware Management Holdings, Inc. and its subsidiaries, including the Fund’s(s’) investment advisor, principal underwriter, and its transfer agent. |
107
Table of Contents
Board of trustees / directors and officers addendum
Delaware Investments® Family of Funds
Name, Address, and Birth Date | Position(s) Held with Fund(s) | Length of Time Served | ||
Independent Trustees (continued) | ||||
| Lucinda S. Landreth | Trustee | Since March 2005 | ||
| 2005 Market Street | ||||
| Philadelphia, PA 19103 | ||||
| June 1947 | ||||
| Frances A. Sevilla-Sacasa | Trustee | Since September 2011 | ||
| 2005 Market Street | ||||
| Philadelphia, PA 19103 | ||||
January 1956
| ||||
| Thomas K. Whitford | Trustee | Since January 2013 | ||
| 2005 Market Street | ||||
| Philadelphia, PA 19103 | ||||
March 1956
|
108
Table of Contents
Principal Occupation(s) During the Past 5 Years | Number of Portfolios in Fund Complex Overseen by Trustee or Officer | Other Directorships Held by Trustee or Officer | ||
| ||||
| Private Investor | 65 | None | ||
(2004–Present)
| ||||
| Chief Executive Officer — | 65 | Trust Manager and | ||
| Banco Itaú | Audit Committee | |||
| International | Member — Camden | |||
| (April 2012–Present) | Property Trust | |||
| Executive Advisor to Dean | ||||
(August 2011–March 2012) and Interim Dean | ||||
| (January 2011–July 2011) — | ||||
| University of Miami School of | ||||
| Business Administration | ||||
| President — U.S. Trust, | ||||
| Bank of America Private | ||||
| Wealth Management | ||||
| (Private Banking) | ||||
| (July 2007 – December 2008) | ||||
| Vice Chairman | 65 | Director — HSBC Finance | ||
| (2010–April 2013) | Corporation and HSBC | |||
| Chief Administrative | North America Holdings Inc. | |||
Officer (2008–2010) and Executive Vice | ||||
| President and Chief | ||||
| Administrative Officer | ||||
| (2007–2009) — | ||||
| PNC Financial | ||||
| Services Group | ||||
109
Table of Contents
Board of trustees / directors and officers addendum
Delaware Investments® Family of Funds
Name, Address, and Birth Date | Position(s) Held with Fund(s) | Length of Time Served | ||
Independent Trustees (continued) | ||||
| Janet L. Yeomans | Trustee | Since April 1999 | ||
| 2005 Market Street | ||||
| Philadelphia, PA 19103 | ||||
July 1948
| ||||
| J. Richard Zecher | Trustee | Since March 2005 | ||
| 2005 Market Street | ||||
| Philadelphia, PA 19103 | ||||
July 1940
|
110
Table of Contents
Principal Occupation(s) During the Past Five Years | Number of Portfolios in Fund Complex Overseen by Trustee or Officer | Other Directorships Held by Trustee or Officer | ||
| ||||
| Vice President and Treasurer | 65 | Director, Audit and | ||
| (January 2006–July 2012) | Compliance Committee Chair, | |||
| Vice President — | Investment Committee | |||
| Mergers & Acquisitions | Member | |||
| (January 2003–January 2006), | and Governance | |||
| and Vice President | Committee Member | |||
| and Treasurer | Okabena Company | |||
| (July 1995–January 2003) | ||||
| 3M Corporation | ||||
| Chair — 3M | ||||
| Investment Management | ||||
| Company | ||||
(2005–2012)
| ||||
| Founder | 65 | Director and Compensation | ||
| Investor Analytics | Committee Chairman | |||
| (Risk Management) | Investor Analytics | |||
| (May 1999–Present) | ||||
| Director — P/E Investments | ||||
| Founder | ||||
| P/E Investments | ||||
| (Hedge Fund) | ||||
(September 1996–Present)
|
111
Table of Contents
Board of trustees / directors and officers addendum
Delaware Investments® Family of Funds
Name, Address, and Birth Date | Position(s) Held with Fund(s) | Length of Time Served | ||
Officers | ||||
| David F. Connor | Senior Vice President, | Senior Vice President, | ||
| 2005 Market Street | Deputy General | Deputy General Counsel | ||
| Philadelphia, PA 19103 | Counsel, and Secretary | since May 2013; | ||
| December 1963 | Vice President, Deputy | |||
| General Counsel | ||||
| September 2000 – | ||||
| May 2013; Secretary since | ||||
October 2005
| ||||
| Daniel V. Geatens | Vice President | Treasurer since October 2007 | ||
| 2005 Market Street | and Treasurer | |||
| Philadelphia, PA 19103 | ||||
October 1972
| ||||
| David P. O’Connor | Executive Vice President, | Executive Vice President | ||
| 2005 Market Street | General Counsel | since February 2012; | ||
| Philadelphia, PA 19103 | and Chief Legal Officer | Senior Vice President | ||
| February 1966 | October 2005 – | |||
| February 2012; | ||||
| General Counsel and | ||||
| Chief Legal Officer | ||||
since October 2005
| ||||
| Richard Salus | Senior Vice President | Chief Financial Officer | ||
| 2005 Market Street | and Chief Financial Officer | since November 2006 | ||
| Philadelphia, PA 19103 | ||||
October 1963
|
The Statement of Additional Information for the Fund(s) includes additional information about the Trustees and Officers and is available, without charge, upon request by calling 800 523-1918.
112
Table of Contents
Principal Occupation(s) During the Past Five Years | Number of Portfolios in Fund Complex Overseen by Trustee or Officer | Other Directorships Held by Trustee or Officer | ||
| ||||
David F. Connor has served as Deputy General Counsel of Delaware Investments since 2000.
| 65 | None3 | ||
| Daniel V. Geatens has served | 65 | None3 | ||
in various capacities at different times at | ||||
Delaware Investments.
| ||||
| David P. O’Connor has served | 65 | None3 | ||
in various executive and legal capacities at different times at Delaware Investments.
| ||||
| Richard Salus has served in | 65 | None3 | ||
various executive capacities at different times at | ||||
Delaware Investments.
|
| 3 | David F. Connor, Daniel V. Geatens, David P. O’Connor, and Richard Salus serve in similar capacities for the six portfolios of the Optimum Fund Trust, which have the same investment advisor, principal underwriter, and transfer agent as the registrant. |
113
Table of Contents
| Board of trustees | ||||||
Patrick P. Coyne | Joseph W. Chow | Lucinda S. Landreth | Thomas K. Whitford | |||
| Chairman, President, and | Former Executive Vice | Former Chief Investment | Former Vice Chairman | |||
| Chief Executive Officer | President | Officer | PNC Financial Services Group | |||
| Delaware Investments® | State Street Corporation | Assurant, Inc. | Pittsburgh, PA | |||
| Family of Funds | Brookline, MA | Philadelphia, PA | ||||
| Philadelphia, PA | Janet L. Yeomans | |||||
| John A. Fry | Frances A. | Former Vice President and | ||||
| Thomas L. Bennett | President | Sevilla-Sacasa | Treasurer | |||
| Private Investor | Drexel University | Chief Executive Officer | 3M Corporation | |||
| Rosemont, PA | Philadelphia, PA | Banco Itaú | St. Paul, MN | |||
International Miami, FL |
J. Richard Zecher | |||||
| Founder | ||||||
| Investor Analytics | ||||||
| Scottsdale, AZ | ||||||
| Affiliated officers | ||||||
| David F. Connor | Daniel V. Geatens | David P. O’Connor | Richard Salus | |||
| Senior Vice President, | Vice President and | Executive Vice President, | Senior Vice President and | |||
| Deputy General Counsel, | Treasurer | General Counsel, | Chief Financial Officer | |||
| and Secretary | Delaware Investments | and Chief Legal Officer | Delaware Investments | |||
| Delaware Investments | Family of Funds | Delaware Investments | Family of Funds | |||
| Family of Funds | Philadelphia, PA | Family of Funds | Philadelphia, PA | |||
| Philadelphia, PA | Philadelphia, PA | |||||
This annual report is for the information of Delaware Emerging Markets Fund, Delaware Global Value Fund, and Delaware International Value Equity Fund shareholders, but it may be used with prospective investors when preceded or accompanied by the Delaware Investments Fund fact sheet for the most recently completed calendar quarter. These documents are available at delawareinvestments.com.
Delaware Investments is the marketing name of Delaware Management Holdings, Inc. and its subsidiaries. Each Fund files its complete schedule of portfolio holdings with the Securities and Exchange Commission (SEC) for the first and third quarters of each fiscal year on Form N-Q. Each Fund’s Forms N-Q, as well as a description of the policies and procedures that each Fund uses to determine how to vote proxies (if any) relating to portfolio securities are available without charge (i) upon request, by calling 800 523-1918; and (ii) on the SEC’s website at sec.gov. In addition, a description of the policies and procedures that each Fund uses to determine how to vote proxies (if any) relating to portfolio securities and each Fund’s Schedule of Investments are available without charge on the Funds’ website at delawareinvestments.com. Each Fund’s Forms N-Q may be reviewed and copied at the SEC’s Public Reference Room in Washington, D.C.; information on the operation of the Public Reference Room may be obtained by calling 800 SEC-0330. Information (if any) regarding how the Funds voted proxies relating to portfolio securities during the most recently disclosed 12-month period ended June 30 is available without charge (i) through the Funds’ website at delawareinvestments.com; and (ii) on the SEC’s website at sec.gov.
114
 |
|
Annual report
Global / international equity mutual fund
Delaware Focus Global Growth Fund
November 30, 2014
Carefully consider the Fund’s investment objectives, risk factors, charges, and expenses before investing. This and other information can be found in the Fund’s prospectus and its summary prospectus, which may be obtained by visiting delawareinvestments.com or calling 800 523-1918. Investors should read the prospectus and the summary prospectus carefully before investing.
You can obtain shareholder reports and prospectuses online instead of in the mail.
Visit delawareinvestments.com/edelivery.
Experience Delaware Investments
Delaware Investments is committed to the pursuit of consistently superior asset management and unparalleled client service. We believe in our investment processes, which seek to deliver consistent results, and in convenient services that help add value for our clients.
If you are interested in learning more about creating an investment plan, contact your financial advisor.
You can learn more about Delaware Investments or obtain a prospectus for Delaware Focus Global Growth Fund at delawareinvestments.com.
Manage your investments online
| • | 24-hour access to your account information |
| • | Obtain share prices |
| • | Check your account balance and recent transactions |
| • | Request statements or literature |
| • | Make purchases and redemptions |
Delaware Management Holdings, Inc. and its subsidiaries (collectively known by the marketing name of Delaware Investments) are wholly owned subsidiaries of Macquarie Group Limited, a global provider of banking, financial, advisory, investment and funds management services.
Investments in Delaware Focus Global Growth Fund are not and will not be deposits with or liabilities of Macquarie Bank Limited ABN 46 008 583 542 and its holding companies, including their subsidiaries or related companies (Macquarie Group), and are subject to investment risk, including possible delays in repayment and loss of income and capital invested. No Macquarie Group company guarantees or will guarantee the performance of the Fund, the repayment of capital from the Fund, or any particular rate of return.
Table of contents
| ||||
| 1 | ||||
| 4 | ||||
| 8 | ||||
| 10 | ||||
| 12 | ||||
| 16 | ||||
| 18 | ||||
| 20 | ||||
| 22 | ||||
| 30 | ||||
| 43 | ||||
| 44 | ||||
| 52 | ||||
| 60 | ||||
Unless otherwise noted, views expressed herein are current as of Nov. 30, 2014, and subject to change for events occurring after such date.
Funds are not FDIC insured and are not guaranteed. It is possible to lose the principal amount invested.
Mutual fund advisory services provided by Delaware Management Company, a series of Delaware Management Business Trust, which is a registered investment advisor. Delaware Investments, a member of Macquarie Group, refers to Delaware Management Holdings, Inc. and its subsidiaries, including the Fund’s distributor, Delaware Distributors, L.P. Macquarie Group refers to Macquarie Group Limited and its subsidiaries and affiliates worldwide.
© 2015 Delaware Management Holdings, Inc.
All third-party marks cited are the property of their respective owners.
| Delaware Focus Global Growth Fund | December 9, 2014 |
| Performance preview (for the year ended November 30, 2014) | ||||||||
Delaware Focus Global Growth Fund (Class A shares) | 1-year return | +6.37 | % | |||||
MSCI World Index (gross) | 1-year return | +9.50 | % | |||||
MSCI World Index (net) | 1-year return | +8.91 | % |
Past performance does not guarantee future results.
For complete, annualized performance for Delaware Focus Global Growth Fund, please see the table on page 4. The performance of Class A shares excludes the applicable sales charge and reflects the reinvestment of all distributions. For a description of the index, please, see page 6. Index performance returns do not reflect any management fees, transaction costs, or expenses. Indices are unmanaged and one cannot invest directly in an index.
Jackson Square Partners, LLC (JSP) is the sub-advisor to the Fund. As sub-advisor, JSP is responsible for day-today management of the Fund’s assets. Although JSP serves as sub-advisor, the investment manager, Delaware Management Company, a series of Delaware Management Business Trust, has ultimate responsibility for all investment advisory services.
Global equity markets took separate paths during the fiscal year ended Nov. 30, 2014. The United States displayed resilience in its ability to recover from the recent global financial crisis while international markets were marked by a continuing struggle, most notably in Japan and the euro zone.
U.S. markets displayed fairly steady, consistent growth during the fiscal year, as indicated by the healthy 17% rise in the S&P 500® Index (source: FactSet). The U.S. Federal Reserve wrapped up its program of quantitative easing (QE) in October, a move that distinguished the U.S. from other markets still struggling to recover from the global economic crisis.
In Japan, economic policy changes enacted after Prime Minister Shinzo Abe’s reelection in November 2012 were in the spotlight as the country’s economy continued to flounder. Dubbed “Abenomics,” the three-pronged economic approach was intended to battle two decades of deflation and stagnant growth. Instead, the program was challenged during the period by a precipitous drop in oil prices and a dramatic dip in the yen’s valuation. The Bank of Japan, in the
midst of a large-scale QE program, recently printed an additional 80 trillion yen, attempting to increase exports and stimulate inflation. Market participants are trying to discern the long-term consequences of these moves.
In Europe, the economy began to improve early in the fiscal year, but stalled midway through. Russia’s invasion of Ukraine had a significant adverse effect on European growth. Ukraine is a key transit point for Europe, and Russia supplies almost 40% of the gas imports of the European Union (EU). Eventually, the EU brokered a deal between Russia and Ukraine to ensure an adequate energy source for European nations this winter. The agreement has been hailed as a potential first step in easing tensions between Russia and Ukraine.
Currency issues continued to haunt the 18-country euro zone, particularly in the second half of the fiscal year period. Government debt continued to rise, particularly in Greece, Portugal, and Ireland and concerns mounted about those nations’ ability to service their debts. To combat falling euro values and to stave off the risk of deflation, the European Central Bank (ECB) cut both its prime rate and deposit rate in May, while also reducing its long-term loan rate for qualifying banks. ECB president Mario Draghi indicated the ECB is willing to do “whatever it takes” to turn the euro-zone economy around and has set the tone for a potential large-scale QE program in the coming year.
1
Portfolio management review
Delaware Focus Global Growth Fund
Emerging market economies also continued to struggle, most notably in China, where a 10-year growth run may be winding down. Excess investment in real estate development, housing, infrastructure, and industrial endeavors have resulted in considerable debt that may take years to absorb. How much of an impact this will have on the economy is a question yet to be determined.
Fund performance
For the fiscal year ended Nov. 30, 2014, Delaware Focus Global Growth Fund (Class A shares) returned +6.37% at net asset value and +0.25% at maximum offer price (both figures reflect all distributions reinvested). During the same period, the Fund’s benchmark, the MSCI World Index (net), returned +8.91%. For complete, annualized performance of Delaware Focus Global Growth Fund, please see the table on page 4.
Allergan was a strong contributor to performance during the period. The stock experienced a strong rise in price following acquisition offers from Canada-based Valeant Pharmaceuticals International and the eventual announcement that Activis, a generic and specialty drug manufacturer, would acquire Allergan at a premium to previous offers by Valeant. While we continue to believe Allergan operates at a high level — driven by the core ophthalmology franchise and the broader use of Botox in both cosmetic and in other medical indications — we are currently discussing what a combined company means for Allergan going forward.
Celgene contributed to performance during the period as the company experienced several positive events throughout the year. The company made significant progress toward regulatory approval for expanded use of one of its drugs within the United Kingdom. It also achieved positive clinical advancements for a new drug to treat Crohn’s disease. Overall, Celgene continues to be a leader in the treatment of blood cancers
with a growing pipeline of breast, lung, and pancreatic cancer treatments. We believe the company continues to benefit from large growth prospects driven by additional indications for its drugs, by increased use of existing drugs, and by international growth opportunities.
Baidu was also a contributor to performance during the period. The stock rose as the company reported attractive financial results, driven in part, by strong growth in its mobile services. Baidu’s heavy capital investment in mobile-related services already appears to be providing benefits for the company. We believe the company stands to benefit widely from the proliferation of wireless and streaming technologies in China that make Baidu’s services more accessible. We feel the company has upside potential given the sheer size of the Chinese market population and the rapid growth of ancillary businesses such as social media, multi-media sharing services, and mobile search.
NeuStar detracted from performance during the period. The company experienced weakness as the approval process — allowing the company to remain the sole database provider of cell phone numbers and other related information for the North American wireless carrier industry — was in negotiations and had come increasingly into question. While we felt the renewal would ultimately be granted, at least in most of its current form, there were growing concerns. While we continue to believe the company has attractive business-model characteristics and an attractive cash-flow-based valuation, we decided to exit the Fund’s position during the period due to the company’s higher risk profile.
Core Laboratories likewise detracted from performance during the period. The stock declined as investors grew increasingly concerned about utilization of Core Laboratories services by North American clients in the near term. We are willing to live with a certain degree of cyclicality in the energy industry given that this company’s
2
solutions to site analysis are valuable throughout the cycle. In our view, this is a well-owned stock with little historical controversy and volatility. Therefore, we believe investors may be overreacting to potentially transitory weakness in commodity prices which may be contributing to a reasonable and conservative assessment of industry conditions by company management.
Intertek Group was also a detractor from performance during the period. The stock experienced weakness as we believe investors grew increasingly concerned about the company’s anemic organic growth and its lack of improvement, even possible weakness, in margins. Despite these concerns, in our opinion, the company continues to have solid
fundamentals that demonstrate its ability to navigate difficult economic environments. We think the company should benefit from its participation in a secular growth segment of the product testing and certification industry.
Regardless of the economic outcome, we remain consistent in our long-term investment philosophy: We want to own what we view as strong secular-growth companies with solid business models and competitive positions that we believe can grow market share and have the potential to deliver shareholder value in a variety of market environments.
3
| Delaware Focus Global Growth Fund | November 30, 2014 |
The performance data quoted represent past performance; past performance does not guarantee future results. Investment return and principal value will fluctuate so your shares, when redeemed, may be worth more or less than their original cost. Please obtain the performance data current for the most recent month end by calling 800 523-1918 or visiting our website at delawareinvestments.com/performance. Current performance may be lower or higher than the performance data quoted.
| Fund and benchmark performance1,2 | Average annual total returns through November 30, 2014 | |||||||||||
| 1 year | 5 years | Lifetime | ||||||||||
Class A (Est. Dec. 29, 2008) | ||||||||||||
Excluding sales charge | +6.37 | % | +13.39 | % | +18.63 | % | ||||||
Including sales charge | +0.25 | % | +12.06 | % | +17.45 | % | ||||||
Class C (Est. Dec. 29, 2010) | ||||||||||||
Excluding sales charge | +5.59 | % | n/a | +9.25 | % | |||||||
Including sales charge | +4.59 | % | n/a | +9.25 | % | |||||||
Class R (Est. Dec. 29, 2010) | ||||||||||||
Excluding sales charge | +6.10 | % | n/a | +9.78 | % | |||||||
Including sales charge | +6.10 | % | n/a | +9.78 | % | |||||||
Institutional Class (Est. Dec. 29, 2008) | ||||||||||||
Excluding sales charge | +6.66 | % | �� | +13.62 | % | +18.84 | % | |||||
Including sales charge | +6.66 | % | +13.62 | % | +18.84 | % | ||||||
MSCI World Index (gross)* | +9.50 | % | +11.57 | % | +14.43 | % | ||||||
MSCI World Index (net)* | +8.91 | % | +10.96 | % | +13.79 | % | ||||||
*Benchmark lifetime returns are for Class A share comparison only and are of the month end prior to the Class A inception date.
1 Returns reflect the reinvestment of all distributions and are presented both with and without the applicable sales charges described below. Returns do not reflect the deduction of taxes the shareholder would pay on Fund distributions or redemptions of Fund shares.
Expense limitations were in effect for certain classes during some or all of the periods shown in the “Fund and benchmark performance” table. Expenses for each class are listed on the “Fund expense ratios” table on page 5. Performance would have been lower had expense limitations not been in effect.
Class A shares are sold with a maximum front-end sales charge of 5.75%, and have an annual distribution and service fee of 0.25% of average daily net assets. Performance for Class A shares,
excluding sales charges, assumes that no front-end sales charge applied.
Class C shares are sold with a contingent deferred sales charge of 1.00% if redeemed during the first 12 months. They are also subject to an annual distribution and service fee of 1.00% of average daily net assets. Performance for Class C shares, excluding sales charges, assumes either that contingent deferred sales charges did not apply or that the investment was not redeemed.
Class R shares are available only for certain retirement plan products. They are sold without a sales charge and have an annual distribution and service fee of 0.50% of average daily net assets.
4
Institutional Class shares are available without sales or asset-based distribution charges only to certain eligible institutional accounts.
The “Fund and benchmark performance” table does not reflect the deduction of taxes the shareholder would pay on Fund distributions or redemptions of Fund shares.
Investments in small and/or medium-sized companies typically exhibit greater risk and higher volatility than larger, more established companies.
International investments entail risks not ordinarily associated with U.S. investments including fluctuation in currency values, differences in accounting principles, or economic or political instability in other nations.
Investing in emerging markets can be riskier than investing in established foreign markets due to increased volatility and lower trading volume.
2 The Fund’s expense ratios, as described in the most recent prospectus, are disclosed in the following “Fund expense ratios” table. Delaware Management Company has agreed to reimburse certain expenses and/or waive certain fees in order to prevent total fund operating expenses (excluding any 12b-1 fees, taxes, interest, inverse floater program expenses, short sale and dividend interest expenses, brokerage fees, certain insurance costs, acquired fund fees and expenses, and nonroutine expenses or costs, including, but not limited to, those relating to reorganizations, litigation, conducting shareholder meetings, and liquidations (collectively, nonroutine expenses)) from exceeding 1.30% of the Fund’s average daily net assets during the period from Dec. 1, 2013, through Nov. 30, 2014.* Please see the most recent prospectus and any applicable supplement(s) for additional information on these fee waivers and/or reimbursements.
| Fund expense ratios | Class A | Class C | Class R | Institutional Class | ||||
Total annual operating expenses (without fee waivers) | 1.51% | 2.26% | 1.76% | 1.26% | ||||
Net expenses (including fee waivers, if any) | 1.51% | 2.26% | 1.76% | 1.26% | ||||
Type of waiver | Contractual | Contractual | Contractual | Contractual |
*The contractual waiver period is from March 28, 2013 through March 30, 2015.
5
Performance summary
Delaware Focus Global Growth Fund
Performance of a $10,000 investment1
Average annual total returns from Dec. 29, 2008 (Fund’s inception), through Nov. 30, 2014
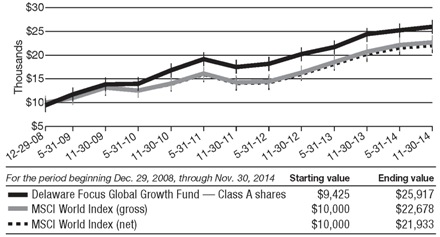
1 The “Performance of a $10,000 investment” graph assumes $10,000 invested in Class A shares of the Fund on Dec. 29, 2008, and includes the effect of a 5.75% front-end sales charge and the reinvestment of all distributions. The graph does not reflect the deduction of taxes the shareholders would pay on Fund distributions or redemptions of Fund shares. Expense limitations were in effect for some or all of the periods shown. Performance would have been lower had expense limitations not been in effect. Expenses are listed in the “Fund expense ratios” table on page 5. Please note additional details on pages 4 through 7.
The graph also assumes $10,000 invested in the MSCI World Index as of Dec. 29, 2008. The MSCI World Index is a free float-adjusted market capitalization weighted index designed to measure equity market performance across developed markets worldwide. Index “gross” return approximates the maximum possible dividend reinvestment. Index “net” return approximates the
minimum possible dividend reinvestment, after deduction of withholding tax at the highest possible rate.
The S&P 500 Index, which is mentioned on page 1, measures the performance of 500 mostly large-cap stocks weighted by market value, and is often used to represent performance of the U.S. stock market.
Index performance returns do not reflect any management fees, transaction costs, or expenses. Indices are unmanaged and one cannot invest directly in an index. Past performance is not a guarantee of future results.
Performance of other Fund classes will vary due to different charges and expenses.
6
| Nasdaq symbols | CUSIPs | |||||||||
Class A | DGGAX | 246118541 | ||||||||
Class C | DGGCX | 246118533 | ||||||||
Class R | DGGRX | 246118525 | ||||||||
Institutional Class | DGGIX | 246118517 | ||||||||
7
For the six-month period from June 1, 2014 to November 30, 2014 (Unaudited)
As a shareholder of the Fund, you incur two types of costs: (1) transaction costs, including sales charges (loads) on purchase payments, reinvested dividends, or other distributions; redemption fees; and exchange fees; and (2) ongoing costs, including management fees; distribution and/or service (12b-1) fees; and other Fund expenses. This example is intended to help you understand your ongoing costs (in dollars) of investing in the Fund and to compare these costs with the ongoing costs of investing in other mutual funds.
The example is based on an investment of $1,000 invested at the beginning of the period and held for the entire six-month period from June 1, 2014 to Nov. 30, 2014.
Actual expenses
The first section of the table shown, “Actual Fund return,” provides information about actual account values and actual expenses. You may use the information in this section of the table, together with the amount you invested, to estimate the expenses that you paid over the period. Simply divide your account value by $1,000 (for example, an $8,600 account value divided by $1,000 = 8.6), then multiply the result by the number in the first section under the heading entitled “Expenses Paid During Period” to estimate the expenses you paid on your account during this period.
Hypothetical example for comparison purposes
The second section of the table shown, “Hypothetical 5% return,” provides information about hypothetical account values and hypothetical expenses based on the Fund’s actual expense ratio and an assumed rate of return of 5% per year before expenses, which is not the Fund’s actual return. The hypothetical account values and expenses may not be used to estimate the actual ending account balance or expenses you paid for the period. You may use this information to compare the ongoing costs of investing in the Fund and other funds. To do so, compare this 5% hypothetical example with the 5% hypothetical examples that appear in the shareholder reports of the other funds.
Please note that the expenses shown in the table are meant to highlight your ongoing costs only and do not reflect any transactional costs, such as sales charges (loads), redemption fees, or exchange fees. Therefore, the second section of the table is useful in comparing ongoing costs only, and will not help you determine the relative total costs of owning different funds. In addition, if these transactional costs were included, your costs would have been higher. The expenses shown in the table assume reinvestment of all dividends and distributions.
8
Delaware Focus Global Growth Fund
Expense analysis of an investment of $1,000
| Beginning Account Value 6/1/14 | Ending Account Value 11/30/14 | Annualized Expense Ratio | Expenses Paid During Period 6/1/14 to 11/30/14* | |||||||||||||
Actual Fund return† | ||||||||||||||||
Class A | $1,000.00 | $1,029.20 | 1.40% | $7.12 | ||||||||||||
Class C | 1,000.00 | 1,025.80 | 2.15% | 10.92 | ||||||||||||
Class R | 1,000.00 | 1,028.00 | 1.65% | 8.39 | ||||||||||||
Institutional Class | 1,000.00 | 1,031.10 | 1.15% | 5.86 | ||||||||||||
Hypothetical 5% return (5% return before expenses) |
| |||||||||||||||
Class A | $1,000.00 | $1,018.05 | 1.40% | $7.08 | ||||||||||||
Class C | 1,000.00 | 1,014.29 | 2.15% | 10.86 | ||||||||||||
Class R | 1,000.00 | 1,016.80 | 1.65% | 8.34 | ||||||||||||
Institutional Class | 1,000.00 | 1,019.30 | 1.15% | 5.82 | ||||||||||||
| * | “Expenses Paid During Period” are equal to the Fund’s annualized expense ratio, multiplied by the average account value over the period, multiplied by 183/365 (to reflect the one-half year period). |
| † | Because actual returns reflect only the most recent six-month period, the returns shown may differ significantly from fiscal year returns. |
9
Security type / country and sector allocations
Delaware Focus Global Growth Fund | As of November 30, 2014 (Unaudited) |
Sector designations may be different than the sector designations presented in other Fund materials. The sector designations may represent the investment manager’s internal sector classifications, which may result in the sector designations for one fund being different than another fund’s sector designations.
Security type / country | Percentage of net assets | |
Common Stock | 99.00% | |
Brazil | 3.10% | |
China/Hong Kong | 4.20% | |
Denmark | 2.56% | |
Finland | 2.30% | |
France | 2.69% | |
India | 2.78% | |
Ireland | 2.88% | |
Japan | 4.78% | |
Netherlands | 2.35% | |
Spain | 4.34% | |
Switzerland | 3.73% | |
Taiwan | 2.57% | |
United Kingdom | 5.00% | |
United States | 55.72% | |
Preferred Stock | 0.13% | |
Short-Term Investments | 0.47% | |
Total Value of Securities | 99.60% | |
Receivables and Other Assets Net of Liabilities | 0.40% | |
Total Net Assets | 100.00% |
10
Common stock and preferred stock by sector² | Percentage of net assets | |
Consumer Discretionary | 19.97% | |
Consumer Staples | 2.39% | |
Energy | 5.00% | |
Financials | 5.97% | |
Healthcare | 11.87% | |
Industrials | 14.19% | |
Information Technology* | 37.94% | |
Materials | 1.80% | |
Total | 99.13% |
| ² | Narrow industries are utilized for compliance purposes for diversification whereas broad sectors are used for financial reporting. |
*To monitor compliance with the Fund’s concentration guidelines, the Information Technology sector (as disclosed herein for financial reporting purposes) is divided into various sub-categories or “industries” — in this case, commercial services, computers, diversified financial services, internet, machinery, semiconductors, and software. As of Nov. 30, 2014, such amounts, as a percentage of total net assets, were 3.43%, 2.58%, 3.31%, 12.29%, 2.50%, 5.72%, and 8.11%, respectively. The percentage in any such single industry will comply with the Fund’s concentration policy even if the percentage in the “Information Technology sector” for financial reporting purposes may exceed 25%.
11
Delaware Focus Global Growth Fund | November 30, 2014 |
| Number of shares | Value (U.S. $) | |||||||
| ||||||||
Common Stock – 99.00%D | ||||||||
| ||||||||
Brazil – 3.10% | ||||||||
Arezzo Industria e Comercio @ | 125,975 | $ | 1,379,620 | |||||
Localiza Rent a Car | 201,375 | 2,747,682 | ||||||
|
| |||||||
| 4,127,302 | ||||||||
|
| |||||||
China/Hong Kong – 4.20% | ||||||||
Baidu ADR † | 22,825 | 5,594,636 | ||||||
|
| |||||||
| 5,594,636 | ||||||||
|
| |||||||
Denmark – 2.56% | ||||||||
Novo Nordisk Class B | 74,761 | 3,411,067 | ||||||
|
| |||||||
| 3,411,067 | ||||||||
|
| |||||||
Finland – 2.30% | ||||||||
Kone Class B | 66,555 | 3,064,748 | ||||||
|
| |||||||
| 3,064,748 | ||||||||
|
| |||||||
France – 2.69% | ||||||||
Edenred | 124,323 | 3,588,100 | ||||||
|
| |||||||
| 3,588,100 | ||||||||
|
| |||||||
India – 2.78% | ||||||||
Zee Entertainment Enterprises | 602,627 | 3,699,942 | ||||||
|
| |||||||
| 3,699,942 | ||||||||
|
| |||||||
Ireland – 2.88% | ||||||||
Experian | 242,342 | 3,839,747 | ||||||
|
| |||||||
| 3,839,747 | ||||||||
|
| |||||||
Japan – 4.78% | ||||||||
Kakaku.com | 187,026 | 2,857,079 | ||||||
Start Today | 162,900 | 3,517,970 | ||||||
|
| |||||||
| 6,375,049 | ||||||||
|
| |||||||
Netherlands – 2.35% | ||||||||
Core Laboratories | 24,270 | 3,126,704 | ||||||
|
| |||||||
| 3,126,704 | ||||||||
|
| |||||||
Spain – 4.34% | ||||||||
Amadeus IT Holding | 81,914 | 3,263,803 | ||||||
Inditex | 86,584 | 2,523,156 | ||||||
|
| |||||||
| 5,786,959 | ||||||||
|
| |||||||
Switzerland – 3.73% | ||||||||
SGS | 1,190 | 2,575,704 | ||||||
Syngenta | 7,288 | 2,402,413 | ||||||
|
| |||||||
| 4,978,117 | ||||||||
|
| |||||||
Taiwan – 2.57% | ||||||||
Taiwan Semiconductor Manufacturing ADR | 146,175 | 3,430,727 | ||||||
|
| |||||||
| 3,430,727 | ||||||||
|
| |||||||
United Kingdom – 5.00% | ||||||||
InterContinental Hotels Group | 84,156 | 3,567,130 | ||||||
12
| Number of shares | Value (U.S. $) | |||||||
| ||||||||
Common StockD (continued) | ||||||||
| ||||||||
United Kingdom (continued) | ||||||||
Intertek Group | 84,902 | $ | 3,100,768 | |||||
|
| |||||||
| 6,667,898 | ||||||||
|
| |||||||
United States – 55.72% | ||||||||
Allergan | 26,095 | 5,581,460 | ||||||
Celgene † | 60,000 | 6,821,400 | ||||||
Crown Castle International | 47,200 | 3,921,848 | ||||||
Discovery Communications Class C † | 98,675 | 3,355,937 | ||||||
eBay † | 72,300 | 3,967,824 | ||||||
EOG Resources | 40,825 | 3,540,344 | ||||||
Google Class A † | 3,623 | 1,989,317 | ||||||
Google Class C † | 3,623 | 1,963,050 | ||||||
IntercontinentalExchange | 17,835 | 4,030,532 | ||||||
Intuit | 33,750 | 3,168,113 | ||||||
MasterCard Class A | 52,275 | 4,563,085 | ||||||
Microsoft | 91,600 | 4,379,396 | ||||||
NIKE Class B | 34,735 | 3,448,838 | ||||||
Priceline Group † | 4,270 | 4,954,011 | ||||||
QUALCOMM | 57,525 | 4,193,573 | ||||||
VeriFone Systems † | 96,475 | 3,440,299 | ||||||
Visa Class A | 17,095 | 4,413,758 | ||||||
Walgreen | 46,500 | 3,190,365 | ||||||
Zebra Technologies † | 45,618 | 3,336,957 | ||||||
|
| |||||||
| 74,260,107 | ||||||||
|
| |||||||
Total Common Stock (cost $108,999,379) | 131,951,103 | |||||||
|
| |||||||
| ||||||||
Preferred Stock – 0.13%D | ||||||||
| ||||||||
India – 0.13% | ||||||||
Zee Entertainment Enterprises 6.00% | 12,310,536 | 174,140 | ||||||
|
| |||||||
Total Preferred Stock (cost $161,469) | 174,140 | |||||||
|
| |||||||
| Principal amount° | ||||||||
| ||||||||
Short-Term Investments – 0.47% | ||||||||
| ||||||||
Discount Notes – 0.18%≠ | ||||||||
Federal Home Loan Bank | ||||||||
0.065% 1/21/15 | 29,126 | 29,125 | ||||||
0.065% 2/25/15 | 67,042 | 67,036 | ||||||
0.065% 3/5/15 | 72,685 | 72,675 | ||||||
0.08% 2/20/15 | 73,209 | 73,202 | ||||||
|
| |||||||
| 242,038 | ||||||||
|
| |||||||
13
Schedule of investments
Delaware Focus Global Growth Fund
| Principal amount° | Value (U.S. $) | |||||||
| ||||||||
Short-Term Investments (continued) | ||||||||
| ||||||||
Repurchase Agreements – 0.27% | ||||||||
Bank of America Merrill Lynch | 126,928 | $ | 126,928 | |||||
Bank of Montreal | 42,310 | 42,310 | ||||||
BNP Paribas | 190,762 | 190,762 | ||||||
|
| |||||||
| 360,000 | ||||||||
|
| |||||||
U.S. Treasury Obligation – 0.02%≠ | ||||||||
U.S. Treasury Bill 0.005% 12/26/14 | 17,382 | 17,381 | ||||||
|
| |||||||
| 17,381 | ||||||||
|
| |||||||
Total Short-Term Investments (cost $619,406) | 619,419 | |||||||
|
| |||||||
Total Value of Securities – 99.60% | $ | 132,744,662 | ||||||
|
| |||||||
| @ | Illiquid security. At Nov. 30, 2014, the aggregate value of illiquid securities was $1,379,620, which represents 1.04% of the Fund’s net assets. See Note 11 in “Notes to financial statements.” |
| ≠ | The rate shown is the effective yield at the time of purchase. |
| ° | Principal amount shown is stated in U.S. dollars unless noted that the security is denominated in another currency. |
| † | Non-income-producing security. |
| D | Securities have been classified by country of origin. Aggregate classification by business sectors has been presented on page 11 in “Security type / country and sector allocations.” |
ADR – American Depositary Receipt
See accompanying notes, which are an integral part of the financial statements.
14
This page intentionally left blank.
Statement of assets and liabilities
| Delaware Focus Global Growth Fund | November 30, 2014 |
Assets: | ||||
Investments, at value1 | $ | 132,125,243 | ||
Short-term investments, at value2 | 619,419 | |||
Cash | 442,677 | |||
Foreign currencies, at value3 | 181,424 | |||
Dividends and interest receivable | 201,551 | |||
Receivable for fund shares sold | 22,150 | |||
|
| |||
Total assets | 133,592,464 | |||
|
| |||
Liabilities: | ||||
Payable for fund shares redeemed | 30,859 | |||
Other accrued expenses | 111,920 | |||
Investment management fees payable | 91,940 | |||
Distribution fees payable to affiliates | 10,529 | |||
Other affiliates payable | 8,220 | |||
Trustees’ fees and expenses payable | 752 | |||
Deferred foreign taxes payable | 53,948 | |||
|
| |||
Total liabilities | 308,168 | |||
|
| |||
Total Net Assets | $ | 133,284,296 | ||
|
| |||
Net Assets Consist of: | ||||
Paid-in capital | $ | 111,818,362 | ||
Undistributed net investment income | 705,607 | |||
Accumulated net realized loss on investments | (2,136,115 | ) | ||
Net unrealized appreciation of investments and foreign currencies | 22,896,442 | |||
|
| |||
Total Net Assets | $ | 133,284,296 | ||
|
| |||
16
Net Asset Value | ||||
Class A: | ||||
Net assets | $ | 28,583,231 | ||
Shares of beneficial interest outstanding, unlimited authorization, no par | 1,424,813 | |||
Net asset value per share | $ | 20.06 | ||
Sales charge | 5.75 | % | ||
Offering price per share, equal to net asset value per share / (1 — sales charge) | $ | 21.28 | ||
Class C: | ||||
Net assets | $ | 5,759,213 | ||
Shares of beneficial interest outstanding, unlimited authorization, no par | 295,808 | |||
Net asset value per share | $ | 19.47 | ||
Class R: | ||||
Net assets | $ | 141,004 | ||
Shares of beneficial interest outstanding, unlimited authorization, no par | 7,104 | |||
Net asset value per share | $ | 19.85 | ||
Institutional Class: | ||||
Net assets | $ | 98,800,848 | ||
Shares of beneficial interest outstanding, unlimited authorization, no par | 4,880,223 | |||
Net asset value per share | $ | 20.25 | ||
1Investments, at cost | $ | 109,160,848 | ||
2Short-term investments, at cost | 619,406 | |||
3Foreign currencies, at cost | 185,588 | |||
See accompanying notes, which are an integral part of the financial statements.
17
| Delaware Focus Global Growth Fund | Year ended November 30, 2014 |
Investment Income: | ||||
Dividends | $ | 2,485,980 | ||
Interest | 1,250 | |||
Foreign tax withheld | (117,268 | ) | ||
|
| |||
| 2,369,962 | ||||
|
| |||
Expenses: | ||||
Management fees | 1,039,638 | |||
Distribution expenses — Class A | 96,732 | |||
Distribution expenses — Class C | 59,361 | |||
Distribution expenses — Class R | 655 | |||
Dividend disbursing and transfer agent fees and expenses | 156,200 | |||
Accounting and administration expenses | 41,169 | |||
Reports and statements to shareholders | 37,054 | |||
Audit and tax | 35,512 | |||
Registration fees | 33,762 | |||
Custodian fees | 27,979 | |||
Legal fees | 9,628 | |||
Trustees’ fees and expenses | 5,581 | |||
Other | 14,475 | |||
|
| |||
| 1,557,746 | ||||
Less expense paid indirectly | (27 | ) | ||
|
| |||
Total operating expenses | 1,557,719 | |||
|
| |||
Net Investment Income | 812,243 | |||
|
| |||
Net Realized and Unrealized Gain (Loss): | ||||
Net realized loss on: | ||||
Investments | (1,924,565 | ) | ||
Foreign currencies | (36,769 | ) | ||
Foreign currency exchange contracts | (64,312 | ) | ||
|
| |||
Net realized loss | (2,025,646 | ) | ||
|
| |||
Net change in unrealized appreciation (depreciation) of: | ||||
Investments* | 8,925,125 | |||
Foreign currencies | (14,360 | ) | ||
Foreign currency exchange contracts | 10 | |||
|
| |||
Net change in unrealized appreciation (depreciation) | 8,910,775 | |||
|
| |||
Net Realized and Unrealized Gain | 6,885,129 | |||
|
| |||
Net Increase in Net Assets Resulting from Operations | $ | 7,697,372 | ||
|
| |||
*Includes $53,948 capital gain taxes accrued.
See accompanying notes, which are an integral part of the financial statements.
18
This page intentionally left blank.
Statements of changes in net assets
Delaware Focus Global Growth Fund
| Year ended | ||||||||
| 11/30/14 | 11/30/13 | |||||||
Increase (Decrease) in Net Assets from Operations: | ||||||||
Net investment income | $ | 812,243 | $ | 107,318 | ||||
Net realized gain (loss) | (2,025,646 | ) | 2,247,606 | |||||
Net change in unrealized appreciation (depreciation) | 8,910,775 | 8,587,204 | ||||||
|
|
|
| |||||
Net increase in net assets resulting from operations | 7,697,372 | 10,942,128 | ||||||
|
|
|
| |||||
Dividends and Distributions to Shareholders from: | ||||||||
Net investment income: | ||||||||
Institutional Class | (32,036 | ) | — | |||||
Net realized gain: | ||||||||
Class A | (800,031 | ) | — | |||||
Class C | (101,315 | ) | — | |||||
Class R | (2,208 | ) | — | |||||
Institutional Class | (739,112 | ) | — | |||||
|
|
|
| |||||
| (1,674,702 | ) | — | ||||||
|
|
|
| |||||
Capital Share Transactions: | ||||||||
Proceeds from shares sold: | ||||||||
Class A | 9,557,913 | 38,974,993 | ||||||
Class C | 1,087,420 | 4,419,876 | ||||||
Class R | 12,901 | 106,265 | ||||||
Institutional Class | 74,279,425 | 27,439,705 | ||||||
Net asset value of shares issued upon reinvestment of dividends and distributions: | ||||||||
Class A | 762,901 | — | ||||||
Class C | 100,191 | — | ||||||
Class R | 2,207 | — | ||||||
Institutional Class | 723,359 | — | ||||||
|
|
|
| |||||
| 86,526,317 | 70,940,839 | |||||||
|
|
|
| |||||
20
| Year ended | ||||||||
| 11/30/14 | 11/30/13 | |||||||
Capital Share Transactions (continued): | ||||||||
Cost of shares redeemed: | ||||||||
Class A | $ | (29,973,057 | ) | $ | (15,948,085 | ) | ||
Class C | (1,504,151 | ) | (895,995 | ) | ||||
Class R | (8,561 | ) | (59,593 | ) | ||||
Institutional Class | (15,142,014 | ) | (7,722,797 | ) | ||||
|
|
|
| |||||
| (46,627,783 | ) | (24,626,470 | ) | |||||
|
|
|
| |||||
Increase in net assets derived from capital share transactions | 39,898,534 | 46,314,369 | ||||||
|
|
|
| |||||
Net Increase in Net Assets | 45,921,204 | 57,256,497 | ||||||
Net Assets: | ||||||||
Beginning of year | 87,363,092 | 30,106,595 | ||||||
|
|
|
| |||||
End of year | $ | 133,284,296 | $ | 87,363,092 | ||||
|
|
|
| |||||
Undistributed net investment income | $ | 705,607 | $ | 29,517 | ||||
|
|
|
| |||||
See accompanying notes, which are an integral part of the financial statements.
21
Delaware Focus Global Growth Fund Class A
Selected data for each share of the Fund outstanding throughout each period were as follows:
Net asset value, beginning of period |
Income (loss) from investment operations: |
Net investment income (loss)1 |
Net realized and unrealized gain |
Total from investment operations. |
Less dividends and distributions from: |
Net investment income |
Net realized gain |
Total dividends and distributions |
Net asset value, end of period |
Total return2 |
Ratios and supplemental data: |
Net assets, end of period (000 omitted) |
Ratio of expenses to average net assets |
Ratio of expenses to average net assets prior to fees waived |
Ratio of net investment income (loss) to average net assets |
Ratio of net investment income (loss) to average net assets prior to fees waived |
Portfolio turnover |
| 1 | The average shares outstanding method has been applied for per share information. |
| 2 | Total investment return is based on the change in net asset value of a share during the period and assumes reinvestment of dividends and distributions at net asset value and does not reflect the impact of a sales charge. Total investment return during some of the periods shown reflects waivers by the manager and/or distributor. Performance would have been lower had the waivers not been in effect. |
See accompanying notes, which are an integral part of the financial statements.
22
| Year ended | ||||||||||||||||||||
|
| |||||||||||||||||||
| 11/30/14 | 11/30/13 | 11/30/12 | 11/30/11 | 11/30/10 | ||||||||||||||||
| ||||||||||||||||||||
| $ | 19.180 | $ | 15.900 | $ | 13.880 | $ | 13.720 | $ | 12.470 | |||||||||||
| 0.104 | 0.031 | (0.002 | ) | — | 0.025 | |||||||||||||||
| 1.099 | 3.249 | 2.133 | 0.594 | 2.422 | ||||||||||||||||
|
|
|
|
|
|
|
|
|
| |||||||||||
| 1.203 | 3.280 | 2.131 | 0.594 | 2.447 | ||||||||||||||||
|
|
|
|
|
|
|
|
|
| |||||||||||
| — | — | — | (0.028 | ) | (0.027 | ) | ||||||||||||||
| (0.323 | ) | — | (0.111 | ) | (0.406 | ) | (1.170 | ) | ||||||||||||
|
|
|
|
|
|
|
|
|
| |||||||||||
| (0.323 | ) | — | (0.111 | ) | (0.434 | ) | (1.197 | ) | ||||||||||||
|
|
|
|
|
|
|
|
|
| |||||||||||
| $ | 20.060 | $ | 19.180 | $ | 15.900 | $ | 13.880 | $ | 13.720 | |||||||||||
|
|
|
|
|
|
|
|
|
| |||||||||||
| 6.37% | 20.63% | 15.49% | 4.28% | 21.31% | ||||||||||||||||
| $ | 28,583 | $ | 46,830 | $ | 16,753 | $ | 8,244 | $ | 2,413 | |||||||||||
| 1.40% | 1.51% | 1.55% | 1.51% | 1.20% | ||||||||||||||||
| 1.40% | 1.55% | 1.76% | 2.78% | 2.04% | ||||||||||||||||
| 0.54% | 0.18% | (0.02% | ) | 0.00% | 0.20% | |||||||||||||||
| 0.54% | 0.14% | (0.23% | ) | (1.27% | ) | (0.64% | ) | |||||||||||||
| 26% | 36% | 37% | 18% | 30% | ||||||||||||||||
| ||||||||||||||||||||
23
Financial highlights
Delaware Focus Global Growth Fund Class C
Selected data for each share of the Fund outstanding throughout each period were as follows:
Net asset value, beginning of period |
Income (loss) from investment operations: |
Net investment loss2 |
Net realized and unrealized gain (loss) |
Total from investment operations |
Less dividends and distributions from: |
Net realized gain |
Total dividends and distributions |
Net asset value, end of period |
Total return3 |
Ratios and supplemental data: |
Net assets, end of period (000 omitted) |
Ratio of expenses to average net assets |
Ratio of expenses to average net assets prior to fees waived |
Ratio of net investment loss to average net assets |
Ratio of net investment loss to average net assets prior to fees waived |
Portfolio turnover |
| 1 | Date of commencement of operations; ratios have been annualized and total return has not been annualized. |
| 2 | The average shares outstanding method has been applied for per share information. |
| 3 | Total investment return is based on the change in net asset value of a share during the period and assumes reinvestment of dividends and distributions at net asset value and does not reflect the impact of a sales charge. Total investment return during some of the periods shown reflect a waiver by the manager. Performance would have been lower had the waiver not been in effect. |
| 4 | Portfolio turnover is representative of the Fund for the entire period from Dec. 1, 2010 through Nov. 30, 2011. |
See accompanying notes, which are an integral part of the financial statements.
24
| Year ended | 12/29/101 to | |||||||||||||||
|
| |||||||||||||||
| 11/30/14 | 11/30/13 | 11/30/12 | 11/30/11 | |||||||||||||
| $ | 18.760 | $ | 15.670 | $ | 13.780 | $ | 14.120 | |||||||||
| (0.039) | (0.097 | ) | (0.113 | ) | (0.108 | ) | ||||||||||
| 1.072 | 3.187 | 2.114 | (0.232 | ) | ||||||||||||
|
|
|
|
|
|
|
| |||||||||
| 1.033 | 3.090 | 2.001 | (0.340 | ) | ||||||||||||
|
|
|
|
|
|
|
| |||||||||
| (0.323) | — | (0.111 | ) | — | ||||||||||||
|
|
|
|
|
|
|
| |||||||||
| (0.323) | — | (0.111 | ) | — | ||||||||||||
|
|
|
|
|
|
|
| |||||||||
| $ | 19.470 | $ | 18.760 | $ | 15.670 | $ | 13.780 | |||||||||
|
|
|
|
|
|
|
| |||||||||
| 5.59% | 19.72% | 14.66% | (2.41% | ) | ||||||||||||
| $ | 5,759 | $ | 5,863 | $ | 1,594 | $ | 68 | |||||||||
| 2.15% | 2.26% | 2.30% | 2.30% | |||||||||||||
| 2.15% | 2.26% | 2.46% | 3.52% | |||||||||||||
| (0.21% | ) | (0.57% | ) | (0.77% | ) | (0.85% | ) | |||||||||
| (0.21% | ) | (0.57% | ) | (0.93% | ) | (2.07% | ) | |||||||||
| 26% | 36% | 37% | 18% | 4 | ||||||||||||
25
Financial highlights
Delaware Focus Global Growth Fund Class R
Selected data for each share of the Fund outstanding throughout each period were as follows:
Net asset value, beginning of period |
Income (loss) from investment operations: |
Net investment income (loss)2 |
Net realized and unrealized gain (loss) |
Total from investment operations |
Less dividends and distributions from: |
Net realized gain |
Total dividends and distributions |
Net asset value, end of period |
Total return3 |
Ratios and supplemental data: |
Net assets, end of period (000 omitted) |
Ratio of expenses to average net assets |
Ratio of expenses to average net assets prior to fees waived |
Ratio of net investment income (loss) to average net assets |
Ratio of net investment income (loss) to average net assets prior to fees waived |
Portfolio turnover |
| 1 | Date of commencement of operations; ratios have been annualized and total return has not been annualized. |
| 2 | The average shares outstanding method has been applied for per share information. |
| 3 | Total investment return is based on the change in net asset value of a share during the period and assumes reinvestment of dividends and distributions at net asset value. Total investment return during some of the periods shown reflects waivers by the manager and/or distributor. Performance would have been lower had the waivers not been in effect. |
| 4 | Portfolio turnover is representative of the Fund for the entire period from Dec. 1, 2010 through Nov. 30, 2011. |
See accompanying notes, which are an integral part of the financial statements.
26
| Year ended | 12/29/101 to 11/30/11 | |||||||||||||||
|
| |||||||||||||||
| 11/30/14 | 11/30/13 | 11/30/12 | ||||||||||||||
| $ | 19.030 | $ | 15.810 | $ | 13.840 | $ | 14.120 | |||||||||
| 0.056 | (0.013 | ) | (0.040 | ) | (0.043 | ) | ||||||||||
| 1.087 | 3.233 | 2.121 | (0.237 | ) | ||||||||||||
|
|
|
|
|
|
|
| |||||||||
| 1.143 | 3.220 | 2.081 | (0.280 | ) | ||||||||||||
|
|
|
|
|
|
|
| |||||||||
| (0.323 | ) | — | (0.111 | ) | — | |||||||||||
|
|
|
|
|
|
|
| |||||||||
| (0.323 | ) | — | (0.111 | ) | — | |||||||||||
|
|
|
|
|
|
|
| |||||||||
| $ | 19.850 | $ | 19.030 | $ | 15.810 | $ | 13.840 | |||||||||
|
|
|
|
|
|
|
| |||||||||
| 6.10% | 20.37% | 15.17% | (1.98% | ) | ||||||||||||
| $ | 141 | $ | 129 | $ | 61 | $ | 5 | |||||||||
| 1.65% | 1.76% | 1.80% | 1.80% | |||||||||||||
| 1.65% | 1.84% | 2.06% | 3.12% | |||||||||||||
| 0.29% | (0.07% | ) | (0.27% | ) | (0.35% | ) | ||||||||||
| 0.29% | (0.15% | ) | (0.53% | ) | (1.67% | ) | ||||||||||
| 26% | 36% | 37% | 18% | 4 | ||||||||||||
27
Financial highlights
Delaware Focus Global Growth Fund Institutional Class
Selected data for each share of the Fund outstanding throughout each period were as follows:
Net asset value, beginning of period |
Income from investment operations: |
Net investment income1 |
Net realized and unrealized gain |
Total from investment operations |
Less dividends and distributions from: |
Net investment income |
Net realized gain |
Total dividends and distributions |
Net asset value, end of period |
Total return2 |
Ratios and supplemental data: |
Net assets, end of period (000 omitted) |
Ratio of expenses to average net assets |
Ratio of expenses to average net assets prior to fees waived |
Ratio of net investment income to average net assets |
Ratio of net investment income (loss) to average net assets prior to fees waived |
Portfolio turnover |
| 1 | The average shares outstanding method has been applied for per share information. |
| 2 | Total investment return is based on the change in net asset value of a share during the period and assumes reinvestment of dividends and distributions at net asset value. Total investment return during some of the periods shown reflects a waiver by the manager. Performance would have been lower had the waiver not been in effect. |
See accompanying notes, which are an integral part of the financial statements.
28
| Year ended | ||||||||||||||||||||
|
| |||||||||||||||||||
| 11/30/14 | 11/30/13 | 11/30/12 | 11/30/11 | 11/30/10 | ||||||||||||||||
|
| |||||||||||||||||||
| $ | 19.320 | $ | 15.970 | $ | 13.910 | $ | 13.720 | $ | 12.470 | |||||||||||
| 0.154 | 0.075 | 0.035 | 0.038 | 0.025 | ||||||||||||||||
| 1.113 | 3.275 | 2.136 | 0.586 | 2.422 | ||||||||||||||||
|
|
|
|
|
|
|
|
|
| |||||||||||
| 1.267 | 3.350 | 2.171 | 0.624 | 2.447 | ||||||||||||||||
|
|
|
|
|
|
|
|
|
| |||||||||||
| (0.014 | ) | — | — | (0.028 | ) | (0.027 | ) | |||||||||||||
| (0.323 | ) | — | (0.111 | ) | (0.406 | ) | (1.170 | ) | ||||||||||||
|
|
|
|
|
|
|
|
|
| |||||||||||
| (0.337 | ) | — | (0.111 | ) | (0.434 | ) | (1.197 | ) | ||||||||||||
|
|
|
|
|
|
|
|
|
| |||||||||||
| $ | 20.250 | $ | 19.320 | $ | 15.970 | $ | 13.910 | $ | 13.720 | |||||||||||
|
|
|
|
|
|
|
|
|
| |||||||||||
| 6.66% | 20.98% | 15.75% | 4.51% | 21.31% | ||||||||||||||||
| $ | 98,801 | $ | 34,541 | $ | 11,699 | $ | 7,336 | $ | 4,781 | |||||||||||
| 1.15% | 1.26% | 1.30% | 1.28% | 1.20% | ||||||||||||||||
| 1.15% | 1.26% | 1.46% | 2.47% | 1.74% | ||||||||||||||||
| 0.79% | 0.43% | 0.23% | 0.27% | 0.20% | ||||||||||||||||
| 0.79% | 0.43% | 0.07% | (0.92% | ) | (0.34% | ) | ||||||||||||||
| 26% | 36% | 37% | 18% | 30% | ||||||||||||||||
29
Delaware Focus Global Growth Fund | November 30, 2014 |
Delaware Group® Global & International Funds (Trust) is organized as a Delaware statutory trust and offers four series: Delaware Emerging Markets Fund, Delaware Focus Global Growth Fund, Delaware Global Value Fund, and Delaware International Value Equity Fund. These financial statements and the related notes pertain to Delaware Focus Global Growth Fund (Fund). The Trust is an open-end investment company. The Fund is considered diversified under the Investment Company Act of 1940, as amended, and offers Class A, Class C, Class R, and Institutional Class shares. Class A shares are sold with a maximum front-end sales charge of 5.75%. Class A share purchases of $1,000,000 or more will incur a contingent deferred sales charge (CDSC) of 1.00%, if redeemed during the first year, and 0.50% during the second year, provided that Delaware Distributors, L.P. (DDLP) paid a financial advisor a commission on the purchase of those shares. Class C shares are sold with a CDSC of 1.00%, if redeemed during the first 12 months. Class R and Institutional Class shares are not subject to a sales charge and are offered for sale exclusively to certain eligible investors.
The investment objective of the Fund is to seek long-term capital appreciation.
1. Significant Accounting Policies
The following accounting policies are in accordance with U.S. generally accepted accounting principles (U.S. GAAP) and are consistently followed by the Fund.
Security Valuation — Equity securities, except those traded on the Nasdaq Stock Market, Inc. (Nasdaq), are valued at the last quoted sales price as of the time of the regular close of the New York Stock Exchange on the valuation date. Securities traded on the Nasdaq are valued in accordance with the Nasdaq Official Closing Price, which may not be the last sales price. If, on a particular day, an equity security does not trade, then the mean between the bid and ask prices will be used, which approximates fair value. Securities listed on a foreign exchange are normally valued at the last quoted sales price on the valuation date. U.S. government and agency securities are valued at the mean between the bid and ask prices, which approximates fair value. Foreign currency exchange contracts and foreign cross currency exchange contracts are valued at the mean between the bid and ask prices, which approximates fair value. Interpolated values are derived when the settlement date of the contract is an interim date for which quotations are not available. Generally, other securities and assets for which market quotations are not readily available are valued at fair value as determined in good faith under the direction of the Fund’s Board of Trustees (Board). In determining whether market quotations are readily available or fair valuation will be used, various factors will be taken into consideration, such as market closures, or suspension of trading in a security. The Fund may use fair value pricing more frequently for securities traded primarily in non-U.S. markets because, among other things, most foreign markets close well before the Fund values its securities, generally as of 4:00 p.m. Eastern time. The earlier close of these foreign markets gives rise to the possibility that significant events, including broad market moves, government actions or pronouncements, aftermarket trading, or news events may have occurred in the interim. Whenever such a significant event occurs, the Fund may value foreign securities using fair value prices based on third-party vendor modeling tools (international fair value pricing).
Federal and Foreign Income Taxes — No provision for federal income taxes has been made as the Fund intends to continue to qualify for federal income tax purposes as a regulated investment company under Subchapter M of the Internal Revenue Code of 1986, as amended, and make the requisite distributions to shareholders. The Fund evaluates tax positions taken or expected to be taken in the
30
course of preparing the Fund’s tax returns to determine whether the tax positions are “more likely-than-not” of being sustained by the applicable tax authority. Tax positions not deemed to meet the “more-likely-than-not” threshold are recorded as a tax benefit or expense in the current year. Management has analyzed the Fund’s tax positions taken for all open federal income tax years (Nov. 30, 2011 – Nov. 30, 2014), and has concluded that no provision for federal income tax is required in the Fund’s financial statements. In regard to foreign taxes only, the Fund has open tax years in certain foreign countries in which it invests that may date back to the inception of the Fund.
Class Accounting — Investment income, common expenses and realized and unrealized gain (loss) on investments are allocated to the various classes of the Fund on the basis of daily net assets of each class. Distribution expenses relating to a specific class are charged directly to that class.
Repurchase Agreements — The Fund may purchase certain U.S. government securities subject to the counterparty’s agreement to repurchase them at an agreed upon date and price. The counterparty will be required on a daily basis to maintain the value of the collateral subject to the agreement at not less than the repurchase price (including accrued interest). The agreements are conditioned upon the collateral being deposited under the Federal Reserve book-entry system with the Fund’s custodian or a third-party sub-custodian. In the event of default or bankruptcy by the other party to the agreement, retention of the collateral may be subject to legal proceedings. All open repurchase agreements as of the date of this report were entered into on Nov. 28, 2014.
Foreign Currency Transactions — Transactions denominated in foreign currencies are recorded at the prevailing exchange rates on the valuation date in accordance with the Fund’s prospectus. The value of all assets and liabilities denominated in foreign currencies is translated daily into U.S. dollars at the exchange rate of such currencies against the U.S. dollar. Transaction gains or losses resulting from changes in exchange rates during the reporting period or upon settlement of the foreign currency transaction are reported in operations for the current period. The Fund generally does not bifurcate that portion of realized gains and losses on investments which is due to changes in foreign exchange rates from that which is due to changes in market prices. The changes are included with the net realized and unrealized gain or loss on investments. The Fund reports certain foreign currency related transactions as components of realized gains (losses) for financial reporting purposes, whereas such components are treated as ordinary income (loss) for federal income tax purposes.
Use of Estimates — The preparation of financial statements in conformity with U.S. GAAP requires management to make estimates and assumptions that affect the fair value of investments, the reported amounts of assets and liabilities and disclosure of contingent assets and liabilities at the date of the financial statements, and the reported amounts of revenues and expenses during the reporting period. Actual results could differ from those estimates and the differences could be material.
Other — Expenses directly attributable to the Fund are charged directly to the Fund. Other expenses common to various funds within the Delaware Investments® Family of Funds are generally allocated among such funds on the basis of average net assets. Management fees and some other expenses are paid monthly. Security transactions are recorded on the date the securities are purchased or sold (trade date) for financial reporting purposes. Costs used in calculating realized gains and losses on the sale of investment securities are those of the specific securities sold. Dividend income is recorded on the
31
Notes to financial statements
Delaware Focus Global Growth Fund
1. Significant Accounting Policies (continued)
ex-dividend date and interest income is recorded on the accrual basis. Foreign dividends are also recorded on the ex-dividend date or as soon after the ex-dividend date that the Fund is aware of such dividends, net of all tax withholdings, a portion of which may be reclaimable. Withholding taxes and reclaims on foreign dividends have been recorded in accordance with the Fund’s understanding of the applicable country’s tax rules and rates. The Fund pays foreign capital gain taxes on certain foreign securities held, which are reported as components of realized and unrealized losses for financial reporting purposes, whereas such components are treated as ordinary loss for federal income tax purposes. The Fund declares and pays dividends from net investment income and distributions from net realized gain on investments, if any, annually. The Fund may distribute more frequently, if necessary for tax purposes. Dividends and distributions, if any, are recorded on the ex-dividend date.
The Fund may receive earnings credits from its custodian when positive cash balances are maintained, which may be used to offset custody fees. There were no earnings credits for the year ended Nov. 30, 2014.
The Fund receives earnings credits from its transfer agent when positive cash balances are maintained, which may be used to offset transfer agent fees. If the amount earned is greater than one dollar, the expense paid under this arrangement is included on the “Statement of operations” under “Dividend disbursing and transfer agent fees and expenses” with the corresponding expense offset shown under “Less expense paid indirectly.” For the year ended Nov. 30, 2014, the Fund earned $27 under this agreement.
2. Investment Management, Administration Agreements and Other Transactions with Affiliates
In accordance with the terms of its investment management agreement, the Fund pays Delaware Management Company (DMC), a series of Delaware Management Business Trust and the investment manager, an annual fee which is calculated daily at the rate of 0.85% on the first $500 million of average daily net assets of the Fund, 0.80% on the next $500 million, 0.75% on the next $1.5 billion, and 0.70% on the average daily net assets in excess of $2.5 billion.
DMC has contractually agreed to waive that portion, if any, of its management fee and reimburse the Fund to the extent necessary to ensure that total annual fund operating expenses (excluding any 12b-1 plan, taxes, interest, short sale and dividend interest expenses, brokerage fees, certain insurance costs, acquired fund fees and expenses, and nonroutine expenses or costs including, but not limited to, those relating to reorganizations, litigation, conducting shareholder meetings, and liquidations (collectively, nonroutine expenses)) do not exceed 1.30% of the Fund’s average daily net assets from Dec. 1, 2013 through Nov. 30, 2014.* For purposes of this waiver and reimbursement, nonroutine expenses may also include such additional costs and expenses as may be agreed upon from time to time by the Fund’s Board and DMC. This expense waiver may only be terminated by agreement of DMC and the Fund.
*The contractual waiver period is from March 28, 2013 through March 30, 2015.
32
Effective June 3, 2014, Jackson Square Partners, LLC (JSP) furnishes investment sub-advisory services to the Fund. Prior to June 3, 2014, the Fund was not sub-advised. For these services, DMC, not the Fund, pays JSP fees based on the aggregate average daily net assets of the Fund at the following annual rate: 0.425% of the first $500 million; 0.40% of the next $500 million; 0.375% of the next $1.5 billion; and 0.35% of aggregate average daily net assets in excess of $2.5 billion.
Effective Nov. 1, 2014, Delaware Investments Fund Services Company (DIFSC), an affiliate of DMC, provides fund accounting and financial administration oversight services to the Fund. Prior to this time, Delaware Service Company, Inc. (DSC), an affiliate of DMC, provided fund accounting and financial administration oversight services to the Fund. For these services, the Fund pays DIFSC fees based on the aggregate daily net assets of the Delaware Investments® Family of Funds at the following annual rate: 0.0050% of the first $30 billion; 0.0045% of the next $10 billion; 0.0040% of the next $10 billion; and 0.0025% of aggregate average daily net assets in excess of $50 billion. The fees payable to DIFSC under the service agreement described above are allocated among all Funds in the Delaware Investments Family of Funds on a relative net asset value basis. For the year ended Nov. 30, 2014, the Fund was charged $5,862 for these services. This amount is included on the “Statement of operations” under “Accounting and administration expenses.”
Effective Nov 1, 2014, DIFSC is the transfer agent and dividend disbursing agent of the Fund. Prior to this time, DSC was the transfer agent and dividend disbursing agent of the Fund. For these services, the Fund pays DIFSC fees based on the aggregate daily net assets of the retail funds within the Delaware Investments Family of Funds at the following annual rate: 0.025% of the first $20 billion; 0.020% of the next $5 billion; 0.015% of the next $5 billion; and 0.013% on average daily net assets in excess of $30 billion. This amount is included on the “Statement of operations” under “Dividend disbursing and transfer agent fees and expenses.” For the year ended Nov. 30, 2014, the Fund was charged $26,406 for these services. Pursuant to a sub-transfer agency agreement between DIFSC and BNY Mellon Investment Servicing (US) Inc. (BNYMIS), BNYMIS provides certain sub-transfer agency services to the Fund. Sub-transfer agency fees are passed on to and paid directly by the Fund.
Pursuant to a distribution agreement and distribution plan, the Fund pays DDLP, the distributor and an affiliate of DMC, an annual distribution and service fee of 0.25% of the average daily net assets of the Class A shares, 1.00% of the average daily net assets of the Class C shares, and 0.50% of the average daily net assets of the Class R shares. Institutional Class shares pay no distribution and service expenses.
As provided in the investment management agreement, the Fund bears a portion of the cost of resources shared with DMC, including the cost of internal personnel of DMC and/or its affiliates that provide legal, tax, and regulatory reporting services to the Fund. For the year ended Nov. 30, 2014, the Fund was charged $3,346 for internal legal, tax, and regulatory reporting services provided by DMC and/or its affiliates’ employees. This amount is included on the “Statement of operations” under “Legal fees.”
For the year ended Nov. 30, 2014, DDLP earned $10,298 for commissions on sales of the Fund’s Class A shares. For the year ended Nov. 30, 2014, DDLP received gross CDSC commissions of $15 and $171 on redemptions of the Fund’s Class A and Class C shares, respectively, and these commissions were entirely used to offset up-front commissions previously paid by DDLP to broker/dealers on sales of those shares.
33
Notes to financial statements
Delaware Focus Global Growth Fund
2. Investment Management, Administration Agreements and Other Transactions with Affiliates (continued)
Trustees’ fees include expenses accrued by the Fund for each Trustee’s retainer and meeting fees. Certain officers of DMC, DIFSC, and DDLP are officers and/or Trustees of the Trust. These officers and Trustees are paid no compensation by the Fund.
3. Investments
For the year ended Nov. 30, 2014, the Fund made purchases and sales of investment securities other than short-term investments as follows:
Purchases | $ | 72,954,773 | ||
Sales | 30,233,680 |
At Nov. 30, 2014, the cost of investments and unrealized appreciation (depreciation) for federal income tax purposes were as follows:
Cost of investments | $ | 109,972,703 | ||
|
| |||
Aggregate unrealized appreciation | $ | 27,912,702 | ||
Aggregate unrealized depreciation | (5,140,743 | ) | ||
|
| |||
Net unrealized appreciation | $ | 22,771,959 | ||
|
|
U.S. GAAP defines fair value as the price that the Fund would receive to sell an asset or pay to transfer a liability in an orderly transaction between market participants at the measurement date under current market conditions. A three-level hierarchy for fair value measurements has been established based upon the transparency of inputs to the valuation of an asset or liability. Inputs may be observable or unobservable and refer broadly to the assumptions that market participants would use in pricing the asset or liability. Observable inputs reflect the assumptions market participants would use in pricing the asset or liability based on market data obtained from sources independent of the reporting entity. Unobservable inputs reflect the reporting entity’s own assumptions about the assumptions that market participants would use in pricing the asset or liability based on the best information available under the circumstances. The Fund’s investment in its entirety is assigned a level based upon the observability of the inputs which are significant to the overall valuation. The three-level hierarchy of inputs is summarized below.
| Level 1 – | Inputs are quoted prices in active markets for identical investments. (Examples: equity securities, open-end investment companies, futures contracts, exchange-traded options contracts) | |
| Level 2 – | Other observable inputs, including, but not limited to: quoted prices for similar assets or liabilities in markets that are active, quoted prices for identical or similar assets or liabilities in markets that are not active, inputs other than quoted prices that are observable for the assets or liabilities (such as interest rates, yield curves, volatilities, prepayment speeds, loss severities, credit risks, and default rates), or other market-corroborated inputs. (Examples: debt securities, government securities, swap contracts, foreign currency exchange contracts, foreign securities utilizing international fair value pricing, broker-quoted securities, fair valued securities) | |
34
| Level 3 – | Significant unobservable inputs, including the Fund’s own assumptions used to determine the fair value of investments. (Examples: broker-quoted securities, fair valued securities) |
Level 3 investments are valued using significant unobservable inputs. The Fund may also use an income-based valuation approach in which the anticipated future cash flows of the investment are discounted to calculate fair value. Discounts may also be applied due to the nature or duration of any restrictions on the disposition of the investments. Valuations may also be based upon current market prices of securities that are comparable in coupon, rating, maturity, and industry. The derived value of a Level 3 investment may not represent the value which is received upon disposition and this could impact the results of operations.
The following table summarizes the valuation of the Fund’s investments by fair value hierarchy levels as of Nov. 30, 2014:
| Level 1 | Level 2 | Total | ||||||||||
Common Stock | $ | 131,951,103 | $ | — | $ | 131,951,103 | ||||||
Preferred Stock | 174,140 | — | 174,140 | |||||||||
Short-Term Investments | — | 619,419 | 619,419 | |||||||||
|
|
|
|
|
| |||||||
Total | $ | 132,125,243 | $ | 619,419 | $ | 132,744,662 | ||||||
|
|
|
|
|
| |||||||
During the year ended Nov. 30, 2014, there were no transfers between Level 1 investments, Level 2 investments, or Level 3 investments that had a significant impact to the Fund. This does not include transfers between Level 1 investments and Level 2 investments due to the Fund utilizing international fair value pricing during the period. In accordance with the fair valuation procedures described in Note 1, international fair value pricing of securities in the Fund occurs when market volatility exceeds an established rolling threshold. If the threshold is exceeded on a given date, then prices of international securities (those that traded on exchanges that close at a different time than the time that the Fund’s net asset value is determined) will be established using a separate pricing feed from a third-party vendor designed to establish a price for each such security as of the time that the Fund’s net asset value is determined. Further, international fair value pricing uses other observable market-based inputs in place of the closing exchange price due to the events occurring after the close of the exchange or market on which the investment is principally traded, causing a change in classification between levels. The Fund’s policy is to recognize transfers between levels at the beginning of the reporting period.
A reconciliation of Level 3 investments is presented when the Fund has a significant amount of Level 3 investments at the beginning, interim, or end of the period in relation to net assets. At Nov. 30, 2014, there were no Level 3 investments.
4. Dividend and Distribution Information
Income and long-term capital gain distributions are determined in accordance with federal income tax regulations, which may differ from U.S. GAAP. Additionally, distributions from net gains on foreign currency transactions and net short-term gains on sales of investment securities are treated as ordinary income for federal income tax purposes. There were no dividends and distributions for the year ended Nov. 30, 2013. The tax character of dividends and distributions paid during the year ended Nov. 30, 2014 was as follows:
35
Notes to financial statements
Delaware Focus Global Growth Fund
4. Dividend and Distribution Information (continued)
| Year ended 11/30/14 | ||||
Ordinary income | $ | 532,163 | ||
Long-term capital gain | 1,142,539 | |||
|
| |||
Total | $ | 1,674,702 | ||
|
| |||
5. Components of Net Assets on a Tax Basis
As of Nov. 30, 2014, the components of net assets on a tax basis were as follows:
Shares of beneficial interest | $ | 111,818,362 | ||
Undistributed ordinary income | 705,607 | |||
Capital loss carryforwards | (1,943,666 | ) | ||
Unrealized appreciation | 22,703,993 | |||
|
| |||
Net assets | $ | 133,284,296 | ||
|
|
The differences between book basis and tax basis components of net assets are primarily attributable to tax deferral of losses on wash sales.
For financial reporting purposes, capital accounts are adjusted to reflect the tax character of permanent book/tax differences. Reclassifications are primarily due to tax treatment of gain (loss) on foreign currency transactions, and dividends and distributions. Results of operations and net assets were not affected by these reclassifications. For the year ended Nov. 30, 2014, the Fund recorded the following reclassifications:
Undistributed net investment income | $ | (104,117 | ) | |
Accumulated net realized loss | 104,117 |
The Regulated Investment Company Modernization Act of 2010 (the Act) was enacted on Dec. 22, 2010. The Act makes changes to several tax rules, including providing for the unlimited carryover of future capital losses. The Act also provides that each capital loss carryforward retains its character as short-term or long-term capital loss.
Losses incurred that will be carried forward under the Act are as follows:
| Loss carryforward character | ||
| Short-term | Long-term | |
$1,747,459 | $196,207 | |
36
6. Capital Shares
Transactions in capital shares were as follows:
Year ended
| ||||||||
| 11/30/14 | 11/30/13 | |||||||
Shares sold: | ||||||||
Class A | 497,763 | 2,309,211 | ||||||
Class C | 58,084 | 263,783 | ||||||
Class R | 675 | 6,328 | ||||||
Institutional Class | 3,830,005 | 1,511,092 | ||||||
Shares issued upon reinvestment of dividends and distributions: | ||||||||
Class A | 40,174 | — | ||||||
Class C | 5,398 | — | ||||||
Class R | 117 | — | ||||||
Institutional Class | 37,832 | — | ||||||
|
|
|
| |||||
| 4,470,048 | 4,090,414 | |||||||
|
|
|
| |||||
Shares redeemed: | ||||||||
Class A | (1,554,687 | ) | (921,591 | ) | ||||
Class C | (80,131 | ) | (53,061 | ) | ||||
Class R | (469 | ) | (3,396 | ) | ||||
Institutional Class | (775,428 | ) | (455,838 | ) | ||||
|
|
|
| |||||
| (2,410,715 | ) | (1,433,886 | ) | |||||
|
|
|
| |||||
Net increase | 2,059,333 | 2,656,528 | ||||||
|
|
|
| |||||
7. Line of Credit
The Fund, along with certain other funds in the Delaware Investments® Family of Funds (Participants), was a participant in a $225,000,000 revolving line of credit intended to be used for temporary or emergency purposes as an additional source of liquidity to fund redemptions of investor shares. Under the agreement, the Participants were charged an annual commitment fee of 0.08%, which was allocated across the Participants on the basis of each Participant’s allocation of the entire facility. The Participants were permitted to borrow up to a maximum of one third of their net assets under the agreement. Each Participant was individually, and not jointly, liable for its particular advances, if any, under the line of credit. The line of credit under the agreement expired on Nov. 10, 2014.
On Nov. 10, 2014, the Fund, along with the other Participants, entered into an amendment to the agreement for a $275,000,000 revolving line of credit. The line of credit is to be used as described above and operates in substantially the same manner as the original agreement. The line of credit available under the agreement expires on Nov. 9, 2015.
On Nov. 30, 2014, The Fund had no amounts outstanding as of Nov. 30, 2014 or at any time during the year then ended.
37
Notes to financial statements
Delaware Focus Global Growth Fund
8. Derivatives
U.S. GAAP requires disclosures that enable investors to understand: (1) how and why an entity uses derivatives; (2) how they are accounted for; and (3) how they affect an entity’s results of operations and financial position.
Foreign Currency Exchange Contracts — The Fund may enter into foreign currency exchange contracts and foreign cross currency exchange contracts as a way of managing foreign exchange rate risk. The Fund may enter into these contracts to fix the U.S. dollar value of a security that it has agreed to buy or sell for the period between the date the trade was entered into and the date the security is delivered and paid for. The Fund may also use these contracts to hedge the U.S. dollar value of securities it already owns that are denominated in foreign currencies. In addition, the Fund may enter into these contracts to facilitate or expedite the settlement of portfolio transactions. The change in value is recorded as an unrealized gain or loss. When the contract is closed, a realized gain or loss is recorded equal to the difference between the value of the contract at the time it was opened and the value at the time it was closed.
The use of foreign currency exchange contracts and foreign cross currency exchange contracts does not eliminate fluctuations in the underlying prices of the securities, but does establish a rate of exchange that can be achieved in the future. Although foreign currency exchange contracts and foreign cross currency exchange contracts limit the risk of loss due to an unfavorable change in the value of the hedged currency, they also limit any potential gain that might result should the value of the currency change favorably. In addition, the Fund could be exposed to risks if the counterparties to the contracts are unable to meet the terms of their contracts. The Fund’s maximum risk of loss from counterparty credit risk is the value of its currency exchanged with the counterparty. The risk is generally mitigated by having a netting arrangement between the Fund and the counterparty and by the posting of collateral by the counterparty to the Fund to cover the Fund’s exposure to the counterparty.
During the year ended Nov. 30, 2014, the Fund entered into foreign currency exchange contracts to hedge the U.S. dollar value of securities it already owns that are denominated in foreign currencies.
During the year ended Nov. 30, 2014, the Fund held foreign currency exchange contracts which are reflected on the “Statement of operations” under “Net realized loss on foreign currency exchange contracts.” No foreign currency exchange contracts were outstanding at Nov. 30, 2014.
Derivatives Generally. The table below summarizes the average balance of derivative holdings by the Fund during the year ended Nov. 30, 2014.
| Long Derivative Volume | Short Derivative Volume | |||||||
Foreign currency exchange contracts (average cost) | USD 204,237 | USD 120,170 | ||||||
9. Offsetting
In December 2011, the Financial Accounting Standards Board (FASB) issued guidance that expands current disclosure requirements on the offsetting of certain assets and liabilities. The disclosures are required for investments and derivative financial instruments subject to master netting or similar agreements which are eligible for offset in the statement of assets and liabilities and require an entity to disclose both gross and net information about such investments and transactions in the financial
38
statements. In January 2013, the FASB issued guidance that clarifies which investments and transactions are subject to the offsetting disclosure requirements. The scope of the disclosure requirements for offsetting is limited to derivative instruments, repurchase agreements and reverse repurchase agreements, and securities borrowing and securities lending transactions. The guidance is effective for financial statements with fiscal years beginning on or after Jan. 1, 2013, and interim periods within those fiscal years. The Fund adopted the disclosure provisions on offsetting during the current reporting period.
In order to better define its contractual rights and to secure rights that will help the Fund mitigate its counterparty risk, the Fund entered into an International Swaps and Derivatives Association, Inc. Master Agreement (ISDA Master Agreement) or a similar agreement with each of its derivative contract counterparties. An ISDA Master Agreement is a bilateral agreement between the Fund and a counterparty that governs certain over-the-counter (OTC) derivatives and foreign exchange contracts and typically contains, among other things, collateral posting items and netting provisions in the event of a default and/or termination event. Under an ISDA Master Agreement, the Fund may, under certain circumstances, offset with the counterparty certain derivative financial instruments’ payables and/or receivables with collateral held and/or posted and create one single net payment. The provisions of the ISDA Master Agreement typically permit a single net payment in the event of default (close-out), including the bankruptcy or insolvency of the counterparty. However, bankruptcy or insolvency laws of a particular jurisdiction may impose restrictions on or prohibitions against the right of offset in bankruptcy, insolvency, or other events.
For financial reporting purposes, the Fund does not offset derivative assets and derivative liabilities that are subject to netting arrangements on the “Statement of assets and liabilities.”
At Nov. 30, 2014, the Fund had the following assets and liabilities subject to offsetting provisions:
Offsetting of Financial Assets and Liabilities and Derivative Assets and Liabilities
Master Repurchase Agreements
Counterparty | Repurchase Agreements | Fair Value of Non-Cash Collateral Received | Cash Collateral Received | Net Amount(a) | ||||||||||||
Bank of America Merrill Lynch | $ | 126,928 | $ | (126,928 | ) | $ | — | $ | — | |||||||
Bank of Montreal | 42,310 | (42,310 | ) | — | — | |||||||||||
BNP Paribas | 190,762 | (190,762 | ) | — | — | |||||||||||
|
|
|
|
|
|
|
| |||||||||
Total | $ | 360,000 | $ | (360,000 | ) | $ | — | $ | — | |||||||
|
|
|
|
|
|
|
| |||||||||
(a)Net amount represents the receivable/(payable) that would be due from/(to) the counterparty in the event of default.
39
Notes to financial statements
Delaware Focus Global Growth Fund
10. Securities Lending
The Fund, along with other funds in the Delaware Investments® Family of Funds, may lend its securities pursuant to a security lending agreement (Lending Agreement) with The Bank of New York Mellon (BNY Mellon). At the time a security is loaned, the borrower must post collateral equal to the required percentage of the market value of the loaned security, including any accrued interest. The required percentage is: (1) 102% with respect to U.S. securities and foreign securities that are denominated and payable in U.S. dollars; and (2) 105% with respect to foreign securities. With respect to each loan, if on any business day the aggregate market value of securities collateral plus cash collateral held is less than the aggregate market value of the securities which are the subject of such loan, the borrower will be notified to provide additional collateral by the end of the following business day which, together with the collateral already held, will be not less than the applicable initial collateral requirements for such security loan. If the aggregate market value of securities collateral and cash collateral held with respect to a security loan exceeds the applicable initial collateral requirement, upon the request of the borrower, BNY Mellon must return enough collateral to the borrower by the end of the following business day to reduce the value of the remaining collateral to the applicable initial collateral requirement for such security loan. As a result of the foregoing, the value of the collateral held with respect to a loaned security on any particular day, may be more or less than the value of the security on loan.
Cash collateral received is generally invested in the Delaware Investments Collateral Fund No. 1 (Collective Trust) established by BNY Mellon for the purpose of investment on behalf of funds managed by DMC that participate in BNY Mellon’s securities lending program. The Collective Trust may invest in U.S. government securities and high quality corporate debt, asset-backed and other money market securities, and in repurchase agreements collateralized by such securities, provided that the Collective Trust will generally have a dollar-weighted average portfolio maturity of 60 days or less. The Fund can also accept U.S. government securities and letters of credit (non-cash collateral) in connection with securities loans. In the event of default or bankruptcy by the lending agent, realization and/or retention of the collateral may be subject to legal proceedings. In the event the borrower fails to return loaned securities and the collateral received is insufficient to cover the value of the loaned securities and provided such collateral shortfall is not the result of investment losses, the lending agent has agreed to pay the amount of the shortfall to the Fund or, at the discretion of the lending agent, replace the loaned securities. The Fund continues to record dividends or interest, as applicable, on the securities loaned and is subject to changes in value of the securities loaned that may occur during the term of the loan. The Fund has the right under the Lending Agreement to recover the securities from the borrower on demand. With respect to security loans collateralized by non-cash collateral, the Fund receives loan premiums paid by the borrower. With respect to security loans collateralized by cash collateral, the earnings from the collateral investments are shared among the Fund, the security lending agent and the borrower. The Fund records security lending income net of allocations to the security lending agent, and the borrower.
The Collective Trust used for the investment of cash collateral received from borrowers of securities seeks to maintain a net asset value per unit of $1.00, but there can be no assurance that it will always be able to do so. The Fund may incur investment losses as a result of investing securities lending collateral in the Collective Trust. This could occur if an investment in the Collective Trust defaulted or if it were necessary to liquidate assets in the Collective Trust to meet returns on outstanding security loans at a
40
time when the Collective Trust’s net asset value per unit was less than $1.00. Under those circumstances, the Fund may not receive an amount from the Collective Trust that is equal in amount to the collateral the Fund would be required to return to the borrower of the securities and the Fund would be required to make up for this shortfall.
During the year ended Nov. 30, 2014, the Fund had no securities out on loan.
11. Credit and Market Risk
Some countries in which the Fund may invest require governmental approval for the repatriation of investment income, capital, or the proceeds of sales of securities by foreign investors. In addition, if there is deterioration in a country’s balance of payments, or for other reasons, a country may impose temporary restrictions on foreign capital remittances abroad.
The securities exchanges of certain foreign markets are substantially smaller, less liquid and more volatile than the major securities markets in the United States. Consequently, acquisition and disposition of securities by the Fund may be inhibited. In addition, a significant portion of the aggregate market value of equity securities listed on the major securities exchanges in emerging markets is held by a smaller number of investors. This may limit the number of shares available for acquisition or disposition by the Fund.
The Fund may invest up to 15% of its net assets in illiquid securities, which may include securities with contractual restrictions on resale, securities exempt from registration under Rule 144A of the Securities Act of 1933, as amended, and other securities which may not be readily marketable. The relative illiquidity of these securities may impair the Fund from disposing of them in a timely manner and at a fair price when it is necessary or desirable to do so. While maintaining oversight, the Fund’s Board has delegated to DMC the day-to-day functions of determining whether individual securities are liquid for purposes of the Fund’s limitation on investments in illiquid securities. Securities eligible for resale pursuant to Rule 144A, which are determined to be liquid, are not subject to the Fund’s 15% limit on investments in illiquid securities. As of Nov. 30, 2014, there were no Rule 144A securities held by the Fund. Illiquid securities have been identified in the “Schedule of investments.”
12. Contractual Obligations
The Fund enters into contracts in the normal course of business that contain a variety of indemnifications. The Fund’s maximum exposure under these arrangements is unknown. However, the Fund has not had prior claims or losses pursuant to these contracts. Management has reviewed the Fund’s existing contracts and expects the risk of loss to be remote.
13. Recent Accounting Pronouncements
In June 2014, the FASB issued guidance to improve the financial reporting of reverse repurchase agreements and other similar transactions. The guidance includes expanded disclosure requirements for entities that enter into reverse repurchase agreements and similar transactions accounted for as secured borrowings. The guidance is effective for financial statements with fiscal years beginning on or after
41
Notes to financial statements
Delaware Focus Global Growth Fund
13. Recent Accounting Pronouncements (Continued)
Dec. 15, 2014 and interim periods within those fiscal years. Management is evaluating the impact, if any, of this guidance on the Fund’s financial statement disclosures.
14. Subsequent Events
Management has determined that no other material events or transactions occurred subsequent to Nov. 30, 2014 that would require recognition or disclosure in the Fund’s financial statements.
42
registered public accounting firm
To the Board of Trustees of Delaware Group® Global & International Funds
and Shareholders of Delaware Focus Global Growth Fund:
In our opinion, the accompanying statement of assets and liabilities, including the schedule of investments, and the related statements of operations and of changes in net assets and the financial highlights present fairly, in all material respects, the financial position of Delaware Focus Global Growth Fund (one of the series constituting Delaware Group Global & International Funds, hereafter referred to as the “Fund”) at November 30, 2014, the results of its operations for the year then ended, the changes in its net assets for each of the two years in the period then ended and the financial highlights for each of the periods indicated, in conformity with accounting principles generally accepted in the United States of America. These financial statements and financial highlights (hereafter referred to as “financial statements”) are the responsibility of the Fund’s management. Our responsibility is to express an opinion on these financial statements based on our audits. We conducted our audits of these financial statements in accordance with the standards of the Public Company Accounting Oversight Board (United States). Those standards require that we plan and perform the audit to obtain reasonable assurance about whether the financial statements are free of material misstatement. An audit includes examining, on a test basis, evidence supporting the amounts and disclosures in the financial statements, assessing the accounting principles used and significant estimates made by management, and evaluating the overall financial statement presentation. We believe that our audits, which included confirmation of securities at November 30, 2014 by correspondence with the custodian and brokers, provide a reasonable basis for our opinion.
PricewaterhouseCoopers LLP
Philadelphia, Pennsylvania
January 22, 2015
43
Other Fund information (Unaudited)
Delaware Focus Global Growth Fund
Tax Information
The information set forth below is for the Fund’s fiscal year as required by federal income tax laws. Shareholders, however, must report distributions on a calendar year basis for income tax purposes, which may include distributions for portions of two fiscal years of the Fund. Accordingly, the information needed by shareholders for income tax purposes will be sent to them in January of each year. Please consult your tax advisor for proper treatment of this information.
All disclosures are based on financial information available as of the date of this annual report and, accordingly are subject to change. For any and all items requiring reporting, it is the intention of the Fund to report the maximum amount permitted under the Internal Revenue Code and the regulations thereunder.
For the fiscal year ended Nov. 30, 2014, the Fund reports distributions paid during the year as follows:
(A) Ordinary Income Distributions* (Tax Basis) | 31.78 | % | ||
(B) Long-Term Capital Gain Distributions (Tax Basis) | 68.22 | % | ||
Total Distributions (Tax Basis) | 100.00 | % | ||
(C) Qualified Dividends1 | 27.26 | % |
(A) and (B) are based on a percentage of the Fund’s total distributions.
(C) is based on a percentage of the Fund’s ordinary income distributions.
1 Qualifying dividends represent dividends which qualify for the corporate dividends received deduction.
*For the fiscal year ended Nov. 30, 2014, certain dividends paid by the Fund may be subject to a maximum tax rate of 20%. The percentage of dividends paid by the Fund from ordinary income reported as qualified dividend income is 100%. Complete information will be computed and reported in conjunction with your 2014 Form 1099-DIV.
Proxy Results
At Joint Special Meetings of Shareholders of Delaware Group® Global & International Funds held on May 16, 2014 on behalf of Delaware Focus Global Growth Fund (Fund), the shareholders of the Fund voted to approve a new sub-advisory agreement for the Fund between Delaware Management Company (DMC), the advisor to the Fund, and Jackson Square Partners, LLC (JSP). JSP, a Delaware limited liability company, is a joint venture between Delaware Investments Advisers Partner, Inc., an affiliate of DMC, and California Street Partners, LP, a Delaware limited liability company owned by certain JSP personnel.
The following proposal was submitted for a vote of the shareholders:
To approve a new sub-advisory agreement for the Fund.
A quorum of the shares outstanding was present, and the votes passed with a majority of those shares.
44
| The results were as follows: | ||||
Shares voted for | 3,544,055 | |||
Percentage of outstanding shares | 55.55 | % | ||
Percentage of shares voted | 99.64 | % | ||
Shares voted against | 4,727 | |||
Percentage of outstanding shares | 0.07 | % | ||
Percentage of shares voted | 0.13 | % | ||
Shares abstained | 8,120 | |||
Percentage of outstanding shares | 0.13 | % | ||
Percentage of shares voted | 0.23 | % | ||
Board consideration of Delaware Focus Global Growth Fund sub-advisory agreement with Jackson Square Partners, LLC
At a meeting held on Feb. 18–20, 2014 (Meeting), the Board of Trustees (Board), including a majority of disinterested or Independent Trustees, approved a Sub-Advisory Agreement for Delaware Focus Global Growth Fund (Fund). In making its decision, the Board considered information prepared specifically in connection with the approval of the Sub-advisory Agreement. Information furnished specifically in connection with the approval of the Sub-advisory Agreement with Jackson Square Partners, LLC (JSP) included materials provided by JSP concerning, among other things, the nature, extent, and quality of service provided to the Fund, the costs of such services to the Fund, economies of scale, and the financial condition and profitability of JSP. In addition, the Board considered reports prepared by Lipper, Inc., an independent statistical compilation organization (Lipper), which compared the Fund’s investment performance and expenses with those of other comparable mutual funds.
In considering information relating to the approval of the Sub-Advisory Agreement, the Independent Trustees received assistance and advice from and met separately with independent legal counsel to the Independent Trustees. Although the Board gave attention to all information furnished, the following discussion identifies, under separate headings, the primary factors taken into account by the Board during its contract approval considerations.
Nature, Extent, and Quality of Service. The Board considered the continuity of investment management to be provided to the Fund and its shareholders. Management provided certain information to the Board regarding the transition of the current portfolio management team (Focus Growth Team) to JSP (Transaction). Following the close of the Transaction, the Focus Growth Team would continue to provide portfolio management services to the Fund as owners or employees of JSP. In reviewing the nature, extent, and quality of services, the Board considered that the same personnel will be providing portfolio management services to the Fund following the completion of the Transaction, and therefore, considered the many reports furnished to them throughout 2012 and 2013 at regular Board meetings covering matters such as the relative performance of the Fund, and the compliance of portfolio managers with the investment policies, strategies, and restrictions for the Fund. The Board was pleased with the emphasis placed on research and risk management in the investment process. The Board concluded that it was satisfied with the nature, extent, and quality of the overall services to be provided by JSP.
45
Other Fund information (Unaudited)
Delaware Focus Global Growth Fund
Board consideration of Delaware Focus Global Growth Fund sub-advisory agreement with Jackson Square Partners, LLC (continued)
In addition, the Board considered that in connection with the Transaction, Delaware Investments Advisers Partner, Inc. (DIAP) and JSP would enter into a transaction services agreement. Under the terms of this agreement, DIAP and certain of its affiliates would provide compliance and other administrative support to JSP for an 18-month period following the close of the Transaction.
Investment Performance. The Board considered the overall investment performance of the Focus Growth Team and the Fund. The Board placed significant emphasis on the investment performance of the Fund in view of its importance to shareholders. The Board reviewed reports prepared by Lipper for the Fund that showed the Fund’s investment performance as of March 31, 2013 in comparison to a group of funds selected by Lipper as being similar to the Fund (the Performance Universe). A fund with the best performance ranked first, and a fund with the poorest performance ranked last. The highest/ best performing 25% of funds in the Performance Universe make up the first quartile; the next 25%, the second quartile; the next 25%, the third quartile; and the poorest/worst performing 25% of funds in the Performance Universe make up the fourth quartile. Annualized investment performance for the Fund was shown for the past 1-, 3-, 5-, and 10-year periods, as applicable, compared to that of the Performance Universe. The Board’s objective was that the Fund’s performance for the periods considered be at or above the median of its Performance Universe. In addition, the Board reviewed more recent Lipper data that had been provided at the quarterly Board meetings held since March 31, 2013. With respect to the Fund’s performance as of Dec. 31, 2013, they noted:
The Performance Universe for the Fund consisted of the Fund and all retail and institutional global multi-cap growth funds as selected by Lipper. The Lipper report comparison showed that the Fund’s total return for the 1-year period was in the third quartile of its Performance Universe. The report further showed that the Fund’s total return for the 3-year period was in the second quartile of its Performance Universe.
The Board noted that they were satisfied with the overall performance of the Fund. Moreover, the Board concluded that the Transaction was unlikely to have any effect on JSP’s management of the Fund or its investment performance because the current portfolio management personnel will continue to provide portfolio management services to the Fund.
Comparative Expenses. The Board also evaluated expense comparison data for the Fund. JSP provided the Board with information on pricing levels and fee structures for the Fund and comparative funds. The Board noted that JSP’s fees will be paid by the Fund’s advisor, Delaware Management Company, Inc. (DMC), not by the Fund. They also focused on the comparative analysis of the effective management fees (including sub-advisory fees) and total expense ratios of the Fund versus the effective management fees (including sub-advisory fees) and expense ratios of a group of funds selected by Lipper as being similar to the Fund (Expense Group). In reviewing comparative costs, the Fund’s contractual management fee (including sub-advisory fees) and the actual management fee incurred by the Fund were compared with the contractual management fees (assuming all funds in the Expense Group were similar in size to the applicable Fund) and actual management fees (as reported by each fund) of other funds within the Expense Group. The Fund’s total expenses were also compared with
46
those of its Expense Group. The Board’s objective was for the Fund’s total expense ratio to be competitive with that of the Expense Group. They concluded that, because the sub-advisory fee rate paid by DMC on behalf of the Fund would not change, the Fund’s expenses were satisfactory.
Management Profitability. Because JSP did not have historical operations, it provided a pro forma profitability analysis to the Board, and the Board considered the level of profits expected to be realized by JSP as part of their annual contract evaluation. The Board discussed the transition services to be provided to JSP by Delaware Investments and the cost of providing those services. The Board also considered the extent to which JSP might derive ancillary benefits from the Fund’s operations, including the potential for procuring additional business as a result of the prestige and visibility associated with its role as Sub-advisor to the Fund and the benefits from allocation of the Fund’s brokerage to improve trading efficiencies. The Board concluded that the sub-advisory fee was reasonable in light of the services to be rendered.
Economies of Scale. The Board considered whether economies of scale would be realized by JSP and the extent to which any economies of scale would be reflected in the level of sub-advisory fees. The Board considered the fact that several of the funds to be managed by JSP had already reached breakpoints in their management fees.
Fall-out Benefits. The Board considered that JSP may derive reputational, strategic, and other benefits from its association with the Fund, and evaluated the extent to which JSP might derive ancillary benefits from Fund operations, including the potential for procuring additional business as a result of its role as a service provider to the Fund and the benefits from allocation of Fund brokerage to improve trading efficiencies. However, the Board concluded that (i) such benefits did not impose a cost or burden on the Fund or its shareholders, and (ii) such benefits would probably have an indirectly beneficial effect on the Fund and its shareholders because of the added importance that JSP might attach to the Fund as a result of the fall-out benefits that the Fund conveyed.
Board consideration of Delaware Focus Global Growth Fund investment management agreement
At a meeting held on Aug. 19-21, 2014 (the Annual Meeting), the Board, including a majority of disinterested or independent Trustees, approved the renewal of the Investment Management Agreement for the Fund. In making its decision, the Board considered information furnished at regular quarterly Board meetings, including reports detailing Fund performance, investment strategies and expenses, as well as information prepared specifically in connection with the renewal of the investment advisory and sub-advisory contracts. Information furnished specifically in connection with the renewal of the Investment Management Agreement with DMC included materials provided by DMC and its affiliates (Delaware Investments) concerning, among other things, the nature, extent and quality of services provided to the Fund, the costs of such services to the Fund, economies of scale and the financial condition and profitability of Delaware Investments. In addition, in connection with the Annual Meeting, reports were provided to the Trustees in May 2014 and included reports provided by Lipper. The Lipper reports compared the Fund’s investment performance and expenses with those of other comparable mutual funds. The Independent Trustees reviewed and discussed the Lipper reports with independent
47
Other Fund information (Unaudited)
Delaware Focus Global Growth Fund
Board consideration of Delaware Focus Global Growth Fund investment management agreement (continued)
legal counsel to the Independent Trustees. The Board requested and received information regarding DMC’s policy with respect to advisory fee levels and its breakpoint philosophy; the structure of portfolio manager compensation; the investment manager’s profitability; comparative client fee information; and any constraints or limitations on the availability of securities for certain investment styles, which had in the past year inhibited, or which were likely in the future to inhibit, DMC’s ability to invest fully in accordance with Fund policies. It was noted that the Board approved a subadvisory agreement between DMC and Jackson Square Partners, LLC in February 2014.
In considering information relating to the approval of the Fund’s advisory agreement, the Independent Trustees received assistance and advice from and met separately with independent legal counsel to the Independent Trustees. Although the Board gave attention to all information furnished, the following discussion identifies, under separate headings, the primary factors taken into account by the Board during its contract renewal considerations.
Nature, Extent, and Quality of Service. The Board considered the services provided by Delaware Investments to the Fund and its shareholders. In reviewing the nature, extent and quality of services, the Board considered reports furnished to it throughout the year, which covered matters such as the relative performance of the Fund, compliance of portfolio managers with the investment policies, strategies and restrictions for the Fund, compliance by DMC and Delaware Distributors, L.P. (together, Management) personnel with the Code of Ethics adopted throughout the Delaware Investments® Family of Funds complex and adherence to fair value pricing procedures as established by the Board. The Board was pleased with the current staffing of the Fund’s investment manager and the emphasis placed on research in the investment process. The Board recognized DMC’s recent receipt of several industry distinctions. The Board gave favorable consideration to DMC’s efforts to control expenditures while maintaining service levels committed to Fund matters. The Board noted that, in the third and fourth quarters of 2013, Management reduced the maximum 12b-1 fee for certain funds; and in November 2013 Management negotiated a substantial reduction in fees for fund accounting services provided to the Funds. The Board noted the benefits provided to Fund shareholders through each shareholder’s ability to exchange an investment in one Delaware Investments fund for the same class of shares in another Delaware Investments fund without a sales charge, to reinvest Fund dividends into additional shares of the Fund or into additional shares of other Delaware Investments funds and the privilege to combine holdings in other Delaware Investments funds to obtain a reduced sales charge. The Board was satisfied with the nature, extent, and quality of the overall services provided by Delaware Investments.
Investment Performance. The Board placed significant emphasis on the investment performance of the Fund in view of the importance of investment performance to shareholders. Although the Board gave appropriate consideration to performance reports and discussions with portfolio managers at Investment Committee meetings throughout the year, the Board gave particular weight to the Lipper reports furnished for the Annual Meeting. The Lipper reports prepared for the Fund showed the investment performance of its Class A shares in comparison to a group of similar funds as selected by Lipper (the Performance Universe). A fund with the best performance ranked first, and a fund with the poorest
48
performance ranked last. The highest/best performing 25% of funds in the Performance Universe make up the first quartile; the next 25%, the second quartile; the next 25%, the third quartile; and the poorest/ worst performing 25% of funds in the Performance Universe make up the fourth quartile. Comparative annualized performance for the Fund was shown for the past 1-, 3-, 5- and 10-year periods, to the extent applicable, ended March 31, 2014. The Board’s objective is that the Fund’s performance for the periods considered be at or above the median of its Performance Universe. The following paragraph summarizes the performance results for the Fund and the Board’s view of such performance.
The Performance Universe for the Fund consisted of the Fund and all retail and institutional global multi-cap growth funds as selected by Lipper. The Lipper report comparison showed that the Fund’s total return for the 1-year period was in the fourth quartile of its Performance Universe. The report further showed that the Fund’s total return for the 3- and 5-year periods was in the second quartile and first quartile of its Performance Universe, respectively. The Board determined that the Fund’s performance results were mixed, but tended toward above median, which was acceptable.
Comparative Expenses. The Board considered expense comparison data for the Delaware Investments Family of Funds. Management provided the Board with information on pricing levels and fee structures for the Fund as of its most recently completed fiscal year. The Board also focused on the comparative analysis of effective management fees and total expense ratios of the Fund versus effective management fees and expense ratios of a group of similar funds as selected by Lipper (the Expense Group). In reviewing comparative costs, the Fund’s contractual management fee and the actual management fee incurred by the Fund were compared with the contractual management fees (assuming all funds in the Expense Group were similar in size to the Fund) and actual management fees (as reported by each fund) within the Expense Group, taking into account any applicable breakpoints and fee waivers. The Fund’s total expenses were also compared with those of its Expense Group. The Lipper total expenses, for comparative consistency, were shown by Lipper for Class A shares and comparative total expenses including 12b-1 and non 12b-1 service fees. The Board considered fees paid to Delaware Investments for non-management services. The Board’s objective is to limit the Fund’s total expense ratio to be competitive with that of the Expense Group. The following paragraph summarizes the expense results for the Fund and the Board’s view of such expenses.
The expense comparisons for the Fund showed that its actual management fee was in the quartile with the highest expenses of its Expense Group and its total expenses were in the quartile with the second highest expenses of its Expense Group. The Board noted that the Fund’s total expenses were not in line with the Board’s objective. In evaluating total expenses, the Board considered fee waivers in place through March 2015 and various initiatives implemented by Management, such as the outsourcing of certain transfer agency services and a negotiation of lower fees for fund accounting services, which had created an opportunity for a further reduction in expenses. The Board was satisfied with Management’s efforts to improve the Fund’s total expense ratio and to bring it in line with the Board’s objective.
Management Profitability. The Board considered the level of profits realized by Delaware Investments in connection with the operation of the Fund. In this respect, the Board reviewed the Investment Management Profitability Analysis that addressed the overall profitability of Delaware Investments’ business in providing management and other services to each of the individual funds and the
49
Other Fund information (Unaudited)
Delaware Focus Global Growth Fund
Board consideration of Delaware Focus Global Growth Fund investment management agreement (continued)
Delaware Investments® Family of Funds as a whole. Specific attention was given to the methodology followed in allocating costs for the purpose of determining profitability. Management stated that the level of profits of Delaware Investments, to a certain extent, reflects recent operational cost savings and efficiencies initiated by Delaware Investments. The Board considered Delaware Investments’ efforts to improve services provided to fund shareholders and to meet additional regulatory and compliance requirements resulting from recent industry-wide Securities and Exchange Commission initiatives. The Board also considered the extent to which Delaware Investments might derive ancillary benefits from fund operations, including the potential for procuring additional business as a result of the prestige and visibility associated with its role as service provider to the Delaware Investments Family of Funds and the benefits from allocation of fund brokerage to improve trading efficiencies. The Board found that the management fees were reasonable in light of the services rendered and the level of profitability of Delaware Investments.
Economies of Scale. The Trustees considered whether economies of scale are realized by Delaware Investments as the Fund’s assets increase and the extent to which any economies of scale are reflected in the level of management fees charged. The Trustees reviewed the standardized advisory fee pricing and structure, approved by the Board and shareholders, which includes breakpoints. Breakpoints in the advisory fee occur when the advisory fee rate is reduced on assets in excess of specified levels. Breakpoints result in a lower advisory fee than would otherwise be the case on all assets when the asset levels specified are exceeded. The Board noted that the fee under the Fund’s management contract fell within the standard structure. Although the Fund has not reached a size at which it can take advantage of breakpoints, the Board recognized that the fee was structured so that when the Fund grows, economies of scale may be shared.
50
This page intentionally left blank.
Board of trustees / directors and officers addendum
Delaware Investments® Family of Funds
A mutual fund is governed by a Board of Trustees / Directors (“Trustees”), which has oversight responsibility for the management of a fund’s business affairs. Trustees establish procedures and oversee and review the performance of the investment manager, the distributor, and others who perform services for the fund. The independent fund trustees, in particular, are advocates
Name, Address, and Birth Date | Position(s) Held with Fund(s) | Length of Time Served | ||
Interested Trustee
| ||||
Patrick P. Coyne1 2005 Market Street Philadelphia, PA 19103 April 1963 | Chairman, President, Chief Executive Officer, and Trustee | Chairman and Trustee since August 16, 2006
President and Chief Executive Officer since August 1, 2006
| ||
Independent Trustees
| ||||
Thomas L. Bennett 2005 Market Street Philadelphia, PA 19103 October 1947
| Trustee | Since March 2005 | ||
Joseph W. Chow 2005 Market Street Philadelphia, PA 19103 January 1953
| Trustee | Since January 2013 | ||
John A. Fry 2005 Market Street Philadelphia, PA 19103 May 1960
| Trustee | Since January 2001 |
| 1 | Patrick P. Coyne is considered to be an “Interested Trustee“ because he is an executive officer of the Fund’s(s’) investment advisor. |
52
for shareholder interests. Each trustee has served in that capacity since he or she was elected to or appointed to the Board of Trustees, and will continue to serve until his or her retirement or the election of a new trustee in his or her place. The following is a list of the Trustees and Officers with certain background and related information.
Principal Occupation(s) During the Past Five Years | Number of Portfolios in Fund Complex Overseen by Trustee or Officer | Other Directorships Held by Trustee or Officer | ||
Patrick P. Coyne has served in various executive capacities at different times at Delaware Investments.2 | 65 | Board of Governors Member Investment Company Institute (ICI)
Director and Audit Committee Member Kaydon Corp. (2007–2013) | ||
Private Investor (March 2004–Present) | 65 | Director Bryn Mawr Bank Corp. (BMTC) (2007–2011)
| ||
Executive Vice President (Emerging Economies Strategies, Risk and Corporate Administration) State Street Corporation (July 2004–March 2011)
| 65 | Director and Audit Committee Member — Hercules Technology Growth Capital, Inc. (2004-2014) | ||
President Drexel University (August 2010–Present)
President Franklin & Marshall College (July 2002–July 2010)
| 65 | Director — Hershey Trust Company
Director, Audit Committee, and Governance Committee Member Community Health Systems |
| 2 | Delaware Investments is the marketing name for Delaware Management Holdings, Inc. and its subsidiaries, including the Fund’s(s’) investment advisor, principal underwriter, and its transfer agent. |
53
Board of trustees / directors and officers addendum
Delaware Investments® Family of Funds
Name, Address, and Birth Date | Position(s) Held with Fund(s) | Length of Time Served | ||
Independent Trustees (continued)
| ||||
Lucinda S. Landreth 2005 Market Street Philadelphia, PA 19103 June 1947
| Trustee | Since March 2005 | ||
Frances A. Sevilla-Sacasa 2005 Market Street Philadelphia, PA 19103 January 1956
| Trustee | Since September 2011 | ||
Thomas K. Whitford 2005 Market Street Philadelphia, PA 19103 March 1956
| Trustee | Since January 2013 |
54
Principal Occupation(s) During the Past Five Years | Number of Portfolios in Fund Complex Overseen by Trustee or Officer | Other Directorships Held by Trustee or Officer | ||
Private Investor (2004–Present)
| 65 | None | ||
Chief Executive Officer — Banco Itaú International (April 2012–Present)
| 65 | Trust Manager and Audit Committee Member — Camden Property Trust | ||
Executive Advisor to Dean (August 2011–March 2012) and Interim Dean (January 2011–July 2011) — University of Miami School of Business Administration
| ||||
President — U.S. Trust, Bank of America Private Wealth Management (Private Banking) (July 2007–December 2008)
| ||||
Vice Chairman (2010–April 2013) Chief Administrative Officer (2008–2010) and Executive Vice President and Chief Administrative Officer (2007–2009) — PNC Financial Services Group
| 65 | Director — HSBC Finance Corporation and HSBC North America Holdings Inc. |
55
Board of trustees / directors and officers addendum
Delaware Investments® Family of Funds
Name, Address, and Birth Date | Position(s) Held with Fund(s) | Length of Time Served | ||
Independent Trustees (continued) | ||||
Janet L. Yeomans 2005 Market Street Philadelphia, PA 19103 July 1948 | Trustee | Since April 1999 | ||
| ||||
J. Richard Zecher 2005 Market Street Philadelphia, PA 19103 July 1940 | Trustee | Since March 2005 | ||
| ||||
56
Principal Occupation(s) During the Past Five Years | Number of Portfolios in Fund Complex Overseen by Trustee or Officer | Other Directorships Held by Trustee or Officer | ||
Vice President and Treasurer (January 2006–July 2012) Vice President — Mergers & Acquisitions (January 2003–January 2006), and Vice President and Treasurer (July 1995–January 2003) 3M Corporation | 65 | Director, Audit and Compliance Committee Chair, Investment Committee Member and Governance Committee Member Okabena Company
Chair — 3M Investment Management Company (2005–2012)
| ||
Founder Investor Analytics (Risk Management) (May 1999–Present) | 65 | Director and Compensation Committee Chairman Investor Analytics | ||
Founder P/E Investments (Hedge Fund) (September 1996–Present) | Director — P/E Investments | |||
57
Board of trustees / directors and officers addendum
Delaware Investments® Family of Funds
Name, Address, and Birth Date | Position(s) Held with Fund(s) | Length of Time Served | ||
| Officers | ||||
David F. Connor 2005 Market Street Philadelphia, PA 19103 December 1963 | Senior Vice President, Deputy General Counsel, and Secretary | Senior Vice President, Deputy General Counsel since May 2013; Vice President, Deputy General Counsel September 2000 – May 2013; Secretary since October 2005 | ||
Daniel V. Geatens 2005 Market Street Philadelphia, PA 19103 October 1972 | Vice President and Treasurer | Treasurer since October 2007 | ||
David P. O’Connor 2005 Market Street Philadelphia, PA 19103 February 1966 | Executive Vice President, General Counsel and Chief Legal Officer | Executive Vice President since February 2012; Senior Vice President October 2005 – February 2012; General Counsel and Chief Legal Officer since October 2005
| ||
Richard Salus 2005 Market Street Philadelphia, PA 19103 October 1963 | Senior Vice President and Chief Financial Officer | Chief Financial Officer since November 2006 |
The Statement of Additional Information for the Fund(s) includes additional information about the Trustees and Officers and is available, without charge, upon request by calling 800 523-1918.
58
Principal Occupation(s) During the Past Five Years | Number of Portfolios in Fund Complex Overseen by Trustee or Officer | Other Directorships Held by Trustee or Officer | ||
| ||||
David F. Connor has served as Deputy General Counsel of Delaware Investments since 2000.
| 65 | None3 | ||
Daniel V. Geatens has served in various capacities at different times at Delaware Investments.
| 65 | None3 | ||
David P. O’Connor has served in various executive and legal capacities at different times at Delaware Investments. | 65 | None3 | ||
Richard Salus has served in various executive capacities at different times at Delaware Investments. | 65 | None3 |
| 3 | David F. Connor, Daniel V. Geatens, David P. O’Connor, and Richard Salus serve in similar capacities for the six portfolios of the Optimum Fund Trust, which have the same investment advisor, principal underwriter, and transfer agent as the registrant. |
59
Board of trustees
| ||||||
| Patrick P. Coyne | Joseph W. Chow | Lucinda S. Landreth | Thomas K. Whitford | |||
| Chairman, President, and | Former Executive Vice | Former Chief Investment | Former Vice Chairman | |||
| Chief Executive Officer | President | Officer | PNC Financial Services Group | |||
| Delaware Investments® | State Street Corporation | Assurant, Inc. | Pittsburgh, PA | |||
| Family of Funds | Brookline, MA | Philadelphia, PA | ||||
| Philadelphia, PA | Janet L. Yeomans | |||||
| John A. Fry | Frances A. | Former Vice President and | ||||
| Thomas L. Bennett | President | Sevilla-Sacasa | Treasurer | |||
| Private Investor | Drexel University | Chief Executive Officer | 3M Corporation | |||
| Rosemont, PA | Philadelphia, PA | Banco Itaú | St. Paul, MN | |||
| International Miami, FL |
J. Richard Zecher | |||||
| Founder | ||||||
| Investor Analytics | ||||||
| Scottsdale, AZ | ||||||
| Affiliated officers | ||||||
| David F. Connor | Daniel V. Geatens | David P. O’Connor | Richard Salus | |||
Senior Vice President, Deputy General Counsel, and Secretary Delaware Investments Family of Funds Philadelphia, PA | Vice President and Treasurer Delaware Investments Family of Funds Philadelphia, PA | Executive Vice President, General Counsel, and Chief Legal Officer Delaware Investments Family of Funds Philadelphia, PA | Senior Vice President and Chief Financial Officer Delaware Investments Family of Funds Philadelphia, PA | |||
This annual report is for the information of Delaware Focus Global Growth Fund shareholders, but it may be used with prospective investors when preceded or accompanied by the Delaware Investments Fund fact sheet for the most recently completed calendar quarter. These documents are available at delawareinvestments.com.
Delaware Investments is the marketing name of Delaware Management Holdings, Inc. and its subsidiaries.
The Fund files its complete schedule of portfolio holdings with the Securities and Exchange Commission (SEC) for the first and third quarters of each fiscal year on Form N-Q. The Fund’s Forms N-Q, as well as a description of the policies and procedures that the Fund uses to determine how to vote proxies (if any) relating to portfolio securities are available without charge (i) upon request, by calling 800 523-1918; and (ii) on the SEC’s website at sec.gov. In addition, a description of the policies and procedures that the Fund uses to determine how to vote proxies (if any) relating to portfolio securities and the Fund’s Schedule of Investments are available without charge on the Fund’s website at delawareinvestments.com. The Fund’s Forms N-Q may be reviewed and copied at the SEC’s Public Reference Room in Washington, D.C.; information on the operation of the Public Reference Room may be obtained by calling 800 SEC-0330.
Information (if any) regarding how the Fund voted proxies relating to portfolio securities during the most recently disclosed 12-month period ended June 30 is available without charge (i) through the Fund’s website at delawareinvestments.com; and (ii) on the SEC’s website at sec.gov.
60
Item 2. Code of Ethics
The registrant has adopted a code of ethics that applies to the registrant’s principal executive officer, principal financial officer, principal accounting officer or controller, or persons performing similar functions, regardless of whether these individuals are employed by the registrant or a third party. A copy of the registrant’s Code of Business Ethics has been posted on the Delaware Investments Internet Web site at www.delawareinvestments.com. Any amendments to the Code of Business Ethics, and information on any waiver from its provisions granted by the registrant, will also be posted on this Web site within five business days of such amendment or waiver and will remain on the Web site for at least 12 months.
Item 3. Audit Committee Financial Expert
The registrant’s Board of Trustees/Directors has determined that certain members of the registrant’s Audit Committee are audit committee financial experts, as defined below. For purposes of this item, an “audit committee financial expert” is a person who has the following attributes:
a. An understanding of generally accepted accounting principles and financial statements;
b. The ability to assess the general application of such principles in connection with the accounting for estimates, accruals, and reserves;
c. Experience preparing, auditing, analyzing, or evaluating financial statements that present a breadth and level of complexity of accounting issues that are generally comparable to the breadth and complexity of issues that can reasonably be expected to be raised by the registrant’s financial statements, or experience actively supervising one or more persons engaged in such activities;
d. An understanding of internal controls and procedures for financial reporting; and
e. An understanding of audit committee functions.
An “audit committee financial expert” shall have acquired such attributes through:
a. Education and experience as a principal financial officer, principal accounting officer, controller, public accountant, or auditor or experience in one or more positions that involve the performance of similar functions;
b. Experience actively supervising a principal financial officer, principal accounting officer, controller, public accountant, auditor, or person performing similar functions;
c. Experience overseeing or assessing the performance of companies or public accountants with respect to the preparation, auditing, or evaluation of financial statements; or
d. Other relevant experience.
The registrant’s Board of Trustees/Directors has also determined that each member of the registrant’s Audit Committee is independent. In order to be “independent” for purposes of this item, the Audit Committee member may not: (i) other than in his or her capacity as a member of the Board of Trustees/Directors or any committee thereof, accept directly or indirectly any consulting, advisory or other compensatory fee from the issuer; or (ii) be an “interested person” of the registrant as defined in Section 2(a)(19) of the Investment Company Act of 1940.
The names of the audit committee financial experts on the registrant’s Audit Committee are set forth below:
Joseph W. Chow
Lucinda S. Landreth1
Frances A. Sevilla-Sacasa
Janet L. Yeomans
Item 4. Principal Accountant Fees and Services
(a) Audit fees.
The aggregate fees billed for services provided to the registrant by its independent auditors for the audit of the registrant’s annual financial statements and for services normally provided by the independent auditors in connection with statutory and regulatory filings or engagements were $108,800 for the fiscal year ended November 30, 2014.
The aggregate fees billed for services provided to the registrant by its independent auditors for the audit of the registrant’s annual financial statements and for services normally provided by the independent auditors in connection with statutory and regulatory filings or engagements were $123,675 for the fiscal year ended November 30, 2013.
(b) Audit-related fees.
The aggregate fees billed by the registrant’s independent auditors for services relating to the performance of the audit of the registrant’s financial statements and not reported under paragraph (a) of this Item were $0 for the fiscal year ended November 30, 2014.
The aggregate fees billed by the registrant’s independent auditors for services relating to the performance of the audit of the financial statements of the registrant’s investment adviser and other service providers under common control with the adviser and that relate directly to the operations or financial reporting of the registrant were $618,000 for the registrant’s fiscal year ended November 30, 2014. The percentage of these fees relating to services approved by the registrant’s Audit Committee pursuant to the de minimis exception from the pre-approval requirement in Rule 2-01(c)(7)(i)(C) of Regulation S-X was 0%. These audit-related services were as follows: year-end audit procedures; group reporting and subsidiary statutory audits.
The aggregate fees billed by the registrant’s independent auditors for services relating to the performance of the audit of the registrant’s financial statements and not reported under paragraph (a) of this Item were $0 for the fiscal year ended November 30, 2013.
1 The instructions to Form N-CSR require disclosure on the relevant experience of persons who qualify as audit committee financial experts based on “other relevant experience.” The Board of Trustees/Directors has determined that Ms. Landreth qualifies as an audit committee financial expert by virtue of her experience as a financial analyst, her Chartered Financial Analyst (CFA) designation and her service as an audit committee chairperson for a non-profit organization.
The aggregate fees billed by the registrant’s independent auditors for services relating to the performance of the audit of the financial statements of the registrant’s investment adviser and other service providers under common control with the adviser and that relate directly to the operations or financial reporting of the registrant were $618,000 for the registrant’s fiscal year ended November 30, 2013. The percentage of these fees relating to services approved by the registrant’s Audit Committee pursuant to the de minimis exception from the pre-approval requirement in Rule 2-01(c)(7)(i)(C) of Regulation S-X was 0%. These audit-related services were as follows: year-end audit procedures; group reporting and subsidiary statutory audits.
(c) Tax fees.
The aggregate fees billed by the registrant’s independent auditors for tax-related services provided to the registrant were $29,605 for the fiscal year ended November 30, 2014. The percentage of these fees relating to services approved by the registrant’s Audit Committee pursuant to the de minimis exception from the pre-approval requirement in Rule 2-01(c)(7)(i)(C) of Regulation S-X was 0%. These tax-related services were as follows: review of income tax returns and review of annual excise distribution calculations.
The aggregate fees billed by the registrant’s independent auditors for tax-related services provided to the registrant’s investment adviser and other service providers under common control with the adviser and that relate directly to the operations or financial reporting of the registrant were $0 for the registrant’s fiscal year ended November 30, 2014.
The aggregate fees billed by the registrant’s independent auditors for tax-related services provided to the registrant were $28,100 for the fiscal year ended November 30, 2013. The percentage of these fees relating to services approved by the registrant’s Audit Committee pursuant to the de minimis exception from the pre-approval requirement in Rule 2-01(c)(7)(i)(C) of Regulation S-X was 0%. These tax-related services were as follows: review of income tax returns and review of annual excise distribution calculations.
The aggregate fees billed by the registrant’s independent auditors for tax-related services provided to the registrant’s investment adviser and other service providers under common control with the adviser and that relate directly to the operations or financial reporting of the registrant were $0 for the registrant’s fiscal year ended November 30, 2013.
(d) All other fees.
The aggregate fees billed for all services provided by the independent auditors to the registrant other than those set forth in paragraphs (a), (b) and (c) of this Item were $0 for the fiscal year ended November 30, 2014.
The aggregate fees billed for all services other than those set forth in paragraphs (b) and (c) of this Item provided by the registrant’s independent auditors to the registrant’s adviser and other service providers under common control with the adviser and that relate directly to the operations or financial reporting of the registrant were $0 for the registrant’s fiscal year ended November 30, 2014. The percentage of these fees relating to services approved by the registrant’s Audit Committee pursuant to the de minimis exception from the pre-approval requirement in Rule 2-01(c)(7)(i)(C) of Regulation S-X was 0%.
The aggregate fees billed for all services provided by the independent auditors to the registrant other than those set forth in paragraphs (a), (b) and (c) of this Item were $0 for the fiscal year ended November 30, 2013.
The aggregate fees billed for all services other than those set forth in paragraphs (b) and (c) of this Item provided by the registrant’s independent auditors to the registrant’s adviser and other service providers under common control with the adviser and that relate directly to the operations or financial reporting of the registrant were $0 for the registrant’s fiscal year ended November 30, 2013. The percentage of these fees relating to services approved by the registrant’s Audit Committee pursuant to the de minimis exception from the pre-approval requirement in Rule 2-01(c)(7)(i)(C) of Regulation S-X was 0%.
(e) The registrant’s Audit Committee has established pre-approval policies and procedures as permitted by Rule 2-01(c)(7)(i)(B) of Regulation S-X (the “Pre-Approval Policy”) with respect to services provided by the registrant’s independent auditors. Pursuant to the Pre-Approval Policy, the Audit Committee has pre-approved the services set forth in the table below with respect to the registrant up to the specified fee limits. Certain fee limits are based on aggregate fees to the registrant and other registrants within the Delaware Investments Family of Funds.
| Service | Range of Fees |
| Audit Services | |
| Statutory audits or financial audits for new Funds | up to $40,000 per Fund |
| Services associated with SEC registration statements (e.g., Form N-1A, Form N-14, etc.), periodic reports and other documents filed with the SEC or other documents issued in connection with securities offerings (e.g., comfort letters for closed-end Fund offerings, consents), and assistance in responding to SEC comment letters | up to $10,000 per Fund |
| Consultations by Fund management as to the accounting or disclosure treatment of transactions or events and/or the actual or potential impact of final or proposed rules, standards or interpretations by the SEC, FASB, or other regulatory or standard-setting bodies (Note: Under SEC rules, some consultations may be considered “audit-related services” rather than “audit services”) | up to $25,000 in the aggregate |
| Audit-Related Services | |
| Consultations by Fund management as to the accounting or disclosure treatment of transactions or events and/or the actual or potential impact of final or proposed rules, standards or interpretations by the SEC, FASB, or other regulatory or standard-setting bodies (Note: Under SEC rules, some consultations may be considered “audit services” rather than “audit-related services”) | up to $25,000 in the aggregate |
| Tax Services | |
| U.S. federal, state and local and international tax planning and advice (e.g., consulting on statutory, regulatory or administrative developments, evaluation of Funds’ tax compliance function, etc.) | up to $25,000 in the aggregate |
| U.S. federal, state and local tax compliance (e.g., excise distribution reviews, etc.) | up to $5,000 per Fund |
| Review of federal, state, local and international income, franchise and other tax returns | up to $5,000 per Fund |
Under the Pre-Approval Policy, the Audit Committee has also pre-approved the services set forth in the table below with respect to the registrant’s investment adviser and other entities controlling, controlled by or under common control with the investment adviser that provide ongoing services to the registrant (the “Control Affiliates”) up to the specified fee limit. This fee limit is based on aggregate fees to the investment adviser and its Control Affiliates.
| Service | Range of Fees |
| Non-Audit Services | |
| Services associated with periodic reports and other documents filed with the SEC and assistance in responding to SEC comment letters | up to $10,000 in the aggregate |
The Pre-Approval Policy requires the registrant’s independent auditors to report to the Audit Committee at each of its regular meetings regarding all services initiated since the last such report was rendered, including those services authorized by the Pre-Approval Policy.
(f) Not applicable.
(g) The aggregate non-audit fees billed by the registrant’s independent auditors for services rendered to the registrant and to its investment adviser and other service providers under common control with the adviser were $5,653,375 and $7,732,970 for the registrant’s fiscal years ended November 30, 2014 and November 30, 2013, respectively.
(h) In connection with its selection of the independent auditors, the registrant’s Audit Committee has considered the independent auditors’ provision of non-audit services to the registrant’s investment adviser and other service providers under common control with the adviser that were not required to be pre-approved pursuant to Rule 2-01(c)(7)(ii) of Regulation S-X. The Audit Committee has determined that the independent auditors’ provision of these services is compatible with maintaining the auditors’ independence.
Item 5. Audit Committee of Listed Registrants
Not applicable.
Item 6. Investments
(a) Included as part of report to shareholders filed under Item 1 of this Form N-CSR.
(b) Divestment of securities in accordance with Section 13(c) of the Investment Company Act of 1940.
Not applicable.
Item 7. Disclosure of Proxy Voting Policies and Procedures for Closed-End Management Investment Companies
Not applicable.
Item 8. Portfolio Managers of Closed-End Management Investment Companies
Not applicable.
Item 9. Purchases of Equity Securities by Closed-End Management Investment Company and Affiliated Purchasers
Not applicable.
Item 10. Submission of Matters to a Vote of Security Holders
Not applicable.
Item 11. Controls and Procedures
The registrant’s principal executive officer and principal financial officer have evaluated the registrant’s disclosure controls and procedures within 90 days of the filing of this report and have concluded that they are effective in providing reasonable assurance that the information required to be disclosed by the registrant in its reports or statements filed under the Securities Exchange Act of 1934 is recorded, processed, summarized and reported within the time periods specified in the rules and forms of the Securities and Exchange Commission.
There were no significant changes in the registrant’s internal control over financial reporting that occurred during the second fiscal quarter of the period covered by the report to stockholders included herein (i.e., the registrant’s fourth fiscal quarter) that have materially affected, or are reasonably likely to materially affect, the registrant’s internal control over financial reporting.
Item 12. Exhibits
(a) (1) Code of Ethics
Not applicable.
(2) Certifications of Principal Executive Officer and Principal Financial Officer pursuant to Rule 30a-2 under the Investment Company Act of 1940 are attached hereto as Exhibit 99.CERT.
(3) Written solicitations to purchase securities pursuant to Rule 23c-1 under the Securities Exchange Act of 1934.
Not applicable.
(b) Certifications pursuant to Section 906 of the Sarbanes-Oxley Act of 2002 are furnished herewith as Exhibit 99.906CERT.
SIGNATURES
Pursuant to the requirements of the Securities Exchange Act of 1934 and the Investment Company Act of 1940, the registrant has duly caused this report to be signed on its behalf, by the undersigned, thereunto duly authorized.
DELAWARE GROUP® GLOBAL & INTERNATIONAL FUNDS
| /s/ PATRICK P. COYNE | |
| By: | Patrick P. Coyne |
| Title: | Chief Executive Officer |
| Date: | February 3, 2015 |
Pursuant to the requirements of the Securities Exchange Act of 1934 and the Investment Company Act of 1940, this report has been signed below by the following persons on behalf of the registrant and in the capacities and on the dates indicated.
| /s/ PATRICK P. COYNE | |
| By: | Patrick P. Coyne |
| Title: | Chief Executive Officer |
| Date: | February 3, 2015 |
| /s/ RICHARD SALUS | |
| By: | Richard Salus |
| Title: | Chief Financial Officer |
| Date: | February 3, 2015 |