Item 1. Reports to Stockholders
Global / international equity mutual funds
Delaware Emerging Markets Fund
Delaware Global Value Fund
Delaware International Value Equity Fund
November 30, 2017
Carefully consider the Funds’ investment objectives, risk factors, charges, and expenses before investing. This and other information can be found in the Funds’ prospectus and their summary prospectuses, which may be obtained by visiting delawarefunds.com/literature or calling 800 523-1918. Investors should read the prospectus and the summary prospectus carefully before investing.
You can obtain shareholder reports and prospectuses online instead of in the mail.
Visit delawarefunds.com/edelivery.
Experience Delaware FundsSM by Macquarie
Macquarie Investment Management (MIM) is a global asset manager with offices throughout the United States, Europe, Asia, and Australia. We are active managers who prioritize autonomy and accountability at the investment team level in pursuit of opportunities that matter for our clients. Delaware Funds is one of the longest-standing mutual fund families, with more than 75 years in existence.
If you are interested in learning more about creating an investment plan, contact your financial advisor.
You can learn more about Delaware Funds by Macquarie or obtain a prospectus for Delaware Emerging Markets Fund, Delaware Global Value Fund, and Delaware International Value Equity Fund at delawarefunds.com/literature.
Manage your account online
| ● | | Check your account balance and transactions |
| ● | | View statements and tax forms |
| ● | | Make purchases and redemptions |
Visit delawarefunds.com/account-access.
Macquarie Investment Management (MIM) is the marketing name for the following registered investment advisers: Macquarie Investment Management Business Trust (MIMBT) (formerly, Delaware Management Business Trust), Macquarie Funds Management Hong Kong Limited, Macquarie Investment Management Austria Kapitalanlage AG, Macquarie Investment Management Global Limited, Macquarie Investment Management Europe Limited, and Macquarie Capital Investment Management, Inc.
The Funds are distributed by Delaware Distributors, L.P., an affiliate of MIMBT and Macquarie Group Limited. MIM, a member of Macquarie Group, refers to the companies comprising the asset management division of Macquarie Group Limited and its subsidiaries and affiliates worldwide.
Other than Macquarie Bank Limited (MBL), none of the entities noted are authorized deposit-taking institutions for the purposes of the Banking Act 1959 (Commonwealth of Australia). The obligations of these entities do not represent deposits or other liabilities of MBL. MBL does not guarantee or otherwise provide assurance in respect of the obligations of these entities, unless noted otherwise. The Funds are governed by US laws and regulations.
Table of contents
Unless otherwise noted, views expressed herein are current as of Nov. 30, 2017, and subject to change for events occurring after such date.
The Funds are not FDIC insured and are not guaranteed. It is possible to lose the principal amount invested.
Advisory services provided by Delaware Management Company, a series of MIMBT, a US registered investment advisor.
All third-party marks cited are the property of their respective owners.
©2018 Macquarie Management Holdings, Inc. (formerly Delaware Management Holdings, Inc.)
| | |
| Portfolio management review |
| Delaware Emerging Markets Fund | | November 30, 2017 |
| | | | | | | | |
| Performance preview (for the year ended November 30, 2017) | | | | | | |
Delaware Emerging Markets Fund (Institutional Class shares) | | | 1-year return | | | | +39.23% | |
Delaware Emerging Markets Fund (Class A shares) | | | 1-year return | | | | +38.94% | |
MSCI Emerging Markets Index (Gross) | | | 1-year return | | | | +33.30% | |
MSCI Emerging Markets Index (Net) | | | 1-year return | | | | +32.82% | |
Past performance does not guarantee future results.
For complete, annualized performance for Delaware Emerging Markets Fund, please see the table on page 10. Institutional Class shares are not subject to a sales charge and are offered for sale exclusively to certain eligible investors. In addition, Institutional Class shares pay no distribution and service fee.
The performance of Class A shares excludes the applicable sales charge. Both Institutional Class shares and Class A shares reflect the reinvestment of all distributions.
Please see page 12 for a description of the index. Index performance returns do not reflect any management fees, transaction costs, or expenses. Indices are unmanaged and one cannot invest directly in an index.
The MSCI Emerging Markets Index rose sharply during the fiscal year ended Nov. 30, 2017, outpacing developed market equities (as measured by the MSCI EAFE Index). Just before the start of the fiscal period, emerging markets fell in November 2016, following the US presidential election that resulted in a surprise victory for Donald Trump and triggered a rise in US bond yields and an appreciation of the US dollar. These, in turn, negatively affected emerging market equities and currencies. By early 2017, however, concerns surrounding the Trump administration’s policy agenda seemed to subside. Fund flows into emerging markets were generally robust, supported by stabilizing economic data, rising earnings expectations, and modest US dollar weakness.
The fiscal period began with a sharp rebound in Asia, which outperformed other regions, while Latin America lagged. China had strong performance for the fiscal year, driven by improving economic data and diminishing concerns about currency depreciation.
India began the fiscal period with its equity market and currency rebounding strongly from a selloff in November 2016, triggered primarily by the government’s demonetization of high-value currency notes. Later in the period, Indian equities
lagged the broader MSCI Emerging Markets Index largely because of the short-term negative effect of a new goods-and-services tax.
Russian equities overall underperformed for the fiscal year as range-bound oil prices held the energy sector’s performance in check.
In Latin America, Brazil and Mexico trailed the MSCI Emerging Markets Index for the fiscal year. Brazil faced ongoing headwinds related to corruption charges against President Michel Temer, and the resulting political uncertainty has clouded the outlook for his reform agenda. Mexico’s stock market had a volatile year, initially plunging in the aftermath of Donald Trump’s election. Equities broadly rebounded, however, as political tensions with the United States appeared to ease. Late in the fiscal period, Mexico once again underperformed as a major earthquake and North American Free Trade Agreement (NAFTA) negotiations weighed on investor sentiment despite improving consumer confidence and subsiding inflationary pressures.
Fund performance
For the fiscal year ended Nov. 30, 2017, Delaware Emerging Markets Fund Institutional Class shares returned +39.23%. The Fund’s Class A shares returned +38.94% at net asset value and
1
Portfolio management review
Delaware Emerging Markets Fund
+30.94% at maximum offer price. These figures reflect all distributions reinvested. During the same period, the Fund’s benchmark, the MSCI Emerging Markets Index (net), returned +32.82%. For complete, annualized performance of Delaware Emerging Markets Fund, please see the table on page 10.
India was the primary driver of the Fund’s outperformance during the fiscal year, due to favorable stock selection. Shares of Reliance Industries rose as its core refining and petrochemicals businesses performed relatively well, while its mobile telecommunications business continued to gain subscriber market share. We believe that Reliance Industries is among the most cost-competitive refiners and petrochemicals manufacturers globally, and that there is potential for the company’s earnings to grow through capacity expansion in these businesses. Additionally, we hold a favorable view toward its ventures in telecommunications and retail.
In Taiwan, the Fund’s underweight allocation, along with positive stock selection, contributed to performance. MediaTek outperformed as it has developed lower-cost smartphone chips that appear likely to bolster profit margins. Shares of FIT Hon Teng, a recently listed company, rose in sympathy with positive sentiment in the communications sector.
Brazil contributed to performance as a result of favorable stock selection. Shares of B2W gained due to optimism toward the company’s shift in sales strategy and Brazil’s improving economic outlook. We continue to believe that B2W appears well positioned for structural growth in Brazil’s ecommerce industry, which is still in its early stages of development.
In China, favorable stock selection in the technology sector contributed to the Fund’s performance, as several Chinese Internet stocks performed well. Strong user growth in Weibo helped drive the share price higher as the
company continued to demonstrate the social media platform’s monetization potential. Shares of Sohu.com rose in light of improved performance in its gaming and search businesses. Over the long term, we believe that these companies remain well positioned to potentially benefit from rising consumption and Internet engagement in China.
The Fund’s underweight allocation to Tencent and lack of exposure to Naspers detracted from relative performance. Shares of Naspers, which owns a large stake in Tencent, rose in sympathy with Tencent. While both companies operate strong franchises, we consider current valuations to be fair and the Fund remains underweight.
BRF, a Brazilian-based food company, detracted from the Fund’s relative performance due, in part, to an unfavorable cycle in the poultry industry along with a change in senior management. In our view, the business remains attractive and competitive globally.
In Russia, Rosneft Oil also detracted from the Fund’s relative performance during the fiscal period, as it experienced headwinds from oil price weakness and continued to digest its recent acquisitions. We retain a positive view on the company’s asset quality and believe there is potential for improvement in future free cash flow generation.
On a sector basis, technology was the largest contributor to the Fund’s performance led by several Chinese Internet stocks, as noted previously, as well as SK Hynix, a Korean semiconductor manufacturer. SK Hynix benefited from strength in memory chip demand. In contrast, the consumer discretionary and consumer staples sectors detracted the most from the Fund’s relative performance.
The Fund utilized foreign currency exchange contracts to facilitate the purchase and sale of equities traded on international exchanges. The
2
effect of these contracts on performance was immaterial.
Considering the varied macroeconomic backdrop that we see across emerging markets, we believe there are selective opportunities for long-term stock appreciation potential, which may be driven by structural demographic shifts, technology adoption, implementation of government policy, improvement in corporate governance, and industry consolidation. Our investment approach
remains centered on seeking to identify individual companies that we believe possess sustainable franchises and favorable long-term growth prospects and that trade at significant discounts to our estimates of their intrinsic value. We are particularly focused on companies that we believe could benefit from long-term changes in how people in emerging markets live and work. Sectors we currently favor include technology, telecommunications, and consumer staples.
3
Portfolio management review
| | |
| Delaware Global Value Fund | | December 12, 2017 |
| | | | | | | | |
| Performance preview (for the year ended November 30, 2017) | | | | | | |
Delaware Global Value Fund (Institutional Class shares) | | | 1-year return | | | | +17.53% | |
Delaware Global Value Fund (Class A shares) | | | 1-year return | | | | +17.24% | |
MSCI World Index (Gross) | | | 1-year return | | | | +24.34% | |
MSCI World Index (Net) | | | 1-year return | | | | +23.66% | |
Past performance does not guarantee future results.
For complete, annualized performance for Delaware Global Value Fund, please see the table on page 14. Institutional Class shares are not subject to a sales charge and are offered for sale exclusively to certain eligible investors. In addition, Institutional Class shares pay no distribution and service fee.
The performance of Class A shares excludes the applicable sales charge. Both Institutional Class shares and Class A shares reflect the reinvestment of all distributions.
Please see page 16 for a description of the index. Index performance returns do not reflect any management fees, transaction costs, or expenses. Indices are unmanaged and one cannot invest directly in an index.
The Fund’s fiscal year ended Nov. 30, 2017 was a period of remarkable continuity in a number of respects, with supportive economic data, modest inflation, benign interest rates, and accommodative credit conditions in most of the world’s developed regions. Equity market participants endorsed this robust view of business prospects, with correspondingly strong price gains in nearly all sectors and regions, and with November’s closing the year with continued positive returns. In the MSCI EAFE (Europe, Australasia, Far East) Index, all sectors had strong double-digit total returns, with information technology leading the way, up 44%.
● In the US market, notable developments included the ongoing transition of Federal Reserve policy toward normalization, including rate increases and plans for balance-sheet reduction after years of quantitative easing. Bond yields, meanwhile, eased from their post-election highs in a downward pattern that culminated in an early September low, accompanied by a similar decline in the US dollar. Underlying economic strength remained as employment data continued improving and business sentiment stayed strong, but there was little sign of acceleration in these measures. Recently, passage by Congress of the tax reform bill was a key focus for investors.
Against this backdrop, US equity returns were slightly behind global equities overall.
● The strength of Europe’s economic indicators stood out during the year, expanding a divergence that was well established in the first half and producing a return of more than 37% for the euro-zone equity market for the fiscal period. Business and consumer sentiment continued to improve. This underlying support drove euro-zone equities to attain global leadership for the period, although without the surge of sentiment that followed the French elections in the spring. Political uncertainty returned in November with the formation of a new coalition in Germany still pending, a general election next year in Italy, and increased political tensions in Catalonia. European Central Bank (ECB) President Mario Draghi boosted investor optimism in October by announcing an extension of the ECB’s quantitative easing program for nine months. Corresponding to solid economic data, the region’s mix of performance generally favored cyclical groups.
● Japan’s economy continued to show slow but steady progress against relatively modest expectations. Voters gave a majority to Prime Minister Shinzo Abe’s government in a snap election in October 2017. Investors welcomed the news as it pointed to the continued stability of the
4
Abe administration and its fiscal and monetary policies.
● Emerging markets as a group maintained solid relative strength throughout the fiscal year, only slightly trailing the euro zone. China, South Korea, and India were among the strongest markets, with returns of more than 30%. Russia and Brazil provided robust returns but lagged the strongest performers. China’s gross domestic product (GDP) growth was a solid 6.8% in the third quarter, but it may soften slightly in response to recently announced credit tightening regulations.
Fund performance
For the fiscal year ended Nov. 30, 2017, Delaware Global Value Fund Institutional Class shares returned +17.53%. The Fund’s Class A shares returned +17.24% at net asset value and +10.49% at maximum offer price. These figures reflect all distributions reinvested. During the same period, the Fund’s benchmark, the MSCI World Index (net), returned +23.66%. For complete, annualized performance of Delaware Global Value Fund, please see the table on page 14.
On a regional basis, the primary source of underperformance was weak stock selection in the United States, Europe ex-euro zone, and the United Kingdom. Regional allocation was positive. The benefits of exposure to emerging markets more than offset the adverse effect from underweight exposures to the UK and the US. On a sector basis, the adverse effect of weak stock selection in healthcare, consumer discretionary, information technology, and consumer staples more than offset gains from strong stock selection in telecommunications, industrials, and financials.
Overall, currency had a positive effect, primarily due to an overweight exposure to the euro and underweight exposures to the US dollar and British pound.
The Fund’s trading activity during the period included trimming positions and redeploying the
proceeds at valuations that we viewed as attractive. This involved positions across a variety of sectors and regions but did not result in material changes to the Fund’s portfolio positioning.
As we face the future, with a strong year of equity market gains behind us and major market indices setting record highs, we must consider the durability of the underlying cycles. Investors may be comforted that this year’s strong equity performance took place against a broadly improving economic backdrop. At the same time, underlying corporate performance generally kept pace with the year’s strong stock price gains. Valuations actually came down during the year in most countries included in MSCI’s developed market indices, with the US a notable exception. The pattern appeared even stronger in the final months of the Fund’s fiscal year. Price-to-earnings ratios declined in countries as diverse as Australia, France, Germany, Japan, and the UK, where underlying earnings performance exceeded gains in share prices (source: MSCI data via FactSet).
We think that aggregate valuation data help define the bounds of probability for prospective performance and, in this context, we find greater scope for improvement in non-US markets, where valuations are generally lower and the economic cycle is in a less advanced stage than in the US. According to MSCI data, as of Nov. 30, 2017, US stocks were trading at a more expensive valuation on trailing earnings than in all but 13% of all months going back to 1974. By contrast, markets such as Japan or the euro zone have valuations that have the potential to be low enough to support additional price gains before reaching historical norms. We believe this potential, combined with cyclical recovery potential, may facilitate further market appreciation.
Debt markets help support a positive outlook, as sovereign yield spreads across Europe are generally subdued while tight credit spreads
5
Portfolio management review
Delaware Global Value Fund
indicate little cause for alarm, in our opinion. Against these positives, we are monitoring the possible sources of cyclical slowdowns in various markets, such as the potential for the appreciating euro to dampen earnings for European exporters, or the effect of reduced fiscal stimulus in Japan.
As always, while we are mindful of the potential of macro drivers to steer markets both up and down, as managers of concentrated, active portfolios, we remain focused on the potential of individual companies to transcend the speculative prospects of the countries where they are domiciled.
6
| | |
| Delaware International Value Equity Fund | | December 12, 2017 |
| | | | | | | | |
| Performance preview (for the year ended November 30, 2017) | | | | | | |
Delaware International Value Equity Fund (Institutional Class shares) | | | 1-year return | | | | +23.87% | |
Delaware International Value Equity Fund (Class A shares) | | | 1-year return | | | | +23.53% | |
MSCI EAFE Index (Gross) | | | 1-year return | | | | +27.86% | |
MSCI EAFE Index (Net) | | | 1-year return | | | | +27.27% | |
Past performance does not guarantee future results.
For complete, annualized performance for Delaware International Value Equity Fund, please see the table on page 18. Institutional Class shares are not subject to a sales charge and are offered for sale exclusively to certain eligible investors. In addition, Institutional Class shares pay no distribution and service fee.
The performance of Class A shares excludes the applicable sales charge. Both Institutional Class shares and Class A shares reflect the reinvestment of all distributions.
Please see page 20 for a description of the index. Index performance returns do not reflect any management fees, transaction costs, or expenses. Indices are unmanaged and one cannot invest directly in an index.
The Fund’s fiscal year ended Nov. 30, 2017 was a period of remarkable continuity in a number of respects, with supportive economic data, modest inflation, benign interest rates, and accommodative credit conditions in most of the world’s developed regions. Equity market participants endorsed this robust view of business prospects, with correspondingly strong price gains in nearly all sectors and regions, and with November’s closing the year with continued positive returns. In the MSCI EAFE (Europe, Australasia, Far East) Index, all sectors had strong double-digit total returns, with information technology leading the way, up 44%.
● In the US market, notable developments included the ongoing transition of Federal Reserve policy toward normalization, including rate increases and plans for balance-sheet reduction after years of quantitative easing. Bond yields, meanwhile, eased from their post-election highs in a downward pattern that culminated in an early September low, accompanied by a similar decline in the US dollar. Underlying economic strength remained as employment data continued to improve and business sentiment stayed strong, though there was little sign of acceleration in these measures. Toward the end of the Fund’s fiscal year, passage by Congress of the tax reform bill
was a key focus for investors. Against this backdrop, US equity returns were slightly behind global equities overall.
● The strength of Europe’s economic indicators stood out during the year, expanding a divergence that was well established in the first half and producing a return of more than 37% for the euro-zone equity market for the fiscal period. Business and consumer sentiment continued to improve. This underlying support drove euro-zone equities to attain global leadership for the period, although without the surge of sentiment that followed the French elections in the spring. Political uncertainty returned in November with the formation of a new coalition in Germany still pending, a general election next year in Italy, and increased political tensions in Catalonia. European Central Bank (ECB) President Mario Draghi boosted investor optimism in October by announcing an extension of the ECB’s quantitative easing program for nine months. Corresponding to solid economic data, the region’s mix of performance generally favored cyclical groups.
● Japan’s economy continued to show slow but steady progress against relatively modest expectations. Voters gave a majority to Prime Minister Shinzo Abe’s government in a snap election in October 2017. Investors welcomed the
7
Portfolio management review
Delaware International Value Equity Fund
news, as it pointed to the continued stability of the Abe administration and its fiscal and monetary policies.
● Emerging markets as a group maintained solid relative strength throughout the fiscal year, only slightly trailing the euro zone. China, South Korea, and India were among the strongest markets, with annual returns of more than 30% each. Russia and Brazil provided robust returns but lagged the strongest performers. China’s gross domestic product (GDP) growth was a solid 6.8% in the third quarter, but it may soften slightly in response to recently announced credit tightening regulations.
Fund performance
For the fiscal year ended Nov. 30, 2017, Delaware International Value Equity Fund Institutional Class shares returned +23.87%. The Fund’s Class A shares returned +23.53% at net asset value and +16.42% at maximum offer price. These figures reflect all distributions reinvested. During the same period, the Fund’s benchmark, the MSCI EAFE Index (net), returned +27.27%. For complete, annualized performance of Delaware International Value Equity Fund, please see the table on page 18.
The primary source of underperformance was negative stock selection. On a regional basis, weak stock selection in Europe ex-euro zone and the United Kingdom more than offset strong stock selection in the euro zone and Japan. Regional allocation was positive. The benefits of exposure to emerging markets more than offset the adverse effect from exposure to Canada and a small position in cash. On a sector basis, the adverse effect of weak stock selection in consumer staples, healthcare, information technology, and energy more than offset gains from strong stock selection in telecommunications, industrials, financials, and consumer discretionary.
Overall, currency had a negative effect, primarily due to an overweight exposure to the Hong Kong dollar.
The Fund’s trading activity during the period included trimming positions and redeploying the proceeds at valuations that we viewed as attractive. This involved positions across a variety of sectors and regions but did not result in material changes to the Fund’s portfolio positioning.
As we face the future, with a strong year of equity market gains behind us and major market indices setting record highs, we must consider the durability of the underlying cycles. Investors may be comforted that this year’s strong equity performance took place against a broadly improving economic backdrop. At the same time, underlying corporate performance generally kept pace with the year’s strong stock price gains. Valuations actually came down during the year in most countries included in MSCI’s developed market indices, with the United States a notable exception. The pattern appeared even stronger in the final months of the fiscal year. Price-to-earnings ratios declined in countries as diverse as Australia, France, Germany, Japan, and the UK, where underlying earnings performance exceeded gains in share prices (source: MSCI data via FactSet).
We think that aggregate valuation data help define the bounds of probability for prospective performance and, in this context, we find greater scope for improvement in non-US markets, where valuations are generally lower and the economic cycle is in a less advanced stage than in the US. According to MSCI data, as of Nov. 30, 2017, US stocks were trading at a more expensive valuation on trailing earnings than in all but 13% of all months going back to 1974. By contrast, markets such as Japan or the euro zone have valuations that have the potential to be low enough to support additional price gains before reaching historical norms. We believe this potential, combined with cyclical recovery potential, may facilitate further market appreciation.
8
Debt markets help support a positive outlook, as sovereign yield spreads across Europe are generally subdued while tight credit spreads indicate little cause for alarm, in our opinion. Against these positives, we are monitoring the possible sources of cyclical slowdowns in various markets, such as the power for the appreciating euro to dampen earnings for European exporters, or the effect of reduced fiscal stimulus in Japan.
As always, while we are mindful of the potential of macro drivers to steer markets both up and down, as managers of concentrated, active portfolios, we remain focused on the potential of individual companies to transcend the speculative prospects of the countries where they are domiciled.
9
| | |
| Performance summaries |
| Delaware Emerging Markets Fund | | November 30, 2017 |
The performance quoted represents past performance and does not guarantee future results. Investment return and principal value of an investment will fluctuate so that shares, when redeemed, may be worth more or less than their original cost. Current performance may be lower or higher than the performance quoted. Performance data current to the most recent month end may be obtained by calling 800 523-1918 or visiting delawarefunds.com/performance.
| | | | | | | | | | | | | | | | | | | | |
| Fund and benchmark performance1,2 | | Average annual total returns through November 30, 2017 |
| | | 1 year | | 5 years | | 10 years | | Lifetime |
Class A (Est. June 10, 1996) | | | | | | | | | | | | | | | | | | | | |
Excluding sales charge | | | | +38.94% | | | | | +9.38% | | | | | +3.54% | | | | | +8.46% | |
Including sales charge | | | | +30.94% | | | | | +8.10% | | | | | +2.93% | | | | | +8.16% | |
Class C (Est. June 10, 1996) | | | | | | | | | | | | | | | | | | | | |
Excluding sales charge | | | | +37.87% | | | | | +8.56% | | | | | +2.77% | | | | | +7.66% | |
Including sales charge | | | | +36.87% | | | | | +8.56% | | | | | +2.77% | | | | | +7.66% | |
Class R (Est. Aug. 31, 2009) | | | | | | | | | | | | | | | | | | | | |
Excluding sales charge | | | | +38.51% | | | | | +9.11% | | | | | n/a | | | | | +7.85% | |
Including sales charge | | | | +38.51% | | | | | +9.11% | | | | | n/a | | | | | +7.85% | |
Institutional Class (Est. June 10, 1996) | | | | | | | | | | | | | | | | | | | | |
Excluding sales charge | | | | +39.23% | | | | | +9.66% | | | | | +3.80% | | | | | +8.75% | |
Including sales charge | | | | +39.23% | | | | | +9.66% | | | | | +3.80% | | | | | +8.75% | |
Class R6 (Est. May 2, 2016) | | | | | | | | | | | | | | | | | | | | |
Excluding sales charge | | | | +39.43% | | | | | n/a | | | | | n/a | | | | | +29.87% | |
Including sales charge | | | | +39.43% | | | | | n/a | | | | | n/a | | | | | +29.87% | |
MSCI Emerging Markets Index (gross) | | | | +33.30% | | | | | +4.98% | | | | | +1.70% | | | | | +6.53%* | |
MSCI Emerging Markets Index (net) | | | | +32.82% | | | | | +4.61% | | | | | +1.36% | | | | | +6.25%* | |
* The benchmark lifetime return is for Institutional Class share comparison only and is calculated using the last business day in the month of the Fund’s Institutional Class inception date.
1 Returns reflect the reinvestment of all distributions and are presented both with and without the applicable sales charges described below. Returns do not reflect the deduction of taxes the shareholder would pay on Fund distributions or redemptions of Fund shares.
Expense limitations were in effect for certain classes during some or all of the periods shown in the “Fund and benchmark performance” table. Expenses for each class are listed on the “Fund expense ratios” table on page 11. Performance
would have been lower had expense limitations not been in effect.
Institutional Class shares are not subject to a sales charge and are offered for sale exclusively to certain eligible investors. In addition, Institutional Class shares pay no distribution and service fee.
Class A shares are sold with a maximum front-end sales charge of 5.75%, and have an annual distribution and service fee of 0.25% of average daily net assets. Performance for Class A shares, excluding sales charges, assumes that no front-end sales charge applied.
10
Class C shares are sold with a contingent deferred sales charge of 1.00% if redeemed during the first 12 months. They are also subject to an annual distribution and service fee of 1.00% of average daily net assets. Performance for Class C shares, excluding sales charges, assumes either that contingent deferred sales charges did not apply or that the investment was not redeemed.
Class R shares are available only for certain retirement plan products. They are sold without a sales charge and have an annual distribution and service fee of 0.50% of average daily net assets.
Class R6 shares are available only to certain investors. In addition, Class R6 shares do not pay any service fees, sub-accounting fees, and/or sub-transfer agency fees to any brokers, dealers, or other financial intermediaries. Class R6 shares pay no distribution and service fee.
International investments entail risks not ordinarily associated with US investments including fluctuation in currency values, differences in accounting principles, or economic or political instability in other nations.
Investing in emerging markets can be riskier than investing in established foreign markets due to increased volatility and lower trading volume.
If and when the Fund invests in forward foreign currency contracts or uses other investments to hedge against currency risks, the Fund will be subject to special risks, including counterparty risk.
Investments in small and/or medium-sized companies typically exhibit greater risk and higher volatility than larger, more established companies.
2The Fund’s expense ratios, as described in the most recent prospectus, are disclosed in the following “Fund expense ratios” table. Delaware Management Company has agreed to reimburse certain expenses and/or waive certain fees in order to prevent total annual fund operating expenses (excluding any 12b-1 fees, acquired fund fees and expenses, taxes, interest, short sale dividend and interest expenses, brokerage fees, certain insurance costs, and nonroutine expenses or costs, including, but not limited to, those relating to reorganizations, litigation, conducting shareholder meetings, and liquidations (collectively, nonroutine expenses)) from exceeding 1.45% of the Fund’s average daily net assets from Dec. 1, 2016 through Nov. 30, 2017* for all share classes other than Class R6, and 1.32% of the Fund’s Class R6 shares’ average daily net assets from Dec. 1, 2016 through Nov. 30, 2017.* Please see the most recent prospectus and any applicable supplement(s) for additional information on these fee waivers and/or reimbursements. Please see the “Financial highlights” section in this report for the most recent expense ratios.
| | | | | | | | | | |
| | | | | | | | | Institutional | | |
| Fund expense ratios | | Class A | | Class C | | Class R | | Class | | Class R6 |
Total annual operating expenses (without fee waivers) | | 1.78% | | 2.53% | | 2.03% | | 1.53% | | 1.40% |
Net expenses (including fee waivers, if any) | | 1.70% | | 2.45% | | 1.95% | | 1.45% | | 1.32% |
Type of waiver | | Contractual | | Contractual | | Contractual | | Contractual | | Contractual |
*The aggregate contractual waiver period covering this report is from May 2, 2016 through March 28, 2018.
11
Performance summaries
Delaware Emerging Markets Fund
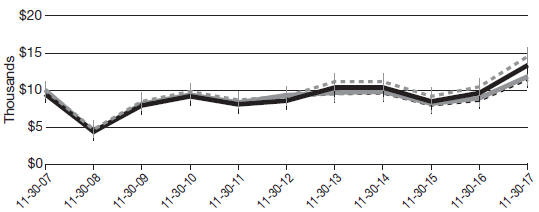
Performance of a $10,000 investment1
Average annual total returns from Nov. 30, 2007, through Nov. 30, 2017
| | | | | | | | | | |
| For the period beginning Nov. 30, 2007, through Nov. 30, 2017 | | Starting value | | | Ending value | |
| | | |

| | Delaware Emerging Markets Fund — Institutional Class shares | | | $10,000 | | | | $14,522 | |

| | Delaware Emerging Markets Fund — Class A shares | | | $9,425 | | | | $13,352 | |

| | MSCI Emerging Markets Index (gross) | | | $10,000 | | | | $11,832 | |

| | MSCI Emerging Markets Index (net) | | | $10,000 | | | | $11,445 | |
1 The “Performance of a $10,000 investment” graph assumes $10,000 invested in Institutional Class and Class A shares of the Fund on Nov. 30, 2007, and includes the effect of a 5.75% front-end sales charge (for Class A shares) and the reinvestment of all distributions. The graph does not reflect the deduction of taxes the shareholders would pay on Fund distributions or redemptions of Fund shares. Expense limitations were in effect for some or all of the periods shown. Performance would have been lower had expense limitations not been in effect. Expenses are listed in the “Fund expense ratios” table on page 11. Please note additional details on pages 10 through 13.
The graph also assumes $10,000 invested in the MSCI Emerging Markets Index as of Nov. 30, 2007. The MSCI Emerging Markets Index is a free float-adjusted market capitalization index designed to measures equity market performance across emerging market countries worldwide. Index “gross” return approximates the maximum
possible dividend reinvestment. Index “net” return approximates the minimum possible dividend reinvestment, after deduction of withholding tax at the highest possible rate.
The MSCI EAFE (Europe, Australasia, Far East) Index, mentioned on page 1, is a free float-adjusted market capitalization weighted index designed to measure equity market performance of developed markets, excluding the United States and Canada. Index “net” return approximates the minimum possible dividend reinvestment, after deduction of withholding tax at the highest possible rate.
Index performance returns do not reflect any management fees, transaction costs, or expenses. Indices are unmanaged and one cannot invest directly in an index. Past performance is not a guarantee of future results.
Performance of other Fund classes will vary due to different charges and expenses.
12
| | | | | | | | |
| | | Nasdaq symbols | | CUSIPs | | | | |
Class A | | DEMAX | | 245914841 | | | | |
Class C | | DEMCX | | 245914825 | | | | |
Class R | | DEMRX | | 245914569 | | | | |
Institutional Class | | DEMIX | | 245914817 | | | | |
Class R6 | | DEMZX | | 245914510 | | | | |
13
| | |
| Performance summaries | | |
| Delaware Global Value Fund | | November 30, 2017 |
The performance quoted represents past performance and does not guarantee future results. Investment return and principal value of an investment will fluctuate so that shares, when redeemed, may be worth more or less than their original cost. Current performance may be lower or higher than the performance quoted. Performance data current to the most recent month end may be obtained by calling 800 523-1918 or visiting delawarefunds.com/performance.
| | | | | | | | | | | | | | | | | | | | |
| Fund and benchmark performance1,2 | | Average annual total returns through November 30, 2017 |
| | | 1 year | | 5 years | | 10 years | | Lifetime |
Class A (Est. Dec. 19, 1997) | | | | | | | | | | | | | | | | | | | | |
Excluding sales charge | | | | +17.24% | | | | | +8.95% | | | | | +2.75% | | | | | +6.96% | |
Including sales charge | | | | +10.49% | | | | | +7.67% | | | | | +2.14% | | | | | +6.64% | |
Class C (Est. Sept. 28, 2001) | | | | | | | | | | | | | | | | | | | | |
Excluding sales charge | | | | +16.37% | | | | | +8.14% | | | | | +1.98% | | | | | +7.14% | |
Including sales charge | | | | +15.37% | | | | | +8.14% | | | | | +1.98% | | | | | +7.14% | |
Institutional Class (Est. Dec. 19, 1997) | | | | | | | | | | | | | | | | | | | | |
Excluding sales charge | | | | +17.53% | | | | | +9.22% | | | | | +3.01% | | | | | +7.18% | |
Including sales charge | | | | +17.53% | | | | | +9.22% | | | | | +3.01% | | | | | +7.18% | |
MSCI World Index (gross) | | | | +24.34% | | | | | +12.38% | | | | | +5.36% | | | | | +6.49%* | |
MSCI World Index (net) | | | | +23.66% | | | | | +11.75% | | | | | +4.76% | | | | | +5.97%* | |
* The benchmark lifetime return is for Institutional Class share comparison only and is calculated using the last business day in the month of the Fund’s Institutional Class inception date.
1 Returns reflect the reinvestment of all distributions and are presented both with and without the applicable sales charges described below. Returns do not reflect the deduction of taxes the shareholder would pay on Fund distributions or redemptions of Fund shares.
Expense limitations were in effect for certain classes during some or all of the periods shown in the “Fund and benchmark performance” table. Expenses for each class are listed on the “Fund expense ratios” table on page 15. Performance would have been lower had expense limitations not been in effect.
Institutional Class shares are not subject to a sales charge and are offered for sale exclusively to certain eligible investors. In addition, Institutional Class shares pay no distribution and service fee.
Class A shares are sold with a maximum front-end sales charge of 5.75%, and have an annual distribution and service fee of 0.25% of average daily net assets. Performance for Class A shares, excluding sales charges, assumes that no front-end sales charge applied.
Class C shares are sold with a contingent deferred sales charge of 1.00% if redeemed during the first 12 months. They are also subject to an annual distribution and service fee of 1.00% of average daily net assets. Performance for Class C shares, excluding sales charges, assumes either that contingent deferred sales charges did not apply or that the investment was not redeemed.
International investments entail risks not ordinarily associated with US investments including fluctuation in currency values, differences in
14
accounting principles, or economic or political instability in other nations.
Investing in emerging markets can be riskier than investing in established foreign markets due to increased volatility and lower trading volume.
Investments in small and/or medium-sized companies typically exhibit greater risk and higher volatility than larger, more established companies.
2The Fund’s expense ratios, as described in the most recent prospectus, are disclosed in the following “Fund expense ratios” table. Delaware Management Company has agreed to reimburse certain expenses and/or waive certain fees in order to prevent total fund operating expenses (excluding any 12b-1 fees, acquired fund fees and expenses, taxes, interest, short sale dividend and interest expenses, brokerage fees, certain insurance costs, and nonroutine expenses or costs, including, but not limited to, those relating to reorganizations, litigation, conducting shareholder meetings, and liquidations (collectively nonroutine expenses)) from exceeding 1.30% of the Fund’s average daily net assets during the period from Dec. 1. 2016 through Nov. 30, 2017.* Please see the most recent prospectus and any applicable supplement(s) for additional information on these fee waivers and/or reimbursements. Please see the “Financial highlights” section in this report for the most recent expense ratios.
| | | | | | | | | | | | |
| Fund expense ratios | | Class A | | | Class C | | | Institutional Class | |
Total annual operating expenses (without fee waivers) | | | 1.88% | | | | 2.63% | | | | 1.63% | |
Net expenses (including fee waivers, if any) | | | 1.55% | | | | 2.30% | | | | 1.30% | |
Type of waiver | | | Contractual | | | | Contractual | | | | Contractual | |
*The aggregate contractual waiver period covering this report is from March 29, 2016 through March 28, 2018.
15
Performance summaries
Delaware Global Value Fund
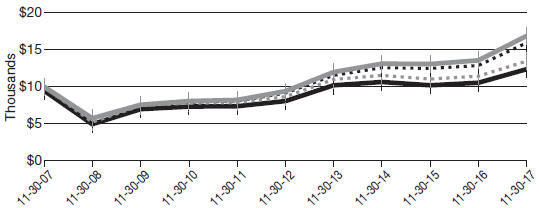
Performance of a $10,000 investment1
Average annual total returns from Nov. 30, 2007, through Nov. 30, 2017
| | | | | | | | | | |
| For the period beginning Nov. 30, 2007, through Nov. 30, 2017 | | Starting value | | | Ending value | |
| | | |
| | MSCI World Index (gross) | | | $10,000 | | | | $16,850 | |
| | MSCI World Index (net) | | | $10,000 | | | | $15,915 | |
| | Delaware Global Value Fund — Institutional Class shares | | | $10,000 | | | | $13,447 | |
| | Delaware Global Value Fund — Class A shares | | | $9,425 | | | | $12,361 | |
1 The “Performance of a $10,000 investment” graph assumes $10,000 invested in Institutional Class and Class A shares of the Fund on Nov. 30, 2007, and includes the effect of a 5.75% front-end sales charge (for Class A shares) and the reinvestment of all distributions. The graph does not reflect the deduction of taxes the shareholders would pay on Fund distributions or redemptions of Fund shares. Expense limitations were in effect for some or all of the periods shown. Performance would have been lower had expense limitations not been in effect. Expenses are listed in the “Fund expense ratios” table on page 15. Please note additional details on pages 14 through 17.
The graph also assumes $10,000 invested in the MSCI World Index as of Nov. 30, 2007. The MSCI World Index is a free float-adjusted market capitalization weighted index designed to measure equity market performance across developed markets worldwide. Index “gross” return approximates the maximum possible dividend reinvestment. Index “net” return approximates the
minimum possible dividend reinvestment, after deduction of withholding tax at the highest possible rate.
The MSCI EAFE (Europe, Australasia, Far East) Index, mentioned on page 4, is a free float-adjusted market capitalization weighted index designed to measure equity market performance of developed markets, excluding the United States and Canada. Index “net” return approximates the minimum possible dividend reinvestment, after deduction of withholding tax at the highest possible rate.
Index performance returns do not reflect any management fees, transaction costs, or expenses. Indices are unmanaged and one cannot invest directly in an index. Past performance is not a guarantee of future results.
Performance of other Fund classes will vary due to different charges and expenses.
16
| | | | | | | | |
| | | Nasdaq symbols | | CUSIPs | | | | |
Class A | | DABAX | | 245914718 | | | | |
Class C | | DABCX | | 245914684 | | | | |
Institutional Class | | DABIX | | 245914676 | | | | |
17
| | |
| Performance summaries |
| Delaware International Value Equity Fund | | November 30, 2017 |
The performance quoted represents past performance and does not guarantee future results. Investment return and principal value of an investment will fluctuate so that shares, when redeemed, may be worth more or less than their original cost. Current performance may be lower or higher than the performance quoted. Performance data current to the most recent month end may be obtained by calling 800 523-1918 or visiting delawarefunds.com/performance.
| | | | | | | | | | | | | | | | | | | | |
| Fund and benchmark performance1,2 | | Average annual total returns through November 30, 2017 |
| | | 1 year | | 5 years | | 10 years | | Lifetime |
Class A (Est. Oct. 31, 1991) | | | | | | | | | | | | | | | | | | | | |
Excluding sales charge | | | | +23.53% | | | | | +7.86% | | | | | +1.54% | | | | | +6.39% | |
Including sales charge | | | | +16.42% | | | | | +6.58% | | | | | +0.94% | | | | | +6.15% | |
Class C (Est. Nov. 29, 1995) | | | | | | | | | | | | | | | | | | | | |
Excluding sales charge | | | | +22.71% | | | | | +7.05% | | | | | +0.80% | | | | | +5.21% | |
Including sales charge | | | | +21.71% | | | | | +7.05% | | | | | +0.80% | | | | | +5.21% | |
Class R (Est. June 2, 2003) | | | | | | | | | | | | | | | | | | | | |
Excluding sales charge | | | | +23.26% | | | | | +7.58% | | | | | +1.31% | | | | | +6.55% | |
Including sales charge | | | | +23.26% | | | | | +7.58% | | | | | +1.31% | | | | | +6.55% | |
Institutional Class (Est. Nov. 9, 1992) | | | | | | | | | | | | | | | | | | | | |
Excluding sales charge | | | | +23.87% | | | | | +8.12% | | | | | +1.81% | | | | | +7.15% | |
Including sales charge | | | | +23.87% | | | | | +8.12% | | | | | +1.81% | | | | | +7.15% | |
MSCI EAFE Index (gross) | | | | +27.86% | | | | | +8.72% | | | | | +2.02% | | | | | +6.81%* | |
MSCI EAFE Index (net) | | | | +27.27% | | | | | +8.24% | | | | | +1.55% | | | | | +6.40%* | |
* The benchmark lifetime return is for Institutional Class share comparison only and is calculated using the last business day in the month of the Fund’s Institutional Class inception date.
1 Returns reflect the reinvestment of all distributions and are presented both with and without the applicable sales charges described below. Returns do not reflect the deduction of taxes the shareholder would pay on Fund distributions or redemptions of Fund shares.
Expense limitations were in effect for certain classes during some or all of the periods shown in the “Fund and benchmark performance” table. Expenses for each class are listed on the “Fund expense ratios” table on page 19. Performance would have been lower had expense limitations not been in effect.
Institutional Class shares are not subject to a sales charge and are offered for sale exclusively to certain eligible investors. In addition, Institutional Class shares pay no distribution and service fee.
Class A shares are sold with a maximum front-end sales charge of 5.75%, and have an annual distribution and service fee of 0.25% of average daily net assets. Performance for Class A shares, excluding sales charges, assumes that no front-end sales charge applied.
Class C shares are sold with a contingent deferred sales charge of 1.00% if redeemed during the first 12 months. They are also subject to an annual distribution and service fee of 1.00% of average
18
daily net assets. Performance for Class C shares, excluding sales charges, assumes either that contingent deferred sales charges did not apply or that the investment was not redeemed.
Class R shares are available only for certain retirement plan products. They are sold without a sales charge and have an annual distribution and service fee of 0.50% of average daily net assets.
International investments entail risks not ordinarily associated with US investments including fluctuation in currency values, differences in accounting principles, or economic or political instability in other nations.
Investing in emerging markets can be riskier than investing in established foreign markets due to increased volatility and lower trading volume.
2The Fund’s expense ratios, as described in the most recent prospectus, are disclosed in the following “Fund expense ratios” table. Delaware Management Company has agreed to reimburse certain expenses and/or waive certain fees in order to prevent total fund operating expenses (excluding any 12b-1 fees, acquired fund fees and expenses, taxes, interest, short sale dividend and interest expenses, brokerage fees, certain insurance costs, and nonroutine expenses or costs, including, but not limited to, those relating to reorganizations, litigation, conducting shareholder meetings, and liquidations (collectively nonroutine expenses)) from exceeding 1.20% of the Fund’s average daily net assets during the period from Dec. 1, 2016 through Nov. 30, 2017.* Please see the most recent prospectus and any applicable supplement(s) for additional information on these fee waivers and/or reimbursements. Please see the “Financial highlights” section in this report for the most recent expense ratios.
| | | | | | | | |
| Fund expense ratios | | Class A | | Class C | | Class R | | Institutional Class |
Total annual operating expenses (without fee waivers) | | 1.36% | | 2.11% | | 1.61% | | 1.11% |
Net expenses** (including fee waivers, if any) | | 1.36% | | 2.11% | | 1.61% | | 1.11% |
Type of waiver | | Contractual | | Contractual | | Contractual | | Contractual |
*The aggregate contractual waiver period covering this report is from March 29, 2016 through March 28, 2018.
**Fee waivers were in place, but due to the Fund’s expense level, the waivers had no impact.
19
Performance summaries
Delaware International Value Equity Fund
Performance of a $10,000 investment1
Average annual total returns from Nov. 30, 2007, through Nov. 30, 2017

| | | | | | | | | | |
| For the period beginning Nov. 30, 2007, through Nov. 30, 2017 | | Starting value | | | Ending value | |
| | | |
| | MSCI EAFE Index (gross) | | | $10,000 | | | | $12,219 | |
| | Delaware International Value Equity Fund — Institutional Class shares | | | $10,000 | | | | $11,968 | |
| | MSCI EAFE Index (net) | | | $10,000 | | | | $11,657 | |
| | Delaware International Value Equity Fund — Class A shares | | | $9,425 | | | | $10,980 | |
1 The “Performance of a $10,000 investment” graph assumes $10,000 invested in Institutional Class and Class A shares of the Fund on Nov. 30, 2007, and includes the effect of a 5.75% front-end sales charge (for Class A shares) and the reinvestment of all distributions. The graph does not reflect the deduction of taxes the shareholders would pay on Fund distributions or redemptions of Fund shares. Expense limitations were in effect for some or all of the periods shown. Performance would have been lower had expense limitations not been in effect. Expenses are listed in the “Fund expense ratios” table on page 19. Please note additional details on pages 18 through 21.
The graph also assumes $10,000 invested in the MSCI EAFE Index as of Nov. 30, 2007. The MSCI EAFE (Europe, Australasia, Far East) Index is a free float-adjusted market capitalization weighted index designed to measure equity market performance of developed markets, excluding the
United States and Canada. Index “gross” return approximates the maximum possible dividend reinvestment. Index “net” return approximates the minimum possible dividend reinvestment, after deduction of withholding tax at the highest possible rate.
Index performance returns do not reflect any management fees, transaction costs, or expenses. Indices are unmanaged and one cannot invest directly in an index. Past performance is not a guarantee of future results.
Performance of other Fund classes will vary due to different charges and expenses.
20
| | | | | | | | | | |
| | | Nasdaq symbols | | CUSIPs | | | | | |
Class A | | DEGIX | | | 245914106 | | | | | |
Class C | | DEGCX | | | 245914858 | | | | | |
Class R | | DIVRX | | | 245914577 | | | | | |
Institutional Class | | DEQIX | | | 245914403 | | | | | |
21
Disclosure of Fund expenses
For the six-month period from June 1, 2017 to November 30, 2017 (Unaudited)
As a shareholder of a Fund, you incur two types of costs: (1) transaction costs, including sales charges (loads) on purchase payments, reinvested dividends, or other distributions; redemption fees; and exchange fees; and (2) ongoing costs, including management fees; distribution and/or service (12b-1) fees; and other Fund expenses. These following examples are intended to help you understand your ongoing costs (in dollars) of investing in a Fund and to compare these costs with the ongoing costs of investing in other mutual funds.
The examples are based on an investment of $1,000 invested at the beginning of the period and held for the entire six-month period from June 1, 2017 to Nov. 30, 2017.
Actual expenses
The first section of the tables shown, “Actual Fund return,” provides information about actual account values and actual expenses. You may use the information in this section of the table, together with the amount you invested, to estimate the expenses that you paid over the period. Simply divide your account value by $1,000 (for example, an $8,600 account value divided by $1,000 = 8.6), then multiply the result by the number in the first section under the heading entitled “Expenses Paid During Period” to estimate the expenses you paid on your account during this period.
Hypothetical example for comparison purposes
The second section of the tables shown, “Hypothetical 5% return,” provides information about hypothetical account values and hypothetical expenses based on the Funds’ actual expense ratios and an assumed rate of return of 5% per year before expenses, which is not the Funds’ actual return. The hypothetical account values and expenses may not be used to estimate the actual ending account balance or expenses you paid for the period. You may use this information to compare the ongoing costs of investing in the Fund and other funds. To do so, compare this 5% hypothetical example with the 5% hypothetical examples that appear in the shareholder reports of the other funds.
Please note that the expenses shown in the tables are meant to highlight your ongoing costs only and do not reflect any transactional costs, such as sales charges (loads), redemption fees, or exchange fees. Therefore, the second section of each table is useful in comparing ongoing costs only, and will not help you determine the relative total costs of owning different funds. In addition, if these transactional costs were included, your costs would have been higher. The Funds’ expenses shown in the tables reflect fee waivers in effect. The expenses shown in each table assume reinvestment of all dividends and distributions.
22
Delaware Emerging Markets Fund
Expense analysis of an investment of $1,000
| | | | | | | | | | | | | | | | | | | | |
| | | Beginning Account Value 6/1/17 | | Ending Account Value 11/30/17 | | Annualized Expense Ratio | | Expenses Paid During Period 6/1/17 to 11/30/17* |
Actual Fund return† | | | | | | | | | | | | | | | | | | | | |
Class A | | | | $1,000.00 | | | | | $1,140.80 | | | | | 1.64% | | | | | $8.80 | |
Class C | | | | 1,000.00 | | | | | 1,136.30 | | | | | 2.39% | | | | | 12.80 | |
Class R | | | | 1,000.00 | | | | | 1,139.20 | | | | | 1.89% | | | | | 10.14 | |
Institutional Class | | | | 1,000.00 | | | | | 1,142.10 | | | | | 1.39% | | | | | 7.46 | |
Class R6 | | | | 1,000.00 | | | | | 1,142.60 | | | | | 1.26% | | | | | 6.77 | |
Hypothetical 5% return (5% return before expenses) | | | | | | | | | | | | | | | | |
Class A | | | | $1,000.00 | | | | | $1,016.85 | | | | | 1.64% | | | | | $8.29 | |
Class C | | | | 1,000.00 | | | | | 1,013.09 | | | | | 2.39% | | | | | 12.06 | |
Class R | | | | 1,000.00 | | | | | 1,015.59 | | | | | 1.89% | | | | | 9.55 | |
Institutional Class | | | | 1,000.00 | | | | | 1,018.10 | | | | | 1.39% | | | | | 7.03 | |
Class R6 | | | | 1,000.00 | | | | | 1,018.75 | | | | | 1.26% | | | | | 6.38 | |
Delaware Global Value Fund Expense analysis of an investment of $1,000 | | | | | | | | | | | | | | | | | | | | |
| | | Beginning Account Value 6/1/17 | | Ending Account Value 11/30/17 | | Annualized Expense Ratio | | Expenses Paid During Period 6/1/17 to 11/30/17* |
Actual Fund return† | | | | | | | | | | | | | | | | | | | | |
Class A | | | | $1,000.00 | | | | | $1,069.60 | | | | | 1.55% | | | | | $8.04 | |
Class C | | | | 1,000.00 | | | | | 1,066.10 | | | | | 2.30% | | | | | 11.91 | |
Institutional Class | | | | 1,000.00 | | | | | 1,071.00 | | | | | 1.30% | | | | | 6.75 | |
Hypothetical 5% return (5% return before expenses) | | | | | | | | | | | | | | | | |
Class A | | | | $1,000.00 | | | | | $1,017.30 | | | | | 1.55% | | | | | $7.84 | |
Class C | | | | 1,000.00 | | | | | 1,013.54 | | | | | 2.30% | | | | | 11.61 | |
Institutional Class | | | | 1,000.00 | | | | | 1,018.55 | | | | | 1.30% | | | | | 6.58 | |
23
Disclosure of Fund expenses
For the six-month period from June 1, 2017 to November 30, 2017 (Unaudited)
Delaware International Value Equity Fund
Expense analysis of an investment of $1,000
| | | | | | | | | | | | | | | | | | | | |
| | | Beginning Account Value 6/1/17 | | Ending Account Value 11/30/17 | | Annualized Expense Ratio | | Expenses Paid During Period 6/1/17 to 11/30/17* |
Actual Fund return† | | | | | | | | | | | | | | | | | | | | |
Class A | | | | $1,000.00 | | | | | $1,063.90 | | | | | 1.35% | | | | | $6.98 | |
Class C | | | | 1,000.00 | | | | | 1,060.00 | | | | | 2.10% | | | | | 10.84 | |
Class R | | | | 1,000.00 | | | | | 1,062.70 | | | | | 1.60% | | | | | 8.27 | |
Institutional Class | | | | 1,000.00 | | | | | 1,065.00 | | | | | 1.10% | | | | | 5.69 | |
Hypothetical 5% return (5% return before expenses) | | | | | | | | | | | |
Class A | | | | $1,000.00 | | | | | $1,018.30 | | | | | 1.35% | | | | | $6.83 | |
Class C | | | | 1,000.00 | | | | | 1,014.54 | | | | | 2.10% | | | | | 10.61 | |
Class R | | | | 1,000.00 | | | | | 1,017.05 | | | | | 1.60% | | | | | 8.09 | |
Institutional Class | | | | 1,000.00 | | | | | 1,019.55 | | | | | 1.10% | | | | | 5.57 | |
| * | “Expenses Paid During Period” are equal to the relevant Fund’s annualized expense ratio, multiplied by the average account value over the period, multiplied by 183/365 (to reflect the one-half year period). |
| † | Because actual returns reflect only the most recent six-month period, the returns shown may differ significantly from fiscal year returns. |
In addition to the Fund’s expenses reflected on the previous page, Delaware Emerging Markets Fund also indirectly bears its portion of the fees and expenses of the investment companies in which it invests (Underlying Funds), including exchange-traded funds. The table on the previous page does not reflect the expenses of the Underlying Funds.
24
Security type / country and sector allocations
| | |
| Delaware Emerging Markets Fund | | As of November 30, 2017 (Unaudited) |
Sector designations may be different than the sector designations presented in other Fund materials. The sector designations may represent the investment manager’s internal sector classifications, which may result in the sector designations for one fund being different than another fund’s sector designations.
| | | | | |
| Security type / country | | Percentage of net assets |
Common Stock by Country | | | | 96.95 | % |
Argentina | | | | 2.51 | % |
Bahrain | | | | 0.04 | % |
Brazil | | | | 9.66 | % |
Canada | | | | 0.93 | % |
Chile | | | | 0.69 | % |
China/Hong Kong | | | | 30.36 | % |
Cyprus | | | | 0.12 | % |
France | | | | 0.03 | % |
India | | | | 7.94 | % |
Indonesia | | | | 0.89 | % |
Israel | | | | 0.15 | % |
Japan | | | | 0.72 | % |
Malaysia | | | | 0.09 | % |
Mexico | | | | 6.52 | % |
Netherlands | | | | 0.36 | % |
Peru | | | | 0.95 | % |
Republic of Korea | | | | 19.49 | % |
Russia | | | | 6.13 | % |
South Africa | | | | 0.34 | % |
Taiwan | | | | 5.24 | % |
Turkey | | | | 1.54 | % |
United Kingdom | | | | 0.07 | % |
United States | | | | 2.18 | % |
Preferred Stock | | | | 3.25 | % |
Exchange-Traded Funds | | | | 0.48 | % |
Participation Notes | | | | 0.00 | % |
Total Value of Securities | | | | 100.68 | % |
Liabilities Net of Receivables and Other Assets | | | | (0.68 | %) |
Total Net Assets | | | | 100.00 | % |
25
Security type / country and sector allocations
Delaware Emerging Markets Fund
| | | | | |
| Common stock, participation notes, and preferred stock by sector² | | Percentage of net assets |
Consumer Discretionary | | | | 9.31 | % |
Consumer Staples | | | | 9.19 | % |
Energy | | | | 11.70 | % |
Financials | | | | 12.65 | % |
Healthcare | | | | 0.59 | % |
Industrials | | | | 1.47 | % |
Information Technology* | | | | 35.32 | % |
Materials | | | | 4.68 | % |
Real Estate | | | | 1.67 | % |
Telecommunication Services. | | | | 13.16 | % |
Utilities | | | | 0.46 | % |
Total | | | | 100.20 | % |
| ² | Narrow industries are utilized for compliance purposes for diversification whereas broad sectors are used for financial reporting. |
| * | To monitor compliance with the Fund’s concentration guidelines as described in the Fund’s Prospectus and Statement of Additional Information, the Information Technology sector (as disclosed herein for financial reporting purposes) is divided into various sub-categories or “industries,” in this case, commercial services, computers, electronics, Internet, semiconductors, and software. As of Nov. 30, 2017, such amounts, as a percentage of total net assets, were 0.12%, 0.08%, 2.29%, 19.85%, 12.88%, and 0.10%, respectively. The percentage in any such single industry will comply with the Fund’s concentration policy even if the percentage in the “Information Technology sector” for financial reporting purposes may exceed 25%. |
26
| | |
| Security type / country and sector allocations |
| Delaware Global Value Fund | | As of November 30, 2017 (Unaudited) |
Sector designations may be different than the sector designations presented in other Fund materials. The sector designations may represent the investment manager’s internal sector classifications, which may result in the sector designations for one fund being different than another fund’s sector designations.
| | | | | |
| Security type / country | | Percentage of net assets |
Common Stock by Country | | | | 97.26 | % |
Canada | | | | 3.61 | % |
France | | | | 9.49 | % |
Germany | | | | 1.64 | % |
Hong Kong | | | | 2.21 | % |
Indonesia | | | | 1.79 | % |
Italy | | | | 3.20 | % |
Japan | | | | 12.34 | % |
Netherlands | | | | 3.49 | % |
Republic of Korea | | | | 2.67 | % |
Russia | | | | 0.96 | % |
Sweden | | | | 1.11 | % |
Switzerland | | | | 1.59 | % |
United Kingdom | | | | 10.81 | % |
United States | | | | 42.35 | % |
Short-Term Investments | | | | 2.60 | % |
Total Value of Securities | | | | 99.86 | % |
Receivables and Other Assets Net of Liabilities | | | | 0.14 | % |
Total Net Assets | | | | 100.00 | % |
27
Security type / country and sector allocations
Delaware Global Value Fund
| | | | | |
| Common stock by sector² | | Percentage of net assets |
Consumer Discretionary | | 12.92% |
Consumer Staples | | 5.22% |
Energy | | 3.34% |
Financials* | | 25.72% |
Healthcare | | 11.74% |
Industrials | | 17.00% |
Information Technology | | 13.92% |
Materials | | 1.79% |
Telecommunication Services. | | 5.61% |
Total | | 97.26% |
² Narrow industries are utilized for compliance purposes for diversification whereas broad sectors are used for financial reporting.
| * | To monitor compliance with the Fund’s concentration guidelines as described in the Fund’s Prospectus and Statement of Additional Information, the Financials sector (as disclosed herein for financial reporting purposes) is divided into various sub-categories or “industries,” in this case, banks, diversified financial services, and insurance. As of Nov. 30, 2017, such amounts, as a percentage of total net assets, were 17.68%, 3.22%, and 4.82%, respectively. The percentage in any such single industry will comply with the Fund’s concentration policy even if the percentage in the “Financials sector” for financial reporting purposes may exceed 25%. |
28
Security type / country and sector allocations
| | |
| Delaware International Value Equity Fund | | As of November 30, 2017 (Unaudited) |
Sector designations may be different than the sector designations presented in other Fund materials. The sector designations may represent the investment manager’s internal sector classifications, which may result in the sector designations for one fund being different than another fund’s sector designations.
| | | | | |
| Security type / country | | Percentage of net assets |
Common Stock by Country | | | | 95.15 | % |
Australia | | | | 0.40 | % |
Canada | | | | 4.35 | % |
China/Hong Kong | | | | 6.84 | % |
Denmark | | | | 2.23 | % |
France | | | | 19.36 | % |
Germany | | | | 5.33 | % |
Indonesia | | | | 1.97 | % |
Italy | | | | 3.34 | % |
Japan | | | | 22.20 | % |
Netherlands | | | | 5.26 | % |
Republic of Korea | | | | 3.72 | % |
Russia | | | | 1.08 | % |
Sweden | | | | 4.03 | % |
Switzerland | | | | 2.93 | % �� |
United Kingdom | | | | 12.11 | % |
Short-Term Investments | | | | 4.37 | % |
Securities Lending Collateral | | | | 0.51 | % |
Total Value of Securities | | | | 100.03 | % |
Obligation to Return Securities Lending Collateral | | | | (0.51 | %) |
Receivables and Other Assets Net of Liabilities | | | | 0.48 | % |
Total Net Assets | | | | 100.00 | % |
29
Security type / country and sector allocations
Delaware International Value Equity Fund
| | |
| Common stock by sector | | Percentage of net assets |
Consumer Discretionary | | 16.30% |
Consumer Staples | | 7.90% |
Energy | | 5.22% |
Financials | | 18.57% |
Healthcare | | 10.37% |
Industrials | | 20.94% |
Information Technology | | 7.74% |
Materials | | 2.63% |
Telecommunication Services | | 5.02% |
Utilities | | 0.46% |
Total | | 95.15% |
30
Schedules of investments
| | | | |
| Delaware Emerging Markets Fund | | | November 30, 2017 | |
| | | | | | | | |
| | | Number of shares | | | Value (US $) | |
| |
Common Stock – 96.95%D | | | | | | | | |
| |
Argentina – 2.51% | | | | | | | | |
Arcos Dorados Holdings Class A † | | | 3,900,000 | | | $ | 38,805,000 | |
Cablevision Holding GDR † | | | 443,972 | | | | 10,366,746 | |
Cresud ADR | | | 1,517,127 | | | | 33,088,540 | |
Grupo Clarin GDR 144A # | | | 131,213 | | | | 800,491 | |
IRSA Inversiones y Representaciones ADR | | | 1,184,728 | | | | 35,766,938 | |
| | | | | | | | |
| | | | | | | 118,827,715 | |
| | | | | | | | |
Bahrain – 0.04% | | | | | | | | |
Aluminum Bahrain GDR 144A # | | | 221,400 | | | | 1,803,458 | |
| | | | | | | | |
| | | | | | | 1,803,458 | |
| | | | | | | | |
Brazil – 9.66% | | | | | | | | |
Aes Tiete Energia | | | 508,806 | | | | 2,036,188 | |
Atacadao Distribuicao Comercio e Industria † | | | 4,235,000 | | | | 19,651,942 | |
B2W Cia Digital † | | | 13,015,600 | | | | 68,349,345 | |
Banco Bradesco ADR | | | 2,215,000 | | | | 21,684,850 | |
Banco Santander Brasil ADR | | | 3,800,000 | | | | 33,250,000 | |
BRF ADR † | | | 5,140,000 | | | | 60,600,600 | |
Centrais Eletricas Brasileiras † | | | 2,140,204 | | | | 12,245,802 | |
Cia Brasileira de Distribuicao ADR | | | 1,161,295 | | | | 24,700,745 | |
Gol Linhas Aereas Inteligentes ADR † | | | 2,400,000 | | | | 20,472,000 | |
Hypermarcas | | | 2,100,000 | | | | 21,074,096 | |
Itau Unibanco Holding ADR | | | 5,120,000 | | | | 64,256,000 | |
JBS | | | 3,000,000 | | | | 7,249,232 | |
Rumo † | | | 1,905,351 | | | | 7,578,448 | |
Telefonica Brasil ADR | | | 2,699,863 | | | | 39,310,005 | |
TIM Participacoes ADR | | | 2,430,908 | | | | 43,610,490 | |
Vale ADR | | | 1,131,557 | | | | 12,107,660 | |
| | | | | | | | |
| | | | | | | 458,177,403 | |
| | | | | | | | |
Canada – 0.93% | | | | | | | | |
Gran Tierra Energy † | | | 134,900 | | | | 303,525 | |
Potash Corp of Saskatchewan | | | 2,220,000 | | | | 43,623,000 | |
| | | | | | | | |
| | | | | | | 43,926,525 | |
| | | | | | | | |
Chile – 0.69% | | | | | | | | |
Cia Cervecerias Unidas ADR | | | 365,790 | | | | 9,320,329 | |
Latam Airlines Group ADR | | | 236,800 | | | | 2,995,520 | |
Sociedad Quimica y Minera de Chile ADR | | | 370,000 | | | | 20,098,400 | |
Vina Concha y Toro | | | 39,250 | | | | 68,423 | |
| | | | | | | 32,482,672 | |
China/Hong Kong – 30.36% | | | | | | | | |
58.com ADR † | | | 90,000 | | | | 6,456,600 | |
Alibaba Group Holding ADR † | | | 1,100,000 | | | | 194,788,000 | |
Baidu ADR † | | | 330,300 | | | | 78,802,974 | |
31
Schedules of investments
Delaware Emerging Markets Fund
| | | | | | | | |
| | | Number of shares | | | Value (US $) | |
| |
Common StockD (continued) | | | | | | | | |
| |
China/Hong Kong (continued) | | | | | | | | |
Bitauto Holdings ADR † | | | 454,200 | | | $ | 13,457,946 | |
China Mengniu Dairy | | | 8,120,000 | | | | 20,684,306 | |
China Mobile | | | 11,824,500 | | | | 120,287,438 | |
China Mobile ADR | | | 720,064 | | | | 36,608,054 | |
China Petroleum & Chemical | | | 30,000,000 | | | | 21,533,283 | |
China Telecom | | | 15,000,000 | | | | 7,266,798 | |
China Telecom ADR | | | 8,623 | | | | 418,129 | |
CITIC Securities | | | 3,000,000 | | | | 6,524,707 | |
Ctrip.com International ADR † | | | 780,000 | | | | 35,942,400 | |
Guangshen Railway | | | 11,000,000 | | | | 6,084,390 | |
Haitong Securities | | | 4,000,000 | | | | 5,996,677 | |
Huatai Securities 144A # | | | 2,000,000 | | | | 4,063,729 | |
Industrial & Commercial Bank of China | | | 77,732,000 | | | | 60,798,922 | |
JD.com ADR † | | | 2,905,000 | | | | 108,792,250 | |
Kunlun Energy | | | 12,000,000 | | | | 10,423,032 | |
Lenovo Group | | | 6,992,000 | | | | 3,990,473 | |
Ping An Insurance Group of China | | | 9,000,000 | | | | 89,308,984 | |
SINA † | | | 1,755,885 | | | | 171,672,876 | |
Sinofert Holdings † | | | 28,000,000 | | | | 4,168,833 | |
Sohu.com † | | | 2,080,000 | | | | 100,651,200 | |
Tencent Holdings | | | 3,750,000 | | | | 192,004,297 | |
Tianjin Development Holdings | | | 15,885,550 | | | | 7,409,678 | |
Tingyi Cayman Islands Holding | | | 23,000,000 | | | | 36,163,198 | |
Tsingtao Brewery | | | 3,574,000 | | | | 14,517,073 | |
Uni-President China Holdings | | | 35,284,000 | | | | 27,402,054 | |
Weibo ADR † | | | 430,000 | | | | 46,680,800 | |
ZhongAn Online P&C Insurance Class H 144A #† | | | 739,600 | | | | 6,747,182 | |
| | | | | | | | |
| | | | | | | 1,439,646,283 | |
| | | | | | | | |
Cyprus – 0.12% | | | | | | | | |
QIWI ADR | | | 385,284 | | | | 5,675,233 | |
| | | | | | | | |
| | | | | | | 5,675,233 | |
France – 0.03% | | | | | | | | |
Vallourec † | | | 258,011 | | | | 1,391,879 | |
| | | | | | | | |
| | | | | | | 1,391,879 | |
| | | | | | | | |
India – 7.94% | | | | | | | | |
ICICI Bank | | | 7,700,000 | | | | 36,920,066 | |
Indiabulls Real Estate GDR † | | | 102,021 | | | | 337,179 | |
RattanIndia Infrastructure GDR † | | | 300,961 | | | | 44,341 | |
Reliance Industries | | | 14,511,110 | | | | 207,338,052 | |
Reliance Industries GDR 144A # | | | 3,678,425 | | | | 102,778,351 | |
32
| | | | | | | | |
| | | Number of shares | | | Value (US $) | |
| |
Common StockD (continued) | | | | | | | | |
| |
India (continued) | | | | | | | | |
Tata Chemicals | | | 1,866,909 | | | $ | 21,035,189 | |
United Breweries | | | 484,517 | | | | 8,140,908 | |
| | | | | | | | |
| | | | | | | 376,594,086 | |
| | | | | | | | |
Indonesia – 0.89% | | | | | | | | |
Astra Agro Lestari | | | 8,732,900 | | | | 8,942,087 | |
Astra International | | | 56,000,000 | | | | 33,089,560 | |
| | | | | | | | |
| | | | | | | 42,031,647 | |
| | | | | | | | |
Israel – 0.15% | | | | | | | | |
Teva Pharmaceutical Industries ADR | | | 477,321 | | | | 7,073,897 | |
| | | | | | | | |
| | | | | | | 7,073,897 | |
| | | | | | | | |
Japan – 0.72% | | | | | | | | |
LINE ADR † | | | 797,176 | | | | 34,143,048 | |
| | | | | | | | |
| | | | | | | 34,143,048 | |
| | | | | | | | |
Malaysia – 0.09% | | | | | | | | |
UEM Sunrise † | | | 17,000,000 | | | | 4,368,441 | |
| | | | | | | | |
| | | | | | | 4,368,441 | |
| | | | | | | | |
Mexico – 6.52% | | | | | | | | |
America Movil ADR | | | 1,700,000 | | | | 29,070,000 | |
Cemex ADR † | | | 3,100,000 | | | | 23,529,000 | |
Coca-Cola Femsa ADR | | | 1,393,700 | | | | 95,412,702 | |
Fomento Economico Mexicano ADR | | | 154,722 | | | | 13,920,338 | |
Grupo Financiero Banorte | | | 4,000,000 | | | | 23,493,237 | |
Grupo Financiero Santander Mexico Class B ADR | | | 4,908,600 | | | | 39,906,918 | |
Grupo Lala | | | 3,900,027 | | | | 5,891,327 | |
Grupo Televisa ADR | | | 3,602,861 | | | | 67,229,386 | |
Kimberly-Clark de Mexico | | | | | | | | |
Class A | | | 5,880,600 | | | | 10,539,869 | |
| | | | | | | | |
| | | | | | | 308,992,777 | |
| | | | | | | | |
Netherlands – 0.36% | | | | | | | | |
VEON ADR | | | 4,281,700 | | | | 17,298,068 | |
| | | | | | | | |
| | | | | | | 17,298,068 | |
| | | | | | | | |
Peru – 0.95% | | | | | | | | |
Cia de Minas Buenaventura ADR | | | 3,217,400 | | | | 45,011,426 | |
| | | | | | | | |
| | | | | | | 45,011,426 | |
| | | | | | | | |
Republic of Korea – 19.49% | | | | | | | | |
Hyundai Motor | | | 110,000 | | | | 16,694,782 | |
KB Financial Group ADR | | | 245,928 | | | | 13,602,278 | |
Kia Motors | | | 380,000 | | | | 11,769,928 | |
KT&G | | | 215,489 | | | | 24,157,738 | |
LG Display | | | 1,500,000 | | | | 42,859,382 | |
33
Schedules of investments
Delaware Emerging Markets Fund
| | | | | | | | |
| | | Number of shares | | | Value (US $) | |
| |
Common StockD (continued) | | | | | | | | |
| |
Republic of Korea (continued) | | | | | | | | |
LG Electronics | | | 580,000 | | | $ | 48,261,988 | |
LG Uplus | | | 2,557,121 | | | | 32,656,503 | |
Lotte | | | 433,093 | | | | 24,527,421 | |
Lotte Chilsung Beverage | | | 10,337 | | | | 11,588,458 | |
Lotte Confectionery † | | | 77,086 | | | | 10,589,807 | |
NAVER | | | 5,250 | | | | 3,879,587 | |
NCSoft | | | 38,011 | | | | 15,321,698 | |
Netmarble Games 144A #† | | | 31,528 | | | | 4,896,147 | |
Samsung Electronics | | | 65,198 | | | | 153,441,069 | |
Samsung Fire & Marine Insurance | | | 126,287 | | | | 30,273,535 | |
Samsung Life Insurance | | | 334,939 | | | | 39,547,043 | |
Shinhan Financial Group Co. | | | 667,253 | | | | 29,770,233 | |
SK Hynix | | | 2,250,000 | | | | 160,365,323 | |
SK Telecom | | | 406,620 | | | | 99,012,390 | |
SK Telecom ADR | | | 5,498,332 | | | | 150,874,230 | |
| | | | | | | | |
| | | | | | | 924,089,540 | |
| | | | | | | | |
Russia – 6.13% | | | | | | | | |
Enel Russia GDR | | | 21,161 | | | | 24,741 | |
Etalon Group GDR 144A # | | | 1,616,300 | | | | 5,495,420 | |
Gazprom ADR | | | 14,600,000 | | | | 65,305,318 | |
Mail.Ru Group GDR † | | | 741,151 | | | | 21,759,871 | |
MegaFon GDR | | | 450,000 | | | | 4,342,500 | |
Mobile TeleSystems ADR | | | 1,200,000 | | | | 12,444,000 | |
Rosneft Oil GDR | | | 13,500,000 | | | | 66,704,081 | |
Sberbank of Russia | | | 12,000,000 | | | | 46,052,002 | |
Sberbank of Russia ADR | | | 800,000 | | | | 13,080,221 | |
Surgutneftegas ADR | | | 2,014,441 | | | | 9,269,013 | |
T Plus =† | | | 36,096 | | | | 0 | |
X5 Retail Group GDR † | | | 526,952 | | | | 19,549,919 | |
Yandex Class A † | | | 800,000 | | | | 26,488,000 | |
| | | | | | | | |
| | | | | | | 290,515,086 | |
| | | | | | | | |
South Africa – 0.34% | | | | | | | | |
Impala Platinum Holdings † | | | 3,000,000 | | | | 8,551,499 | |
Sun International † | | | 290,543 | | | | 1,157,935 | |
Tongaat Hulett | | | 838,307 | | | | 6,492,524 | |
| | | | | | | | |
| | | | | | | 16,201,958 | |
| | | | | | | | |
Taiwan – 5.24% | | | | | | | | |
FIT Hon Teng 144A # | | | 20,213,000 | | | | 15,354,610 | |
Hon Hai Precision Industry | | | 14,960,000 | | | | 50,219,170 | |
MediaTek | | | 6,500,000 | | | | 71,230,488 | |
34
| | | | | | | | |
| | | Number of shares | | | Value (US $) | |
| |
Common StockD (continued) | | | | | | | | |
| |
Taiwan (continued) | | | | | | | | |
Taiwan Semiconductor Manufacturing | | | 14,661,000 | | | $ | 110,742,730 | |
United Microelectronics | | | 1,327,000 | | | | 679,967 | |
| | | | | | | 248,226,965 | |
Turkey – 1.54% | | | | | | | | |
Akbank Turk | | | 15,000,000 | | | | 34,407,435 | |
Turk Telekomunikasyon † | | | 951,192 | | | | 1,380,112 | |
Turkcell Iletisim Hizmetleri | | | 2,427,827 | | | | 9,430,722 | |
Turkcell Iletisim Hizmetleri ADR | | | 2,059,101 | | | | 19,726,188 | |
Turkiye Sise ve Cam Fabrikalari | | | 7,651,443 | | | | 8,179,199 | |
| | | | | | | 73,123,656 | |
United Kingdom – 0.07% | | | | | | | | |
Griffin Mining † | | | 3,056,187 | | | | 3,490,477 | |
| | | | | | | 3,490,477 | |
United States – 2.18% | | | | | | | | |
Altaba † | | | 500,000 | | | | 35,030,000 | |
Micron Technology † | | | 1,610,000 | | | | 68,247,900 | |
| | | | | | | 103,277,900 | |
| | |
Total Common Stock (cost $3,922,358,756) | | | | | | | 4,596,370,140 | |
|
| |
Preferred Stock – 3.25%D | | | | | | | | |
| |
Brazil – 1.60% | | | | | | | | |
Braskem Class A 2.84% | | | 1,470,000 | | | | 20,387,664 | |
Gerdau 0.54% | | | 2,764,900 | | | | 9,358,656 | |
Petroleo Brasileiro Class A ADR † | | | 4,000,000 | | | | 37,520,000 | |
Usinas Siderurgicas de Minas Gerais SA † | | | 3,235,733 | | | | 8,461,371 | |
| | | | | | | 75,727,691 | |
Republic of Korea – 0.97% | | | | | | | | |
Samsung Electronics 1.40% | | | 23,662 | | | | 45,890,011 | |
| | | | | | | 45,890,011 | |
Russia – 0.68% | | | | | | | | |
AK Transneft 4.71% | | | 10,588 | | | | 32,238,522 | |
| | | | | | | 32,238,522 | |
Total Preferred Stock (cost $99,060,928) | | | | | | | 153,856,224 | |
|
| |
Exchange-Traded Funds – 0.48% | | | | | | | | |
| |
iShares MSCI Brazil Capped ETF | | | 300,000 | | | | 11,610,000 | |
iShares MSCI Turkey ETF | | | 300,500 | | | | 11,385,945 | |
Total Exchange-Traded Funds (cost $23,541,971) | | | | | | | 22,995,945 | |
35
Schedules of investments
Delaware Emerging Markets Fund
| | | | | | | | |
| | | Number of shares | | | Value (US $) | |
| |
Participation Notes – 0.00% | |
Lehman Indian Oil | | | | | | | | |
CW 12 LEPO 144A #=† | | | 172,132 | | | $ | 0 | |
Lehman Oil & Natural Gas | | | | | | | | |
CW 12 LEPO =† | | | 254,590 | | | | 0 | |
| | | | | | | | |
Total Participation Notes (cost $8,559,057) | | | | | | | 0 | |
| | | | | | | | |
| | |
Total Value of Securities – 100.68%
(cost $4,053,520,712) | | | | | | $ | 4,773,222,309 | |
| | | | | | | | |
| # | Security exempt from registration under Rule 144A of the Securities Act of 1933, as amended. At Nov. 30, 2017, the aggregate value of Rule 144A securities was $141,939,388, which represents 2.99% of the Fund’s net assets. See Note 11 in “Notes to financial statements.” |
| = | The value of this security was determined using significant unobservable inputs and is reported as a Level 3 security in the disclosure table located in Note 3 in “Notes to financial statements.” |
| D | Securities have been classified by country of origin. Aggregate classification by business sector has been presented on page 26 in “Security type / country and sector allocations.” |
| † | Non-income producing security. |
The following foreign currency exchange contracts were outstanding at Nov. 30, 2017:1
| | | | | | | | | | | | | | | | | | | | |
| Foreign Currency Exchange Contracts | | | | | | | | | | |
Counterparty | | Contracts to
Receive (Deliver) | | | In Exchange For | | | Settlement Date | | | Unrealized
Depreciation | |
BNYM | | | HKD | | | | 2,786,765 | | | | USD (357,058 | ) | | | 12/1/17 | | | $ | (239 | ) |
BNYM | | | KRW | | | | 399,029,131 | | | | USD (367,757 | ) | | | 12/1/17 | | | | (1,061 | ) |
| | | | | | | | | | | | | | | | | | | | |
| | | | | | | | | | | | | | | | | | $ | (1,300 | ) |
| | | | | | | | | | | | | | | | | | | | |
The use of foreign currency exchange contracts involves elements of market risk and risks in excess of the amounts disclosed in the financial statements. The foreign currency exchange contract presented above represents the Fund’s total exposure in such contract, whereas only the net unrealized appreciation (depreciation) is reflected in the Fund’s net assets.
1See Note 8 in “Notes to financial statements.”
Summary of abbreviations:
ADR – American Depositary Receipt
BNYM – BNY Mellon
ETF – Exchange-Traded Fund
GDR – Global Depositary Receipt
HKD – Hong Kong Dollar
KRW – South Korean Won
LEPO – Low Exercise Price Option
USD – US Dollar
See accompanying notes, which are an integral part of the financial statements.
36
Schedules of investments
| | |
| Delaware Global Value Fund | | November 30, 2017 |
| | | | | | | | |
| | | Number of shares | | | Value (US $) | |
Common Stock – 97.26%D | |
Canada – 3.61% | | | | | | | | |
CGI Group Class A † | | | 7,148 | | | $ | 377,249 | |
Suncor Energy | | | 9,410 | | | | 326,394 | |
| | | | | | | | |
| | | | | | | 703,643 | |
| | | | | | | | |
France – 9.49% | | | | | | | | |
AXA | | | 12,812 | | | | 386,568 | |
Sanofi | | | 4,914 | | | | 448,253 | |
TOTAL | | | 5,718 | | | | 323,209 | |
Valeo | | | 3,942 | | | | 285,861 | |
Vinci | | | 3,955 | | | | 404,018 | |
| | | | | | | | |
| | | | | | | 1,847,909 | |
| | | | | | | | |
Germany – 1.64% | | | | | | | | |
Bayerische Motoren Werke | | | 3,172 | | | | 320,231 | |
| | | | | | | | |
| | | | | | | 320,231 | |
| | | | | | | | |
Hong Kong – 2.21% | | | | | | | | |
Yue Yuen Industrial Holdings | | | 120,000 | | | | 429,372 | |
| | | | | | | | |
| | | | | | | 429,372 | |
| | | | | | | | |
Indonesia – 1.79% | | | | | | | | |
Bank Rakyat Indonesia Persero | | | 1,466,405 | | | | 348,008 | |
| | | | | | | | |
| | | | | | | 348,008 | |
| | | | | | | | |
Italy – 3.20% | | | | | | | | |
Leonardo | | | 12,088 | | | | 144,512 | |
UniCredit † | | | 23,737 | | | | 478,538 | |
| | | | | | | | |
| | | | | | | 623,050 | |
| | | | | | | | |
Japan – 12.34% | | | | | | | | |
East Japan Railway | | | 3,470 | | | | 336,224 | |
ITOCHU | | | 20,078 | | | | 349,029 | |
Japan Tobacco | | | 14,095 | | | | 466,802 | |
Matsumotokiyoshi Holdings | | | 1,600 | | | | 132,507 | |
MINEBEA MITSUMI | | | 17,420 | | | | 347,431 | |
Mitsubishi UFJ Financial Group | | | 26,524 | | | | 189,066 | |
Nippon Telegraph & Telephone | | | 6,876 | | | | 358,955 | |
Toyota Motor | | | 3,520 | | | | 222,272 | |
| | | | | | | | |
| | | | | | | 2,402,286 | |
| | | | | | | | |
Netherlands – 3.49% | | | | | | | | |
ING Groep CVA | | | 22,856 | | | | 413,013 | |
Koninklijke Philips | | | 6,897 | | | | 267,408 | |
| | | | | | | | |
| | | | | | | 680,421 | |
| | | | | | | | |
Republic of Korea – 2.67% | | | | | | | | |
Samsung Electronics | | | 221 | | | | 520,115 | |
| | | | | | | | |
| | | | | | | 520,115 | |
| | | | | | | | |
37
Schedules of investments
Delaware Global Value Fund
| | | | | | | | |
| | | Number of shares | | | Value (US $) | |
Common StockD (continued) | | | | | | | | |
Russia – 0.96% | | | | | | | | |
Mobile TeleSystems ADR | | | 17,945 | | | $ | 186,090 | |
| | | | | | | | |
| | | | | | | 186,090 | |
| | | | | | | | |
Sweden – 1.11% | | | | | | | | |
Tele2 Class B | | | 16,891 | | | | 216,056 | |
| | | | | | | | |
| | | | | | | 216,056 | |
| | | | | | | | |
Switzerland – 1.59% | | | | | | | | |
Novartis | | | 3,609 | | | | 309,640 | |
| | | | | | | | |
| | | | | | | 309,640 | |
| | | | | | | | |
United Kingdom – 10.81% | | | | | | | | |
Imperial Brands | | | 10,075 | | | | 417,602 | |
Meggitt | | | 49,988 | | | | 327,658 | |
Playtech | | | 29,254 | | | | 332,726 | |
Rio Tinto | | | 7,363 | | | | 348,598 | |
Shire | | | 6,524 | | | | 323,430 | |
Standard Chartered † | | | 35,594 | | | | 355,114 | |
| | | | | | | | |
| | | | | | | 2,105,128 | |
| | | | | | | | |
United States – 42.35% | | | | | | | | |
American Airlines Group | | | 3,605 | | | | 182,016 | |
Apple | | | 3,455 | | | | 593,742 | |
AT&T | | | 9,095 | | | | 330,876 | |
Caterpillar | | | 4,065 | | | | 573,775 | |
Cintas | | | 2,280 | | | | 358,963 | |
Delphi Automotive | | | 4,065 | | | | 425,483 | |
Goldman Sachs Group | | | 2,175 | | | | 538,617 | |
International Business Machines | | | 1,585 | | | | 244,042 | |
Johnson & Johnson | | | 2,670 | | | | 372,011 | |
JPMorgan Chase & Co. | | | 6,440 | | | | 673,110 | |
Lowe’s | | | 3,075 | | | | 256,363 | |
Mylan † | | | 5,855 | | | | 213,883 | |
Nasdaq | | | 7,930 | | | | 627,739 | |
Omnicom Group * | | | 3,670 | | | | 262,185 | |
Oracle | | | 13,085 | | | | 641,950 | |
Pfizer | | | 9,710 | | | | 352,084 | |
Target | | | 5,255 | | | | 314,775 | |
Travelers | | | 4,070 | | | | 551,770 | |
Wells Fargo & Co. | | | 7,925 | | | | 447,525 | |
WESCO International † | | | 4,360 | | | | 285,798 | |
| | | | | | | | |
| | | | | | | 8,246,707 | |
| | | | | | | | |
| | |
Total Common Stock (cost $14,564,839) | | | | | | | 18,938,656 | |
| | | | | | | | |
38
| | | | | | | | |
| | | Principal amount° | | | Value (US $) | |
| |
Short-Term Investments – 2.60% | | | | | | | | |
| |
Discount Notes – 0.51%≠ | | | | | | | | |
Federal Farm Credit 1.001% 12/6/17 | | | 35,190 | | | $ | 35,184 | |
Federal Home Loan Bank 1.07% 12/21/17 | | | 63,247 | | | | 63,207 | |
| | | | | | | | |
| | | | | | | 98,391 | |
| | | | | | | | |
Repurchase Agreements – 1.64% | | | | | | | | |
Bank of America Merrill Lynch | | | | | | | | |
0.97%, dated 11/30/17, to be repurchased on 12/1/17, repurchase price $52,805 (collateralized by US government obligations 2.250% 12/31/23;market value $53,860) | | | 52,804 | | | | 52,804 | |
Bank of Montreal | | | | | | | | |
0.92%, dated 11/30/17, to be repurchased on 12/1/17, repurchase price $132,012 (collateralized by US government obligations 0.00%–3.50% | | | | | | | | |
1/2/18–5/15/47; market value $134,649) | | | 132,009 | | | | 132,009 | |
BNP Paribas | | | | | | | | |
1.00%, dated 11/30/17, to be repurchased on 12/1/17, repurchase price $135,038 (collateralized by US government obligations 0.00%–3.625% | | | | | | | | |
3/31/18–2/15/46; market value $137,735) | | | 135,034 | | | | 135,034 | |
| | | | | | | | |
| | | | | | | 319,847 | |
| | | | | | | | |
US Treasury Obligation – 0.45%≠ | | | | | | | | |
US Treasury Bill 0.93% 12/7/17 | | | 87,976 | | | | 87,962 | |
| | | | | | | | |
| | | | | | | 87,962 | |
| | | | | | | | |
Total Short-Term Investments (cost $506,204) | | | | | | | 506,200 | |
| | | | | | | | |
| | |
Total Value of Securities – 99.86% | | | | | | | | |
(cost $15,071,043) | | | | | | $ | 19,444,856∎ | |
| | | | | | | | |
| * | Fully or partially on loan. |
| ≠ | The rate shown is the effective yield at the time of purchase. |
| ∎ | Includes $262,185 of securities loaned. |
| ° | Principal amount shown is stated in US dollars unless noted that the security is denominated in another currency. |
| D | Securities have been classified by country of origin. Aggregate classification by business sector has been presented on page 28 in “Security type / country and sector allocations.” |
| † | Non-income producing security. |
Summary of abbreviations:
ADR – American Depositary Receipt
CVA – Dutch Certificate
US – US Dollar
See accompanying notes, which are an integral part of the financial statements.
39
Schedules of investments
| | |
| Delaware International Value Equity Fund | | November 30, 2017 |
| | | | | | | | |
| | | Number of shares | | | Value (US $) | |
| |
Common Stock – 95.15%D | | | | | | | | |
| |
Australia – 0.40% | | | | | | | | |
Coca-Cola Amatil | | | 211,581 | | | $ | 1,275,225 | |
| | | | | | | | |
| | | | | | | 1,275,225 | |
| | | | | | | | |
Canada – 4.35% | | | | | | | | |
Alamos Gold * | | | 254,495 | | | | 1,617,532 | |
CGI Group Class A † | | | 115,273 | | | | 6,083,741 | |
Suncor Energy | | | 154,800 | | | | 5,369,376 | |
Yamana Gold | | | 337,672 | | | | 863,712 | |
| | | | | | | | |
| | | | | | | 13,934,361 | |
| | | | | | | | |
China/Hong Kong – 6.84% | | | | | | | | |
CNOOC | | | 3,421,000 | | | | 4,691,846 | |
Techtronic Industries | | | 1,291,000 | | | | 7,484,518 | |
Yue Yuen Industrial Holdings | | | 2,715,000 | | | | 9,714,540 | |
| | | | | | | | |
| | | | | | | 21,890,904 | |
| | | | | | | | |
Denmark – 2.23% | | | | | | | | |
Carlsberg Class B | | | 60,098 | | | | 7,129,632 | |
| | | | | | | | |
| | | | | | | 7,129,632 | |
| | | | | | | | |
France – 19.36% | | | | | | | | |
AXA | | | 303,424 | | | | 9,155,015 | |
Kering | | | 17,758 | | | | 7,874,715 | |
Publicis Groupe | | | 37,164 | | | | 2,467,261 | |
Rexel | | | 170,580 | | | | 3,142,981 | |
Sanofi | | | 109,543 | | | | 9,992,471 | |
Teleperformance | | | 44,995 | | | | 6,656,248 | |
TOTAL | | | 117,325 | | | | 6,631,788 | |
Valeo | | | 59,346 | | | | 4,303,587 | |
Vinci | | | 114,906 | | | | 11,738,068 | |
| | | | | | | | |
| | | | | | | 61,962,134 | |
| | | | | | | | |
Germany – 5.33% | | | | | | | | |
Bayerische Motoren Werke | | | 65,601 | | | | 6,622,777 | |
Deutsche Post | | | 219,122 | | | | 10,430,351 | |
| | | | | | | | |
| | | | | | | 17,053,128 | |
| | | | | | | | |
Indonesia – 1.97% | | | | | | | | |
Bank Rakyat Indonesia Persero | | | 26,512,800 | | | | 6,292,037 | |
| | | | | | | | |
| | | | | | | 6,292,037 | |
| | | | | | | | |
Italy – 3.34% | | | | | | | | |
Leonardo | | | 268,201 | | | | 3,206,343 | |
UniCredit † | | | 371,544 | | | | 7,490,332 | |
| | | | | | | | |
| | | | | | | 10,696,675 | |
| | | | | | | | |
Japan – 22.20% | | | | | | | | |
East Japan Railway | | | 85,844 | | | | 8,317,809 | |
40
| | | | | | | | |
| | | Number of shares | | | Value (US $) | |
| |
Common StockD (continued) | | | | | | | | |
| |
Japan (continued) | | | | | | | | |
ITOCHU | | | 661,460 | | | $ | 11,498,580 | |
Japan Tobacco | | | 242,800 | | | | 8,041,116 | |
Matsumotokiyoshi Holdings | | | 25,200 | | | | 2,086,983 | |
MINEBEA MITSUMI | | | 335,800 | | | | 6,697,324 | |
Mitsubishi UFJ Financial Group | | | 1,631,557 | | | | 11,629,941 | |
Nippon Telegraph & Telephone | | | 174,056 | | | | 9,086,423 | |
Nitori Holdings | | | 23,294 | | | | 3,804,859 | |
Toyota Motor | | | 156,600 | | | | 9,888,594 | |
| | | | | | | | |
| | | | | | | 71,051,629 | |
| | | | | | | | |
Netherlands – 5.26% | | | | | | | | |
ING Groep CVA | | | 456,605 | | | | 8,250,952 | |
Koninklijke Philips | | | 221,246 | | | | 8,578,072 | |
| | | | | | | | |
| | | | | | | 16,829,024 | |
| | | | | | | | |
Republic of Korea – 3.72% | | | | | | | | |
Samsung Electronics | | | 5,058 | | | | 11,903,815 | |
| | | | | | | | |
| | | | | | | 11,903,815 | |
| | | | | | | | |
Russia – 1.08% | | | | | | | | |
Mobile TeleSystems ADR | | | 332,500 | | | | 3,448,025 | |
| | | | | | | | |
| | | | | | | 3,448,025 | |
| | | | | | | | |
Sweden – 4.03% | | | | | | | | |
Nordea Bank | | | 799,697 | | | | 9,377,571 | |
Tele2 Class B | | | 275,880 | | | | 3,528,829 | |
| | | | | | | | |
| | | | | | | 12,906,400 | |
| | | | | | | | |
Switzerland – 2.93% | | | | | | | | |
Novartis | | | 109,114 | | | | 9,361,614 | |
| | | | | | | | |
| | | | | | | 9,361,614 | |
| | | | | | | | |
United Kingdom – 12.11% | | | | | | | | |
Imperial Brands | | | 163,281 | | | | 6,767,882 | |
Meggitt | | | 813,303 | | | | 5,330,983 | |
National Grid | | | 123,721 | | | | 1,481,471 | |
Playtech | | | 595,833 | | | | 6,776,816 | |
Rio Tinto | | | 125,360 | | | | 5,935,118 | |
Shire | | | 105,754 | | | | 5,242,793 | |
Standard Chartered † | | | 723,941 | | | | 7,222,609 | |
| | | | | | | | |
| | | | | | | 38,757,672 | |
| | | | | | | | |
| | |
Total Common Stock (cost $251,440,523) | | | | | | | 304,492,275 | |
| | | | | | | | |
41
Schedules of investments
Delaware International Value Equity Fund
| | | | | | | | |
| | | Principal amount° | | | Value (US $) | |
| |
Short-Term Investments – 4.37% | | | | | | | | |
| |
Discount Notes – 0.70%≠ | | | | | | | | |
Federal Farm Credit 1.00% 12/6/17 | | | 1,012,815 | | | $ | 1,012,653 | |
Federal Home Loan Bank 1.07% 12/21/17 | | | 1,223,653 | | | | 1,222,871 | |
| | | | | | | | |
| | | | | | | 2,235,524 | |
| | | | | | | | |
Repurchase Agreements – 2.88% | | | | | | | | |
Bank of America Merrill Lynch
0.97%, dated 11/30/17, to be repurchased on 12/1/17, repurchase price $1,519,784 (collateralized by US government obligations 2.250% 12/31/23; market value $1,550,138) | | | 1,519,743 | | | | 1,519,743 | |
Bank of Montreal
0.92%, dated 11/30/17, to be repurchased on 12/1/17, repurchase price $3,799,456 (collateralized by US government obligations 0.00%-3.50% 1/2/18–5/15/47; market value $3,875,347) | | | 3,799,359 | | | | 3,799,359 | |
BNP Paribas
1.00%, dated 11/30/17, to be repurchased on 12/1/17, repurchase price $3,886,533 (collateralized by US government obligations 0.00%–3.625% 3/31/18–2/15/46; market value $3,964,153) | | | 3,886,425 | | | | 3,886,425 | |
| | | | | | | | |
| | | | | | | 9,205,527 | |
| | | | | | | | |
US Treasury Obligation – 0.79%≠ | | | | | | | | |
US Treasury Bill 0.93% 12/7/17 | | | 2,532,038 | | | | 2,531,631 | |
| | | | | | | | |
| | | | | | | 2,531,631 | |
| | | | | | | | |
Total Short-Term Investments (cost $13,972,773) | | | | | | | 13,972,682 | |
| | | | | | | | |
Total Value of Securities Before Securities Lending Collateral – 99.52%
(cost $265,413,296) | | | | | | | 318,464,957 | |
| | | | | | | | |
|
| |
Security Lending Collateral – 0.51%** | | | | | | | | |
| |
Certificates of Deposit – 0.16%≠ | | | | | | | | |
Australia & New Zealand Banking Group (London) 1.18% 12/1/17 | | | 73,000 | | | | 73,000 | |
Bank of Nova Scotia (Toronto) 1.10% 12/1/17 | | | 73,000 | | | | 73,000 | |
Canadian Imperial Bank of Commerce (Cayman) 1.08% 12/1/17 | | | 73,000 | | | | 73,000 | |
Commonwealth Bank of Australia (London) 1.10% 12/1/17 | | | 73,000 | | | | 73,000 | |
National Australia Bank (Cayman) 1.05% 12/1/17 | | | 73,000 | | | | 73,000 | |
National Bank of Canada (Montreal) 1.08% 12/1/17 | | | 73,000 | | | | 73,000 | |
Royal Bank of Canada (Toronto) 1.08% 12/1/17 | | | 73,000 | | | | 73,000 | |
| | | | | | | | |
| | | | | | | 511,000 | |
| | | | | | | | |
42
| | | | | | | | |
| | | Principal amount° | | | Value (US $) | |
| |
Security Lending Collateral** (continued) | | | | | | | | |
| |
Repurchase Agreements – 0.35% | | | | | | | | |
Bank of Nova Scotia
1.03%, dated 11/30/17, to be repurchased on 12/1/17, repurchase price $376,515 (collateralized by US government obligations 1.143%–8.750% 4/30/19–2/28/22; market value $384,046) | | | 376,504 | | | $ | 376,504 | |
JPMorgan Securities
1.04%, dated 11/30/17, to be repurchased on 12/1/17, repurchase price $376,515 (collateralized by US government obligations 0.125%-1.875% 7/15/18–7/15/22; market value $384,037) | | | 376,504 | | | | 376,504 | |
Merrill Lynch, Pierce, Fenner & Smith
1.01, dated 11/30/17, to be repurchased on 12/1/17, repurchase price $353,587 (collateralized by US government obligations 1.250% 7/15/20; market value $360,650) | | | 353,577 | | | | 353,577 | |
| | | | | | | | |
| | | | | | | 1,106,585 | |
| | | | | | | | |
Total Securities Lending Collateral (cost $1,617,585) | | | | | | | 1,617,585 | |
| | | | | | | | |
| | |
Total Value of Securities – 100.03%
(cost $267,030,881) | | | | | | $ | 320,082,542∎ | |
| | | | | | | | |
| * | Fully or partially on loan. |
| ** | See Note 10 in “Notes to financial statements” for additional information on securities lending collateral and non-cash collateral. |
| ≠ | The rate shown is the effective yield at the time of purchase. |
| ∎ | Includes $1,555,423 of securities loaned. |
| ° | Principal amount shown is stated in US dollars unless noted that the security is denominated in another currency. |
| D | Securities have been classified by country of origin. Aggregate classification by business sector has been presented on page 30 in “Security type / country and sector allocations.” |
| † | Non-income producing security. |
Summary of abbreviations:
ADR – American Depositary Receipt
CVA – Dutch Certificate
See accompanying notes, which are an integral part of the financial statements.
43
Statements of assets and liabilities
November 30, 2017
| | | | | | | | | | | | |
| | | Delaware Emerging Markets Fund | | | Delaware Global Value Fund | | | Delaware
International
Value Equity
Fund | |
Assets: | | | | | | | | | | | | |
Investments, at value1, 2 | | $ | 4,773,222,309 | | | $ | 18,938,656 | | | $ | 304,492,275 | |
Short-term investments, at value3 | | | — | | | | 506,200 | | | | 13,972,682 | |
Short-term investments held as collateral for loaned securities, at value4 | | | — | | | | — | | | | 1,617,585 | |
Foreign currencies, at value5 | | | 29,435,642 | | | | 21,255 | | | | 515,342 | |
Cash | | | — | | | | 863 | | | | 1,488 | |
Receivable for fund shares sold | | | 20,574,334 | | | | 608 | | | | 506,003 | |
Dividends and interest receivable | | | 2,213,738 | | | | 41,926 | | | | 600,744 | |
Foreign tax reclaims receivable | | | 140,139 | | | | 14,306 | | | | 634,171 | |
Securities lending income receivable | | | — | | | | 26 | | | | 538 | |
Receivable from investment manager | | | — | | | | 12,849 | | | | — | |
| | | | | | | | | | | | |
Total assets | | | 4,825,586,162 | | | | 19,536,689 | | | | 322,340,828 | |
| | | | | | | | | | | | |
Liabilities: | | | | | | | | | | | | |
Cash due to custodian | | | 44,452,242 | | | | — | | | | — | |
Payable for securities purchased | | | 19,003,700 | | | | — | | | | — | |
Payable for fund shares redeemed | | | 4,159,349 | | | | — | | | | 261,969 | |
Obligation to return securities lending collateral | | | — | | | | — | | | | 1,615,172 | |
Investment management fees payable to affiliates | | | 4,498,405 | | | | — | | | | 222,683 | |
Other accrued expenses | | | 1,558,609 | | | | 7,500 | | | | 122,017 | |
Accounting and administration expenses payable to non-affiliates | | | 346,496 | | | | 12,068 | | | | 35,522 | |
Distribution fees payable to affiliates | | | 280,663 | | | | 6,115 | | | | 32,952 | |
Dividend disbursing and transfer agent fees and expenses payable to affiliates | | | 77,547 | | | | 315 | | | | 5,156 | |
Audit and tax fees payable | | | 37,676 | | | | 37,676 | | | | 37,676 | |
Trustees’ fees and expenses payable | | | 32,231 | | | | 133 | | | | 2,176 | |
Accounting and administration expenses payable to affiliates | | | 15,329 | | | | 390 | | | | 1,326 | |
Legal fees payable to affiliates | | | 7,575 | | | | 1,037 | | | | 845 | |
Reports and statements to shareholders payable to affiliates | | | 3,554 | | | | 15 | | | | 240 | |
Unrealized depreciation on foreign currency exchange contracts | | | 1,300 | | | | — | | | | — | |
Deferred capital gains tax payable | | | 9,983,459 | | | | — | | | | — | |
Other liabilities | | | — | | | | — | | | | 2,461 | |
| | | | | | | | | | | | |
Total liabilities | | | 84,458,135 | | | | 65,249 | | | | 2,340,195 | |
| | | | | | | | | | | | |
Total Net Assets | | $ | 4,741,128,027 | | | $ | 19,471,440 | | | $ | 320,000,633 | |
| | | | | | | | | | | | |
44
| | | | | | | | | | | | |
| | | Delaware Emerging Markets Fund | | | Delaware Global Value Fund | | | Delaware
International
Value Equity
Fund | |
| | | |
Net Assets Consist of: | | | | | | | | | | | | |
Paid-in capital | | $ | 4,081,445,848 | | | $ | 15,334,277 | �� | | $ | 281,303,661 | |
Undistributed net investment income | | | 13,486,339 | | | | 206,857 | | | | 5,097,707 | |
Accumulated net realized loss on investments | | | (63,539,355 | ) | | | (444,471 | ) | | | (19,467,274 | ) |
Net unrealized appreciation of investments6 | | | 709,718,138 | | | | 4,373,813 | | | | 53,051,661 | |
Net unrealized appreciation of foreign currencies | | | 18,357 | | | | 964 | | | | 14,878 | |
Net unrealized appreciation (depreciation) of foreign currency exchange contracts | | | (1,300 | ) | | | — | | | | — | |
| | | | | | | | | | | | |
Total Net Assets | | $ | 4,741,128,027 | | | $ | 19,471,440 | | | $ | 320,000,633 | |
| | | | | | | | | | | | |
| | | |
Net Asset Value | | | | | | | | | | | | |
| | | |
Class A: | | | | | | | | | | | | |
Net assets | | $ | 463,441,053 | | | $ | 12,977,169 | | | $ | 68,411,738 | |
Shares of beneficial interest outstanding, unlimited authorization, no par | | | 23,058,257 | | | | 982,111 | | | | 4,367,757 | |
Net asset value per share | | $ | 20.10 | | | $ | 13.21 | | | $ | 15.66 | |
Sales charge | | | 5.75 | % | | | 5.75 | % | | | 5.75 | % |
Offering price per share, equal to net asset value per share /
(1 – sales charge) | | $ | 21.33 | | | $ | 14.02 | | | $ | 16.62 | |
| | | |
Class C: | | | | | | | | | | | | |
Net assets | | $ | 190,226,393 | | | $ | 4,210,410 | | | $ | 21,504,950 | |
Shares of beneficial interest outstanding, unlimited authorization, no par | | | 10,182,299 | | | | 326,417 | | | | 1,400,296 | |
Net asset value per share | | $ | 18.68 | | | $ | 12.90 | | | $ | 15.36 | |
| | | |
Class R: | | | | | | | | | | | | |
Net assets | | $ | 61,735,209 | | | $ | — | | | $ | 3,439,821 | |
Shares of beneficial interest outstanding, unlimited authorization, no par | | | 3,054,441 | | | | — | | | | 220,596 | |
Net asset value per share | | $ | 20.21 | | | $ | — | | | $ | 15.59 | |
45
Statements of assets and liabilities
| | | | | | | | | | | | |
| | | Delaware Emerging Markets Fund | | | Delaware Global Value Fund | | | Delaware International Value Equity Fund | |
| | | |
Institutional Class: | | | | | | | | | | | | |
Net assets | | $ | 3,885,606,364 | | | $ | 2,283,861 | | | $ | 226,644,124 | |
Shares of beneficial interest outstanding, unlimited authorization, no par | | | 191,791,657 | | | | 172,055 | | | | 14,396,226 | |
Net asset value per share | | $ | 20.26 | | | $ | 13.27 | | | $ | 15.74 | |
| | | |
Class R6: | | | | | | | | | | | | |
Net assets | | $ | 140,119,008 | | | $ | — | | | $ | — | |
Shares of beneficial interest outstanding, unlimited authorization, no par | | | 6,911,706 | | | | — | | | | — | |
Net asset value per share | | $ | 20.27 | | | $ | — | | | $ | — | |
|
| |
1Investments, at cost | | $ | 4,053,520,712 | | | $ | 14,564,839 | | | $ | 251,440,523 | |
2Including securities on loan | | | — | | | | 262,185 | | | | 1,555,423 | |
3Short-term investments, at cost | | | — | | | | 506,204 | | | | 13,972,773 | |
4Short-term investments held as collateral for loaned securities, at cost | | | — | | | | — | | | | 1,617,585 | |
5Foreign currencies, at cost | | | 29,421,092 | | �� | | 20,815 | | | | 506,830 | |
6Includes deferred capital gains tax payable | | | 9,983,459 | | | | — | | | | — | |
See accompanying notes, which are an integral part of the financial statements.
46
This page intentionally left blank.
Statements of operations
| | |
| Delaware International Funds | | Year ended November 30, 2017 |
| | | | | | | | | | | | |
| | | Delaware Emerging Markets Fund | | | Delaware Global Value Fund | | | Delaware International Value Equity Fund | |
| | | |
Investment Income: | | | | | | | | | | | | |
Dividends | | $ | 100,718,399 | | | $ | 549,917 | | | $ | 9,341,237 | |
Interest | | | 5,716 | | | | 1,411 | | | | 59,836 | |
Securities lending income | | | — | | | | 2,129 | | | | 43,967 | |
Foreign tax withheld | | | (6,335,795 | ) | | | (32,676 | ) | | | (866,348 | ) |
| | | | | | | | | | | | |
| | | 94,388,320 | | | | 520,781 | | | | 8,578,692 | |
| | | | | | | | | | | | |
Expenses: | | | | | | | | | | | | |
Management fees | | | 39,645,070 | | | | 163,117 | | | | 2,433,487 | |
Distribution expenses – Class A | | | 1,282,986 | | | | 32,003 | | | | 158,650 | |
Distribution expenses – Class C | | | 1,504,101 | | | | 42,915 | | | | 206,516 | |
Distribution expenses – Class R | | | 250,796 | | | | — | | | | 12,623 | |
Dividend disbursing and transfer agent fees and expenses | | | 5,412,581 | | | | 30,484 | | | | 336,068 | |
Custodian fees | | | 1,039,328 | | | | 5,844 | | | | 69,907 | |
Accounting and administration expenses | | | 841,311 | | | | 16,384 | | | | 83,431 | |
Registration fees | | | 521,282 | | | | 60,887 | | | | 85,824 | |
Reports and statements to shareholders | | | 338,926 | | | | 8,293 | | | | 41,777 | |
Legal fees | | | 240,591 | | | | 3,667 | | | | 20,743 | |
Trustees’ fees and expenses | | | 162,205 | | | | 919 | | | | 13,503 | |
Audit and tax | | | 40,132 | | | | 38,291 | | | | 38,503 | |
Other | | | 77,975 | | | | 12,246 | | | | 21,912 | |
| | | | | | | | | | | | |
| | | 51,357,284 | | | | 415,050 | | | | 3,522,944 | |
Less expenses waived | | | (96,636 | ) | | | (90,607 | ) | | | — | |
Less expenses paid indirectly | | | (2,269 | ) | | | (100 | ) | | | (633 | ) |
| | | | | | | | | | | | |
Total operating expenses | | | 51,258,379 | | | | 324,343 | | | | 3,522,311 | |
| | | | | | | | | | | | |
Net Investment Income | | | 43,129,941 | | | | 196,438 | | | | 5,056,381 | |
| | | | | | | | | | | | |
48
| | | | | | | | | | | | |
| | | Delaware Emerging Markets Fund | | | Delaware Global Value Fund | | | Delaware International Value Equity Fund | |
| | | |
Net Realized and Unrealized Gain (Loss): | | | | | | | | | | | | |
Net realized gain (loss) on: | | | | | | | | | | | | |
Investments | | $ | 18,422,189 | | | $ | (396,107 | ) | | $ | (4,424,805 | ) |
Foreign currencies | | | 232,342 | | | | 4,222 | | | | 35,317 | |
Foreign currency exchange contracts | | | (978,334 | ) | | | 13,350 | | | | 105,560 | |
| | | | | | | | | | | | |
Net realized gain (loss) | | | 17,676,197 | | | | (378,535 | ) | | | (4,283,928 | ) |
| | | | | | | | | | | | |
Net change in unrealized appreciation (depreciation) of: | | | | | | | | | | | | |
Investments1 | | | 974,049,210 | | | | 3,189,867 | | | | 58,413,313 | |
Foreign currencies | | | 37,620 | | | | 2,986 | | | | 104,808 | |
Foreign currency exchange contracts | | | (1,391 | ) | | | — | | | | — | |
| | | | | | | | | | | | |
Net change in unrealized appreciation (depreciation) | | | 974,085,439 | | | | 3,192,853 | | | | 58,518,121 | |
| | | | | | | | | | | | |
Net Realized and Unrealized Gain | | | 991,761,636 | | | | 2,814,318 | | | | 54,234,193 | |
| | | | | | | | | | | | |
Net Increase in Net Assets Resulting from Operations | | $ | 1,034,891,577 | | | $ | 3,010,756 | | | $ | 59,290,574 | |
| | | | | | | | | | | | |
1Includes $8,769,753 increase in capital gains tax accrued for Delaware Emerging Markets Fund.
See accompanying notes, which are an integral part of the financial statements.
49
Statements of changes in net assets
Delaware Emerging Markets Fund
| | | | | | | | |
| | | Year ended | |
| | | 11/30/17 | | | 11/30/16 | |
| | |
Increase (Decrease) in Net Assets from Operations: | | | | | | | | |
Net investment income | | $ | 43,129,941 | | | $ | 7,498,568 | |
Net realized gain (loss) | | | 17,676,197 | | | | (9,253,533 | ) |
Net change in unrealized appreciation (depreciation) | | | 974,085,439 | | | | 181,929,440 | |
| | | | | | | | |
Net increase in net assets resulting from operations | | | 1,034,891,577 | | | | 180,174,475 | |
| | | | | | | | |
| | |
Dividends and Distributions to Shareholders from: | | | | | | | | |
Net investment income: | | | | | | | | |
Class A | | | (3,211,395 | ) | | | (84,127 | ) |
Class C | | | (95,955 | ) | | | — | |
Class R | | | (170,901 | ) | | | — | |
Institutional Class | | | (13,058,434 | ) | | | (3,161,089 | ) |
Class R6 | | | (13,492 | ) | | | — | |
| | | | | | | | |
| | |
| | | (16,550,177 | ) | | | (3,245,216 | ) |
| | | | | | | | |
Capital Share Transactions: | | | | | | | | |
Proceeds from shares sold: | | | | | | | | |
Class A | | | 236,362,922 | | | | 320,861,555 | |
Class C | | | 64,662,798 | | | | 11,210,598 | |
Class R | | | 26,236,730 | | | | 15,921,415 | |
Institutional Class | | | 2,501,849,920 | | | | 559,676,114 | |
Class R6 | | | 138,637,939 | | | | 313,729 | |
Net asset value of shares issued upon reinvestment of dividends and distributions: | | | | | | | | |
Class A | | | 3,152,907 | | | | 81,518 | |
Class C | | | 91,725 | | | | — | |
Class R | | | 170,579 | | | | — | |
Institutional Class | | | 9,447,872 | | | | 2,509,155 | |
Class R6 | | | 13,492 | | | | — | |
| | | | | | | | |
| | | 2,980,626,884 | | | | 910,574,084 | |
| | | | | | | | |
50
| | | | | | | | |
| | | Year ended | |
| | | 11/30/17 | | | 11/30/16 | |
| | |
Capital Share Transactions (continued): | | | | | | | | |
Cost of shares redeemed: | | | | | | | | |
Class A | | $ | (404,967,706 | ) | | $ | (159,186,373 | ) |
Class C | | | (40,197,551 | ) | | | (36,467,120 | ) |
Class R | | | (16,565,446 | ) | | | (7,742,810 | ) |
Institutional Class | | | (754,898,858 | ) | | | (603,723,575 | ) |
Class R6 | | | (5,860,644 | ) | | | (25,146 | ) |
| | | | | | | | |
| | | (1,222,490,205 | ) | | | (807,145,024 | ) |
| | | | | | | | |
Increase in net assets derived from capital share transactions | | | 1,758,136,679 | | | | 103,429,060 | |
| | | | | | | | |
Net Increase in Net Assets | | | 2,776,478,079 | | | | 280,358,319 | |
| | |
Net Assets: | | | | | | | | |
Beginning of year | | | 1,964,649,948 | | | | 1,684,291,629 | |
| | | | | | | | |
End of year | | $ | 4,741,128,027 | | | $ | 1,964,649,948 | |
| | | | | | | | |
Undistributed (distributions in excess of) net investment income | | $ | 13,486,339 | | | $ | (13,846,504 | ) |
| | | | | | | | |
See accompanying notes, which are an integral part of the financial statements.
51
Statements of changes in net assets
Delaware Global Value Fund
| | | | | | | | |
| | | Year ended | |
| | | 11/30/17 | | | 11/30/16 | |
| | |
Increase (Decrease) in Net Assets from Operations: | | | | | | | | |
Net investment income | | $ | 196,438 | | | $ | 165,063 | |
Net realized gain (loss) | | | (378,535 | ) | | | 649,961 | |
Net change in unrealized appreciation (depreciation) | | | 3,192,853 | | | | (310,116 | ) |
| | | | | | | | |
Net increase in net assets resulting from operations | | | 3,010,756 | | | | 504,908 | |
| | | | | | | | |
| | |
Dividends and Distributions to Shareholders from: | | | | | | | | |
Net investment income: | | | | | | | | |
Class A | | | (214,985 | ) | | | (104,081 | ) |
Class C | | | (45,327 | ) | | | — | |
Institutional Class | | | (30,941 | ) | | | (20,540 | ) |
| | | | | | | | |
| | | (291,253 | ) | | | (124,621 | ) |
| | | | | | | | |
| | |
Capital Share Transactions: | | | | | | | | |
Proceeds from shares sold: | | | | | | | | |
Class A | | | 1,018,925 | | | | 729,328 | |
Class C | | | 643,132 | | | | 329,276 | |
Institutional Class | | | 930,642 | | | | 172,714 | |
Net asset value of shares issued upon reinvestment of dividends and distributions: | | | | | | | | |
Class A | | | 206,409 | | | | 100,258 | |
Class C | | | 44,578 | | | | — | |
Institutional Class | | | 27,498 | | | | 17,485 | |
| | | | | | | | |
| | | 2,871,184 | | | | 1,349,061 | |
| | | | | | | | |
52
| | | | | | | | |
| | | Year ended | |
| | | 11/30/17 | | | 11/30/16 | |
| | |
Capital Share Transactions (continued): | | | | | | | | |
Cost of shares redeemed: | | | | | | | | |
Class A | | $ | (2,523,541 | ) | | $ | (3,077,056 | ) |
Class C | | | (1,195,075 | ) | | | (911,456 | ) |
Institutional Class | | | (590,138 | ) | | | (650,267 | ) |
| | | | | | | | |
| | | (4,308,754 | ) | | | (4,638,779 | ) |
| | | | | | | | |
Decrease in net assets derived from capital share transactions | | | (1,437,570 | ) | | | (3,289,718 | ) |
| | | | | | | | |
Net Increase (Decrease) in Net Assets | | | 1,281,933 | | | | (2,909,431 | ) |
| | |
Net Assets: | | | | | | | | |
Beginning of year | | | 18,189,507 | | | | 21,098,938 | |
| | | | | | | | |
End of year | | $ | 19,471,440 | | | $ | 18,189,507 | |
| | | | | | | | |
Undistributed net investment income | | $ | 206,857 | | | $ | 284,100 | |
| | | | | | | | |
See accompanying notes, which are an integral part of the financial statements.
53
Statements of changes in net assets
Delaware International Value Equity Fund
| | | | | | | | |
| | | Year ended | |
| | | 11/30/17 | | | 11/30/16 | |
| | |
Increase (Decrease) in Net Assets from Operations: | | | | | | | | |
Net investment income | | $ | 5,056,381 | | | $ | 3,945,931 | |
Net realized gain (loss) | | | (4,283,928 | ) | | | 8,525,978 | |
Net change in unrealized appreciation (depreciation) | | | 58,518,121 | | | | (9,126,819 | ) |
| | | | | | | | |
Net increase in net assets resulting from operations | | | 59,290,574 | | | | 3,345,090 | |
| | | | | | | | |
| | |
Dividends and Distributions to Shareholders from: | | | | | | | | |
Net investment income: | | | | | | | | |
Class A | | | (1,135,918 | ) | | | (843,910 | ) |
Class C | | | (294,982 | ) | | | (133,918 | ) |
Class R | | | (32,069 | ) | | | (16,051 | ) |
Institutional Class | | | (3,801,623 | ) | | | (2,426,729 | ) |
| | | | | | | | |
| | | (5,264,592 | ) | | | (3,420,608 | ) |
| | | | | | | | |
| | |
Capital Share Transactions: | | | | | | | | |
Proceeds from shares sold: | | | | | | | | |
Class A | | | 16,868,024 | | | | 9,364,853 | |
Class C | | | 4,847,373 | | | | 1,698,895 | |
Class R | | | 2,246,244 | | | | 601,854 | |
Institutional Class | | | 66,981,526 | | | | 50,653,860 | |
| | |
Net asset value of shares issued upon reinvestment of dividends and distributions: | | | | | | | | |
Class A | | | 1,096,074 | | | | 822,166 | |
Class C | | | 285,822 | | | | 129,562 | |
Class R | | | 32,069 | | | | 16,050 | |
Institutional Class | | | 3,767,360 | | | | 2,410,920 | |
| | | | | | | | |
| | | 96,124,492 | | | | 65,698,160 | |
| | | | | | | | |
54
| | | | | | | | |
| | | Year ended | |
| | | 11/30/17 | | | 11/30/16 | |
| | |
Capital Shares Transactions (continued): | | | | | | | | |
Cost of shares redeemed: | | | | | | | | |
Class A | | $ | (16,493,701 | ) | | $ | (21,479,373 | ) |
Class C | | | (9,211,639 | ) | | | (6,402,105 | ) |
Class R | | | (872,466 | ) | | | (476,291 | ) |
Institutional Class | | | (47,150,045 | ) | | | (49,791,088 | ) |
| | | | | | | | |
| | | (73,727,851 | ) | | | (78,148,857 | ) |
| | | | | | | | |
Increase (decrease) in net assets derived from capital share transactions | | | 22,396,641 | | | | (12,450,697 | ) |
| | | | | | | | |
Net Increase (Decrease) in Net Assets | | | 76,422,623 | | | | (12,526,215 | ) |
| | |
Net Assets: | | | | | | | | |
Beginning of year | | | 243,578,010 | | | | 256,104,225 | |
| | | | | | | | |
End of year | | $ | 320,000,633 | | | $ | 243,578,010 | |
| | | | | | | | |
Undistributed net investment income | | $ | 5,097,707 | | | $ | 5,165,041 | |
| | | | | | | | |
See accompanying notes, which are an integral part of the financial statements.
55
Financial highlights
Delaware Emerging Markets Fund Class A
Selected data for each share of the Fund outstanding throughout each period were as follows:
|
|
Net asset value, beginning of period |
|
Income (loss) from investment operations: |
Net investment income (loss)1 |
Net realized and unrealized gain (loss) |
Total from investment operations |
|
Less dividends and distributions from: |
Net investment income |
Return of capital |
Net realized gain |
Total dividends and distributions |
|
Net asset value, end of period |
|
Total return3 |
|
Ratios and supplemental data: |
Net assets, end of period (000 omitted) |
Ratio of expenses to average net assets4 |
Ratio of expenses to average net assets prior to fees waived4,5 |
Ratio of net investment income (loss) to average net assets |
Ratio of net investment income (loss) to average net assets prior to fees waived5 |
Portfolio turnover |
|
| 1 | The average shares outstanding method has been applied for per share information. |
| 2 | For the year ended Nov. 30, 2016, net investment income distributions of $84,127 was made by the Fund’s A Class, which calculated to a de minimis amount of $(0.004) per share. |
| 3 | Total investment return is based on the change in net asset value of a share during the period and assumes reinvestment of dividends and distributions at net asset value and does not reflect the impact of a sales charge. Total investment return during some of the periods shown reflects waivers by the manager and/or distributor. Performance would have been lower had the waivers not been in effect. |
| 4 | Expense ratios do not include expenses of the Underlying Funds in which the Fund invests. |
| 5 | Expenses paid indirectly were not material and had no impact on the ratios disclosed. Expenses paid indirectly for the year ended Nov. 30, 2017 are reflected on the “Statements of operations.” |
See accompanying notes, which are an integral part of the financial statements.
56
| | | | | | | | | | | | | | | | | | | | | | | | | | | | |
| | | Year ended | |
| | | | |
| | | 11/30/17 | | | | | 11/30/16 | | | | | 11/30/15 | | | | | 11/30/14 | | | | | 11/30/13 | |
| |
| | | $ 14.57 | | | | | | $ 12.80 | | | | | | $ 16.08 | | | | | | $ 16.23 | | | | | | $ 13.50 | |
| | | | | | | | | |
| | | | | | | | | | | | | | | | | | | | | | | | | | | | | |
| | | 0.19 | | | | | | 0.05 | | | | | | (0.01 | ) | | | | | 0.01 | | | | | | 0.02 | |
| | | 5.44 | | | | | | 1.72 | | | | | | (2.85 | ) | | | | | (0.04 | ) | | | | | 2.82 | |
| | | | | | | | | | | | | | | | | | | | | | | | | | | | |
| | | 5.63 | | | | | | 1.77 | | | | | | (2.86 | ) | | | | | (0.03 | ) | | | | | 2.84 | |
| | | | | | | | | | | | | | | | | | | | | | | | | | | | |
| | | | | | | | | |
| | | | | | | | | | | | | | | | | | | | | | | | | | | | | |
| | | (0.10 | ) | | | | | — | 2 | | | | | (0.07 | ) | | | | | (0.12 | ) | | | | | (0.11 | ) |
| | | — | | | | | | — | | | | | | (0.02 | ) | | | | | — | | | | | | — | |
| | | — | | | | | | — | | | | | | (0.33 | ) | | | | | — | | | | | | — | |
| | | | | | | | | | | | | | | | | | | | | | | | | | | | |
| | | (0.10 | ) | | | | | — | | | | | | (0.42 | ) | | | | | (0.12 | ) | | | | | (0.11 | ) |
| | | | | | | | | | | | | | | | | | | | | | | | | | | | |
| | | | | | | | | |
| | | $ 20.10 | | | | | | $ 14.57 | | | | | | $ 12.80 | | | | | | $ 16.08 | | | | | | $ 16.23 | |
| | | | | | | | | | | | | | | | | | | | | | | | | | | | |
| | | | | | | | | |
| | | 38.94% | | | | | | 13.87% | | | | | | (18.15% | ) | | | | | (0.20% | ) | | | | | 21.16% | |
| | | | | | | | | |
| | | | | | | | | | | | | | | | | | | | | | | | | | | | | |
| | | $463,441 | | | | | | $461,124 | | | | | | $274,075 | | | | | | $423,620 | | | | | | $498,686 | |
| | | 1.66% | | | | | | 1.74% | | | | | | 1.75% | | | | | | 1.69% | | | | | | 1.71% | |
| | | 1.66% | | | | | | 1.78% | | | | | | 1.75% | | | | | | 1.69% | | | | | | 1.75% | |
| | | 1.10% | | | | | | 0.35% | | | | | | (0.08% | ) | | | | | 0.01% | | | | | | 0.16% | |
| | | 1.10% | | | | | | 0.31% | | | | | | (0.08% | ) | | | | | 0.01% | | | | | | 0.12% | |
| | | 11% | | | | | | 25% | | | | | | 12% | | | | | | 26% | | | | | | 24% | |
| |
57
Financial highlights
Delaware Emerging Markets Fund Class C
Selected data for each share of the Fund outstanding throughout each period were as follows:
|
|
Net asset value, beginning of period |
|
Income (loss) from investment operations: |
Net investment income (loss)1 |
Net realized and unrealized gain (loss) |
Total from investment operations |
|
Less dividends and distributions from: |
Net investment income |
Return of capital |
Net realized gain |
Total dividends and distributions |
|
Net asset value, end of period |
|
Total return2 |
|
Ratios and supplemental data: |
Net assets, end of period (000 omitted) |
Ratio of expenses to average net assets3 |
Ratio of expenses to average net assets prior to fees waived3,4 |
Ratio of net investment income (loss) to average net assets |
Ratio of net investment income (loss) to average net assets prior to fees waived4 |
Portfolio turnover |
|
| 1 | The average shares outstanding method has been applied for per share information. |
| 2 | Total investment return is based on the change in net asset value of a share during the period and assumes reinvestment of dividends and distributions at net asset value and does not reflect the impact of a sales charge. Total investment return during some of the periods shown reflects a waiver by the manager. Performance would have been lower had the waiver not been in effect. |
| 3 | Expense ratios do not include expenses of the Underlying Funds in which the Fund invests. |
| 4 | Expenses paid indirectly were not material and had no impact on the ratios disclosed. Expenses paid indirectly for the year ended Nov. 30, 2017 are reflected on the “Statements of operations.” |
See accompanying notes, which are an integral part of the financial statements.
58
| | | | | | | | | | | | | | | | | | | | | | | | | | | | |
| | | | | | | | | | | | | Year ended | | | | | | | | | | | |
| | | | |
| | | 11/30/17 | | | | | 11/30/16 | | | | | 11/30/15 | | | | | 11/30/14 | | | | | 11/30/13 | |
| |
| | | $ 13.56 | | | | | | $ 12.00 | | | | | | $ 15.14 | | | | | | $ 15.30 | | | | | | $ 12.74 | |
| | | | | | | | | |
| | | | | | | | | | | | | | | | | | | | | | | | | | | | | |
| | | 0.06 | | | | | | (0.05 | ) | | | | | (0.11 | ) | | | | | (0.12 | ) | | | | | (0.08 | ) |
| | | 5.07 | | | | | | 1.61 | | | | | | (2.68 | ) | | | | | (0.03 | ) | | | | | 2.66 | |
| | | | | | | | | | | | | | | | | | | | | | | | | | | | |
| | | 5.13 | | | | | | 1.56 | | | | | | (2.79 | ) | | | | | (0.15 | ) | | | | | 2.58 | |
| | | | | | | | | | | | | | | | | | | | | | | | | | | | |
| | | | | | | | | |
| | | | | | | | | | | | | | | | | | | | | | | | | | | | | |
| | | (0.01 | ) | | | | | — | | | | | | — | | | | | | (0.01 | ) | | | | | (0.02 | ) |
| | | — | | | | | | — | | | | | | (0.02 | ) | | | | | — | | | | | | — | |
| | | — | | | | | | — | | | | | | (0.33 | ) | | | | | — | | | | | | — | |
| | | | | | | | | | | | | | | | | | | | | | | | | | | | |
| | | (0.01 | ) | | | | | — | | | | | | (0.35 | ) | | | | | (0.01 | ) | | | | | (0.02 | ) |
| | | | | | | | | | | | | | | | | | | | | | | | | | | | |
| | | | | | | | | |
| | | $ 18.68 | | | | | | $ 13.56 | | | | | | $ 12.00 | | | | | | $ 15.14 | | | | | | $ 15.30 | |
| | | | | | | | | | | | | | | | | | | | | | | | | | | | |
| | | | | | | | | |
| | | 37.87% | | | | | | 13.00% | | | | | | (18.74% | ) | | | | | (0.97% | ) | | | | | 20.25% | |
| | | | | | | | | |
| | | | | | | | | | | | | | | | | | | | | | | | | | | | | |
| | | $190,227 | | | | | | $120,306 | | | | | | $131,724 | | | | | | $198,428 | | | | | | $180,168 | |
| | | 2.41% | | | | | | 2.49% | | | | | | 2.50% | | | | | | 2.44% | | | | | | 2.46% | |
| | | 2.41% | | | | | | 2.53% | | | | | | 2.50% | | | | | | 2.44% | | | | | | 2.46% | |
| | | 0.35% | | | | | | (0.40% | ) | | | | | (0.83% | ) | | | | | (0.74% | ) | | | | | (0.59% | ) |
| | | 0.35% | | | | | | (0.44% | ) | | | | | (0.83% | ) | | | | | (0.74% | ) | | | | | (0.59% | ) |
| | | 11% | | | | | | 25% | | | | | | 12% | | | | | | 26% | | | | | | 24% | |
| |
59
Financial highlights
Delaware Emerging Markets Fund Class R
Selected data for each share of the Fund outstanding throughout each period were as follows:
|
|
Net asset value, beginning of period |
|
Income (loss) from investment operations: |
Net investment income (loss)1 |
Net realized and unrealized gain (loss) |
Total from investment operations |
|
Less dividends and distributions from: |
Net investment income |
Return of capital |
Net realized gain |
Total dividends and distributions |
|
Net asset value, end of period |
|
Total return2 |
|
Ratios and supplemental data: |
Net assets, end of period (000 omitted) |
Ratio of expenses to average net assets3 |
Ratio of expenses to average net assets prior to fees waived3,4 |
Ratio of net investment income (loss) to average net assets |
Ratio of net investment income (loss) to average net assets prior to fees waived4 |
Portfolio turnover |
|
| 1 | The average shares outstanding method has been applied for per share information. |
| 2 | Total investment return is based on the change in net asset value of a share during the period and assumes reinvestment of dividends and distributions at net asset value. Total investment return during some of the periods shown reflects waivers by the manager and/or distributor. Performance would have been lower had the waivers not been in effect. |
| 3 | Expense ratios do not include expenses of the Underlying Funds in which the Fund invests. |
| 4 | Expenses paid indirectly were not material and had no impact on the ratios disclosed. Expenses paid indirectly for the year ended Nov. 30, 2017 are reflected on the “Statements of operations.” |
See accompanying notes, which are an integral part of the financial statements.
60
| | | | | | | | | | | | | | | | | | | | | | | | | | | | |
| | �� | Year ended | |
| | | | |
| | | 11/30/17 | | | | | 11/30/16 | | | | | 11/30/15 | | | | | 11/30/14 | | | | | 11/30/13 | |
| |
| | | $ 14.66 | | | | | | $ 12.90 | | | | | | $ 16.20 | | | | | | $ 16.35 | | | | | | $ 13.60 | |
| | | | | | | | | |
| | | | | | | | | | | | | | | | | | | | | | | | | | | | | |
| | | 0.15 | | | | | | 0.02 | | | | | | (0.05 | ) | | | | | (0.06 | ) | | | | | (0.01 | ) |
| | | 5.47 | | | | | | 1.74 | | | | | | (2.88 | ) | | | | | (0.01 | ) | | | | | 2.84 | |
| | | | | | | | | | | | | | | | | | | | | | | | | | | | |
| | | 5.62 | | | | | | 1.76 | | | | | | (2.93 | ) | | | | | (0.07 | ) | | | | | 2.83 | |
| | | | | | | | | | | | | | | | | | | | | | | | | | | | |
| | | | | | | | | |
| | | | | | | | | | | | | | | | | | | | | | | | | | | | | |
| | | (0.07 | ) | | | | | — | | | | | | (0.02 | ) | | | | | (0.08 | ) | | | | | (0.08 | ) |
| | | — | | | | | | — | | | | | | (0.02 | ) | | | | | — | | | | | | — | |
| | | — | | | | | | — | | | | | | (0.33 | ) | | | | | — | | | | | | — | |
| | | | | | | | | | | | | | | | | | | | | | | | | | | | |
| | | (0.07 | ) | | | | | — | | | | | | (0.37 | ) | | | | | (0.08 | ) | | | | | (0.08 | ) |
| | | | | | | | | | | | | | | | | | | | | | | | | | | | |
| | | | | | | | | |
| | | $ 20.21 | | | | | | $ 14.66 | | | | | | $ 12.90 | | | | | | $ 16.20 | | | | | | $ 16.35 | |
| | | | | | | | | | | | | | | | | | | | | | | | | | | | |
| | | | | | | | | |
| | | 38.51% | | | | | | 13.64% | | | | | | (18.37% | ) | | | | | (0.44% | ) | | | | | 20.86% | |
| | | | | | | | | |
| | | | | | | | | | | | | | | | | | | | | | | | | | | | | |
| | | $61,735 | | | | | | $36,591 | | | | | | $ 24,299 | | | | | | $ 14,173 | | | | | | $ 5,282 | |
| | | 1.91% | | | | | | 1.99% | | | | | | 2.00% | | | | | | 1.94% | | | | | | 1.96% | |
| | | 1.91% | | | | | | 2.03% | | | | | | 2.00% | | | | | | 1.94% | | | | | | 2.04% | |
| | | 0.85% | | | | | | 0.10% | | | | | | (0.33% | ) | | | | | (0.24% | ) | | | | | (0.09% | ) |
| | | 0.85% | | | | | | 0.06% | | | | | | (0.33% | ) | | | | | (0.24% | ) | | | | | (0.17% | ) |
| | | 11% | | | | | | 25% | | | | | | 12% | | | | | | 26% | | | | | | 24% | |
| |
61
Financial highlights
Delaware Emerging Markets Fund Institutional Class
Selected data for each share of the Fund outstanding throughout each period were as follows:
|
|
Net asset value, beginning of period |
|
Income (loss) from investment operations: |
Net investment income1 |
Net realized and unrealized gain (loss) |
Total from investment operations |
|
Less dividends and distributions from: |
Net investment income |
Return of capital |
Net realized gain |
Total dividends and distributions |
|
Net asset value, end of period |
|
Total return2 |
|
Ratios and supplemental data: |
Net assets, end of period (000 omitted) |
Ratio of expenses to average net assets3 |
Ratio of expenses to average net assets prior to fees waived3,4 |
Ratio of net investment income to average net assets |
Ratio of net investment income to average net assets prior to fees waived4 |
Portfolio turnover |
|
| 1 | The average shares outstanding method has been applied for per share information. |
| 2 | Total investment return is based on the change in net asset value of a share during the period and assumes reinvestment of dividends and distributions at net asset value. Total investment return during some of the periods shown reflects a waiver by the manager. Performance would have been lower had the waiver not been in effect. |
| 3 | Expense ratios do not include expenses of the Underlying Funds in which the Fund invests. |
| 4 | Expenses paid indirectly were not material and had no impact on the ratios disclosed. Expenses paid indirectly for the year ended Nov. 30, 2017 are reflected on the “Statements of operations.” |
See accompanying notes, which are an integral part of the financial statements.
62
| | | | | | | | | | | | | | | | | | | | | | | | | | | | | | | | |
| | | | | | Year ended | |
| | | | | | | | |
| | | | | | 11/30/17 | | | | | 11/30/16 | | | | | 11/30/15 | | | | | 11/30/14 | | | | | 11/30/13 | |
| | |
| | | | | | | $ 14.69 | | | | | | $ 12.90 | | | | | | $ 16.21 | | | | | | $ 16.36 | | | | | | $ 13.60 | |
| | | | | | | | | | |
| | | | | | | | | | | | | | | | | | | | | | | | | | | | | | | | |
| | | | | | | 0.25 | | | | | | 0.08 | | | | | | 0.02 | | | | | | 0.04 | | | | | | 0.06 | |
| | | | | | | 5.46 | | | | | | 1.75 | | | | | | (2.87 | ) | | | | | (0.04 | ) | | | | | 2.84 | |
| | | | | | | | | | | | | | | | | | | | | | | | | | | | | | | | |
| | | | | | | 5.71 | | | | | | 1.83 | | | | | | (2.85 | ) | | | | | — | | | | | | 2.90 | |
| | | | | | | | | | | | | | | | | | | | | | | | | | | | | | | | |
| | | | | | | | | | |
| | | | | | | | | | | | | | | | | | | | | | | | | | | | | | | | |
| | | | | | | (0.14 | ) | | | | | (0.04 | ) | | | | | (0.11 | ) | | | | | (0.15 | ) | | | | | (0.14 | ) |
| | | | | | | — | | | | | | — | | | | | | (0.02 | ) | | | | | — | | | | | | — | |
| | | | | | | — | | | | | | — | | | | | | (0.33 | ) | | | | | — | | | | | | — | |
| | | | | | | | | | | | | | | | | | | | | | | | | | | | | | | | |
| | | | | | | (0.14 | ) | | | | | (0.04 | ) | | | | | (0.46 | ) | | | | | (0.15 | ) | | | | | (0.14 | ) |
| | | | | | | | | | | | | | | | | | | | | | | | | | | | | | | | |
| | | | | | | | | | |
| | | | | | | $ 20.26 | | | | | | $ 14.69 | | | | | | $ 12.90 | | | | | | $ 16.21 | | | | | | $ 16.36 | |
| | | | | | | | | | | | | | | | | | | | | | | | | | | | | | | | |
| | | | | | | | | | |
| | | | | | | 39.23% | | | | | | 14.22% | | | | | | (17.96% | ) | | | | | 0.04% | | | | | | 21.50% | |
| | | | | | | | | | |
| | | | | | | | | | | | | | | | | | | | | | | | | | | | | | | | |
| | | | | | | $3,885,606 | | | | | | $1,346,361 | | | | | | $1,254,194 | | | | | | $2,464,277 | | | | | | $1,974,807 | |
| | | | | | | 1.41% | | | | | | 1.49% | | | | | | 1.50% | | | | | | 1.44% | | | | | | 1.46% | |
| | | | | | | 1.41% | | | | | | 1.53% | | | | | | 1.50% | | | | | | 1.44% | | | | | | 1.46% | |
| | | | | | | 1.35% | | | | | | 0.60% | | | | | | 0.17% | | | | | | 0.26% | | | | | | 0.41% | |
| | | | | | | 1.35% | | | | | | 0.56% | | | | | | 0.17% | | | | | | 0.26% | | | | | | 0.41% | |
| | | | | | | 11% | | | | | | 25% | | | | | | 12% | | | | | | 26% | | | | | | 24% | |
| | |
63
Financial highlights
Delaware Emerging Markets Fund Class R6
Selected data for each share of the Fund outstanding throughout each period were as follows:
| | | | | | | | |
| | | Year ended
11/30/17 | | | 5/2/161 to 11/30/16 | |
| |
Net asset value, beginning of period | | | $ 14.69 | | | | $ 13.55 | |
| | |
Income from investment operations: | | | | | | | | |
Net investment income2 | | | 0.28 | | | | 0.08 | |
Net realized and unrealized gain | | | 5.45 | | | | 1.06 | |
| | | | | | | | |
Total from investment operations | | | 5.73 | | | | 1.14 | |
| | | | | | | | |
| | |
Less dividends and distributions from: | | | | | | | | |
Net investment income | | | (0.15 | ) | | | — | |
| | | | | | | | |
Total dividends and distributions | | | (0.15 | ) | | | — | |
| | | | | | | | |
| | |
Net asset value, end of period | | | $ 20.27 | | | | $ 14.69 | |
| | | | | | | | |
| | |
Total return3 | | | 39.43% | | | | 8.41% | |
| | |
Ratios and supplemental data: | | | | | | | | |
Net assets, end of period (000 omitted) | | | $140,119 | | | | $ 268 | |
Ratio of expenses to average net assets4 | | | 1.28% | | | | 1.32% | |
Ratio of expenses to average net assets prior to fees waived4,5 | | | 1.28% | | | | 1.37% | |
Ratio of net investment income to average net assets | | | 1.47% | | | | 0.85% | |
Ratio of net investment income to average net assets prior to fees waived5 | | | 1.47% | | | | 0.80% | |
Portfolio turnover | | | 11% | | | | 25% | 6 |
| |
| 1 | Date of commencement of operations; ratios have been annualized and total return has not been annualized. |
| 2 | The average shares outstanding method has been applied for per share information. |
| 3 | Total investment return is based on the change in net asset value of a share during the period and assumes reinvestment of dividends and distributions at net asset value. Total investment return shown reflects a waiver by the manager. Performance would have been lower had the waiver not been in effect. |
| 4 | Expense ratios do not include expenses of the Underlying Funds in which the Fund invests. |
| 5 | Expenses paid indirectly were not material and had no impact on the ratios disclosed. Expenses paid indirectly for the year ended Nov. 30, 2017 are reflected on the “Statements of operations.” |
| 6 | Portfolio turnover is representative of the Fund for the entire year ended Nov. 30, 2016. |
See accompanying notes, which are an integral part of the financial statements.
64
This page intentionally left blank.
Financial highlights
Delaware Global Value Fund Class A
Selected data for each share of the Fund outstanding throughout each period were as follows:
|
|
Net asset value, beginning of period |
|
Income (loss) from investment operations: |
Net investment income1 |
Net realized and unrealized gain (loss) |
Total from investment operations |
|
Less dividends and distributions from: |
Net investment income |
Total dividends and distributions |
|
Net asset value, end of period |
|
Total return2 |
|
Ratios and supplemental data: |
Net assets, end of period (000 omitted) |
Ratio of expenses to average net assets |
Ratio of expenses to average net assets prior to fees waived3 |
Ratio of net investment income to average net assets |
Ratio of net investment income to average net assets prior to fees waived3 |
Portfolio turnover |
|
| 1 | The average shares outstanding method has been applied for per share information. |
| 2 | Total investment return is based on the change in net asset value of a share during the period and assumes reinvestment of dividends and distributions at net asset value and does not reflect the impact of a sales charge. Total investment return during all of the periods shown reflects waivers by the manager and/or distributor. Performance would have been lower had the waivers not been in effect. |
| 3 | Expenses paid indirectly were not material and had no impact on the ratios disclosed. Expenses paid indirectly for the year ended Nov. 30, 2017 are reflected on the “Statement of operations.” |
See accompanying notes, which are an integral part of the financial statements.
66
| | | | | | | | | | | | | | | | | | | | | | | | | | | | |
| | | Year ended | |
| | | | |
| | | 11/30/17 | | | | | 11/30/16 | | | | | 11/30/15 | | | | | 11/30/14 | | | | | 11/30/13 | |
| |
| | | $ 11.46 | | | | | | $ 11.16 | | | | | | $ 11.71 | | | | | | $ 11.27 | | | | | | $ 9.01 | |
| | | | | | | | | |
| | | | | | | | | | | | | | | | | | | | | | | | | | | | | |
| | | 0.14 | | | | | | 0.11 | | | | | | 0.08 | | | | | | 0.07 | | | | | | 0.08 | |
| | | 1.81 | | | | | | 0.27 | | | | | | (0.58 | ) | | | | | 0.44 | | | | | | 2.28 | |
| | | | | | | | | | | | | | | | | | | | | | | | | | | | |
| | | 1.95 | | | | | | 0.38 | | | | | | (0.50 | ) | | | | | 0.51 | | | | | | 2.36 | |
| | | | | | | | | | | | | | | | | | | | | | | | | | | | |
| | | | | | | | | |
| | | | | | | | | | | | | | | | | | | | | | | | | | | | | |
| | | (0.20 | ) | | | | | (0.08 | ) | | | | | (0.05 | ) | | | | | (0.07 | ) | | | | | (0.10 | ) |
| | | | | | | | | | | | | | | | | | | | | | | | | | | | |
| | | (0.20 | ) | | | | | (0.08 | ) | | | | | (0.05 | ) | | | | | (0.07 | ) | | | | | (0.10 | ) |
| | | | | | | | | | | | | | | | | | | | | | | | | | | | |
| | | | | | | | | |
| | | $ 13.21 | | | | | | $ 11.46 | | | | | | $ 11.16 | | | | | | $ 11.71 | | | | | | $ 11.27 | |
| | | | | | | | | | | | | | | | | | | | | | | | | | | | |
| | | | | | | | | |
| | | 17.24% | | | | | | 3.45% | | | | | | (4.27% | ) | | | | | 4.57% | | | | | | 26.46% | |
| | | | | | | | | |
| | | | | | | | | | | | | | | | | | | | | | | | | | | | | |
| | | $12,977 | | | | | | $12,460 | | | | | | $14,457 | | | | | | $16,950 | | | | | | $16,951 | |
| | | 1.55% | | | | | | 1.55% | | | | | | 1.64% | | | | | | 1.55% | | | | | | 1.55% | |
| | | 2.02% | | | | | | 1.88% | | | | | | 1.89% | | | | | | 1.80% | | | | | | 1.82% | |
| | | 1.16% | | | | | | 1.01% | | | | | | 0.71% | | | | | | 0.58% | | | | | | 0.75% | |
| | | 0.69% | | | | | | 0.69% | | | | | | 0.46% | | | | | | 0.32% | | | | | | 0.48% | |
| | | 12% | | | | | | 12% | | | | | | 14% | | | | | | 43% | | | | | | 27% | |
| | | | | | | | | | | | | | | | | | | | | | | | | | | | |
| |
67
Financial highlights
Delaware Global Value Fund Class C
Selected data for each share of the Fund outstanding throughout each period were as follows:
|
|
Net asset value, beginning of period |
|
Income (loss) from investment operations: |
Net investment income (loss)1 |
Net realized and unrealized gain (loss) |
Total from investment operations |
|
Less dividends and distributions from: |
Net investment income |
Total dividends and distributions |
|
Net asset value, end of period |
|
Total return3 |
|
Ratios and supplemental data: |
Net assets, end of period (000 omitted) |
Ratio of expenses to average net assets |
Ratio of expenses to average net assets prior to fees waived4 |
Ratio of net investment income (loss) to average net assets |
Ratio of net investment income (loss) to average net assets prior to fees waived4 |
Portfolio turnover |
|
| 1 | The average shares outstanding method has been applied for per share information. |
| 2 | Amount is less than $(0.005) per share. |
| 3 | Total investment return is based on the change in net asset value of a share during the period and assumes reinvestment of dividends and distributions at net asset value and does not reflect the impact of a sales charge. Total investment return during all of the periods shown reflects a waiver by the manager. Performance would have been lower had the waiver not been in effect. |
| 4 | Expenses paid indirectly were not material and had no impact on the ratios disclosed. Expenses paid indirectly for the year ended Nov. 30, 2017 are reflected on the “Statement of operations.” |
| 5 | Amount is less than (0.01%). |
See accompanying notes, which are an integral part of the financial statements.
68
| | | | | | | | | | | | | | | | | | | | | | | | | | | | |
| | | Year ended | |
| | | | |
| | | 11/30/17 | | | | | 11/30/16 | | | | | 11/30/15 | | | | | 11/30/14 | | | | | 11/30/13 | |
| |
| | | $ 11.20 | | | | | | $ 10.90 | | | | | | $ 11.48 | | | | | | $ 11.06 | | | | | | $ 8.85 | |
| | | | | | | | | |
| | | | | | | | | | | | | | | | | | | | | | | | | | | | | |
| | | 0.05 | | | | | | 0.03 | | | | | | — | 2 | | | | | (0.02 | ) | | | | | — | 2 |
| | | 1.77 | | | | | | 0.27 | | | | | | (0.58 | ) | | | | | 0.44 | | | | | | 2.25 | |
| | | | | | | | | | | | | | | | | | | | | | | | | | | | |
| | | 1.82 | | | | | | 0.30 | | | | | | (0.58 | ) | | | | | 0.42 | | | | | | 2.25 | |
| | | | | | | | | | | | | | | | | | | | | | | | | | | | |
| | | | | | | | | |
| | | | | | | | | | | | | | | | | | | | | | | | | | | | | |
| | | (0.12 | ) | | | | | — | | | | | | — | | | | | | — | | | | | | (0.04 | ) |
| | | | | | | | | | | | | | | | | | | | | | | | | | | | |
| | | (0.12 | ) | | | | | — | | | | | | — | | | | | | — | | | | | | (0.04 | ) |
| | | | | | | | | | | | | | | | | | | | | | | | | | | | |
| | | | | | | | | |
| | | $ 12.90 | | | | | | $ 11.20 | | | | | | $ 10.90 | | | | | | $ 11.48 | | | | | | $ 11.06 | |
| | | | | | | | | | | | | | | | | | | | | | | | | | | | |
| | | | | | | | | |
| | | 16.37% | | | | | | 2.75% | | | | | | (5.05% | ) | | | | | 3.80% | | | | | | 25.48% | |
| | | | | | | | | |
| | | | | | | | | | | | | | | | | | | | | | | | | | | | | |
| | | $ 4,210 | | | | | | $ 4,116 | | | | | | $ 4,601 | | | | | | $ 5,361 | | | | | | $ 5,882 | |
| | | 2.30% | | | | | | 2.30% | | | | | | 2.39% | | | | | | 2.30% | | | | | | 2.30% | |
| | | 2.77% | | | | | | 2.63% | | | | | | 2.64% | | | | | | 2.55% | | | | | | 2.53% | |
| | | 0.41% | | | | | | 0.26% | | | | | | (0.04% | ) | | | | | (0.17% | ) | | | | | 0.00% | 5 |
| | | (0.06% | ) | | | | | (0.06% | ) | | | | | (0.29% | ) | | | | | (0.43% | ) | | | | | (0.23% | ) |
| | | 12% | | | | | | 12% | | | | | | 14% | | | | | | 43% | | | | | | 27% | |
| | | | | | | | | | | | | | | | | | | | | | | | | | | | |
| |
69
Financial highlights
Delaware Global Value Fund Institutional Class
Selected data for each share of the Fund outstanding throughout each period were as follows:
|
|
Net asset value, beginning of period |
|
Income (loss) from investment operations: |
Net investment income1 |
Net realized and unrealized gain (loss) |
Total from investment operations |
|
Less dividends and distributions from: |
Net investment income |
Total dividends and distributions |
|
Net asset value, end of period |
|
Total return2 |
|
Ratios and supplemental data: |
Net assets, end of period (000 omitted) |
Ratio of expenses to average net assets |
Ratio of expenses to average net assets prior to fees waived3 |
Ratio of net investment income to average net assets |
Ratio of net investment income to average net assets prior to fees waived3 |
Portfolio turnover |
|
|
| 1 | The average shares outstanding method has been applied for per share information. |
| 2 | Total investment return is based on the change in net asset value of a share during the period and assumes reinvestment of dividends and distributions at net asset value. Total investment return during all of the periods shown reflects a waiver by the manager. Performance would have been lower had the waiver not been in effect. |
| 3 | Expenses paid indirectly were not material and had no impact on the ratios disclosed. Expenses paid indirectly for the year ended Nov. 30, 2017 are reflected on the “Statement of operations.” |
See accompanying notes, which are an integral part of the financial statements.
70
| | | | | | | | | | | | | | | | | | | | | | | | | | | | |
| | | Year ended | |
| | | | |
| | | 11/30/17 | | | | | 11/30/16 | | | | | 11/30/15 | | | | | 11/30/14 | | | | | 11/30/13 | |
| |
| | | $ 11.51 | | | | | | $ 11.21 | | | | | | $ 11.77 | | | | | | $ 11.32 | | | | | | $ 9.05 | |
| | | | | | | | | |
| | | | | | | | | | | | | | | | | | | | | | | | | | | | | |
| | | 0.18 | | | | | | 0.14 | | | | | | 0.11 | | | | | | 0.10 | | | | | | 0.10 | |
| | | 1.81 | | | | | | 0.27 | | | | | | (0.59 | ) | | | | | 0.45 | | | | | | 2.29 | |
| | | | | | | | | | | | | | | | | | | | | | | | | | | | |
| | | 1.99 | | | | | | 0.41 | | | | | | (0.48 | ) | | | | | 0.55 | | | | | | 2.39 | |
| | | | | | | | | | | | | | | | | | | | | | | | | | | | |
| | | | | | | | | |
| | | | | | | | | | | | | | | | | | | | | | | | | | | | | |
| | | (0.23 | ) | | | | | (0.11 | ) | | | | | (0.08 | ) | | | | | (0.10 | ) | | | | | (0.12 | ) |
| | | | | | | | | | | | | | | | | | | | | | | | | | | | |
| | | (0.23 | ) | | | | | (0.11 | ) | | | | | (0.08 | ) | | | | | (0.10 | ) | | | | | (0.12 | ) |
| | | | | | | | | | | | | | | | | | | | | | | | | | | | |
| | | | | | | | | |
| | | $ 13.27 | | | | | | $ 11.51 | | | | | | $ 11.21 | | | | | | $ 11.77 | | | | | | $ 11.32 | |
| | | | | | | | | | | | | | | | | | | | | | | | | | | | |
| | | | | | | | | |
| | | 17.53% | | | | | | 3.71% | | | | | | (4.09% | ) | | | | | 4.88% | | | | | | 26.75% | |
| | | | | | | | | |
| | | | | | | | | | | | | | | | | | | | | | | | | | | | | |
| | | $ 2,284 | | | | | | $ 1,614 | | | | | | $ 2,042 | | | | | | $ 2,348 | | | | | | $ 2,112 | |
| | | 1.30% | | | | | | 1.30% | | | | | | 1.39% | | | | | | 1.30% | | | | | | 1.30% | |
| | | 1.77% | | | | | | 1.63% | | | | | | 1.64% | | | | | | 1.55% | | | | | | 1.53% | |
| | | 1.41% | | | | | | 1.26% | | | | | | 0.96% | | | | | | 0.83% | | | | | | 1.00% | |
| | | 0.94% | | | | | | 0.94% | | | | | | 0.71% | | | | | | 0.57% | | | | | | 0.77% | |
| | | 12% | | | | | | 12% | | | | | | 14% | | | | | | 43% | | | | | | 27% | |
| | | | | | | | | | | | | | | | | | | | | | | | | | | | |
| |
71
Financial highlights
Delaware International Value Equity Fund Class A
Selected data for each share of the Fund outstanding throughout each period were as follows:
|
|
Net asset value, beginning of period |
|
Income (loss) from investment operations: |
Net investment income1 |
Net realized and unrealized gain (loss) |
Total from investment operations |
|
Less dividends and distributions from: |
Net investment income |
Total dividends and distributions |
|
Net asset value, end of period |
|
Total return2 |
|
Ratios and supplemental data: |
Net assets, end of period (000 omitted) |
Ratio of expenses to average net assets |
Ratio of expenses to average net assets prior to fees waived3 |
Ratio of net investment income to average net assets |
Ratio of net investment income to average net assets prior to fees waived3 |
Portfolio turnover |
|
|
| 1 | The average shares outstanding method has been applied for per share information. |
| 2 | Total investment return is based on the change in net asset value of a share during the period and assumes reinvestment of dividends and distributions at net asset value and does not reflect the impact of a sales charge. Total investment return during some of the periods shown reflects waivers by the manager and/or distributor. Performance would have been lower had the waivers not been in effect. |
| 3 | Expenses paid indirectly were not material and had no impact on the ratios disclosed. Expenses paid indirectly for the year ended Nov. 30, 2017 are reflected on the “Statements of operations.” |
See accompanying notes, which are an integral part of the financial statements.
72
| | | | | | | | | | | | | | | | | | | | | | | | | | | | |
| | | Year ended | |
| | | | |
| | | 11/30/17 | | | | | 11/30/16 | | | | | 11/30/15 | | | | | 11/30/14 | | | | | 11/30/13 | |
| |
| | | $ 12.94 | | | | | | $ 12.96 | | | | | | $ 13.53 | | | | | | $ 14.26 | | | | | | $ 11.59 | |
| | | | | | | | | |
| | | | | | | | | | | | | | | | | | | | | | | | | | | | | |
| | | 0.24 | | | | | | 0.19 | | | | | | 0.17 | | | | | | 0.27 | | | | | | 0.17 | |
| | | 2.75 | | | | | | (0.05 | ) | | | | | (0.47 | ) | | | | | (0.85 | ) | | | | | 2.65 | |
| | | | | | | | | | | | | | | | | | | | | | | | | | | | |
| | | 2.99 | | | | | | 0.14 | | | | | | (0.30 | ) | | | | | (0.58 | ) | | | | | 2.82 | |
| | | | | | | | | | | | | | | | | | | | | | | | | | | | |
| | | | | | | | | |
| | | | | | | | | | | | | | | | | | | | | | | | | | | | | |
| | | (0.27 | ) | | | | | (0.16 | ) | | | | | (0.27 | ) | | | | | (0.15 | ) | | | | | (0.15 | ) |
| | | | | | | | | | | | | | | | | | | | | | | | | | | | |
| | | (0.27 | ) | | | | | (0.16 | ) | | | | | (0.27 | ) | | | | | (0.15 | ) | | | | | (0.15 | ) |
| | | | | | | | | | | | | | | | | | | | | | | | | | | | |
| | | | | | | | | |
| | | $ 15.66 | | | | | | $ 12.94 | | | | | | $ 12.96 | | | | | | $ 13.53 | | | | | | $ 14.26 | |
| | | | | | | | | | | | | | | | | | | | | | | | | | | | |
| | | | | | | | | |
| | | 23.53% | | | | | | 1.15% | | | | | | (2.23% | ) | | | | | (4.13% | ) | | | | | 24.64% | |
| | | | | | | | | |
| | | | | | | | | | | | | | | | | | | | | | | | | | | | | |
| | | $ 68,412 | | | | | | $54,967 | | | | | | $66,785 | | | | | | $74,118 | | | | | | $104,289 | |
| | | 1.35% | | | | | | 1.36% | | | | | | 1.40% | | | | | | 1.42% | | | | | | 1.45% | |
| | | 1.35% | | | | | | 1.36% | | | | | | 1.40% | | | | | | 1.42% | | | | | | 1.51% | |
| | | 1.65% | | | | | | 1.50% | | | | | | 1.24% | | | | | | 1.85% | | | | | | 1.31% | |
| | | 1.65% | | | | | | 1.50% | | | | | | 1.24% | | | | | | 1.85% | | | | | | 1.25% | |
| | | 15% | | | | | | 13% | | | | | | 13% | | | | | | 26% | | | | | | 30% | |
| | | | | | | | | | | | | | | | | | | | | | | | | | | | |
| |
73
Financial highlights
Delaware International Value Equity Fund Class C
Selected data for each share of the Fund outstanding throughout each period were as follows:
|
|
Net asset value, beginning of period |
|
Income (loss) from investment operations: |
Net investment income1 |
Net realized and unrealized gain (loss) |
Total from investment operations |
|
Less dividends and distributions from: |
Net investment income |
Total dividends and distributions |
|
Net asset value, end of period |
|
Total return2 |
|
Ratios and supplemental data: |
Net assets, end of period (000 omitted) |
Ratio of expenses to average net assets |
Ratio of expenses to average net assets prior to fees waived3 |
Ratio of net investment income to average net assets |
Ratio of net investment income to average net assets prior to fees waived3 |
Portfolio turnover |
|
|
| 1 | The average shares outstanding method has been applied for per share information. |
| 2 | Total investment return is based on the change in net asset value of a share during the period and assumes reinvestment of dividends and distributions at net asset value and does not reflect the impact of a sales charge. Total investment return during some of the periods shown reflects a waiver by the manager. Performance would have been lower had the waiver not been in effect. |
| 3 | Expenses paid indirectly were not material and had no impact on the ratios disclosed. Expenses paid indirectly for the year ended Nov. 30, 2017 are reflected on the “Statements of operations.” |
See accompanying notes, which are an integral part of the financial statements.
74
| | | | | | | | | | | | | | | | | | | | | | | | | | | | |
| | | Year ended | |
| | | | |
| | | 11/30/17 | | | | | 11/30/16 | | | | | 11/30/15 | | | | | 11/30/14 | | | | | 11/30/13 | |
| |
| | | $ 12.69 | | | | | | $ 12.71 | | | | | | $ 13.27 | | | | | | $ 13.99 | | | | | | $ 11.38 | |
| | | | | | | | | |
| | | | | | | | | | | | | | | | | | | | | | | | | | | | | |
| | | 0.13 | | | | | | 0.09 | | | | | | 0.06 | | | | | | 0.16 | | | | | | 0.07 | |
| | | 2.72 | | | | | | (0.04 | ) | | | | | (0.46 | ) | | | | | (0.83 | ) | | | | | 2.61 | |
| | | | | | | | | | | | | | | | | | | | | | | | | | | | |
| | | 2.85 | | | | | | 0.05 | | | | | | (0.40 | ) | | | | | (0.67 | ) | | | | | 2.68 | |
| | | | | | | | | | | | | | | | | | | | | | | | | | | | |
| | | | | | | | | |
| | | | | | | | | | | | | | | | | | | | | | | | | | | | | |
| | | (0.18 | ) | | | | | (0.07 | ) | | | | | (0.16 | ) | | | | | (0.05 | ) | | | | | (0.07 | ) |
| | | | | | | | | | | | | | | | | | | | | | | | | | | | |
| | | (0.18 | ) | | | | | (0.07 | ) | | | | | (0.16 | ) | | | | | (0.05 | ) | | | | | (0.07 | ) |
| | | | | | | | | | | | | | | | | | | | | | | | | | | | |
| | | | | | | | | |
| | | $ 15.36 | | | | | | $ 12.69 | | | | | | $ 12.71 | | | | | | $ 13.27 | | | | | | $ 13.99 | |
| | | | | | | | | | | | | | | | | | | | | | | | | | | | |
| | | | | | | | | |
| | | 22.71% | | | | | | 0.36% | | | | | | (2.99% | ) | | | | | (4.80% | ) | | | | | 23.60% | |
| | | | | | | | | |
| | | | | | | | | | | | | | | | | | | | | | | | | | | | | |
| | | $ 21,505 | | | | | | $21,672 | | | | | | $26,402 | | | | | | $28,609 | | | | | | $ 33,566 | |
| | | 2.10% | | | | | | 2.11% | | | | | | 2.15% | | | | | | 2.17% | | | | | | 2.20% | |
| | | 2.10% | | | | | | 2.11% | | | | | | 2.15% | | | | | | 2.17% | | | | | | 2.22% | |
| | | 0.90% | | | | | | 0.75% | | | | | | 0.49% | | | | | | 1.10% | | | | | | 0.56% | |
| | | 0.90% | | | | | | 0.75% | | | | | | 0.49% | | | | | | 1.10% | | | | | | 0.54% | |
| | | 15% | | | | | | 13% | | | | | | 13% | | | | | | 26% | | | | | | 30% | |
| | | | | | | | | | | | | | | | | | | | | | | | | | | | |
| |
75
Financial highlights
Delaware International Value Equity Fund Class R
Selected data for each share of the Fund outstanding throughout each period were as follows:
|
|
Net asset value, beginning of period |
|
Income (loss) from investment operations: |
Net investment income1 |
Net realized and unrealized gain (loss) |
Total from investment operations |
|
Less dividends and distributions from: |
Net investment income |
Total dividends and distributions |
|
Net asset value, end of period |
|
Total return2 |
|
Ratios and supplemental data: |
Net assets, end of period (000 omitted) |
Ratio of expenses to average net assets |
Ratio of expenses to average net assets prior to fees waived3 |
Ratio of net investment income to average net assets |
Ratio of net investment income to average net assets prior to fees waived3 |
Portfolio turnover |
|
|
| 1 | The average shares outstanding method has been applied for per share information. |
| 2 | Total investment return is based on the change in net asset value of a share during the period and assumes reinvestment of dividends and distributions at net asset value. Total investment return during some of the periods shown reflects waivers by the manager and/or distributor. Performance would have been lower had the waivers not been in effect. |
| 3 | Expenses paid indirectly were not material and had no impact on the ratios disclosed. Expenses paid indirectly for the year ended Nov. 30, 2017 are reflected on the “Statements of operations.” |
See accompanying notes, which are an integral part of the financial statements.
76
| | | | | | | | | | | | | | | | | | | | | | | | | | | | |
| | | Year ended | |
| | | | |
| | | 11/30/17 | | | | | 11/30/16 | | | | | 11/30/15 | | | | | 11/30/14 | | | | | 11/30/13 | |
| |
| | | $ 12.88 | | | | | | $ 12.90 | | | | | | $ 13.47 | | | | | | $ 14.20 | | | | | | $ 11.54 | |
| | | | | | | | | |
| | | | | | | | | | | | | | | | | | | | | | | | | | | | | |
| | | 0.20 | | | | | | 0.16 | | | | | | 0.13 | | | | | | 0.23 | | | | | | 0.14 | |
| | | 2.75 | | | | | | (0.05 | ) | | | | | (0.47 | ) | | | | | (0.85 | ) | | | | | 2.65 | |
| | | | | | | | | | | | | | | | | | | | | | | | | | | | |
| | | 2.95 | | | | | | 0.11 | | | | | | (0.34 | ) | | | | | (0.62 | ) | | | | | 2.79 | |
| | | | | | | | | | | | | | | | | | | | | | | | | | | | |
| | | | | | | | | |
| | | | | | | | | | | | | | | | | | | | | | | | | | | | | |
| | | (0.24 | ) | | | | | (0.13 | ) | | | | | (0.23 | ) | | | | | (0.11 | ) | | | | | (0.13 | ) |
| | | | | | | | | | | | | | | | | | | | | | | | | | | | |
| | | (0.24 | ) | | | | | (0.13 | ) | | | | | (0.23 | ) | | | | | (0.11 | ) | | | | | (0.13 | ) |
| | | | | | | | | | | | | | | | | | | | | | | | | | | | |
| | | | | | | | | |
| | | $ 15.59 | | | | | | $ 12.88 | | | | | | $ 12.90 | | | | | | $ 13.47 | | | | | | $ 14.20 | |
| | | | | | | | | | | | | | | | | | | | | | | | | | | | |
| | | | | | | | | |
| | | 23.26% | | | | | | 0.88% | | | | | | (2.50% | ) | | | | | (4.37% | ) | | | | | 24.28% | |
| | | | | | | | | |
| | | | | | | | | | | | | | | | | | | | | | | | | | | | | |
| | | $ 3,440 | | | | | | $ 1,578 | | | | | | $ 1,449 | | | | | | $ 2,317 | | | | | | $ 2,898 | |
| | | 1.60% | | | | | | 1.61% | | | | | | 1.65% | | | | | | 1.67% | | | | | | 1.70% | |
| | | 1.60% | | | | | | 1.61% | | | | | | 1.65% | | | | | | 1.67% | | | | | | 1.80% | |
| | | 1.40% | | | | | | 1.25% | | | | | | 0.99% | | | | | | 1.60% | | | | | | 1.06% | |
| | | 1.40% | | | | | | 1.25% | | | | | | 0.99% | | | | | | 1.60% | | | | | | 0.96% | |
| | | 15% | | | | | | 13% | | | | | | 13% | | | | | | 26% | | | | | | 30% | |
| | | | | | | | | | | | | | | | | | | | | | | | | | | | |
| |
77
Financial highlights
Delaware International Value Equity Fund Institutional Class
Selected data for each share of the Fund outstanding throughout each period were as follows:
|
|
Net asset value, beginning of period |
|
Income (loss) from investment operations: |
Net investment income1 |
Net realized and unrealized gain (loss) |
Total from investment operations |
|
Less dividends and distributions from: |
Net investment income |
Total dividends and distributions |
|
Net asset value, end of period |
|
Total return2 |
|
Ratios and supplemental data: |
Net assets, end of period (000 omitted) |
Ratio of expenses to average net assets |
Ratio of expenses to average net assets prior to fees waived3 |
Ratio of net investment income to average net assets |
Ratio of net investment income to average net assets prior to fees waived3 |
Portfolio turnover |
|
| 1 | The average shares outstanding method has been applied for per share information. |
| 2 | Total investment return is based on the change in net asset value of a share during the period and assumes reinvestment of dividends and distributions at net asset value. Total investment return during some of the periods shown reflects a waiver by the manager. Performance would have been lower had the waiver not been in effect. |
| 3 | Expenses paid indirectly were not material and had no impact on the ratios disclosed. Expenses paid indirectly for the year ended Nov. 30, 2017 are reflected on the “Statements of operations.” |
See accompanying notes, which are an integral part of the financial statements.
78
| | | | | | | | | | | | | | | | | | | | | | | | | | | | |
| | | Year ended | |
| | | | |
| | | 11/30/17 | | | | | 11/30/16 | | | | | 11/30/15 | | | | | 11/30/14 | | | | | 11/30/13 | |
| |
| | | $ 13.00 | | | | | | $ 13.02 | | | | | | $ 13.60 | | | | | | $ 14.33 | | | | | | $ 11.65 | |
| | | | | | | | | |
| | | | | | | | | | | | | | | | | | | | | | | | | | | | | |
| | | 0.28 | | | | | | 0.22 | | | | | | 0.20 | | | | | | 0.30 | | | | | | 0.20 | |
| | | 2.76 | | | | | | (0.04 | ) | | | | | (0.48 | ) | | | | | (0.85 | ) | | | | | 2.66 | |
| | | | | | | | | | | | | | | | | | | | | | | | | | | | |
| | | 3.04 | | | | | | 0.18 | | | | | | (0.28 | ) | | | | | (0.55 | ) | | | | | 2.86 | |
| | | | | | | | | | | | | | | | | | | | | | | | | | | | |
| | | | | | | | | |
| | | | | | | | | | | | | | | | | | | | | | | | | | | | | |
| | | (0.30 | ) | | | | | (0.20 | ) | | | | | (0.30 | ) | | | | | (0.18 | ) | | | | | (0.18 | ) |
| | | | | | | | | | | | | | | | | | | | | | | | | | | | |
| | | (0.30 | ) | | | | | (0.20 | ) | | | | | (0.30 | ) | | | | | (0.18 | ) | | | | | (0.18 | ) |
| | | | | | | | | | | | | | | | | | | | | | | | | | | | |
| | | | | | | | | |
| | | $ 15.74 | | | | | | $ 13.00 | | | | | | $ 13.02 | | | | | | $ 13.60 | | | | | | $ 14.33 | |
| | | | | | | | | | | | | | | | | | | | | | | | | | | | |
| | | | | | | | | |
| | | 23.87% | | | | | | 1.41% | | | | | | (2.03% | ) | | | | | (3.88% | ) | | | | | 24.91% | |
| | | | | | | | | |
| | | | | | | | | | | | | | | | | | | | | | | | | | | | | |
| | | $226,644 | | | | | | $165,361 | | | | | | $161,468 | | | | | | $181,828 | | | | | | $178,614 | |
| | | 1.10% | | | | | | 1.11% | | | | | | 1.15% | | | | | | 1.17% | | | | | | 1.20% | |
| | | 1.10% | | | | | | 1.11% | | | | | | 1.15% | | | | | | 1.17% | | | | | | 1.22% | |
| | | 1.90% | | | | | | 1.75% | | | | | | 1.49% | | | | | | 2.10% | | | | | | 1.56% | |
| | | 1.90% | | | | | | 1.75% | | | | | | 1.49% | | | | | | 2.10% | | | | | | 1.54% | |
| | | 15% | | | | | | 13% | | | | | | 13% | | | | | | 26% | | | | | | 30% | |
| |
79
Notes to financial statements
| | |
| Delaware International Funds | | November 30, 2017 |
Delaware Group® Global & International Funds (Trust) is organized as a Delaware statutory trust and offers four series: Delaware Emerging Markets Fund, Delaware International Small Cap Fund, Delaware Global Value Fund, and Delaware International Value Equity Fund. These financial statements and the related notes pertain to Delaware Emerging Markets Fund, Delaware Global Value Fund, and Delaware International Value Equity Fund (each, a Fund or collectively, the Funds). The Trust is an open-end investment company. Each Fund is considered diversified under the Investment Company Act of 1940, as amended, (1940 Act), and offers Class A, Class C, Class R, and Institutional Class shares. Emerging Markets Fund also offers Class R6 shares. As of Nov. 30, 2017, Delaware Global Value Fund has not commenced operations of its Class R shares. Class A shares are sold with a maximum front-end sales charge of 5.75%. Class A share purchases of $1,000,000 or more will incur a contingent deferred sales charge (CDSC) instead of a front-end sales charge of 1.00% if redeemed during the first year, and 0.50% during the second year, provided that Delaware Distributors, L.P. (DDLP) paid a financial advisor a commission on the purchase of those shares. Class C shares are sold with a CDSC of 1.00%, if redeemed during the first 12 months. Class R, Institutional Class, and Class R6 shares are not subject to a sales charge and are offered for sale exclusively to certain eligible investors. In addition, Class R6 shares do not pay any service fees, sub-accounting fees, and/or sub-transfer agency fees to any brokers, dealers, or other financial intermediaries.
The investment objective of Delaware Emerging Markets Fund and Delaware Global Value Fund is to seek long-term capital appreciation.
The investment objective of Delaware International Value Equity Fund is to seek long-term growth without undue risk to principal.
1. Significant Accounting Policies
The following accounting policies are in accordance with US generally accepted accounting principles (US GAAP) and are consistently followed by the Funds.
Security Valuation – Equity securities and exchange-traded funds (ETFs), except those traded on the Nasdaq Stock Market LLC (Nasdaq), are valued at the last quoted sales price as of the time of the regular close of the New York Stock Exchange on the valuation date. Equity securities and ETFs traded on the Nasdaq are valued in accordance with the Nasdaq Official Closing Price, which may not be the last sales price. If, on a particular day, an equity security or ETF does not trade, the mean between the bid and ask prices will be used, which approximates fair value. Equity securities listed on a foreign exchange are normally valued at the last quoted sales price on the valuation date. US government and agency securities are valued at the mean between the bid and ask prices, which approximates fair value. Foreign currency exchange contracts and foreign cross currency exchange contracts are valued at the mean between the bid and ask prices, which approximates fair value. Interpolated values are derived when the settlement date of the contract is an interim date for which quotations are not available. Generally, other securities and assets for which market quotations are not readily available are valued at fair value as determined in good faith under the direction of the Trust’s Board of Trustees (Board). In determining whether market quotations are readily available or fair valuation will be used, various factors will be taken into consideration, such as market closures or suspension of trading in a security. The Funds may use fair value pricing more frequently for securities traded primarily in non-US markets because, among other things, most foreign markets close well before the Funds value their securities,
80
generally as of 4:00pm Eastern time. The earlier close of these foreign markets gives rise to the possibility that significant events, including broad market moves, government actions or pronouncements, aftermarket trading, or news events may have occurred in the interim. Whenever such a significant event occurs, the Funds may value foreign securities using fair value prices based on third-party vendor modeling tools (international fair value pricing). The foregoing valuation policies apply to restricted and unrestricted securities.
Federal and Foreign Income Taxes – No provision for federal income taxes has been made as each Fund intends to continue to qualify for federal income tax purposes as a regulated investment company under Subchapter M of the Internal Revenue Code of 1986, as amended, and make the requisite distributions to shareholders. Each Fund evaluates tax positions taken or expected to be taken in the course of preparing each Fund’s tax returns to determine whether the tax positions are “more-likely-than-not” of being sustained by the applicable tax authority. Tax positions not deemed to meet the “more-likely-than-not” threshold are recorded as a tax benefit or expense in the current year. Management has analyzed each Fund’s tax positions taken or to be taken on each Fund’s federal income tax returns through the year ended Nov. 30, 2017 and for all open tax years (years ended Nov. 30, 2014–Nov. 30, 2016), and has concluded that no provision for federal income tax is required in any Fund’s financial statements. If applicable, the Funds recognize interest accrued on unrecognized tax benefits in interest expense and penalties in other expenses on the “Statements of operations.” During the year ended Nov. 30, 2017, the Funds did not incur any interest or tax penalties. In regard to foreign taxes only, each Fund has open tax years in certain foreign countries in which it invests that may date back to the inception of each Fund.
Class Accounting – Investment income, common expenses, and realized and unrealized gain (loss) on investments are allocated to the various classes of each Fund on the basis of daily net assets of each class. Distribution expenses relating to a specific class are charged directly to that class. Class R6 shares will not be allocated any expenses related to service fees, sub-accounting fees, and/or sub-transfer agency fees paid to brokers, dealers, or other financial intermediaries.
Underlying Funds – The Funds may invest in other investment companies (Underlying Funds) to the extent permitted by the 1940 Act. The Underlying Funds in which the Funds invest include ETFs. A Fund will indirectly bear the investment management fees and other expenses of the Underlying Funds.
Repurchase Agreements – Each Fund may purchase certain US government securities subject to the counterparty’s agreement to repurchase them at an agreed upon date and price. The counterparty will be required on a daily basis to maintain the value of the collateral subject to the agreement at not less than the repurchase price (including accrued interest). The agreements are conditioned upon the collateral being deposited under the Federal Reserve book-entry system with each Fund’s custodian or a third-party sub-custodian. In the event of default or bankruptcy by the other party to the agreement, retention of the collateral may be subject to legal proceedings. All open repurchase agreements as of the date of this report were entered into on Nov. 30, 2017, and matured on the next business day.
Foreign Currency Transactions – Transactions denominated in foreign currencies are recorded at the prevailing exchange rates on the valuation date in accordance with each Fund’s prospectus. The value of all assets and liabilities denominated in foreign currencies is translated daily into US dollars at the exchange rate of such currencies against the US dollar. Transaction gains or losses resulting from
81
Notes to financial statements
Delaware International Funds
1. Significant Accounting Policies (continued)
changes in exchange rates during the reporting period or upon settlement of the foreign currency transaction are reported in operations for the current period. The Funds generally do not bifurcate that portion of realized gains and losses on investments which is due to changes in foreign exchange rates from that which is due to changes in market prices. These gains and losses are included on the “Statements of operations” under “Net realized and unrealized gain (loss) on investments.” Each Fund reports certain foreign currency related transactions as components of realized gains (losses) for financial reporting purposes, whereas such components are treated as ordinary income (loss) for federal income tax purposes.
Use of Estimates – Each Fund is an investment company, whose financial statements are prepared in conformity with US GAAP. Therefore, each Fund follows the accounting and reporting guidelines for investment companies. The preparation of financial statements in conformity with US GAAP requires management to make estimates and assumptions that affect the fair value of investments, the reported amounts of assets and liabilities and disclosure of contingent assets and liabilities at the date of the financial statements, and the reported amounts of revenues and expenses during the reporting period. Actual results could differ from those estimates and the differences could be material.
Other – Expenses directly attributable to a Fund are charged directly to the Fund. Other expenses common to various funds within the Delaware FundsSM by Macquarie (Delaware Funds) are generally allocated among such funds on the basis of average net assets. Management fees and certain other expenses are paid monthly. Security transactions are recorded on the date the securities are purchased or sold (trade date) for financial reporting purposes. Costs used in calculating realized gains and losses on the sale of investment securities are those of the specific securities sold. Dividend income is recorded on the ex-dividend date and interest income is recorded on the accrual basis. Discounts and premiums on debt securities are accreted or amortized to interest income, respectively, over the lives of the respective securities using the effective interest method. Taxable non-cash dividends are recorded as dividend income. Foreign dividends are also recorded on the ex-dividend date or as soon after the ex-dividend date that a Fund is aware of such dividends, net of all tax withholdings, a portion of which may be reclaimable. Withholding taxes and reclaims on foreign dividends have been recorded in accordance with each Fund’s understanding of the applicable country’s tax rules and rates. Each Fund may pay foreign capital gains taxes on certain foreign securities held, which are reported as components of realized losses for financial reporting purposes, whereas such components are treated as ordinary loss for federal income tax purposes. Each Fund will accrue such taxes as applicable based upon current interpretations of the tax rules and regulations that exist in the markets in which it invests.
Each Fund declares and pays dividends from net investment income and distributions from net realized gain on investments, if any, annually. Each Fund may distribute more frequently, if necessary for tax purposes. Dividends and distributions, if any, are recorded on the ex-dividend date.
Each Fund receives earnings credits from its custodian when positive cash balances are maintained, which may be used to offset custody fees. The expenses paid under this arrangement are included on the “Statements of operations” under “Custodian fees” with the corresponding offset included under “Less expenses paid indirectly.” For the year ended Nov. 30, 2017, Delaware Global Value Fund and Delaware International Value Equity Fund earned $3 and $67, respectively, under this agreement.
82
Each Fund receives earnings credits from its transfer agent when positive cash balances are maintained, which may be used to offset transfer agent fees. If the amount earned is greater than $1, the expense paid under this arrangement is included on the “Statements of operations” under “Dividend disbursing and transfer agent fees and expenses” with the corresponding expense offset included under “Less expense paid indirectly.” For the year ended Nov. 30, 2017, each Fund earned the following amounts under this agreement:
| | | | |
Delaware Emerging
Markets Fund | | Delaware Global
Value Fund | | Delaware International
Value Equity Fund |
| $2,269 | | $97 | | $566 |
During the year ended Nov. 30, 2017, Delaware Emerging Markets Fund frequently maintained a negative cash balance with its custodian, which is considered a form of borrowing or leverage. If that Fund maintains a negative cash balance and the Fund’s investments decrease in value, the Fund’s losses will be greater than if the Fund did not maintain a negative cash balance. Each Fund is required to pay interest to the custodian on negative cash balances. During the year ended Nov. 30, 2017, Delaware Emerging Markets Fund had an average outstanding overdraft balance equal to 0.54% of its average net assets for which it was charged interest of $125,043, which is included on the “Statements of operations” under “Custodian fees.” The average borrowing rate charged on the overdraft was 1.36%.
2. Investment Management, Administration Agreements, and Other Transactions with Affiliates
In accordance with the terms of its respective Investment Management Agreement, each Fund pays Delaware Management Company (DMC), a series of Macquarie Investment Management Business Trust (formerly, Delaware Management Business Trust) and the investment manager, an annual fee which is calculated daily and paid monthly, based on each Fund’s average daily net assets as follows:
| | | | | | |
| | | Delaware Emerging
Markets Fund | | Delaware Global
Value Fund | | Delaware International
Value Equity Fund |
On the first $500 million | | 1.25% | | 0.85% | | 0.85% |
On the next $500 million | | 1.20% | | 0.80% | | 0.80% |
On the next $1.5 billion | | 1.15% | | 0.75% | | 0.75% |
In excess of $2.5 billion | | 1.10% | | 0.70% | | 0.70% |
DMC has contractually agreed to waive that portion, if any, of its management fee and/or pay/reimburse the Funds to the extent necessary to ensure that annual operating expenses (excluding any 12b-1 fees, acquired fund fees and expenses, taxes, interest, short sale dividend and interest expenses, brokerage fees, certain insurance costs, and nonroutine expenses or costs, including, but not limited to, those relating to reorganizations, litigation, conducting shareholder meetings, and liquidations), do not exceed specified percentages of average daily net assets of each Fund as shown on the next page. The expense waivers were in effect from Dec. 1, 2016 through Nov. 30, 2017.* For purposes of these waivers and reimbursements, nonroutine expenses may also include such additional costs and expenses as may be agreed upon from time to time by the Funds’ Board and DMC. These expense waivers and reimbursements apply only to expenses paid directly by the Funds and may only be terminated by agreement of DMC and the Funds.
83
Notes to financial statements
Delaware International Funds
2. Investment Management, Administration Agreements, and Other Transactions with Affiliates (continued)
| | | | | | |
| | | Delaware Emerging
Markets Fund | | Delaware Global
Value Fund | | Delaware International
Value Equity Fund |
Operating expense limitation as a percentage of average daily net assets (per annum) | | 1.45%1 | | 1.30% | | 1.20%2 |
1The expense limitation is 1.32% for Class R6 shares.
2The expense limitation was 1.21% for the period Dec. 1, 2016 through March 27, 2017.
Delaware Investments Fund Services Company (DIFSC), an affiliate of DMC, provides fund accounting and financial administration oversight services to each Fund. For these services, DIFSC’s fees were calculated daily and paid monthly based on the aggregate daily net assets of the Delaware Funds from Nov. 1, 2016 through Aug. 31, 2017 at the following annual rate: 0.0050% of the first $30 billion; 0.0045% of the next $10 billion; 0.0040% of the next $10 billion; and 0.0025% of aggregate average daily net assets in excess of $50 billion. The fees payable to DIFSC under the service agreement described above were allocated among all funds in the Delaware Funds on a relative net asset value (NAV) basis. Effective Sept. 1, 2017, the Funds entered into an amendment to the DIFSC agreement. Under the amendment to the DIFSC agreement, DIFSC’s fees are calculated daily and paid monthly based on the aggregate daily net assets of the Delaware Funds at the following annual rate: 0.00475% of the first $35 billion; 0.0040% of the next $10 billion; and 0.0025% of aggregate daily net assets in excess of $45 billion (Total Fee). Each Fund in the Delaware Funds pays a minimum of $4,000, which, in aggregate, is subtracted from the Total Fee. Each Fund in the Delaware Funds then pays its relative portion of the remainder of the Total Fee on a relative NAV basis. These amounts are included on the “Statements of operations” under “Accounting and administration expenses.” For the year ended Nov. 30, 2017, each Fund was charged for these services as follows:
| | | | | | |
| | | Delaware Emerging Markets Fund | | Delaware Global
Value Fund | | Delaware International
Value Equity Fund |
| | $150,152 | | $1,847 | | $13,618 |
DIFSC is also the transfer agent and dividend disbursing agent of each Fund. For these services, DIFSC’s fees are calculated daily and paid monthly based on the aggregate daily net assets of the retail funds within the Delaware Funds at the following annual rate: 0.025% of the first $20 billion; 0.020% of the next $5 billion; 0.015% of the next $5 billion; and 0.013% on average daily net assets in excess of $30 billion. The fees payable to DIFSC under the service agreement described above are allocated among all retail funds in the Delaware Funds on a relative NAV basis. These amounts are included on the “Statements of operations” under “Dividend disbursing and transfer agent fees and expenses.” For the year ended Nov. 30, 2017, each Fund was charged for these services as follows:
| | | | | | |
| | | Delaware Emerging
Markets Fund | | Delaware Global
Value Fund | | Delaware International
Value Equity Fund |
| | $679,092 | | $3,811 | | $56,825 |
84
Pursuant to a sub-transfer agency agreement between DIFSC and BNY Mellon Investment Servicing (US) Inc. (BNYMIS), BNYMIS provides certain sub-transfer agency services to the Funds. Sub-transfer agency fees are paid by the Funds and are also included on the “Statements of operations” under “Dividend disbursing and transfer agent fees and expenses.”
Pursuant to a distribution agreement and distribution plan, each Fund pays DDLP, the distributor and an affiliate of DMC, an annual distribution and service (12b-1) fee of 0.25% of the average daily net assets of the Class A shares, 1.00% of the average daily net assets of the Class C shares, and 0.50% of the average daily net assets of the Class R shares. The fees are calculated daily and paid monthly. Institutional Class and Class R6 shares pay no 12b-1 fees.
As provided in the investment management agreement, each Fund bears a portion of the cost of certain resources shared with DMC, including the cost of internal personnel of DMC and/or its affiliates that provide legal, tax, and regulatory reporting services to the Funds. These amounts are included on the “Statements of operations” under “Legal Fees.” For the year ended Nov. 30, 2017, each Fund was charged for internal legal, tax, and regulatory reporting services provided by DMC and/or its affiliates’ employees as follows:
| | | | | | |
| | | Delaware Emerging Markets Fund | | Delaware Global Value Fund | | Delaware International Value Equity Fund |
| | $68,239 | | $2,507 | | $7,209 |
For the year ended Nov. 30, 2017, DDLP earned commissions on sales of Class A shares for each Fund as follows:
| | | | | | |
| | | Delaware Emerging Markets Fund | | Delaware Global Value Fund | | Delaware International Value Equity Fund |
| | $159,634 | | $855 | | $14,743 |
For the year ended Nov. 30, 2017, DDLP received gross CDSC commissions on redemptions of each Fund’s Class A and Class C shares, and these commissions were entirely used to offset upfront commissions previously paid by DDLP to broker/dealers on sales of those shares. The amounts received were as follows:
| | | | | | |
| | | Delaware Emerging Markets Fund | | Delaware Global Value Fund | | Delaware International Value Equity Fund |
Class A | | $ 22 | | $290 | | $ 17 |
Class C | | 10,007 | | 8 | | 683 |
Trustees’ fees include expenses accrued by each Fund for each Trustee’s retainer and meeting fees. Certain officers of DMC, DIFSC, and DDLP are officers and/or Trustees of the Trust. These officers and Trustees are paid no compensation by the Funds.
Cross trades for the year ended Nov. 30, 2017, were executed by the Funds pursuant to procedures adopted by the Board designed to ensure compliance with Rule 17a-7 under the 1940 Act. Cross trading is the buying or selling of portfolio securities between funds of investment companies, or between a fund of an investment company and another entity, that are or could be considered affiliates by virtue of having a common investment advisor (or affiliated investment advisors), common directors/trustees and/or common officers. At its regularly scheduled meetings, the Board reviews such transactions for
85
Notes to financial statements
Delaware International Funds
2. Investment Management, Administration Agreements, and Other Transactions with Affiliates (continued)
compliance with the procedures adopted by the Board. Pursuant to these procedures, for the year ended Nov. 30, 2017, the Funds engaged in securities purchases and securities sales, which resulted in the following net realized gains (losses):
| | | | | | | | | | | | | | | |
| | | Purchases | | Sales | | Net realized gain (loss) |
Delaware Emerging Markets Fund | | | $ | 3,804,926 | | | | $ | — | | | | $ | — | |
Delaware Global Value Fund | | | | — | | | | | 16,217 | | | | | 1 | |
Delaware International Value Equity Fund | | | | — | | | | | 11,079,211 | | | | | 354 | |
* The aggregate contractual waiver period covering this report is from May 2, 2016 through March 28, 2018 for Delaware Emerging Markets Fund, and March 29, 2016 through March 28, 2018 for Delaware Global Value Fund and Delaware International Value Equity Fund.
3. Investments
For the year ended Nov. 30, 2017, each Fund made purchases and sales of investment securities other than short-term investments as follows:
| | | | | | | | | | | | | | | |
| | | Delaware Emerging
Markets Fund | | Delaware Global
Value Fund | | Delaware International
Value Equity Fund |
| | | | | | | | | | | | | | | |
Purchases | | | $ | 2,085,743,417 | | | | $ | 2,194,141 | | | | $ | 57,361,022 | |
Sales | | | | 376,439,246 | | | | | 4,055,674 | | | | | 41,465,164 | |
The tax cost of investments includes adjustments to net unrealized appreciation (depreciation) which may not necessarily be final tax cost basis adjustments, but approximates the tax basis unrealized gains and losses that may be realized and distributed to shareholders. At Nov. 30, 2017, the cost and unrealized appreciation (depreciation) of investments and derivatives for federal income tax purposes for each Fund were as follows:
| | | | | | | | | | | | | | | |
| | | Delaware Emerging
Markets Fund | | Delaware Global
Value Fund | | Delaware International
Value Equity Fund |
| | | | | | | | | | | | | | | |
Cost of investments and derivatives | | | $ | 4,124,549,323 | | | | $ | 15,118,065 | | | | $ | 273,433,956 | |
| | | | | | | | | | | | | | | |
Aggregate unrealized appreciation of investments and derivatives | | | $ | 1,020,401,999 | | | | $ | 5,833,830 | | | | $ | 82,567,027 | |
Aggregate unrealized depreciation of investments and derivatives | | | | (371,730,313 | ) | | | | (1,507,039 | ) | | | | (35,918,441 | ) |
| | | | | | | | | | | | | | | |
Net unrealized appreciation of investments and derivatives | | | $ | 648,671,686 | | | | $ | 4,326,791 | | | | $ | 46,648,586 | |
| | | | | | | | | | | | | | | |
86
US GAAP defines fair value as the price that each Fund would receive to sell an asset or pay to transfer a liability in an orderly transaction between market participants at the measurement date under current market conditions. A three-level hierarchy for fair value measurements has been established based upon the transparency of inputs to the valuation of an asset or liability. Inputs may be observable or unobservable and refer broadly to the assumptions that market participants would use in pricing the asset or liability. Observable inputs reflect the assumptions market participants would use in pricing the asset or liability based on market data obtained from sources independent of the reporting entity. Unobservable inputs reflect the reporting entity’s own assumptions about the assumptions that market participants would use in pricing the asset or liability based on the best information available under the circumstances. Each Fund’s investment in its entirety is assigned a level based upon the observability of the inputs which are significant to the overall valuation. The three-level hierarchy of inputs is summarized below.
| | |
| Level 1 – | | Inputs are quoted prices in active markets for identical investments. (Examples: equity securities, open-end investment companies, futures contracts, exchange-traded options contracts) |
| |
| Level 2 – | | Other observable inputs, including, but not limited to: quoted prices for similar assets or liabilities in markets that are active, quoted prices for identical or similar assets or liabilities in markets that are not active, inputs other than quoted prices that are observable for the assets or liabilities (such as interest rates, yield curves, volatilities, prepayment speeds, loss severities,credit risks, and default rates) or other market-corroborated inputs. (Examples: debt securities,government securities, swap contracts, foreign currency exchange contracts, foreign securities utilizing international fair value pricing, broker-quoted securities, fair valued securities) |
| |
| Level 3 – | | Significant unobservable inputs, including each Fund’s own assumptions used to determine the fair value of investments. (Examples: broker-quoted securities, fair valued securities) |
Level 3 investments are valued using significant unobservable inputs. Each Fund may also use an income-based valuation approach in which the anticipated future cash flows of the investment are discounted to calculate fair value. Discounts may also be applied due to the nature or duration of any restrictions on the disposition of the investments. Valuations may also be based upon current market prices of securities that are comparable in coupon, rating, maturity, and industry. The derived value of a Level 3 investment may not represent the value which is received upon disposition and this could impact the results of operations.
87
Notes to financial statements
Delaware International Funds
3. Investments (continued)
The following tables summarize the valuation of each Fund’s investments by fair value hierarchy levels as of Nov. 30, 2017:
| | | | | | | | | | | | | | | | |
| | | Delaware Emerging Markets Fund | |
Securities | | Level 1 | | | Level 2 | | | Level 3 | | | Total | |
Assets: | | | | | | | | | | | | | | | | |
Common Stock | | | | | | | | | | | | | | | | |
Argentina | | $ | 118,027,224 | | | $ | 800,491 | | | $ | — | | | $ | 118,827,715 | |
Bahrain | | | — | | | | 1,803,458 | | | | — | | | | 1,803,458 | |
Brazil | | | 458,177,403 | | | | — | | | | — | | | | 458,177,403 | |
Canada | | | 43,926,525 | | | | — | | | | — | | | | 43,926,525 | |
Chile | | | 32,482,672 | | | | — | | | | — | | | | 32,482,672 | |
China/Hong Kong | | | 843,265,999 | | | | 596,380,284 | | | | — | | | | 1,439,646,283 | |
Cyprus | | | 5,675,233 | | | | — | | | | — | | | | 5,675,233 | |
France | | | — | | | | 1,391,879 | | | | — | | | | 1,391,879 | |
India | | | 8,478,087 | | | | 368,115,999 | | | | — | | | | 376,594,086 | |
Indonesia | | | 8,942,087 | | | | 33,089,560 | | | | — | | | | 42,031,647 | |
Israel | | | 7,073,897 | | | | — | | | | — | | | | 7,073,897 | |
Japan | | | 34,143,048 | | | | — | | | | — | | | | 34,143,048 | |
Malaysia | | | — | | | | 4,368,441 | | | | — | | | | 4,368,441 | |
Mexico | | | 308,992,777 | | | | — | | | | — | | | | 308,992,777 | |
Netherlands | | | 17,298,068 | | | | — | | | | — | | | | 17,298,068 | |
Peru | | | 45,011,426 | | | | — | | | | — | | | | 45,011,426 | |
Republic of Korea | | | 215,708,658 | | | | 708,380,882 | | | | — | | | | 924,089,540 | |
Russia | | | 62,824,419 | | | | 227,690,667 | | | | — | | | | 290,515,086 | |
South Africa | | | 7,650,459 | | | | 8,551,499 | | | | — | | | | 16,201,958 | |
Taiwan | | | — | | | | 248,226,965 | | | | — | | | | 248,226,965 | |
Turkey | | | 19,726,188 | | | | 53,397,468 | | | | — | | | | 73,123,656 | |
United Kingdom | | | 3,490,477 | | | | — | | | | — | | | | 3,490,477 | |
United States | | | 103,277,900 | | | | — | | | | — | | | | 103,277,900 | |
Preferred Stock1 | | | 75,727,691 | | | | 78,128,533 | | | | — | | | | 153,856,224 | |
Exchange-Traded Funds | | | 22,995,945 | | | | — | | | | — | | | | 22,995,945 | |
Participation Notes | | | — | | | | — | | | | — | | | | — | |
| | | | | | | | | | | | | | | | |
Total Value of Securities | | $ | 2,442,896,183 | | | $ | 2,330,326,126 | | | $ | — | | | $ | 4,773,222,309 | |
| | | | | | | | | | | | | | | | |
Derivatives* | | | | | | | | | | | | | | | | |
Liabilities: | | | | | | | | | | | | | | | | |
Foreign Currency Exchange Contracts | | $ | — | | | $ | (1,300 | ) | | $ | — | | | $ | (1,300 | ) |
1Security type is valued across multiple levels. The amounts attributed to Level 1 investments and Level 2 investments represent 49.22% and 50.78%, respectively, of the total market value of this security type. Level 1 investments represent exchange traded investments and Level 2 investments represent investments with observable inputs.
*Foreign Currency Exchange Contracts are valued at the unrealized appreciation (depreciation) on the instrument at the year end.
88
| | | | | | | | | | | | |
| | | Delaware Global Value Fund | |
Securities | | Level 1 | | | Level 2 | | | Total | |
Assets: | | | | | | | | | | | | |
Common Stock | | | | | | | | | | | | |
Canada | | | 703,643 | | | | — | | | | 703,643 | |
France | | | — | | | | 1,847,909 | | | | 1,847,909 | |
Germany | | | — | | | | 320,231 | | | | 320,231 | |
Hong Kong | | | — | | | | 429,372 | | | | 429,372 | |
Indonesia | | | 348,008 | | | | — | | | | 348,008 | |
Italy | | | — | | | | 623,050 | | | | 623,050 | |
Japan | | | — | | | | 2,402,286 | | | | 2,402,286 | |
Netherlands | | | — | | | | 680,421 | | | | 680,421 | |
Republic of Korea | | | — | | | | 520,115 | | | | 520,115 | |
Russia | | | 186,090 | | | | — | | | | 186,090 | |
Sweden | | | — | | | | 216,056 | | | | 216,056 | |
Switzerland | | | — | | | | 309,640 | | | | 309,640 | |
United Kingdom | | | 332,726 | | | | 1,772,402 | | | | 2,105,128 | |
United States | | | 8,246,707 | | | | — | | | | 8,246,707 | |
Short-Term Investments | | | — | | | | 506,200 | | | | 506,200 | |
| | | | | | | | | | | | |
Total Value of Securities | | $ | 9,817,174 | | | $ | 9,627,682 | | | $ | 19,444,856 | |
| | | | | | | | | | | | |
89
Notes to financial statements
Delaware International Funds
3. Investments (continued)
| | | | | | | | | | | | |
| | | Delaware International Value Equity Fund | |
Securities | | Level 1 | | | Level 2 | | | Total | |
Assets: | | | | | | | | | | | | |
Common Stock | | | | | | | | | | | | |
Australia | | $ | — | | | $ | 1,275,225 | | | $ | 1,275,225 | |
Canada | | | 13,934,361 | | | | — | | | | 13,934,361 | |
China/Hong Kong | | | — | | | | 21,890,904 | | | | 21,890,904 | |
Denmark | | | — | | | | 7,129,632 | | | | 7,129,632 | |
France | | | — | | | | 61,962,134 | | | | 61,962,134 | |
Germany | | | — | | | | 17,053,128 | | | | 17,053,128 | |
Indonesia | | | 6,292,037 | | | | — | | | | 6,292,037 | |
Italy | | | — | | | | 10,696,675 | | | | 10,696,675 | |
Japan | | | — | | | | 71,051,629 | | | | 71,051,629 | |
Netherlands | | | — | | | | 16,829,024 | | | | 16,829,024 | |
Republic of Korea | | | — | | | | 11,903,815 | | | | 11,903,815 | |
Russia | | | 3,448,025 | | | | — | | | | 3,448,025 | |
Sweden | | | — | | | | 12,906,400 | | | | 12,906,400 | |
Switzerland | | | — | | | | 9,361,614 | | | | 9,361,614 | |
United Kingdom | | | 6,776,816 | | | | 31,980,856 | | | | 38,757,672 | |
Short-Term Investments | | | — | | | | 13,972,682 | | | | 13,972,682 | |
Securities Lending Collateral | | | — | | | | 1,617,585 | | | | 1,617,585 | |
| | | | | | | | | | | | |
Total Value of Securities | | $ | 30,451,239 | | | $ | 289,631,303 | | | $ | 320,082,542 | |
| | | | | | | | | | | | |
The securities that have been valued at zero on the “Schedules of investments” are considered to be Level 3 securities in these tables.
During the year ended Nov. 30, 2017, there were no transfers between Level 1 investments, Level 2 investments, or Level 3 investments that had a significant impact to each Fund. This does not include transfers between Level 1 investments and Level 2 investments due to each Fund utilizing international fair value pricing during the period. In accordance with the fair valuation procedures described in Note 1, international fair value pricing of securities in each Fund occurs when market volatility exceeds an established rolling threshold. If the threshold is exceeded on a given date, then prices of international securities (those that traded on exchanges that close at a different time than the time that each Fund’s NAV is determined) are established using a separate pricing feed from a third party vendor designed to establish a price for each such security as of the time that each Fund’s NAV is determined. Further, international fair value pricing uses other observable market-based inputs in place of the closing exchange price due to the events occurring after the close of the exchange or market on which the investment is principally traded, causing a change in classification between levels. Each Fund’s policy is to recognize transfers between levels based on fair value at the beginning of the reporting period.
90
A reconciliation of Level 3 investments is presented when a Fund has a significant amount of Level 3 investments at the beginning, interim, or end of the period in relation to the Fund’s net assets. Management has determined not to provide a reconciliation of Level 3 investments as the Level 3 investments were not considered significant to each Fund’s net assets at the beginning, interim, or end of the year. Management has determined not to provide additional disclosure on Level 3 inputs since the Level 3 investments are not considered significant to each Fund’s net assets at the end of the year.
During the year ended Nov. 30, 2017, Delaware Global Value Fund and Delaware International Value Equity Fund had no Level 3 investments.
4. Dividend and Distribution Information
Income and long-term capital gain distributions are determined in accordance with federal income tax regulations, which may differ from US GAAP. Additionally, distributions from net gains on foreign currency transactions and net short-term gains on sales of investment securities are treated as ordinary income for federal income tax purposes. The tax character of dividends and distributions paid during the years ended Nov. 30, 2017 and 2016 was as follows:
| | | | | | | | | | | | |
| | | Delaware Emerging
Markets Fund | | | Delaware Global
Value Fund | | | Delaware International
Value Equity Fund | |
Year ended Nov. 30, 2017 | | | | | | | | | | | | |
Ordinary income | | | $16,550,177 | | | | $291,253 | | | | $5,264,592 | |
| | | |
Year ended Nov. 30, 2016 | | | | | | | | | | | | |
Ordinary income | | | $ 3,245,216 | | | | $124,621 | | | | $3,420,608 | |
5. Components of Net Assets on a Tax Basis
As of Nov. 30, 2017, the components of net assets on a tax basis were as follows:
| | | | | | | | | | | | | | | | | | | | |
| | | Delaware Emerging
Markets Fund | | | Delaware Global
Value Fund | | | Delaware International
Value Equity Fund | |
Shares of beneficial interest | | | $4,081,445,848 | | | | $15,334,277 | | | | | | | | $281,303,661 | | | | | |
Undistributed ordinary income | | | 71,471,770 | | | | 206,857 | | | | | | | | 5,097,707 | | | | | |
Capital loss carryforwards | | | (60,461,277 | ) | | | (396,485 | ) | | | | | | | (13,049,321 | ) | | | | |
Unrealized appreciation (depreciation) of investments and foreign currencies | | | 648,671,686 | | | | 4,326,791 | | | | | | | | 46,648,586 | | | | | |
| | | | | | | | | | | | | | | | | | | | |
Net assets | | | $4,741,128,027 | | | | $19,471,440 | | | | | | | | $320,000,633 | | | | | |
| | | | | | | | | | | | | | | | | | | | |
The differences between book basis and tax basis components of net assets are primarily attributable to tax deferral of losses on wash sales, capital loss carryforwards, and tax recognition of unrealized gain on passive foreign investment companies.
91
Notes to financial statements
Delaware International Funds
For financial reporting purposes, capital accounts are adjusted to reflect the tax character of permanent book/tax differences. Reclassifications are primarily due to tax treatment of gain (loss) on foreign currency transactions, expiring capital loss carryforwards, and passive foreign investment companies. Results of operations and net assets were not affected by these reclassifications. For year ended Nov. 30, 2017, the Funds recorded the following reclassifications:
| | | | | | | | | | | | | | | | | | | | |
| | | Delaware Emerging
Markets Fund | | Delaware Global
Value Fund | | Delaware International
Value Equity Fund |
Undistributed net investment income | | | | $ 753,079 | | | | $ | 17,572 | | | | $ | 140,877 | | | | | | |
Accumulated net realized loss on investments | | | | (753,079 | ) | | | | 12,525,105 | | | | | 113,148,704 | | | | | | |
Paid in capital | | | | — | | | | | (12,542,677 | ) | | | | (113,289,581 | ) | | | | | |
For federal income tax purposes, capital loss carryforwards may be carried forward and applied against future capital gains.
In 2017, capital loss carryforwards expired as follows:
| | | | |
Delaware Global Value Fund | | | $ 12,542,677 | |
Delaware International Value Equity Fund | | | 113,289,581 | |
In 2017, the Funds utilized capital loss carryforwards as follows: | | | | |
Delaware Emerging Markets Fund | | | $19,389,507 | |
Under the Regulated Investment Company Modernization Act of 2010 (Act), net capital losses recognized for tax years beginning after Dec. 22, 2010 may be carried forward indefinitely, and their character is retained as short-term and/or long-term losses. Previously, net capital losses were carried forward for eight years and treated as short-term losses. As a transition rule, the Act requires that post-enactment net capital losses be used before pre-enactment net capital losses. Capital loss carryforwards available to offset future realized capital gains for the Funds are as follows:
| | | | | | | | | | | | | | | | | | | | |
| | | Pre-enactment capital loss Expiration date | | No expiration Post-enactment capital loss character | | |
| | | 2019 | | Short-term | | Long-term | | Total |
Delaware Emerging Markets Fund | | | $ | — | | | | $ | 31,046,490 | | | | $ | 29,414,787 | | | | $ | 60,461,277 | |
Delaware Global Value Fund | | | | — | | | | | — | | | | | 396,485 | | | | | 396,485 | |
Delaware International Value Equity Fund | | | | 8,738,476 | | | | | — | | | | | 4,310,845 | | | | | 13,049,321 | |
92
6. Capital Shares
Transactions in capital shares were as follows:
| | | | | | | | | | | | | | | | | | | | | | | | |
| | | Delaware Emerging
Markets Fund | | | Delaware Global
Value Fund | | | Delaware International
Value Equity Fund | |
| | | Year ended 11/30/17 | | | Year ended
11/30/16 | | | Year
ended
11/30/17 | | | Year
ended
11/30/16 | | | Year ended
11/30/17 | | | Year ended
11/30/16 | |
Shares sold: | | | | | | | | | | | | | | | | | | | | | | | | |
Class A | | | 13,346,314 | | | | 22,072,538 | | | | 81,858 | | | | 67,302 | | | | 1,196,983 | | | | 741,691 | |
Class C | | | 3,794,133 | | | | 894,709 | | | | 54,251 | | | | 30,520 | | | | 334,496 | | | | 137,781 | |
Class R | | | 1,492,045 | | | | 1,181,426 | | | | — | | | | — | | | | 157,796 | | | | 47,872 | |
Institutional Class | | | 141,062,624 | | | | 40,955,057 | | | | 76,454 | | | | 15,937 | | | | 4,644,421 | | | | 4,054,883 | |
Class R6 | | | 7,221,734 | | | | 19,949 | | | | — | | | | — | | | | — | | | | — | |
| | | | | | |
Shares issued upon reinvestment of dividends and distributions: | | | | | | | | | | | | | | | | | | | | | | | | |
Class A | | | 220,484 | | | | 6,537 | | | | 17,840 | | | | 9,275 | | | | 84,637 | | | | 65,407 | |
Class C | | | 6,850 | | | | — | | | | 3,917 | | | | — | | | | 22,347 | | | | 10,423 | |
Class R | | | 11,829 | | | | — | | | | — | | | | — | | | | 2,482 | | | | 1,279 | |
Institutional Class | | | 657,021 | | | | 200,093 | | | | 2,370 | | | | 1,614 | | | | 290,020 | | | | 191,191 | |
Class R6 | | | 938 | | | | — | | | | — | | | | — | | | | — | | | | — | |
| | | | | | | | | | | | | | | | | | | | | | | | |
| | | 167,813,972 | | | | 65,330,309 | | | | 236,690 | | | | 124,648 | | | | 6,733,182 | | | | 5,250,527 | |
| | | | | | | | | | | | | | | | | | | | | | | | |
| | | | | | |
Shares redeemed: | | | | | | | | | | | | | | | | | | | | | | | | |
Class A | | | (22,151,536 | ) | | | (11,845,045) | | | | (204,600 | ) | | | (285,311 | ) | | | (1,162,696 | ) | | | (1,712,335 | ) |
Class C | | | (2,489,522 | ) | | | (3,001,592 | ) | | | (99,255 | ) | | | (85,071 | ) | | | (663,928 | ) | | | (517,950 | ) |
Class R | | | (946,132 | ) | | | (568,075 | ) | | | — | | | | — | | | | (62,204 | ) | | | (38,932 | ) |
Institutional Class | | | (41,595,939 | ) | | | (46,678,696) | | | | (46,989 | ) | | | (59,402 | ) | | | (3,256,911 | ) | | | (3,926,023 | ) |
Class R6 | | | (329,177 | ) | | | (1,738 | ) | | | — | | | | — | | | | — | | | | — | |
| | | | | | | | | | | | | | | | | | | | | | | | |
| | | (67,512,306 | ) | | | (62,095,146 | ) | | | (350,844 | ) | | | (429,784 | ) | | | (5,145,739 | ) | | | (6,195,240 | ) |
| | | | | | | | | | | | | | | | | | | | | | | | |
Net increase (decrease) | | | 100,301,666 | | | | 3,235,163 | | | | (114,154 | ) | | | (305,136 | ) | | | 1,587,443 | | | | (944,713 | ) |
| | | | | | | | | | | | | | | | | | | | | | | | |
93
Notes to financial statements
Delaware International Funds
6. Capital Shares (continued)
For each Fund, certain shareholders may exchange shares of one class for shares of another class in the same Fund. For the years ended Nov. 30, 2017 and 2016, exchange transactions were as follows:
| | | | | | | | | | | | | | | | |
| | | | | | Year ended | | | | |
| | | | | | 11/30/17 | | |
| | | Exchange Redemptions | | |
| | | | | | | | | Institutional | | |
| | | Class A | | | Class C | | | Class | | |
| | | Shares | | | Shares | | | Shares | | |
Delaware Emerging Markets Fund | | | 11,513,880 | | | | 23,829 | | | | 3,511,618 | | |
Delaware Global Value Fund | | | 7,161 | | | | 7,565 | | | | — | | |
Delaware International Value Equity Fund | | | 181,758 | | | | 329,299 | | | | — | | |
| | |
| | | Exchange Subscriptions | | | | |
| | | | | | Institutional | | | | | | | |
| | | Class A | | | Class | | | Class R6 | | | | |
| | | Shares | | | Shares | | | Shares | | | Value | |
Delaware Emerging Markets Fund | | | 8,719 | | | | 11,447,912 | | | | 3,506,199 | | | $ | 293,875,364 | |
Delaware Global Value Fund | | | 236 | | | | 14,297 | | | | — | | | $ | 176,654 | |
Delaware International Value Equity Fund | | | 7,718 | | | | 496,658 | | | | — | | | $ | 6,956,220 | |
| | | | | | | | | | | | | | | | | | | | | | | | |
| | | | | | | | | Year ended | | | | | | | |
| | | | | | | | | 11/30/16 | | | | | | | |
| | | Exchange Redemptions | | | Exchange Subscriptions | |
| | | | | | | | | Institutional | | | | | | Institutional | | | | |
| | | Class A | | | Class C | | | Class | | | Class A | | | Class | | | | |
| | | Shares | | | Shares | | | Shares | | | Shares | | | Shares | | | Value | |
Delaware Emerging Markets Fund | | | 206,437 | | | | 9,708 | | | | 358 | | | | 361 | | | | 214,112 | | | $ | 2,932,645 | |
Delaware International Value Equity Fund | | | 385 | | | | 46,154 | | | | — | | | | — | | | | 45,659 | | | | 582,118 | |
These exchange transactions are included as subscriptions and redemptions in the tables on the previous page and the “Statements of changes in net assets.” For the year ended Nov. 30, 2016, Delaware Global Value Fund had no exchange transactions.
7. Line of Credit
Each Fund, along with certain other funds in the Delaware Funds (Participants), was a participant in a $155,000,000 revolving line of credit to be used for temporary or emergency purposes as an additional source of liquidity to fund redemptions of investor shares. Under the agreement, the Participants were
94
charged an annual commitment fee of 0.15%, which was generally allocated across the Participants based on a weighted average of the respective net assets of each Participant. The Participants were permitted to borrow up to a maximum of one-third of their net assets under the agreement. Each Participant was individually, and not jointly, liable for its particular advances, if any, under the line of credit. The line of credit available under the agreement expired on Nov. 6, 2017.
On Nov. 6, 2017, each Fund along with the other Participants, entered into an amendment to the agreement for a $155,000,000 revolving line of credit. The line of credit is to be used as described above and operates in substantially the same manner as the original agreement. Under the amendment to the agreement, the Participants are charged an annual commitment fee of 0.15%, which is generally allocated across the Participants based on a weighted average of the respective net assets of each Participant. The line of credit available under the agreement expires on Nov. 5, 2018.
The Funds had no amounts outstanding as of Nov. 30, 2017, or at any time during the year then ended.
8. Derivatives
US GAAP requires disclosures that enable investors to understand: (1) how and why an entity uses derivatives; (2) how they are accounted for; and (3) how they affect an entity’s results of operations and financial position.
Foreign Currency Exchange Contracts – Each Fund may enter into foreign currency exchange contracts and foreign cross currency exchange contracts as a way of managing foreign exchange rate risk. Each Fund may enter into these contracts to fix the US dollar value of a security that it has agreed to buy or sell for the period between the date the trade was entered into and the date the security is delivered and paid for. Each Fund may also use these contracts to hedge the US dollar value of securities it already owns that are denominated in foreign currencies. In addition, each Fund may enter into these contracts to facilitate or expedite the settlement of portfolio transactions. The change in value is recorded as an unrealized gain or loss. When the contract is closed, a realized gain or loss is recorded equal to the difference between the value of the contract at the time it was opened and the value at the time it was closed.
The use of foreign currency exchange contracts and foreign cross currency exchange contracts does not eliminate fluctuations in the underlying prices of the securities, but does establish a rate of exchange that can be achieved in the future. Although foreign currency exchange contracts and foreign cross currency exchange contracts limit the risk of loss due to an unfavorable change in the value of the hedged currency, they also limit any potential gain that might result should the value of the currency change favorably. In addition, each Fund could be exposed to risks if the counterparties to the contracts are unable to meet the terms of their contracts. Each Fund’s maximum risk of loss from counterparty credit risk is the value of its currency exchanged with the counterparty. The risk is generally mitigated by having a netting arrangement between each Fund and the counterparty and by the posting of collateral by the counterparty to the Fund to cover each Fund’s exposure to the counterparty.
During the year ended Nov. 30, 2017, Delaware Emerging Markets Fund entered into foreign currency exchange contracts and foreign cross currency exchange contracts to facilitate or expedite the settlement of portfolio transactions. Delaware Global Value Fund and Delaware International Value Equity Fund entered into foreign currency exchange contracts and foreign cross currency contracts in order to
95
Notes to financial statements
Delaware International Funds
8. Derivatives (continued)
fix the US dollar value of a security between the trade date and settlement date and to facilitate or expedite the settlement of portfolio transactions.
At Nov. 30, 2017, the Funds experienced net realized and unrealized gains or losses attributable to foreign currency holdings, which are disclosed on the “Statements of assets and liabilities” and “Statements of operations.”
Derivatives Generally. The table below summarizes the average balance of derivative holdings by each Fund during the year ended Nov. 30, 2017.
| | | | | | | | | | |
| | | | | Long Derivatives Volume | | |
| | | Delaware Emerging
Markets Fund | | | | Delaware Global
Value Fund | | | | Delaware International
Value Equity Fund |
Foreign currency exchange contracts (average cost) | | $2,184,286 | | | | $6,308 | | | | $214,669 |
| | | |
| | | | | Short Derivatives Volume | | |
| | | Delaware Emerging
Markets Fund | | | | Delaware Global
Value Fund | | | | Delaware International
Value Equity Fund |
Foreign currency exchange contracts (average cost) | | $58,054 | | | | $7,728 | | | | $160,417 |
9. Offsetting
Each Fund entered into an International Swaps and Derivatives Association, Inc. Master Agreement (ISDA Master Agreement) or a similar agreement with certain of their derivative contract counterparties in order to better define their contractual rights and to secure rights that will help each Fund mitigate its counterparty risk. An ISDA Master Agreement is a bilateral agreement between each Fund and a counterparty that governs certain over-the-counter (OTC) derivatives and foreign exchange contracts and typically contains, among other things, collateral posting items and netting provisions in the event of a default and/or termination event. Under an ISDA Master Agreement, each Fund may, under certain circumstances, offset with the counterparty certain derivative financial instruments’ payables and/or receivables with collateral held and/or posted and create one single net payment. The provisions of the ISDA Master Agreement typically permit a single net payment in the event of default (close-out), including the bankruptcy or insolvency of the counterparty. However, bankruptcy or insolvency laws of a particular jurisdiction may impose restrictions on or prohibitions against the right of offset in bankruptcy, insolvency, or other events.
For financial reporting purposes, the Funds do not offset derivative assets and derivative liabilities that are subject to netting arrangements on the “Statements of assets and liabilities.”
96
At Nov. 30, 2017, The Funds had the following assets and liabilities subject to offsetting provisions:
Offsetting of Financial Assets and Liabilities and Derivative Assets and Liabilities
| | | | | | |
| | | Delaware Emerging Markets Fund |
Counterparty | | Gross Value of
Derivative Asset | | Gross Value of
Derivative Liability | | Net Position |
BNY Mellon | | $— | | $(1,300) | | $(1,300) |
| | | | | | | | | | | | |
| | | | | Fair Value of Non-Cash Collateral Received | | | | Fair Value of Non-Cash Collateral Pledged | | | | |
Counterparty | | Net Position | | | Cash Collateral Received | | | Cash Collateral
Pledged | | Net
Exposure(a) |
BNY Mellon | | $(1,300) | | $— | | $— | | $— | | $— | | $(1,300) |
| | | | | | | | | | | | | | |
| | | Delaware Global Value Fund | | | |
| | | | | | Fair Value of Non-Cash Collateral Received(b) | | | | | | | |
Master Repurchase Agreements Counterparty | | Repurchase
Agreements | | | | Cash Collateral
Received | | Net Collateral
Received | | | Net Exposure(a) |
Bank of America Merrill Lynch | | $ | 52,804 | | | $ (52,804) | | $— | | | $ (52,804 | ) | | $— |
Bank of Montreal | | | 132,009 | | | (132,009) | | — | | | (132,009 | ) | | — |
BNP Paribas | | | 135,034 | | | (135,034) | | — | | | (135,034 | ) | | — |
Total | | $ | 319,847 | | | $(319,847) | | $— | | | $(319,847 | ) | | $— |
| | | | | | | | | | | | | | |
| | | Delaware International Value Equity Fund | | | |
| | | | | | Fair Value of Non-Cash Collateral Received(b) | | | | | | ` |
Master Repurchase Agreements Counterparty | | Repurchase
Agreements | | | | Cash Collateral
Received | | Net Collateral
Received | | Net Exposure(a) |
Bank of America Merrill Lynch | | | $1,519,743 | | | $(1,519,743) | | $— | | | $(1,519,743) | | | $— |
Bank of Montreal | | | 3,799,359 | | | (3,799,359) | | — | | | (3,799,359) | | | — |
BNP Paribas | | | 3,886,425 | | | (3,886,425) | | — | | | (3,886,425) | | | — |
Total | | | $9,205,527 | | | $(9,205,527) | | $— | | | $(9,205,527) | | | $— |
Securities Lending
Securities lending transactions are entered into by the Funds under Master Securities Lending Agreements (each, an “MSLA”) which provide the right, in the event of default (including bankruptcy or insolvency), for the non-defaulting party to liquidate the collateral and calculate a net exposure to the defaulting party or request additional collateral. In the event that a borrower defaults, the Funds, as lender, would offset the market value of the collateral received against the market value of the securities loaned. When the value of the collateral is greater than that of the market value of the securities loaned, the lender is left with a net amount payable to the defaulting party. However, bankruptcy or insolvency laws of a particular jurisdiction may impose restrictions on or prohibitions against such a right of offset in the event of an MSLA counterparty’s bankruptcy or insolvency. Under the MSLA, the borrower can resell or re-pledge the loaned securities, and the Funds can reinvest cash collateral, or, upon an event of default, resell or re-pledge the collateral (see also Note 10).
97
Notes to financial statements
Delaware International Funds
9. Offsetting (continued)
As of Nov. 30, 2017, the following tables are a summary of the Funds’ securities lending agreements by counterparty which are subject to offset under an MSLA:
| | | | | | | | |
| | | Delaware Global Value Fund | | |
Counterparty | | Securities
Loaned
at Value | | Cash Collateral
Received -
Invested in
Securities(b) | | Fair Value of Non-Cash
Collateral Received(b) | | Net Exposure(a) |
BNY Mellon | | $262,185 | | $— | | $(262,185) | | $— |
| | |
| | | Delaware International Value Equity Fund | | |
Counterparty | | Securities
Loaned at Value | | Cash Collateral
Received -
Invested in
Securities(b) | | Fair Value of Non-Cash
Collateral Received(b) | | Net Exposure(a) |
BNY Mellon | | $1,555,423 | | $(1,555,423) | | $— | | $— |
(a)Net exposure represents the receivable (payable) that would be due from (to) the counterparty in the event of default.
(b)The value of the related collateral received exceeded the value of the net position, repurchase agreements, and securities loaned at value, as applicable, as of Nov. 30, 2017.
10. Securities Lending
Each Fund, along with other funds in the Delaware Funds, may lend its securities pursuant to a security lending agreement (Lending Agreement) with The Bank of New York Mellon (BNY Mellon). At the time a security is loaned, the borrower must post collateral equal to the required percentage of the market value of the loaned security, including any accrued interest. The required percentage is: (1) 102% with respect to US securities and foreign securities that are denominated and payable in US dollars; and (2) 105% with respect to foreign securities. With respect to each loan, if on any business day the aggregate market value of securities collateral plus cash collateral held is less than the aggregate market value of the securities which are the subject of such loan, the borrower will be notified to provide additional collateral by the end of the following business day which, together with the collateral already held, will be not less than the applicable initial collateral requirements for such security loan. If the aggregate market value of securities collateral and cash collateral held with respect to a security loan exceeds the applicable initial collateral requirement, upon request of the borrower, BNY Mellon must return enough collateral to the borrower by the end of the following business day to reduce the value of the remaining collateral to the applicable initial collateral requirement for such security loan. As a result of the foregoing, the value of the collateral held with respect to a loaned security on any particular day may be more or less than the value of the security on loan. The collateral percentage with respect to the market value of the loaned security is determined by the security lending agent.
Cash collateral received by each fund of the Trust is generally invested in a series of individual separate accounts, each corresponding to a fund. The investment guidelines permit each separate account to hold certain securities that would be considered eligible securities for a money market fund. Cash collateral received is generally invested in government securities; certain obligations issued by
98
government sponsored enterprises; repurchase agreements collateralized by US Treasury securities; obligations issued by the central government of any Organization for Economic Cooperation and Development (OECD) country or its agencies, instrumentalities or establishments; obligations of supranational organizations, commercial paper, notes, bonds and other debt obligations; certificates of deposit, time deposits, and other bank obligations; and asset-backed securities as disclosed on the “Schedule of investments.” Securities purchased with cash collateral are valued at the market value. A Fund can also accept US government securities and letters of credit (non-cash collateral) in connection with securities loans.
In the event of default or bankruptcy by the lending agent, realization and/or retention of the collateral may be subject to legal proceedings. In the event the borrower fails to return loaned securities and the collateral received is insufficient to cover the value of the loaned securities and provided such collateral shortfall is not the result of investment losses, the lending agent has agreed to pay the amount of the shortfall to each Fund or, at the discretion of the lending agent, replace the loaned securities. Each Fund continues to record dividends or interest, as applicable, on the securities loaned and are subject to changes in value of the securities loaned that may occur during the term of the loan. Each Fund has the right under the Lending Agreement to recover the securities from the borrower on demand. With respect to security loans collateralized by non-cash collateral, each Fund receives loan premiums paid by the borrower. With respect to security loans collateralized by cash collateral, the earnings from the collateral investments are shared among each Fund, the security lending agent, and the borrower. Each Fund records security lending income net of allocations to the security lending agent and the borrower.
Each Fund may incur investment losses as a result of investing securities lending collateral. This could occur if an investment in the collateral investment account defaulted or became impaired. Under those circumstances, the value of each Fund’s cash collateral account may be less than the amount each Fund would be required to return to the borrowers of the securities and each Fund would be required to make up for this shortfall.
The following table reflects a breakdown of security lending collateral accounted for as secured borrowings, the gross obligation by the type of collateral pledged, and the remaining contractual maturity of those transactions as of Nov. 30, 2017:
| | | | | | | | | | | | | | | | | | | | |
| | | Remaining Contractual Maturity of the Agreements as of | | | | |
| | | Nov. 30, 2017 | | | | |
Securities Lending Collateral | | Overnight
and
Continuous | | | Under
30 days | | | Between
30 & 90 days | | | Over
90 days | | | Total | |
Delaware International Value Equity Fund | | | | | | | | | | | | | | | | | | | | |
Certificates of Deposit and Repurchase Agreements | | | $1,617,585 | | | | $— | | | | $— | | | | $— | | | | $1,617,585 | |
99
Notes to financial statements
Delaware International Funds
10. Securities Lending (continued)
At Nov. 30, 2017, the values of securities on loan and the values of invested collateral for each Fund are presented below, for which cash collateral was received and invested in accordance with the MSLA. These investments are presented on the “Schedules of investments” under the caption “Securities Lending Collateral.”
| | | | | | | | | | |
| | | Delaware Emerging
Markets Fund | | Delaware Global
Value Fund | | Delaware International
Value Equity Fund |
Values of securities on loan | | $— | | | $262,185 | | | | $1,555,423 | |
Values of non-cash collateral | | — | | | 273,008 | | | | — | |
Values of invested collateral | | — | | | — | | | | 1,617,585 | |
11. Credit and Market Risk
Delaware Emerging Markets Fund invests in the greater China region, which consists of Hong Kong, the People’s Republic of China, and Taiwan, among other countries. As a result, the Fund’s investments in the region are particularly susceptible to risks in that region. Adverse events in any one country within the region may impact the other countries in the region or Asia as a whole. As a result, adverse events in the region will generally have a greater effect on the Fund than if the Fund were more geographically diversified, which could result in greater volatility in the Fund’s net asset value and losses. Markets in the greater China region can experience significant volatility due to social, economic, regulatory, and political uncertainties.
Some countries in which the Funds may invest require governmental approval for the repatriation of investment income, capital, or the proceeds of sales of securities by foreign investors. In addition, if there is deterioration in a country’s balance of payments or for other reasons, a country may impose temporary restrictions on foreign capital remittances abroad.
The securities exchanges of certain foreign markets are substantially smaller, less liquid, and more volatile than the major securities markets in the US. Consequently, acquisition and disposition of securities by each Fund may be inhibited. In addition, a significant portion of the aggregate market value of equity securities listed on the major securities exchanges in emerging markets is held by a smaller number of investors. This may limit the number of shares available for acquisition or disposition by each Fund.
Each Fund may invest up to 15% of its net assets in illiquid securities, which may include securities with contractual restrictions on resale, securities exempt from registration under Rule 144A promulgated under the Securities Act of 1933, as amended, and other securities which may not be readily marketable. The relative illiquidity of these securities may impair each Fund from disposing of them in a timely manner and at a fair price when it is necessary or desirable to do so. While maintaining oversight, each Fund’s Board has delegated to DMC, the day-to-day functions of determining whether individual securities are liquid for purposes of each Fund’s limitation on investments in illiquid securities. Securities eligible for resale pursuant to Rule 144A, which are determined to be liquid, are not subject to each
100
Fund’s 15% limit on investments in illiquid securities. Rule 144A securities have been identified on the “Schedules of investments.”
12. Contractual Obligations
Each Fund enters into contracts in the normal course of business that contain a variety of indemnifications. Each Fund’s maximum exposure under these arrangements is unknown. However, the Funds have not had prior claims or losses pursuant to these contracts. Management has reviewed each Fund’s existing contracts and expects the risk of loss to be remote.
13. Recent Accounting Pronouncements
In October 2016, the Securities and Exchange Commission released its Final Rule on Investment Company Reporting Modernization (Rule). The Rule contains amendments to Regulation S-X which impact financial statement presentation, particularly the presentation of derivative investments. The financial statements presented are in compliance with the most recent Regulation S-X amendments.
14. Subsequent Events
Management has determined that no material events or transactions occurred subsequent to Nov. 30, 2017 that would require recognition or disclosure in the Funds’ financial statements.
101
Report of Independent
Registered Public Accounting Firm
To the Board of Trustees of Delaware Group® Global & International Funds and the Shareholders of the Funds, as defined
In our opinion, the accompanying statements of assets and liabilities, including the schedules of investments, and the related statements of operations and of changes in net assets and the financial highlights present fairly, in all material respects, the financial position of Delaware Emerging Markets Fund, Delaware Global Value Fund and Delaware International Value Equity Fund (three of the series constituting Delaware Group Global & International Funds, hereafter referred to as the “Funds”) as of November 30, 2017, the results of each of their operations for the year then ended, the changes in each of their net assets for each of the two years in the period then ended and the financial highlights for each of the periods indicated, in conformity with accounting principles generally accepted in the United States of America. These financial statements and financial highlights (hereafter referred to as “financial statements”) are the responsibility of the Funds’ management. Our responsibility is to express an opinion on these financial statements based on our audits. We conducted our audits of these financial statements in accordance with the standards of the Public Company Accounting Oversight Board (United States). Those standards require that we plan and perform the audit to obtain reasonable assurance about whether the financial statements are free of material misstatement. An audit includes examining, on a test basis, evidence supporting the amounts and disclosures in the financial statements, assessing the accounting principles used and significant estimates made by management, and evaluating the overall financial statement presentation. We believe that our audits, which included confirmation of securities as of November 30, 2017 by correspondence with the custodian and brokers, provide a reasonable basis for our opinion.
PricewaterhouseCoopers LLP
Philadelphia, Pennsylvania
January 18, 2018
102
Other Fund information (Unaudited)
Delaware International Funds
Tax Information
The information set forth below is for each Fund’s fiscal year as required by federal income tax laws. Shareholders, however, must report distributions on a calendar year basis for income tax purposes, which may include distributions for portions of two fiscal years of a fund. Accordingly, the information needed by shareholders for income tax purposes will be sent to them in January of each year. Please consult your tax advisor for proper treatment of this information.
All disclosures are based on financial information available as of the date of this annual report and, accordingly are subject to change. For any and all items requiring reporting, it is the intention of each Fund to report the maximum amount permitted under the Internal Revenue Code and the regulations thereunder.
For the fiscal year ended Nov. 30, 2017, each Fund reports distributions paid during the year as follows:
| | | | | | | | | | | | |
| | | (A)
Ordinary
Income
Distributions*
(Tax Basis) | | | Total
Distributions
(Tax Basis) | | | (B)
Qualifying
Dividends1 | |
Delaware Emerging Markets Fund | | | 100.00 | % | | | 100.00 | % | | | — | |
Delaware Global Value Fund | | | 100.00 | % | | | 100.00 | % | | | 60.17 | % |
Delaware International Value Equity Fund | | | 100.00 | % | | | 100.00 | % | | | — | |
| (A) | is based on a percentage of each Fund’s total distributions. |
(B) is based on a percentage of each Fund’s ordinary income distributions.
| 1 | Qualifying dividends represent dividends which qualify for the corporate dividends received deduction. |
| * | For the fiscal year ended Nov. 30, 2017, certain dividends paid by each Fund may be subject to a maximum tax rate of 20%. The percentage of dividends paid by each Fund from ordinary income reported as dividend income is listed below. Complete information will be computed and reported in conjunction with your 2017 Form 1099-DIV. |
| | | | | | | | |
Delaware Emerging
Markets Fund | | | | Delaware Global
Value Fund | | | | Delaware
International Value Equity Fund |
93.38% | | | | 100.00% | | | | 100.00% |
103
Other Fund information (Unaudited)
Delaware International Funds
Each Fund intends to pass through foreign tax credits in the maximum amount as follows:
| | | | | | | | |
Delaware Emerging
Markets Fund | | | | Delaware Global
Value Fund | | | | Delaware
International
Value Equity Fund |
| $4,612,576 | | | | $16,713 | | | | $510,429 |
The gross foreign source income earned during the fiscal year 2017 by each Fund was as follows:
| | | | | | | | |
Delaware Emerging
Markets Fund | | | | Delaware Global
Value Fund | | | | Delaware
International
Value Equity Fund |
| $100,325,254 | | | | $365,049 | | | | $9,341,237 |
Board consideration of Delaware Emerging Markets Fund, Delaware Global Value Fund, and Delaware International Value Equity Fund investment advisory agreements
At a meeting held on Aug. 16-17, 2017 (the “Annual Meeting”), the Board of Trustees (the “Board”), including a majority of disinterested or independent Trustees, approved the renewal of the Investment Advisory Agreements for Delaware Emerging Markets Fund, Delaware Global Value Fund, and Delaware International Value Equity Fund (each, a “Fund” and together, the “Funds”). In making its decision, the Board considered information furnished at regular quarterly Board meetings, including reports detailing Fund performance, investment strategies, and expenses, as well as information prepared specifically in connection with the renewal of the Investment Advisory Agreements. Information furnished specifically in connection with the renewal of the Investment Advisory Agreements with Delaware Management Company (“DMC”), a series of Macquarie Investment Management Business Trust (formerly, Delaware Management Business Trust), included materials provided by DMC and its affiliates concerning, among other things, the nature, extent, and quality of services provided to the Funds; the costs of such services to the Funds; economies of scale; and the investment manager’s financial condition and profitability. In addition, in connection with the Annual Meeting, reports were provided to the Trustees in May 2017 and included reports provided by Broadridge Financial Solutions (formerly Lipper) (“Broadridge” or “Lipper”). The Broadridge reports compared each Fund’s investment performance and expenses with those of other comparable mutual funds. The Independent Trustees reviewed and discussed the Broadridge reports with independent legal counsel to the Independent Trustees. In addition to the information noted above, the Board also requested and received information regarding DMC’s policy with respect to advisory fee levels and its breakpoint philosophy; the structure of portfolio manager compensation; comparative client fee information; and any constraints or limitations on the availability of securities for certain investment styles, which had in the past year inhibited, or which were likely in the future to inhibit, the investment manager’s ability to invest fully in accordance with Fund policies.
In considering information relating to the approval of each Fund’s Investment Advisory Agreement, the Independent Trustees received assistance and advice from and met separately with independent legal counsel to the Independent Trustees and also from an experienced and knowledgeable fund consultant, JDL Consultants, LLC (“JDL”). Although the Board gave attention to all information furnished, the following discussion identifies, under separate headings, the primary factors taken into account by the Board during its contract renewal considerations.
104
Nature, extent, and quality of service. The Board considered the services provided by DMC to the Funds and their shareholders. In reviewing the nature, extent, and quality of services, the Board considered reports furnished to it throughout the year, which covered matters such as the relative performance of the Funds; compliance of portfolio managers with the investment policies, strategies, and restrictions for the Funds; compliance by DMC and Delaware Distributors, L.P. (together, “Management”) personnel with the Code of Ethics adopted throughout the Delaware FundsSM by Macquarie (“Delaware Funds”); and adherence to fair value pricing procedures as established by the Board. The Board was pleased with the current staffing of the Funds’ investment advisor and the emphasis placed on research in the investment process. The Board recognized DMC’s receipt of certain industry distinctions during the past several years. The Board gave favorable consideration to DMC’s efforts to control expenditures while maintaining service levels committed to Fund matters. The Board also noted the benefits provided to Fund shareholders through each shareholder’s ability to exchange an investment in one Delaware Fund for the same class of shares in another Delaware Fund without a sales charge, to reinvest Fund dividends into additional shares of the Fund or into additional shares of other Delaware Funds and the privilege to combine holdings in other Delaware Funds to obtain a reduced sales charge. The Board was satisfied with the nature, extent, and quality of the overall services provided by DMC.
Investment performance. The Board placed significant emphasis on the investment performance of the Funds in view of the importance of investment performance to shareholders. Although the Board considered performance reports and discussions with portfolio managers at Investment Committee meetings throughout the year, the Board gave particular weight to the Broadridge reports furnished for the Annual Meeting. The Broadridge reports prepared for each Fund showed the investment performance of its Class A shares in comparison to a group of similar funds as selected by Broadridge (the “Performance Universe”). A fund with the best performance ranked first, and a fund with the poorest performance ranked last. The highest/best performing 25% of funds in the Performance Universe make up the first quartile; the next 25%, the second quartile; the next 25%, the third quartile; and the poorest/worst performing 25% of funds in the Performance Universe make up the fourth quartile. Comparative annualized performance for each Fund was shown for the past 1-, 3-, 5-, and 10-year periods, to the extent applicable, ended Jan. 31, 2017. The Board’s objective is that each Fund’s performance for the 1-, 3-, and 5-year periods considered be at or above the median of its Performance Universe.
Delaware Emerging Markets Fund – The Performance Universe for the Fund consisted of the Fund and all retail and institutional emerging markets funds as selected by Broadridge. The Broadridge report comparison showed that the Fund’s total return for the 1- and 5-year periods was in the first quartile of its Performance Universe. The report further showed that the Fund’s total return for the 3-year period was in the second quartile of its Performance Universe. The Board was satisfied with performance.
Delaware Global Value Fund – The Performance Universe for the Fund consisted of the Fund and all retail and institutional global multi-cap value funds as selected by Broadridge. The Broadridge report comparison showed that the Fund’s total return for the 1- and 3-year periods was in the third quartile of its Performance Universe. The report further showed that the Fund’s total return for the 5-year period was in the fourth quartile of its Performance Universe. The Board noted that the Fund’s performance was not in line with the Board’s objective. In evaluating the Fund’s performance, the Board considered the
105
Other Fund information (Unaudited)
Delaware International Funds
Board consideration of Delaware Emerging Markets Fund, Delaware Global Value Fund, and Delaware International Value Equity Fund investment advisory agreements (continued)
performance attribution included in the Meeting materials, as well as the numerous investment and performance reports delivered by Management personnel to the Board’s Investments Committee. The Board was satisfied that Management was taking action to improve Fund performance and meet the Board’s performance objective.
Delaware International Value Equity Fund – The Performance Universe for the Fund consisted of the Fund and all retail and institutional international multi-cap value funds as selected by Broadridge. The Broadridge report comparison showed that the Fund’s total return for the 1- and 3-year periods was in the second quartile of its Performance Universe. The report further showed that the Fund’s total return for the 5-year period was in the third quartile of its Performance Universe. The Board was satisfied with performance.
Comparative expenses. The Board considered expense data for the Delaware Funds. Management provided the Board with information on pricing levels and fee structures for each Fund as of its most recently completed fiscal year. The Board also focused on the comparative analysis of effective management fees and total expense ratios of each Fund versus effective management fees and total expense ratios of a group of similar funds as selected by Broadridge (the “Expense Group”). In reviewing comparative costs, each Fund’s contractual management fee and the actual management fee incurred by the Fund were compared with the contractual management fees (assuming all funds in the Expense Group were similar in size to the Fund) and actual management fees (as reported by each fund) within the Expense Group, taking into account any applicable breakpoints and fee waivers. Each Fund’s total expenses were also compared with those of its Expense Group. The Broadridge total expenses, for comparative consistency, were shown by Broadridge for Class A shares and comparative total expenses including 12b-1 and non-12b-1 service fees. The Board’s objective is to limit each Fund’s total expense ratio to be competitive with that of the Expense Group.
Delaware Emerging Markets Fund – The expense comparisons for the Fund showed that its actual management fee and total expenses were in the quartile with the highest expenses of its Expense Group. The Board noted that the Fund’s management fee and total expenses were not in line with the Board’s objective. In evaluating total expenses, the Board considered fee waivers in place through March 28, 2018 and various initiatives implemented by Management, such as the negotiation of lower fees for fund accounting, fund accounting oversight and custody services, which had created an opportunity for a further reduction in expenses. The Board was satisfied with Management’s efforts to improve the Fund’s total expense ratio and to bring it in line with the Board’s objective.
Delaware Global Value Fund – The expense comparisons for the Fund showed that its actual management fee was in the quartile with the lowest expenses of its Expense Group and its total expenses were in the quartile with the highest expenses of its Expense Group. The Board gave favorable consideration to the Fund’s management fee, but noted that the Fund’s total expenses were not in line with the Board’s objective. In evaluating total expenses, the Board considered fee waivers in place through March 28, 2018 and various initiatives implemented by Management, such as the negotiation of lower fees for fund accounting, fund accounting oversight and custody services, which had created an
106
opportunity for a further reduction in expenses. The Board was satisfied with Management’s efforts to improve the Fund’s total expense ratio and to bring it in line with the Board’s objective.
Delaware International Value Equity Fund – The expense comparisons for the Fund showed that its actual management fee and total expenses were in the quartile with the second highest expenses of its Expense Group. The Board noted that the Fund’s management fee and total expenses were not in line with the Board’s objective. In evaluating total expenses, the Board considered fee waivers in place through March 28, 2018 and various initiatives implemented by Management, such as the negotiation of lower fees for fund accounting, fund accounting oversight, and custody services, which had created an opportunity for a further reduction in expenses. The Board was satisfied with Management’s efforts to improve the Fund’s total expense ratio and to bring it in line with the Board’s objective.
Management profitability. The Board considered the level of profits realized by DMC in connection with the operation of the Funds. In this respect, the Board reviewed the Investment Management Profitability Analysis that addressed the overall profitability of DMC’s business in providing management and other services to each of the individual funds and the Delaware Funds as a whole. Specific attention was given to the methodology used by DMC in allocating costs for the purpose of determining profitability. Management stated that the level of profits of DMC, to a certain extent, reflects recent operational cost savings and efficiencies initiated by DMC. The Board considered DMC’s efforts to improve services provided to fund shareholders and to meet additional regulatory and compliance requirements resulting from recent industry-wide Securities and Exchange Commission initiatives. The Board also considered the extent to which DMC might derive ancillary benefits from fund operations, including the potential for procuring additional business as a result of the prestige and visibility associated with its role as service provider to the Delaware Funds and the benefits from allocation of fund brokerage to improve trading efficiencies. Finally, the Board also reviewed a report prepared by JDL regarding DMC profitability in the context of sub-advised funds and met with JDL personnel to discuss DMC’s profitability in such context. The Board found that the management fees were reasonable in light of the services rendered and the level of profitability of DMC.
Economies of scale. The Trustees considered whether economies of scale are realized by DMC as each Fund’s assets increase and the extent to which any economies of scale are reflected in the level of management fees charged. The Trustees reviewed the standardized advisory fee pricing and structure, approved by the Board and shareholders, which includes breakpoints, and which applies to most funds in the Delaware Funds complex. Breakpoints in the advisory fee occur when the advisory fee rate is reduced on assets in excess of specified levels. Breakpoints result in a lower advisory fee than would otherwise be the case in the absence of breakpoints, when the asset levels specified in the breakpoints are exceeded. The Board noted that the fee under each Fund’s management contract fell within the standardized fee pricing structure. The Board also noted that, as of Feb. 28, 2017, the Delaware Emerging Markets Fund’s assets exceeded the final breakpoint level. The Board believed that, given the extent to which economies of scale might be realized by the advisor and its affiliates, the schedule of fees under the Investment Advisory Agreement provides a sharing of benefits with the Fund and its shareholders. Although, as of Feb. 28, 2017, Delaware Global Value Fund and Delaware International Value Equity Fund had not reached a size at which they could take advantage of any breakpoints in the applicable fee schedule, the Board recognized that the fees were structured so that if the Funds grow, economies of scale may be shared.
107
Board of trustees / directors and officers addendum
Delaware FundsSM by Macquarie
A mutual fund is governed by a Board of Trustees/Directors (“Trustees”), which has oversight responsibility for the management of a fund’s business affairs. Trustees establish procedures and oversee and review the performance of the investment manager, the distributor, and others who perform services for the fund. The independent fund trustees, in particular, are advocates
| | | | | | | | |
| | Name, Address,
and Birth Date | | Position(s)
Held with Fund(s) | | Length of
Time Served | | |
| | Interested Trustee | | | | | | |
| | Shawn K. Lytle1, 2 | | President, | | Trustee since | | |
| | 2005 Market Street | | Chief Executive Officer, | | September 2015 | | |
| | Philadelphia, PA 19103 | | and Trustee | | | | |
| | February 1970 | | | | President and | | |
| | | | | | Chief Executive Officer | | |
| | | | | | since August 2015 | | |
| | Independent Trustees | | | | | | |
| | Thomas L. Bennett | | Chairman and Trustee | | Trustee since | | |
| | 2005 Market Street | | | | March 2005 | | |
| | Philadelphia, PA 19103 | | | | | | |
| | October 1947 | | | | Chairman since | | |
| | | | | | | March 2015 | | |
| | Ann D. Borowiec | | Trustee | | Since March 2015 | | |
| | 2005 Market Street | | | | | | |
| | Philadelphia, PA 19103 | | | | | | |
| | | November 1958 | | | | | | |
| | Joseph W. Chow | | Trustee | | Since January 2013 | | |
| | 2005 Market Street | | | | | | |
| | Philadelphia, PA 19103 | | | | | | |
| | | January 1953 | | | | | | |
| 1 | Shawn K. Lytle is considered to be an “Interested Trustee“ because he is an executive officer of the Fund’s(s’) investment advisor. |
| 2 | Shawn K. Lytle, David F. Connor, Daniel V. Geatens, and Richard Salus serve in similar capacities for the six portfolios of the Optimum Fund Trust, which have the same investment advisor, principal underwriter, and transfer agent as the registrant. Mr. Geatens also serves as the CFO and Treasurer for Macquarie Global Infrastructure Total Return Fund Inc., which shares an affiliated investment manager. |
108
for shareholder interests. Each trustee has served in that capacity since he or she was elected to or appointed to the Board of Trustees, and will continue to serve until his or her retirement or the election of a new trustee in his or her place. The following is a list of the Trustees and Officers with certain background and related information.
| | | | | | | | |
| | | | Number of Portfolios in | | | | |
| | Principal Occupation(s) | | Fund Complex Overseen | | Other Directorships | | |
| | During the Past Five Years | | by Trustee or Officer | | Held by Trustee or Officer | | |
| | | | | | | | |
| | Shawn K. Lytle has served as | | 60 | | Trustee — UBS | | |
| | President of | | | | Relationship Funds, | | |
| | Macquarie Investment | | | | SMA Relationship | | |
| | Management3 | | | | Trust, and UBS Funds | | |
| | since June 2015 and was the | | | | (May 2010–April 2015) | | |
| | Regional Head of Americas for | | | | | | |
| | UBS Global Asset | | | | | | |
| | Management from | | | | | | |
| | 2010 through 2015. | | | | | | |
| | | | | | | | |
| | Private Investor | | 60 | | None | | |
| | (March 2004–Present) | | | | | | |
| | | | |
| | | | | | | | | |
| | Chief Executive Officer, | | 60 | | Director — | | |
| | Private Wealth Management | | | | Banco Santander International | | |
| | (2011–2013) and | | | | | | |
| | Market Manager, | | | | Director — | | |
| | New Jersey Private | | | | Santander Bank, N.A. | | |
| | Bank (2005–2011) — | | | | | | |
| | | J.P. Morgan Chase & Co. | | | | | | |
| | Executive Vice President | | 60 | | Director and Audit Committee | | |
| | (Emerging Economies | | | | Member — Hercules | | |
| | Strategies, Risks, and | | | | Technology Growth | | |
| | Corporate Administration) | | | | Capital, Inc. | | |
| | State Street Corporation | | | | (2004–2014) | | |
| | | (July 2004–March 2011) | | | | ` | | |
| 3 | Macquarie Investment Management (formerly known as Delaware Investments) is the marketing name for Macquarie Management Holdings, Inc. (formerly known as Delaware Management Holdings, Inc.) and its subsidiaries, including the Fund’s(s’) investment advisor, principal underwriter, and its transfer agent. |
109
Board of trustees / directors and officers addendum
Delaware FundsSM by Macquarie
| | | | | | | | |
| | Name, Address, | | Position(s) | | Length of | | |
| | and Birth Date | | Held with Fund(s) | | Time Served | | |
| | Independent Trustees (continued) | | | | | | |
| | John A. Fry | | Trustee | | Since January 2001 | | |
| | 2005 Market Street | | | | | | |
| | Philadelphia, PA 19103 | | | | | | |
| | May 1960 | | | | | | |
| | | | |
| | | | | | | | | |
| | Lucinda S. Landreth | | Trustee | | Since March 2005 | | |
| | 2005 Market Street | | | | | | |
| | Philadelphia, PA 19103 | | | | | | |
| | | June 1947 | | | | | | |
| | Frances A. Sevilla-Sacasa | | Trustee | | Since September 2011 | | |
| | 2005 Market Street | | | | | | |
| | Philadelphia, PA 19103 | | | | | | |
| | | January 1956 | | | | | | |
110
| | | | | | | | |
| | | | Number of Portfolios in | | | | |
| | Principal Occupation(s) | | Fund Complex Overseen | | Other Directorships | | |
| | During the Past Five Years | | by Trustee or Officer | | Held by Trustee or Officer | | |
| | | | | | | | |
| | President — | | 60 | | Director, Audit Committee, | | |
| | Drexel University | | | | and Governance Committee | | |
| | (August 2010–Present) | | | | Member — Community | | |
| | | | | | Health Systems | | |
| | President — | | | | | | |
| | Franklin & Marshall College | | | | Director — Drexel | | |
| | (July 2002–July 2010) | | | | Morgan & Co. | | |
| | | | |
| | | | | | Director, Audit Committee | | |
| | | | | | Member — vTv | | |
| | | | | | Therapeutics LLC | | |
| | | | |
| | | | | | Director — FS Credit Real | | |
| | | | | | | Estate Income Trust, Inc. | | |
| | Private Investor | | 60 | | None | | |
| | (2004–Present) | | | | | | |
| | | | |
| | | | | | | | | |
| | Chief Executive Officer — | | 60 | | Trust Manager and | | |
| | Banco Itaú | | | | Audit Committee | | |
| | International | | | | Chair — Camden | | |
| | (April 2012–December 2016) | | | | Property Trust | | |
| | | | |
| | Executive Advisor to Dean | | | | | | |
| | (August 2011–March 2012)
and Interim Dean | | | | | | |
| | (January 2011–July 2011) — | | | | | | |
| | University of Miami School of | | | | | | |
| | Business Administration | | | | | | |
| | | | |
| | President — U.S. Trust, | | | | | | |
| | Bank of America Private | | | | | | |
| | Wealth Management | | | | | | |
| | (Private Banking) | | | | | | |
| | | (July 2007–December 2008) | | | | | | |
111
Board of trustees / directors and officers addendum
Delaware FundsSM by Macquarie
| | | | | | | | |
| | Name, Address, | | Position(s) | | Length of | | |
| | and Birth Date | | Held with Fund(s) | | Time Served | | |
| | Independent Trustees (continued) |
| | Thomas K. Whitford | | Trustee | | Since January 2013 | | |
| | 2005 Market Street | | | | | | |
| | Philadelphia, PA 19103 | | | | | | |
| | March 1956 | | | | | | |
| | | | |
| | | | | | | | | |
| | Janet L. Yeomans | | Trustee | | Since April 1999 | | |
| | 2005 Market Street | | | | | | |
| | Philadelphia, PA 19103 | | | | | | |
| | July 1948 | | | | | | |
| | | | |
| | | | | | | | |
| | Officers | | | | | | |
| | David F. Connor | | Senior Vice President, | | Senior Vice President | | |
| | 2005 Market Street | | General Counsel, | | since May 2013; | | |
| | Philadelphia, PA 19103 | | and Secretary | | General Counsel | | |
| | December 1963 | | | | since May 2015; | | |
| | | | | | Secretary since | | |
| | | | | | | October 2005 | | |
| | Daniel V. Geatens | | Vice President | | Treasurer since October 2007 | | |
| | 2005 Market Street | | and Treasurer | | | | |
| | Philadelphia, PA 19103 | | | | | | |
| | October 1972 | | | | | | |
| | | | |
| | | | | | | | | |
| | Richard Salus | | Senior Vice President | | Chief Financial Officer | | |
| | 2005 Market Street | | and Chief Financial Officer | | since November 2006 | | |
| | Philadelphia, PA 19103 | | | | | | |
| | | October 1963 | | | | | | |
The Statement of Additional Information for the Fund(s) includes additional information about the Trustees and Officers and is available, without charge, upon request by calling 800 523-1918.
112
| | | | | | | | |
| | | | Number of Portfolios in | | | | |
| | Principal Occupation(s) | | Fund Complex Overseen | | Other Directorships | | |
| | During the Past Five Years | | by Trustee or Officer | | Held by Trustee or Officer | | |
| | | | | | | | |
| | Vice Chairman | | 60 | | Director — HSBC Finance | | |
| | (2010–April 2013) — | | | | Corporation and HSBC | | |
| | PNC Financial | | | | North America Holdings Inc. | | |
| | Services Group | | | | | | |
| | | | | | Director — | | |
| | | | | | | HSBC USA Inc. | | |
| | Vice President and Treasurer | | 60 | | Director (2009–2017); | | |
| | (January 2006–July 2012), | | | | Personnel and Compensation | | |
| | Vice President — | | | | Committee Chair; Member of | | |
| | Mergers & Acquisitions | | | | Nominating, Investments, and | | |
| | (January 2003–January 2006), | | | | Audit Committees for various | | |
| | and Vice President | | | | periods throughout | | |
| | and Treasurer | | | | directorship — | | |
| | (July 1995–January 2003) — | | | | Okabena Company | | |
| | 3M Company | | | | | | |
| | | | | | | | |
| | David F. Connor has served | | 60 | | None2 | | |
| | in various capacities at different times at | | | | | | |
| | Macquarie Investment | | | | | | |
| | Management. | | | | | | |
| | | | |
| | | | | | | | | |
| | Daniel V. Geatens has served | | 60 | | None2 | | |
| | in various capacities at different times at | | | | | | |
| | Macquarie Investment | | | | | | |
| | | Management. | | | | | | |
| | Richard Salus has served | | 60 | | None2 | | |
| | in various executive capacities at different times at | | | | | | |
| | Macquarie Investment | | | | | | |
| | | Management. | | | | | | |
113
About the organization
| | | | | | |
| Board of trustees | | | | | | |
| | | |
Shawn K. Lytle President and Chief Executive Officer Delaware FundsSM by Macquarie Philadelphia, PA Thomas L. Bennett Chairman of the Board Delaware Funds by Macquarie Private Investor Rosemont, PA | | Ann D. Borowiec Former Chief Executive Officer Private Wealth Management J.P. Morgan Chase & Co. New York, NY Joseph W. Chow Former Executive Vice President State Street Corporation Boston, MA | | John A. Fry President Drexel University Philadelphia, PA Lucinda S. Landreth Former Chief Investment Officer Assurant, Inc. New York, NY | | Frances A. Sevilla-Sacasa Former Chief Executive Officer Banco Itaú International Miami, FL Thomas K. Whitford Former Vice Chairman PNC Financial Services Group Pittsburgh, PA Janet L. Yeomans Former Vice President and Treasurer 3M Company St. Paul, MN |
Affiliated officers David F. Connor Senior Vice President, General Counsel, and Secretary Delaware Funds by Macquarie Philadelphia, PA | | Daniel V. Geatens Vice President and Treasurer Delaware Funds by Macquarie Philadelphia, PA | | Richard Salus Senior Vice President and Chief Financial Officer Delaware Funds by Macquarie Philadelphia, PA | | |
This annual report is for the information of Delaware Emerging Markets Fund, Delaware Global Value Fund, and Delaware International Value Equity Fund shareholders, but it may be used with prospective investors when preceded or accompanied by the Delaware Fund fact sheet for the most recently completed calendar quarter. These documents are available at delawarefunds.com/literature.
Each Fund files its complete schedule of portfolio holdings with the Securities and Exchange Commission (SEC) for the first and third quarters of each fiscal year on Form N-Q. Each Fund’s Forms N-Q, as well as a description of the policies and procedures that the Funds use to determine how to vote proxies (if any) relating to portfolio securities are available without charge (i) upon request, by calling 800 523-1918; and (ii) on the SEC’s website at sec.gov. In addition, a description of the policies and procedures that the Funds use to determine how to vote proxies (if any) relating to portfolio securities and the Schedules of Investments included in the Funds’ most recent Form N-Q are available without charge on the Funds’ website at delawarefunds.com/literature. Each Fund’s Forms N-Q may be reviewed and copied at the SEC’s Public Reference Room in Washington, D.C.; information on the operation of the Public Reference Room may be obtained by calling 800 SEC-0330.
Information (if any) regarding how the Funds voted proxies relating to portfolio securities during the most recently disclosed 12-month period ended June 30 is available without charge (i) through the Funds’ website at delawarefunds.com/proxy; and (ii) on the SEC’s website at sec.gov.
114
| | |

| | 
Annual report |
Global / international equity mutual fund
Delaware International Small Cap Fund
November 30, 2017
Carefully consider the Fund’s investment objectives, risk factors, charges, and expenses before investing. This and other information can be found in the Fund’s prospectus and its summary prospectus, which may be obtained by visiting delawarefunds.com/literature or calling 800 523-1918. Investors should read the prospectus and the summary prospectus carefully before investing.
You can obtain shareholder reports and prospectuses online instead of in the mail.
Visit delawarefunds.com/edelivery.
Experience Delaware FundsSM by Macquarie
Macquarie Investment Management (MIM) is a global asset manager with offices throughout the United States, Europe, Asia, and Australia. We are active managers who prioritize autonomy and accountability at the investment team level in pursuit of opportunities that matter for our clients. Delaware Funds is one of the longest-standing mutual fund families, with more than 75 years in existence.
If you are interested in learning more about creating an investment plan, contact your financial advisor.
You can learn more about Delaware Funds or obtain a prospectus for Delaware International Small Cap Fund at delawarefunds.com/literature.
Manage your account online
| • | | Check your account balance and transactions |
| • | | View statements and tax forms |
| • | | Make purchases and redemptions |
Visit delawarefunds.com/account-access.
Macquarie Investment Management (MIM) is the marketing name for the following registered investment advisers: Macquarie Investment Management Business Trust (MIMBT) (formerly, Delaware Management Business Trust), Macquarie Funds Management Hong Kong Limited, Macquarie Investment Management Austria Kapitalanlage AG, Macquarie Investment Management Global Limited, Macquarie Investment Management Europe Limited, and Macquarie Capital Investment Management, Inc.
The Fund is distributed by Delaware Distributors, L.P., an affiliate of MIMBT and Macquarie Group Limited. MIM, a member of Macquarie Group, refers to the companies comprising the asset management division of Macquarie Group Limited and its subsidiaries and affiliates worldwide.
Other than Macquarie Bank Limited (MBL), none of the entities noted are authorized deposit-taking institutions for the purposes of the Banking Act 1959 (Commonwealth of Australia). The obligations of these entities do not represent deposits or other liabilities of MBL. MBL does not guarantee or otherwise provide assurance in respect of the obligations of these entities, unless noted otherwise. The Fund is governed by US laws and regulations.
Table of contents
Unless otherwise noted, views expressed herein are current as of Nov. 30, 2017, and subject to change for events occurring after such date.
The Fund is not FDIC insured and is not guaranteed. It is possible to lose the principal amount invested.
Advisory services provided by Delaware Management Company, a series of MIMBT, a US registered investment advisor.
All third-party marks cited are the property of their respective owners.
© 2018 Macquarie Management Holdings, Inc. (formerly, Delaware Management Holdings, Inc.)
Portfolio management review
| | |
| Delaware International Small Cap Fund | | December 12, 2017 |
| | | | | | | | |
Performance preview (for the year ended November 30, 2017) | | | | | | | | |
| Delaware International Small Cap Fund (Institutional Class shares)* | | | 1-year return | | | | +40.57% | |
| Delaware International Small Cap Fund (Class A shares)* | | | 1-year return | | | | +40.29% | |
| MSCI ACWI ex USA Small Cap Index (gross) (current benchmark) | | | 1-year return | | | | +30.90% | |
| MSCI ACWI ex USA Small Cap Index (net) (current benchmark) | | | 1-year return | | | | +30.43% | |
| MSCI World Index (gross) (former benchmark) | | | 1-year return | | | | +24.34% | |
| MSCI World Index (net) (former benchmark) | | | 1-year return | | | | +23.66% | |
Past performance does not guarantee future results.
For complete, annualized performance for Delaware International Small Cap Fund, please see the table on page 4.
Institutional Class shares are not subject to a sales charge and are offered for sale exclusively to certain eligible investors. In addition, Institutional Class shares pay no distribution and service fee.
The performance of Class A shares excludes the applicable sales charge. Both Institutional Class shares and Class A shares reflect the reinvestment of all distributions.
Please see page 7 for a description of the indices. Index performance returns do not reflect any management fees, transaction costs, or expenses. Indices are unmanaged and one cannot invest directly in an index.
*Total returns for the report period presented in the table differ from the returns in “Financial highlights.” The total returns presented in the above table are calculated based on the net asset value (NAV) at which shareholder transactions were processed. The total returns presented in “Financial highlights” are calculated in the same manner, but also take into account certain adjustments that are necessary under US generally accepted accounting principles (US GAAP) required in the annual report.
Early in the Fund’s fiscal year, investors pushed equity markets higher, encouraged by the incoming Trump administration’s proposals for infrastructure spending, deregulation, and tax reform. While the direct effect on international small-cap stocks was somewhat limited (primarily affecting the expected beneficiaries of reflation such as materials-related companies) a reduction of political risk in Europe and a pickup in global economic growth provided a tailwind for the asset class.
Elections held in France, the Netherlands, and Germany generally turned out better than investors had feared, igniting a relief rally in the spring of 2017. Japan’s economy improved along with Europe’s, while Brazil emerged from a deep recession.
The backdrop of improving global economic growth enabled the market to look beyond geopolitical concerns such as North Korea’s continued development of nuclear weapons, Brexit headlines, and Catalonia’s drive for
independence from Spain. Although there was some volatility, investors appeared to remain focused on improving economic growth. This resulted in a macroeconomic environment in which companies with improving fundamentals generally were rewarded, a positive development for our investment philosophy and process.
During the fiscal year, we started to see central banks’ monetary policies diverge. The announcement of steps towards policy normalization in the United States – the Federal Reserve’s effort to sell security holdings and reduce its balance sheet – seemed to generate some uncertainty. While inflation has remained low, it will be worth monitoring along with central bank action and economic growth rates globally.
Our team uses a bottom-up (stock-by-stock) investment approach and believes in investing in companies that have been experiencing accelerating earnings due largely to positive fundamental change.
1
Portfolio management review
Delaware International Small Cap Fund
Fund performance
For the fiscal year ended Nov. 30, 2017, Delaware International Small Cap Fund Institutional Class shares returned +40.57%. The Fund’s Class A shares returned +40.29% at net asset value and +32.21% at maximum offer price. These figures reflect all distributions reinvested. During the same period, the Fund’s benchmark, the MSCI All Country World Index (ACWI) ex USA Small Cap Index (net), returned +30.43%. For complete, annualized performance of Delaware International Small Cap Fund, please see the table on page 4.
Our individual stock-by-stock selection process drives the Fund’s positioning. As a result, sector and geographic attribution largely reflects the performance of individual securities. Sectors that contributed to performance during the fiscal year were consumer discretionary and industrials. Countries that contributed included Japan, China, and Brazil. These largely reflected the holdings that did well and where the Fund had conviction.
Contributors to the Fund’s performance included Magazine Luiza, a hard-line retailer in Brazil with 850 stores and an online marketplace. The firm performed well during the year. Since 2016, management has implemented a digital strategy that focused on a consumer electronics ecommerce site to serve both itself and other merchants. Magazine Luiza, in our view, posted strong sales and earnings, particularly in the second quarter of 2017, driven by growth in ecommerce sales as well as solid performance at its brick-and-mortar stores. Profit margins expanded, helping to reduce its debt level and improve its balance sheet. The firm benefited from a rebound in retail spending as Brazil’s economy continued to recover from a deep recession.
Another contributor was Japanese firm Start Today, which operates an online fashion mall, Zozotown. The company exceeded consensus expectations on multiple metrics and reported strong earnings during the fiscal year.
Start Today continued to add new stores, developed creative sales promotions, and made progress on a new private-label brand, all of which helped drive an increase in active members/ customers, and helped solidify its position in the ecommerce fashion market.
Harmonic Drive Systems is a Japanese industrial firm that manufactures precision speed reducers, a key component in small industrial robots and collaborative robots. The company contributed to the Fund’s performance as it reported above-consensus quarterly earnings and showed signs of stronger-than-expected order growth. Harmonic Drive Systems benefited from growth in factory automation and potential growth in collaborative robots (“cobots”). Cobots can be very useful for small tasks and are designed to work safely alongside humans.
Sectors that detracted from performance included materials and energy. Norway, South Korea, and Canada were among the countries that detracted.
Individual detractors included Ichigo, a Japanese real estate management firm that is also involved in clean energy generation. It underperformed during the holding period largely on the perception of weak earnings guidance that management issued in its quarterly results in January 2017.
RPC Group, a hard-plastic packaging company, also detracted from the Fund’s performance during the fiscal period. Although the firm reported solid fiscal year 2016 results that surpassed its guidance and analysts’ expectations, it was hurt by the announcement that it was undertaking a rights issue to fund the acquisition of a competitor, Letica. Concerned about the rights issue, many investors sold off their shares despite, what we view as, RPC Group’s solid fundamentals.
Axactor, a debt management firm, also detracted from performance in spite of no clear catalysts or reasons for the stock’s extended underperformance during the holding period. In
2
late 2016, the company had announced that it entered into an agreement to acquire portfolios on a monthly basis from a large Nordic financial institution. This move would allow Axactor to manage the cases throughout the entire collection process and provide a solid entry into the Norwegian market. Despite the company executing according to its stated strategy, the market failed to reward the company for its consistent actions.
We exited the Fund’s positions in all three of these detractors, as each stock triggered one of our sell rules, either by violating the team’s investment thesis or through continued underperformance. With the proceeds from the sales, we sought to take advantage of the growing number of what we viewed as exciting market opportunities that we had uncovered.
Global economic growth has been positive across geographies, providing us with investment opportunities across a wide variety of countries. We see Europe’s growth prospects as improving, aided by reduced political risk. Japan’s economic data, including gross domestic product (GDP) growth, its unemployment rate, and corporate earnings, are improving. Within emerging markets, the Brazilian economy is strengthening, and China is rebalancing toward a more consumer-oriented economy.
We are also encouraged by the number of opportunities across various growth areas such as
robotics, artificial intelligence, big data, the electrification of vehicles, the Internet of things (IoT), and ecommerce.
We are aware of several risks, including the possibility of slowing growth, central bank policy normalization, and the possibility that the Fed could overtighten if it raises interest rates too quickly. An increase in inflation is another possible concern along with geopolitical risks, such as North Korea and Brexit.
As mentioned, the Fund’s positioning in terms of country and sector weights is driven primarily by bottom-up stock-selection opportunities. As a result, at period end, relative to the benchmark, the Fund was overweight the consumer discretionary and information technology sectors. From a country perspective, the Fund’s largest overweight positions were in Brazil and Turkey. Conversely, the Fund’s largest relative underweight countries were Germany and South Korea, while the Fund’s largest sector underweights were real estate and financials.
Derivatives or structured products may be used in certain limited situations. For example, the portfolio may use equity linked notes to gain local market access in situations where direct market participation is limited. Derivatives and structured products were not used by the Fund during the fiscal period.
3
Performance summary
| | |
| Delaware International Small Cap Fund | | November 30, 2017 |
The performance quoted represents past performance and does not guarantee future results. Investment return and principal value of an investment will fluctuate so that shares, when redeemed, may be worth more or less than their original cost. Current performance may be lower or higher than the performance quoted. Performance data current to the most recent month end may be obtained by calling 800 523-1918 or visiting delawarefunds.com/performance.
| | | | | | | | | | | | |
| Fund and benchmark performance1,2 | | Average annual total returns through November 30, 2017 | |
| | | 1 year | | | 5 years | | | Lifetime | |
Class A (Est. Dec. 29, 2008) | | | | | | | | | | | | |
Excluding sales charge | | | +40.29%* | | | | +12.08% | | | | +16.11% | |
Including sales charge | | | +32.21%* | | | | +10.76% | | | | +15.34% | |
| | |
Class C (Est. Dec. 29, 2010) | | | | | | | | | | | | |
Excluding sales charge | | | +39.23%* | | | | +11.25% | | | | +9.77% | |
Including sales charge | | | +38.85%* | | | | +11.25% | | | | +9.77% | |
| | |
Class R (Est. Dec. 29, 2010) | | | | | | | | | | | | |
Excluding sales charge | | | +39.89%* | | | | +11.80% | | | | +10.31% | |
Including sales charge | | | +39.89%* | | | | +11.80% | | | | +10.31% | |
| | |
Institutional Class (Est. Dec. 29, 2008) | | | | | | | | | | | | |
Excluding sales charge | | | +40.57%* | | | | +12.36% | | | | +16.33% | |
Including sales charge | | | +40.57%* | | | | +12.36% | | | | +16.33% | |
| | |
Class R6 (Est. June 30, 2017) | | | | | | | | | | | | |
Excluding sales charge | | | n/a | | | | n/a | | | | +18.11%** | |
Including sales charge | | | n/a | | | | n/a | | | | +18.11%** | |
| | |
MSCI ACWI ex USA Small Cap Index | | | | | | | | | | | | |
(gross) | | | +30.90% | | | | +10.62% | | | | +13.85%*** | |
| | |
MSCI ACWI ex USA Small Cap Index | | | | | | | | | | | | |
(net) | | | +30.43% | | | | +10.23% | | | | +13.46%*** | |
| | |
MSCI World Index (gross) | | | +24.34% | | | | +12.38% | | | | +12.51%*** | |
| | |
MSCI World Index (net) | | | +23.66% | | | | +11.75% | | | | +11.87%*** | |
| | |
*Total returns for the report period presented in the table differ from the returns in “Financial highlights.” The total returns presented in the above table are calculated based on the net asset value (NAV) at which shareholder transactions were processed. The total returns presented in “Financial highlights” are calculated in the same manner, but also take into account certain adjustments that are necessary under US generally accepted accounting principles (US GAAP) required in the annual report.
**Returns are as of the Fund’s Class R6 inception date. Returns for less than one year are not annualized. The benchmark lifetime returns since the Class R6 inception date were +10.63% (gross) and +10.52% (net).
***The benchmark lifetime return is for Class A share comparison only and is calculated using the last business day in the month of the Fund’s Class A inception date.
1Returns reflect the reinvestment of all distributions and are presented both with and without the applicable sales charges described on the next page. Returns do not reflect the
deduction of taxes the shareholder would pay on Fund distributions or redemptions of Fund shares.
Expense limitations were in effect for certain classes during some or all of the periods shown in
4
the “Fund and benchmark performance” table. Expenses for each class are listed on the “Fund expense ratios” table on page 6. Performance would have been lower had expense limitations not been in effect.
Institutional Class shares are not subject to a sales charge and are offered for sale exclusively to certain eligible investors. In addition, Institutional Class shares pay no distribution and service fee.
Class A shares are sold with a maximum front-end sales charge of 5.75%, and have an annual distribution and service fee of 0.25% of average daily net assets. Performance for Class A shares, excluding sales charges, assumes that no front-end sales charge applied.
Class C shares are sold with a contingent deferred sales charge of 1.00% if redeemed during the first 12 months. They are also subject to an annual distribution and service fee of 1.00% of average daily net assets. Performance for Class C shares, excluding sales charges, assumes either that contingent deferred sales charges did not apply or that the investment was not redeemed.
Class R shares are available only for certain retirement plan products. They are sold without a sales charge and have an annual distribution and service fee of 0.50% of average daily net assets.
Class R6 shares are available only to certain investors. In addition, Class R6 shares do not pay any service fees, sub-accounting fees, and/or sub-transfer agency fees to any brokers, dealers, or other financial intermediaries. Class R6 shares pay no distribution and service fee.
Investments in small and/or medium-sized companies typically exhibit greater risk and higher volatility than larger, more established companies.
International investments entail risks not ordinarily associated with US investments including fluctuation in currency values, differences in accounting principles, or economic or political instability in other nations.
Investing in emerging markets can be riskier than investing in established foreign markets due to increased volatility and lower trading volume.
The Fund may experience portfolio turnover in excess of 100%, which could result in higher transaction costs and tax liability.
5
Performance summary
Delaware International Small Cap Fund
2The Fund’s expense ratios, as described in the most recent prospectus, are disclosed in the following “Fund expense ratios” table. Delaware Management Company has agreed to reimburse certain expenses and/or waive certain fees in order to prevent total annual fund operating expenses (excluding any 12b-1 fees, acquired fund fees and expenses, taxes, interest, short sale and dividend interest expenses, brokerage fees, certain insurance costs, and nonroutine expenses or costs, including, but not limited to, those relating to reorganizations, litigation, conducting shareholder meetings, and liquidations (collectively, nonroutine expenses)) from exceeding 1.13% of the Fund’s average daily net assets for all share classes other than Class R6 and 1.00% of the Fund’s Class R6 shares’ average daily net assets from June 30, 2017 (Class R6 inception date) through Nov. 30, 2017*. Prior to June 30, 2017, the contractual waiver was 1.18% of average daily net assets of Class A, Class C, Class R, and Institutional Class shares. Please see the most recent prospectus and any applicable supplement(s) for additional information on these fee waivers and/or reimbursements. Please see the “Financial highlights” section in this report for the most recent expense ratios.
| | | | | | | | | | |
| Fund expense ratios | | Class A | | Class C | | Class R | | Institutional
Class | | Class R6 |
| Total annual operating expenses | | 1.51% | | 2.26% | | 1.76% | | 1.26% | | 1.13% |
| (without fee waivers) | | | | | | | | | | |
| Net expenses | | 1.38% | | 2.13% | | 1.63% | | 1.13% | | 1.00% |
| (including fee waivers, if any) | | | | | | | | | | |
| Type of waiver | | Contractual | | Contractual | | Contractual | | Contractual | | Contractual |
*The aggregate contractual waiver period covering this report is from June 30, 2017, through June 30, 2018.
6
Performance of a $10,000 investment1
Average annual total returns from Dec. 29, 2008 (Fund’s inception),
through Nov. 30, 2017
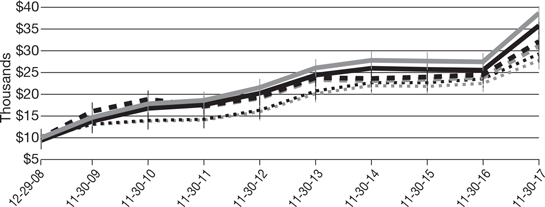
| | | | | | | | |
For the period beginning Dec. 29, 2008, through Nov. 30, 2017 | | Starting value | | | Ending value | |
 Delaware International Small Cap Fund — Institutional Class shares Delaware International Small Cap Fund — Institutional Class shares
| | | $10,000 | | | | $38,561 | |
 Delaware International Small Cap Fund — Class A shares Delaware International Small Cap Fund — Class A shares
| | | $9,425 | | | | $35,721 | |
 MSCI ACWI ex USA Small Cap Index (gross) MSCI ACWI ex USA Small Cap Index (gross)
| | | $10,000 | | | | $32,048 | |
 MSCI ACWI ex USA Small Cap Index (net) MSCI ACWI ex USA Small Cap Index (net)
| | | $10,000 | | | | $31,066 | |
 MSCI World Index (gross) MSCI World Index (gross)
| | | $10,000 | | | | $29,212 | |
 MSCI World Index (net) MSCI World Index (net)
| | | $10,000 | | | | $27,774 | |
1 The “Performance of a $10,000 investment” graph assumes $10,000 invested in Institutional Class and Class A shares of the Fund on Dec. 29, 2008, and includes the effect of a 5.75% front-end sales charge (for Class A shares) and the reinvestment of all distributions. The graph does not reflect the deduction of taxes the shareholders would pay on Fund distributions or redemptions of Fund shares. Expense limitations were in effect for some or all of the periods shown. Performance would have been lower had expense limitations not been in effect. Expenses are listed in the “Fund expense ratios” table on the previous page. Please note additional details on pages 4 through 8.
The graph also assumes $10,000 invested in the MSCI ACWI ex USA Small Cap Index and the MSCI World Index as of Dec. 29, 2008. The MSCI ACWI ex USA Small Cap Index captures small-cap
representation across 22 of 23 developed market countries (excluding the United States) and 24 emerging market countries. The index covers approximately 14% of the global equity opportunity set outside the US Index “gross” return approximates the maximum possible dividend reinvestment. Index “net” return approximates the minimum possible dividend reinvestment, after deduction of withholding tax at the highest possible rate.
The MSCI World Index is a free float-adjusted market capitalization weighted index designed to measure equity market performance across developed markets worldwide. Index “gross” return approximates the maximum possible dividend reinvestment. Index “net” return approximates the minimum possible dividend reinvestment, after deduction of withholding tax at the highest possible rate.
7
Performance summary
Delaware International Small Cap Fund
Index performance returns do not reflect any management fees, transaction costs, or expenses. Indices are unmanaged and one cannot invest directly in an index. Past performance is not a guarantee of future results.
Performance of other Fund classes will vary due to different charges and expenses.
| | | | | | |
| | | Nasdaq symbols | | CUSIPs | | |
Class A | | DGGAX | | 246118541 | | |
Class C | | DGGCX | | 246118533 | | |
Class R | | DGGRX | | 246118525 | | |
Institutional Class | | DGGIX | | 246118517 | | |
Class R6 | | DGRRX | | 245914486 | | |
8
Disclosure of Fund expenses
For the six-month period from June 1, 2017 to November 30, 2017 (Unaudited)
As a shareholder of the Fund, you incur two types of costs: (1) transaction costs, including sales charges (loads) on purchase payments, reinvested dividends, or other distributions; redemption fees; and exchange fees; and (2) ongoing costs, including management fees; distribution and/or service (12b-1) fees; and other Fund expenses. This example is intended to help you understand your ongoing costs (in dollars) of investing in the Fund and to compare these costs with the ongoing costs of investing in other mutual funds.
The example is based on an investment of $1,000 invested at the beginning of the period and held for the entire six-month period from June 1, 2017 to Nov. 30, 2017.
Actual expenses
The first section of the table shown, “Actual Fund return,” provides information about actual account values and actual expenses. You may use the information in this section of the table, together with the amount you invested, to estimate the expenses that you paid over the period. Simply divide your account value by $1,000 (for example, an $8,600 account value divided by $1,000 = 8.6), then multiply the result by the number in the first section under the heading entitled “Expenses Paid During Period” to estimate the expenses you paid on your account during this period.
Hypothetical example for comparison purposes
The second section of the table shown, “Hypothetical 5% return,” provides information about hypothetical account values and hypothetical expenses based on the Fund’s actual expense ratio and an assumed rate of return of 5% per year before expenses, which is not the Fund’s actual return. The hypothetical account values and expenses may not be used to estimate the actual ending account balance or expenses you paid for the period. You may use this information to compare the ongoing costs of investing in the Fund and other funds. To do so, compare this 5% hypothetical example with the 5% hypothetical examples that appear in the shareholder reports of the other funds.
Please note that the expenses shown in the table are meant to highlight your ongoing costs only and do not reflect any transactional costs, such as sales charges (loads), redemption fees, or exchange fees. Therefore, the second section of the table is useful in comparing ongoing costs only, and will not help you determine the relative total costs of owning different funds. In addition, if these transactional costs were included, your costs would have been higher. The Fund’s expenses shown in the table reflect waivers in effect. The expenses shown in the table assume reinvestment of all dividends and distributions.
9
Disclosure of Fund expenses
For the six-month period from June 1, 2017 to November 30, 2017 (Unaudited)
Delaware International Small Cap Fund
Expense analysis of an investment of $1,000
| | | | | | | | | | | | | | | | | | | | |
| | | Beginning
Account Value
6/1/17 | | Ending
Account Value
11/30/17 | | Annualized
Expense Ratio | | Expenses
Paid During Period
6/1/17 to 11/30/17* |
Actual Fund return† | | | | | | | | | | | | | | | | | | | | |
Class A | | | | $1,000.00 | | | | | $1,190.80 | | | | | 1.33 | % | | | | $7.30 | |
Class C | | | | 1,000.00 | | | | | 1,185.80 | | | | | 2.08 | % | | | | 11.40 | |
Class R | | | | 1,000.00 | | | | | 1,189.10 | | | | | 1.58 | % | | | | 8.67 | |
Institutional Class | | | | 1,000.00 | | | | | 1,191.40 | | | | | 1.08 | % | | | | 5.93 | |
Class R6** | | | | 1,000.00 | | | | | 1,181.10 | | | | | 1.00 | % | | | | 4.57 | |
| | |
Hypothetical 5% return (5% return before expenses) | | | | | | | | | | | | | | | | | | | | |
Class A | | | | $1,000.00 | | | | | $1,018.40 | | | | | 1.33 | % | | | | $6.73 | |
Class C | | | | 1,000.00 | | | | | 1,014.64 | | | | | 2.08 | % | | | | 10.50 | |
Class R | | | | 1,000.00 | | | | | 1,017.15 | | | | | 1.58 | % | | | | 7.99 | |
Institutional Class | | | | 1,000.00 | | | | | 1,019.65 | | | | | 1.08 | % | | | | 5.47 | |
Class R6** | | | | 1,000.00 | | | | | 1,020.05 | | | | | 1.00 | % | | | | 5.06 | |
| | |
| * | “Expenses Paid During Period” are equal to the Fund’s annualized expense ratio, multiplied by the average account value over the period, multiplied by 183/365 (to reflect the one-half year period). |
| † | Because actual returns reflect only the most recent six-month period, the returns shown may differ significantly from fiscal year returns. |
| ** | The Class R6 shares commenced operations on June 30, 2017. The ending account value for “Actual” uses the performance since inception and is not annualized and the expenses paid during the period for “Actual” are equal to the Class R6 annualized expense ratio, multiplied by the average account value over the period, multiplied by 153/365 (to reflect the actual days since inception). |
10
Security type / country and sector allocations
| | |
| Delaware International Small Cap Fund | | As of November 30, 2017 (Unaudited) |
Sector designations may be different than the sector designations presented in other Fund materials. The sector designations may represent the investment manager’s internal sector classifications.
| | | | | |
| Security type / country | | Percentage of net assets |
Common Stock by Country | | | | 95.97 | % |
Argentina | | | | 1.01 | % |
Australia | | | | 1.85 | % |
Austria | | | | 1.52 | % |
Brazil | | | | 1.93 | % |
Canada | | | | 5.90 | % |
China/Hong Kong | | | | 5.55 | % |
Denmark | | | | 2.75 | % |
Finland | | | | 1.37 | % |
France | | | | 3.60 | % |
Germany | | | | 0.41 | % |
India | | | | 1.42 | % |
Ireland | | | | 3.66 | % |
Israel | | | | 2.32 | % |
Italy | | | | 3.68 | % |
Japan | | | | 22.87 | % |
Malaysia | | | | 1.11 | % |
Mexico | | | | 0.93 | % |
Netherlands | | | | 1.65 | % |
Norway | | | | 0.49 | % |
Philippines | | | | 0.89 | % |
Republic of Korea | | | | 0.71 | % |
South Africa | | | | 0.50 | % |
Spain | | | | 1.10 | % |
Sweden | | | | 4.38 | % |
Switzerland | | | | 3.15 | % |
Taiwan | | | | 5.71 | % |
Thailand | | | | 1.06 | % |
Turkey | | | | 1.91 | % |
United Kingdom | | | | 9.37 | % |
United States | | | | 2.36 | % |
Uruguay | | | | 0.81 | % |
Preferred Stock | | | | 0.88 | % |
Short-Term Investments | | | | 1.74 | % |
Total Value of Securities | | | | 98.59 | % |
Receivables and Other Assets Net of Liabilities | | | | 1.41 | % |
Total Net Assets | | | | 100.00 | % |
11
Security type / country and sector allocations
Delaware International Small Cap Fund
| | | | | |
| Common stock and preferred stock by sector | | Percentage of net assets |
Consumer Discretionary | | | | 20.06 | % |
Consumer Staples | | | | 8.36 | % |
Energy | | | | 1.20 | % |
Financials | | | | 6.81 | % |
Healthcare | | | | 7.38 | % |
Industrials | | | | 20.12 | % |
Information Technology | | | | 16.50 | % |
Materials | | | | 12.37 | % |
Real Estate | | | | 3.13 | % |
Telecommunication Services | | | | 0.92 | % |
Total | | | | 96.85 | % |
12
Schedule of investments
| | |
| Delaware International Small Cap Fund | | November 30, 2017 |
| | | | | | | | |
| | | Number of shares | | | Value (US $) | |
Common Stock – 95.97%D | | | | | | | | |
| | | | | | | | | |
Argentina – 1.01% | | | | | | | | |
Grupo Supervielle ADR | | | 12,150 | | | $ | 319,545 | |
| | | | | | | | |
| | | | | | | 319,545 | |
| | | | | | | | |
Australia – 1.85% | | | | | | | | |
Afterpay Touch Group † | | | 78,441 | | | | 296,664 | |
G8 Education | | | 86,507 | | | | 289,536 | |
| | | | | | | | |
| | | | | | | 586,200 | |
| | | | | | | | |
Austria – 1.52% | | | | | | | | |
BUWOG † | | | 16,816 | | | | 482,723 | |
| | | | | | | | |
| | | | | | | 482,723 | |
| | | | | | | | |
Brazil – 1.93% | | | | | | | | |
BR Properties | | | 34,200 | | | | 114,925 | |
Magazine Luiza | | | 8,700 | | | | 151,013 | |
Rumo † | | | 46,300 | | | | 184,156 | |
Ser Educacional 144A # | | | 18,057 | | | | 162,673 | |
| | | | | | | | |
| | | | | | | 612,767 | |
| | | | | | | | |
Canada – 5.90% | | | | | | | | |
Descartes Systems Group † | | | 13,400 | | | | 371,937 | |
Enerplus | | | 24,700 | | | | 224,954 | |
Interfor † | | | 27,100 | | | | 449,514 | |
Norbord | | | 8,000 | | | | 276,929 | |
Quebecor Class B | | | 14,800 | | | | 283,691 | |
Trevali Mining † | | | 248,500 | | | | 261,954 | |
| | | | | | | | |
| | | | | | | 1,868,979 | |
| | | | | | | | |
China/Hong Kong – 5.55% | | | | | | | | |
China Lodging Group ADR | | | 1,775 | | | | 189,410 | |
China Resources Cement Holdings | | | 534,000 | | | | 354,009 | |
Lee & Man Paper Manufacturing | | | 278,000 | | | | 327,646 | |
Melco International Development | | | 119,000 | | | | 344,526 | |
Microport Scientific | | | 312,000 | | | | 359,532 | |
Xiabuxiabu Catering Management China Holdings 144A # | | | 111,000 | | | | 184,760 | |
| | | | | | | | |
| | | | | | | 1,759,883 | |
| | | | | | | | |
Denmark – 2.75% | | | | | | | | |
DFDS | | | 2,723 | | | | 146,997 | |
GN Store Nord | | | 10,554 | | | | 331,994 | |
Royal Unibrew | | | 6,859 | | | | 391,702 | |
| | | | | | | | |
| | | | | | | 870,693 | |
| | | | | | | | |
Finland – 1.37% | | | | | | | | |
Outokumpu | | | 23,545 | | | | 203,053 | |
Valmet | | | 12,629 | | | | 232,666 | |
| | | | | | | | |
| | | | | | | 435,719 | |
| | | | | | | | |
13
Schedule of investments
Delaware International Small Cap Fund
| | | | | | | | |
| | | Number of shares | | | Value (US $) | |
Common StockD (continued) | | | | | | | | |
| | |
France – 3.60% | | | | | | | | |
Alten | | | 2,349 | | | $ | 195,138 | |
Elior Group 144A # | | | 2,655 | | | | 58,290 | |
Remy Cointreau | | | 3,112 | | | | 413,785 | |
SOITEC † | | | 4,035 | | | | 308,427 | |
Teleperformance | | | 1,126 | | | | 166,573 | |
| | | | | | | | |
| | | | | | | 1,142,213 | |
| | | | | | | | |
Germany – 0.41% | | | | | | | | |
Evotec † | | | 8,760 | | | | 128,930 | |
| | | | | | | | |
| | | | | | | 128,930 | |
| | | | | | | | |
India – 1.42% | | | | | | | | |
Sterlite Technologies | | | 105,073 | | | | 449,473 | |
| | | | | | | | |
| | | | | | | 449,473 | |
| | | | | | | | |
Ireland – 3.66% | | | | | | | | |
Cairn Homes † | | | 116,128 | | | | 246,034 | |
Dalata Hotel Group † | | | 46,350 | | | | 321,078 | |
Keywords Studios | | | 29,887 | | | | 593,758 | |
| | | | | | | | |
| | | | | | | 1,160,870 | |
| | | | | | | | |
Israel – 2.32% | | | | | | | | |
Israel Discount Bank Class A † | | | 165,371 | | | | 469,505 | |
Mizrahi Tefahot Bank | | | 14,588 | | | | 266,212 | |
| | | | | | | | |
| | | | | | | 735,717 | |
| | | | | | | | |
Italy – 3.68% | | | | | | | | |
Brembo | | | 15,047 | | | | 232,698 | |
Buzzi Unicem | | | 8,863 | | | | 235,787 | |
Fincantieri † | | | 276,834 | | | | 394,644 | |
Moncler | | | 11,109 | | | | 304,729 | |
| | | | | | | | |
| | | | | | | 1,167,858 | |
| | | | | | | | |
Japan – 22.87% | | | | | | | | |
CMK | | | 51,775 | | | | 491,886 | |
Daifuku | | | 9,400 | | | | 516,185 | |
Fujikura | | | 44,600 | | | | 417,511 | |
Harmonic Drive Systems | | | 15,300 | | | | 977,031 | |
Investors Cloud | | | 6,600 | | | | 394,429 | |
Maeda | | | 38,000 | | | | 560,844 | |
Matsumotokiyoshi Holdings | | | 5,700 | | | | 472,056 | |
Persol Holdings | | | 22,400 | | | | 524,442 | |
SCREEN Holdings | | | 4,300 | | | | 387,204 | |
Seria | | | 9,400 | | | | 596,136 | |
SMS | | | 13,500 | | | | 433,421 | |
Start Today | | | 10,615 | | | | 324,794 | |
TechnoPro Holdings | | | 8,800 | | | | 442,322 | |
14
| | | | | | | | |
| | | Number of shares | | | Value (US $) | |
Common StockD (continued) | | | | | | | | |
| | |
Japan (continued) | | | | | | | | |
THK | | | 19,200 | | | $ | 710,153 | |
| | | | | | | | |
| | | | | | | 7,248,414 | |
| | | | | | | | |
Malaysia – 1.11% | | | | | | | | |
Hartalega Holdings | | | 149,800 | | | | 350,187 | |
| | | | | | | | |
| | | | | | | 350,187 | |
| | | | | | | | |
Mexico – 0.93% | | | | | | | | |
Telesites † | | | 370,400 | | | | 293,177 | |
| | | | | | | | |
| | | | | | | 293,177 | |
| | | | | | | | |
Netherlands – 1.65% | | | | | | | | |
Corbion | | | 5,294 | | | | 170,944 | |
Wessanen | | | 17,424 | | | | 350,384 | |
| | | | | | | | |
| | | | | | | 521,328 | |
| | | | | | | | |
Norway – 0.49% | | | | | | | | |
TGS NOPEC Geophysical | | | 6,442 | | | | 155,462 | |
| | | | | | | | |
| | | | | | | 155,462 | |
| | | | | | | | |
Philippines – 0.89% | | | | | | | | |
Bloomberry Resorts † | | | 1,335,600 | | | | 282,214 | |
| | | | | | | | |
| | | | | | | 282,214 | |
| | | | | | | | |
Republic of Korea – 0.71% | | | | | | | | |
Tera Semicon | | | 8,526 | | | | 225,091 | |
| | | | | | | | |
| | | | | | | 225,091 | |
| | | | | | | | |
South Africa – 0.50% | | | | | | | | |
Dis-Chem Pharmacies 144A # | | | 58,199 | | | | 157,008 | |
| | | | | | | | |
| | | | | | | 157,008 | |
| | | | | | | | |
Spain – 1.10% | | | | | | | | |
CIE Automotive | | | 11,835 | | | | 347,854 | |
| | | | | | | | |
| | | | | | | 347,854 | |
| | | | | | | | |
Sweden – 4.38% | | | | | | | | |
Evolution Gaming Group 144A # | | | 6,679 | | | | 441,227 | |
LeoVegas 144A # | | | 38,479 | | | | 391,871 | |
Scandic Hotels Group 144A # | | | 27,304 | | | | 355,531 | |
SSAB Class A † | | | 42,501 | | | | 199,882 | |
| | | | | | | | |
| | | | | | | 1,388,511 | |
| | | | | | | | |
Switzerland – 3.15% | | | | | | | | |
Forbo Holding | | | 174 | | | | 258,111 | |
Georg Fischer | | | 155 | | | | 204,271 | |
Logitech International | | | 7,288 | | | | 254,227 | |
Temenos Group † | | | 2,269 | | | | 280,409 | |
| | | | | | | | |
| | | | | | | 997,018 | |
| | | | | | | | |
15
Schedule of investments
Delaware International Small Cap Fund
| | | | | | | | |
| | | Number of shares | | | Value (US $) | |
Common StockD (continued) | | | | | | | | |
| | | | | | | | | |
Taiwan – 5.71% | | | | | | | | |
Accton Technology | | | 109,000 | | | $ | 401,745 | |
Airtac International Group | | | 34,072 | | | | 583,824 | |
China General Plastics | | | 251,370 | | | | 242,316 | |
Gourmet Master | | | 24,000 | | | | 303,777 | |
Nanya Technology | | | 107,000 | | | | 279,427 | |
| | | | | | | | |
| | | | | | | 1,811,089 | |
| | | | | | | | |
Thailand – 1.06% | | | | | | | | |
Tisco Financial Group Foreign Shares | | | 124,900 | | | | 337,490 | |
| | | | | | | | |
| | | | | | | 337,490 | |
| | | | | | | | |
Turkey – 1.91% | | | | | | | | |
Mavi Giyim Sanayi Ve Ticaret Class B 144A #† | | | 21,327 | | | | 287,835 | |
Turk Hava Yollari † | | | 101,454 | | | | 316,222 | |
| | | | | | | | |
| | | | | | | 604,057 | |
| | | | | | | | |
United Kingdom – 9.37% | | | | | | | | |
Abcam | | | 32,864 | | | | 436,897 | |
Cranswick | | | 9,382 | | | | 408,434 | |
CVS Group | | | 15,958 | | | | 217,974 | |
Fevertree Drinks | | | 17,321 | | | | 456,786 | |
Ibstock 144A # | | | 82,993 | | | | 270,253 | |
Indivior † | | | 50,670 | | | | 254,095 | |
KAZ Minerals † | | | 44,790 | | | | 453,882 | |
Sanne Group | | | 28,193 | | | | 278,336 | |
Scapa Group | | | 29,169 | | | | 194,085 | |
| | | | | | | | |
| | | | | | | 2,970,742 | |
| | | | | | | | |
United States – 2.36% | | | | | | | | |
Burford Capital | | | 29,240 | | | | 487,184 | |
SMART Global Holdings † | | | 8,700 | | | | 260,913 | |
| | | | | | | | |
| | | | | | | 748,097 | |
| | | | | | | | |
Uruguay – 0.81% | | | | | | | | |
Biotoscana Investments BDR † | | | 37,200 | | | | 257,966 | |
| | | | | | | | |
| | | | | | | 257,966 | |
| | | | | | | | |
Total Common Stock (cost $24,840,249) | | | | | | | 30,417,275 | |
| | | | | | | | |
| | |
Preferred Stock – 0.88%D | | | | | | | | |
| | | | | | | | | |
Brazil – 0.88% | | | | | | | | |
Bradespar 2.26% | | | 36,200 | | | | 279,895 | |
| | | | | | | | |
Total Preferred Stock (cost $239,649) | | | | | | | 279,895 | |
| | | | | | | | |
16
| | | | | | | | |
| | | Principal amount° | | | Value (US $) | |
Short-Term Investments – 1.74% | | | | | | | | |
| | | | | | | | | |
Discount Note – 0.14%≠ | | | | | | | | |
Federal Farm Credit 1.00% 12/6/17 | | | 43,690 | | | $ | 43,683 | |
| | | | | | | | |
| | | | | | | 43,683 | |
| | | | | | | | |
Repurchase Agreements – 1.25% | | | | | | | | |
Bank of America Merrill Lynch
0.97%, dated 11/30/17, to be repurchased on 12/1/17, repurchase price $65,559 (collateralized by US government obligations 2.25% 12/31/23; market value $66,869) | | | 65,557 | | | | 65,557 | |
Bank of Montreal
0.92%, dated 11/30/17, to be repurchased on 12/1/17, repurchase price $163,898 (collateralized by US government obligations 0.00%-3.50% 1/2/18-5/15/47; market value $167,172) | | | 163,894 | | | | 163,894 | |
BNP Paribas
1.00%, dated 11/30/17, to be repurchased on 12/1/17, repurchase price $167,654 (collateralized by US government obligations 0.00%-3.625% 3/31/18-2/15/46; market value $171,003) | | | 167,650 | | | | 167,650 | |
| | | | | | | | |
| | | | | | | 397,101 | |
| | | | | | | | |
US Treasury Obligation – 0.35%≠ | | | | | | | | |
US Treasury Bill 0.93% 12/7/17 | | | 109,225 | | | | 109,208 | |
| | | | | | | | |
| | | | | | | 109,208 | |
| | | | | | | | |
Total Short-Term Investments (cost $549,993) | | | | | | | 549,992 | |
| | | | | | | | |
Total Value of Securities – 98.59% (cost $25,629,891) | | | | | | $ | 31,247,162 | |
| | | | | | | | |
| # | Security exempt from registration under Rule 144A of the Securities Act of 1933, as amended. At Nov. 30, 2017, the aggregate value of Rule 144A securities was $2,309,448, which represents 7.29% of the Fund’s net assets. See Note 11 in “Notes to financial statements.” |
| ≠ | The rate shown is the effective yield at the time of purchase. |
| ° | Principal amount shown is stated in US dollars unless noted that the security is denominated in another currency. |
| D | Securities have been classified by country of origin. Aggregate classification by business sector has been presented on page 11 in “Security type / country and sector allocations.” |
| † | Non-income producing security. |
17
Schedule of investments
Delaware International Small Cap Fund
The following foreign currency exchange contracts were outstanding at Nov. 30, 2017:1
Foreign Currency Exchange Contracts
| | | | | | | | | | | | | | | | | | | | | | | | |
Counterparty | | Contracts to
Receive (Deliver) | | | In Exchange For | | | Settlement
Date | | | Unrealized
Appreciation | |
BNYM | | | GBP | | | | 59,920 | | | | USD | | | | (80,541 | ) | | | 12/1/17 | | | $ | 497 | |
BNYM | | | JPY | | | | (25,680,680 | ) | | | USD | | | | 228,996 | | | | 12/4/17 | | | | 780 | |
BNYM | | | JPY | | | | (258,272 | ) | | | USD | | | | 2,295 | | | | 12/5/17 | | | | — | |
| | | | | | | | | | | | | | | | | | | | | | | | |
Total Foreign Currency Exchange Contracts | | | | | | | | | | | | | | | | | | | | | | $ | 1,277 | |
| | | | | | | | | | | | | | | | | | | | | | | | |
The use of foreign currency exchange contracts involves elements of market risk and risks in excess of the amounts disclosed in the financial statements. The foreign currency exchange contracts presented above represent the Fund’s total exposure in such contracts, whereas only the net unrealized appreciation (depreciation) is reflected in the Fund’s net assets.
1See Note 8 in “Notes to financial statements.”
Summary of abbreviations:
ADR – American Depositary Receipt
BDR – Brazilian Depositary Receipt
BNYM – BNY Mellon
GBP – British Pound Sterling
JPY – Japanese Yen
USD – US Dollar
See accompanying notes, which are an integral part of the financial statements.
18
This page intentionally left blank.
Statement of assets and liabilities
| | |
| Delaware International Small Cap Fund | | November 30, 2017 |
| | | | |
Assets: | | | | |
Investments, at value1 | | $ | 30,697,170 | |
Short-term investments, at value2 | | | 549,992 | |
Foreign currencies, at value3 | | | 153,333 | |
Cash | | | 2,068 | |
Receivable for securities sold | | | 295,431 | |
Receivable for fund shares sold | | | 68,800 | |
Dividends and interest receivable | | | 24,607 | |
Foreign tax reclaims receivable | | | 66,686 | |
Receivable from investment manager | | | 38,762 | |
Unrealized appreciation on foreign currency exchange contracts | | | 1,277 | |
| | | | |
Total assets | | | 31,898,126 | |
| | | | |
Liabilities: | | | | |
Payable for securities purchased | | | 81,038 | |
Payable for fund shares redeemed | | | 22,781 | |
Audit and tax fees payable | | | 36,024 | |
Other accrued expenses | | | 31,210 | |
Deferred foreign taxes payable | | | 23,443 | |
Distribution fees payable to affiliates | | | 6,803 | |
Dividend disbursing and transfer agent fees and expenses payable to affiliates | | | 517 | |
Accounting and administration expenses payable to affiliates | | | 429 | |
Legal fees payable to affiliates | | | 399 | |
Trustees’ fees and expenses payable | | | 191 | |
Reports and statements to shareholders expenses payable to affiliates | | | 24 | |
| | | | |
Total liabilities | | | 202,859 | |
| | | | |
Total Net Assets | | $ | 31,695,267 | |
| | | | |
| |
Net Assets Consist of: | | | | |
Paid-in capital | | $ | 25,101,245 | |
Distributions in excess of net investment income | | | (176,169 | ) |
Accumulated net realized gain on investments | | | 1,179,344 | |
Net unrealized appreciation of investments* | | | 5,593,828 | |
Net unrealized depreciation of foreign currencies | | | (4,258 | ) |
Net unrealized appreciation of foreign currency exchange contracts | | | 1,277 | |
| | | | |
Total Net Assets | | $ | 31,695,267 | |
| | | | |
*Includes $23,443 capital gain taxes accrued.
20
| | | | |
Net Asset Value | | | | |
Class A: | | | | |
Net assets | | $ | 12,376,819 | |
Shares of beneficial interest outstanding, unlimited authorization, no par | | | 1,548,547 | |
Net asset value per share | | $ | 7.99 | |
Sales charge | | | 5.75 | % |
Offering price per share, equal to net asset value per share / (1 – sales charge) | | $ | 8.48 | |
| |
Class C: | | | | |
Net assets | | $ | 5,199,093 | |
Shares of beneficial interest outstanding, unlimited authorization, no par | | | 761,082 | |
Net asset value per share | | $ | 6.83 | |
| |
Class R: | | | | |
Net assets | | $ | 92,206 | |
Shares of beneficial interest outstanding, unlimited authorization, no par | | | 12,113 | |
Net asset value per share | | $ | 7.61 | |
| |
Institutional Class: | | | | |
Net assets | | $ | 14,024,787 | |
Shares of beneficial interest outstanding, unlimited authorization, no par | | | 1,681,428 | |
Net asset value per share | | $ | 8.34 | |
| |
Class R6: | | | | |
Net assets | | $ | 2,362 | |
Shares of beneficial interest outstanding, unlimited authorization, no par | | | 283 | |
Net asset value per share | | $ | 8.35 | |
| |
1Investments, at cost | | $ | 25,079,898 | |
2Short-term investments, at cost | | | 549,993 | |
3Foreign currencies, at cost | | | 152,707 | |
See accompanying notes, which are an integral part of the financial statements.
21
Statement of operations
| | |
| Delaware International Small Cap Fund | | Year ended November 30, 2017 |
| | | | |
Investment Income: | | | | |
Dividends | | $ | 266,085 | |
Interest | | | 6,395 | |
Foreign tax withheld | | | (30,487 | ) |
| | | | |
| | | 241,993 | |
| | | | |
Expenses: | | | | |
Management fees | | | 180,991 | |
Distribution expenses – Class A | | | 26,409 | |
Distribution expenses – Class C | | | 43,474 | |
Distribution expenses – Class R | | | 351 | |
Registration fees | | | 105,292 | |
Audit and tax fees | | | 44,053 | |
Legal fees | | | 36,122 | |
Dividend disbursing and transfer agent fees and expenses | | | 33,740 | |
Reports and statements to shareholders expenses | | | 24,193 | |
Accounting and administration expenses | | | 16,774 | |
Custodian fees | | | 7,429 | |
Trustees’ fees and expenses | | | 1,050 | |
Other | | | 25,137 | |
| | | | |
| | | 545,015 | |
Less expenses waived | | | (233,524 | ) |
Less expenses paid indirectly | | | (152 | ) |
| | | | |
Total operating expenses | | | 311,339 | |
| | | | |
Net Investment Loss | | | (69,346 | ) |
| | | | |
| |
Net Realized and Unrealized Gain (Loss): | | | | |
Net realized gain (loss) on: | | | | |
Investments | | | 1,300,034 | |
Foreign currencies | | | (225,786 | ) |
Foreign currency exchange contracts | | | 9,447 | |
| | | | |
Net realized gain | | | 1,083,695 | |
| | | | |
Net change in unrealized appreciation (depreciation) of: | | | | |
Investments* | | | 5,249,429 | |
Foreign currencies | | | 3,960 | |
Foreign currency exchange contracts | | | 20,281 | |
| | | | |
Net change in unrealized appreciation (depreciation) | | | 5,273,670 | |
| | | | |
Net Realized and Unrealized Gain | | | 6,357,365 | |
| | | | |
Net Increase in Net Assets Resulting from Operations | | $ | 6,288,019 | |
| | | | |
*Includes $23,443 capital gain taxes accrued.
See accompanying notes, which are an integral part of the financial statements.
22
This page intentionally left blank.
Statements of changes in net assets
Delaware International Small Cap Fund
| | | | | | | | |
| | | Year ended | |
| | | 11/30/17 | | | 11/30/16 | |
| | |
Increase (Decrease) in Net Assets from Operations: | | | | | | | | |
Net investment income (loss) | | $ | (69,346 | ) | | $ | 66,792 | |
Net realized gain | | | 1,083,695 | | | | 16,316,522 | |
Net change in unrealized appreciation (depreciation) | | | 5,273,670 | | | | (15,979,876 | ) |
| | | | | | | | |
Net increase in net assets resulting from operations | | | 6,288,019 | | | | 403,438 | |
| | | | | | | | |
| | |
Dividends and Distributions to Shareholders from: | | | | | | | | |
Net realized gain: | | | | | | | | |
Class A | | | (10,020,739 | ) | | | (908,814 | ) |
Class C | | | (3,015,855 | ) | | | (192,191 | ) |
Class R | | | (36,619 | ) | | | (1,918 | ) |
Institutional Class | | | (2,864,606 | ) | | | (3,094,350 | ) |
| | | | | | | | |
| | | (15,937,819 | ) | | | (4,197,273 | ) |
| | | | | | | | |
| | |
Capital Share Transactions: | | | | | | | | |
Proceeds from shares sold: | | | | | | | | |
Class A | | | 4,204,914 | | | | 3,595,888 | |
Class C | | | 1,089,447 | | | | 506,935 | |
Class R | | | 19,218 | | | | 3,856 | |
Institutional Class | | | 14,783,555 | | | | 8,282,179 | |
Class R6 | | | 2,000 | | | | — | |
| | |
Net asset value of shares issued upon reinvestment of dividends and distributions: | | | | | | | | |
Class A | | | 9,638,668 | | | | 847,004 | |
Class C | | | 3,015,827 | | | | 191,962 | |
Class R | | | 36,592 | | | | 1,917 | |
Institutional Class | | | 2,860,069 | | | | 3,094,111 | |
| | | | | | | | |
| | | 35,650,290 | | | | 16,523,852 | |
| | | | | | | | |
24
| | | | | | | | |
| | | Year ended | |
| | | 11/30/17 | | | 11/30/16 | |
| | |
Capital Share Transactions (continued): | | | | | | | | |
Cost of shares redeemed: | | | | | | | | |
Class A | | $ | (9,964,853 | ) | | $ | (14,864,370 | ) |
Class C | | | (1,697,946 | ) | | | (1,434,702 | ) |
Class R | | | (1,562 | ) | | | (59,568 | ) |
Institutional Class | | | (20,225,250 | ) | | | (85,410,690 | ) |
| | | | | | | | |
| | | (31,889,611 | ) | | | (101,769,330 | ) |
| | | | | | | | |
Increase (decrease) in net assets derived from capital share transactions | | | 3,760,679 | | | | (85,245,478 | ) |
| | | | | | | | |
Net Decrease in Net Assets | | | (5,889,121 | ) | | | (89,039,313 | ) |
| | |
Net Assets: | | | | | | | | |
Beginning of year | | | 37,584,388 | | | | 126,623,701 | |
| | | | | | | | |
End of year | | $ | 31,695,267 | | | $ | 37,584,388 | |
| | | | | | | | |
Distributions in excess of net investment income | | $ | (176,169 | ) | | $ | (8 | ) |
| | | | | | | | |
See accompanying notes, which are an integral part of the financial statements.
25
Financial highlights
Delaware International Small Cap Fund Class A
Selected data for each share of the Fund outstanding throughout each period were as follows:
| | | | | | | | | | | | | | | | | | | | |
Net asset value, beginning of period | | | | | | | | | | | | | | | | | | | | |
| | | | | |
Income (loss) from investment operations: | | | | | | | | | | | | | | | | | | | | |
Net investment income (loss)1 | | | | | | | | | | | | | | | | | | | | |
Net realized and unrealized gain (loss) | | | | | | | | | | | | | | | | | | | | |
Total from investment operations | | | | | | | | | | | | | | | | | | | | |
| | | | | |
Less dividends and distributions from: | | | | | | | | | | | | | | | | | | | | |
Net investment income | | | | | | | | | | | | | | | | | | | | |
Net realized gain | | | | | | | | | | | | | | | | | | | | |
Total dividends and distributions | | | | | | | | | | | | | | | | | | | | |
| | | | | |
Net asset value, end of period | | | | | | | | | | | | | | | | | | | | |
| | | | | |
Total return2 | | | | | | | | | | | | | | | | | | | | |
| | | | | |
Ratios and supplemental data: | | | | | | | | | | | | | | | | | | | | |
Net assets, end of period (000 omitted) | | | | | | | | | | | | | | | | | | | | |
Ratio of expenses to average net assets | | | | | | | | | | | | | | | | | | | | |
Ratio of expenses to average net assets prior to fees waived3 | | | | | | | | | | | | | | | | | | | | |
Ratio of net investment income (loss) to average net assets | | | | | | | | | | | | | | | | | | | | |
Ratio of net investment income (loss) to average net assets prior to fees waived3 | | | | | | | | | | | | | | | | | | | | |
Portfolio turnover | | | | | | | | | | | | | | | | | | | | |
| | | | | | | | | | | | | | | | | | | | | |
| 1 | The average shares outstanding method has been applied for per share information. |
| 2 | Total investment return is based on the change in net asset value of a share during the period and assumes reinvestment of dividends and distributions at net asset value. Total investment return during some of the periods shown reflects waivers by the manager and/or distributor. Performance would have been lower had the waivers not been in effect. |
| 3 | Expenses paid indirectly were not material and had no impact on the ratios disclosed. Expenses paid indirectly for the year ended Nov. 30, 2017 are reflected on the “Statement of operations.” |
See accompanying notes, which are an integral part of the financial statements.
26
| | | | | | | | | | | | | | | | | | | | |
| | | Year ended | |
| | | 11/30/17 | | | 11/30/16 | | | 11/30/15 | | | 11/30/14 | | | 11/30/13 | |
| | $ | 19.03 | | | $ | 19.78 | | | $ | 20.06 | | | $ | 19.18 | | | $ | 15.90 | |
| | | | | |
| | | | | | | | | | | | | | | | | | | | |
| | | (0.02 | ) | | | (0.02 | ) | | | (0.05 | ) | | | 0.10 | | | | 0.03 | |
| | | 1.86 | | | | (0.06 | ) | | | (0.15 | ) | | | 1.10 | | | | 3.25 | |
| | | | | | | | | | | | | | | | | | | | |
| | | 1.84 | | | | (0.08 | ) | | | (0.20 | ) | | | 1.20 | | | | 3.28 | |
| | | | | | | | | | | | | | | | | | | | |
| | | | | |
| | | | | | | | | | | | | | | | | | | | |
| | | — | | | | — | | | | (0.08 | ) | | | — | | | | — | |
| | | (12.88 | ) | | | (0.67 | ) | | | — | | | | (0.32 | ) | | | — | |
| | | | | | | | | | | | | | | | | | | | |
| | | (12.88 | ) | | | (0.67 | ) | | | (0.08 | ) | | | (0.32 | ) | | | — | |
| | | | | | | | | | | | | | | | | | | | |
| | | | | |
| | $ | 7.99 | | | $ | 19.03 | | | $ | 19.78 | | | $ | 20.06 | | | $ | 19.18 | |
| | | | | | | | | | | | | | | | | | | | |
| | | | | |
| | | 39.78% | | | | (0.38% | ) | | | (1.02% | ) | | | 6.37% | | | | 20.63% | |
| | | | | |
| | | | | | | | | | | | | | | | | | | | |
| | $ | 12,377 | | | $ | 15,158 | | | $ | 27,046 | | | $ | 28,583 | | | $ | 46,830 | |
| | | 1.38% | | | | 1.48% | | | | 1.45% | | | | 1.40% | | | | 1.51% | |
| | | 2.48% | | | | 1.51% | | | | 1.45% | | | | 1.40% | | | | 1.55% | |
| | | (0.22% | ) | | | (0.09% | ) | | | (0.23% | ) | | | 0.54% | | | | 0.18% | |
| | | (1.32% | ) | | | (0.12% | ) | | | (0.23% | ) | | | 0.54% | | | | 0.14% | |
| | | 142% | | | | 66% | | | | 41% | | | | 26% | | | | 36% | |
| | | | | | | | | | | | | | | | | | | | | |
27
Financial highlights
Delaware International Small Cap Fund Class C
Selected data for each share of the Fund outstanding throughout each period were as follows:
| | | | | | | | | | | | | | | | | | | | |
Net asset value, beginning of period | | | | | | | | | | | | | | | | | | | | |
| | | | | |
Income (loss) from investment operations: | | | | | | | | | | | | | | | | | | | | |
Net investment loss1 | | | | | | | | | | | | | | | | | | | | |
Net realized and unrealized gain (loss) | | | | | | | | | | | | | | | | | | | | |
Total from investment operations | | | | | | | | | | | | | | | | | | | | |
| | | | | |
Less dividends and distributions from: | | | | | | | | | | | | | | | | | | | | |
Net realized gain | | | | | | | | | | | | | | | | | | | | |
Total dividends and distributions | | | | | | | | | | | | | | | | | | | | |
| | | | | |
Net asset value, end of period | | | | | | | | | | | | | | | | | | | | |
| | | | | |
Total return2 | | | | | | | | | | | | | | | | | | | | |
| | | | | |
Ratios and supplemental data: | | | | | | | | | | | | | | | | | | | | |
Net assets, end of period (000 omitted) | | | | | | | | | | | | | | | | | | | | |
Ratio of expenses to average net assets | | | | | | | | | | | | | | | | | | | | |
Ratio of expenses to average net assets prior to fees waived3 | | | | | | | | | | | | | | | | | | | | |
Ratio of net investment loss to average net assets | | | | | | | | | | | | | | | | | | | | |
Ratio of net investment loss to average net assets prior to fees waived3 | | | | | | | | | | | | | | | | | | | | |
Portfolio turnover | | | | | | | | | | | | | | | | | | | | |
| | | | | | | | | | | | | | | | | | | | | |
| 1 | The average shares outstanding method has been applied for per share information. |
| 2 | Total investment return is based on the change in net asset value of a share during the period and assumes reinvestment of dividends and distributions at net asset value and does not reflect the impact of a sales charge. Total investment return during some of the periods shown reflect a waiver by the manager. Performance would have been lower had the waiver not been in effect. |
| 3 | Expenses paid indirectly were not material and had no impact on the ratios disclosed. Expenses paid indirectly for the year ended Nov. 30, 2017 are reflected on the “Statement of operations.” |
See accompanying notes, which are an integral part of the financial statements.
28
| | | | | | | | | | | | | | | | | | | | |
| | | Year ended | |
| | | 11/30/17 | | | 11/30/16 | | | 11/30/15 | | | 11/30/14 | | | 11/30/13 | |
| | $ | 18.24 | | | $ | 19.13 | | | $ | 19.47 | | | $ | 18.76 | | | $ | 15.67 | |
| | | | | |
| | | | | | | | | | | | | | | | | | | | |
| | | (0.06 | ) | | | (0.15 | ) | | | (0.19 | ) | | | (0.04 | ) | | | (0.10 | ) |
| | | 1.53 | | | | (0.07 | ) | | | (0.15 | ) | | | 1.07 | | | | 3.19 | |
| | | | | | | | | | | | | | | | | | | | |
| | | 1.47 | | | | (0.22 | ) | | | (0.34 | ) | | | 1.03 | | | | 3.09 | |
| | | | | | | | | | | | | | | | | | | | |
| | | | | |
| | | | | | | | | | | | | | | | | | | | |
| | | (12.88 | ) | | | (0.67 | ) | | | — | | | | (0.32 | ) | | | — | |
| | | | | | | | | | | | | | | | | | | | |
| | | (12.88 | ) | | | (0.67 | ) | | | — | | | | (0.32 | ) | | | — | |
| | | | | | | | | | | | | | | | | | | | |
| | | | | |
| | $ | 6.83 | | | $ | 18.24 | | | $ | 19.13 | | | $ | 19.47 | | | $ | 18.76 | |
| | | | | | | | | | | | | | | | | | | | |
| | | | | |
| | | 38.77% | | | | (1.15% | ) | | | (1.75% | ) | | | 5.59% | | | | 19.72% | |
| | | | | |
| | | | | | | | | | | | | | | | | | | | |
| | $ | 5,199 | | | $ | 4,417 | | | $ | 5,424 | | | $ | 5,759 | | | $ | 5,863 | |
| | | 2.13% | | | | 2.23% | | | | 2.20% | | | | 2.15% | | | | 2.26% | |
| | | 3.23% | | | | 2.26% | | | | 2.20% | | | | 2.15% | | | | 2.26% | |
| | | (0.97% | ) | | | (0.84% | ) | | | (0.98% | ) | | | (0.21% | ) | | | (0.57% | ) |
| | | (2.07% | ) | | | (0.87% | ) | | | (0.98% | ) | | | (0.21% | ) | | | (0.57% | ) |
| | | 142% | | | | 66% | | | | 41% | | | | 26% | | | | 36% | |
| | | | | | | | | | | | | | | | | | | | | |
29
Financial highlights
Delaware International Small Cap Fund Class R
Selected data for each share of the Fund outstanding throughout each period were as follows:
| | | | | | | | | | | | | | | | | | | | |
Net asset value, beginning of period | | | | | | | | | | | | | | | | | | | | |
| | | | | |
Income (loss) from investment operations: | | | | | | | | | | | | | | | | | | | | |
Net investment income (loss)1 | | | | | | | | | | | | | | | | | | | | |
Net realized and unrealized gain (loss) | | | | | | | | | | | | | | | | | | | | |
Total from investment operations. | | | | | | | | | | | | | | | | | | | | |
| | | | | |
Less dividends and distributions from: | | | | | | | | | | | | | | | | | | | | |
Net investment income | | | | | | | | | | | | | | | | | | | | |
Net realized gain | | | | | | | | | | | | | | | | | | | | |
Total dividends and distributions | | | | | | | | | | | | | | | | | | | | |
| | | | | |
Net asset value, end of period | | | | | | | | | | | | | | | | | | | | |
| | | | | |
Total return2 | | | | | | | | | | | | | | | | | | | | |
| | | | | |
Ratios and supplemental data: | | | | | | | | | | | | | | | | | | | | |
Net assets, end of period (000 omitted) | | | | | | | | | | | | | | | | | | | | |
Ratio of expenses to average net assets | | | | | | | | | | | | | | | | | | | | |
Ratio of expenses to average net assets prior to fees waived3 | | | | | | | | | | | | | | | | | | | | |
Ratio of net investment income (loss) to average net assets | | | | | | | | | | | | | | | | | | | | |
Ratio of net investment income (loss) to average net assets prior to fees waived3 | | | | | | | | | | | | | | | | | | | | |
Portfolio turnover | | | | | | | | | | | | | | | | | | | | |
| | | | | | | | | | | | | | | | | | | | | |
| 1 | The average shares outstanding method has been applied for per share information. |
| 2 | Total investment return is based on the change in net asset value of a share during the period and assumes reinvestment of dividends and distributions at net asset value. Total investment return during some of the periods shown reflects waivers by the manager and/or distributor. Performance would have been lower had the waivers not been in effect. |
| 3 | Expenses paid indirectly were not material and had no impact on the ratios disclosed. Expenses paid indirectly for the year ended Nov. 30, 2017 are reflected on the “Statement of operations.” |
See accompanying notes, which are an integral part of the financial statements.
30
| | | | | | | | | | | | | | | | | | | | |
| | | Year ended | |
| | | 11/30/17 | | | 11/30/16 | | | 11/30/15 | | | 11/30/14 | | | 11/30/13 | |
| | $ | 18.77 | | | $ | 19.57 | | | $ | 19.85 | | | $ | 19.03 | | | $ | 15.81 | |
| | | | | |
| | | | | | | | | | | | | | | | | | | | |
| | | (0.03 | ) | | | (0.06 | ) | | | (0.09 | ) | | | 0.06 | | | | (0.01 | ) |
| | | 1.75 | | | | (0.07 | ) | | | (0.16 | ) | | | 1.08 | | | | 3.23 | |
| | | | | | | | | | | | | | | | | | | | |
| | | 1.72 | | | | (0.13 | ) | | | (0.25 | ) | | | 1.14 | | | | 3.22 | |
| | | | | | | | | | | | | | | | | | | | |
| | | | | |
| | | | | | | | | | | | | | | | | | | | |
| | | — | | | | — | | | | (0.03 | ) | | | — | | | | — | |
| | | (12.88 | ) | | | (0.67 | ) | | | — | | | | (0.32 | ) | | | — | |
| | | | | | | | | | | | | | | | | | | | |
| | | (12.88 | ) | | | (0.67 | ) | | | (0.03 | ) | | | (0.32 | ) | | | — | |
| | | | | | | | | | | | | | | | | | | | |
| | | | | |
| | $ | 7.61 | | | $ | 18.77 | | | $ | 19.57 | | | $ | 19.85 | | | $ | 19.03 | |
| | | | | | | | | | | | | | | | | | | | |
| | | | | |
| | | 39.45% | | | | (0.65% | ) | | | (1.27% | ) | | | 6.10% | | | | 20.37% | |
| | | | | |
| | | | | | | | | | | | | | | | | | | | |
| | $ | 92 | | | $ | 51 | | | $ | 107 | | | $ | 141 | | | $ | 129 | |
| | | 1.63% | | | | 1.73% | | | | 1.70% | | | | 1.65% | | | | 1.76% | |
| | | 2.73% | | | | 1.76% | | | | 1.70% | | | | 1.65% | | | | 1.84% | |
| | | (0.47% | ) | | | (0.34% | ) | | | (0.48% | ) | | | 0.29% | | | | (0.07% | ) |
| | | (1.57% | ) | | | (0.37% | ) | | | (0.48% | ) | | | 0.29% | | | | (0.15% | ) |
| | | 142% | | | | 66% | | | | 41% | | | | 26% | | | | 36% | |
| | | | | | | | | | | | | | | | | | | | | |
31
Financial highlights
Delaware International Small Cap Fund Institutional Class
Selected data for each share of the Fund outstanding throughout each period were as follows:
| | | | | | | | | | | | | | | | | | | | |
Net asset value, beginning of period | | | | | | | | | | | | | | | | | | | | |
| | | | | |
Income (loss) from investment operations: | | | | | | | | | | | | | | | | | | | | |
Net investment income1 | | | | | | | | | | | | | | | | | | | | |
Net realized and unrealized gain (loss) | | | | | | | | | | | | | | | | | | | | |
Total from investment operations | | | | | | | | | | | | | | | | | | | | |
| | | | | |
Less dividends and distributions from: | | | | | | | | | | | | | | | | | | | | |
Net investment income | | | | | | | | | | | | | | | | | | | | |
Net realized gain | | | | | | | | | | | | | | | | | | | | |
Total dividends and distributions | | | | | | | | | | | | | | | | | | | | |
| | | | | |
Net asset value, end of period | | | | | | | | | | | | | | | | | | | | |
| | | | | |
Total return3 | | | | | | | | | | | | | | | | | | | | |
| | | | | |
Ratios and supplemental data: | | | | | | | | | | | | | | | | | | | | |
Net assets, end of period (000 omitted) | | | | | | | | | | | | | | | | | | | | |
Ratio of expenses to average net assets | | | | | | | | | | | | | | | | | | | | |
Ratio of expenses to average net assets prior to fees waived4 | | | | | | | | | | | | | | | | | | | | |
Ratio of net investment income to average net assets | | | | | | | | | | | | | | | | | | | | |
Ratio of net investment income (loss) to average net assets prior to fees waived4 | | | | | | | | | | | | | | | | | | | | |
Portfolio turnover | | | | | | | | | | | | | | | | | | | | |
| | | | | | | | | | | | | | | | | | | | | |
| 1 | The average shares outstanding method has been applied for per share information. |
| 2 | Amount is less than $0.005 per share. |
| 3 | Total investment return is based on the change in net asset value of a share during the period and assumes reinvestment of dividends and distributions at net asset value. Total investment return during some of the periods shown reflects a waiver by the manager. Performance would have been lower had the waiver not been in effect. |
| 4 | Expenses paid indirectly were not material and had no impact on the ratios disclosed. Expenses paid indirectly for the year ended Nov. 30, 2017 are reflected on the “Statement of operations.” |
See accompanying notes, which are an integral part of the financial statements.
32
| | | | | | | | | | | | | | | | | | | | |
| | | Year ended | |
| | | 11/30/17 | | | 11/30/16 | | | 11/30/15 | | | 11/30/14 | | | 11/30/13 | |
| | $ | 19.27 | | | $ | 19.97 | | | $ | 20.25 | | | $ | 19.32 | | | $ | 15.97 | |
| | | | | |
| | | | | | | | | | | | | | | | | | | | |
| | | — | 2 | | | 0.03 | | | | — | 2 | | | 0.15 | | | | 0.08 | |
| | | 1.95 | | | | (0.06 | ) | | �� | (0.16 | ) | | | 1.11 | | | | 3.27 | |
| | | | | | | | | | | | | | | | | | | | |
| | | 1.95 | | | | (0.03 | ) | | | (0.16 | ) | | | 1.26 | | | | 3.35 | |
| | | | | | | | | | | | | | | | | | | | |
| | | | | |
| | | | | | | | | | | | | | | | | | | | |
| | | — | | | | — | | | | (0.12 | ) | | | (0.01 | ) | | | — | |
| | | (12.88 | ) | | | (0.67 | ) | | | — | | | | (0.32 | ) | | | — | |
| | | | | | | | | | | | | | | | | | | | |
| | | (12.88 | ) | | | (0.67 | ) | | | (0.12 | ) | | | (0.33 | ) | | | — | |
| | | | | | | | | | | | | | | | | | | | |
| | | | | |
| | $ | 8.34 | | | $ | 19.27 | | | $ | 19.97 | | | $ | 20.25 | | | $ | 19.32 | |
| | | | | | | | | | | | | | | | | | | | |
| | | | | |
| | | 40.06% | | | | (0.12% | ) | | | (0.77% | ) | | | 6.66% | | | | 20.98% | |
| | | | | |
| | | | | | | | | | | | | | | | | | | | |
| | $ | 14,025 | | | $ | 17,958 | | | $ | 94,047 | | | $ | 98,801 | | | $ | 34,541 | |
| | | 1.13% | | | | 1.23% | | | | 1.20% | | | | 1.15% | | | | 1.26% | |
| | | 2.23% | | | | 1.26% | | | | 1.20% | | | | 1.15% | | | | 1.26% | |
| | | 0.03% | | | | 0.16% | | | | 0.02% | | | | 0.79% | | | | 0.43% | |
| | | (1.07% | ) | | | 0.13% | | | | 0.02% | | | | 0.79% | | | | 0.43% | |
| | | 142% | | | | 66% | | | | 41% | | | | 26% | | | | 36% | |
| | | | | | | | | | | | | | | | | | | | | |
33
Financial highlights
Delaware International Small Cap Fund Class R6
Selected data for each share of the Fund outstanding throughout the period were as follows:
| | | | |
| | | 6/30/171 to 11/30/17 | |
Net asset value, beginning of period | | $ | 7.07 | |
| |
Income (loss) from investment operations: | | | | |
Net investment loss2 | | | — | 3 |
Net realized and unrealized gain | | | 1.28 | |
| | | | |
Total from investment operations | | | 1.28 | |
| | | | |
| |
Net asset value, end of period | | $ | 8.35 | |
| | | | |
| |
Total return4 | | | 18.11 | % |
| |
Ratios and supplemental data: | | | | |
Net assets, end of period (000 omitted) | | $ | 2 | |
Ratio of expenses to average net assets | | | 1.00 | % |
Ratio of expenses to average net assets prior to fees waived5 | | | 2.28 | % |
Ratio of net investment loss to average net assets. | | | (0.08 | %) |
Ratio of net investment loss to average net assets prior to fees waived5 | | | (1.36 | %) |
Portfolio turnover | | | 142 | %6 |
| | | | | |
| 1 | Date of commencement of operations; ratios have been annualized and total return has not been annualized. |
| 2 | The average shares outstanding method has been applied for per share information. |
| 3 | Amount is less than $0.005 per share. |
| 4 | Total investment return is based on the change in net asset value of a share during the period and assumes reinvestment of dividends and distributions at net asset value. Total investment return shown reflects a waiver by the manager. Performance would have been lower had the waiver not been in effect. |
| 5 | Expenses paid indirectly were not material and had no impact on the ratios disclosed. Expenses paid indirectly for the year ended Nov. 30, 2017 are reflected on the “Statement of operations.” |
| 6 | Portfolio turnover is representative of the Fund for the entire year ended Nov. 30, 2017. |
34
Notes to financial statements
| | |
| Delaware International Small Cap Fund | | November 30, 2017 |
Delaware Group® Global & International Funds (Trust) is organized as a Delaware statutory trust and offers four series: Delaware Emerging Markets Fund, Delaware Global Value Fund, Delaware International Small Cap Fund, and Delaware International Value Equity Fund. These financial statements and the related notes pertain to Delaware International Small Cap Fund (Fund). The Trust is an open-end investment company. The Fund is considered diversified under the Investment Company Act of 1940, as amended (1940 Act), and offers Class A, Class C, Class R, Institutional Class, and Class R6 shares. Class A shares are sold with a maximum front-end sales charge of 5.75%. Class A share purchases of $1,000,000 or more will incur a contingent deferred sales charge (CDSC) instead of a front-end sales charge of 1.00%, if redeemed during the first year, and 0.50% during the second year, provided that Delaware Distributors, L.P. (DDLP) paid a financial advisor a commission on the purchase of those shares. Class C shares are sold with a CDSC of 1.00%, if redeemed during the first 12 months. Class R, Institutional Class, and Class R6 shares are not subject to a sales charge and are offered for sale exclusively to certain eligible investors. In addition, Class R6 shares do not pay any service fees, sub-accounting fees, and/or sub-transfer agency fees to any brokers, dealers or other financial intermediaries. Class R6 shares commenced operations on June 30, 2017.
The investment objective of the Fund is to seek long-term capital appreciation.
1. Significant Accounting Policies
The following accounting policies are in accordance with US generally accepted accounting principles (US GAAP) and are consistently followed by the Fund.
Security Valuation – Equity securities, except those traded on the Nasdaq Stock Market LLC (Nasdaq), are valued at the last quoted sales price as of the time of the regular close of the New York Stock Exchange on the valuation date. Equity securities traded on the Nasdaq are valued in accordance with the Nasdaq Official Closing Price, which may not be the last sales price. If, on a particular day, an equity security does not trade, the mean between the bid and ask prices will be used, which approximates fair value. Equity securities listed on a foreign exchange are normally valued at the last quoted sales price on the valuation date. US government and agency securities are valued at the mean between the bid and ask prices, which approximates fair value. Foreign currency exchange contracts and foreign cross currency exchange contracts are valued at the mean between the bid and ask prices, which approximates fair value. Interpolated values are derived when the settlement date of the contract is an interim date for which quotations are not available. Generally, other securities and assets for which market quotations are not readily available are valued at fair value as determined in good faith under the direction of the Trust’s Board of Trustees (Board). In determining whether market quotations are readily available or fair valuation will be used, various factors will be taken into consideration, such as market closures, or suspension of trading in a security. The Fund may use fair value pricing more frequently for securities traded primarily in non-US markets because, among other things, most foreign markets close well before the Fund values its securities, generally as of 4:00pm Eastern time. The earlier close of these foreign markets gives rise to the possibility that significant events, including broad market moves, government actions or pronouncements, aftermarket trading, or news events may have occurred in the interim. Whenever such a significant event occurs, the Fund may value foreign securities using fair value prices based on third-party vendor modeling tools (international fair value pricing). The foregoing valuation policy also applies to restricted and unrestricted securities.
35
Notes to financial statements
Delaware International Small Cap Fund
1. Significant Accounting Policies (continued)
Federal and Foreign Income Taxes – No provision for federal income taxes has been made as the Fund intends to continue to qualify for federal income tax purposes as a regulated investment company under Subchapter M of the Internal Revenue Code of 1986, as amended, and make the requisite distributions to shareholders. The Fund evaluates tax positions taken or expected to be taken in the course of preparing the Fund’s tax returns to determine whether the tax positions are “more-likely-than-not” of being sustained by the applicable tax authority. Tax positions not deemed to meet the “more-likely-than-not” threshold are recorded as a tax benefit or expense in the current year. Management has analyzed the Fund’s tax positions taken or to be taken on the Fund’s federal income tax returns through the year ended Nov. 30, 2017 and for all open federal income tax years (years ended Nov. 30, 2014–Nov. 30, 2016), and has concluded that no provision for federal income tax is required in the Fund’s financial statements. If applicable, the Fund recognizes interest accrued on unrecognized tax benefits in interest expense and penalties in other expenses on the “Statement of operations.” During year ended Nov. 30, 2017, the Fund did not incur any interest or tax penalties. In regard to foreign taxes only, the Fund has open tax years in certain foreign countries in which it invests that may date back to the inception of the Fund.
Class Accounting – Investment income, common expenses, and realized and unrealized gain (loss) on investments are allocated to the various classes of the Fund on the basis of daily net assets of each class. Distribution expenses relating to a specific class are charged directly to that class. Class R6 shares will not be allocated any expenses related to service fees, sub-accounting fees, and/or sub-transfer agency fees paid to brokers, dealers, or other financial intermediaries.
Repurchase Agreements – The Fund may purchase certain US government securities subject to the counterparty’s agreement to repurchase them at an agreed upon date and price. The counterparty will be required on a daily basis to maintain the value of the collateral subject to the agreement at not less than the repurchase price (including accrued interest). The agreements are conditioned upon the collateral being deposited under the Federal Reserve book-entry system with the Fund’s custodian or a third-party sub-custodian. In the event of default or bankruptcy by the other party to the agreement, retention of the collateral may be subject to legal proceedings. All open repurchase agreements as of the date of this report were entered into on Nov. 30, 2017 and matured the following business day.
Foreign Currency Transactions – Transactions denominated in foreign currencies are recorded at the prevailing exchange rates on the valuation date in accordance with the Fund’s prospectus. The value of all assets and liabilities denominated in foreign currencies is translated daily into US dollars at the exchange rate of such currencies against the US dollar. Transaction gains or losses resulting from changes in exchange rates during the reporting period or upon settlement of the foreign currency transaction are reported in operations for the current period. The Fund generally does not bifurcate that portion of realized gains and losses on investments which is due to changes in foreign exchange rates from that which is due to changes in market prices. These gains and losses are included on the “Statement of operations” under “Net realized and unrealized gain (loss) on investments.” The Fund reports certain foreign currency related transactions as components of realized gains (losses) for financial reporting purposes, whereas such components are treated as ordinary income (loss) for federal income tax purposes.
36
Use of Estimates – The Fund is an investment company, whose financial statements are prepared in conformity with US GAAP. Therefore, the Fund follows the accounting and reporting guidelines for investment companies. The preparation of financial statements in conformity with US GAAP requires management to make estimates and assumptions that affect the fair value of investments, the reported amounts of assets and liabilities and disclosure of contingent assets and liabilities at the date of the financial statements, and the reported amounts of revenues and expenses during the reporting period. Actual results could differ from those estimates and the differences could be material.
Other – Expenses directly attributable to the Fund are charged directly to the Fund. Other expenses common to various funds within the Delaware FundsSM by Macquarie (Delaware Funds) are generally allocated among such funds on the basis of average net assets. Management fees and certain other expenses are paid monthly. Security transactions are recorded on the date the securities are purchased or sold (trade date) for financial reporting purposes. Costs used in calculating realized gains and losses on the sale of investment securities are those of the specific securities sold. Dividend income is recorded on the ex-dividend date and interest income is recorded on the accrual basis. Discounts and premiums on debt securities are accreted or amortized to interest income, respectively over the lives of the respective securities using the effective interest method. Foreign dividends are also recorded on the ex-dividend date or as soon after the ex-dividend date that the Fund is aware of such dividends, net of all tax withholdings, a portion of which may be reclaimable. Withholding taxes and reclaims on foreign dividends have been recorded in accordance with the Fund’s understanding of the applicable country’s tax rules and rates. The Fund pays foreign capital gain taxes on certain foreign securities held, which are reported as components of realized losses for financial reporting purposes, whereas such components are treated as ordinary loss for federal income tax purposes. The Fund will accrue such taxes as applicable based upon current interpretations of the tax rules and regulations that exist in the markets in which it invests. The Fund declares and pays dividends from net investment income and distributions from net realized gain on investments, if any, annually. The Fund may distribute more frequently, if necessary for tax purposes. Dividends and distributions, if any, are recorded on the ex-dividend date.
Subject to seeking best execution, the Fund may direct certain security trades to brokers who have agreed to rebate a portion of the related brokerage commission to the Fund in cash. In general, best execution refers to many factors, including the price paid or received for a security, the commission charged, the promptness and reliability of execution, the confidentiality and placement accorded the order, and other factors affecting the overall benefit obtained by the Fund on the transaction. There were no commission rebates for the year ended Nov. 30, 2017.
The Fund receives earnings credits from its custodian when positive cash balances are maintained, which may be used to offset custody fees. The expense paid under this arrangement is included on the “Statements of operations” under “Custodian fees” with the corresponding offset included under “Less expenses paid indirectly.” For the year ended Nov. 30, 2017, the Fund earned $47 under this agreement.
37
Notes to financial statements
Delaware International Small Cap Fund
1. Significant Accounting Policies (continued)
The Fund receives earnings credits from its transfer agent when positive cash balances are maintained, which may be used to offset transfer agent fees. If the amount earned is greater than $1, the expense paid under this arrangement is included on the “Statement of operations” under “Dividend disbursing and transfer agent fees and expenses” with the corresponding expense offset included under “Less expenses paid indirectly.” For the year ended Nov. 30, 2017, the Fund earned $105 under this agreement.
2. Investment Management, Administration Agreements, and Other Transactions with Affiliates
In accordance with the terms of its investment management agreement, the Fund pays Delaware Management Company (DMC), a series of Macquarie Investment Management Business Trust (formerly, Delaware Management Business Trust) and the investment manager, an annual fee which is calculated daily and paid monthly at the rate of 0.85% on the first $500 million of average daily net assets of the Fund, 0.80% on the next $500 million, 0.75% on the next $1.5 billion, and 0.70% on the average daily net assets in excess of $2.5 billion.
DMC has contractually agreed to waive that portion, if any, of its management fee and/or pay/reimburse the Fund to the extent necessary to ensure that total annual fund operating expenses (excluding any distribution and service (12b-1) fees, acquired fund fees and expenses, taxes, interest, short sale and dividend interest expenses, brokerage fees, certain insurance costs, and nonroutine expenses or costs including, but not limited to, those relating to reorganizations, litigation, conducting shareholder meetings, and liquidations (collectively, nonroutine expenses)) do not exceed 1.13% of average daily net assets of Class A, Class C, Class R, and Institutional Class shares and 1.00% of average daily net assets of Class R6 shares from June 30, 2017 through Nov. 30, 2017.* Prior to June 30, 2017, the contractual waiver was 1.18% of average daily net assets of Class A, Class C, Class R, and Institutional Class shares.** For purposes of this waiver and reimbursement, nonroutine expenses may also include such additional costs and expenses as may be agreed upon from time to time by the Board and DMC. This expense waiver and reimbursement may only be terminated by agreement of DMC and the Fund.
Delaware Investments Fund Services Company (DIFSC), an affiliate of DMC, provides fund accounting and financial administration oversight services to the Fund. For these services, DIFSC’s fees were calculated daily and paid monthly based on the aggregate daily net assets of the Delaware Funds from Nov. 1, 2016 through Aug. 31, 2017 at the following annual rate: 0.0050% of the first $30 billion; 0.0045% of the next $10 billion; 0.0040% of the next $10 billion; and 0.0025% of aggregate average daily net assets in excess of $50 billion. The fees payable to DIFSC under the service agreement described above are allocated among all retail funds in the Delaware Funds on the relative net asset value (NAV) basis. Effective Sept. 1, 2017, the Fund as well as the other Delaware Funds entered into an amendment to the DIFSC agreement. Under the amendment to the DIFSC agreement, DIFSC’s fees are calculated daily and paid monthly based on the aggregate daily net assets of the Delaware Funds at the following annual rate: 0.00475% of the first $35 billion; 0.0040% of the next $10 billion; and 0.0025% of aggregate average daily net assets in excess of $45 billion (Total Fee). Each Fund in the Delaware Funds pays a minimum of $4,000, which, in aggregate, is subtracted from the Total Fee. Each Fund in the Delaware Funds then pays its portion of the remainder of the Total Fee on a relative NAV basis. For the
38
year ended Nov. 30, 2017, the Fund was charged $1,928 for these services. This amount is included on the “Statement of operation” under “Accounting and administration expenses.”
DIFSC is also the transfer agent and dividend disbursing agent of the Fund. For these services, DIFSC’s fees are calculated daily and paid monthly based on the aggregate daily net assets of the retail funds within the Delaware Funds at the following annual rate: 0.025% of the first $20 billion; 0.020% of the next $5 billion; 0.015% of the next $5 billion; and 0.013% of average daily net assets in excess of $30 billion. The fees payable to DIFSC under the service agreement described above are allocated among all retail funds in the Delaware Funds on a relative NAV basis. For the year ended Nov. 30, 2017, the Fund was charged $4,226. This amount is included on the “Statement of operations” under “Dividend disbursing and transfer agent fees and expenses.” Pursuant to a sub-transfer agency agreement between DIFSC and BNY Mellon Investment Servicing (US) Inc. (BNYMIS), BNYMIS provides certain sub-transfer agency services to the Fund. Sub-transfer agency fees are paid by the Fund and are also included on the “Statement of operations” under “Dividend disbursing and transfer agent fees and expenses.”
Pursuant to a distribution agreement and distribution plan, the Fund pays DDLP, the distributor and an affiliate of DMC, an annual 12b-1 fee of 0.25% of the average daily net assets of the Class A shares, 1.00% of the average daily net assets of the Class C shares, and 0.50% of the average daily net assets of the Class R shares. The fees are calculated daily and paid monthly. Institutional Class and Class R6 shares pay no 12b-1 fees.
As provided in the investment management agreement, the Fund bears a portion of the cost of certain resources shared with DMC, including the cost of internal personnel of DMC and/or its affiliates that provide legal, tax, and regulatory reporting services to the Fund. For the year ended Nov. 30, 2017, the Fund was charged $1,872 for internal legal, tax, and regulatory reporting services provided by DMC and/or its affiliates’ employees. This amount is included on the “Statement of operations” under “Legal fees.”
For the year ended Nov. 30, 2017, DDLP earned $4,357 for commissions on sales of the Fund’s Class A shares. For the year ended Nov. 30, 2017, DDLP received gross CDSC commissions of $1,636 on redemptions of the Fund’s Class C shares, and these commissions were entirely used to offset upfront commissions previously paid by DDLP to broker/dealers on sales of those shares.
Trustees’ fees include expenses accrued by the Fund for each Trustee’s retainer and meeting fees. Certain officers of DMC, DIFSC, and DDLP are officers and/or Trustees of the Trust. These officers and Trustees are paid no compensation by the Fund.
Cross trades for the year ended Nov. 30, 2017 were executed by the Fund pursuant to procedures adopted by the Board designed to ensure compliance with Rule 17a-7 under the 1940 Act. Cross trading is the buying or selling of portfolio securities between funds of investment companies, or between a fund of an investment company and another entity, that are or could be considered affiliates by virtue of having a common investment advisor (or affiliated investment advisors), common directors/trustees and/or common officers. At its regularly scheduled meetings, the Board reviews such transactions for compliance with the procedures adopted by the Board. Pursuant to these procedures, for the year
39
Notes to financial statements
Delaware International Small Cap Fund
2. Investment Management, Administration Agreements, and Other Transactions with Affiliates (continued)
ended Nov. 30, 2017, the Fund engaged in securities sales of $384,842, which resulted in net realized gains of $19. The Fund did not engage in securities purchases under Rule 17a-7 during the year ended Nov. 30, 2017.
*The aggregate contractual waiver period covering this report is from June 30, 2017 through June 30, 2018.
** The aggregate contractual waiver period was from March 30, 2016 through June 29, 2017.
3. Investments
For the year ended Nov. 30, 2017, the Fund made purchases and sales of investment securities other than short-term investments as follows:
| | | | |
Purchases | | $ | 30,942,976 | |
Sales | | | 44,137,318 | |
The tax cost of investments includes adjustments to net unrealized appreciation (depreciation) which may not necessarily be final tax cost basis adjustments, but approximate the tax basis unrealized gains and losses that may be realized and distributed to shareholders. At Nov. 30, 2017, the cost and unrealized appreciation (depreciation) of investments and derivatives for federal income tax purposes were as follows: | |
Cost of investments and derivatives | | $ | 25,952,049 | |
| | | | |
Aggregate unrealized appreciation of investments and derivatives | | $ | 5,905,526 | |
Aggregate unrealized depreciation of investments and derivatives | | | (609,136 | ) |
| | | | |
Net unrealized appreciation of investments and derivatives | | $ | 5,296,390 | |
| | | | |
US GAAP defines fair value as the price that the Fund would receive to sell an asset or pay to transfer a liability in an orderly transaction between market participants at the measurement date under current market conditions. A three-level hierarchy for fair value measurements has been established based upon the transparency of inputs to the valuation of an asset or liability. Inputs may be observable or unobservable and refer broadly to the assumptions that market participants would use in pricing the asset or liability. Observable inputs reflect the assumptions market participants would use in pricing the asset or liability based on market data obtained from sources independent of the reporting entity. Unobservable inputs reflect the reporting entity’s own assumptions about the assumptions that market participants would use in pricing the asset or liability based on the best information available under the circumstances. The Fund’s investment in its entirety is assigned a level based upon the observability of the inputs which are significant to the overall valuation. The three-level hierarchy of inputs is summarized below and on the next page.
| | |
| Level 1 – | | Inputs are quoted prices in active markets for identical investments. (Examples: equity securities, open-end investment companies, futures contracts, exchange-traded options contracts) |
| Level 2 – | | Other observable inputs, including, but not limited to: quoted prices for similar assets or liabilities in markets that are active, quoted prices for identical or similar assets or liabilities in markets that are not active, inputs other than quoted prices that are observable for the assets |
40
| | |
| | or liabilities (such as interest rates, yield curves, volatilities, prepayment speeds, loss severities, credit risks, and default rates), or other market-corroborated inputs. (Examples: debt securities, government securities, swap contracts, foreign currency exchange contracts, foreign securities utilizing international fair value pricing, broker-quoted securities, fair valued securities) |
| Level 3 – | | Significant unobservable inputs, including the Fund’s own assumptions used to determine the fair value of investments. (Examples: broker-quoted securities, fair valued securities) |
Level 3 investments are valued using significant unobservable inputs. The Fund may also use an income-based valuation approach in which the anticipated future cash flows of the investment are discounted to calculate fair value. Discounts may also be applied due to the nature or duration of any restrictions on the disposition of the investments. Valuations may also be based upon current market prices of securities that are comparable in coupon, rating, maturity, and industry. The derived value of a Level 3 investment may not represent the value which is received upon disposition and this could impact the results of operations.
41
Notes to financial statements
Delaware International Small Cap Fund
3. Investments (continued)
The following table summarizes the valuation of the Fund’s investments by fair value hierarchy levels as of Nov. 30, 2017:
| | | | | | | | | | | | |
| | | Level 1 | | | Level 2 | | | Total | |
Securities | | | | | | | | | | | | |
Assets: | | | | | | | | | | | | |
Common Stock | | | | | | | | | | | | |
Argentina | | $ | 319,545 | | | $ | — | | | $ | 319,545 | |
Australia | | | 296,664 | | | | 289,536 | | | | 586,200 | |
Austria | | | — | | | | 482,723 | | | | 482,723 | |
Brazil | | | 612,767 | | | | — | | | | 612,767 | |
Canada | | | 1,868,979 | | | | — | | | | 1,868,979 | |
China/Hong Kong | | | 733,702 | | | | 1,026,181 | | | | 1,759,883 | |
Denmark | | | 391,702 | | | | 478,991 | | | | 870,693 | |
Finland | | | — | | | | 435,719 | | | | 435,719 | |
France | | | 308,427 | | | | 833,786 | | | | 1,142,213 | |
Germany | | | — | | | | 128,930 | | | | 128,930 | |
India | | | — | | | | 449,473 | | | | 449,473 | |
Ireland | | | 1,160,870 | | | | — | | | | 1,160,870 | |
Israel | | | — | | | | 735,717 | | | | 735,717 | |
Italy | | | — | | | | 1,167,858 | | | | 1,167,858 | |
Japan | | | — | | | | 7,248,414 | | | | 7,248,414 | |
Malaysia | | | 350,187 | | | | — | | | | 350,187 | |
Mexico | | | 293,177 | | | | — | | | | 293,177 | |
Netherlands | | | 350,384 | | | | 170,944 | | | | 521,328 | |
Norway | | | — | | | | 155,462 | | | | 155,462 | |
Philippines | | | 282,214 | | | | — | | | | 282,214 | |
Republic of Korea | | | — | | | | 225,091 | | | | 225,091 | |
South Africa | | | 157,008 | | | | — | | | | 157,008 | |
Spain | | | — | | | | 347,854 | | | | 347,854 | |
Sweden | | | 1,188,629 | | | | 199,882 | | | | 1,388,511 | |
Switzerland | | | — | | | | 997,018 | | | | 997,018 | |
Taiwan | | | — | | | | 1,811,089 | | | | 1,811,089 | |
Thailand | | | 337,490 | | | | — | | | | 337,490 | |
Turkey | | | 287,835 | | | | 316,222 | | | | 604,057 | |
United Kingdom | | | 2,246,607 | | | | 724,135 | | | | 2,970,742 | |
United States | | | 748,097 | | | | — | | | | 748,097 | |
Uruguay | | | 257,966 | | | | — | | | | 257,966 | |
Preferred Stock | | | 279,895 | | | | — | | | | 279,895 | |
Short-Term Investments | | | — | | | | 549,992 | | | | 549,992 | |
| | | | | | | | | | | | |
Total Value of Securities | | $ | 12,472,145 | | | $ | 18,775,017 | | | $ | 31,247,162 | |
| | | | | | | | | | | | |
42
| | | | | | | | | | | | |
| | | Level 1 | | | Level 2 | | | Total | |
Derivatives* | | | | | | | | | | | | |
Assets: | | | | | | | | | | | | |
Foreign Currency Exchange Contracts | | $ | — | | | $ | 1,277 | | | $ | 1,277 | |
*Foreign currency exchange contracts are valued at the unrealized appreciation (depreciation) on the instrument at the year end.
As a result of utilizing international fair value pricing at Nov. 30, 2017, the majority of the Fund’s common stock was categorized as Level 2.
During the year ended Nov. 30, 2017, there were no transfers between Level 1 investments, Level 2 investments, or Level 3 investments that had a significant impact to the Fund. This does not include transfers between Level 1 investments and Level 2 investments due to the Fund utilizing international fair value pricing during the period. In accordance with the fair valuation procedures described in Note 1, international fair value pricing of securities in the Fund occurs when market volatility exceeds an established rolling threshold. If the threshold is exceeded on a given date, then prices of international securities (those that traded on exchanges that close at a different time than the time that the Fund’s NAV is determined) are established using a separate pricing feed from a third-party vendor designed to establish a price for each such security as of the time that the Fund’s NAV is determined. Further, international fair value pricing uses other observable market-based inputs in place of the closing exchange price due to the events occurring after the close of the exchange or market on which the investment is principally traded, causing a change in classification between levels. The Fund’s policy is to recognize transfers between levels based on fair value at the beginning of the reporting period.
A reconciliation of Level 3 investments is presented when the Fund has a significant amount of Level 3 investments at the beginning, interim, or end of the period in relation to net assets. During the year ended Nov. 30, 2017, there were no Level 3 investments.
43
Notes to financial statements
Delaware International Small Cap Fund
4. Dividend and Distribution Information
Income and long-term capital gain distributions are determined in accordance with federal income tax regulations, which may differ from US GAAP. Additionally, distributions from net gains on foreign currency transactions and net short-term gains on sales of investment securities are treated as ordinary income for federal income tax purposes. The tax character of dividends and distributions paid during the years ended Nov. 30, 2017 and 2016 was as follows:
| | | | | | | | |
| | | Year ended | |
| | | 11/30/17 | | | 11/30/16 | |
Ordinary income | | $ | 2,421,608 | | | $ | — | |
Long-term capital gain | | | 13,516,211 | | | | 4,197,261 | |
| | | | | | | | |
Total | | $ | 15,937,819 | | | $ | 4,197,261 | |
| | | | | | | | |
5. Components of Net Assets on a Tax Basis
As of Nov. 30, 2017, the components of net assets on a tax basis were as follows:
| | | | |
Shares of beneficial interest | | $ | 25,101,245 | |
Undistributed ordinary income | | | 660,193 | |
Undistributed long-term capital gains | | | 637,439 | |
Net unrealized appreciation of investments, foreign currencies, and derivatives | | | 5,296,390 | |
| | | | |
Net assets | | $ | 31,695,267 | |
| | | | |
The differences between book basis and tax basis components of net assets are primarily attributable to tax deferral of losses on wash sales, tax treatment of forward currency contracts, and tax treatment of passive foreign investment companies.
For financial reporting purposes, capital accounts are adjusted to reflect the tax character of permanent book/tax differences. Reclassifications are primarily due to tax treatment of gain (loss) on foreign currency transactions, net operating losses, and passive foreign investment companies. Results of operations and net assets were not affected by these reclassifications. For the year ended Nov. 30, 2017, the Fund recorded the following reclassifications:
| | | | |
Distributions in excess of net investment income | | $ | (106,815 | ) |
Accumulated net realized gain | | | 106,815 | |
44
6. Capital Shares
Transactions in capital shares were as follows:
| | | | | | | | |
| | | Year ended | |
| | | 11/30/17 | | | 11/30/16 | |
Shares sold: | | | | | | | | |
Class A | | | 589,389 | | | | 189,509 | |
Class C | | | 179,426 | | | | 27,705 | |
Class R | | | 2,717 | | | | 214 | |
Institutional Class | | | 1,892,825 | | | | 443,941 | |
Class R6 | | | 283 | | | | — | |
| | |
Shares issued upon reinvestment of dividends and distributions: | | | | | | | | |
Class A | | | 1,742,977 | | | | 44,982 | |
Class C | | | 633,577 | | | | 10,559 | |
Class R | | | 6,930 | | | | 103 | |
Institutional Class | | | 496,539 | | | | 162,677 | |
| | | | | | | | |
| | | 5,544,663 | | | | 879,690 | |
| | | | | | | | |
| | |
Shares redeemed: | | | | | | | | |
Class A | | | (1,580,440 | ) | | | (805,041 | ) |
Class C | | | (294,061 | ) | | | (79,700 | ) |
Class R | | | (243 | ) | | | (3,089 | ) |
Institutional Class | | | (1,639,643 | ) | | | (4,385,221 | ) |
| | | | | | | | |
| | | (3,514,387 | ) | | | (5,273,051 | ) |
| | | | | | | | |
Net increase (decrease) | | | 2,030,276 | | | | (4,393,361 | ) |
| | | | | | | | |
Certain shareholders may exchange shares of one class for shares of another class in the same Fund. These exchange transactions are included as subscriptions and redemptions in the table above and on the “Statements of changes in net assets.” For the years ended Nov. 30, 2017 and 2016, the Fund had the following exchange transactions:
| | | | | | | | | | | | | | | | | | | | |
| | | Exchange Redemptions | | Exchange Subscriptions | | |
| | | | | | | Institutional | | |
| | | Class A | | Class C | | Class | | |
| Year ended | | Shares | | Shares | | Shares | | Value |
11/30/17 | | | | 197,989 | | | | | 5,915 | | | | | 194,964 | | | | $ | 1,229,836 | |
11/30/16 | | | | 32,858 | | | | | 3,365 | | | | | 35,717 | | | | | 676,986 | |
7. Line of Credit
The Fund, along with certain other funds in the Delaware Funds (Participants), was a participant in a $155,000,000 revolving line of credit intended to be used for temporary or emergency purposes as an additional source of liquidity to fund redemptions of investor shares. Under the agreement, the Participants were charged an annual commitment fee of 0.15%, which was generally allocated across the Participants based on a weighted average of the respective net assets of each Participant. The Participants were permitted to borrow up to a maximum of one third of their net assets under the
45
Notes to financial statements
Delaware International Small Cap Fund
7. Line of Credit (continued)
agreement. Each Participant was individually, and not jointly, liable for its particular advances, if any, under the line of credit. The line of credit available under the agreement expired on Nov. 6, 2017.
On Nov. 6, 2017, the Fund, along with the other Participants, entered into an amendment to the agreement for a $155,000,000 revolving line of credit. The line of credit is to be used as described above and operates in substantially the same manner as the original agreement. The line of credit available under the agreement expires on Nov. 5, 2018.
The Fund had no amounts outstanding as of Nov. 30, 2017, or at any time during the year then ended.
8. Derivatives
US GAAP requires disclosures that enable investors to understand: (1) how and why an entity uses derivatives; (2) how they are accounted for; and (3) how they affect an entity’s results of operations and financial position.
Foreign Currency Exchange Contracts — The Fund may enter into foreign currency exchange contracts and foreign cross currency exchange contracts as a way of managing foreign exchange rate risk. The Fund may enter into these contracts to fix the US dollar value of a security that it has agreed to buy or sell for the period between the date the trade was entered into and the date the security is delivered and paid for. The Fund may also use these contracts to hedge the US dollar value of securities it already owns that are denominated in foreign currencies. In addition, the Fund may enter into these contracts to facilitate or expedite the settlement of portfolio transactions. The change in value is recorded as an unrealized gain or loss. When the contract is closed, a realized gain or loss is recorded equal to the difference between the value of the contract at the time it was opened and the value at the time it was closed.
The use of foreign currency exchange contracts and foreign cross currency exchange contracts does not eliminate fluctuations in the underlying prices of the securities, but does establish a rate of exchange that can be achieved in the future. Although foreign currency exchange contracts and foreign cross currency exchange contracts limit the risk of loss due to an unfavorable change in the value of the hedged currency, they also limit any potential gain that might result should the value of the currency change favorably. In addition, the Fund could be exposed to risks if the counterparties to the contracts are unable to meet the terms of their contracts. The Fund’s maximum risk of loss from counterparty credit risk is the value of its currency exchanged with the counterparty. The risk is generally mitigated by having a netting arrangement between the Fund and the counterparty and by the posting of collateral by the counterparty to the Fund to cover the Fund’s exposure to the counterparty.
During the year ended Nov. 30, 2017, the Fund held foreign currency exchange contracts which produced net realized gains and are reflected on the “Statement of operations” under “Net realized gain on foreign currency exchange contracts.”
During the year ended Nov. 30, 2017, the Fund entered into foreign currency exchange contracts to facilitate or expedite the settlement of portfolio transactions.
46
Derivatives generally. The table below summarizes the average balance of derivative holdings by the Fund during the year ended Nov. 30, 2017.
| | | | | | | | |
| | | Long Derivatives Volume | | | Short Derivatives Volume | |
| | |
Foreign currency exchange contracts (average cost) | | $ | 107,690 | | | $ | 199,554 | |
9. Offsetting
The Fund entered into an International Swaps and Derivatives Association, Inc. Master Agreement (ISDA Master Agreement) or a similar agreement with certain of its derivative contract counterparties in order to better define its contractual rights and to secure rights that will help the Fund mitigate its counterparty risk. An ISDA Master Agreement is a bilateral agreement between the Fund and a counterparty that governs certain over-the-counter (OTC) derivatives and foreign exchange contracts and typically contains, among other things, collateral posting items and netting provisions in the event of a default and/or termination event. Under an ISDA Master Agreement, the Fund may, under certain circumstances, offset with the counterparty certain derivative financial instruments’ payables and/or receivables with collateral held and/or posted and create one single net payment. The provisions of the ISDA Master Agreement typically permit a single net payment in the event of default (close-out), including the bankruptcy or insolvency of the counterparty. However, bankruptcy or insolvency laws of a particular jurisdiction may impose restrictions on or prohibitions against the right of offset in bankruptcy, insolvency, or other events.
For financial reporting purposes, the Fund does not offset derivative assets and derivative liabilities that are subject to netting arrangements on the “Statement of assets and liabilities.”
At Nov. 30, 2017, the Fund had the following assets and liabilities subject to offsetting provisions:
Offsetting of Financial Assets and Liabilities and Derivative Assets and Liabilities
| | | | | | | | | | | | | | | |
Counterparty | | Gross Value of
Derivative Asset | | Gross Value of
Derivative Liability | | Net Position |
| | | |
BNY Mellon | | | | $1,277 | | | | | $— | | | | | $1,277 | |
| | | | | | | | | | | | | | | | | | | | | | | | | | | | | | |
| | | | | Fair Value of
Non-Cash
Collateral Received | | Cash Collateral Received | | Fair Value of
Non-Cash
Collateral Pledged | | Cash Collateral Pledged | | Net
Exposure(a) |
| | | | | | |
| Counterparty | | Net Position | | | | | |
BNY Mellon | | | | $1,277 | | | | | $— | | | | | $— | | | | | $— | | | | | $— | | | | | $1,277 | |
47
Notes to financial statements
Delaware International Small Cap Fund
9. Offsetting (continued)
Master Repurchase Agreements
| | | | | | | | | | | | | | | | | | | | | | | | | |
Counterparty | | Repurchase
Agreements | | Fair Value of
Non-cash
Collateral Received(b) | | Cash Collateral Received | | Net Collateral Received | | Net Exposure(a) |
| Bank of America Merrill Lynch | | | | $ 65,557 | | | | | $ (65,557 | ) | | | | $— | | | | | $ (65,557 | ) | | | | $— | |
| Bank of Montreal | | | | 163,894 | | | | | (163,894 | ) | | | | — | | | | | (163,894 | ) | | | | — | |
| BNP Paribas | | | | 167,650 | | | | | (167,650 | ) | | | | — | | | | | (167,650 | ) | | | | — | |
| | | | | | | | | | | | | | | | | | | | | | | | | |
| Total | | | | $397,101 | | | | | $(397,101 | ) | | | | $— | | | | | $(397,101 | ) | | | | $— | |
| | | | | | | | | | | | | | | | | | | | | | | | | |
(a)Net exposure represents the receivable (payable) that would be due from (to) the counterparty in the event of default.
(b)The value of the related collateral received exceeded the value of the repurchase agreements as of Nov. 30, 2017.
10. Securities Lending
The Fund, along with other funds in the Delaware Funds, may lend its securities pursuant to a security lending agreement (Lending Agreement) with The Bank of New York Mellon (BNY Mellon). At the time a security is loaned, the borrower must post collateral equal to the required percentage of the market value of the loaned security, including any accrued interest. The required percentage is: (1) 102% with respect to US securities and foreign securities that are denominated and payable in US dollars; and (2) 105% with respect to foreign securities. With respect to each loan, if on any business day the aggregate market value of securities collateral plus cash collateral held is less than the aggregate market value of the securities which are the subject of such loan, the borrower will be notified to provide additional collateral by the end of the following business day which, together with the collateral already held, will be not less than the applicable initial collateral requirements for such security loan. If the aggregate market value of securities collateral and cash collateral held with respect to a security loan exceeds the applicable initial collateral requirement, upon request of the borrower, BNY Mellon must return enough collateral to the borrower by the end of the following business day to reduce the value of the remaining collateral to the applicable initial collateral requirement for such security loan. As a result of the foregoing, the value of the collateral held with respect to a loaned security on any particular day, may be more or less than the value of the security on loan. The collateral percentage with respect to the market value of the loaned security is determined by the security lending agent.
Cash collateral received by each fund of the Trust is generally invested in a series of individual separate accounts, each corresponding to a fund. The investment guidelines permit each separate account to hold certain securities that would be considered eligible securities for a money market fund. Cash collateral received is generally invested in government securities; certain obligations issued by government sponsored enterprises; repurchase agreements collateralized by US Treasury securities; obligations issued by the central government of any Organization for Economic Cooperation and Development (OECD) country or its agencies, instrumentalities, or establishments; obligations of supranational organizations; commercial paper, notes, bonds, and other debt obligations; certificates of deposit, time deposits, and other bank obligations; and asset-backed securities. A Fund can also accept US government securities and letters of credit (non-cash collateral) in connection with securities loans.
48
In the event of default or bankruptcy by the lending agent, realization and/or retention of the collateral may be subject to legal proceedings. In the event the borrower fails to return loaned securities and the collateral received is insufficient to cover the value of the loaned securities and provided such collateral shortfall is not the result of investment losses, the lending agent has agreed to pay the amount of the shortfall to the Fund or, at the discretion of the lending agent, replace the loaned securities. The Fund continues to record dividends or interest, as applicable, on the securities loaned and is subject to changes in value of the securities loaned that may occur during the term of the loan. The Fund has the right under the Lending Agreement to recover the securities from the borrower on demand. With respect to security loans collateralized by non-cash collateral, the Fund receives loan premiums paid by the borrower. With respect to security loans collateralized by cash collateral, the earnings from the collateral investments are shared among the Fund, the security lending agent, and the borrower. The Fund records security lending income net of allocations to the security lending agent and the borrower.
The Fund may incur investment losses as a result of investing securities lending collateral. This could occur if an investment in the collateral investment account defaulted or became impaired. Under those circumstances, the value of the Fund’s cash collateral account may be less than the amount the Fund would be required to return to the borrowers of the securities and the Fund would be required to make up for this shortfall.
During the year ended Nov. 30, 2017, the Fund had no securities out on loan.
11. Credit and Market Risk
Some countries in which the Fund may invest require governmental approval for the repatriation of investment income, capital, or the proceeds of sales of securities by foreign investors. In addition, if there is deterioration in a country’s balance of payments, or for other reasons, a country may impose temporary restrictions on foreign capital remittances abroad.
The securities exchanges of certain foreign markets are substantially smaller, less liquid and more volatile than the major securities markets in the US. Consequently, acquisition and disposition of securities by the Fund may be inhibited. In addition, a significant portion of the aggregate market value of equity securities listed on the major securities exchanges in emerging markets is held by a smaller number of investors. This may limit the number of shares available for acquisition or disposition by the Fund.
The Fund may invest up to 15% of its net assets in illiquid securities, which may include securities with contractual restrictions on resale, securities exempt from registration under Rule 144A, promulgated under the Securities Act of 1933, as amended, and other securities which may not be readily marketable. The relative illiquidity of these securities may impair the Fund from disposing of them in a timely manner and at a fair price when it is necessary or desirable to do so. While maintaining oversight, the Fund’s Board has delegated to DMC, the day-to-day functions of determining whether individual securities are liquid for purposes of the Fund’s limitation on investments in illiquid securities. Securities eligible for resale pursuant to Rule 144A, which are determined to be liquid, are not subject to the Fund’s 15% limit on investments in illiquid securities. Rule 144A securities have been identified on the “Schedule of investments.”
49
Notes to financial statements
Delaware International Small Cap Fund
12. Contractual Obligations
The Fund enters into contracts in the normal course of business that contain a variety of indemnifications. The Fund’s maximum exposure under these arrangements is unknown. However, the Fund has not had prior claims or losses pursuant to these contracts. Management has reviewed the Fund’s existing contracts and expects the risk of loss to be remote.
13. Recent Accounting Pronouncements
In October 2016, the Securities and Exchange Commission released its Final Rule on Investment Company Reporting Modernization (Rule). The Rule contains amendments to Regulation S-X which impact financial statement presentation, particularly the presentation of derivative investments. The financial statements presented are in compliance with the most recent Regulation S-X amendments.
14. Subsequent Events
Management has determined that no material events or transactions occurred subsequent to Nov. 30, 2017 that would require recognition or disclosure in the Fund’s financial statements.
50
Report of independent
registered public accounting firm
To the Board of Trustees of Delaware Group® Global & International Funds and the Shareholders of Delaware International Small Cap Fund
In our opinion, the accompanying statement of assets and liabilities, including the schedule of investments, and the related statements of operations and of changes in net assets and the financial highlights present fairly, in all material respects, the financial position of Delaware International Small Cap Fund (one of the series constituting Delaware Group Global & International Funds, hereafter referred to as the “Fund”) as of November 30, 2017, the results of its operations for the year then ended, the changes in its net assets for each of the two years in the period then ended and the financial highlights for each of the periods indicated, in conformity with accounting principles generally accepted in the United States of America. These financial statements and financial highlights (hereafter referred to as “financial statements”) are the responsibility of the Fund’s management. Our responsibility is to express an opinion on these financial statements based on our audits. We conducted our audits of these financial statements in accordance with the standards of the Public Company Accounting Oversight Board (United States). Those standards require that we plan and perform the audit to obtain reasonable assurance about whether the financial statements are free of material misstatement. An audit includes examining, on a test basis, evidence supporting the amounts and disclosures in the financial statements, assessing the accounting principles used and significant estimates made by management, and evaluating the overall financial statement presentation. We believe that our audits, which included confirmation of securities as of November 30, 2017 by correspondence with the custodian and brokers, provide a reasonable basis for our opinion.
PricewaterhouseCoopers LLP
Philadelphia, Pennsylvania
January 18, 2018
51
Other Fund information (Unaudited)
Delaware International Small Cap Fund
Tax Information
The information set forth below is for the Fund’s fiscal year as required by federal income tax laws. Shareholders, however, must report distributions on a calendar year basis for income tax purposes, which may include distributions for portions of two fiscal years of the Fund. Accordingly, the information needed by shareholders for income tax purposes will be sent to them in January of each year. Please consult your tax advisor for proper treatment of this information.
All disclosures are based on financial information available as of the date of this annual report and, accordingly are subject to change. For any and all items requiring reporting, it is the intention of the Fund to report the maximum amount permitted under the Internal Revenue Code and the regulations thereunder.
For the fiscal year ended Nov. 30, 2017, the Fund reports distributions paid during the year as follows:
| | | | |
(A) Ordinary Income Distributions (Tax Basis)* | | | 15.19% | |
(B) Long-Term Capital Gain Distributions (Tax Basis) | | | 84.81% | |
Total Distributions (Tax Basis) | | | 100.00% | |
(C) Qualified Dividends1 | | | 14.40% | |
(A) and (B) are based on a percentage of the Fund’s total distributions.
(C) is based on a percentage of the Fund’s ordinary income distributions.
| 1 | Qualified dividends represent dividends which qualify for the corporate dividends received deduction. |
| * | For the fiscal year ended Nov. 30, 2017, certain dividends paid by the Fund may be subject to a maximum tax rate of 20%. The percentage of dividends paid by the Fund from ordinary income reported as qualified dividend income is 55.62%. Complete information will be computed and reported in conjunction with your 2017 Form 1099-DIV, as applicable. |
For the fiscal year ended Nov. 30, 2017, certain interest income paid by the Fund determined to be Qualified Interest Income and Short-Term Capital Gains, may be subject to relief from US withholding for foreign shareholders, as provided by the American Jobs Creation Act of 2004, and by the Tax Relief Unemployment Insurance Reauthorization and Job Creations Act of 2010, and as extended by the American Taxpayer Relief Act of 2012. For the fiscal year ended Nov. 30, 2017, the Fund has reported maximum distributions of Short-Term Capital Gain of $660,998. Complete information will be computed and reported in conjunction with your 2017 Form 1099-DIV.
Board consideration of Delaware International Small Cap Fund investment advisory agreement
At a meeting held on Aug. 16-17, 2017 (the “Annual Meeting”), the Board of Trustees (the “Board”), including a majority of disinterested or independent Trustees, approved the renewal of the Investment Advisory Agreement for Delaware International Small Cap Fund (the “Fund”). In making its decision, the Board considered information furnished at regular quarterly Board meetings, including reports detailing Fund performance, investment strategies, and expenses, as well as information prepared specifically in connection with the renewal of the Investment Advisory Agreement. Information furnished specifically in connection with the renewal of the Investment Advisory Agreement with Delaware Management Company (“DMC”), a series of Macquarie Investment Management Business Trust (formerly, Delaware Management Business Trust), included materials provided by DMC and its affiliates concerning, among other things, the nature, extent, and quality of services provided to the Fund; the costs of such services
52
to the Fund; economies of scale; and the investment manager’s financial condition and profitability. In addition, in connection with the Annual Meeting, reports were provided to the Trustees in May 2017 and included reports provided by Broadridge Financial Solutions (formerly Lipper) (“Broadridge” or “Lipper”). The Broadridge reports compared the Fund’s investment performance and expenses with those of other comparable mutual funds. The Independent Trustees reviewed and discussed the Broadridge reports with independent legal counsel to the Independent Trustees. In addition to the information noted above, the Board also requested and received information regarding DMC’s policy with respect to advisory fee levels and its breakpoint philosophy; the structure of portfolio manager compensation; comparative client fee information; and any constraints or limitations on the availability of securities for certain investment styles, which had in the past year inhibited, or which were likely in the future to inhibit, the investment manager’s ability to invest fully in accordance with Fund policies.
In considering information relating to the approval of the Fund’s Investment Advisory Agreement, the Independent Trustees received assistance and advice from and met separately with independent legal counsel to the Independent Trustees and also from an experienced and knowledgeable fund consultant, JDL Consultants, LLC (“JDL”). Although the Board gave attention to all information furnished, the following discussion identifies, under separate headings, the primary factors taken into account by the Board during its contract renewal considerations.
Nature, extent, and quality of service. The Board considered the services provided by DMC to the Fund and its shareholders. In reviewing the nature, extent, and quality of services, the Board considered reports furnished to it throughout the year, which covered matters such as the relative performance of the Fund; compliance of portfolio managers with the investment policies, strategies, and restrictions for the Fund; compliance by DMC and Delaware Distributors, L.P. (together, “Management”) personnel with the Code of Ethics adopted throughout the Delaware FundsSM by Macquarie (“Delaware Funds”); and adherence to fair value pricing procedures as established by the Board. The Board was pleased with the current staffing of the Fund’s investment advisor and the emphasis placed on research in the investment process. The Board recognized DMC’s receipt of certain industry distinctions during the past several years. The Board gave favorable consideration to DMC’s efforts to control expenditures while maintaining service levels committed to Fund matters. The Board also noted the benefits provided to Fund shareholders through each shareholder’s ability to exchange an investment in one Delaware Fund for the same class of shares in another Delaware Fund without a sales charge, to reinvest Fund dividends into additional shares of the Fund or into additional shares of other Delaware Funds and the privilege to combine holdings in other Delaware Funds to obtain a reduced sales charge. The Board was satisfied with the nature, extent, and quality of the overall services provided by DMC.
Investment performance. The Board placed significant emphasis on the investment performance of the Fund in view of the importance of investment performance to shareholders. Although the Board considered performance reports and discussions with portfolio managers at Investment Committee meetings throughout the year, the Board gave particular weight to the Broadridge reports furnished for the Annual Meeting. The Broadridge reports prepared for the Fund showed the investment performance of its Class A shares in comparison to a group of similar funds as selected by Broadridge (the “Performance Universe”). A fund with the best performance ranked first, and a fund with the poorest performance ranked last. The highest/best performing 25% of funds in the Performance Universe make up the first quartile; the next 25%, the second quartile; the next 25%, the third quartile; and the
53
Other Fund information (Unaudited)
Delaware International Small Cap Fund
Board consideration of Delaware International Small Cap Fund investment advisory agreement (continued)
poorest/worst performing 25% of funds in the Performance Universe make up the fourth quartile. Comparative annualized performance for the Fund was shown for the past 1-, 3-, 5-, and 10-year periods, to the extent applicable, ended Jan. 31, 2017. The Board’s objective is that the Fund’s performance for the 1-, 3-, and 5-year periods considered be at or above the median of its Performance Universe.
The Performance Universe for the Fund consisted of the Fund and all retail and institutional global multi-cap growth funds as selected by Broadridge. The Broadridge report comparison showed that the Fund’s total return for the 1-year period was in the second quartile of its Performance Universe. The report further showed that the Fund’s total return for the 3-year period was in the first quartile of its Performance Universe and the Fund’s total return for the 5-year period was in the third quartile of its Performance Universe. The Board was satisfied with performance.
Comparative expenses. The Board considered expense data for the Delaware Funds. Management provided the Board with information on pricing levels and fee structures for the Fund as of its most recently completed fiscal year. The Board also focused on the comparative analysis of effective management fees and total expense ratios of the Fund versus effective management fees and total expense ratios of a group of similar funds as selected by Broadridge (the “Expense Group”). In reviewing comparative costs, the Fund’s contractual management fee and the actual management fee incurred by the Fund were compared with the contractual management fees (assuming all funds in the Expense Group were similar in size to the Fund) and actual management fees (as reported by each fund) within the Expense Group, taking into account any applicable breakpoints and fee waivers. The Fund’s total expenses were also compared with those of its Expense Group. The Broadridge total expenses, for comparative consistency, were shown by Broadridge for Class A shares and comparative total expenses including 12b-1 and non-12b-1 service fees. The Board’s objective is to limit the Fund’s total expense ratio to be competitive with that of the Expense Group.
The expense comparisons for the Fund showed that its actual management fee and total expenses were in the quartile with the lowest expenses of its Expense Group. The Board was satisfied with the management fee and total expenses of the Fund in comparison to those of its Expense Group as shown in the Broadridge report.
Management profitability. The Board considered the level of profits realized by DMC in connection with the operation of the Fund. In this respect, the Board reviewed the Investment Management Profitability Analysis that addressed the overall profitability of DMC’s business in providing management and other services to each of the individual funds and the Delaware Funds as a whole. Specific attention was given to the methodology used by DMC in allocating costs for the purpose of determining profitability. Management stated that the level of profits of DMC, to a certain extent, reflects recent operational cost savings and efficiencies initiated by DMC. The Board considered DMC’s efforts to improve services provided to fund shareholders and to meet additional regulatory and compliance requirements resulting from recent industry-wide Securities and Exchange Commission initiatives. The Board also considered the extent to which DMC might derive ancillary benefits from fund operations, including the potential for procuring additional business as a result of the prestige and visibility associated with its role as service
54
provider to the Delaware Funds and the benefits from allocation of fund brokerage to improve trading efficiencies. Finally, the Board also reviewed a report prepared by JDL regarding DMC profitability in the context of sub-advised funds and met with JDL personnel to discuss DMC’s profitability in such context. The Board found that the management fees were reasonable in light of the services rendered and the level of profitability of DMC.
Economies of scale. The Trustees considered whether economies of scale are realized by DMC as the Fund’s assets increase and the extent to which any economies of scale are reflected in the level of management fees charged. The Trustees reviewed the standardized advisory fee pricing and structure, approved by the Board and shareholders, which includes breakpoints, and which applies to most funds in the Delaware Funds complex. Breakpoints in the advisory fee occur when the advisory fee rate is reduced on assets in excess of specified levels. Breakpoints result in a lower advisory fee than would otherwise be the case in the absence of breakpoints, when the asset levels specified in the breakpoints are exceeded. The Board noted that the fee under the Fund’s management contract fell within the standardized fee pricing structure. Although, as of Feb. 28, 2017, the Fund had not reached a size at which it could take advantage of any breakpoints in the applicable fee schedule, the Board recognized that the fee was structured so that if the Fund grows, economies of scale may be shared.
55
Board of trustees / directors and officers addendum
Delaware FundsSM by Macquarie
A mutual fund is governed by a Board of Trustees/Directors (“Trustees”), which has oversight responsibility for the management of a fund’s business affairs. Trustees establish procedures and oversee and review the performance of the investment manager, the distributor, and others who perform services for the fund. The independent fund trustees, in particular, are advocates
| | | | |
Name, Address, and Birth Date | | Position(s) Held with Fund(s) | | Length of Time Served |
Interested Trustee | | | | |
Shawn K. Lytle1, 2 | | President, | | Trustee since |
2005 Market Street | | Chief Executive Officer, | | September 2015 |
Philadelphia, PA 19103 | | and Trustee | | |
February 1970 | | | | President and |
| | | | Chief Executive Officer |
| | | | since August 2015 |
| | |
| | | | |
Independent Trustees | | | | |
Thomas L. Bennett | | Chairman and Trustee | | Trustee since |
2005 Market Street | | | | March 2005 |
Philadelphia, PA 19103 | | | | |
October 1947 | | | | Chairman since |
| | | | | March 2015 |
Ann D. Borowiec | | Trustee | | Since March 2015 |
2005 Market Street | | | | |
Philadelphia, PA 19103 | | | | |
November 1958 | | | | |
| | |
| | | | | |
Joseph W. Chow | | Trustee | | Since January 2013 |
2005 Market Street | | | | |
Philadelphia, PA 19103 | | | | |
January 1953 | | | | |
| | |
| | | | | |
| 1 | Shawn K. Lytle is considered to be an “Interested Trustee” because he is an executive officer of the Fund’s(s’) investment advisor. |
| 2 | Shawn K. Lytle, David F. Connor, Daniel V. Geatens, and Richard Salus serve in similar capacities for the six portfolios of the Optimum Fund Trust, which have the same investment advisor, principal underwriter, and transfer agent as the registrant. Mr. Geatens also serves as the CFO and Treasurer for Macquarie Global Infrastructure Total Return Fund Inc., which shares an affiliated investment manager. |
56
for shareholder interests. Each trustee has served in that capacity since he or she was elected to or appointed to the Board of Trustees, and will continue to serve until his or her retirement or the election of a new trustee in his or her place. The following is a list of the Trustees and Officers with certain background and related information.
| | | | |
Principal Occupation(s) During the Past Five Years | | Number of Portfolios in Fund Complex Overseen by Trustee or Officer | | Other Directorships Held by Trustee or Officer |
| | | | |
Shawn K. Lytle has served as | | 60 | | Trustee — UBS |
President of | | | | Relationship Funds, |
Macquarie Investment | | | | SMA Relationship |
Management3 | | | | Trust, and UBS Funds |
since June 2015 and was the | | | | (May 2010–April 2015) |
Regional Head of Americas for | | | | |
UBS Global Asset | | | | |
Management from 2010 through 2015. | | | | |
| | | | |
Private Investor | | 60 | | None |
(March 2004–Present) | | | | |
| | |
| | | | | |
Chief Executive Officer, | | 60 | | Director — |
Private Wealth Management | | | | Banco Santander International |
(2011–2013) and | | | | |
Market Manager, | | | | Director — |
New Jersey Private | | | | Santander Bank, N.A. |
Bank (2005–2011) — | | | | |
J.P. Morgan Chase & Co. | | | | |
Executive Vice President | | 60 | | Director and Audit Committee |
(Emerging Economies | | | | Member — Hercules |
Strategies, Risks, and | | | | Technology Growth |
Corporate Administration) | | | | Capital, Inc. |
State Street Corporation | | | | (2004–2014) |
(July 2004–March 2011) | | | | |
| | 3 | Macquarie Investment Management (formerly known as Delaware Investments) is the marketing name for Macquarie Management Holdings, Inc. (formerly known as Delaware Management Holdings, Inc.) and its subsidiaries, including the Fund’s(s’) investment advisor, principal underwriter, and its transfer agent. |
57
Board of trustees / directors and officers addendum
Delaware FundsSM by Macquarie
| | | | |
Name, Address,
and Birth Date | | Position(s)
Held with Fund(s) | | Length of
Time Served |
Independent Trustees (continued) | | | | |
| John A. Fry | | Trustee | | Since January 2001 |
| 2005 Market Street | | | | |
| Philadelphia, PA 19103 | | | | |
May 1960 | | | | |
| Lucinda S. Landreth | | Trustee | | Since March 2005 |
| 2005 Market Street | | | | |
| Philadelphia, PA 19103 | | | | |
June 1947 | | | | |
| Frances A. Sevilla-Sacasa | | Trustee | | Since September 2011 |
| 2005 Market Street | | | | |
| Philadelphia, PA 19103 | | | | |
January 1956 | | | | |
58
| | | | |
Principal Occupation(s)
During the Past Five Years | | Number of Portfolios in
Fund Complex Overseen by
Trustee or Officer | | Other Directorships
Held by Trustee or Officer |
| | | | |
| President — | | 60 | | Director, Audit Committee, |
| Drexel University | | | | and Governance Committee |
| (August 2010–Present) | | | | Member — Community |
| | | | Health Systems |
President — | | | | |
| Franklin & Marshall College | | | | Director — Drexel |
| (July 2002–July 2010) | | | | Morgan & Co. |
| | | | Director, Audit Committee |
| | | | Member — vTv |
| | | | Therapeutics LLC |
| | | | Director — FS Credit Real |
| | | | | Estate Income Trust, Inc. |
| Private Investor | | 60 | | None |
(2004–Present) | | | | |
| Chief Executive Officer — | | 60 | | Trust Manager and |
| Banco Itaú | | | | Audit Committee |
| International | | | | Chair — Camden |
| (April 2012–December 2016) | | | | Property Trust |
Executive Advisor to Dean | | | | |
(August 2011–March 2012) and Interim Dean | | | | |
| (January 2011–July 2011) — | | | | |
| University of Miami School of | | | | |
| Business Administration | | | | |
President — U.S. Trust, | | | | |
| Bank of America Private | | | | |
| Wealth Management | | | | |
| (Private Banking) | | | | |
(July 2007–December 2008) | | | | |
59
Board of trustees / directors and officers addendum
Delaware FundsSM by Macquarie
| | | | |
Name, Address,
and Birth Date | | Position(s)
Held with Fund(s) | | Length of
Time Served |
Independent Trustees (continued) | | |
| Thomas K. Whitford | | Trustee | | Since January 2013 |
| 2005 Market Street | | | | |
| Philadelphia, PA 19103 | | | | |
March 1956 | | | | |
| Janet L. Yeomans | | Trustee | | Since April 1999 |
| 2005 Market Street | | | | |
| Philadelphia, PA 19103 | | | | |
July 1948 | | | | |
Officers | | | | |
| David F. Connor | | Senior Vice President, | | Senior Vice President |
| 2005 Market Street | | General Counsel, | | since May 2013; |
| Philadelphia, PA 19103 | | and Secretary | | General Counsel |
| December 1963 | | | | since May 2015; |
| | | | Secretary since |
| | | | | October 2005 |
| Daniel V. Geatens | | Vice President | | Treasurer since October 2007 |
| 2005 Market Street | | and Treasurer | | |
| Philadelphia, PA 19103 | | | | |
October 1972 | | | | |
| Richard Salus | | Senior Vice President | | Chief Financial Officer |
| 2005 Market Street | | and Chief Financial Officer | | since November 2006 |
| Philadelphia, PA 19103 | | | | |
October 1963 | | | | |
The Statement of Additional Information for the Fund(s) includes additional information about the Trustees and Officers and is available, without charge, upon request by calling 800 523-1918.
60
| | | | |
Principal Occupation(s) During the Past Five Years | | Number of Portfolios in Fund Complex Overseen by Trustee or Officer | | Other Directorships Held by Trustee or Officer |
| | |
| | | | |
Vice Chairman | | 60 | | Director — HSBC Finance |
(2010–April 2013) — | | | | Corporation and HSBC |
PNC Financial | | | | North America Holdings Inc. |
Services Group | | | | |
| | | | Director — |
| | | | | HSBC USA Inc. |
Vice President and Treasurer | | 60 | | Director (2009–2017); |
(January 2006–July 2012), | | | | Personnel and Compensation |
Vice President — | | | | Committee Chair; Member of |
Mergers & Acquisitions | | | | Nominating, Investments, and |
(January 2003–January 2006), | | | | Audit Committees for various |
and Vice President | | | | periods throughout |
and Treasurer | | | | directorship — |
(July 1995–January 2003) — | | | | Okabena Company |
3M Company | | | | |
| | | | |
David F. Connor has served | | 60 | | None2 |
in various capacities at different times at | | | | |
Macquarie Investment | | | | |
Management. | | | | |
Daniel V. Geatens has served | | 60 | | None2 |
in various capacities at different times at | | | | |
| Macquarie Investment | | | | |
Management. | | | | |
Richard Salus has served | | 60 | | None2 |
in various executive capacities at different times at | | | | |
| Macquarie Investment | | | | |
Management. | | | | |
61
About the organization
Board of trustees
Shawn K. Lytle
President and
Chief Executive Officer
Delaware FundsSM
by Macquarie
Philadelphia, PA
Thomas L. Bennett
Chairman of the Board
Delaware Funds
by Macquarie
Private Investor
Rosemont, PA
Ann D. Borowiec
Former Chief Executive
Officer
Private Wealth Management
J.P. Morgan Chase & Co.
New York, NY
Joseph W. Chow
Former Executive Vice
President
State Street Corporation
Boston, MA
John A. Fry
President
Drexel University
Philadelphia, PA
Lucinda S. Landreth
Former Chief Investment
Officer
Assurant, Inc.
New York, NY
Frances A.
Sevilla-Sacasa
Former Chief Executive
Officer
Banco Itaú
International
Miami, FL
Thomas K. Whitford
Former Vice Chairman
PNC Financial Services Group
Pittsburgh, PA
Janet L. Yeomans
Former Vice President and
Treasurer
3M Company
St. Paul, MN
Affiliated officers
David F. Connor
Senior Vice President,
General Counsel,
and Secretary
Delaware Funds
by Macquarie
Philadelphia, PA
Daniel V. Geatens
Vice President and
Treasurer
Delaware Funds
by Macquarie
Philadelphia, PA
Richard Salus
Senior Vice President and
Chief Financial Officer
Delaware Funds
by Macquarie
Philadelphia, PA
This annual report is for the information of Delaware International Small Cap Fund shareholders, but it may be used with prospective investors when preceded or accompanied by the Delaware Fund fact sheet for the most recently completed calendar quarter. These documents are available at delawarefunds.com/literature.
The Fund files its complete schedule of portfolio holdings with the Securities and Exchange Commission (SEC) for the first and third quarters of each fiscal year on Form N-Q. The Fund’s Forms N-Q, as well as a description of the policies and procedures that the Fund uses to determine how to vote proxies (if any) relating to portfolio securities are available without charge (i) upon request, by calling 800 523-1918; and (ii) on the SEC’s website at sec.gov. In addition, a description of the policies and procedures that the Fund uses to determine how to vote proxies (if any) relating to portfolio securities and the Schedule of Investments included in the Fund’s most recent Form N-Q are available without charge on the Fund’s website at delawarefunds.com/literature. The Fund’s Forms N-Q may be reviewed and copied at the SEC’s Public Reference Room in Washington, D.C.; information on the operation of the Public Reference Room may be obtained by calling 800 SEC-0330.
Information (if any) regarding how the Fund voted proxies relating to portfolio securities during the most recently disclosed 12-month period ended June 30 is available without charge (i) through the Fund’s website at delawarefunds.com/proxy; and (ii) on the SEC’s website at sec.gov.
62
Item 2. Code of Ethics
Item 3. Audit Committee Financial Expert
The registrant’s Board of Trustees/Directors has determined that certain members of the registrant’s Audit Committee are audit committee financial experts, as defined below. For purposes of this item, an “audit committee financial expert” is a person who has the following attributes:
a. An understanding of generally accepted accounting principles and financial statements;
b. The ability to assess the general application of such principles in connection with the accounting for estimates, accruals, and reserves;
c. Experience preparing, auditing, analyzing, or evaluating financial statements that present a breadth and level of complexity of accounting issues that are generally comparable to the breadth and complexity of issues that can reasonably be expected to be raised by the registrant’s financial statements, or experience actively supervising one or more persons engaged in such activities;
d. An understanding of internal controls and procedures for financial reporting; and
e. An understanding of audit committee functions.
An “audit committee financial expert” shall have acquired such attributes through:
a. Education and experience as a principal financial officer, principal accounting officer, controller, public accountant, or auditor or experience in one or more positions that involve the performance of similar functions;
b. Experience actively supervising a principal financial officer, principal accounting officer, controller, public accountant, auditor, or person performing similar functions;
c. Experience overseeing or assessing the performance of companies or public accountants with respect to the preparation, auditing, or evaluation of financial statements; or
d. Other relevant experience.
The registrant’s Board of Trustees/Directors has also determined that each member of the registrant’s Audit Committee is independent. In order to be “independent” for purposes of this item, the Audit Committee member may not: (i) other than in his or her capacity as a member of the Board of Trustees/Directors or any committee thereof, accept directly or indirectly any consulting, advisory or other compensatory fee from the issuer; or (ii) be an “interested person” of the registrant as defined in Section 2(a)(19) of the Investment Company Act of 1940.
The names of the audit committee financial experts on the registrant’s Audit Committee are set forth below:
Joseph W. Chow
John A. Fry
Lucinda S. Landreth
Thomas K. Whitford
Item 4. Principal Accountant Fees and Services
The aggregate fees billed for services provided to the registrant by its independent auditors for the audit of the registrant’s annual financial statements and for services normally provided by the independent auditors in connection with statutory and regulatory filings or engagements were $147,989 for the fiscal year ended November 30, 2017.
The aggregate fees billed for services provided to the registrant by its independent auditors for the audit of the registrant’s annual financial statements and for services normally provided by the independent auditors in connection with statutory and regulatory filings or engagements were $147,989 for the fiscal year ended November 30, 2016.
The aggregate fees billed by the registrant’s independent auditors for services relating to the performance of the audit of the registrant’s financial statements and not reported under paragraph (a) of this Item were $0 for the fiscal year ended November 30, 2017.
The aggregate fees billed by the registrant’s independent auditors for services relating to the performance of the audit of the registrant’s financial statements and not reported under paragraph (a) of this Item were $0 for the fiscal year ended November 30, 2016.
The aggregate fees billed by the registrant’s independent auditors for tax-related services provided to the registrant’s investment adviser and other service providers under common control with the adviser and that relate directly to the operations or financial reporting of the registrant were $0 for the registrant’s fiscal year ended November 30, 2017. The percentage of these fees relating to services approved by the registrant’s Audit Committee pursuant to the de minimis exception from the pre-approval requirement in Rule 2-01(c)(7)(i)(C) of Regulation S-X was 0%.
The aggregate fees billed by the registrant’s independent auditors for tax-related services provided to the registrant’s investment adviser and other service providers under common control with the adviser and that relate directly to the operations or financial reporting of the registrant were $0 for the registrant’s fiscal year ended November 30, 2016. The percentage of these fees relating to services approved by the registrant’s Audit Committee pursuant to the de minimis exception from the pre-approval requirement in Rule 2-01(c)(7)(i)(C) of Regulation S-X was 0%.
The aggregate fees billed for all services provided by the independent auditors to the registrant other than those set forth in paragraphs (a), (b) and (c) of this Item were $0 for the fiscal year ended November 30, 2017.
The aggregate fees billed for all services provided by the independent auditors to the registrant other than those set forth in paragraphs (a), (b) and (c) of this Item were $0 for the fiscal year ended November 30, 2016.
Under the Pre-Approval Policy, the Audit Committee has also pre-approved the services set forth in the table below with respect to the registrant’s investment adviser and other entities controlling, controlled by or under common control with the investment adviser that provide ongoing services to the registrant (the “Control Affiliates”) up to the specified fee limit. This fee limit is based on aggregate fees to the investment adviser and its Control Affiliates.
The Pre-Approval Policy requires the registrant’s independent auditors to report to the Audit Committee at each of its regular meetings regarding all services initiated since the last such report was rendered, including those services authorized by the Pre-Approval Policy.
(f) Not applicable.
(g) The aggregate non-audit fees billed by the registrant’s independent auditors for services rendered to the registrant and to its investment adviser and other service providers under common control with the adviser were $11,180,000 and $8,665,000 for the registrant’s fiscal years ended November 30, 2017 and November 30, 2016, respectively.
(h) In connection with its selection of the independent auditors, the registrant’s Audit Committee has considered the independent auditors’ provision of non-audit services to the registrant’s investment adviser and other service providers under common control with the adviser that were not required to be pre-approved pursuant to Rule 2-01(c)(7)(ii) of Regulation S-X. The Audit Committee has determined that the independent auditors’ provision of these services is compatible with maintaining the auditors’ independence.
Item 5. Audit Committee of Listed Registrants
Not applicable.
Item 6. Investments
(a) Included as part of report to shareholders filed under Item 1 of this Form N-CSR.
(b) Divestment of securities in accordance with Section 13(c) of the Investment Company Act of 1940.
Not applicable.
Item 7. Disclosure of Proxy Voting Policies and Procedures for Closed-End Management Investment Companies
Not applicable.
Item 8. Portfolio Managers of Closed-End Management Investment Companies
Not applicable.
Item 9. Purchases of Equity Securities by Closed-End Management Investment Company and Affiliated Purchasers
Not applicable.
Item 10. Submission of Matters to a Vote of Security Holders
Not applicable.
Item 11. Controls and Procedures
The registrant’s principal executive officer and principal financial officer have evaluated the registrant’s disclosure controls and procedures within 90 days of the filing of this report and have concluded that they are effective in providing reasonable assurance that the information required to be disclosed by the registrant in its reports or statements filed under the Securities Exchange Act of 1934 is recorded, processed, summarized and reported within the time periods specified in the rules and forms of the Securities and Exchange Commission.
There were no significant changes in the registrant’s internal control over financial reporting that occurred during the second fiscal quarter of the period covered by the report to stockholders included herein (i.e., the registrant’s fourth fiscal quarter) that have materially affected, or are reasonably likely to materially affect, the registrant’s internal control over financial reporting.
Item 12. Exhibits
Not applicable.
(2) Certifications of Principal Executive Officer and Principal Financial Officer pursuant to Rule 30a-2 under the Investment Company Act of 1940 are attached hereto as Exhibit 99.CERT.
(3) Written solicitations to purchase securities pursuant to Rule 23c-1 under the Securities Exchange Act of 1934.
Not applicable.
(b) Certifications pursuant to Section 906 of the Sarbanes-Oxley Act of 2002 are furnished herewith as Exhibit 99.906CERT.
Pursuant to the requirements of the Securities Exchange Act of 1934 and the Investment Company Act of 1940, the registrant has duly caused this report to be signed on its behalf, by the undersigned, thereunto duly authorized.
Pursuant to the requirements of the Securities Exchange Act of 1934 and the Investment Company Act of 1940, this report has been signed below by the following persons on behalf of the registrant and in the capacities and on the dates indicated.