Item 1. Reports to Stockholders

Annual report
Global / international equity funds
Delaware Emerging Markets Fund
Delaware Global Value Fund
Delaware International Value Equity Fund
November 30, 2015
Carefully consider the Funds’ investment objectives, risk factors, charges, and expenses before investing. This and other information can be found in the Funds’ prospectuses and their summary prospectuses, which may be obtained by visiting delawareinvestments.com or calling 800 523-1918. Investors should read the prospectus and the summary prospectus carefully before investing.
You can obtain shareholder reports and prospectuses online instead of in the mail.
Visit delawareinvestments.com/edelivery.
Experience Delaware Investments
Delaware Investments is committed to the pursuit of consistently superior asset management and unparalleled client service. We believe in our investment processes, which seek to deliver consistent results, and in convenient services that help add value for our clients.
If you are interested in learning more about creating an investment plan, contact your financial advisor.
You can learn more about Delaware Investments or obtain a prospectus for Delaware Emerging Markets Fund, Delaware Global Value Fund, and Delaware International Value Equity Fund at delawareinvestments.com.
Manage your investments online
| ● | | 24-hour access to your account information |
| ● | | Check your account balance and recent transactions |
| ● | | Request statements or literature |
| ● | | Make purchases and redemptions |
Delaware Management Holdings, Inc. and its subsidiaries (collectively known by the marketing name of Delaware Investments) are wholly owned subsidiaries of Macquarie Group Limited, a global provider of banking, financial, advisory, investment and funds management services.
Neither Delaware Investments nor its affiliates noted in this document are authorized deposit-taking institutions for the purpose of the Banking Act 1959 (Commonwealth of Australia). The obligations of these entities do not represent deposits or other liabilities of Macquarie Bank Limited (MBL). MBL does not guarantee or otherwise provide assurance in respect of the obligations of these entities, unless otherwise noted.
Unless otherwise noted, views expressed herein are current as of Nov. 30, 2015, and subject to change for events occurring after such date.
Funds are not FDIC insured and are not guaranteed. It is possible to lose the principal amount invested.
Mutual fund advisory services provided by Delaware Management Company, a series of Delaware Management Business Trust, which is a registered investment advisor. Delaware Investments, a member of Macquarie Group, refers to Delaware Management Holdings, Inc. and its subsidiaries, including the Fund’s distributor, Delaware Distributors, L.P. Macquarie Group refers to Macquarie Group Limited and its subsidiaries and affiliates worldwide.
© 2016 Delaware Management Holdings, Inc.
All third-party marks cited are the property of their respective owners.
| | |
| Portfolio management review | | |
| Delaware Emerging Markets Fund | | December 8, 2015 |
| | | | | | | | |
| Performance preview (for the year ended November 30, 2015) | | | | | | |
Delaware Emerging Markets Fund (Class A shares) | | | 1-year return | | | | -18.15% | |
MSCI Emerging Markets Index (Gross) | | | 1-year return | | | | -16.68% | |
MSCI Emerging Markets Index (Net) | | | 1-year return | | | | -16.99% | |
Past performance does not guarantee future results.
For complete, annualized performance for Delaware Emerging Markets Fund, please see the table on page 9.
The performance of Class A shares excludes the applicable sales charge and reflects the reinvestment of all distributions. Please see page 11 for a description of the index.
Index performance returns do not reflect any management fees, transaction costs, or expenses. Indices are unmanaged and one cannot invest directly in an index.
Emerging market equities fell sharply during the Fund’s fiscal year ended Nov. 30, 2015. Slowing economic growth in China, steep declines in commodities prices, and prospects for higher interest rates in the United States led to lackluster earnings growth and heightened investor risk aversion.
In China, equities rose sharply early in the fiscal period amid speculation of government stimulus in response to a wide-scale domestic economic slowdown; this was compounded by global weakness and the resulting decline in China’s exports. However, Chinese stocks plummeted in late June when the speculative bubble burst. And they tumbled further in late August after China devalued its yuan currency, shaking confidence and raising suspicions regarding the accuracy of official Chinese government economic data.
Concerns about China’s slowing economy caused global reverberations and seemed exacerbated by fears of further emerging market currency declines versus the U.S. dollar. We viewed this as being largely due to the investors’ anticipation of central bank policy divergence and the U.S. Federal Reserve raising rates by year-end.
Russia’s economy and stock market were shaken by both the sharp downturn in the price of oil and the effect of U.S. and European Union economic sanctions against Russia over its aggression in Ukraine.
Latin America, particularly Brazil, contained some of the weakest markets. In our opinion, Brazil’s heavy dependence on China as a robust market for exports proved costly, as demand from China fell and the prices commanded for oil and other commodities remained depressed; this resulted from the imbalance between supply and demand, and, in the case of oil in particular, growing inventories.
Fund performance
For the fiscal year ended Nov. 30, 2015, Delaware Emerging Markets Fund (Class A shares) returned -18.15% at net asset value and -22.85% at maximum offer price (both figures reflect all distributions reinvested). For the same period, the Fund’s benchmark, the MSCI Emerging Markets Index (net), returned -16.99%. For complete annualized performance for Delaware Emerging Markets Fund, please see the table on page 9.
During the fiscal year, China contributed the most positively to relative performance due to favorable stock selection. The Fund’s position in Sina benefited from an additional investment by the chairman and speculation that the company could be privatized or acquired. Shares of Youku Tudou rose after the company received a buyout offer from Alibaba. Shares of Baidu, in which the Fund holds a large overweight position, performed well on a relative basis after the company reported third quarter earnings that were in-line and
1
Portfolio management review
Delaware Emerging Markets Fund
provided encouraging revenue guidance, alleviating some concerns about the slowing Chinese economy.
In Russia, hopes for thawing relations with the West and recent strong earnings aided Sberbank. Additionally, shares of X5 benefited from improvement in the company’s operating performance.
In Korea, the Fund’s position in Samsung Electronics outperformed on a relative basis in anticipation of increased capital returns to shareholders and relatively stable performance in its semiconductor business. Shares of Lotte Chilsung Beverage benefited from the company’s market share gains in beer. The Fund’s underweight positions in Greece, Colombia, Thailand, Malaysia, and Indonesia also contributed to relative performance as all of these markets underperformed.
In contrast, Brazil detracted the most from performance. Shares of consumer company B2W Cia Digital and telecommunication operators Tim Participacoes and Telefonica Brasil declined as general economic weakness reduced consumers’ purchasing power. In addition, currency depreciation eroded revenue and profits in U.S. dollar terms. Slowing business travel and the weaker currency significantly affected airline Gol Linhas Aereas Inteligentes S.A. We believe that long-term competitiveness and franchise sustainability remain intact for all these companies and that they may be well positioned for structural growth when the economy recovers. Shares of Petrobras also declined in sympathy with oil prices. We continue to believe that the company owns what we view as significantly undervalued high-quality assets with strong prospects for long-term production growth.
In Taiwan, underperformance primarily stemmed from the Fund’s position in Mediatek, which
declined largely due to weak demand for non-Apple smartphones. In Mexico, the Fund’s position in Grupo Televisa also detracted from performance on weaker-than-expected recent advertising revenue, raising questions about whether this is a cyclical or longer-term structural downturn. In addition, the correction in U.S. media stocks seems to have cast a cloud over the company’s proposed initial public offering of Univision. We believe that Grupo Televisa’s ecosystem remains robust and that the company could be well-positioned to benefit if long-term growth in consumption and income occurs. Shares of Empresas ICA declined due to disappointing earnings coupled with slow progress in reducing its debt through asset divestiture.
Among sectors, technology contributed the most to positive/relative performance due to the Fund’s positions in Sina, Youku Tudou, and Baidu. On the negative side, the consumer discretionary sector detracted the most from performance, hurt by B2W Cia Digital in Brazil and an underweight position in Naspers in South Africa.
Our investment approach remains centered on identifying individual companies that we believe possess sustainable franchises and favorable long-term growth prospects, trading at significant discounts to our view of their intrinsic value. We are particularly focused on companies that we think should benefit from long-term changes in how people in emerging markets live and work. Sectors we currently favor include technology and telecommunications. Our view is that in the short term, global growth concerns are eclipsing fundamental valuation merits. However, we remain patient with our investments and continue to believe that companies with what we view as sound fundamentals have the potential to outperform over the long term.
2
Delaware Global Value Fund | December 8, 2015 |
| | | | | | | | |
| Performance preview (for the year ended November 30, 2015) | |
Delaware Global Value Fund (Class A shares) | | | 1-year return | | | | -4.27% | |
MSCI World Index (Gross) | | | 1-year return | | | | -0.17% | |
MSCI World Index (Net) | | | 1-year return | | | | -0.73% | |
Past performance does not guarantee future results.
For complete, annualized performance for Delaware Global Value Fund, please see the table on page 13.
The performance of Class A shares excludes the applicable sales charge and reflects the reinvestment of all distributions. Please see page 15 for a description of the index.
Index performance returns do not reflect any management fees, transaction costs, or expenses. Indices are unmanaged and one cannot invest directly in an index.
While much of 2015 saw a wide variety of trends vying for leadership in a market lacking any clear direction, weakening growth in emerging markets coupled with a renewed downward trajectory in commodity prices set the tone for a weaker environment for equity prices later in the year.
Declines appeared across all regions and sectors, with a mix of relative performance that corresponded to the ubiquitous weakening sentiment. Japan and perceived safe havens, such as the United States and Switzerland, outperformed regions with more concentrated exposure to commodity prices and emerging markets, while sectors such as consumer discretionary, healthcare, and staples outperformed energy and materials. Some regional highlights included:
● In the U.S., speculation about the timing of a U.S. Federal Reserve interest rate increase remained an ongoing issue. Gradual improvement across a broad sample of economic indicators was offset by concerns about slowing demand growth in overseas markets, particularly China, and the Federal Open Market Committee passed on its chance to initiate a rate increase at its October meeting. As the issue of drug pricing became grist for the U.S. political debate in the fall, the healthcare sector gave up a good deal of its prior outperformance, in the U.S. and abroad.
● European indices performed well for most of the period, buoyed by gradually improving economic
data, undemanding valuations, and relative quiescence on the political front. Interest rates eased slightly from the modest peak reached in June. Relative performance was hit in the third quarter, though, as the Volkswagen emissions-testing scandal broke, with consequences to the region’s substantial automotive industry and related suppliers. The region’s global healthcare stocks also saw some blowback from the escalating dialogue on drug pricing centered in the U.S.
● Japan led the global indices for the period, as gradual progress in economic indicators remained largely intact. However, as concerns about slowing growth in China (and more broadly across Asia) grew in prominence in the third quarter, Japan’s exposure to the region became manifest in both relative equity market underperformance and heightened volatility.
Slowing growth, high levels of debt, and persistent inflation remained prevalent emerging market headwinds. We saw this sentiment crystallized in the third quarter when China announced its decision to devalue its currency. Chinese officials said that they would “review and improve the regulatory framework of the market, strengthen supervision, and take measures to restore the functioning of the equity market, when appropriate.”
The market appeared to receive this move as an official acknowledgement that weakness in the
3
Portfolio management review
Delaware Global Value Fund
country’s economy called for more drastic intervention. Not for the first time, the tone and direction of equity market performance in non-U.S. developed markets has appeared to owe more to events outside that group than within it. The sheer scale of the U.S. and Chinese economies is sufficient that speculation about the timing of a Fed rate action, or the protracted slowing of Chinese industrial production, could define outcomes for the rest of the world, at least in the very short term. We believe that prospective returns, though, have more to do with long-term developments in economic growth, profitability, and valuation than the vicissitudes of local cycles. By these measures, we see some cause for optimism.
Fund performance
For the fiscal year ended Nov. 30, 2015, Delaware Global Value Fund (Class A shares) returned -4.27% at net asset value and -9.74% at maximum offer price (both figures reflect Class A shares with all distributions reinvested). For the same period, the Fund’s benchmark MSCI World Index (net) returned -0.73%. For complete, annualized performance for Delaware Global Value Fund, please see the table on page 13.
On a regional basis, positive stock selection in Japan and Canada was more than offset by adverse stock selection in the U.S., Europe ex-euro zone, and the United Kingdom. Overall regional allocation was slightly negative primarily due to exposure to emerging markets, which more than offset the positive effect from an overweight exposure to Japan and an underweight exposure to Asia ex-Japan. On a sector basis, strong stock selection in financials and health care was more than offset by weak stock selection in consumer staples, industrials, and consumer discretionary. Overall sector allocation was positive due to underweight positions in materials, energy, and utilities. Net currency effect was negative with an adverse effect from overweight exposure to the
Canadian dollar and the euro, which more than offset the favorable effect from an underweight exposure to the Australian dollar.
We believe little has changed across much of the developed world since the end of 2014, except a clearer recognition that earnings from emerging markets may be less certain than previously thought, and that valuations appear correspondingly more attractive. In Europe, relatively high valuations on trailing earnings continue to reflect, in part, the cyclical weakness that still prevails. Returns on equity remain in the lower band of the historical range, and normalization of profitability under a scenario of economic recovery could support stock prices even without further expansion of valuations. In Japan, a steep valuation discount to global norms on book value suggests there is room for further gains if the corresponding lag in returns-on-equity continues to close. As a group, U.S. companies are both highly profitable and highly valued. The third quarter’s rotation toward defensive consumer staple and utility stocks suggests the market is concerned that there is little room for further improvement. However, we believe few of the indications of tightness in the economy that typically mark the top of the business cycle are in place today, and low prevailing interest rates could justify further expansion of valuations.
Finally, in our view emerging economies remain the most significant source of market volatility. There is little indication even now that the rate of deterioration in economic growth has even started to slow – a necessary precondition to the renewal of confidence in the group as an attractive place to invest. Given the scale and duration of the investment cycle of the past decade, we are wary of further downside.
As a guide to investment policy, we believe that forecasting the complex interaction of economic trends is a daunting enterprise, but that strength and adaptability can be recognized at the company level, and it is these qualities, in our
4
view, that may facilitate long-term success under a variety of economic outcomes perhaps difficult to envision today.
5
| | |
| Portfolio management review | | |
| Delaware International Value Equity Fund | | December 8, 2015 |
| | | | | | | | |
| Performance preview (for the year ended November 30, 2015) | | | | | | |
Delaware International Value Equity Fund (Class A shares) | | | 1-year return | | | | -2.23% | |
MSCI EAFE Index (Gross) | | | 1-year return | | | | -2.52% | |
MSCI EAFE Index (Net) | | | 1-year return | | | | -2.94% | |
Past performance does not guarantee future results.
For complete, annualized performance for Delaware International Value Equity Fund, please see the table on page 17.
The performance of Class A shares excludes the applicable sales charge and reflects the reinvestment of all distributions. Please see page 19 for a description of the index.
Index performance returns do not reflect any management fees, transaction costs, or expenses. Indices are unmanaged and one cannot invest directly in an index.
While much of 2015 saw a wide variety of trends vying for leadership in a market lacking any clear direction, weakening growth in emerging markets coupled with a renewed downward trajectory in commodity prices set the tone for a weaker environment for equity prices later in the year.
Declines appeared across all regions and sectors, with a mix of relative performance that corresponded to the ubiquitous weakening sentiment. Japan and perceived safe havens, such as the United States and Switzerland, outperformed regions with more concentrated exposure to commodity prices and emerging markets, while sectors such as consumer discretionary, healthcare, and staples outperformed energy and materials. Some regional highlights included:
● In the U.S., speculation about the timing of a U.S. Federal Reserve interest rate increase remained an ongoing issue. Gradual improvement across a broad sample of economic indicators was offset by concerns about slowing demand growth in overseas markets, particularly China, and the Federal Open Market Committee passed on its chance to initiate a rate increase at its October meeting. As the issue of drug pricing became grist for the U.S. political debate in the fall, the healthcare sector gave up a good deal of its prior outperformance in the U.S. and abroad.
● European indices performed well for most of the period, buoyed by gradually improving economic
data, undemanding valuations, and relative quiescence on the political front. Interest rates eased slightly from the modest peak reached in June. Relative performance was hit in the third quarter, though, as the Volkswagen emissions-testing scandal broke, with consequences to the region’s substantial automotive industry and related suppliers. The region’s global healthcare stocks also saw some blowback from the escalating dialogue on drug pricing centered in the U.S.
● Japan led the global indices for the period, as gradual progress in economic indicators remained largely intact. However, as concerns about slowing growth in China (and more broadly across Asia) grew in prominence in the third quarter, Japan’s exposure to the region became manifest in both relative equity market underperformance and heightened volatility.
Slowing growth, high levels of debt, and persistent inflation remained prevalent emerging market headwinds. We saw this sentiment crystallized in the third quarter when China announced its decision to devalue its currency. Chinese officials said that they would “review and improve the regulatory framework of the market, strengthen supervision, and take measures to restore the functioning of the equity market, when appropriate.”
The market appeared to receive this move as an official acknowledgement that weakness in the
6
country’s economy called for more drastic intervention. Not for the first time, the tone and direction of equity market performance in non-U.S. developed markets has appeared to owe more to events outside that group than within it. The sheer scale of the U.S. and Chinese economies is sufficient that speculation about the timing of a Fed rate action, or the protracted slowing of Chinese industrial production, could define outcomes for the rest of the world, at least in the very short term. We believe that prospective returns, though, have more to do with long-term developments in economic growth, profitability, and valuation than the vicissitudes of local cycles. By these measures, we see some cause for optimism.
Fund performance
For the fiscal year ended Nov. 30, 2015, Delaware International Value Equity Fund (Class A shares) returned -2.23% at net asset value and -7.88% at maximum offer price (both figures reflect Class A shares with all distributions reinvested). For the same period, the Fund’s benchmark MSCI EAFE Index (net) returned -2.94%. For complete, annualized performance for Delaware International Value Equity Fund, please see the table on page 17.
On a regional basis, strong stock selection in Japan, Asia Pacific ex-Japan, and the euro zone more than offset adverse stock selection in Europe ex-euro zone and the United Kingdom. Overall regional allocation was positive. A favorable effect from underweight exposures to the U.K. and Asia Pacific and an overweight exposure to Canada more than offset the negative effect of exposure to emerging markets. Strong stock selection in information technology, consumer discretionary, and financials more than offset the adverse effect of weak stock selection in consumer staples. Overall sector allocation was positive in eight out of 10 sectors. Most notably, the favorable effect from an underweight exposure
to materials, an overweight exposure to information technology and an underweight exposure to financials more than offset the slightly negative effect from an underweight exposure to consumer staples. Net currency effect was negative. A favorable overweight exposure to the U.S. dollar and underweight exposure to the Australian dollar was more than offset by an underweight exposure to the British pound and exposure to the Canadian dollar.
Our view on global market drivers
We believe little has changed across much of the developed world since the end of 2014, except a clearer recognition that earnings from emerging markets may be less certain than previously thought, and that valuations appear correspondingly more attractive. In Europe, relatively high valuations on trailing earnings continue to reflect, in part, the cyclical weakness that still prevails. Returns on equity remain in the lower band of the historical range, and normalization of profitability under a scenario of economic recovery could support stock prices even without further expansion of valuations. In Japan, a steep valuation discount to global norms on book value suggests there is room for further gains if the corresponding lag in returns-on-equity continues to close. As a group, U.S. companies are both highly profitable and highly valued. The third quarter’s rotation toward defensive consumer staple and utility stocks suggests the market is concerned that there is little room for further improvement. However, we believe few of the indications of tightness in the economy that typically mark the top of the business cycle are in place today, and low prevailing interest rates could justify further expansion of valuations.
Finally, in our view emerging economies remain the most significant source of market volatility. There is little indication even now that the rate of deterioration in economic growth has even started to slow — a necessary precondition to the
7
Performance management review
Delaware International Value Equity Fund
renewal of confidence in the group as an attractive place to invest. Given the scale and duration of the investment cycle of the past decade, we are wary of further downside.
As a guide to investment policy, we believe that forecasting the complex interaction of economic trends is a daunting enterprise, but that strength and adaptability can be recognized at the company level, and it is these qualities, in our view, that may facilitate long-term success under a variety of economic outcomes perhaps difficult to envision today.
8
| | |
| Performance summaries | | |
| Delaware Emerging Markets Fund | | November 30, 2015 |
The performance data quoted represent past performance; past performance does not guarantee future results. Investment return and principal value will fluctuate so your shares, when redeemed, may be worth more or less than their original cost. Please obtain the performance data current for the most recent month end by calling 800 523-1918 or visiting our website at delawareinvestments.com/performance. Current performance may be lower or higher than the performance data quoted.
| | | | | | | | | | | | | | | | |
| Fund and benchmark performance1,2 | | Average annual total returns through November 30, 2015 | |
| | | 1 year | | | 5 years | | | 10 years | | | Lifetime | |
Class A (Est. June 10, 1996) | | | | | | | | | | | | | | | | |
Excluding sales charge | | | -18.15% | | | | -1.58% | | | | +5.17% | | | | +6.82% | |
Including sales charge | | | -22.85% | | | | -2.74% | | | | +4.55% | | | | +6.50% | |
Class C (Est. June 10, 1996) | | | | | | | | | | | | | | | | |
Excluding sales charge | | | -18.74% | | | | -2.31% | | | | +4.39% | | | | +6.03% | |
Including sales charge | | | -19.53% | | | | -2.31% | | | | +4.39% | | | | +6.03% | |
Class R (Est. Aug. 31, 2009) | | | | | | | | | | | | | | | | |
Excluding sales charge | | | -18.37% | | | | -1.83% | | | | n/a | | | | +2.75% | |
Including sales charge | | | -18.37% | | | | -1.83% | | | | n/a | | | | +2.75% | |
Institutional Class (Est. June 10, 1996) | | | | | | | | | | | | | | | | |
Excluding sales charge | | | -17.96% | | | | -1.33% | | | | -5.43% | | | | +7.10% | |
Including sales charge | | | -17.96% | | | | -1.33% | | | | -5.43% | | | | +7.10% | |
MSCI Emerging Markets Index (Gross)* | | | -16.68% | | | | -2.72% | | | | +4.78% | | | | +5.19% | |
MSCI Emerging Markets Index (Net)* | | | -16.99% | | | | -3.05% | | | | +4.44% | | | | +4.93% | |
*The benchmark lifetime return is for Class A share comparison only and is calculated using the last business day in the month of the Fund’s Class A inception date.
1 Returns reflect the reinvestment of all distributions and are presented both with and without the applicable sales charges described below. Returns do not reflect the deduction of taxes the shareholder would pay on Fund distributions or redemptions of Fund shares.
Expense limitations were in effect for certain classes during some or all of the periods shown in the “Fund and benchmark performance” table. Expenses for each class are listed on the “Fund expense ratios” table on page 10. Performance would have been lower had expense limitations not been in effect.
Class A shares are sold with a maximum front-end sales charge of 5.75%, and have an annual distribution and service fee of 0.25% of average daily net assets. Performance for Class A shares, excluding sales charges, assumes that no front-end sales charge applied.
Class C shares are sold with a contingent deferred sales charge of 1.00% if redeemed during the first 12 months. They are also subject to an annual distribution and service fee of 1.00% of average daily net assets. Performance for C shares, excluding sales charges, assumes either that contingent deferred sales charges did not apply or that the investment was not redeemed.
9
Performance summaries
Delaware Emerging Markets Fund
Class R shares are available only for certain retirement plan products. They are sold without a sales charge and have an annual distribution and service fee of 0.50% of average daily net assets.
Institutional Class shares are available without sales or asset-based distribution charges only to certain eligible institutional accounts.
International investments entail risks not ordinarily associated with U.S. investments including
fluctuation in currency values, differences in accounting principles, or economic or political instability in other nations.
Investing in emerging markets can be riskier than investing in established foreign markets due to increased volatility and lower trading volume.
Investments in small and/or medium-sized companies typically exhibit greater risk and higher volatility than larger, more established companies.
2The Fund’s expense ratios, as described in the most recent prospectus, are disclosed in the following “Fund expense ratios” table.
| | | | | | | | |
| Fund expense ratios | | Class A | | Class C | | Class R | | Institutional Class |
Total annual operating expenses | | 1.69% | | 2.44% | | 1.94% | | 1.44% |
(without fee waivers) | | | | | | | | |
Net expenses | | 1.69% | | 2.44% | | 1.94% | | 1.44% |
(including fee waivers, if any) | | | | | | | | |
Type of waiver | | n/a | | n/a | | n/a | | n/a |
10
Performance of a $10,000 investment1
Average annual total returns from Nov. 30, 2005, through Nov. 30, 2015
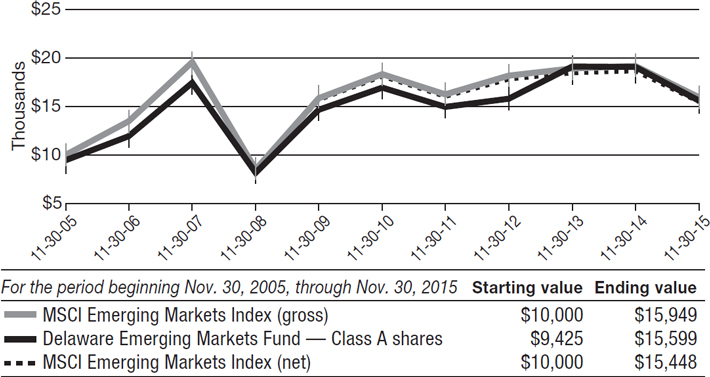
1 The “Performance of a $10,000 investment” graph assumes $10,000 invested in Class A shares of the Fund on Nov. 30, 2005, and includes the effect of a 5.75% front-end sales charge and the reinvestment of all distributions. The graph does not reflect the deduction of taxes the shareholders would pay on Fund distributions or redemptions of Fund shares. Expense limitations were in effect for some or all of the periods shown. Performance would have been lower had expense limitations not been in effect. Expenses are listed in the “Fund expense ratios” table on page 10. Please note additional details on pages 9 through 12.
The graph also assumes $10,000 invested in the MSCI Emerging Markets Index as of Nov. 30, 2005. The MSCI Emerging Markets Index measures equity market performance across emerging market countries worldwide. Index “gross” return approximates the maximum possible dividend reinvestment. Index “net” return approximates the minimum possible dividend reinvestment, after deduction of withholding tax at the highest possible rate.
Index performance returns do not reflect any management fees, transaction costs, or expenses. Indices are unmanaged and one cannot invest directly in an index. Past performance is not a guarantee of future results.
Performance of other Fund classes will vary due to different charges and expenses.
11
Performance summaries
Delaware Emerging Markets Fund
| | | | | | | | | | |
| | | Nasdaq symbols | | CUSIPs | | | | | |
Class A | | DEMAX | | | 245914841 | | | | | |
Class C | | DEMCX | | | 245914825 | | | | | |
Class R | | DEMRX | | | 245914569 | | | | | |
Institutional Class | | DEMIX | | | 245914817 | | | | | |
12
| | |
| Performance summaries | | |
| Delaware Global Value Fund | | November 30, 2015 |
The performance data quoted represent past performance; past performance does not guarantee future results. Investment return and principal value will fluctuate so your shares, when redeemed, may be worth more or less than their original cost. Please obtain the performance data current for the most recent month end by calling 800 523-1918 or visiting our website at delawareinvestments.com/performance. Current performance may be lower or higher than the performance data quoted.
| | |
| Fund and benchmark performance1,2 | | Average annual total returns through November 30, 2015 |
| | | | | | | | | | | | |
| | | 1 year | | | 5 years | | | 10 years | |
Class A (Est. Dec. 19, 1997) | | | | | | | | | | | | |
Excluding sales charge | | | -4.27% | | | | +6.90% | | | | +4.23% | |
Including sales charge | | | -9.74% | | | | +5.63% | | | | +3.61% | |
Class C (Est. Sept. 28, 2001) | | | | | | | | | | | | |
Excluding sales charge | | | -5.05% | | | | +6.09% | | | | +3.45% | |
Including sales charge | | | -6.00% | | | | +6.09% | | | | +3.45% | |
Institutional Class (Est. Dec. 19, 1997) | | | | | | | | | | | | |
Excluding sales charge | | | -4.09% | | | | +7.14% | | | | +4.49% | |
Including sales charge | | | -4.09% | | | | +7.14% | | | | +4.49% | |
MSCI World Index (Gross) | | | -0.17% | | | | +10.13% | | | | +5.98% | |
MSCI World Index (Net) | | | -0.73% | | | | +9.52% | | | | +5.40% | |
1 Returns reflect the reinvestment of all distributions and are presented both with and without the applicable sales charges described below. Returns do not reflect the deduction of taxes the shareholder would pay on Fund distributions or redemptions of Fund shares.
Expense limitations were in effect for certain classes during some or all of the periods shown in the “Fund and benchmark performance” table. Expenses for each class are listed on the “Fund expense ratios” table on page 14. Performance would have been lower had expense limitations not been in effect.
Class A shares are sold with a maximum front-end sales charge of 5.75%, and have an annual distribution and service fee of 0.25% of average daily net assets. Performance for Class A shares,
excluding sales charges, assumes that no front-end sales charge applied.
Class C shares are sold with a contingent deferred sales charge of 1.00% if redeemed during the first 12 months. They are also subject to an annual distribution and service fee of 1.00% of average daily net assets. Performance for Class C shares, excluding sales charges, assumes either that contingent deferred sales charges did not apply or that the investment was not redeemed.
Institutional Class shares are available without sales or asset-based distribution charges only to certain eligible institutional accounts.
International investments entail risks not ordinarily associated with U.S. investments including fluctuation in currency values, differences in accounting principles, or economic or political instability in other nations.
13
Performance summaries
Delaware Global Value Fund
Investing in emerging markets can be riskier than investing in established foreign markets due to increased volatility and lower trading volume.
Investments in small and/or medium-sized companies typically exhibit greater risk and higher volatility than larger, more established companies.
2The Fund’s expense ratios, as described in the most recent prospectus, are disclosed in the following “Fund expense ratios” table. Delaware Management Company has agreed to reimburse certain expenses and/or waive certain fees in order to prevent total fund operating expenses (excluding any 12b-1 fees, taxes, interest, short sale dividend and interest expenses, brokerage fees, certain insurance costs, acquired fund fees and expenses, and nonroutine expenses or costs, including, but not limited to, those relating to reorganizations, litigation, conducting shareholder meetings, and liquidations (collectively nonroutine expenses)) from exceeding 1.30% of the Fund’s average daily net assets during the period from Dec. 1. 2014 through Nov. 30, 2015.* Please see the most recent prospectus and any applicable supplement(s) for additional information on these fee waivers and/or reimbursements.
| | | | | | |
| Fund expense ratios | | Class A | | Class C | | Institutional Class |
Total annual operating expenses | | 1.80% | | 2.55% | | 1.55% |
(without fee waivers) | | | | | | |
Net expenses | | 1.55% | | 2.30% | | 1.30% |
(including fee waivers, if any) | | | | | | |
Type of waiver | | Contractual | | Contractual | | Contractual |
*The contractual waiver period is from March 28, 2014 through March 30, 2016.
14
Performance of a $10,000 investment1
Average annual total returns from Nov. 30, 2005, through Nov. 30, 2015
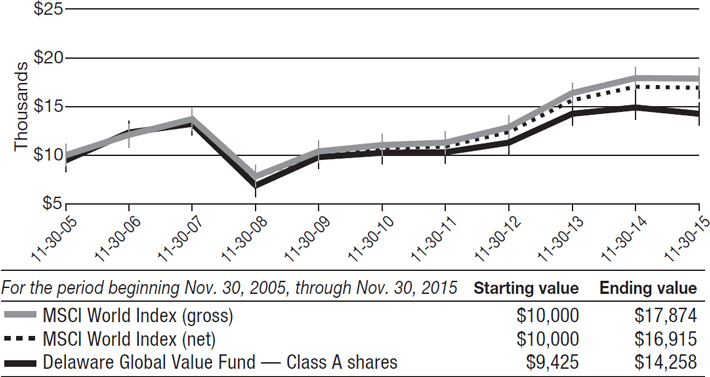
1 The “Performance of a $10,000 investment” graph assumes $10,000 invested in Class A shares of the Fund on Nov. 30, 2005, and includes the effect of a 5.75% front-end sales charge and the reinvestment of all distributions. The graph does not reflect the deduction of taxes the shareholders would pay on Fund distributions or redemptions of Fund shares. Expense limitations were in effect for some or all of the periods shown. Performance would have been lower had expense limitations not been in effect. Expenses are listed in the “Fund expense ratios” table on page 14. Please note additional details on pages 13 through 16.
The graph also assumes $10,000 invested in the MSCI World Index as of Nov. 30, 2005. The MSCI World Index is a free float-adjusted market capitalization weighted index designed to measure equity market performance across developed markets worldwide. Index “gross” return approximates the maximum possible dividend reinvestment. Index “net” return approximates the minimum possible dividend reinvestment, after deduction of withholding tax at the highest possible rate.
Index performance returns do not reflect any management fees, transaction costs, or expenses. Indices are unmanaged and one cannot invest directly in an index. Past performance is not a guarantee of future results.
Performance of other Fund classes will vary due to different charges and expenses.
15
Performance summaries
Delaware Global Value Fund
| | | | | | | | | | |
| | | Nasdaq symbols | | CUSIPs | | | | | |
Class A | | DABAX | | | 245914718 | | | | | |
Class C | | DABCX | | | 245914684 | | | | | |
Institutional Class | | DABIX | | | 245914676 | | | | | |
16
| | |
| Delaware International Value Equity Fund | | November 30, 2015 |
The performance data quoted represent past performance; past performance does not guarantee future results. Investment return and principal value will fluctuate so your shares, when redeemed, may be worth more or less than their original cost. Please obtain the performance data current for the most recent month end by calling 800 523-1918 or visiting our website at delawareinvestments.com/performance. Current performance may be lower or higher than the performance data quoted.
| | |
| Fund and benchmark performance1,2 | | Average annual total returns through November 30, 2015 |
| | | | | | | | | | | | |
| | | 1 year | | | 5 years | | | 10 years | |
Class A (Est. Oct. 31, 1991) | | | | | | | | | | | | |
Excluding sales charge | | | -2.23% | | | | +3.76% | | | | +2.51% | |
Including sales charge | | | -7.88% | | | | +2.53% | | | | +1.90% | |
Class C (Est. Nov. 29, 1995) | | | | | | | | | | | | |
Excluding sales charge | | | -2.99% | | | | +2.98% | | | | +1.78% | |
Including sales charge | | | -3.95% | | | | +2.98% | | | | +1.78% | |
Class R (Est. June 2, 2003) | | | | | | | | | | | | |
Excluding sales charge | | | -2.50% | | | | +3.52% | | | | +2.30% | |
Including sales charge | | | -2.50% | | | | +3.52% | | | | +2.30% | |
Institutional Class (Est. Nov. 9, 1992) | | | | | | | | | | | | |
Excluding sales charge | | | -2.03% | | | | +4.03% | | | | +2.80% | |
Including sales charge | | | -2.03% | | | | +4.03% | | | | +2.80% | |
MSCI EAFE Index (Gross) | | | -2.52% | | | | +5.99% | | | | +4.11% | |
MSCI EAFE Index (Net) | | | -2.94% | | | | +5.52% | | | | +3.64% | |
1 Returns reflect the reinvestment of all distributions and are presented both with and without the applicable sales charges described below. Returns do not reflect the deduction of taxes the shareholder would pay on Fund distributions or redemptions of Fund shares.
Expense limitations were in effect for certain classes during some or all of the periods shown in the “Fund and benchmark performance” table. Expenses for each class are listed on the “Fund expense ratios” table on page 18. Performance would have been lower had expense limitations not been in effect.
Class A shares are sold with a maximum front-end sales charge of 5.75%, and have an annual distribution and service fee of 0.25% of average daily net assets. Performance for Class A shares, excluding sales charges, assumes that no front-end sales charge applied.
Class C shares are sold with a contingent deferred sales charge of 1.00% if redeemed during the first 12 months. They are also subject to an annual distribution and service fee of 1.00% of average daily net assets. Performance for Class C shares, excluding sales charges, assumes either that contingent deferred sales charges did not apply or that the investment was not redeemed.
17
Performance summaries
Delaware International Value Equity Fund
Class R shares are available only for certain retirement plan products. They are sold without a sales charge and have an annual distribution and service fee of 0.50% of average daily net assets.
Institutional Class shares are available without sales or asset-based distribution charges only to certain eligible institutional accounts.
International investments entail risks not ordinarily associated with U.S. investments including fluctuation in currency values, differences in accounting principles, or economic or political instability in other nations.
Investing in emerging markets can be riskier than investing in established foreign markets due to increased volatility and lower trading volume.
2The Fund’s expense ratios, as described in the most recent prospectus, are disclosed in the following “Fund expense ratios” table. Delaware Management Company has agreed to reimburse certain expenses and/or waive certain fees in order to prevent total fund operating expenses (excluding any 12b-1 fees, taxes, interest, short sale dividend and interest expenses, brokerage fees, certain insurance costs, acquired fund fees and expenses, and nonroutine expenses or costs, including, but not limited to, those relating to reorganizations, litigation, conducting shareholder meetings, and liquidations (collectively nonroutine expenses)) from exceeding 1.21% of the Fund’s average daily net assets during the period from Dec. 1, 2014 through Nov. 30, 2015.* Please see the most recent prospectus and any applicable supplement(s) for additional information on these fee waivers and/or reimbursements.
| | | | | | | | |
| Fund expense ratios | | Class A | | Class C | | Class R | | Institutional Class |
Total annual operating expenses | | 1.42% | | 2.17% | | 1.67% | | 1.17% |
(without fee waivers) | | | | | | | | |
Net expenses** | | 1.42% | | 2.17% | | 1.67% | | 1.17% |
(including fee waivers, if any) | | | | | | | | |
Type of waiver | | Contractual | | Contractual | | Contractual | | Contractual |
*The contractual waiver period is from March 28, 2014 through March 30, 2016.
**Fee waivers were in place, but due to the Fund’s expense level, the waivers had no impact.
18
Performance of a $10,000 investment1
Average annual total returns from Nov. 30, 2005, through Nov. 30, 2015
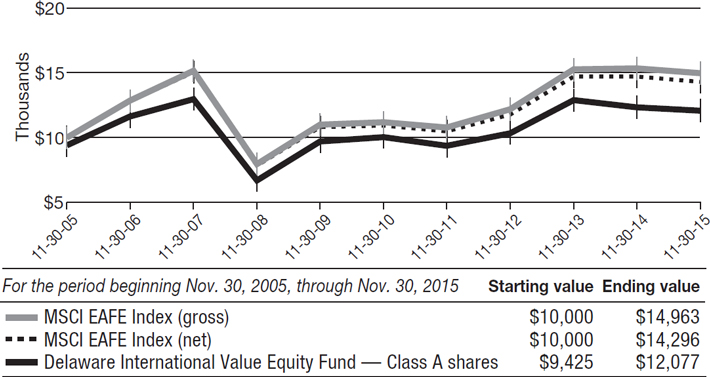
1 The “Performance of a $10,000 investment” graph assumes $10,000 invested in Class A shares of the Fund on Nov. 30, 2005, and includes the effect of a 5.75% front-end sales charge and the reinvestment of all distributions. The graph does not reflect the deduction of taxes the shareholders would pay on Fund distributions or redemptions of Fund shares. Expense limitations were in effect for some or all of the periods shown. Performance would have been lower had expense limitations not been in effect. Current expenses are listed in the “Fund expense ratios” table on page 18. Please note additional details on pages 17 through 20.
The graph also assumes $10,000 invested in the MSCI EAFE Index as of Nov. 30, 2005. The MSCI EAFE (Europe, Australasia, FarEast) Index is a free float-adjusted market capitalization weighted index designed to measure equity market performance of developed markets, excluding the United States and Canada. Index “gross” return approximates the maximum possible dividend reinvestment. Index “net” return approximates the minimum possible dividend reinvestment, after deduction of withholding tax at the highest possible rate.
Index performance returns do not reflect any management fees, transaction costs, or expenses. Indices are unmanaged and one cannot invest directly in an index. Past performance is not a guarantee of future results.
Performance of other Fund classes will vary due to different charges and expenses.
19
Performance summaries
Delaware International Value Equity Fund
| | | | | | | | | | |
| | | Nasdaq symbols | | CUSIPs | | | | | |
Class A | | DEGIX | | | 245914106 | | | | | |
Class C | | DEGCX | | | 245914858 | | | | | |
Class R | | DIVRX | | | 245914577 | | | | | |
Institutional Class | | DEQIX | | | 245914403 | | | | | |
20
Disclosure of Fund expenses
For the six-month period from June 1, 2015 to November 30, 2015 (Unaudited)
As a shareholder of a Fund, you incur two types of costs: (1) transaction costs, including sales charges (loads) on purchase payments, reinvested dividends, or other distributions; redemption fees; and exchange fees; and (2) ongoing costs, including management fees; distribution and/or service (12b-1) fees; and other Fund expenses. These following examples are intended to help you understand your ongoing costs (in dollars) of investing in a Fund and to compare these costs with the ongoing costs of investing in other mutual funds.
The examples are based on an investment of $1,000 invested at the beginning of the period and held for the entire six-month period from June 1, 2015 to Nov. 30, 2015.
Actual expenses
The first section of the tables shown, “Actual Fund return,” provides information about actual account values and actual expenses. You may use the information in this section of the table, together with the amount you invested, to estimate the expenses that you paid over the period. Simply divide your account value by $1,000 (for example, an $8,600 account value divided by $1,000 = 8.6), then multiply the result by the number in the first section under the heading entitled “Expenses Paid During Period” to estimate the expenses you paid on your account during this period.
Hypothetical example for comparison purposes
The second section of the tables shown, “Hypothetical 5% return,” provides information about hypothetical account values and hypothetical expenses based on the Funds’ actual expense ratios and an assumed rate of return of 5% per year before expenses, which is not the Funds’ actual return. The hypothetical account values and expenses may not be used to estimate the actual ending account balance or expenses you paid for the period. You may use this information to compare the ongoing costs of investing in the Fund and other funds. To do so, compare this 5% hypothetical example with the 5% hypothetical examples that appear in the shareholder reports of the other funds.
Please note that the expenses shown in the tables are meant to highlight your ongoing costs only and do not reflect any transactional costs, such as sales charges (loads), redemption fees, or exchange fees. Therefore, the second section of each table is useful in comparing ongoing costs only, and will not help you determine the relative total costs of owning different funds. In addition, if these transactional costs were included, your costs would have been higher. The Funds’ expenses shown in the tables reflect fee waivers in effect. The expenses shown in each table assume reinvestment of all dividends and distributions.
21
Disclosure of Fund expenses
For the six-month period from June 1, 2015 to November 30, 2015 (Unaudited)
Delaware Emerging Markets Fund
Expense analysis of an investment of $1,000
| | | | | | | | | | | | | | | | |
| | | Beginning Account Value 6/1/15 | | | Ending Account Value 11/30/15 | | | Annualized Expense Ratio | | | Expenses Paid During Period 6/1/15 to 11/30/15* | |
| | | | |
Actual Fund return† | | | | | | | | | | | | | | | | |
Class A | | | $1,000.00 | | | | $871.90 | | | | 1.76% | | | | $8.26 | |
Class C | | | 1,000.00 | | | | 868.30 | | | | 2.51% | | | | 11.76 | |
Class R | | | 1,000.00 | | | | 870.40 | | | | 2.01% | | | | 9.42 | |
Institutional Class | | | 1,000.00 | | | | 872.80 | | | | 1.51% | | | | 7.09 | |
| | | | |
Hypothetical 5% return (5% return before expenses) | | | | | | | | | | | | | | | | |
Class A | | | $1,000.00 | | | | $1,016.24 | | | | 1.76% | | | | $8.90 | |
Class C | | | 1,000.00 | | | | 1,012.48 | | | | 2.51% | | | | 12.66 | |
Class R | | | 1,000.00 | | | | 1,014.99 | | | | 2.01% | | | | 10.15 | |
Institutional Class | | | 1,000.00 | | | | 1,017.50 | | | | 1.51% | | | | 7.64 | |
Delaware Global Value Fund | |
Expense analysis of an investment of $1,000 | |
| | | Beginning Account Value 6/1/15 | | | Ending Account Value 11/30/15 | | | Annualized Expense Ratio | | | Expenses Paid During Period 6/1/15 to 11/30/15* | |
| | | | |
Actual Fund return† | | | | | | | | | | | | | | | | |
Class A | | | $1,000.00 | | | | $919.30 | | | | 1.70% | | | | $8.18 | |
Class C | | | 1,000.00 | | | | 915.20 | | | | 2.45% | | | | 11.76 | |
Institutional Class | | | 1,000.00 | | | | 920.40 | | | | 1.45% | | | | 6.98 | |
| | | | |
Hypothetical 5% return (5% return before expenses) | | | | | | | | | | | | | | | | |
Class A | | | $1,000.00 | | | | $1,016.55 | | | | 1.70% | | | | $8.59 | |
Class C | | | 1,000.00 | | | | 1,012.78 | | | | 2.45% | | | | 12.36 | |
Institutional Class | | | 1,000.00 | | | | 1,017.80 | | | | 1.45% | | | | 7.33 | |
22
Delaware International Value Equity Fund
Expense analysis of an investment of $1,000
| | | | | | | | | | | | | | | | |
| | | Beginning Account Value 6/1/15 | | | Ending Account Value 11/30/15 | | | Annualized Expense Ratio | | | Expenses Paid During Period 6/1/15 to 11/30/15* | |
| | | | |
Actual Fund return† | | | | | | | | | | | | | | | | |
Class A | | | $1,000.00 | | | | $923.10 | | | | 1.36% | | | | $6.56 | |
Class C | | | 1,000.00 | | | | 919.00 | | | | 2.11% | | | | 10.15 | |
Class R | | | 1,000.00 | | | | 921.40 | | | | 1.61% | | | | 7.75 | |
Institutional Class | | | 1,000.00 | | | | 923.40 | | | | 1.11% | | | | 5.35 | |
| | | | |
Hypothetical 5% return (5% return before expenses) | | | | | | | | | | | | | | | | |
Class A | | | $1,000.00 | | | | $1,018.25 | | | | 1.36% | | | | $6.88 | |
Class C | | | 1,000.00 | | | | 1,014.49 | | | | 2.11% | | | | 10.66 | |
Class R | | | 1,000.00 | | | | 1,017.00 | | | | 1.61% | | | | 8.14 | |
Institutional Class | | | 1,000.00 | | | | 1,019.50 | | | | 1.11% | | | | 5.62 | |
| * | “Expenses Paid During Period” are equal to the relevant Fund’s annualized expense ratio, multiplied by the average account value over the period, multiplied by 183/365 (to reflect the one-half year period). |
| † | Because actual returns reflect only the most recent six-month period, the returns shown may differ significantly from fiscal year returns. |
23
Security type / country and sector allocations
| | |
| Delaware Emerging Markets Fund | | As of November 30, 2015 (Unaudited) |
Sector designations may be different than the sector designations presented in other fund materials. The sector designations may represent the investment manager’s internal sector classifications, which may result in the sector designations for one fund being different than another fund’s sector designations.
| | | | |
Security type / country | | Percentage of net assets | |
Common Stock by Country | | | 99.57% | |
Argentina | | | 3.14% | |
Bahrain | | | 0.06% | |
Brazil | | | 11.30% | |
Canada | | | 0.02% | |
Chile | | | 0.94% | |
China/Hong Kong | | | 33.35% | |
Cyprus | | | 0.44% | |
France | | | 0.06% | |
India | | | 10.91% | |
Malaysia | | | 0.85% | |
Mexico | | | 4.65% | |
Peru | | | 0.34% | |
Poland | | | 0.32% | |
Republic of Korea | | | 14.65% | |
Russia | | | 8.48% | |
South Africa | | | 0.44% | |
Taiwan | | | 4.85% | |
Thailand | | | 0.65% | |
Turkey | | | 3.05% | |
United Kingdom | | | 0.07% | |
United States | | | 1.00% | |
Preferred Stock | | | 3.75% | |
Exchange-Traded Fund | | | 0.68% | |
Participation Notes | | | 0.00% | |
Rights | | | 0.02% | |
Total Value of Securities | | | 104.02% | |
Liabilities Net of Receivables and Other Assets | | | (4.02%) | |
Total Net Assets | | | 100.00% | |
24
| | | | |
Common stock, participation notes and preferred stock by sector² | | Percentage of net assets | |
Consumer Discretionary | | | 6.74% | |
Consumer Staples | | | 9.61% | |
Energy | | | 14.83% | |
Financials | | | 13.42% | |
Industrials | | | 4.40% | |
Information Technology* | | | 36.66% | |
Materials | | | 3.73% | |
Telecommunication Service | | | 13.64% | |
Utilities | | | 0.29% | |
Total | | | 103.32% | |
| ² | Narrow industries are utilized for compliance purposes for diversification whereas broad sectors are used for financial reporting. |
| * | To monitor compliance with the Fund’s concentration guidelines as described in the Fund’s Prospectus and Statement of Additional Information, the Information Technology sector (as disclosed herein for financial reporting purposes) is divided into various sub-categories or “industries,” in this case, electronics, internet, semiconductors, and software. As of Nov. 30, 2015, such amounts, as a percentage of total net assets, were 1.59%, 24.85%, 10.16% and 0.06%, respectively. The percentage in any such single industry will comply with the Fund’s concentration policy even if the percentage in the “Information Technology sector” for financial reporting purposes may exceed 25%. |
25
Security type / country and sector allocations
| | |
| Delaware Global Value Fund | | As of November 30, 2015 (Unaudited) |
Sector designations may be different than the sector designations presented in other fund materials. The sector designations may represent the investment manager’s internal sector classifications, which may result in the sector designations for one fund being different than another fund’s sector designations.
| | | | |
Security type / country | | Percentage of net assets | |
Common Stock by Country | | | 98.97% | |
Australia | | | 1.11% | |
Canada | | | 5.78% | |
France | | | 6.63% | |
Germany | | | 2.10% | |
Indonesia | | | 1.31% | |
Israel | | | 3.40% | |
Italy | | | 2.05% | |
Japan | | | 13.63% | |
Netherlands | | | 3.23% | |
Russia | | | 0.73% | |
Sweden | | | 2.08% | |
Switzerland | | | 2.66% | |
United Kingdom | | | 6.40% | |
United States | | | 47.86% | |
Rights | | | 0.05% | |
Short-Term Investments | | | 1.04% | |
Securities Lending Collateral | | | 3.74% | |
Total Value of Securities | | | 103.80% | |
Obligation to Return Securities Lending Collateral | | | (3.74%) | |
Liabilities Net of Receivables and Other Assets | | | (0.06%) | |
Total Net Assets | | | 100.00% | |
26
| | | | |
Common stock by sector | | Percentage of net assets | |
Consumer Discretionary | | | 13.61% | |
Consumer Staples | | | 7.69% | |
Energy | | | 5.17% | |
Financials | | | 22.87% | |
Healthcare | | | 13.04% | |
Industrials | | | 15.41% | |
Information Technology | | | 13.74% | |
Materials | | | 1.10% | |
Telecommunication Services | | | 6.34% | |
Total | | | 98.97% | |
27
Security type / country and sector allocations
| | |
| Delaware International Value Equity Fund | | As of November 30, 2015 (Unaudited) |
Sector designations may be different than the sector designations presented in other fund materials. The sector designations may represent the investment manager’s internal sector classifications, which may result in the sector designations for one fund being different than another fund’s sector designations.
| | | | |
Security type / country | | Percentage of net assets | |
Common Stock by Country | | | 98.43% | |
Australia | | | 1.19% | |
Canada | | | 6.09% | |
China/Hong Kong | | | 6.09% | |
Denmark | | | 1.97% | |
France | | | 17.01% | |
Germany | | | 5.60% | |
Indonesia | | | 1.45% | |
Israel | | | 4.37% | |
Italy | | | 2.32% | |
Japan | | | 23.53% | |
Netherlands | | | 4.32% | |
Norway | | | 0.15% | |
Republic of Korea | | | 1.95% | |
Russia | | | 0.84% | |
Sweden | | | 5.18% | |
Switzerland | | | 5.95% | |
United Kingdom | | | 10.42% | |
Rights | | | 0.07% | |
Short-Term Investments | | | 1.39% | |
Securities Lending Collateral | | | 2.23% | |
Total Value of Securities | | | 102.12% | |
Obligation to Return Securities Lending Collateral | | | (2.23%) | |
Receivables and Other Assets Net of Liabilities | | | 0.11% | |
Total Net Assets | | | 100.00% | |
28
| | | | |
Common stock by sector | | Percentage of net assets | |
Consumer Discretionary | | | 15.94% | |
Consumer Staples | | | 9.71% | |
Energy | | | 5.29% | |
Financials | | | 17.80% | |
Healthcare | | | 12.86% | |
Industrials | | | 15.40% | |
Information Technology | | | 9.74% | |
Materials | | | 3.79% | |
Telecommunication Services | | | 6.63% | |
Utilities | | | 1.27% | |
Total | | | 98.43% | |
29
| | |
| Schedules of investments | | |
| Delaware Emerging Markets Fund | | November 30, 2015 |
| | | | | | | | |
| | | Number of shares | | | Value (U.S. $) | |
| |
Common Stock – 99.57%D | | | | | | | | |
| |
Argentina – 3.14% | | | | | | | | |
Arcos Dorados Holdings Class A @ | | | 3,864,818 | | | $ | 15,227,383 | |
Cresud ADR @† | | | 1,459,225 | | | | 16,080,660 | |
Grupo Clarin Class B GDR 144A #@= | | | 353,200 | | | | 9,566,127 | |
IRSA Inversiones y Representaciones ADR @† | | | 873,600 | | | | 12,012,000 | |
| | | | | | | | |
| | | | | | | 52,886,170 | |
| | | | | | | | |
Bahrain – 0.06% | | | | | | | | |
Aluminum Bahrain GDR 144A #@ | | | 221,400 | | | | 1,091,015 | |
| | | | | | | | |
| | | | | | | 1,091,015 | |
| | | | | | | | |
Brazil – 11.30% | | | | | | | | |
AES Tiete | | | 493,000 | | | | 1,682,289 | |
B2W Cia Digital @† | | | 5,402,365 | | | | 20,613,424 | |
Banco Santander Brasil ADR | | | 2,188,500 | | | | 8,272,530 | |
Braskem ADR | | | 411,400 | | | | 5,529,216 | |
BRF ADR | | | 686,500 | | | | 9,775,760 | |
Centrais Eletricas Brasileiras † | | | 2,140,204 | | | | 3,203,418 | |
Cia Brasileira de Distribuicao ADR | | | 537,100 | | | | 6,745,976 | |
Cia Siderurgica Nacional ADR | | | 1,200,000 | | | | 1,704,000 | |
Gerdau @ | | | 2,764,900 | | | | 2,966,247 | |
Gol Linhas Aereas Inteligentes ADR | | | 4,800,000 | | | | 3,873,600 | |
Hypermarcas † | | | 5,200,000 | | | | 30,111,418 | |
Itau Unibanco Holding ADR | | | 4,510,000 | | | | 31,930,800 | |
Petroleo Brasileiro ADR † | | | 2,000,000 | | | | 9,540,000 | |
Rumo Logistica Operadora Multimodal † | | | 1,439,651 | | | | 2,232,998 | |
Telefonica Brasil ADR | | | 2,699,863 | | | | 25,324,715 | |
Tim Participacoes ADR | | | 2,300,000 | | | | 22,954,000 | |
Vale ADR | | | 1,131,557 | | | | 3,813,347 | |
| | | | | | | | |
| | | | | | | 190,273,738 | |
| | | | | | | | |
Canada – 0.02% | | | | | | | | |
Gran Tierra Energy † | | | 134,900 | | | | 337,250 | |
| | | | | | | | |
| | | | | | | 337,250 | |
| | | | | | | | |
Chile – 0.94% | | | | | | | | |
Latam Airlines Group ADR † | | | 300,000 | | | | 1,656,000 | |
Sociedad Quimica y Minera de Chile ADR | | | 841,749 | | | | 14,132,966 | |
| | | | | | | | |
| | | | | | | 15,788,966 | |
| | | | | | | | |
China/Hong Kong – 33.35% | | | | | | | | |
Alibaba Group Holding ADR † | | | 88,000 | | | | 7,399,040 | |
Baidu ADR † | | | 480,000 | | | | 104,625,600 | |
China Mengniu Dairy | | | 8,120,000 | | | | 12,923,216 | |
China Mobile ADR | | | 869,300 | | | | 49,958,671 | |
China Petroleum & Chemical | | | 38,000,000 | | | | 23,279,659 | |
30
| | | | | | | | |
| | | Number of shares | | | Value (U.S. $) | |
| |
Common StockD (continued) | | | | | | | | |
| |
China/Hong Kong (continued) | | | | | | | | |
China Telecom | | | 19,906,000 | | | $ | 9,755,892 | |
Fosun International | | | 2,886,500 | | | | 5,152,370 | |
Guangshen Railway | | | 11,000,000 | | | | 5,532,949 | |
Hollysys Automation Technologies | | | 253,641 | | | | 5,222,468 | |
JD.com ADR † | | | 458,300 | | | | 14,060,644 | |
Kunlun Energy | | | 15,000,000 | | | | 13,135,918 | |
Qunar Cayman Islands ADR † | | | 236,682 | | | | 10,657,790 | |
SINA † | | | 1,600,000 | | | | 80,912,000 | |
Sinofert Holdings | | | 14,000,000 | | | | 2,166,749 | |
Sinotrans | | | 15,326,332 | | | | 8,895,086 | |
Sohu.com @† | | | 1,550,000 | | | | 77,887,500 | |
Tencent Holdings | | | 2,000,000 | | | | 39,801,123 | |
Tianjin Development Holdings @ | | | 15,559,550 | | | | 10,134,161 | |
TravelSky Technology | | | 572,000 | | | | 978,226 | |
Uni-President China Holdings @ | | | 29,777,000 | | | | 24,578,780 | |
Vipshop Holdings ADR † | | | 640,000 | | | | 10,579,200 | |
Weibo ADR † | | | 200,000 | | | | 3,720,000 | |
Youku Tudou ADR † | | | 1,500,000 | | | | 40,305,000 | |
| | | | | | | | |
| | | | | | | 561,662,042 | |
| | | | | | | | |
Cyprus – 0.44% | | | | | | | | |
QIWI ADR | | | 385,284 | | | | 7,355,072 | |
| | | | | | | | |
| | | | | | | 7,355,072 | |
| | | | | | | | |
France – 0.06% | | | | | | | | |
Vallourec | | | 99,235 | | | | 1,020,578 | |
| | | | | | | | |
| | | | | | | 1,020,578 | |
| | | | | | | | |
India – 10.91% | | | | | | | | |
ICICI Bank | | | 5,500,000 | | | | 22,731,751 | |
Indiabulls Real Estate GDR † | | | 102,021 | | | | 98,144 | |
Rattanindia Infrastructure GDR =† | | | 300,961 | | | | 15,619 | |
Reliance Capital | | | 2,150,000 | | | | 14,159,461 | |
Reliance Communications † | | | 10,114,849 | | | | 11,533,500 | |
Reliance Industries | | | 5,500,000 | | | | 79,910,690 | |
Reliance Industries GDR 144A # | | | 1,451,526 | | | | 41,441,067 | |
Tata Chemicals @ | | | 2,198,589 | | | | 13,852,721 | |
| | | | | | | | |
| | | | | | | 183,742,953 | |
| | | | | | | | |
Malaysia – 0.85% | | | | | | | | |
Hong Leong Bank @ | | | 3,059,889 | | | | 9,741,072 | |
UEM Sunrise | | | 17,000,000 | | | | 4,509,919 | |
| | | | | | | | |
| | | | | | | 14,250,991 | |
| | | | | | | | |
Mexico – 4.65% | | | | | | | | |
Empresas ICA † | | | 4,500,000 | | | | 1,438,654 | |
31
Schedules of investments
Delaware Emerging Markets Fund
| | | | | | | | |
| | | Number of shares | | | Value (U.S. $) | |
| |
Common StockD (continued) | | | | | | | | |
| |
Mexico (continued) | | | | | | | | |
Fomento Economico Mexicano ADR | | | 146,122 | | | $ | 14,083,238 | |
Grupo Financiero Santander Mexico Class B ADR | | | 2,500,000 | | | | 24,225,000 | |
Grupo Lala | | | 3,120,000 | | | | 7,488,527 | |
Grupo Televisa ADR | | | 1,100,000 | | | | 31,020,000 | |
| | | | | | | | |
| | | | | | | 78,255,419 | |
| | | | | | | | |
Peru – 0.34% | | | | | | | | |
Cia de Minas Buenaventura ADR | | | 1,200,000 | | | | 5,688,000 | |
| | | | | | | | |
| | | | | | | 5,688,000 | |
| | | | | | | | |
Poland – 0.32% | | | | | | | | |
Jastrzebska Spolka Weglowa † | | | 254,155 | | | | 791,367 | |
Orange Polska | | | 2,800,000 | | | | 4,681,209 | |
| | | | | | | | |
| | | | | | | 5,472,576 | |
| | | | | | | | |
Republic of Korea – 14.65% | | | | | | | | |
Daum Communications | | | 60,000 | | | | 6,238,039 | |
KB Financial Group ADR | | | 540,000 | | | | 16,318,800 | |
KCC | | | 70,000 | | | | 27,728,926 | |
LG Uplus | | | 1,840,040 | | | | 16,893,762 | |
Lotte Chilsung Beverage @ | | | 13,000 | | | | 25,081,467 | |
Lotte Confectionery | | | 8,000 | | | | 13,517,474 | |
Samsung Electronics | | | 80,000 | | | | 88,553,251 | |
SK Telecom ADR | | | 2,351,046 | | | | 52,381,305 | |
| | | | | | | | |
| | | | | | | 246,713,024 | |
| | | | | | | | |
Russia – 8.48% | | | | | | | | |
Chelyabinsk Zinc Plant GDR @† | | | 143,300 | | | | 939,461 | |
Enel OGK-5 GDR | | | 21,161 | | | | 11,550 | |
Etalon Group GDR 144A #@= | | | 1,616,300 | | | | 3,151,785 | |
Gazprom ADR | | | 4,000,000 | | | | 16,524,000 | |
MegaFon GDR | | | 450,000 | | | | 6,817,500 | |
Mobile TeleSystems ADR | | | 1,200,000 | | | | 8,460,000 | |
Rosneft GDR | | | 7,730,000 | | | | 31,074,600 | |
Sberbank of Russia @= | | | 12,000,000 | | | | 18,614,252 | |
Sberbank of Russia ADR | | | 1,400,000 | | | | 9,381,400 | |
Surgutneftegas ADR | | | 500,000 | | | | 2,500,000 | |
Volga Territorial Generating † | | | 36,096 | | | | 296 | |
X5 Retail Group GDR † | | | 526,952 | | | | 11,909,115 | |
Yandex Class A † | | | 2,010,000 | | | | 33,426,300 | |
| | | | | | | | |
| | | | | | | 142,810,259 | |
| | | | | | | | |
South Africa – 0.44% | | | | | | | | |
Sun International | | | 290,543 | | | | 1,813,545 | |
Tongaat Hulett @ | | | 838,307 | | | | 5,687,781 | |
| | | | | | | | |
| | | | | | | 7,501,326 | |
| | | | | | | | |
32
| | | | | | | | |
| | | Number of shares | | | Value (U.S. $) | |
| |
Common StockD (continued) | | | | | | | | |
| |
Taiwan – 4.85% | | | | | | | | |
Hon Hai Precision Industry | | | 8,400,000 | | | $ | 21,615,991 | |
MediaTek | | | 3,800,000 | | | | 30,325,496 | |
Taiwan Semiconductor Manufacturing | | | 7,000,000 | | | | 29,807,766 | |
| | | | | | | | |
| | | | | | | 81,749,253 | |
| | | | | | | | |
Thailand – 0.65% | | | | | | | | |
Bangkok Bank-Foreign | | | 2,300,000 | | | | 10,982,966 | |
| | | | | | | | |
| | | | | | | 10,982,966 | |
| | | | | | | | |
Turkey – 3.05% | | | | | | | | |
Akbank | | | 10,000,000 | | | | 23,786,233 | |
Turk Telekomunikasyon | | | 951,192 | | | | 1,958,898 | |
Turkcell Iletisim Hizmetleri ADR | | | 2,000,000 | | | | 19,040,000 | |
Turkiye Sise ve Cam Fabrikalari | | | 6,461,222 | | | | 6,542,280 | |
| | | | | | | | |
| | | | | | | 51,327,411 | |
| | | | | | | | |
United Kingdom – 0.07% | �� | | | | | | | |
Griffin Mining @† | | | 3,056,187 | | | | 1,258,293 | |
| | | | | | | | |
| | | | | | | 1,258,293 | |
| | | | | | | | |
United States – 1.00% | | | | | | | | |
Yahoo † | | | 500,000 | | | | 16,905,000 | |
| | | | | | | | |
| | | | | | | 16,905,000 | |
| | | | | | | | |
| | |
Total Common Stock (cost $2,115,754,260) | | | | | | | 1,677,072,302 | |
| | | | | | | | |
|
| |
Preferred Stock – 3.75%D | | | | | | | | |
| |
Brazil – 1.44% | | | | | | | | |
Braskem Class A 2.39% | | | 1,049,994 | | | | 7,117,039 | |
Petroleo Brasileiro Class A ADR † | | | 4,000,000 | | | | 15,480,000 | |
Usinas Siderurgicas de Minas Gerais SA 1.87% | | | 3,000,000 | | | | 1,706,176 | |
| | | | | | | | |
| | | | | | | 24,303,215 | |
| | | | | | | | |
Republic of Korea – 1.33% | | | | | | | | |
Samsung Electronics 1.94% | | | 23,662 | | | | 22,356,896 | |
| | | | | | | | |
| | | | | | | 22,356,896 | |
| | | | | | | | |
Russia – 0.98% | | | | | | | | |
AK Transneft 0.39% = | | | 7,239 | | | | 16,478,000 | |
| | | | | | | | |
| | | | | | | 16,478,000 | |
| | | | | | | | |
Total Preferred Stock (cost $58,959,955) | | | | | | | 63,138,111 | |
| | | | | | | | |
33
Schedules of investments
Delaware Emerging Markets Fund
| | | | | | | | |
| | | Number of shares | | | Value (U.S. $) | |
| |
Exchange-Traded Fund – 0.68% | | | | | | | | |
| |
iShares MSCI Turkey | | | 300,500 | | | $ | 11,512,155 | |
| | | | | | | | |
Total Exchange-Traded Fund (cost $13,682,561) | | | | | | | 11,512,155 | |
| | | | | | | | |
|
| |
Participation Notes – 0.00% | | | | | | | | |
| |
Lehman Indian Oil | | | | | | | | |
CW 12 LEPO 144A #@=† | | | 172,132 | | | | 0 | |
Lehman Oil & Natural Gas | | | | | | | | |
CW 12 LEPO =† | | | 254,590 | | | | 0 | |
| | | | | | | | |
Total Participation Notes (cost $8,559,056) | | | | | | | 0 | |
| | | | | | | | |
|
| |
Rights – 0.02% | | | | | | | | |
| |
Hong Leong Bank
exercise price MYR 10.40
expiration date 12/14/15 † | | | 489,582 | | | | 304,588 | |
| | | | | | | | |
Total Rights (cost $0) | | | | | | | 304,588 | |
| | | | | | | | |
| | |
Total Value of Securities – 104.02%
(cost $2,196,955,832) | | | | | | $ | 1,752,027,156 | |
| | | | | | | | |
| # | Security exempt from registration under Rule 144A of the Securities Act of 1933, as amended. At Nov. 30, 2015, the aggregate value of Rule 144A securities was $55,249,994, which represents 3.28% of the Fund’s net assets. See Note 11 in “Notes to financial statements.” |
| @ | Illiquid security. At Nov. 30, 2015, the aggregate value of illiquid securities was $268,484,129, which represents 15.94% of the Fund’s net assets. See Note 11 in “Notes to financial statements.” |
| = | Security is being fair valued in accordance with the Fund’s fair valuation policy. At Nov. 30, 2015, the aggregate value of fair valued securities was $47,825,783, which represents 2.84% of the Fund’s net assets. See Note 1 in “Notes to financial statements.” |
| † | Non-income-producing security. |
| D | Securities have been classified by country of origin. Aggregate classification by business sectors has been presented on page 25 in “Security type / country and sector allocations.” |
Summary of abbreviations:
ADR – American Depositary Receipt
GDR – Global Depositary Receipt
LEPO – Low Exercise Price Option
MYR – Malaysian Ringgit
See accompanying notes, which are an integral part of the financial statements.
34
Schedules of investments
| | |
| Delaware Global Value Fund | | November 30, 2015 |
| | | | | | | | |
| | | Number of shares | | | Value (U.S. $) | |
| |
Common Stock – 98.97%D | | | | | | | | |
| |
Australia – 1.11% | | | | | | | | |
Coca-Cola Amatil | | | 35,779 | | | $ | 233,655 | |
| | | | | | | | |
| | | | | | | 233,655 | |
| | | | | | | | |
Canada – 5.78% | | | | | | | | |
CGI Group Class A † | | | 15,443 | | | | 672,234 | |
Suncor Energy | | | 12,000 | | | | 331,586 | |
WestJet Airlines @ | | | 9,802 | | | | 155,904 | |
Yamana Gold | | | 28,802 | | | | 60,822 | |
| | | | | | | | |
| | | | | | | 1,220,546 | |
| | | | | | | | |
France – 6.63% | | | | | | | | |
AXA | | | 15,455 | | | | 418,185 | |
Sanofi | | | 4,941 | | | | 440,498 | |
TOTAL | | | 4,649 | | | | 230,859 | |
Vinci * | | | 4,774 | | | | 310,507 | |
| | | | | | | | |
| | | | | | | 1,400,049 | |
| | | | | | | | |
Germany – 2.10% | | | | | | | | |
STADA Arzneimittel | | | 11,603 | | | | 443,046 | |
| | | | | | | | |
| | | | | | | 443,046 | |
| | | | | | | | |
Indonesia – 1.31% | | | | | | | | |
Bank Rakyat Indonesia Persero | | | 354,131 | | | | 275,805 | |
| | | | | | | | |
| | | | | | | 275,805 | |
| | | | | | | | |
Israel – 3.40% | | | | | | | | |
Teva Pharmaceutical Industries ADR | | | 11,400 | | | | 717,402 | |
| | | | | | | | |
| | | | | | | 717,402 | |
| | | | | | | | |
Italy – 2.05% | | | | | | | | |
Saipem *† | | | 14,067 | | | | 121,575 | |
UniCredit | | | 52,927 | | | | 310,636 | |
| | | | | | | | |
| | | | | | | 432,211 | |
| | | | | | | | |
Japan – 13.63% | | | | | | | | |
East Japan Railway | | | 4,400 | | | | 415,354 | |
ITOCHU | | | 23,953 | | | | 292,273 | |
Japan Tobacco | | | 14,300 | | | | 512,312 | |
Mitsubishi UFJ Financial Group | | | 31,854 | | | | 204,433 | |
Nippon Telegraph & Telephone | | | 11,536 | | | | 427,815 | |
Nitori Holdings | | | 5,114 | | | | 421,268 | |
Sumitomo Rubber Industries | | | 23,600 | | | | 318,642 | |
Toyota Motor | | | 4,550 | | | | 283,028 | |
| | | | | | | | |
| | | | | | | 2,875,125 | |
| | | | | | | | |
Netherlands – 3.23% | | | | | | | | |
ING Groep CVA | | | 33,052 | | | | 453,799 | |
Koninklijke Philips | | | 8,318 | | | | 227,443 | |
| | | | | | | | |
| | | | | | | 681,242 | |
| | | | | | | | |
35
| | |
| Schedules of investments | | |
| Delaware Global Value Fund | | |
| | | | | | | | |
| | | Number of shares | | | Value (U.S. $) | |
| |
Common StockD (continued) | | | | | | | | |
| |
Russia – 0.73% | | | | | | | | |
Mobile TeleSystems ADR | | | 21,800 | | | $ | 153,690 | |
| | | | | | | | |
| | | | | | | 153,690 | |
| | | | | | | | |
Sweden – 2.08% | | | | | | | | |
Tele2 Class B | | | 43,083 | | | | 438,655 | |
| | | | | | | | |
| | | | | | | 438,655 | |
| | | | | | | | |
Switzerland – 2.66% | | | | | | | | |
Aryzta *† | | | 11,953 | | | | 561,326 | |
| | | | | | | | |
| | | | | | | 561,326 | |
| | | | | | | | |
United Kingdom – 6.40% | | | | | | | | |
Meggitt | | | 42,872 | | | | 250,353 | |
Playtech | | | 29,819 | | | | 363,125 | |
Rio Tinto | | | 5,129 | | | | 170,613 | |
Standard Chartered | | | 29,812 | | | | 250,198 | |
Tesco | | | 125,542 | | | | 316,161 | |
| | | | | | | | |
| | | | | | | 1,350,450 | |
| | | | | | | | |
United States – 47.86% | | | | | | | | |
American Airlines Group | | | 11,700 | | | | 482,742 | |
Apple | | | 6,400 | | | | 757,120 | |
AT&T | | | 9,400 | | | | 316,498 | |
Caterpillar * | | | 5,300 | | | | 385,045 | |
Cintas | | | 5,000 | | | | 457,950 | |
Delphi Automotive | | | 5,200 | | | | 456,976 | |
Goldman Sachs Group | | | 3,000 | | | | 570,060 | |
Halliburton | | | 10,200 | | | | 406,470 | |
International Business Machines | | | 1,600 | | | | 223,072 | |
Johnson & Johnson | | | 4,100 | | | | 415,084 | |
JPMorgan Chase | | | 8,400 | | | | 560,112 | |
Lowe’s | | | 4,600 | | | | 352,360 | |
Mylan † | | | 6,300 | | | | 323,190 | |
NASDAQ OMX Group | | | 12,600 | | | | 738,612 | |
Omnicom Group | | | 4,700 | | | | 347,424 | |
Oracle | | | 13,200 | | | | 514,404 | |
Pfizer | | | 12,600 | | | | 412,902 | |
Target | | | 5,900 | | | | 427,750 | |
Travelers | | | 4,300 | | | | 492,651 | |
Viacom Class B | | | 5,300 | | | | 263,887 | |
Wells Fargo | | | 10,000 | | | | 551,000 | |
WESCO International *† | | | 5,700 | | | | 273,885 | |
Western Union * | | | 19,600 | | | | 369,656 | |
| | | | | | | | |
| | | | | | | 10,098,850 | |
| | | | | | | | |
| | |
Total Common Stock (cost $19,400,646) | | | | | | | 20,882,052 | |
| | | | | | | | |
36
| | | | | | | | |
| | | Number of shares | | | Value (U.S. $) | |
| |
Rights – 0.05% | | | | | | | | |
| |
Standard Chartered
exercise price GBP 4.65
expiration date 12/10/15 † | | | 8,517 | | | $ | 11,674 | |
| | | | | | | | |
Total Rights (cost $0) | | | | | | | 11,674 | |
| | | | | | | | |
| | |
| | | Principal amount° | | | | |
| |
Short-Term Investments – 1.04% | | | | | | | | |
| |
Discount Notes – 0.49%≠ | | | | | | | | |
Federal Home Loan Bank | | | | | | | | |
0.12% 1/4/16 | | | 16,319 | | | | 16,317 | |
0.12% 1/25/16 | | | 12,193 | | | | 12,191 | |
0.14% 2/18/16 | | | 27,843 | | | | 27,831 | |
0.155% 2/3/16 | | | 10,775 | | | | 10,772 | |
0.169% 1/21/16 | | | 6,235 | | | | 6,235 | |
0.174% 12/2/15 | | | 1,843 | | | | 1,843 | |
0.18% 3/7/16 | | | 8,545 | | | | 8,540 | |
0.186% 1/19/16 | | | 1,301 | | | | 1,301 | |
0.19% 3/22/16 | | | 18,011 | | | | 17,998 | |
0.295% 3/2/16 | | | 630 | | | | 629 | |
| | | | | | | | |
| | | | | | | 103,657 | |
| | | | | | | | |
Repurchase Agreements – 0.55% | | | | | | | | |
Bank of America Merrill Lynch
0.07%, dated 11/30/15, to be repurchased on 12/1/15, repurchase price $22,446 (collateralized by U.S. government obligations 1.50%–3.375% 5/31/19–5/15/44; market value $22,894) | | | 22,446 | | | | 22,446 | |
Bank of Montreal
0.09%, dated 11/30/15, to be repurchased on 12/1/15, repurchase price $37,409 (collateralized by U.S. government obligations 0.125%–4.625% 4/15/16–2/15/40; market value $38,157) | | | 37,409 | | | | 37,409 | |
BNP Paribas
0.11%, dated 11/30/15, to be repurchased on 12/1/15, repurchase price $55,145 (collateralized by U.S. government obligations 0.00%–3.125% 9/15/17–8/15/44; market value $56,248) | | | 55,145 | | | | 55,145 | |
| | | | | | | | |
| | | | | | | 115,000 | |
| | | | | | | | |
Total Short-Term Investments (cost $218,662) | | | | | | | 218,657 | |
| | | | | | | | |
| |
Total Value of Securities Before Securities Lending Collateral – 100.06%
(cost $19,619,308) | | | | 21,112,383 | |
| | | | | | | | |
37
Schedules of investments
Delaware Global Value Fund
| | | | | | | | |
| | | Number of shares | | | Value (U.S. $) | |
| |
Securities Lending Collateral – 3.74%** | | | | | | | | |
| |
Investment Company | | | | | | | | |
Delaware Investments® Collateral Fund No. 1 | | | 788,505 | | | $ | 788,505 | |
| | | | | | | | |
Total Securities Lending Collateral (cost $788,505) | | | | | | | 788,505 | |
| | | | | | | | |
| | |
Total Value of Securities – 103.80%
(cost $20,407,813) | | | | | | $ | 21,900,888n | |
| | | | | | | | |
| * | Fully or partially on loan. |
| ** | See Note 10 in “Notes to financial statements” for additional information on securities lending collateral and non-cash collateral. |
| @ | Illiquid security. At Nov. 30, 2015, the aggregate value of illiquid securities was $155,904, which represents 0.74% of the Fund’s net assets. See Note 11 in “Notes to financial statements.” |
| ≠ | The rate shown is the effective yield at the time of purchase. |
| n | Includes $1,705,023 of securities loaned. |
| ° | Principal amount shown is stated in U.S. dollars unless noted that the security is denominated in another currency. |
| † | Non-income-producing security. |
| D | Securities have been classified by country of origin. Aggregate classification by business sectors has been presented on page 27 in “Security type / country and sector allocations.” |
Summary of abbreviations:
ADR – American Depositary Receipt
CVA – Dutch Certificate
GBP – British Pound Sterling
See accompanying notes, which are an integral part of the financial statements.
38
Schedules of investments
| | |
| Delaware International Value Equity Fund | | November 30, 2015 |
| | | | | | | | |
| | | Number of shares | | | Value (U.S. $) | |
| |
Common Stock – 98.43%D | | | | | | | | |
| |
Australia – 1.19% | | | | | | | | |
Coca-Cola Amatil | | | 467,318 | | | $ | 3,051,818 | |
| | | | | | | | |
| | | | | | | 3,051,818 | |
| | | | | | | | |
Canada – 6.09% | | | | | | | | |
Alamos Gold | | | 232,095 | | | | 705,636 | |
CGI Group Class A † | | | 196,873 | | | | 8,569,887 | |
Suncor Energy | | | 139,000 | | | | 3,840,872 | |
WestJet Airlines @ | | | 114,590 | | | | 1,822,594 | |
Yamana Gold | | | 308,072 | | | | 650,564 | |
| | | | | | | | |
| | | | | | | 15,589,553 | |
| | | | | | | | |
China/Hong Kong – 6.09% | | | | | | | | |
CNOOC | | | 3,118,000 | | | | 3,450,347 | |
Techtronic Industries | | | 1,160,000 | | | | 4,705,200 | |
Yue Yuen Industrial Holdings | | | 2,049,500 | | | | 7,440,905 | |
| | | | | | | | |
| | | | | | | 15,596,452 | |
| | | | | | | | |
Denmark – 1.97% | | | | | | | | |
Carlsberg Class B | | | 59,175 | | | | 5,032,372 | |
| | | | | | | | |
| | | | | | | 5,032,372 | |
| | | | | | | | |
France – 17.01% | | | | | | | | |
AXA | | | 380,751 | | | | 10,302,454 | |
Kering * | | | 19,044 | | | | 3,290,779 | |
Publicis Groupe * | | | 33,399 | | | | 2,107,382 | |
Rexel * | | | 155,617 | | | | 2,131,668 | |
Sanofi * | | | 88,601 | | | | 7,898,928 | |
Teleperformance * | | | 84,445 | | | | 7,019,858 | |
TOTAL | | | 80,526 | | | | 3,998,748 | |
Vinci | | | 104,750 | | | | 6,813,067 | |
| | | | | | | | |
| | | | | | | 43,562,884 | |
| | | | | | | | |
Germany – 5.60% | | | | | | | | |
Bayerische Motoren Werke | | | 28,720 | | | | 3,134,547 | |
Deutsche Post | | | 196,934 | | | | 5,756,273 | |
STADA Arzneimittel | | | 142,777 | | | | 5,451,756 | |
| | | | | | | | |
| | | | | | | 14,342,576 | |
| | | | | | | | |
Indonesia – 1.45% | | | | | | | | |
Bank Rakyat Indonesia Persero | | | 4,765,600 | | | | 3,711,553 | |
| | | | | | | | |
| | | | | | | 3,711,553 | |
| | | | | | | | |
Israel – 4.37% | | | | | | | | |
Teva Pharmaceutical Industries ADR | | | 178,000 | | | | 11,201,540 | |
| | | | | | | | |
| | | | | | | 11,201,540 | |
| | | | | | | | |
Italy – 2.32% | | | | | | | | |
Saipem *† | | | 216,262 | | | | 1,869,061 | |
39
Schedules of investments
Delaware International Value Equity Fund
| | | | | | | | |
| | | Number of shares | | | Value (U.S. $) | |
| |
Common StockD (continued) | | | | | | | | |
| |
Italy (continued) | | | | | | | | |
UniCredit | | | 691,919 | | | $ | 4,060,966 | |
| | | | | | | | |
| | | | | | | 5,930,027 | |
| | | | | | | | |
Japan – 23.53% | | | | | | | | |
East Japan Railway | | | 77,144 | | | | 7,282,288 | |
ITOCHU | | | 594,660 | | | | 7,256,016 | |
Japan Tobacco | | | 171,400 | | | | 6,140,574 | |
Mitsubishi UFJ Financial Group | | | 1,542,357 | | | | 9,898,550 | |
Nippon Telegraph & Telephone | | | 256,756 | | | | 9,521,842 | |
Nitori Holdings | | | 90,794 | | | | 7,479,192 | |
Sumitomo Rubber Industries * | | | 290,800 | | | | 3,926,314 | |
Toyota Motor | | | 140,700 | | | | 8,752,101 | |
| | | | | | | | |
| | | | | | | 60,256,877 | |
| | | | | | | | |
Netherlands – 4.32% | | | | | | | | |
ING Groep CVA | | | 410,359 | | | | 5,634,174 | |
Koninklijke Philips * | | | 198,843 | | | | 5,437,066 | |
| | | | | | | | |
| | | | | | | 11,071,240 | |
| | | | | | | | |
Norway – 0.15% | | | | | | | | |
Subsea 7 † | | | 48,782 | | | | 388,159 | |
| | | | | | | | |
| | | | | | | 388,159 | |
| | | | | | | | |
Republic of Korea – 1.95% | | | | | | | | |
Samsung Electronics | | | 4,518 | | | | 5,001,045 | |
| | | | | | | | |
| | | | | | | 5,001,045 | |
| | | | | | | | |
Russia – 0.84% | | | | | | | | |
Mobile TeleSystems ADR | | | 305,700 | | | | 2,155,185 | |
| | | | | | | | |
| | | | | | | 2,155,185 | |
| | | | | | | | |
Sweden – 5.18% | | | | | | | | |
Nordea Bank | | | 718,713 | | | | 7,964,549 | |
Tele2 Class B | | | 521,140 | | | | 5,306,048 | |
| | | | | | | | |
| | | | | | | 13,270,597 | |
| | | | | | | | |
Switzerland – 5.95% | | | | | | | | |
Aryzta *† | | | 146,123 | | | | 6,862,095 | |
Novartis | | | 98,063 | | | | 8,380,354 | |
| | | | | | | | |
| | | | | | | 15,242,449 | |
| | | | | | | | |
United Kingdom – 10.42% | | | | | | | | |
Meggitt | | | 503,045 | | | | 2,937,550 | |
National Grid | | | 232,457 | | | | 3,241,473 | |
Playtech | | | 357,230 | | | | 4,350,214 | |
Rexam | | | 603,451 | | | | 5,267,179 | |
Rio Tinto | | | 92,494 | | | | 3,076,760 | |
40
| | | | | | | | |
| | | Number of shares | | | Value (U.S. $) | |
| |
Common StockD (continued) | | | | | | | | |
| |
United Kingdom (continued) | | | | | | | | |
Standard Chartered | | | 479,963 | | | $ | 4,028,112 | |
Tesco | | | 1,503,239 | | | | 3,785,707 | |
| | | | | | | | |
| | | | | | | 26,686,995 | |
| | | | | | | | |
| | |
Total Common Stock (cost $248,564,125) | | | | | | | 252,091,322 | |
| | | | | | | | |
|
| |
Rights – 0.07% | | | | | | | | |
| |
Standard Chartered
exercise price GBP 4.65
expiration date 12/10/15 † | | | 137,132 | | | | 187,959 | |
| | | | | | | | |
Total Rights (cost $0) | | | | | | | 187,959 | |
| | | | | | | | |
| | |
| | | Principal amount° | | | | |
| |
Short-Term Investments – 1.39% | | | | | | | | |
| |
Discount Notes – 0.82%≠ | | | | | | | | |
Federal Home Loan Bank | | | | | | | | |
0.12% 1/4/16 | | | 273,843 | | | | 273,816 | |
0.12% 1/25/16 | | | 136,134 | | | | 136,112 | |
0.14% 2/18/16 | | | 230,053 | | | | 229,957 | |
0.155% 2/3/16 | | | 180,818 | | | | 180,756 | |
0.17% 1/21/16 | | | 77,201 | | | | 77,189 | |
0.18% 2/26/16 | | | 110,307 | | | | 110,257 | |
0.18% 3/7/16 | | | 143,392 | | | | 143,307 | |
0.185% 1/19/16 | | | 258,508 | | | | 258,471 | |
0.19% 3/22/16 | | | 185,063 | | | | 184,937 | |
0.194% 12/2/15 | | | 366,135 | | | | 366,134 | |
0.295% 3/2/16 | | | 125,118 | | | | 125,048 | |
| | | | | | | | |
| | | | | | | 2,085,984 | |
| | | | | | | | |
Repurchase Agreements – 0.57% | | | | | | | | |
Bank of America Merrill Lynch
0.07%, dated 11/30/15, to be repurchased on 12/1/15, repurchase price $284,376 (collateralized by U.S. government obligations 1.50%–3.375% 5/31/19–5/15/44; market value $290,063) | | | 284,375 | | | | 284,375 | |
Bank of Montreal
0.09%, dated 11/30/15, to be repurchased on 12/1/15, repurchase price $473,960 (collateralized by U.S. government obligations 0.125%–4.625% 4/15/16–2/15/40; market value $483,438) | | | 473,959 | | | | 473,959 | |
41
Schedules of investments
Delaware International Value Equity Fund
| | | | | | | | |
| | | Principal amount° | | | Value (U.S. $) | |
| |
Short-Term Investments (continued) | | | | | | | | |
| |
Repurchase Agreements (continued) | | | | | | | | |
BNP Paribas
0.11%, dated 11/30/15, to be repurchased on 12/1/15, repurchase price $698,668 (collateralized by U.S. government obligations 0.00%–3.125% 9/15/17–8/15/44; market value $712,640) | | | 698,666 | | | $ | 698,666 | |
| | | | | | | | |
| | | | | | | 1,457,000 | |
| | | | | | | | |
Total Short-Term Investments (cost $3,542,989) | | | | | | | 3,542,984 | |
| | | | | | | | |
| | |
Total Value of Securities Before Securities Lending Collateral – 99.89%
(cost $252,107,114) | | | | | | | 255,822,265 | |
| | | | | | | | |
| | |
| | | Number of shares | | | | |
| |
Securities Lending Collateral – 2.23%** | | | | | | | | |
| |
Investment Company | | | | | | | | |
Delaware Investments® Collateral Fund No. 1 | | | 5,706,403 | | | | 5,706,403 | |
| | | | | | | | |
Total Securities Lending Collateral (cost $5,706,403) | | | | | | | 5,706,403 | |
| | | | | | | | |
| | |
Total Value of Securities – 102.12%
(cost $257,813,517) | | | | | | $ | 261,528,668n | |
| | | | | | | | |
| * | Fully or partially on loan. |
| ** | See Note 10 in “Notes to financial statements” for additional information on securities lending collateral and non-cash collateral. |
| @ | Illiquid security. At Nov. 30, 2015, the aggregate value of illiquid securities was $1,822,594, which represents 0.71% of the Fund’s net assets. See Note 11 in “Notes to financial statements.” |
| ≠ | The rate shown is the effective yield at the time of purchase. |
| n | Includes $5,664,904 of securities loaned. |
| ° | Principal amount shown is stated in U.S. dollars unless noted that the security is denominated in another currency. |
| † | Non-income-producing security. |
| D | Securities have been classified by country of origin. Aggregate classification by business sectors has been presented on page 29 in “Security type / country and sector allocations.” |
Summary of abbreviations:
ADR – American Depositary Receipt
CVA – Dutch Certificate
GBP – British Pound Sterling
See accompanying notes, which are an integral part of the financial statement.
42
This page intentionally left blank.
Statements of assets and liabilities
November 30, 2015
| | | | | | | | | | | | | | | | |
| | | Delaware
Emerging Markets Fund | | | | | Delaware
Global Value Fund | | | | | Delaware
International
Value Equity
Fund | |
Assets: | | | | | | | | | | | | | | | | |
Investments, at value1, 2 | | $ | 1,752,027,156 | | | | | $ | 20,893,726 | | | | | $ | 252,279,281 | |
Short-term investments, at value3 | | | — | | | | | | 218,657 | | | | | | 3,542,984 | |
Short-term investments held as collateral for loaned securities, at value4 | | | — | | | | | | 788,505 | | | | | | 5,706,403 | |
Foreign currencies, at value5 | | | 784,219 | | | | | | — | | | | | | 8 | |
Cash | | | — | | | | | | 1,225 | | | | | | 1,183 | |
Receivable for fund shares sold | | | 3,485,264 | | | | | | 8,234 | | | | | | 222,576 | |
Dividends and interest receivable | | | 909,777 | | | | | | 49,089 | | | | | | 746,954 | |
Securities lending income receivable | | | — | | | | | | 691 | | | | | | 8,848 | |
| | | | | | | | | | | | | | | | |
Total assets | | | 1,757,206,416 | | | | | | 21,960,127 | | | | | | 262,508,237 | |
| | | | | | | | | | | | | | | | |
Liabilities: | | | | | | | | | | | | | | | | |
Cash overdraft | | | 52,692,431 | | | | | | — | | | | | | — | |
Payable for securities purchased | | | 9,703,087 | | | | | | — | | | | | | — | |
Payable for fund shares redeemed | | | 6,194,008 | | | | | | 5,347 | | | | | | 300,784 | |
Obligation to return securities lending collateral | | | — | | | | | | 788,505 | | | | | | 5,706,403 | |
Investment management fees payable | | | 1,689,089 | | | | | | 7,115 | | | | | | 179,062 | |
Other accrued expenses | | | 948,854 | | | | | | 52,232 | | | | | | 167,959 | |
Distribution fees payable | | | 179,235 | | | | | | 6,748 | | | | | | 36,325 | |
Other affiliates payable | | | 158,597 | | | | | | 1,117 | | | | | | 11,972 | |
Trustees’ fees and expenses payable | | | 10,074 | | | | | | 125 | | | | | | 1,507 | |
Deferred capital gain tax | | | 1,339,412 | | | | | | — | | | | | | — | |
| | | | | | | | | | | | | | | | |
Total liabilities | | | 72,914,787 | | | | | | 861,189 | | | | | | 6,404,012 | |
| | | | | | | | | | | | | | | | |
Total Net Assets | | $ | 1,684,291,629 | | | | | $ | 21,098,938 | | | | | $ | 256,104,225 | |
| | | | | | | | | | | | | | | | |
| | | | | |
Net Assets Consist of: | | | | | | | | | | | | | | | | |
Paid-in capital | | $ | 2,219,880,109 | | | | | $ | 40,967,064 | | | | | $ | 428,526,102 | |
Undistributed (distributions in excess of) net investment income | | | (26,113,770 | ) | | | | | 123,950 | | | | | | 3,382,083 | |
Accumulated net realized loss on investments | | | (63,195,026 | ) | | | | | (21,484,116 | ) | | | | | (179,479,197 | ) |
Net unrealized appreciation (depreciation) of investments | | | (446,268,088 | ) | | | | | 1,493,075 | | | | | | 3,715,151 | |
Net unrealized appreciation (depreciation) of foreign currencies | | | (11,596 | ) | | | | | (1,035 | ) | | | | | (39,914 | ) |
| | | | | | | | | | | | | | | | |
Total Net Assets | | $ | 1,684,291,629 | | | | | $ | 21,098,938 | | | | | $ | 256,104,225 | |
| | | | | | | | | | | | | | | | |
44
| | | | | | | | | | | | |
| | | Delaware
Emerging Markets Fund | | | Delaware
Global Value Fund | | | Delaware
International
Value Equity
Fund | |
Net Asset Value | | | | | | | | | | | | |
Class A: | | | | | | | | | | | | |
Net assets | | $ | 274,075,299 | | | $ | 14,456,720 | | | $ | 66,784,864 | |
Shares of beneficial interest outstanding, unlimited authorization, no par | | | 21,408,965 | | | | 1,295,747 | | | | 5,154,070 | |
Net asset value per share | | $ | 12.80 | | | $ | 11.16 | | | $ | 12.96 | |
Sales charge | | | 5.75 | % | | | 5.75 | % | | | 5.75 | % |
Offering price per share, equal to net asset value per share /
(1 – sales charge) | | $ | 13.58 | | | $ | 11.84 | | | $ | 13.75 | |
| | | |
Class C: | | | | | | | | | | | | |
Net assets | | $ | 131,723,322 | | | $ | 4,601,465 | | | $ | 26,402,651 | |
Shares of beneficial interest outstanding, unlimited authorization, no par | | | 10,977,721 | | | | 422,055 | | | | 2,077,127 | |
Net asset value per share | | $ | 12.00 | | | $ | 10.90 | | | $ | 12.71 | |
| | | |
Class R: | | | | | | | | | | | | |
Net assets | | $ | 24,299,027 | | | $ | — | | | $ | 1,448,879 | |
Shares of beneficial interest outstanding, unlimited authorization, no par | | | 1,883,348 | | | | — | | | | 112,303 | |
Net asset value per share | | $ | 12.90 | | | $ | — | | | $ | 12.90 | |
| | | |
Institutional Class: | | | | | | | | | | | | |
Net assets | | $ | 1,254,193,981 | | | $ | 2,040,753 | | | $ | 161,467,831 | |
Shares of beneficial interest outstanding, unlimited authorization, no par | | | 97,191,497 | | | | 182,071 | | | | 12,398,645 | |
Net asset value per share | | $ | 12.90 | | | $ | 11.21 | | | $ | 13.02 | |
| | | |
1Investments, at cost | | $ | 2,196,955,832 | | | $ | 19,400,646 | | | $ | 248,564,125 | |
2Including securities on loan | | | — | | | | 1,705,023 | | | | 5,664,904 | |
3Short-term investments, at cost | | | — | | | | 218,662 | | | | 3,542,989 | |
4Short-term investments held as collateral for loaned securities, at cost | | | — | | | | 788,505 | | | | 5,706,403 | |
5Foreign currencies, at cost | | | 795,815 | | | | — | | | | 8 | |
See accompanying notes, which are an integral part of the financial statements.
45
| | |
| Statements of operations |
| Delaware International Funds | | Year ended November 30, 2015 |
| | | | | | | | | | | | | | | |
| | | Delaware
Emerging
Markets Fund | | Delaware
Global
Value Fund | | Delaware
International
Value Equity
Fund |
| | | |
Investment Income: | | | | | | | | | | | | | | | |
Dividends | | | $ | 45,167,283 | | | | $ | 582,129 | | | | $ | 7,772,998 | |
Interest | | | | 4,525 | | | | | 213 | | | | | 4,120 | |
Securities lending income | | | | — | | | | | 3,780 | | | | | 42,553 | |
Foreign tax withheld | | | | (5,565,877 | ) | | | | (38,685 | ) | | | | (786,608 | ) |
| | | | | | | | | | | | | | | |
| | | | 39,605,931 | | | | | 547,437 | | | | | 7,033,063 | |
| | | | | | | | | | | | | | | |
Expenses: | | | | | | | | | | | | | | | |
Management fees | | | | 27,847,654 | | | | | 197,633 | | | | | 2,264,111 | |
Distribution expenses — Class A | | | | 834,916 | | | | | 39,714 | | | | | 179,646 | |
Distribution expenses — Class C | | | | 1,620,134 | | | | | 51,028 | | | | | 280,685 | |
Distribution expenses — Class R | | | | 97,635 | | | | | — | | | | | 9,077 | |
Dividend disbursing and transfer agent fees and expenses | | | | 3,893,097 | | | | | 38,852 | | | | | 335,039 | |
Custodian fees | | | | 1,387,850 | | | | | 10,001 | | | | | 64,487 | |
Reports and statements to shareholders | | | | 941,508 | | | | | 29,974 | | | | | 158,207 | |
Accounting and administration expenses | | | | 765,490 | | | | | 7,412 | | | | | 84,940 | |
Legal fees | | | | 206,366 | | | | | 2,003 | | | | | 28,786 | |
Registration fees | | | | 164,735 | | | | | 46,138 | | | | | 61,829 | |
Trustees’ fees and expenses | | | | 113,045 | | | | | 1,091 | | | | | 12,505 | |
Audit and tax | | | | 78,896 | | | | | 37,405 | | | | | 37,535 | |
Other | | | | 87,102 | | | | | 10,950 | | | | | 19,565 | |
| | | | | | | | | | | | | | | |
| | | | 38,038,428 | | | | | 472,201 | | | | | 3,536,412 | |
Less expenses waived | | | | — | | | | | (57,573 | ) | | | | — | |
Less expense paid indirectly | | | | (1,028 | ) | | | | (38 | ) | | | | (159 | ) |
| | | | | | | | | | | | | | | |
Total operating expenses | | | | 38,037,400 | | | | | 414,590 | | | | | 3,536,253 | |
| | | | | | | | | | | | | | | |
Net Investment Income | | | | 1,568,531 | | | | | 132,847 | | | | | 3,496,810 | |
| | | | | | | | | | | | | | | |
46
| | | | | | | | | | | | | | | | |
| | | Delaware
Emerging
Markets Fund | | | | | Delaware
Global Value Fund | | | | | Delaware
International
Value Equity
Fund | |
| | | | | |
Net Realized and Unrealized Gain (Loss): | | | | | | | | | | | | | | | | |
Net realized gain (loss) on: | | | | | | | | | | | | | | | | |
Investments1 | | $ | (45,038,381 | ) | | | | $ | 1,344,247 | | | | | $ | 13,006,626 | |
Foreign currencies | | | (455,082 | ) | | | | | (6,561 | ) | | | | | (257,893 | ) |
Foreign currency exchange contracts | | | (392,462 | ) | | | | | (932 | ) | | | | | 157,650 | |
| | | | | | | | | | | | | | | | |
Net realized gain (loss) | | | (45,885,925 | ) | | | | | 1,336,754 | | | | | | 12,906,383 | |
| | | | | | | | | | | | | | | | |
Net change in unrealized appreciation (depreciation) of: | | | | | | | | | | | | | | | | |
Investments2 | | | (512,200,874 | ) | | | | | (2,481,710 | ) | | | | | (22,253,176 | ) |
Foreign currencies | | | 90,367 | | | | | | 1,858 | | | | | | 4,823 | |
Foreign currency exchange contracts | | | (57,358 | ) | | | | | — | | | | | | — | |
| | | | | | | | | | | | | | | | |
Net change in unrealized appreciation (depreciation) | | | (512,167,865 | ) | | | | | (2,479,852 | ) | | | | | (22,248,353 | ) |
| | | | | | | | | | | | | | | | |
Net Realized and Unrealized Loss | | | (558,053,790 | ) | | | | | (1,143,098 | ) | | | | | (9,341,970 | ) |
| | | | | | | | | | | | | | | | |
Net Decrease in Net Assets Resulting from Operations | | $ | (556,485,259 | ) | | | | $ | (1,010,251 | ) | | | | $ | (5,845,160 | ) |
| | | | | | | | | | | | | | | | |
1Includes $20,490 capital gains taxes refunded for Delaware Emerging Markets Fund.
2Includes $4,442,430 decrease in capital gains taxes accrued for Delaware Emerging Markets Fund.
See accompanying notes, which are an integral part of the financial statements.
47
Statements of changes in net assets
Delaware Emerging Markets Fund
| | | | | | | | |
| | | Year ended | |
| | | 11/30/15 | | | 11/30/14 | |
| | |
Increase (Decrease) in Net Assets from Operations: | | | | | | | | |
Net investment income | | $ | 1,568,531 | | | $ | 4,050,838 | |
Net realized gain (loss) | | | (45,885,925 | ) | | | 67,823,382 | |
Net change in unrealized appreciation (depreciation) | | | (512,167,865 | ) | | | (98,384,034 | ) |
| | | | | | | | |
Net decrease in net assets resulting from operations | | | (556,485,259 | ) | | | (26,509,814 | ) |
| | | | | | | | |
| | |
Dividends and Distributions to Shareholders from: | | | | | | | | |
Net investment income: | | | | | | | | |
Class A | | | (1,603,971 | ) | | | (3,652,148 | ) |
Class B | | | — | | | | (1,305 | ) |
Class C | | | — | | | | (142,676 | ) |
Class R | | | (21,450 | ) | | | (26,825 | ) |
Institutional Class | | | (15,526,139 | ) | | | (18,983,668 | ) |
| | |
Return of capital: | | | | | | | | |
Class A | | | (334,544 | ) | | | — | |
Class C | | | (171,542 | ) | | | — | |
Class R | | | (29,430 | ) | | | — | |
Institutional Class | | | (1,518,749 | ) | | | — | |
| | |
Net realized gain: | | | | | | | | |
Class A | | | (8,253,184 | ) | | | — | |
Class C | | | (4,341,441 | ) | | | — | |
Class R | | | (295,110 | ) | | | — | |
Institutional Class | | | (49,453,826 | ) | | | — | |
| | | | | | | | |
| | | (81,549,386 | ) | | | (22,806,622 | ) |
| | | | | | | | |
48
| | | | | | | | |
| | | Year ended | |
| | | 11/30/15 | | | 11/30/14 | |
| | |
Capital Share Transactions: | | | | | | | | |
Proceeds from shares sold: | | | | | | | | |
Class A | | $ | 88,623,991 | | | $ | 236,965,336 | |
Class B | | | — | | | | 5,365 | |
Class C | | | 23,043,605 | | | | 59,258,608 | |
Class R | | | 18,689,087 | | | | 12,425,595 | |
Institutional Class | | | 661,781,543 | | | | 1,326,279,522 | |
| | |
Net asset value of shares issued upon reinvestment of dividends and distributions: | | | | | | | | |
Class A | | | 9,332,668 | | | | 3,427,396 | |
Class B | | | — | | | | 1,061 | |
Class C | | | 4,336,236 | | | | 135,639 | |
Class R | | | 345,702 | | | | 26,766 | |
Institutional Class | | | 48,825,603 | | | | 11,594,662 | |
| | | | | | | | |
| | | 854,978,435 | | | | 1,650,119,950 | |
| | | | | | | | |
| | |
Cost of shares redeemed: | | | | | | | | |
Class A | | | (165,314,154 | ) | | | (317,613,494 | ) |
Class B | | | — | | | | (2,060,969 | ) |
Class C | | | (53,166,527 | ) | | | (38,048,822 | ) |
Class R | | | (4,930,704 | ) | | | (3,376,234 | ) |
Institutional Class | | | (1,409,738,748 | ) | | | (800,152,351 | ) |
| | | | | | | | |
| | | (1,633,150,133 | ) | | | (1,161,251,870 | ) |
| | | | | | | | |
Increase (decrease) in net assets derived from capital share transactions | | | (778,171,698 | ) | | | 488,868,080 | |
| | | | | | | | |
Net Increase (Decrease) in Net Assets | | | (1,416,206,343 | ) | | | 439,551,644 | |
| | |
Net Assets: | | | | | | | | |
Beginning of year | | | 3,100,497,972 | | | | 2,660,946,328 | |
| | | | | | | | |
End of year | | $ | 1,684,291,629 | | | $ | 3,100,497,972 | |
| | | | | | | | |
Distributions in excess of net investment income | | $ | (26,113,770 | ) | | $ | (25,078,807 | ) |
| | | | | | | | |
See accompanying notes, which are an integral part of the financial statements.
49
Statements of changes in net assets
Delaware Global Value Fund
| | | | | | | | |
| | | Year ended | |
| | | 11/30/15 | | | 11/30/14 | |
| | |
Increase (Decrease) in Net Assets from Operations: | | | | | | | | |
Net investment income | | $ | 132,847 | | | $ | 108,871 | |
Net realized gain | | | 1,336,754 | | | | 3,007,127 | |
Net change in unrealized appreciation (depreciation) | | | (2,479,852 | ) | | | (1,982,194 | ) |
| | | | | | | | |
Net increase (decrease) in net assets resulting from operations | | | (1,010,251 | ) | | | 1,133,804 | |
| | | | | | | | |
| | |
Dividends and Distributions to Shareholders from: | | | | | | | | |
Net investment income: | | | | | | | | |
Class A | | | (75,087 | ) | | | (106,910 | ) |
Institutional Class | | | (15,983 | ) | | | (17,636 | ) |
| | | | | | | | |
| | | (91,070 | ) | | | (124,546 | ) |
| | | | | | | | |
| | |
Capital Share Transactions: | | | | | | | | |
Proceeds from shares sold: | | | | | | | | |
Class A | | | 1,205,345 | | | | 2,248,966 | |
Class B | | | — | | | | 345 | |
Class C | | | 825,664 | | | | 487,839 | |
Institutional Class | | | 289,535 | | | | 573,978 | |
| | |
Net asset value of shares issued upon reinvestment of dividends and distributions: | | | | | | | | |
Class A | | | 70,874 | | | | 101,819 | |
Institutional Class | | | 13,960 | | | | 16,383 | |
| | | | | | | | |
| | | 2,405,378 | | | | 3,429,330 | |
| | | | | | | | |
50
| | | | | | | | |
| | | Year ended | |
| | | 11/30/15 | | | 11/30/14 | |
| | |
Capital Share Transactions (continued): | | | | | | | | |
Cost of shares redeemed: | | | | | | | | |
Class A | | $ | (3,025,305 | ) | | $ | (3,013,577 | ) |
Class B | | | — | | | | (1,229,702 | ) |
Class C | | | (1,355,317 | ) | | | (1,220,397 | ) |
Institutional Class | | | (483,191 | ) | | | (452,307 | ) |
| | | | | | | | |
| | | (4,863,813 | ) | | | (5,915,983 | ) |
| | | | | | | | |
Decrease in net assets derived from capital share transactions | | | (2,458,435 | ) | | | (2,486,653 | ) |
| | | | | | | | |
Net Decrease in Net Assets | | | (3,559,756 | ) | | | (1,477,395 | ) |
| | |
Net Assets: | | | | | | | | |
Beginning of year | | | 24,658,694 | | | | 26,136,089 | |
| | | | | | | | |
End of year | | $ | 21,098,938 | | | $ | 24,658,694 | |
| | | | | | | | |
Undistributed net investment income | | $ | 123,950 | | | $ | 89,666 | |
| | | | | | | | |
See accompanying notes, which are an integral part of the financial statements.
51
Statements of changes in net assets
Delaware International Value Equity Fund
| | | | | | | | |
| | | Year ended | |
| | | 11/30/15 | | | 11/30/14 | |
| | |
Increase (Decrease) in Net Assets from Operations: | | | | | | | | |
Net investment income | | $ | 3,496,810 | | | $ | 6,099,593 | |
Net realized gain | | | 12,906,383 | | | | 12,122,621 | |
Net change in unrealized appreciation (depreciation) | | | (22,248,353 | ) | | | (29,089,888 | ) |
| | | | | | | | |
Net decrease in net assets resulting from operations | | | (5,845,160 | ) | | | (10,867,674 | ) |
| | | | | | | | |
| | |
Dividends and Distributions to Shareholders from: | | | | | | | | |
Net investment income: | | | | | | | | |
Class A | | | (1,451,343 | ) | | | (1,058,838 | ) |
Class B | | | — | | | | (6,962 | ) |
Class C | | | (350,383 | ) | | | (120,167 | ) |
Class R | | | (39,553 | ) | | | (23,230 | ) |
Institutional Class | | | (3,998,532 | ) | | | (2,208,546 | ) |
| | | | | | | | |
| | | (5,839,811 | ) | | | (3,417,743 | ) |
| | | | | | | | |
| | |
Capital Share Transactions: | | | | | | | | |
Proceeds from shares sold: | | | | | | | | |
Class A | | | 9,250,945 | | | | 14,927,742 | |
Class B | | | — | | | | 1,215 | |
Class C | | | 4,251,688 | | | | 2,398,591 | |
Class R | | | 501,786 | | | | 322,591 | |
Institutional Class | | | 43,438,290 | | | | 72,579,330 | |
| | |
Net asset value of shares issued upon reinvestment of dividends and distributions: | | | | | | | | |
Class A | | | 1,411,159 | | | | 1,033,504 | |
Class B | | | — | | | | 6,879 | |
Class C | | | 337,636 | | | | 116,294 | |
Class R | | | 39,553 | | | | 23,229 | |
Institutional Class | | | 3,967,791 | | | | 2,190,119 | |
| | | | | | | | |
| | | 63,198,848 | | | | 93,599,494 | |
| | | | | | | | |
52
| | | | | | | | |
| | | Year ended | |
| | | 11/30/15 | | | 11/30/14 | |
| | |
Capital Share Transactions (continued): | | | | | | | | |
Cost of shares redeemed: | | | | | | | | |
Class A | | $ | (14,968,607 | ) | | $ | (42,480,531 | ) |
Class B | | | — | | | | (1,991,338 | ) |
Class C | | | (5,615,616 | ) | | | (5,900,316 | ) |
Class R | | | (1,328,545 | ) | | | (819,860 | ) |
Institutional Class | | | (60,368,997 | ) | | | (62,606,876 | ) |
| | | | | | | | |
| | | (82,281,765 | ) | | | (113,798,921 | ) |
| | | | | | | | |
Decrease in net assets derived from capital share transactions | | | (19,082,917 | ) | | | (20,199,427 | ) |
| | | | | | | | |
Net Decrease in Net Assets | | | (30,767,888 | ) | | | (34,484,844 | ) |
| | |
Net Assets: | | | | | | | | |
Beginning of year | | | 286,872,113 | | | | 321,356,957 | |
| | | | | | | | |
End of year | | $ | 256,104,225 | | | $ | 286,872,113 | |
| | | | | | | | |
Undistributed net investment income | | $ | 3,382,083 | | | $ | 5,825,327 | |
| | | | | | | | |
See accompanying notes, which are an integral part of the financial statements.
53
Financial highlights
Delaware Emerging Markets Fund Class A
Selected data for each share of the Fund outstanding throughout each period were as follows:
|
Net asset value, beginning of period |
|
Income (loss) from investment operations: |
Net investment income (loss)1 |
Net realized and unrealized gain (loss) |
Total from investment operations |
|
Less dividends and distributions from: |
Net investment income |
Return of capital |
Net realized gain |
Total dividends and distributions |
|
Net asset value, end of period |
|
Total return2 |
|
Ratios and supplemental data: |
Net assets, end of period (000 omitted) |
Ratio of expenses to average net assets |
Ratio of expenses to average net assets prior to fees waived |
Ratio of net investment income (loss) to average net assets |
Ratio of net investment income (loss) to average net assets prior to fees waived |
Portfolio turnover |
| 1 | The average shares outstanding method has been applied for per share information. |
| 2 | Total investment return is based on the change in net asset value of a share during the period and assumes reinvestment of dividends and distributions at net asset value and does not reflect the impact of a sales charge. Total investment return during some of the periods shown reflects a waiver by the distributor. Performance would have been lower had the waiver not been in effect. |
See accompanying notes, which are an integral part of the financial statements.
54
| | | | | | | | | | | | | | | | | | | | |
| | | Year ended | |
| | | | |
| | | 11/30/15 | | | 11/30/14 | | | 11/30/13 | | | 11/30/12 | | | 11/30/11 | |
| |
| | $ | 16.080 | | | $ | 16.230 | | | $ | 13.500 | | | $ | 13.050 | | | $ | 14.860 | |
| | | | | |
| | | | | | | | | | | | | | | | | | | | |
| | | (0.010 | ) | | | 0.008 | | | | 0.023 | | | | 0.077 | | | | 0.094 | |
| | | (2.857 | ) | | | (0.041 | ) | | | 2.816 | | | | 0.642 | | | | (1.819 | ) |
| | | | | | | | | | | | | | | | | | | | |
| | | (2.867 | ) | | | (0.033 | ) | | | 2.839 | | | | 0.719 | | | | (1.725 | ) |
| | | | | | | | | | | | | | | | | | | | |
| | | | | |
| | | | | | | | | | | | | | | | | | | | |
| | | (0.065 | ) | | | (0.117 | ) | | | (0.109 | ) | | | (0.130 | ) | | | (0.085 | ) |
| | | (0.016 | ) | | | — | | | | — | | | | — | | | | — | |
| | | (0.332 | ) | | | — | | | | — | | | | (0.139 | ) | | | — | |
| | | | | | | | | | | | | | | | | | | | |
| | | (0.413 | ) | | | (0.117 | ) | | | (0.109 | ) | | | (0.269 | ) | | | (0.085 | ) |
| | | | | | | | | | | | | | | | | | | | |
| | | | | |
| | $ | 12.800 | | | $ | 16.080 | | | $ | 16.230 | | | $ | 13.500 | | | $ | 13.050 | |
| | | | | | | | | | | | | | | | | | | | |
| | | | | |
| | | (18.15% | ) | | | (0.20% | ) | | | 21.16% | | | | 5.67% | | | | (11.70% | ) |
| | | | | |
| | | | | | | | | | | | | | | | | | | | |
| | $ | 274,075 | | | $ | 423,620 | | | $ | 498,686 | | | $ | 470,670 | | | $ | 542,207 | |
| | | 1.75% | | | | 1.69% | | | | 1.71% | | | | 1.70% | | | | 1.78% | |
| | | 1.75% | | | | 1.69% | | | | 1.75% | | | | 1.75% | | | | 1.83% | |
| | | (0.08% | ) | | | 0.01% | | | | 0.16% | | | | 0.59% | | | | 0.63% | |
| | | (0.08% | ) | | | 0.01% | | | | 0.12% | | | | 0.54% | | | | 0.58% | |
| | | 12% | | | | 26% | | | | 24% | | | | 15% | | | | 19% | |
55
Financial highlights
Delaware Emerging Markets Fund Class C
Selected data for each share of the Fund outstanding throughout each period were as follows:
|
Net asset value, beginning of period |
|
Income (loss) from investment operations: |
Net investment loss1 |
Net realized and unrealized gain (loss) |
Total from investment operations |
|
Less dividends and distributions from: |
Net investment income |
Return of capital |
Net realized gain |
Total dividends and distributions |
|
Net asset value, end of period |
|
Total return2 |
|
Ratios and supplemental data: |
Net assets, end of period (000 omitted) |
Ratio of expenses to average net assets |
Ratio of net investment income (loss) to average net assets |
Portfolio turnover |
| 1 | The average shares outstanding method has been applied for per share information. |
| 2 | Total investment return is based on the change in net asset value of a share during the period and assumes reinvestment of dividends and distributions at net asset value and does not reflect the impact of a sales charge. |
See accompanying notes, which are an integral part of the financial statements.
56
| | | | | | | | | | | | | | | | | | | | |
| | | Year ended | |
| | | | |
| | | 11/30/15 | | | 11/30/14 | | | 11/30/13 | | | 11/30/12 | | | 11/30/11 | |
| |
| | $ | 15.140 | | | $ | 15.300 | | | $ | 12.740 | | | $ | 12.320 | | | $ | 14.050 | |
| | | | | |
| | | | | | | | | | | | | | | | | | | | |
| | | (0.108 | ) | | | (0.116 | ) | | | (0.083 | ) | | | (0.020 | ) | | | (0.017 | ) |
| | | (2.684 | ) | | | (0.032 | ) | | | 2.660 | | | | 0.605 | | | | (1.713 | ) |
| | | | | | | | | | | | | | | | | | | | |
| | | (2.792 | ) | | | (0.148 | ) | | | 2.577 | | | | 0.585 | | | | (1.730 | ) |
| | | | | | | | | | | | | | | | | | | | |
| | | | | |
| | | | | | | | | | | | | | | | | | | | |
| | | — | | | | (0.012 | ) | | | (0.017 | ) | | | (0.026 | ) | | | — | |
| | | (0.016 | ) | | | — | | | | — | | | | — | | | | — | |
| | | (0.332 | ) | | | — | | | | — | | | | (0.139 | ) | | | — | |
| | | | | | | | | | | | | | | | | | | | |
| | | (0.348 | ) | | | (0.012 | ) | | | (0.017 | ) | | | (0.165 | ) | | | — | |
| | | | | | | | | | | | | | | | | | | | |
| | | | | |
| | $ | 12.000 | | | $ | 15.140 | | | $ | 15.300 | | | $ | 12.740 | | | $ | 12.320 | |
| | | | | | | | | | | | | | | | | | | | |
| | | | | |
| | | (18.74% | ) | | | (0.97% | ) | | | 20.25% | | | | 4.85% | | | | (12.31% | ) |
| | | | | |
| | | | | | | | | | | | | | | | | | | | |
| | $ | 131,724 | | | $ | 198,428 | | | $ | 180,168 | | | $ | 155,040 | | | $ | 194,124 | |
| | | 2.50% | | | | 2.44% | | | | 2.46% | | | | 2.45% | | | | 2.53% | |
| | | (0.83% | ) | | | (0.74% | ) | | | (0.59% | ) | | | (0.16% | ) | | | (0.12% | ) |
| | | 12% | | | | 26% | | | | 24% | | | | 15% | | | | 19% | |
57
Financial highlights
Delaware Emerging Markets Fund Class R
Selected data for each share of the Fund outstanding throughout each period were as follows:
|
Net asset value, beginning of period |
|
Income (loss) from investment operations: |
Net investment income (loss)1 |
Net realized and unrealized gain (loss) |
Total from investment operations |
|
Less dividends and distributions from: |
Net investment income |
Return of capital |
Net realized gain |
Total dividends and distributions |
|
Net asset value, end of period |
|
Total return2 |
|
Ratios and supplemental data: |
Net assets, end of period (000 omitted) |
Ratio of expenses to average net assets |
Ratio of expenses to average net assets prior to fees waived |
Ratio of net investment income (loss) to average net assets |
Ratio of net investment income (loss) to average net assets prior to fees waived |
Portfolio turnover |
| 1 | The average shares outstanding method has been applied for per share information. |
| 2 | Total investment return is based on the change in net asset value of a share during the period and assumes reinvestment of dividends and distributions at net asset value. Total investment return during some of the periods shown reflects a waiver by the distributor. Performance would have been lower had the waiver not been in effect. |
See accompanying notes, which are an integral part of the financial statements.
58
| | | | | | | | | | | | | | | | | | | | |
| | | Year ended | |
| | | | |
| | | 11/30/15 | | | 11/30/14 | | | 11/30/13 | | | 11/30/12 | | | 11/30/11 | |
| |
| | $ | 16.200 | | | $ | 16.350 | | | $ | 13.600 | | | $ | 13.140 | | | $ | 14.960 | |
| | | | | |
| | | | | | | | | | | | | | | | | | | | |
| | | (0.045 | ) | | | (0.055 | ) | | | (0.014 | ) | | | 0.044 | | | | 0.056 | |
| | | (2.884 | ) | | | (0.018 | ) | | | 2.839 | | | | 0.649 | | | | (1.833 | ) |
| | | | | | | | | | | | | | | | | | | | |
| | | (2.929 | ) | | | (0.073 | ) | | | 2.825 | | | | 0.693 | | | | (1.777 | ) |
| | | | | | | | | | | | | | | | | | | | |
| | | | | |
| | | | | | | | | | | | | | | | | | | | |
| | | (0.023 | ) | | | (0.077 | ) | | | (0.075 | ) | | | (0.094 | ) | | | (0.043 | ) |
| | | (0.016 | ) | | | — | | | | — | | | | — | | | | — | |
| | | (0.332 | ) | | | — | | | | — | | | | (0.139 | ) | | | — | |
| | | | | | | | | | | | | | | | | | | | |
| | | (0.371 | ) | | | (0.077 | ) | | | (0.075 | ) | | | (0.233 | ) | | | (0.043 | ) |
| | | | | | | | | | | | | | | | | | | | |
| | | | | |
| | $ | 12.900 | | | $ | 16.200 | | | $ | 16.350 | | | $ | 13.600 | | | $ | 13.140 | |
| | | | | | | | | | | | | | | | | | | | |
| | | | | |
| | | (18.37% | ) | | | (0.44% | ) | | | 20.86% | | | | 5.41% | | | | (11.93% | ) |
| | | | | |
| | | | | | | | | | | | | | | | | | | | |
| | $ | 24,299 | | | $ | 14,173 | | | $ | 5,282 | | | $ | 2,691 | | | $ | 1,500 | |
| | | 2.00% | | | | 1.94% | | | | 1.96% | | | | 1.95% | | | | 2.03% | |
| | | 2.00% | | | | 1.94% | | | | 2.04% | | | | 2.05% | | | | 2.13% | |
| | | (0.33% | ) | | | (0.24% | ) | | | (0.09% | ) | | | 0.34% | | | | 0.38% | |
| | | (0.33% | ) | | | (0.24% | ) | | | (0.17% | ) | | | 0.24% | | | | 0.28% | |
| | | 12% | | | | 26% | | | | 24% | | | | 15% | | | | 19% | |
59
Financial highlights
Delaware Emerging Markets Fund Institutional Class
Selected data for each share of the Fund outstanding throughout each period were as follows:
|
Net asset value, beginning of period |
|
Income (loss) from investment operations: |
Net investment income1 |
Net realized and unrealized gain (loss) |
Total from investment operations |
|
Less dividends and distributions from: |
Net investment income |
Return of capital |
Net realized gain |
Total dividends and distributions |
|
Net asset value, end of period |
|
Total return2 |
|
Ratios and supplemental data: |
Net assets, end of period (000 omitted) |
Ratio of expenses to average net assets |
Ratio of net investment income to average net assets |
Portfolio turnover |
| 1 | The average shares outstanding method has been applied for per share information. |
| 2 | Total investment return is based on the change in net asset value of a share during the period and assumes reinvestment of dividends and distributions at net asset value. |
See accompanying notes, which are an integral part of the financial statements.
60
| | | | | | | | | | | | | | | | | | | | |
| | | Year ended | |
| | | | |
| | | 11/30/15 | | | 11/30/14 | | | 11/30/13 | | | 11/30/12 | | | 11/30/11 | |
| |
| | $ | 16.210 | | | $ | 16.360 | | | $ | 13.600 | | | $ | 13.160 | | | $ | 14.970 | |
| | | | | |
| | | | | | | | | | | | | | | | | | | | |
| | | 0.024 | | | | 0.039 | | | | 0.061 | | | | 0.111 | | | | 0.131 | |
| | | (2.880 | ) | | | (0.035 | ) | | | 2.841 | | | | 0.635 | | | | (1.821 | ) |
| | | | | | | | | | | | | | | | | | | | |
| | | (2.856 | ) | | | 0.004 | | | | 2.902 | | | | 0.746 | | | | (1.690 | ) |
| | | | | | | | | | | | | | | | | | | | |
| | | | | |
| | | | | | | | | | | | | | | | | | | | |
| | | (0.106 | ) | | | (0.154 | ) | | | (0.142 | ) | | | (0.167 | ) | | | (0.120 | ) |
| | | (0.016 | ) | | | — | | | | — | | | | — | | | | — | |
| | | (0.332 | ) | | | — | | | | — | | | | (0.139 | ) | | | — | |
| | | | | | | | | | | | | | | | | | | | |
| | | (0.454 | ) | | | (0.154 | ) | | | (0.142 | ) | | | (0.306 | ) | | | (0.120 | ) |
| | | | | | | | | | | | | | | | | | | | |
| | | | | |
| | $ | 12.900 | | | $ | 16.210 | | | $ | 16.360 | | | $ | 13.600 | | | $ | 13.160 | |
| | | | | | | | | | | | | | | | | | | | |
| | | | | |
| | | (17.96% | ) | | | 0.04% | | | | 21.50% | | | | 5.86% | | | | (11.42% | ) |
| | | | | |
| | | | | | | | | | | | | | | | | | | | |
| | $ | 1,254,194 | | | $ | 2,464,277 | | | $ | 1,974,807 | | | $ | 1,217,065 | | | $ | 1,672,668 | |
| | | 1.50% | | | | 1.44% | | | | 1.46% | | | | 1.45% | | | | 1.53% | |
| | | 0.17% | | | | 0.26% | | | | 0.41% | | | | 0.84% | | | | 0.88% | |
| | | 12% | | | | 26% | | | | 24% | | | | 15% | | | | 19% | |
61
Financial highlights
Delaware Global Value Fund Class A
Selected data for each share of the Fund outstanding throughout each period were as follows:
|
Net asset value, beginning of period |
|
Income (loss) from investment operations: |
Net investment income1 |
Net realized and unrealized gain (loss) |
Total from investment operations |
|
Less dividends and distributions from: |
Net investment income |
Total dividends and distributions |
|
Net asset value, end of period |
|
Total return2 |
|
Ratios and supplemental data: |
Net assets, end of period (000 omitted) |
Ratio of expenses to average net assets |
Ratio of expenses to average net assets prior to fees waived |
Ratio of net investment income to average net assets |
Ratio of net investment income to average net assets prior to fees waived |
Portfolio turnover |
| 1 | The average shares outstanding method has been applied for per share information. |
| 2 | Total investment return is based on the change in net asset value of a share during the period and assumes reinvestment of dividends and distributions at net asset value and does not reflect the impact of a sales charge. Total investment return during all of the periods shown reflects waivers by the manager and/or distributor. Performance would have been lower had the waivers not been in effect. |
See accompanying notes, which are an integral part of the financial statements.
62
| | | | | | | | | | | | | | | | | | | | |
| | | Year ended | |
| | | | |
| | | 11/30/15 | | | 11/30/14 | | | 11/30/13 | | | 11/30/12 | | | 11/30/11 | |
| |
| | $ | 11.710 | | | $ | 11.270 | | | $ | 9.010 | | | $ | 8.310 | | | $ | 8.300 | |
| | | | | |
| | | | | | | | | | | | | | | | | | | | |
| | | 0.082 | | | | 0.067 | | | | 0.075 | | | | 0.093 | | | | 0.101 | |
| | | (0.580 | ) | | | 0.444 | | | | 2.286 | | | | 0.699 | | | | (0.053 | ) |
| | | | | | | | | | | | | | | | | | | | |
| | | (0.498 | ) | | | 0.511 | | | | 2.361 | | | | 0.792 | | | | 0.048 | |
| | | | | | | | | | | | | | | | | | | | |
| | | | | |
| | | | | | | | | | | | | | | | | | | | |
| | | (0.052 | ) | | | (0.071 | ) | | | (0.101 | ) | | | (0.092 | ) | | | (0.038 | ) |
| | | | | | | | | | | | | | | | | | | | |
| | | (0.052 | ) | | | (0.071 | ) | | | (0.101 | ) | | | (0.092 | ) | | | (0.038 | ) |
| | | | | | | | | | | | | | | | | | | | |
| | | | | |
| | $ | 11.160 | | | $ | 11.710 | | | $ | 11.270 | | | $ | 9.010 | | | $ | 8.310 | |
| | | | | | | | | | | | | | | | | | | | |
| | | | | |
| | | (4.27% | ) | | | 4.57% | | | | 26.46% | | | | 9.65% | | | | 0.55% | |
| | | | | |
| | | | | | | | | | | | | | | | | | | | |
| | $ | 14,457 | | | $ | 16,950 | | | $ | 16,951 | | | $ | 16,479 | | | $ | 17,989 | |
| | | 1.64% | | | | 1.55% | | | | 1.55% | | | | 1.55% | | | | 1.55% | |
| | | 1.89% | | | | 1.80% | | | | 1.82% | | | | 1.81% | | | | 1.88% | |
| | | 0.71% | | | | 0.58% | | | | 0.75% | | | | 1.08% | | | | 1.12% | |
| | | 0.46% | | | | 0.32% | | | | 0.48% | | | | 0.82% | | | | 0.79% | |
| | | 14% | | | | 43% | | | | 27% | | | | 69% | | | | 40% | |
63
Financial highlights
Delaware Global Value Fund Class C
Selected data for each share of the Fund outstanding throughout each period were as follows:
|
Net asset value, beginning of period |
|
Income (loss) from investment operations: |
Net investment income (loss)1 |
Net realized and unrealized gain (loss) |
Total from investment operations |
|
Less dividends and distributions from: |
Net investment income |
Total dividends and distributions |
|
Net asset value, end of period |
|
Total return2 |
|
Ratios and supplemental data: |
Net assets, end of period (000 omitted) |
Ratio of expenses to average net assets |
Ratio of expenses to average net assets prior to fees waived |
Ratio of net investment income (loss) to average net assets |
Ratio of net investment income (loss) to average net assets prior to fees waived |
Portfolio turnover |
| 1 | The average shares outstanding method has been applied for per share information. |
| 2 | Total investment return is based on the change in net asset value of a share during the period and assumes reinvestment of dividends and distributions at net asset value and does not reflect the impact of a sales charge. Total investment return during all of the periods shown reflects a waiver by the manager. Performance would have been lower had the waiver not been in effect. |
| 3 | Amount is less than (0.01%). |
See accompanying notes, which are an integral part of the financial statements.
64
| | | | | | | | | | | | | | | | | | | | |
| | | Year ended | |
| | | | |
| | | 11/30/15 | | | 11/30/14 | | | 11/30/13 | | | 11/30/12 | | | 11/30/11 | |
| |
| | $ | 11.480 | | | $ | 11.060 | | | $ | 8.850 | | | $ | 8.150 | | | $ | 8.170 | |
| | | | | |
| | | | | | | | | | | | | | | | | | | | |
| | | (0.004 | ) | | | (0.020 | ) | | | (0.001 | ) | | | 0.028 | | | | 0.033 | |
| | | (0.576 | ) | | | 0.440 | | | | 2.248 | | | | 0.698 | | | | (0.053 | ) |
| | | | | | | | | | | | | | | | | | | | |
| | | (0.580 | ) | | | 0.420 | | | | 2.247 | | | | 0.726 | | | | (0.020 | ) |
| | | | | | | | | | | | | | | | | | | | |
| | | | | |
| | | | | | | | | | | | | | | | | | | | |
| | | — | | | | — | | | | (0.037 | ) | | | (0.026 | ) | | | — | |
| | | | | | | | | | | | | | | | | | | | |
| | | — | | | | — | | | | (0.037 | ) | | | (0.026 | ) | | | — | |
| | | | | | | | | | | | | | | | | | | | |
| | | | | |
| | $ | 10.900 | | | $ | 11.480 | | | $ | 11.060 | | | $ | 8.850 | | | $ | 8.150 | |
| | | | | | | | | | | | | | | | | | | | |
| | | | | |
| | | (5.05% | ) | | | 3.80% | | | | 25.48% | | | | 8.94% | | | | (0.24% | ) |
| | | | | |
| | | | | | | | | | | | | | | | | | | | |
| | $ | 4,601 | | | $ | 5,361 | | | $ | 5,882 | | | $ | 5,878 | | | $ | 6,745 | |
| | | 2.39% | | | | 2.30% | | | | 2.30% | | | | 2.30% | | | | 2.30% | |
| | | 2.64% | | | | 2.55% | | | | 2.53% | | | | 2.51% | | | | 2.58% | |
| | | (0.04% | ) | | | (0.17% | ) | | | 0.00% | 3 | | | 0.33% | | | | 0.37% | |
| | | (0.29% | ) | | | (0.43% | ) | | | (0.23% | ) | | | 0.12% | | | | 0.09% | |
| | | 14% | | | | 43% | | | | 27% | | | | 69% | | | | 40% | |
|
| |
65
Financial highlights
Delaware Global Value Fund Institutional Class
Selected data for each share of the Fund outstanding throughout each period were as follows:
|
Net asset value, beginning of period |
|
Income (loss) from investment operations: |
Net investment income1 |
Net realized and unrealized gain (loss) |
Total from investment operations |
|
Less dividends and distributions from: |
Net investment income |
Total dividends and distributions |
|
Net asset value, end of period |
|
Total return2 |
|
Ratios and supplemental data: |
Net assets, end of period (000 omitted) |
Ratio of expenses to average net assets |
Ratio of expenses to average net assets prior to fees waived |
Ratio of net investment income to average net assets |
Ratio of net investment income to average net assets prior to fees waived |
Portfolio turnover |
| 1 | The average shares outstanding method has been applied for per share information. |
| 2 | Total investment return is based on the change in net asset value of a share during the period and assumes reinvestment of dividends and distributions at net asset value. Total investment return during all of the periods shown reflects a waiver by the manager. Performance would have been lower had the waiver not been in effect. |
See accompanying notes, which are an integral part of the financial statements.
66
| | | | | | | | | | | | | | | | | | | | |
| | | Year ended | |
| | | | |
| | | 11/30/15 | | | 11/30/14 | | | 11/30/13 | | | 11/30/12 | | | 11/30/11 | |
| |
| | $ | 11.770 | | | $ | 11.320 | | | $ | 9.050 | | | $ | 8.340 | | | $ | 8.340 | |
| | | | | |
| | | | | | | | | | | | | | | | | | | | |
| | | 0.112 | | | | 0.096 | | | | 0.101 | | | | 0.115 | | | | 0.124 | |
| | | (0.591 | ) | | | 0.451 | | | | 2.291 | | | | 0.709 | | | | (0.066 | ) |
| | | | | | | | | | | | | | | | | | | | |
| | | (0.479 | ) | | | 0.547 | | | | 2.392 | | | | 0.824 | | | | 0.058 | |
| | | | | | | | | | | | | | | | | | | | |
| | | | | |
| | | | | | | | | | | | | | | | | | | | |
| | | (0.081 | ) | | | (0.097 | ) | | | (0.122 | ) | | | (0.114 | ) | | | (0.058 | ) |
| | | | | | | | | | | | | | | | | | | | |
| | | (0.081 | ) | | | (0.097 | ) | | | (0.122 | ) | | | (0.114 | ) | | | (0.058 | ) |
| | | | | | | | | | | | | | | | | | | | |
| | | | | |
| | $ | 11.210 | | | $ | 11.770 | | | $ | 11.320 | | | $ | 9.050 | | | $ | 8.340 | |
| | | | | | | | | | | | | | | | | | | | |
| | | | | |
| | | (4.09% | ) | | | 4.88% | | | | 26.75% | | | | 10.03% | | | | 0.65% | |
| | | | | |
| | $ | 2,041 | | | $ | 2,348 | | | $ | 2,112 | | | $ | 1,932 | | | $ | 1,685 | |
| | | 1.39% | | | | 1.30% | | | | 1.30% | | | | 1.30% | | | | 1.30% | |
| | | 1.64% | | | | 1.55% | | | | 1.53% | | | | 1.51% | | | | 1.58% | |
| | | 0.96% | | | | 0.83% | | | | 1.00% | | | | 1.33% | | | | 1.37% | |
| | | 0.71% | | | | 0.57% | | | | 0.77% | | | | 1.12% | | | | 1.09% | |
| | | 14% | | | | 43% | | | | 27% | | | | 69% | | | | 40% | |
|
| |
67
Financial highlights
Delaware International Value Equity Fund Class A
Selected data for each share of the Fund outstanding throughout each period were as follows:
|
Net asset value, beginning of period |
|
Income (loss) from investment operations: |
Net investment income1 |
Net realized and unrealized gain (loss) |
Total from investment operations |
|
Less dividends and distributions from: |
Net investment income |
Total dividends and distributions |
|
Net asset value, end of period |
|
Total return2 |
|
Ratios and supplemental data: |
Net assets, end of period (000 omitted) |
Ratio of expenses to average net assets |
Ratio of expenses to average net assets prior to fees waived |
Ratio of net investment income to average net assets |
Ratio of net investment income to average net assets prior to fees waived |
Portfolio turnover |
| 1 | The average shares outstanding method has been applied for per share information. |
| 2 | Total investment return is based on the change in net asset value of a share during the period and assumes reinvestment of dividends and distributions at net asset value and does not reflect the impact of a sales charge. Total investment return during some of the periods shown reflects waivers by the manager and/or distributor. Performance would have been lower had the waivers not been in effect. |
See accompanying notes, which are an integral part of the financial statements.
68
| | | | | | | | | | | | | | | | | | | | |
| | | Year ended | |
| | | | |
| | | 11/30/15 | | | 11/30/14 | | | 11/30/13 | | | 11/30/12 | | | 11/30/11 | |
| |
| | $ | 13.530 | | | $ | 14.260 | | | $ | 11.590 | | | $ | 10.710 | | | $ | 11.570 | |
| | | | | |
| | | | | | | | | | | | | | | | | | | | |
| | | 0.166 | | | | 0.272 | | | | 0.169 | | | | 0.164 | | | | 0.211 | |
| | | (0.469 | ) | | | (0.857 | ) | | | 2.654 | | | | 0.909 | | | | (0.966 | ) |
| | | | | | | | | | | | | | | | | | | | |
| | | (0.303 | ) | | | (0.585 | ) | | | 2.823 | | | | 1.073 | | | | (0.755 | ) |
| | | | | | | | | | | | | | | | | | | | |
| | | | | |
| | | | | | | | | | | | | | | | | | | | |
| | | (0.267 | ) | | | (0.145 | ) | | | (0.153 | ) | | | (0.193 | ) | | | (0.105 | ) |
| | | | | | | | | | | | | | | | | | | | |
| | | (0.267 | ) | | | (0.145 | ) | | | (0.153 | ) | | | (0.193 | ) | | | (0.105 | ) |
| | | | | | | | | | | | | | | | | | | | |
| | | | | |
| | $ | 12.960 | | | $ | 13.530 | | | $ | 14.260 | | | $ | 11.590 | | | $ | 10.710 | |
| | | | | | | | | | | | | | | | | | | | |
| | | | | |
| | | (2.23% | ) | | | (4.13% | ) | | | 24.64% | | | | 10.25% | | | | (6.64% | ) |
| | | | | |
| | $ | 66,785 | | | $ | 74,118 | | | $ | 104,289 | | | $ | 93,440 | | | $ | 103,418 | |
| | | 1.40% | | | | 1.42% | | | | 1.45% | | | | 1.47% | | | | 1.59% | |
| | | 1.40% | | | | 1.42% | | | | 1.51% | | | | 1.50% | | | | 1.59% | |
| | | 1.24% | | | | 1.85% | | | | 1.31% | | | | 1.49% | | | | 1.70% | |
| | | 1.24% | | | | 1.85% | | | | 1.25% | | | | 1.46% | | | | 1.70% | |
| | | 13% | | | | 26% | | | | 30% | | | | 34% | | | | 42% | |
|
| |
69
Financial highlights
Delaware International Value Equity Fund Class C
Selected data for each share of the Fund outstanding throughout each period were as follows:
|
Net asset value, beginning of period |
|
Income (loss) from investment operations: |
Net investment income1 |
Net realized and unrealized gain (loss) |
Total from investment operations |
|
Less dividends and distributions from: |
Net investment income |
Total dividends and distributions |
|
Net asset value, end of period |
|
Total return2 |
|
Ratios and supplemental data: |
Net assets, end of period (000 omitted) |
Ratio of expenses to average net assets |
Ratio of expenses to average net assets prior to fees waived |
Ratio of net investment income to average net assets |
Ratio of net investment income to average net assets prior to fees waived |
Portfolio turnover |
| 1 | The average shares outstanding method has been applied for per share information. |
| 2 | Total investment return is based on the change in net asset value of a share during the period and assumes reinvestment of dividends and distributions at net asset value and does not reflect the impact of a sales charge. Total investment return during some of the periods shown reflects a waiver by the manager. Performance would have been lower had the waiver not been in effect. |
See accompanying notes, which are an integral part of the financial statements.
70
| | | | | | | | | | | | | | | | | | | | | | |
| | | | Year ended | |
| | | | | | |
| | | | 11/30/15 | | | 11/30/14 | | | 11/30/13 | | | 11/30/12 | | | 11/30/11 | |
| | |
| | | | $ | 13.270 | | | $ | 13.990 | | | $ | 11.380 | | | $ | 10.510 | | | $ | 11.370 | |
| | | | | |
| | | | | | | | | | | | | | | | | | | | | | |
| | | | | 0.064 | | | | 0.158 | | | | 0.071 | | | | 0.083 | | | | 0.122 | |
| | | | | (0.461 | ) | | | (0.828 | ) | | | 2.612 | | | | 0.896 | | | | (0.954 | ) |
| | | | | | | | | | | | | | | | | | | | | | |
| | | | | (0.397 | ) | | | (0.670 | ) | | | 2.683 | | | | 0.979 | | | | (0.832 | ) |
| | | | | | | | | | | | | | | | | | | | | | |
| | | | | |
| | | | | | | | | | | | | | | | | | | | | | | |
| | | | | (0.163 | ) | | | (0.050 | ) | | | (0.073 | ) | | | (0.109 | ) | | | (0.028 | ) |
| | | | | | | | | | | | | | | | | | | | | | |
| | | | | (0.163 | ) | | | (0.050 | ) | | | (0.073 | ) | | | (0.109 | ) | | | (0.028 | ) |
| | | | | | | | | | | | | | | | | | | | | | |
| | | | | |
| | | | $ | 12.710 | | | $ | 13.270 | | | $ | 13.990 | | | $ | 11.380 | | | $ | 10.510 | |
| | | | | | | | | | | | | | | | | | | | | | |
| | | | | |
| | | | | (2.99% | ) | | | (4.80% | ) | | | 23.60% | | | | 9.53% | | | | (7.35% | ) |
| | | | | |
| | | | | | | | | | | | | | | | | | | | | | |
| | | | $ | 26,402 | | | $ | 28,609 | | | $ | 33,566 | | | $ | 30,510 | | | $ | 33,164 | |
| | | | | 2.15% | | | | 2.17% | | | | 2.20% | | | | 2.20% | | | | 2.29% | |
| | | | | 2.15% | | | | 2.17% | | | | 2.22% | | | | 2.20% | | | | 2.29% | |
| | | | | 0.49% | | | | 1.10% | | | | 0.56% | | | | 0.76% | | | | 1.00% | |
| | | | | 0.49% | | | | 1.10% | | | | 0.54% | | | | 0.76% | | | | 1.00% | |
| | | | | 13% | | | | 26% | | | | 30% | | | | 34% | | | | 42% | |
|
| | |
71
Financial highlights
Delaware International Value Equity Fund Class R
Selected data for each share of the Fund outstanding throughout each period were as follows:
|
Net asset value, beginning of period |
|
Income (loss) from investment operations: |
Net investment income1 |
Net realized and unrealized gain (loss) |
Total from investment operations |
|
Less dividends and distributions from: |
Net investment income |
Total dividends and distributions |
|
Net asset value, end of period |
|
Total return2 |
|
Ratios and supplemental data: |
Net assets, end of period (000 omitted) |
Ratio of expenses to average net assets |
Ratio of expenses to average net assets prior to fees waived |
Ratio of net investment income to average net assets |
Ratio of net investment income to average net assets prior to fees waived |
Portfolio turnover |
| 1 | The average shares outstanding method has been applied for per share information. |
| 2 | Total investment return is based on the change in net asset value of a share during the period and assumes reinvestment of dividends and distributions at net asset value. Total investment return during some of the periods shown reflects waivers by the manager and/or distributor. Performance would have been lower had the waivers not been in effect. |
See accompanying notes, which are an integral part of the financial statements.
72
| | | | | | | | | | | | | | | | | | | | | | |
| | | | Year ended | |
| | | | | | |
| | | | 11/30/15 | | | 11/30/14 | | | 11/30/13 | | | 11/30/12 | | | 11/30/11 | |
| | |
| | | | $ | 13.470 | | | $ | 14.200 | | | $ | 11.540 | | | $ | 10.660 | | | $ | 11.520 | |
| | | | | |
| | | | | | | | | | | | | | | | | | | | | | | |
| | | | | 0.132 | | | | 0.233 | | | | 0.136 | | | | 0.138 | | | | 0.186 | |
| | | | | (0.470 | ) | | | (0.851 | ) | | | 2.651 | | | | 0.911 | | | | (0.965 | ) |
| | | | | | | | | | | | | | | | | | | | | | |
| | | | | (0.338 | ) | | | (0.618 | ) | | | 2.787 | | | | 1.049 | | | | (0.779 | ) |
| | | | | | | | | | | | | | | | | | | | | | |
| | | | | |
| | | | | | | | | | | | | | | | | | | | | | | |
| | | | | (0.232 | ) | | | (0.112 | ) | | | (0.127 | ) | | | (0.169 | ) | | | (0.081 | ) |
| | | | | | | | | | | | | | | | | | | | | | |
| | | | | (0.232 | ) | | | (0.112 | ) | | | (0.127 | ) | | | (0.169 | ) | | | (0.081 | ) |
| | | | | | | | | | | | | | | | | | | | | | |
| | | | | |
| | | | $ | 12.900 | | | $ | 13.470 | | | $ | 14.200 | | | $ | 11.540 | | | $ | 10.660 | |
| | | | | | | | | | | | | | | | | | | | | | |
| | | | | |
| | | | | (2.50% | ) | | | (4.37% | ) | | | 24.28% | | | | 10.13% | | | | (6.85% | ) |
| | | | | |
| | | | | | | | | | | | | | | | | | | | | | | |
| | | | $ | 1,449 | | | $ | 2,317 | | | $ | 2,898 | | | $ | 2,288 | | | $ | 2,321 | |
| | | | | 1.65% | | | | 1.67% | | | | 1.70% | | | | 1.70% | | | | 1.79% | |
| | | | | 1.65% | | | | 1.67% | | | | 1.80% | | | | 1.80% | | | | 1.89% | |
| | | | | 0.99% | | | | 1.60% | | | | 1.06% | | | | 1.26% | | | | 1.50% | |
| | | | | 0.99% | | | | 1.60% | | | | 0.96% | | | | 1.16% | | | | 1.40% | |
| | | | | 13% | | | | 26% | | | | 30% | | | | 34% | | | | 42% | |
73
Financial highlights
Delaware International Value Equity Fund Institutional Class
Selected data for each share of the Fund outstanding throughout each period were as follows:
|
Net asset value, beginning of period |
|
Income (loss) from investment operations: |
Net investment income1 |
Net realized and unrealized gain (loss) |
Total from investment operations |
|
Less dividends and distributions from: |
Net investment income |
Total dividends and distributions |
|
Net asset value, end of period |
|
Total return2 |
|
Ratios and supplemental data: |
Net assets, end of period (000 omitted) |
Ratio of expenses to average net assets |
Ratio of expenses to average net assets prior to fees waived |
Ratio of net investment income to average net assets |
Ratio of net investment income to average net assets prior to fees waived |
Portfolio turnover |
| 1 | The average shares outstanding method has been applied for per share information. |
| 2 | Total investment return is based on the change in net asset value of a share during the period and assumes reinvestment of dividends and distributions at net asset value. Total investment return during some of the periods shown reflects a waiver by the manager. Performance would have been lower had the waiver not been in effect. |
See accompanying notes, which are an integral part of the financial statements.
74
| | | | | | | | | | | | | | | | | | | | | | |
| | | | Year ended | |
| | | | | | |
| | | | 11/30/15 | | | 11/30/14 | | | 11/30/13 | | | 11/30/12 | | | 11/30/11 | |
| | |
| | | | $ | 13.600 | | | $ | 14.330 | | | $ | 11.650 | | | $ | 10.770 | | | $ | 11.630 | |
| | | | | |
| | | | | | | | | | | | | | | | | | | | | | | |
| | | | | 0.200 | | | | 0.300 | | | | 0.203 | | | | 0.194 | | | | 0.250 | |
| | | | | (0.478 | ) | | | (0.852 | ) | | | 2.659 | | | | 0.916 | | | | (0.972 | ) |
| | | | | | | | | | | | | | | | | | | | | | |
| | | | | (0.278 | ) | | | (0.552 | ) | | | 2.862 | | | | 1.110 | | | | (0.722 | ) |
| | | | | | | | | | | | | | | | | | | | | | |
| | | | | |
| | | | | | | | | | | | | | | | | | | | | | | |
| | | | | (0.302 | ) | | | (0.178 | ) | | | (0.182 | ) | | | (0.230 | ) | | | (0.138 | ) |
| | | | | | | | | | | | | | | | | | | | | | |
| | | | | (0.302 | ) | | | (0.178 | ) | | | (0.182 | ) | | | (0.230 | ) | | | (0.138 | ) |
| | | | | | | | | | | | | | | | | | | | | | |
| | | | | |
| | | | $ | 13.020 | | | $ | 13.600 | | | $ | 14.330 | | | $ | 11.650 | | | $ | 10.770 | |
| | | | | | | | | | | | | | | | | | | | | | |
| | | | | |
| | | | | (2.03% | ) | | | (3.88% | ) | | | 24.91% | | | | 10.59% | | | | (6.36% | ) |
| | | | | |
| | | | | | | | | | | | | | | | | | | | | | | |
| | | | $ | 161,468 | | | $ | 181,828 | | | $ | 178,614 | | | $ | 107,817 | | | $ | 90,093 | |
| | | | | 1.15% | | | | 1.17% | | | | 1.20% | | | | 1.20% | | | | 1.29% | |
| | | | | 1.15% | | | | 1.17% | | | | 1.22% | | | | 1.20% | | | | 1.29% | |
| | | | | 1.49% | | | | 2.10% | | | | 1.56% | | | | 1.76% | | | | 2.00% | |
| | | | | 1.49% | | | | 2.10% | | | | 1.54% | | | | 1.76% | | | | 2.00% | |
| | | | | 13% | | | | 26% | | | | 30% | | | | 34% | | | | 42% | |
75
Notes to financial statements
| | |
| Delaware International Funds | | November 30, 2015 |
Delaware Group® Global & International Funds (Trust) is organized as a Delaware statutory trust and offers four series: Delaware Emerging Markets Fund, Delaware Focus Global Growth Fund, Delaware Global Value Fund, and Delaware International Value Equity Fund. These financial statements and the related notes pertain to Delaware Emerging Markets Fund, Delaware Global Value Fund, and Delaware International Value Equity Fund (each, a Fund or collectively, the Funds). The Trust is an open-end investment company. Each Fund is considered diversified under the Investment Company Act of 1940, as amended, and offers Class A, Class C, Class R, and Institutional Class shares. As of Nov. 30, 2015, Delaware Global Value Fund has not commenced operations of its Class R shares. Class A shares are sold with a maximum front-end sales charge of 5.75%. Class A share purchases of $1,000,000 or more will incur a contingent deferred sales charge (CDSC) of 1.00% if redeemed during the first year and 0.50% during the second year, provided that Delaware Distributors, L.P. (DDLP) paid a financial advisor a commission on the purchase of those shares. Effective Sept. 25, 2014, all remaining shares of Class B were converted to Class A shares. Class C shares are sold with a CDSC of 1.00%, if redeemed during the first 12 months. Class R and Institutional Class shares are not subject to a sales charge and are offered for sale exclusively to certain eligible investors.
The investment objective of Delaware Emerging Markets Fund and Delaware Global Value Fund is to seek long-term capital appreciation.
The investment objective of Delaware International Value Equity Fund is to seek long-term growth without undue risk to principal.
1. Significant Accounting Policies
The following accounting policies are in accordance with U.S. generally accepted accounting principles (U.S. GAAP) and are consistently followed by the Funds.
Security Valuation — Equity securities and exchange-traded funds (ETFs), except those traded on the Nasdaq Stock Market LLC (Nasdaq), are valued at the last quoted sales price as of the time of the regular close of the New York Stock Exchange on the valuation date. Equity securities and ETFs traded on the Nasdaq are valued in accordance with the Nasdaq Official Closing Price, which may not be the last sales price. If, on a particular day, an equity security or ETF does not trade, the mean between the bid and ask prices will be used, which approximates fair value. Securities listed on a foreign exchange are normally valued at the last quoted sales price on the valuation date. Open-end investment company securities are valued at net asset value per share, as reported by the underlying investment company. U.S. government and agency securities are valued at the mean between the bid and ask prices, which approximates fair value. Foreign currency exchange contracts and foreign cross currency exchange contracts are valued at the mean between the bid and ask prices, which approximates fair value. Interpolated values are derived when the settlement date of the contract is an interim date for which quotations are not available. Generally, other securities and assets for which market quotations are not readily available are valued at fair value as determined in good faith under the direction of the Trust’s Board of Trustees (Board). In determining whether market quotations are readily available or fair valuation will be used, various factors will be taken into consideration, such as market closures or suspension of trading in a security. The Funds may use fair value pricing more frequently for securities traded primarily in non-U.S. markets because, among other things, most foreign markets close well before the Funds value their securities, generally as of 4:00 p.m. Eastern time. The earlier close of these
76
foreign markets gives rise to the possibility that significant events, including broad market moves, government actions or pronouncements, aftermarket trading, or news events may have occurred in the interim. Whenever such a significant event occurs, the Funds may value foreign securities using fair value prices based on third-party vendor modeling tools (international fair value pricing).
Federal and Foreign Income Taxes — No provision for federal income taxes has been made as each Fund intends to continue to qualify for federal income tax purposes as a regulated investment company under Subchapter M of the Internal Revenue Code of 1986, as amended, and make the requisite distributions to shareholders. Each Fund evaluates tax positions taken or expected to be taken in the course of preparing each Fund’s tax returns to determine whether the tax positions are “more-likely-than-not” of being sustained by the applicable tax authority. Tax positions not deemed to meet the “more-likely-than-not” threshold are recorded as a tax benefit or expense in the current year. Management has analyzed each Fund’s tax positions taken for all open federal income tax years (Nov. 30, 2012–Nov. 30, 2015), and has concluded that no provision for federal income tax is required in any Fund’s financial statements. In regard to foreign taxes only, each Fund has open tax years in certain foreign countries in which it invests that may date back to the inception of each Fund.
Class Accounting — Investment income, common expenses, and realized and unrealized gain (loss) on investments are allocated to the various classes of each Fund on the basis of daily net assets of each class. Distribution expenses relating to a specific class are charged directly to that class.
Repurchase Agreements — Each Fund may purchase certain U.S. government securities subject to the counterparty’s agreement to repurchase them at an agreed upon date and price. The counterparty will be required on a daily basis to maintain the value of the collateral subject to the agreement at not less than the repurchase price (including accrued interest). The agreements are conditioned upon the collateral being deposited under the Federal Reserve book-entry system with each Fund’s custodian or a third-party sub-custodian. In the event of default or bankruptcy by the other party to the agreement, retention of the collateral may be subject to legal proceedings. All open repurchase agreements as of the date of this report were entered into on Nov. 27, 2015 and matured on the next business day.
Foreign Currency Transactions — Transactions denominated in foreign currencies are recorded at the prevailing exchange rates on the valuation date in accordance with each Fund’s prospectus. The value of all assets and liabilities denominated in foreign currencies is translated daily into U.S. dollars at the exchange rate of such currencies against the U.S. dollar. Transaction gains or losses resulting from changes in exchange rates during the reporting period or upon settlement of the foreign currency transaction are reported in operations for the current period. The Funds generally do not bifurcate that portion of realized gains and losses on investments which is due to changes in foreign exchange rates from that which is due to changes in market prices. The changes are included on the “Statements of operations” under “Net realized and unrealized gain (loss) on investments.” Each Fund reports certain foreign currency related transactions as components of realized gains (losses) for financial reporting purposes, whereas such components are treated as ordinary income (loss) for federal income tax purposes.
Use of Estimates — Each Fund is an investment company, whose financial statements are prepared in conformity with U.S. GAAP. Therefore, each Fund follows the accounting and reporting guidelines for investment companies. The preparation of financial statements in conformity with U.S. GAAP requires
77
Notes to financial statements
Delaware International Funds
1. Significant Accounting Policies (continued)
management to make estimates and assumptions that affect the fair value of investments, the reported amounts of assets and liabilities and disclosure of contingent assets and liabilities at the date of the financial statements, and the reported amounts of revenues and expenses during the reporting period. Actual results could differ from those estimates and the differences could be material.
Other — Expenses directly attributable to a Fund are charged directly to the Fund. Other expenses common to various funds within the Delaware Investments® Family of Funds are generally allocated among such funds on the basis of average net assets. Management fees and some other expenses are paid monthly. Security transactions are recorded on the date the securities are purchased or sold (trade date) for financial reporting purposes. Costs used in calculating realized gains and losses on the sale of investment securities are those of the specific securities sold. Dividend income is recorded on the ex-dividend date and interest income is recorded on the accrual basis. Discounts and premiums on debt securities are accreted or amortized to interest income, respectively, over the lives of the respective securities using the effective interest method. Taxable non-cash dividends are recorded as dividend income. Foreign dividends are also recorded on the ex-dividend date or as soon after the ex-dividend date that a Fund is aware of such dividends, net of all tax withholdings, a portion of which may be reclaimable. Withholding taxes and reclaims on foreign dividends have been recorded in accordance with each Fund’s understanding of the applicable country’s tax rules and rates. Each Fund may pay foreign capital gains taxes on certain foreign securities held, which are reported as components of realized losses for financial reporting purposes, whereas such components are treated as ordinary loss for federal income tax purposes.
Each Fund declares and pays dividends from net investment income and distributions from net realized gain on investments, if any, annually. Each Fund may distribute more frequently, if necessary for tax purposes. Dividends and distributions, if any, are recorded on the ex-dividend date.
Each Fund may receive earnings credits from its custodian when positive cash balances are maintained, which may be used to offset custody fees. There were no such earnings credits for the year ended Nov. 30, 2015.
Each Fund receives earnings credits from its transfer agent when positive cash balances are maintained, which may be used to offset transfer agent fees. If the amount earned is greater than one dollar, the expense paid under this arrangement is included on the “Statements of operations” under “Dividend disbursing and transfer agent fees and expenses” with the corresponding expense offset shown under “Less expense paid indirectly.” For the year ended Nov. 30, 2015, each Fund earned the following amounts under this agreement:
| | | | | | | | | | | | | |
Delaware Emerging
Markets Fund | | Delaware Global
Value Fund | | Delaware International
Value Equity Fund |
| | |
| | | $1,028 | | | | $ | 38 | | | | $ | 159 | |
78
During the year ended Nov. 30, 2015, Delaware Emerging Markets Fund frequently maintained a negative cash balance with its custodian, which is considered a form of borrowing or leverage. If that Fund maintains a negative cash balance and the Fund’s investments decrease in value, the Fund’s losses will be greater than if the Fund did not maintain a negative cash balance. Each Fund is required to pay interest to the custodian on negative cash balances. During the year ended Nov. 30, 2015, Delaware Emerging Markets Fund had an average outstanding overdraft balance equal to 1.07% of its average net assets for which it was charged interest of $161,589, which is included on the “Statements of operations” under “Custodian fees.” The average borrowing rate charged on the overdraft was 0.64%.
2. Investment Management, Administration Agreements, and Other Transactions with Affiliates
In accordance with the terms of its respective Investment Management Agreement, each Fund pays Delaware Management Company (DMC), a series of Delaware Management Business Trust and the investment manager, an annual fee based on each Fund’s average daily net assets as follows:
| | | | | | | | | | | | | | | | | | | |
| | | Delaware Emerging
Markets Fund | | | | Delaware Global
Value Fund | | | | Delaware International
Value Equity Fund |
On the first $500 million | | | | 1.25 | % | | | | | | 0.85 | % | | | | | | 0.85 | % |
On the next $500 million | | | | 1.20 | % | | | | | | 0.80 | % | | | | | | 0.80 | % |
On the next $1.5 billion | | | | 1.15 | % | | | | | | 0.75 | % | | | | | | 0.75 | % |
In excess of $2.5 billion | | | | 1.10 | % | | | | | | 0.70 | % | | | | | | 0.70 | % |
DMC has contractually agreed to waive that portion, if any, of its management fee and reimburse Delaware Global Value Fund and Delaware International Value Equity Fund to the extent necessary to ensure that annual operating expenses (excluding any 12b-1 fees, taxes, interest, short sale dividend and interest expenses, acquired fund fees and expenses, brokerage fees, certain insurance costs, and nonroutine expenses or costs, including, but not limited to, those relating to reorganizations, litigation, conducting shareholder meetings, and liquidations), do not exceed specified percentages of average daily net assets of each Fund from Dec. 1, 2014 through Nov. 30, 2015* as shown below. For purposes of these waivers and reimbursements, nonroutine expenses may also include such additional costs and expenses as may be agreed upon from time to time by the Funds’ Board and DMC. These expense waivers and reimbursements apply only to expenses paid directly by the Funds and may only be terminated by agreement of DMC and the Funds.
| | | | | | | | | | | | | | | | | | | |
| | | Delaware Emerging
Markets Fund | | | | Delaware Global
Value Fund | | | | Delaware International
Value Equity Fund |
| Operating expense limitation as a percentage of average daily net assets (per annum) | | | | None | | | | | | | 1.30 | % | | | | | | 1.21 | % |
79
Notes to financial statements
Delaware International Funds
| 2. | Investment Management, Administration Agreements, and Other Transactions with Affiliates (continued) | |
Delaware Investments Fund Services Company (DIFSC), an affiliate of DMC, provides fund accounting and financial administration oversight services to each Fund. For these services, DIFSC’s fees are calculated based on the aggregate daily net assets of the Delaware Investments® Family of Funds at the following annual rate: 0.0050% of the first $30 billion; 0.0045% of the next $10 billion; 0.0040% of the next $10 billion; and 0.0025% of aggregate average daily net assets in excess of $50 billion. The fees payable to DIFSC under the service agreement described above are allocated among all retail funds in the Delaware Investments Family of Funds on a relative net asset value basis. These amounts are included on the “Statements of operations” under “Accounting and administration expenses.” For the year ended Nov. 30, 2015, each Fund was charged for these services as follows:
| | | | |
Delaware Emerging Markets Fund | | Delaware Global
Value Fund | | Delaware International
Value Equity Fund |
| | |
| $111,594 | | $1,099 | | $12,594 |
DIFSC is also the transfer agent and dividend disbursing agent of each Fund. For these services, DIFSC’s fees are calculated based on the aggregate daily net assets of the retail funds within the Delaware Investments Family of Funds at the following annual rate: 0.025% of the first $20 billion; 0.020% of the next $5 billion; 0.015% of the next $5 billion; and 0.013% on average daily net assets in excess of $30 billion. The fees payable to DIFSC under the service agreement described above are allocated among all retail funds in the Delaware Investments Family of Funds on a relative net asset value basis. These amounts are included on the “Statements of operations” under “Dividend disbursing and transfer agent fees and expenses.” For the year ended Nov. 30, 2015, each Fund was charged for these services as follows:
| | | | |
Delaware Emerging Markets Fund | | Delaware Global
Value Fund | | Delaware International
Value Equity Fund |
| | |
| $488,262 | | $4,809 | | $55,107 |
Pursuant to a sub-transfer agency agreement between DIFSC and BNY Mellon Investment Servicing (US) Inc. (BNYMIS), BNYMIS provides certain sub-transfer agency services to the Funds. Sub-transfer agency fees are paid by the Funds and are also included on the “Statements of operations” under “Dividend disbursing and transfer agent fees and expenses.”
Pursuant to a distribution agreement and distribution plan, each Fund pays DDLP, the distributor and an affiliate of DMC, an annual distribution and service fee of 0.25% of the average daily net assets of the Class A shares, 1.00% of the average daily net assets of the Class C shares, and 0.50% of the average daily net assets of the Class R shares. Institutional Class shares pay no distribution and service expenses.
80
As provided in the investment management agreement, each Fund bears a portion of the cost of resources shared with DMC, including the cost of internal personnel of DMC and/or its affiliates that provide legal, tax, and regulatory reporting services to the Funds. These amounts are included on the “Statements of operations” under “Legal Fees.” For the year ended Nov. 30, 2015, each Fund was charged for internal legal, tax, and regulatory reporting services provided by DMC and/or its affiliates’ employees as follows:
| | | | |
Delaware Emerging
Markets Fund | | Delaware Global
Value Fund | | Delaware International
Value Equity Fund |
| | |
| $63,733 | | $570 | | $6,536 |
For the year ended Nov. 30, 2015, DDLP earned commissions on sales of Class A shares for each Fund as follows:
| | | | |
Delaware Emerging
Markets Fund | | Delaware Global
Value Fund | | Delaware International
Value Equity Fund |
| | |
| $40,453 | | $2,494 | | $8,476 |
For the year ended Nov. 30, 2015, DDLP received gross CDSC commissions on redemptions of each Fund’s Class A and Class C shares, and these commissions were entirely used to offset upfront commissions previously paid by DDLP to broker/dealers on sales of those shares. The amounts received were as follows:
| | | | | | | | | | | | | | | |
| | | Delaware Emerging
Markets Fund | | Delaware Global
Value Fund | | Delaware International
Value Equity Fund |
| | | |
Class A | | | $ | 3,497 | | | | $ | 77 | | | | $ | 1 | |
Class C | | | | 32,590 | | | | | 16 | | | | | 894 | |
Trustees’ fees include expenses accrued by each Fund for each Trustee’s retainer and meeting fees. Certain officers of DMC, DIFSC, and DDLP are officers and/or Trustees of the Trust. These officers and Trustees are paid no compensation by the Funds.
* The contractual period is from March 28, 2014 through March 30, 2016.
3. Investments
For the year ended Nov. 30, 2015, each Fund made purchases and sales of investment securities other than short-term investments as follows:
| | | | | | | | | | | | | | | |
| | | Delaware Emerging
Markets Fund | | Delaware Global
Value Fund | | Delaware International
Value Equity Fund |
| | | |
Purchases | | | $ | 294,676,162 | | | | $ | 3,306,793 | | | | $ | 33,074,634 | |
Sales | | | | 1,054,733,887 | | | | | 5,337,477 | | | | | 53,684,466 | |
81
Notes to financial statements
Delaware International Funds
3. Investments (continued)
At Nov. 30, 2015, the cost of investments and unrealized appreciation (depreciation) for federal income tax purposes for each Fund were as follows:
| | | | | | | | | | | | | | | |
| | | Delaware Emerging
Markets Fund | | Delaware Global
Value Fund | | Delaware International
Value Equity Fund |
| | | |
Cost of investments | | | $ | 2,224,651,363 | | | | $ | 20,465,436 | | | | $ | 265,141,304 | |
| | | | | | | | | | | | | | | |
Aggregate unrealized appreciation of investments | | | $ | 232,336,205 | | | | $ | 4,961,275 | | | | $ | 61,832,183 | |
Aggregate unrealized depreciation of investments | | | | (704,960,412 | ) | | | | (3,525,823 | ) | | | | (65,444,819 | ) |
| | | | | | | | | | | | | | | |
Net unrealized appreciation (depreciation) of investments | | | $ | (472,624,207 | ) | | | $ | 1,435,452 | | | | $ | (3,612,636 | ) |
| | | | | | | | | | | | | | | |
U.S. GAAP defines fair value as the price that each Fund would receive to sell an asset or pay to transfer a liability in an orderly transaction between market participants at the measurement date under current market conditions. A three-level hierarchy for fair value measurements has been established based upon the transparency of inputs to the valuation of an asset or liability. Inputs may be observable or unobservable and refer broadly to the assumptions that market participants would use in pricing the asset or liability. Observable inputs reflect the assumptions market participants would use in pricing the asset or liability based on market data obtained from sources independent of the reporting entity. Unobservable inputs reflect the reporting entity’s own assumptions about the assumptions that market participants would use in pricing the asset or liability based on the best information available under the circumstances. Each Fund’s investment in its entirety is assigned a level based upon the observability of the inputs which are significant to the overall valuation. The three-level hierarchy of inputs is summarized below.
| | | | |
| Level 1 | | – | | Inputs are quoted prices in active markets for identical investments. (Examples: equity securities, open-end investment companies, futures contracts, exchange-traded options contracts) |
| | |
| Level 2 | | – | | Other observable inputs, including, but not limited to: quoted prices for similar assets or liabilities in markets that are active, quoted prices for identical or similar assets or liabilities in markets that are not active, inputs other than quoted prices that are observable for the assets or liabilities (such as interest rates, yield curves, volatilities, prepayment speeds, loss severities, credit risks, and default rates), or other market-corroborated inputs. (Examples: debt securities, government securities, swap contracts, foreign currency exchange contracts, foreign securities utilizing international fair value pricing, broker-quoted securities, fair valued securities) |
| | |
| Level 3 | | – | | Significant unobservable inputs, including each Fund’s own assumptions used to determine the fair value of investments. (Examples: broker-quoted securities, fair valued securities) |
82
Level 3 investments are valued using significant unobservable inputs. Each Fund may also use an income-based valuation approach in which the anticipated future cash flows of the investment are discounted to calculate fair value. Discounts may also be applied due to the nature or duration of any restrictions on the disposition of the investments. Valuations may also be based upon current market prices of securities that are comparable in coupon, rating, maturity, and industry. The derived value of a Level 3 investment may not represent the value which is received upon disposition and this could impact the results of operations.
The following tables summarize the valuation of each Fund’s investments by fair value hierarchy levels as of Nov. 30, 2015:
| | | | | | | | | | | | | | | | | | | | |
| | | Delaware Emerging Markets Fund |
| | | | |
Securities | | Level 1 | | Level 2 | | Level 3 | | Total |
| | | | |
Common Stock | | | | | | | | | | | | | | | | | | | | |
Argentina | | | $ | 43,320,043 | | | | $ | 9,566,127 | | | | $ | — | | | | $ | 52,886,170 | |
Bahrain | | | | — | | | | | 1,091,015 | | | | | — | | | | | 1,091,015 | |
Brazil | | | | 190,273,738 | | | | | — | | | | | — | | | | | 190,273,738 | |
Canada | | | | 337,250 | | | | | — | | | | | — | | | | | 337,250 | |
Chile | | | | 15,788,966 | | | | | — | | | | | — | | | | | 15,788,966 | |
China/Hong Kong | | | | 561,662,042 | | | | | — | | | | | — | | | | | 561,662,042 | |
Cyprus | | | | 7,355,072 | | | | | — | | | | | — | | | | | 7,355,072 | |
France | | | | 1,020,578 | | | | | — | | | | | — | | | | | 1,020,578 | |
India | | | | 183,727,334 | | | | | 15,619 | | | | | — | | | | | 183,742,953 | |
Malaysia | | | | 14,250,991 | | | | | — | | | | | — | | | | | 14,250,991 | |
Mexico | | | | 78,255,419 | | | | | — | | | | | — | | | | | 78,255,419 | |
Peru | | | | 5,688,000 | | | | | — | | | | | — | | | | | 5,688,000 | |
Poland | | | | 5,472,576 | | | | | — | | | | | — | | | | | 5,472,576 | |
Republic of Korea | | | | 246,713,024 | | | | | — | | | | | — | | | | | 246,713,024 | |
Russia | | | | 120,093,211 | | | | | 22,717,048 | | | | | — | | | | | 142,810,259 | |
South Africa | | | | 7,501,326 | | | | | — | | | | | — | | | | | 7,501,326 | |
Taiwan | | | | 81,749,253 | | | | | — | | | | | — | | | | | 81,749,253 | |
Thailand | | | | 10,982,966 | | | | | — | | | | | — | | | | | 10,982,966 | |
Turkey | | | | 51,327,411 | | | | | — | | | | | — | | | | | 51,327,411 | |
United Kingdom | | | | 1,258,293 | | | | | — | | | | | — | | | | | 1,258,293 | |
United States | | | | 16,905,000 | | | | | — | | | | | — | | | | | 16,905,000 | |
Preferred Stock1 | | | | 46,660,111 | | | | | 16,478,000 | | | | | — | | | | | 63,138,111 | |
Exchange-Traded Fund | | | | 11,512,155 | | | | | — | | | | | — | | | | | 11,512,155 | |
Participation Notes | | | | — | | | | | — | | | | | — | | | | | — | |
Rights | | | | 304,588 | | | | | — | | | | | — | | | | | 304,588 | |
| | | | | | | | | | | | | | | | | | | | |
| | | | |
Total Value of Securities | | | $ | 1,702,159,347 | | | | $ | 49,867,809 | | | | $ | — | | | | $ | 1,752,027,156 | |
| | | | | | | | | | | | | | | | | | | | |
1Security type is valued across multiple levels. The amounts attributed to Level 1 investments and Level 2 investments represent 73.90% and 26.10%, respectively, of the total market value of this security type. Level 1 investments represent exchange traded investments and Level 2 investments represent investments with observable inputs.
83
Notes to financial statements
Delaware International Funds
3. Investments (continued)
| | | | | | | | | | | | | | | |
| | | Delaware Global Value Fund |
| | | |
Securities | | Level 1 | | Level 2 | | Total |
| | | |
Common Stock | | | $ | 20,882,052 | | | | $ | — | | | | $ | 20,882,052 | |
Rights | | | | 11,674 | | | | | — | | | | | 11,674 | |
Short-Term Investments | | | | — | | | | | 218,657 | | | | | 218,657 | |
Securities Lending Collateral | | | | — | | | | | 788,505 | | | | | 788,505 | |
| | | | | | | | | | | | | | | |
| | | |
Total Value of Securities | | | $ | 20,893,726 | | | | $ | 1,007,162 | | | | $ | 21,900,888 | |
| | | | | | | | | | | | | | | |
| | | | | | | | | | | | | | | |
| |
| | | Delaware International Value Equity Fund |
| | | |
Securities | | Level 1 | | Level 2 | | Total |
| | | |
Common Stock | | | $ | 252,091,322 | | | | $ | — | | | | $ | 252,091,322 | |
Rights | | | | 187,959 | | | | | — | | | | | 187,959 | |
Short-Term Investments | | | | — | | | | | 3,542,984 | | | | | 3,542,984 | |
Securities Lending Collateral | | | | — | | | | | 5,706,403 | | | | | 5,706,403 | |
| | | | | | | | | | | | | | | |
| | | |
Total Value of Securities | | | $ | 252,279,281 | | | | $ | 9,249,387 | | | | $ | 261,528,668 | |
| | | | | | | | | | | | | | | |
The securities that have been valued at zero on the “Schedules of investments” are considered to be Level 3 securities in these tables.
During the year ended Nov. 30, 2015, there were no transfers between Level 1 investments, Level 2 investments, or Level 3 investments that had a significant impact to each Fund. This does not include transfers between Level 1 investments and Level 2 investments due to each Fund utilizing international fair value pricing during the period. In accordance with the fair valuation procedures described in Note 1, international fair value pricing of securities in each Fund occurs when market volatility exceeds an established rolling threshold. If the threshold is exceeded on a given date, then prices of international securities (those that traded on exchanges that close at a different time than the time that each Fund’s net asset value is determined) are established using a separate pricing feed from a third party vendor designed to establish a price for each such security as of the time that each Fund’s net asset value is determined. Further, international fair value pricing uses other observable market-based inputs in place of the closing exchange price due to the events occurring after the close of the exchange or market on which the investment is principally traded, causing a change in classification between levels. Each Fund’s policy is to recognize transfers between levels at the beginning of the reporting period.
A reconciliation of Level 3 investments is presented when a Fund has a significant amount of Level 3 investments at the beginning, interim, or end of the period in relation to net assets. Management has determined not to provide additional disclosure on Level 3 inputs since the Level 3 investments are not considered significant to each Fund’s net assets at the end of the year.
At Nov. 30, 2015, Delaware Global Value Fund and Delaware International Value Equity Fund had no Level 3 investments.
84
4. Dividend and Distribution Information
Income and long-term capital gain distributions are determined in accordance with federal income tax regulations, which may differ from U.S. GAAP. Additionally, distributions from net gains on foreign currency transactions and net short-term gains on sales of investment securities are treated as ordinary income for federal income tax purposes. The tax character of dividends and distributions paid during the years ended Nov. 30, 2015 and 2014 was as follows:
| | | | | | | | | | | | | | | |
| | | Delaware Emerging
Markets Fund | | Delaware Global
Value Fund | | Delaware International
Value Equity Fund |
Year ended Nov. 30, 2015 | | | | | | | | | | | | | | | |
Ordinary income | | | $ | 26,798,002 | | | | $ | 91,070 | | | | $ | 5,839,811 | |
Long-term capital gains | | | | 52,697,119 | | | | | — | | | | | — | |
Return of capital | | | | 2,054,265 | | | | | — | | | | | — | |
| | | | | | | | | | | | | | | |
Total | | | $ | 81,549,386 | | | | $ | 91,070 | | | | $ | 5,839,811 | |
| | | | | | | | | | | | | | | |
| | | |
Year ended Nov. 30, 2014 | | | | | | | | | | | | | | | |
Ordinary income | | | $ | 22,806,622 | | | | $ | 124,546 | | | | $ | 3,417,743 | |
5. Components of Net Assets on a Tax Basis
As of Nov. 30, 2015, the components of net assets on a tax basis were as follows:
| | | | | | | | | | | | |
| | | Delaware Emerging
Markets Fund | | | Delaware Global
Value Fund | | | Delaware International
Value Equity Fund | |
Shares of beneficial interest | | $ | 2,219,880,109 | | | $ | 40,967,064 | | | $ | 428,526,102 | |
Undistributed ordinary income | | | — | | | | 123,950 | | | | 3,382,083 | |
Capital loss carryforwards | | | (61,613,265) | | | | (21,426,493) | | | | (172,151,410) | |
Unrealized appreciation (depreciation) of investments and foreign currencies | | | (473,975,215) | | | | 1,434,417 | | | | (3,652,550) | |
| | | | | | | | | | | | |
Net assets | | $ | 1,684,291,629 | | | $ | 21,098,938 | | | $ | 256,104,225 | |
| | | | | | | | | | | | |
The differences between book basis and tax basis components of net assets are primarily attributable to tax deferral of losses on wash sales, and tax recognition of unrealized gain on passive foreign investment companies.
For financial reporting purposes, capital accounts are adjusted to reflect the tax character of permanent book/tax differences. Reclassifications are primarily due to tax treatment of gain (loss) on foreign currency transactions, foreign capital gains tax, dividends and distributions, and passive foreign investment companies. Results of operations and net assets were not affected by these reclassifications. For year ended Nov. 30, 2015, the Funds recorded the following reclassifications:
85
Notes to financial statements
Delaware International Funds
| 5. | Components of Net Assets on a Tax Basis |
(continued)
| | | | | | | | | | | | | | | |
| | | Delaware Emerging
Markets Fund | | Delaware Global
Value Fund | | Delaware International
Value Equity Fund |
Undistributed (distributions in excess of) net investment income | | | $ | 14,548,066 | | | | $ | (7,493 | ) | | | $ | (100,243 | ) |
Accumulated net realized loss on investments | | | | (14,548,066 | ) | | | | 7,493 | | | | | 100,243 | |
For federal income tax purposes, capital loss carryforwards may be carried forward and applied against future capital gains.
In 2015, the Funds utilized capital loss carryforwards as follows:
| | | | |
Delaware Global Value Fund | | $ | 1,318,056 | |
Delaware International Value Equity Fund | | | 12,017,803 | |
Capital loss carryforwards remaining at Nov. 30, 2015 will expire as follows:
| | | | | | | | | | |
| | | Delaware Global
Value Fund | | Delaware International
Value Equity Fund |
Year of expiration | | | | |
2016 | | | $ | 8,883,816 | | | | $ | 50,123,353 | |
2017 | | | | 12,542,677 | | | | | 113,289,581 | |
2019 | | | | — | | | | | 8,738,476 | |
| | | | | | | | | | |
Total | | | $ | 21,426,493 | | | | $ | 172,151,410 | |
| | | | | | | | | | |
On Dec. 22, 2010, the Regulated Investment Company Modernization Act of 2010 (Act) was enacted, which changed various technical rules governing the tax treatment of regulated investment companies. The changes were generally effective for taxable years beginning after the date of enactment. Under the Act, each Fund is permitted to carry forward capital losses incurred in taxable years beginning after the date of enactment for an unlimited period. However, any losses incurred during those future taxable years will be required to be utilized prior to the losses incurred in pre-enactment taxable years, which carry an expiration date. As a result of this ordering rule, pre-enactment capital loss carryforwards may be more likely to expire unused. Additionally, post-enactment capital loss carryforwards will retain their character as either short-term or long-term capital losses rather than being considered all short-term as permitted under previous regulation.
Losses incurred that will be carried forward under the Act are as follows:
| | | | | | | | | | |
| | | Loss carryforward character |
| | | Short-term | | Long-term |
Delaware Emerging Markets Fund | | | $ | 23,820,350 | | | | $ | 37,792,915 | |
86
6. Capital Shares
Transactions in capital shares were as follows:
| | | | | | | | | | | | | | | | | | | | | | | | |
| | | Delaware Emerging
Markets Fund | | | Delaware Global
Value Fund | | | Delaware International
Value Equity Fund | |
| | | | | | |
| | | Year ended | | | Year ended | | | Year
ended | | | Year
ended | | | Year ended | | | Year ended | |
| | | 11/30/15 | | | 11/30/14 | | | 11/30/15 | | | 11/30/14 | | | 11/30/15 | | | 11/30/14 | |
| | | | | | |
Shares sold: | | | | | | | | | | | | | | | | | | | | | | | | |
Class A | | | 6,347,742 | | | | 14,505,685 | | | | 104,296 | | | | 194,985 | | | | 688,161 | | | | 1,055,634 | |
Class B | | | — | | | | 355 | | | | — | | | | 31 | | | | — | | | | 79 | |
Class C | | | 1,743,497 | | | | 3,815,185 | | | | 73,821 | | | | 43,147 | | | | 322,130 | | | | 173,347 | |
Class R | | | 1,337,364 | | | | 754,384 | | | | — | | | | — | | | | 37,840 | | | | 23,034 | |
Institutional Class | | | 47,267,532 | | | | 79,899,892 | | | | 25,026 | | | | 50,382 | | | | 3,214,516 | | | | 5,094,493 | |
| | | | | | |
Shares issued upon reinvestment of dividends and distributions: | | | | | | | | | | | | | | | | | | | | | | | | |
Class A | | | 639,662 | | | | 215,559 | | | | 6,136 | | | | 9,148 | | | | 109,477 | | | | 74,353 | |
Class B | | | — | | | | 70 | | | | — | | | | — | | | | — | | | | 501 | |
Class C | | | 314,905 | | | | 8,995 | | | | — | | | | — | | | | 26,523 | | | | 8,470 | |
Class R | | | 23,453 | | | | 1,668 | | | | — | | | | — | | | | 3,076 | | | | 1,675 | |
Institutional Class | | | 3,328,262 | | | | 725,120 | | | | 1,207 | | | | 1,468 | | | | 307,105 | | | | 157,110 | |
| | | | | | | | | | | | | | | | | | | | | | | | |
| | | 61,002,417 | | | | 99,926,913 | | | | 210,486 | | | | 299,161 | | | | 4,708,828 | | | | 6,588,696 | |
| | | | | | | | | | | | | | | | | | | | | | | | |
| | | | | | |
Shares redeemed: | | | | | | | | | | | | | | | | | | | | | | | | |
Class A | | | (11,916,634 | ) | | | (19,101,339 | ) | | | (261,616 | ) | | | (261,755 | ) | | | (1,120,263 | ) | | | (2,968,656 | ) |
Class B | | | — | | | | (131,085 | ) | | | — | | | | (107,762 | ) | | | — | | | | (142,571 | ) |
Class C | | | (4,183,293 | ) | | | (2,496,978 | ) | | | (118,728 | ) | | | (108,186 | ) | | | (427,070 | ) | | | (425,165 | ) |
Class R | | | (352,306 | ) | | | (204,237 | ) | | | — | | | | — | | | | (100,574 | ) | | | (56,904 | ) |
Institutional Class | | | (105,391,312 | ) | | | (49,342,853 | ) | | | (43,643 | ) | | | (39,041 | ) | | | (4,489,914 | ) | | | (4,352,143 | ) |
| | | | | | | | | | | | | | | | | | | | | | | | |
| | | (121,843,545 | ) | | | (71,276,492 | ) | | | (423,987 | ) | | | (516,744 | ) | | | (6,137,821 | ) | | | (7,945,439 | ) |
| | | | | | | | | | | | | | | | | | | | | | | | |
Net increase (decrease) | | | (60,841,128 | ) | | | 28,650,421 | | | | (213,501 | ) | | | (217,583 | ) | | | (1,428,993 | ) | | | (1,356,743 | ) |
| | | | | | | | | | | | | | | | | | | | | | | | |
87
Notes to financial statements
Delaware International Funds
6. Capital Shares (continued)
For the year ended Nov. 30, 2014, the following shares and values were converted from Class B to Class A. The respective amounts are included in Class B redemptions and Class A subscriptions in the tables on the previous page and the “Statements of changes in net assets.”
| | | | | | | | | | | | |
| | | Class B
Shares | | | Class A
Shares | | | Value | |
Delaware Emerging Markets Fund | | | 33,015 | | | | 31,318 | | | | $521,580 | |
Delaware Global Value Fund | | | 31,991 | | | | 31,514 | | | | 366,688 | |
Delaware International Value Equity Fund | | | 46,482 | | | | 45,935 | | | | 647,640 | |
For each Fund, certain shareholders may exchange shares of one class of shares for shares of another class in the same Fund. For the years ended Nov. 30, 2015 and 2014, exchange transactions were as follows:
| | | | | | | | | | | | | | | | | | | | | | | | |
| | | Year ended 11/30/15 | |
| | |
| | | Exchange Redemptions | | | Exchange Subscriptions | |
| | | | | | |
| | | Class A
Shares | | | Class C
Shares | | | Institutional
Class
Shares | | | Class A
Shares | | | Institutional
Class
Shares | | | Value | |
Delaware Emerging Markets Fund | | | 12,941 | | | | 18,540 | | | | 7,274 | | | | 10,623 | | | | 26,891 | | | | $529,639 | |
Delaware International Value Equity Fund | | | — | | | | 6,404 | | | | — | | | | — | | | | 6,277 | | | | 85,559 | |
| |
| | | Year ended 11/30/14 | |
| | |
| | | Exchange Redemptions | | | Exchange Subscriptions | |
| | | | | | |
| | | Class A
Shares | | | Class C
Shares | | | Institutional
Class
Shares | | | Class A
Shares | | | Institutional
Class
Shares | | | Value | |
Delaware Emerging Markets Fund | | | 1,347,933 | | | | 5,305 | | | | 1,478 | | | | 1,490 | | | | 1,343,519 | | | | $23,106,103 | |
Delaware International Value Equity Fund | | | 1,514 | | | | 22,900 | | | | — | | | | — | | | | 23,877 | | | | 326,209 | |
These exchange transactions are included as subscriptions and redemptions in the tables on the previous page and the “Statements of changes in net assets.” For the years ended Nov. 30, 2015 and 2014, Delaware Global Value Fund had no exchange transactions.
7. Line of Credit
Each Fund, along with certain other funds in the Delaware Investments® Family of Funds (Participants), was a participant in a $275,000,000 revolving line of credit to be used for temporary or emergency purposes as an additional source of liquidity to fund redemptions of investor shares. Under the
88
agreement, the Participants were charged an annual commitment fee of 0.08%, which was allocated across the Participants on the basis of each Participant’s allocation of the entire facility. The Participants were permitted to borrow up to a maximum of one third of their net assets under the agreement. Each Participant was individually, and not jointly, liable for its particular advances, if any, under the line of credit. The line of credit available under the agreement expired on Nov. 9, 2015.
On Nov. 9, 2015, each Fund along with the other Participants, entered into an amendment to the agreement for a $155,000,000 revolving line of credit. The line of credit is to be used as described above and operates in substantially the same manner as the original agreement, with the exception of the annual commitment fee. Under the amendment to the agreement, the Participants are charged an annual commitment fee of 0.10%, which is allocated across the Participants on the basis of each Participant’s allocation of the entire facility. The line of credit available under the agreement expires on Nov. 7, 2016.
The Funds had no amounts outstanding as of Nov. 30, 2015 or at any time during the year then ended.
8. Derivatives
U.S. GAAP requires disclosures that enable investors to understand: (1) how and why an entity uses derivatives; (2) how they are accounted for; and (3) how they affect an entity’s results of operations and financial position.
Foreign Currency Exchange Contracts — Each Fund may enter into foreign currency exchange contracts and foreign cross currency exchange contracts as a way of managing foreign exchange rate risk. Each Fund may enter into these contracts to fix the U.S. dollar value of a security that it has agreed to buy or sell for the period between the date the trade was entered into and the date the security is delivered and paid for. Each Fund may also use these contracts to hedge the U.S. dollar value of securities it already owns that are denominated in foreign currencies. In addition, each Fund may enter into these contracts to facilitate or expedite the settlement of portfolio transactions. The change in value is recorded as an unrealized gain or loss. When the contract is closed, a realized gain or loss is recorded equal to the difference between the value of the contract at the time it was opened and the value at the time it was closed.
The use of foreign currency exchange contracts and foreign cross currency exchange contracts does not eliminate fluctuations in the underlying prices of the securities, but does establish a rate of exchange that can be achieved in the future. Although foreign currency exchange contracts and foreign cross currency exchange contracts limit the risk of loss due to an unfavorable change in the value of the hedged currency, they also limit any potential gain that might result should the value of the currency change favorably. In addition, each Fund could be exposed to risks if the counterparties to the contracts are unable to meet the terms of their contracts. Each Fund’s maximum risk of loss from counterparty credit risk is the value of its currency exchanged with the counterparty. The risk is generally mitigated by having a netting arrangement between each Fund and the counterparty and by the posting of collateral by the counterparty to the Fund to cover the Fund’s exposure to the counterparty.
During the year ended Nov. 30, 2015, each Fund entered into foreign currency exchange contracts and foreign cross currency exchange contracts to facilitate or expedite the settlement of portfolio transactions. Delaware Global Value Fund and Delaware International Value Equity Fund also entered
89
Notes to financial statements
Delaware International Funds
8. Derivatives (continued)
into foreign currency exchange contracts and foreign cross currency contracts in order to fix the U.S. dollar value of a security between the trade date and settlement date.
At Nov. 30, 2015, the Funds experienced net realized gains or losses attributable to foreign currency holdings, which are disclosed on the “Statements of operations.”
Derivatives Generally. The table below summarizes the average balance of derivative holdings by each Fund during the year ended Nov. 30, 2015.
| | | | | | |
| | | Long Derivatives Volume |
| | | |
| | | Delaware Emerging
Markets Fund | | Delaware Global
Value Fund | | Delaware International
Value Equity Fund |
| Foreign currency exchange contracts (average cost) | | $476,983 | | $9,925 | | $143,074 |
| |
| | | Short Derivatives Volume |
| | | |
| | | Delaware Emerging
Markets Fund | | Delaware Global
Value Fund | | Delaware International
Value Equity Fund |
| Foreign currency exchange contracts (average cost) | | $2,222,454 | | $8,610 | | $208,244 |
9. Offsetting
In December 2011, the Financial Accounting Standards Board (FASB) issued guidance that expanded disclosure requirements on the offsetting of certain assets and liabilities. The disclosures are required for investments and derivative financial instruments subject to master netting or similar agreements which are eligible for offset on the “Statements of assets and liabilities” and requires an entity to disclose both gross and net information about such investments and transactions in the financial statements. In January 2013, the FASB issued guidance that clarified which investments and transactions are subject to the offsetting disclosure requirements. The scope of the disclosure requirements for offsetting is limited to derivative instruments, repurchase agreements and reverse repurchase agreements, and securities borrowing. The guidance is effective for financial statements with fiscal years beginning on or after Jan. 1, 2013, and interim periods within those fiscal years.
In order to better define its contractual rights and to secure rights that will help each Fund mitigate its counterparty risk, the Funds entered into an International Swaps and Derivatives Association, Inc. Master Agreement (ISDA Master Agreement) or a similar agreement with certain of their derivative contract counterparties. An ISDA Master Agreement is a bilateral agreement between each Fund and a counterparty that governs over-the-counter (OTC) derivatives and foreign exchange contracts and typically contains, among other things, collateral posting items and netting provisions in the event of a default and/or termination event. Under an ISDA Master Agreement, each Fund may, under certain circumstances, offset with the counterparty certain derivative financial instrument’s payables and/or receivables with collateral held and/or posted and create one single net payment. The provisions of the ISDA Master Agreement typically permit a single net payment in the event of default (close-out), including the bankruptcy or insolvency of the counterparty. However, bankruptcy or insolvency laws of a particular
90
jurisdiction may impose restrictions on or prohibitions against the right of offset in bankruptcy, insolvency, or other events.
For financial reporting purposes, the Funds do not offset derivative assets and derivative liabilities that are subject to netting arrangements on the “Statements of assets and liabilities.”
At Nov. 30, 2015, Delaware Emerging Markets Fund had no assets and liabilities subject to offsetting provisions. Delaware Global Value Fund and Delaware International Value Equity Fund had the following assets and liabilities subject to offsetting provisions:
Offsetting of Financial Assets and Liabilities and Derivative Assets and Liabilities
| | | | | | | | | | | | | | | | | | | | |
| | | Delaware Global Value Fund | | | | |
| | | | | |
| Master Repurchase Agreements | | Repurchase | | | Fair Value of
Non-Cash
Collateral | | | Cash
Collateral | | | Net Collateral | | | | |
Counterparty | | Agreements | | | Received | | | Received | | | Received | | | Net Amount(a) | |
Bank of America Merrill Lynch | | | $ 22,446 | | | | $ (22,446 | ) | | | $— | | | | $ (22,446 | ) | | | $— | |
Bank of Montreal | | | 37,409 | | | | (37,409 | ) | | | — | | | | (37,409 | ) | | | — | |
BNP Paribas | | | 55,145 | | | | (55,145 | ) | | | — | | | | (55,145 | ) | | | — | |
| | | | | | | | | | | | | | | | | | | | |
Total | | | $115,000 | | | | $(115,000 | ) | | | $— | | | | $(115,000 | ) | | | $— | |
| | | | | | | | | | | | | | | | | | | | |
| | |
| | | Delaware International Value Equity Fund | | | | |
| | | | | |
| Master Repurchase Agreements | | Repurchase | | | Fair Value of
Non-Cash
Collateral | | | Cash
Collateral | | | Net Collateral | | | Net | |
Counterparty | | Agreements | | | Received | | | Received | | | Received | | | Exposure(a) | |
Bank of America Merrill Lynch | | | $ 284,375 | | | | $ (284,375 | ) | | | $— | | | | $ (284,375 | ) | | | $— | |
Bank of Montreal | | | 473,959 | | | | (473,959 | ) | | | — | | | | (473,959 | ) | | | — | |
BNP Paribas | | | 698,666 | | | | (698,666 | ) | | | — | | | | (698,666 | ) | | | — | |
| | | | | | | | | | | | | | | | | | | | |
Total | | | $1,457,000 | | | | $(1,457,000 | ) | | | $— | | | | $(1,457,000 | ) | | | $— | |
| | | | | | | | | | | | | | | | | | | | |
(a)Net exposure represents the receivable (payable) that would be due from (to) the counterparty in the event of default.
10. Securities Lending
Each Fund, along with other funds in the Delaware Investments® Family of Funds, may lend its securities pursuant to a security lending agreement (Lending Agreement) with The Bank of New York Mellon (BNY Mellon). At the time a security is loaned, the borrower must post collateral equal to the required percentage of the market value of the loaned security, including any accrued interest. The required percentage is: (1) 102% with respect to U.S. securities and foreign securities that are denominated and payable in U.S. dollars; and (2) 105% with respect to foreign securities. With respect to each loan, if on any business day the aggregate market value of securities collateral plus cash collateral held is less than the aggregate market value of the securities which are the subject of such loan, the borrower will be notified to provide additional collateral by the end of the following business day which, together with the collateral already held, will be not less than the applicable initial collateral requirements for such security loan. If the aggregate market value of securities collateral and cash collateral held with respect to a security loan exceeds the applicable initial collateral requirement, upon the request of the borrower, BNY
91
Notes to financial statements
Delaware International Funds
10. Securities Lending (continued)
Mellon must return enough collateral to the borrower by the end of the following business day to reduce the value of the remaining collateral to the applicable initial collateral requirement for such security loan. As a result of the foregoing, the value of the collateral held with respect to a loaned security on any particular day may be more or less than the value of the security on loan.
Cash collateral received is generally invested in the Delaware Investments Collateral Fund No. 1 (Collective Trust) established by BNY Mellon for the purpose of investment on behalf of funds managed by DMC that participate in BNY Mellon’s securities lending program. The Collective Trust may invest in U.S. government securities and high-quality corporate debt, asset-backed and other money market securities, and in repurchase agreements collateralized by such securities, provided that the Collective Trust will generally have a dollar-weighted average portfolio maturity of 60 days or less. Each Fund can also accept U.S. government securities and letters of credit (non-cash collateral) in connection with securities loans. In the event of default or bankruptcy by the lending agent, realization and/or retention of the collateral may be subject to legal proceedings. In the event the borrower fails to return loaned securities and the collateral received is insufficient to cover the value of the loaned securities and provided such collateral shortfall is not the result of investment losses, the lending agent has agreed to pay the amount of the shortfall to each Fund or, at the discretion of the lending agent, replace the loaned securities. Each Fund continues to record dividends or interest, as applicable, on the securities loaned and is subject to changes in value of the securities loaned that may occur during the term of the loan. Each Fund has the right under the Lending Agreement to recover the securities from the borrower on demand. With respect to security loans collateralized by non-cash collateral, each Fund receives loan premiums paid by the borrower. With respect to security loans collateralized by cash collateral, the earnings from the collateral investments are shared among each Fund, the security lending agent, and the borrower. Each Fund records security lending income net of allocations to the security lending agent and the borrower.
The Collective Trust used for the investment of cash collateral received from borrowers of securities seeks to maintain a net asset value per unit of $1.00, but there can be no assurance that it will always be able to do so. Each Fund may incur investment losses as a result of investing securities lending collateral in the Collective Trust or another collateral investment pool. This could occur if an investment in a collateral investment pool defaulted or if it were necessary to liquidate assets in the collateral investment pool to meet returns on outstanding security loans at a time when the collateral investment pool’s net asset value per unit was less than $1.00. Under those circumstances, each Fund may not receive an amount from the collateral investment pool that is equal in amount to the collateral each Fund would be required to return to the borrower of the securities and each Fund would be required to make up for this shortfall.
92
At Nov. 30, 2015, the values of securities on loan and the values of invested collateral for each Fund are presented below, for which cash collateral was received and invested in accordance with the Lending Agreement. These investments are presented on the “Schedules of investments” under the caption “Securities Lending Collateral.”
| | | | | | | | | | | | | | | |
| | | Delaware Emerging
Markets Fund | | Delaware Global
Value Fund | | Delaware International
Value Equity Fund |
Values of securities on loan | | | $ | — | | | | $ | 1,705,023 | | | | $ | 5,664,904 | |
Values of non-cash collateral | | | | — | | | | | 927,082 | | | | | 144,563 | |
Values of invested collateral | | | | — | | | | | 788,505 | | | | | 5,706,403 | |
11. Credit and Market Risk
Some countries in which the Funds may invest require governmental approval for the repatriation of investment income, capital, or the proceeds of sales of securities by foreign investors. In addition, if there is deterioration in a country’s balance of payments or for other reasons, a country may impose temporary restrictions on foreign capital remittances abroad.
The securities exchanges of certain foreign markets are substantially smaller, less liquid, and more volatile than the major securities markets in the United States. Consequently, acquisition and disposition of securities by each Fund may be inhibited. In addition, a significant portion of the aggregate market value of equity securities listed on the major securities exchanges in emerging markets is held by a smaller number of investors. This may limit the number of shares available for acquisition or disposition by each Fund.
Each Fund may invest up to 15% of its net assets in illiquid securities, which may include securities with contractual restrictions on resale, securities exempt from registration under Rule 144A promulgated under the Securities Act of 1933, as amended, and other securities which may not be readily marketable. The relative illiquidity of these securities may impair each Fund from disposing of them in a timely manner and at a fair price when it is necessary or desirable to do so. While maintaining oversight, each Fund’s Board has delegated to DMC the day-to-day functions of determining whether individual securities are liquid for purposes of each Fund’s limitation on investments in illiquid securities. Securities eligible for resale pursuant to Rule 144A, which are determined to be liquid, are not subject to each Fund’s 15% limit on investments in illiquid securities. Rule 144A and illiquid securities have been identified on the “Schedules of investments.”
12. Contractual Obligations
Each Fund enters into contracts in the normal course of business that contain a variety of indemnifications. Each Fund’s maximum exposure under these arrangements is unknown. However, the Funds have not had prior claims or losses pursuant to these contracts. Management has reviewed each Fund’s existing contracts and expects the risk of loss to be remote.
93
Notes to financial statements
Delaware International Funds
13. Recent Accounting Pronouncements
In June 2014, the FASB issued guidance to improve the financial reporting of reverse repurchase agreements and other similar transactions. The guidance includes expanded disclosure requirements for entities that enter into reverse repurchase agreements and similar transactions accounted for as secured borrowings. The guidance is effective for financial statements with fiscal years beginning on or after Dec. 15, 2014 and interim periods within those fiscal years. Management has determined that this pronouncement has no impact to the Funds’ financial statements.
In May, 2015, the FASB issued Accounting Standards Update (“ASU”) No. 2015-07 regarding “Disclosures for Investments in Certain Entities That Calculate Net Asset Value per Share”. The amendments in this update are effective for the Funds for fiscal years beginning after Dec. 15, 2015, and interim periods within those fiscal years. ASU NO. 2015-07 will eliminate the requirement to categorize investments in the fair value hierarchy if their fair value is measured at net asset value per share (or its equivalent) using the practical expedient in the FASB’s fair value measurement guidance. Management is evaluating the impact, if any, of this guidance on the Funds’ financial statement disclosures.
14. Subsequent Events
The Trust now offers five series with the launch of Delaware Macquarie Asia Select Fund on Dec. 21, 2015.
Management has determined that no other material events or transactions occurred subsequent to Nov. 30, 2015 that would require recognition or disclosure in the Funds’ financial statements.
94
Report of Independent
Registered Public Accounting Firm
To the Board of Trustees of Delaware Group® Global & International Funds
and Shareholders of Delaware Emerging Markets Fund,
Delaware Global Value Fund and Delaware International Value Equity Fund:
In our opinion, the accompanying statements of assets and liabilities, including the schedules of investments, and the related statements of operations and of changes in net assets and the financial highlights present fairly, in all material respects, the financial position of Delaware Emerging Markets Fund, Delaware Global Value Fund and Delaware International Value Equity Fund (three of the series constituting Delaware Group® Global & International Funds, hereafter collectively referred to as the “Funds”) at November 30, 2015, the results of each of their operations for the year then ended, the changes in each of their net assets for each of the two years in the period then ended and the financial highlights for each of the five years in the period then ended, in conformity with accounting principles generally accepted in the United States of America. These financial statements and financial highlights (hereafter referred to as “financial statements”) are the responsibility of the Funds’ management. Our responsibility is to express an opinion on these financial statements based on our audits. We conducted our audits of these financial statements in accordance with the standards of the Public Company Accounting Oversight Board (United States). Those standards require that we plan and perform the audit to obtain reasonable assurance about whether the financial statements are free of material misstatement. An audit includes examining, on a test basis, evidence supporting the amounts and disclosures in the financial statements, assessing the accounting principles used and significant estimates made by management, and evaluating the overall financial statement presentation. We believe that our audits, which included confirmation of securities at November 30, 2015 by correspondence with the custodian and brokers and the application of alternative auditing procedures where confirmations of security purchases had not been received, provide a reasonable basis for our opinion.
PricewaterhouseCoopers LLP
Philadelphia, Pennsylvania
January 21, 2016
95
Other Fund information (Unaudited)
Delaware International Funds
Tax Information (Unaudited)
The information set forth below is for each Fund’s fiscal year as required by federal income tax laws. Shareholders, however, must report distributions on a calendar year basis for income tax purposes, which may include distributions for portions of two fiscal years of a fund. Accordingly, the information needed by shareholders for income tax purposes will be sent to them in January of each year. Please consult your tax advisor for proper treatment of this information.
All disclosures are based on financial information available as of the date of this annual report and, accordingly is subject to change. For any and all items requiring reporting, it is the intention of each Fund to report the maximum amount permitted under the Internal Revenue Code and the regulations thereunder.
For the fiscal year ended Nov. 30, 2015, each Fund reports distributions paid during the year as follows:
| | | | | | | | | | | | | | | | | | | | | | | | | |
| | | (A) Long-Term Capital Gains Distributions (Tax Basis) | | (B) Ordinary Income Distributions* (Tax Basis) | | (C) Return of Capital Distributions (Tax Basis) | | Total
Distributions (Tax Basis) | | (D)
Qualifying Dividends1 |
| Delaware Emerging Markets Fund | | | | 64.62 | % | | | | 32.86 | % | | | | 2.52 | % | | | | 100.00 | % | | | | 0.51 | % |
| Delaware Global Value Fund | | | | — | | | | | 100.00 | % | | | | — | | | | | 100.00 | % | | | | 100.00 | % |
| Delaware International Value Equity Fund | | | | — | | | | | 100.00 | % | | | | — | | | | | 100.00 | % | | | | — | |
(A), (B), and (C) are based on a percentage of each Fund’s total distributions.
(D) is based on a percentage of each Fund’s ordinary income distributions.
1 Qualifying dividends represent dividends which qualify for the corporate dividends received deduction.
| * | For the fiscal year ended Nov. 30, 2015, certain dividends paid by each Fund may be subject to a maximum tax rate of 20%. The percentage of dividends paid by each Fund from ordinary income reported as dividend income is listed below. Complete information will be computed and reported in conjunction with your 2015 Form 1099-DIV. |
| | | | | | | | | | | | | |
Delaware Emerging Markets Fund | | Delaware Global Value Fund | | Delaware International Value Equity Fund |
| | | 100.00 | % | | | | 100.00 | % | | | | 100.00 | % |
96
Each Fund intends to pass through foreign tax credits in the maximum amount as follows:
| | | | | | | | | | | | | |
Delaware Emerging Markets Fund | | Delaware Global Value Fund | | Delaware International Value Equity Fund |
| | | $4,090,797 | | | | | $26,933 | | | | | $510,890 | |
The gross foreign source income earned during the fiscal year 2015 by each Fund was as follows:
| | | | | | | | | | | | | |
Delaware Emerging Markets Fund | | Delaware Global Value Fund | | Delaware International Value Equity Fund |
| | | $44,463,841 | | | | | $360,069 | | | | | $7,772,998 | |
97
Other Fund information (Unaudited)
Delaware International Funds
Board Consideration of Delaware Emerging Markets Fund, Delaware Global Value Fund, and Delaware International Value Equity Fund investment management agreements
At a meeting held on Aug. 18–20, 2015 (the “Annual Meeting”), the Board of Trustees (collectively referred to here as the “Board”), including a majority of disinterested or independent Trustees, approved the renewal of the Investment Advisory Agreements for Delaware Emerging Markets Fund, Delaware Global Value Fund, and Delaware International Value Equity Fund (each, a “Fund” and together, the “Funds”). In making its decision, the Board considered information furnished at regular quarterly Board meetings, including reports detailing Fund performance, investment strategies, and expenses, as well as information prepared specifically in connection with the renewal of the investment advisory and sub-advisory contracts. Information furnished specifically in connection with the renewal of the Investment Management Agreements with Delaware Management Company (“DMC”) included materials provided by DMC and its affiliates (“Delaware Investments”) concerning, among other things, the nature, extent, and quality of services provided to the Funds; the costs of such services to the Funds; economies of scale; and the investment manager’s financial condition and profitability. In addition, in connection with the Annual Meeting, reports were provided to the Trustees in May 2015 and included reports provided by Lipper, Inc., an independent statistical compilation organization (“Lipper”). The Lipper reports compared each Fund’s investment performance and expenses with those of other comparable mutual funds. The Independent Trustees reviewed and discussed the Lipper reports with independent legal counsel to the Independent Trustees. In addition to the information noted above, the Board also requested and received information regarding DMC’s policy with respect to advisory fee levels and its breakpoint philosophy; the structure of portfolio manager compensation; comparative client fee information; and any constraints or limitations on the availability of securities for certain investment styles, which had in the past year inhibited, or which were likely in the future to inhibit, the investment manager’s ability to invest fully in accordance with Fund policies.
In considering information relating to the approval of each Fund’s advisory agreement, the Independent Trustees received assistance and advice from and met separately with independent legal counsel to the Independent Trustees. They also engaged a consultant to assist them in analyzing portions of the data presented and received. The Independent Trustees reviewed and discussed with the consultant two reports prepared by the consultant with respect to such data. Although the Board gave attention to all information furnished, the following discussion identifies, under separate headings, the primary factors taken into account by the Board during its contract renewal considerations.
Nature, extent, and quality of service. The Board considered the services provided by DMC to the Funds and their shareholders. In reviewing the nature, extent, and quality of services, the Board considered reports furnished to it throughout the year, which covered matters such as the relative performance of the Funds; compliance of portfolio managers with the investment policies, strategies, and restrictions for the Funds; compliance by DMC and Delaware Distributors, L.P. (together, “Management”) personnel with the Code of Ethics adopted throughout the Delaware Investments® Family of Funds complex; and adherence to fair value pricing procedures as established by the Board. The Board was pleased with the current staffing of the Funds’ investment advisor and the emphasis placed on research in the investment process. The Board recognized DMC’s receipt of several industry distinctions during the past several years. The Board gave favorable consideration to DMC’s efforts to control expenditures while maintaining service levels committed to fund matters. The Board noted that,
98
in the third and fourth quarters of 2013, Management reduced the maximum 12b-1 fee for certain funds, and in November 2013 Management negotiated a substantial reduction in fees for fund accounting services provided to the Funds. The Board noted the benefits provided to Fund shareholders through each shareholder’s ability to exchange an investment in one Delaware Investments fund for the same class of shares in another Delaware Investments fund without a sales charge, to reinvest Fund dividends into additional shares of the Fund or into additional shares of other Delaware Investments funds, and the privilege to combine holdings in other Delaware Investments funds to obtain a reduced sales charge. The Board was satisfied with the nature, extent, and quality of the overall services provided by DMC.
Investment performance. The Board placed significant emphasis on the investment performance of the Funds in view of the importance of investment performance to shareholders. Although the Board gave appropriate consideration to performance reports and discussions with portfolio managers at Investment Committee meetings throughout the year, the Board gave particular weight to the Lipper reports furnished for the Annual Meeting. The Lipper reports prepared for each Fund showed the investment performance of its Class A shares in comparison to a group of similar funds as selected by Lipper (the “Performance Universe”). A fund with the best performance ranked first, and a fund with the poorest performance ranked last. The highest/best performing 25% of funds in the Performance Universe make up the first quartile; the next 25%, the second quartile; the next 25%, the third quartile; and the poorest/ worst performing 25% of funds in the Performance Universe make up the fourth quartile. Comparative annualized performance for each Fund was shown for the past 1-, 3-, 5-, and 10-year periods, to the extent applicable, ended March 31, 2015. The Board’s objective is that each Fund’s performance for the periods considered be at or above the median of its Performance Universe.
Delaware Emerging Markets Fund – The Performance Universe for the Fund consisted of the Fund and all retail and institutional emerging markets funds as selected by Lipper. The Lipper report comparison showed that the Fund’s total return for the 1-year period was in the fourth quartile of its Performance Universe. The report further showed that the Fund’s total return for the 3- and 10-year periods was in the second quartile of its Performance Universe and the Fund’s total return for the 5-year period was in the third quartile of its Performance Universe. In evaluating the Fund’s performance, the Board considered the Fund’s longer-term performance results, which were strong overall. On balance, the Board was satisfied with performance.
Delaware Global Value Fund – The Performance Universe for the Fund consisted of the Fund and all retail and institutional global multi-cap value funds as selected by Lipper. The Lipper report comparison showed that the Fund’s total return for the 1-year period was in the second quartile of its Performance Universe. The report further showed that the Fund’s total return for the 3-, 5-, and 10-year periods was in the third quartile of its Performance Universe. The Board observed that the Fund’s performance results were mixed. In evaluating the Fund’s performance, the Board considered the Fund’s short-term performance results, which were acceptable. On balance, the Board was satisfied with performance.
Delaware International Value Equity Fund – The Performance Universe for the Fund consisted of the Fund and all retail and institutional international multi-cap value funds as selected by Lipper. The Lipper report comparison showed that the Fund’s total return for the 1-year period was in the second quartile of its Performance Universe. The report further showed that the Fund’s total return for the 3-, 5-, and 10-year periods was in the third quartile of its Performance Universe. The Board observed that the Fund’s
99
Other Fund information (Unaudited)
Delaware International Funds
performance results were mixed. In evaluating the Fund’s performance, the Board considered the Fund’s short-term performance results, which were acceptable. On balance, the Board was satisfied with performance.
Comparative expenses. The Board considered expense comparison data for the Delaware Investments® Family of Funds. Management provided the Board with information on pricing levels and fee structures for each Fund as of its most recently completed fiscal year. The Board also focused on the comparative analysis of effective management fees and total expense ratios of each Fund versus effective management fees and expense ratios of a group of similar funds as selected by Lipper (the “Expense Group”). In reviewing comparative costs, each Fund’s contractual management fee and the actual management fee incurred by the Fund were compared with the contractual management fees (assuming all funds in the Expense Group were similar in size to the Fund) and actual management fees (as reported by each fund) within the Expense Group, taking into account any applicable breakpoints and fee waivers. Each Fund’s total expenses were also compared with those of its Expense Group. The Lipper total expenses, for comparative consistency, were shown by Lipper for Class A shares and comparative total expenses including 12b-1 and non-12b-1 service fees. The Board considered fees paid to DMC for non-management services. The Board’s objective is to limit each Fund’s total expense ratio to be competitive with that of the Expense Group.
Delaware Emerging Markets Fund – The expense comparisons for the Fund showed that its actual management fee and total expenses were in the quartile with the second highest expenses of its Expense Group. The Board noted that the Fund’s management fee and total expenses were not in line with the Board’s objective. In evaluating total expenses, the Board considered various initiatives implemented by Management, such as the negotiation of lower fees for fund accounting services, which had created an opportunity for a further reduction in expenses. The Board was satisfied with Management’s efforts to improve the Fund’s total expense ratio and to bring it in line with the Board’s objective.
Delaware Global Value Fund – The expense comparisons for the Fund showed that its actual management fee was in the quartile with the lowest expenses of its Expense Group and its total expenses were in the quartile with the second highest expenses of its Expense Group. The Board gave favorable consideration to the Fund’s management fee, but noted that the Fund’s total expenses were not in line with the Board’s objective. In evaluating total expenses, the Board considered fee waivers in place through March 30, 2016 and various initiatives implemented by Management, such as the outsourcing the negotiation of lower fees for fund accounting services, which had created an opportunity for a further reduction in expenses. The Board was satisfied with Management’s efforts to improve the Fund’s total expense ratio and to bring it in line with the Board’s objective.
Delaware International Value Equity Fund – The expense comparisons for the Fund showed that its actual management fee was in the quartile with the highest expenses of its Expense Group and its total expenses were in the quartile with the second lowest expenses of its Expense Group. The Board was satisfied with the total expenses of the Fund in comparison to those of both Expense Groups as shown in the Lipper report.
Management profitability. The Board considered the level of profits realized by DMC in connection with the operation of the Funds. In this respect, the Board reviewed the Investment Management Profitability
100
Analysis that addressed the overall profitability of DMC’s business in providing management and other services to each of the individual funds and the Delaware Investments® Family of Funds as a whole. Specific attention was given to the methodology followed in allocating costs for the purpose of determining profitability. Management stated that the level of profits of DMC, to a certain extent, reflects recent operational cost savings and efficiencies initiated by DMC. The Board considered DMC’s efforts to improve services provided to fund shareholders and to meet additional regulatory and compliance requirements resulting from recent industry-wide Securities and Exchange Commission initiatives. The Board also considered the extent to which DMC might derive ancillary benefits from fund operations, including the potential for procuring additional business as a result of the prestige and visibility associated with its role as service provider to the Delaware Investments Family of Funds and the benefits from allocation of fund brokerage to improve trading efficiencies. The Board found that the management fees were reasonable in light of the services rendered and the level of profitability of DMC.
Economies of scale. The Trustees considered whether economies of scale are realized by DMC as each Fund’s assets increase and the extent to which any economies of scale are reflected in the level of management fees charged. The Trustees reviewed the standardized advisory fee pricing and structure, approved by the Board and shareholders, which includes breakpoints, and which applies to most funds in the Delaware Investments Family of Funds complex. Breakpoints in the advisory fee occur when the advisory fee rate is reduced on assets in excess of specified levels. Breakpoints result in a lower advisory fee, than would otherwise be the case in the absence of breakpoints, when the asset levels specified in the breakpoints are exceeded. The Board noted that the fee under each Fund’s management contract fell within the standard structure. The Board also noted that Delaware Emerging Markets Fund’s assets exceeded the final breakpoint level. The Board believed that, given the extent to which economies of scale might be realized by the advisor and its affiliates, the schedule of fees under the Investment Management Agreement provides a sharing of benefits with Delaware Emerging Markets Fund and its shareholders. Although Delaware Global Value Fund and Delaware International Value Equity Fund have not reached a size at which they can take advantage of any breakpoints in the applicable fee schedule, the Board recognized that the fees were structured so that if the Funds grow, economies of scale may be shared.
101
Board of trustees / directors and officers addendum
Delaware Investments® Family of Funds
A mutual fund is governed by a Board of Trustees/Directors (“Trustees”), which has oversight responsibility for the management of a fund’s business affairs. Trustees establish procedures and oversee and review the performance of the investment manager, the distributor, and others who perform services for the fund. The independent fund trustees, in particular, are advocates
| | | | | | |
| Name, Address, | | Position(s) | | Length of | | |
| and Birth Date | | Held with Fund(s) | | Time Served | | |
Interested Trustee | | | | | | |
Shawn K. Lytle1 | | President, | | Trustee since | | |
2005 Market Street | | Chief Executive Officer, | | September 2015 | | |
Philadelphia, PA 19103 | | and Trustee | | | | |
February 1970 | | | | President and | | |
| | | | Chief Executive Officer | | |
| | | | since August 2015 | | |
| | | | | | |
| | | | | | |
Independent Trustees | | | | | | |
Thomas L. Bennett | | Chairman and Trustee | | Trustee since | | |
2005 Market Street | | | | March 2005 | | |
Philadelphia, PA 19103 | | | | | | |
October 1947 | | | | Chairman since | | |
| | | | | March 2015 | | |
Ann D. Borowiec | | Trustee | | Since March 2015 | | |
2005 Market Street | | | | | | |
Philadelphia, PA 19103 | | | | | | |
November 1958 | | | | | | |
| | | | | | |
| | | | | | |
| | | | | | | |
Joseph W. Chow | | Trustee | | Since January 2013 | | |
2005 Market Street | | | | | | |
Philadelphia, PA 19103 | | | | | | |
January 1953 | | | | | | |
| | | | | | |
| | | | | | | |
| 1 | Shawn K. Lytle is considered to be an “Interested Trustee” because he is an executive officer of the Fund’s(s’) investment advisor. |
102
for shareholder interests. Each trustee has served in that capacity since he or she was elected to or appointed to the Board of Trustees, and will continue to serve until his or her retirement or the election of a new trustee in his or her place. The following is a list of the Trustees and Officers with certain background and related information.
| | | | |
| | | Number of Portfolios in | | |
| Principal Occupation(s) | | Fund Complex Overseen | | Other Directorships |
| During the Past Five Years | | by Trustee or Officer | | Held by Trustee or Officer |
| | | | |
Shawn K. Lytle has served as | | 65 | | Trustee — UBS |
President of | | | | Relationship Funds, |
Delaware Investments2 | | | | SMA Relationship |
since June 2015 and was the | | | | Trust, and UBS Funds |
Regional Head of Americas for | | | | (May 2010–April 2015) |
UBS Global Asset | | | | |
Management from | | | | |
2010 through 2015. | | | | |
| | | | |
Private Investor | | 65 | | Director — |
(March 2004–Present) | | | | Bryn Mawr Bank Corp. (BMTC) |
| | | | (2007–2011) |
| | | | |
| | | | | |
Chief Executive Officer | | 65 | | None |
Private Wealth Management | | | | |
(2011–2013) and | | | | |
Market Manager, | | | | |
New Jersey Private | | | | |
Bank (2005–2011) — | | | | |
J.P. Morgan Chase & Co. | | | | |
Executive Vice President | | 65 | | Director and Audit Committee |
(Emerging Economies | | | | Member — Hercules |
Strategies, Risks, and | | | | Technology Growth |
Corporate Administration) | | | | Capital, Inc. |
State Street Corporation | | | | (2004–2014) |
(July 2004–March 2011) | | | | |
| 2 | Delaware Investments is the marketing name for Delaware Management Holdings, Inc. and its subsidiaries, including the Fund’s(s’) investment advisor, principal underwriter, and its transfer agent. |
103
Board of trustees / directors and officers addendum
Delaware Investments® Family of Funds
| | | | |
| Name, Address, | | Position(s) | | Length of |
| and Birth Date | | Held with Fund(s) | | Time Served |
Independent Trustees (continued) | | | | |
John A. Fry | | Trustee | | Since January 2001 |
2005 Market Street | | | | |
Philadelphia, PA 19103 | | | | |
May 1960 | | | | |
| | | | |
| | | | |
| | | | |
| | | | |
| | | | |
| | | | |
| | | | | |
Lucinda S. Landreth | | Trustee | | Since March 2005 |
2005 Market Street | | | | |
Philadelphia, PA 19103 | | | | |
June 1947 | | | | |
Frances A. Sevilla-Sacasa | | Trustee | | Since September 2011 |
2005 Market Street | | | | |
Philadelphia, PA 19103 | | | | |
January 1956 | | | | |
| | | | |
| | | | |
| | | | |
| | | | |
| | | | |
| | | | |
| | | | |
| | | | |
| | | | |
| | | | |
| | | | |
| | | | |
| | | | | |
104
| | | | |
| | | Number of Portfolios in | | |
| Principal Occupation(s) | | Fund Complex Overseen | | Other Directorships |
| During the Past Five Years | | by Trustee or Officer | | Held by Trustee or Officer |
| | | | |
President — | | 65 | | Director — Hershey Trust |
Drexel University | | | | Company |
(August 2010–Present) | | | | |
| | | | Director, Audit Committee, |
President — | | | | and Governance Committee |
Franklin & Marshall College | | | | Member — Community |
(July 2002–July 2010) | | | | Health Systems |
| | | | |
| | | | Director — Drexel |
| | | | Morgan & Co. |
| | | | | |
Private Investor | | 65 | | None |
(2004–Present) | | | | |
| | | | |
| | | | | |
Chief Executive Officer — | | 65 | | Trust Manager and |
Banco Itaú | | | | Audit Committee |
International | | | | Member — Camden |
(April 2012–Present) | | | | Property Trust |
| | | | |
Executive Advisor to Dean | | | | |
(August 2011–March 2012) and Interim Dean | | | | |
(January 2011–July 2011) — | | | | |
University of Miami School of | | | | |
Business Administration | | | | |
| | | | |
President — U.S. Trust, | | | | |
Bank of America Private | | | | |
Wealth Management | | | | |
(Private Banking) | | | | |
(July 2007–December 2008) | | | | |
105
Board of trustees / directors and officers addendum
Delaware Investments® Family of Funds
| | | | |
| Name, Address, | | Position(s) | | Length of |
| and Birth Date | | Held with Fund(s) | | Time Served |
Independent Trustees (continued) | | | | |
Thomas K. Whitford | | Trustee | | Since January 2013 |
2005 Market Street | | | | |
Philadelphia, PA 19103 | | | | |
March 1956 | | | | |
| | | | |
| | | | |
| | | | |
| | | | |
| | | | |
| | | | | |
Janet L. Yeomans | | Trustee | | Since April 1999 |
2005 Market Street | | | | |
Philadelphia, PA 19103 | | | | |
July 1948 | | | | |
| | | | |
| | | | |
| | | | |
| | | | |
| | | | |
| | | | |
| | | | | |
106
| | | | |
| | | Number of Portfolios in | | |
| Principal Occupation(s) | | Fund Complex Overseen | | Other Directorships |
| During the Past Five Years | | by Trustee or Officer | | Held by Trustee or Officer |
| | | | |
Vice Chairman | | 65 | | Director — HSBC Finance |
(2010–April 2013), | | | | Corporation and HSBC |
Chief Administrative | | | | North America Holdings Inc. |
Officer (2008–2010), and Executive Vice | | | | Director — |
President and Chief | | | | HSBC Bank |
Administrative Officer | | | | |
(2007–2009) — | | | | |
PNC Financial | | | | |
Services Group | | | | |
Vice President and Treasurer | | 65 | | Director, Audit and |
(January 2006–July 2012) | | | | Compliance Committee Chair, |
Vice President — | | | | Investment Committee |
Mergers & Acquisitions | | | | Member, and Governance |
(January 2003–January 2006), | | | | Committee Member — |
and Vice President | | | | Okabena Company |
and Treasurer | | | | |
(July 1995–January 2003) | | | | Chair — 3M |
3M Corporation | | | | Investment Management |
| | | | Company |
| | | | | (2005–2012) |
107
Board of trustees / directors and officers addendum
Delaware Investments® Family of Funds
| | | | |
| Name, Address, | | Position(s) | | Length of |
| and Birth Date | | Held with Fund(s) | | Time Served |
Officers | | | | |
David F. Connor | | Senior Vice President, | | Senior Vice President |
2005 Market Street | | General Counsel, | | since May 2013; |
Philadelphia, PA 19103 | | and Secretary | | General Counsel |
December 1963 | | | | since May 2015; |
| | | | Secretary since |
| | | | October 2005 |
| | | | |
| | | | |
| | | | |
| | | | | |
Daniel V. Geatens | | Vice President | | Treasurer since October 2007 |
2005 Market Street | | and Treasurer | | |
Philadelphia, PA 19103 | | | | |
October 1972 | | | | |
| | | | |
| | | | |
| | | | | |
Richard Salus | | Senior Vice President | | Chief Financial Officer |
2005 Market Street | | and Chief Financial Officer | | since November 2006 |
Philadelphia, PA 19103 | | | | |
October 1963 | | | | |
| | | | | |
The Statement of Additional Information for the Fund(s) includes additional information about the Trustees and Officers and is available, without charge, upon request by calling 800 523-1918.
108
| | | | |
| | | Number of Portfolios in | | |
| Principal Occupation(s) | | Fund Complex Overseen | | Other Directorships |
| During the Past Five Years | | by Trustee or Officer | | Held by Trustee or Officer |
| | | | |
David F. Connor has served as | | 65 | | None3 |
Senior Vice President of the Fund(s) and the investment advisor since 2013, General Counsel of the Fund(s) and the investment advisor since 2015, and Secretary of the Fund(s) and the investment advisor since 2005. | | | | |
Daniel V. Geatens has served | | 65 | | None3 |
as Vice President and | | | | |
Treasurer of the Fund(s) since 2007 and Vice President and Director of Financial | | | | |
Administration of the investment advisor since 2010. | | | | |
Richard Salus has served as | | 65 | | None3 |
Senior Vice President and Chief Financial Officer of the Fund(s) and the investment advisor since 2006. | | | | |
| 3 | David F. Connor, Daniel V. Geatens, and Richard Salus serve in similar capacities for the six portfolios of the Optimum Fund Trust, which have the same investment advisor, principal underwriter, and transfer agent as the registrant. |
109
About the organization
| | | | | | |
Board of trustees | | | | | | |
Shawn K. Lytle President and | | Ann D. Borowiec Former Chief Executive | | John A. Fry President | | Frances A. Sevilla-Sacasa |
| Chief Executive Officer | | Officer | | Drexel University | | Chief Executive Officer |
| Delaware Investment® | | Private Wealth Management | | Philadelphia, PA | | Banco Itaú |
Family of Funds Philadelphia, PA | | J.P. Morgan Chase & Co. New York, NY | | Lucinda S. Landreth Former Chief Investment | | International Miami, FL |
| Thomas L. Bennett | | Joseph W. Chow Former Executive Vice President State Street Corporation Boston, MA | | Officer | | Thomas K. Whitford |
| Chairman of the Board | | | Assurant, Inc. | | Former Vice Chairman |
| Delaware Investment | | | New York, NY | | PNC Financial Services Group |
| Family of Funds | | | | | Pittsburgh, PA |
| Private Investor | | | | | |
| Rosemont, PA | | | | | Janet L. Yeomans |
| | | | | | Former Vice President and |
| | | | | | Treasurer |
| | | | | | 3M Corporation |
| | | | | | St. Paul, MN |
Affiliated officers
| | | | | | |
| David F. Connor | | Daniel V. Geatens | | Richard Salus | | |
| Senior Vice President, | | Vice President and | | Senior Vice President and | | |
| General Counsel, | | Treasurer | | Chief Financial Officer | | |
| and Secretary | | Delaware Investments | | Delaware Investments | | |
| Delaware Investments | | Family of Funds | | Family of Funds | | |
| Family of Funds | | Philadelphia, PA | | Philadelphia, PA | | |
| Philadelphia, PA | | | | | | |
This annual report is for the information of Delaware Emerging Markets Fund, Delaware Global Value Fund, and Delaware International Value Equity Fund shareholders, but it may be used with prospective investors when preceded or accompanied by the Delaware Investments Fund fact sheet for the most recently completed calendar quarter. These documents are available at delawareinvestments.com.
Delaware Investments is the marketing name of Delaware Management Holdings, Inc. and its subsidiaries.
Each Fund files its complete schedule of portfolio holdings with the Securities and Exchange Commission (SEC) for the first and third quarters of each fiscal year on Form N-Q. Each Fund’s Forms N-Q, as well as a description of the policies and procedures that the Funds use to determine how to vote proxies (if any) relating to portfolio securities are available without charge (i) upon request, by calling 800 523-1918; and (ii) on the SEC’s website at sec.gov. In addition, a description of the policies and procedures that the Funds use to determine how to vote proxies (if any) relating to portfolio securities and the Schedules of Investments included in the Funds’ most recent Forms N-Q are available without charge on the Funds’ website at delawareinvestments.com. Each Fund’s Forms N-Q may be reviewed and copied at the SEC’s Public Reference Room in Washington, D.C.; information on the operation of the Public Reference Room may be obtained by calling 800 SEC-0330.
Information (if any) regarding how the Funds voted proxies relating to portfolio securities during the most recently disclosed 12-month period ended June 30 is available without charge (i) through the Funds’ website at delawareinvestments.com; and (ii) on the SEC’s website at sec.gov.
110

Annual report
Global / international equity mutual fund
Delaware Focus Global Growth Fund
November 30, 2015
Carefully consider the Fund’s investment objectives, risk factors, charges, and expenses before investing. This and other information can be found in the Fund’s prospectus and its summary prospectus, which may be obtained by visiting delawareinvestments.com or calling 800 523-1918. Investors should read the prospectus and the summary prospectus carefully before investing.
You can obtain shareholder reports and prospectuses online instead of in the mail.
Visit delawareinvestments.com/edelivery.
Experience Delaware Investments
Delaware Investments is committed to the pursuit of consistently superior asset management and unparalleled client service. We believe in our investment processes, which seek to deliver consistent results, and in convenient services that help add value for our clients.
If you are interested in learning more about creating an investment plan, contact your financial advisor.
You can learn more about Delaware Investments or obtain a prospectus for Delaware Focus Global Growth Fund at delawareinvestments.com.
Manage your investments online
| ● | | 24-hour access to your account information |
| ● | | Check your account balance and recent transactions |
| ● | | Request statements or literature |
| ● | | Make purchases and redemptions |
Delaware Management Holdings, Inc. and its subsidiaries (collectively known by the marketing name of Delaware Investments) are wholly owned subsidiaries of Macquarie Group Limited, a global provider of banking, financial, advisory, investment and funds management services.
Neither Delaware Investments nor its affiliates noted in this document are authorized deposit-taking institutions for the purpose of the Banking Act 1959 (Commonwealth of Australia). The obligations of these entities do not represent deposits or other liabilities of Macquarie Bank Limited ( MBL). MBL does not guarantee or otherwise provide assurance in respect of the obligations of these entities, unless noted otherwise.
Unless otherwise noted, views expressed herein are current as of Nov. 30, 2015, and subject to change for events occurring after such date.
Funds are not FDIC insured and are not guaranteed. It is possible to lose the principal amount invested.
Mutual fund advisory services provided by Delaware Management Company, a series of Delaware Management Business Trust, which is a registered investment advisor. Delaware Investments, a member of Macquarie Group, refers to Delaware Management Holdings, Inc. and its subsidiaries, including the Fund’s distributor, Delaware Distributors, L.P. Macquarie Group refers to Macquarie Group Limited and its subsidiaries and affiliates worldwide.
© 2016 Delaware Management Holdings, Inc.
All third-party marks cited are the property of their respective owners.
| | | | |
| Portfolio management review | |
| Delaware Focus Global Growth Fund | | | December 8, 2015 | |
| | | | | | | | |
| Performance preview (for the year ended November 30, 2015) | | | | | | |
Delaware Focus Global Growth Fund (Class A shares) | | | 1-year return | | | | -1.02% | |
MSCI World Index (gross) | | | 1-year return | | | | -0.17% | |
MSCI World Index (net) | | | 1-year return | | | | -0.73% | |
Past performance does not guarantee future results.
For complete, annualized performance for Delaware Focus Global Growth Fund, please see the table on page 4. The performance of Class A shares excludes the applicable sales charge and reflects the reinvestment of all distributions. Please see page 6 for a description of the index.
Index performance returns do not reflect any management fees, transaction costs, or expenses. Indices are unmanaged and one cannot invest directly in an index.
Jackson Square Partners, LLC (JSP), a U.S. registered investment advisor, is the sub-advisor to the Fund. As sub-advisor, JSP is responsible for day-to-day management of the Fund’s assets. Although JSP serves as sub-advisor, the investment manager, Delaware Management Company, a series of Delaware Management Business Trust, has ultimate responsibility for all investment advisory services.
It was a turbulent year for global markets as many economies were hindered by several large-scale events. The Chinese economy — which seemingly surpassed the United States as the world’s largest in December 2014 — sputtered in late summer 2015, setting off an economic domino effect across the globe. At the same time, global economies were rocked by precipitously dropping oil prices. That put more cash in consumer pockets but reduced oil-related profits, particularly among non – Organization of the Petroleum Exporting Countries (OPEC) producers. There was also the uncertainty of future economic policy moves by several of the world’s largest economies, including the U.S., the European Union (EU), and Japan.
In a bid to drive down competition from U.S. shale oil producers, OPEC nations significantly raised production. The subsequent increase in the world’s oil reserves helped push crude oil prices down to less than $40 a barrel, the lowest trading price seen since 2003. As prices continued to fall, OPEC continued to pump, pushing prices at fiscal
year end to a level that may not be sustainable for U.S. drilling operations over the long term.
Still, depressed oil prices seemed to come with one positive side effect, as lower fuel costs put extra cash in the pockets of both U.S. and euro-zone consumers. The increased spending that resulted helped drive the EU’s economy. Whether or not the European Central Bank continues the quantitative easing program initiated in March remains an issue. Further, the euro remains depressed, largely affected by the effort to relieve Greece’s debt crisis through a series of bailouts.
The global economy generally treaded water for the 12-month period, as measured by the -0.73% decline of the MSCI World Index. Still, some areas were substantially worse off. Emerging-market stock markets experienced a drop of nearly 17% (as measured by the MSCI Emerging Markets Index), precipitated mainly by China’s woes. In mid-August, the Chinese government surprised investors by devaluing its currency by roughly 2% relative to the U.S. dollar, a move that triggered the yuan’s largest one-day drop in more than two decades. As the cost of Chinese goods fell in foreign markets, fears about the stability of other Asian nations rose.
Japan led the global indices for the period, as gradual progress in economic indicators remained largely intact. However, as concerns about slowing growth in China (and more broadly across Asia) grew in prominence in the third quarter,
1
Portfolio management review
Delaware Focus Global Growth Fund
Japan’s relatively greater exposure to the region became manifest in both relative equity market underperformance and heightened volatility.
The United Kingdom’s floating currency remained relatively strong, which kept the cost of imports down and inflation at a level that may have been a little too low. Growth of the U.K.’s gross domestic product (GDP) has been both slow and steady, bringing the nation’s economy above its pre-recession level.
Although the U.S. economy saw modest gains for the fiscal year (the S&P 500® Index rose nearly 3%), it wasn’t immune from global events and spent the last three months of the fiscal year in recovery mode. The U.S. Federal Reserve pushed back its plan to tighten fiscal policy, indicating a desire to wait until developments overseas and at home were on the mend. Recent improvements in domestic job gains, consumer spending, and construction manufacturing led markets to anticipate that the Fed might begin to raise rates for the first time since 2006.
Within the Fund
For the fiscal year ended Nov. 30, 2015, Delaware Focus Global Growth Fund returned -1.02% at net asset value and -6.70% at maximum offer price (both figures represent Class A shares with all distributions reinvested). For the same period, the Fund’s benchmark, the MSCI World Index (net), returned -0.73%. Complete annualized performance for Delaware Focus Global Growth Fund is shown in the table on page 4.
The Fund lagged the benchmark primarily due to weak relative performance in the consumer discretionary and industrials sectors. It’s worth noting that the Fund experienced strong relative performance in the financials and energy sectors.
Start Today, a Japanese company that operates e-commerce shopping and fashion-related websites, contributed to performance during the period. The company reported relatively strong
financial results driven, in part, by its progress toward adapting its e-commerce platform for wireless devices (smartphones and tablets). While increased capital expenditures into this segment could decrease margins in the short-term, we believe it could lead to increased growth potential long term if strong secular demand for wireless and streaming technologies within the region continues. Additionally, the company’s consignment business has expanded, which we believe may have the potential to be a significant driver of future growth.
Equinix, a company that connects businesses with partners and customers around the world through a global platform of data centers, was also a contributor to performance during the period. The company reported relatively strong financial results and increased its 2015 outlook. Additionally, the company is pursuing several strategic acquisitions that, if completed, should further strengthen its global presence. The company continued to benefit from opportunities associated with cloud computing and its disruption of the information technology supply chain. We believe increased globalization and a continued need for a secure and accessible network to meet the needs of a dispersed user base appeared to create significant demand for a company like Equinix. We believe the company’s innovative product offerings make it likely well-positioned in a technology-spending environment that is focused on addressing the needs of enterprises struggling to maintain the highest level of network performance and quality of service for global users.
Qualcomm was a detractor from performance during the period. The stock experienced weakness amid concern that increased competition would lead to more pricing pressure. Additionally, there are issues within its patent-licensing business segment. We believe these
2
issues are transitory and do not threaten our long-term thesis on the company. A positive development was a settlement of the anti-monopoly suit with the Chinese government that had added to downward pressure on the stock. We believe that Qualcomm appears likely to continue to benefit from its unique intellectual property and patent position in the semiconductor industry and its technology applications targeted at wireless devices. Further, we believe that new management at the company appears more willing than its predecessors to consider meaningful capital allocation actions that may have the potential to create significant value for shareholders.
Valeant Pharmaceuticals International detracted from performance during the period. The company was hit hard by allegations of wrongdoing at its specialty pharmacy partner, Philidor. Investors’ lack of familiarity with this relationship left the stock vulnerable when questions were raised, and a short seller’s analogy
to Enron put incremental pressure on the stock and raised investor scrutiny. Our best assessment at this point is that Philidor appears to be a relatively small part of Valeant’s total business. Further, third-quarter cash generation was positive and if sustained would indicate the company is what we thought it was — a business with cash-generating potential and solid medium-term growth prospects. It is now trading at a very high free-cash-flow yield on our 2016 projections, despite our having applied a haircut to those projections. Considering both risk and reward potential, as well as the remaining unknowns, we believe we have the stock appropriately weighted.
Regardless of the economic outcome, we remain consistent in our long-term investment philosophy: We want to own what we view as strong secular-growth companies with solid business models and competitive positions that we believe can grow market share and have the potential to deliver shareholder value in a variety of market environments.
3
Performance summary
| | |
| Delaware Focus Global Growth Fund | | November 30, 2015 |
The performance data quoted represent past performance; past performance does not guarantee future results. Investment return and principal value will fluctuate so your shares, when redeemed, may be worth more or less than their original cost. Please obtain the performance data current for the most recent month end by calling 800 523-1918 or visiting our website at delawareinvestments.com/performance. Current performance may be lower or higher than the performance data quoted.
| | | | | | | | | | | | |
| Fund and benchmark performance1,2 | | Average annual total returns through November 30, 2015 | |
| | | 1 year | | | 5 years | | | Lifetime | |
Class A (Est. Dec. 29, 2008) | | | | | | | | | | | | |
Excluding sales charge | | | -1.02% | | | | +8.87% | | | | +15.57% | |
Including sales charge | | | -6.70% | | | | +7.59% | | | | +14.58% | |
Class C (Est. Dec. 29, 2010) | | | | | | | | | | | | |
Excluding sales charge | | | -1.75% | | | | n/a | | | | +6.92% | |
Including sales charge | | | -2.73% | | | | n/a | | | | +6.92% | |
Class R (Est. Dec. 29, 2010) | | | | | | | | | | | | |
Excluding sales charge | | | -1.27% | | | | n/a | | | | +7.44% | |
Including sales charge | | | -1.27% | | | | n/a | | | | +7.44% | |
Institutional Class (Est. Dec. 29, 2008) | | | | | | | | | | | | |
Excluding sales charge | | | -0.77% | | | | +9.14% | | | | +15.78% | |
Including sales charge | | | -0.77% | | | | +9.14% | | | | +15.78% | |
MSCI World Index (gross)* | | | -0.17% | | | | +10.13% | | | | +12.20% | |
MSCI World Index (net)* | | | -0.73% | | | | +9.52% | | | | +11.57% | |
*The benchmark lifetime return is for Class A share comparison only and is calculated using the last business day in the month of the Fund’s Class A inception date.
1 Returns reflect the reinvestment of all distributions and are presented both with and without the applicable sales charges described below. Returns do not reflect the deduction of taxes the shareholder would pay on Fund distributions or redemptions of Fund shares.
Expense limitations were in effect for certain classes during some or all of the periods shown in the “Fund and benchmark performance” table. Expenses for each class are listed on the “Fund expense ratios” table on page 5. Performance would have been lower had expense limitations not been in effect.
Class A shares are sold with a maximum front-end sales charge of 5.75%, and have an annual distribution and service fee of 0.25% of average daily net assets. Performance for Class A shares,
excluding sales charges, assumes that no front-end sales charge applied.
Class C shares are sold with a contingent deferred sales charge of 1.00% if redeemed during the first 12 months. They are also subject to an annual distribution and service fee of 1.00% of average daily net assets. Performance for Class C shares, excluding sales charges, assumes either that contingent deferred sales charges did not apply or that the investment was not redeemed.
Class R shares are available only for certain retirement plan products. They are sold without a sales charge and have an annual distribution and service fee of 0.50% of average daily net assets.
4
Institutional Class shares are available without sales or asset-based distribution charges only to certain eligible institutional accounts.
International investments entail risks not ordinarily associated with U.S. investments including fluctuation in currency values, differences in accounting principles, or economic or political instability in other nations.
Investing in emerging markets can be riskier than investing in established foreign markets due to increased volatility and lower trading volume.
Investments in small and/or medium-sized companies typically exhibit greater risk and higher volatility than larger, more established companies.
2 The Fund’s expense ratios, as described in the most recent prospectus, are disclosed in the following “Fund expense ratios” table. Delaware Management Company has agreed to reimburse certain expenses and/or waive certain fees in order to prevent total fund operating expenses (excluding any 12b-1 fees, taxes, interest, short sale and dividend interest expenses, brokerage fees, certain insurance costs, acquired fund fees and expenses, and nonroutine expenses or costs, including, but not limited to, those relating to reorganizations, litigation, conducting shareholder meetings, and liquidations (collectively, nonroutine expenses)) from exceeding 1.30% of the Fund’s average daily net assets during the period from Dec. 1, 2014, through Nov. 30, 2015.* Please see the most recent prospectus and any applicable supplement(s) for additional information on these fee waivers and/or reimbursements.
| | | | | | | | |
| Fund expense ratios | | Class A | | Class C | | Class R | | Institutional Class |
Total annual operating expenses | | 1.40% | | 2.15% | | 1.65% | | 1.15% |
(without fee waivers) | | | | | | | | |
Net expenses | | 1.40% | | 2.15% | | 1.65% | | 1.15% |
(including fee waivers, if any) | | | | | | | | |
Type of waiver | | Contractual | | Contractual | | Contractual | | Contractual |
* The contractual waiver period is from March 28, 2014 through March 30, 2016.
5
Performance summary
Delaware Focus Global Growth Fund
Performance of a $10,000 investment1
Average annual total returns from Dec. 29, 2008 (Fund’s inception), through Nov. 30, 2015
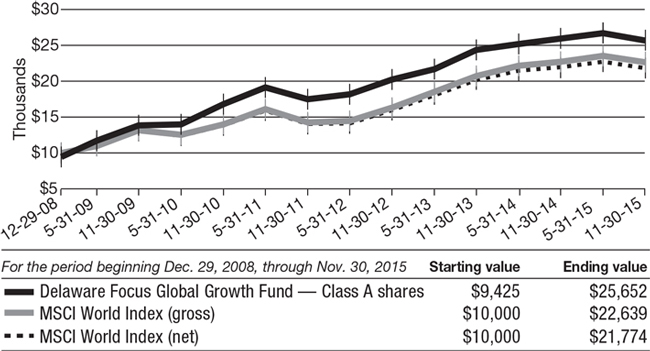
1 The “Performance of a $10,000 investment” graph assumes $10,000 invested in Class A shares of the Fund on Dec. 29, 2008, and includes the effect of a 5.75% front-end sales charge and the reinvestment of all distributions. The graph does not reflect the deduction of taxes the shareholders would pay on Fund distributions or redemptions of Fund shares. Expense limitations were in effect for some or all of the periods shown. Performance would have been lower had expense limitations not been in effect. Expenses are listed in the “Fund expense ratios” table on page 5. Please note additional details on pages 4 through 7.
The graph also assumes $10,000 invested in the MSCI World Index as of Dec. 29, 2008. The MSCI World Index is a free float-adjusted market capitalization weighted index designed to measure equity market performance across developed markets worldwide. Index “gross” return approximates the maximum possible dividend reinvestment. Index “net” return approximates the
minimum possible dividend reinvestment, after deduction of withholding tax at the highest possible rate.
The MSCI Emerging Markets Index, mentioned on page 1, is a free float-adjusted market capitalization index designed to measure equity market performance across emerging market countries worldwide. Index “net” return approximates the minimum possible dividend reinvestment, after deduction of withholding tax at the highest possible rate.
The S&P 500 Index, mentioned on page 2, measures the performance of 500 mostly large-cap stocks weighted by market value, and is often used to represent performance of the U.S. stock market.
Index performance returns do not reflect any management fees, transaction costs, or expenses. Indices are unmanaged and one cannot invest directly in an index. Past performance is not a guarantee of future results.
6
Performance of other Fund classes will vary due to
different charges and expenses.
| | | | | | |
| | | Nasdaq symbols | | CUSIPs | | |
| Class A | | DGGAX | | 246118541 | | |
| Class C | | DGGCX | | 246118533 | | |
| Class R | | DGGRX | | 246118525 | | |
Institutional Class | | DGGIX | | 246118517 | | |
7
Disclosure of Fund expenses
For the six-month period from June 1, 2015 to November 30, 2015 (Unaudited)
As a shareholder of the Fund, you incur two types of costs: (1) transaction costs, including sales charges (loads) on purchase payments, reinvested dividends, or other distributions; redemption fees; and exchange fees; and (2) ongoing costs, including management fees; distribution and/or service (12b-1) fees; and other Fund expenses. This example is intended to help you understand your ongoing costs (in dollars) of investing in the Fund and to compare these costs with the ongoing costs of investing in other mutual funds.
The example is based on an investment of $1,000 invested at the beginning of the period and held for the entire six-month period from June 1, 2015 to Nov. 30, 2015.
Actual expenses
The first section of the table shown, “Actual Fund return,” provides information about actual account values and actual expenses. You may use the information in this section of the table, together with the amount you invested, to estimate the expenses that you paid over the period. Simply divide your account value by $1,000 (for example, an $8,600 account value divided by $1,000 = 8.6), then multiply the result by the number in the first section under the heading entitled “Expenses Paid During Period” to estimate the expenses you paid on your account during this period.
Hypothetical example for comparison purposes
The second section of the table shown, “Hypothetical 5% return,” provides information about hypothetical account values and hypothetical expenses based on the Fund’s actual expense ratio and an assumed rate of return of 5% per year before expenses, which is not the Fund’s actual return. The hypothetical account values and expenses may not be used to estimate the actual ending account balance or expenses you paid for the period. You may use this information to compare the ongoing costs of investing in the Fund and other funds. To do so, compare this 5% hypothetical example with the 5% hypothetical examples that appear in the shareholder reports of the other funds.
Please note that the expenses shown in the table are meant to highlight your ongoing costs only and do not reflect any transactional costs, such as sales charges (loads), redemption fees, or exchange fees. Therefore, the second section of the table is useful in comparing ongoing costs only, and will not help you determine the relative total costs of owning different funds. In addition, if these transactional costs were included, your costs would have been higher. The expenses shown in the table assume reinvestment of all dividends and distributions.
8
Delaware Focus Global Growth Fund
Expense analysis of an investment of $1,000
| | | | | | | | | | | | | | | | | | | | |
| | | Beginning Account Value 6/1/15 | | Ending Account Value 11/30/15 | | Annualized Expense Ratio | | Expenses Paid During Period 6/1/15 to 11/30/15* |
Actual Fund return† | | | | | | | | | | | | | | | | | | | | |
Class A | | | | $1,000.00 | | | | | $962.50 | | | | | 1.47% | | | | | $7.23 | |
Class C | | | | 1,000.00 | | | | | 958.90 | | | | | 2.22% | | | | | 10.90 | |
Class R | | | | 1,000.00 | | | | | 961.20 | | | | | 1.72% | | | | | 8.46 | |
Institutional Class | | | | 1,000.00 | | | | | 963.80 | | | | | 1.22% | | | | | 6.01 | |
Hypothetical 5% return (5% return before expenses) | | | | | | | | | | | |
Class A | | | | $1,000.00 | | | | | $1,017.70 | | | | | 1.47% | | | | | $7.43 | |
Class C | | | | 1,000.00 | | | | | 1,013.94 | | | | | 2.22% | | | | | 11.21 | |
Class R | | | | 1,000.00 | | | | | 1,016.45 | | | | | 1.72% | | | | | 8.69 | |
Institutional Class | | | | 1,000.00 | | | | | 1,018.95 | | | | | 1.22% | | | | | 6.17 | |
| * | “Expenses Paid During Period” are equal to the Fund’s annualized expense ratio, multiplied by the average account value over the period, multiplied by 183/365 (to reflect the one-half year period). |
| † | Because actual returns reflect only the most recent six-month period, the returns shown may differ significantly from fiscal year returns. |
9
| | | | |
| Security type / country and sector allocations | |
| |
| Delaware Focus Global Growth Fund | | | As of November 30, 2015 (Unaudited) | |
Sector designations may be different than the sector designations presented in other Fund materials. The sector designations may represent the investment manager’s internal sector classifications, which may result in the sector designations for one fund being different than another fund’s sector designations.
| | | | | |
Security type / country | | Percentage of net assets |
Common Stock by Country | | | | 99.14% | |
Brazil | | | | 1.84% | |
China/Hong Kong | | | | 6.42% | |
Denmark | | | | 3.78% | |
India | | | | 2.63% | |
Ireland | | | | 3.47% | |
Japan | | | | 5.96% | |
Mexico | | | | 2.24% | |
Netherlands | | | | 5.80% | |
Spain | | | | 5.03% | |
Taiwan | | | | 2.57% | |
United Kingdom | | | | 5.57% | |
United States | | | | 53.83% | |
Short-Term Investments | | | | 2.14% | |
Total Value of Securities | | | | 101.28% | |
Liabilities Net of Receivables and Other Assets | | | | (1.28%) | |
Total Net Assets | | | | 100.00% | |
10
| | |
Common stock by sector² | | Percentage of net assets |
Consumer Discretionary | | 15.59% |
Consumer Staples | | 2.05% |
Energy | | 2.23% |
Financials | | 2.97% |
Healthcare | | 17.28% |
Industrials | | 8.39% |
Information Technology* | | 46.57% |
Technology | | 4.06% |
Total | | 99.14% |
| | |
| ² | | Narrow industries are utilized for compliance purposes for diversification whereas broad sectors are used for financial reporting. |
| |
| * | | To monitor compliance with the Fund’s concentration guidelines as described in the Fund’s Prospectus and Statement of Additional Information, the Information Technology sector (as disclosed herein for financial reporting purposes) is divided into various sub-categories or “industries” – in this case, commercial services, computers, diversified financial services, Internet, machinery, semiconductors, and software. As of Nov. 30, 2015, such amounts, as a percentage of total net assets, were 2.28%, 2.47%, 7.05%, 14.96%, 3.08%, 9.72%, and 7.02%, respectively. The percentage in any such single industry will comply with the Fund’s concentration policy even if the percentage in the “Information Technology sector” for financial reporting purposes may exceed 25%. |
11
| | |
| Schedule of investments |
| |
| Delaware Focus Global Growth Fund | | November 30, 2015 |
| | | | | | | | |
| | | Number of shares | | | Value (U.S. $) | |
| |
Common Stock – 99.14%D | | | | | | | | |
| |
Brazil – 1.84% | | | | | | | | |
Localiza Rent a Car | | | 339,748 | | | $ | 2,333,610 | |
| | | | | | | | |
| | | | | | | 2,333,610 | |
| | | | | | | | |
China/Hong Kong – 6.42% | | | | | | | | |
Baidu ADR † | | | 25,931 | | | | 5,652,180 | |
Tencent Holdings | | | 124,589 | | | | 2,479,391 | |
| | | | | | | | |
| | | | | | | 8,131,571 | |
| | | | | | | | |
Denmark – 3.78% | | | | | | | | |
Novo Nordisk Class B | | | 86,804 | | | | 4,782,014 | |
| | | | | | | | |
| | | | | | | 4,782,014 | |
| | | | | | | | |
India – 2.63% | | | | | | | | |
Zee Entertainment Enterprises | | | 542,325 | | | | 3,329,752 | |
| | | | | | | | |
| | | | | | | 3,329,752 | |
| | | | | | | | |
Ireland – 3.47% | | | | | | | | |
Experian | | | 237,138 | | | | 4,396,852 | |
| | | | | | | | |
| | | | | | | 4,396,852 | |
| | | | | | | | |
Japan – 5.96% | | | | | | | | |
Kakaku.com | | | 183,926 | | | | 3,508,333 | |
Start Today | | | 116,278 | | | | 4,038,250 | |
| | | | | | | | |
| | | | | | | 7,546,583 | |
| | | | | | | | |
Mexico – 2.24% | | | | | | | | |
Grupo Televisa ADR | | | 100,475 | | | | 2,833,395 | |
| | | | | | | | |
| | | | | | | 2,833,395 | |
| | | | | | | | |
Netherlands – 5.80% | | | | | | | | |
Core Laboratories | | | 23,887 | | | | 2,822,249 | |
NXP Semiconductor † | | | 48,420 | | | | 4,525,333 | |
| | | | | | | | |
| | | | | | | 7,347,582 | |
| | | | | | | | |
Spain – 5.03% | | | | | | | | |
Amadeus IT Holding | | | 80,546 | | | | 3,230,855 | |
Grifols | | | 66,065 | | | | 3,135,460 | |
| | | | | | | | |
| | | | | | | 6,366,315 | |
| | | | | | | | |
Taiwan – 2.57% | | | | | | | | |
Taiwan Semiconductor Manufacturing ADR | | | 142,775 | | | | 3,249,559 | |
| | | | | | | | |
| | | | | | | 3,249,559 | |
| | | | | | | | |
United Kingdom – 5.57% | | | | | | | | |
InterContinental Hotels Group | | | 82,190 | | | | 3,164,189 | |
Intertek Group | | | 91,326 | | | | 3,888,686 | |
| | | | | | | | |
| | | | | | | 7,052,875 | |
| | | | | | | | |
United States – 53.83% | | | | | | | | |
Allergan | | | 13,173 | | | | 4,134,873 | |
Alphabet Class A † | | | 3,423 | | | | 2,611,236 | |
Alphabet Class C † | | | 3,407 | | | | 2,530,038 | |
12
| | | | | | | | |
| | | Number of shares | | | Value (U.S. $) | |
| |
Common StockD (continued) | | | | | | | | |
| |
United States (continued) | | | | | | | | |
Biogen † | | | 10,014 | | | $ | 2,872,616 | |
Celgene † | | | 44,775 | | | | 4,900,624 | |
Discovery Communications Class C † | | | 67,075 | | | | 1,984,079 | |
eBay † | | | 117,520 | | | | 3,477,417 | |
Equinix | | | 12,916 | | | | 3,829,649 | |
Intercontinental Exchange | | | 14,485 | | | | 3,763,782 | |
Intuit | | | 25,725 | | | | 2,577,645 | |
MasterCard Class A | | | 43,825 | | | | 4,291,344 | |
Microsoft | | | 56,692 | | | | 3,081,210 | |
PayPal Holdings † | | | 81,850 | | | | 2,886,031 | |
QUALCOMM | | | 92,800 | | | | 4,527,712 | |
TripAdvisor † | | | 53,278 | | | | 4,388,509 | |
Valeant Pharmaceuticals International † | | | 22,884 | | | | 2,058,645 | |
VeriFone Systems † | | | 109,075 | | | | 3,128,271 | |
Visa Class A | | | 58,630 | | | | 4,632,356 | |
Walgreens Boots Alliance | | | 30,925 | | | | 2,598,628 | |
Zebra Technologies † | | | 48,559 | | | | 3,894,432 | |
| | | | | | | | |
| | | | | | | 68,169,097 | |
| | | | | | | | |
| | |
Total Common Stock (cost $109,225,010) | | | | | | | 125,539,205 | |
| | | | | | | | |
| | | Principal amount° | | | | |
| |
Short-Term Investments – 2.14% | | | | | | | | |
| |
Discount Notes – 1.00%≠ | | | | | | | | |
Federal Home Loan Bank | | | | | | | | |
0.12% 1/4/16 | | | 204,852 | | | | 204,831 | |
0.12% 1/25/16 | | | 121,624 | | | | 121,604 | |
0.14% 2/18/16 | | | 218,803 | | | | 218,712 | |
0.155% 2/3/16 | | | 135,263 | | | | 135,217 | |
0.17% 1/21/16 | | | 161,032 | | | | 161,008 | |
0.18% 2/26/16 | | | 82,460 | | | | 82,422 | |
0.18% 3/7/16 | | | 107,266 | | | | 107,203 | |
0.185% 1/19/16 | | | 18,846 | | | | 18,844 | |
0.19% 3/22/16 | | | 175,514 | | | | 175,394 | |
0.192% 12/2/15 | | | 26,693 | | | | 26,693 | |
0.295% 3/2/16 | | | 9,122 | | | | 9,116 | |
| | | | | | | | |
| | | | | | | 1,261,044 | |
| | | | | | | | |
Repurchase Agreements – 1.14% | | | | | | | | |
Bank of America Merrill Lynch
0.07%, dated 11/30/15, to be repurchased on 12/1/15, repurchase price $281,643 (collateralized by U.S. government obligations 1.50%–3.375% 5/31/19–5/15/44; market value $287,276) | | | 281,643 | | | | 281,643 | |
13
Schedule of investments
Delaware Focus Global Growth Fund
| | | | | | | | |
| | | Principal amount° | | | Value (U.S. $) | |
| |
Short-Term Investments (continued) | | | | | | | | |
| |
Repurchase Agreements (continued) | | | | | | | | |
Bank of Montreal
0.09%, dated 11/30/15, to be repurchased on 12/1/15, repurchase price $469,406 (collateralized by U.S. government obligations 0.125%–4.625% 4/15/16–2/15/40; market value $478,793) | | | 469,404 | | | $ | 469,404 | |
BNP Paribas
0.11%, dated 11/30/15, to be repurchased on 12/1/15, repurchase price $691,955 (collateralized by U.S. government obligations 0.00%–3.125% 9/15/17–8/15/44; market value $705,792) | | | 691,953 | | | | 691,953 | |
| | | | | | | | |
| | | | | | | 1,443,000 | |
| | | | | | | | |
Total Short-Term Investments (cost $2,704,083) | | | | | | | 2,704,044 | |
| | | | | | | | |
| | |
Total Value of Securities – 101.28%
(cost $111,929,093) | | | | | | $ | 128,243,249 | |
| | | | | | | | |
| ≠ | The rate shown is the effective yield at the time of purchase. |
| ° | Principal amount shown is stated in U.S. dollars unless noted that the security is denominated in another currency. |
| † | Non-income-producing security. |
| D | Securities have been classified by country of origin. Aggregate classification by business sectors has been presented on page 11 in “Security type / country and sector allocations.” |
The following foreign currency exchange contracts were outstanding at Nov. 30, 20151:
Foreign Currency Exchange Contracts
| | | | | | | | | | | | | | |
Counterparty | | Contracts to
Receive (Deliver) | | | In Exchange For | | | Settlement Date | | Unrealized
Appreciation
(Depreciation) | |
BNYM | | HKD | 4,729,837 | | | USD | (610,559 | ) | | 12/1/15 | | $ | (535 | ) |
BNYM | | HKD | 3,783,082 | | | USD | (488,163 | ) | | 12/2/15 | | | (242 | ) |
| | | | | | | | | | | | | | |
| | | | | | | | | | | | $ | (777 | ) |
| | | | | | | | | | | | | | |
The use of foreign currency exchange contracts involves elements of market risk and risks in excess of the amounts disclosed in the financial statements. The foreign currency exchange contracts presented above represent the Fund’s total exposure in such contracts, whereas only the net unrealized appreciation (depreciation) is reflected in the Fund’s net assets.
1See Note 8 in “Notes to financial statements.”
14
Summary of abbreviations:
ADR – American Depositary Receipt
BNYM – BNY Mellon
HKD – Hong Kong Dollar
USD – U.S. Dollar
See accompanying notes, which are an integral part of the financial statements.
15
| | |
| Statement of assets and liabilities |
| |
| Delaware Focus Global Growth Fund | | November 30, 2015 |
| | | | |
Assets: | | | | |
Investments, at value1 | | $ | 125,539,205 | |
Short-term investments, at value2 | | | 2,704,044 | |
Foreign currencies, at value3 | | | 174,704 | |
Dividends and interest receivable | | | 192,256 | |
Receivable for fund shares sold | | | 87,936 | |
| | | | |
Total assets | | | 128,698,145 | |
| | | | |
Liabilities: | | | | |
Cash overdraft | | | 711,761 | |
Payable for securities purchased | | | 1,097,938 | |
Payable for fund shares redeemed | | | 52,618 | |
Other accrued expenses | | | 106,973 | |
Investment management fees payable | | | 86,881 | |
Distribution fees payable to affiliates | | | 9,962 | |
Other affiliates payable | | | 6,811 | |
Trustees’ fees and expenses payable | | | 723 | |
Unrealized depreciation on foreign currency exchange contracts | | | 777 | |
| | | | |
Total liabilities | | | 2,074,444 | |
| | | | |
Total Net Assets | | $ | 126,623,701 | |
| | | | |
| |
Net Assets Consist of: | | | | |
Paid-in capital | | $ | 106,586,044 | |
Distributions in excess of net investment income | | | (35,227 | ) |
Undistributed net realized gain on investments | | | 3,775,831 | |
Net unrealized appreciation of investments | | | 16,314,156 | |
Net unrealized depreciation of foreign currencies | | | (16,326 | ) |
Net unrealized depreciation of foreign currency exchange contracts | | | (777 | ) |
| | | | |
Total Net Assets | | $ | 126,623,701 | |
| | | | |
16
| | | | |
Net Asset Value | | | | |
Class A: | | | | |
Net assets | | $ | 27,045,529 | |
Shares of beneficial interest outstanding, unlimited authorization, no par | | | 1,367,171 | |
Net asset value per share | | $ | 19.78 | |
Sales charge | | | 5.75 | % |
Offering price per share, equal to net asset value per share / (1 – sales charge) | | $ | 20.99 | |
| |
Class C: | | | | |
Net assets | | $ | 5,424,079 | |
Shares of beneficial interest outstanding, unlimited authorization, no par | | | 283,576 | |
Net asset value per share | | $ | 19.13 | |
| |
Class R: | | | | |
Net assets | | $ | 107,270 | |
Shares of beneficial interest outstanding, unlimited authorization, no par | | | 5,481 | |
Net asset value per share | | $ | 19.57 | |
| |
Institutional Class: | | | | |
Net assets | | $ | 94,046,823 | |
Shares of beneficial interest outstanding, unlimited authorization, no par | | | 4,710,310 | |
Net asset value per share | | $ | 19.97 | |
| |
| | | | |
1Investments, at cost | | $ | 109,225,010 | |
2Short-term investments, at cost | | | 2,704,083 | |
3Foreign currencies, at cost | | | 180,143 | |
See accompanying notes, which are an integral part of the financial statements.
17
| | |
| Statement of operations |
| |
| Delaware Focus Global Growth Fund | | Year ended November 30, 2015 |
| | | | |
Investment Income: | | | | |
Dividends | | $ | 1,665,545 | |
Interest | | | 1,112 | |
Foreign tax withheld | | | (91,931 | ) |
| | | | |
| | | 1,574,726 | |
| | | | |
Expenses: | | | | |
Management fees | | | 1,103,020 | |
Distribution expenses – Class A | | | 70,592 | |
Distribution expenses – Class C | | | 56,655 | |
Distribution expenses – Class R | | | 594 | |
Dividend disbursing and transfer agent fees and expenses | | | 176,894 | |
Registration fees | | | 89,086 | |
Accounting and administration expenses | | | 41,367 | |
Reports and statements to shareholders | | | 41,301 | |
Audit and tax fees | | | 38,969 | |
Custodian fees | | | 26,088 | |
Legal fees | | | 14,845 | |
Trustees’ fees and expenses | | | 6,084 | |
Other | | | 14,522 | |
| | | | |
| | | 1,680,017 | |
Less expense paid indirectly | | | (32 | ) |
| | | | |
Total operating expenses | | | 1,679,985 | |
| | | | |
Net Investment Loss | | | (105,259 | ) |
| | | | |
| |
Net Realized and Unrealized Gain (Loss): | | | | |
Net realized gain (loss) on: | | | | |
Investments* | | | 5,862,115 | |
Foreign currencies | | | (83,538 | ) |
Foreign currency exchange contracts | | | 46,077 | |
| | | | |
Net realized gain | | | 5,824,654 | |
| | | | |
Net change in unrealized appreciation (depreciation) of: | | | | |
Investments | | | (6,596,304 | ) |
Foreign currencies | | | (2,308 | ) |
Foreign currency exchange contracts | | | (777 | ) |
| | | | |
Net change in unrealized appreciation (depreciation) | | | (6,599,389 | ) |
| | | | |
Net Realized and Unrealized Loss | | | (774,735 | ) |
| | | | |
Net Decrease in Net Assets Resulting from Operations | | $ | (879,994 | ) |
| | | | |
*Includes $59,159 capital gain taxes paid.
See accompanying notes, which are an integral part of the financial statements.
18
This page intentionally left blank.
Statements of changes in net assets
Delaware Focus Global Growth Fund
| | | | | | | | |
| | | Year ended | |
| | | 11/30/15 | | | 11/30/14 | |
| | |
Increase (Decrease) in Net Assets from Operations: | | | | | | | | |
Net investment income (loss) | | $ | (105,259 | ) | | $ | 812,243 | |
Net realized gain (loss) | | | 5,824,654 | | | | (2,025,646 | ) |
Net change in unrealized appreciation (depreciation) | | | (6,599,389 | ) | | | 8,910,775 | |
| | | | | | | | |
Net increase (decrease) in net assets resulting from operations | | | (879,994 | ) | | | 7,697,372 | |
| | | | | | | | |
| | |
Dividends and Distributions to Shareholders from: | | | | | | | | |
Net investment income: | | | | | | | | |
Class A | | | (109,681 | ) | | | — | |
Class R | | | (217 | ) | | | — | |
Institutional Class | | | (605,037 | ) | | | (32,036 | ) |
| | |
Net realized gain: | | | | | | | | |
Class A | | | — | | | | (800,031 | ) |
Class C | | | — | | | | (101,315 | ) |
Class R | | | — | | | | (2,208 | ) |
Institutional Class | | | — | | | | (739,112 | ) |
| | | | | | | | |
| | | (714,935 | ) | | | (1,674,702 | ) |
| | | | | | | | |
| | |
Capital Share Transactions: | | | | | | | | |
Proceeds from shares sold: | | | | | | | | |
Class A | | | 3,949,273 | | | | 9,557,913 | |
Class C | | | 1,211,543 | | | | 1,087,420 | |
Class R | | | 31,354 | | | | 12,901 | |
Institutional Class | | | 15,465,793 | | | | 74,279,425 | |
| | |
Net asset value of shares issued upon reinvestment of dividends and distributions: | | | | | | | | |
Class A | | | 101,162 | | | | 762,901 | |
Class C | | | — | | | | 100,191 | |
Class R | | | 217 | | | | 2,207 | |
Institutional Class | | | 605,037 | | | | 723,359 | |
| | | | | | | | |
| | | 21,364,379 | | | | 86,526,317 | |
| | | | | | | | |
20
| | | | | | | | |
| | | Year ended | |
| | | 11/30/15 | | | 11/30/14 | |
| | |
Capital Share Transactions (continued): | | | | | | | | |
Cost of shares redeemed: | | | | | | | | |
Class A | | $ | (5,194,785 | ) | | $ | (29,973,057 | ) |
Class C | | | (1,432,163 | ) | | | (1,504,151 | ) |
Class R | | | (63,876 | ) | | | (8,561 | ) |
Institutional Class | | | (19,739,221 | ) | | | (15,142,014 | ) |
| | | | | | | | |
| | | (26,430,045 | ) | | | (46,627,783 | ) |
| | | | | | | | |
Increase (decrease) in net assets derived from capital share transactions | | | (5,065,666 | ) | | | 39,898,534 | |
| | | | | | | | |
Net Increase (Decrease) in Net Assets | | | (6,660,595 | ) | | | 45,921,204 | |
| | |
Net Assets: | | | | | | | | |
Beginning of year | | | 133,284,296 | | | | 87,363,092 | |
| | | | | | | | |
End of year | | $ | 126,623,701 | | | $ | 133,284,296 | |
| | | | | | | | |
Undistributed (distributions in excess of) net investment income | | $ | (35,227 | ) | | $ | 705,607 | |
| | | | | | | | |
See accompanying notes, which are an integral part of the financial statements.
21
Financial highlights
Delaware Focus Global Growth Fund Class A
Selected data for each share of the Fund outstanding throughout each period were as follows:
|
Net asset value, beginning of period |
|
Income (loss) from investment operations: |
Net investment income (loss)1 |
Net realized and unrealized gain (loss) |
Total from investment operations |
|
Less dividends and distributions from: |
Net investment income |
Net realized gain |
Total dividends and distributions |
|
Net asset value, end of period |
|
Total return2 |
|
Ratios and supplemental data: |
Net assets, end of period (000 omitted) |
Ratio of expenses to average net assets |
Ratio of expenses to average net assets prior to fees waived |
Ratio of net investment income (loss) to average net assets |
Ratio of net investment income (loss) to average net assets prior to fees waived |
Portfolio turnover |
| 1 | The average shares outstanding method has been applied for per share information. |
| 2 | Total investment return is based on the change in net asset value of a share during the period and assumes reinvestment of dividends and distributions at net asset value and does not reflect the impact of a sales charge. Total investment return during some of the periods shown reflects waivers by the manager and/or distributor. Performance would have been lower had the waivers not been in effect. |
See accompanying notes, which are an integral part of the financial statements.
22
| | | | | | | | | | | | | | | | | | | | | | |
| | | | Year ended | |
| | | | | | |
| | | | 11/30/15 | | | 11/30/14 | | | 11/30/13 | | | 11/30/12 | | | 11/30/11 | |
| | |
| | | | $ | 20.060 | | | $ | 19.180 | | | $ | 15.900 | | | $ | 13.880 | | | $ | 13.720 | |
| | | | | |
| | | | | | | | | | | | | | | | | | | | | | | |
| | | | | (0.046 | ) | | | 0.104 | | | | 0.031 | | | | (0.002 | ) | | | — | |
| | | | | (0.158 | ) | | | 1.099 | | | | 3.249 | | | | 2.133 | | | | 0.594 | |
| | | | | | | | | | | | | | | | | | | | | | |
| | | | | (0.204 | ) | | | 1.203 | | | | 3.280 | | | | 2.131 | | | | 0.594 | |
| | | | | | | | | | | | | | | | | | | | | | |
| | | | | |
| | | | | | | | | | | | | | | | | | | | | | | |
| | | | | (0.076 | ) | | | — | | | | — | | | | — | | | | (0.028 | ) |
| | | | | — | | | | (0.323 | ) | | | — | | | | (0.111 | ) | | | (0.406 | ) |
| | | | | | | | | | | | | | | | | | | | | | |
| | | | | (0.076 | ) | | | (0.323 | ) | | | — | | | | (0.111 | ) | | | (0.434 | ) |
| | | | | | | | | | | | | | | | | | | | | | |
| | | | | |
| | | | $ | 19.780 | | | $ | 20.060 | | | $ | 19.180 | | | $ | 15.900 | | | $ | 13.880 | |
| | | | | | | | | | | | | | | | | | | | | | |
| | | | | |
| | | | | (1.02% | ) | | | 6.37% | | | | 20.63% | | | | 15.49% | | | | 4.28% | |
| | | | | |
| | | | | | | | | | | | | | | | | | | | | | | |
| | | | $ | 27,046 | | | $ | 28,583 | | | $ | 46,830 | | | $ | 16,753 | | | $ | 8,244 | |
| | | | | 1.45% | | | | 1.40% | | | | 1.51% | | | | 1.55% | | | | 1.51% | |
| | | | | 1.45% | | | | 1.40% | | | | 1.55% | | | | 1.76% | | | | 2.78% | |
| | | | | (0.23% | ) | | | 0.54% | | | | 0.18% | | | | (0.02% | ) | | | 0.00% | |
| | | | | (0.23% | ) | | | 0.54% | | | | 0.14% | | | | (0.23% | ) | | | (1.27% | ) |
| | | | | 41% | | | | 26% | | | | 36% | | | | 37% | | | | 18% | |
| | |
23
Financial highlights
Delaware Focus Global Growth Fund Class C
Selected data for each share of the Fund outstanding throughout each period were as follows:
|
|
Net asset value, beginning of period |
|
Income (loss) from investment operations: |
Net investment loss2 |
Net realized and unrealized gain (loss) |
|
Total from investment operations |
|
|
Less dividends and distributions from: |
Net realized gain |
|
Total dividends and distributions |
|
|
Net asset value, end of period |
|
|
Total return3 |
|
Ratios and supplemental data: |
Net assets, end of period (000 omitted) |
Ratio of expenses to average net assets |
Ratio of expenses to average net assets prior to fees waived |
Ratio of net investment loss to average net assets |
Ratio of net investment loss to average net assets prior to fees waived |
Portfolio turnover |
| 1 | Date of commencement of operations; ratios have been annualized and total return has not been annualized. |
| 2 | The average shares outstanding method has been applied for per share information. |
| 3 | Total investment return is based on the change in net asset value of a share during the period and assumes reinvestment of dividends and distributions at net asset value and does not reflect the impact of a sales charge. Total investment return during some of the periods shown reflect a waiver by the manager. Performance would have been lower had the waiver not been in effect. |
| 4 | Portfolio turnover is representative of the Fund for the entire annual period. |
See accompanying notes, which are an integral part of the financial statements.
24
| | | | | | | | | | | | | | | | | | | | | | |
| | | | | | | 12/29/101 | |
| | | | Year ended | | | to | |
| | | | | | | | | | |
| | | | 11/30/15 | | | 11/30/14 | | | 11/30/13 | | | 11/30/12 | | | 11/30/11 | |
| | |
| | | | $ | 19.470 | | | $ | 18.760 | | | $ | 15.670 | | | $ | 13.780 | | | $ | 14.120 | |
| | | | | |
| | | | | | | | | | | | | | | | | | | | | | | |
| | | | | (0.189 | ) | | | (0.039 | ) | | | (0.097 | ) | | | (0.113 | ) | | | (0.108 | ) |
| | | | | (0.151 | ) | | | 1.072 | | | | 3.187 | | | | 2.114 | | | | (0.232 | ) |
| | | | | | | | | | | | | | | | | | | | | | |
| | | | | (0.340 | ) | | | 1.033 | | | | 3.090 | | | | 2.001 | | | | (0.340 | ) |
| | | | | | | | | | | | | | | | | | | | | | |
| | | | | |
| | | | | | | | | | | | | | | | | | | | | | | |
| | | | | — | | | | (0.323 | ) | | | — | | | | (0.111 | ) | | | — | |
| | | | | | | | | | | | | | | | | | | | | | |
| | | | | — | | | | (0.323 | ) | | | — | | | | (0.111 | ) | | | — | |
| | | | | | | | | | | | | | | | | | | | | | |
| | | | | |
| | | | $ | 19.130 | | | $ | 19.470 | | | $ | 18.760 | | | $ | 15.670 | | | $ | 13.780 | |
| | | | | | | | | | | | | | | | | | | | | | |
| | | | | |
| | | | | (1.75% | ) | | | 5.59% | | | | 19.72% | | | | 14.66% | | | | (2.41% | ) |
| | | | | |
| | | | | | | | | | | | | | | | | | | | | | | |
| | | | $ | 5,424 | | | $ | 5,759 | | | $ | 5,863 | | | $ | 1,594 | | | $ | 68 | |
| | | | | 2.20% | | | | 2.15% | | | | 2.26% | | | | 2.30% | | | | 2.30% | |
| | | | | 2.20% | | | | 2.15% | | | | 2.26% | | | | 2.46% | | | | 3.52% | |
| | | | | (0.98% | ) | | | (0.21% | ) | | | (0.57% | ) | | | (0.77% | ) | | | (0.85% | ) |
| | | | | (0.98% | ) | | | (0.21% | ) | | | (0.57% | ) | | | (0.93% | ) | | | (2.07% | ) |
| | | | | 41% | | | | 26% | | | | 36% | | | | 37% | | | | 18% | 4 |
|
| | |
25
Financial highlights
Delaware Focus Global Growth Fund Class R
Selected data for each share of the Fund outstanding throughout each period were as follows:
|
|
Net asset value, beginning of period |
|
Income (loss) from investment operations: |
Net investment income (loss)2 |
Net realized and unrealized gain (loss) |
Total from investment operations |
|
Less dividends and distributions from: |
Net investment income |
Net realized gain |
Total dividends and distributions |
|
Net asset value, end of period |
|
Total return3 |
|
Ratios and supplemental data: |
Net assets, end of period (000 omitted) |
Ratio of expenses to average net assets |
Ratio of expenses to average net assets prior to fees waived |
Ratio of net investment income (loss) to average net assets |
Ratio of net investment income (loss) to average net assets prior to fees waived |
Portfolio turnover |
| 1 | Date of commencement of operations; ratios have been annualized and total return has not been annualized. |
| 2 | The average shares outstanding method has been applied for per share information. |
| 3 | Total investment return is based on the change in net asset value of a share during the period and assumes reinvestment of dividends and distributions at net asset value. Total investment return during some of the periods shown reflects waivers by the manager and/or distributor. Performance would have been lower had the waivers not been in effect. |
| 4 | Portfolio turnover is representative of the Fund for the entire annual period. |
See accompanying notes, which are an integral part of the financial statements.
26
| | | | | | | | | | | | | | | | | | | | | | |
| | | | | | | 12/29/101 | |
| | | | Year ended | | | to | |
| | | | | | | | | | |
| | | | 11/30/15 | | | 11/30/14 | | | 11/30/13 | | | 11/30/12 | | | 11/30/11 | |
| | |
| | | | $ | 19.850 | | | $ | 19.030 | | | $ | 15.810 | | | $ | 13.840 | | | $ | 14.120 | |
| | | | | |
| | | | | | | | | | | | | | | | | | | | | | | |
| | | | | (0.095 | ) | | | 0.056 | | | | (0.013 | ) | | | (0.040 | ) | | | (0.043 | ) |
| | | | | (0.157 | ) | | | 1.087 | | | | 3.233 | | | | 2.121 | | | | (0.237 | ) |
| | | | | | | | | | | | | | | | | | | | | | |
| | | | | (0.252 | ) | | | 1.143 | | | | 3.220 | | | | 2.081 | | | | (0.280 | ) |
| | | | | | | | | | | | | | | | | | | | | | |
| | | | | |
| | | | | | | | | | | | | | | | | | | | | | | |
| | | | | (0.028 | ) | | | — | | | | — | | | | — | | | | — | |
| | | | | — | | | | (0.323 | ) | | | — | | | | (0.111 | ) | | | — | |
| | | | | | | | | | | | | | | | | | | | | | |
| | | | | (0.028 | ) | | | (0.323 | ) | | | — | | | | (0.111 | ) | | | — | |
| | | | | | | | | | | | | | | | | | | | | | |
| | | | | |
| | | | $ | 19.570 | | | $ | 19.850 | | | $ | 19.030 | | | $ | 15.810 | | | $ | 13.840 | |
| | | | | | | | | | | | | | | | | | | | | | |
| | | | | |
| | | | | (1.27% | ) | | | 6.10% | | | | 20.37% | | | | 15.17% | | | | (1.98% | ) |
| | | | | |
| | | | | | | | | | | | | | | | | | | | | | | |
| | | | $ | 107 | | | $ | 141 | | | $ | 129 | | | $ | 61 | | | $ | 5 | |
| | | | | 1.70% | | | | 1.65% | | | | 1.76% | | | | 1.80% | | | | 1.80% | |
| | | | | 1.70% | | | | 1.65% | | | | 1.84% | | | | 2.06% | | | | 3.12% | |
| | | | | (0.48% | ) | | | 0.29% | | | | (0.07% | ) | | | (0.27% | ) | | | (0.35% | ) |
| | | | | (0.48% | ) | | | 0.29% | | | | (0.15% | ) | | | (0.53% | ) | | | (1.67% | ) |
| | | | | 41% | | | | 26% | | | | 36% | | | | 37% | | | | 18% | 4 |
| | |
27
Financial highlights
Delaware Focus Global Growth Fund Institutional Class
Selected data for each share of the Fund outstanding throughout each period were as follows:
|
|
Net asset value, beginning of period |
|
Income (loss) from investment operations: |
Net investment income1 |
Net realized and unrealized gain (loss) |
Total from investment operations |
|
Less dividends and distributions from: |
Net investment income |
Net realized gain |
Total dividends and distributions |
|
Net asset value, end of period |
|
Total return2 |
|
Ratios and supplemental data: |
Net assets, end of period (000 omitted) |
Ratio of expenses to average net assets |
Ratio of expenses to average net assets prior to fees waived |
Ratio of net investment income to average net assets |
Ratio of net investment income (loss) to average net assets prior to fees waived |
Portfolio turnover |
|
|
|
| 1 | The average shares outstanding method has been applied for per share information. |
| 2 | Total investment return is based on the change in net asset value of a share during the period and assumes reinvestment of dividends and distributions at net asset value. Total investment return during some of the periods shown reflects a waiver by the manager. Performance would have been lower had the waiver not been in effect. |
See accompanying notes, which are an integral part of the financial statements.
28
| | | | | | | | | | | | | | | | | | | | |
| | | Year ended | |
| | | | |
| | | 11/30/15 | | | 11/30/14 | | | 11/30/13 | | | 11/30/12 | | | 11/30/11 | |
| |
| | $ | 20.250 | | | $ | 19.320 | | | $ | 15.970 | | | $ | 13.910 | | | $ | 13.720 | |
| | | | | |
| | | | | | | | | | | | | | | | | | | | | |
| | | 0.003 | | | | 0.154 | | | | 0.075 | | | | 0.035 | | | | 0.038 | |
| | | (0.159 | ) | | | 1.113 | | | | 3.275 | | | | 2.136 | | | | 0.586 | |
| | | | | | | | | | | | | | | | | | | | |
| | | (0.156 | ) | | | 1.267 | | | | 3.350 | | | | 2.171 | | | | 0.624 | |
| | | | | | | | | | | | | | | | | | | | |
| | | | | |
| | | | | | | | | | | | | | | | | | | | | |
| | | (0.124 | ) | | | (0.014 | ) | | | — | | | | — | | | | (0.028 | ) |
| | | — | | | | (0.323 | ) | | | — | | | | (0.111 | ) | | | (0.406 | ) |
| | | | | | | | | | | | | | | | | | | | |
| | | (0.124 | ) | | | (0.337 | ) | | | — | | | | (0.111 | ) | | | (0.434 | ) |
| | | | | | | | | | | | | | | | | | | | |
| | | | | |
| | $ | 19.970 | | | $ | 20.250 | | | $ | 19.320 | | | $ | 15.970 | | | $ | 13.910 | |
| | | | | | | | | | | | | | | | | | | | |
| | | | | |
| | | (0.77% | ) | | | 6.66% | | | | 20.98% | | | | 15.75% | | | | 4.51% | |
| | | | | |
| | | | | | | | | | | | | | | | | | | | |
| | $ | 94,047 | | | $ | 98,801 | | | $ | 34,541 | | | $ | 11,699 | | | $ | 7,336 | |
| | | 1.20% | | | | 1.15% | | | | 1.26% | | | | 1.30% | | | | 1.28% | |
| | | 1.20% | | | | 1.15% | | | | 1.26% | | | | 1.46% | | | | 2.47% | |
| | | 0.02% | | | | 0.79% | | | | 0.43% | | | | 0.23% | | | | 0.27% | |
| | | 0.02% | | | | 0.79% | | | | 0.43% | | | | 0.07% | | | | (0.92% | ) |
| | | 41% | | | | 26% | | | | 36% | | | | 37% | | | | 18% | |
| | | | | |
| | | | | | | | | | | | | | | | | | | | |
| |
29
| | |
| Notes to financial statements | | |
| Delaware Focus Global Growth Fund | | November 30, 2015 |
Delaware Group® Global & International Funds (Trust) is organized as a Delaware statutory trust and offers four series: Delaware Emerging Markets Fund, Delaware Focus Global Growth Fund, Delaware Global Value Fund, and Delaware International Value Equity Fund. These financial statements and the related notes pertain to Delaware Focus Global Growth Fund (Fund). The Trust is an open-end investment company. The Fund is considered diversified under the Investment Company Act of 1940, as amended, and offers Class A, Class C, Class R, and Institutional Class shares. Class A shares are sold with a maximum front-end sales charge of 5.75%. Class A share purchases of $1,000,000 or more will incur a contingent deferred sales charge (CDSC) of 1.00%, if redeemed during the first year, and 0.50% during the second year, provided that Delaware Distributors, L.P. (DDLP) paid a financial advisor a commission on the purchase of those shares. Class C shares are sold with a CDSC of 1.00%, if redeemed during the first 12 months. Class R and Institutional Class shares are not subject to a sales charge and are offered for sale exclusively to certain eligible investors.
The investment objective of the Fund is to seek long-term capital appreciation.
1. Significant Accounting Policies
The following accounting policies are in accordance with U.S. generally accepted accounting principles (U.S. GAAP) and are consistently followed by the Fund.
Security Valuation — Equity securities, except those traded on the Nasdaq Stock Market LLC (Nasdaq), are valued at the last quoted sales price as of the time of the regular close of the New York Stock Exchange on the valuation date. Equity securities traded on the Nasdaq are valued in accordance with the Nasdaq Official Closing Price, which may not be the last sales price. If, on a particular day, an equity security does not trade, the mean between the bid and ask prices will be used, which approximates fair value. Securities listed on a foreign exchange are normally valued at the last quoted sales price on the valuation date. U.S. government and agency securities are valued at the mean between the bid and ask prices, which approximates fair value. Foreign currency exchange contracts and foreign cross currency exchange contracts are valued at the mean between the bid and ask prices, which approximates fair value. Interpolated values are derived when the settlement date of the contract is an interim date for which quotations are not available. Generally, other securities and assets for which market quotations are not readily available are valued at fair value as determined in good faith under the direction of the Trust’s Board of Trustees (Board). In determining whether market quotations are readily available or fair valuation will be used, various factors will be taken into consideration, such as market closures, or suspension of trading in a security. The Fund may use fair value pricing more frequently for securities traded primarily in non-U.S. markets because, among other things, most foreign markets close well before the Fund values its securities, generally as of 4:00 p.m. Eastern time. The earlier close of these foreign markets gives rise to the possibility that significant events, including broad market moves, government actions or pronouncements, aftermarket trading, or news events may have occurred in the interim. Whenever such a significant event occurs, the Fund may value foreign securities using fair value prices based on third-party vendor modeling tools (international fair value pricing).
Federal and Foreign Income Taxes — No provision for federal income taxes has been made as the Fund intends to continue to qualify for federal income tax purposes as a regulated investment company under Subchapter M of the Internal Revenue Code of 1986, as amended, and make the requisite distributions to shareholders. The Fund evaluates tax positions taken or expected to be taken in the
30
course of preparing the Fund’s tax returns to determine whether the tax positions are “more-likely-than-not” of being sustained by the applicable tax authority. Tax positions not deemed to meet the “more-likely-than-not” threshold are recorded as a tax benefit or expense in the current year. Management has analyzed the Fund’s tax positions taken for all open federal income tax years (Nov. 30, 2012–Nov. 30, 2015), and has concluded that no provision for federal income tax is required in the Fund’s financial statements. In regard to foreign taxes only, the Fund has open tax years in certain foreign countries in which it invests in that may date back to the inception of the Fund.
Class Accounting — Investment income, common expenses, and realized and unrealized gain (loss) on investments are allocated to the various classes of the Fund on the basis of daily net assets of each class. Distribution expenses relating to a specific class are charged directly to that class.
Repurchase Agreements — The Fund may purchase certain U.S. government securities subject to the counterparty’s agreement to repurchase them at an agreed upon date and price. The counterparty will be required on a daily basis to maintain the value of the collateral subject to the agreement at not less than the repurchase price (including accrued interest). The agreements are conditioned upon the collateral being deposited under the Federal Reserve book-entry system with the Fund’s custodian or a third-party sub-custodian. In the event of default or bankruptcy by the other party to the agreement, retention of the collateral may be subject to legal proceedings. All open repurchase agreements as of the date of this report were entered on Nov. 30, 2015 and matured the following business day.
Foreign Currency Transactions — Transactions denominated in foreign currencies are recorded at the prevailing exchange rates on the valuation date in accordance with the Fund’s prospectus. The value of all assets and liabilities denominated in foreign currencies is translated daily into U.S. dollars at the exchange rate of such currencies against the U.S. dollar. Transaction gains or losses resulting from changes in exchange rates during the reporting period or upon settlement of the foreign currency transaction are reported in operations for the current period. The Fund generally does not bifurcate that portion of realized gains and losses on investments which is due to changes in foreign exchange rates from that which is due to changes in market prices. The changes are included on the “Statement of operations” under “Net realized and unrealized gain (loss) on investments.” The Fund reports certain foreign currency related transactions as components of realized gains (losses) for financial reporting purposes, whereas such components are treated as ordinary income (loss) for federal income tax purposes.
Use of Estimates — The Fund is an investment company, whose financial statements are prepared in conformity with U.S. GAAP. Therefore, the Fund follows the accounting and reporting guidelines for investment companies. The preparation of financial statements in conformity with U.S. GAAP requires management to make estimates and assumptions that affect the fair value of investments, the reported amounts of assets and liabilities and disclosure of contingent assets and liabilities at the date of the financial statements, and the reported amounts of revenues and expenses during the reporting period. Actual results could differ from those estimates and the differences could be material.
Other — Expenses directly attributable to the Fund are charged directly to the Fund. Other expenses common to various funds within the Delaware Investments® Family of Funds are generally allocated among such funds on the basis of average net assets. Management fees and some other expenses are paid monthly. Security transactions are recorded on the date the securities are purchased or sold (trade
31
Notes to financial statements
Delaware Focus Global Growth Fund
1. Significant Accounting Policies (continued)
date) for financial reporting purposes. Costs used in calculating realized gains and losses on the sale of investment securities are those of the specific securities sold. Dividend income is recorded on the ex-dividend date and interest income is recorded on the accrual basis. Discounts and premiums on debt securities are accreted or amortized to interest income, respectively over the lives of the respective securities using the effective interest method. Foreign dividends are also recorded on the ex-dividend date or as soon after the ex-dividend date that the Fund is aware of such dividends, net of all tax withholdings, a portion of which may be reclaimable. Withholding taxes and reclaims on foreign dividends have been recorded in accordance with the Fund’s understanding of the applicable country’s tax rules and rates. The Fund pays foreign capital gain taxes on certain foreign securities held, which are reported as components of realized and unrealized losses for financial reporting purposes, whereas such components are treated as ordinary loss for federal income tax purposes. The Fund declares and pays dividends from net investment income and distributions from net realized gain on investments, if any, annually. The Fund may distribute more frequently, if necessary for tax purposes. Dividends and distributions, if any, are recorded on the ex-dividend date.
The Fund may receive earnings credits from its custodian when positive cash balances are maintained, which may be used to offset custody fees. There were no such earnings credits for the year ended Nov. 30, 2015.
The Fund receives earnings credits from its transfer agent when positive cash balances are maintained, which may be used to offset transfer agent fees. If the amount earned is greater than one dollar, the expense paid under this arrangement is included on the “Statement of operations” under “Dividend disbursing and transfer agent fees and expenses” with the corresponding expense offset shown under “Less expense paid indirectly.” For the year ended Nov. 30, 2015, the Fund earned $32 under this agreement.
2. Investment Management, Administration Agreements, and Other Transactions with Affiliates
In accordance with the terms of its investment management agreement, the Fund pays Delaware Management Company (DMC), a series of Delaware Management Business Trust and the investment manager, an annual fee which is calculated daily at the rate of 0.85% on the first $500 million of average daily net assets of the Fund, 0.80% on the next $500 million, 0.75% on the next $1.5 billion, and 0.70% on the average daily net assets in excess of $2.5 billion.
DMC has contractually agreed to waive that portion, if any, of its management fee and/or pay/reimburse the Fund to the extent necessary to ensure that total annual operating expenses (excluding any 12b-1 fees, acquired fund fees and expenses, taxes, interest, short sale and dividend interest expenses, brokerage fees, certain insurance costs, and nonroutine expenses or costs including, but not limited to, those relating to reorganizations, litigation, conducting shareholder meetings, and liquidations (collectively, nonroutine expenses)) do not exceed 1.30% of the Fund’s average daily net assets from
32
Dec. 1, 2014 through Nov. 30, 2015.* For purposes of this waiver and reimbursement, nonroutine expenses may also include such additional costs and expenses as may be agreed upon from time to time by the Fund’s Board and DMC. This expense waiver and reimbursement may only be terminated by agreement of DMC and the Fund.
Jackson Square Partners, LLC (JSP), a related party of DMC, furnishes investment sub-advisory services to the Fund. For these services, DMC, not the Fund, pays JSP fees based on the aggregate average daily net assets of the Fund at the following annual rate: 0.425% of the first $500 million; 0.40% of the next $500 million; 0.375% of the next $1.5 billion; and 0.35% of aggregate average daily net assets in excess of $2.5 billion.
Delaware Investments Fund Services Company (DIFSC), an affiliate of DMC, provides fund accounting and financial administration oversight services to the Fund. For these services, DIFSC’s fees are calculated based on the aggregate daily net assets of the Delaware Investments® Family of Funds at the following annual rate: 0.0050% of the first $30 billion; 0.0045% of the next $10 billion; 0.0040% of the next $10 billion; and 0.0025% of aggregate average daily net assets in excess of $50 billion. The fees payable to DIFSC under the service agreement described above are allocated among all retail funds in the Delaware Investments Family of Funds on a relative net asset value (NAV) basis. For the year ended Nov. 30, 2015, the Fund was charged $6,135 for these services. This amount is included on the “Statement of operations” under “Accounting and administration expenses.”
DIFSC is also the transfer agent and dividend disbursing agent of the Fund. For these services, DIFSC’s fees are calculated based on the aggregate daily net assets of the retail funds within the Delaware Investments Family of Funds at the following annual rate: 0.025% of the first $20 billion; 0.020% of the next $5 billion; 0.015% of the next $5 billion; and 0.013% of average daily net assets in excess of $30 billion. The fees payable to DIFSC under the service agreement described above are allocated among all retail funds in the Delaware Investments Family of Funds on a relative NAV basis. This amount is included on the “Statement of operations” under “Dividend disbursing and transfer agent fees and expenses.” For the year ended Nov. 30, 2015, the amount charged by DIFSC was $26,841. Pursuant to a sub-transfer agency agreement between DIFSC and BNY Mellon Investment Servicing (US) Inc. (BNYMIS), BNYMIS provides certain sub-transfer agency services to the Fund. Sub-transfer agency fees are paid by the Fund and are also included on the “Statement of operations” under “Dividend disbursing and transfer agent fees and expenses.”
Pursuant to a distribution agreement and distribution plan, the Fund pays DDLP, the distributor and an affiliate of DMC, an annual distribution and service fee of 0.25% of the average daily net assets of the Class A shares, 1.00% of the average daily net assets of the Class C shares, and 0.50% of the average daily net assets of the Class R shares. Institutional Class shares pay no distribution and service fee.
As provided in the investment management agreement, the Fund bears a portion of the cost of certain resources shared with DMC, including the cost of internal personnel of DMC and/or its affiliates that provide legal, tax, and regulatory reporting services to the Fund. For the year ended Nov. 30, 2015, the Fund was charged $3,178 for internal legal, tax, and regulatory reporting services provided by DMC and/ or its affiliates’ employees. This amount is included on the “Statement of operations” under “Legal fees.”
33
Notes to financial statements
Delaware Focus Global Growth Fund
2. Investment Management, Administration Agreements, and Other Transactions with Affiliates (continued)
For the year ended Nov. 30, 2015, DDLP earned $4,815 for commissions on sales of the Fund’s Class A shares. For the year ended Nov. 30, 2015, DDLP received gross CDSC commissions of $5 and $361 on redemptions of the Fund’s Class A and Class C shares, respectively, and these commissions were entirely used to offset upfront commissions previously paid by DDLP to broker/dealers on sales of those shares.
Trustees’ fees include expenses accrued by the Fund for each Trustee’s retainer and meeting fees. Certain officers of DMC, DIFSC, and DDLP are officers and/or Trustees of the Trust. These officers and Trustees are paid no compensation by the Fund.
| | | | |
| | | | |
|
| *The contractual waiver period is from March 28, 2014 through March 30, 2016 |
3. Investments
For the year ended Nov. 30, 2015, the Fund made purchases and sales of investment securities other than short-term investments as follows:
| | | | |
Purchases | | $ | 51,821,740 | |
Sales | | | 57,678,851 | |
At Nov. 30, 2015, the cost of investments and unrealized appreciation (depreciation) for federal income tax purposes were as follows:
| | | | |
Cost of investments | | $ | 112,345,652 | |
| | | | |
Aggregate unrealized appreciation of investments | | $ | 27,123,966 | |
Aggregate unrealized depreciation of investments | | | (11,226,369 | ) |
| | | | |
Net unrealized appreciation of investments | | $ | 15,897,597 | |
| | | | |
U.S. GAAP defines fair value as the price that the Fund would receive to sell an asset or pay to transfer a liability in an orderly transaction between market participants at the measurement date under current market conditions. A three-level hierarchy for fair value measurements has been established based upon the transparency of inputs to the valuation of an asset or liability. Inputs may be observable or unobservable and refer broadly to the assumptions that market participants would use in pricing the asset or liability. Observable inputs reflect the assumptions market participants would use in pricing the asset or liability based on market data obtained from sources independent of the reporting entity. Unobservable inputs reflect the reporting entity’s own assumptions about the assumptions that market participants would use in pricing the asset or liability based on the best information available under the circumstances. The Fund’s investment in its entirety is assigned a level based upon the observability of the inputs which are significant to the overall valuation. The three-level hierarchy of inputs is summarized below.
| | |
| Level 1 – | | Inputs are quoted prices in active markets for identical investments. (Examples: equity securities, open-end investment companies, futures contracts, exchange-traded options contracts) |
34
| | |
| Level 2 – | | Other observable inputs, including, but not limited to: quoted prices for similar assets or liabilities in markets that are active, quoted prices for identical or similar assets or liabilities in markets that are not active, inputs other than quoted prices that are observable for the assets or liabilities (such as interest rates, yield curves, volatilities, prepayment speeds, loss severities, credit risks, and default rates), or other market-corroborated inputs. (Examples: debt securities, government securities, swap contracts, foreign currency exchange contracts, foreign securities utilizing international fair value pricing, broker-quoted securities, fair valued securities) |
| |
| Level 3 – | | Significant unobservable inputs, including the Fund’s own assumptions used to determine the fair value of investments. (Examples: broker-quoted securities, fair valued securities) |
Level 3 investments are valued using significant unobservable inputs. The Fund may also use an income-based valuation approach in which the anticipated future cash flows of the investment are discounted to calculate fair value. Discounts may also be applied due to the nature or duration of any restrictions on the disposition of the investments. Valuations may also be based upon current market prices of securities that are comparable in coupon, rating, maturity, and industry. The derived value of a Level 3 investment may not represent the value which is received upon disposition and this could impact the results of operations.
The following table summarizes the valuation of the Fund’s investments by fair value hierarchy levels as of Nov. 30, 2015:
| | | | | | | | | | | | |
Securities | | Level 1 | | | Level 2 | | | Total | |
| | | |
Common Stock | | | | | | | | | | | | |
Brazil | | $ | 2,333,610 | | | $ | — | | | $ | 2,333,610 | |
China/Hong Kong | | | 8,131,571 | | | | — | | | | 8,131,571 | |
Denmark | | | 4,782,014 | | | | — | | | | 4,782,014 | |
India | | | 3,329,752 | | | | — | | | | 3,329,752 | |
Ireland | | | 4,396,852 | | | | — | | | | 4,396,852 | |
Japan | | | 7,546,583 | | | | — | | | | 7,546,583 | |
Mexico | | | 2,833,395 | | | | — | | | | 2,833,395 | |
Netherlands | | | 7,347,582 | | | | — | | | | 7,347,582 | |
Spain | | | 6,366,315 | | | | — | | | | 6,366,315 | |
Taiwan | | | 3,249,559 | | | | — | | | | 3,249,559 | |
United Kingdom | | | 7,052,875 | | | | — | | | | 7,052,875 | |
United States | | | 68,169,097 | | | | — | | | | 68,169,097 | |
Short-Term Investments | | | — | | | | 2,704,044 | | | | 2,704,044 | |
| | | | | | | | | | | | |
Total Value of Securities | | $ | 125,539,205 | | | $ | 2,704,044 | | | $ | 128,243,249 | |
| | | | | | | | | | | | |
| | | |
Foreign Currency Exchange Contracts | | $ | — | | | $ | (777 | ) | | $ | (777 | ) |
As a result of utilizing international fair value pricing at Nov. 30, 2015, a portion of the Fund’s common stock was categorized as Level 2.
35
Notes to financial statements
Delaware Focus Global Growth Fund
3. Investments (continued)
During the year ended Nov. 30, 2015, there were no transfers between Level 1 investments, Level 2 investments, or Level 3 investments that had a significant impact to the Fund. This does not include transfers between Level 1 investments and Level 2 investments due to the Fund utilizing international fair value pricing during the period. In accordance with the fair valuation procedures described in Note 1, international fair value pricing of securities in the Fund occurs when market volatility exceeds an established rolling threshold. If the threshold is exceeded on a given date, then prices of international securities (those that traded on exchanges that close at a different time than the time that the Fund’s NAV is determined) are established using a separate pricing feed from a third-party vendor designed to establish a price for each such security as of the time that the Fund’s NAV is determined. Further, international fair value pricing uses other observable market-based inputs in place of the closing exchange price due to the events occurring after the close of the exchange or market on which the investment is principally traded, causing a change in classification between levels. The Fund’s policy is to recognize transfers between levels at the beginning of the reporting period.
A reconciliation of Level 3 investments is presented when the Fund has a significant amount of Level 3 investments at the beginning, interim, or end of the period in relation to net assets. At Nov. 30, 2015, there were no Level 3 investments.
4. Dividend and Distribution Information
Income and long-term capital gain distributions are determined in accordance with federal income tax regulations, which may differ from U.S. GAAP. Additionally, distributions from net gains on foreign currency transactions and net short-term gains on sales of investment securities are treated as ordinary income for federal income tax purposes. The tax character of dividends and distributions paid during the years ended Nov. 30, 2015 and 2014 was as follows:
| | | | | | | | | | |
| | | Year ended | |
| | | 11/30/15 | | | | | 11/30/14 | |
Ordinary income | | $ | 705,607 | | | | | $ | 532,163 | |
Long-term capital gain | | | 9,328 | | | | | | 1,142,539 | |
| | | | | | | | | | |
Total | | $ | 714,935 | | | | | $ | 1,674,702 | |
| | | | | | | | | | |
36
5. Components of Net Assets on a Tax Basis
As of Nov. 30, 2015, the components of net assets on a tax basis were as follows:
| | | | |
Shares of beneficial interest | | $ | 106,586,044 | |
Undistributed long-term capital gains | | | 4,192,390 | |
Qualified late year loss deferrals | | | (35,227 | ) |
Net unrealized appreciation of investments, foreign currencies, and derivatives | | | 15,880,494 | |
| | | | |
Net assets | | $ | 126,623,701 | |
| | | | |
The differences between book basis and tax basis components of net assets are primarily attributable to tax deferral of losses on wash sales.
For financial reporting purposes, capital accounts are adjusted to reflect the tax character of permanent book/tax differences. Reclassifications are primarily due to tax treatment of gain (loss) on foreign currency transactions, net operating losses, capital gains tax reclass, and dividends and distributions. Results of operations and net assets were not affected by these reclassifications. For the year ended Nov. 30, 2015, the Fund recorded the following reclassifications:
| | | | |
Undistributed net investment income | | $ | 79,360 | |
Accumulated net realized gain | | | 87,292 | |
Paid-in capital | | | (166,652 | ) |
For federal income tax purposes, capital loss carryforwards may be carried forward and applied against future capital gains. $1,943,666 was utilized in 2015. There were no capital loss carryforwards remaining at Nov. 30, 2015.
On Dec. 22, 2010 the Regulated Investment Company Modernization Act of 2010 (Act) was enacted, which changed various technical rules governing the tax treatment of regulated investment companies. The changes were generally effective for taxable years beginning after the date of enactment. Under the Act, the Fund is permitted to carry forward capital losses incurred in taxable years beginning after the date of enactment for an unlimited period. Additionally, post-enactment capital loss carryforwards will retain their character as either short-term or long-term capital losses rather than being considered all short-term as permitted under previous regulation. At Nov. 30, 2015, no capital loss carryforwards was incurred under the Act.
37
Notes to financial statements
Delaware Focus Global Growth Fund
6. Capital Shares
Transactions in capital shares were as follows:
| | | | | | | | | | |
| | | Year ended | |
| | | 11/30/15 | | | | | 11/30/14 | |
Shares sold: | | | | | | | | | | |
Class A | | | 199,663 | | | | | | 497,763 | |
Class C | | | 62,707 | | | | | | 58,084 | |
Class R | | | 1,588 | | | | | | 675 | |
Institutional Class | | | 780,574 | | | | | | 3,830,005 | |
| | | |
Shares issued upon reinvestment of dividends and distributions: | | | | | | | | | | |
Class A | | | 5,071 | | | | | | 40,174 | |
Class C | | | — | | | | | | 5,398 | |
Class R | | | 11 | | | | | | 117 | |
Institutional Class | | | 30,131 | | | | | | 37,832 | |
| | | | | | | | | | |
| | | 1,079,745 | | | | | | 4,470,048 | |
| | | | | | | | | | |
Shares redeemed: | | | | | | | | | | |
Class A | | | (262,376 | ) | | | | | (1,554,687 | ) |
Class C | | | (74,939 | ) | | | | | (80,131 | ) |
Class R | | | (3,222 | ) | | | | | (469 | ) |
Institutional Class | | | (980,618 | ) | | | | | (775,428 | ) |
| | | | | | | | | | |
| | | (1,321,155 | ) | | | | | (2,410,715 | ) |
| | | | | | | | | | |
Net increase(decrease) | | | (241,410 | ) | | | | | 2,059,333 | |
| | | | | | | | | | |
7. Line of Credit
The Fund, along with certain other funds in the Delaware Investments® Family of Funds (Participants), was a participant in a $275,000,000 revolving line of credit intended to be used for temporary or emergency purposes as an additional source of liquidity to fund redemptions of investor shares. Under the agreement, the Participants were charged an annual commitment fee of 0.08%, which was allocated across the Participants on the basis of each Participant’s allocation of the entire facility. The Participants were permitted to borrow up to a maximum of one third of their net assets under the agreement. Each Participant was individually, and not jointly, liable for its particular advances, if any, under the line of credit. The line of credit available under the agreement expired on Nov. 9, 2015.
On Nov. 9, 2015, the Fund, along with the other Participants, entered into an amendment to the agreement for a $155,000,000 revolving line of credit. Under the amendment to the agreement, the Participants are charged an annual commitment fee of 0.10%, which is allocated across the Participants on the basis of each Participant’s allocation of the entire facility. Other than the annual commitment fee, the line of credit is to be used as described above and operates in substantially the same manner as the original agreement. The line of credit available under the agreement expires on Nov. 7, 2016.
The Fund had no amounts outstanding as of Nov. 30, 2015, or at any time during the year then ended.
38
8. Derivatives
U.S. GAAP requires disclosures that enable investors to understand: (1) how and why an entity uses derivatives; (2) how they are accounted for; and (3) how they affect an entity’s results of operations and financial position.
Foreign Currency Exchange Contracts — The Fund may enter into foreign currency exchange contracts and foreign cross currency exchange contracts as a way of managing foreign exchange rate risk. The Fund may enter into these contracts to fix the U.S. dollar value of a security that it has agreed to buy or sell for the period between the date the trade was entered into and the date the security is delivered and paid for. The Fund may also use these contracts to hedge the U.S. dollar value of securities it already owns that are denominated in foreign currencies. In addition, the Fund may enter into these contracts to facilitate or expedite the settlement of portfolio transactions. The change in value is recorded as an unrealized gain or loss. When the contract is closed, a realized gain or loss is recorded equal to the difference between the value of the contract at the time it was opened and the value at the time it was closed.
The use of foreign currency exchange contracts and foreign cross currency exchange contracts does not eliminate fluctuations in the underlying prices of the securities, but does establish a rate of exchange that can be achieved in the future. Although foreign currency exchange contracts and foreign cross currency exchange contracts limit the risk of loss due to an unfavorable change in the value of the hedged currency, they also limit any potential gain that might result should the value of the currency change favorably. In addition, the Fund could be exposed to risks if the counterparties to the contracts are unable to meet the terms of their contracts. The Fund’s maximum risk of loss from counterparty credit risk is the value of its currency exchanged with the counterparty. The risk is generally mitigated by having a netting arrangement between the Fund and the counterparty and by the posting of collateral by the counterparty to the Fund to cover the Fund’s exposure to the counterparty.
During the year ended Nov. 30, 2015, the Fund held foreign currency exchange contracts which produced net realized gains and are reflected on the “Statement of operations” under “Net realized gain on foreign currency exchange contracts.”
During the year ended Nov. 30, 2015, the Fund entered into foreign currency exchange contracts to fix the U.S. dollar value of a security between trade date and settlement date.
Derivatives Generally. The table below summarizes the average balance of derivative holdings by the Fund during the year ended Nov. 30, 2015.
| | | | | | | | |
| | | Long Derivatives | | | Short Derivatives | |
| | | Volume | | | Volume | |
Foreign currency exchange contracts (average cost) | | | USD 35,896 | | | | USD 65,354 | |
39
Notes to financial statements
Delaware Focus Global Growth Fund
9. Offsetting
In December 2011, the Financial Accounting Standards Board (FASB) issued guidance that expanded disclosure requirements on the offsetting of certain assets and liabilities. The disclosures are required for investments and derivative financial instruments subject to master netting or similar agreements which are eligible for offset on the “Statement of assets and liabilities” and requires an entity to disclose both gross and net information about such investments and transactions in the financial statements. In January 2013, the FASB issued guidance that clarified which investments and transactions are subject to the offsetting disclosure requirements. The scope of the disclosure requirements for offsetting is limited to derivative instruments, repurchase agreements and reverse repurchase agreements, and securities borrowing. The guidance was effective for financial statements with fiscal years beginning on or after Jan. 1, 2013, and interim periods within those fiscal years.
In order to better define its contractual rights and to secure rights that will help the Fund mitigate its counterparty risk, the Fund entered into an International Swaps and Derivatives Association, Inc. Master Agreement (ISDA Master Agreement) or a similar agreement with certain of its derivative contract counterparties. An ISDA Master Agreement is a bilateral agreement between the Fund and a counterparty that governs certain over-the-counter (OTC) derivatives and foreign exchange contracts and typically contains, among other things, collateral posting items and netting provisions in the event of a default and/or termination event. Under an ISDA Master Agreement, the Fund may, under certain circumstances, offset with the counterparty certain derivative financial instruments’ payables and/or receivables with collateral held and/or posted and create one single net payment. The provisions of the ISDA Master Agreement typically permit a single net payment in the event of default (close-out), including the bankruptcy or insolvency of the counterparty. However, bankruptcy or insolvency laws of a particular jurisdiction may impose restrictions on or prohibitions against the right of offset in bankruptcy, insolvency, or other events.
For financial reporting purposes, the Fund does not offset derivative assets and derivative liabilities that are subject to netting arrangements on the “Statement of assets and liabilities.”
At Nov. 30, 2015, the Fund had the following assets and liabilities subject to offsetting provisions:
Offsetting of Financial Assets and Liabilities and Derivative Assets and Liabilities
| | | | | | | | | | |
Counterparty | | Gross Value of
Derivative Asset | | | | Gross Value of
Derivative Liability | | | | Net Position |
BNY Mellon | | $— | | | | $(777) | | | | $(777) |
| | | | | | | | | | | | |
| | | | | Fair Value of
Non-Cash | | Cash Collateral | | Fair Value of
Non-Cash | | Cash Collateral | | |
Counterparty | | Net Position | | Collateral Received | | Received | | Collateral Pledged | | Pledged | | Net Amount(a) |
BNY Mellon | | $(777) | | $— | | $— | | $— | | $— | | $(777) |
40
Master Repurchase Agreements
| | | | | | | | | | |
| | | Repurchase | | Fair Value of Non-cash | | Cash Collateral | | Net Collateral | | |
Counterparty | | Agreements | | Collateral Received | | Received | | Received | | Net Exposure(a) |
Bank of America
Merrill Lynch | | $ 281,643 | | $ (281,643) | | $— | | $ (281,643) | | $— |
Bank of Montreal | | 469,404 | | (469,404) | | — | | (469,404) | | — |
BNP Paribas | | 691,953 | | (691,953) | | — | | (691,953) | | — |
Total | | $1,443,000 | | $(1,443,000) | | $— | | $(1,443,000) | | $— |
(a)Net amount represents the receivable/(payable) that would be due from/(to) the counterparty in the event of default.
10. Securities Lending
The Fund, along with other funds in the Delaware Investments® Family of Funds, may lend its securities pursuant to a security lending agreement (Lending Agreement) with The Bank of New York Mellon (BNY Mellon). At the time a security is loaned, the borrower must post collateral equal to the required percentage of the market value of the loaned security, including any accrued interest. The required percentage is: (1) 102% with respect to U.S. securities and foreign securities that are denominated and payable in U.S. dollars; and (2) 105% with respect to foreign securities. With respect to each loan, if on any business day the aggregate market value of securities collateral plus cash collateral held is less than the aggregate market value of the securities which are the subject of such loan, the borrower will be notified to provide additional collateral by the end of the following business day which, together with the collateral already held, will be not less than the applicable initial collateral requirements for such security loan. If the aggregate market value of securities collateral and cash collateral held with respect to a security loan exceeds the applicable initial collateral requirement, upon the request of the borrower, BNY Mellon must return enough collateral to the borrower by the end of the following business day to reduce the value of the remaining collateral to the applicable initial collateral requirement for such security loan. As a result of the foregoing, the value of the collateral held with respect to a loaned security on any particular day, may be more or less than the value of the security on loan.
Cash collateral received is generally invested in the Delaware Investments Collateral Fund No. 1 (Collective Trust) established by BNY Mellon for the purpose of investment on behalf of funds managed by DMC that participate in BNY Mellon’s securities lending program. The Collective Trust may invest in U.S. government securities and high quality corporate debt, asset-backed and other money market securities, and in repurchase agreements collateralized by such securities, provided that the Collective Trust will generally have a dollar-weighted average portfolio maturity of 60 days or less. The Fund can also accept U.S. government securities and letters of credit (non-cash collateral) in connection with securities loans. In the event of default or bankruptcy by the lending agent, realization and/or retention of the collateral may be subject to legal proceedings. In the event the borrower fails to return loaned securities and the collateral received is insufficient to cover the value of the loaned securities and provided such collateral shortfall is not the result of investment losses, the lending agent has agreed to pay the amount of the shortfall to the Fund or, at the discretion of the lending agent, replace the loaned securities. The Fund continues to record dividends or interest, as applicable, on the securities loaned
41
Notes to financial statements
Delaware Focus Global Growth Fund
10. Securities Lending (continued)
and is subject to changes in value of the securities loaned that may occur during the term of the loan. The Fund has the right under the Lending Agreement to recover the securities from the borrower on demand. With respect to security loans collateralized by non-cash collateral, the Fund receives loan premiums paid by the borrower. With respect to security loans collateralized by cash collateral, the earnings from the collateral investments are shared among the Fund, the security lending agent, and the borrower. The Fund records security lending income net of allocations to the security lending agent and the borrower.
The Collective Trust used for the investment of cash collateral received from borrowers of securities seeks to maintain a NAV per unit of $1.00, but there can be no assurance that it will always be able to do so. The Fund may incur investment losses as a result of investing securities lending collateral in the Collective Trust. This could occur if an investment in the Collective Trust defaulted or if it were necessary to liquidate assets in the Collective Trust to meet returns on outstanding security loans at a time when the Collective Trust’s NAV per unit was less than $1.00. Under those circumstances, the Fund may not receive an amount from the Collective Trust that is equal in amount to the collateral the Fund would be required to return to the borrower of the securities and the Fund would be required to make up for this shortfall.
During the year ended Nov. 30, 2015, the Fund had no securities out on loan.
11. Credit and Market Risk
Some countries in which the Fund may invest require governmental approval for the repatriation of investment income, capital, or the proceeds of sales of securities by foreign investors. In addition, if there is deterioration in a country’s balance of payments, or for other reasons, a country may impose temporary restrictions on foreign capital remittances abroad.
The securities exchanges of certain foreign markets are substantially smaller, less liquid and more volatile than the major securities markets in the United States. Consequently, acquisition and disposition of securities by the Fund may be inhibited. In addition, a significant portion of the aggregate market value of equity securities listed on the major securities exchanges in emerging markets is held by a smaller number of investors. This may limit the number of shares available for acquisition or disposition by the Fund.
The Fund may invest up to 15% of its net assets in illiquid securities, which may include securities with contractual restrictions on resale, securities exempt from registration under Rule 144A, promulgated under the Securities Act of 1933, as amended, and other securities which may not be readily marketable. The relative illiquidity of these securities may impair the Fund from disposing of them in a timely manner and at a fair price when it is necessary or desirable to do so. While maintaining oversight, the Fund’s Board has delegated to DMC, the day-to-day functions of determining whether individual securities are liquid for purposes of the Fund’s limitation on investments in illiquid securities. Securities eligible for resale pursuant to Rule 144A, which are determined to be liquid, are not subject to the Fund’s 15% limit on investments in illiquid securities. As of Nov. 30, 2015, there were no Rule 144A securities held by the Fund, and no securities have been determined to be illiquid under the Fund’s Liquidity Procedures.
42
12. Contractual Obligations
The Fund enters into contracts in the normal course of business that contain a variety of indemnifications. The Fund’s maximum exposure under these arrangements is unknown. However, the Fund has not had prior claims or losses pursuant to these contracts. Management has reviewed the Fund’s existing contracts and expects the risk of loss to be remote.
13. Recent Accounting Pronouncements
In June 2014, the FASB issued guidance to improve the financial reporting of reverse repurchase agreements and other similar transactions. The guidance includes expanded disclosure requirements for entities that enter into reverse repurchase agreements and similar transactions accounted for as secured borrowings. The guidance is effective for financial statements with fiscal years beginning on or after Dec. 15, 2014 and interim periods within those fiscal years. Management has determined that this pronouncement has no impact to the Fund’s financial statements.
In May 2015, the FASB issued Accounting Standards Update (“ASU”) No. 2015-07 regarding “Disclosures for Investments in Certain Entities That Calculate Net Asset Value per Share.” The amendments in this update are effective for the Fund for fiscal years beginning after Dec. 15, 2015, and interim periods within those fiscal years. ASU No. 2015-07 will eliminate the requirement to categorize investments in the fair value hierarchy if the fair value is measured at NAV per share (or its equivalent) using the practical expedient in the FASB’s fair value measurement guidance. Management is evaluating the impact, if any, of this guidance on the Fund’s financial statement disclosures.
14. Subsequent Events
The Trust now offers five series with the launch of Delaware Macquarie Asia Select Fund on Dec. 21, 2015.
Management has determined that no other material events or transactions occurred subsequent to Nov. 30, 2015 that would require recognition or disclosure in the Fund’s financial statements.
43
Report of independent
registered public accounting firm
To the Board of Trustees of Delaware Group® Global & International Funds
and Shareholders of Delaware Focus Global Growth Fund:
In our opinion, the accompanying statement of assets and liabilities, including the schedule of investments, and the related statements of operations and of changes in net assets and the financial highlights present fairly, in all material respects, the financial position of Delaware Focus Global Growth Fund (one of the series constituting Delaware Group Global & International Funds, hereafter referred to as the “Fund”) at November 30, 2015, the results of its operations for the year then ended, the changes in its net assets for each of the two years in the period then ended and the financial highlights for each of the five years in the period then ended, in conformity with accounting principles generally accepted in the United States of America. These financial statements and financial highlights (hereafter referred to as “financial statements”) are the responsibility of the Fund’s management. Our responsibility is to express an opinion on these financial statements based on our audits. We conducted our audits of these financial statements in accordance with the standards of the Public Company Accounting Oversight Board (United States). Those standards require that we plan and perform the audit to obtain reasonable assurance about whether the financial statements are free of material misstatement. An audit includes examining, on a test basis, evidence supporting the amounts and disclosures in the financial statements, assessing the accounting principles used and significant estimates made by management, and evaluating the overall financial statement presentation. We believe that our audits, which included confirmation of securities at November 30, 2015 by correspondence with the custodian and brokers and the application of alternative auditing procedures where confirmations of security purchases had not been received, provide a reasonable basis for our opinion.
PricewaterhouseCoopers LLP
Philadelphia, Pennsylvania
January 21, 2016
44
Other Fund information (Unaudited)
Delaware Focus Global Growth Fund
Tax Information
The information set forth below is for the Fund’s fiscal year as required by federal income tax laws. Shareholders, however, must report distributions on a calendar year basis for income tax purposes, which may include distributions for portions of two fiscal years of the Fund. Accordingly, the information needed by shareholders for income tax purposes will be sent to them in January of each year. Please consult your tax advisor for proper treatment of this information.
All disclosures are based on financial information available as of the date of this annual report and, accordingly are subject to change. For any and all items requiring reporting, it is the intention of the Fund to report the maximum amount permitted under the Internal Revenue Code and the regulations thereunder.
For the fiscal year ended Nov. 30, 2015, the Fund reports distributions paid during the year as follows:
| | | | |
(A) Ordinary Income Distributions* (Tax Basis) | | | 98.70% | |
(B) Long-Term Capital Gain Distributions (Tax Basis) | | | 1.30% | |
Total Distributions (Tax Basis) | | | 100.00% | |
(C) Qualified Dividends1 | | | 59.12% | |
(A) and (B) are based on a percentage of the Fund’s total distributions.
(C) is based on a percentage of the Fund’s ordinary income distributions.
1 Qualifying dividends represent dividends which qualify for the corporate dividends received deduction.
| * | For the fiscal year ended Nov. 30, 2015, certain dividends paid by the Fund may be subject to a maximum tax rate of 20%. The percentage of dividends paid by the Fund from ordinary income reported as qualified dividend income is 100%. Complete information will be computed and reported in conjunction with your 2015 Form 1099-DIV. |
45
Other Fund information (Unaudited)
Delaware Focus Global Growth Fund
Board consideration of Delaware Focus Global Growth Fund investment management agreement
At a meeting held on Aug. 18–20, 2015 (the “Annual Meeting”), the Board of Trustees (collectively referred to here as the “Board”), including a majority of disinterested or independent Trustees, approved the renewal of the Investment Management Agreement and Sub-Advisory Agreement for Delaware Focus Global Growth Fund (the “Fund”). In making its decision, the Board considered information furnished at regular quarterly Board meetings, including reports detailing Fund performance, investment strategies, and expenses, as well as information prepared specifically in connection with the renewal of the investment advisory and sub-advisory contracts. Information furnished specifically in connection with the renewal of the Investment Management Agreement with Delaware Management Company (“DMC”) and Sub-Advisory Agreement with Jackson Square Partners, LLC (“JSP”) included materials provided by DMC and its affiliates (“Delaware Investments”) and JSP, as applicable, concerning, among other things, the nature, extent, and quality of services provided to the Fund; the costs of such services to the Fund; economies of scale; and the investment manager’s financial condition and profitability. In addition, in connection with the Annual Meeting, reports were provided to the Trustees in May 2015 and included reports provided by Lipper, Inc., an independent statistical compilation organization (“Lipper”). The Lipper reports compared the Fund’s investment performance and expenses with those of other comparable mutual funds. The Independent Trustees reviewed and discussed the Lipper reports with independent legal counsel to the Independent Trustees. In addition to the information noted above, the Board also requested and received information regarding DMC’s or JSP’s, as applicable, policy with respect to advisory fee levels and its breakpoint philosophy; the structure of portfolio manager compensation; comparative client fee information; and any constraints or limitations on the availability of securities for certain investment styles, which had in the past year inhibited, or which were likely in the future to inhibit, the investment manager’s ability to invest fully in accordance with Fund policies.
In considering information relating to the approval of the Fund’s advisory and sub-advisory agreements, the Independent Trustees received assistance and advice from and met separately with independent legal counsel to the Independent Trustees. They also engaged a consultant to assist them in analyzing portions of the data received. The Independent Trustees reviewed and discussed with such consultant two reports prepared by the consultant with respect to such data. Although the Board gave attention to all information furnished, the following discussion identifies, under separate headings, the primary factors taken into account by the Board during its contract renewal considerations.
Nature, extent, and quality of service of DMC. The Board considered the services provided by DMC to the Fund and its shareholders. In reviewing the nature, extent, and quality of services, the Board considered reports furnished to it throughout the year, which covered matters such as the relative performance of the Fund; compliance of portfolio managers with the investment policies, strategies, and restrictions for the Fund; compliance by DMC and Delaware Distributors, L.P. (together, “Management”) personnel with the Code of Ethics adopted throughout the Delaware Investments® Family of Funds complex; and adherence to fair value pricing procedures as established by the Board. The Board was pleased with the current staffing of the Fund’s investment adviser and the emphasis placed on research in the investment process. The Board recognized DMC’s receipt of several industry distinctions during the past several years. The Board gave favorable consideration to DMC’s efforts to control expenditures while maintaining service levels committed to Fund matters. The Board noted that, in the third and fourth quarters of 2013, Management reduced the maximum 12b-1 fee for certain Funds, and in November
46
2013 Management negotiated a substantial reduction in fees for fund accounting services provided to the Funds. The Board noted the benefits provided to Fund shareholders through each shareholder’s ability to exchange an investment in one Delaware Investments fund for the same class of shares in another Delaware Investments fund without a sales charge, to reinvest Fund dividends into additional shares of the Fund or into additional shares of other Delaware Investments funds, and the privilege to combine holdings in other Delaware Investments funds to obtain a reduced sales charge. The Board was satisfied with the nature, extent, and quality of the overall services provided by DMC.
Nature, extent, and quality of service of JSP. The Board considered the services provided by JSP to the Fund and its shareholders. In reviewing the nature, extent, and quality of services, the Board took account of reports furnished to it throughout the year at regular Board Meetings covering matters such as relative performance of the Fund; compliance of portfolio managers with the investment policies, strategies, and restrictions for the Fund; the compliance of JSP personnel with its Code of Ethics; and adherence to fair value pricing procedures as established by the Board. The Board was pleased with the current staffing of JSP and the emphasis placed on research in the investment process. The Board was satisfied with the nature, extent, and quality of the overall services provided by JSP.
Investment performance. The Board placed significant emphasis on the investment performance of the Fund in view of the importance of investment performance to shareholders. Although the Board gave appropriate consideration to performance reports and discussions with portfolio managers at Investment Committee meetings throughout the year, the Board gave particular weight to the Lipper reports furnished for the Annual Meeting. The Lipper reports prepared for the Fund showed the investment performance of its Class A shares in comparison to a group of similar funds as selected by Lipper (the “Performance Universe”). A fund with the best performance ranked first, and a fund with the poorest performance ranked last. The highest/best performing 25% of funds in the Performance Universe make up the first quartile; the next 25%, the second quartile; the next 25%, the third quartile; and the poorest/ worst performing 25% of funds in the Performance Universe make up the fourth quartile. Comparative annualized performance for the Fund was shown for the past 1-, 3-, 5-, and 10-year periods, to the extent applicable, ended March 31, 2015. The Board’s objective is that the Fund’s performance for the periods considered be at or above the median of its Performance Universe.
The Performance Universe for the Fund consisted of the Fund and all retail and institutional global multi-cap growth funds as selected by Lipper. The Lipper report comparison showed that the Fund’s total return for the 1-year period was in the third quartile of its Performance Universe. The report further showed that the Fund’s total return for the 3- and 5-year periods was in the fourth quartile and second quartile, respectively, of its Performance Universe. The Board observed that the Fund’s performance results were not in line with the Board’s objective. In evaluating the Fund’s performance, the Board considered the numerous investment and performance reports delivered by Management personnel to the Board’s Investments Committee. The Board was satisfied that Management was taking action to improve Fund performance and to meet the Board’s performance objective.
47
Other Fund information (Unaudited)
Delaware Focus Global Growth Fund
Board consideration of Delaware Focus Global Growth Fund investment management agreement (continued)
Comparative expenses. The Board considered expense comparison data for the Delaware Investments® Family of Funds. Management provided the Board with information on pricing levels and fee structures for the Fund as of its most recently completed fiscal year. The Board also focused on the comparative analysis of effective management fees and total expense ratios of the Fund versus effective management fees and expense ratios of a group of similar funds as selected by Lipper (the “Expense Group”). In reviewing comparative costs, the Fund’s contractual management fee and the actual management fee incurred by the Fund were compared with the contractual management fees (assuming all funds in the Expense Group were similar in size to the Fund) and actual management fees (as reported by each fund) within the Expense Group, taking into account any applicable breakpoints and fee waivers. The Fund’s total expenses were also compared with those of its Expense Group. The Lipper total expenses, for comparative consistency, were shown by Lipper for Class A shares and comparative total expenses including 12b-1 and non-12b-1 service fees. The Board considered fees paid to DMC for non-management services. The Board’s objective is to limit the Fund’s total expense ratio to be competitive with that of the Expense Group.
The expense comparisons for the Fund showed that its actual management fee was in the quartile with the second highest expenses of its Expense Group and its total expenses were in the quartile with the second lowest expenses of its Expense Group. The Board was satisfied with the total expenses of the Fund in comparison to those of its Expense Group as shown in the Lipper report.
Management profitability of DMC. The Board considered the level of profits realized by DMC in connection with the operation of the Fund. In this respect, the Board reviewed the Investment Management Profitability Analysis that addressed the overall profitability of DMC’s business in providing management and other services to each of the individual funds and the Delaware Investments Family of Funds as a whole. Specific attention was given to the methodology followed in allocating costs for the purpose of determining profitability. Management stated that the level of profits of DMC, to a certain extent, reflects recent operational cost savings and efficiencies initiated by DMC. The Board considered DMC’s efforts to improve services provided to fund shareholders and to meet additional regulatory and compliance requirements resulting from recent industry-wide Securities and Exchange Commission initiatives. The Board also considered the extent to which DMC might derive ancillary benefits from fund operations, including the potential for procuring additional business as a result of the prestige and visibility associated with its role as service provider to the Delaware Investments Family of Funds and the benefits from allocation of fund brokerage to improve trading efficiencies. The Board found that the management fees were reasonable in light of the services rendered and the level of profitability of DMC.
Management profitability of JSP. Trustees were also given available information on profits being realized by in relation to the services being provided to the Fund or in relation to JSP’s overall investment advisory business, but believed such information to be of limited relevance because the sub-advisory fees are paid by DMC out of its management fee, and changes in the level of sub-advisory fees have no impact on Fund expenses. The Board was also provided information on potential fall-out benefits derived or to be derived by JSP in connection with its relationship to the Fund, such as reputational enhancement, soft dollar arrangements or commissions paid to affiliated broker/dealers, as applicable.
48
Economies of scale. The Trustees considered whether economies of scale are realized by DMC as the Fund’s assets increase and the extent to which any economies of scale are reflected in the level of management fees charged. The Trustees reviewed the standardized advisory fee pricing and structure, approved by the Board and shareholders, which includes breakpoints, and which applies to most funds in the Delaware Investments® Family of Funds complex. Breakpoints in the advisory fee occur when the advisory fee rate is reduced on assets in excess of specified levels. Breakpoints result in a lower advisory fee than would otherwise be the case in the absence of breakpoints, when the asset levels specified in the breakpoints are exceeded. The Board noted that the fee under the Fund’s management contract fell within the standardized fee pricing structure. Although the Fund has not reached a size at which it can take advantage of any breakpoints in the applicable fee schedule, the Board recognized that the fee was structured so that if the Fund grows, economies of scale may be shared.
49
Board of trustees / directors and officers addendum
Delaware Investments® Family of Funds
A mutual fund is governed by a Board of Trustees / Directors (“Trustees”), which has oversight responsibility for the management of a fund’s business affairs. Trustees establish procedures and oversee and review the performance of the investment manager, the distributor, and others who perform services for the fund. The independent fund trustees, in particular, are advocates
| | | | |
Name, Address, and Birth Date | | Position(s) Held with Fund(s) | | Length of Time Served |
Interested Trustee | | | | |
Shawn K. Lytle1 | | President, | | Trustee since |
2005 Market Street | | Chief Executive Officer, | | September 2015 |
Philadelphia, PA 19103 | | and Trustee | | |
February 1970 | | | | President and |
| | | | Chief Executive Officer |
| | | | since August 2015 |
Independent Trustees | | | | |
Thomas L. Bennett | | Chairman and Trustee | | Trustee since |
2005 Market Street | | | | March 2005 |
Philadelphia, PA 19103 | | | | |
October 1947 | | | | Chairman since |
| | | | | March 2015 |
Ann D. Borowiec | | Trustee | | Since March 2015 |
2005 Market Street | | | | |
Philadelphia, PA 19103 | | | | |
November 1958 | | | | |
Joseph W. Chow | | Trustee | | Since January 2013 |
2005 Market Street | | | | |
Philadelphia, PA 19103 | | | | |
January 1953 | | | | |
| 1 | Shawn K. Lytle is considered to be an “Interested Trustee” because he is an executive officer of the Fund’s(s’) investment advisor. |
50
for shareholder interests. Each trustee has served in that capacity since he or she was elected to or appointed to the Board of Trustees, and will continue to serve until his or her retirement or the election of a new trustee in his or her place. The following is a list of the Trustees and Officers with certain background and related information.
| | | | |
Principal Occupation(s) During the Past Five Years | | Number of Portfolios in Fund Complex Overseen by Trustee or Officer | | Other Directorships Held by Trustee or Officer |
| | | | |
Shawn K. Lytle has served as | | 65 | | Trustee — UBS |
President of | | | | Relationship Funds, |
Delaware Investments2 | | | | SMA Relationship |
since June 2015 and was the | | | | Trust, and UBS Funds |
Regional Head of Americas for | | | | (May 2010–April 2015) |
UBS Global Asset | | | | |
Management from | | | | |
2010 through 2015. | | | | |
| | | | |
Private Investor | | 65 | | Director — |
(March 2004–Present) | | | | Bryn Mawr Bank Corp. (BMTC) |
| | | | (2007–2011) |
| | |
| | | | | |
Chief Executive Officer | | 65 | | None |
Private Wealth Management | | | | |
(2011–2013) and | | | | |
Market Manager, | | | | |
New Jersey Private | | | | |
Bank (2005–2011) — | | | | |
J.P. Morgan Chase & Co. | | | | |
Executive Vice President | | 65 | | Director and Audit Committee |
(Emerging Economies | | | | Member — Hercules |
Strategies, Risks, and | | | | Technology Growth |
Corporate Administration) | | | | Capital, Inc. |
State Street Corporation | | | | (2004–2014) |
(July 2004–March 2011) | | | | |
| 2 | Delaware Investments is the marketing name for Delaware Management Holdings, Inc. and its subsidiaries, including the Fund’s(s’) investment advisor, principal underwriter, and its transfer agent. |
51
Board of trustees / directors and officers addendum
Delaware Investments® Family of Funds
| | | | |
Name, Address, and Birth Date | | Position(s) Held with Fund(s) | | Length of Time Served |
Independent Trustees (continued) | | | | |
John A. Fry | | Trustee | | Since January 2001 |
2005 Market Street | | | | |
Philadelphia, PA 19103 | | | | |
May 1960 | | | | |
Lucinda S. Landreth | | Trustee | | Since March 2005 |
2005 Market Street | | | | |
Philadelphia, PA 19103 | | | | |
June 1947 | | | | |
Frances A. Sevilla-Sacasa | | Trustee | | Since September 2011 |
2005 Market Street | | | | |
Philadelphia, PA 19103 | | | | |
January 1956 | | | | |
52
| | | | |
Principal Occupation(s) During the Past Five Years | | Number of Portfolios in Fund Complex Overseen by Trustee or Officer | | Other Directorships Held by Trustee or Officer |
| | | | |
President — | | 65 | | Director — Hershey Trust |
Drexel University | | | | Company |
(August 2010–Present) | | | | |
| | | | Director, Audit Committee, |
President — | | | | and Governance Committee |
Franklin & Marshall College | | | | Member — Community |
(July 2002–July 2010) | | | | Health Systems |
| | | | Director — Drexel |
| | | | | Morgan & Co. |
Private Investor | | 65 | | None |
(2004–Present) | | | | |
| | |
| | | | | |
Chief Executive Officer — | | 65 | | Trust Manager and |
Banco Itaú | | | | Audit Committee |
International | | | | Member — Camden |
(April 2012–Present) | | | | Property Trust |
| | |
| | | | |
Executive Advisor to Dean | | | | |
(August 2011–March 2012) and Interim Dean | | | | |
(January 2011–July 2011) — | | | | |
University of Miami School of | | | | |
Business Administration | | | | |
| | |
| | | | |
President — U.S. Trust, | | | | |
Bank of America Private | | | | |
Wealth Management | | | | |
(Private Banking) | | | | |
(July 2007–December 2008) | | | | |
53
Board of trustees / directors and officers addendum
Delaware Investments® Family of Funds
| | | | |
Name, Address, and Birth Date | | Position(s) Held with Fund(s) | | Length of Time Served |
Independent Trustees (continued) | | | | |
Thomas K. Whitford | | Trustee | | Since January 2013 |
2005 Market Street | | | | |
Philadelphia, PA 19103 | | | | |
March 1956 | | | | |
Janet L. Yeomans | | Trustee | | Since April 1999 |
2005 Market Street | | | | |
Philadelphia, PA 19103 | | | | |
July 1948 | | | | |
54
| | | | |
Principal Occupation(s) During the Past Five Years | | Number of Portfolios in Fund Complex Overseen by Trustee or Officer | | Other Directorships Held by Trustee or Officer |
| | | | |
Vice Chairman | | 65 | | Director — HSBC Finance |
(2010–April 2013), | | | | Corporation and HSBC |
Chief Administrative | | | | North America Holdings Inc. |
Officer (2008–2010), | | | | |
and Executive Vice | | | | Director — |
President and Chief | | | | HSBC Bank |
Administrative Officer | | | | |
(2007–2009) — | | | | |
PNC Financial | | | | |
Services Group | | | | |
Vice President and Treasurer | | 65 | | Director, Audit and |
(January 2006–July 2012) | | | | Compliance Committee Chair, |
Vice President — | | | | Investment Committee |
Mergers & Acquisitions | | | | Member, and Governance |
(January 2003–January 2006), | | | | Committee Member — |
and Vice President | | | | Okabena Company |
and Treasurer | | | | |
(July 1995–January 2003) | | | | Chair — 3M |
3M Corporation | | | | Investment Management |
| | | | Company |
| | | | | (2005–2012) |
55
Board of trustees / directors and officers addendum
Delaware Investments® Family of Funds
| | | | |
Name, Address, and Birth Date | | Position(s) Held with Fund(s) | | Length of Time Served |
Officers | | | | |
David F. Connor | | Senior Vice President, | | Senior Vice President |
2005 Market Street | | General Counsel, | | since May 2013; |
Philadelphia, PA 19103 | | and Secretary | | General Counsel |
December 1963 | | | | since May 2015; |
| | | | Secretary since |
| | | | | October 2005 |
Daniel V. Geatens | | Vice President | | Treasurer since October 2007 |
2005 Market Street | | and Treasurer | | |
Philadelphia, PA 19103 | | | | |
October 1972 | | | | |
Richard Salus | | Senior Vice President | | Chief Financial Officer |
2005 Market Street | | and Chief Financial Officer | | since November 2006 |
Philadelphia, PA 19103 | | | | |
October 1963 | | | | |
The Statement of Additional Information for the Fund(s) includes additional information about the Trustees and Officers and is available, without charge, upon request by calling 800 523-1918.
56
| | | | |
Principal Occupation(s) During the Past Five Years | | Number of Portfolios in Fund Complex Overseen by Trustee or Officer | | Other Directorships Held by Trustee or Officer |
| | | | |
David F. Connor has served as | | 65 | | None3 |
Senior Vice President of the Fund(s) and the investment advisor since 2013, General Counsel of the Fund(s) and the investment advisor since 2015, and Secretary of the Fund(s) and the investment advisor since 2005. | | | | |
Daniel V. Geatens has served | | 65 | | None3 |
as Vice President and | | | | |
Treasurer of the Fund(s) since 2007 and Vice President and Director of Financial | | | | |
Administration of the investment advisor since 2010. | | | | |
Richard Salus has served as | | 65 | | None3 |
Senior Vice President and Chief Financial Officer of the Fund(s) and the investment advisor since 2006. | | | | |
| 3 | David F. Connor, Daniel V. Geatens, and Richard Salus serve in similar capacities for the six portfolios of the Optimum Fund Trust, which have the same investment advisor, principal underwriter, and transfer agent as the registrant. |
57
About the organization
| | | | | | |
Board of trustees | | | | | | |
| Shawn K. Lytle | | Ann D. Borowiec | | John A. Fry | | Frances A. |
President and Chief Executive Officer Delaware Investments® Family of Funds Philadelphia, PA Thomas L. Bennett Chairman of the Board Delaware Investments Family of Funds Private Investor Rosemont, PA | | Former Chief Executive
Officer Private Wealth Management J.P. Morgan Chase & Co. New York, NY Joseph W. Chow Former Executive Vice
President State Street Corporation Boston, MA | | President Drexel University Philadelphia, PA Lucinda S. Landreth Former Chief Investment
Officer Assurant, Inc. New York, NY | | Sevilla-Sacasa Chief Executive Officer Banco Itaú International Miami, FL Thomas K. Whitford Former Vice Chairman PNC Financial Services Group Pittsburgh, PA Janet L. Yeomans Former Vice President and Treasurer 3M Corporation St. Paul, MN |
Affiliated officers | | | | | | |
| David F. Connor | | Daniel V. Geatens | | Richard Salus | | |
Senior Vice President, General Counsel,
and Secretary Delaware Investments Family of Funds Philadelphia, PA | | Vice President and
Treasurer Delaware Investments Family of Funds Philadelphia, PA | | Senior Vice President and Chief Financial Officer Delaware Investments Family of Funds Philadelphia, PA | | |
This annual report is for the information of Delaware Focus Global Growth Fund shareholders, but it may be used with prospective investors when preceded or accompanied by the Delaware Investments Fund fact sheet for the most recently completed calendar quarter. These documents are available at delawareinvestments.com.
Delaware Investments is the marketing name of Delaware Management Holdings, Inc. and its subsidiaries.
The Fund files its complete schedule of portfolio holdings with the Securities and Exchange Commission (SEC) for the first and third quarters of each fiscal year on Form N-Q. The Fund’s Forms N-Q, as well as a description of the policies and procedures that the Fund uses to determine how to vote proxies (if any) relating to portfolio securities are available without charge (i) upon request, by calling 800 523-1918; and (ii) on the SEC’s website at sec.gov. In addition, a description of the policies and procedures that the Fund uses to determine how to vote proxies (if any) relating to portfolio securities and the Schedule of Investments included in the Fund’s most recent Form N-Q are available without charge on the Fund’s website at delawareinvestments.com. The Fund’s Forms N-Q may be reviewed and copied at the SEC’s Public Reference Room in Washington, D.C.; information on the operation of the Public Reference Room may be obtained by calling 800 SEC-0330.
Information (if any) regarding how the Fund voted proxies relating to portfolio securities during the most recently disclosed 12-month period ended June 30 is available without charge (i) through the Fund’s website at delawareinvestments.com; and (ii) on the SEC’s website at sec.gov.
58
Item 2. Code of Ethics
The registrant has adopted a code of ethics that applies to the registrant’s principal executive officer, principal financial officer, principal accounting officer or controller, or persons performing similar functions, regardless of whether these individuals are employed by the registrant or a third party. A copy of the registrant’s Code of Business Ethics has been posted on the Delaware Investments Internet Web site at www.delawareinvestments.com. Any amendments to the Code of Business Ethics, and information on any waiver from its provisions granted by the registrant, will also be posted on this Web site within five business days of such amendment or waiver and will remain on the Web site for at least 12 months.
Item 3. Audit Committee Financial Expert
The registrant’s Board of Trustees/Directors has determined that certain members of the registrant’s Audit Committee are audit committee financial experts, as defined below. For purposes of this item, an “audit committee financial expert” is a person who has the following attributes:
a. An understanding of generally accepted accounting principles and financial statements;
b. The ability to assess the general application of such principles in connection with the accounting for estimates, accruals, and reserves;
c. Experience preparing, auditing, analyzing, or evaluating financial statements that present a breadth and level of complexity of accounting issues that are generally comparable to the breadth and complexity of issues that can reasonably be expected to be raised by the registrant’s financial statements, or experience actively supervising one or more persons engaged in such activities;
d. An understanding of internal controls and procedures for financial reporting; and
e. An understanding of audit committee functions.
An “audit committee financial expert” shall have acquired such attributes through:
a. Education and experience as a principal financial officer, principal accounting officer, controller, public accountant, or auditor or experience in one or more positions that involve the performance of similar functions;
b. Experience actively supervising a principal financial officer, principal accounting officer, controller, public accountant, auditor, or person performing similar functions;
c. Experience overseeing or assessing the performance of companies or public accountants with respect to the preparation, auditing, or evaluation of financial statements; or
d. Other relevant experience.
The registrant’s Board of Trustees/Directors has also determined that each member of the registrant’s Audit Committee is independent. In order to be “independent” for purposes of this item, the Audit Committee member may not: (i) other than in his or her capacity as a member of the Board of Trustees/Directors or any committee thereof, accept directly or indirectly any consulting, advisory or other compensatory fee from the issuer; or (ii) be an “interested person” of the registrant as defined in Section 2(a)(19) of the Investment Company Act of 1940.
The names of the audit committee financial experts on the registrant’s Audit Committee are set forth below:
Item 4. Principal Accountant Fees and Services
The aggregate fees billed for services provided to the registrant by its independent auditors for the audit of the registrant’s annual financial statements and for services normally provided by the independent auditors in connection with statutory and regulatory filings or engagements were $118,060 for the fiscal year ended November 30, 2015.
The aggregate fees billed for services provided to the registrant by its independent auditors for the audit of the registrant’s annual financial statements and for services normally provided by the independent auditors in connection with statutory and regulatory filings or engagements were $108,800 for the fiscal year ended November 30, 2014.
The aggregate fees billed by the registrant’s independent auditors for services relating to the performance of the audit of the registrant’s financial statements and not reported under paragraph (a) of this Item were $0 for the fiscal year ended November 30, 2015.
The aggregate fees billed by the registrant’s independent auditors for services relating to the performance of the audit of the registrant’s financial statements and not reported under paragraph (a) of this Item were $0 for the fiscal year ended November 30, 2014.
The aggregate fees billed by the registrant’s independent auditors for tax-related services provided to the registrant’s investment adviser and other service providers under common control with the adviser and that relate directly to the operations or financial reporting of the registrant were $0 for the registrant’s fiscal year ended November 30, 2015.
The aggregate fees billed by the registrant’s independent auditors for tax-related services provided to the registrant’s investment adviser and other service providers under common control with the adviser and that relate directly to the operations or financial reporting of the registrant were $0 for the registrant’s fiscal year ended November 30, 2014.
The aggregate fees billed for all services provided by the independent auditors to the registrant other than those set forth in paragraphs (a), (b) and (c) of this Item were $0 for the fiscal year ended November 30, 2015.
The aggregate fees billed for all services provided by the independent auditors to the registrant other than those set forth in paragraphs (a), (b) and (c) of this Item were $0 for the fiscal year ended November 30, 2014.
(e) The registrant’s Audit Committee has established pre-approval policies and procedures as permitted by Rule 2-01(c)(7)(i)(B) of Regulation S-X (the “Pre-Approval Policy”) with respect to services provided by the registrant’s independent auditors. Pursuant to the Pre-Approval Policy, the Audit Committee has pre-approved the services set forth in the table below with respect to the registrant up to the specified fee limits. Certain fee limits are based on aggregate fees to the registrant and other registrants within the Delaware Investments Family of Funds.
Under the Pre-Approval Policy, the Audit Committee has also pre-approved the services set forth in the table below with respect to the registrant’s investment adviser and other entities controlling, controlled by or under common control with the investment adviser that provide ongoing services to the registrant (the “Control Affiliates”) up to the specified fee limit. This fee limit is based on aggregate fees to the investment adviser and its Control Affiliates.
The Pre-Approval Policy requires the registrant’s independent auditors to report to the Audit Committee at each of its regular meetings regarding all services initiated since the last such report was rendered, including those services authorized by the Pre-Approval Policy.
(f) Not applicable.
(g) The aggregate non-audit fees billed by the registrant’s independent auditors for services rendered to the registrant and to its investment adviser and other service providers under common control with the adviser were $11,111,212 and $5,653,375 for the registrant’s fiscal years ended November 30, 2015 and November 30, 2014, respectively.
(h) In connection with its selection of the independent auditors, the registrant’s Audit Committee has considered the independent auditors’ provision of non-audit services to the registrant’s investment adviser and other service providers under common control with the adviser that were not required to be pre-approved pursuant to Rule 2-01(c)(7)(ii) of Regulation S-X. The Audit Committee has determined that the independent auditors’ provision of these services is compatible with maintaining the auditors’ independence.
Item 5. Audit Committee of Listed Registrants
Not applicable.
Item 6. Investments
(a) Included as part of report to shareholders filed under Item 1 of this Form N-CSR.
(b) Divestment of securities in accordance with Section 13(c) of the Investment Company Act of 1940.
Not applicable.
Item 7. Disclosure of Proxy Voting Policies and Procedures for Closed-End Management Investment Companies
Not applicable.
Item 8. Portfolio Managers of Closed-End Management Investment Companies
Not applicable.
Item 9. Purchases of Equity Securities by Closed-End Management Investment Company and Affiliated Purchasers
Not applicable.
Item 10. Submission of Matters to a Vote of Security Holders
Not applicable.
Item 11. Controls and Procedures
The registrant’s principal executive officer and principal financial officer have evaluated the registrant’s disclosure controls and procedures within 90 days of the filing of this report and have concluded that they are effective in providing reasonable assurance that the information required to be disclosed by the registrant in its reports or statements filed under the Securities Exchange Act of 1934 is recorded, processed, summarized and reported within the time periods specified in the rules and forms of the Securities and Exchange Commission.
There were no significant changes in the registrant’s internal control over financial reporting that occurred during the second fiscal quarter of the period covered by the report to stockholders included herein (i.e., the registrant’s fourth fiscal quarter) that have materially affected, or are reasonably likely to materially affect, the registrant’s internal control over financial reporting.
Item 12. Exhibits
Not applicable.
(2) Certifications of Principal Executive Officer and Principal Financial Officer pursuant to Rule 30a-2 under the Investment Company Act of 1940 are attached hereto as Exhibit 99.CERT.
(3) Written solicitations to purchase securities pursuant to Rule 23c-1 under the Securities Exchange Act of 1934.
Not applicable.
(b) Certifications pursuant to Section 906 of the Sarbanes-Oxley Act of 2002 are furnished herewith as Exhibit 99.906CERT.
Pursuant to the requirements of the Securities Exchange Act of 1934 and the Investment Company Act of 1940, the registrant has duly caused this report to be signed on its behalf, by the undersigned, thereunto duly authorized.
Pursuant to the requirements of the Securities Exchange Act of 1934 and the Investment Company Act of 1940, this report has been signed below by the following persons on behalf of the registrant and in the capacities and on the dates indicated.