Item 1. Reports to Stockholders
Global / international equity mutual funds
Delaware Emerging Markets Fund
Delaware Global Value Fund
Delaware International Small Cap Fund
Delaware International Value Equity Fund
November 30, 2018
Carefully consider the Funds’ investment objectives, risk factors, charges, and expenses before investing. This and other information can be found in the Funds’ prospectus and their summary prospectuses, which may be obtained by visiting delawarefunds.com/literature or calling 800523-1918. Investors should read the prospectus and the summary prospectus carefully before investing.
You can obtain shareholder reports and prospectuses online instead of in the mail.
Visit delawarefunds.com/edelivery.

Experience Delaware Funds®by Macquarie
Macquarie Investment Management (MIM) is a global asset manager with offices throughout the United States, Europe, Asia, and Australia. We are active managers who prioritize autonomy and accountability at the investment team level in pursuit of opportunities that matter for our clients. Delaware Funds is one of the longest-standing mutual fund families, with more than 75 years in existence.
If you are interested in learning more about creating an investment plan, contact your financial advisor.
You can learn more about Delaware Funds or obtain a prospectus for Delaware Emerging Markets Fund, Delaware Global Value Fund, Delaware International Small Cap Fund, and Delaware International Value Equity Fund at delawarefunds.com/literature.
Manage your account online
| ● | | Check your account balance and transactions |
| ● | | View statements and tax forms |
| ● | | Make purchases and redemptions |
Visit delawarefunds.com/account-access.
Macquarie Asset Management (MAM) offers a diverse range of products including securities investment management, infrastructure and real asset management, and fund and equity-based structured products. MIM is the marketing name for certain companies comprising the asset management division of Macquarie Group. This includes the following registered investment advisers: Macquarie Investment Management Business Trust (MIMBT), Macquarie Funds Management Hong Kong Limited, Macquarie Investment Management Austria Kapitalanlage AG, Macquarie Investment Management Global Limited, Macquarie Investment Management Europe Limited, and Macquarie Capital Investment Management LLC.
The Funds are distributed byDelaware Distributors, L.P.
(DDLP), an affiliate of MIMBT and Macquarie Group Limited.
Other than Macquarie Bank Limited (MBL), none of the entities noted are authorized deposit-taking institutions for the purposes of the Banking Act 1959 (Commonwealth of Australia). The obligations of these entities do not represent deposits or other liabilities of MBL. MBL does not guarantee or otherwise provide assurance in respect of the obligations of these entities, unless noted otherwise. The Funds are governed by US laws and regulations.
Unless otherwise noted, views expressed herein are current as of Nov. 30, 2018, and subject to change for events occurring after such date.
The Funds are not FDIC insured and are not guaranteed. It is possible to lose the principal amount invested.
Advisory services provided by Delaware Management Company, a series of MIMBT, a US registered investment advisor.
All third-party marks cited are the property of their respective owners.
© 2019 Macquarie Management Holdings, Inc.
| | |
| Portfolio management review | | |
| Delaware Emerging Markets Fund | | December 11, 2018 |
| | | | | | | | |
| Performance preview (for the year ended November 30, 2018) | | | | | | |
Delaware Emerging Markets Fund (Institutional Class shares) | | | 1-year return | | | | -11.21% | |
Delaware Emerging Markets Fund (Class A shares) | | | 1-year return | | | | -11.40% | |
MSCI Emerging Markets Index (net) | | | 1-year return | | | | -9.09% | |
MSCI Emerging Markets Index (gross) | | | 1-year return | | | | -8.75% | |
Past performance does not guarantee future results.
For complete, annualized performance for Delaware Emerging Markets Fund, please see the table on page 13. Institutional Class shares are not subject to a sales charge and are offered for sale exclusively to certain eligible investors. In addition, Institutional Class shares pay no distribution and service fee.
The performance of Class A shares excludes the applicable sales charge. Both Institutional Class shares and Class A shares reflect the reinvestment of all distributions.
Please see page 15 for a description of the index. Index performance returns do not reflect any management fees, transaction costs, or expenses. Indices are unmanaged and one cannot invest directly in an index.
The MSCI Emerging Markets Index (net) fell 9% during the fiscal year ended Nov. 30, 2018. Concerns related to US interest rate tightening and a rising US dollar led to depreciation in emerging markets currencies and rate hikes in some countries. This in turn raised concerns about weakening economic growth and higher inflation. Additionally, persistent rhetoric around tariffs and trade ratcheted up, especially between the United States and China.
Country-specific concerns were also present, particularly related to Turkey, South Africa, and China, as well as elections in Brazil and Mexico. Sector performance varied widely. Energy delivered the strongest performance on the back of higher oil prices. In contrast, the technology sector declined largely on concerns about both the semiconductor cycle peaking and the Chinese Internet sector.
Within the Fund
For the fiscal year ended Nov. 30, 2018, Delaware Emerging Markets Fund underperformed its benchmark, the MSCI Emerging Markets Index (net). The Fund’s Institutional Class shares declined 11.21%. The Fund’s Class A shares fell 11.40% at net asset value and fell 16.50% at maximum offer price. These figures reflect all distributions reinvested. During the same period, the Fund’s benchmark declined 9.09%. For
| | |
Considering the varied macroeconomic backdrop that we see across emerging markets, we believe there are selective opportunities for long-term stock appreciation potential, which may be driven by structural demographic shifts, technology adoption, implementation of government policy, improvement in corporate governance, and industry consolidation. We have found that in markets where price action is heavily macro driven, investors can often misprice individual companies significantly. Our investment approach remains centered on identifying individual companies that we believe possess sustainable franchises and favorable long-term growth prospects and that trade at levels below our assessment of their intrinsic value. | | |
1
Portfolio management review
Delaware Emerging Markets Fund
complete, annualized performance of Delaware Emerging Markets Fund, please see the table on page 13.
The Fund’s holdings in China detracted the most from relative performance due to unfavorable stock selection. Concerns about slower economic growth, exacerbated by rising trade tensions, weighed on advertising-driven stocks such asSINA Corp. ChinaandWeibo Corp.In addition, tightening government regulations in the gaming sector adversely affected sentiment toward stocks such as Internet companySohu.com Ltd., which has an online multi-player gaming subsidiary. Shares of ecommerce firmJD.com Inc.declined following allegations of misconduct by its chairman and CEO. Despite these concerns, we retain our optimistic view about long-term consumption growth and Internet engagement in China, and we continue to see these companies as well positioned to potentially capitalize, particularly if these trends continue.
In Taiwan, shares of electronics manufacturerHon Hai Precision Industry Co. Ltd.declined earlier this year as first-quarter margins were weaker than expected. We believe that the company is positioning itself for growth opportunities in areas such as smart devices, automation, and electric vehicles, and the company’s diverse components portfolio and manufacturing experience, which if successful, may provide a strong competitive advantage. Semiconductor chip makerMediaTek Inc.underperformed due to concerns about Chinese smartphone demand. Despite this underperformance, MediaTek has, in our view, strong technology capabilities in mobile basebands, chipsets, andWi-Fi. As mobile technology penetrates more deeply into everyday products, we see the potential for attractive structural growth opportunities for the company.
The Fund’s overweight allocation to Argentina detracted from performance as the peso came under pressure due to greater reliance on external
funding, higher inflation, and rising US interest rates. Despite higher macroeconomic volatility, we believe the Fund’s holdings are appropriately positioned and remain invested. The primary detractors in Argentina were real estate developerIRSA Inversiones y Representaciones S.A.and agricultural firmCresud SACIF y A.Other detractors from relative performance included Qatar, Thailand, and Malaysia, where the Fund’s underweight positioning was unfavorable.
On the positive side, among countries, holdings in South Korea contributed the most to the Fund’s relative performance due to positive stock selection. Shares of telecommunication services operatorsSK Telecom Co. Ltd.andLG Uplus Corp.rose, supported by a stable operating environment and, what we view as, inexpensive valuations. We remain optimistic about the potential for these companies’ long-term growth opportunities in 5G.
In Brazil, positive stock selection and favorable asset allocation contributed to relative performance. Shares ofB2W Cia Digitalgained due to optimism about the company’s shift in sales strategy. We continue to believe that the company is well positioned if structural growth continues in Brazil’s ecommerce industry, which appears to be still in its early stages of development. Shares of energy giantPetroleo Brasileiro S.A. (Petrobras)likewise performed well as the company showed progress on both divesture and operations. Shares of banksBanco Santander Brasil S.A.andItau Unibanco Holding S.A.performed well due to expectations for accelerating growth in Brazil. This outperformance was somewhat mitigated by the Fund’s position in food companyBRF S.A.Shares were hit hard following news that the company was under investigation for forging records. Although this will likely weigh on short-term results, we believe that the company’s brand and operations are largely preserved and therefore has the potential to recover.
2
Elsewhere, in Russia, rising energy prices drove performance of energy giantsRosneft Oil Co. PJSCandGazprom PJSC.In India, favorable stock selection contributed to the Fund’s relative performance as shares ofReliance Industries Ltd.rose. The company reported strong financial results, driven by both its refining and petrochemicals businesses, and its telecommunications business. Furthermore, the company has increasingly focused on strengthening its media and retail businesses. Finally, the Fund’s underweight positioning in South Africa contributed to relative performance as currency depreciation weighed on the equity market.
Among sectors, the financials sector detracted most from relative performance as the Fund’s underweight stance hurt returns. Shares ofChina Construction Bank Corp.also underperformed, and we sold them from the Fund during the12-month period. In contrast, energy contributed the most to performance due to the Fund’s positions in Reliance Industries in India and Rosneft in Russia. The consumer discretionary sector also outperformed due to the Fund’s position in B2W.
Our positive long-term view on emerging markets remains intact. Despite ongoing political and macro concerns in many parts of the world, we believe that monetary and fiscal policies, coupled with government reform measures, appears likely to provide support for emerging economies. We continue to believe that the Chinese economy has the potential to muddle through, supported by structural growth in consumption, improvements
in living standards, and targeted policies from the government. While in the near term, macro risks seem to dominate investor sentiment, we believe these risks may be more manageable than the market appears to assume.
Considering the varied macroeconomic backdrop that we see across emerging markets, we believe there are selective opportunities for long-term stock appreciation potential, which may be driven by structural demographic shifts, technology adoption, implementation of government policy, improvement in corporate governance, and industry consolidation.
We have found that in markets where price action is heavily macro driven, investors can often misprice individual companies significantly. Our investment approach remains centered on identifying individual companies that we believe possess sustainable franchises and favorable long-term growth prospects and that trade at levels below our assessment of their intrinsic value. We are particularly focused on companies that we believe could benefit from long-term changes in how people in emerging markets live and work.
Among countries, the Fund currently holds overweight positions in Brazil, Russia, South Korea, and Mexico. Conversely, the Fund is currently underweight South Africa and Taiwan. Sectors we currently favor include technology, communication services, and consumer staples. The Fund has an underweight allocation to financials.
3
| | |
| Portfolio management review | | |
| Delaware Global Value Fund | | December 11, 2018 |
| | | | | | | | |
| Performance preview (for the year ended November 30, 2018) | | | | | | |
Delaware Global Value Fund (Institutional Class shares) | | | 1-year return | | | | -8.20% | |
Delaware Global Value Fund (Class A shares)* | | | 1-year return | | | | -8.38% | |
MSCI World Index (net) | | | 1-year return | | | | +0.14% | |
MSCI World Index (gross) | | | 1-year return | | | | +0.68% | |
Past performance does not guarantee future results.
For complete, annualized performance for Delaware Global Value Fund, please see the table on page 17. Institutional Class shares are not subject to a sales charge and are offered for sale exclusively to certain eligible investors. In addition, Institutional Class shares pay no distribution and service fee.
The performance of Class A shares excludes the applicable sales charge. Both Institutional Class shares and Class A shares reflect the reinvestment of all distributions.
Please see page 19 for a description of the index. Index performance returns do not reflect any management fees, transaction costs, or expenses. Indices are unmanaged and one cannot invest directly in an index.
*Total return for the report period presented in the table differs from the return in “Financial highlights.” The total return presented in the above table is calculated based on the net asset value (NAV) at which shareholder transactions were processed. The total return presented in “Financial highlights” is calculated in the same manner, but also takes into account certain adjustments that are necessary under US generally accepted accounting principles (US GAAP) required in the annual report.
Economic developments / market drivers
After remarkably steady improvement in the market’s appreciation of global economic drivers for the duration of 2017, uncertainty regained prominence in 2018. Though major economies remained within uptrends and stimulus in many regions remained in play, leading sentiment measures generally cooled. Meanwhile, unsettled political conditions both within major economic blocs and with respect to the trade regimes between them further helped to dispel complacency about the durability of the current cycle of global growth. Stocks reflected this growing skepticism through higher volatility, lack of a clear market direction, and a mix of performance that favored stable, defensive characteristics.
● US market conditions displayed a curious combination. The US Federal Reserve’s rate increases were accompanied by comments by Chairman Jerome H. Powell indicating confident satisfaction that the economy was on a solid track. Jobs continued to grow, retail and industrial activity remained on firm footing, and inflation was contained. All of this was true in 2017, however, while some leading indicators such as the Purchasing Managers’ Index (PMI) showed pronounced signs of slowing (albeit to a still-strong level), trade tensions continued to increase, and domestic politics remained unsettled. The
| | |
● After a calm 2017, markets became more uncertain and volatile in 2018. ● While the US market showed ongoing relative strength — albeit with a negative impact from trade tensions and concerns over rising interest rates — Europe, Japan, and emerging markets were notably weaker. ● The Fund trailed its benchmark because of both stock selection and asset allocation effects. | | |
4
confidence behind solid returns of US equities through September wavered during October’s selloff, but the position of the United States as a perceived safe haven against rising risks elsewhere kept it well ahead of global alternatives through the full fiscal year.
● Europe’s stocks told the other side of the US momentum story. Economic sentiment indicators, while remaining positive and showing signs of stabilizing, remained well below the unsustainably high readings that prevailed in late 2017. In addition, ongoing concerns with the Italian government’s ability to fund its budgetary ambitions were compounded by a currency crisis in Turkey. Perceived exposure to trade tensions and an uncertain outcome of Brexit negotiations completed the picture, and though these troubles were manifest in heightened volatility of equity performance rather than in absolute declines for most of the year, the contrast with the US was clear.
● Japan’s equity performance showed little to be desired for much of the period, with its relatively stable but uninspiring economic indicators reflected in a similarly undistinguished equity market trajectory. Exposure to trade tensions, among other things, placed it among the weaker regions early on, but a combination of 3.0% second-quarter gross domestic product (GDP) annualized growth and strong electoral endorsement for Shinzo Abe’s government helped propel a rebound. Accompanied by a meaningful increase in the country’s notably low bond yields, this burgeoning optimism helped support most Japanese equity sectors in the second half of the fiscal year.
● The emerging markets’ reversal of fortune began in late March and persisted through November. These markets bore the brunt of fears related to the future of the global trading regime. China, having the most prominently mentioned role in global supply chains, was most commonly cited as the locus of concerns affecting emerging
markets more broadly. There were few pockets of strength, with only Brazil, Russia, and Thailand among the major emerging markets outperforming the MSCI ACWI (All Country World Index).
Within the Fund
For the fiscal year ended Nov. 30, 2018, Delaware Global Value Fund underperformed its benchmark, the MSCI World Index (net). The Fund’s Institutional Class shares declined 8.20%. The Fund’s Class A shares fell 8.38% at net asset value and fell 13.67% at maximum offer price. These figures reflect all distributions reinvested. During the same period, the Fund’s benchmark gained 0.14%. For complete, annualized performance of Delaware Global Value Fund, please see the table on page 17.
With late-cycle patterns of relative performance presenting a challenge to the Fund’s value style, the Fund underperformed the benchmark primarily due to a combination of stock selection and allocation effects. On a sector basis, positive stock selection in materials was more than offset by weakness in consumer discretionary, consumer staples, and technology. Overall sector allocation also detracted from relative performance, with the adverse effect of overweight exposures to financials and industrials more than offsetting an underweight exposure to materials. On a regional basis, weak stock selection in the euro zone and the US more than offset strong stock selection in Canada and Europe ex euro zone. Overall regional allocation detracted from relative performance due to a US underweight and an overweight tonon-US regions. Net currency effect added to this pattern, hurting relative returns through an underweight in the US dollar and an overweight to other currencies.
The Fund’s trading activity during the fiscal year included trimming positions and redeploying the proceeds at what we viewed as attractive valuations. This activity involved a variety of
5
Portfolio management review
Delaware Global Value Fund
sectors and regions but did not result in material changes to the Fund’s portfolio positioning.
Prospective global market drivers and general outlook
The confluence of economics and politics found interesting expression in equity price movements during the fiscal year, but uniformity was not among its main traits. On the economic front, the Fed’s now well-established shift toward monetary normalization contrasted with earlier phases of recovery in Europe and Japan, where interest rates remain extremely low. The market responses one might expect under these conditions, such as relative outperformance by late-cycle secular growth in the US and a more procyclical mix of performance in other regions, was only partly borne out in a period that saw abrupt and inconsistent rotations of leadership within an overall market that seemed to lack clear direction. The overlay of political events may help explain the market’s performance during the year, but it leaves considerable uncertainty regarding the future. We witnessed an eclectic mix of budgetary challenges in Italy (with overtones for the broader European Union), uncertain negotiations surrounding Brexit, the ratcheting up of trade restrictions between the US and other countries and regions, and the broader question of populism’s impact on Western governments and
global multilateral institutions. These issues shaped perceptions of risk and return potential across equity markets. For some industries, the business cycle and the political environment appeared to blow hot and cold simultaneously.
The challenge of navigating these shifting currents is a daunting one, but important elements of it are not without precedent. Though the specifics may be new, political developments have often materially affected the functioning of industries and their constituent members. Adapting to change is a key part of competitive success. In fact, the lack of a large-scale domestic market has forced manynon-US firms to develop distinctive sets of competitive skills in adapting to and capitalizing on the shifting dynamics of multinational markets. In doing our company research, we focus on these and other measures of competitive strength, weighing them against long-term measures of cyclical variation, secular growth, and bands of valuation that have applied through time. As always, while mindful of the potential of macro drivers to steer markets both up and down, as managers of concentrated, active portfolios, we remain focused on the power of individual companies to transcend the speculative cycles to which they happen to have some exposure.
6
| | |
Portfolio management review | | |
| Delaware International Small Cap Fund | | December 11, 2018 |
| | | | | | | | |
| Performance preview (for the year ended November 30, 2018) | | | | | | |
Delaware International Small Cap Fund (Institutional Class shares) | | | 1-year return | | | | -12.99 | % |
Delaware International Small Cap Fund (Class A shares) | | | 1-year return | | | | -13.19 | % |
MSCI ACWI (All Country World Index) ex USA Small Cap Index (net) | | | 1-year return | | | | -10.83 | % |
MSCI ACWI (All Country World Index) ex USA Small Cap Index (gross) | | | 1-year return | | | | -10.50 | % |
Past performance does not guarantee future results.
For complete, annualized performance for Delaware International Small Cap Fund, please see the table on page 21. Institutional Class shares are not subject to a sales charge and are offered for sale exclusively to certain eligible investors. In addition, Institutional Class shares pay no distribution and service fee.
The performance of Class A shares excludes the applicable sales charge. Both Institutional Class shares and Class A shares reflect the reinvestment of all distributions.
Please see page 23 for a description of the index. Index performance returns do not reflect any management fees, transaction costs, or expenses. Indices are unmanaged and one cannot invest directly in an index.
During the Fund’s fiscal year ended Nov. 30, 2018, several factors combined to create uncertainty and increase volatility in international equity markets. Rising trade tensions between the United States and China seemed to weigh on investor sentiment, creating broad uncertainty.
Toward the end of the12-month period, crude oil sold off sharply, dropping more than 30% from the October 2018 highs, partly on concerns of slowing demand. Although the overall price decline during the fiscal year was more modest, at period end crude prices settled below $60 a barrel.
Concerns intensified regarding Federal Reserve plans and whether the US central bank would slow its progress toward normalizing monetary policy. The Fed implemented four quarter-point rate increases during the fiscal year, three of which occurred under its new chair, Jerome Powell. These increases raised the federal funds rate target range to 2.00%–2.25%.
Additionally, political risk increased in Europe, fueled by uncertainty over Brexit, political disruption in Italy, and, to a lesser extent, political volatility in Germany. A variety of economic and political concerns – including a stronger US dollar that increased the burden of servicing dollar-denominated debt – weighed heavily on emerging market countries, notably Turkey and Argentina, in the spring and early summer of 2018.
| | |
| |
Internationalsmall-cap stocks were volatile during the fiscal year as: | | |
| |
● The trade dispute between the US and China escalated. | | |
| |
● Crude oil prices dropped precipitously. | | |
| |
● The Fed continued to raise rates. | | |
| |
● Political uncertainty persisted in Europe. | | |
| |
| | |
7
Portfolio management review
Delaware International Small Cap Fund
This challenging environment created headwinds for internationalsmall-cap stocks in general, and for the Fund specifically. The heightened market volatility generally made it more difficult for our investment approach, which searches for companies undergoing positive fundamental change on astock-by-stock basis. In that environment, the broad market can overwhelm individual company fundamentals.
Our team uses abottom-up(stock-by-stock) investment approach, and we believe in investing in companies that have the potential for continued earnings growth due to positive fundamental change.
Within the Fund
For the fiscal year ended Nov. 30, 2018, Delaware International Small Cap Fund underperformed its benchmark, the MSCI ACWI ex USA Small Cap Index (net). The Fund’s Institutional Class shares declined 12.99%. The Fund’s Class A shares fell 13.19% at net asset value and fell 18.21% at maximum offer price. These figures reflect all distributions reinvested. During the same period, the Fund’s benchmark declined 10.83%. For complete, annualized performance of Delaware International Small Cap Fund, please see the table on page 21.
Our individualstock-by-stock selection process drives the Fund’s positioning. As a result, sectors that detracted the most from performance during the fiscal year were consumer discretionary and industrials. Countries that detracted the most from performance included Japan, Taiwan, and Sweden. These largely reflected the holdings that performed poorly relative to the overall market.
Harmonic Drive Systems Inc.is a Japanese manufacturer of speed reducers, a key component in small industrial robots and collaborative robots. It underperformed after reporting financial results that were below expectations. We exited the Fund’s position before period end.
El.En SpAis an Italian company that produces laser equipment for medical and aesthetic applications. Its business in lasers for plastic surgery is largely driven by demand from an aging population with higher disposable income. El.En reported weaker-than-expected third-quarter financial results and lowered its guidance. Political uncertainty in Italy, which weighed on Italian equities in general, also affected El.En. We sold the Fund’s position in the company to reduce country risk.
Seria Co. Ltd., a Japanese discount retailer, reported declining same-store sales growth in early 2018, causing the stock to disappoint. While the company didn’t perform as well as we had hoped early in the year, we still hold Seria in the Fund, although at a reduced position.
Sectors that contributed to the Fund’s relative performance included consumer staples and financials. Countries that contributed to relative performance included China, Denmark, and Germany.
The leading individual contributor wasTATERU Inc., a Japanese provider of real estate brokerage services and apartment-management platforms. TATERU combines technology and real estate to match investors to a seller of land, who then constructs property for the investor without the markup of a contractor. The company continued to expand its membership and services and outperformed during the12-month period after posting annual results that, in our view, significantly beat expectations.
China Resource Cement Holdings Ltd., a leading cement manufacturer primarily focused on southern China, also performed well during the fiscal year. The Fund had a significant weight in this stock and the share price increased after the company reported better-than-expected financial results driven by strong demand for cement.
8
Afterpay Touch Group Ltd., an Australian company that provides installment loans, outperformed during the fiscal year, benefiting from a successful US product launch. It rolled out its service to large fashion retailers, including Urban Outfitters, and performed better than expected. Since the US market is several times larger than the Australian market, we think there are potential new verticals for the firm.
Several risks could affect investors going forward, including theUS-China trade dispute, which continues to weigh heavily on markets. Growing uncertainty over Brexit has also added to investor uneasiness along with a protracted oil selloff, volatility in Italy, and uncertainty over further Fed rate hikes.
However, we believe opportunities exist as well for investors. The widescale market turbulence that ended the fiscal year has created, in our view, pockets of opportunity in those stocks that indiscriminately sold off without experiencing any underlying changes to company fundamentals. In terms of positioning, we continue to pursue our investment philosophy and process, seeking to invest in companies that we think exhibit positive sustainable change, while making sure the risks are well understood. This continues to be abottom-up-driven process focused on what we see as the most favorable opportunities.
Meanwhile, we are mindful of risks that help to guide the magnitude of the overweight or underweight allocation that we take from a country and sector perspective.
As previously mentioned, the Fund’s positioning in terms of country and sector weights is driven primarily bybottom-up stock selection opportunities. As a result, at period end, relative to the MSCI ACWI ex USA Small Cap Index, the Fund was overweight the consumer staples and information technology sectors. From a country perspective, the Fund’s largest overweight positions were in the United Kingdom and Ireland. Conversely, the Fund’s largest relative underweight countries were Japan and Taiwan, while its largest sector underweights were real estate and consumer discretionary.
The Fund may use derivatives or structured products in certain limited situations. For example, the Fund may use equity-linked notes to gain local market access in situations where direct market participation is limited. Derivatives and structured products were not used by the Fund during the fiscal period. The Fund utilized foreign currency exchange contracts to facilitate the purchase and sale of equities traded on international exchanges. The effect of these contracts on performance was immaterial.
9
| | |
Portfolio management review | | |
| Delaware International Value Equity Fund | | December 11, 2018 |
| | | | | | | | |
| Performance preview (for the year ended November 30, 2018) | | | | | | |
Delaware International Value Equity Fund (Institutional Class shares) | | | 1-year return | | | | -12.11 | % |
Delaware International Value Equity Fund (Class A shares) | | | 1-year return | | | | -12.32 | % |
MSCI EAFE (Europe, Australasia, Far East) Index (net) | | | 1-year return | | | | -7.94 | % |
MSCI EAFE (Europe, Australasia, Far East) Index (gross) | | | 1-year return | | | | -7.48 | % |
Past performance does not guarantee future results.
For complete, annualized performance for Delaware International Value Equity Fund, please see the table on page 25. Institutional Class shares are not subject to a sales charge and are offered for sale exclusively to certain eligible investors. In addition, Institutional Class shares pay no distribution and service fee.
The performance of Class A shares excludes the applicable sales charge. Both Institutional Class shares and Class A shares reflect the reinvestment of all distributions.
Please see page 27 for a description of the index. Index performance returns do not reflect any management fees, transaction costs, or expenses. Indices are unmanaged and one cannot invest directly in an index.
Economic developments / market drivers
After remarkably steady improvement in the market’s appreciation of global economic drivers for the duration of 2017, uncertainty regained prominence in 2018. Though major economies remained within uptrends and stimulus in many regions remained in play, leading sentiment measures generally cooled. Meanwhile, unsettled political conditions both within major economic blocs and with respect to the trade regimes between them further helped to dispel complacency about the durability of the current cycle of global growth. Stocks reflected this growing skepticism through higher volatility, lack of a clear market direction, and a mix of performance that favored stable, defensive characteristics.
● US market conditions displayed a curious combination. The US Federal Reserve’s rate increases were accompanied by comments by Chairman Jerome H. Powell indicating confident satisfaction that the economy was on a solid track. Jobs continued to grow, retail and industrial activity remained on firm footing, and inflation was contained. All of this was true in 2017, however, while some leading indicators such as the Purchasing Managers’ Index (PMI) showed pronounced signs of slowing (albeit to a still-strong level), trade tensions continued to increase, and domestic politics remained unsettled. The
| | ● | | After a calm 2017, markets became more uncertain and volatile in 2018. | |
| | ● | | While the US market showed ongoing relative strength — albeit with a negative impact from trade tensions and concerns over rising interest rates — Europe, Japan, and emerging markets were notably weaker. | |
| | ● | | The Fund lagged its benchmark largely due to stock selection, with weak selection in consumer discretionary, financials, and consumer staples more than offsetting strong selection in technology, healthcare, and energy. | |
10
confidence behind solid returns of US equities through September wavered during October’s selloff, but the position of the United States as a perceived safe haven against rising risks elsewhere kept it well ahead of global alternatives through the full fiscal year.
● Europe’s stocks told the other side of the US momentum story. Economic sentiment indicators, while remaining positive and showing signs of stabilizing, remained well below the unsustainably high readings that prevailed in late 2017. In addition, ongoing concerns with the Italian government’s ability to fund its budgetary ambitions were compounded by a currency crisis in Turkey. Perceived exposure to trade tensions and an uncertain outcome of Brexit negotiations completed the picture, and though these troubles were manifest in heightened volatility of equity performance rather than in absolute declines for most of the year, the contrast with the US was clear.
● Japan’s equity performance showed little to be desired for much of the period, with its relatively stable but uninspiring economic indicators reflected in a similarly undistinguished equity market trajectory. Exposure to trade tensions, among other things, placed it among the weaker regions early on, but a combination of 3.0% second-quarter gross domestic product (GDP) annualized growth and strong electoral endorsement for Shinzo Abe’s government helped propel a rebound. Accompanied by a meaningful increase in the country’s notably low bond yields, this burgeoning optimism helped support most Japanese equity sectors in the second half of the fiscal year.
● The emerging markets’ reversal of fortune began in late March and persisted through November. These markets bore the brunt of fears related to the future of the global trading regime. China, having the most prominently mentioned role in global supply chains, was most commonly cited as the locus of concerns affecting emerging
markets more broadly. There were few pockets of strength, with only Brazil, Russia, and Thailand among the major emerging markets outperforming the MSCI ACWI (All Country World Index).
Within the Fund
For the fiscal year ended Nov. 30, 2018, Delaware International Value Equity Fund underperformed its benchmark, the MSCI EAFE Index (net). The Fund’s Institutional Class shares declined 12.11%. The Fund’s Class A shares fell 12.32% at net asset value and fell 17.38% at maximum offer price. These figures reflect all distributions reinvested. During the same period, the Fund’s benchmark declined 7.94%. For complete, annualized performance of Delaware International Value Equity Fund, please see the table on page 25.
With late-cycle patterns of relative performance presenting a challenge to the Fund’s value style, the Fund underperformed the benchmark primarily due to stock selection. On a sector basis, strong stock selection in technology, healthcare, and energy was more than offset by weak stock selection in consumer discretionary, financials, and consumer staples. Overall sector allocation was also negative, with the adverse effect of an overweight exposure to consumer discretionary and industrials as well as an underweight in utilities more than offsetting underweight exposures to materials and financials. On a regional basis, weak stock selection in the euro zone and Japan more than offset strong stock selection in Europe ex euro zone. Overall regional allocation was positive due to strong contributions byout-of-benchmark holdings in Canada and the emerging markets. Net currency effect was positive, with the adverse effect of an underweight to the Swiss franc more than offset by the benefit of positive exposure to the Canadian dollar and Hong Kong dollar.
The Fund’s trading activity during the fiscal year included trimming positions and redeploying the
11
Portfolio management review
Delaware International Value Equity Fund
proceeds at what we viewed as attractive valuations. This activity involved a variety of sectors and regions but did not result in material changes to the Fund’s portfolio positioning.
Prospective global market drivers and general outlook
The confluence of economics and politics found interesting expression in equity price movements during the fiscal year, but uniformity was not among its main traits. On the economic front, the Fed’s now well-established shift toward monetary normalization contrasted with earlier phases of recovery in Europe and Japan, where interest rates remain extremely low. The market responses one might expect under these conditions, such as relative outperformance by late-cycle secular growth in the US and a more procyclical mix of performance in other regions, was only partly borne out in a period that saw abrupt and inconsistent rotations of leadership within an overall market that seemed to lack clear direction. The overlay of political events may help explain the market’s performance during the year, but it leaves considerable uncertainty regarding the future. We witnessed an eclectic mix of budgetary challenges in Italy (with overtones for the broader European Union), uncertain negotiations surrounding Brexit, the ratcheting up of trade restrictions between the US and other countries and regions, and the broader question of
populism’s impact on Western governments and global multilateral institutions. These issues shaped perceptions of risk and return potential across equity markets. For some industries, the business cycle and the political environment appeared to blow hot and cold simultaneously.
The challenge of navigating these shifting currents is a daunting one, but important elements of it are not without precedent. Though the specifics may be new, political developments have often materially affected the functioning of industries and their constituent members. Adapting to change is a key part of competitive success. In fact, the lack of a large-scale domestic market has forced manynon-US firms to develop distinctive sets of competitive skills in adapting to and capitalizing on the shifting dynamics of multinational markets. In doing our company research, we focus on these and other measures of competitive strength, weighing them against long-term measures of cyclical variation, secular growth, and bands of valuation that have applied through time. As always, while mindful of the potential of macro drivers to steer markets both up and down, as managers of concentrated, active portfolios, we remain focused on the power of individual companies to transcend the speculative cycles to which they happen to have some exposure.
12
| | |
Performance summaries | | |
| Delaware Emerging Markets Fund | | November 30, 2018 |
The performance quoted represents past performance and does not guarantee future results. Investment return and principal value of an investment will fluctuate so that shares, when redeemed, may be worth more or less than their original cost. Current performance may be lower or higher than the performance quoted. Performance data current to the most recent month end may be obtained by calling 800523-1918 or visiting delawarefunds.com/performance.
| | | | | | | | | | | | | | | | | | | | |
| Fund and benchmark performance1,2 | | Average annual total returns through November 30, 2018 |
| | | 1 year | | 5 years | | 10 years | | Lifetime |
Class A (Est. June 10, 1996) | | | | | | | | | | | | | | | | | | | | |
Excluding sales charge | | | | -11.40 | % | | | | +2.75 | % | | | | +10.39 | % | | | | +7.49 | % |
Including sales charge | | | | -16.50 | % | | | | +1.54 | % | | | | +9.73 | % | | | | +7.20 | % |
Class C (Est. June 10, 1996) | | | | | | | | | | | | | | | | | | | | |
Excluding sales charge | | | | -12.05 | % | | | | +1.97 | % | | | | +9.57 | % | | | | +6.69 | % |
Including sales charge | | | | -12.92 | % | | | | +1.97 | % | | | | +9.57 | % | | | | +6.69 | % |
Class R (Est. Aug. 31, 2009) | | | | | | | | | | | | | | | | | | | | |
Excluding sales charge | | | | -11.64 | % | | | | +2.48 | % | | | | n/a | | | | | +5.55 | % |
Including sales charge | | | | -11.64 | % | | | | +2.48 | % | | | | n/a | | | | | +5.55 | % |
Institutional Class (Est. June 10, 1996) | | | | | | | | | | | | | | | | | | | | |
Excluding sales charge | | | | -11.21 | % | | | | +2.99 | % | | | | +10.67 | % | | | | +7.77 | % |
Including sales charge | | | | -11.21 | % | | | | +2.99 | % | | | | +10.67 | % | | | | +7.77 | % |
Class R6 (Est. May 2, 2016) | | | | | | | | | | | | | | | | | | | | |
Excluding sales charge | | | | -11.04 | % | | | | n/a | | | | | n/a | | | | | +12.16 | % |
Including sales charge | | | | -11.04 | % | | | | n/a | | | | | n/a | | | | | +12.16 | % |
MSCI Emerging Markets Index (net) | | | | -9.09 | % | | | | +1.90 | % | | | | +9.13 | % | | | | +5.52 | %* |
MSCI Emerging Markets Index (gross) | | | | -8.75 | % | | | | +2.27 | % | | | | +9.50 | % | | | | +5.80 | %* |
*The benchmark lifetime return is for Institutional Class share comparison only and is calculated using the last business day in the month of the Fund’s Institutional Class inception date.
1Returns reflect the reinvestment of all distributions and are presented both with and without the applicable sales charges described below. Returns do not reflect the deduction of taxes the shareholder would pay on Fund distributions or redemptions of Fund shares.
Expense limitations were in effect for certain classes during some or all of the periods shown in the “Fund and benchmark performance” table. Expenses for each class are listed on the “Fund expense ratios” table on page 14. Performance would have been lower had expense limitations not been in effect.
Institutional Class shares are not subject to a sales charge and are offered for sale exclusively to certain eligible investors. In addition, Institutional Class shares pay no distribution and service fee.
Class A shares are sold with a maximumfront-end sales charge of 5.75%, and have an annual distribution and service fee of 0.25% of average daily net assets. Performance for Class A shares, excluding sales charges, assumes that nofront-end sales charge applied.
Class C shares are sold with a contingent deferred sales charge of 1.00% if redeemed during the first 12 months. They are also subject to an annual
13
Performance summaries
Delaware Emerging Markets Fund
distribution and service fee of 1.00% of average daily net assets. Performance for Class C shares, excluding sales charges, assumes either that contingent deferred sales charges did not apply or that the investment was not redeemed.
Class R shares are available only for certain retirement plan products. They are sold without a sales charge and have an annual distribution and service fee of 0.50% of average daily net assets.
Class R6 shares are available only to certain investors. In addition, Class R6 shares do not pay any service fees,sub-accounting fees, and/orsub-transfer agency fees to any brokers, dealers, or other financial intermediaries. Class R6 shares pay no distribution and service fee.
International investments entail risks not ordinarily associated with US investments including
fluctuation in currency values, differences in accounting principles, or economic or political instability in other nations.
Investing in emerging markets can be riskier than investing in established foreign markets due to increased volatility and lower trading volume.
If and when the Fund invests in forward foreign currency contracts or uses other investments to hedge against currency risks, the Fund will be subject to special risks, including counterparty risk.
Investments in small and/ormedium-sized companies typically exhibit greater risk and higher volatility than larger, more established companies.
2The Fund’s expense ratios, as described in the most recent prospectus, are disclosed in the following “Fund expense ratios” table. Delaware Management Company has agreed to reimburse certain expenses and/or waive certain fees in order to prevent total annual fund operating expenses (excluding any12b-1 fees, acquired fund fees and expenses, taxes, interest, short sale and dividend and interest expenses, brokerage fees, certain insurance costs, and nonroutine expenses or costs, including, but not limited to, those relating to reorganizations, litigation, conducting shareholder meetings, and liquidations (collectively, nonroutine expenses)) from exceeding 1.42% of the Fund’s average daily net assets for all share classes other than Class R6, and 1.29% of the Fund’s Class R6 shares’ average daily net assets from Dec. 1, 2017 to Nov. 30, 2018.* Prior to March 29, 2018, the contractual waiver was 1.45% of average daily net assets for all share classes other than Class R6, and 1.32% of the Class R6 shares. Please see the most recent prospectus and any applicable supplement(s) for additional information on these fee waivers and/or reimbursements. Please see the “Financial highlights” section in this report for the most recent expense ratios.
| | | | | | | | | | |
| | | | | | | | | Institutional | | |
| Fund expense ratios | | Class A | | Class C | | Class R | | Class | | Class R6 |
Total annual operating expenses | | 1.66% | | 2.41% | | 1.91% | | 1.41% | | 1.28% |
(without fee waivers) | | | | | | | | | | |
Net expenses | | 1.66% | | 2.41% | | 1.91% | | 1.41% | | 1.28% |
(including fee waivers, if any) | | | | | | | | | | |
Type of waiver | | Contractual | | Contractual | | Contractual | | Contractual | | Contractual |
*The aggregate contractual waiver period covering this report is from May 2, 2016 through March 29, 2019.
14
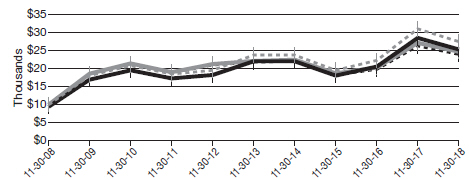
Performance of a $10,000 investment1
Average annual total returns from Nov. 30, 2008 through Nov. 30, 2018
| | | | | | | | | | |
| For the period beginning Nov. 30, 2008 through Nov. 30, 2018 | | Starting value | | | Ending value | |

| | Delaware Emerging Markets Fund — Institutional Class shares | | | $10,000 | | | | $27,558 | |

| | Delaware Emerging Markets Fund — Class A shares | | | $9,425 | | | | $25,312 | |

| | MSCI Emerging Markets Index (gross) | | | $10,000 | | | | $24,774 | |

| | MSCI Emerging Markets Index (net) | | | $10,000 | | | | $23,952 | |
1The “Performance of a $10,000 investment” graph assumes $10,000 invested in Institutional Class and Class A shares of the Fund on Nov. 30, 2008, and includes the effect of a 5.75%front-end sales charge (for Class A shares) and the reinvestment of all distributions. The graph does not reflect the deduction of taxes the shareholders would pay on Fund distributions or redemptions of Fund shares. Expense limitations were in effect for some or all of the periods shown. Performance would have been lower had expense limitations not been in effect. Expenses are listed in the “Fund expense ratios” table on page 14. Please note additional details on pages 13 through 16.
The graph also assumes $10,000 invested in the MSCI Emerging Markets Index as of Nov. 30, 2008. The MSCI Emerging Markets Index is a free float-adjusted market capitalization index designed to measure equity market performance across emerging market countries worldwide. Index “gross” return approximates the maximum
possible dividend reinvestment. Index “net” return approximates the minimum possible dividend reinvestment, after deduction of withholding tax at the highest possible rate.
Index performance returns do not reflect any management fees, transaction costs, or expenses. Indices are unmanaged and one cannot invest directly in an index. Past performance is not a guarantee of future results.
Performance of other Fund classes will vary due to different charges and expenses.
15
Performance summaries
Delaware Emerging Markets Fund
| | | | | | | | |
| | | Nasdaq symbols | | CUSIPs | | | | |
Class A | | DEMAX | | 245914841 | | | | |
Class C | | DEMCX | | 245914825 | | | | |
Class R | | DEMRX | | 245914569 | | | | |
Institutional Class | | DEMIX | | 245914817 | | | | |
Class R6 | | DEMZX | | 245914510 | | | | |
16
| | |
Performance summaries | | |
| Delaware Global Value Fund | | November 30, 2018 |
The performance quoted represents past performance and does not guarantee future results. Investment return and principal value of an investment will fluctuate so that shares, when redeemed, may be worth more or less than their original cost. Current performance may be lower or higher than the performance quoted. Performance data current to the most recent month end may be obtained by calling 800523-1918 or visiting delawarefunds.com/performance.
| | | | | | | | | | | | | | | | |
| Fund and benchmark performance1,2 | | Average annual total returns through November 30, 2018 | |
| | | 1 year | | | 5 years | | | 10 years | | | Lifetime | |
Class A (Est. Dec. 19, 1997) | | | | | | | | | | | | | | | | |
Excluding sales charge | | | -8.38 | %* | | | +2.15 | % | | | +8.71 | % | | | +6.17 | % |
Including sales charge | | | -13.67 | % | | | +0.95 | % | | | +8.06 | % | | | +5.87 | % |
Class C (Est. Sept. 28, 2001) | | | | | | | | | | | | | | | | |
Excluding sales charge | | | -9.14 | % | | | +1.38 | % | | | +7.89 | % | | | +6.12 | % |
Including sales charge | | | -10.04 | % | | | +1.38 | % | | | +7.89 | % | | | +6.12 | % |
Institutional Class (Est. Dec. 19, 1997) | | | | | | | | | | | | | | | | |
Excluding sales charge | | | -8.20 | % | | | +2.39 | % | | | +8.97 | % | | | +6.39 | % |
Including sales charge | | | -8.20 | % | | | +2.39 | % | | | +8.97 | % | | | +6.39 | % |
MSCI World Index (net) | | | +0.14 | % | | | +6.67 | % | | | +10.89 | % | | | +5.68 | %** |
MSCI World Index (gross) | | | +0.68 | % | | | +7.27 | % | | | +11.51 | % | | | +6.21 | %** |
*Total return for the report period presented in the table differs from the return in “Financial highlights.” The total return presented in the above table is calculated based on the net asset value (NAV) at which shareholder transactions were processed. The total return presented in “Financial highlights” is calculated in the same manner, but also takes into account certain adjustments that are necessary under US generally accepted accounting principles (US GAAP) required in the annual report.
**The benchmark lifetime return is for Institutional Class share comparison only and is calculated using the last business day in the month of the Fund’s Institutional Class inception date.
1Returns reflect the reinvestment of all distributions and are presented both with and without the applicable sales charges described below. Returns do not reflect the deduction of taxes the shareholder would pay on Fund distributions or redemptions of Fund shares.
Expense limitations were in effect for certain classes during some or all of the periods shown in the “Fund and benchmark performance” table. Expenses for each class are listed on the “Fund expense ratios” table on page 18. Performance would have been lower had expense limitations not been in effect.
Institutional Class shares are not subject to a sales charge and are offered for sale exclusively to
certain eligible investors. In addition, Institutional Class shares pay no distribution and service fee.
Class A shares are sold with a maximumfront-end sales charge of 5.75%, and have an annual distribution and service fee of 0.25% of average daily net assets. Performance for Class A shares, excluding sales charges, assumes that nofront-end sales charge applied.
Class C shares are sold with a contingent deferred sales charge of 1.00% if redeemed during the first 12 months. They are also subject to an annual distribution and service fee of 1.00% of average daily net assets. Performance for Class C shares, excluding sales charges, assumes either that
17
Performance summaries
Delaware Global Value Fund
contingent deferred sales charges did not apply or that the investment was not redeemed.
International investments entail risks not ordinarily associated with US investments including fluctuation in currency values, differences in accounting principles, or economic or political instability in other nations.
Investing in emerging markets can be riskier than investing in established foreign markets due to increased volatility and lower trading volume.
Investments in small and/ormedium-sized companies typically exhibit greater risk and higher volatility than larger, more established companies.
2The Fund’s expense ratios, as described in the most recent prospectus, are disclosed in the following “Fund expense ratios” table. Delaware Management Company has agreed to reimburse certain expenses and/or waive certain fees in order to prevent total annual fund operating expenses (excluding any12b-1 fees, acquired fund fees and expenses, taxes, interest, short sale and dividend and interest expenses, brokerage fees, certain insurance costs, and nonroutine expenses or costs, including, but not limited to, those relating to reorganizations, litigation, conducting shareholder meetings, and liquidations (collectively, nonroutine expenses)) from exceeding 1.30% of the Fund’s average daily net assets during the period from Dec. 1, 2017 to Nov. 30, 2018.* Please see the most recent prospectus and any applicable supplement(s) for additional information on these fee waivers and/or reimbursements. Please see the “Financial highlights” section in this report for the most recent expense ratios.
| | | | | | |
| Fund expense ratios | | Class A | | Class C | | Institutional Class |
Total annual operating expenses | | 2.02% | | 2.77% | | 1.77% |
(without fee waivers) | | | | | | |
Net expenses | | 1.55% | | 2.30% | | 1.30% |
(including fee waivers, if any) | | | | | | |
Type of waiver | | Contractual | | Contractual | | Contractual |
*The aggregate contractual waiver period covering this report is from March 28, 2017 through March 29, 2019.
18
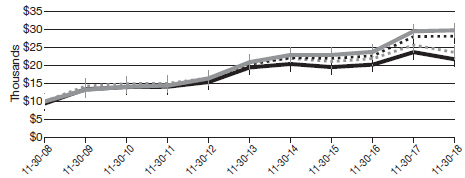
Performance of a $10,000 investment1
Average annual total returns from Nov. 30, 2008 through Nov. 30, 2018
| | | | | | | | | | |
| For the period beginning Nov. 30, 2008 through Nov. 30, 2018 | | Starting value | | | Ending value | |
| | | |

| | MSCI World Index (gross) | | | $10,000 | | | | $29,735 | |

| | MSCI World Index (net) | | | $10,000 | | | | $28,105 | |

| | Delaware Global Value Fund — Institutional Class shares | | | $10,000 | | | | $23,600 | |

| | Delaware Global Value Fund — Class A shares | | | $9,425 | | | | $21,701 | |
1The “Performance of a $10,000 investment” graph assumes $10,000 invested in Institutional Class and Class A shares of the Fund on Nov. 30, 2008, and includes the effect of a 5.75%front-end sales charge (for Class A shares) and the reinvestment of all distributions. The graph does not reflect the deduction of taxes the shareholders would pay on Fund distributions or redemptions of Fund shares. Expense limitations were in effect for some or all of the periods shown. Performance would have been lower had expense limitations not been in effect. Expenses are listed in the “Fund expense ratios” table on page 18. Please note additional details on pages 17 through 20.
The graph also assumes $10,000 invested in the MSCI World Index as of Nov. 30, 2008. The MSCI World Index is a free float-adjusted market capitalization weighted index designed to measure equity market performance across developed markets worldwide. Index “gross” return approximates the maximum possible dividend reinvestment. Index “net” return approximates the
minimum possible dividend reinvestment, after deduction of withholding tax at the highest possible rate.
The Purchasing Managers’ Index, mentioned on page 4, is an indicator of the economic health of the manufacturing sector. A PMI reading above 50% indicates that the manufacturing economy is generally expanding; below 50% indicates that it is generally contracting.
The MSCI ACWI (All Country World Index), mentioned on page 5, is a free float-adjusted market capitalization weighted index that is designed to measure equity market performance across developed and emerging markets worldwide.
Index performance returns do not reflect any management fees, transaction costs, or expenses. Indices are unmanaged and one cannot invest directly in an index. Past performance is not a guarantee of future results.
19
Performance summaries
Delaware Global Value Fund
Performance of other Fund classes will vary due to
different charges and expenses.
| | | | | | | | |
| | | Nasdaq symbols | | CUSIPs | | | | |
Class A | | DABAX | | 245914718 | | | | |
Class C | | DABCX | | 245914684 | | | | |
Institutional Class | | DABIX | | 245914676 | | | | |
20
| | |
Performance summaries | | |
| Delaware International Small Cap Fund | | November 30, 2018 |
The performance quoted represents past performance and does not guarantee future results. Investment return and principal value of an investment will fluctuate so that shares, when redeemed, may be worth more or less than their original cost. Current performance may be lower or higher than the performance quoted. Performance data current to the most recent month end may be obtained by calling 800523-1918 or visiting delawarefunds.com/performance.
| | | | | | | | | | | | | | | | |
| Fund and benchmark performance1,2 | | Average annual total returns through November 30, 2018 | |
| | | 1 year | | | 5 years | | | 10 years | | | Lifetime | |
Class A (Est. Dec. 29, 2008) | | | | | | | | | | | | | | | | |
Excluding sales charge | | | -13.19 | % | | | +4.94% | | | | n/a | | | | +12.76 | % |
Including sales charge | | | -18.21 | % | | | +3.70% | | | | n/a | | | | +12.08 | % |
Class C (Est. Dec. 29, 2010) | | | | | | | | | | | | | | | | |
Excluding sales charge | | | -13.86 | % | | | +4.16% | | | | n/a | | | | +6.46 | % |
Including sales charge | | | -14.68 | % | | | +4.16% | | | | n/a | | | | +6.46 | % |
Class R (Est. Dec. 29, 2010) | | | | | | | | | | | | | | | | |
Excluding sales charge | | | -13.47 | % | | | +4.66% | | | | n/a | | | | +6.98 | % |
Including sales charge | | | -13.47 | % | | | +4.66% | | | | n/a | | | | +6.98 | % |
Institutional Class (Est. Dec. 29, 2008) | | | | | | | | | | | | | | | | |
Excluding sales charge | | | -12.99 | % | | | +5.20% | | | | n/a | | | | +12.98 | % |
Including sales charge | | | -12.99 | % | | | +5.20% | | | | n/a | | | | +12.98 | % |
Class R6 (Est. June 30, 2017) | | | | | | | | | | | | | | | | |
Excluding sales charge | | | -12.98 | % | | | n/a | | | | n/a | | | | +1.95 | % |
Including sales charge | | | -12.98 | % | | | n/a | | | | n/a | | | | +1.95 | % |
MSCI ACWI ex USA Small Cap Index (net) | | | -10.83 | % | | | +3.46% | | | | n/a | | | | +10.73 | %* |
MSCI ACWI ex USA Small Cap Index (gross) | | | -10.50 | % | | | +3.83% | | | | n/a | | | | +11.12 | %* |
*The benchmark lifetime return is for Class A share comparison only and is calculated using the last business day in the month of the Fund’s Class A inception date.
1Returns reflect the reinvestment of all distributions and are presented both with and without the applicable sales charges described below. Returns do not reflect the deduction of taxes the shareholder would pay on Fund distributions or redemptions of Fund shares.
Expense limitations were in effect for certain classes during some or all of the periods shown in the “Fund and benchmark performance” table. Expenses for each class are listed on the “Fund expense ratios” table on page 22. Performance
would have been lower had expense limitations not been in effect.
Institutional Class shares are not subject to a sales charge and are offered for sale exclusively to certain eligible investors. In addition, Institutional Class shares pay no distribution and service fee.
Class A shares are sold with a maximumfront-end sales charge of 5.75%, and have an annual distribution and service fee of 0.25% of average daily net assets. Performance for Class A shares,
21
Performance summaries
Delaware International Small Cap Fund
excluding sales charges, assumes that nofront-end sales charge applied.
Class C shares are sold with a contingent deferred sales charge of 1.00% if redeemed during the first 12 months. They are also subject to an annual distribution and service fee of 1.00% of average daily net assets. Performance for Class C shares, excluding sales charges, assumes either that contingent deferred sales charges did not apply or that the investment was not redeemed.
Class R shares are available only for certain retirement plan products. They are sold without a sales charge and have an annual distribution and service fee of 0.50% of average daily net assets.
Class R6 shares are available only to certain investors. In addition, Class R6 shares do not pay any service fees, sub-accounting fees, and/or sub-transfer agency fees to any brokers, dealers,
or other financial intermediaries. Class R6 shares pay no distribution and service fee.
International investments entail risks not ordinarily associated with US investments including fluctuation in currency values, differences in accounting principles, or economic or political instability in other nations.
Investing in emerging markets can be riskier than investing in established foreign markets due to increased volatility and lower trading volume. The Fund may experience portfolio turnover in excess of 100%, which could result in higher transaction costs and tax liability.
Investments in small and/ormedium-sized companies typically exhibit greater risk and higher volatility than larger, more established companies.
2The Fund’s expense ratios, as described in the most recent prospectus, are disclosed in the following “Fund expense ratios” table. Delaware Management Company has agreed to reimburse certain expenses and/or waive certain fees in order to prevent total annual fund operating expenses (excluding any12b-1 fees, acquired fund fees and expenses, taxes, interest, short sale and dividend and interest expenses, brokerage fees, certain insurance costs, and nonroutine expenses or costs, including, but not limited to, those relating to reorganizations, litigation, conducting shareholder meetings, and liquidations (collectively, nonroutine expenses)) from exceeding 1.12% of the Fund’s average daily net assets for all share classes other than Class R6 and 1.00% of the Fund’s Class R6 shares’ average daily net assets from March 29, 2018 through Nov. 30, 2018.* Prior to March 29, 2018, the contractual waiver was 1.13% of average daily net assets of Class A, Class C, Class R, and Institutional Class shares.** Please see the most recent prospectus and any applicable supplement(s) for additional information on these fee waivers and/or reimbursements. Please see the “Financial highlights” section in this report for the most recent expense ratios.
| | | | | | | | | | | | | | | | | | | | |
| | | | | | | | | | | | Institutional | | | | |
| Fund expense ratios | | Class A | | | Class C | | | Class R | | | Class | | | Class R6 | |
Total annual operating expenses | | | 2.48% | | | | 3.23% | | | | 2.73% | | | | 2.23% | | | | 2.11% | |
(without fee waivers) | | | | | | | | | | | | | | | | | | | | |
Net expenses | | | 1.37% | | | | 2.12% | | | | 1.62% | | | | 1.12% | | | | 1.00% | |
(including fee waivers, if any) | | | | | | | | | | | | | | | | | | | | |
Type of waiver | | | Contractual | | | | Contractual | | | | Contractual | | | | Contractual | | | | Contractual | |
*The aggregate contractual waiver period covering this report is from March 29, 2018 through March 29, 2019.
**The aggregate contractual waiver period was from June 30, 2017 through March 28, 2018.
22
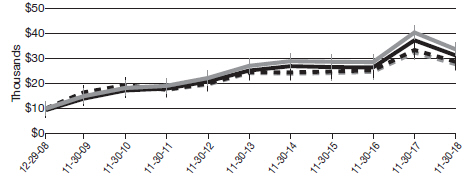
Performance of a $10,000 investment1
Average annual total returns from Dec. 29, 2008 (Fund’s inception) through Nov. 30, 2018
| | | | | | | | | | |
| For the period beginning Dec. 29, 2008 through Nov. 30, 2018 | | Starting value | | | Ending value | |

| | Delaware International Small Cap Fund — Institutional Class shares | | | $10,000 | | | | $33,550 | |

| | Delaware International Small Cap Fund — Class A shares | | | $9,425 | | | | $31,008 | |

| | MSCI ACWI ex USA Small Cap Index (gross) | | | $10,000 | | | | $28,683 | |

| | MSCI ACWI ex USA Small Cap Index (net) | | | $10,000 | | | | $27,701 | |
1The “Performance of a $10,000 investment” graph assumes $10,000 invested in Institutional Class and Class A shares of the Fund on Dec. 29, 2008, and includes the effect of a 5.75%front-end sales charge (for Class A shares) and the reinvestment of all distributions. The graph does not reflect the deduction of taxes the shareholders would pay on Fund distributions or redemptions of Fund shares. Expense limitations were in effect for some or all of the periods shown. Performance would have been lower had expense limitations not been in effect. Expenses are listed in the “Fund expense ratios” table on page 22. Please note additional details on pages 21 through 24
The graph also assumes $10,000 invested in the MSCI ACWI ex USA Small Cap Index as of Dec. 29, 2008. The MSCI ACWI (All Country World Index) ex USA Small Cap Index captures small-
cap representation across 22 of 23 developed market countries (excluding the United States) and 24 emerging market countries. The index covers approximately 14% of the global equity opportunity set outside the US. Index “gross” return approximates the maximum possible dividend reinvestment. Index “net” return approximates the minimum possible dividend reinvestment, after deduction of withholding tax at the highest possible rate.
Index performance returns do not reflect any management fees, transaction costs, or expenses. Indices are unmanaged and one cannot invest directly in an index. Past performance is not a guarantee of future results.
Performance of other Fund classes will vary due to different charges and expenses.
23
Performance summaries
Delaware International Small Cap Fund
| | | | | | | | | | |
| | | Nasdaq symbols | | CUSIPs | | | | | |
Class A | | DGGAX | | | 246118541 | | | | | |
Class C | | DGGCX | | | 246118533 | | | | | |
Class R | | DGGRX | | | 246118525 | | | | | |
Institutional Class | | DGGIX | | | 246118517 | | | | | |
Class R6 | | DGRRX | | | 245914486 | | | | | |
24
| | |
| Performance summaries | | |
| Delaware International Value Equity Fund | | November 30, 2018 |
The performance quoted represents past performance and does not guarantee future results. Investment return and principal value of an investment will fluctuate so that shares, when redeemed, may be worth more or less than their original cost. Current performance may be lower or higher than the performance quoted. Performance data current to the most recent month end may be obtained by calling 800523-1918 or visiting delawarefunds.com/performance.
| | | | | | | | | | | | | | | | |
| Fund and benchmark performance1,2 | | Average annual total returns through November 30, 2018 | |
| | | 1 year | | | 5 years | | | 10 years | | | Lifetime | |
Class A (Est. Oct. 31, 1991) | | | | | | | | | | | | | | | | |
Excluding sales charge | | | -12.32% | | | | +0.53% | | | | +7.05% | | | | +5.63% | |
Including sales charge | | | -17.38% | | | | -0.65% | | | | +6.41% | | | | +5.40% | |
Class C (Est. Nov. 29, 1995) | | | | | | | | | | | | | | | | |
Excluding sales charge | | | -13.04% | | | | -0.22% | | | | +6.25% | | | | +4.34% | |
Including sales charge | | | -13.90% | | | | -0.22% | | | | +6.25% | | | | +4.34% | |
Class R (Est. June 2, 2003) | | | | | | | | | | | | | | | | |
Excluding sales charge | | | -12.58% | | | | +0.27% | | | | +6.79% | | | | +5.20% | |
Including sales charge | | | -12.58% | | | | +0.27% | | | | +6.79% | | | | +5.20% | |
Institutional Class (Est. Nov. 9, 1992) | | | | | | | | | | | | | | | | |
Excluding sales charge | | | -12.11% | | | | +0.78% | | | | +7.33% | | | | +6.34% | |
Including sales charge | | | -12.11% | | | | +0.78% | | | | +7.33% | | | | +6.34% | |
Class R6 (Est. March 29, 2018) | | | | | | | | | | | | | | | | |
Excluding sales charge | | | n/a | | | | n/a | | | | n/a | | | | -11.46%* | |
Including sales charge | | | n/a | | | | n/a | | | | n/a | | | | -11.46%* | |
MSCI EAFE Index (net) | | | -7.94% | | | | +1.84% | | | | +7.47% | | | | +5.81%** | |
MSCI EAFE Index (gross) | | | -7.48% | | | | +2.31% | | | | +7.97% | | | | +6.22%** | |
*Returns are as of the Fund’s Class R6 inception date. Returns for less than one year are not annualized. The benchmark lifetime returns since the Class R6 inception date were-7.65% (gross) and-7.98% (net).
**The benchmark lifetime return is for Institutional Class share comparison only and is calculated using the last business day in the month of the Fund’s Institutional Class inception date.
1Returns reflect the reinvestment of all distributions and are presented both with and without the applicable sales charges described below. Returns do not reflect the deduction of taxes the shareholder would pay on Fund distributions or redemptions of Fund shares.
Expense limitations were in effect for certain classes during some or all of the periods shown in the “Fund and benchmark performance” table. Expenses for each class are listed on the “Fund expense ratios” table on page 26. Performance
would have been lower had expense limitations not been in effect.
Institutional Class shares are not subject to a sales charge and are offered for sale exclusively to certain eligible investors. In addition, Institutional Class shares pay no distribution and service fee.
Class A shares are sold with a maximumfront-end sales charge of 5.75%, and have an annual distribution and service fee of 0.25% of average daily net assets. Performance for Class A shares,
25
Performance summaries
Delaware International Value Equity Fund
excluding sales charges, assumes that nofront-end sales charge applied.
Class C shares are sold with a contingent deferred sales charge of 1.00% if redeemed during the first 12 months. They are also subject to an annual distribution and service fee of 1.00% of average daily net assets. Performance for Class C shares, excluding sales charges, assumes either that contingent deferred sales charges did not apply or that the investment was not redeemed.
Class R shares are available only for certain retirement plan products. They are sold without a sales charge and have an annual distribution and service fee of 0.50% of average daily net assets.
Class R6 shares are available only to certain investors. In addition, Class R6 shares do not pay any service fees,sub-accounting fees, and/orsub-transfer agency fees to any brokers, dealers, or other financial intermediaries. Class R6 shares pay no distribution and service fee.
International investments entail risks not ordinarily associated with US investments including fluctuation in currency values, differences in accounting principles, or economic or political instability in other nations.
Investing in emerging markets can be riskier than investing in established foreign markets due to increased volatility and lower trading volume.
2The Fund’s expense ratios, as described in the most recent prospectus, are disclosed in the following “Fund expense ratios” table. Delaware Management Company has agreed to reimburse certain expenses and/or waive certain fees in order to prevent total annual fund operating expenses (excluding any12b-1 fees, acquired fund fees and expenses, taxes, interest, short sale and dividend and interest expenses, brokerage fees, certain insurance costs, and nonroutine expenses or costs, including, but not limited to, those relating to reorganizations, litigation, conducting shareholder meetings, and liquidations (collectively, nonroutine expenses)) from exceeding 1.16% of the Fund’s average daily net assets for all share classes other than Class R6, and 1.09% of the Fund’s Class R6 shares’ average daily net assets from Dec. 1, 2017 to Nov. 30, 2018.* Prior to March 29, 2018, the contractual waiver was 1.20% of average daily net assets of Class A, Class C, Class R, and Institutional Class shares. Please see the most recent prospectus and any applicable supplement(s) for additional information on these fee waivers and/ or reimbursements. Please see the “Financial highlights” section in this report for the most recent expense ratios.
| | | | | | | | | | | | | | | | | | | | |
| | | | | | | | | | | | Institutional | | | | |
| Fund expense ratios | | Class A | | | Class C | | | Class R | | | Class | | | Class R6 | |
Total annual operating expenses | | | 1.35% | | | | 2.10% | | | | 1.60% | | | | 1.10% | | | | 1.03% | |
(without fee waivers) | | | | | | | | | | | | | | | | | | | | |
Net expenses** | | | 1.35% | | | | 2.10% | | | | 1.60% | | | | 1.10% | | | | 1.03% | |
(including fee waivers, if any) | | | | | | | | | | | | | | | | | | | | |
Type of waiver | | | Contractual | | | | Contractual | | | | Contractual | | | | Contractual | | | | Contractual | |
*The aggregate contractual waiver period covering this report is from May 2, 2016 through March 29, 2019.
**Fee waivers were in place, but due to the Fund’s expense level, the waivers had no impact.
26
Performance of a $10,000 investment1
Average annual total returns from Nov. 30, 2008 through Nov. 30, 2018
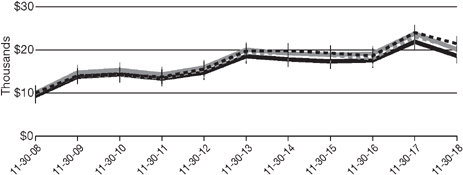
| | | | | | | | | | |
| For the period beginning Nov. 30, 2008 through Nov. 30, 2018 | | Starting value | | | Ending value | |
| | | |
| | MSCI EAFE Index (gross) | | | $10,000 | | | | $21,533 | |
| | MSCI EAFE Index (net) | | | $10,000 | | | | $20,559 | |
| | Delaware International Value Equity Fund — Institutional Class shares | | | $10,000 | | | | $20,283 | |
| | Delaware International Value Equity Fund — Class A shares | | | $9,425 | | | | $18,617 | |
1The “Performance of a $10,000 investment” graph assumes $10,000 invested in Institutional Class and Class A shares of the Fund on Nov. 30, 2008, and includes the effect of a 5.75%front-end sales charge (for Class A shares) and the reinvestment of all distributions. The graph does not reflect the deduction of taxes the shareholders would pay on Fund distributions or redemptions of Fund shares. Expense limitations were in effect for some or all of the periods shown. Performance would have been lower had expense limitations not been in effect. Expenses are listed in the “Fund expense ratios” table on page 26. Please note additional details on pages 25 through 28.
The graph also assumes $10,000 invested in the MSCI EAFE Index as of Nov. 30, 2008. The MSCI EAFE (Europe, Australasia, Far East) Index is a free float-adjusted market capitalization weighted index designed to measure equity market performance of developed markets, excluding the
United States and Canada. Index “gross” return approximates the maximum possible dividend reinvestment. Index “net” return approximates the minimum possible dividend reinvestment, after deduction of withholding tax at the highest possible rate.
The Purchasing Managers’ Index, mentioned on page 10, is an indicator of the economic health of the manufacturing sector. A PMI reading above 50% indicates that the manufacturing economy is generally expanding; below 50% indicates that it is generally contracting.
The MSCI ACWI (All Country World Index), mentioned on page 11, is a free float-adjusted market capitalization weighted index that is designed to measure equity market performance across developed and emerging markets worldwide.
27
Performance summaries
Delaware International Value Equity Fund
Index performance returns do not reflect any management fees, transaction costs, or expenses. Indices are unmanaged and one cannot invest directly in an index. Past performance is not a
guarantee of future results.
Performance of other Fund classes will vary due to different charges and expenses.
| | | | | | | | | | |
| | | Nasdaq symbols | | CUSIPs | | | | | |
Class A | | DEGIX | | | 245914106 | | | | | |
Class C | | DEGCX | | | 245914858 | | | | | |
Class R | | DIVRX | | | 245914577 | | | | | |
Institutional Class | | DEQIX | | | 245914403 | | | | | |
Class R6 | | DEQRX | | | 245914478 | | | | | |
28
Disclosure of Fund expenses
For thesix-month period from June 1, 2018 to November 30, 2018 (Unaudited)
As a shareholder of a Fund, you incur two types of costs: (1) transaction costs, including sales charges (loads) on purchase payments, reinvested dividends, or other distributions; redemption fees; and exchange fees; and (2) ongoing costs, including management fees; distribution and service(12b-1) fees; and other Fund expenses. These following examples are intended to help you understand your ongoing costs (in dollars) of investing in a Fund and to compare these costs with the ongoing costs of investing in other mutual funds.
The examples are based on an investment of $1,000 invested at the beginning of the period and held for the entiresix-month period from June 1, 2018 to Nov. 30, 2018.
Actual expenses
The first section of the tables shown, “Actual Fund return,” provides information about actual account values and actual expenses. You may use the information in this section of the table, together with the amount you invested, to estimate the expenses that you paid over the period. Simply divide your account value by $1,000 (for example, an $8,600 account value divided by $1,000 = 8.6), then multiply the result by the number in the first section under the heading entitled “Expenses Paid During Period” to estimate the expenses you paid on your account during this period.
Hypothetical example for comparison purposes
The second section of the tables shown, “Hypothetical 5% return,” provides information about hypothetical account values and hypothetical expenses based on the Funds’ actual expense ratios and an assumed rate of return of 5% per year before expenses, which is not the Funds’ actual return. The hypothetical account values and expenses may not be used to estimate the actual ending account balance or expenses you paid for the period. You may use this information to compare the ongoing costs of investing in each Fund and other funds. To do so, compare this 5% hypothetical example with the 5% hypothetical examples that appear in the shareholder reports of the other funds.
Please note that the expenses shown in the tables are meant to highlight your ongoing costs only and do not reflect any transactional costs, such as sales charges (loads), redemption fees, or exchange fees. Therefore, the second section of each table is useful in comparing ongoing costs only, and will not help you determine the relative total costs of owning different funds. In addition, if these transactional costs were included, your costs would have been higher. The Funds’ expenses shown in the tables reflect fee waivers in effect. The Funds’ expenses shown in each table assume reinvestment of all dividends and distributions.
29
Disclosure of Fund expenses
For thesix-month period from June 1, 2018 to November 30, 2018 (Unaudited)
Delaware Emerging Markets Fund
Expense analysis of an investment of $1,000
| | | | | | | | | | | | | | | | | | | | |
| | | Beginning Account Value 6/1/18 | | Ending Account Value 11/30/18 | | Annualized
Expense Ratio | | Expenses Paid During Period 6/1/18 to 11/30/18* |
Actual Fund return† | | | | | | | | | | | | | | | | | | | | |
Class A | | | | $1,000.00 | | | | | $920.70 | | | | | 1.63% | | | | | $7.85 | |
Class C | | | | 1,000.00 | | | | | 917.10 | | | | | 2.38% | | | | | 11.44 | |
Class R | | | | 1,000.00 | | | | | 919.10 | | | | | 1.88% | | | | | 9.04 | |
Institutional Class | | | | 1,000.00 | | | | | 921.30 | | | | | 1.38% | | | | | 6.65 | |
Class R6 | | | | 1,000.00 | | | | | 922.30 | | | | | 1.26% | | | | �� | 6.07 | |
Hypothetical 5% return(5% return before expenses) | | | | | | | | | | | | | | | | |
Class A | | | | $1,000.00 | | | | | $1,016.90 | | | | | 1.63% | | | | | $8.24 | |
Class C | | | | 1,000.00 | | | | | 1,013.14 | | | | | 2.38% | | | | | 12.01 | |
Class R | | | | 1,000.00 | | | | | 1,015.64 | | | | | 1.88% | | | | | 9.50 | |
Institutional Class | | | | 1,000.00 | | | | | 1,018.15 | | | | | 1.38% | | | | | 6.98 | |
Class R6 | | | | 1,000.00 | | | | | 1,018.75 | | | | | 1.26% | | | | | 6.38 | |
Delaware Global Value Fund Expense analysis of an investment of $1,000 | | | | | | | | | | | | | | | | | | | | |
| | | Beginning Account Value
6/1/18 | | Ending Account Value 11/30/18 | | Annualized Expense Ratio | | Expenses Paid During Period 6/1/18 to 11/30/18* |
Actual Fund return† | | | | | | | | | | | | | | | | | | | | |
Class A | | | | $1,000.00 | | | | | $927.80 | | | | | 1.55% | | | | | $7.49 | |
Class C | | | | 1,000.00 | | | | | 924.70 | | | | | 2.30% | | | | | 11.10 | |
Institutional Class | | | | 1,000.00 | | | | | 929.60 | | | | | 1.30% | | | | | 6.29 | |
Hypothetical 5% return(5% return before expenses) | | | | | | | | | | | | | | | | |
Class A | | | | $1,000.00 | | | | | $1,017.30 | | | | | 1.55% | | | | | $7.84 | |
Class C | | | | 1,000.00 | | | | | 1,013.54 | | | | | 2.30% | | | | | 11.61 | |
Institutional Class | | | | 1,000.00 | | | | | 1,018.55 | | | | | 1.30% | | | | | 6.58 | |
30
Delaware International Small Cap Fund
Expense analysis of an investment of $1,000
| | | | | | | | | | | | | | | | |
| | | Beginning Account Value 6/1/18 | | | Ending Account Value 11/30/18 | | | Annualized Expense Ratio | | | Expenses Paid During Period 6/1/18 to 11/30/18* | |
Actual Fund return† | | | | | | | | | | | | | | | | |
Class A | | | $1,000.00 | | | | $811.20 | | | | 1.36% | | | | $6.17 | |
Class C | | | 1,000.00 | | | | 808.40 | | | | 2.11% | | | | 9.57 | |
Class R | | | 1,000.00 | | | | 810.00 | | | | 1.61% | | | | 7.31 | |
Institutional Class | | | 1,000.00 | | | | 812.60 | | | | 1.11% | | | | 5.04 | |
Class R6 | | | 1,000.00 | | | | 812.80 | | | | 1.00% | | | | 4.54 | |
Hypothetical 5% return(5% return before expenses) | | | | | | | | | |
Class A | | | $1,000.00 | | | | $1,018.25 | | | | 1.36% | | | | $6.88 | |
Class C | | | 1,000.00 | | | | 1,014.49 | | | | 2.11% | | | | 10.66 | |
Class R | | | 1,000.00 | | | | 1,017.00 | | | | 1.61% | | | | 8.14 | |
Institutional Class | | | 1,000.00 | | | | 1,019.50 | | | | 1.11% | | | | 5.62 | |
Class R6 | | | 1,000.00 | | | | 1,020.05 | | | | 1.00% | | | | 5.06 | |
Delaware International Value Equity Fund Expense analysis of an investment of $1,000 | | | | | | | | | | | | | | | | |
| | | Beginning Account Value 6/1/18 | | | Ending Account Value 11/30/18 | | | Annualized Expense Ratio | | | Expenses Paid During Period 6/1/18 to 11/30/18* | |
Actual Fund return† | | | | | | | | | | | | | | | | |
Class A | | | $1,000.00 | | | | $900.80 | | | | 1.34% | | | | $6.39 | |
Class C | | | 1,000.00 | | | | 897.10 | | | | 2.09% | | | | 9.94 | |
Class R | | | 1,000.00 | | | | 899.10 | | | | 1.59% | | | | 7.57 | |
Institutional Class | | | 1,000.00 | | | | 901.90 | | | | 1.09% | | | | 5.20 | |
Class R6 | | | 1,000.00 | | | | 901.90 | | | | 1.02% | | | | 4.86 | |
Hypothetical 5% return(5% return before expenses) | | | | | | | | | |
Class A | | | $1,000.00 | | | | $1,018.35 | | | | 1.34% | | | | $6.78 | |
Class C | | | 1,000.00 | | | | 1,014.59 | | | | 2.09% | | | | 10.56 | |
Class R | | | 1,000.00 | | | | 1,017.10 | | | | 1.59% | | | | 8.04 | |
Institutional Class | | | 1,000.00 | | | | 1,019.60 | | | | 1.09% | | | | 5.52 | |
Class R6 | | | 1,000.00 | | | | 1,019.95 | | | | 1.02% | | | | 5.16 | |
*“Expenses Paid During Period” are equal to the relevant Fund’s annualized expense ratio, multiplied by the average account value over the period, multiplied by 183/365 (to reflect theone-half year period).
†Because actual returns reflect only the most recentsix-month period, the returns shown may differ significantly from fiscal year returns.
31
Disclosure of Fund expenses
For thesix-month period from June 1, 2018 to November 30, 2018 (Unaudited)
In addition to the Fund’s expenses reflected on the previous pages, Delaware Emerging Markets Fund also indirectly bears its portion of the fees and expenses of the investment companies in which it invests (Underlying Funds), including exchange-traded funds. The table on the previous page does not reflect the expenses of the Underlying Funds.
32
| | |
| Security type / country and sector allocations |
| Delaware Emerging Markets Fund | | As of November 30, 2018 (Unaudited) |
Sector designations may be different than the sector designations presented in other Fund materials. The sector designations may represent the investment manager’s internal sector classifications, which may result in the sector designations for one fund being different than another fund’s sector designations.
| | | | | |
| Security type / country | | Percentage of net assets |
Common Stock by Country | | | | 96.78 | % |
Argentina | | | | 1.39 | % |
Bahrain | | | | 0.03 | % |
Brazil | | | | 11.09 | % |
Chile | | | | 0.94 | % |
China/Hong Kong | | | | 29.69 | % |
Cyprus | | | | 0.11 | % |
France | | | | 0.01 | % |
India | | | | 9.64 | % |
Indonesia | | | | 0.79 | % |
Japan | | | | 0.57 | % |
Malaysia | | | | 0.06 | % |
Mexico | | | | 5.56 | % |
Netherlands | | | | 0.23 | % |
Peru | | | | 0.89 | % |
Republic of Korea | | | | 18.66 | % |
Russia | | | | 6.04 | % |
South Africa | | | | 0.56 | % |
Taiwan | | | | 7.30 | % |
Turkey | | | | 0.95 | % |
United Kingdom | | | | 0.07 | % |
United States | | | | 2.20 | % |
Preferred Stock | | | | 3.03 | % |
Exchange-Traded Fund | | | | 0.15 | % |
Participation Notes | | | | 0.00 | % |
Total Value of Securities | | | | 99.96 | % |
Receivables and Other Assets Net of Liabilities | | | | 0.04 | % |
Total Net Assets | | | | 100.00 | % |
33
Security type / country and sector allocations
Delaware Emerging Markets Fund
| | | | | |
| Common stock, participation notes, and preferred stock² | | Percentage of net assets |
Consumer Discretionary | | | | 13.07 | % |
Consumer Staples | | | | 7.88 | % |
Energy | | | | 15.69 | % |
Financials | | | | 10.31 | % |
Healthcare | | | | 2.53 | % |
Industrials | | | | 1.62 | % |
Information Technology* | | | | 29.99 | % |
Materials | | | | 3.70 | % |
Real Estate | | | | 0.82 | % |
Telecommunication Services | | | | 13.80 | % |
Utilities | | | | 0.40 | % |
Total | | | | 99.81 | % |
| ² | Narrow industries are utilized for compliance purposes for diversification whereas broad sectors are used for financial reporting. |
| * | To monitor compliance with the Fund’s concentration guidelines as described in the Fund’s Prospectus and Statement of Additional Information, the Information Technology sector (as disclosed herein for financial reporting purposes) is subdivided into a variety of “industries” (in accordance with the requirements of the Investment Company Act of 1940 (1940 Act)). The Information Technology sector consisted of commercial services, electronics, Internet, and semiconductors. As of Nov. 30, 2018, such amounts, as a percentage of total net assets, were 0.11%, 2.12%, 12.12%, and 15.64%, respectively. The percentage in any such single industry will comply with the Fund’s concentration policy even if the percentage in the Information Technology sector for financial reporting purposes may exceed 25%. |
34
| | |
| Security type / country and sector allocations |
| Delaware Global Value Fund | | As of November 30, 2018 (Unaudited) |
Sector designations may be different than the sector designations presented in other Fund materials. The sector designations may represent the investment manager’s internal sector classifications, which may result in the sector designations for one fund being different than another fund’s sector designations.
| | | | | |
| Security type / country | | Percentage of net assets |
Common Stock by Country | | | | 99.23 | % |
Canada | | | | 3.95 | % |
China/Hong Kong | | | | 2.56 | % |
France | | | | 6.98 | % |
Germany | | | | 2.98 | % |
Indonesia | | | | 1.76 | % |
Italy | | | | 1.99 | % |
Japan | | | | 11.44 | % |
Netherlands | | | | 2.08 | % |
Panama | | | | 0.53 | % |
Republic of Korea | | | | 1.91 | % |
Russia | | | | 0.78 | % |
Singapore | | | | 1.05 | % |
Spain | | | | 1.51 | % |
Sweden | | | | 1.16 | % |
Switzerland | | | | 1.86 | % |
United Kingdom | | | | 12.96 | % |
United States | | | | 43.73 | % |
Total Value of Securities | | | | 99.23 | % |
Receivables and Other Assets Net of Liabilities | | | | 0.77 | % |
Total Net Assets | | | | 100.00 | % |
35
Security type / country and sector allocations
Delaware Global Value Fund
| | | | | |
| Common stock by sector | | Percentage of net assets |
Consumer Discretionary | | 14.48% |
Consumer Staples | | 5.04% |
Energy | | 4.35% |
Financials | | 22.36% |
Healthcare | | 13.35% |
Industrials | | 20.02% |
Information Technology | | 12.15% |
Materials | | 1.84% |
Telecommunication Services | | 5.64% |
Total | | 99.23% |
36
| | |
| Security type / country and sector allocations |
| Delaware International Small Cap Fund | | As of November 30, 2018 (Unaudited) |
Sector designations may be different than the sector designations presented in other Fund materials. The sector designations may represent the investment manager’s internal sector classifications, which may result in the sector designations for one fund being different than another fund’s sector designations.
| | | | | |
| Security type / country | | Percentage of net assets |
Common Stock by Country | | | | 95.35 | % |
Australia | | | | 3.78 | % |
Austria | | | | 1.04 | % |
Belgium | | | | 0.85 | % |
Brazil | | | | 0.57 | % |
Canada | | | | 7.24 | % |
China/Hong Kong | | | | 5.67 | % |
Colombia | | | | 1.08 | % |
Denmark | | | | 1.98 | % |
Finland | | | | 1.08 | % |
France | | | | 2.43 | % |
Germany | | | | 4.99 | % |
India | | | | 3.47 | % |
Ireland | | | | 7.18 | % |
Israel | | | | 2.11 | % |
Italy | | | | 1.75 | % |
Japan | | | | 19.34 | % |
Malaysia | | | | 1.30 | % |
Mexico | | | | 0.92 | % |
Netherlands | | | | 1.10 | % |
Norway | | | | 5.13 | % |
Portugal | | | | 1.10 | % |
Republic of Korea | | | | 1.90 | % |
Spain | | | | 0.65 | % |
Sweden | | | | 1.09 | % |
Switzerland | | | | 1.06 | % |
Taiwan | | | | 0.81 | % |
United Kingdom | | | | 15.73 | % |
Preferred Stock | | | | 0.54 | % |
Total Value of Securities | | | | 95.89 | % |
Receivables and Other Assets Net of Liabilities | | | | 4.11 | % |
Total Net Assets | | | | 100.00 | % |
37
Security type / country and sector allocations
Delaware International Small Cap Fund
| | |
| Common stock and preferred stock by sector | | Percentage of net assets |
Consumer Discretionary | | 10.30% |
Consumer Staples | | 18.15% |
Energy | | 5.09% |
Financials | | 8.65% |
Healthcare | | 7.83% |
Industrials | | 16.67% |
Information Technology | | 16.57% |
Materials | | 6.67% |
Real Estate | | 2.82% |
Telecommunication Services | | 1.98% |
Utilities | | 1.16% |
Total | | 95.89% |
38
Security type / country and sector allocations
| | |
| Delaware International Value Equity Fund | | As of November 30, 2018 (Unaudited) |
Sector designations may be different than the sector designations presented in other Fund materials. The sector designations may represent the investment manager’s internal sector classifications, which may result in the sector designations for one fund being different than another fund’s sector designations.
| | | | | |
| Security type / country | | Percentage of net assets |
Common Stock by Country | | | | 99.01 | % |
Australia | | | | 0.45 | % |
Canada | | | | 4.89 | % |
China/Hong Kong | | | | 8.67 | % |
Denmark | | | | 2.35 | % |
Finland | | | | 2.54 | % |
France | | | | 17.98 | % |
Germany | | | | 4.37 | % |
Indonesia | | | | 2.78 | % |
Italy | | | | 2.98 | % |
Japan | | | | 21.32 | % |
Netherlands | | | | 4.91 | % |
Panama | | | | 0.51 | % |
Republic of Korea | | | | 2.17 | % |
Russia | | | | 0.86 | % |
Singapore | | | | 1.02 | % |
Spain | | | | 1.84 | % |
Sweden | | | | 1.22 | % |
Switzerland | | | | 3.51 | % |
United Kingdom | | | | 14.64 | % |
Securities Lending Collateral | | | | 0.00 | % |
Total Value of Securities | | | | 99.01 | % |
Receivables and Other Assets Net of Liabilities | | | | 0.99 | % |
Total Net Assets | | | | 100.00 | % |
39
Security type / country and sector allocations
Delaware International Value Equity Fund
| | | | | |
| Common stock by sector | | Percentage of net assets |
Consumer Discretionary | | | | 19.60 | % |
Consumer Staples | | | | 8.03 | % |
Energy | | | | 6.13 | % |
Financials | | | | 19.15 | % |
Healthcare | | | | 11.10 | % |
Industrials | | | | 20.91 | % |
Information Technology | | | | 5.73 | % |
Materials | | | | 2.55 | % |
Telecommunication Services | | | | 4.60 | % |
Utilities | | | | 1.21 | % |
Total | | | | 99.01 | % |
40
| | |
| Schedules of investments | | |
| Delaware Emerging Markets Fund | | November 30, 2018 |
| | | | | | | | |
| | | Number of shares | | | Value (US $) | |
Common Stock – 96.78%D | | | | | | | | |
Argentina – 1.39% | | | | | | | | |
Arcos Dorados Holdings Class A | | | 3,900,000 | | | $ | 32,175,000 | |
Cablevision Holding GDR † | | | 443,972 | | | | 3,147,229 | |
Cresud ADR † | | | 1,582,280 | | | | 18,860,778 | |
Grupo Clarin GDR Class B 144A #† | | | 131,213 | | | | 347,714 | |
IRSA Inversiones y Representaciones ADR † | | | 1,184,728 | | | | 16,278,163 | |
IRSA Propiedades Comerciales ADR † | | | 32,849 | | | | 673,405 | |
| | | | | | | | |
| | | | | | | 71,482,289 | |
| | | | | | | | |
Bahrain – 0.03% | | | | | | | | |
Aluminum Bahrain GDR 144A # | | | 221,400 | | | | 1,747,577 | |
| | | | | | | | |
| | | | | | | 1,747,577 | |
| | | | | | | | |
Brazil – 11.09% | | | | | | | | |
Aes Tiete Energia | | | 508,806 | | | | 1,355,237 | |
Atacadao Distribuicao Comercio e Industria | | | 4,268,300 | | | | 18,653,807 | |
B2W Cia Digital † | | | 13,015,600 | | | | 128,809,675 | |
Banco Bradesco ADR | | | 3,870,000 | | | | 38,545,200 | |
Banco Santander Brasil ADR | | | 3,800,000 | | | | 42,560,000 | |
BRF ADR † | | | 6,850,000 | | | | 39,045,000 | |
Centrais Eletricas Brasileiras † | | | 2,140,204 | | | | 13,520,865 | |
Cia Brasileira de Distribuicao ADR | | | 1,161,295 | | | | 25,025,907 | |
Embraer ADR | | | 522,544 | | | | 11,731,113 | |
Gol Linhas Aereas Inteligentes ADR † | | | 2,400,000 | | | | 27,384,000 | |
Hypera | | | 1,800,000 | | | | 14,941,815 | |
Itau Unibanco Holding ADR | | | 8,535,000 | | | | 79,631,550 | |
Petroleo Brasileiro ADR | | | 2,717,900 | | | | 39,572,624 | |
Rumo † | | | 1,905,351 | | | | 8,593,049 | |
Telefonica Brasil ADR | | | 2,500,000 | | | | 29,625,000 | |
TIM Participacoes ADR | | | 2,270,179 | | | | 34,779,142 | |
Vale ADR | | | 1,131,557 | | | | 15,502,331 | |
| | | | | | | | |
| | | | | | | 569,276,315 | |
| | | | | | | | |
Chile – 0.94% | | | | | | | | |
Cia Cervecerias Unidas ADR | | | 365,790 | | | | 9,503,224 | |
Latam Airlines Group ADR | | | 236,800 | | | | 2,467,456 | |
Sociedad Quimica y Minera de Chile ADR | | | 830,000 | | | | 36,520,000 | |
| | | | | | | | |
| | | | | | | 48,490,680 | |
| | | | | | | | |
China/Hong Kong – 29.69% | | | | | | | | |
58.com ADR † | | | 90,000 | | | | 5,363,100 | |
Alibaba Group Holding ADR † | | | 1,280,000 | | | | 205,900,800 | |
Baidu ADR † | | | 585,000 | | | | 110,143,800 | |
BeiGene † | | | 1,615,700 | | | | 17,943,483 | |
BeiGene ADR † | | | 58,827 | | | | 9,018,767 | |
Bitauto Holdings ADR † | | | 454,200 | | | | 8,384,532 | |
China Mengniu Dairy † | | | 8,120,000 | | | | 25,185,586 | |
41
Schedules of investments
Delaware Emerging Markets Fund
| | | | | | | | |
| | | Number of shares | | | Value (US $) | |
Common StockD (continued) | | | | | | | | |
China/Hong Kong (continued) | | | | | | | | |
China Mobile | | | 17,222,000 | | | $ | 171,673,292 | |
China Mobile ADR | | | 720,064 | | | | 35,815,983 | |
China Petroleum & Chemical Class H | | | 30,000,000 | | | | 25,680,061 | |
CNOOC | | | 19,311,000 | | | | 32,623,081 | |
Ctrip.com International ADR † | | | 830,000 | | | | 23,945,500 | |
Genscript Biotech † | | | 10,640,000 | | | | 18,654,243 | |
Guangshen Railway Class H | | | 11,000,000 | | | | 4,321,314 | |
Industrial & Commercial Bank of China Class H | | | 130,000,000 | | | | 92,848,629 | |
JD.com ADR † | | | 2,910,000 | | | | 61,779,300 | |
Kunlun Energy | | | 21,000,000 | | | | 25,512,928 | |
Kweichow Moutai Class A | | | 100 | | | | 8,174 | |
NIO ADR † | | | 550,000 | | | | 4,240,500 | |
PetroChina Class H | | | 31,688,000 | | | | 22,132,776 | |
Ping An Insurance Group Co. of China | | | 7,000,000 | | | | 68,218,306 | |
SINA † | | | 2,120,000 | | | | 137,312,400 | |
Sinofert Holdings † | | | 28,000,000 | | | | 3,125,156 | |
Sogou ADR † | | | 1,500,000 | | | | 9,315,000 | |
Sohu.com ADR † | | | 2,219,642 | | | | 46,279,536 | |
Tencent Holdings | | | 4,750,000 | | | | 189,898,563 | |
Tianjin Development Holdings | | | 15,885,550 | | | | 5,545,277 | |
Tingyi Cayman Islands Holding | | | 23,000,000 | | | | 29,830,465 | |
Tsingtao Brewery Class H | | | 12,194,073 | | | | 49,844,779 | |
Uni-President China Holdings | | | 37,019,000 | | | | 33,829,579 | |
Weibo ADR † | | | 560,000 | | | | 35,660,800 | |
YY ADR † | | | 170,000 | | | | 11,571,900 | |
ZhongAn Online P&C Insurance Class H 144A #† | | | 739,600 | | | | 3,050,799 | |
| | | | | | | | |
| | | | | | | 1,524,658,409 | |
| | | | | | | | |
Cyprus – 0.11% | | | | | | | | |
QIWI ADR † | | | 385,284 | | | | 5,794,671 | |
| | | | | | | | |
| | | | | | | 5,794,671 | |
| | | | | | | | |
France – 0.01% | | | | | | | | |
Vallourec † | | | 258,011 | | | | 611,933 | |
| | | | | | | | |
| | | | | | | 611,933 | |
| | | | | | | | |
India – 9.64% | | | | | | | | |
Aurobindo Pharma | | | 1,500,000 | | | | 17,458,311 | |
Glenmark Pharmaceuticals | | | 1,167,988 | | | | 10,952,248 | |
Indiabulls Real Estate GDR † | | | 102,021 | | | | 114,923 | |
Lupin | | | 2,500,000 | | | | 31,812,155 | |
Oil & Natural Gas | | | 1,200,000 | | | | 2,418,407 | |
RattanIndia Infrastructure GDR =† | | | 300,961 | | | | 14,682 | |
Reliance Industries | | | 14,511,110 | | | | 243,336,826 | |
42
| | | | | | | | |
| | | Number of shares | | | Value (US $) | |
| |
Common StockD (continued) | | | | | | | | |
| |
India (continued) | | | | | | | | |
Reliance Industries GDR 144A # | | | 3,775,184 | | | $ | 125,632,842 | |
Tata Chemicals | | | 1,866,909 | | | | 18,706,974 | |
Tata Motors † | | | 3,000,000 | | | | 7,389,662 | |
Tata Motors ADR † | | | 1,000,000 | | | | 12,200,000 | |
United Breweries | | | 484,517 | | | | 8,633,770 | |
Wockhardt † | | | 1,200,000 | | | | 9,341,345 | |
Zee Entertainment Enterprises | | | 1,000,000 | | | | 7,010,046 | |
| | | | | | | | |
| | | | | | | 495,022,191 | |
| | | | | | | | |
Indonesia – 0.79% | | | | | | | | |
Astra Agro Lestari | | | 9,132,500 | | | | 7,018,326 | |
Astra International | | | 56,000,000 | | | | 33,538,858 | |
| | | | | | | | |
| | | | | | | 40,557,184 | |
| | | | | | | | |
Japan – 0.57% | | | | | | | | |
LINE ADR † | | | 827,957 | | | | 29,160,646 | |
| | | | | | | | |
| | | | | | | 29,160,646 | |
| | | | | | | | |
Malaysia – 0.06% | | | | | | | | |
UEM Sunrise | | | 17,000,000 | | | | 2,811,839 | |
| | | | | | | | |
| | | | | | | 2,811,839 | |
| | | | | | | | |
Mexico – 5.56% | | | | | | | | |
America Movil ADR Class L | | | 1,500,000 | | | | 20,175,000 | |
Banco Santander Mexico Institucion de Banca Multiple | | | | | | | | |
Grupo Financiero Santander ADR | | | 7,432,526 | | | | 45,338,409 | |
Cemex ADR † | | | 3,623,267 | | | | 18,623,592 | |
Coca-Cola Femsa ADR | | | 1,585,781 | | | | 95,923,893 | |
Fomento Economico Mexicano ADR | | | 154,722 | | | | 13,422,133 | |
Grupo Financiero Banorte Class O | | | 4,000,000 | | | | 18,335,688 | |
Grupo Lala | | | 3,900,027 | | | | 3,537,161 | |
Grupo Televisa ADR | | | 4,520,000 | | | | 61,698,000 | |
Kimberly-Clark de Mexico Class A | | | 5,880,600 | | | | 8,708,041 | |
| | | | | | | | |
| | | | | | | 285,761,917 | |
| | | | | | | | |
Netherlands – 0.23% | | | | | | | | |
VEON ADR | | | 4,281,700 | | | | 11,646,224 | |
| | | | | | | | |
| | | | | | | 11,646,224 | |
| | | | | | | | |
Peru – 0.89% | | | | | | | | |
Cia de Minas Buenaventura ADR | | | 3,217,400 | | | | 45,494,036 | |
| | | | | | | | |
| | | | | | | 45,494,036 | |
| | | | | | | | |
Republic of Korea – 18.66% | | | | | | | | |
Hyundai Motor | | | 80,000 | | | | 7,646,408 | |
KB Financial Group ADR | | | 245,928 | | | | 10,356,028 | |
Kia Motors | | | 380,000 | | | | 10,345,661 | |
LG Display | | | 1,000,000 | | | | 15,677,701 | |
LG Electronics | | | 320,000 | | | | 20,771,959 | |
43
Schedules of investments
Delaware Emerging Markets Fund
| | | | | | | | |
| | | Number of shares | | | Value (US $) | |
| |
Common StockD(continued) | | | | | | | | |
| |
Republic of Korea (continued) | | | | | | | | |
LG Uplus | | | 2,226,000 | | | $ | 35,197,442 | |
Lotte † | | | 433,093 | | | | 21,405,245 | |
Lotte Chilsung Beverage | | | 8,648 | | | | 11,294,591 | |
Lotte Confectionery | | | 77,164 | | | | 11,547,299 | |
NAVER | | | 26,250 | | | | 2,968,450 | |
Samsung Electronics | | | 5,330,000 | | | | 199,721,302 | |
Samsung Fire & Marine Insurance | | | 73,195 | | | | 17,793,512 | |
Samsung Life Insurance | | | 360,939 | | | | 27,893,104 | |
Shinhan Financial Group Co. | | | 500,000 | | | | 18,447,928 | |
SK Hynix | | | 3,290,000 | | | | 205,493,810 | |
SK Telecom | | | 678,597 | | | | 175,642,379 | |
SK Telecom ADR | | | 5,860,934 | | | | 166,274,698 | |
| | | | | | | | |
| | | | | | | 958,477,517 | |
| | | | | | | | |
Russia – 6.04% | | | | | | | | |
ENEL RUSSIA PJSC GDR | | | 21,161 | | | | 17,384 | |
Etalon Group GDR 144A # | | | 1,616,300 | | | | 3,200,274 | |
Gazprom PJSC ADR | | | 14,600,000 | | | | 69,670,514 | |
LUKOIL PJSC ADR | | | 610,000 | | | | 45,014,887 | |
Mail.Ru Group GDR † | | | 500,000 | | | | 12,565,171 | |
Mobile TeleSystems PJSC ADR | | | 1,200,000 | | | | 8,892,000 | |
Rosneft Oil PJSC GDR | | | 13,500,000 | | | | 85,227,809 | |
Sberbank of Russia PJSC | | | 12,000,000 | | | | 34,746,268 | |
Sberbank of Russia PJSC ADR | | | 800,000 | | | | 9,541,360 | |
Surgutneftegas PJSC ADR | | | 2,014,441 | | | | 8,026,498 | |
T Plus PJSC =† | | | 36,096 | | | | 0 | |
X5 Retail Group GDR | | | 380,000 | | | | 9,690,000 | |
Yandex Class A † | | | 800,000 | | | | 23,600,000 | |
| | | | | | | | |
| | | | | | | 310,192,165 | |
| | | | | | | | |
South Africa – 0.56% | | | | | | | | |
Impala Platinum Holdings † | | | 3,000,000 | | | | 7,197,648 | |
Naspers | | | 80,000 | | | | 15,948,259 | |
Sun International † | | | 364,166 | | | | 1,577,144 | |
Tongaat Hulett | | | 838,307 | | | | 4,134,448 | |
| | | | | | | | |
| | | | | | | 28,857,499 | |
| | | | | | | | |
Taiwan – 7.30% | | | | | | | | |
FIT Hon Teng 144A # | | | 20,213,000 | | | | 8,714,991 | |
Hon Hai Precision Industry | | | 36,000,000 | | | | 84,513,372 | |
MediaTek | | | 9,000,000 | | | | 69,708,204 | |
Taiwan Semiconductor Manufacturing | | | 28,000,000 | | | | 206,788,353 | |
United Microelectronics | | | 14,262,000 | | | | 5,329,060 | |
| | | | | | | | |
| | | | | | | 375,053,980 | |
| | | | | | | | |
44
| | | | | | | | |
| | | Number of shares | | | Value (US $) | |
| |
Common StockD (continued) | | | | | | | | |
| |
Turkey – 0.95% | | | | | | | | |
Akbank T.A.S. | | | 15,000,000 | | | $ | 22,076,415 | |
Turk Telekomunikasyon † | | | 951,192 | | | | 713,549 | |
Turkcell Iletisim Hizmetleri | | | 2,427,827 | | | | 5,914,313 | |
Turkcell Iletisim Hizmetleri ADR | | | 2,066,701 | | | | 12,441,540 | |
Turkiye Sise ve Cam Fabrikalari | | | 7,651,443 | | | | 7,386,874 | |
| | | | | | | 48,532,691 | |
United Kingdom – 0.07% | | | | | | | | |
Griffin Mining † | | | 3,056,187 | | | | 3,827,683 | |
| | | | | | | 3,827,683 | |
United States – 2.20% | | | | | | | | |
Altaba † | | | 500,000 | | | | 32,795,000 | |
Micron Technology † | | | 2,080,000 | | | | 80,204,800 | |
| | | | | | | 112,999,800 | |
| | |
Total Common Stock(cost $5,051,088,124) | | | | | | | 4,970,457,246 | |
|
| |
Preferred Stock – 3.03%D | | | | | | | | |
| |
Brazil – 1.79% | | | | | | | | |
Braskem Class A 3.70% | | | 1,470,000 | | | | 20,595,966 | |
Gerdau 2.37% | | | 2,764,900 | | | | 11,068,180 | |
Petroleo Brasileiro Class A ADR 0.82% | | | 4,000,000 | | | | 52,560,000 | |
Usinas Siderurgicas de Minas Gerais Class A 0.50% | | | 3,235,733 | | | | 7,823,663 | |
| | | | | | | 92,047,809 | |
Republic of Korea – 0.70% | | | | | | | | |
Samsung Electronics 4.52% | | | 1,183,100 | | | | 35,782,105 | |
| | | | | | | 35,782,105 | |
Russia – 0.54% | | | | | | | | |
Transneft PJSC 4.43% | | | 10,588 | | | | 27,718,436 | |
| | | | | | | 27,718,436 | |
Total Preferred Stock(cost $99,060,928) | | | | | | | 155,548,350 | |
|
| |
Exchange-Traded Fund – 0.15% | | | | | | | | |
| |
iShares MSCI Turkey ETF | | | 290,275 | | | | 7,622,621 | |
Total Exchange-Traded Fund(cost $13,207,352) | | | | | | | 7,622,621 | |
45
Schedules of investments
Delaware Emerging Markets Fund
| | | | | | | | |
| | | Number of shares | | | Value (US $) | |
| |
Participation Notes – 0.00% | |
Lehman Indian Oil | | | | | | | | |
CW 12 LEPO =† | | | 172,132 | | | $ | 0 | |
Lehman Oil & Natural Gas | | | | | | | | |
CW 12 LEPO =† | | | 254,590 | | | | 0 | |
| | | | | | | | |
Total Participation Notes(cost $8,559,057) | | | | | | | 0 | |
| | | | | | | | |
| | |
Total Value of Securities – 99.96%
(cost $5,171,915,461) | | | | | | $ | 5,133,628,217 | |
| | | | | | | | |
| # | Security exempt from registration under Rule 144A of the Securities Act of 1933, as amended. At Nov. 30, 2018, the aggregate value of Rule 144A securities was $142,694,197, which represents 2.78% of the Fund’s net assets. See Note 11 in “Notes to financial statements.” |
| = | The value of this security was determined using significant unobservable inputs and is reported as a Level 3 security in the disclosure table located in Note 3 in “Notes to financial statements.” |
| D | Securities have been classified by country of origin. Aggregate classification by business sector has been presented on page 34 in “Security type / country and sector allocations.” |
| † | Non-income producing security. |
The following foreign currency exchange contract was outstanding at Nov. 30, 2018:1
| | | | | | | | | | | | | | | | |
| Foreign Currency Exchange Contract | | | | | | | | | | |
Counterparty | | Contract to
Receive (Deliver) | | | In Exchange For | | Settlement
Date | | Unrealized
Depreciation | |
BNYM | | KRW | | | (634,903,118) | | | USD | | 566,004 | | 12/3/18 | | $ | (689 | ) |
The use of foreign currency exchange contracts involves elements of market risk and risks in excess of the amounts disclosed in the financial statements. The foreign currency exchange contract presented above represents the Fund’s total exposure in such contract, whereas only the net unrealized appreciation (depreciation) is reflected in the Fund’s net assets.
1See Note 8 in “Notes to financial statements.”
|
| Summary of abbreviations: |
| ADR – American Depositary Receipt |
| BNYM – The Bank of New York Mellon |
| ETF – Exchange-Traded Fund |
| GDR – Global Depositary Receipt |
| KRW – South Korean Won |
| LEPO – Low Exercise Price Option |
| PJSC – Public Joint Stock Company |
| USD – US Dollar |
|
| See accompanying notes, which are an integral part of the financial statements. |
46
Schedules of investments
| | |
| Delaware Global Value Fund | | November 30, 2018 |
| | | | | | | | |
| | | Number of shares | | | Value (US $) | |
Common Stock – 99.23%D | |
Canada – 3.95% | | | | | | | | |
CGI Group Class A † | | | 5,348 | | | $ | 342,137 | |
Suncor Energy | | | 7,010 | | | | 226,025 | |
| | | | | | | | |
| | | | | | | 568,162 | |
| | | | | | | | |
China/Hong Kong – 2.56% | | | | | | | | |
Sinopharm Group Class H | | | 17,066 | | | | 84,201 | |
Yue Yuen Industrial Holdings | | | 97,500 | | | | 284,122 | |
| | | | | | | | |
| | | | | | | 368,323 | |
| | | | | | | | |
France – 6.98% | | | | | | | | |
AXA | | | 9,584 | | | | 233,392 | |
Sanofi | | | 1,874 | | | | 169,897 | |
TOTAL | | | 4,514 | | | | 251,068 | |
Valeo | | | 4,320 | | | | 123,281 | |
Vinci | | | 2,602 | | | | 227,050 | |
| | | | | | | | |
| | | | | | | 1,004,688 | |
| | | | | | | | |
Germany – 2.98% | | | | | | | | |
Bayerische Motoren Werke | | | 2,524 | | | | 207,254 | |
Deutsche Post | | | 6,947 | | | | 222,047 | |
| | | | | | | | |
| | | | | | | 429,301 | |
| | | | | | | | |
Indonesia – 1.76% | | | | | | | | |
Bank Rakyat Indonesia Persero | | | 998,905 | | | | 253,502 | |
| | | | | | | | |
| | | | | | | 253,502 | |
| | | | | | | | |
Italy – 1.99% | | | | | | | | |
Leonardo | | | 13,169 | | | | 130,241 | |
UniCredit | | | 12,122 | | | | 156,466 | |
| | | | | | | | |
| | | | | | | 286,707 | |
| | | | | | | | |
Japan – 11.44% | | | | | | | | |
East Japan Railway | | | 1,770 | | | | 161,026 | |
ITOCHU | | | 15,678 | | | | 279,064 | |
Matsumotokiyoshi Holdings | | | 7,300 | | | | 272,038 | |
MINEBEA MITSUMI | | | 25,820 | | | | 421,441 | |
Mitsubishi UFJ Financial Group | | | 19,724 | | | | 107,918 | |
Nippon Telegraph & Telephone | | | 5,276 | | | | 217,641 | |
Toyota Motor | | | 3,120 | | | | 188,608 | |
| | | | | | | | |
| | | | | | | 1,647,736 | |
| | | | | | | | |
Netherlands – 2.08% | | | | | | | | |
ING Groep CVA | | | 8,313 | | | | 100,685 | |
Koninklijke Philips | | | 5,252 | | | | 199,155 | |
| | | | | | | | |
| | | | | | | 299,840 | |
| | | | | | | | |
Panama – 0.53% | | | | | | | | |
Copa Holdings Class A | | | 900 | | | | 76,527 | |
| | | | | | | | |
| | | | | | | 76,527 | |
| | | | | | | | |
47
Schedules of investments
Delaware Global Value Fund
| | | | | | | | |
| | | Number of shares | | | Value (US $) | |
Common StockD (continued) | | | | | | | | |
Republic of Korea – 1.91% | | | | | | | | |
Samsung Electronics | | | 7,338 | | | $ | 274,963 | |
| | | | | | | | |
| | | | | | | 274,963 | |
| | | | | | | | |
Russia – 0.78% | | | | | | | | |
Mobile TeleSystems PJSC ADR | | | 15,145 | | | | 112,224 | |
| | | | | | | | |
| | | | | | | 112,224 | |
| | | | | | | | |
Singapore – 1.05% | | | | | | | | |
United Overseas Bank | | | 8,200 | | | | 150,564 | |
| | | | | | | | |
| | | | | | | 150,564 | |
| | | | | | | | |
Spain – 1.51% | | | | | | | | |
Banco Santander | | | 45,919 | | | | 218,135 | |
| | | | | | | | |
| | | | | | | 218,135 | |
| | | | | | | | |
Sweden – 1.16% | | | | | | | | |
Tele2 Class B | | | 13,321 | | | | 166,840 | |
| | | | | | | | |
| | | | | | | 166,840 | |
| | | | | | | | |
Switzerland – 1.86% | | | | | | | | |
Novartis | | | 2,938 | | | | 268,244 | |
| | | | | | | | |
| | | | | | | 268,244 | |
| | | | | | | | |
United Kingdom – 12.96% | | | | | | | | |
Aptiv | | | 3,465 | | | | 249,133 | |
Imperial Brands | | | 14,717 | | | | 453,639 | |
Meggitt | | | 39,452 | | | | 261,553 | |
Playtech | | | 51,669 | | | | 292,589 | |
Rio Tinto | | | 5,812 | | | | 265,621 | |
Shire | | | 4,799 | | | | 280,270 | |
Standard Chartered | | | 8,026 | | | | 62,610 | |
| | | | | | | | |
| | | | | | | 1,865,415 | |
| | | | | | | | |
United States – 43.73% | | | | | | | | |
American Airlines Group | | | 5,905 | | | | 237,145 | |
Apple | | | 1,955 | | | | 349,124 | |
AT&T | | | 6,995 | | | | 218,524 | |
Caterpillar | | | 2,665 | | | | 361,561 | |
Cintas | | | 1,880 | | | | 352,274 | |
Goldman Sachs Group | | | 1,975 | | | | 376,613 | |
International Business Machines | | | 2,385 | | | | 296,384 | |
Johnson & Johnson | | | 2,770 | | | | 406,913 | |
JPMorgan Chase & Co. | | | 4,840 | | | | 538,160 | |
Lowe’s | | | 2,875 | | | | 271,314 | |
Marathon Petroleum | | | 2,300 | | | | 149,868 | |
Mylan † | | | 4,355 | | | | 147,460 | |
Nasdaq | | | 6,230 | | | | 568,924 | |
48
| | | | | | | | |
| | | Number of shares | | | Value (US $) | |
Common StockD(continued) | | | | | | | | |
United States (continued) | | | | | | | | |
Omnicom Group * | | | 3,270 | | | $ | 251,692 | |
Oracle | | | 9,985 | | | | 486,869 | |
Pfizer | | | 7,910 | | | | 365,679 | |
Target | | | 3,055 | | | | 216,783 | |
Travelers | | | 3,470 | | | | 452,384 | |
Verizon Communications | | | 1,600 | | | | 96,480 | |
WESCO International † | | | 2,860 | | | | 152,753 | |
| | | | | | | | |
| | | | | | | 6,296,904 | |
| | | | | | | | |
| | |
Total Common Stock(cost $12,340,070) | | | | | | | 14,288,075 | |
| | | | | | | | |
| | |
Total Value of Securities – 99.23%
(cost $12,340,070) | | | | | | $ | 14,288,075∎ | |
| | | | | | | | |
| * | Fully or partially on loan. |
| ∎ | Includes $251,692 of securities loaned for which the counterparty pledged additionalnon-cash collateral valued at $257,500. |
| D | Securities have been classified by country of origin. Aggregate classification by business sector has been presented on page 36 in “Security type / country and sector allocations.” |
| † | Non-income producing security. |
The following foreign currency exchange contracts were outstanding at Nov. 30, 2018:1
| | | | | | | | | | | | | | | | | | | | |
| Foreign Currency Exchange Contracts | | | | | | | | | | |
Counterparty | | Contract to
Receive (Deliver) | | | In Exchange For | | | Settlement
Date | | | Unrealized
Depreciation | |
BNYM | | | CAD | | | | (12,844 | ) | | USD | 9,662 | | | | 12/3/18 | | | $ | (4 | ) |
BNYM | | | CAD | | | | (8,458 | ) | | USD | 6,357 | | | | 12/4/18 | | | | (10 | ) |
BNYM | | | CHF | | | | (1,726 | ) | | USD | 1,725 | | | | 12/4/18 | | | | (3 | ) |
BNYM | | | EUR | | | | (33,052 | ) | | USD | 37,429 | | | | 12/4/18 | | | | (3 | ) |
BNYM | | | GBP | | | | (23,394 | ) | | USD | 29,803 | | | | 12/4/18 | | | | (16 | ) |
BNYM | | | HKD | | | | (23,245 | ) | | USD | 2,970 | | | | 12/4/18 | | | | (1 | ) |
BNYM | | | JPY | | | | (833,525 | ) | | USD | 7,337 | | | | 12/3/18 | | | | (7 | ) |
BNYM | | | JPY | | | | (1,947,102 | ) | | USD | 17,135 | | | | 12/5/18 | | | | (20 | ) |
BNYM | | | SEK | | | | (28,037 | ) | | USD | 3,078 | | | | 12/4/18 | | | | (1 | ) |
BNYM | | | SGD | | | | (2,498 | ) | | USD | 1,820 | | | | 12/5/18 | | | | — | |
| | | | | | | | | | | | | | | | | | | | |
Total Foreign Currency Exchange Contracts | | | | | | | | | | | | | | | | | | $ | (65 | ) |
| | | | | | | | | | | | | | | | | | | | |
The use of foreign currency exchange contracts involves elements of market risk and risks in excess of the amounts disclosed in the financial statements. The foreign currency exchange contracts presented above represent the Fund’s total exposure in such contracts, whereas only the net unrealized appreciation (depreciation) is reflected in the Fund’s net assets.
49
Schedules of investments
Delaware Global Value Fund
|
| 1See Note 8 in “Notes to financial statements.” |
|
Summary of abbreviations: |
ADR – American Depositary Receipt |
BNYM – The Bank of New York Mellon |
CAD – Canadian Dollar |
CHF – Swiss Franc |
CVA – Dutch Certificate |
EUR – European Monetary Unit |
GBP – British Pound Sterling |
HKD – Hong Kong Dollar |
JPY – Japanese Yen |
PJSC – Public Joint Stock Company |
SEK – Swedish Krona |
SGD – Singapore Dollar |
USD – US Dollar |
See accompanying notes, which are an integral part of the financial statements.
50
Schedules of investments
| | |
| Delaware International Small Cap Fund | | November 30, 2018 |
| | | | | | | | |
| | | Number of shares | | | Value (US $) | |
Common Stock – 95.35%D | |
Australia – 3.78% | | | | | | | | |
Afterpay Touch Group † | | | 107,703 | | | $ | 1,145,704 | |
Cleanaway Waste Management | | | 643,862 | | | | 802,136 | |
Costa Group Holdings | | | 177,662 | | | | 992,755 | |
| | | | | | | | |
| | | | | | | 2,940,595 | |
| | | | | | | | |
Austria – 1.04% | | | | | | | | |
Vienna Insurance Group AG Wiener Versicherung Gruppe | | | 31,554 | | | | 811,610 | |
| | | | | | | | |
| | | | | | | 811,610 | |
| | | | | | | | |
Belgium – 0.85% | | | | | | | | |
Fagron | | | 38,427 | | | | 657,621 | |
| | | | | | | | |
| | | | | | | 657,621 | |
| | | | | | | | |
Brazil – 0.57% | | | | | | | | |
Rumo † | | | 97,800 | | | | 441,074 | |
| | | | | | | | |
| | | | | | | 441,074 | |
| | | | | | | | |
Canada – 7.24% | | | | | | | | |
Descartes Systems Group † | | | 41,500 | | | | 1,222,214 | |
Enerplus | | | 121,900 | | | | 1,172,530 | |
Finning International | | | 48,200 | | | | 1,001,620 | |
Norbord | | | 24,900 | | | | 695,847 | |
Quebecor Class B | | | 71,300 | | | | 1,538,532 | |
| | | | | | | | |
| | | | | | | 5,630,743 | |
| | | | | | | | |
China/Hong Kong – 5.67% | | | | | | | | |
China Resources Cement Holdings | | | 1,732,000 | | | | 1,705,854 | |
Chinasoft International † | | | 624,000 | | | | 369,238 | |
Kingdee International Software Group | | | 755,000 | | | | 759,561 | |
Lonking Holdings | | | 1,434,000 | | | | 374,562 | |
Microport Scientific | | | 633,000 | | | | 697,656 | |
Xiabuxiabu Catering Management China Holdings † | | | 346,000 | | | | 500,540 | |
| | | | | | | | |
| | | | | | | 4,407,411 | |
| | | | | | | | |
Colombia – 1.08% | | | | | | | | |
Geopark † | | | 54,425 | | | | 836,512 | |
| | | | | | | | |
| | | | | | | 836,512 | |
| | | | | | | | |
Denmark – 1.98% | | | | | | | | |
Royal Unibrew | | | 21,171 | | | | 1,537,126 | |
| | | | | | | | |
| | | | | | | 1,537,126 | |
| | | | | | | | |
Finland – 1.08% | | | | | | | | |
Valmet | | | 39,064 | | | | 842,811 | |
| | | | | | | | |
| | | | | | | 842,811 | |
| | | | | | | | |
France – 2.43% | | | | | | | | |
Alten | | | 14,818 | | | | 1,348,844 | |
Remy Cointreau | | | 4,662 | | | | 539,924 | |
| | | | | | | | |
| | | | | | | 1,888,768 | |
| | | | | | | | |
51
Schedules of investments
Delaware International Small Cap Fund
| | | | | | | | |
| | | Number of shares | | | Value (US $) | |
Common StockD (continued) | |
Germany – 4.99% | | | | | | | | |
Evotec † | | | 69,533 | | | $ | 1,642,530 | |
Koenig & Bauer | | | 9,964 | | | | 461,491 | |
Rocket Internet † | | | 17,252 | | | | 442,845 | |
TAG Immobilien | | | 55,447 | | | | 1,331,449 | |
| | | | | | | | |
| | | | | | | 3,878,315 | |
| | | | | | | | |
India – 3.47% | | | | | | | | |
Sterlite Technologies | | | 301,177 | | | | 1,507,434 | |
United Breweries | | | 44,151 | | | | 786,741 | |
Varun Beverages | | | 36,272 | | | | 404,523 | |
| | | | | | | | |
| | | | | | | 2,698,698 | |
| | | | | | | | |
Ireland – 7.18% | | | | | | | | |
C&C Group | | | 241,122 | | | | 831,206 | |
Cairn Homes † | | | 332,046 | | | | 478,157 | |
Dalata Hotel Group | | | 169,288 | | | | 891,177 | |
Glanbia | | | 53,076 | | | | 953,387 | |
Hibernia REIT | | | 557,050 | | | | 857,665 | |
Keywords Studios | | | 99,943 | | | | 1,568,343 | |
| | | | | | | | |
| | | | | | | 5,579,935 | |
| | | | | | | | |
Israel – 2.11% | | | | | | | | |
Israel Discount Bank Class A | | | 474,010 | | | | 1,641,450 | |
| | | | | | | | |
| | | | | | | 1,641,450 | |
| | | | | | | | |
Italy – 1.75% | | | | | | | | |
Fincantieri | | | 477,574 | | | | 563,953 | |
Reply | | | 14,198 | | | | 793,217 | |
| | | | | | | | |
| | | | | | | 1,357,170 | |
| | | | | | | | |
Japan – 19.34% | | | | | | | | |
Anicom Holdings | | | 31,000 | | | | 1,026,887 | |
Bic Camera | | | 63,200 | | | | 891,352 | |
Daifuku | | | 8,300 | | | | 426,728 | |
Fancl | | | 57,200 | | | | 1,496,309 | |
GMO Payment Gateway | | | 21,400 | | | | 1,320,374 | |
Kusuri no Aoki Holdings | | | 18,600 | | | | 1,378,122 | |
Maeda | | | 65,800 | | | | 691,846 | |
Matsumotokiyoshi Holdings | | | 34,300 | | | | 1,278,208 | |
NET One Systems | | | 39,900 | �� | | | 828,322 | |
Persol Holdings | | | 41,900 | | | | 786,754 | |
Seino Holdings | | | 54,300 | | | | 807,438 | |
Seria | | | 8,700 | | | | 370,161 | |
SMS | | | 51,100 | | | | 845,703 | |
TechnoPro Holdings | | | 31,000 | | | | 1,554,402 | |
THK | | | 16,400 | | | | 377,981 | |
52
| | | | | | | | |
| | | Number of shares | | | Value (US $) | |
Common StockD (continued) | |
Japan (continued) | | | | | | | | |
Tokai Carbon | | | 68,600 | | | $ | 954,718 | |
| | | | | | | | |
| | | | | | | 15,035,305 | |
| | | | | | | | |
Malaysia – 1.30% | | | | | | | | |
Hartalega Holdings | | | 659,800 | | | | 1,010,460 | |
| | | | | | | | |
| | | | | | | 1,010,460 | |
| | | | | | | | |
Mexico – 0.92% | | | | | | | | |
Alpek † | | | 586,200 | | | | 714,255 | |
| | | | | | | | |
| | | | | | | 714,255 | |
| | | | | | | | |
Netherlands – 1.10% | | | | | | | | |
IMCD Loan | | | 12,942 | | | | 858,299 | |
| | | | | | | | |
| | | | | | | 858,299 | |
| | | | | | | | |
Norway – 5.13% | | | | | | | | |
BW Offshore † | | | 250,347 | | | | 1,086,556 | |
Leroy Seafood Group | | | 177,882 | | | | 1,520,431 | |
Norway Royal Salmon | | | 22,574 | | | | 518,988 | |
TGS NOPEC Geophysical | | | 30,760 | | | | 863,714 | |
| | | | | | | | |
| | | | | | | 3,989,689 | |
| | | | | | | | |
Portugal – 1.10% | | | | | | | | |
NOS SGPS | | | 137,349 | | | | 854,245 | |
| | | | | | | | |
| | | | | | | 854,245 | |
| | | | | | | | |
Republic of Korea – 1.90% | | | | | | | | |
Douzone Bizon | | | 17,128 | | | | 763,968 | |
Hotel Shilla | | | 9,238 | | | | 712,720 | |
| | | | | | | | |
| | | | | | | 1,476,688 | |
| | | | | | | | |
Spain – 0.65% | | | | | | | | |
CIE Automotive | | | 20,214 | | | | 509,051 | |
| | | | | | | | |
| | | | | | | 509,051 | |
| | | | | | | | |
Sweden – 1.09% | | | | | | | | |
Evolution Gaming Group | | | 14,164 | | | | 848,272 | |
| | | | | | | | |
| | | | | | | 848,272 | |
| | | | | | | | |
Switzerland – 1.06% | | | | | | | | |
Georg Fischer | | | 312 | | | | 243,560 | |
Logitech International | | | 17,215 | | | | 580,809 | |
| | | | | | | | |
| | | | | | | 824,369 | |
| | | | | | | | |
Taiwan – 0.81% | | | | | | | | |
Airtac International Group | | | 59,072 | | | | 627,136 | |
| | | | | | | | |
| | | | | | | 627,136 | |
| | | | | | | | |
United Kingdom – 15.73% | | | | | | | | |
Abcam | | | 100,378 | | | | 1,456,293 | |
Beazley | | | 219,972 | | | | 1,570,575 | |
Biffa | | | 137,725 | | | | 356,066 | |
53
Schedules of investments
Delaware International Small Cap Fund
| | | | | | | | |
| | | Number of shares | | | Value (US $) | |
Common StockD (continued) | |
United Kingdom (continued) | | | | | | | | |
Burford Capital | | | 86,282 | | | $ | 1,670,861 | |
Coats Group | | | 696,240 | | | | 723,869 | |
Countryside Properties | | | 212,651 | | | | 785,584 | |
Cranswick | | | 14,227 | | | | 516,434 | |
Dechra Pharmaceuticals | | | 22,580 | | | | 623,745 | |
Drax Group | | | 179,784 | | | | 899,694 | |
Fevertree Drinks | | | 44,195 | | | | 1,353,226 | |
Ibstock | | | 256,014 | | | | 698,058 | |
Learning Technologies Group | | | 547,802 | | | | 673,082 | |
Rotork | | | 268,222 | | | | 898,519 | |
| | | | | | | | |
| | | | | | | 12,226,006 | |
| | | | | | | | |
| | |
Total Common Stock(cost $75,887,519) | | | | | | | 74,123,614 | |
|
| |
Preferred Stock – 0.54%D | | | | | | | | |
Brazil – 0.54% | | | | | | | | |
Bradespar 7.08% | | | 50,700 | | | | 416,666 | |
| | | | | | | | |
Total Preferred Stock(cost $341,390) | | | | | | | 416,666 | |
| | | | | | | | |
| | |
Total Value of Securities – 95.89%
(cost $76,228,909) | | | | | | $ | 74,540,280 | |
| | | | | | | | |
| D | Securities have been classified by country of origin. Aggregate classification by business sector has been presented on page 38 in “Security type / country and sector allocations.” |
| † | Non-income producing security. |
The following foreign currency exchange contracts were outstanding at Nov. 30, 2018:1
| | | | | | | | | | | | | | | | | | | | | | |
| Foreign Currency Exchange Contracts | | | | | | | | | | | | | | |
Counterparty | | Contracts to
Receive (Deliver) | | | In Exchange For | | | Settlement
Date | | Unrealized
Appreciation | | | Unrealized
Depreciation | |
BNYM | | BRL | | | (1,812,871) | | | USD | | | 469,305 | | | 12/3/18 | | $ | 596 | | | $ | — | |
BNYM | | EUR | | | (135,981) | | | USD | | | 154,707 | | | 12/3/18 | | | 728 | | | | — | |
BNYM | | GBP | | | (9,713) | | | USD | | | 12,400 | | | 12/4/18 | | | 21 | | | | — | |
BNYM | | HKD | | | 2,018,173 | | | USD | | | (258,250 | ) | | 12/3/18 | | | — | | | | (278 | ) |
BNYM | | HKD | | | 960,795 | | | USD | | | (122,928 | ) | | 12/4/18 | | | — | | | | (111 | ) |
BNYM | | JPY | | | (211,213,822) | | | USD | | | 1,852,730 | | | 12/3/18 | | | — | | | | (8,317 | ) |
BNYM | | JPY | | | (350,596) | | | USD | | | 3,085 | | | 12/5/18 | | | — | | | | (4 | ) |
BNYM | | MYR | | | (594,456) | | | USD | | | 141,662 | | | 12/3/18 | | | — | | | | (428 | ) |
| | | | | | | | | | | | | | | | | | | | | | |
Total Foreign Currency Exchange Contracts | | | | | | | | | | | $ | 1,345 | | | $ | (9,138 | ) |
| | | | | | | | | | | | | | | | | | | | | | |
54
The use of foreign currency exchange contracts involves elements of market risk and risks in excess of the amounts disclosed in the financial statements. The foreign currency exchange contracts presented above represent the Fund’s total exposure in such contracts, whereas only the net unrealized appreciation (depreciation) is reflected in the Fund’s net assets.
1See Note 8 in “Notes to financial statements.”
Summary of abbreviations:
BNYM – The Bank of New York Mellon
BRL – Brazilian Real
EUR – European Monetary Unit
GBP – British Pound Sterling
HKD – Hong Kong Dollar
JPY – Japanese Yen
MYR – Malaysian Ringgit
REIT – Real Estate Investment Trust
USD – US Dollar
See accompanying notes, which are an integral part of the financial statements.
55
Schedules of investments
| | |
| Delaware International Value Equity Fund | | November 30, 2018 |
| | | | | | | | |
| | | Number of shares | | | Value (US $) | |
Common Stock – 99.01%D | |
Australia – 0.45% | | | | | | | | |
Coca-Cola Amatil | | | 209,014 | | | $ | 1,320,132 | |
| | | | | | | | |
| | | | | | | 1,320,132 | |
| | | | | | | | |
Canada – 4.89% | | | | | | | | |
Alamos Gold Class A | | | 262,295 | | | | 842,961 | |
CGI Group Class A † | | | 120,673 | | | | 7,720,020 | |
Suncor Energy | | | 162,000 | | | | 5,223,407 | |
Yamana Gold | | | 348,172 | | | | 725,877 | |
| | | | | | | | |
| | | | | | | 14,512,265 | |
| | | | | | | | |
China/Hong Kong – 8.67% | | | | | | | | |
CNOOC | | | 3,623,000 | | | | 6,120,523 | |
Sinopharm Group Class H | | | 549,452 | | | | 2,710,916 | |
Techtronic Industries | | | 1,367,000 | | | | 7,413,568 | |
Yue Yuen Industrial Holdings | | | 3,245,500 | | | | 9,457,628 | |
| | | | | | | | |
| | | | | | | 25,702,635 | |
| | | | | | | | |
Denmark – 2.35% | | | | | | | | |
Carlsberg Class B | | | 62,881 | | | | 6,973,186 | |
| | | | | | | | |
| | | | | | | 6,973,186 | |
| | | | | | | | |
Finland – 2.54% | | | | | | | | |
Nordea Bank | | | 846,879 | | | | 7,521,286 | |
| | | | | | | | |
| | | | | | | 7,521,286 | |
| | | | | | | | |
France – 17.98% | | | | | | | | |
AXA | | | 317,465 | | | | 7,730,973 | |
Cie Generale des Etablissements Michelin | | | 66,355 | | | | 6,953,408 | |
Kering | | | 14,595 | | | | 6,352,947 | |
Publicis Groupe | | | 38,885 | | | | 2,309,717 | |
Rexel | | | 106,785 | | | | 1,282,721 | |
Sanofi | | | 58,116 | | | | 5,268,815 | |
Teleperformance | | | 33,396 | | | | 5,535,926 | |
TOTAL | | | 122,754 | | | | 6,827,547 | |
Valeo | | | 86,764 | | | | 2,476,017 | |
Vinci | | | 98,602 | | | | 8,603,992 | |
| | | | | | | | |
| | | | | | | 53,342,063 | |
| | | | | | | | |
Germany – 4.37% | | | | | | | | |
Bayerische Motoren Werke | | | 68,640 | | | | 5,636,257 | |
Deutsche Post | | | 229,263 | | | | 7,327,927 | |
| | | | | | | | |
| | | | | | | 12,964,184 | |
| | | | | | | | |
Indonesia – 2.78% | | | | | | | | |
Bank Rakyat Indonesia Persero | | | 32,542,800 | | | | 8,258,710 | |
| | | | | | | | |
| | | | | | | 8,258,710 | |
| | | | | | | | |
56
| | | | | | | | |
| | | Number of shares | | | Value (US $) | |
| |
Common StockD (continued) | | | | | | | | |
| |
Italy – 2.98% | | | | | | | | |
Leonardo | | | 387,621 | | | $ | 3,833,559 | |
UniCredit | | | 388,738 | | | | 5,017,683 | |
| | | | | | | | |
| | | | | | | 8,851,242 | |
| | | | | | | | |
Japan – 21.32% | | | | | | | | |
East Japan Railway | | | 71,744 | | | | 6,526,933 | |
Hitachi | | | 98,100 | | | | 2,856,818 | |
ITOCHU | | | 631,560 | | | | 11,241,602 | |
Matsumotokiyoshi Holdings | | | 153,400 | | | | 5,716,533 | |
MINEBEA MITSUMI | | | 645,000 | | | | 10,527,857 | |
Mitsubishi UFJ Financial Group | | | 1,478,257 | | | | 8,088,149 | |
Nippon Telegraph & Telephone | | | 181,556 | | | | 7,489,375 | |
Nitori Holdings | | | 5,694 | | | | 763,533 | |
Toyota Motor | | | 165,800 | | | | 10,022,841 | |
| | | | | | | | |
| | | | | | | 63,233,641 | |
| | | | | | | | |
Netherlands – 4.91% | | | | | | | | |
ING Groep CVA | | | 477,737 | | | | 5,786,212 | |
Koninklijke Philips | | | 231,484 | | | | 8,777,846 | |
| | | | | | | | |
| | | | | | | 14,564,058 | |
| | | | | | | | |
Panama – 0.51% | | | | | | | | |
Copa Holdings Class A | | | 17,700 | | | | 1,505,031 | |
| | | | | | | | |
| | | | | | | 1,505,031 | |
| | | | | | | | |
Republic of Korea – 2.17% | | | | | | | | |
Samsung Electronics | | | 171,742 | | | | 6,435,373 | |
| | | | | | | | |
| | | | | | | 6,435,373 | |
| | | | | | | | |
Russia – 0.86% | | | | | | | | |
Mobile TeleSystems PJSC ADR | | | 342,600 | | | | 2,538,666 | |
| | | | | | | | |
| | | | | | | 2,538,666 | |
| | | | | | | | |
Singapore – 1.02% | | | | | | | | |
United Overseas Bank | | | 164,300 | | | | 3,016,784 | |
| | | | | | | | |
| | | | | | | 3,016,784 | |
| | | | | | | | |
Spain – 1.84% | | | | | | | | |
Banco Santander | | | 1,150,441 | | | | 5,465,088 | |
| | | | | | | | |
| | | | | | | 5,465,088 | |
| | | | | | | | |
Sweden – 1.22% | | | | | | | | |
Tele2 Class B | | | 288,649 | | | | 3,615,207 | |
| | | | | | | | |
| | | | | | | 3,615,207 | |
| | | | | | | | |
Switzerland – 3.51% | | | | | | | | |
Novartis | | | 114,165 | | | | 10,423,427 | |
| | | | | | | | |
| | | | | | | 10,423,427 | |
| | | | | | | | |
57
Schedules of investments
Delaware International Value Equity Fund
| | | | | | | | |
| | | Number of shares | | | Value (US $) | |
| |
Common StockD (continued) | | | | | | | | |
| |
United Kingdom – 14.64% | | | | | | | | |
Imperial Brands | | | 317,773 | | | $ | 9,795,075 | |
Meggitt | | | 850,945 | | | | 5,641,480 | |
National Grid | | | 335,953 | | | | 3,586,298 | |
Playtech | | | 1,189,801 | | | | 6,737,566 | |
Rio Tinto | | | 131,163 | | | | 5,994,430 | |
Shire | | | 98,439 | | | | 5,749,021 | |
Standard Chartered | | | 757,447 | | | | 5,908,811 | |
| | | | | | | | |
| | | | | | | 43,412,681 | |
| | | | | | | | |
| | |
Total Common Stock(cost $297,525,883) | | | | | | | 293,655,659 | |
| | |
Total Value of Securities Before Securities Lending Collateral – 99.01%
(cost $297,525,883) | | | | | | | 293,655,659 | |
| | |
| | | Principal amount° | | | | |
| |
Security Lending Collateral – 0.00%** | | | | | | | | |
| |
Repurchase Agreements – 0.00% | | | | | | | | |
Bank of Montreal
2.27%, dated 11/30/18, to be repurchased on 12/3/18, repurchase price $253 (collateralized by US government obligations 0.00%–3.50% 12/6/18–9/9/49; market value $258) | | | 253 | | | | 253 | |
Bank of Nova Scotia
2.27%, dated 11/30/18, to be repurchased on 12/3/18, repurchase price $253 (collateralized by US government obligations 0.125%–1.858% 4/15/19–10/31/23; market value $258) | | | 253 | | | | 253 | |
Credit Agricole
2.27%, dated 11/30/18, to be repurchased on 12/3/18, repurchase price $253 (collateralized by US government obligations 1.875% 2/28/22; market value $258) | | | 253 | | | | 253 | |
JP Morgan Securities
2.27%, dated 11/30/18, to be repurchased on 12/3/18, repurchase price $72 (collateralized by US government obligations 0.00%–0.625% 4/15/23–9/9/49; market value $73) | | | 72 | | | | 72 | |
Merrill Lynch, Pierce, Fenner & Smith
2.25%, dated 11/30/18, to be repurchased on 12/3/18, repurchase price $253 (collateralized by US government obligations 1.375% 6/30/23; market value $258) | | | 253 | | | | 253 | |
| | | | | | | | |
| | |
Total Securities Lending Collateral(cost $1,084) | | | | | | | 1,084 | |
| | |
Total Value of Securities – 99.01%
(cost $297,526,967) | | | | | | $ | 293,656,743 | |
| | | | | | | | |
58
| ** | See Note 10 in “Notes to financial statements” for additional information on securities lending collateral. |
| ° | Principal amount shown is stated in USD unless noted that the security is denominated in another currency. |
| D | Securities have been classified by country of origin. Aggregate classification by business sector has been presented on page 40 in “Security type / country and sector allocations.” |
| † | Non-income producing security. |
The following foreign currency exchange contracts were outstanding at Nov. 30, 2018:1
Foreign Currency Exchange Contracts
| | | | | | | | | | | | | | | | |
Counterparty | | Contracts to
Receive (Deliver) | | | In Exchange For | | | Settlement
Date | | Unrealized
Depreciation | |
BNYM | | CAD | | | (151,943 | ) | | USD | 114,195 | | | 12/4/18 | | $ | (172 | ) |
BNYM | | CHF | | | (125,912 | ) | | USD | 125,874 | | | 12/4/18 | | | (201 | ) |
BNYM | | DKK | | | (555,564 | ) | | USD | 84,179 | | | 12/4/18 | | | (121 | ) |
BNYM | | EUR | | | (988,569 | ) | | USD | 1,117,889 | | | 12/4/18 | | | (1,608 | ) |
BNYM | | GBP | | | (377,310 | ) | | USD | 480,641 | | | 12/4/18 | | | (228 | ) |
BNYM | | JPY | | | (30,274,620 | ) | | USD | 266,514 | | | 12/3/18 | | | (240 | ) |
BNYM | | SEK | | | (396,069 | ) | | USD | 43,456 | | | 12/4/18 | | | (64 | ) |
| | | | | | | | | | | | | | | | |
Total Foreign Currency Exchange Contracts | | | | | | | | | | | | $ | (2,634 | ) |
| | | | | | | | | | | | | | | | |
The use of foreign currency exchange contracts involves elements of market risk and risks in excess of the amounts disclosed in the financial statements. The foreign currency exchange contracts presented above represent the Fund’s total exposure in such contracts, whereas only the net unrealized appreciation (depreciation) is reflected in the Fund’s net assets.
1See Note 8 in “Notes to financial statements.”
Summary of abbreviations:
ADR – American Depositary Receipt
BNYM – The Bank of New York Mellon
CAD – Canadian Dollar
CHF – Swiss Franc
CVA – Dutch Certificate
DKK – Danish Krone
EUR – European Monetary Unit
GBP – British Pound Sterling
JPY – Japanese Yen
PJSC – Public Joint Stock Company
SEK – Swedish Krona
USD – US Dollar
See accompanying notes, which are an integral part of the financial statements.
59
Statements of assets and liabilities
November 30, 2018
| | | | | | | | |
| | | Delaware Emerging Markets Fund | | | Delaware Global Value Fund | |
Assets: | | | | | | | | |
Investments, at value1,2 | | $ | 5,133,628,217 | | | $ | 14,288,075 | |
Foreign currencies, at value3 | | | 21,695,637 | | | | 29,698 | |
Receivable for fund shares sold | | | 22,208,555 | | | | 63 | |
Dividends and interest receivable | | | 2,581,401 | | | | 46,119 | |
Receivable for securities sold | | | 784,893 | | | | 217,182 | |
Foreign tax reclaims receivable | | | 463,044 | | | | 23,711 | |
Securities lending income receivable | | | — | | | | 25 | |
Investment management fees receivable | | | — | | | | 2,743 | |
| | | | | | | | |
Total assets | | | 5,181,361,747 | | | | 14,607,616 | |
| | | | | | | | |
Liabilities: | | | | | | | | |
Cash due to custodian | | | 27,992,415 | | | | 80,300 | |
Payable for fund shares redeemed | | | 9,808,553 | | | | 92,840 | |
Investment management fees payable to affiliates | | | 4,754,268 | | | | — | |
Other accrued expenses | | | 2,072,207 | | | | 6,983 | |
Custody fees payable | | | — | | | | 4,842 | |
Distribution fees payable to affiliates | | | 215,731 | | | | 3,583 | |
Dividend disbursing and transfer agent fees and expenses payable | | | — | | | | 4,345 | |
Dividend disbursing and transfer agent fees and expenses payable to affiliates | | | 41,639 | | | | 120 | |
Trustees’ fees and expenses payable | | | 40,036 | | | | 118 | |
Accounting and administration expenses payable | | | — | | | | 8,695 | |
Accounting and administration expenses payable to affiliates | | | 16,200 | | | | 374 | |
Legal fees payable to affiliates | | | 8,176 | | | | 26 | |
Reports and statements to shareholders payable to affiliates | | | 4,419 | | | | 12 | |
Audit and tax fees payable | | | — | | | | 6,971 | |
Unrealized depreciation on foreign currency exchange contracts | | | 689 | | | | 65 | |
Deferred capital gains tax payable | | | 645,260 | | | | — | |
| | | | | | | | |
Total liabilities | �� | | 45,599,593 | | | | 209,274 | |
| | | | | | | | |
Total Net Assets | | $ | 5,135,762,154 | | | $ | 14,398,342 | |
| | | | | | | | |
| | |
Net Assets Consist of: | | | | | | | | |
Paid-in capital | | $ | 5,237,765,447 | | | $ | 11,861,638 | |
Total distributable earnings (loss)4 | | | (102,003,293 | ) | | | 2,536,704 | |
| | | | | | | | |
Total Net Assets | | $ | 5,135,762,154 | | | $ | 14,398,342 | |
| | | | | | | | |
60
| | | | | | | | |
| | | Delaware Emerging Markets Fund | | | Delaware Global Value Fund | |
Net Asset Value | | | | | | | | |
Class A: | | | | | | | | |
Net assets | | $ | 353,094,008 | | | $ | 11,452,188 | |
Shares of beneficial interest outstanding, unlimited authorization, no par | | | 20,145,517 | | | | 957,946 | |
Net asset value per share | | $ | 17.53 | | | $ | 11.95 | |
Sales charge | | | 5.75 | % | | | 5.75 | % |
Offering price per share, equal to net asset value per share / (1 – sales charge) | | $ | 18.60 | | | $ | 12.68 | |
| | |
Class C: | | | | | | | | |
Net assets | | $ | 152,856,444 | | | $ | 1,436,975 | |
Shares of beneficial interest outstanding, unlimited authorization, no par | | | 9,401,151 | | | | 123,238 | |
Net asset value per share | | $ | 16.26 | | | $ | 11.66 | |
| | |
Class R: | | | | | | | | |
Net assets | | $ | 48,875,331 | | | $ | — | |
Shares of beneficial interest outstanding, unlimited authorization, no par | | | 2,773,209 | | | | — | |
Net asset value per share | | $ | 17.62 | | | $ | — | |
| | |
Institutional Class: | | | | | | | | |
Net assets | | $ | 4,189,528,281 | | | $ | 1,509,179 | |
Shares of beneficial interest outstanding, unlimited authorization, no par | | | 237,037,868 | | | | 125,647 | |
Net asset value per share | | $ | 17.67 | | | $ | 12.01 | |
| | |
Class R6: | | | | | | | | |
Net assets | | $ | 391,408,090 | | | $ | — | |
Shares of beneficial interest outstanding, unlimited authorization, no par | | | 22,132,190 | | | | — | |
Net asset value per share | | $ | 17.69 | | | $ | — | |
| | |
| | | | | | | | |
1Investments, at cost | | $ | 5,171,915,461 | | | $ | 12,340,070 | |
2Including securities on loan | | | — | | | | 251,692 | |
3Foreign currencies, at cost | | | 21,568,561 | | | | 29,666 | |
4Includes deferred capital gains tax payable | | | 645,260 | | | | — | |
See accompanying notes, which are an integral part of the financial statements.
61
Statements of assets and liabilities
| | | | | | | | |
| | | Delaware
International
Small Cap
Fund | | | Delaware
International
Value Equity
Fund | |
Assets: | | | | | | | | |
Investments, at value1 | | $ | 74,540,280 | | | $ | 293,655,659 | |
Short-term investments held as collateral for loaned securities, at value2 | | | — | | | | 1,084 | |
Foreign currencies, at value3 | | | 1,249,693 | | | | 683,157 | |
Receivable for securities sold | | | 2,837,041 | | | | 2,063,986 | |
Receivable for fund shares sold | | | 320,611 | | | | 249,966 | |
Dividends and interest receivable | | | 72,210 | | | | 947,503 | |
Foreign tax reclaims receivable | | | 66,188 | | | | 1,045,070 | |
Securities lending income receivable | | | — | | | | 242 | |
Unrealized appreciation on foreign currency exchange contracts | | | 1,345 | | | | — | |
| | | | | | | | |
Total assets | | | 79,087,368 | | | | 298,646,667 | |
| | | | | | | | |
Liabilities: | | | | | | | | |
Cash due to custodian | | | 480,681 | | | | 633,074 | |
Payable for securities purchased | | | 380,748 | | | | — | |
Payable for fund shares redeemed | | | 343,280 | | | | 1,043,416 | |
Custody fees payable | | | 29,537 | | | | — | |
Investment management fees payable to affiliates | | | 22,817 | | | | 211,051 | |
Other accrued expenses | | | 22,815 | | | | 71,293 | |
Reports and statements to shareholders payable | | | 19,256 | | | | — | |
Dividend disbursing and transfer agent fees and expenses payable | | | 18,968 | | | | 60,185 | |
Accounting and Administration expenses payable | | | 10,463 | | | | — | |
Distribution fees payable to affiliates | | | 6,198 | | | | 21,938 | |
Dividend disbursing and transfer agent fees and expenses payable to affiliates | | | 731 | | | | 2,478 | |
Trustees’ fees and expenses payable | | | 723 | | | | 2,377 | |
Accounting and administration expenses payable to affiliates | | | 607 | | | | 1,273 | |
Legal fees payable to affiliates | | | 147 | | | | 486 | |
Reports and statements to shareholders payable to affiliates | | | 67 | | | | 255 | |
Unrealized depreciation on foreign currency exchange contracts | | | 9,138 | | | | 2,634 | |
Other liabilities | | | 1,976 | | | | 1,085 | |
| | | | | | | | |
Total liabilities | | | 1,348,152 | | | | 2,051,545 | |
| | | | | | | | |
Total Net Assets | | $ | 77,739,216 | | | $ | 296,595,122 | |
| | | | | | | | |
62
| | | | | | | | |
| | | Delaware
International
Small Cap Fund | | | Delaware
International
Value Equity
Fund | |
Net Assets Consist of: | | | | | | | | |
Paid-in capital | | $ | 89,713,090 | | | $ | 305,797,730 | |
Total distributable earnings (loss) | | | (11,973,874 | ) | | | (9,202,608 | ) |
| | | | | | | | |
Total Net Assets | | $ | 77,739,216 | | | $ | 296,595,122 | |
| | | | | | | | |
| | |
Net Asset Value | | | | | | | | |
Class A: | | | | | | | | |
Net assets | | $ | 10,154,626 | | | $ | 63,604,095 | |
Shares of beneficial interest outstanding, unlimited authorization, no par | | | 1,525,600 | | | | 4,702,370 | |
Net asset value per share | | $ | 6.66 | | | $ | 13.53 | |
Sales charge | | | 5.75 | % | | | 5.75 | % |
Offering price per share, equal to net asset value per share / (1 – sales charge) | | $ | 7.07 | | | $ | 14.36 | |
| | |
Class C: | | | | | | | | |
Net assets | | $ | 4,698,175 | | | $ | 8,733,956 | |
Shares of beneficial interest outstanding, unlimited authorization, no par | | | 837,987 | | | | 659,106 | |
Net asset value per share | | $ | 5.61 | | | $ | 13.25 | |
| | |
Class R: | | | | | | | | |
Net assets | | $ | 86,635 | | | $ | 3,508,572 | |
Shares of beneficial interest outstanding, unlimited authorization, no par | | | 13,730 | | | | 260,611 | |
Net asset value per share | | $ | 6.31 | | | $ | 13.46 | |
| | |
Institutional Class: | | | | | | | | |
Net assets | | $ | 60,124,142 | | | $ | 220,746,731 | |
Shares of beneficial interest outstanding, unlimited authorization, no par | | | 8,617,776 | | | | 16,233,823 | |
Net asset value per share | | $ | 6.98 | | | $ | 13.60 | |
63
Statements of assets and liabilities
| | | | | | | | |
| | | Delaware
International
Small Cap
Fund | | | Delaware
International
Value Equity
Fund | |
Class R6: | | | | | | | | |
Net assets | | $ | 2,675,638 | | | $ | 1,768 | |
Shares of beneficial interest outstanding, unlimited authorization, no par | | | 382,813 | | | | 130 | |
Net asset value per share | | $ | 6.99 | | | $ | 13.60 | |
| | |
| | | | | | | | |
1Investments, at cost | | $ | 76,228,909 | | | $ | 297,525,883 | |
2Short-term investments held as collateral for loaned securities, at cost | | | — | | | | 1,084 | |
3Foreign currencies, at cost | | | 1,248,040 | | | | 695,356 | |
See accompanying notes, which are an integral part of the financial statements.
64
This page intentionally left blank.
| | |
Statements of operations | | |
| Delaware International Funds | | Year ended November 30, 2018 |
| | | | | | | | |
| | | Delaware
Emerging
Markets Fund | | | Delaware
Global
Value Fund | |
| | |
Investment Income: | | | | | | | | |
Dividends | | $ | 118,759,385 | | | $ | 512,419 | |
Interest | | | 209,612 | | | | 1,855 | |
Securities lending income | | | — | | | | 1,413 | |
Foreign tax withheld | | | (14,107,224 | ) | | | (31,818 | ) |
| | | | | | | | |
| | | 104,861,773 | | | | 483,869 | |
| | | | | | | | |
Expenses: | | | | | | | | |
Management fees | | | 60,269,217 | | | | 148,213 | |
Distribution expenses – Class A | | | 1,071,939 | | | | 31,190 | |
Distribution expenses – Class C | | | 1,906,678 | | | | 29,911 | |
Distribution expenses – Class R | | | 295,091 | | | | — | |
Dividend disbursing and transfer agent fees and expenses | | | 7,314,179 | | | | 26,210 | |
Custodian fees | | | 2,266,226 | | | | 11,902 | |
Accounting and administration expenses | | | 973,852 | | | | 36,268 | |
Registration fees | | | 658,793 | | | | 53,282 | |
Reports and statements to shareholders | | | 566,525 | | | | 10,594 | |
Legal fees | | | 281,948 | | | | 6,132 | |
Trustees’ fees and expenses | | | 252,971 | | | | 839 | |
Audit and tax | | | 138,181 | | | | 39,526 | |
Other | | | 126,078 | | | | 15,521 | |
| | | | | | | | |
| | | 76,121,678 | | | | 409,588 | |
Less expenses waived | | | — | | | | (121,418 | ) |
Less expenses paid indirectly | | | (2,329 | ) | | | (132 | ) |
| | | | | | | | |
Total operating expenses | | | 76,119,349 | | | | 288,038 | |
| | | | | | | | |
Net Investment Income | | | 28,742,424 | | | | 195,831 | |
| | | | | | | | |
66
| | | | | | | | |
| | | Delaware
Emerging
Markets Fund | | | Delaware
Global Value Fund | |
| | |
Net Realized and Unrealized Gain (Loss): | | | | | | | | |
Net realized gain (loss) on: | | | | | | | | |
Investments | | $ | 44,654,162 | | | $ | 842,309 | |
Foreign currencies | | | (873,364 | ) | | | 1,284 | |
Foreign currency exchange contracts | | | (1,402,686 | ) | | | (4,102 | ) |
| | | | | | | | |
Net realized gain | | | 42,378,112 | | | | 839,491 | |
| | | | | | | | |
Net change in unrealized appreciation (depreciation) of: | | | | | | | | |
Investments1 | | | (748,650,642 | ) | | | (2,425,808 | ) |
Foreign currencies | | | 90,320 | | | | (1,753 | ) |
Foreign currency exchange contracts | | | 611 | | | | (65 | ) |
| | | | | | | | |
Net change in unrealized appreciation (depreciation) | | | (748,559,711 | ) | | | (2,427,626 | ) |
| | | | | | | | |
Net Realized and Unrealized Loss | | | (706,181,599 | ) | | | (1,588,135 | ) |
| | | | | | | | |
Net Decrease in Net Assets Resulting from Operations | | $ | (677,439,175 | ) | | $ | (1,392,304 | ) |
| | | | | | | | |
1Includes $9,338,199 decrease in capital gains tax accrued for Delaware Emerging Markets Fund.
See accompanying notes, which are an integral part of the financial statements.
67
Statements of operations
Delaware International Funds
| | | | | | | | |
| | | Delaware
International
Small Cap
Fund | | | Delaware
International
Value Equity
Fund | |
| | |
Investment Income: | | | | | | | | |
Dividends | | $ | 1,073,447 | | | $ | 11,900,841 | |
Interest | | | 42,200 | | | | 91,076 | |
Securities lending income | | | — | | | | 36,247 | |
Foreign tax withheld | | | (82,063 | ) | | | (1,338,388 | ) |
| | | | | | | | |
| | | 1,033,584 | | | | 10,689,776 | |
| | | | | | | | |
Expenses: | | | | | | | | |
Management fees | | | 593,971 | | | | 2,792,546 | |
Distribution expenses – Class A | | | 32,412 | | | | 172,627 | |
Distribution expenses – Class C | | | 59,666 | | | | 161,752 | |
Distribution expenses – Class R | | | 492 | | | | 19,747 | |
Registration fees | | | 86,622 | | | | 98,023 | |
Dividend disbursing and transfer agent fees and expenses | | | 86,051 | | | | 357,659 | |
Custodian fees | | | 75,864 | | | | 79,962 | |
Audit and tax | | | 52,909 | | | | 39,049 | |
Accounting and administration expenses | | | 45,559 | | | | 91,568 | |
Reports and statements to shareholders | | | 43,628 | | | | 38,376 | |
Legal fees | | | 5,729 | | | | 19,669 | |
Trustees’ fees and expenses | | | 3,336 | | | | 15,719 | |
Other | | | 31,998 | | | | 27,636 | |
| | | | | | | | |
| | | 1,118,237 | | | | 3,914,333 | |
Less expenses waived | | | (259,945 | ) | | | — | |
Less expenses paid indirectly | | | (133 | ) | | | (1,310 | ) |
| | | | | | | | |
Total operating expenses | | | 858,159 | | | | 3,913,023 | |
| | | | | | | | |
Net Investment Income | | | 175,425 | | | | 6,776,753 | |
| | | | | | | | |
68
| | | | | | | | |
| | | Delaware
International
Small Cap Fund | | | Delaware
International
Value Equity
Fund | |
| | |
Net Realized and Unrealized Gain (Loss): | | | | | | | | |
Net realized gain (loss) on: | | | | | | | | |
Investments1 | | $ | (9,946,619 | ) | | $ | 7,569,042 | |
Foreign currencies | | | 47,937 | | | | (2,004 | ) |
Foreign currency exchange contracts | | | (271,659 | ) | | | (132,929 | ) |
| | | | | | | | |
Net realized gain (loss) | | | (10,170,341 | ) | | | 7,434,109 | |
| | | | | | | | |
Net change in unrealized appreciation (depreciation) of: | | | | | | | | |
Investments2 | | | (7,284,433 | ) | | | (56,921,885 | ) |
Foreign currencies | | | 3,968 | | | | (68,473 | ) |
Foreign currency exchange contracts | | | (9,070 | ) | | | (2,634 | ) |
| | | | | | | | |
Net change in unrealized appreciation (depreciation) | | | (7,289,535 | ) | | | (56,992,992 | ) |
| | | | | | | | |
Net Realized and Unrealized Loss | | | (17,459,876 | ) | | | (49,558,883 | ) |
| | | | | | | | |
Net Decrease in Net Assets Resulting from Operations | | $ | (17,284,451 | ) | | $ | (42,782,130 | ) |
| | | | | | | | |
1Includes $2,159 capital gains taxes paid for Delaware International Small Cap Fund.
2Includes $21,467 decrease in capital gains taxes accrued for Delaware International Small Cap Fund.
See accompanying notes, which are an integral part of the financial statements.
69
Statements of changes in net assets
Delaware Emerging Markets Fund
| | | | | | | | |
| | | Year ended | |
| | | 11/30/18 | | | 11/30/17 | |
| | |
Increase (Decrease) in Net Assets from Operations: | | | | | | | | |
Net investment income | | $ | 28,742,424 | | | $ | 43,129,941 | |
Net realized gain | | | 42,378,112 | | | | 17,676,197 | |
Net change in unrealized appreciation (depreciation) | | | (748,559,711 | ) | | | 974,085,439 | |
| | | | | | | | |
Net increase (decrease) in net assets resulting from operations | | | (677,439,175 | ) | | | 1,034,891,577 | |
| | | | | | | | |
| | |
Dividends and Distributions to Shareholders from: | | | | | | | | |
Distributable earnings*: | | | | | | | | |
Class A | | | (7,215,373 | ) | | | (3,211,395 | ) |
Class C | | | (2,019,144 | ) | | | (95,955 | ) |
Class R | | | (825,273 | ) | | | (170,901 | ) |
Institutional Class | | | (70,993,273 | ) | | | (13,058,434 | ) |
Class R6 | | | (3,193,234 | ) | | | (13,492 | ) |
| | | | | | | | |
| | | (84,246,297 | ) | | | (16,550,177 | ) |
| | | | | | | | |
| | |
Capital Share Transactions: | | | | | | | | |
Proceeds from shares sold: | | | | | | | | |
Class A | | | 158,835,777 | | | | 236,362,922 | |
Class C | | | 60,032,212 | | | | 64,662,798 | |
Class R | | | 19,070,928 | | | | 26,236,730 | |
Institutional Class | | | 2,551,509,956 | | | | 2,501,849,920 | |
Class R6 | | | 396,108,348 | | | | 138,637,939 | |
| | |
Net asset value of shares issued upon reinvestment of dividends and distributions: | | | | | | | | |
Class A | | | 6,886,769 | | | | 3,152,907 | |
Class C | | | 1,977,233 | | | | 91,725 | |
Class R | | | 824,132 | | | | 170,579 | |
Institutional Class | | | 51,476,055 | | | | 9,447,872 | |
Class R6 | | | 1,783,576 | | | | 13,492 | |
| | | | | | | | |
| | | 3,248,504,986 | | | | 2,980,626,884 | |
| | | | | | | | |
70
| | | | | | | | |
| | | Year ended | |
| | | 11/30/18 | | | 11/30/17 | |
| | |
Capital Share Transactions (continued): | | | | | | | | |
Cost of shares redeemed: | | | | | | | | |
Class A | | $ | (218,030,573 | ) | | $ | (404,967,706 | ) |
Class C | | | (72,479,514 | ) | | | (40,197,551 | ) |
Class R | | | (24,769,737 | ) | | | (16,565,446 | ) |
Institutional Class | | | (1,684,995,838 | ) | | | (754,898,858 | ) |
Class R6 | | | (91,909,725 | ) | | | (5,860,644 | ) |
| | | | | | | | |
| | | (2,092,185,387 | ) | | | (1,222,490,205 | ) |
| | | | | | | | |
Increase in net assets derived from capital share transactions | | | 1,156,319,599 | | | | 1,758,136,679 | |
| | | | | | | | |
Net Increase in Net Assets | | | 394,634,127 | | | | 2,776,478,079 | |
| | |
Net Assets: | | | | | | | | |
Beginning of year | | | 4,741,128,027 | | | | 1,964,649,948 | |
| | | | | | | | |
End of year1 | | $ | 5,135,762,154 | | | $ | 4,741,128,027 | |
| | | | | | | | |
| 1 | Net Assets - End of year includes undistributed net investment income of $13,486,339 in 2017. The Securities and Exchange Commission eliminated the requirement to disclose undistributed (distributions in excess of) net investment income in 2018. |
| * | For the year ended Nov. 30, 2018, the Fund has adopted amendments to RegulationS-X (see Note 13 in “Notes to financial statements”). For the year ended Nov. 30, 2017, the dividends and distributions to shareholders were as follows: |
| | | | | | | | | | |
| | | Class A | | Class C | | Class R | | Institutional
Class | | Class R6 |
| | | | | |
Dividends from net investment income | | $(3,211,395) | | $(95,955) | | $(170,901) | | $(13,058,434) | | $(13,492) |
See accompanying notes, which are an integral part of the financial statements.
71
Statements of changes in net assets
Delaware Global Value Fund
| | | | | | | | |
| | | Year ended | |
| | | 11/30/18 | | | 11/30/17 | |
| | |
Increase (Decrease) in Net Assets from Operations: | | | | | | | | |
Net investment income | | $ | 195,831 | | | $ | 196,438 | |
Net realized gain (loss) | | | 839,491 | | | | (378,535 | ) |
Net change in unrealized appreciation (depreciation) | | | (2,427,626 | ) | | | 3,192,853 | |
| | | | | | | | |
Net increase (decrease) in net assets resulting from operations | | | (1,392,304 | ) | | | 3,010,756 | |
| | | | | | | | |
| | |
Dividends and Distributions to Shareholders from: | | | | | | | | |
Distributable earnings*: | | | | | | | | |
Class A | | | (154,249 | ) | | | (214,985 | ) |
Class C | | | (21,765 | ) | | | (45,327 | ) |
Institutional Class | | | (32,141 | ) | | | (30,941 | ) |
| | | | | | | | |
| | | (208,155 | ) | | | (291,253 | ) |
| | | | | | | | |
| | |
Capital Share Transactions: | | | | | | | | |
Proceeds from shares sold: | | | | | | | | |
Class A | | | 2,429,817 | | | | 1,018,925 | |
Class C | | | 134,560 | | | | 643,132 | |
Institutional Class | | | 459,948 | | | | 930,642 | |
| | |
Net asset value of shares issued upon reinvestment of dividends and distributions: | | | | | | | | |
Class A | | | 150,793 | | | | 206,409 | |
Class C | | | 21,614 | | | | 44,578 | |
Institutional Class | | | 29,145 | | | | 27,498 | |
| | | | | | | | |
| | | 3,225,877 | | | | 2,871,184 | |
| | | | | | | | |
72
| | | | | | | | |
| | | Year ended | |
| | | 11/30/18 | | | 11/30/17 | |
| | |
Capital Share Transactions (continued): | | | | | | | | |
Cost of shares redeemed: | | | | | | | | |
Class A | | $ | (2,893,302 | ) | | $ | (2,523,541 | ) |
Class C | | | (2,720,379 | ) | | | (1,195,075 | ) |
Institutional Class | | | (1,084,835 | ) | | | (590,138 | ) |
| | | | | | | | |
| | | (6,698,516 | ) | | | (4,308,754 | ) |
| | | | | | | | |
Decrease in net assets derived from capital share transactions | | | (3,472,639 | ) | | | (1,437,570 | ) |
| | | | | | | | |
Net Increase (Decrease) in Net Assets | | | (5,073,098 | ) | | | 1,281,933 | |
| | |
Net Assets: | | | | | | | | |
Beginning of year | | | 19,471,440 | | | | 18,189,507 | |
| | | | | | | | |
End of year1 | | $ | 14,398,342 | | | $ | 19,471,440 | |
| | | | | | | | |
| 1 | Net Assets - End of year includes undistributed net investment income of $206,857 in 2017. The Securities and Exchange Commission eliminated the requirement to disclose undistributed (distributions in excess of) net investment income in 2018. |
| * | For the year ended Nov. 30, 2018, the Fund has adopted amendments to RegulationS-X (see Note 13 in “Notes to financial statements”). For the year ended Nov. 30, 2017, the class specific dividends and distributions to shareholders were as follows: |
| | | | | | |
| | | Class A | | Class C | | Institutional Class |
| | | |
Dividends from net investment income | | $(214,985) | | $(45,327) | | $(30,941) |
See accompanying notes, which are an integral part of the financial statements.
73
Statements of changes in net assets
Delaware International Small Cap Fund
| | | | | | | | |
| | | Year ended | |
| | | 11/30/18 | | | 11/30/17 | |
| | |
Increase (Decrease) in Net Assets from Operations: | | | | | | | | |
Net investment income (loss) | | $ | 175,425 | | | $ | (69,346 | ) |
Net realized gain (loss) | | | (10,170,341 | ) | | | 1,083,695 | |
Net change in unrealized appreciation (depreciation) | | | (7,289,535 | ) | | | 5,273,670 | |
| | | | | | | | |
Net increase (decrease) in net assets resulting from operations | | | (17,284,451 | ) | | | 6,288,019 | |
| | | | | | | | |
| | |
Dividends and Distributions to Shareholders from: | | | | | | | | |
Distributable earnings*: | | | | | | | | |
Class A | | | (490,469 | ) | | | (10,020,739 | ) |
Class C | | | (244,690 | ) | | | (3,015,855 | ) |
Class R | | | (3,896 | ) | | | (36,619 | ) |
Institutional Class | | | (556,829 | ) | | | (2,864,606 | ) |
Class R6 | | | (91 | ) | | | — | |
| | | | | | | | |
| | | (1,295,975 | ) | | | (15,937,819 | ) |
| | | | | | | | |
| | |
Capital Share Transactions: | | | | | | | | |
Proceeds from shares sold: | | | | | | | | |
Class A | | | 6,491,912 | | | | 4,204,914 | |
Class C | | | 2,511,719 | | | | 1,089,447 | |
Class R | | | 22,376 | | | | 19,218 | |
Institutional Class | | | 115,392,556 | | | | 14,783,555 | |
Class R6 | | | 3,174,669 | | | | 2,000 | |
| | |
Net asset value of shares issued upon reinvestment of dividends and distributions: | | | | | | | | |
Class A | | | 449,810 | | | | 9,638,668 | |
Class C | | | 244,369 | | | | 3,015,827 | |
Class R | | | 3,894 | | | | 36,592 | |
Institutional Class | | | 553,926 | | | | 2,860,069 | |
Class R6 | | | 91 | | | | — | |
| | | | | | | | |
| | | 128,845,322 | | | | 35,650,290 | |
| | | | | | | | |
74
| | | | | | | | |
| | | Year ended | |
| | | 11/30/18 | | | 11/30/17 | |
| | |
Capital Share Transactions (continued): | | | | | | | | |
Cost of shares redeemed: | | | | | | | | |
Class A | | $ | (6,893,181 | ) | | $ | (9,964,853 | ) |
Class C | | | (2,134,434 | ) | | | (1,697,946 | ) |
Class R | | | (14,613 | ) | | | (1,562 | ) |
Institutional Class | | | (55,116,731 | ) | | | (20,225,250 | ) |
Class R6 | | | (61,988 | ) | | | — | |
| | | | | | | | |
| | | (64,220,947 | ) | | | (31,889,611 | ) |
| | | | | | | | |
Increase in net assets derived from capital share transactions | | | 64,624,375 | | | | 3,760,679 | |
| | | | | | | | |
Net Increase (Decrease) in Net Assets | | | 46,043,949 | | | | (5,889,121 | ) |
| | |
Net Assets: | | | | | | | | |
Beginning of year | | | 31,695,267 | | | | 37,584,388 | |
| | | | | | | | |
End of year1 | | $ | 77,739,216 | | | $ | 31,695,267 | |
| | | | | | | | |
| 1 | Net Assets - End of year includes distributions in excess of net investment income of $ 176,169 in 2017. The Securities and Exchange Commission eliminated the requirement to disclose undistributed (distributions in excess of) net investment income in 2018. |
| * | For the year ended Nov. 30, 2018, the Fund has adopted amendments to RegulationS-X (see Note 13 in “Notes to financial statements”). For the year ended Nov. 30, 2017, the dividends and distributions to shareholders were as follows: |
| | | | | | | | |
| | | Class A | | Class C | | Class R | | Institutional Class |
| | | | |
Distributions from net realized gains | | $(10,020,739) | | $(3,015,855) | | $(36,619) | | $(2,864,606) |
See accompanying notes, which are an integral part of the financial statements.
75
Statements of changes in net assets
Delaware International Value Equity Fund
| | | | | | | | |
| | | Year ended | |
| | | 11/30/18 | | | 11/30/17 | |
| | |
Increase (Decrease) in Net Assets from Operations: | | | | | | | | |
Net investment income | | $ | 6,776,753 | | | $ | 5,056,381 | |
Net realized gain (loss) | | | 7,434,109 | | | | (4,283,928 | ) |
Net change in unrealized appreciation (depreciation) | | | (56,992,992 | ) | | | 58,518,121 | |
| | | | | | | | |
Net increase (decrease) in net assets resulting from operations | | | (42,782,130 | ) | | | 59,290,574 | |
| | | | | | | | |
| | |
Dividends and Distributions to Shareholders from: | | | | | | | | |
Distributable earnings*: | | | | | | | | |
Class A | | | (1,011,407 | ) | | | (1,135,918 | ) |
Class C | | | (173,964 | ) | | | (294,982 | ) |
Class R | | | (43,727 | ) | | | (32,069 | ) |
Institutional Class | | | (3,888,352 | ) | | | (3,801,623 | ) |
| | | | | | | | |
| | | (5,117,450 | ) | | | (5,264,592 | ) |
| | | | | | | | |
| | |
Capital Share Transactions: | | | | | | | | |
Proceeds from shares sold: | | | | | | | | |
Class A | | | 18,799,750 | | | | 16,868,024 | |
Class C | | | 2,110,748 | | | | 4,847,373 | |
Class R | | | 2,755,456 | | | | 2,246,244 | |
Institutional Class | | | 78,250,729 | | | | 66,981,526 | |
Class R6 | | | 2,000 | | | | — | |
| | |
Net asset value of shares issued upon reinvestment of dividends and distributions: | | | | | | | | |
Class A | | | 988,979 | | | | 1,096,074 | |
Class C | | | 171,678 | | | | 285,822 | |
Class R | | | 43,727 | | | | 32,069 | |
Institutional Class | | | 3,869,082 | | | | 3,767,360 | |
| | | | | | | | |
| | | 106,992,149 | | | | 96,124,492 | |
| | | | | | | | |
76
| | | | | | | | |
| | | Year ended | |
| | | 11/30/18 | | | 11/30/17 | |
| | |
Capital Share Transactions (continued): | | | | | | | | |
Cost of shares redeemed: | | | | | | | | |
Class A | | $ | (14,584,318 | ) | | $ | (16,493,701 | ) |
Class C | | | (13,153,666 | ) | | | (9,211,639 | ) |
Class R | | | (2,134,461 | ) | | | (872,466 | ) |
Institutional Class | | | (52,625,635 | ) | | | (47,150,045 | ) |
| | | | | | | | |
| | | (82,498,080 | ) | | | (73,727,851 | ) |
| | | | | | | | |
Increase in net assets derived from capital share transactions | | | 24,494,069 | | | | 22,396,641 | |
| | | | | | | | |
Net Increase (Decrease) in Net Assets | | | (23,405,511 | ) | | | 76,422,623 | |
| | |
Net Assets: | | | | | | | | |
Beginning of year | | | 320,000,633 | | | | 243,578,010 | |
| | | | | | | | |
End of year1 | | $ | 296,595,122 | | | $ | 320,000,633 | |
| | | | | | | | |
| 1 | Net Assets - End of year includes undistributed net investment income of $5,097,707 in 2017. The Securities and Exchange Commission eliminated the requirement to disclose undistributed (distributions in excess of) net investment income in 2018. |
| * | For the year ended Nov. 30, 2018, the Fund has adopted amendments to RegulationS-X (see Note 13 in “Notes to financial statements”). For the year ended Nov. 30, 2017, the dividends and distributions to shareholders were as follows: |
| | | | | | | | | | | | | | |
| | | Class A | | Class C | | | Class R | | | Institutional
Class | |
| | | | |
Dividends from net investment income | | $(1,135,918) | | $ | (294,982 | ) | | $ | (32,069 | ) | | $ | (3,801,623 | ) |
See accompanying notes, which are an integral part of the financial statements.
77
Financial highlights
Delaware Emerging Markets Fund Class A
Selected data for each share of the Fund outstanding throughout each period were as follows:
|
|
Net asset value, beginning of period |
|
Income (loss) from investment operations: |
Net investment income (loss)1 |
Net realized and unrealized gain (loss) |
Total from investment operations |
|
Less dividends and distributions from: |
Net investment income |
Return of capital |
Net realized gain |
Total dividends and distributions |
|
Net asset value, end of period |
|
Total return3 |
|
Ratios and supplemental data: |
Net assets, end of period (000 omitted) |
Ratio of expenses to average net assets4 |
Ratio of expenses to average net assets prior to fees waived4 |
Ratio of net investment income (loss) to average net assets |
Ratio of net investment income (loss) to average net assets prior to fees waived |
Portfolio turnover |
|
| 1 | The average shares outstanding method has been applied for per share information. |
| 2 | For the year ended Nov. 30, 2016, net investment income distributions of $84,127 was made by the Fund’s Class A shares, which calculated to a de minimis amount of $(0.004) per share. |
| 3 | Total investment return is based on the change in net asset value of a share during the period and assumes reinvestment of dividends and distributions at net asset value and does not reflect the impact of a sales charge. Total investment return during some of the periods shown reflects waivers by the manager and/or distributor. Performance would have been lower had the waivers not been in effect. |
| 4 | Expense ratios do not include expenses of the Underlying Funds in which the Fund invests. |
See accompanying notes, which are an integral part of the financial statements.
78
| | | | | | | | | | | | | | | | | | | | | | | | | | | | |
| | | Year ended | |
| | | | |
| | | 11/30/18 | | | | | 11/30/17 | | | | | 11/30/16 | | | | | 11/30/15 | | | | | 11/30/14 | |
| |
| | | $ 20.10 | | | | | | $ 14.57 | | | | | | $ 12.80 | | | | | | $ 16.08 | | | | | | $ 16.23 | |
| | | | | | | | | |
| | | | | | | | | | | | | | | | | | | | | | | | | | | | | |
| | | 0.07 | | | | | | 0.19 | | | | | | 0.05 | | | | | | (0.01 | ) | | | | | 0.01 | |
| | | (2.32 | ) | | | | | 5.44 | | | | | | 1.72 | | | | | | (2.85 | ) | | | | | (0.04 | ) |
| | | | | | | | | | | | | | | | | | | | | | | | | | | | |
| | | (2.25 | ) | | | | | 5.63 | | | | | | 1.77 | | | | | | (2.86 | ) | | | | | (0.03 | ) |
| | | | | | | | | | | | | | | | | | | | | | | | | | | | |
| | | | | | | | | |
| | | | | | | | | | | | | | | | | | | | | | | | | | | | | |
| | | (0.32 | ) | | | | | (0.10 | ) | | | | | — | 2 | | | | | (0.07 | ) | | | | | (0.12 | ) |
| | | — | | | | | | — | | | | | | — | | | | | | (0.02 | ) | | | | | — | |
| | | — | | | | | | — | | | | | | — | | | | | | (0.33 | ) | | | | | — | |
| | | | | | | | | | | | | | | | | | | | | | | | | | | | |
| | | (0.32 | ) | | | | | (0.10 | ) | | | | | — | | | | | | (0.42 | ) | | | | | (0.12 | ) |
| | | | | | | | | | | | | | | | | | | | | | | | | | | | |
| | | | | | | | | |
| | | $ 17.53 | | | | | | $ 20.10 | | | | | | $ 14.57 | | | | | | $ 12.80 | | | | | | $ 16.08 | |
| | | | | | | | | | | | | | | | | | | | | | | | | | | | |
| | | | | | | | | |
| | | (11.40% | ) | | | | | 38.94% | | | | | | 13.87% | | | | | | (18.15% | ) | | | | | (0.20% | ) |
| | | | | | | | | |
| | | | | | | | | | | | | | | | | | | | | | | | | | | | | |
| | | $353,094 | | | | | | $463,441 | | | | | | $461,124 | | | | | | $274,075 | | | | | | $423,620 | |
| | | 1.63% | | | | | | 1.66% | | | | | | 1.74% | | | | | | 1.75% | | | | | | 1.69% | |
| | | 1.63% | | | | | | 1.66% | | | | | | 1.78% | | | | | | 1.75% | | | | | | 1.69% | |
| | | 0.35% | | | | | | 1.10% | | | | | | 0.35% | | | | | | (0.08% | ) | | | | | 0.01% | |
| | | 0.35% | | | | | | 1.10% | | | | | | 0.31% | | | | | | (0.08% | ) | | | | | 0.01% | |
| | | 11% | | | | | | 11% | | | | | | 25% | | | | | | 12% | | | | | | 26% | |
| |
79
Financial highlights
Delaware Emerging Markets Fund Class C
Selected data for each share of the Fund outstanding throughout each period were as follows:
|
|
Net asset value, beginning of period |
|
Income (loss) from investment operations: |
Net investment income (loss)1 |
Net realized and unrealized gain (loss) |
Total from investment operations |
|
Less dividends and distributions from: |
Net investment income |
Return of capital |
Net realized gain |
Total dividends and distributions |
|
Net asset value, end of period |
|
Total return2 |
|
Ratios and supplemental data: |
Net assets, end of period (000 omitted) |
Ratio of expenses to average net assets3 |
Ratio of expenses to average net assets prior to fees waived3 |
Ratio of net investment income (loss) to average net assets |
Ratio of net investment income (loss) to average net assets prior to fees waived |
Portfolio turnover |
|
| 1 | The average shares outstanding method has been applied for per share information. |
| 2 | Total investment return is based on the change in net asset value of a share during the period and assumes reinvestment of dividends and distributions at net asset value and does not reflect the impact of a sales charge. Total investment return during some of the periods shown reflects a waiver by the manager. Performance would have been lower had the waiver not been in effect. |
| 3 | Expense ratios do not include expenses of the Underlying Funds in which the Fund invests. |
See accompanying notes, which are an integral part of the financial statements.
80
| | | | | | | | | | | | | | | | | | | | | | | | | | | | |
| | | Year ended | |
| | | | |
| | | 11/30/18 | | | | | 11/30/17 | | | | | 11/30/16 | | | | | 11/30/15 | | | | | 11/30/14 | |
| |
| | | $ 18.68 | | | | | | $ 13.56 | | | | | | $ 12.00 | | | | | | $ 15.14 | | | | | | $ 15.30 | |
| | | | | | | | | |
| | | | | | | | | | | | | | | | | | | | | | | | | | | | | |
| | | (0.07 | ) | | | | | 0.06 | | | | | | (0.05 | ) | | | | | (0.11 | ) | | | | | (0.12 | ) |
| | | (2.16 | ) | | | | | 5.07 | | | | | | 1.61 | | | | | | (2.68 | ) | | | | | (0.03 | ) |
| | | | | | | | | | | | | | | | | | | | | | | | | | | | |
| | | (2.23 | ) | | | | | 5.13 | | | | | | 1.56 | | | | | | (2.79 | ) | | | | | (0.15 | ) |
| | | | | | | | | | | | | | | | | | | | | | | | | | | | |
| | | | | | | | | |
| | | | | | | | | | | | | | | | | | | | | | | | | | | | | |
| | | (0.19 | ) | | | | | (0.01 | ) | | | | | — | | | | | | — | | | | | | (0.01 | ) |
| | | — | | | | | | — | | | | | | — | | | | | | (0.02 | ) | | | | | — | |
| | | — | | | | | | — | | | | | | — | | | | | | (0.33 | ) | | | | | — | |
| | | | | | | | | | | | | | | | | | | | | | | | | | | | |
| | | (0.19 | ) | | | | | (0.01 | ) | | | | | — | | | | | | (0.35 | ) | | | | | (0.01 | ) |
| | | | | | | | | | | | | | | | | | | | | | | | | | | | |
| | | | | | | | | |
| | | $ 16.26 | | | | | | $ 18.68 | | | | | | $ 13.56 | | | | | | $ 12.00 | | | | | | $ 15.14 | |
| | | | | | | | | | | | | | | | | | | | | | | | | | | | |
| | | | | | | | | |
| | | (12.05% | ) | | | | | 37.87% | | | | | | 13.00% | | | | | | (18.74% | ) | | | | | (0.97% | ) |
| | | | | | | | | |
| | | | | | | | | | | | | | | | | | | | | | | | | | | | | |
| | | $152,857 | | | | | | $190,227 | | | | | | $120,306 | | | | | | $131,724 | | | | | | $198,428 | |
| | | 2.38% | | | | | | 2.41% | | | | | | 2.49% | | | | | | 2.50% | | | | | | 2.44% | |
| | | 2.38% | | | | | | 2.41% | | | | | | 2.53% | | | | | | 2.50% | | | | | | 2.44% | |
| | | (0.40% | ) | | | | | 0.35% | | | | | | (0.40% | ) | | | | | (0.83% | ) | | | | | (0.74% | ) |
| | | (0.40% | ) | | | | | 0.35% | | | | | | (0.44% | ) | | | | | (0.83% | ) | | | | | (0.74% | ) |
| | | 11% | | | | | | 11% | | | | | | 25% | | | | | | 12% | | | | | | 26% | |
| |
81
Financial highlights
Delaware Emerging Markets Fund Class R
Selected data for each share of the Fund outstanding throughout each period were as follows:
|
|
Net asset value, beginning of period |
|
Income (loss) from investment operations: |
Net investment income (loss)1 |
Net realized and unrealized gain (loss) |
Total from investment operations |
|
Less dividends and distributions from: |
Net investment income |
Return of capital |
Net realized gain |
Total dividends and distributions |
|
Net asset value, end of period |
|
Total return2 |
|
Ratios and supplemental data: |
Net assets, end of period (000 omitted) |
Ratio of expenses to average net assets3 |
Ratio of expenses to average net assets prior to fees waived3 |
Ratio of net investment income (loss) to average net assets |
Ratio of net investment income (loss) to average net assets prior to fees waived |
Portfolio turnover |
|
| 1 | The average shares outstanding method has been applied for per share information. |
| 2 | Total investment return is based on the change in net asset value of a share during the period and assumes reinvestment of dividends and distributions at net asset value. Total investment return during some of the periods shown reflects waivers by the manager and/or distributor. Performance would have been lower had the waivers not been in effect. |
| 3 | Expense ratios do not include expenses of the Underlying Funds in which the Fund invests. |
See accompanying notes, which are an integral part of the financial statements.
82
| | | | | | | | | | | | | | | | | | | | | | | | | | | | |
| | | Year ended | |
| | | | |
| | | 11/30/18 | | | | | 11/30/17 | | | | | 11/30/16 | | | | | 11/30/15 | | | | | 11/30/14 | |
| |
| | | $ 20.21 | | | | | | $ 14.66 | | | | | | $ 12.90 | | | | | | $ 16.20 | | | | | | $ 16.35 | |
| | | | | | | | | |
| | | | | | | | | | | | | | | | | | | | | | | | | | | | | |
| | | 0.02 | | | | | | 0.15 | | | | | | 0.02 | | | | | | (0.05 | ) | | | | | (0.06 | ) |
| | | (2.34 | ) | | | | | 5.47 | | | | | | 1.74 | | | | | | (2.88 | ) | | | | | (0.01 | ) |
| | | | | | | | | | | | | | | | | | | | | | | | | | | | |
| | | (2.32 | ) | | | | | 5.62 | | | | | | 1.76 | | | | | | (2.93 | ) | | | | | (0.07 | ) |
| | | | | | | | | | | | | | | | | | | | | | | | | | | | |
| | | | | | | | | |
| | | | | | | | | | | | | | | | | | | | | | | | | | | | | |
| | | (0.27 | ) | | | | | (0.07 | ) | | | | | — | | | | | | (0.02 | ) | | | | | (0.08 | ) |
| | | — | | | | | | — | | | | | | — | | | | | | (0.02 | ) | | | | | — | |
| | | — | | | | | | — | | | | | | — | | | | | | (0.33 | ) | | | | | — | |
| | | | | | | | | | | | | | | | | | | | | | | | | | | | |
| | | (0.27 | ) | | | | | (0.07 | ) | | | | | — | | | | | | (0.37 | ) | | | | | (0.08 | ) |
| | | | | | | | | | | | | | | | | | | | | | | | | | | | |
| | | | | | | | | |
| | | $ 17.62 | | | | | | $ 20.21 | | | | | | $ 14.66 | | | | | | $ 12.90 | | | | | | $ 16.20 | |
| | | | | | | | | | | | | | | | | | | | | | | | | | | | |
| | | | | | | | | |
| | | (11.64% | ) | | | | | 38.51% | | | | | | 13.64% | | | | | | (18.37% | ) | | | | | (0.44% | ) |
| | | | | | | | | |
| | | | | | | | | | | | | | | | | | | | | | | | | | | | | |
| | | $ 48,875 | | | | | | $ 61,735 | | | | | | $ 36,591 | | | | | | $ 24,299 | | | | | | $ 14,173 | |
| | | 1.88% | | | | | | 1.91% | | | | | | 1.99% | | | | | | 2.00% | | | | | | 1.94% | |
| | | 1.88% | | | | | | 1.91% | | | | | | 2.03% | | | | | | 2.00% | | | | | | 1.94% | |
| | | 0.10% | | | | | | 0.85% | | | | | | 0.10% | | | | | | (0.33% | ) | | | | | (0.24% | ) |
| | | 0.10% | | | | | | 0.85% | | | | | | 0.06% | | | | | | (0.33% | ) | | | | | (0.24% | ) |
| | | 11% | | | | | | 11% | | | | | | 25% | | | | | | 12% | | | | | | 26% | |
| |
83
Financial highlights
Delaware Emerging Markets Fund Institutional Class
Selected data for each share of the Fund outstanding throughout each period were as follows:
|
|
Net asset value, beginning of period |
|
Income (loss) from investment operations: |
Net investment income1 |
Net realized and unrealized gain (loss) |
Total from investment operations |
|
Less dividends and distributions from: |
Net investment income |
Return of capital |
Net realized gain |
Total dividends and distributions |
|
Net asset value, end of period |
|
Total return2 |
|
Ratios and supplemental data: |
Net assets, end of period (000 omitted) |
Ratio of expenses to average net assets3 |
Ratio of expenses to average net assets prior to fees waived3 |
Ratio of net investment income to average net assets |
Ratio of net investment income to average net assets prior to fees waived |
Portfolio turnover |
|
| 1 | The average shares outstanding method has been applied for per share information. |
| 2 | Total investment return is based on the change in net asset value of a share during the period and assumes reinvestment of dividends and distributions at net asset value. Total investment return during some of the periods shown reflects a waiver by the manager. Performance would have been lower had the waiver not been in effect. |
| 3 | Expense ratios do not include expenses of the Underlying Funds in which the Fund invests. |
See accompanying notes, which are an integral part of the financial statements.
84
| | | | | | | | | | | | | | | | | | | | | | | | | | | | |
| | | Year ended | |
| | | | |
| | | 11/30/18 | | | | | 11/30/17 | | | | | 11/30/16 | | | | | 11/30/15 | | | | | 11/30/14 | |
| |
| | | $ 20.26 | | | | | | $ 14.69 | | | | | | $ 12.90 | | | | | | $ 16.21 | | | | | | $ 16.36 | |
| | | | | | | | | |
| | | | | | | | | | | | | | | | | | | | | | | | | | | | | |
| | | 0.12 | | | | | | 0.25 | | | | | | 0.08 | | | | | | 0.02 | | | | | | 0.04 | |
| | | (2.34 | ) | | | | | 5.46 | | | | | | 1.75 | | | | | | (2.87 | ) | | | | | (0.04 | ) |
| | | | | | | | | | | | | | | | | | | | | | | | | | | | |
| | | (2.22 | ) | | | | | 5.71 | | | | | | 1.83 | | | | | | (2.85 | ) | | | | | — | |
| | | | | | | | | | | | | | | | | | | | | | | | | | | | |
| | | | | | | | | |
| | | | | | | | | | | | | | | | | | | | | | | | | | | | | |
| | | (0.37 | ) | | | | | (0.14 | ) | | | | | (0.04 | ) | | | | | (0.11 | ) | | | | | (0.15 | ) |
| | | — | | | | | | — | | | | | | — | | | | | | (0.02 | ) | | | | | — | |
| | | — | | | | | | — | | | | | | — | | | | | | (0.33 | ) | | | | | — | |
| | | | | | | | | | | | | | | | | | | | | | | | | | | | |
| | | (0.37 | ) | | | | | (0.14 | ) | | | | | (0.04 | ) | | | | | (0.46 | ) | | | | | (0.15 | ) |
| | | | | | | | | | | | | | | | | | | | | | | | | | | | |
| | | | | | | | | |
| | | $ 17.67 | | | | | | $ 20.26 | | | | | | $ 14.69 | | | | | | $ 12.90 | | | | | | $ 16.21 | |
| | | | | | | | | | | | | | | | | | | | | | | | | | | | |
| | | | | | | | | |
| | | (11.21% | ) | | | | | 39.23% | | | | | | 14.22% | | | | | | (17.96% | ) | | | | | 0.04% | |
| | | | | | | | | |
| | | | | | | | | | | | | | | | | | | | | | | | | | | | | |
| | | $4,189,528 | | | | | | $3,885,606 | | | | | | $1,346,361 | | | | | | $1,254,194 | | | | | | $2,464,277 | |
| | | 1.38% | | | | | | 1.41% | | | | | | 1.49% | | | | | | 1.50% | | | | | | 1.44% | |
| | | 1.38% | | | | | | 1.41% | | | | | | 1.53% | | | | | | 1.50% | | | | | | 1.44% | |
| | | 0.60% | | | | | | 1.35% | | | | | | 0.60% | | | | | | 0.17% | | | | | | 0.26% | |
| | | 0.60% | | | | | | 1.35% | | | | | | 0.56% | | | | | | 0.17% | | | | | | 0.26% | |
| | | 11% | | | | | | 11% | | | | | | 25% | | | | | | 12% | | | | | | 26% | |
| |
85
Financial highlights
Delaware Emerging Markets Fund Class R6
Selected data for each share of the Fund outstanding throughout each period were as follows:
|
|
Net asset value, beginning of period |
|
Income (loss) from investment operations: |
Net investment income2 |
Net realized and unrealized gain (loss) |
Total from investment operations |
|
Less dividends and distributions from: |
Net investment income |
Total dividends and distributions |
|
Net asset value, end of period |
|
Total return3 |
|
Ratios and supplemental data: |
Net assets, end of period (000 omitted) |
Ratio of expenses to average net assets4 |
Ratio of expenses to average net assets prior to fees waived4 |
Ratio of net investment income to average net assets |
Ratio of net investment income to average net assets prior to fees waived |
Portfolio turnover |
|
| 1 | Date of commencement of operations; ratios have been annualized and total return has not been annualized. |
| 2 | The average shares outstanding method has been applied for per share information. |
| 3 | Total investment return is based on the change in net asset value of a share during the period and assumes reinvestment of dividends and distributions at net asset value. Total investment return during some of the periods shown reflects a waiver by the manager. Performance would have been lower had the waiver not been in effect. |
| 4 | Expense ratios do not include expenses of the Underlying Funds in which the Fund invests. |
| 5 | Portfolio turnover is representative of the Fund for the entire year ended Nov. 30, 2016. |
See accompanying notes, which are an integral part of the financial statements.
86
| | | | | | | | | | | | | | | | |
| | | | | | | | | | | | | 5/2/161 | |
| | | Year Ended | | | | | to | |
| | | | | | | | | | |
| | | 11/30/18 | | | | | 11/30/17 | | | | | 11/30/16 | |
| |
| | $ | 20.27 | | | | | $ | 14.69 | | | | | $ | 13.55 | |
| | | | | |
| | | | | | | | | | | | | | | | | |
| | | 0.14 | | | | | | 0.28 | | | | | | 0.08 | |
| | | (2.33 | ) | | | | | 5.45 | | | | | | 1.06 | |
| | | | | | | | | | | | | | | | |
| | | (2.19 | ) | | | | | 5.73 | | | | | | 1.14 | |
| | | | | | | | | | | | | | | | |
| | | | | |
| | | | | | | | | | | | | | | | | |
| | | (0.39 | ) | | | | | (0.15 | ) | | | | | — | |
| | | | | | | | | | | | | | | | |
| | | (0.39 | ) | | | | | (0.15 | ) | | | | | — | |
| | | | | | | | | | | | | | | | |
| | | | | |
| | $ | 17.69 | | | | | $ | 20.27 | | | | | $ | 14.69 | |
| | | | | | | | | | | | | | | | |
| | | | | |
| | | (11.04% | ) | | | | | 39.43% | | | | | | 8.41% | |
| | | | | |
| | | | | | | | | | | | | | | | | |
| | $ | 391,408 | | | | | $ | 140,119 | | | | | $ | 268 | |
| | | 1.26% | | | | | | 1.28% | | | | | | 1.32% | |
| | | 1.26% | | | | | | 1.28% | | | | | | 1.37% | |
| | | 0.72% | | | | | | 1.47% | | | | | | 0.85% | |
| | | 0.72% | | | | | | 1.47% | | | | | | 0.80% | |
| | | 11% | | | | | | 11% | | | | | | 25% | 5 |
| |
87
Financial highlights
Delaware Global Value Fund Class A
Selected data for each share of the Fund outstanding throughout each period were as follows:
|
|
Net asset value, beginning of period |
|
Income (loss) from investment operations: |
Net investment income1 |
Net realized and unrealized gain (loss) |
Total from investment operations |
|
Less dividends and distributions from: |
Net investment income |
Total dividends and distributions |
|
Net asset value, end of period |
|
Total return2 |
|
Ratios and supplemental data: |
Net assets, end of period (000 omitted) |
Ratio of expenses to average net assets |
Ratio of expenses to average net assets prior to fees waived |
Ratio of net investment income to average net assets |
Ratio of net investment income to average net assets prior to fees waived |
Portfolio turnover |
|
| 1 | The average shares outstanding method has been applied for per share information. |
| 2 | Total investment return is based on the change in net asset value of a share during the period and assumes reinvestment of dividends and distributions at net asset value and does not reflect the impact of a sales charge. Total investment return during all of the periods shown reflects waivers by the manager and/or distributor. Performance would have been lower had the waivers not been in effect. |
See accompanying notes, which are an integral part of the financial statements.
88
| | | | | | | | | | | | | | | | | | | | | | | | | | | | |
| | | Year ended | |
| | | | |
| | | 11/30/18 | | | | | 11/30/17 | | | | | 11/30/16 | | | | | 11/30/15 | | | | | 11/30/14 | |
| |
| | $ | 13.21 | | | | | $ | 11.46 | | | | | $ | 11.16 | | | | | $ | 11.71 | | | | | $ | 11.27 | |
| | | | | | | | | |
| | | | | | | | | | | | | | | | | | | | | | | | | | | | | |
| | | 0.16 | | | | | | 0.14 | | | | | | 0.11 | | | | | | 0.08 | | | | | | 0.07 | |
| | | (1.26 | ) | | . | | | 1.81 | | | | | | 0.27 | | | | | | (0.58 | ) | | | | | 0.44 | |
| | | | | | | | | | | | | | | | | | | | | | | | | | | | |
| | | (1.10 | ) | | | | | 1.95 | | | | | | 0.38 | | | | | | (0.50 | ) | | | | | 0.51 | |
| | | | | | | | | | | | | | | | | | | | | | | | | | | | |
| | | | | | | | | |
| | | | | | | | | | | | | | | | | | | | | | | | | | | | | |
| | | (0.16 | ) | | | | | (0.20 | ) | | | | | (0.08 | ) | | | | | (0.05 | ) | | | | | (0.07 | ) |
| | | | | | | | | | | | | | | | | | | | | | | | | | | | |
| | | (0.16 | ) | | | | | (0.20 | ) | | | | | (0.08 | ) | | | | | (0.05 | ) | | | | | (0.07 | ) |
| | | | | | | | | | | | | | | | | | | | | | | | | | | | |
| | | | | | | | | |
| | $ | 11.95 | | | | | $ | 13.21 | | | | | $ | 11.46 | | | | | $ | 11.16 | | | | | $ | 11.71 | |
| | | | | | | | | | | | | | | | | | | | | | | | | | | | |
| | | | | | | | | |
| | | (8.45% | ) | | | | | 17.24% | | | | | | 3.45% | | | | | | (4.27% | ) | | | | | 4.57% | |
| | | | | | | | | |
| | | | | | | | | | | | | | | | | | | | | | | | | | | | | |
| | $ | 11,452 | | | | | $ | 12,977 | | | | | $ | 12,460 | | | | | $ | 14,457 | | | | | $ | 16,950 | |
| | | 1.55% | | | | | | 1.55% | | | | | | 1.55% | | | | | | 1.64% | | | | | | 1.55% | |
| | | 2.25% | | | | | | 2.02% | | | | | | 1.88% | | | | | | 1.89% | | | | | | 1.80% | |
| | | 1.22% | | | | | | 1.16% | | | | | | 1.01% | | | | | | 0.71% | | | | | | 0.58% | |
| | | 0.52% | | | | | | 0.69% | | | | | | 0.69% | | | | | | 0.46% | | | | | | 0.32% | |
| | | 19% | | | | | | 12% | | | | | | 12% | | | | | | 14% | | | | | | 43% | |
| |
89
Financial highlights
Delaware Global Value Fund Class C
Selected data for each share of the Fund outstanding throughout each period were as follows:
|
|
Net asset value, beginning of period |
|
Income (loss) from investment operations: |
Net investment income (loss)1 |
Net realized and unrealized gain (loss) |
Total from investment operations |
|
Less dividends and distributions from: |
Net investment income |
Total dividends and distributions |
|
Net asset value, end of period |
|
Total return3 |
|
Ratios and supplemental data: |
Net assets, end of period (000 omitted) |
Ratio of expenses to average net assets |
Ratio of expenses to average net assets prior to fees waived |
Ratio of net investment income (loss) to average net assets |
Ratio of net investment loss to average net assets prior to fees waived |
Portfolio turnover |
|
| 1 | The average shares outstanding method has been applied for per share information. |
| 2 | Amount is less than $(0.005) per share. |
| 3 | Total investment return is based on the change in net asset value of a share during the period and assumes reinvestment of dividends and distributions at net asset value and does not reflect the impact of a sales charge. Total investment return during all of the periods shown reflects a waiver by the manager. Performance would have been lower had the waiver not been in effect. |
See accompanying notes, which are an integral part of the financial statements.
90
| | | | | | | | | | | | | | | | | | | | | | | | | | | | |
| | | Year ended | |
| | | | |
| | | 11/30/18 | | | | | 11/30/17 | | | | | 11/30/16 | | | | | 11/30/15 | | | | | 11/30/14 | |
| |
| | $ | 12.90 | | | | | $ | 11.20 | | | | | $ | 10.90 | | | | | $ | 11.48 | | | | | $ | 11.06 | |
| | | | | | | | | |
| | | | | | | | | | | | | | | | | | | | | | | | | | | | | |
| | | 0.06 | | | | | | 0.05 | | | | | | 0.03 | | | | | | — | 2 | | | | | (0.02 | ) |
| | | (1.23 | ) | | | | | 1.77 | | | | | | 0.27 | | | | | | (0.58 | ) | | | | | 0.44 | |
| | | | | | | | | | | | | | | | | | | | | | | | | | | | |
| | | (1.17 | ) | | | | | 1.82 | | | | | | 0.30 | | | | | | (0.58 | ) | | | | | 0.42 | |
| | | | | | | | | | | | | | | | | | | | | | | | | | | | |
| | | | | | | | | |
| | | | | | | | | | | | | | | | | | | | | | | | | | | | | |
| | | (0.07 | ) | | | | | (0.12 | ) | | | | | — | | | | | | — | | | | | | — | |
| | | | | | | | | | | | | | | | | | | | | | | | | | | | |
| | | (0.07 | ) | | | | | (0.12 | ) | | | | | — | | | | | | — | | | | | | — | |
| | | | | | | | | | | | | | | | | | | | | | | | | | | | |
| | | | | | | | | |
| | $ | 11.66 | | | | | $ | 12.90 | | | | | $ | 11.20 | | | | | $ | 10.90 | | | | | $ | 11.48 | |
| | | | | | | | | | | | | | | | | | | | | | | | | | | | |
| | | | | | | | | |
| | | (9.14% | ) | | | | | 16.37% | | | | | | 2.75% | | | | | | (5.05% | ) | | | | | 3.80% | |
| | | | | | | | | |
| | | | | | | | | | | | | | | | | | | | | | | | | | | | | |
| | $ | 1,437 | | | | | $ | 4,210 | | | | | $ | 4,116 | | | | | $ | 4,601 | | | | | $ | 5,361 | |
| | | 2.30% | | | | | | 2.30% | | | | | | 2.30% | | | | | | 2.39% | | | | | | 2.30% | |
| | | 3.00% | | | | | | 2.77% | | | | | | 2.63% | | | | | | 2.64% | | | | | | 2.55% | |
| | | 0.47% | | | | | | 0.41% | | | | | | 0.26% | | | | | | (0.04% | ) | | | | | (0.17% | ) |
| | | (0.23% | ) | | | | | (0.06% | ) | | | | | (0.06% | ) | | | | | (0.29% | ) | | | | | (0.43% | ) |
| | | 19% | | | | | | 12% | | | | | | 12% | | | | | | 14% | | | | | | 43% | |
| |
91
Financial highlights
Delaware Global Value Fund Institutional Class
Selected data for each share of the Fund outstanding throughout each period were as follows:
|
|
Net asset value, beginning of period |
|
Income (loss) from investment operations: |
Net investment income1 |
Net realized and unrealized gain (loss) |
Total from investment operations |
|
Less dividends and distributions from: |
Net investment income |
Total dividends and distributions |
|
Net asset value, end of period |
|
Total return2 |
|
Ratios and supplemental data: |
Net assets, end of period (000 omitted) |
Ratio of expenses to average net assets |
Ratio of expenses to average net assets prior to fees waived |
Ratio of net investment income to average net assets |
Ratio of net investment income to average net assets prior to fees waived |
Portfolio turnover |
|
| 1 | The average shares outstanding method has been applied for per share information. |
| 2 | Total investment return is based on the change in net asset value of a share during the period and assumes reinvestment of dividends and distributions at net asset value. Total investment return during all of the periods shown reflects a waiver by the manager. Performance would have been lower had the waiver not been in effect. |
See accompanying notes, which are an integral part of the financial statements.
92
| | | | | | | | | | | | | | | | | | | | | | | | | | | | |
| | | Year ended | |
| | | | |
| | | 11/30/18 | | | | | 11/30/17 | | | | | 11/30/16 | | | | | 11/30/15 | | | | | 11/30/14 | |
| |
| | $ | 13.27 | | | | | $ | 11.51 | | | | | $ | 11.21 | | | | | $ | 11.77 | | | | | $ | 11.32 | |
| | | | | | | | | |
| | | | | | | | | | | | | | | | | | | | | | | | | | | | | |
| | | 0.19 | | | | | | 0.18 | | | | | | 0.14 | | | | | | 0.11 | | | | | | 0.10 | |
| | | (1.26 | ) | | | | | 1.81 | | | | | | 0.27 | | | | | | (0.59 | ) | | | | | 0.45 | |
| | | | | | | | | | | | | | | | | | | | | | | | | | | | |
| | | (1.07 | ) | | | | | 1.99 | | | | | | 0.41 | | | | | | (0.48 | ) | | | | | 0.55 | |
| | | | | | | | | | | | | | | | | | | | | | | | | | | | |
| | | | | | | | | |
| | | | | | | | | | | | | | | | | | | | | | | | | | | | | |
| | | (0.19 | ) | | | | | (0.23 | ) | | | | | (0.11 | ) | | | | | (0.08 | ) | | | | | (0.10 | ) |
| | | | | | | | | | | | | | | | | | | | | | | | | | | | |
| | | (0.19 | ) | | | | | (0.23 | ) | | | | | (0.11 | ) | | | | | (0.08 | ) | | | | | (0.10 | ) |
| | | | | | | | | | | | | | | | | | | | | | | | | | | | |
| | | | | | | | | |
| | $ | 12.01 | | | | | $ | 13.27 | | | | | $ | 11.51 | | | | | $ | 11.21 | | | | | $ | 11.77 | |
| | | | | | | | | | | | | | | | | | | | | | | | | | | | |
| | | | | | | | | |
| | | (8.20% | ) | | | | | 17.53% | | | | | | 3.71% | | | | | | (4.09% | ) | | | | | 4.88% | |
| | | | | | | | | |
| | | | | | | | | | | | | | | | | | | | | | | | | | | | | |
| | $ | 1,509 | | | | | $ | 2,284 | | | | | $ | 1,614 | | | | | $ | 2,042 | | | | | $ | 2,348 | |
| | | 1.30% | | | | | | 1.30% | | | | | | 1.30% | | | | | | 1.39% | | | | | | 1.30% | |
| | | 2.00% | | | | | | 1.77% | | | | | | 1.63% | | | | | | 1.64% | | | | | | 1.55% | |
| | | 1.47% | | | | | | 1.41% | | | | | | 1.26% | | | | | | 0.96% | | | | | | 0.83% | |
| | | 0.77% | | | | | | 0.94% | | | | | | 0.94% | | | | | | 0.71% | | | | | | 0.57% | |
| | | 19% | | | | | | 12% | | | | | | 12% | | | | | | 14% | | | | | | 43% | |
| |
93
Financial highlights
Delaware International Small Cap Fund Class A
Selected data for each share of the Fund outstanding throughout each period were as follows:
|
|
Net asset value, beginning of period |
|
Income (loss) from investment operations: |
Net investment income (loss)1 |
Net realized and unrealized gain (loss) |
Total from investment operations |
|
Less dividends and distributions from: |
Net investment income |
Net realized gain |
Total dividends and distributions |
|
Net asset value, end of period |
|
Total return2 |
|
Ratios and supplemental data: |
Net assets, end of period (000 omitted) |
Ratio of expenses to average net assets |
Ratio of expenses to average net assets prior to fees waived |
Ratio of net investment income (loss) to average net assets |
Ratio of net investment income (loss) to average net assets prior to fees waived |
Portfolio turnover |
|
| 1 | The average shares outstanding method has been applied for per share information. |
| 2 | Total investment return is based on the change in net asset value of a share during the period and assumes reinvestment of dividends and distributions at net asset value. Total investment return during some of the periods shown reflects waivers by the manager and/or distributor. Performance would have been lower had the waivers not been in effect. |
See accompanying notes, which are an integral part of the financial statements.
94
| | | | | | | | | | | | | | | | | | | | | | | | | | | | |
| | | Year ended | |
| | | | |
| | | 11/30/18 | | | | | 11/30/17 | | | | | 11/30/16 | | | | | 11/30/15 | | | | | 11/30/14 | |
| |
| | $ | 7.99 | | | | | $ | 19.03 | | | | | $ | 19.78 | | | | | $ | 20.06 | | | | | $ | 19.18 | |
| | | | | | | | | |
| | | | | | | | | | | | | | | | | | | | | | | | | | | | | |
| | | 0.01 | | | | | | (0.02 | ) | | | | | (0.02 | ) | | | | | (0.05 | ) | | | | | 0.10 | |
| | | (1.02 | ) | | | | | 1.86 | | | | | | (0.06 | ) | | | | | (0.15 | ) | | | | | 1.10 | |
| | | | | | | | | | | | | | | | | | | | | | | | | | | | |
| | | (1.01 | ) | | | | | 1.84 | | | | | | (0.08 | ) | | | | | (0.20 | ) | | | | | 1.20 | |
| | | | | | | | | | | | | | | | | | | | | | | | | | | | |
| | | | | | | | | |
| | | | | | | | | | | | | | | | | | | | | | | | | | | | | |
| | | — | | | | | | — | | | | | | — | | | | | | (0.08 | ) | | | | | — | |
| | | (0.32 | ) | | | | | (12.88 | ) | | | | | (0.67 | ) | | | | | — | | | | | | (0.32 | ) |
| | | | | | | | | | | | | | | | | | | | | | | | | | | | |
| | | (0.32 | ) | | | | | (12.88 | ) | | | | | (0.67 | ) | | | | | (0.08 | ) | | | | | (0.32 | ) |
| | | | | | | | | | | | | | | | | | | | | | | | | | | | |
| | | | | | | | | |
| | $ | 6.66 | | | | | $ | 7.99 | | | | | $ | 19.03 | | | | | $ | 19.78 | | | | | $ | 20.06 | |
| | | | | | | | | | | | | | | | | | | | | | | | | | | | |
| | | | | | | | | |
| | | (13.19% | ) | | | | | 39.78% | | | | | | (0.38% | ) | | | | | (1.02% | ) | | | | | 6.37% | |
| | | | | | | | | |
| | | | | | | | | | | | | | | | | | | | | | | | | | | | | |
| | $ | 10,154 | | | | | $ | 12,377 | | | | | $ | 15,158 | | | | | $ | 27,046 | | | | | $ | 28,583 | |
| | | 1.34% | | | | | | 1.38% | | | | | | 1.48% | | | | | | 1.45% | | | | | | 1.40% | |
| | | 1.72% | | | | | | 2.48% | | | | | | 1.51% | | | | | | 1.45% | | | | | | 1.40% | |
| | | 0.13% | | | | | | (0.22% | ) | | | | | (0.09% | ) | | | | | (0.23% | ) | | | | | 0.54% | |
| | | (0.25% | ) | | | | | (1.32% | ) | | | | | (0.12% | ) | | | | | (0.23% | ) | | | | | 0.54% | |
| | | 106% | | | | | | 142% | | | | | | 66% | | | | | | 41% | | | | | | 26% | |
| |
95
Financial highlights
Delaware International Small Cap Fund Class C
Selected data for each share of the Fund outstanding throughout each period were as follows:
|
|
Net asset value, beginning of period |
|
Income (loss) from investment operations: |
Net investment loss1 |
Net realized and unrealized gain (loss) |
Total from investment operations |
|
Less dividends and distributions from: |
Net realized gain |
Total dividends and distributions |
|
Net asset value, end of period |
|
Total return2 |
|
Ratios and supplemental data: |
Net assets, end of period (000 omitted) |
Ratio of expenses to average net assets |
Ratio of expenses to average net assets prior to fees waived |
Ratio of net investment loss to average net assets |
Ratio of net investment loss to average net assets prior to fees waived |
Portfolio turnover |
|
| 1 | The average shares outstanding method has been applied for per share information. |
| 2 | Total investment return is based on the change in net asset value of a share during the period and assumes reinvestment of dividends and distributions at net asset value and does not reflect the impact of a sales charge. Total investment return during some of the periods shown reflect a waiver by the manager. Performance would have been lower had the waiver not been in effect. |
See accompanying notes, which are an integral part of the financial statements.
96
| | | | | | | | | | | | | | | | | | | | | | | | | | | | |
| | | Year ended | |
| | | | |
| | | 11/30/18 | | | | | 11/30/17 | | | | | 11/30/16 | | | | | 11/30/15 | | | | | 11/30/14 | |
| |
| | $ | 6.83 | | | | | $ | 18.24 | | | | | $ | 19.13 | | | | | $ | 19.47 | | | | | $ | 18.76 | |
| | | | | | | | | |
| | | | | | | | | | | | | | | | | | | | | | | | | | | | | |
| | | (0.04 | ) | | | | | (0.06 | ) | | | | | (0.15 | ) | | | | | (0.19 | ) | | | | | (0.04 | ) |
| | | (0.86 | ) | | | | | 1.53 | | | | | | (0.07 | ) | | | | | (0.15 | ) | | | | | 1.07 | |
| | | | | | | | | | | | | | | | | | | | | | | | | | | | |
| | | (0.90 | ) | | | | | 1.47 | | | | | | (0.22 | ) | | | | | (0.34 | ) | | | | | 1.03 | |
| | | | | | | | | | | | | | | | | | | | | | | | | | | | |
| | | | | | | | | |
| | | | | | | | | | | | | | | | | | | | | | | | | | | | | |
| | | (0.32 | ) | | | | | (12.88 | ) | | | | | (0.67 | ) | | | | | — | | | | | | (0.32 | ) |
| | | | | | | | | | | | | | | | | | | | | | | | | | | | |
| | | (0.32 | ) | | | | | (12.88 | ) | | | | | (0.67 | ) | | | | | — | | | | | | (0.32 | ) |
| | | | | | | | | | | | | | | | | | | | | | | | | | | | |
| | | | | | | | | |
| | $ | 5.61 | | | | | $ | 6.83 | | | | | $ | 18.24 | | | | | $ | 19.13 | | | | | $ | 19.47 | |
| | | | | | | | | | | | | | | | | | | | | | | | | | | | |
| | | | | | | | | |
| | | (13.86% | ) | | | | | 38.77% | | | | | | (1.15% | ) | | | | | (1.75% | ) | | | | | 5.59% | |
| | | | | | | | | |
| | | | | | | | | | | | | | | | | | | | | | | | | | | | | |
| | $ | 4,698 | | | | | $ | 5,199 | | | | | $ | 4,417 | | | | | $ | 5,424 | | | | | $ | 5,759 | |
| | | 2.09% | | | | | | 2.13% | | | | | | 2.23% | | | | | | 2.20% | | | | | | 2.15% | |
| | | 2.47% | | | | | | 3.23% | | | | | | 2.26% | | | | | | 2.20% | | | | | | 2.15% | |
| | | (0.62% | ) | | | | | (0.97% | ) | | | | | (0.84% | ) | | | | | (0.98% | ) | | | | | (0.21% | ) |
| | | (1.00% | ) | | | | | (2.07% | ) | | | | | (0.87% | ) | | | | | (0.98% | ) | | | | | (0.21% | ) |
| | | 106% | | | | | | 142% | | | | | | 66% | | | | | | 41% | | | | | | 26% | |
| |
97
Financial highlights
Delaware International Small Cap Fund Class R
Selected data for each share of the Fund outstanding throughout each period were as follows:
|
|
Net asset value, beginning of period |
|
Income (loss) from investment operations: |
Net investment income (loss)1 |
Net realized and unrealized gain (loss) |
Total from investment operations |
|
Less dividends and distributions from: |
Net investment income |
Net realized gain |
Total dividends and distributions |
|
Net asset value, end of period |
|
Total return2 |
|
Ratios and supplemental data: |
Net assets, end of period (000 omitted) |
Ratio of expenses to average net assets |
Ratio of expenses to average net assets prior to fees waived |
Ratio of net investment income (loss) to average net assets |
Ratio of net investment income (loss) to average net assets prior to fees waived |
Portfolio turnover |
|
| 1 | The average shares outstanding method has been applied for per share information. |
| 2 | Total investment return is based on the change in net asset value of a share during the period and assumes reinvestment of dividends and distributions at net asset value. Total investment return during some of the periods shown reflects waivers by the manager and/or distributor. Performance would have been lower had the waivers not been in effect. |
See accompanying notes, which are an integral part of the financial statements.
98
| | | | | | | | | | | | | | | | | | | | | | | | | | | | |
| | | Year ended | |
| | | | |
| | | 11/30/18 | | | | | 11/30/17 | | | | | 11/30/16 | | | | | 11/30/15 | | | | | 11/30/14 | |
| |
| | $ | 7.61 | | | | | $ | 18.77 | | | | | $ | 19.57 | | | | | $ | 19.85 | | | | | $ | 19.03 | |
| | | | | | | | | |
| | | | | | | | | | | | | | | | | | | | | | | | | | | | | |
| | | (0.01 | ) | | | | | (0.03 | ) | | | | | (0.06 | ) | | | | | (0.09 | ) | | | | | 0.06 | |
| | | (0.97 | ) | | | | | 1.75 | | | | | | (0.07 | ) | | | | | (0.16 | ) | | | | | 1.08 | |
| | | | | | | | | | | | | | | | | | | | | | | | | | | | |
| | | (0.98 | ) | | | | | 1.72 | | | | | | (0.13 | ) | | | | | (0.25 | ) | | | | | 1.14 | |
| | | | | | | | | | | | | | | | | | | | | | | | | | | | |
| | | | | | | | | |
| | | | | | | | | | | | | | | | | | | | | | | | | | | | | |
| | | — | | | | | | — | | | | | | — | | | | | | (0.03 | ) | | | | | — | |
| | | (0.32 | ) | | | | | (12.88 | ) | | | | | (0.67 | ) | | | | | — | | | | | | (0.32 | ) |
| | | | | | | | | | | | | | | | | | | | | | | | | | | | |
| | | (0.32 | ) | | | | | (12.88 | ) | | | | | (0.67 | ) | | | | | (0.03 | ) | | | | | (0.32 | ) |
| | | | | | | | | | | | | | | | | | | | | | | | | | | | |
| | | | | | | | | |
| | $ | 6.31 | | | | | $ | 7.61 | | | | | $ | 18.77 | | | | | $ | 19.57 | | | | | $ | 19.85 | |
| | | | | | | | | | | | | | | | | | | | | | | | | | | | |
| | | | | | | | | |
| | | (13.47% | ) | | | | | 39.45% | | | | | | (0.65% | ) | | | | | (1.27% | ) | | | | | 6.10% | |
| | | | | | | | | |
| | | | | | | | | | | | | | | | | | | | | | | | | | | | | |
| | $ | 87 | | | | | $ | 92 | | | | | $ | 51 | | | | | $ | 107 | | | | | $ | 141 | |
| | | 1.59% | | | | | | 1.63% | | | | | | 1.73% | | | | | | 1.70% | | | | | | 1.65% | |
| | | 1.97% | | | | | | 2.73% | | | | | | 1.76% | | | | | | 1.70% | | | | | | 1.65% | |
| | | (0.12% | ) | | | | | (0.47% | ) | | | | | (0.34% | ) | | | | | (0.48% | ) | | | | | 0.29% | |
| | | (0.50% | ) | | | | | (1.57% | ) | | | | | (0.37% | ) | | | | | (0.48% | ) | | | | | 0.29% | |
| | | 106% | | | | | | 142% | | | | | | 66% | | | | | | 41% | | | | | | 26% | |
| |
99
Financial highlights
Delaware International Small Cap Fund Institutional Class
Selected data for each share of the Fund outstanding throughout each period were as follows:
|
|
Net asset value, beginning of period |
|
Income (loss) from investment operations: |
Net investment income1 |
Net realized and unrealized gain (loss) |
Total from investment operations |
|
Less dividends and distributions from: |
Net investment income |
Net realized gain |
Total dividends and distributions |
|
Net asset value, end of period |
|
Total return3 |
|
Ratios and supplemental data: |
Net assets, end of period (000 omitted) |
Ratio of expenses to average net assets |
Ratio of expenses to average net assets prior to fees waived |
Ratio of net investment income to average net assets |
Ratio of net investment income (loss) to average net assets prior to fees waived |
Portfolio turnover |
|
| 1 | The average shares outstanding method has been applied for per share information. |
| 2 | Amount is less than $0.005 per share. |
| 3 | Total investment return is based on the change in net asset value of a share during the period and assumes reinvestment of dividends and distributions at net asset value. Total investment return during some of the periods shown reflects a waiver by the manager. Performance would have been lower had the waiver not been in effect. |
See accompanying notes, which are an integral part of the financial statements.
100
| | | | | | | | | | | | | | | | | | | | | | | | | | | | |
| | | Year ended | |
| | | | |
| | | 11/30/18 | | | | | 11/30/17 | | | | | 11/30/16 | | | | | 11/30/15 | | | | | 11/30/14 | |
| |
| | $ | 8.34 | | | | | $ | 19.27 | | | | | $ | 19.97 | | | | | $ | 20.25 | | | | | $ | 19.32 | |
| | | | | | | | | |
| | | | | | | | | | | | | | | | | | | | | | | | | | | | | |
| | | 0.03 | | | | | | — | 2 | | | | | 0.03 | | | | | | — | 2 | | | | | 0.15 | |
| | | (1.07 | ) | | | | | 1.95 | | | | | | (0.06 | ) | | | | | (0.16 | ) | | | | | 1.11 | |
| | | | | | | | | | | | | | | | | | | | | | | | | | | | |
| | | (1.04 | ) | | | | | 1.95 | | | | | | (0.03 | ) | | | | | (0.16 | ) | | | | | 1.26 | |
| | | | | | | | | | | | | | | | | | | | | | | | | | | | |
| | | | | | | | | |
| | | | | | | | | | | | | | | | | | | | | | | | | | | | | |
| | | — | | | | | | — | | | | | | — | | | | | | (0.12 | ) | | | | | (0.01 | ) |
| | | (0.32 | ) | | | | | (12.88 | ) | | | | | (0.67 | ) | | | | | — | | | | | | (0.32 | ) |
| | | | | | | | | | | | | | | | | | | | | | | | | | | | |
| | | (0.32 | ) | | | | | (12.88 | ) | | | | | (0.67 | ) | | | | | (0.12 | ) | | | | | (0.33 | ) |
| | | | | | | | | | | | | | | | | | | | | | | | | | | | |
| | | | | | | | | |
| | $ | 6.98 | | | | | $ | 8.34 | | | | | $ | 19.27 | | | | | $ | 19.97 | | | | | $ | 20.25 | |
| | | | | | | | | | | | | | | | | | | | | | | | | | | | |
| | | | | | | | | |
| | | (12.99% | ) | | | | | 40.06% | | | | | | (0.12% | ) | | | | | (0.77% | ) | | | | | 6.66% | |
| | | | | | | | | |
| | | | | | | | | | | | | | | | | | | | | | | | | | | | | |
| | $ | 60,124 | | | | | $ | 14,025 | | | | | $ | 17,958 | | | | | $ | 94,047 | | | | | $ | 98,801 | |
| | | 1.09% | | | | | | 1.13% | | | | | | 1.23% | | | | | | 1.20% | | | | | | 1.15% | |
| | | 1.47% | | | | | | 2.23% | | | | | | 1.26% | | | | | | 1.20% | | | | | | 1.15% | |
| | | 0.38% | | | | | | 0.03% | | | | | | 0.16% | | | | | | 0.02% | | | | | | 0.79% | |
| | | 0.00% | | | | | | (1.07% | ) | | | | | 0.13% | | | | | | 0.02% | | | | | | 0.79% | |
| | | 106% | | | | | | 142% | | | | | | 66% | | | | | | 41% | | | | | | 26% | |
| |
101
Financial highlights
Delaware International Small Cap Fund Class R6
Selected data for each share of the Fund outstanding throughout each period were as follows:
| | | | | | | | |
| | | Year ended
11/30/18 | | | 6/30/171 to 11/30/17 | |
| |
Net asset value, beginning of period | | $ | 8.35 | | | $ | 7.07 | |
| | |
Income (loss) from investment operations: | | | | | | | | |
Net investment income (loss)2 | | | 0.04 | | | | — | 3 |
Net realized and unrealized gain (loss) | | | (1.08 | ) | | | 1.28 | |
| | | | | | | | |
Total from investment operations | | | (1.04 | ) | | | 1.28 | |
| | | | | | | | |
| | |
Less dividends and distributions from: | | | | | | | | |
Net realized gain | | | (0.32 | ) | | | — | |
| | | | | | | | |
Total dividends and distributions | | | (0.32 | ) | | | — | |
| | | | | | | | |
| | |
Net asset value, end of period | | $ | 6.99 | | | $ | 8.35 | |
| | | | | | | | |
| | |
Total return4 | | | (12.98% | ) | | | 18.11% | |
| | |
Ratios and supplemental data: | | | | | | | | |
Net assets, end of period (000 omitted) | | $ | 2,676 | | | $ | 2 | |
Ratio of expenses to average net assets | | | 1.00% | | | | 1.00% | |
Ratio of expenses to average net assets prior to fees waived | | | 1.38% | | | | 2.28% | |
Ratio of net investment income (loss) to average net assets | | | 0.47% | | | | (0.08% | ) |
Ratio of net investment income (loss) to average net assets prior to fees waived | | | 0.09% | | | | (1.36% | ) |
Portfolio turnover | | | 106% | | | | 142% | 5 |
| |
| 1 | Date of commencement of operations; ratios have been annualized and total return has not been annualized. |
| 2 | The average shares outstanding method has been applied for per share information. |
| 3 | Amount is less than $(0.005) per share. |
| 4 | Total investment return is based on the change in net asset value of a share during the period and assumes reinvestment of dividends and distributions at net asset value. Total investment return during all of the periods shown reflects a waiver by the manager. Performance would have been lower had the waiver not been in effect. |
| 5 | Portfolio turnover is representative of the Fund for the entire year ended Nov. 30, 2017. |
See accompanying notes, which are an integral part of the financial statements.
102
This page intentionally left blank.
Financial highlights
Delaware International Value Equity Fund Class A
Selected data for each share of the Fund outstanding throughout each period were as follows:
|
|
Net asset value, beginning of period |
|
Income (loss) from investment operations: |
Net investment income1 |
Net realized and unrealized gain (loss) |
Total from investment operations |
|
Less dividends and distributions from: |
Net investment income |
Total dividends and distributions |
|
Net asset value, end of period |
|
Total return2 |
|
Ratios and supplemental data: |
Net assets, end of period (000 omitted) |
Ratio of expenses to average net assets |
Ratio of net investment income to average net assets |
Portfolio turnover |
|
| 1 | The average shares outstanding method has been applied for per share information. |
| 2 | Total investment return is based on the change in net asset value of a share during the period and assumes reinvestment of dividends and distributions at net asset value and does not reflect the impact of a sales charge. Total investment return during some of the periods shown reflects waivers by the manager and/or distributor. Performance would have been lower had the waivers not been in effect. |
See accompanying notes, which are an integral part of the financial statements.
104
| | | | | | | | | | | | | | | | | | | | | | | | | | | | |
| | | Year ended | |
| | | | |
| | | 11/30/18 | | | | | 11/30/17 | | | | | 11/30/16 | | | | | 11/30/15 | | | | | 11/30/14 | |
| |
| | $ | 15.66 | | | | | $ | 12.94 | | | | | $ | 12.96 | | | | | $ | 13.53 | | | | | $ | 14.26 | |
| | | | | | | | | |
| | | | | | | | | | | | | | | | | | | | | | | | | | | | | |
| | | 0.29 | | | | | | 0.24 | | | | | | 0.19 | | | | | | 0.17 | | | | | | 0.27 | |
| | | (2.19 | ) | | | | | 2.75 | | | | | | (0.05 | ) | | | | | (0.47 | ) | | | | | (0.85 | ) |
| | | | | | | | | | | | | | | | | | | | | | | | | | | | |
| | | (1.90 | ) | | | | | 2.99 | | | | | | 0.14 | | | | | | (0.30 | ) | | | | | (0.58 | ) |
| | | | | | | | | | | | | | | | | | | | | | | | | | | | |
| | | | | | | | | |
| | | | | | | | | | | | | | | | | | | | | | | | | | | | | |
| | | (0.23 | ) | | | | | (0.27 | ) | | | | | (0.16 | ) | | | | | (0.27 | ) | | | | | (0.15 | ) |
| | | | | | | | | | | | | | | | | | | | | | | | | | | | |
| | | (0.23 | ) | | | | | (0.27 | ) | | | | | (0.16 | ) | | | | | (0.27 | ) | | | | | (0.15 | ) |
| | | | | | | | | | | | | | | | | | | | | | | | | | | | |
| | | | | | | | | |
| | $ | 13.53 | | | | | $ | 15.66 | | | | | $ | 12.94 | | | | | $ | 12.96 | | | | | $ | 13.53 | |
| | | | | | | | | | | | | | | | | | | | | | | | | | | | |
| | | | | | | | | |
| | | (12.32% | ) | | | | | 23.53% | | | | | | 1.15% | | | | | | (2.23% | ) | | | | | (4.13% | ) |
| | | | | | | | | |
| | | | | | | | | | | | | | | | | | | | | | | | | | | | | |
| | $ | 63,604 | | | | | $ | 68,412 | | | | | $ | 54,967 | | | | | $ | 66,785 | | | | | $ | 74,118 | |
| | | 1.33% | | | | | | 1.35% | | | | | | 1.36% | | | | | | 1.40% | | | | | | 1.42% | |
| | | 1.93% | | | | | | 1.65% | | | | | | 1.50% | | | | | | 1.24% | | | | | | 1.85% | |
| | | 13% | | | | | | 15% | | | | | | 13% | | | | | | 13% | | | | | | 26% | |
| |
105
Financial highlights
Delaware International Value Equity Fund Class C
Selected data for each share of the Fund outstanding throughout each period were as follows:
|
|
Net asset value, beginning of period |
|
Income (loss) from investment operations: |
Net investment income1 |
Net realized and unrealized gain (loss) |
Total from investment operations |
|
Less dividends and distributions from: |
Net investment income |
Total dividends and distributions |
|
Net asset value, end of period |
|
Total return2 |
|
Ratios and supplemental data: |
Net assets, end of period (000 omitted) |
Ratio of expenses to average net assets |
Ratio of net investment income to average net assets |
Portfolio turnover |
|
| 1 | The average shares outstanding method has been applied for per share information. |
| 2 | Total investment return is based on the change in net asset value of a share during the period and assumes reinvestment of dividends and distributions at net asset value and does not reflect the impact of a sales charge. Total investment return during some of the periods shown reflects a waiver by the manager. Performance would have been lower had the waiver not been in effect. |
See accompanying notes, which are an integral part of the financial statements.
106
| | | | | | | | | | | | | | | | | | | | | | | | | | | | |
| | | Year ended | |
| | | | |
| | | 11/30/18 | | | | | 11/30/17 | | | | | 11/30/16 | | | | | 11/30/15 | | | | | 11/30/14 | |
| |
| | $ | 15.36 | | | | | $ | 12.69 | | | | | $ | 12.71 | | | | | $ | 13.27 | | | | | $ | 13.99 | |
| | | | | | | | | |
| | | | | | | | | | | | | | | | | | | | | | | | | | | | | |
| | | 0.16 | | | | | | 0.13 | | | | | | 0.09 | | | | | | 0.06 | | | | | | 0.16 | |
| | | (2.15 | ) | | | | | 2.72 | | | | | | (0.04 | ) | | | | | (0.46 | ) | | | | | (0.83 | ) |
| | | | | | | | | | | | | | | | | | | | | | | | | | | | |
| | | (1.99 | ) | | | | | 2.85 | | | | | | 0.05 | | | | | | (0.40 | ) | | | | | (0.67 | ) |
| | | | | | | | | | | | | | | | | | | | | | | | | | | | |
| | | | | | | | | |
| | | | | | | | | | | | | | | | | | | | | | | | | | | | | |
| | | (0.12 | ) | | | | | (0.18 | ) | | | | | (0.07 | ) | | | | | (0.16 | ) | | | | | (0.05 | ) |
| | | | | | | | | | | | | | | | | | | | | | | | | | | | |
| | | (0.12 | ) | | | | | (0.18 | ) | | | | | (0.07 | ) | | | | | (0.16 | ) | | | | | (0.05 | ) |
| | | | | | | | | | | | | | | | | | | | | | | | | | | | |
| | | | | | | | | |
| | $ | 13.25 | | | | | $ | 15.36 | | | | | $ | 12.69 | | | | | $ | 12.71 | | | | | $ | 13.27 | |
| | | | | | | | | | | | | | | | | | | | | | | | | | | | |
| | | | | | | | | |
| | | (13.04% | ) | | | | | 22.71% | | | | | | 0.36% | | | | | | (2.99% | ) | | | | | (4.80% | ) |
| | | | | | | | | |
| | | | | | | | | | | | | | | | | | | | | | | | | | | | | |
| | $ | 8,734 | | | | | $ | 21,505 | | | | | $ | 21,672 | | | | | $ | 26,402 | | | | | $ | 28,609 | |
| | | 2.08% | | | | | | 2.10% | | | | | | 2.11% | | | | | | 2.15% | | | | | | 2.17% | |
| | | 1.18% | | | | | | 0.90% | | | | | | 0.75% | | | | | | 0.49% | | | | | | 1.10% | |
| | | 13% | | | | | | 15% | | | | | | 13% | | | | | | 13% | | | | | | 26% | |
| |
107
Financial highlights
Delaware International Value Equity Fund Class R
Selected data for each share of the Fund outstanding throughout each period were as follows:
|
|
Net asset value, beginning of period |
|
Income (loss) from investment operations: |
Net investment income1 |
Net realized and unrealized gain (loss) |
Total from investment operations |
|
Less dividends and distributions from: |
Net investment income |
Total dividends and distributions |
|
Net asset value, end of period |
|
Total return2 |
|
Ratios and supplemental data: |
Net assets, end of period (000 omitted) |
Ratio of expenses to average net assets |
Ratio of net investment income to average net assets |
Portfolio turnover |
|
| 1 | The average shares outstanding method has been applied for per share information. |
| 2 | Total investment return is based on the change in net asset value of a share during the period and assumes reinvestment of dividends and distributions at net asset value. Total investment return during some of the periods shown reflects waivers by the manager and/or distributor. Performance would have been lower had the waivers not been in effect. |
| See | accompanying notes, which are an integral part of the financial statements. |
108
| | | | | | | | | | | | | | | | | | | | | | | | | | | | |
| | | Year ended | |
| | | | |
| | | 11/30/18 | | | | | 11/30/17 | | | | | 11/30/16 | | | | | 11/30/15 | | | | | 11/30/14 | |
| |
| | $ | 15.59 | | | | | $ | 12.88 | | | | | $ | 12.90 | | | | | $ | 13.47 | | | | | $ | 14.20 | |
| | | | | | | | | |
| | | | | | | | | | | | | | | | | | | | | | | | | | | | | |
| | | 0.25 | | | | | | 0.20 | | | | | | 0.16 | | | | | | 0.13 | | | | | | 0.23 | |
| | | (2.19 | ) | | | | | 2.75 | | | | | | (0.05 | ) | | | | | (0.47 | ) | | | | | (0.85 | ) |
| | | | | | | | | | | | | | | | | | | | | | | | | | | | |
| | | (1.94 | ) | | | | | 2.95 | | | | | | 0.11 | | | | | | (0.34 | ) | | | | | (0.62 | ) |
| | | | | | | | | | | | | | | | | | | | | | | | | | | | |
| | | | | | | | | |
| | | | | | | | | | | | | | | | | | | | | | | | | | | | | |
| | | (0.19 | ) | | | | | (0.24 | ) | | | | | (0.13 | ) | | | | | (0.23 | ) | | | | | (0.11 | ) |
| | | | | | | | | | | | | | | | | | | | | | | | | | | | |
| | | (0.19 | ) | | | | | (0.24 | ) | | | | | (0.13 | ) | | | | | (0.23 | ) | | | | | (0.11 | ) |
| | | | | | | | | | | | | | | | | | | | | | | | | | | | |
| | | | | | | | | |
| | $ | 13.46 | | | | | $ | 15.59 | | | | | $ | 12.88 | | | | | $ | 12.90 | | | | | $ | 13.47 | |
| | | | | | | | | | | | | | | | | | | | | | | | | | | | |
| | | | | | | | | |
| | | (12.58% | ) | | | | | 23.26% | | | | | | 0.88% | | | | | | (2.50% | ) | | | | | (4.37% | ) |
| | | | | | | | | |
| | | | | | | | | | | | | | | | | | | | | | | | | | | | | |
| | $ | 3,508 | | | | | $ | 3,440 | | | | | $ | 1,578 | | | | | $ | 1,449 | | | | | $ | 2,317 | |
| | | 1.58% | | | | | | 1.60% | | | | | | 1.61% | | | | | | 1.65% | | | | | | 1.67% | |
| | | 1.68% | | | | | | 1.40% | | | | | | 1.25% | | | | | | 0.99% | | | | | | 1.60% | |
| | | 13% | | | | | | 15% | | | | | | 13% | | | | | | 13% | | | | | | 26% | |
| |
109
Financial highlights
Delaware International Value Equity Fund Institutional Class
Selected data for each share of the Fund outstanding throughout each period were as follows:
|
|
Net asset value, beginning of period |
|
Income (loss) from investment operations: |
Net investment income1 |
Net realized and unrealized gain (loss) |
Total from investment operations |
|
Less dividends and distributions from: |
Net investment income |
Total dividends and distributions |
|
Net asset value, end of period |
|
Total return2 |
|
Ratios and supplemental data: |
Net assets, end of period (000 omitted) |
Ratio of expenses to average net assets |
Ratio of net investment income to average net assets |
Portfolio turnover |
|
| 1 | The average shares outstanding method has been applied for per share information. |
| 2 | Total investment return is based on the change in net asset value of a share during the period and assumes reinvestment of dividends and distributions at net asset value. Total investment return during some of the periods shown reflects a waiver by the manager. Performance would have been lower had the waiver not been in effect. |
See accompanying notes, which are an integral part of the financial statements.
110
| | | | | | | | | | | | | | | | | | | | | | | | | | | | |
| | | Year ended | |
| | | | |
| | | 11/30/18 | | | | | 11/30/17 | | | | | 11/30/16 | | | | | 11/30/15 | | | | | 11/30/14 | |
| |
| | $ | 15.74 | | | | | $ | 13.00 | | | | | $ | 13.02 | | | | | $ | 13.60 | | | | | $ | 14.33 | |
| | | | | | | | | |
| | | | | | | | | | | | | | | | | | | | | | | | | | | | | |
| | | 0.33 | | | | | | 0.28 | | | | | | 0.22 | | | | | | 0.20 | | | | | | 0.30 | |
| | | (2.20 | ) | | | | | 2.76 | | | | | | (0.04 | ) | | | | | (0.48 | ) | | | | | (0.85 | ) |
| | | | | | | | | | | | | | | | | | | | | | | | | | | | |
| | | (1.87 | ) | | | | | 3.04 | | | | | | 0.18 | | | | | | (0.28 | ) | | | | | (0.55 | ) |
| | | | | | | | | | | | | | | | | | | | | | | | | | | | |
| | | | | | | | | |
| | | | | | | | | | | | | | | | | | | | | | | | | | | | | |
| | | (0.27 | ) | | | | | (0.30 | ) | | | | | (0.20 | ) | | | | | (0.30 | ) | | | | | (0.18 | ) |
| | | | | | | | | | | | | | | | | | | | | | | | | | | | |
| | | (0.27 | ) | | | | | (0.30 | ) | | | | | (0.20 | ) | | | | | (0.30 | ) | | | | | (0.18 | ) |
| | | | | | | | | | | | | | | | | | | | | | | | | | | | |
| | | | | | | | | |
| | $ | 13.60 | | | | | $ | 15.74 | | | | | $ | 13.00 | | | | | $ | 13.02 | | | | | $ | 13.60 | |
| | | | | | | | | | | | | | | | | | | | | | | | | | | | |
| | | | | | | | | |
| | | (12.11% | ) | | | | | 23.87% | | | | | | 1.41% | | | | | | (2.03% | ) | | | | | (3.88% | ) |
| | | | | | | | | |
| | | | | | | | | | | | | | | | | | | | | | | | | | | | | |
| | $ | 220,747 | | | | | $ | 226,644 | | | | | $ | 165,361 | | | | | $ | 161,468 | | | | | $ | 181,828 | |
| | | 1.08% | | | | | | 1.10% | | | | | | 1.11% | | | | | | 1.15% | | | | | | 1.17% | |
| | | 2.18% | | | | | | 1.90% | | | | | | 1.75% | | | | | | 1.49% | | | | | | 2.10% | |
| | | 13% | | | | | | 15% | | | | | | 13% | | | | | | 13% | | | | | | 26% | |
| |
111
Financial highlights
Delaware International Value Equity Fund Class R6
Selected data for each share of the Fund outstanding throughout the period were as follows:
| | | | |
| | | 3/29/181 to 11/30/18 | |
| |
Net asset value, beginning of period | | $ | 15.36 | |
| |
Income (loss) from investment operations: | | | | |
Net investment income2 | | | 0.25 | |
Net realized and unrealized loss | | | (2.01 | ) |
| | | | |
Total from investment operations | | | (1.76 | ) |
| | | | |
| |
Net asset value, end of period | | $ | 13.60 | |
| | | | |
| |
Total return3 | | | (11.46% | ) |
| |
Ratios and supplemental data: | | | | |
Net assets, end of period (000 omitted) | | $ | 2 | |
Ratio of expenses to average net assets | | | 1.02% | |
Ratio of net investment income to average net assets | | | 2.47% | |
Portfolio turnover | | | 13% | 4 |
| |
| 1 | Date of commencement of operations; ratios have been annualized and total return has not been annualized. |
| 2 | The average shares outstanding method has been applied for per share information. |
| 3 | Total investment return is based on the change in net asset value of a share during the period and assumes reinvestment of dividends and distributions at net asset value. Total investment return during all of the periods shown reflects a waiver by the manager. Performance would have been lower had the waivers not been in effect. |
| 4 | Portfolio turnover is representative of the Fund for the entire year ended Nov. 30, 2018. |
See accompanying notes, which are an integral part of the financial statements.
112
| | |
Notes to financial statements | | |
| Delaware International Funds | | November 30, 2018 |
Delaware Group® Global & International Funds (Trust) is organized as a Delaware statutory trust and offers four series: Delaware Emerging Markets Fund, Delaware Global Value Fund, Delaware International Small Cap Fund, and Delaware International Value Equity Fund. These financial statements and the related notes pertain to Delaware Emerging Markets Fund, Delaware Global Value Fund, Delaware International Small Cap Fund, and Delaware International Value Equity Fund (each, a Fund or collectively, the Funds). The Trust is anopen-end investment company. Each Fund is considered diversified under the Investment Company Act of 1940, as amended, and offers Class A, Class C, Class R, and Institutional Class shares. Delaware Emerging Markets Fund, Delaware International Small Cap Fund and Delaware International Value Equity Fund also offer Class R6 shares. As of Nov. 30, 2018, Delaware Global Value Fund has not commenced operations of its Class R shares. Class A shares are sold with a maximumfront-end sales charge of 5.75%. Class A share purchases of $1,000,000 or more will incur a contingent deferred sales charge (CDSC) instead of afront-end sales charge of 1.00%, which will be if redeemed during the first year, and 0.50% during the second year, provided that Delaware Distributors, L.P. (DDLP) paid a financial advisor a commission on the purchase of those shares. Class C shares are sold with a CDSC of 1.00%, which will be incurred if redeemed during the first 12 months. Class R, Institutional Class, and Class R6 shares are not subject to a sales charge and are offered for sale exclusively to certain eligible investors. In addition, Class R6 shares do not pay any service fees,sub-accounting fees, and/orsub-transfer agency fees to any brokers, dealers, or other financial intermediaries.
The investment objective of Delaware Emerging Markets Fund, Delaware Global Value Fund, and Delaware International Small Cap Fund is to seek long-term capital appreciation.
The investment objective of Delaware International Value Equity Fund is to seek long-term growth without undue risk to principal.
1. Significant Accounting Policies
Each Fund is an investment company and follows accounting and reporting guidance under Financial Accounting Standards Board (FASB) Accounting Standards Codification Topic 946, Financial Services –Investment Companies. The following accounting policies are in accordance with US generally accepted accounting principles (US GAAP) and are consistently followed by the Funds.
Security Valuation– Equity securities and exchange-traded funds (ETFs), except those traded on the Nasdaq Stock Market LLC (Nasdaq), are valued at the last quoted sales price as of the time of the regular close of the New York Stock Exchange on the valuation date. Equity securities and ETFs traded on the Nasdaq are valued in accordance with the Nasdaq Official Closing Price, which may not be the last sales price. If, on a particular day, an equity security or ETF does not trade, the mean between the bid and ask prices will be used, which approximates fair value. Equity securities listed on a foreign exchange are normally valued at the last quoted sales price on the valuation date. US government and agency securities are valued at the mean between the bid and ask prices, which approximates fair value. Investments in repurchase agreements are generally valued at par, which approximates fair value, each business day.Open-end investment company securities are valued at net asset value (NAV) per share, as reported by the underlying investment company. Foreign currency exchange contracts and foreign cross currency exchange contracts are valued at the mean between the bid and ask prices, which approximates fair value. Interpolated values are derived when the settlement date of the contract is an
113
Notes to financial statements
Delaware International Funds
1. Significant Accounting Policies (continued)
interim date for which quotations are not available. Generally, other securities and assets for which market quotations are not readily available are valued at fair value as determined in good faith under the direction of the Trust’s Board of Trustees (Board). In determining whether market quotations are readily available or fair valuation will be used, various factors will be taken into consideration, such as market closures or suspension of trading in a security. The Funds may use fair value pricing more frequently for securities traded primarily innon-US markets because, among other things, most foreign markets close well before the Funds value their securities, generally as of 4:00pm Eastern time. The earlier close of these foreign markets gives rise to the possibility that significant events, including broad market moves, government actions or pronouncements, aftermarket trading, or news events may have occurred in the interim. Whenever such a significant event occurs, the Funds may value foreign securities using fair value prices based on third-party vendor modeling tools (international fair value pricing). Restricted securities are valued at fair value using methods approved by the Board.
Federal and Foreign Income Taxes– No provision for federal income taxes has been made as each Fund intends to continue to qualify for federal income tax purposes as a regulated investment company under Subchapter M of the Internal Revenue Code of 1986, as amended, and make the requisite distributions to shareholders. Each Fund evaluates tax positions taken or expected to be taken in the course of preparing each Fund’s tax returns to determine whether the tax positions are“more-likely-than-not” of being sustained by the applicable tax authority. Tax positions not deemed to meet the“more-likely-than-not” threshold are recorded as a tax benefit or expense in the current year. Management has analyzed each Fund’s tax positions taken or expected to be taken on each Fund’s federal income tax returns through the year ended Nov. 30, 2018 and for all open tax years (years ended Nov. 30, 2015–Nov. 30, 2017), and has concluded that no provision for federal income tax is required in any Fund’s financial statements. If applicable, the Funds recognize interest accrued on unrecognized tax benefits in interest expense and penalties in other expenses on the “Statements of operations.” During the year ended Nov. 30, 2018, the Funds did not incur any interest or tax penalties. In regard to foreign taxes only, each Fund has open tax years in certain foreign countries in which it invests that may date back to the inception of each Fund.
Class Accounting– Investment income, common expenses, and realized and unrealized gain (loss) on investments are allocated to the various classes of each Fund on the basis of daily net assets of each class. Distribution expenses relating to a specific class are charged directly to that class. Class R6 shares are not allocated any expenses related to service fees,sub-accounting fees, and/orsub-transfer agency fees paid to brokers, dealers, or other financial intermediaries.
Underlying Funds– The Funds may invest in other investment companies (Underlying Funds) to the extent permitted by the 1940 Act. The Underlying Funds in which the Funds may invest include ETFs. A Fund will indirectly bear the investment management fees and other expenses of the Underlying Funds.
Repurchase Agreements– Each Fund may purchase certain US government securities subject to the counterparty’s agreement to repurchase them at an agreed upon date and price. The counterparty will be required on a daily basis to maintain the value of the collateral subject to the agreement at not less than the repurchase price (including accrued interest). The agreements are conditioned upon the collateral being deposited under the Federal Reserve book-entry system with each Fund’s custodian or a
114
third-partysub-custodian. In the event of default or bankruptcy by the other party to the agreement, retention of the collateral may be subject to legal proceedings. At Nov. 30, 2018, the Funds held no investments in repurchase agreements.
Foreign Currency Transactions– Transactions denominated in foreign currencies are recorded at the prevailing exchange rates on the valuation date in accordance with each Fund’s prospectus. The value of all assets and liabilities denominated in foreign currencies is translated daily into US dollars at the exchange rate of such currencies against the US dollar. Transaction gains or losses resulting from changes in exchange rates during the reporting period or upon settlement of the foreign currency transaction are reported in operations for the current period. The Funds generally do not bifurcate that portion of realized gains and losses on investments which is due to changes in foreign exchange rates from that which is due to changes in market prices. These gains and losses are included on the “Statements of operations” under “Net realized gain (loss) on investments.” Each Fund reports certain foreign currency related transactions as components of realized gains (losses) for financial reporting purposes, whereas such components are treated as ordinary income (loss) for federal income tax purposes.
Use of Estimates– The preparation of financial statements in conformity with US GAAP requires management to make estimates and assumptions that affect the fair value of investments, the reported amounts of assets and liabilities and disclosure of contingent assets and liabilities at the date of the financial statements, and the reported amounts of revenues and expenses during the reporting period. Actual results could differ from those estimates and the differences could be material.
Other– Expenses directly attributable to a Fund are charged directly to the Fund. Other expenses common to various funds within the Delaware Funds® by Macquarie (Delaware Funds) are generally allocated among such funds on the basis of average net assets. Management fees and certain other expenses are paid monthly. Security transactions are recorded on the date the securities are purchased or sold (trade date) for financial reporting purposes. Costs used in calculating realized gains and losses on the sale of investment securities are those of the specific securities sold. Dividend income is recorded on theex-dividend date and interest income is recorded on the accrual basis. Discounts and premiums on debt securities are accreted or amortized to interest income, respectively, over the lives of the respective securities using the effective interest method. Taxablenon-cash dividends are recorded as dividend income. Foreign dividends are also recorded on theex-dividend date or as soon after theex-dividend date that a Fund is aware of such dividends, net of all tax withholdings, a portion of which may be reclaimable. Withholding taxes and reclaims on foreign dividends have been recorded in accordance with each Fund’s understanding of the applicable country’s tax rules and rates. Each Fund may pay foreign capital gains taxes on certain foreign securities held, which are reported as components of realized losses for financial reporting purposes, whereas such components are treated as ordinary loss for federal income tax purposes. Each Fund will accrue such taxes as applicable based upon current interpretations of the tax rules and regulations that exist in the markets in which it invests. Each Fund declares and pays dividends from net investment income and distributions from net realized gain on investments, if any, annually. Each Fund may distribute more frequently, if necessary for tax purposes. Dividends and distributions, if any, are recorded on theex-dividend date.
115
Notes to financial statements
Delaware International Funds
1. Significant Accounting Policies (continued)
Subject to seeking best execution, Delaware International Small Cap Fund may direct certain security trades to brokers who have agreed to rebate a portion of the related brokerage commission to the Fund in cash. In general, best execution refers to many factors, including the price paid or received for a security, the commission charged, the promptness and reliability of execution, the confidentiality and placement accorded the order, and other factors affecting the overall benefit obtained by the Fund on the transaction. There were no commission rebates for the year ended Nov. 30, 2018.
Each Fund receives earnings credits from its custodian when positive cash balances are maintained, which may be used to offset custody fees. The expenses paid under this arrangement are included on the “Statements of operations” under “Custodian fees” with the corresponding expense offset included under “Less expenses paid indirectly.” For the year ended Nov. 30, 2018, each Fund earned the following amounts under this arrangement:
| | | | |
Delaware Global Value Fund | | Delaware International Small Cap Fund | | Delaware International Value Equity Fund |
| $35 | | $7 | | $683 |
Delaware Emerging Markets Fund did not receive any earnings credit from the custodian for the year ended Nov. 30, 2018.
Each Fund receives earnings credits from its transfer agent when positive cash balances are maintained, which may be used to offset transfer agent fees. If the amount earned is greater than $1, the expense paid under this arrangement is included on the “Statements of operations” under “Dividend disbursing and transfer agent fees and expenses” with the corresponding expense offset included under “Less expenses paid indirectly.” For the year ended Nov. 30, 2018, each Fund earned the following amounts under this arrangement:
| | | | | | |
Delaware Emerging Markets Fund | | Delaware Global Value Fund | | Delaware International Small Cap Fund | | Delaware International Value Equity Fund |
| $2,329 | | $97 | | $126 | | $627 |
During the year ended Nov. 30, 2018, Delaware Emerging Markets Fund frequently maintained a negative cash balance with its custodian, which is considered a form of borrowing or leverage. If that Fund maintains a negative cash balance and the Fund’s investments decrease in value, the Fund’s losses will be greater than if the Fund did not maintain a negative cash balance. Each Fund is required to pay interest to the custodian on negative cash balances. During the year ended Nov. 30, 2018, Delaware Emerging Markets Fund had an average outstanding overdraft balance equal to 0.36% of its average net assets for which it was charged interest of $423,590, which is included on the “Statements of operations” under “Custodian fees.” The average borrowing rate charged on the overdraft was 2.24%.
2. Investment Management, Administration Agreements, and Other Transactions with Affiliates
In accordance with the terms of its respective investment management agreement, each Fund pays Delaware Management Company (DMC), a series of Macquarie Investment Management Business Trust
116
and the investment manager, an annual fee which is calculated daily and paid monthly, based on each Fund’s average daily net assets as follows:
| | | | | | | | |
| | | Delaware Emerging
Markets Fund | | Delaware Global
Value Fund | | Delaware International
Small Cap Fund | | Delaware International
Value Equity Fund |
| On the first $500 million | | 1.25% | | 0.85% | | 0.85% | | 0.85% |
| On the next $500 million | | 1.20% | | 0.80% | | 0.80% | | 0.80% |
| On the next $1.5 billion | | 1.15% | | 0.75% | | 0.75% | | 0.75% |
| In excess of $2.5 billion | | 1.10% | | 0.70% | | 0.70% | | 0.70% |
DMC has contractually agreed to waive that portion, if any, of its management fee and/or pay/reimburse the Funds to the extent necessary to ensure that annual operating expenses (excluding any distribution and service(12b-1) fees, acquired fund fees and expenses, taxes, interest, short sale dividend and interest expenses, brokerage fees, certain insurance costs, and nonroutine expenses or costs, including, but not limited to, those relating to reorganizations, litigation, conducting shareholder meetings, and liquidations), do not exceed specified percentages of average daily net assets of each Fund as shown on the next page. The expense waivers were in effect from Dec. 1, 2017 through Nov. 30, 2018.* For purposes of these waivers and reimbursements, nonroutine expenses may also include such additional costs and expenses as may be agreed upon from time to time by the Funds’ Board and DMC. These expense waivers and reimbursements apply to expenses paid directly by the Funds and may only be terminated by agreement of DMC and the Funds. The waivers and reimbursements are accrued daily and received monthly.
| | | | | | | | |
| | | Delaware
Emerging
Markets Fund | | Delaware Global
Value Fund | | Delaware International
Small Cap Fund | | Delaware International
Value Equity Fund |
| Operating expense limitation as a percentage of average daily net assets (per annum) Dec. 1, 2017 – March 28, 2018 | | 1.45%1 | | 1.30% | | 1.13% | | 1.20% |
| Operating expense limitation as a percentage of average daily net assets (per annum) March 29, 2018 – Nov. 30, 2018 | | 1.42%2 | | 1.30% | | 1.12%3 | | 1.16%4 |
1The expense limitation was 1.32% for Class R6 shares.
2The expense limitation is 1.29% for Class R6 shares.
3The expense limitation is 1.00% for Class R6 shares.
117
Notes to financial statements
Delaware International Funds
2. Investment Management, Administration Agreements, and Other Transactions with Affiliates (continued)
4The expense limitation is 1.09% for Class R6 shares.
The Class commenced on March 28, 2018. Delaware Investments Fund Services Company (DIFSC), an affiliate of DMC, provides fund accounting and financial administration oversight services to each Fund. For these services DIFSC’s fees are calculated daily and paid monthly based on the aggregate daily net assets of all funds within the Delaware Funds at the following annual rate: 0.00475% of the first $35 billion; 0.0040% of the next $10 billion; and 0.0025% of aggregate average daily net assets in excess of $45 billion (Total Fee). Each Fund in the Delaware Funds pays a minimum of $4,000, which, in aggregate, is subtracted from the Total Fee. Each fund then pays its portion of the remainder of the Total Fee on a relative NAV basis. These amounts are included on the “Statements of operations” under “Accounting and administration expenses.” For the year ended Nov. 30, 2018, each Fund was charged for these services as follows:
| | | | | | |
Delaware Emerging Markets Fund | | Delaware Global Value Fund | | Delaware International Small Cap Fund | | Delaware International Value Equity Fund |
| $203,782 | | $4,658 | | $6,633 | | $16,391 |
DIFSC is also the transfer agent and dividend disbursing agent of the Funds. For these services, DIFSC’s fees were calculated daily and paid monthly based on the aggregate daily net assets of the retail funds within the Delaware Funds from Nov. 1, 2017 through June 30, 2018 at the following annual rate: 0.025% of the first $20 billion; 0.020% of the next $5 billion; 0.015% of the next $5 billion; and 0.013% of average daily net assets in excess of $30 billion. Effective July 1, 2018, the Funds as well as the other Delaware Funds entered into an amendment to the DIFSC agreement. Under the amendment to the DIFSC agreement, DIFSC’s fees are calculated daily and paid monthly based on the aggregate daily net assets of the retail funds within the Delaware Funds at the following annual rate: 0.014% of the first $20 billion; 0.011% of the next $5 billion; 0.007% of the next $5 billion; 0.005% of the next $20 billion; and 0.0025% of average daily net assets in excess of $50 billion. The fees payable to DIFSC under the transfer agent agreement described above are allocated among all retail funds in the Delaware Funds on a relative NAV basis. This amount is included on the “Statements of operations” under “Dividend disbursing and transfer agent fees and expenses.” For the year ended Nov. 30, 2018, each Fund was charged for these services as follows:
| | | | | | |
Delaware Emerging Markets Fund | | Delaware Global Value Fund | | Delaware International Small Cap Fund | | Delaware International Value Equity Fund |
| $817,169 | | $2,756 | | $9,807 | | $51,088 |
Pursuant to asub-transfer agency agreement between DIFSC and BNY Mellon Investment Servicing (US) Inc. (BNYMIS), BNYMIS provides certainsub-transfer agency services to the Funds.Sub-transfer agency fees are paid by the Funds and are also included on the “Statements of operations” under “Dividend disbursing and transfer agent fees and expenses.”
Pursuant to a distribution agreement and distribution plan, each Fund pays DDLP, the distributor and an affiliate of DMC, an annual12b-1 fee of 0.25% of the average daily net assets of the Class A shares, 1.00% of the average daily net assets of the Class C shares, and 0.50% of the average daily net assets
118
of the Class R shares. The fees are calculated daily and paid monthly. Institutional Class and Class R6 shares pay no12b-1 fees.
As provided in the investment management agreement, each Fund bears a portion of the cost of certain resources shared with DMC, including the cost of internal personnel of DMC and/or its affiliates that provide legal, tax, and regulatory reporting services to the Funds. These amounts are included on the “Statements of operations” under “Legal fees.” For the year ended Nov. 30, 2018, each Fund was charged for internal legal, tax, and regulatory reporting services provided by DMC and/or its affiliates’ employees as follows:
| | | | | | |
Delaware Emerging Markets Fund | | Delaware Global Value Fund | | Delaware International Small Cap Fund | | Delaware International Value Equity Fund |
| $107,243 | | $5,316 | | $5,424 | | $13,372 |
For the year ended Nov. 30, 2018, DDLP earned commissions on sales of Class A shares for each Fund as follows:
| | | | | | |
Delaware Emerging Markets Fund | | Delaware Global Value Fund | | Delaware International Small Cap Fund | | Delaware International Value Equity Fund |
| $137,577 | | $1,182 | | $9,876 | | $14,752 |
For the year ended Nov. 30, 2018, DDLP received gross CDSC commissions on redemptions of each Fund’s Class A and Class C shares, and these commissions were entirely used to offset upfront commissions previously paid by DDLP to broker/dealers on sales of those shares. The amounts received were as follows:
| | | | | | | | |
| | | Delaware Emerging
Markets Fund | | Delaware Global
Value Fund | | Delaware International
Small Cap Fund | | Delaware International
Value Equity Fund |
| Class A | | $29,949 | | $18 | | $ — | | $ — |
| Class C | | 66,164 | | 7 | | 1,876 | | 1,921 |
Trustees’ fees include expenses accrued by each Fund for each Trustee’s retainer and meeting fees. Certain officers of DMC, DIFSC, and DDLP are officers and/or Trustees of the Trust. These officers and Trustees are paid no compensation by the Funds.
In addition to the management fees and other expenses of a Fund, a Fund indirectly bears the investment management fees and other expenses of the Underlying Funds. The amount of these fees and expenses incurred indirectly by a Fund will vary based upon the expense and fee levels of the Underlying Funds and the amount of shares that are owned of the Underlying Funds at different times.
*The aggregate contractual waiver period covering this report is from May 2, 2016 through March 29, 2019 for Delaware Emerging Markets Fund; March 28, 2017 through March 29, 2019 for Delaware Global Value Fund and Delaware International Value Equity Fund; and June 30, 2017 through March 29, 2019 for Delaware International Small Cap Fund.
119
Notes to financial statements
Delaware International Funds
3. Investments
For the year ended Nov. 30, 2018, each Fund made purchases and sales of investment securities other than short-term investments as follows:
| | | | | | | | | | | | | | | | |
| | | Delaware Emerging
Markets Fund | | | Delaware Global
Value Fund | | | Delaware
International
Small Cap Fund | | | Delaware
International
Value Equity
Fund | |
Purchases | | | $1,649,703,339 | | | | $3,281,378 | | | | $130,828,853 | | | | $81,162,192 | |
Sales | | | 575,060,308 | | | | 6,347,424 | | | | 69,733,406 | | | | 42,691,969 | |
The tax cost of investments includes adjustments to net unrealized appreciation (depreciation) which may not necessarily be final tax cost basis adjustments, but approximates the tax basis unrealized gains and losses that may be realized and distributed to shareholders. At Nov. 30, 2018, the cost and unrealized appreciation (depreciation) of investments and derivatives for federal income tax purposes for each Fund were as follows:
| | | | | | | | | | | | | | | | |
| | | Delaware
Emerging
Markets Fund | | | Delaware
Global
Value Fund | | | Delaware
International
Small Cap
Fund | | | Delaware
International
Value Equity
Fund | |
Cost of investments and derivatives | | $ | 5,230,812,382 | | | $ | 12,387,002 | | | $ | 79,185,674 | | | $ | 302,138,758 | |
| | | | | | | | | | | | | | | | |
Aggregate unrealized appreciation of investments and derivatives | | $ | 782,613,676 | | | $ | 3,778,654 | | | $ | 5,188,975 | | | $ | 51,572,157 | |
Aggregate unrealized depreciation of investments and derivatives | | | (879,798,530 | ) | | | (1,877,646 | ) | | | (9,842,162 | ) | | | (60,056,806 | ) |
| | | | | | | | | | | | | | | | |
Net unrealized appreciation (depreciation) of investments and derivatives | | $ | (97,184,854 | ) | | $ | 1,901,008 | | | $ | (4,653,187 | ) | | $ | (8,484,649 | ) |
| | | | | | | | | | | | | | | | |
US GAAP defines fair value as the price that each Fund would receive to sell an asset or pay to transfer a liability in an orderly transaction between market participants at the measurement date under current market conditions. A three-level hierarchy for fair value measurements has been established based upon the transparency of inputs to the valuation of an asset or liability. Inputs may be observable or unobservable and refer broadly to the assumptions that market participants would use in pricing the asset or liability. Observable inputs reflect the assumptions market participants would use in pricing the asset or liability based on market data obtained from sources independent of the reporting entity. Unobservable inputs reflect the reporting entity’s own assumptions about the assumptions that market participants would use in pricing the asset or liability based on the best information available under the circumstances. Each Fund’s investment in its entirety is assigned a level based upon the observability of the inputs which are significant to the overall valuation. The three-level hierarchy of inputs is summarized on the next page.
120
| | |
| Level 1 – | | Inputs are quoted prices in active markets for identical investments. (Examples: equity securities,open-end investment companies, futures contracts, exchange-traded options contracts) |
| |
| Level 2 – | | Other observable inputs, including, but not limited to: quoted prices for similar assets or liabilities in markets that are active, quoted prices for identical or similar assets or liabilities in markets that are not active, inputs other than quoted prices that are observable for the assets or liabilities (such as interest rates, yield curves, volatilities, prepayment speeds, loss severities, credit risks, and default rates) or other market-corroborated inputs. (Examples: debt securities, government securities, swap contracts, foreign currency exchange contracts, foreign securities utilizing international fair value pricing, broker-quoted securities, fair valued securities) |
| |
| Level 3 – | | Significant unobservable inputs, including each Fund’s own assumptions used to determine the fair value of investments. (Examples: broker-quoted securities, fair valued securities) |
Level 3 investments are valued using significant unobservable inputs. Each Fund may also use an income-based valuation approach in which the anticipated future cash flows of the investment are discounted to calculate fair value. Discounts may also be applied due to the nature or duration of any restrictions on the disposition of the investments. Valuations may also be based upon current market prices of securities that are comparable in coupon, rating, maturity, and industry. The derived value of a Level 3 investment may not represent the value which is received upon disposition and this could impact the results of operations.
121
Notes to financial statements
Delaware International Funds
3. Investments (continued)
The following tables summarize the valuation of each Fund’s investments by fair value hierarchy levels as of Nov. 30, 2018:
| | | | | | | | | | | | | | | | |
| | | Delaware Emerging Markets Fund | |
| | | Level 1 | | | Level 2 | | | Level 3 | | | Total | |
Securities | | | | | | | | | | | | | | | | |
Assets: | | | | | | | | | | | | | | | | |
Common Stock | | | | | | | | | | | | | | | | |
Argentina | | $ | 71,134,575 | | | $ | 347,714 | | | $ | — | | | $ | 71,482,289 | |
Bahrain | | | — | | | | 1,747,577 | | | | — | | | | 1,747,577 | |
Brazil | | | 569,276,315 | | | | — | | | | — | | | | 569,276,315 | |
Chile | | | 48,490,680 | | | | — | | | | — | | | | 48,490,680 | |
China/Hong Kong | | | 704,731,918 | | | | 819,926,491 | | | | — | | | | 1,524,658,409 | |
Cyprus | | | 5,794,671 | | | | — | | | | — | | | | 5,794,671 | |
France | | | — | | | | 611,933 | | | | — | | | | 611,933 | |
India | | | 12,314,923 | | | | 482,692,586 | | | | 14,682 | | | | 495,022,191 | |
Indonesia | | | — | | | | 40,557,184 | | | | — | | | | 40,557,184 | |
Japan | | | 29,160,646 | | | | — | | | | — | | | | 29,160,646 | |
Malaysia | | | — | | | | 2,811,839 | | | | — | | | | 2,811,839 | |
Mexico | | | 285,761,917 | | | | — | | | | — | | | | 285,761,917 | |
Netherlands | | | 11,646,224 | | | | — | | | | — | | | | 11,646,224 | |
Peru | | | 45,494,036 | | | | — | | | | — | | | | 45,494,036 | |
Republic of Korea | | | 205,718,829 | | | | 752,758,688 | | | | — | | | | 958,477,517 | |
Russia | | | 42,182,000 | | | | 268,010,165 | | | | — | | | | 310,192,165 | |
South Africa | | | 5,711,592 | | | | 23,145,907 | | | | — | | | | 28,857,499 | |
Taiwan | | | — | | | | 375,053,980 | | | | — | | | | 375,053,980 | |
Turkey | | | 12,441,540 | | | | 36,091,151 | | | | — | | | | 48,532,691 | |
United Kingdom | | | — | | | | 3,827,683 | | | | — | | | | 3,827,683 | |
United States | | | 112,999,800 | | | | — | | | | — | | | | 112,999,800 | |
Preferred Stock1 | | | 92,047,809 | | | | 63,500,541 | | | | — | | | | 155,548,350 | |
Exchange-Traded Funds | | | 7,622,621 | | | | — | | | | — | | | | 7,622,621 | |
Participation Notes | | | — | | | | — | | | | — | | | | — | |
| | | | | | | | | | | | | | | | |
Total Value of Securities | | $ | 2,262,530,096 | | | $ | 2,871,083,439 | | | $ | 14,682 | | | $ | 5,133,628,217 | |
| | | | | | | | | | | | | | | | |
Derivatives2 | | | | | | | | | | | | | | | | |
Liabilities: | | | | | | | | | | | | | | | | |
Foreign Currency Exchange Contracts | | $ | — | | | $ | (689 | ) | | $ | — | | | $ | (689 | ) |
1Security type is valued across multiple levels. The amounts attributed to Level 1 investments and Level 2 investments represent 59.18% and 40.82%, respectively, of the total market value of this security type. Level 1 investments represent exchange traded investments and Level 2 investments represent investments with observable inputs.
2Foreign currency exchange contracts are valued at the unrealized appreciation (depreciation) on the instrument at the year end.
122
| | | | | | | | | | | | |
| | | Delaware Global Value Fund | |
| | | Level 1 | | | Level 2 | | | Total | |
Securities | | | | | | | | | | | | |
Assets: | | | | | | | | | | | | |
Common Stock | | | | | | | | | | | | |
Canada | | $ | 568,162 | | | $ | — | | | $ | 568,162 | |
China/Hong Kong | | | — | | | | 368,323 | | | | 368,323 | |
France | | | — | | | | 1,004,688 | | | | 1,004,688 | |
Germany | | | — | | | | 429,301 | | | | 429,301 | |
Indonesia | | | — | | | | 253,502 | | | | 253,502 | |
Italy | | | — | | | | 286,707 | | | | 286,707 | |
Japan | | | — | | | | 1,647,736 | | | | 1,647,736 | |
Netherlands | | | — | | | | 299,840 | | | | 299,840 | |
Panama | | | 76,527 | | | | — | | | | 76,527 | |
Republic of Korea | | | — | | | | 274,963 | | | | 274,963 | |
Russia | | | 112,224 | | | | — | | | | 112,224 | |
Singapore | | | — | | | | 150,564 | | | | 150,564 | |
Spain | | | — | | | | 218,135 | | | | 218,135 | |
Sweden | | | — | | | | 166,840 | | | | 166,840 | |
Switzerland | | | — | | | | 268,244 | | | | 268,244 | |
United Kingdom | | | 541,722 | | | | 1,323,693 | | | | 1,865,415 | |
United States | | | 6,296,904 | | | | — | | | | 6,296,904 | |
| | | | | | | | | | | | |
Total Value of Securities | | $ | 7,595,539 | | | $ | 6,692,536 | | | $ | 14,288,075 | |
| | | | | | | | | | | | |
Derivatives1 | | | | | | | | | | | | |
Liabilities: | | | | | | | | | | | | |
Foreign Currency Exchange Contracts | | $ | — | | | $ | (65 | ) | | $ | (65 | ) |
1Foreign currency exchange contracts are valued at the unrealized appreciation (depreciation) on the instrument at the year end.
123
Notes to financial statements
Delaware International Funds
3. Investments (continued)
| | | | | | | | | | | | |
| | | Delaware International Small Cap Fund | |
| | | |
| | | Level 1 | | | Level 2 | | | Total | |
Securities | | | | | | | | | | | | |
Assets: | | | | | | | | | | | | |
Common Stock | | | | | | | | | | | | |
Australia | | $ | — | | | $ | 2,940,595 | | | $ | 2,940,595 | |
Austria | | | 811,610 | | | | — | | | | 811,610 | |
Belgium | | | — | | | | 657,621 | | | | 657,621 | |
Brazil | | | 441,074 | | | | — | | | | 441,074 | |
Canada | | | 5,630,743 | | | | — | | | | 5,630,743 | |
China/Hong Kong | | | — | | | | 4,407,411 | | | | 4,407,411 | |
Colombia | | | 836,512 | | | | — | | | | 836,512 | |
Denmark | | | — | | | | 1,537,126 | | | | 1,537,126 | |
Finland | | | — | | | | 842,811 | | | | 842,811 | |
France | | | 539,924 | | | | 1,348,844 | | | | 1,888,768 | |
Germany | | | — | | | | 3,878,315 | | | | 3,878,315 | |
India | | | — | | | | 2,698,698 | | | | 2,698,698 | |
Ireland | | | 3,058,205 | | | | 2,521,730 | | | | 5,579,935 | |
Israel | | | — | | | | 1,641,450 | | | | 1,641,450 | |
Italy | | | — | | | | 1,357,170 | | | | 1,357,170 | |
Japan | | | — | | | | 15,035,305 | | | | 15,035,305 | |
Malaysia | | | — | | | | 1,010,460 | | | | 1,010,460 | |
Mexico | | | 714,255 | | | | — | | | | 714,255 | |
Netherlands | | | — | | | | 858,299 | | | | 858,299 | |
Norway | | | 518,988 | | | | 3,470,701 | | | | 3,989,689 | |
Portugal | | | — | | | | 854,245 | | | | 854,245 | |
Republic of Korea | | | — | | | | 1,476,688 | | | | 1,476,688 | |
Spain | | | — | | | | 509,051 | | | | 509,051 | |
Sweden | | | — | | | | 848,272 | | | | 848,272 | |
Switzerland | | | — | | | | 824,369 | | | | 824,369 | |
Taiwan | | | — | | | | 627,136 | | | | 627,136 | |
United Kingdom | | | — | | | | 12,226,006 | | | | 12,226,006 | |
Preferred Stock | | | 416,666 | | | | — | | | | 416,666 | |
| | | | | | | | | | | | |
Total Value of Securities | | $ | 12,967,977 | | | $ | 61,572,303 | | | $ | 74,540,280 | |
| | | | | | | | | | | | |
Derivatives1 | | | | | | | | | | | | |
Assets: | | | | | | | | | | | | |
Foreign Currency Exchange Contracts | | $ | — | | | $ | 1,345 | | | $ | 1,345 | |
Liabilities: | | | | | | | | | | | | |
Foreign Currency Exchange Contracts | | $ | — | | | $ | (9,138 | ) | | $ | (9,138 | ) |
124
1Foreign currency exchange contracts are valued at the unrealized appreciation (depreciation) on the instrument at the year end.
| | | | | | | | | | | | |
| | | Delaware International Value Equity Fund | |
| | | Level 1 | | | Level 2 | | | Total | |
Securities | | | | | | | | | | | | |
Assets: | | | | | | | | | | | | |
Common Stock | | | | | | | | | | | | |
Australia | | $ | — | | | $ | 1,320,132 | | | $ | 1,320,132 | |
Canada | | | 14,512,265 | | | | — | | | | 14,512,265 | |
China/Hong Kong | | | — | | | | 25,702,635 | | | | 25,702,635 | |
Denmark | | | — | | | | 6,973,186 | | | | 6,973,186 | |
Finland | | | — | | | | 7,521,286 | | | | 7,521,286 | |
France | | | — | | | | 53,342,063 | | | | 53,342,063 | |
Germany | | | — | | | | 12,964,184 | | | | 12,964,184 | |
Indonesia | | | — | | | | 8,258,710 | | | | 8,258,710 | |
Italy | | | — | | | | 8,851,242 | | | | 8,851,242 | |
Japan | | | — | | | | 63,233,641 | | | | 63,233,641 | |
Netherlands | | | — | | | | 14,564,058 | | | | 14,564,058 | |
Panama | | | 1,505,031 | | | | — | | | | 1,505,031 | |
Republic of Korea | | | — | | | | 6,435,373 | | | | 6,435,373 | |
Russia | | | 2,538,666 | | | | — | | | | 2,538,666 | |
Singapore | | | — | | | | 3,016,784 | | | | 3,016,784 | |
Spain | | | — | | | | 5,465,088 | | | | 5,465,088 | |
Sweden | | | — | | | | 3,615,207 | | | | 3,615,207 | |
Switzerland | | | — | | | | 10,423,427 | | | | 10,423,427 | |
United Kingdom | | | 6,737,566 | | | | 36,675,115 | | | | 43,412,681 | |
Securities Lending Collateral | | | — | | | | 1,084 | | | | 1,084 | |
| | | | | | | | | | | | |
Total Value of Securities | | $ | 25,293,528 | | | $ | 268,363,215 | | | $ | 293,656,743 | |
| | | | | | | | | | | | |
Derivatives1 | | | | | | | | | | | | |
Liabilities: | | | | | | | | | | | | |
Foreign Currency Exchange Contract | | $ | — | | | $ | (2,634 | ) | | $ | (2,634 | ) |
1Foreign currency exchange contracts are valued at the unrealized appreciation (depreciation) on the instrument at the year end.
The securities that have been valued at zero on the “Schedules of investments” are considered to be Level 3 securities in these tables.
As a result of utilizing international fair value pricing at Nov. 30, 2018, a portion of the common stock of the Funds was categorized as Level 2.
During the year ended Nov. 30, 2018, there were no transfers between Level 1 investments, Level 2 investments, or Level 3 investments that had a significant impact to each Fund. This does not
125
Notes to financial statements
Delaware International Funds
3. Investments (continued)
include transfers between Level 1 investments and Level 2 investments due to each Fund utilizing international fair value pricing during the year. In accordance with the fair valuation procedures described in Note 1, international fair value pricing of securities in each Fund occurs when market volatility exceeds an established rolling threshold. If the threshold is exceeded on a given date, then prices of international securities (those that traded on exchanges that close at a different time than the time that each Fund’s NAV is determined) are established using a separate pricing feed from a third party vendor designed to establish a price for each such security as of the time that each Fund’s NAV is determined. Further, international fair value pricing uses other observable market-based inputs in place of the closing exchange price due to the events occurring after the close of the exchange or market on which the investment is principally traded, causing a change in classification between levels. Each Fund’s policy is to recognize transfers between levels based on fair value at the beginning of the reporting period.
A reconciliation of Level 3 investments is presented when a Fund has a significant amount of Level 3 investments at the beginning, interim, or end of the period in relation to the Fund’s net assets. Management has determined not to provide a reconciliation of Level 3 investments as the Level 3 investments were not considered significant to each Fund’s net assets at the beginning, interim, or end of the year. Management has determined not to provide additional disclosure on Level 3 inputs since the Level 3 investments are not considered significant to each Fund’s net assets at the end of the year.
During the year ended Nov. 30, 2018, Delaware Global Value Fund, Delaware International Small Cap Fund, and Delaware International Value Equity Fund had no Level 3 investments.
4. Dividend and Distribution Information
Income and long-term capital gain distributions are determined in accordance with federal income tax regulations, which may differ from US GAAP. Additionally, distributions from net gains on foreign currency transactions and net short-term gains on sales of investment securities are treated as ordinary income for federal income tax purposes. The tax character of dividends and distributions paid during the years ended Nov. 30, 2018 and 2017 was as follows:
| | | | | | | | | | | | | | | | | | | | |
| | | Delaware
Emerging
Markets Fund | | Delaware Global
Value Fund | | Delaware
International
Small Cap Fund | | Delaware
International
Value Equity Fund |
Year ended Nov. 30, 2018 | | | | | | | | | | | | | | | | | | | | |
Ordinary income | | | | $84,246,297 | | | | | $208,155 | | | | | $ 658,536 | | | | | $5,117,450 | |
Long-term capital gains | | | | — | | | | | — | | | | | 637,439 | | | | | — | |
| | | | | | | | | | | | | | | | | | | | |
Total | | | | $84,246,297 | | | | | $208,155 | | | | | $ 1,295,975 | | | | | $5,117,450 | |
| | | | | | | | | | | | | | | | | | | | |
| | | | |
Year ended Nov. 30, 2017 | | | | | | | | | | | | | | | | | | | | |
Ordinary income | | | | $16,550,177 | | | | | $291,253 | | | | | $ 2,421,608 | | | | | $5,264,592 | |
Long-term capital gains | | | | — | | | | | — | | | | | 13,516,211 | | | | | — | |
| | | | | | | | | | | | | | | | | | | | |
Total | | | | $16,550,177 | | | | | $291,253 | | | | | $15,937,819 | | | | | $5,264,592 | |
| | | | | | | | | | | | | | | | | | | | |
126
5. Components of Net Assets on a Tax Basis
As of Nov. 30, 2018, the components of net assets on a tax basis were as follows:
| | | | | | | | | | | | | | | | | | | | |
| | | Delaware
Emerging
Markets Fund | | Delaware Global
Value Fund | | Delaware
International
Small Cap Fund | | Delaware
International
Value Equity Fund |
Shares of beneficial interest | | | $ | 5,237,765,447 | | | | $ | 11,861,638 | | | | $ | 89,713,090 | | | | $ | 305,797,730 | |
Undistributed ordinary income | | | | 13,570,703 | | | | | 191,651 | | | | | 1,657 | | | | | 6,619,443 | |
Undistributed long-term capital gains | | | | — | | | | | 444,045 | | | | | — | | | | | — | |
Capital loss carryforwards | | | | (18,389,142 | ) | | | | — | | | | | (7,322,344 | ) | | | | (7,337,402 | ) |
Unrealized appreciation (depreciation) of investments and foreign currencies | | | | (97,184,854 | ) | | | | 1,901,008 | | | | | (4,653,187 | ) | | | | (8,484,649 | ) |
| | | | | | | | | | | | | | | | | | | | |
Net assets | | | $ | 5,135,762,154 | | | | $ | 14,398,342 | | | | $ | 77,739,216 | | | | $ | 296,595,122 | |
| | | | | | | | | | | | | | | | | | | | |
The differences between book basis and tax basis components of net assets are primarily attributable to tax deferral of losses on wash sales, tax treatment of forward currency contracts, and tax treatment of passive foreign investment companies.
For financial reporting purposes, capital accounts are adjusted to reflect the tax character of permanent book/tax differences. Reclassifications are primarily due to net operating losses. Results of operations and net assets were not affected by these reclassifications. For year ended Nov. 30, 2018, the Funds recorded the following reclassifications:
| | | | | |
| | | Delaware International
Small Cap Fund |
| |
Total distributable earnings (loss) | | | $ | 12,530 | |
Paid in capital | | | | (12,530 | ) |
Delaware Emerging Markets Fund, Delaware Global Value Fund and Delaware International Value Equity Fund had no reclassifications.
127
Notes to financial statements
Delaware International Funds
5. Components of Net Assets on a Tax Basis (continued)
For federal income tax purposes, capital loss carryforwards may be carried forward and applied against future capital gains. In 2018, the Funds utilized capital loss carryforwards as follows:
| | | | |
Delaware Emerging Markets Fund | | | $42,072,135 | |
Delaware Global Value Fund | | | 396,485 | |
Delaware International Value Equity Fund | | | 5,711,919 | |
Delaware International Small Cap Fund did not utilized capital loss carryforward for 2018.
Under the Regulated Investment Company Modernization Act of 2010 (Act), net capital losses recognized for tax years beginning after Dec. 22, 2010 may be carried forward indefinitely, and their character is retained as short-term and/or long-term losses. Previously, net capital losses were carried forward for eight years and treated as short-term losses. As a transition rule, the Act requires that post-enactment net capital losses be used beforepre-enactment net capital losses. Capital loss carryforwards available to offset future realized capital gains for the Funds are as follows:
| | | | | | | | | | | | | | | | | | | | |
| | | Pre-enactment capital loss
Expiration date | | No expiration
Post-enactment capital loss character | | |
| | | 2019 | | Short-term | | Long-term | | Total |
Delaware Emerging Markets Fund | | | $ | — | | | | $ | 18,389,142 | | | | $ | — | | | | $ | 18,389,142 | |
Delaware International Small | | | | | | | | | | | | | | | | | | | | |
Cap Fund | | | | — | | | | | 7,322,344 | | | | | — | | | | | 7,322,344 | |
Delaware International Value | | | | | | | | | | | | | | | | | | | | |
Equity Fund | | | | 7,337,402 | | | | | — | | | | | — | | | | | 7,337,402 | |
Delaware Global Value Fund had no capital loss carryforwards.
128
6. Capital Shares
Transactions in capital shares were as follows:
| | | | | | | | | | | | | | | | |
| | | Delaware Emerging
Markets Fund | | | Delaware Global
Value Fund | |
| | | Year ended | | | Year ended | |
| | | 11/30/18 | | | 11/30/17 | | | 11/30/18 | | | 11/30/17 | |
| | | | |
Shares sold: | | | | | | | | | | | | | | | | |
Class A | | | 8,112,239 | | | | 13,346,314 | | | | 187,765 | | | | 81,858 | |
Class C | | | 3,234,819 | | | | 3,794,133 | | | | 10,459 | | | | 54,251 | |
Class R | | | 963,388 | | | | 1,492,045 | | | | — | | | | — | |
Institutional Class | | | 131,145,527 | | | | 141,062,624 | | | | 34,927 | | | | 76,454 | |
Class R6 | | | 19,988,356 | | | | 7,221,734 | | | | — | | | | — | |
| | |
Shares issued upon reinvestment of dividends and distributions: | | | | | | | | | |
Class A | | | 343,651 | | | | 220,484 | | | | 11,389 | | | | 17,840 | |
Class C | | | 105,622 | | | | 6,850 | | | | 1,661 | | | | 3,917 | |
Class R | | | 40,799 | | | | 11,829 | | | | — | | | | — | |
Institutional Class | | | 2,553,380 | | | | 657,021 | | | | 2,195 | | | | 2,370 | |
Class R6 | | | 88,515 | | | | 938 | | | | — | | | | — | |
| | | | | | | | | | | | | | | | |
| | | 166,576,296 | | | | 167,813,972 | | | | 248,396 | | | | 236,690 | |
| | | | | | | | | | | | | | | | |
| | | |
Shares redeemed: | | | | | | | | | | | | | |
Class A | | | (11,368,630 | ) | | | (22,151,536 | ) | | | (223,319 | ) | | | (204,600 | ) |
Class C | | | (4,121,589 | ) | | | (2,489,522 | ) | | | (215,299 | ) | | | (99,255 | ) |
Class R | | | (1,285,419 | ) | | | (946,132 | ) | | | — | | | | — | |
Institutional Class | | | (88,452,696 | ) | | | (41,595,939 | ) | | | (83,530 | ) | | | (46,989 | ) |
Class R6 | | | (4,856,387 | ) | | | (329,177 | ) | | | — | | | | — | |
| | | | | | | | | | | | | | | | |
| | | (110,084,721 | ) | | | (67,512,306 | ) | | | (522,148 | ) | | | (350,844 | ) |
| | | | | | | | | | | | | | | | |
Net increase (decrease) | | | 56,491,575 | | | | 100,301,666 | | | | (273,752 | ) | | | (114,154 | ) |
| | | | | | | | | | | | | | | | |
129
Notes to financial statements
Delaware International Funds
6. Capital Shares (continued)
| | | | | | | | | | | | | | | | |
| | | Delaware International
Small Cap Fund | | | Delaware International
Value Equity Fund | |
| | | Year ended | | | Year ended | |
| | | 11/30/18 | | | 11/30/17 | | | 11/30/18 | | | 11/30/17 | |
| | | | |
Shares sold: | | | | | | | | | | | | | | | | |
Class A | | | 800,917 | | | | 589,389 | | | | 1,248,179 | | | | 1,196,983 | |
Class C | | | 368,089 | | | | 179,426 | | | | 143,866 | | | | 334,496 | |
Class R | | | 3,007 | | | | 2,717 | | | | 179,220 | | | | 157,796 | |
Institutional Class | | | 14,005,419 | | | | 1,892,825 | | | | 5,129,280 | | | | 4,644,421 | |
Class R6 | | | 390,636 | | | | 283 | | | | 130 | | | | — | |
| | |
Shares issued upon reinvestment of dividends and distributions: | | | | | | | | | |
Class A | | | 57,668 | | | | 1,742,977 | | | | 63,518 | | | | 84,637 | |
Class C | | | 36,914 | | | | 633,577 | | | | 11,177 | | | | 22,347 | |
Class R | | | 524 | | | | 6,930 | | | | 2,816 | | | | 2,482 | |
Institutional Class | | | 67,883 | | | | 496,539 | | | | 247,859 | | | | 290,020 | |
Class R6 | | | 11 | | | | — | | | | — | | | | — | |
| | | | | | | | | | | | | | | | |
| | | 15,731,068 | | | | 5,544,663 | | | | 7,026,045 | | | | 6,733,182 | |
| | | | | | | | | | | | | | | | |
| | | | |
Shares redeemed: | | | | | | | | | | | | | | | | |
Class A | | | (881,532 | ) | | | (1,580,440 | ) | | | (977,084 | ) | | | (1,162,696 | ) |
Class C | | | (328,098 | ) | | | (294,061 | ) | | | (896,233 | ) | | | (663,928 | ) |
Class R | | | (1,914 | ) | | | (243 | ) | | | (142,021 | ) | | | (62,204 | ) |
Institutional Class | | | (7,136,954 | ) | | | (1,639,643 | ) | | | (3,539,542 | ) | | | (3,256,911 | ) |
Class R6 | | | (8,117 | ) | | | — | | | | — | | | | — | |
| | | | | | | | | | | | | | | | |
| | | (8,356,615 | ) | | | (3,514,387 | ) | | | (5,554,880 | ) | | | (5,145,739 | ) |
| | | | | | | | | | | | | | | | |
Net increase | | | 7,374,453 | | | | 2,030,276 | | | | 1,471,165 | | | | 1,587,443 | |
| | | | | | | | | | | | | | | | |
130
For each Fund, certain shareholders may exchange shares of one class for shares of another class in the same Fund. For the years ended Nov. 30, 2018 and 2017, exchange transactions for each Fund were as follows:
| | | | | | | | | | | | | | | | | | | | | | | | | | | | | | | | |
| | | | | | | | | | | | Year ended 11/30/18 | | | | | | | | | | |
| | | Exchange Redemptions | | | Exchange Subscriptions | | | | |
| | | | | | | | | Institutional | | | | | | | | | Institutional | | | | | | | |
| | | Class A | | | Class C | | | Class | | | Class R6 | | | Class A | | | Class | | | Class R6 | | | | |
| | | Shares | | | Shares | | | Shares | | | Shares | | | Shares | | | Shares | | | Shares | | | Value | |
Delaware Emerging Markets Fund | | | 354,242 | | | | 108,891 | | | | 1,653,340 | | | | 16,474 | | | | 94,004 | | | | 375,462 | | | | 1,653,339 | | | $ | 40,425,826 | |
Delaware Global Value Fund | | | — | | | | 34,222 | | | | — | | | | — | | | | 31,917 | | | | 1,556 | | | | — | | | | 430,683 | |
Delaware International Small Cap Fund | | | 114 | | | | 6,349 | | | | — | | | | — | | | | 5,365 | | | | 109 | | | | — | | | | 44,286 | |
Delaware International Value Equity Fund | | | 645 | | | | 75,112 | | | | — | | | | — | | | | 71,625 | | | | 2,859 | | | | — | | | | 1,113,027 | |
| | |
| | | | | | Year ended 11/30/17 | |
| | | | | | Exchange Redemptions | | | | | | Exchange Subscriptions | | | | |
| | | | | | | | | | | | Institutional | | | | | | Institutional | | | | | | | |
| | | | | | Class A | | | Class C | | | Class | | | Class A | | | Class | | | Class R6 | | | | |
| | | | | | Shares | | | Shares | | | Shares | | | Shares | | | Shares | | | Shares | | | Value | |
Delaware Emerging Markets Fund | | | | | | | 11,513,880 | | | | 23,829 | | | | 3,511,618 | | | | 8,719 | | | | 11,447,912 | | | | 3,506,199 | | | $ | 293,875,364 | |
Delaware Global Value Fund | | | | | | | 7,161 | | | | 7,565 | | | | — | | | | 236 | | | | 14,297 | | | | — | | | | 176,654 | |
Delaware International Small Cap Fund | | | | | | | 197,989 | | | | 5,915 | | | | — | | | | — | | | | 194,964 | | | | — | | | | 1,229,836 | |
Delaware International Value Equity Fund | | | | | | | 181,758 | | | | 329,299 | | | | — | | | | 7,718 | | | | 496,658 | | | | — | | | | 6,956,220 | |
These exchange transactions are included as subscriptions and redemptions in the tables on the previous pages and on the “Statements of changes in net assets.”
7. Line of Credit
Each Fund, along with certain other funds in the Delaware Funds (Participants), was a participant in a $155,000,000 revolving line of credit intended to be used for temporary or emergency purposes as an additional source of liquidity to fund redemptions of investor shares. Under the agreement, the Participants were charged an annual commitment fee of 0.15%, which was allocated across the Participants based on a weighted average of the respective net assets of each Participant. The revolving line of credit available was reduced from $155,000,000 to $130,000,000 on Sept. 6, 2018. The Participants were permitted to borrow up to a maximum ofone-third of their net assets under the
131
Notes to financial statements
Delaware International Funds
7. Line of Credit (continued)
agreement. Each Participant was individually, and not jointly, liable for its particular advances, if any, under the line of credit. The line of credit available under the agreement expired on Nov. 5, 2018.
On Nov. 5, 2018, each Fund, along with the other Participants, entered into an amendment to the agreement for a $190,000,000 revolving line of credit. The revolving line of credit available was increased from $190,000,000 to $220,000,000 on Nov. 29, 2018. The revolving line of credit is to be used as described above and operated in substantially the same manner as the original agreement. The line of credit available under the agreement expires on Nov. 4, 2019.
The Funds had no amounts outstanding as of Nov. 30, 2018, or at any time during the year then ended.
8. Derivatives
US GAAP requires disclosures that enable investors to understand: (1) how and why an entity uses derivatives; (2) how they are accounted for; and (3) how they affect an entity’s results of operations and financial position.
Foreign Currency Exchange Contracts– Each Fund may enter into foreign currency exchange contracts and foreign cross currency exchange contracts as a way of managing foreign exchange rate risk. Each Fund may enter into these contracts to fix the US dollar value of a security that it has agreed to buy or sell for the period between the date the trade was entered into and the date the security is delivered and paid for. Each Fund may also use these contracts to hedge the US dollar value of securities it already owns that are denominated in foreign currencies. In addition, each Fund may enter into these contracts to facilitate or expedite the settlement of portfolio transactions. The change in value is recorded as an unrealized gain or loss. When the contract is closed, a realized gain or loss is recorded equal to the difference between the value of the contract at the time it was opened and the value at the time it was closed.
The use of foreign currency exchange contracts and foreign cross currency exchange contracts does not eliminate fluctuations in the underlying prices of the securities, but does establish a rate of exchange that can be achieved in the future. Although foreign currency exchange contracts and foreign cross currency exchange contracts limit the risk of loss due to an unfavorable change in the value of the hedged currency, they also limit any potential gain that might result should the value of the currency change favorably. In addition, each Fund could be exposed to risks if the counterparties to the contracts are unable to meet the terms of their contracts. Each Fund’s maximum risk of loss from counterparty credit risk is the value of its currency exchanged with the counterparty. The risk is generally mitigated by having a netting arrangement between each Fund and the counterparty and by the posting of collateral by the counterparty to the Fund to cover each Fund’s exposure to the counterparty.
During the year ended Nov. 30, 2018, Delaware Emerging Markets Fund and Delaware International Small Cap Fund entered into foreign currency exchange contracts and foreign cross currency exchange contracts to facilitate or expedite the settlement of portfolio transactions. Delaware Global Value Fund and Delaware International Value Equity Fund entered into foreign currency exchange contracts and foreign cross currency contracts in order to fix the US dollar value of a security between the trade date and settlement date and to facilitate or expedite the settlement of portfolio transactions.
132
During the year ended Nov. 30, 2018, the Funds experienced net realized and unrealized gains or losses attributable to foreign currency holdings, which are disclosed on the “Statements of assets and liabilities” and “Statements of operations.”
Derivatives Generally. The table below summarizes the average balance of derivative holdings by each Fund during the year ended Nov. 30, 2018.
| | | | | | | | |
| | | Long Derivatives Volume |
| | | Delaware Emerging
Markets Fund | | Delaware Global
Value Fund | | Delaware International
Small Cap Fund | | Delaware International
Value Equity Fund |
| Foreign currency exchange contracts (average cost) | | $2,026,503 | | $13,171 | | $482,882 | | $404,578 |
| |
| | | Short Derivatives Volume |
| | | Delaware Emerging
Markets Fund | | Delaware Global
Value Fund | | Delaware International
Small Cap Fund | | Delaware International
Value Equity Fund |
| Foreign currency exchange contracts (average cost) | | $490,388 | | $19,416 | | $241,573 | | $222,025 |
9. Offsetting
Each Fund entered into an International Swaps and Derivatives Association, Inc. Master Agreement (ISDA Master Agreement) or a similar agreement with certain of their derivative contract counterparties in order to better define their contractual rights and to secure rights that will help each Fund mitigate its counterparty risk. An ISDA Master Agreement is a bilateral agreement between each Fund and a counterparty that governs certainover-the-counter (OTC) derivatives and foreign exchange contracts and typically contains, among other things, collateral posting items and netting provisions in the event of a default and/or termination event. Under an ISDA Master Agreement, each Fund may, under certain circumstances, offset with the counterparty certain derivative financial instruments’ payables and/or receivables with collateral held and/or posted and create one single net payment. The provisions of the ISDA Master Agreement typically permit a single net payment in the event of default(close-out), including the bankruptcy or insolvency of the counterparty. However, bankruptcy or insolvency laws of a particular jurisdiction may impose restrictions on or prohibitions against the right of offset in bankruptcy, insolvency, or other events.
For financial reporting purposes, the Funds do not offset derivative assets and derivative liabilities that are subject to netting arrangements on the “Statements of assets and liabilities.”
133
Notes to financial statements
Delaware International Funds
9. Offsetting (continued)
At Nov. 30, 2018, the Funds had the following assets and liabilities subject to offsetting provisions:
Offsetting of Financial Assets and Liabilities and Derivative Assets and Liabilities
| | | | | | | | | | | | | | | |
| | | Delaware Emerging Markets Fund |
Counterparty | | Gross Value of
Derivative Asset | | Gross Value of
Derivative Liability | | Net Position |
| | | |
BNY Mellon | | | $ | — | | | | $ | (689 | ) | | | $ | (689 | ) |
| | | | | | | | | | | | | | | |
| | | | | | | | | | | | | | | | | | | | | | | | | | | | | | |
| | | | | | |
Counterparty | | Net Position | | Fair Value of
Non-Cash
Collateral Received(a) | | Cash Collateral
Received | | Fair Value of
Non-Cash
Collateral Pledged | | Cash Collateral
Pledged | | Net
Exposure(b) |
BNY Mellon | | | $ | (689 | ) | | | $ | — | | | | $ | — | | | | $ | — | | | | $ | — | | | | $ | (689 | ) |
| | | | | | | | | | | | | | | | | | | | | | | | | | | | | | |
| | | | | | | | | | | | | | | |
| |
| | | Delaware Global Value Fund |
Counterparty | | Gross Value of
Derivative Asset | | Gross Value of
Derivative Liability | | Net Position |
BNY Mellon | | | $ | — | | | | $ | (65 | ) | | | $ | (65 | ) |
| | | | | | | | | | | | | | | |
| | | | | | | | | | | | | | | | | | | | | | | | | | | | | | |
| | | | | | |
Counterparty | | Net Position | | Fair Value of
Non-Cash
Collateral Received(a) | | Cash Collateral
Received | | Fair Value of
Non-Cash
Collateral Pledged | | Cash Collateral
Pledged | | Net
Exposure(b) |
BNY Mellon | | | $ | (65 | ) | | | $ | — | | | | $ | — | | | | $ | — | | | | $ | — | | | | $ | (65 | ) |
| | | | | | | | | | | | | | | | | | | | | | | | | | | | | | |
| | | | | | | | | | | | | | | |
| |
| | | Delaware International Small Cap Fund |
Counterparty | | Gross Value of
Derivative Asset | | Gross Value of
Derivative Liability | | Net Position |
BNY Mellon | | | $ | 1,345 | | | | $ | (9,138 | ) | | | $ | (7,793 | ) |
| | | | | | | | | | | | | | | |
| | | | | | | | | | | | | | | | | | | | | | | | | | | | | | |
| | | | | | |
Counterparty | | Net Position | | Fair Value of
Non-Cash
Collateral Received(a) | | Cash Collateral
Received | | Fair Value of
Non-Cash
Collateral Pledged | | Cash Collateral
Pledged | | Net
Exposure(b) |
BNY Mellon | | | $ | (7,793 | ) | | | $ | — | | | | $ | — | | | | $ | — | | | | $ | — | | | | $ | (7,793 | ) |
| | | | | | | | | | | | | | | | | | | | | | | | | | | | | | |
| | | | | | | | | | | | | | | |
| |
| | | Delaware International Value Equity Fund |
Counterparty | | Gross Value of
Derivative Asset | | Gross Value of
Derivative Liability | | Net Position |
BNY Mellon | | | $ | — | | | | $ | (2,634 | ) | | | $ | (2,634 | ) |
| | | | | | | | | | | | | | | |
| | | | | | | | | | | | | | | | | | | | | | | | | | | | | | |
| | | | | | |
Counterparty | | Net
Position | | Fair Value of
Non-Cash
Collateral Received | | Cash
Collateral
Received | | Fair Value of
Non-Cash
Collateral Pledged | | Cash Collateral
Pledged | | Net
Exposure(b) |
BNY Mellon | | | $ | (2,634 | ) | | | $ | — | | | | $ | — | | | | $ | — | | | | $ | — | | | | $ | (2,634 | ) |
| | | | | | | | | | | | | | | | | | | | | | | | | | | | | | |
Securities Lending
Securities lending transactions are entered into by the Funds under Master Securities Lending Agreements (each, an “MSLA”) which provide the right, in the event of default (including bankruptcy or
134
insolvency), for thenon-defaulting party to liquidate the collateral and calculate a net exposure to the defaulting party or request additional collateral. In the event that a borrower defaults, the Funds, as lender, would offset the market value of the collateral received against the market value of the securities loaned. When the value of the collateral is greater than that of the market value of the securities loaned, the lender is left with a net amount payable to the defaulting party. However, bankruptcy or insolvency laws of a particular jurisdiction may impose restrictions on or prohibitions against such a right of offset in the event of an MSLA counterparty’s bankruptcy or insolvency. Under the MSLA, the borrower can resell orre-pledge the loaned securities, and the Funds can reinvest cash collateral, or, upon an event of default, resell orre-pledge the collateral (see also Note 10).
As of Nov. 30, 2018, the following table is a summary of the Funds’ securities lending agreements by counterparty which are subject to offset under an MSLA:
| | | | | | | | |
| | | Delaware Global Value Fund | | |
Counterparty | | Securities
Loaned
at Value | | Cash Collateral
Received -
Invested in
Securities | | Fair Value of
Non-Cash
Collateral Received(a) | | Net
Exposure(b) |
BNY Mellon | | $251,692 | | $— | | $(251,692) | | $— |
(a)The value of the related collateral exceeded the value of the net position, and securities loaned at value, as applicable, as of Nov. 30, 2018.
(b)Net exposure represents the receivable (payable) that would be due from (to) the counterparty in the event of default.
10. Securities Lending
Each Fund, along with other funds in the Delaware Funds, may lend its securities pursuant to a security lending agreement (Lending Agreement) with The Bank of New York Mellon (BNY Mellon). At the time a security is loaned, the borrower must post collateral equal to the required percentage of the market value of the loaned security, including any accrued interest. The required percentage is: (1) 102% with respect to US securities and foreign securities that are denominated and payable in US dollars; and (2) 105% with respect to foreign securities. With respect to each loan, if on any business day the aggregate market value of securities collateral plus cash collateral held is less than the aggregate market value of the securities which are the subject of such loan, the borrower will be notified to provide additional collateral by the end of the following business day, which, together with the collateral already held, will be not less than the applicable initial collateral requirements for such security loan. If the aggregate market value of securities collateral and cash collateral held with respect to a security loan exceeds the applicable initial collateral requirement, upon the request of the borrower, BNY Mellon must return enough collateral to the borrower by the end of the following business day to reduce the value of the remaining collateral to the applicable initial collateral requirement for such security loan. As a result of the foregoing, the value of the collateral held with respect to a loaned security on any particular day may be more or less than the value of the security on loan. The collateral percentage with respect to the market value of the loaned security is determined by the security lending agent.
Cash collateral received by each fund of the Trust is generally invested in a series of individual separate accounts, each corresponding to a fund. The investment guidelines permit each separate account to
135
Notes to financial statements
Delaware International Funds
10. Securities Lending (continued)
hold certain securities that would be considered eligible securities for a money market fund. Cash collateral received is generally invested in government securities; certain obligations issued by government sponsored enterprises; repurchase agreements collateralized by US Treasury securities; obligations issued by the central government of any Organization for Economic Cooperation and Development (OECD) country or its agencies, instrumentalities or establishments; obligations of supranational organizations; commercial paper, notes, bonds and other debt obligations; certificates of deposit, time deposits, and other bank obligations; and asset-backed securities as disclosed on the “Schedule of investments.” Securities purchased with cash collateral are valued at the market value. Each Fund can also accept US government securities and letters of credit(non-cash collateral) in connection with securities loans.
In the event of default or bankruptcy by the lending agent, realization and/or retention of the collateral may be subject to legal proceedings. In the event the borrower fails to return loaned securities and the collateral received is insufficient to cover the value of the loaned securities and provided such collateral shortfall is not the result of investment losses, the lending agent has agreed to pay the amount of the shortfall to each Fund or, at the discretion of the lending agent, replace the loaned securities. Each Fund continues to record dividends or interest, as applicable, on the securities loaned and are subject to changes in value of the securities loaned that may occur during the term of the loan. Each Fund has the right under the Lending Agreement to recover the securities from the borrower on demand. With respect to security loans collateralized bynon-cash collateral, each Fund receives loan premiums paid by the borrower. With respect to security loans collateralized by cash collateral, the earnings from the collateral investments are shared among each Fund, the security lending agent, and the borrower. Each Fund records security lending income net of allocations to the security lending agent and the borrower.
Each Fund may incur investment losses as a result of investing securities lending collateral. This could occur if an investment in the collateral investment account defaulted or became impaired. Under those circumstances, the value of each Fund’s cash collateral account may be less than the amount each Fund would be required to return to the borrowers of the securities and each Fund would be required to make up for this shortfall.
The following table reflects a breakdown of security lending collateral accounted for as secured borrowings, the gross obligation by the type of collateral pledged, and the remaining contractual maturity of those transactions as of Nov. 30, 2018:
| | | | | | | | | | | | | | | | | | | | |
| | | Remaining Contractual Maturity of the Agreements as of
Nov. 30, 2018 | | | | |
Securities Lending Collateral | | Overnight
and
Continuous | | | Under
30 days | | | Between
30 & 90 days | | | Over
90 days | | | Total | |
Delaware International Value Equity Fund Repurchase Agreements | | | $1,084 | | | | $— | | | | $— | | | | $— | | | | $1,084 | |
136
At Nov. 30, 2018, the values of securities on loan and the values of invested collateral for each Fund are presented below, for which cash collateral was received and invested in accordance with the MSLA. These investments are presented on the “Schedules of investments” under the caption “Securities Lending Collateral.”
| | | | | | | | | | |
| | | Delaware
Global
Value Fund | | Delaware
International
Value
Equity Fund |
Values of securities on loan | | | $ | 251,692 | | | | $ | — | |
Values ofnon-cash collateral | | | | 257,500 | | | | | — | |
Values of invested collateral | | | | — | | | | | 1,084 | |
During the year ended Nov. 30, 2018, Delaware Emerging Markets Fund and Delaware International Small Cap Fund had no securities out on loan.
11. Credit and Market Risk
Delaware Emerging Markets Fund invests a significant portion of its assets in the greater China region, which consists of Hong Kong, the People’s Republic of China, and Taiwan, among other countries. As a result, the Fund’s investments in the region are particularly susceptible to risks in that region. Adverse events in any one country within the region may impact the other countries in the region or Asia as a whole. As a result, adverse events in the region will generally have a greater effect on the Fund than if the Fund were more geographically diversified, which could result in greater volatility in the Fund’s net asset value and losses. Markets in the greater China region can experience significant volatility due to social, economic, regulatory, and political uncertainties.
Some countries in which the Funds may invest require governmental approval for the repatriation of investment income, capital, or the proceeds of sales of securities by foreign investors. In addition, if there is deterioration in a country’s balance of payments or for other reasons, a country may impose temporary restrictions on foreign capital remittances abroad.
The securities exchanges of certain foreign markets are substantially smaller, less liquid, and more volatile than the major securities markets in the US. Consequently, acquisition and disposition of securities by each Fund may be inhibited. In addition, a significant portion of the aggregate market value of equity securities listed on the major securities exchanges in emerging markets is held by a smaller number of investors. This may limit the number of shares available for acquisition or disposition by each Fund.
Each Fund may invest up to 15% of its net assets in illiquid securities, which may include securities with contractual restrictions on resale, securities exempt from registration under Rule 144A promulgated under the Securities Act of 1933, as amended, and other securities which may not be readily marketable. The relative illiquidity of these securities may impair each Fund from disposing of them in a timely manner and at a fair price when it is necessary or desirable to do so. While maintaining oversight, each Board has delegated to DMC, theday-to-day functions of determining whether individual securities are liquid for purposes of each Fund’s limitation on investments in illiquid securities. Securities eligible for resale pursuant to Rule 144A, which are determined to be liquid, are not subject to each Fund’s 15%
137
Notes to financial statements
Delaware International Funds
11. Credit and Market Risk (continued)
limit on investments in illiquid securities. Rule 144A securities have been identified on the “Schedules of investments.” Restricted securities are valued pursuant to the security valuation procedures described in Note 1.
12. Contractual Obligations
Each Fund enters into contracts in the normal course of business that contain a variety of indemnifications. Each Fund’s maximum exposure under these arrangements is unknown. However, the Funds have not had prior claims or losses pursuant to these contracts. Management has reviewed each Fund’s existing contracts and expects the risk of loss to be remote.
13. Recent Accounting Pronouncements
In August 2018, the FASB issued an Accounting Standards Update, ASU2018-13, which changes certain fair value measurement disclosure requirements. The ASU2018-13, in addition to other modifications and additions, removes the requirement to disclose the amount and reasons for transfers between Level 1 and Level 2 of the fair value hierarchy, the policy for the timing of transfers between levels and the valuation process for Level 3 fair value measurements. The ASU2018-13 is effective for fiscal years, and interim periods within those fiscal years, beginning after Dec. 15, 2019. At this time, management is evaluating the implications of these changes on the financial statements.
In August 2018, the Securities and Exchange Commission (SEC) adopted amendments to RegulationS-X to update and simplify the disclosure requirements for registered investment companies by eliminating requirements that are redundant or duplicative of US GAAP requirements or other SEC disclosure requirements. The new amendments require the presentation of the total, rather than the components, of distributable earnings on the “Statements of assets and liabilities” and the total, rather than the components, of dividends from net investment income and distributions from net realized gains on the “Statements of changes in net assets.” The amendments also removed the requirement for the parenthetical disclosure of undistributed net investment income on the “Statements of changes in net assets” and certain tax adjustments that were reflected in the “Notes to financial statements.” All of these have been reflected in each Fund’s financial statements.
14. Subsequent Events
Management has determined that no material events or transactions occurred subsequent to Nov. 30, 2018, that would require recognition or disclosure in the Funds’ financial statements.
138
Report of independent
registered public accounting firm
To the Board of Trustees of Delaware Group® Global & International Funds and Shareholders of Delaware Emerging Markets Fund, Delaware Global Value Fund, Delaware International Small Cap Fund and Delaware International Value Equity Fund
Opinions on the Financial Statements
We have audited the accompanying statements of assets and liabilities, including the schedules of investments, of Delaware Emerging Markets Fund, Delaware Global Value Fund, Delaware International Small Cap Fund and Delaware International Value Equity Fund (constituting Delaware Group® Global & International Funds, hereafter collectively referred to as the “Funds”) as of November 30, 2018, the related statements of operations for the year ended November 30, 2018, the statements of changes in net assets for each of the two years in the period ended November 30, 2018, including the related notes, and the financial highlights for each of the periods indicated therein (collectively referred to as the “financial statements”). In our opinion, the financial statements present fairly, in all material respects, the financial position of each of the Funds as of November 30, 2018, the results of each of their operations for the year then ended, the changes in each of their net assets for each of the two years in the period ended November 30, 2018 and each of the financial highlights for each of the periods indicated therein in conformity with accounting principles generally accepted in the United States of America.
Basis for Opinions
These financial statements are the responsibility of the Funds’ management. Our responsibility is to express an opinion on the Funds’ financial statements based on our audits. We are a public accounting firm registered with the Public Company Accounting Oversight Board (United States) (PCAOB) and are required to be independent with respect to the Funds in accordance with the U.S. federal securities laws and the applicable rules and regulations of the Securities and Exchange Commission and the PCAOB.
We conducted our audits of these financial statements in accordance with the standards of the PCAOB. Those standards require that we plan and perform the audit to obtain reasonable assurance about whether the financial statements are free of material misstatement, whether due to error or fraud.
Our audits included performing procedures to assess the risks of material misstatement of the financial statements, whether due to error or fraud, and performing procedures that respond to those risks. Such procedures included examining, on a test basis, evidence regarding the amounts and disclosures in the financial statements. Our audits also included evaluating the accounting principles used and significant estimates made by management, as well as evaluating the overall presentation of the financial statements. Our procedures included confirmation of securities owned as of November 30, 2018 by correspondence with the custodian and brokers. We believe that our audits provide a reasonable basis for our opinions.
|
/s/ PricewaterhouseCoopers LLP Philadelphia, Pennsylvania January 22, 2019 |
We have served as the auditor of one or more investment companies in Delaware Funds® by Macquarie since 2010.
139
Other Fund information (Unaudited)
Delaware International Funds
Tax Information
The information set forth below is for each Fund’s fiscal year as required by federal income tax laws. Shareholders, however, must report distributions on a calendar year basis for income tax purposes, which may include distributions for portions of two fiscal years of a fund. Accordingly, the information needed by shareholders for income tax purposes will be sent to them in January of each year. Please consult your tax advisor for proper treatment of this information.
All disclosures are based on financial information available as of the date of this annual report and, accordingly are subject to change. For any and all items requiring reporting, it is the intention of each Fund to report the maximum amount permitted under the Internal Revenue Code and the regulations thereunder.
For the fiscal year ended Nov. 30, 2018, each Fund reports distributions paid during the year as follows:
| | | | | | | | | | | | | | | | |
| | | (A) Ordinary
Income
Distributions
(Tax Basis) | | | (B) Long-Term Capital Gain
Distributions (Tax Basis) | | | Total Distributions
(Tax Basis) | | | (C) Qualifying Dividends1 | |
Delaware Emerging Markets Fund | | | 100.00% | | | | — | | | | 100.00% | | | | — | |
Delaware Global Value Fund | | | 100.00% | | | | — | | | | 100.00% | | | | 83.07% | |
Delaware International Small Cap Fund | | | 50.81% | | | | 49.19% | | | | 100.00% | | | | — | |
Delaware International Value Equity Fund | | | 100.00% | | | | — | | | | 100.00% | | | | — | |
(A) and (B) are based on a percentage of each Fund’s total distributions.
(C) is based on a percentage of each Fund’s ordinary income distributions.
1Qualifying dividends represent dividends which qualify for the corporate dividends received deduction.
*For the fiscal year ended Nov. 30, 2018, certain dividends paid by each Fund may be subject to a maximum tax rate of 20%. The percentage of dividends paid by each Fund from ordinary income reported as dividend income is listed below. Complete information will be computed and reported in conjunction with your 2018 Form1099-DIV.
| | | | | | | | |
Delaware Emerging
Markets Fund | | | | Delaware Global
Value Fund | | | | Delaware
International Value Equity Fund |
69.81% | | | | 100.00% | | | | 100.00% |
There were no ordinary income for Delaware International Small Cap Fund.
140
Each Fund intends to pass through foreign tax credits in the maximum amount as follows:
| | | | | | | | |
Delaware Emerging
Markets Fund | | | | Delaware Global
Value Fund | | | | Delaware
International Value Equity Fund |
$10,350,142 | | | | $18,398 | | | | $627,959 |
There were no pass through foreign tax credits for Delaware International Small Cap Fund.
The gross foreign source income earned during the fiscal year 2018 by each Fund was as follows:
| | | | | | | | |
Delaware Emerging
Markets Fund | | | | Delaware Global
Value Fund | | | | Delaware
International Value Equity Fund |
$117,546,798 | | | | $359,021 | | | | $11,900,841 |
There were no foreign source income earned for Delaware International Small Cap Fund.
Board consideration of advisory agreements for Delaware Emerging Markets Fund, Delaware Global Value Fund, Delaware International Small Cap Fund, and Delaware International Value Equity Fund at a meeting held August15-16, 2018
At a meeting held on Aug.15-16, 2018 (the “Annual Meeting”), the Board of Trustees (the “Board”), including a majority of disinterested or independent Trustees, approved the renewal of the Investment Advisory Agreement for each of Delaware Emerging Markets Fund, Delaware Global Value Fund, Delaware International Small Cap Fund, and Delaware International Value Equity Fund (each, a “Fund” and together, the “Funds”). In making its decision, the Board considered information furnished at regular quarterly Board meetings, including reports detailing Fund performance, investment strategies, and expenses, as well as information prepared specifically in connection with the renewal of the investment advisory contracts. Information furnished specifically in connection with the renewal of the Investment Management Agreements with Delaware Management Company (“DMC”), a series of Macquarie Investment Management Business Trust (“MIMBT”), included materials provided by DMC and its affiliates (collectively, “Macquarie Investment Management”) concerning, among other things, the nature, extent, and quality of services provided to the Funds; the costs of such services to the Funds; economies of scale; and the investment manager’s financial condition and profitability. In addition, in connection with the Annual Meeting, materials were provided to the Trustees in May 2018, including reports provided by Broadridge Financial Solutions (“Broadridge”). The Broadridge reports compared each Fund’s investment performance and expenses with those of other comparable mutual funds. The Independent Trustees reviewed and discussed the Broadridge reports with independent legal counsel to the Independent Trustees. In addition to the information noted above, the Board also requested and received information regarding DMC’s policy with respect to advisory fee levels and its breakpoint philosophy; the structure of portfolio manager compensation; comparative client fee information; and any constraints or limitations on the availability of securities for certain investment styles, which had in the past year inhibited, or which were likely in the future to inhibit, the investment manager’s ability to invest fully in accordance with Fund policies.
In considering information relating to the approval of each Fund’s advisory agreement, the Independent Trustees received assistance and advice from and met separately with independent legal counsel to the
141
Other Fund information (Unaudited)
Delaware International Funds
Board consideration of advisory agreements for Delaware Emerging Markets Fund, Delaware Global Value Fund, Delaware International Small Cap Fund, and Delaware International Value Equity Fund at a meeting held August15-16, 2018 (continued)
Independent Trustees and also received assistance and advice from an experienced and knowledgeable independent fund consultant, JDL Consultants, LLC (“JDL”). Although the Board gave attention to all information furnished, the following discussion identifies, under separate headings, the primary factors taken into account by the Board during its contract renewal considerations.
Nature, extent, and quality of services.The Board considered the services provided by DMC to the Funds and their shareholders. In reviewing the nature, extent, and quality of services, the Board considered reports furnished to it throughout the year, which covered matters such as the relative performance of the Funds; compliance of portfolio managers with the investment policies, strategies, and restrictions for the Funds; compliance by DMC and Delaware Distributors, L.P. (together, “Management”) personnel with the Code of Ethics adopted throughout the Delaware Funds® by Macquarie (“Delaware Funds”); and adherence to fair value pricing procedures as established by the Board. The Board was pleased with the current staffing of DMC and the emphasis placed on research in the investment process. The Board recognized DMC’s receipt of certain favorable industry distinctions during the past several years. The Board gave favorable consideration to DMC’s efforts to control expenses while maintaining service levels committed to Fund matters. The Board also noted the benefits provided to Fund shareholders (a) through each shareholder’s ability to: (i) exchange an investment in one Delaware Fund for the same class of shares in another Delaware Fund without a sales charge, or (ii) reinvest Fund dividends into additional shares of the Fund or into additional shares of other Delaware Funds, and (b) the privilege to combine holdings in other Delaware Funds to obtain a reduced sales charge. The Board was satisfied with the nature, extent, and quality of the overall services provided by DMC.
Investment performance.The Board placed significant emphasis on the investment performance of the Funds in view of the importance of investment performance to shareholders. Although the Board considered performance reports and discussions with portfolio managers at Investment Committee meetings throughout the year, the Board gave particular weight to the Broadridge reports furnished for the Annual Meeting. The Broadridge reports prepared for each Fund showed the investment performance of its Class A shares in comparison to a group of similar funds as selected by Broadridge (the “Performance Universe”). A fund with the best performance ranked first, and a fund with the poorest performance ranked last. The highest/best performing 25% of funds in the Performance Universe make up the first quartile; the next 25%, the second quartile; the next 25%, the third quartile; and the poorest/worst performing 25% of funds in the Performance Universe make up the fourth quartile. Comparative annualized performance for each Fund was shown for the past1-,3-,5-, and10-year periods, to the extent applicable, ended Jan. 31, 2018. The Board’s objective is that each Fund’s performance for the1-,3-, and5-year periods be at or above the median of its Performance Universe.
Delaware Emerging Markets Fund – The Performance Universe for the Fund consisted of the Fund and all retail and institutional emerging markets funds as selected by Broadridge. The Broadridge report comparison showed that the Fund’s total return for the1-,3-,5-, and10-year periods was in the first quartile of its Performance Universe. The Board was very satisfied with performance.
142
Delaware Global Value Fund – The Performance Universe for the Fund consisted of the Fund and all retail and institutional globalmulti-cap value funds as selected by Broadridge. The Broadridge report comparison showed that the Fund’s total return for the1-year period was in the second quartile of its Performance Universe. The report further showed that the Fund’s total return for the3- and5-year periods was in the third quartile of its Performance Universe and the Fund’s total return for the10-year period was in the fourth quartile of its Performance Universe. The Board observed that the Fund’s intermediate- and long-term performance was not in line with the Board’s objective. In evaluating the Fund’s performance, however, the Board evaluated favorably the Fund’s short-term performance results.
Delaware International Small Cap Fund – The Performance Universe for the Fund consisted of the Fund and all retail and institutional internationalsmall-/mid-cap growth funds as selected by Broadridge. The Broadridge report comparison showed that the Fund’s total return for the1-,3-, and5-year periods, as well as the period since inception, was in the first quartile of its Performance Universe. The Board was very satisfied with performance.
Delaware International Value Equity Fund – The Performance Universe for the Fund consisted of the Fund and all retail and institutional internationalmulti-cap value funds as selected by Broadridge. The Broadridge report comparison showed that the Fund’s total return for the1-,5-, and10-year periods was in the second quartile of its Performance Universe. The report further showed that the Fund’s total return for the3-year period was in the first quartile of its Performance Universe. The Board was satisfied with performance.
Comparative expenses.The Board considered expense data for the Delaware Funds. Management provided the Board with information on pricing levels and fee structures for each Fund as of its most recently completed fiscal year. The Board also focused on the comparative analysis of effective management fees and total expense ratios of each Fund versus effective management fees and total expense ratios of a group of similar funds as selected by Broadridge (the “Expense Group”). In reviewing comparative costs, each Fund’s contractual management fee and the actual management fee incurred by each Fund were compared with the contractual management fees (assuming all funds in the Expense Group were similar in size to the Fund) and actual management fees (as reported by each fund) within the Expense Group, taking into account any applicable breakpoints and fee waivers. Each Fund’s total expenses were also compared with those of its Expense Group. The Broadridge total expenses, for comparative consistency, were shown by Broadridge for Class A shares and comparative total expenses including12b-1 andnon-12b-1 service fees. The Board’s objective is for each Fund’s total expense ratio to be competitive with those of the peer funds within its Expense Group.
Delaware Emerging Markets Fund – The expense comparisons for the Fund showed that its actual management fee and total expenses were in the quartile with the highest expenses of its Expense Group. The Board noted that the Fund’s management fee and total expenses were not in line with the Board’s objective. In evaluating total expenses, the Board considered fee waivers in place through March 2019 and various initiatives implemented by Management, such as the negotiation of lower fees for fund accounting, fund accounting oversight and custody services, which had created an opportunity for a further reduction in expenses. The Board was satisfied with Management’s efforts to improve the Fund’s total expense ratio and to bring it in line with the Board’s objective.
143
Other Fund information (Unaudited)
Delaware International Funds
Board consideration of advisory agreements for Delaware Emerging Markets Fund, Delaware Global Value Fund, Delaware International Small Cap Fund, and Delaware International Value Equity Fund at a meeting held August15-16, 2018 (continued)
Delaware Global Value Fund – The expense comparisons for the Fund showed that its actual management fee was in the quartile with the second lowest expenses of its Expense Group and its total expenses were in the quartile with the highest expenses of its Expense Group. The Board gave favorable consideration to the Fund’s management fee, but noted that the Fund’s total expenses were not in line with the Board’s objective. In evaluating total expenses, the Board considered fee waivers in place through March 2019 and various initiatives implemented by Management, such as the negotiation of lower fees for fund accounting, fund accounting oversight and custody services, which had created an opportunity for a further reduction in expenses. The Board was satisfied with Management’s efforts to improve the Fund’s total expense ratio and to bring it in line with the Board’s objective.
Delaware International Small Cap Fund – The expense comparisons for the Fund showed that its actual management fee was in the quartile with the lowest expenses of its Expense Group and its total expenses were in the quartile with the second lowest expenses of its Expense Group. The Board was satisfied with the management fee and total expenses of the Fund in comparison to those of its Expense Group as shown in the Broadridge report.
Delaware International Value Equity Fund – The expense comparisons for the Fund showed that its actual management fee and total expenses were in the quartile with the highest expenses of its Expense Group. The Board noted that the Fund’s management fee and total expenses were not in line with the Board’s objective. In evaluating total expenses, the Board considered fee waivers in place through March 2019 and various initiatives implemented by Management, such as the negotiation of lower fees for fund accounting, fund accounting oversight and custody services, which had created an opportunity for a further reduction in expenses. The Board was satisfied with Management’s efforts to improve the Fund’s total expense ratio and to bring it in line with the Board’s objective.
Management profitability.The Board considered the level of profits realized by DMC in connection with the operation of the Funds. In this respect, the Board reviewed the Investment Management Profitability Analysis that addressed the overall profitability of DMC’s business in providing management and other services to each of the individual funds and the Delaware Funds as a whole. Specific attention was given to the methodology used by DMC in allocating costs for the purpose of determining profitability. Management stated that the level of profits of DMC, to a certain extent, reflects recent operational cost savings and efficiencies initiated by DMC. The Board considered DMC’s efforts to improve services provided to Fund shareholders and to meet additional regulatory and compliance requirements resulting from recent industry-wide Securities and Exchange Commission initiatives. The Board also considered the extent to which DMC might derive ancillary benefits from fund operations, including the potential for procuring additional business as a result of the prestige and visibility associated with its role as service provider to the Delaware Funds and the benefits from allocation of fund brokerage to improve trading efficiencies. As part of its work, the Board also reviewed a report prepared by JDL regarding MIMBT profitability as compared to certain peer fund complexes and the Independent Trustees met with JDL personnel to discuss DMC’s profitability in such context. The Board found that the management fees were reasonable in light of the services rendered and the level of profitability of DMC.
144
Economies of scale.The Trustees considered whether economies of scale are realized by DMC as each Fund’s assets increase and the extent to which any economies of scale are reflected in the level of management fees charged. The Trustees reviewed each Fund’s advisory fee pricing and structure, approved by the Board and shareholders, which includes breakpoints, and which applies to most funds in the Delaware Funds complex. Breakpoints in the advisory fee occur when the advisory fee rate is reduced on assets in excess of specified levels. Breakpoints result in a lower advisory fee than would otherwise be the case in the absence of breakpoints, when the asset levels specified in the breakpoints are exceeded. The Board noted that, as of March 31, 2018, the Delaware Emerging Markets Fund’s assets exceeded the final breakpoint level. The Board believed that, given the extent to which economies of scale might be realized by DMC and its affiliates, the schedule of fees under the Investment Management Agreement provides a sharing of benefits with the Fund and its shareholders. Although, as of March 31, 2018, each of the Delaware Global Value Fund, Delaware International Small Cap Fund, and Delaware International Value Equity Fund had not reached a size at which it could take advantage of any breakpoints in the applicable fee schedule, the Board recognized that the Fund’s fee was structured so that, if the Fund increases sufficiently in size, then economies of scale may be shared.
145
Board of trustees / directors and officers addendum
Delaware Funds®by Macquarie
A mutual fund is governed by a Board of Trustees/Directors (“Trustees”), which has oversight responsibility for the management of a fund’s business affairs. Trustees establish procedures and oversee and review the performance of the investment manager, the distributor, and others who perform services for the fund. The independent fund trustees, in particular, are advocates
| | | | | | | | |
| | Name, Address, and Birth Date | | Position(s) Held with Fund(s) | | Length of Time Served | | |
| | Interested Trustee | | | | | | |
| | Shawn K. Lytle1,2 | | President, | | Trustee since | | |
| | 2005 Market Street | | Chief Executive Officer, | | September 2015 | | |
| | Philadelphia, PA 19103 | | and Trustee | | | | |
| | February 1970 | | | | President and | | |
| | | | | | | Chief Executive Officer | | |
| | | | | | since August 2015 | | |
| | Independent Trustees | | | | | | |
| | Thomas L. Bennett | | Chair and Trustee | | Trustee since | | |
| | 2005 Market Street | | | | March 2005 | | |
| | Philadelphia, PA 19103 | | | | | | |
| | October 1947 | | | | Chair since | | |
| | | | | | | March 2015 | | |
| | Jerome D. Abernathy | | Trustee | | Since January 2019 | | |
| | 2005 Market Street | | | | | | |
| | Philadelphia, PA 19103 | | | | | | |
| | | July 1959 | | | | | | |
| | Ann D. Borowiec | | Trustee | | Since March 2015 | | |
| | 2005 Market Street | | | | | | |
| | Philadelphia, PA 19103 | | | | | | |
| | | November 1958 | | | | | | |
| 1 | Shawn K. Lytle is considered to be an “Interested Trustee” because he is an executive officer of the Fund’s(s’) investment advisor. |
| 2 | Shawn K. Lytle, David F. Connor, Daniel V. Geatens, and Richard Salus serve in similar capacities for the six portfolios of the Optimum Fund Trust, which have the same investment advisor, principal underwriter, and transfer agent as the registrant. Mr. Geatens also serves as the Chief Financial Officer and Treasurer for Macquarie Global Infrastructure Total Return Fund Inc., which has an affiliated investment manager. |
146
for shareholder interests. Each trustee has served in that capacity since he or she was elected to or appointed to the Board of Trustees, and will continue to serve until his or her retirement or the election of a new trustee in his or her place. The following is a list of the Trustees and Officers with certain background and related information.
| | | | | | | | |
| | | | Number of Portfolios in | | | | |
| | Principal Occupation(s) | | Fund Complex Overseen | | Other Directorships | | |
| | During the Past Five Years | | by Trustee or Officer | | Held by Trustee or Officer | | |
| | | | | | | | |
| | President — Macquarie | | 59 | | Trustee — UBS | | |
| | Investment Management3 | | | | Relationship Funds, | | |
| | | (June 2015–Present) | | | | SMA Relationship | | |
| | | | | | Trust, and UBS Funds | | |
| | Regional Head of | | | | (May 2010–April 2015) | | |
| | Americas — UBS Global | | | | | | |
| | Asset Management | | | | | | |
| | (April 2010–May 2015) | | | | | | |
| | | | | | | | |
| | Private Investor | | 59 | | None | | |
| | (March 2004–Present) | | | | | | |
| | | | |
| | | | | | | | | |
| | Managing Member, | | 59 | | None | | |
| | Stonebrook Capital | | | | | | |
| | Management, LLC (financial | | | | | | |
| | technology: macro factors | | | | | | |
| | and databases) | | | | | | |
| | | (January 1993–Present) | | | | | | |
| | Chief Executive Officer, | | 59 | | Director — | | |
| | Private Wealth Management | | | | Banco Santander International | | |
| | (2011–2013) and | | | | (October 2016–Present) | | |
| | Market Manager, | | | | | | |
| | New Jersey Private | | | | Director — | | |
| | Bank (2005–2011) — | | | | Santander Bank, N.A. | | |
| | | J.P. Morgan Chase & Co. | | | | (December 2016–Present) | | |
| 3 | Macquarie Investment Management is the marketing name for Macquarie Management Holdings, Inc. and its subsidiaries, including the Fund’s(s’) investment advisor, principal underwriter, and its transfer agent. |
147
Board of trustees / directors and officers addendum
Delaware Funds®by Macquarie
| | | | | | | | |
| | Name, Address, | | Position(s) | | Length of | | |
| | and Birth Date | | Held with Fund(s) | | Time Served | | |
| | Independent Trustees (continued) | | | | |
| | Joseph W. Chow | | Trustee | | Since January 2013 | | |
| | 2005 Market Street | | | | | | |
| | | Philadelphia, PA 19103 | | | | | | |
| | | January 1953 | | | | | | |
| | | | |
| | John A. Fry | | Trustee | | Since January 2001 | | |
| | 2005 Market Street | | | | | | |
| | Philadelphia, PA 19103 | | | | | | |
| | May 1960 | | | | | | |
| | | | |
| | | | | | | | | |
| | | | |
| | Lucinda S. Landreth | | Trustee | | Since March 2005 | | |
| | 2005 Market Street | | | | | | |
| | Philadelphia, PA 19103 | | | | | | |
| | | June 1947 | | | | | | |
148
| | | | | | | | |
| | | | Number of Portfolios in | | | | |
| | Principal Occupation(s) | | Fund Complex Overseen | | Other Directorships | | |
| | During the Past Five Years | | by Trustee or Officer | | Held by Trustee or Officer | | |
| | | | | | | | |
| | | Private Investor | | 59 | | Director and Audit Committee | | |
| | (April 2011–Present) | | | | Member — Hercules | | |
| | | | | | Technology Growth | | |
| | | | | | Capital, Inc. | | |
| | | | | | | (July 2004–July 2014) | | |
| | President — | | 59 | | Director; Compensation | | |
| | Drexel University | | | | Committee and | | |
| | (August 2010–Present) | | | | Governance Committee | | |
| | | | | | Member — Community | | |
| | President — | | | | Health Systems | | |
| | Franklin & Marshall College | | | | | | |
| | (July 2002–July 2010) | | | | Director — Drexel | | |
| | | | | | Morgan & Co. | | |
| | | | |
| | | | | | Director; Audit Committee | | |
| | | | | | Member — vTv | | |
| | | | | | Therapeutics LLC | | |
| | | | |
| | | | | | Director; Audit Committee | | |
| | | | | | Member — FS Credit Real | | |
| | | | | | | Estate Income Trust, Inc. | | |
| | Private Investor | | 59 | | None | | |
| | (2004–Present) | | | | | | |
| | | | |
| | | | | | | | | |
149
Board of trustees / directors and officers addendum
Delaware Funds®by Macquarie
| | | | | | | | |
| | Name, Address, | | Position(s) | | Length of | | |
| | and Birth Date | | Held with Fund(s) | | Time Served | | |
| | Independent Trustees (continued) |
| | | Frances A. Sevilla-Sacasa | | Trustee | | Since September 2011 | | |
| | 2005 Market Street | | | | | | |
| | Philadelphia, PA 19103 | | | | | | |
| | January 1956 | | | | | | |
| | | | |
| | | | | | | | | |
| | Thomas K. Whitford | | Trustee | | Since January 2013 | | |
| | 2005 Market Street | | | | | | |
| | Philadelphia, PA 19103 | | | | | | |
| | March 1956 | | | | | | |
| | | | |
| | | | | | | | | |
150
| | | | | | | | |
| | | | Number of Portfolios in | | | | |
| | Principal Occupation(s) | | Fund Complex Overseen | | Other Directorships | | |
| | | During the Past Five Years | | by Trustee or Officer | | Held by Trustee or Officer | | |
| | | | | | | | |
| | Private Investor | | 59 | | Trust Manager and | | |
| | (January 2017–Present) | | | | Audit Committee | | |
| | | | | | Chair — Camden | | |
| | Chief Executive Officer — | | | | Property Trust | | |
| | Banco Itaú | | | | (August 2011–Present) | | |
| | International | | | | | | |
| | (April 2012–December 2016) | | | | Director — | | |
| | | | | | Carrizo Oil & Gas, Inc. | | |
| | Executive Advisor to Dean | | | | (March 2018–Present) | | |
| | (August 2011–March 2012) | | | | | | |
| | and Interim Dean | | | | | | |
| | (January 2011–July 2011) — | | | | | | |
| | University of Miami School of | | | | | | |
| | Business Administration | | | | | | |
| | | | |
| | President — U.S. Trust, | | | | | | |
| | Bank of America Private | | | | | | |
| | Wealth Management | | | | | | |
| | (Private Banking) | | | | | | |
| | | (July 2007–December 2008) | | | | | | |
| | Vice Chairman | | 59 | | Director — HSBC North | | |
| | (2010–April 2013) — | | | | America Holdings Inc. | | |
| | PNC Financial | | | | (December 2013–Present) | | |
| | Services Group | | | | | | |
| | | | | | Director — HSBC USA Inc. | | |
| | | | | | (July 2014–Present) | | |
| | | | |
| | | | | | Director — | | |
| | | | | | HSBC Bank USA, | | |
| | | | | | National Association | | |
| | | | | | (July 2014–March 2017) | | |
| | | | |
| | | | | | Director — HSBC | | |
| | | | | | Finance Corporation | | |
| | | | | | | (December 2013–April 2018) | | |
151
Board of trustees / directors and officers addendum
Delaware Funds®by Macquarie
| | | | | | | | |
| | Name, Address, | | Position(s) | | Length of | | |
| | and Birth Date | | Held with Fund(s) | | Time Served | | |
| | | Independent Trustees (continued) | | |
| | Christianna Wood | | Trustee | | Since January 2019 | | |
| | 2005 Market Street | | | | | | |
| | Philadelphia, PA 19103 | | | | | | |
| | August 1959 | | | | | | |
| | | | |
| | | | | | | | | |
| | Janet L. Yeomans | | Trustee | | Since April 1999 | | |
| | 2005 Market Street | | | | | | |
| | Philadelphia, PA 19103 | | | | | | |
| | July 1948 | | | | | | |
| | | | |
| | | | | | | | | |
152
| | | | | | | | |
| | | | Number of Portfolios in | | | | |
| | Principal Occupation(s) | | Fund Complex Overseen | | Other Directorships | | |
| | During the Past Five Years | | by Trustee or Officer | | Held by Trustee or Officer | | |
| | | | | | | | |
| | Chief Executive Officer | | 59 | | Director of H&R Block | | |
| | and President — | | | | Corporation | | |
| | | Gore Creek | | | | (July 2008–Present); | | |
| | Capital, Ltd. | | | | Director of Grange | | |
| | (August 2009–Present) | | | | Insurance (2013-Present); | | |
| | | | | | Trustee of Merger Fund | | |
| | | | | | (August 2009-Present), | | |
| | | | | | WCM Alternatives: | | |
| | | | | | Event-Driven Fund | | |
| | | | | | (March 2017-Present), | | |
| | | | | | and WCM Alternatives: | | |
| | | | | | Credit Event Fund | | |
| | | | | | | (December 2017-Present) | | |
| | Vice President and Treasurer | | 59 | | Director (2009–2017); | | |
| | (January 2006–July 2012), | | | | Personnel and Compensation | | |
| | Vice President — | | | | Committee Chair; Member of | | |
| | Mergers & Acquisitions | | | | Nominating, Investments, and | | |
| | (January 2003–January 2006), | | | | Audit Committees for various | | |
| | and Vice President | | | | periods throughout | | |
| | and Treasurer | | | | directorship — | | |
| | (July 1995–January 2003) — | | | | Okabena Company | | |
| | | 3M Company | | | | | | |
153
Board of trustees / directors and officers addendum
Delaware Funds®by Macquarie
| | | | | | | | |
| | Name, Address, | | Position(s) | | Length of | | |
| | and Birth Date | | Held with Fund(s) | | Time Served | | |
| | Officers |
| | David F. Connor | | Senior Vice President, | | Senior Vice President since | | |
| | | 2005 Market Street | | General Counsel, | | May 2013; General | | |
| | Philadelphia, PA 19103 | | and Secretary | | Counsel since May 2015; | | |
| | December 1963 | | | | Secretary since | | |
| | | | | | | October 2005 | | |
| | Daniel V. Geatens | | Vice President | | Vice President and | | |
| | 2005 Market Street | | and Treasurer | | Treasurer since October 2007 | | |
| | Philadelphia, PA 19103 | | | | | | |
| | | October 1972 | | | | | | |
| | Richard Salus | | Senior Vice President | | Senior Vice President and | | |
| | 2005 Market Street | | and Chief Financial Officer | | Chief Financial Officer | | |
| | Philadelphia, PA 19103 | | | | since November 2006 | | |
| | | October 1963 | | | | | | |
The Statement of Additional Information for the Fund(s) includes additional information about the Trustees and Officers and is available, without charge, upon request by calling 800523-1918.
154
| | | | | | | | |
| | | | Number of Portfolios in | | | | |
| | Principal Occupation(s) | | Fund Complex Overseen | | Other Directorships | | |
| | During the Past Five Years | | by Trustee or Officer | | Held by Trustee or Officer | | |
| | | | | | | | |
| | | David F. Connor has served | | 59 | | None2 | | |
| | in various capacities at | | | | | | |
| | different times at | | | | | | |
| | Macquarie Investment | | | | | | |
| | | Management. | | | | | | |
| | Daniel V. Geatens has served | | 59 | | None2 | | |
| | in various capacities at | | | | | | |
| | different times at | | | | | | |
| | Macquarie Investment | | | | | | |
| | | Management. | | | | | | |
| | Richard Salus has served | | 59 | | None2 | | |
| | in various executive capacities | | | | | | |
| | at different times at | | | | | | |
| | Macquarie Investment | | | | | | |
| | | Management. | | | | | | |
155
About the organization
| | | | | | |
| Board of trustees | | | | | | |
| | | |
Shawn K. Lytle President and Chief Executive Officer Delaware Funds® by Macquarie Philadelphia, PA Thomas L. Bennett Chairman of the Board Delaware Funds by Macquarie Private Investor Rosemont, PA Jerome D. Abernathy Managing Member Stonebrook Capital Management, LLC New York, NY | | Ann D. Borowiec Former Chief Executive Officer Private Wealth Management J.P. Morgan Chase & Co. New York, NY Joseph W. Chow Former Executive Vice President State Street Corporation Boston, MA John A. Fry President Drexel University Philadelphia, PA | | Lucinda S. Landreth Former Chief Investment Officer Assurant, Inc. New York, NY Frances A. Sevilla-Sacasa Former Chief Executive Officer Banco Itaú International Miami, FL | | Thomas K. Whitford Former Vice Chairman PNC Financial Services Group Pittsburgh, PA Christianna Wood Chief Executive Officer and President Gore Creek Capital, Ltd. Golden, CO Janet L. Yeomans Former Vice President and Treasurer 3M Company St. Paul, MN |
| | | |
| Affiliated officers | | | | | | |
| | | |
David F. Connor Senior Vice President, General Counsel, and Secretary Delaware Funds by Macquarie Philadelphia, PA | | Daniel V. Geatens Vice President and Treasurer Delaware Funds by Macquarie Philadelphia, PA | | Richard Salus Senior Vice President and Chief Financial Officer Delaware Funds by Macquarie Philadelphia, PA | | |
This annual report is for the information of Delaware Emerging Markets Fund, Delaware Global Value Fund, Delaware International Small Cap Fund, and Delaware International Value Equity Fund shareholders, but it may be used with prospective investors when preceded or accompanied by the Delaware Fund fact sheet for the most recently completed calendar quarter. These documents are available at delawarefunds.com/literature.
Each Fund files its complete schedule of portfolio holdings with the Securities and Exchange Commission (SEC) for the first and third quarters of each fiscal year on FormN-Q. Each Fund’s FormsN-Q, as well as a description of the policies and procedures that the Funds use to determine how to vote proxies (if any) relating to portfolio securities are available without charge (i) upon request, by calling 800523-1918; and (ii) on the SEC’s website at sec.gov. In addition, a description of the policies and procedures that the Funds use to determine how to vote proxies (if any) relating to portfolio securities and the Schedules of Investments included in the Funds’ most recent FormN-Q are available without charge on the Funds’ website at delawarefunds.com/literature. Each Fund’s FormN-Q may be reviewed and copied at the SEC’s Public Reference Room in Washington, D.C.; information on the operation of the Public Reference Room may be obtained by calling 800SEC-0330.
Information (if any) regarding how the Funds voted proxies relating to portfolio securities during the most recently disclosed12-month period ended June 30 is available without charge (i) through the Funds’ website at delawarefunds.com/proxy; and (ii) on the SEC’s website at sec.gov.
156
Item 2. Code of Ethics
Item 3. Audit Committee Financial Expert
The registrant’s Board of Trustees has determined that certain members of the registrant’s Audit Committee are audit committee financial experts, as defined below. For purposes of this item, an “audit committee financial expert” is a person who has the following attributes:
a. An understanding of generally accepted accounting principles and financial statements;
b. The ability to assess the general application of such principles in connection with the accounting for estimates, accruals, and reserves;
c. Experience preparing, auditing, analyzing, or evaluating financial statements that present a breadth and level of complexity of accounting issues that are generally comparable to the breadth and complexity of issues that can reasonably be expected to be raised by the registrant’s financial statements, or experience actively supervising one or more persons engaged in such activities;
d. An understanding of internal controls and procedures for financial reporting; and
e. An understanding of audit committee functions.
An “audit committee financial expert” shall have acquired such attributes through:
a. Education and experience as a principal financial officer, principal accounting officer, controller, public accountant, or auditor or experience in one or more positions that involve the performance of similar functions;
b. Experience actively supervising a principal financial officer, principal accounting officer, controller, public accountant, auditor, or person performing similar functions;
c. Experience overseeing or assessing the performance of companies or public accountants with respect to the preparation, auditing, or evaluation of financial statements; or
d. Other relevant experience.
The registrant’s Board of Trustees has also determined that each member of the registrant’s Audit Committee is independent. In order to be “independent” for purposes of this item, the Audit Committee member may not: (i) other than in his or her capacity as a member of the Board of Trustees or any committee thereof, accept directly or indirectly any consulting, advisory or other compensatory fee from the issuer; or (ii) be an “interested person” of the registrant as defined in Section 2(a)(19) of the Investment Company Act of 1940.
The names of the audit committee financial experts on the registrant’s Audit Committee are set forth below:
John A. Fry
Lucinda S. Landreth
Thomas K. Whitford
Christianna Wood
Janet L. Yeomans
Item 4. Principal Accountant Fees and Services
The aggregate fees billed for services provided to the registrant by its independent auditors for the audit of the registrant’s annual financial statements and for services normally provided by the independent auditors in connection with statutory and regulatory filings or engagements were $126,360 for the fiscal year ended November 30, 2018.
The aggregate fees billed for services provided to the registrant by its independent auditors for the audit of the registrant’s annual financial statements and for services normally provided by the independent auditors in connection with statutory and regulatory filings or engagements were $147,989 for the fiscal year ended November 30, 2017.
The aggregate fees billed by the registrant’s independent auditors for services relating to the performance of the audit of the registrant’s financial statements and not reported under paragraph (a) of this Item were $0 for the fiscal year ended November 30, 2018.
The aggregate fees billed by the registrant’s independent auditors for services relating to the performance of the audit of the registrant’s financial statements and not reported under paragraph (a) of this Item were $0 for the fiscal year ended November 30, 2017.
The aggregate fees billed by the registrant’s independent auditors for tax-related services provided to the registrant’s investment adviser and other service providers under common control with the adviser and that relate directly to the operations or financial reporting of the registrant were $0 for the registrant’s fiscal year ended November 30, 2018. The percentage of these fees relating to services approved by the registrant’s Audit Committee pursuant to the de minimis exception from the pre-approval requirement in Rule 2-01(c)(7)(i)(C) of Regulation S-X was 0%.
The aggregate fees billed by the registrant’s independent auditors for tax-related services provided to the registrant’s investment adviser and other service providers under common control with the adviser and that relate directly to the operations or financial reporting of the registrant were $0 for the registrant’s fiscal year ended November 30, 2017. The percentage of these fees relating to services approved by the registrant’s Audit Committee pursuant to the de minimis exception from the pre-approval requirement in Rule 2-01(c)(7)(i)(C) of Regulation S-X was 0%.
The aggregate fees billed for all services provided by the independent auditors to the registrant other than those set forth in paragraphs (a), (b) and (c) of this Item were $0 for the fiscal year ended November 30, 2018.
The aggregate fees billed for all services provided by the independent auditors to the registrant other than those set forth in paragraphs (a), (b) and (c) of this Item were $0 for the fiscal year ended November 30, 2017.
Under the Pre-Approval Policy, the Audit Committee has also pre-approved the services set forth in the table below with respect to the registrant’s investment adviser and other entities controlling, controlled by or under common control with the investment adviser that provide ongoing services to the registrant (the “Control Affiliates”) up to the specified fee limit. This fee limit is based on aggregate fees to the investment adviser and its Control Affiliates.
The Pre-Approval Policy requires the registrant’s independent auditors to report to the Audit Committee at each of its regular meetings regarding all services initiated since the last such report was rendered, including those services authorized by the Pre-Approval Policy.
(f) Not applicable.
(g) The aggregate non-audit fees billed by the registrant’s independent auditors for services rendered to the registrant and to its investment adviser and other service providers under common control with the adviser were $11,748,000 and $11,180,000 for the registrant’s fiscal years ended November 30, 2018 and November 30, 2017, respectively.
(h) In connection with its selection of the independent auditors, the registrant’s Audit Committee has considered the independent auditors’ provision of non-audit services to the registrant’s investment adviser and other service providers under common control with the adviser that were not required to be pre-approved pursuant to Rule 2-01(c)(7)(ii) of Regulation S-X. The Audit Committee has determined that the independent auditors’ provision of these services is compatible with maintaining the auditors’ independence.
Item 5. Audit Committee of Listed Registrants
Not applicable.
Item 6. Investments
(a) Included as part of report to shareholders filed under Item 1 of this Form N-CSR.
(b) Divestment of securities in accordance with Section 13(c) of the Investment Company Act of 1940.
Not applicable.
Item 7. Disclosure of Proxy Voting Policies and Procedures for Closed-End Management Investment Companies
Not applicable.
Item 8. Portfolio Managers of Closed-End Management Investment Companies
Not applicable.
Item 9. Purchases of Equity Securities by Closed-End Management Investment Company and Affiliated Purchasers
Not applicable.
Item 10. Submission of Matters to a Vote of Security Holders
Not applicable.
Item 11. Controls and Procedures
The registrant’s principal executive officer and principal financial officer have evaluated the registrant’s disclosure controls and procedures within 90 days of the filing of this report and have concluded that they are effective in providing reasonable assurance that the information required to be disclosed by the registrant in its reports or statements filed under the Securities Exchange Act of 1934 is recorded, processed, summarized and reported within the time periods specified in the rules and forms of the Securities and Exchange Commission.
There were no significant changes in the registrant’s internal control over financial reporting that occurred during the second fiscal quarter of the period covered by the report to stockholders included herein (i.e., the registrant’s fourth fiscal quarter) that have materially affected, or are reasonably likely to materially affect, the registrant’s internal control over financial reporting.
Item 12. Disclosure of Securities Lending Activities for Closed-End Management Investment Companies
Not applicable.
Item 13. Exhibits
(b) Certifications pursuant to Section 906 of the Sarbanes-Oxley Act of 2002 are furnished herewith as Exhibit 99.906CERT.
Pursuant to the requirements of the Securities Exchange Act of 1934 and the Investment Company Act of 1940, the registrant has duly caused this report to be signed on its behalf, by the undersigned, thereunto duly authorized.
Pursuant to the requirements of the Securities Exchange Act of 1934 and the Investment Company Act of 1940, this report has been signed below by the following persons on behalf of the registrant and in the capacities and on the dates indicated.