UNITED STATES SECURITIES AND EXCHANGE COMMISSION
Washington, D.C. 20549
FORM N-CSR
CERTIFIED SHAREHOLDER REPORT OF REGISTERED MANAGEMENT
INVESTMENT COMPANIES
| Investment Company Act file number: | 811-06324 | |
| Exact name of registrant as specified in charter: | Delaware Group® Global & International Funds | |
| Address of principal executive offices: | 610 Market Street | |
| Philadelphia, PA 19106 | ||
| Name and address of agent for service: | David F. Connor, Esq. | |
| 610 Market Street | ||
| Philadelphia, PA 19106 | ||
| Registrant’s telephone number, including area code: | (800) 523-1918 | |
| Date of fiscal year end: | November 30 | |
| Date of reporting period: | November 30, 2021 |
Item 1. Reports to Stockholders
Annual report | |
Global / international equity mutual funds
Delaware Emerging Markets Fund
Delaware International Small Cap Fund
Delaware International Value Equity Fund
November 30, 2021
Carefully consider the Funds’ investment objectives, risk factors, charges, and expenses before investing. This and other information can be found in the Funds’ prospectus and their summary prospectuses, which may be obtained by visiting delawarefunds.com/literature or calling 800 523-1918. Investors should read the prospectus and the summary prospectus carefully before investing.
You can obtain shareholder reports and prospectuses online instead of in the mail.
Visit delawarefunds.com/edelivery.
Experience Delaware Funds by Macquarie®
Macquarie Investment Management (MIM) is a global asset manager with offices in the United States, Europe, Asia, and Australia. As active managers, we prioritize autonomy and accountability at the investment team level in pursuit of opportunities that matter for clients. Delaware Funds is one of the longest-standing mutual fund families, with more than 80 years in existence.
If you are interested in learning more about creating an investment plan, contact your financial advisor.
You can learn more about Delaware Funds or obtain a prospectus for Delaware Emerging Markets Fund, Delaware International Small Cap Fund, and Delaware International Value Equity Fund at delawarefunds.com/literature.
Manage your account online
| ● | Check your account balance and transactions |
| ● | View statements and tax forms |
| ● | Make purchases and redemptions |
Visit delawarefunds.com/account-access.
Macquarie Asset Management (MAM) offers a diverse range of products including securities investment management, infrastructure and real asset management, and fund and equity-based structured products. MIM is the marketing name for certain companies comprising the asset management division of Macquarie Group. This includes the following investment advisers: Macquarie Investment Management Business Trust (MIMBT), Macquarie Funds Management Hong Kong Limited, Macquarie Investment Management Austria Kapitalanlage AG, Macquarie Investment Management Global Limited, Macquarie Investment Management Europe Limited, and Macquarie Investment Management Europe S.A.
The Funds are distributed by Delaware Distributors, L.P. (DDLP), an affiliate of MIMBT and Macquarie Group Limited.
None of the entities noted in this document is an authorized deposit-taking institution for the purposes of the Banking Act 1959 (Commonwealth of Australia) and the obligations of these entities do not represent deposits or other liabilities of Macquarie Bank Limited ABN 46 008 583 542 (Macquarie Bank). Macquarie Bank does not guarantee or otherwise provide assurance in respect of the obligations of these entities. In addition, if this document relates to an investment, (a) each investor is subject to investment risk including possible delays in repayment and loss of income and principal invested and (b) none of Macquarie Bank or any other Macquarie Group company guarantees any particular rate of return on or the performance of the investment, nor do they guarantee repayment of capital in respect of the investment.
The Funds are governed by US laws and regulations.
Unless otherwise noted, views expressed herein are current as of November 30, 2021, and subject to change for events occurring after such date.
The Funds are not FDIC insured and are not guaranteed. It is possible to lose the principal amount invested.
Advisory services provided by Delaware Management Company, a series of MIMBT, a US registered investment advisor.
All third-party marks cited are the property of their respective owners.
© 2022 Macquarie Management Holdings, Inc.
| Portfolio management review | |
| Delaware Emerging Markets Fund | December 7, 2021 (Unaudited) |
Performance preview (for the year ended November 30, 2021)
| Delaware Emerging Markets Fund (Institutional Class shares) | 1-year return | +2.84% | ||
| Delaware Emerging Markets Fund (Class A shares) | 1-year return | +2.57% | ||
| MSCI Emerging Markets Index (net) | 1-year return | +2.70% | ||
| MSCI Emerging Markets Index (gross) | 1-year return | +3.03% | ||
| Past performance does not guarantee future results. |
For complete, annualized performance for Delaware Emerging Markets Fund, please see the table on page 9.
Institutional Class shares are not subject to a sales charge and are offered for sale exclusively to certain eligible investors. In addition, Institutional Class shares pay no distribution and service fee.
The performance of Class A shares excludes the applicable sales charge. The performance of both Institutional Class shares and Class A shares reflects the reinvestment of all distributions.
Please see page 12 for a description of the index. Index performance returns do not reflect any management fees, transaction costs, or expenses. Indices are unmanaged and one cannot invest directly in an index.
Investment objective
The Fund seeks long-term capital appreciation.
Market review
The MSCI Emerging Markets Index rose during the fiscal year ended November 30, 2021, but significantly lagged developed markets. Early in the 12-month period, markets rallied on the progress of COVID-19 vaccines, US dollar weakness, and fund inflows. The rally stalled, however, as investors wrestled with a host of issues including the pace of economic recovery, hints of earlier-than-expected interest rate hikes by the US Federal Reserve, supply chain disruptions, and the spread of COVID-19 variants. During the second half of the fiscal year, inflationary pressures globally appeared to ratchet up, prompting several central banks to tighten monetary policy. In addition, equities in China corrected sharply as policy makers announced measures to regulate business activities more tightly in sectors such as online gaming and for-profit education. Concern about debt defaults in the property-development sector and weaker-than-expected macroeconomic data further weighed on investor sentiment. Among regions, Europe, the Middle East, and Africa (EMEA) outperformed significantly, while Latin America lagged. Among sectors, energy and technology outperformed the most, while consumer discretionary and real estate lagged.
Within the Fund
For the fiscal year ended November 30, 2021, Delaware Emerging Markets Fund Institutional Class shares gained 2.84%. The Fund’s Class A shares rose 2.57% at net asset value and -3.31% at maximum offer price. These figures reflect all distributions reinvested. During the same period, the Fund’s benchmark, the MSCI Emerging Markets Index (net) gained 2.70%. For complete, annualized performance of Delaware Emerging Markets Fund, please see the table on page 9.
The energy sector contributed the most to the Fund’s relative performance due to favorable asset allocation and stock selection. Companies producing oil and gas benefited from rising energy prices. The technology sector also contributed to relative performance as end-user demand for technology products appeared resilient, supporting the outlook for leading semiconductor companies.
1
Portfolio management review
Delaware Emerging Markets Fund
On the negative side, the financials and materials sectors detracted the most from relative performance. The Fund, compared to the benchmark, was underweight these sectors, both of which outperformed significantly as global economies began to recover from COVID-related slowdowns.
Among individual stocks, MediaTek Inc. in Taiwan and SK Telecom Co. Ltd. in South Korea were the leading contributors to the Fund’s relative performance. Strong demand for MediaTek’s 5G smartphone chips supported share price. Shares of SK Telecom also outperformed following the company’s announced plans to separate its telecommunications and non-telecommunications assets into two companies.
In contrast, Americanas S.A. (formerly B2W Companhia Digital) and Wuliangye Yibin Co. Ltd. detracted the most from relative performance. Shares of Americanas in Brazil underperformed as the company’s gross merchandise value (GMV) growth rate lagged peers, while investments in digital marketing and other growth initiatives weighed on margins. We believe that Brazilian ecommerce remains an attractive secular growth opportunity and that Americanas’ business strategy and assets position the company to benefit from this growth. Shares of Wuliangye Yibin in China underperformed when the macroeconomic outlook appeared to soften, potentially slowing consumption growth. We believe that long-term consumption premiumization trends in China remain intact, however, and that Wuliangye Yibin’s brand strength may support the company’s market-share gains. We continued to hold both Americanas and Wuliangye Yibin in the Fund at the end of the fiscal year.
We think that market volatility may persist in the near term due to ongoing concerns about global supply chain challenges, rising interest rates, and geopolitical tension. Nonetheless, over the long term, we continue to expect some trends to persist including greater technology adoption, industry consolidation, consumption premiumization, accommodative monetary policy, and improvements in corporate governance. Our strategy remains centered on identifying individual companies that we believe possess sustainable franchises and favorable long-term growth prospects, and that trade at significant discounts to their intrinsic value. We are particularly focused on companies that we think could benefit from long-term changes in how people in emerging markets live and work.
Among countries, we currently hold overweight positions in South Korea, the United States, and Russia. Conversely, we are currently underweight China, Southeast Asia, Saudi Arabia, and South Africa. Sectors we currently favor include technology, consumer staples, and energy. The Fund is most underweight financials, materials, and industrials.
The Fund used foreign currency exchange contracts to facilitate the purchase and sale of equities traded on international exchanges. The effect of these contracts on performance was immaterial.
2
| Portfolio management review | |
| Delaware International Small Cap Fund | December 7, 2021 (Unaudited) |
Performance preview (for the year ended November 30, 2021)
| Delaware International Small Cap Fund (Institutional Class shares) | 1-year return | +10.92% | ||
| Delaware International Small Cap Fund (Class A shares) | 1-year return | +10.55% | ||
| MSCI ACWI (All Country World Index) ex USA Small Cap Index (net) | 1-year return | +15.92% | ||
| MSCI ACWI (All Country World Index) ex USA Small Cap Index (gross) | 1-year return | +16.36% | ||
| Past performance does not guarantee future results. |
For complete, annualized performance for Delaware International Small Cap Fund, please see the table on page 14.
Institutional Class shares are not subject to a sales charge and are offered for sale exclusively to certain eligible investors. In addition, Institutional Class shares pay no distribution and service fee.
The performance of Class A shares excludes the applicable sales charge. The performance of both Institutional Class shares and Class A shares reflects the reinvestment of all distributions.
Please see page 16 for a description of the index. Index performance returns do not reflect any management fees, transaction costs, or expenses. Indices are unmanaged and one cannot invest directly in an index.
Investment objective
The Fund seeks long-term capital appreciation.
Market review
The introduction of vaccines for COVID-19 coincided with the beginning of the Fund’s fiscal year ended November 30, 2021. Investors around the world greeted that news enthusiastically. Despite the availability of the vaccines, however, the struggle to contain the virus continued and markets grew more volatile. As the fiscal period unfolded, significant differences developed, by both country and region, in the distribution of those vaccines, in the prevalence of the virus, and in responses (including renewed economic lockdowns and re-openings).
Investors also grew increasingly concerned with the specter of inflation and the very real global supply chain disruptions. The emergence of the Delta variant of COVID-19 mid-way through the 12-month period exacerbated those worries. At the very tail end of the fiscal year, the arrival of yet another variant, Omicron, raised fears that a return to normalcy might be further delayed.
Unrelated to the virus, investors grew wary about the Chinese government’s policies pertaining to technology firms. Additionally, the financial unraveling of property development giant Evergrande severely strained the Chinese real estate sector.
Global central banks remained largely supportive throughout the fiscal period. In the US, however, growing inflationary concern put pressure on the Federal Reserve to begin tapering its asset purchases sooner than previously expected, adding to market volatility as the period ended.
Within the Fund
For the fiscal year ended November 30, 2021, Delaware International Small Cap Fund advanced, although it underperformed its benchmark, the MSCI ACWI ex USA Small Cap Index (net). The Fund’s Institutional Class shares gained 10.92%. The Fund’s Class A shares rose 10.55% at net asset value and 4.15% at maximum offer price. These figures reflect all distributions reinvested. During the same period, the Fund’s benchmark (net) returned 15.92%. For complete, annualized performance of Delaware International Small Cap Fund, please see the table on page 14.
The strong macroeconomic forces at play through the 12-month period created a challenging
3
Portfolio management review
Delaware International Small Cap Fund
environment for disciplined bottom-up (stock-by-stock) investment process. Early in the fiscal period, following the initial vaccine news, the market moved toward higher-beta (more volatile) stocks that had been beaten down during the COVID lockdown. As the fiscal year progressed, investors’ focus shifted based largely on news flow related to the virus, inflation, and supply chain issues. Throughout it all, the Fund remained true to its consistent process of individual stock-by-stock selection by seeking companies undergoing positive, fundamental change that we believe will drive earnings growth beyond what the market expects.
With that in mind, sectors that detracted the most from the Fund’s relative performance during the fiscal year were information technology (IT) and industrials. Countries that detracted the most from the Fund’s relative performance were Australia, Japan, and Brazil.
The three largest individual detractors from performance were Solutions 30 SE in Luxembourg, Japan Elevator Service Holdings Co. Ltd. in Japan, and Locaweb Servicos de Internet S.A. in Brazil.
Solutions 30 is an IT services company specializing in the Internet of Things (IoT) among other lines of business. It reported strong quarterly results but underperformed after an anonymous report alleged that Solutions 30 had engaged in money laundering. As of the end of the fiscal year, we no longer hold it in the Fund.
Japan Elevator, an elevator-maintenance firm, underperformed despite reporting results that were in line with expectations. Despite strong maintenance-business results, demand for modernization services declined as customers delayed upgrade projects during the pandemic. We reduced the Fund’s weighting in the stock; however, we continue to believe in the value Japan Elevator provides as a lower-cost elevator-maintenance provider. Additionally, the share price has been largely range-bound in 2021 (albeit at the lower end of the range as of the end of the Fund’s fiscal year).
Locaweb is the leading provider of Internet services to small- and mid-sized businesses in Brazil with three business units: Be Online, which offers hosting, domain, and cloud solutions; software as a service (SaaS) & Solutions; and Commerce, an ecommerce platform solution that enables clients to create a virtual store and sell online. Locaweb has seen strong growth in its Commerce division and has acquired companies to complement the ecommerce business to optimize customer acquisition, manage social network exposure, as well as manage payments and logistics. Like other recently listed companies in Brazil, the stock has declined due to a general derating of Brazilian equities. Although we reduced the Fund’s weighting, we continue to hold the stock given Locaweb’s strong presence in Brazilian ecommerce.
Largely offsetting those negative factors, the sectors that contributed the most to the Fund’s relative performance were healthcare and financials. Geographically, the strongest performance came from Canada, the United Kingdom, and Russia.
The three stocks that contributed the most to relative performance were Future PLC in the UK, MIPS AB in Sweden, and ATS Automation Tooling Systems Inc. in Canada.
Future, a publishing firm with specialized magazines and websites catering to computing, gaming, automotive, and leisure, outperformed during the 12-month period. Future had solid financial results, benefiting from strong momentum in digital advertising. It also executed well on several acquisitions. The April 2020 acquisition of the UK’s largest print publisher, TI Media, was swiftly followed with Future’s largest deal yet, the acquisition of GoCo
4
Group PLC in February 2021, and the acquisition of Dennis Publishing Ltd. in October 2021.
MIPS provides safety technology for helmets. Although COVID-19 restrictions held back its snow (skiing and snowboarding) business, its shares gained overall on strong results in its bicycle-helmet business, as the pandemic led more people to exercise outdoors.
ATS outperformed after posting strong financial results in its manufacturing and assembly systems business. Its Life Sciences, Transportation, and Consumer Products segments drove the company’s strong growth. Of note, its medical devices and electric vehicle battery assembly businesses had strong demand on a mix of organic growth and successful acquisitions.
As we approach the two-year anniversary of the initial spread of COVID-19, the pandemic remains in the forefront of global investors’ concerns. While the rollout of vaccine boosters is bringing greater optimism, there are questions over how effective the boosters will be against the Omicron variant. The potential for effective therapeutic COVID-19 drugs is another source of optimism for a return to greater normalcy. An important element of that normalcy would be the restoration of global supply chains.
Nonetheless, the Omicron variant is raising new worries over transmissibility, the severity of new cases, the effect on hospital capacity, and the potential for renewed government restrictions. Beyond COVID-related issues, geopolitical concerns have increased given the heightened aggression displayed by Russia and China. Inflation pressures also remain an overriding concern.
As previously mentioned, the Fund’s country and sector weights are driven primarily by bottom-up stock-selection opportunities. As a result, relative to the Fund’s benchmark, we were overweight Canada and Germany at the end of the fiscal year. From a sector perspective, industrials and communication services were our largest overweights. Conversely, Taiwan and Switzerland were the largest underweight positions geographically, again based on bottom-up stock-specific decisions. Financials and materials remained two of the Fund’s largest sector underweights at period end.
The Fund may use derivatives or structured products in certain limited situations. For example, the Fund may use equity-linked notes to gain local market access in situations where direct market participation is limited. Derivatives and structured products were not used by the Fund during the fiscal period. However, the Fund used foreign currency exchange contracts to facilitate the purchase and sale of equities traded on international exchanges. The effect of these contracts on performance was immaterial.
5
| Portfolio management review | |
| Delaware International Value Equity Fund | November 30, 2021 |
Performance preview (for the year ended November 30, 2021)
| Delaware International Value Equity Fund (Institutional Class shares) | 1-year return | +6.24% | ||
| Delaware International Value Equity Fund (Class A shares) | 1-year return | +6.02% | ||
| MSCI EAFE (Europe, Australasia, Far East) Index (net) | 1-year return | +10.77% | ||
| MSCI EAFE (Europe, Australasia, Far East) Index (gross) | 1-year return | +11.28% |
For complete, annualized performance for Delaware International Value Equity Fund, please see the table on page 18. Institutional Class shares are not subject to a sales charge and are offered for sale exclusively to certain eligible investors. In addition, Institutional Class shares pay no distribution and service fee.
The performance of Class A shares excludes the applicable sales charge. The performance of both Institutional Class shares and Class A shares reflects the reinvestment of all distributions.
Please see page 20 for a description of the index. Index performance returns do not reflect any management fees, transaction costs, or expenses. Indices are unmanaged and one cannot invest directly in an index.
Investment objective
The Fund seeks long-term growth without undue risk to principal.
Economic developments and market performance
December 2020 ended a dramatic year. The pandemic had crumbled the global economic system as consumers and companies went into lock-down. In March 2021, we marked the one-year anniversary of the coronavirus pandemic and looked back on one of the fastest and most remarkable stock market rebounds in history. During the summer of 2021, prospects for a strong economic rebound, combined with accelerated vaccination efforts in most developed countries that allowed easing of COVID-related restrictions, provided a boost to international equities. As a result, second-quarter equity performance was strong and the Fund’s benchmark, the MSCI EAFE Index, gained more than 5% (net). Economic reopenings led to a surge of spending given the pent-up demand and significant level of savings that households had accumulated during the pandemic.
Against this backdrop, investors are now more worried that the economy might be running too hot, which would force central banks to raise interest rates sooner rather than later. As former US Federal Reserve Chairman William McChesney Martin once remarked, that would “take away the punch bowl,” setting the stage for renewed volatility in financial markets. In November, current Fed Chairman Jerome Powell altered his stance on rising prices saying that it could no longer be anticipated that inflation is transitory. While tapering of the Fed’s asset-purchasing program is already underway, it remains to be seen what the European Central Bank (ECB) plans to do. In our view, this will come down to when the ECB removes the word “transitory” from its vocabulary.
Within the Fund
For the fiscal year ended November 30, 2021, Delaware International Value Equity Fund gained although it underperformed its benchmark, the MSCI EAFE Index (net). The Fund’s Institutional Class shares gained 6.24%. The Fund’s Class A shares advanced 6.02% at net asset value (NAV) and declined 0.05% at maximum offer price. These figures reflect reinvestment of all distributions. During the same period, the Fund’s benchmark (net) gained 10.77%. For complete,
6
annualized performance of Delaware International Value Equity Fund, please see the table on page 18.
We invest with the mindset of long-term business owners. Our research is focused on how well we think a company can deploy its capital and redeploy retained earnings. Therefore, the Fund’s portfolio is built bottom up (stock-by-stock) by selecting company stocks based on quantitative insights and qualitative assessments.
Information technology, energy, and financials provided the strongest sector returns for the Fund during the fiscal year ending November 30, 2021, yielding 24.6%, 21.2%, and 14.5%, respectively. The weakest performance came from utilities, communication services, and consumer staples with returns of -2.4%, 0.8%, and 4.8%, respectively.
Active sector allocation had a negative effect on the Fund’s relative performance. The largest detractor from performance on a sector basis resulted from a large allocation to consumer staples, which contributed on an absolute basis but underperformed the benchmark. Likewise, the higher-than-benchmark allocation to communication services, which performed negatively, also was a drag on performance. The lack of ownership of stocks within financials and energy also detracted from performance. The largest contributor to the Fund’s relative performance due to sector allocation was the lack of investment in utilities.
In terms of individual holdings, three of the largest contributors to active performance were Danish multinational pharmaceutical company Novo Nordisk A/S, French advertising company Publicis Groupe S.A., and British spirits producer Diageo PLC.
Novo Nordisk raised its guidance for the second time in 2021 in connection with its second-quarter results. The company once again reported double-digit growth underpinned by glucagon-like peptide-1 (GLP-1) drugs for diabetes and obesity. We continue to see a solid long-term growth runway for Novo Nordisk, supported by still unmet needs in diabetes and a huge potential in its obesity franchise, which is in its early stage.
As marketing budgets ramped up globally, Publicis Groupe increased its business segment by helping clients monetize very strong consumer demand. Publicis upgraded all its key performance indicators twice in 2021. The all-important US market grew organically almost 11% in the third quarter of 2021.
Diageo was hit by COVID-19 as its main customer segments had to close down their businesses. Diageo stayed disciplined in developing its own business and steered the company well through the challenges, in our view. In addition, Diageo actively helped its customers through a challenging period, which has helped the company gain market share. Re-openings have brought stronger earnings dynamics for Diageo and the stock has been rewarded for its high resilience and premium offering.
Conversely, three of the largest detractors from the Fund’s performance during the fiscal year were German global dialysis provider Fresenius Medical Care AG & Co. KGaA, Japanese personal-products supplier Kao Corp., and UK-based healthcare equipment provider Smith & Nephew PLC.
The pandemic imparted an external shock to Fresenius’ business model, and we were surprised by the limited flexibility in the company’s cost structure. Nonetheless, we believe that the investment case remains intact, supported in large part by an undemanding valuation offering a substantial margin of safety.
Kao had a rough start to 2021, with its share price declining throughout the first quarter and into the second. We believe the current earnings headwind is transitory and pandemic-related, and we expect a recovery phase to develop in the coming
7
Portfolio management review
Delaware International Value Equity Fund
months. We remain confident that Kao has the potential to resume moderate top-line growth and, with some leverage to increase margin, we see a potential for solid profit growth.
Smith & Nephew’s main customers are the global healthcare system. Its products are used primarily in joint replacement surgeries. Globally, many elective procedures have been postponed, which has created a drop in demand for Smith & Nephew’s products. As a result, the stock has suffered. We have invested into Smith & Nephew after the sharp fall in share price. Elective procedures are still not back at pre-pandemic levels as the healthcare system is capacity constrained due to COVID-19. Nonetheless, Smith & Nephew stands to benefit once surgeries are back to normal levels.
The Fund used foreign currency exchange contracts to facilitate the purchase and sale of equities traded on international exchanges. The effect of these contracts on performance was immaterial.
8
| Performance summaries | |
| Delaware Emerging Markets Fund | November 30, 2021 (Unaudited) |
The performance quoted represents past performance and does not guarantee future results. Investment return and principal value of an investment will fluctuate so that shares, when redeemed, may be worth more or less than their original cost. Current performance may be lower or higher than the performance quoted. Performance data current to the most recent month end may be obtained by calling 800 523-1918 or visiting delawarefunds.com/performance.
Fund and benchmark performance1,2 | Average annual total returns through November 30, 2021 | |||||||
| 1 year | 5 year | 10 year | Lifetime | |||||
| Class A (Est. June 10, 1996) | ||||||||
| Excluding sales charge | +2.57% | +11.46% | +7.44% | +7.99% | ||||
| Including sales charge | -3.31% | +10.15% | +6.80% | +7.74% | ||||
| Class C (Est. June 10, 1996) | ||||||||
| Excluding sales charge | +1.82% | +10.63% | +6.63% | +7.19% | ||||
| Including sales charge | +0.82% | +10.63% | +6.63% | +7.19% | ||||
| Class R (Est. August 31, 2009) | ||||||||
| Excluding sales charge | +2.34% | +11.18% | +7.17% | +6.99% | ||||
| Including sales charge | +2.34% | +11.18% | +7.17% | +6.99% | ||||
| Institutional Class (Est. June 10, 1996) | ||||||||
| Excluding sales charge | +2.84% | +11.73% | +7.70% | +8.27% | ||||
| Including sales charge | +2.84% | +11.73% | +7.70% | +8.27% | ||||
| Class R6 (Est. May 2, 2016) | ||||||||
| Excluding sales charge | +2.94% | +11.87% | — | +12.18% | ||||
| Including sales charge | +2.94% | +11.87% | — | +12.18% | ||||
| MSCI Emerging Markets Index (net) | +2.70% | +9.52% | +5.16% | +5.95%* | ||||
| MSCI Emerging Markets Index (gross) | +3.03% | +9.91% | +5.54% | +6.25%* | ||||
| * | The benchmark lifetime return is for Institutional Class share comparison only and is calculated using the last business day in the month of the Fund’s Institutional Class inception date. |
1 | Returns reflect the reinvestment of all distributions and are presented both with and without the applicable sales charges described below. Returns do not reflect the deduction of taxes the shareholder would pay on Fund distributions or redemptions of Fund shares. Expense limitations were in effect for certain classes during some or all of the periods shown in the “Fund and benchmark performance” table. Expenses for each class are listed in the “Fund expense ratios” table on page 10. Performance would have been lower had expense limitations not been in effect. Institutional Class shares are not subject to a sales charge and are offered for sale exclusively to certain eligible investors. In addition, Institutional Class shares pay no distribution and service (12b-1) fee. Class A shares are sold with a maximum front-end sales charge of 5.75%, and have an annual 12b-1 fee of 0.25% of average daily net assets. Performance for Class A shares, excluding sales |
9
Performance summaries
Delaware Emerging Markets Fund
charges, assumes that no front-end sales charge applied. Class C shares are sold with a contingent deferred sales charge (CDSC) of 1.00% if redeemed during the first 12 months. They are also subject to an annual 12b-1 fee of 1.00% of average daily net assets. Performance for Class C shares, excluding sales charges, assumes either that CDSCs did not apply or that the investment was not redeemed. Class R shares are available only for certain retirement plan products. They are sold without a sales charge and have an annual 12b-1 fee of 0.50% of average daily net assets. Class R6 shares are available only to certain investors. In addition, Class R6 shares do not pay any service fees, sub-accounting fees, and/or sub-transfer agency fees to any brokers, dealers, or other financial intermediaries. Class R6 shares pay no 12b-1 fee. International investments entail risks including fluctuation in currency values, differences in accounting principles, or economic or political instability. Investing in emerging markets can be riskier than investing in established foreign markets due to increased volatility, lower trading volume, and higher risk of market closures. In many emerging markets, there is substantially less publicly available information and the available information may be incomplete or misleading. Legal claims are generally more difficult to pursue. Investments in small and/or medium-sized companies typically exhibit greater risk and higher volatility than larger, more established companies. The disruptions caused by natural disasters, pandemics, or similar events could prevent the Fund from executing advantageous investment decisions in a timely manner and could negatively impact the Fund’s ability to achieve its investment objective and the value of the Fund’s investments. |
10
| 2 | The Fund’s expense ratios, as described in the most recent prospectus, are disclosed in the following “Fund expense ratios” table. Delaware Management Company has agreed to reimburse certain expenses and/or waive certain fees in order to prevent total annual fund operating expenses (excluding any 12b-1 fees, acquired fund fees and expenses, taxes, interest, short sale dividend and interest expenses, brokerage fees, certain insurance costs, and nonroutine expenses or costs, including, but not limited to, those relating to reorganizations, litigation, conducting shareholder meetings, and liquidations (collectively, nonroutine expenses)) from exceeding 1.32% of the Fund’s average daily net assets for all share classes other than Class R6, and 1.20% of the Fund’s Class R6 shares’ average daily net assets, from March 30, 2021 to November 30, 2021.* From December 1, 2020 through March 29, 2021, the waiver was 1.37% for all share classes other than Class R6 and 1.25% for Class R6. Please see the most recent prospectus and any applicable supplement(s) for additional information on these fee waivers and/or reimbursements. Please see the “Financial highlights” section in this report for the most recent expense ratios. |
| Institutional | ||||||||||
| Fund expense ratios | Class A | Class C | Class R | Class | Class R6 | |||||
| Total annual operating expenses | ||||||||||
| (without fee waivers) | 1.63% | 2.38% | 1.88% | 1.38% | 1.26% | |||||
| Net expenses (including fee | ||||||||||
| waivers, if any) | 1.57% | 2.32% | 1.82% | 1.32% | 1.20% | |||||
| Type of waiver | Contractual | Contractual | Contractual | Contractual | Contractual | |||||
| * | The aggregate contractual waiver period covering this report is from March 27, 2020 through March 31, 2022. |
11
Performance summaries
Delaware Emerging Markets Fund
Performance of a $10,000 investment1
Average annual total returns from November 30, 2011 through November 30, 2021
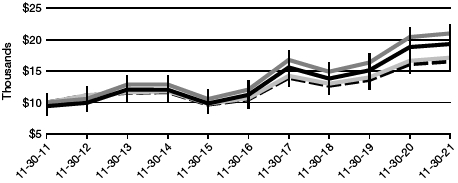
| For period beginning November 30, 2011 through November 30, 2021 | Starting value | Ending value | |||||||
 | Delaware Emerging Markets Fund — Institutional Class shares | $10,000 | $20,998 | ||||||
 | Delaware Emerging Markets Fund — Class A shares | $9,425 | $19,308 | ||||||
 | MSCI Emerging Markets Index (gross) | $10,000 | $17,142 | ||||||
 | MSCI Emerging Markets Index (net) | $10,000 | $16,546 | ||||||
| 1 | The “Performance of a $10,000 investment” graph assumes $10,000 invested in Institutional Class and Class A shares of the Fund on November 30, 2011, and includes the effect of a 5.75% front-end sales charge (for Class A shares) and the reinvestment of all distributions. The graph does not reflect the deduction of taxes the shareholders would pay on Fund distributions or redemptions of Fund shares. Expense limitations were in effect for some or all of the periods shown. Performance would have been lower had expense limitations not been in effect. Expenses are listed in the “Fund expense ratios” table on page 11. Please note additional details on pages 9 through 13. The graph also assumes $10,000 invested in the MSCI Emerging Markets Index as of November 30, 2011. The MSCI Emerging Markets Index represents large- and mid-cap stocks across emerging market countries worldwide. The index covers approximately 85% of the free float-adjusted market capitalization in each country. Index “net” return approximates the minimum possible dividend reinvestment, after deduction of withholding tax at the highest possible rate. Index “gross” return approximates the maximum possible dividend reinvestment. Index performance returns do not reflect any management fees, transaction costs, or expenses. Indices are unmanaged and one cannot invest directly in an index. Past performance does not guarantee future results. Performance of other Fund classes will vary due to different charges and expenses. |
12
| Nasdaq symbols | CUSIPs | |||
| Class A | DEMAX | 245914841 | ||
| Class C | DEMCX | 245914825 | ||
| Class R | DEMRX | 245914569 | ||
| Institutional Class | DEMIX | 245914817 | ||
| Class R6 | DEMZX | 245914510 |
13
| Performance summaries | |
| Delaware International Small Cap Fund | November 30, 2021 (Unaudited) |
The performance quoted represents past performance and does not guarantee future results. Investment return and principal value of an investment will fluctuate so that shares, when redeemed, may be worth more or less than their original cost. Current performance may be lower or higher than the performance quoted. Performance data current to the most recent month end may be obtained by calling 800 523-1918 or visiting delawarefunds.com/performance.
| Fund and benchmark performance1,2 | Average annual total returns through November 30, 2021 | |||||||
| 1 year | 5 year | 10 year | Lifetime | |||||
| Class A (Est. December 29, 2008) | ||||||||
| Excluding sales charge | +10.55% | +11.77% | +9.77% | +12.75% | ||||
| Including sales charge | +4.15% | +10.45% | +9.12% | +12.23% | ||||
| Class C (Est. December 29, 2010) | ||||||||
| Excluding sales charge | +9.78% | +10.94% | +8.96% | +7.93% | ||||
| Including sales charge | +8.78% | +10.94% | +8.96% | +7.93% | ||||
| Class R (Est. December 29, 2010) | ||||||||
| Excluding sales charge | +10.20% | +11.47% | +9.48% | +8.45% | ||||
| Including sales charge | +10.20% | +11.47% | +9.48% | +8.45% | ||||
| Institutional Class (Est. December 29, 2008) | ||||||||
| Excluding sales charge | +10.92% | +12.05% | +10.05% | +12.99% | ||||
| Including sales charge | +10.92% | +12.05% | +10.05% | +12.99% | ||||
| Class R6 (Est. June 30, 2017) | ||||||||
| Excluding sales charge | +10.88% | — | — | +9.40% | ||||
| Including sales charge | +10.88% | — | — | +9.40% | ||||
| MSCI ACWI ex USA Small Cap Index (net) | +15.92% | +10.75% | +8.81% | +11.20%* | ||||
| MSCI ACWI ex USA Small Cap Index (gross) | +16.36% | +11.17% | +9.21% | +11.60%* | ||||
* | The benchmark lifetime return is for Institutional Class share comparison only and is calculated using the last business day in the month of the Fund’s Institutional Class inception date. |
1 | Returns reflect the reinvestment of all distributions and are presented both with and without the applicable sales charges described below. Returns do not reflect the deduction of taxes the shareholder would pay on Fund distributions or redemptions of Fund shares. Expense limitations were in effect for certain classes during some or all of the periods shown in the “Fund and benchmark performance” table. Expenses for each class are listed in the “Fund expense ratios” table on page 15. Performance would have been lower had expense limitations not been in effect. Institutional Class shares are not subject to a sales charge and are offered for sale exclusively to certain eligible investors. In addition, Institutional Class shares pay no distribution and service (12b-1) fee. Class A shares are sold with a maximum front-end sales charge of 5.75%, and have an annual 12b-1 fee of 0.25% of average daily net assets. Performance for Class A shares, excluding sales |
14
charges, assumes that no front-end sales charge applied. Class C shares are sold with a contingent deferred sales charge (CDSC) of 1.00% if redeemed during the first 12 months. They are also subject to an annual 12b-1 fee of 1.00% of average daily net assets. Performance for Class C shares, excluding sales charges, assumes either that CDSCs did not apply or that the investment was not redeemed. Class R shares are available only for certain retirement plan products. They are sold without a sales charge and have an annual 12b-1 fee of 0.50% of average daily net assets. Class R6 shares are available only to certain investors. In addition, Class R6 shares do not pay any service fees, sub-accounting fees, and/or sub-transfer agency fees to any brokers, dealers, or other financial intermediaries. Class R6 shares pay no 12b-1 fee. International investments entail risks including fluctuation in currency values, differences in accounting principles, or economic or political instability. Investing in emerging markets can be riskier than investing in established foreign markets due to increased volatility, lower trading volume, and higher risk of market closures. In many emerging markets, there is substantially less publicly available information and the available information may be incomplete or misleading. Legal claims are generally more difficult to pursue. Investments in small and/or medium-sized companies typically exhibit greater risk and higher volatility than larger, more established companies. The disruptions caused by natural disasters, pandemics, or similar events could prevent the Fund from executing advantageous investment decisions in a timely manner and could negatively impact the Fund’s ability to achieve its investment objective and the value of the Fund’s investments. | |
| 2 | The Fund’s expense ratios, as described in the most recent prospectus, are disclosed in the following “Fund expense ratios” table. Delaware Management Company has agreed to reimburse certain expenses and/or waive certain fees in order to prevent total annual fund operating expenses (excluding any 12b-1 fees, acquired fund fees and expenses, taxes, interest, short sale dividend and interest expenses, brokerage fees, certain insurance costs, and nonroutine expenses or costs, including, but not limited to, those relating to reorganizations, litigation, conducting shareholder meetings, and liquidations (collectively, nonroutine expenses)) from exceeding 1.12% of the Fund’s average daily net assets for all share classes other than Class R6, and 1.00% of the Fund’s Class R6 shares’ average daily net assets, from December 1, 2020 to November 30, 2021.* Please see the most recent prospectus and any applicable supplement(s) for additional information on these fee waivers and/or reimbursements. Please see the “Financial highlights” section in this report for the most recent expense ratios. |
| Institutional | |||||||||
| Fund expense ratios | Class A | Class C | Class R | Class | Class R6 | ||||
| Total annual operating expenses | |||||||||
| (without fee waivers) | 1.54% | 2.29% | 1.79% | 1.29% | 1.17% | ||||
| Net expenses (including fee | |||||||||
| waivers, if any) | 1.37% | 2.12% | 1.62% | 1.12% | 1.00% | ||||
| Type of waiver | Contractual | Contractual | Contractual | Contractual | Contractual | ||||
* | The aggregate contractual waiver period covering this report is from March 27, 2020 through March 31, 2022. |
15
Performance summaries
Delaware International Small Cap Fund
Performance of a $10,000 investment1
Average annual total returns from November 30, 2011 through November 30, 2021
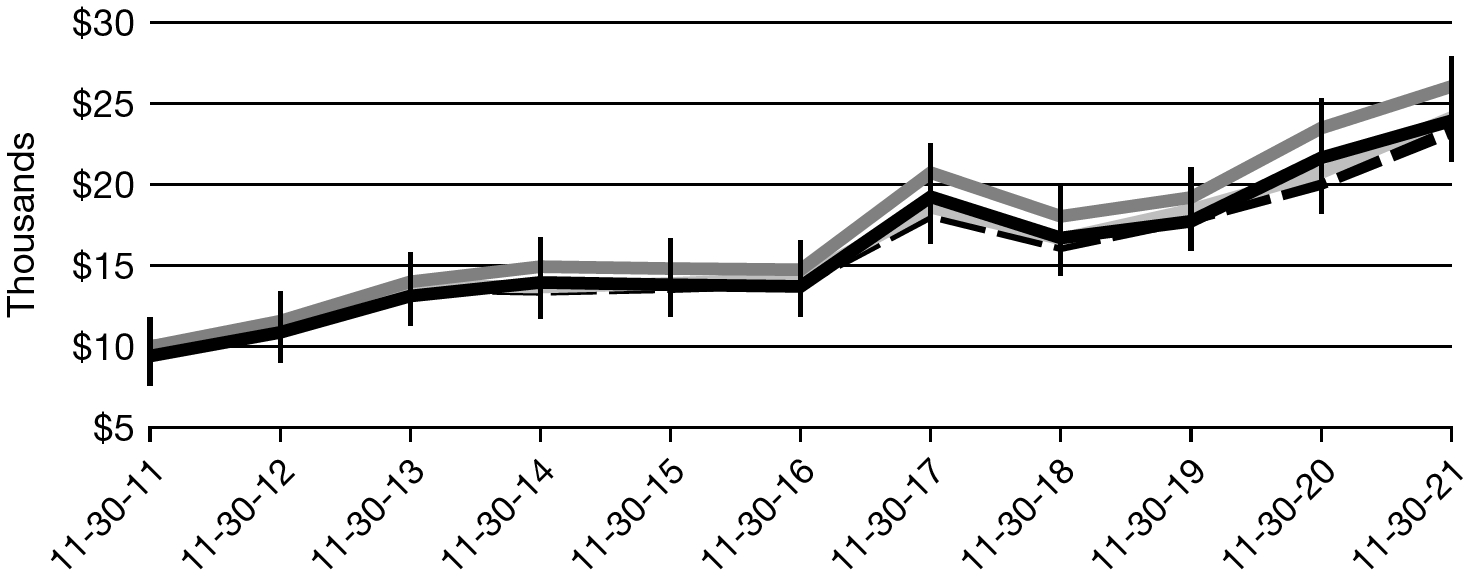
| For period beginning November 30, 2011 through November 30, 2021 | Starting value | Ending value | |||||
 | Delaware International Small Cap Fund — Institutional Class | ||||||
| shares | $10,000 | $26,046 | |||||
 | MSCI ACWI ex USA Small Cap Index (gross) | $10,000 | $24,130 | ||||
 | Delaware International Small Cap Fund — Class A shares | $9,425 | $23,931 | ||||
 | MSCI ACWI ex USA Small Cap Index (net) | $10,000 | $23,261 | ||||
1 | The “Performance of a $10,000 investment” graph assumes $10,000 invested in Institutional Class and Class A shares of the Fund on November 30, 2011, and includes the effect of a 5.75% front-end sales charge (for Class A shares) and the reinvestment of all distributions. The graph does not reflect the deduction of taxes the shareholders would pay on Fund distributions or redemptions of Fund shares. Expense limitations were in effect for some or all of the periods shown. Performance would have been lower had expense limitations not been in effect. Expenses are listed in the “Fund expense ratios” table on page 15. Please note additional details on pages 14 through 17. The graph also assumes $10,000 invested in the MSCI ACWI ex USA Small Cap Index as of November 30, 2011. The MSCI ACWI (All Country World Index) ex USA Small Cap Index represents small-cap stocks across 22 of 23 developed market countries (excluding the United States) and 27 emerging market countries. The index covers approximately 14% of the global equity opportunity set outside the US. Index performance returns do not reflect any management fees, transaction costs, or expenses. Indices are unmanaged and one cannot invest directly in an index. Past performance does not guarantee future results. Performance of other Fund classes will vary due to different charges and expenses. |
16
| Nasdaq symbols | CUSIPs | |||
| Class A | DGGAX | 246118541 | ||
| Class C | DGGCX | 246118533 | ||
| Class R | DGGRX | 246118525 | ||
| Institutional Class | DGGIX | 246118517 | ||
| Class R6 | DGRRX | 245914486 |
17
| Performance summaries | |
| Delaware International Value Equity Fund | November 30, 2021 (Unaudited) |
The performance quoted represents past performance and does not guarantee future results. Investment return and principal value of an investment will fluctuate so that shares, when redeemed, may be worth more or less than their original cost. Current performance may be lower or higher than the performance quoted. Performance data current to the most recent month end may be obtained by calling 800 523-1918 or visiting delawarefunds.com/performance.
| Fund and benchmark performance1,2 | Average annual total returns through November 30, 2021 | |||||||
| 1 year | 5 year | 10 year | Lifetime | |||||
| Class A (Est. October 31, 1991) | ||||||||
| Excluding sales charge | +6.02% | +5.75% | +5.59% | +5.75% | ||||
| Including sales charge | -0.05% | +4.50% | +4.97% | +5.55% | ||||
| Class C (Est. November 29, 1995) | ||||||||
| Excluding sales charge | +5.21% | +4.96% | +4.80% | +4.54% | ||||
| Including sales charge | +4.21% | +4.96% | +4.80% | +4.54% | ||||
| Class R (Est. June 2, 2003) | ||||||||
| Excluding sales charge | +5.75% | +5.49% | +5.33% | +5.43% | ||||
| Including sales charge | +5.75% | +5.49% | +5.33% | +5.43% | ||||
| Institutional Class (Est. November 9, 1992) | ||||||||
| Excluding sales charge | +6.24% | +6.01% | +5.85% | +6.42% | ||||
| Including sales charge | +6.24% | +6.01% | +5.85% | +6.42% | ||||
| Class R6 (Est. March 29, 2018) | ||||||||
| Excluding sales charge | +6.31% | — | — | +2.41% | ||||
| Including sales charge | +6.31% | — | — | +2.41% | ||||
| MSCI EAFE Index (net) | +10.77% | +9.19% | +7.39% | +6.22%* | ||||
| MSCI EAFE Index (gross) | +11.28% | +9.71% | +7.89% | +6.64%* | ||||
* | The benchmark lifetime return is for Institutional Class share comparison only and is calculated using the last business day in the month of the Fund’s Institutional Class inception date. |
1 | Returns reflect the reinvestment of all distributions and are presented both with and without the applicable sales charges described below. Returns do not reflect the deduction of taxes the shareholder would pay on Fund distributions or redemptions of Fund shares. Expense limitations were in effect for certain classes during some or all of the periods shown in the “Fund and benchmark performance” table. Expenses for each class are listed in the “Fund expense ratios” table on page 19. Performance would have been lower had expense limitations not been in effect. Institutional Class shares are not subject to a sales charge and are offered for sale exclusively to certain eligible investors. In addition, Institutional Class shares pay no distribution and service (12b-1) fee. Class A shares are sold with a maximum front-end sales charge of 5.75%, and have an annual 12b-1 fee of 0.25% of average daily net assets. Performance for Class A shares, excluding sales |
18
charges, assumes that no front-end sales charge applied.
Class C shares are sold with a contingent deferred sales charge (CDSC) of 1.00% if redeemed during the first 12 months. They are also subject to an annual 12b-1 fee of 1.00% of average daily net assets. Performance for Class C shares, excluding sales charges, assumes either that CDSCs did not apply or that the investment was not redeemed.
Class R shares are available only for certain retirement plan products. They are sold without a sales charge and have an annual 12b-1 fee of 0.50% of average daily net assets.
Class R6 shares are available only to certain investors. In addition, Class R6 shares do not pay any service fees, sub-accounting fees, and/or sub-transfer agency fees to any brokers, dealers, or other financial intermediaries. Class R6 shares pay no 12b-1 fee.
International investments entail risks including fluctuation in currency values, differences in accounting principles, or economic or political instability. Investing in emerging markets can be riskier than investing in established foreign markets due to increased volatility, lower trading volume, and higher risk of market closures. In many emerging markets, there is substantially less publicly available information and the available information may be incomplete or misleading. Legal claims are generally more difficult to pursue.
The disruptions caused by natural disasters, pandemics, or similar events could prevent the Fund from executing advantageous investment decisions in a timely manner and could negatively impact the Fund’s ability to achieve its investment objective and the value of the Fund’s investments.
| 2 | The Fund’s expense ratios, as described in the most recent prospectus, are disclosed in the following “Fund expense ratios” table. Delaware Management Company has agreed to reimburse certain expenses and/or waive certain fees in order to prevent total annual fund operating expenses (excluding any 12b-1 fees, acquired fund fees and expenses, taxes, interest, short sale dividend and interest expenses, brokerage fees, certain insurance costs, and nonroutine expenses or costs, including, but not limited to, those relating to reorganizations, litigation, conducting shareholder meetings, and liquidations (collectively, nonroutine expenses)) from exceeding 0.88% of the Fund’s average daily net assets for all share classes other than Class R6, and 0.82% of the Fund’s Class R6 shares’ average daily net assets, from December 1, 2020 to November 30, 2021.* Please see the most recent prospectus and any applicable supplement(s) for additional information on these fee waivers and/or reimbursements. Please see the “Financial highlights” section in this report for the most recent expense ratios. |
| Institutional | ||||||||||
| Fund expense ratios | Class A | Class C | Class R | Class | Class R6 | |||||
| Total annual operating expenses | ||||||||||
| (without fee waivers) | 1.33% | 2.08% | 1.58% | 1.08% | 1.02% | |||||
| Net expenses (including fee | ||||||||||
| waivers, if any) | 1.13% | 1.88% | 1.38% | 0.88% | 0.82% | |||||
| Type of waiver | Contractual | Contractual | Contractual | Contractual | Contractual |
| * | The aggregate contractual waiver period covering this report is from July 31, 2020 through March 31, 2022. |
19
Performance summaries
Delaware International Value Equity Fund
Performance of a $10,000 investment1
Average annual total returns from November 30, 2011 through November 30, 2021
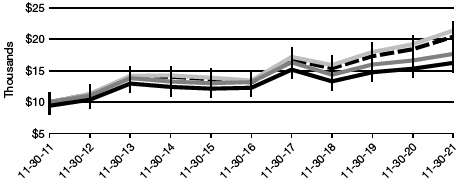
For period beginning November 30, 2011 through November 30, 2021 | Starting value | Ending value | |||||||
 | MSCI EAFE Index (gross) | $ | 10,000 | $ | 21,374 | ||||
 | MSCI EAFE Index (net) | $ | 10,000 | $ | 20,399 | ||||
 | Delaware International Value Equity Fund — Institutional Class | ||||||||
| shares | $ | 10,000 | $ | 17,664 | |||||
 | Delaware International Value Equity Fund — Class A shares | $ | 9,425 | $ | 16,241 | ||||
| 1 | The “Performance of a $10,000 investment” graph assumes $10,000 invested in Institutional Class and Class A shares of the Fund on November 30, 2011, and includes the effect of a 5.75% front-end sales charge (for Class A shares) and the reinvestment of all distributions. The graph does not reflect the deduction of taxes the shareholders would pay on Fund distributions or redemptions of Fund shares. Expense limitations were in effect for some or all of the periods shown. Performance would have been lower had expense limitations not been in effect. Expenses are listed in the “Fund expense ratios” table on page 19. Please note additional details on pages 18 through 21. |
The graph also assumes $10,000 invested in the MSCI EAFE Index as of November 30, 2011. The MSCI EAFE (Europe, Australasia, Far East) Index represents large- and mid-cap stocks across 21 developed markets, excluding the United States and Canada. The index covers approximately 85% of the free float-adjusted market capitalization in each country. Index “net” return approximates the minimum possible dividend reinvestment, after deduction of withholding tax at the highest possible rate. Index “gross” return approximates the maximum possible dividend reinvestment.
Index performance returns do not reflect any management fees, transaction costs, or expenses. Indices are unmanaged and one cannot invest directly in an index. Past performance does not guarantee future results.
Performance of other Fund classes will vary due to different charges and expenses.
20
| Nasdaq symbols | CUSIPs | |||
| Class A | DEGIX | 245914106 | ||
| Class C | DEGCX | 245914858 | ||
| Class R | DIVRX | 245914577 | ||
| Institutional Class | DEQIX | 245914403 | ||
| Class R6 | DEQRX | 245914478 |
21
Disclosure of Fund expenses
For the six-month period from June 1, 2021 to November 30, 2021 (Unaudited)
As a shareholder of a Fund, you incur two types of costs: (1) transaction costs, including sales charges (loads) on purchase payments, reinvested dividends, or other distributions; redemption fees; and exchange fees; and (2) ongoing costs, including management fees; distribution and service (12b-1) fees; and other Fund expenses. The following examples are intended to help you understand your ongoing costs (in dollars) of investing in a Fund and to compare these costs with the ongoing costs of investing in other mutual funds.
The examples are based on an investment of $1,000 invested at the beginning of the period and held for the entire six-month period from June 1, 2021 to November 30, 2021.
Actual expenses
The first section of the tables shown, “Actual Fund return,” provides information about actual account values and actual expenses. You may use the information in this section of the table, together with the amount you invested, to estimate the expenses that you paid over the period. Simply divide your account value by $1,000 (for example, an $8,600 account value divided by $1,000 = 8.6), then multiply the result by the number in the first section under the heading entitled “Expenses Paid During Period” to estimate the expenses you paid on your account during this period.
Hypothetical example for comparison purposes
The second section of the tables shown, “Hypothetical 5% return,” provides information about hypothetical account values and hypothetical expenses based on the Funds’ actual expense ratios and an assumed rate of return of 5% per year before expenses, which is not the Funds’ actual return. The hypothetical account values and expenses may not be used to estimate the actual ending account balance or expenses you paid for the period. You may use this information to compare the ongoing costs of investing in each Fund and other funds. To do so, compare this 5% hypothetical example with the 5% hypothetical examples that appear in the shareholder reports of the other funds.
Please note that the expenses shown in the tables are meant to highlight your ongoing costs only and do not reflect any transactional costs, such as sales charges (loads), redemption fees, or exchange fees. Therefore, the second section of each table is useful in comparing ongoing costs only, and will not help you determine the relative total costs of owning different funds. In addition, if these transactional costs were included, your costs would have been higher. The Funds’ expenses shown in the tables reflect fee waivers in effect and assume reinvestment of all dividends and distributions.
22
Delaware Emerging Markets Fund
Expense analysis of an investment of $1,000
| Beginning | Ending | Expenses | ||||||||||||||
| Account Value | Account Value | Annualized | Paid During Period | |||||||||||||
| 6/1/21 | 11/30/21 | Expense Ratio | 6/1/21 to 11/30/21* | |||||||||||||
| Actual Fund return† | ||||||||||||||||
| Class A | $1,000.00 | $880.70 | 1.57% | $7.40 | ||||||||||||
| Class C | 1,000.00 | 877.60 | 2.32% | 10.92 | ||||||||||||
| Class R | 1,000.00 | 879.50 | 1.82% | 8.58 | ||||||||||||
| Institutional Class | 1,000.00 | 881.60 | 1.32% | 6.23 | ||||||||||||
| Class R6 | 1,000.00 | 882.00 | 1.20% | 5.66 | ||||||||||||
| Hypothetical 5% return (5% return before expenses) | ||||||||||||||||
| Class A | $1,000.00 | $1,017.20 | 1.57% | $7.94 | ||||||||||||
| Class C | 1,000.00 | 1,013.44 | 2.32% | 11.71 | ||||||||||||
| Class R | 1,000.00 | 1,015.94 | 1.82% | 9.20 | ||||||||||||
| Institutional Class | 1,000.00 | 1,018.45 | 1.32% | 6.68 | ||||||||||||
| Class R6 | 1,000.00 | 1,019.05 | 1.20% | 6.07 | ||||||||||||
Delaware International Small Cap Fund
Expense analysis of an investment of $1,000
| Beginning | Ending | Expenses | ||||||||||||||
| Account Value | Account Value | Annualized | Paid During Period | |||||||||||||
| 6/1/21 | 11/30/21 | Expense Ratio | 6/1/21 to 11/30/21* | |||||||||||||
| Actual Fund return† | ||||||||||||||||
| Class A | $1,000.00 | $977.50 | 1.35% | $6.69 | ||||||||||||
| Class C | 1,000.00 | 974.00 | 2.10% | 10.39 | ||||||||||||
| Class R | 1,000.00 | 975.00 | 1.60% | 7.92 | ||||||||||||
| Institutional Class | 1,000.00 | 978.60 | 1.10% | 5.46 | ||||||||||||
| Class R6 | 1,000.00 | 977.70 | 1.00% | 4.96 | ||||||||||||
| Hypothetical 5% return (5% return before expenses) | ||||||||||||||||
| Class A | $1,000.00 | $ | 1,018.30 | 1.35% | $6.83 | |||||||||||
| Class C | 1,000.00 | 1,014.54 | 2.10% | 10.61 | ||||||||||||
| Class R | 1,000.00 | 1,017.05 | 1.60% | 8.09 | ||||||||||||
| Institutional Class | 1,000.00 | 1,019.55 | 1.10% | 5.57 | ||||||||||||
| Class R6 | 1,000.00 | 1,020.05 | 1.00% | 5.06 | ||||||||||||
23
Disclosure of Fund expenses
For the six-month period from June 1, 2021 to November 30, 2021 (Unaudited)
Delaware International Value Equity Fund
Expense analysis of an investment of $1,000
| Beginning | Ending | Expenses | |||||||||||||||
| Account Value | Account Value | Annualized | Paid During Period | ||||||||||||||
| 6/1/21 | 11/30/21 | Expense Ratio | 6/1/21 to 11/30/21* | ||||||||||||||
| Actual Fund return† | |||||||||||||||||
| Class A | $ | 1,000.00 | $921.40 | 1.21% | $ | 5.83 | |||||||||||
| Class C | 1,000.00 | 918.30 | 1.96% | 9.43 | |||||||||||||
| Class R | 1,000.00 | 919.90 | 1.46% | 7.03 | |||||||||||||
| Institutional Class | 1,000.00 | 922.30 | 0.96% | 4.63 | |||||||||||||
| Class R6 | 1,000.00 | 922.90 | 0.90% | 4.34 | |||||||||||||
| Hypothetical 5% return (5% return before expenses) | |||||||||||||||||
| Class A | $ | 1,000.00 | $ | 1,019.00 | 1.21% | $ | 6.12 | ||||||||||
| Class C | 1,000.00 | 1,015.24 | 1.96% | 9.90 | |||||||||||||
| Class R | 1,000.00 | 1,017.75 | 1.46% | 7.38 | |||||||||||||
| Institutional Class | 1,000.00 | 1,020.26 | 0.96% | 4.86 | |||||||||||||
| Class R6 | 1,000.00 | 1,020.56 | 0.90% | 4.56 | |||||||||||||
| * | “Expenses Paid During Period” are equal to the relevant Fund’s annualized expense ratio, multiplied by the average account value over the period, multiplied by 183/365 (to reflect the one-half year period). |
| † | Because actual returns reflect only the most recent six-month period, the returns shown may differ significantly from fiscal year returns. |
In addition to the Funds’ expenses reflected above, each Fund also indirectly bears its portion of the fees and expenses of the investment companies (Underlying Funds) in which it invests, including exchange-traded funds. The tables above do not reflect the expenses of the Underlying Funds.
24
| Security type / country and sector allocations | |
| Delaware Emerging Markets Fund | As of November 30, 2021 (Unaudited) |
Sector designations may be different from the sector designations presented in other Fund materials. The sector designations may represent the investment manager’s or a sub-advisor’s internal sector classifications, which may result in the sector designations for one fund being different from another fund’s sector designations.
| Security type / country | Percentage of net assets | ||||
| Common Stock by Country | 98.47 | % | |||
| Argentina | 0.23 | % | |||
| Australia | 0.62 | % | |||
| Bahrain | 0.04 | % | |||
| Brazil | 4.02 | % | |||
| Chile | 1.06 | % | |||
| China | 30.25 | % | |||
| Hong Kong | 0.18 | % | |||
| India | 12.09 | % | |||
| Indonesia | 1.23 | % | |||
| Malaysia | 0.02 | % | |||
| Mexico | 3.61 | % | |||
| Peru | 0.37 | % | |||
| Philippines | 0.25 | % | |||
| Republic of Korea | 17.13 | % | |||
| Russia | 6.50 | % | |||
| South Africa | 0.22 | % | |||
| Taiwan | 16.09 | % | |||
| Turkey | 0.57 | % | |||
| United Kingdom | 0.06 | % | |||
| United States | 3.93 | % | |||
| Preferred Stock | 2.08 | % | |||
| Warrants | 0.01 | % | |||
| Exchange-Traded Fund | 0.08 | % | |||
| Participation Notes | 0.00 | % | |||
| Total Value of Securities | 100.64 | % | |||
| Liabilities Net of Receivables and Other Assets | (0.64 | %) | |||
| Total Net Assets | 100.00 | % | |||
25
Security type / country and sector allocations
Delaware Emerging Markets Fund
| Common stock, participation notes, and preferred stock by sector ◆ | Percentage of net assets | ||||
| Communication Services | 15.60 | % | |||
| Consumer Discretionary | 11.69 | % | |||
| Consumer Staples | 14.83 | % | |||
| Energy | 13.64 | % | |||
| Financials | 4.62 | % | |||
| Healthcare | 1.47 | % | |||
| Industrials | 0.52 | % | |||
| Information Technology* | 33.31 | % | |||
| Materials | 4.23 | % | |||
| Real Estate Investment Trusts | 0.26 | % | |||
| Utilities | 0.38 | % | |||
| Total | 100.55 | % | |||
| ◆ | Narrow industries are utilized for compliance purposes for diversification whereas broad sectors are used for financial reporting. |
| * | To monitor compliance with the Fund’s concentration guidelines as described in the Fund’s Prospectus and Statement of Additional Information, the Information Technology sector (as disclosed herein for financial reporting purposes) is subdivided into a variety of “industries” (in accordance with the requirements of the Investment Company Act of 1940, as amended). The Information Technology sector consisted of Computers, Electronics, Internet, Retail, Electronic Components-Semiconductors, Semiconductor Components- Integrated Circuits, and Software. As of November 30, 2021, such amounts, as a percentage of total net assets were 1.63%, 0.12%, 0.58%, 0.01%, 20.04%, 10.27%, and 0.66%, respectively. The percentage in any such single industry will comply with the Fund’s concentration policy even if the percentage in the Information Technology sector for financial reporting purposes may exceed 25%. |
26
| Security type / country and sector allocations | |
| Delaware International Small Cap Fund | As of November 30, 2021 (Unaudited) |
Sector designations may be different from the sector designations presented in other Fund materials. The sector designations may represent the investment manager’s or a sub-advisor’s internal sector classifications, which may result in the sector designations for one fund being different from another fund’s sector designations.
| Security type / country | Percentage of net assets | ||||
| Common Stock by Country | 96.83 | % | |||
| Australia | 3.87 | % | |||
| Austria | 0.39 | % | |||
| Brazil | 2.61 | % | |||
| Canada | 11.93 | % | |||
| Denmark | 0.59 | % | |||
| Finland | 1.18 | % | |||
| France | 1.28 | % | |||
| Germany | 7.91 | % | |||
| Hong Kong | 0.47 | % | |||
| India | 3.93 | % | |||
| Ireland | 1.11 | % | |||
| Israel | 1.84 | % | |||
| Italy | 4.28 | % | |||
| Japan | 19.57 | % | |||
| Mexico | 0.66 | % | |||
| Norway | 1.45 | % | |||
| Republic of Korea | 6.22 | % | |||
| Russia | 2.70 | % | |||
| South Africa | 1.14 | % | |||
| Spain | 0.91 | % | |||
| Sweden | 5.22 | % | |||
| Taiwan | 2.19 | % | |||
| United Kingdom | 15.38 | % | |||
| Short-Term Investments | 2.23 | % | |||
| Total Value of Securities | 99.06 | % | |||
| Receivables and Other Assets Net of Liabilities | 0.94 | % | |||
| Total Net Assets | 100.00 | % | |||
27
Security type / country and sector allocations
Delaware International Small Cap Fund
| Common stock by sector ◆ | Percentage of net assets | ||||
| Communication Services | 8.18 | % | |||
| Consumer Discretionary | 10.07 | % | |||
| Consumer Staples | 2.54 | % | |||
| Energy | 3.82 | % | |||
| Financials | 4.48 | % | |||
| Healthcare | 8.97 | % | |||
| Industrials* | 27.78 | % | |||
| Information Technology | 13.51 | % | |||
| Materials | 6.55 | % | |||
| Real Estate | 10.01 | % | |||
| Utilities | 0.92 | % | |||
| Total | 96.83 | % | |||
| ◆ | Narrow industries are utilized for compliance purposes for diversification whereas broad sectors are used for financial reporting. |
* | To monitor compliance with the Fund’s concentration guidelines as described in the Fund’s Prospectus and Statement of Additional Information, the Industrials sector (as disclosed herein for financial reporting purposes) is subdivided into a variety of “industries” (in accordance with the requirements of the Investment Company Act of 1940, as amended). The Industrials sector consisted of Aerospace/Defense, Building Materials, Commercial Services, Diversified Financial Services, Electronics, Engineering & Construction, Environmental Control, Hand/Machine Tools, Internet, Machinery-Construction & Mining, Machinery-Diversified, Retail, Software and Transportation. As of November 30, 2021, such amounts, as a percentage of total net assets were 0.65%, 1.40%, 2.86%, 0.50%, 2.37%, 0.66%, 2.61%, 0.82%, 2.89%, 0.82%, 8.21%, 2.31%, 1.12%, and 0.56%, respectively. The percentage in any such single industry will comply with the Fund’s concentration policy even if the percentage in the Industrials sector for financial reporting purposes may exceed 25%. |
28
| Security type / country and sector allocations | |
| Delaware International Value Equity Fund | As of November 30, 2021 (Unaudited) |
Sector designations may be different from the sector designations presented in other Fund materials. The sector designations may represent the investment manager’s or a sub-advisor’s internal sector classifications, which may result in the sector designations for one fund being different from another fund’s sector designations.
| Security type / country | Percentage of net assets | ||||
| Common Stock by Country | 97.01 | % | |||
| Denmark | 5.33 | % | |||
| France | 17.85 | % | |||
| Germany | 13.75 | % | |||
| Japan | 13.60 | % | |||
| Netherlands | 4.33 | % | |||
| Spain | 4.75 | % | |||
| Sweden | 9.49 | % | |||
| Switzerland | 15.96 | % | |||
| United Kingdom | 11.95 | % | |||
| Exchange-Traded Funds | 1.68 | % | |||
| Short-Term Investments | 0.44 | % | |||
| Securities Lending Collateral | 3.36 | % | |||
| Total Value of Securities | 102.49 | % | |||
| Obligation to Return Securities Lending Collateral | (3.36 | %) | |||
| Receivables and Other Assets Net of Liabilities | 0.87 | % | |||
| Total Net Assets | 100.00 | % | |||
29
Security type / country and sector allocations
Delaware International Value Equity Fund
| Common stock by sector ◆ | Percentage of net assets | ||||
| Communication Services | 7.45 | % | |||
| Consumer Discretionary | 15.07 | % | |||
| Consumer Staples* | 35.90 | % | |||
| Healthcare | 19.01 | % | |||
| Industrials | 5.94 | % | |||
| Information Technology | 8.66 | % | |||
| Materials | 4.98 | % | |||
| Total | 97.01 | % | |||
| ◆ | Narrow industries are utilized for compliance purposes for diversification whereas broad sectors are used for financial reporting. |
* | To monitor compliance with the Fund’s concentration guidelines as described in the Fund’s Prospectus and Statement of Additional Information, the Consumer Staples sector (as disclosed herein for financial reporting purposes) is subdivided into a variety of “industries” (in accordance with the requirements of the Investment Company Act of 1940, as amended). The Consumer Staples sector consisted of Beverages, Cosmetics/Personal Care, Food, and Retail. As of November 30, 2021, such amounts, as a percentage of total net assets were 10.01%, 6.22%, 17.91%, and 1.76%, respectively. The percentage in any such single industry will comply with the Fund’s concentration policy even if the percentage in the Consumer Staples sector for financial reporting purposes may exceed 25%. |
30
| Schedules of investments | |
| Delaware Emerging Markets Fund | November 30, 2021 |
| Number of | |||||
| shares | Value (US $) | ||||
| Common Stock – 98.47%Δ | |||||
| Argentina – 0.23% | |||||
| Cablevision Holding GDR | 443,972 | $ | 1,035,125 | ||
| Cresud ADR † | 1,624,384 | 7,212,265 | |||
| Grupo Clarin GDR Class B 144A #, † | 131,213 | 128,617 | |||
| IRSA Inversiones y Representaciones ADR † | 1,348,512 | 5,731,176 | |||
| IRSA Propiedades Comerciales ADR | 225,805 | 496,771 | |||
| 14,603,954 | |||||
| Australia – 0.62% | |||||
| BHP Group ADR | 380,000 | 21,352,200 | |||
| Rio Tinto ADR | 300,000 | 18,807,000 | |||
| 40,159,200 | |||||
| Bahrain – 0.04% | |||||
| Aluminium Bahrain GDR 144A # | 221,400 | 2,348,766 | |||
| 2,348,766 | |||||
| Brazil – 4.02% | |||||
| AES Brasil Energia | 516,085 | 1,045,600 | |||
| Americanas † | 10,500,000 | 56,591,692 | |||
| Arcos Dorados Holdings Class A † | 2,337,159 | 11,498,822 | |||
| Atacadao | 500,000 | 1,356,315 | |||
| Banco Bradesco ADR | 5,982,240 | 21,057,485 | |||
| Banco Santander Brasil ADR | 3,051,128 | 17,757,565 | |||
| BRF ADR † | 6,850,000 | 24,043,500 | |||
| Embraer ADR † | 420,704 | 5,776,266 | |||
| Getnet Adquirencia e Servicos para Meios de Pagamento ADR | |||||
| † | 381,391 | 495,808 | |||
| Itau Unibanco Holding ADR | 9,170,000 | 35,946,400 | |||
| Rumo † | 1,905,351 | 5,944,637 | |||
| Telefonica Brasil ADR | 2,050,000 | 18,101,500 | |||
| TIM ADR | 1,244,820 | 15,124,563 | |||
| Vale ADR | 3,000,000 | 37,110,000 | |||
| XP Class A † | 211,715 | 6,071,986 | |||
| 257,922,139 | |||||
| Chile – 1.06% | |||||
| Cia Cervecerias Unidas ADR | 410,528 | 6,597,185 | |||
| Sociedad Quimica y Minera de Chile ADR | 989,600 | 61,612,496 | |||
| 68,209,681 | |||||
| China – 30.25% | |||||
| Alibaba Group Holding † | 2,300,000 | 36,725,715 | |||
| Alibaba Group Holding ADR † | 1,217,000 | 155,204,010 | |||
| Anhui Conch Cement Class H | 7,800,000 | 35,512,097 | |||
31
Schedules of investments
Delaware Emerging Markets Fund
| Number of | ||||||
| shares | Value (US $) | |||||
| Common StockΔ (continued) | ||||||
| China (continued) | ||||||
| Baidu ADR † | 420,000 | $ | 62,932,800 | |||
| BeiGene † | 1,615,700 | 43,076,433 | ||||
| China National Building Material Class H | 10,000,000 | 10,743,197 | ||||
| China Petroleum & Chemical Class H | 30,000,000 | 13,077,288 | ||||
| DiDi Global ADR † | 771,500 | 5,886,545 | ||||
| Guangshen Railway Class H † | 11,000,000 | 1,815,670 | ||||
| Hengan International Group | 2,000,000 | 9,658,604 | ||||
| iQIYI ADR † | 700,000 | 4,368,000 | ||||
| JD.com ADR † | 3,080,000 | 259,058,800 | ||||
| Joinn Laboratories China Class H 144A # | 61,320 | 731,281 | ||||
| Kangji Medical Holdings | 3,000 | 3,364 | ||||
| Kunlun Energy | 21,000,000 | 19,750,233 | ||||
| Kweichow Moutai Class A | 969,961 | 293,966,014 | ||||
| Lizhi ADR † | 100,000 | 212,000 | ||||
| New Oriental Education & Technology Group ADR † | 7,000,000 | 15,470,000 | ||||
| PetroChina Class H | 18,000,000 | 7,794,155 | ||||
| Ping An Insurance Group Co. of China Class H | 4,000,000 | 27,728,970 | ||||
| Prosus † | 1,099,494 | 88,358,499 | ||||
| Sohu.com ADR † | 2,219,642 | 37,445,361 | ||||
| TAL Education Group ADR † | 1,030,000 | 5,335,400 | ||||
| Tencent Holdings | 4,750,000 | 277,015,631 | ||||
| Tencent Music Entertainment Group ADR † | 950,000 | 6,830,500 | ||||
| Tianjin Development Holdings | 15,885,550 | 3,259,410 | ||||
| Tingyi Cayman Islands Holding | 13,000,000 | 25,114,871 | ||||
| Trip.com Group ADR † | 582,400 | 16,016,000 | ||||
| Tsingtao Brewery Class H | 7,000,000 | 56,583,883 | ||||
| Uni-President China Holdings | 31,186,000 | 30,596,573 | ||||
| Weibo ADR † | 899,622 | 35,813,952 | ||||
| Wuliangye Yibin Class A | 10,299,780 | 352,688,395 | ||||
| Zhihu ADR † | 142,600 | 1,042,406 | ||||
| ZhongAn Online P&C Insurance Class H 144A #, † | 739,600 | 2,520,634 | ||||
| 1,942,336,691 | ||||||
| Hong Kong – 0.18% | ||||||
| Vinda International Holdings | 4,300,000 | 11,635,035 | ||||
| 11,635,035 | ||||||
| India – 12.09% | ||||||
| Aurobindo Pharma | 1,500,000 | 13,169,370 | ||||
| Glenmark Pharmaceuticals | 1,167,988 | 8,141,794 | ||||
| HCL Technologies | 2,800,000 | 42,409,836 | ||||
| Indiabulls Real Estate GDR † | 102,021 | 227,520 | ||||
32
| Number of | ||||||
| shares | Value (US $) | |||||
| Common StockΔ (continued) | ||||||
| India (continued) | ||||||
| Infosys | 2,640,000 | $ | 60,049,469 | |||
| Lupin | 2,500,000 | 29,410,658 | ||||
| Reliance Industries | 10,500,000 | 335,727,842 | ||||
| Reliance Industries GDR 144A # | 2,340,879 | 149,582,168 | ||||
| Tata Chemicals | 1,866,909 | 21,662,836 | ||||
| Tata Consultancy Services | 950,000 | 44,647,403 | ||||
| Tata Consumer Products | 2,128,276 | 22,070,650 | ||||
| Tata Motors † | 3,000,000 | 18,320,435 | ||||
| United Breweries | 1,000,000 | 20,027,825 | ||||
| Zee Entertainment Enterprises | 2,530,000 | 10,912,915 | ||||
| 776,360,721 | ||||||
| Indonesia – 1.23% | ||||||
| Astra Agro Lestari | 9,132,500 | 6,356,231 | ||||
| Astra International | 180,000,000 | 72,580,782 | ||||
| 78,937,013 | ||||||
| Malaysia – 0.02% | ||||||
| UEM Sunrise † | 17,000,000 | 1,251,336 | ||||
| 1,251,336 | ||||||
| Mexico – 3.61% | ||||||
| America Movil ADR Class L | 1,369,199 | 23,851,447 | ||||
| Banco Santander Mexico Institucion de Banca Multiple Grupo | ||||||
| Financiero Santander ADR | 8,042,900 | 49,222,548 | ||||
| Cemex ADR † | 2,326,397 | 14,307,341 | ||||
| Coca-Cola Femsa ADR | 600,000 | 29,472,000 | ||||
| Fomento Economico Mexicano ADR | 508,329 | 35,959,193 | ||||
| Grupo Financiero Banorte Class O | 4,000,000 | 23,829,311 | ||||
| Grupo Televisa ADR | 6,017,000 | 55,296,230 | ||||
| 231,938,070 | ||||||
| Peru – 0.37% | ||||||
| Cia de Minas Buenaventura ADR † | 3,217,400 | 23,519,194 | ||||
| 23,519,194 | ||||||
| Philippines – 0.25% | ||||||
| Monde Nissin 144A #, † | 49,002,500 | 16,341,610 | ||||
| 16,341,610 | ||||||
| Republic of Korea – 17.13% | ||||||
| KB Financial Group ADR | 245,928 | 10,914,285 | ||||
| LG Uplus | 2,403,542 | 27,353,214 | ||||
| Lotte | 300,000 | 7,310,998 | ||||
| Lotte Chilsung Beverage | 44,000 | 4,838,522 | ||||
33
Schedules of investments
Delaware Emerging Markets Fund
| Number of shares | Value (US $) | |||||
| Common StockΔ (continued) | ||||||
| Republic of Korea (continued) | ||||||
| Lotte Confectionery | 60,000 | $ | 5,608,977 | |||
| Samsung Electronics | 5,200,000 | 312,136,411 | ||||
| Samsung Life Insurance | 360,939 | 18,093,303 | ||||
| Shinhan Financial Group | 300,000 | 8,724,400 | ||||
| SK Hynix | 3,490,000 | 333,647,794 | ||||
| SK Square † | 1,707,973 | 97,770,994 | ||||
| SK Telecom | 2,642,027 | 120,975,954 | ||||
| SK Telecom ADR | 3,312,676 | 152,383,121 | ||||
| 1,099,757,973 | ||||||
| Russia – 6.50% | ||||||
| ENEL RUSSIA PJSC GDR † | 21,161 | 11,950 | ||||
| Etalon Group GDR 144A # | 1,616,300 | 2,182,005 | ||||
| Gazprom PJSC ADR | 14,600,000 | 129,515,082 | ||||
| LUKOIL PJSC ADR | 350,644 | 30,411,891 | ||||
| Mail.Ru Group GDR † | 551,200 | 9,226,766 | ||||
| Rosneft Oil PJSC GDR | 14,555,684 | 109,594,650 | ||||
| Sberbank of Russia PJSC | 12,000,000 | 51,637,617 | ||||
| Sberbank of Russia PJSC ADR | 800,000 | 13,481,259 | ||||
| Surgutneftegas PJSC ADR | 2,014,441 | 9,779,859 | ||||
| T Plus PJSC =, † | 36,096 | 0 | ||||
| VEON ADR † | 732,264 | 1,266,817 | ||||
| Yandex Class A † | 836,225 | 60,158,026 | ||||
| 417,265,922 | ||||||
| South Africa – 0.22% | ||||||
| Naspers Class N † | 86,398 | 13,353,475 | ||||
| Sun International † | 364,166 | 583,856 | ||||
| 13,937,331 | ||||||
| Taiwan – 16.09% | ||||||
| FIT Hon Teng 144A #, † | 38,000,000 | 7,804,380 | ||||
| MediaTek | 10,092,000 | 365,841,603 | ||||
| Taiwan Semiconductor Manufacturing | 31,000,000 | 659,329,428 | ||||
| 1,032,975,411 | ||||||
| Turkey – 0.57% | ||||||
| Akbank TAS | 19,500,000 | 9,288,258 | ||||
| D-MARKET Elektronik Hizmetler ve Ticaret ADR † | 144,600 | 354,270 | ||||
| Turk Telekomunikasyon | 951,192 | 683,084 | ||||
| Turkcell Iletisim Hizmetleri | 2,427,827 | 3,396,219 | ||||
| Turkcell Iletisim Hizmetleri ADR | 4,449,485 | 16,018,146 | ||||
34
| Number of shares | Value (US $) | ||||||
| Common StockΔ (continued) | |||||||
| Turkey (continued) | |||||||
| Turkiye Sise ve Cam Fabrikalari | 7,651,443 | $ | 7,015,185 | ||||
| 36,755,162 | |||||||
| United Kingdom – 0.06% | |||||||
| Griffin Mining † | 3,056,187 | 3,901,582 | |||||
| 3,901,582 | |||||||
| United States – 3.93% | |||||||
| ConocoPhillips | 580,000 | 40,675,400 | |||||
| Intel | 800,000 | 39,360,000 | |||||
| Micron Technology | 2,050,900 | 172,275,600 | |||||
| 252,311,000 | |||||||
| Total Common Stock (cost $4,903,524,401) | 6,322,467,791 | ||||||
| Preferred Stock – 2.08%Δ | |||||||
| Brazil – 0.73% | |||||||
| Braskem Class A †, ** | 1,470,000 | 12,951,093 | |||||
| Petroleo Brasileiro ADR 19.61% ** | 2,500,000 | 25,875,000 | |||||
| Usinas Siderurgicas de Minas Gerais Usiminas | |||||||
| Class A 8.77% ** | 3,235,733 | 7,816,155 | |||||
| 46,642,248 | |||||||
| Republic of Korea – 0.99% | |||||||
| Samsung Electronics 4.34% ** | 1,183,100 | 63,799,845 | |||||
| 63,799,845 | |||||||
| Russia – 0.36% | |||||||
| Transneft PJSC 6.43% ** | 12,000 | 22,959,597 | |||||
| 22,959,597 | |||||||
| Total Preferred Stock (cost $66,489,867) | 133,401,690 | ||||||
| Warrants – 0.01% | |||||||
| Argentina – 0.01% | |||||||
| IRSA Inversiones y Representaciones, | |||||||
| expiration date 3/5/26 † | 1,637,840 | 229,298 | |||||
| Total Warrants (cost $0) | 229,298 | ||||||
35
Schedules of investments
Delaware Emerging Markets Fund
| Number of shares | Value (US $) | ||||||
| Exchange-Traded Fund – 0.08% | |||||||
| iShares MSCI Turkey ETF | 290,275 | $ | 5,213,339 | ||||
| Total Exchange-Traded Fund | |||||||
| (cost $13,207,352) | 5,213,339 | ||||||
| Participation Notes – 0.00% | |||||||
| Lehman Indian Oil | |||||||
| CW 12 LEPO =, † | 172,132 | 0 | |||||
| Lehman Oil & Natural Gas | |||||||
| CW 12 LEPO =, † | 254,590 | 0 | |||||
| Total Participation Notes | |||||||
| (cost $8,559,057) | 0 | ||||||
| Total Value of Securities-100.64% | |||||||
| (cost $4,991,780,677) | $ | 6,461,312,118 | |||||
| Δ | Securities have been classified by country of risk. Aggregate classification by business sector has been presented on page 25 in “Security type / country and sector allocations.” |
| † | Non-income producing security. |
| # | Security exempt from registration under Rule 144A of the Securities Act of 1933, as amended. At November 30, 2021, the aggregate value of Rule 144A securities was $181,639,461, which represents 2.83% of the Fund’s net assets. See Note 12 in “Notes to financial statements.” |
| = | The value of this security was determined using significant unobservable inputs and is reported as a Level 3 security in the disclosure table located in Note 3 in “Notes to financial statements.” |
| ** | Perpetual security with no stated maturity date. |
Summary of abbreviations:
ADR – American Depositary Receipt
ETF – Exchange-Traded Fund
GDR – Global Depositary Receipt
LEPO – Low Exercise Price Option
MSCI – Morgan Stanley Capital International
PJSC – Private Joint Stock Company
See accompanying notes, which are an integral part of the financial statements.
36
| Schedules of investments | |
| Delaware International Small Cap Fund | November 30, 2021 |
| Number of shares | Value (US $) | |||||
| Common Stock – 96.83%Δ | ||||||
| Australia – 3.87% | ||||||
| Bapcor | 80,611 | $ | 408,415 | |||
| Domain Holdings Australia | 265,994 | 995,459 | ||||
| HUB24 | 53,769 | 1,109,223 | ||||
| Pro Medicus | 36,372 | 1,604,689 | ||||
| 4,117,786 | ||||||
| Austria – 0.39% | ||||||
| Vienna Insurance Group AG Wiener Versicherung Gruppe | 15,045 | 418,032 | ||||
| 418,032 | ||||||
| Brazil – 2.61% | ||||||
| Embraer ADR † | 50,331 | 691,044 | ||||
| Locaweb Servicos de Internet | 204,932 | 481,541 | ||||
| Meliuz | 597,136 | 316,527 | ||||
| Petro Rio † | 171,953 | 614,484 | ||||
| SLC Agricola | 99,531 | 677,721 | ||||
| 2,781,317 | ||||||
| Canada – 11.93% | ||||||
| Aritzia † | 39,407 | 1,561,535 | ||||
| ATS Automation Tooling Systems † | 73,507 | 2,743,026 | ||||
| Capital Power | 32,700 | 975,279 | ||||
| Endeavour Mining | 23,735 | 556,842 | ||||
| Enerplus | 230,156 | 2,174,632 | ||||
| Granite Real Estate Investment Trust | 29,804 | 2,299,022 | ||||
| Major Drilling Group International † | 163,879 | 1,103,260 | ||||
| Vermilion Energy † | 127,281 | 1,271,365 | ||||
| 12,684,961 | ||||||
| Denmark – 0.59% | ||||||
| Royal Unibrew | 5,891 | 627,871 | ||||
| 627,871 | ||||||
| Finland – 1.18% | ||||||
| Valmet | 30,758 | 1,258,625 | ||||
| 1,258,625 | ||||||
| France – 1.28% | ||||||
| SOITEC † | 5,184 | 1,364,925 | ||||
| 1,364,925 | ||||||
| Germany – 7.91% | ||||||
| Befesa | 18,641 | 1,233,526 | ||||
| Duerr | 28,730 | 1,143,965 | ||||
| Evotec † | 28,621 | 1,354,967 | ||||
37
Schedules of investments
Delaware International Small Cap Fund
| Number of shares | Value (US $) | |||||
| Common StockΔ (continued) | ||||||
| Germany (continued) | ||||||
| K+S † | 104,511 | $ | 1,775,203 | |||
| Salzgitter † | 31,340 | 926,905 | ||||
| Steico | 6,581 | 765,270 | ||||
| TAG Immobilien | 43,759 | 1,212,814 | ||||
| 8,412,650 | ||||||
| Hong Kong – 0.47% | ||||||
| LK Technology Holdings | 210,000 | 500,463 | ||||
| 500,463 | ||||||
| India – 3.93% | ||||||
| Affle India † | 44,860 | 687,640 | ||||
| Mahindra Logistics | 68,694 | 595,240 | ||||
| Varun Beverages | 118,385 | 1,403,380 | ||||
| Voltas | 93,260 | 1,489,199 | ||||
| 4,175,459 | ||||||
| Ireland – 1.11% | ||||||
| Glenveagh Properties † | 915,616 | 1,181,699 | ||||
| 1,181,699 | ||||||
| Israel – 1.84% | ||||||
| Inmode † | 25,763 | 1,957,988 | ||||
| 1,957,988 | ||||||
| Italy – 4.28% | ||||||
| Azimut Holding | 38,491 | 1,064,607 | ||||
| OVS † | 177,671 | 538,195 | ||||
| Reply | 9,057 | 1,752,812 | ||||
| Tinexta | 29,105 | 1,192,331 | ||||
| 4,547,945 | ||||||
| Japan – 19.57% | ||||||
| Amvis Holdings | 16,500 | 1,601,482 | ||||
| Asics | 62,500 | 1,547,591 | ||||
| Capcom | 26,900 | 669,551 | ||||
| CKD | 37,200 | 724,652 | ||||
| Dip | 30,600 | 1,066,934 | ||||
| DMG Mori | 56,300 | 874,122 | ||||
| Fujimi | 19,900 | 1,284,594 | ||||
| Insource | 32,100 | 691,429 | ||||
| Japan Elevator Service Holdings | 53,400 | 996,384 | ||||
| JMDC † | 19,800 | 1,582,506 | ||||
| Katitas | 39,500 | 1,455,883 | ||||
38
| Number of | ||||||
| shares | Value (US $) | |||||
| Common StockΔ (continued) | ||||||
| Japan (continued) | ||||||
| Mitsui High-Tec | 23,100 | $ | 1,850,779 | |||
| SMS | 38,700 | 1,437,150 | ||||
| SRE Holdings † | 17,300 | 1,374,557 | ||||
| Taiyo Yuden | 14,700 | 805,526 | ||||
| TechnoPro Holdings | 47,900 | 1,308,426 | ||||
| Tokyo Seimitsu | 21,000 | 881,298 | ||||
| Tsugami | 53,900 | 665,525 | ||||
| 20,818,389 | ||||||
| Mexico – 0.66% | ||||||
| Grupo Aeroportuario del Centro Norte † | 124,377 | 705,398 | ||||
| 705,398 | ||||||
| Norway – 1.45% | ||||||
| TOMRA Systems | 22,463 | 1,540,071 | ||||
| 1,540,071 | ||||||
| Republic of Korea – 6.22% | ||||||
| Doosan Fuel Cell † | 20,874 | 868,023 | ||||
| Hansae | 49,316 | 825,467 | ||||
| L&F | 8,126 | 1,532,468 | ||||
| LEENO Industrial | 7,909 | 1,317,640 | ||||
| OCI † | 14,296 | 1,317,214 | ||||
| Wonik QnC † | 33,437 | 755,182 | ||||
| 6,615,994 | ||||||
| Russia – 2.70% | ||||||
| Cian ADR † | 28,755 | 462,955 | ||||
| Detsky Mir PJSC | 409,635 | 767,211 | ||||
| HeadHunter Group ADR | 29,837 | 1,639,543 | ||||
| 2,869,709 | ||||||
| South Africa – 1.14% | ||||||
| Transaction Capital | 452,775 | 1,211,575 | ||||
| 1,211,575 | ||||||
| Spain – 0.91% | ||||||
| Banco de Sabadell † | 1,431,692 | 966,750 | ||||
| 966,750 | ||||||
| Sweden – 5.22% | ||||||
| Catena | 22,715 | 1,436,143 | ||||
| Fortnox | 20,597 | 1,256,542 | ||||
| Intrum | 21,350 | 535,685 | ||||
39
Schedules of investments
Delaware International Small Cap Fund
| Number of | ||||||
| shares | Value (US $) | |||||
| Common StockΔ (continued) | ||||||
| Sweden (continued) | ||||||
| MIPS | 17,512 | $ | 2,327,464 | |||
| 5,555,834 | ||||||
| Taiwan – 2.19% | ||||||
| Kindom Development | 665,600 | 919,115 | ||||
| Merida Industry | 41,000 | 440,307 | ||||
| Wafer Works | 329,000 | 968,012 | ||||
| 2,327,434 | ||||||
| United Kingdom – 15.38% | ||||||
| 888 Holdings | 25,696 | 106,009 | ||||
| Dechra Pharmaceuticals | 21,562 | 1,446,725 | ||||
| Electrocomponents | 156,165 | 2,515,590 | ||||
| Future | 66,698 | 3,183,569 | ||||
| Grafton Group | 108,965 | 1,694,095 | ||||
| Great Portland Estates | 100,199 | 956,912 | ||||
| Inchcape | 92,247 | 1,017,050 | ||||
| Keywords Studios | 39,018 | 1,400,046 | ||||
| Pagegroup | 123,670 | 1,037,014 | ||||
| Rotork | 154,417 | 698,658 | ||||
| S4 Capital † | 170,006 | 1,313,083 | ||||
| Savills | 55,599 | 987,890 | ||||
| 16,356,641 | ||||||
| Total Common Stock (cost $80,172,750) | 102,997,516 | |||||
| Short-Term Investments – 2.23% | ||||||
| Money Market Mutual Funds – 2.23% | ||||||
| BlackRock FedFund – Institutional Shares (seven-day effective | ||||||
| yield 0.03%) | 593,125 | 593,125 | ||||
| Fidelity Investments Money Market Government Portfolio – | ||||||
| Class I (seven-day effective yield 0.01%) | 593,124 | 593,124 | ||||
| GS Financial Square Government Fund – Institutional Shares | ||||||
| (seven-day effective yield 0.03%) | 593,124 | 593,124 | ||||
| Morgan Stanley Government Portfolio – Institutional Share | ||||||
| Class (seven-day effective yield 0.03%) | 593,124 | 593,124 | ||||
| Total Short-Term Investments (cost $2,372,497) | 2,372,497 | |||||
| Total Value of Securities–99.06% | ||||||
| (cost $82,545,247) | $ | 105,370,013 | ||||
| Δ | Securities have been classified by country of risk. Aggregate classification by business sector has been presented on page 27 in “Security type / country and sector allocations.” |
40
| † | Non-income producing security. |
The following foreign currency exchange contracts were outstanding at November 30, 2021:1
Foreign Currency Exchange Contracts
| Currency to | Settlement | Unrealized | |||||||||||
| Counterparty | Receive (Deliver) | In Exchange For | Date | Depreciation | |||||||||
| BNYM | GBP | (275,228 | ) | USD | 365,742 | 12/1/21 | $ | (297 | ) | ||||
| BNYM | GBP | (57,374 | ) | USD | 76,214 | 12/2/21 | (91 | ) | |||||
| BNYM | JPY | (955,800 | ) | USD | 8,392 | 12/1/21 | (63 | ) | |||||
| BNYM | JPY | (1,011,600 | ) | USD | 8,926 | 12/2/21 | (23 | ) | |||||
| BNYM | ZAR | (2,621,452 | ) | USD | 160,785 | 12/1/21 | (4,012 | ) | |||||
| BNYM | ZAR | (3,821,305 | ) | USD | 235,890 | 12/2/21 | (4,304 | ) | |||||
| BNYM | ZAR | (3,206,293 | ) | USD | 200,716 | 12/3/21 | (794 | ) | |||||
| Total Foreign Currency Exchange Contracts | $ | (9,584 | ) | ||||||||||
The use of foreign currency exchange contracts involves elements of market risk and risks in excess of the amounts disclosed in the financial statements. The foreign currency exchange contracts presented above represent the Fund’s total exposure in such contracts, whereas only the net unrealized appreciation (depreciation) is reflected in the Fund’s net assets.
| 1 | See Note 9 in “Notes to financial statements.” |
| Summary of abbreviations: |
| ADR – American Depositary Receipt |
| AG – Aktiengesellschaft |
| BNYM – Bank of New York Mellon |
| GS – Goldman Sachs |
| PJSC – Private Joint Stock Company |
| Summary of currencies: |
| GBP – British Pound Sterling |
| JPY – Japanese Yen |
| USD – US Dollar |
| ZAR – South Africa Rand |
See accompanying notes, which are an integral part of the financial statements.
41
| Schedules of investments | |
| Delaware International Value Equity Fund | November 30, 2021 |
| Number of | ||||||
| shares | Value (US $) | |||||
| Common Stock – 97.01%Δ | ||||||
| Denmark – 5.33% | ||||||
| Novo Nordisk Class B | 265,570 | $ | 28,429,285 | |||
| 28,429,285 | ||||||
| France – 17.85% | ||||||
| Air Liquide | 161,010 | 26,589,609 | ||||
| Danone | 363,290 | 21,366,365 | ||||
| Orange | 1,278,650 | 13,746,456 | ||||
| Publicis Groupe | 172,840 | 11,184,265 | ||||
| Sodexo † | 265,250 | 22,317,485 | ||||
| 95,204,180 | ||||||
| Germany – 13.75% | ||||||
| adidas AG | 74,110 | 21,433,918 | ||||
| Fresenius Medical Care AG & Co. | 385,170 | 22,964,765 | ||||
| Knorr-Bremse | 80,880 | 8,045,445 | ||||
| SAP | 162,920 | 20,878,397 | ||||
| 73,322,525 | ||||||
| Japan – 13.60% | ||||||
| Asahi Group Holdings | 251,400 | 9,271,728 | ||||
| Kao | 316,100 | 16,124,772 | ||||
| KDDI | 508,600 | 14,757,118 | ||||
| Kirin Holdings | 282,800 | 4,505,765 | ||||
| Lawson | 191,100 | 9,369,574 | ||||
| Seven & i Holdings | 460,200 | 18,535,680 | ||||
| 72,564,637 | ||||||
| Netherlands – 4.33% | ||||||
| Koninklijke Ahold Delhaize | 685,750 | 23,075,326 | ||||
| 23,075,326 | ||||||
| Spain – 4.75% | ||||||
| Amadeus IT Group † | 396,080 | 25,359,262 | ||||
| 25,359,262 | ||||||
| Sweden – 9.49% | ||||||
| Essity Class B | 534,060 | 17,053,647 | ||||
| H & M Hennes & Mauritz Class B * | 562,860 | 9,921,848 | ||||
| Securitas Class B | 1,635,290 | 23,627,161 | ||||
| 50,602,656 | ||||||
| Switzerland – 15.96% | ||||||
| Nestle * | 253,720 | 32,519,743 | ||||
| Roche Holding | 66,280 | 25,876,398 | ||||
42
| Number of | ||||||
| shares | Value (US $) | |||||
| Common StockΔ (continued) | ||||||
| Switzerland (continued) | ||||||
| Swatch Group | 91,090 | $ | 26,753,995 | |||
| 85,150,136 | ||||||
| United Kingdom – 11.95% | ||||||
| Diageo | 784,630 | 39,598,899 | ||||
| Smith & Nephew | 1,500,490 | 24,114,938 | ||||
| 63,713,837 | ||||||
| Total Common Stock (cost $502,892,989) | 517,421,844 | |||||
| Exchange-Traded Funds – 1.68% | ||||||
| iShares MSCI EAFE ETF * | 3,570 | 274,319 | ||||
| iShares Trust iShares ESG Aware MSCI EAFE ETF * | 108,600 | 8,365,458 | ||||
| Vanguard FTSE Developed Markets ETF * | 6,610 | 328,517 | ||||
| Total Exchange-Traded Funds | ||||||
| (cost $9,448,511) | 8,968,294 | |||||
| Short-Term Investments – 0.44% | ||||||
| Money Market Mutual Funds – 0.44% | ||||||
| BlackRock FedFund – Institutional Shares (seven-day effective | ||||||
| yield 0.03%) | 586,662 | 586,662 | ||||
| Fidelity Investments Money Market Government Portfolio – | ||||||
| Class I (seven-day effective yield 0.01%) | 586,662 | 586,662 | ||||
| GS Financial Square Government Fund – Institutional Shares | ||||||
| (seven-day effective yield 0.03%) | 586,661 | 586,661 | ||||
| Morgan Stanley Government Portfolio – Institutional Share | ||||||
| Class (seven-day effective yield 0.03%) | 586,661 | 586,661 | ||||
| Total Short-Term Investments (cost $2,346,646) | 2,346,646 | |||||
| Total Value of Securities Before | ||||||
| Securities Lending Collateral–99.13% | ||||||
| (cost $514,688,146) | 528,736,784 | |||||
| Principal | ||||||
| amount° | ||||||
| Securities Lending Collateral** – 3.36% | ||||||
| Certificates of Deposit – 0.45% | ||||||
| Canadian Imperial Bank of Commerce (Toronto) | ||||||
| 0.06% 12/1/2021 | 805,000 | 805,000 | ||||
| National Australia Bank (Cayman) 0.06% 12/1/2021 | 805,000 | 805,000 | ||||
| Royal Bank of Canada (Toronto) 0.05% 12/1/2021 | 805,000 | 805,000 | ||||
| 2,415,000 | ||||||
43
Schedules of investments
Delaware International Value Equity Fund
| Principal | |||||||
| amount° | Value (US $) | ||||||
| Securities Lending Collateral** (continued) | |||||||
| Repurchase Agreements – 2.91% | |||||||
| Bank of Montreal | |||||||
| 0.02%, dated 11/30/21, to be repurchased on 12/1/21, | |||||||
| repurchase price $3,825,894 (collateralized by US | |||||||
| government obligations 0.00%–2.875% 12/2/21–10/15/26; | |||||||
| market value $3,902,410) | 3,825,892 | $ | 3,825,892 | ||||
| Bank of Nova Scotia | |||||||
| 0.05%, dated 11/30/21, to be repurchased on 12/1/21, | |||||||
| repurchase price $3,825,897 (collateralized by US | |||||||
| government obligations 0.00%–2.875% 12/2/21–11/30/26; | |||||||
| market value $3,902,415) | 3,825,892 | 3,825,892 | |||||
| BOFA Securities | |||||||
| 0.05%, dated 11/30/21, to be repurchased on 12/1/21, | |||||||
| repurchase price $3,825,897 (collateralized by US | |||||||
| government obligations 0.125% 7/31/22; market value | |||||||
| $3,902,410) | 3,825,892 | 3,825,892 | |||||
| Credit Agricole | |||||||
| 0.05%, dated 11/30/21, to be repurchased on 12/1/21, | |||||||
| repurchase price $3,825,897 (collateralized by US | |||||||
| government obligations 0.105% 7/31/22; market value | |||||||
| $3,902,413) | 3,825,892 | 3,825,892 | |||||
| JP Morgan Securities | |||||||
| 0.05%, dated 11/30/21, to be repurchased on 12/1/21, | |||||||
| repurchase price $180,318 (collateralized by US government | |||||||
| obligations 0.00% 12/14/21–2/8/22; market value $183,925) | 180,318 | 180,318 | |||||
| 15,483,886 | |||||||
| Total Securities Lending Collateral (cost $17,898,886) | 17,898,886 | ||||||
| Total Value of Securities–102.49% | |||||||
| (cost $532,587,032) | $ | 546,635,670■ | |||||
| Δ | Securities have been classified by country of risk. Aggregate classification by business sector has been presented on page 29 in “Security type / country and sector allocations.” |
| † | Non-income producing security. |
| * | Fully or partially on loan. |
| ° | Principal amount shown is stated in USD unless noted that the security is denominated in another currency. |
| ** | See Note 11 in “Notes to financial statements” for additional information on securities lending collateral. |
| ■ | Includes $47,244,185 of securities loaned for which the counterparty pledged additional non-cash collateral valued at $32,331,946. |
44
The following foreign currency exchange contracts were outstanding at November 30, 2021:1
Foreign Currency Exchange Contracts
| Currency to | Settlement | Unrealized | Unrealized | ||||||||||||||||
| Counterparty | Receive (Deliver) | In Exchange For | Date | Appreciation | Depreciation | ||||||||||||||
| BNYM | DKK | (3,579,904 | ) | USD | 541,785 | 12/1/21 | $ | — | $ | (4,122 | ) | ||||||||
| BNYM | EUR | 1,858,236 | USD | (2,094,907 | ) | 12/1/21 | 12,557 | — | |||||||||||
| BNYM | GBP | 1,089,981 | USD | (1,450,315 | ) | 12/1/21 | — | (692 | ) | ||||||||||
| BNYM | GBP | (469,612 | ) | USD | 624,567 | 12/1/21 | 6 | — | |||||||||||
| BNYM | JPY | (96,275,673 | ) | USD | 846,230 | 12/1/21 | — | (5,506 | ) | ||||||||||
| Total Foreign Currency Exchange Contracts | $ | 12,563 | $ | (10,320 | ) | ||||||||||||||
The use of foreign currency exchange contracts involves elements of market risk and risks in excess of the amounts disclosed in the financial statements. The foreign currency exchange contracts presented above represent the Fund’s total exposure in such contracts, whereas only the net unrealized appreciation (depreciation) is reflected in the Fund’s net assets.
| 1 | See Note 9 in “Notes to financial statements.” |
Summary of abbreviations:
AG – Aktiengesellschaft
BNYM – Bank of New York Mellon
EAFE – Europe, Australasia, and Far East
ESG – Environmental, Social, and Governance
ETF – Exchange-Traded Fund
FTSE – Financial Times Stock Exchange
GS – Goldman Sachs
MSCI – Morgan Stanley Capital International
Summary of currencies:
DKK – Danish Krone
EUR – European Monetary Unit
GBP – British Pound Sterling
JPY – Japanese Yen
USD – US Dollar
See accompanying notes, which are an integral part of the financial statements.
45
| Statements of assets and liabilities | November 30, 2021 |
| Delaware | Delaware | |||||||||
| Delaware Emerging | International | International | ||||||||
| Markets Fund | Small Cap Fund | Value Equity Fund | ||||||||
| Assets: | ||||||||||
| Investments, at value*,† | $ | 6,461,312,118 | $ | 105,370,013 | $ | 528,736,784 | ||||
| Short-term investments held as collateral | ||||||||||
| for loaned securities, at value= | — | — | 17,898,886 | |||||||
| Foreign currencies, at valueΔ | 6,351,355 | 47,811 | 185,647 | |||||||
| Receivable for fund shares sold | 15,591,785 | 124,241 | 662,028 | |||||||
| Dividends and interest receivable | 2,998,060 | 61,722 | 263,526 | |||||||
| Receivable for securities sold | — | 1,092,037 | 5,137,214 | |||||||
| Foreign tax reclaims receivable | — | 131,585 | 3,203,534 | |||||||
| Unrealized appreciation on foreign | ||||||||||
| currency exchange contracts | — | — | 12,563 | |||||||
| Securities lending income receivable | — | — | 7,466 | |||||||
| Other assets | — | — | 12,749 | |||||||
| Total Assets | 6,486,253,318 | 106,827,409 | 556,120,397 | |||||||
46
| Delaware | Delaware | |||||||||
| Delaware Emerging | International | International | ||||||||
| Markets Fund | Small Cap Fund | Value Equity Fund | ||||||||
| Liabilities: | ||||||||||
| Due to custodian | 22,487,180 | — | 206 | |||||||
| Capital gains tax payable | 23,494,176 | — | — | |||||||
| Payable for fund shares redeemed | 10,882,634 | 77,010 | 690,655 | |||||||
| Investment management fees payable to | ||||||||||
| affiliates | 5,921,233 | 60,148 | 286,423 | |||||||
| Custody fees payable | 1,400,004 | 26,594 | 76,711 | |||||||
| Dividend disbursing and transfer agent | ||||||||||
| fees and expenses payable to | ||||||||||
| non-affiliates | 843,067 | 16,883 | 107,516 | |||||||
| Reports and statements to shareholders | ||||||||||
| expenses payable to non-affiliates | 235,448 | 11,251 | 31,251 | |||||||
| Distribution fees payable to affiliates | 182,057 | 3,831 | 50,688 | |||||||
| Accounting and administration expenses | ||||||||||
| payable to non-affiliates | 153,451 | 11,658 | 22,429 | |||||||
| Dividend disbursing and transfer agent | ||||||||||
| fees and expenses payable to affiliates | 46,411 | 796 | 3,960 | |||||||
| Legal fees payable to non-affiliates | 31,805 | 524 | 2,384 | |||||||
| Accounting and administration expenses | ||||||||||
| payable to affiliates | 19,887 | 664 | 1,997 | |||||||
| Trustees’ fees and expenses payable to | ||||||||||
| affiliates | 19,790 | 343 | 1,705 | |||||||
| Other accrued expenses | 16,941 | 12,972 | 7,616 | |||||||
| Audit and tax fees payable | 5,949 | 5,949 | 11,124 | |||||||
| Registration fees payable to affiliates | 2,699 | 30,061 | 2,710 | |||||||
| Legal fees payable to affiliates | 2,677 | 247 | 1,225 | |||||||
| Payable for securities purchased | — | — | 3,557,048 | |||||||
| Obligation to return securities lending | ||||||||||
| collateral | — | — | 17,898,360 | |||||||
| Unrealized depreciation on foreign | ||||||||||
| currency exchange contracts | — | 9,584 | 10,320 | |||||||
| Other liabilities | — | 188,244 | 550 | |||||||
| Reports and statements to shareholders | ||||||||||
| expenses payable to affiliates | — | 121 | 624 | |||||||
| Total Liabilities | 65,745,409 | 456,880 | 22,765,502 | |||||||
| Total Net Assets | $ | 6,420,507,909 | $ | 106,370,529 | $ | 533,354,895 | ||||
47
Statements of assets and liabilities
| Delaware | Delaware | ||||||||||||
| Delaware Emerging | International | International | |||||||||||
| Markets Fund | Small Cap Fund | Value Equity Fund | |||||||||||
| Net Assets Consist of: | |||||||||||||
| Paid-in capital | $ | 5,038,360,387 | $ | 79,041,676 | $ | 484,985,408 | |||||||
| Total distributable earnings (loss) | 1,382,147,522 | 27,328,853 | 48,369,487 | ||||||||||
| Total Net Assets | $ | 6,420,507,909 | $ | 106,370,529 | $ | 533,354,895 | |||||||
| Net Asset Value | |||||||||||||
| Class A: | |||||||||||||
| Net assets | $ | 361,527,841 | $ | 9,534,760 | $ | 201,366,772 | |||||||
| Shares of beneficial interest outstanding, | |||||||||||||
| unlimited authorization, no par | 14,976,057 | 999,559 | 13,015,194 | ||||||||||
| Net asset value per share | $ | 24.14 | $ | 9.54 | $ | 15.47 | |||||||
| Sales charge | 5.75 | % | 5.75 | % | 5.75 | % | |||||||
| Offering price per share, equal to net asset | |||||||||||||
| value per share / (1 - sales charge) | $ | 25.61 | $ | 10.12 | $ | 16.41 | |||||||
| Class C: | |||||||||||||
| Net assets | $ | 105,473,986 | $ | 1,954,657 | $ | 4,548,964 | |||||||
| Shares of beneficial interest outstanding, | |||||||||||||
| unlimited authorization, no par | 4,775,565 | 248,813 | 297,701 | ||||||||||
| Net asset value per share | $ | 22.09 | $ | 7.86 | $ | 15.28 | |||||||
| Class R: | |||||||||||||
| Net assets | $ | 34,147,658 | $ | 159,026 | $ | 4,941,074 | |||||||
| Shares of beneficial interest outstanding, | |||||||||||||
| unlimited authorization, no par | 1,408,902 | 17,719 | 320,773 | ||||||||||
| Net asset value per share | $ | 24.24 | $ | 8.97 | $ | 15.40 | |||||||
| Institutional Class: | |||||||||||||
| Net assets | $ | 3,728,519,619 | $ | 73,091,043 | $ | 318,766,514 | |||||||
| Shares of beneficial interest outstanding, | |||||||||||||
| unlimited authorization, no par | 153,102,258 | 7,269,064 | 20,502,060 | ||||||||||
| Net asset value per share | $ | 24.35 | $ | 10.06 | $ | 15.55 | |||||||
| Class R6: | |||||||||||||
| Net assets | $ | 2,190,838,805 | $ | 21,631,043 | $ | 3,731,571 | |||||||
| Shares of beneficial interest outstanding, | |||||||||||||
| unlimited authorization, no par | 89,844,842 | 2,142,959 | 239,778 | ||||||||||
| Net asset value per share | $ | 24.38 | $ | 10.09 | $ | 15.56 | |||||||
| ____________________ | |||||||||||||
| *Investments, at cost | $ | 4,991,780,677 | $ | 82,545,247 | $ | 514,688,146 | |||||||
| † Including securities on loan | — | — | 47,244,185 | ||||||||||
| = Short-term investments held as collateral for loaned | |||||||||||||
| securities, at cost | — | — | 17,898,886 | ||||||||||
| Δ Foreign currencies, at cost | 6,440,604 | 48,388 | 183,414 | ||||||||||
See accompanying notes, which are an integral part of the financial statements.
48
| Statements of operations | |
| Delaware International Funds | Year ended November 30, 2021 |
| Delaware | Delaware | |||||||||||
| Delaware Emerging | International | International | ||||||||||
| Markets Fund | Small Cap Fund | Value Equity Fund | ||||||||||
| Investment Income: | ||||||||||||
| Dividends | $ | 265,682,397 | $ | 1,311,153 | $ | 10,007,149 | ||||||
| Interest | — | 19,938 | — | |||||||||
| Securities lending income | — | — | 59,061 | |||||||||
| Foreign tax withheld | (19,407,519 | ) | (140,595 | ) | (1,233,839 | ) | ||||||
| 246,274,878 | 1,190,496 | 8,832,371 | ||||||||||
| Expenses: | ||||||||||||
| Management fees | 76,271,500 | 1,015,093 | 3,790,988 | |||||||||
| Distribution expenses — Class A | 1,010,029 | 22,991 | 316,619 | |||||||||
| Distribution expenses — Class C | 1,234,443 | 25,526 | 55,228 | |||||||||
| Distribution expenses — Class R | 201,151 | 918 | 23,612 | |||||||||
| Dividend disbursing and transfer agent fees and expenses | 6,774,069 | 122,614 | 499,553 | |||||||||
| Custodian fees | 3,118,542 | 57,324 | 123,403 | |||||||||
| Accounting and administration expenses | 1,120,780 | 58,119 | 112,811 | |||||||||
| Reports and statements to shareholders expenses | 572,731 | 19,413 | 188,766 | |||||||||
| Registration fees | 372,232 | 83,002 | 96,224 | |||||||||
| Legal fees | 328,791 | 13,124 | 61,554 | |||||||||
| Trustees’ fees and expenses | 228,038 | 4,118 | 14,104 | |||||||||
| Audit and tax fees | 50,968 | 39,581 | 78,738 | |||||||||
| Other | 139,806 | 30,835 | 28,369 | |||||||||
| 91,423,080 | 1,492,658 | 5,389,969 | ||||||||||
| Less expenses waived | (1,685,241 | ) | (151,665 | ) | (870,343 | ) | ||||||
| Less expenses paid indirectly | (1,319 | ) | (53 | ) | (496 | ) | ||||||
| Total operating expenses | 89,736,520 | 1,340,940 | 4,519,130 | |||||||||
| Net Investment Income (Loss) | 156,538,358 | (150,444 | ) | 4,313,241 | ||||||||
49
Statements of operations
Delaware International Funds
| Delaware | Delaware | |||||||||||
| Delaware Emerging | International | International | ||||||||||
| Markets Fund | Small Cap Fund | Value Equity Fund | ||||||||||
| Net Realized and Unrealized Gain (Loss): | ||||||||||||
| Net realized gain (loss) on: | ||||||||||||
| Investments | $ | (155,418,354 | ) | $ | 21,213,703 | $ | 35,505,579 | |||||
| Foreign currencies | (430,131 | ) | (32,191 | ) | 127,045 | |||||||
| Foreign currency exchange contracts | (265,924 | ) | (185,295 | ) | (368,030 | ) | ||||||
| Net realized gain (loss) | (156,114,409 | ) | 20,996,217 | 35,264,594 | ||||||||
| Net change in unrealized appreciation (depreciation) of: | ||||||||||||
| Investments1 | 92,739,640 | (8,105,374 | ) | (37,719,819 | ) | |||||||
| Foreign currencies | (223,872 | ) | (154,451 | ) | (91,343 | ) | ||||||
| Foreign currency exchange contracts | 1,136 | (9,584 | ) | 6,581 | ||||||||
| Net change in unrealized appreciation (depreciation) | 92,516,904 | (8,269,409 | ) | (37,804,581 | ) | |||||||
| Net Realized and Unrealized Gain (Loss) | (63,597,505 | ) | 12,726,808 | (2,539,987 | ) | |||||||
| Net Increase in Net Assets Resulting from Operations | $ | 92,940,853 | $ | 12,576,364 | $ | 1,773,254 | ||||||
| 1 | Includes $3,525 capital gains taxes paid and $23,494,176 increase in capital gains tax accrued for Delaware Emerging Markets Fund. Includes $188,244 increase in capital gains tax accrued in Delaware International Small Cap Fund. |
See accompanying notes, which are an integral part of the financial statements.
50
Statements of changes in net assets
Delaware Emerging Markets Fund
| Year ended | ||||||||
| 11/30/21 | 11/30/20 | |||||||
| Increase (Decrease) in Net Assets from Operations: | ||||||||
| Net investment income | $ | 156,538,358 | $ | 22,775,764 | ||||
| Net realized gain (loss) | (156,114,409 | ) | 60,472,633 | |||||
| Net change in unrealized appreciation (depreciation) | 92,516,904 | 962,217,181 | ||||||
| Net increase in net assets resulting from operations | 92,940,853 | 1,045,465,578 | ||||||
| Dividends and Distributions to Shareholders from: | ||||||||
| Distributable earnings: | ||||||||
| Class A | (2,191,579 | ) | (2,106,361 | ) | ||||
| Class C | (777,266 | ) | — | |||||
| Class R | (233,457 | ) | (134,733 | ) | ||||
| Institutional Class | (31,453,917 | ) | (32,655,147 | ) | ||||
| Class R6 | (9,680,857 | ) | (9,240,260 | ) | ||||
| (44,337,076 | ) | (44,136,501 | ) | |||||
| Capital Share Transactions: | ||||||||
| Proceeds from shares sold: | ||||||||
| Class A | 92,377,068 | 76,335,194 | ||||||
| Class C | 18,657,537 | 7,687,667 | ||||||
| Class R | 8,550,198 | 6,538,377 | ||||||
| Institutional Class | 1,680,473,003 | 1,160,950,980 | ||||||
| Class R6 | 1,503,974,331 | 277,336,004 | ||||||
| Net asset value of shares issued upon reinvestment of dividends and distributions: | ||||||||
| Class A | 2,086,866 | 1,975,692 | ||||||
| Class C | 767,990 | — | ||||||
| Class R | 233,456 | 134,501 | ||||||
| Institutional Class | 28,046,095 | 28,322,042 | ||||||
| Class R6 | 6,192,889 | 4,324,074 | ||||||
| 3,341,359,433 | 1,563,604,531 | |||||||
51
Statements of changes in net assets
Delaware Emerging Markets Fund
| Year ended | ||||||||
| 11/30/21 | 11/30/20 | |||||||
| Capital Share Transactions (continued): | ||||||||
| Cost of shares redeemed: | ||||||||
| Class A | $ | (103,991,549 | ) | $ | (126,070,388 | ) | ||
| Class C | (35,479,357 | ) | (46,172,300 | ) | ||||
| Class R | (14,381,448 | ) | (20,009,580 | ) | ||||
| Institutional Class | (2,119,024,485 | ) | (1,656,472,701 | ) | ||||
| Class R6 | (427,423,318 | ) | (337,875,551 | ) | ||||
| (2,700,300,157 | ) | (2,186,600,520 | ) | |||||
| Increase (decrease) in net assets derived from capital share transactions | 641,059,276 | (622,995,989 | ) | |||||
| Net Increase in Net Assets | 689,663,053 | 378,333,088 | ||||||
| Net Assets: | ||||||||
| Beginning of year | 5,730,844,856 | 5,352,511,768 | ||||||
| End of year | $ | 6,420,507,909 | $ | 5,730,844,856 | ||||
See accompanying notes, which are an integral part of the financial statements.
52
Statements of changes in net assets
Delaware International Small Cap Fund
| Year ended | ||||||||
| 11/30/21 | 11/30/20 | |||||||
| Increase (Decrease) in Net Assets from Operations: | ||||||||
| Net investment income (loss) | $ | (150,444 | ) | $ | 206,308 | |||
| Net realized gain | 20,996,217 | 6,805,352 | ||||||
| Net change in unrealized appreciation (depreciation) | (8,269,409 | ) | 12,304,635 | |||||
| Net increase in net assets resulting from operations | 12,576,364 | 19,316,295 | ||||||
| Dividends and Distributions to Shareholders from: | ||||||||
| Distributable earnings: | ||||||||
| Institutional Class | — | (202,016 | ) | |||||
| Class R6 | — | (7,968 | ) | |||||
| Return of capital: | ||||||||
| Institutional Class | — | (20,169 | ) | |||||
| Class R6 | — | (2,752 | ) | |||||
| — | (232,905 | ) | ||||||
| Capital Share Transactions: | ||||||||
| Proceeds from shares sold: | ||||||||
| Class A | 3,088,137 | 1,273,028 | ||||||
| Class C | 58,611 | 422,284 | ||||||
| Class R | 8,558 | 201,431 | ||||||
| Institutional Class | 9,773,696 | 15,641,483 | ||||||
| Class R6 | 8,484,030 | 9,711,200 | ||||||
| Net asset value of shares issued upon reinvestment of | ||||||||
| dividends and distributions: | ||||||||
| Institutional Class | — | 202,956 | ||||||
| Class R6 | — | 4,763 | ||||||
| 21,413,032 | 27,457,145 | |||||||
53
Statements of changes in net assets
Delaware International Small Cap Fund
| Year ended | ||||||||||
| 11/30/21 | 11/30/20 | |||||||||
| Capital Share Transactions (continued): | ||||||||||
| Cost of shares redeemed: | ||||||||||
| Class A | $ | (1,863,927 | ) | $ | (6,084,064 | ) | ||||
| Class C | (1,507,039 | ) | (1,406,868 | ) | ||||||
| Class R | (218,860 | ) | (8,104 | ) | ||||||
| Institutional Class | (38,037,501 | ) | (57,306,700 | ) | ||||||
| Class R6 | (774,529 | ) | (3,006,521 | ) | ||||||
| (42,401,856 | ) | (67,812,257 | ) | |||||||
| Decrease in net assets derived from capital share | ||||||||||
| transactions | (20,988,824 | ) | (40,355,112 | ) | ||||||
| Net Decrease in Net Assets | (8,412,460 | ) | (21,271,722 | ) | ||||||
| Net Assets: | ||||||||||
| Beginning of year | 114,782,989 | 136,054,711 | ||||||||
| End of year | $ | 106,370,529 | $ | 114,782,989 | ||||||
See accompanying notes, which are an integral part of the financial statements.
54
Statements of changes in net assets
Delaware International Value Equity Fund
| Year ended | ||||||||||
| 11/30/21 | 11/30/20 | |||||||||
| Increase (Decrease) in Net Assets from Operations: | ||||||||||
| Net investment income | $ | 4,313,241 | $ | 2,798,511 | ||||||
| Net realized gain | 35,264,594 | 437,909 | ||||||||
| Net change in unrealized appreciation (depreciation) | (37,804,581 | ) | 6,710,802 | |||||||
| Net increase in net assets resulting from operations | 1,773,254 | 9,947,222 | ||||||||
| Dividends and Distributions to Shareholders from: | ||||||||||
| Distributable earnings: | ||||||||||
| Class A | (962,517 | ) | (1,689,196 | ) | ||||||
| Class C | (45,886 | ) | (164,835 | ) | ||||||
| Class R | (40,540 | ) | (82,337 | ) | ||||||
| Institutional Class | (4,611,994 | ) | (6,547,235 | ) | ||||||
| Class R6 | (30,364 | ) | (60,572 | ) | ||||||
| (5,691,301 | ) | (8,544,175 | ) | |||||||
| Capital Share Transactions: | ||||||||||
| Proceeds from shares sold: | ||||||||||
| Class A | 60,313,862 | 8,432,761 | ||||||||
| Class C | 472,619 | 893,450 | ||||||||
| Class R | 3,436,609 | 1,512,848 | ||||||||
| Institutional Class | 71,593,274 | 105,325,379 | ||||||||
| Class R6 | 2,720,260 | 259,964 | ||||||||
| Net assets from merger:1 | ||||||||||
| Class A | 123,151,872 | — | ||||||||
| Institutional Class | 130,443,502 | — | ||||||||
| Class R6 | 184,692 | — | ||||||||
| Net asset value of shares issued upon reinvestment of | ||||||||||
| dividends and distributions: | ||||||||||
| Class A | 943,519 | 1,649,987 | ||||||||
| Class C | 45,884 | 164,645 | ||||||||
| Class R | 40,540 | 82,336 | ||||||||
| Institutional Class | 4,604,032 | 6,527,472 | ||||||||
| Class R6 | 5,491 | 56,322 | ||||||||
| 397,956,156 | 124,905,164 | |||||||||
55
Statements of changes in net assets
Delaware International Value Equity Fund
| Year ended | ||||||||||
| 11/30/21 | 11/30/20 | |||||||||
| Capital Share Transactions (continued): | ||||||||||
| Cost of shares redeemed: | ||||||||||
| Class A | $ | (34,560,175 | ) | $ | (12,515,028 | ) | ||||
| Class C | (2,430,458 | ) | (3,325,090 | ) | ||||||
| Class R | (1,496,630 | ) | (2,174,632 | ) | ||||||
| Institutional Class | (140,588,542 | ) | (94,119,755 | ) | ||||||
| Class R6 | (666,061 | ) | (786,459 | ) | ||||||
| (179,741,866 | ) | (112,920,964 | ) | |||||||
| Increase in net assets derived from capital share transactions | 218,214,290 | 11,984,200 | ||||||||
| Net Increase in Net Assets | 214,296,243 | 13,387,247 | ||||||||
| Net Assets: | ||||||||||
| Beginning of year | 319,058,652 | 305,671,405 | ||||||||
| End of year | $ | 533,354,895 | $ | 319,058,652 | ||||||
| 1 | See Note 7 in “Notes to financial statements.” |
See accompanying notes, which are an integral part of the financial statements.
56
Financial highlights
Delaware Emerging Markets Fund Class A
Selected data for each share of the Fund outstanding throughout each period were as follows:
| Net asset value, beginning of period |
| Income (loss) from investment operations: |
| Net investment income1 |
| Net realized and unrealized gain (loss) |
| Total from investment operations |
| Less dividends and distributions from: |
| Net investment income |
| Net realized gain |
| Total dividends and distributions |
| Net asset value, end of period |
| Total return2 |
| Ratios and supplemental data: |
| Net assets, end of period (000 omitted) |
| Ratio of expenses to average net assets4 |
| Ratio of expenses to average net assets prior to fees waived4 |
| Ratio of net investment income to average net assets |
| Ratio of net investment income to average net assets prior to fees waived |
| Portfolio turnover |
| 1 | Calculated using average shares outstanding. |
| 2 | Total return is based on the change in net asset value of a share during the period and assumes reinvestment of dividends and distributions at net asset value and does not reflect the impact of a sales charge. |
| 3 | Total return during the period reflects a waiver by the manager. Performance would have been lower had the waiver not been in effect. |
| 4 | Expense ratios do not include expenses of the Underlying Funds in which the Fund invests. |
See accompanying notes, which are an integral part of the financial statements.
58
| Year ended | ||||||||||||||||||||
| 11/30/21 | 11/30/20 | 11/30/19 | 11/30/18 | 11/30/17 | ||||||||||||||||
| $ | 23.67 | $ | 19.13 | $ | 17.53 | $ | 20.10 | $ | 14.57 | |||||||||||
| 0.54 | 0.04 | 0.11 | 0.07 | 0.19 | ||||||||||||||||
| 0.07 | 4.62 | 1.55 | (2.32 | ) | 5.44 | |||||||||||||||
| 0.61 | 4.66 | 1.66 | (2.25 | ) | 5.63 | |||||||||||||||
| — | (0.12 | ) | (0.06 | ) | (0.32 | ) | (0.10 | ) | ||||||||||||
| (0.14 | ) | — | — | — | — | |||||||||||||||
| (0.14 | ) | (0.12 | ) | (0.06 | ) | (0.32 | ) | (0.10 | ) | |||||||||||
| $ | 24.14 | $ | 23.67 | $ | 19.13 | $ | 17.53 | $ | 20.10 | |||||||||||
| 2.57% | 3 | 24.44% | 3 | 9.50% | (11.40% | ) | 38.94% | 3 | ||||||||||||
| $ | 361,528 | $ | 364,314 | $ | 346,732 | $ | 353,094 | $ | 463,441 | |||||||||||
| 1.57% | 1.62% | 1.63% | 1.63% | 1.66% | ||||||||||||||||
| 1.59% | 1.63% | 1.63% | 1.63% | 1.66% | ||||||||||||||||
| 2.08% | 0.21% | 0.62% | 0.35% | 1.10% | ||||||||||||||||
| 2.06% | 0.20% | 0.62% | 0.35% | 1.10% | ||||||||||||||||
| 4 | 5% | 10% | 11% | 11% | ||||||||||||||||
59
Financial highlights
Delaware Emerging Markets Fund Class C
Selected data for each share of the Fund outstanding throughout each period were as follows:
| Net asset value, beginning of period |
| Income (loss) from investment operations: |
| Net investment income (loss)1 |
| Net realized and unrealized gain (loss) |
| Total from investment operations |
| Less dividends and distributions from: |
| Net investment income |
| Net realized gain |
| Total dividends and distributions |
| Net asset value, end of period |
| Total return2 |
| Ratios and supplemental data: |
| Net assets, end of period (000 omitted) |
| Ratio of expenses to average net assets4 |
| Ratio of expenses to average net assets prior to fees waived4 |
| Ratio of net investment income (loss) to average net assets |
| Ratio of net investment income (loss) to average net assets prior to fees waived |
| Portfolio turnover |
| 1 | Calculated using average shares outstanding. |
| 2 | Total return is based on the change in net asset value of a share during the period and assumes reinvestment of dividends and distributions at net asset value and does not reflect the impact of a sales charge. |
| 3 | Total return during the period reflects a waiver by the manager. Performance would have been lower had the waiver not been in effect. |
| 4 | Expense ratios do not include expenses of the Underlying Funds in which the Fund invests. |
See accompanying notes, which are an integral part of the financial statements.
60
| Year ended | ||||||||||||||||||||
| 11/30/21 | 11/30/20 | 11/30/19 | 11/30/18 | 11/30/17 | ||||||||||||||||
| $ | 21.83 | $ | 17.67 | $ | 16.26 | $ | 18.68 | $ | 13.56 | |||||||||||
| 0.32 | (0.10 | ) | (0.02 | ) | (0.07 | ) | 0.06 | |||||||||||||
| 0.08 | 4.26 | 1.43 | (2.16 | ) | 5.07 | |||||||||||||||
| 0.40 | 4.16 | 1.41 | (2.23 | ) | 5.13 | |||||||||||||||
| — | — | — | (0.19 | ) | (0.01 | ) | ||||||||||||||
| (0.14 | ) | — | — | — | — | |||||||||||||||
| (0.14 | ) | — | — | (0.19 | ) | (0.01 | ) | |||||||||||||
| $ | 22.09 | $ | 21.83 | $ | 17.67 | $ | 16.26 | $ | 18.68 | |||||||||||
| 1.82% | 3 | 23.54% | 3 | 8.67% | (12.05% | ) | 37.87% | 3 | ||||||||||||
| $ | 105,474 | $ | 118,977 | $ | 135,346 | $ | 152,857 | $ | 190,227 | |||||||||||
| 2.32% | 2.37% | 2.38% | 2.38% | 2.41% | ||||||||||||||||
| 2.34% | 2.38% | 2.38% | 2.38% | 2.41% | ||||||||||||||||
| 1.33% | (0.54% | ) | (0.13% | ) | (0.40% | ) | 0.35% | |||||||||||||
| 1.31% | (0.55% | ) | (0.13% | ) | (0.40% | ) | 0.35% | |||||||||||||
| 4% | 5% | 10% | 11% | 11% | ||||||||||||||||
61
Financial highlights
Delaware Emerging Markets Fund Class R
Selected data for each share of the Fund outstanding throughout each period were as follows:
| Net asset value, beginning of period |
| Income (loss) from investment operations: |
| Net investment income (loss)1 |
| Net realized and unrealized gain (loss) |
| Total from investment operations |
| Less dividends and distributions from: |
| Net investment income |
| Net realized gain |
| Total dividends and distributions |
| Net asset value, end of period |
| Total return3 |
| Ratios and supplemental data: |
| Net assets, end of period (000 omitted) |
| Ratio of expenses to average net assets5 |
| Ratio of expenses to average net assets prior to fees waived5 |
| Ratio of net investment income (loss) to average net assets |
| Ratio of net investment income (loss) to average net assets prior to fees waived |
| Portfolio turnover |
| 1 | Calculated using average shares outstanding. |
| 2 | Amount is less than $0.005 per share. |
| 3 | Total return is based on the change in net asset value of a share during the period and assumes reinvestment of dividends and distributions at net asset value. |
| 4 | Total return during the period reflects a waiver by the manager and/or distributor. Performance would have been lower had the waiver not been in effect. |
| 5 | Expense ratios do not include expenses of the Underlying Funds in which the Fund invests. |
See accompanying notes, which are an integral part of the financial statements.
62
| Year ended | ||||||||||||||||||||
| 11/30/21 | 11/30/20 | 11/30/19 | 11/30/18 | 11/30/17 | ||||||||||||||||
| $ | 23.82 | $ | 19.25 | $ | 17.62 | $ | 20.21 | $ | 14.66 | |||||||||||
| 0.48 | (0.01 | ) | 0.07 | 0.02 | 0.15 | |||||||||||||||
| 0.08 | 4.64 | 1.56 | (2.34 | ) | 5.47 | |||||||||||||||
| 0.56 | 4.63 | 1.63 | (2.32 | ) | 5.62 | |||||||||||||||
| — | (0.06 | ) | — | 2 | (0.27 | ) | (0.07 | ) | ||||||||||||
| (0.14 | ) | — | — | — | — | |||||||||||||||
| (0.14 | ) | (0.06 | ) | — | (0.27 | ) | (0.07 | ) | ||||||||||||
| $ | 24.24 | $ | 23.82 | $ | 19.25 | $ | 17.62 | $ | 20.21 | |||||||||||
| 2.34% | 4 | 24.11% | 4 | 9.28% | (11.64% | ) | 38.51% | 4 | ||||||||||||
| $ | 34,148 | $ | 38,689 | $ | 43,962 | $ | 48,875 | $ | 61,735 | |||||||||||
| 1.82% | 1.87% | 1.88% | 1.88% | 1.91% | ||||||||||||||||
| 1.84% | 1.88% | 1.88% | 1.88% | 1.91% | ||||||||||||||||
| 1.83% | (0.04% | ) | 0.37% | 0.10% | 0.85% | |||||||||||||||
| 1.81% | (0.05% | ) | 0.37% | 0.10% | 0.85% | |||||||||||||||
| 4% | 5% | 10% | 11% | 11% | ||||||||||||||||
63
Financial highlights
Delaware Emerging Markets Fund Institutional Class
Selected data for each share of the Fund outstanding throughout each period were as follows:
| Net asset value, beginning of period |
| Income (loss) from investment operations: |
| Net investment income1 |
| Net realized and unrealized gain (loss) |
| Total from investment operations |
| Less dividends and distributions from: |
| Net investment income |
| Net realized gain |
| Total dividends and distributions |
| Net asset value, end of period |
| Total return2 |
| Ratios and supplemental data: |
| Net assets, end of period (000 omitted) |
| Ratio of expenses to average net assets4 |
| Ratio of expenses to average net assets prior to fees waived4 |
| Ratio of net investment income to average net assets |
| Ratio of net investment income to average net assets prior to fees waived |
| Portfolio turnover |
| 1 | Calculated using average shares outstanding. |
| 2 | Total return is based on the change in net asset value of a share during the period and assumes reinvestment of dividends and distributions at net asset value. |
| 3 | Total return during the period reflects a waiver by the manager. Performance would have been lower had the waiver not been in effect. |
| 4 | Expense ratios do not include expenses of the Underlying Funds in which the Fund invests. |
See accompanying notes, which are an integral part of the financial statements.
64
| Year ended | ||||||||||||||||||||||
| 11/30/21 | 11/30/20 | 11/30/19 | 11/30/18 | 11/30/17 | ||||||||||||||||||
| $ | 23.85 | $ | 19.27 | $ | 17.67 | $ | 20.26 | $ | 14.69 | |||||||||||||
| 0.61 | 0.09 | 0.16 | 0.12 | 0.25 | ||||||||||||||||||
| 0.07 | 4.66 | 1.55 | (2.34 | ) | 5.46 | |||||||||||||||||
| 0.68 | 4.75 | 1.71 | (2.22 | ) | 5.71 | |||||||||||||||||
| (0.04 | ) | (0.17 | ) | (0.11 | ) | (0.37 | ) | (0.14 | ) | |||||||||||||
| (0.14 | ) | — | — | — | — | |||||||||||||||||
| (0.18 | ) | (0.17 | ) | (0.11 | ) | (0.37 | ) | (0.14 | ) | |||||||||||||
| $ | 24.35 | $ | 23.85 | $ | 19.27 | $ | 17.67 | $ | 20.26 | |||||||||||||
| 2.84% | 3 | 24.76% | 3 | 9.79% | (11.21% | ) | 39.23% | 3 | ||||||||||||||
| $ | 3,728,519 | $ | 4,078,412 | $ | 3,826,272 | $ | 4,189,528 | $ | 3,885,606 | |||||||||||||
| 1.32% | 1.37% | 1.38% | 1.38% | 1.41% | ||||||||||||||||||
| 1.34% | 1.38% | 1.38% | 1.38% | 1.41% | ||||||||||||||||||
| 2.33% | 0.46% | 0.87% | 0.60% | 1.35% | ||||||||||||||||||
| 2.31% | 0.45% | 0.87% | 0.60% | 1.35% | ||||||||||||||||||
| 4% | 5% | 10% | 11% | 11% | ||||||||||||||||||
65
Financial highlights
Delaware Emerging Markets Fund Class R6
Selected data for each share of the Fund outstanding throughout each period were as follows:
| Net asset value, beginning of period |
| Income (loss) from investment operations: |
| Net investment income1 |
| Net realized and unrealized gain (loss) |
| Total from investment operations |
| Less dividends and distributions from: |
| Net investment income |
| Net realized gain |
| Total dividends and distributions |
| Net asset value, end of period |
| Total return2 |
| Ratios and supplemental data: |
| Net assets, end of period (000 omitted) |
| Ratio of expenses to average net assets4 |
| Ratio of expenses to average net assets prior to fees waived4 |
| Ratio of net investment income to average net assets |
| Ratio of net investment income to average net assets prior to fees waived |
| Portfolio turnover |
| 1 | Calculated using average shares outstanding. |
| 2 | Total return is based on the change in net asset value of a share during the period and assumes reinvestment of dividends and distributions at net asset value. |
| 3 | Total return during the period reflects a waiver by the manager. Performance would have been lower had the waiver not been in effect. |
| 4 | Expense ratios do not include expenses of the Underlying Funds in which the Fund invests. |
See accompanying notes, which are an integral part of the financial statements.
66
| Year ended | ||||||||||||||||||||||
| 11/30/21 | 11/30/20 | 11/30/19 | 11/30/18 | 11/30/17 | ||||||||||||||||||
| $ | 23.88 | $ | 19.28 | $ | 17.69 | $ | 20.27 | $ | 14.69 | |||||||||||||
| 0.64 | 0.12 | 0.18 | 0.14 | 0.28 | ||||||||||||||||||
| 0.07 | 4.66 | 1.54 | (2.33 | ) | 5.45 | |||||||||||||||||
| 0.71 | 4.78 | 1.72 | (2.19 | ) | 5.73 | |||||||||||||||||
| (0.07 | ) | (0.18 | ) | (0.13 | ) | (0.39 | ) | (0.15 | ) | |||||||||||||
| (0.14 | ) | — | — | — | — | |||||||||||||||||
| (0.21 | ) | (0.18 | ) | (0.13 | ) | (0.39 | ) | (0.15 | ) | |||||||||||||
| $ | 24.38 | $ | 23.88 | $ | 19.28 | $ | 17.69 | $ | 20.27 | |||||||||||||
| 2.94% | 3 | 24.93% | 3 | 9.84% | (11.04% | ) | 39.43% | 3 | ||||||||||||||
| $ | 2,190,839 | $ | 1,130,453 | $ | 1,000,200 | $ | 391,408 | $ | 140,119 | |||||||||||||
| 1.21% | 1.25% | 1.26% | 1.26% | 1.28% | ||||||||||||||||||
| 1.23% | 1.26% | 1.26% | 1.26% | 1.28% | ||||||||||||||||||
| 2.44% | 0.58% | 0.99% | 0.72% | 1.47% | ||||||||||||||||||
| 2.42% | 0.57% | 0.99% | 0.72% | 1.47% | ||||||||||||||||||
| 4% | 5% | 10% | 11% | 11% | ||||||||||||||||||
67
Financial highlights
Delaware International Small Cap Fund Class A
Selected data for each share of the Fund outstanding throughout each period were as follows:
| Net asset value, beginning of period |
| Income (loss) from investment operations: |
| Net investment income (loss)1 |
| Net realized and unrealized gain (loss) |
| Total from investment operations |
| Less dividends and distributions from: |
| Net realized gain |
| Total dividends and distributions |
| Net asset value, end of period |
| Total return3 |
| Ratios and supplemental data: |
| Net assets, end of period (000 omitted) |
| Ratio of expenses to average net assets4 |
| Ratio of expenses to average net assets prior to fees waived4 |
| Ratio of net investment income (loss) to average net assets |
| Ratio of net investment loss to average net assets prior to fees waived |
| Portfolio turnover |
| 1 | Calculated using average shares outstanding. |
| 2 | Amount is less than $(0.005) per share. |
| 3 | Total return is based on the change in net asset value of a share during the period and assumes reinvestment of dividends and distributions at net asset value and does not reflect the impact of a sales charge. Total return during all of the periods shown reflects waivers by the manager and/or distributor. Performance would have been lower had the waivers not been in effect. |
| 4 | Expense ratios do not include expenses of the Underlying Funds in which the Fund invests. |
See accompanying notes, which are an integral part of the financial statements.
68
| Year ended | ||||||||||||||||||||||
| 11/30/21 | 11/30/20 | 11/30/19 | 11/30/18 | 11/30/17 | ||||||||||||||||||
| $ | 8.63 | $ | 7.07 | $ | 6.66 | $ | 7.99 | $ | 19.03 | |||||||||||||
| (0.03 | ) | — | 2 | 0.01 | 0.01 | (0.02 | ) | |||||||||||||||
| 0.94 | 1.56 | 0.40 | (1.02 | ) | 1.86 | |||||||||||||||||
| 0.91 | 1.56 | 0.41 | (1.01 | ) | 1.84 | |||||||||||||||||
| — | — | — | (0.32 | ) | (12.88 | ) | ||||||||||||||||
| — | — | — | (0.32 | ) | (12.88 | ) | ||||||||||||||||
| $ | 9.54 | $ | 8.63 | $ | 7.07 | $ | 6.66 | $ | 7.99 | |||||||||||||
| 10.55% | 22.07% | 6.16% | (13.19% | ) | 39.78% | |||||||||||||||||
| $ | 9,535 | $ | 7,499 | $ | 10,934 | $ | 10,154 | $ | 12,377 | |||||||||||||
| 1.35% | 1.35% | 1.34% | 1.34% | 1.38% | ||||||||||||||||||
| 1.48% | 1.52% | 1.55% | 1.72% | 2.48% | ||||||||||||||||||
| (0.35% | ) | (0.04% | ) | 0.16% | 0.13% | (0.22% | ) | |||||||||||||||
| (0.48% | ) | (0.21% | ) | (0.05% | ) | (0.25% | ) | (1.32% | ) | |||||||||||||
| 95% | 66% | 97% | 106% | 142% | ||||||||||||||||||
69
Financial highlights
Delaware International Small Cap Fund Class C
Selected data for each share of the Fund outstanding throughout each period were as follows:
| Net asset value, beginning of period |
| Income (loss) from investment operations: |
| Net investment loss1 |
| Net realized and unrealized gain (loss) |
| Total from investment operations |
| Less dividends and distributions from: |
| Net realized gain |
| Total dividends and distributions |
| Net asset value, end of period |
| Total return2 |
| Ratios and supplemental data: |
| Net assets, end of period (000 omitted) |
| Ratio of expenses to average net assets3 |
| Ratio of expenses to average net assets prior to fees waived3 |
| Ratio of net investment loss to average net assets |
| Ratio of net investment loss to average net assets prior to fees waived |
| Portfolio turnover |
| 1 | Calculated using average shares outstanding. |
| 2 | Total return is based on the change in net asset value of a share during the period and assumes reinvestment of dividends and distributions at net asset value and does not reflect the impact of a sales charge. Total return during all of the periods shown reflects a waiver by the manager. Performance would have been lower had the waiver not been in effect. |
| 3 | Expense ratios do not include expenses of the Underlying Funds in which the Fund invests. |
See accompanying notes, which are an integral part of the financial statements.
70
| Year ended | ||||||||||||||||||||
| 11/30/21 | 11/30/20 | 11/30/19 | 11/30/18 | 11/30/17 | ||||||||||||||||
| $ | 7.16 | $ | 5.91 | $ | 5.61 | $ | 6.83 | $ | 18.24 | |||||||||||
| (0.09 | ) | (0.05 | ) | (0.03 | ) | (0.04 | ) | (0.06 | ) | |||||||||||
| 0.79 | 1.30 | 0.33 | (0.86 | ) | 1.53 | |||||||||||||||
| 0.70 | 1.25 | 0.30 | (0.90 | ) | 1.47 | |||||||||||||||
| — | — | — | (0.32 | ) | (12.88 | ) | ||||||||||||||
| — | — | — | (0.32 | ) | (12.88 | ) | ||||||||||||||
| $ | 7.86 | $ | 7.16 | $ | 5.91 | $ | 5.61 | $ | 6.83 | |||||||||||
| 9.78% | 21.15% | 5.35% | (13.86% | ) | 38.77% | |||||||||||||||
| $ | 1,955 | $ | 3,106 | $ | 3,541 | $ | 4,698 | $ | 5,199 | |||||||||||
| 2.10% | 2.10% | 2.09% | 2.09% | 2.13% | ||||||||||||||||
| 2.23% | 2.27% | 2.30% | 2.47% | 3.23% | ||||||||||||||||
| (1.10% | ) | (0.79% | ) | (0.59% | ) | (0.62% | ) | (0.97% | ) | |||||||||||
| (1.23% | ) | (0.96% | ) | (0.80% | ) | (1.00% | ) | (2.07% | ) | |||||||||||
| 95% | 66% | 97% | 106% | 142% | ||||||||||||||||
71
Financial highlights
Delaware International Small Cap Fund Class R
Selected data for each share of the Fund outstanding throughout each period were as follows:
| Net asset value, beginning of period |
| Income (loss) from investment operations: |
| Net investment loss1 |
| Net realized and unrealized gain (loss) |
| Total from investment operations |
| Less dividends and distributions from: |
| Net realized gain |
| Total dividends and distributions |
| Net asset value, end of period |
| Total return2 |
| Ratios and supplemental data: |
| Net assets, end of period (000 omitted) |
| Ratio of expenses to average net assets3 |
| Ratio of expenses to average net assets prior to fees waived3 |
| Ratio of net investment loss to average net assets |
| Ratio of net investment loss to average net assets prior to fees waived |
| Portfolio turnover |
| 1 | Calculated using average shares outstanding. |
| 2 | Total return is based on the change in net asset value of a share during the period and assumes reinvestment of dividends and distributions at net asset value. Total return during all of the periods shown reflects waivers by the manager and/or distributor. Performance would have been lower had the waivers not been in effect. |
| 3 | Expense ratios do not include expenses of the Underlying Funds in which the Fund invests. |
See accompanying notes, which are an integral part of the financial statements.
72
| Year ended | ||||||||||||||||||||
| 11/30/21 | 11/30/20 | 11/30/19 | 11/30/18 | 11/30/17 | ||||||||||||||||
| $ | 8.14 | $ | 6.68 | $ | 6.31 | $ | 7.61 | $ | 18.77 | |||||||||||
| (0.05 | ) | (0.02 | ) | (0.01 | ) | (0.01 | ) | (0.03 | ) | |||||||||||
| 0.88 | 1.48 | 0.38 | (0.97 | ) | 1.75 | |||||||||||||||
| 0.83 | 1.46 | 0.37 | (0.98 | ) | 1.72 | |||||||||||||||
| — | — | — | (0.32 | ) | (12.88 | ) | ||||||||||||||
| — | — | — | (0.32 | ) | (12.88 | ) | ||||||||||||||
| $ | 8.97 | $ | 8.14 | $ | 6.68 | $ | 6.31 | $ | 7.61 | |||||||||||
| 10.20% | 21.86% | 5.86% | (13.47% | ) | 39.45% | |||||||||||||||
| $ | 159 | $ | 340 | $ | 98 | $ | 87 | $ | 92 | |||||||||||
| 1.60% | 1.60% | 1.59% | 1.59% | 1.63% | ||||||||||||||||
| 1.73% | 1.77% | 1.80% | 1.97% | 2.73% | ||||||||||||||||
| (0.60% | ) | (0.29% | ) | (0.09% | ) | (0.12% | ) | (0.47% | ) | |||||||||||
| (0.73% | ) | (0.46% | ) | (0.30% | ) | (0.50% | ) | (1.57% | ) | |||||||||||
| 95% | 66% | 97% | 106% | 142% | ||||||||||||||||
73
Financial highlights
Delaware International Small Cap Fund Institutional Class
Selected data for each share of the Fund outstanding throughout each period were as follows:
| Net asset value, beginning of period |
| Income (loss) from investment operations: |
| Net investment income (loss)1 |
| Net realized and unrealized gain (loss) |
| Total from investment operations |
| Less dividends and distributions from: |
| Net investment income |
| Net realized gain |
| Return of capital |
| Total dividends and distributions |
| Net asset value, end of period |
| Total return3 |
| Ratios and supplemental data: |
| Net assets, end of period (000 omitted) |
| Ratio of expenses to average net assets4 |
| Ratio of expenses to average net assets prior to fees waived4 |
| Ratio of net investment income (loss) to average net assets |
| Ratio of net investment income (loss) to average net assets prior to fees waived |
| Portfolio turnover |
| 1 | Calculated using average shares outstanding. |
| 2 | Amount is less than $0.005 per share. |
| 3 | Total return is based on the change in net asset value of a share during the period and assumes reinvestment of dividends and distributions at net asset value. Total return during all of the periods shown reflects a waiver by the manager. Performance would have been lower had the waiver not been in effect. |
| 4 | Expense ratios do not include expenses of the Underlying Funds in which the Fund invests. |
See accompanying notes, which are an integral part of the financial statements.
74
| Year ended | |||||||||||||||||||
| 11/30/21 | 11/30/20 | 11/30/19 | 11/30/18 | 11/30/17 | |||||||||||||||
| $ | 9.07 | $ | 7.43 | $ | 6.98 | $ | 8.34 | $ | 19.27 | ||||||||||
| (0.01 | ) | 0.02 | 0.03 | 0.03 | — | 2 | |||||||||||||
| 1.00 | 1.63 | 0.42 | (1.07 | ) | 1.95 | ||||||||||||||
| 0.99 | 1.65 | 0.45 | (1.04 | ) | 1.95 | ||||||||||||||
| — | (0.01 | ) | — | — | — | ||||||||||||||
| — | — | — | (0.32 | ) | (12.88 | ) | |||||||||||||
| — | — | 2 | — | — | — | ||||||||||||||
| — | (0.01 | ) | — | (0.32 | ) | (12.88 | ) | ||||||||||||
| $ | 10.06 | $ | 9.07 | $ | 7.43 | $ | 6.98 | $ | 8.34 | ||||||||||
| 10.92% | 22.30% | 6.45% | (12.99% | ) | 40.06% | ||||||||||||||
| $ | 73,091 | $ | 91,340 | $ | 117,702 | $ | 60,124 | $ | 14,025 | ||||||||||
| 1.10% | 1.10% | 1.09% | 1.09% | 1.13% | |||||||||||||||
| 1.23% | 1.27% | 1.30% | 1.47% | 2.23% | |||||||||||||||
| (0.10% | ) | 0.21% | 0.41% | 0.38% | 0.03% | ||||||||||||||
| (0.23% | ) | 0.04% | 0.20% | 0.00% | (1.07% | ) | |||||||||||||
| 95% | 66% | 97% | 106% | 142% | |||||||||||||||
75
Financial highlights
Delaware International Small Cap Fund Class R6
Selected data for each share of the Fund outstanding throughout each period were as follows:
| Net asset value, beginning of period |
| Income (loss) from investment operations: |
| Net investment income (loss)2 |
| Net realized and unrealized gain (loss) |
| Total from investment operations |
| Less dividends and distributions from: |
| Net investment income |
| Net realized gain |
| Return of capital |
| Total dividends and distributions |
| Net asset value, end of period |
| Total return5 |
| Ratios and supplemental data: |
| Net assets, end of period (000 omitted) |
| Ratio of expenses to average net assets6 |
| Ratio of expenses to average net assets prior to fees waived6 |
| Ratio of net investment income (loss) to average net assets |
| Ratio of net investment income (loss) to average net assets prior to fees waived |
| Portfolio turnover |
| 1 | Date of commencement of operations; ratios have been annualized and total return has not been annualized. |
| 2 | Calculated using average shares outstanding. |
| 3 | Amount is less than $(0.005) per share. |
| 4 | Amount is less than $0.005 per share. |
| 5 | Total return is based on the change in net asset value of a share during the period and assumes reinvestment of dividends and distributions at net asset value. Total return during all of the periods shown reflects a waiver by the manager. Performance would have been lower had the waiver not been in effect. |
| 6 | Expense ratios do not include expenses of the Underlying Funds in which the Fund invests. |
| 7 | Portfolio turnover is representative of the Fund for the entire period. |
See accompanying notes, which are an integral part of the financial statements.
76
| 6/30/171 | |||||||||||||||||||
| Year ended | to | ||||||||||||||||||
| 11/30/21 | 11/30/20 | 11/30/19 | 11/30/18 | 11/30/17 | |||||||||||||||
| $ | 9.10 | $ | 7.45 | $ | 6.99 | $ | 8.35 | $ | 7.07 | ||||||||||
| — | 3 | 0.02 | 0.04 | 0.04 | — | 3 | |||||||||||||
| 0.99 | 1.65 | 0.42 | (1.08 | ) | 1.28 | ||||||||||||||
| 0.99 | 1.67 | 0.46 | (1.04 | ) | 1.28 | ||||||||||||||
| — | (0.02 | ) | — | — | — | ||||||||||||||
| — | — | — | (0.32 | ) | — | ||||||||||||||
| — | — | 4 | — | — | — | ||||||||||||||
| — | (0.02 | ) | — | (0.32 | ) | — | |||||||||||||
| $ | 10.09 | $ | 9.10 | $ | 7.45 | $ | 6.99 | $ | 8.35 | ||||||||||
| 10.88% | 22.48% | 6.58% | (12.98% | ) | 18.11% | ||||||||||||||
| $ | 21,631 | $ | 12,498 | $ | 3,780 | $ | 2,676 | $ | 2 | ||||||||||
| 1.00% | 1.00% | 1.00% | 1.00% | 1.00% | |||||||||||||||
| 1.13% | 1.17% | 1.21% | 1.38% | 2.28% | |||||||||||||||
| 0.00% | 0.31% | 0.50% | 0.47% | (0.08% | ) | ||||||||||||||
| (0.13% | ) | 0.14% | 0.29% | 0.09% | (1.36% | ) | |||||||||||||
| 95% | 66% | 97% | 106% | 142% | 7 | ||||||||||||||
77
Financial highlights
Delaware International Value Equity Fund Class A
Selected data for each share of the Fund outstanding throughout each period were as follows:
| Net asset value, beginning of period |
| Income (loss) from investment operations: |
| Net investment income1 |
| Net realized and unrealized gain (loss) |
| Total from investment operations |
| Less dividends and distributions from: |
| Net investment income |
| Net realized gain |
| Total dividends and distributions |
| Net asset value, end of period |
| Total return3 |
| Ratios and supplemental data: |
| Net assets, end of period (000 omitted) |
| Ratio of expenses to average net assets5 |
| Ratio of expenses to average net assets prior to fees waived5 |
| Ratio of net investment income to average net assets |
| Ratio of net investment income to average net assets prior to fees waived |
| Portfolio turnover |
| 1 | Calculated using average shares outstanding. |
| 2 | The per share amount of realized and unrealized gain (loss) on investments does not accord with the amounts reported in the Statements of Operations due to the timing of creation of Fund shares in relation to fluctuating market values. |
| 3 | Total return is based on the change in net asset value of a share during the period and assumes reinvestment of dividends and distributions at net asset value and does not reflect the impact of a sales charge. |
| 4 | Total return during the period reflects a waiver by the manager and/or distributor. Performance would have been lower had the waiver not been in effect. |
| 5 | Expense ratios do not include expenses of the Underlying Funds in which the Fund invests. |
| 6 | The Fund’s portfolio turnover rate increased substantially during the year ended November 30, 2019 due to a change in the Fund’s portfolio managers and associated repositioning. |
See accompanying notes, which are an integral part of the financial statements.
78
| Year ended | ||||||||||||||||||||
| 11/30/21 | 11/30/20 | 11/30/19 | 11/30/18 | 11/30/17 | ||||||||||||||||
| $ | 14.82 | $ | 14.66 | $ | 13.53 | $ | 15.66 | $ | 12.94 | |||||||||||
| 0.13 | 0.11 | 0.19 | 0.29 | 0.24 | ||||||||||||||||
| 0.76 | 2 | 0.43 | 1.23 | (2.19 | ) | 2.75 | ||||||||||||||
| 0.89 | 0.54 | 1.42 | (1.90 | ) | 2.99 | |||||||||||||||
| (0.13 | ) | (0.18 | ) | (0.29 | ) | (0.23 | ) | (0.27 | ) | |||||||||||
| (0.11 | ) | (0.20 | ) | — | — | — | ||||||||||||||
| (0.24 | ) | (0.38 | ) | (0.29 | ) | (0.23 | ) | (0.27 | ) | |||||||||||
| $ | 15.47 | $ | 14.82 | $ | 14.66 | $ | 13.53 | $ | 15.66 | |||||||||||
| 6.02% | 4 | 3.80% | 4 | 10.94% | 4 | (12.32% | ) | 23.53% | ||||||||||||
| $ | 201,367 | $ | 59,692 | $ | 62,035 | $ | 63,604 | $ | 68,412 | |||||||||||
| 1.17% | 1.26% | 1.34% | 1.33% | 1.35% | ||||||||||||||||
| 1.36% | 1.35% | 1.35% | 1.33% | 1.35% | ||||||||||||||||
| 0.80% | 0.81% | 1.35% | 1.93% | 1.65% | ||||||||||||||||
| 0.61% | 0.72% | 1.34% | 1.93% | 1.65% | ||||||||||||||||
| 38% | 36% | 143% | 6 | 13% | 15% | |||||||||||||||
79
Financial highlights
Delaware International Value Equity Fund Class C
Selected data for each share of the Fund outstanding throughout each period were as follows:
| Net asset value, beginning of period |
| Income (loss) from investment operations: |
| Net investment income1 |
| Net realized and unrealized gain (loss) |
| Total from investment operations |
| Less dividends and distributions from: |
| Net investment income |
| Net realized gain |
| Total dividends and distributions |
| Net asset value, end of period |
| Total return3 |
| Ratios and supplemental data: |
| Net assets, end of period (000 omitted) |
| Ratio of expenses to average net assets5 |
| Ratio of expenses to average net assets prior to fees waived5 |
| Ratio of net investment income to average net assets |
| Ratio of net investment income (loss) to average net assets prior to fees waived |
| Portfolio turnover |
| 1 | Calculated using average shares outstanding. |
| 2 | The per share amount of realized and unrealized gain (loss) on investments does not accord with the amounts reported in the Statements of Operations due to the timing of creation of Fund shares in relation to fluctuating market values. |
| 3 | Total return is based on the change in net asset value of a share during the period and assumes reinvestment of dividends and distributions at net asset value and does not reflect the impact of a sales charge. |
| 4 | Total return during the period reflects a waiver by the manager. Performance would have been lower had the waiver not been in effect. |
| 5 | Expense ratios do not include expenses of the Underlying Funds in which the Fund invests. |
| 6 | The Fund’s portfolio turnover rate increased substantially during the year ended November 30, 2019 due to a change in the Fund’s portfolio managers and associated repositioning. |
See accompanying notes, which are an integral part of the financial statements.
80
| Year ended | ||||||||||||||||||||||
| 11/30/21 | 11/30/20 | 11/30/19 | 11/30/18 | 11/30/17 | ||||||||||||||||||
| $ | 14.63 | $ | 14.48 | $ | 13.25 | $ | 15.36 | $ | 12.69 | |||||||||||||
| 0.01 | 0.01 | 0.08 | 0.16 | 0.13 | ||||||||||||||||||
| 0.75 | 2 | 0.42 | 1.25 | (2.15 | ) | 2.72 | ||||||||||||||||
| 0.76 | 0.43 | 1.33 | (1.99 | ) | 2.85 | |||||||||||||||||
| — | (0.08 | ) | (0.10 | ) | (0.12 | ) | (0.18 | ) | ||||||||||||||
| (0.11 | ) | (0.20 | ) | — | — | — | ||||||||||||||||
| (0.11 | ) | (0.28 | ) | (0.10 | ) | (0.12 | ) | (0.18 | ) | |||||||||||||
| $ | 15.28 | $ | 14.63 | $ | 14.48 | $ | 13.25 | $ | 15.36 | |||||||||||||
| 5.21% | 4 | 3.01% | 4 | 10.18% | 4 | (13.04% | ) | 22.71% | ||||||||||||||
| $ | 4,549 | $ | 6,127 | $ | 8,562 | $ | 8,734 | $ | 21,505 | |||||||||||||
| 1.92% | 2.01% | 2.09% | 2.08% | 2.10% | ||||||||||||||||||
| 2.11% | 2.10% | 2.10% | 2.08% | 2.10% | ||||||||||||||||||
| 0.05% | 0.06% | 0.60% | 1.18% | 0.90% | ||||||||||||||||||
| (0.14% | ) | (0.03% | ) | 0.59% | 1.18% | 0.90% | ||||||||||||||||
| 38% | 36% | 143% | 6 | 13% | 15% | |||||||||||||||||
81
Financial highlights
Delaware International Value Equity Fund Class R
Selected data for each share of the Fund outstanding throughout each period were as follows:
| Net asset value, beginning of period |
| Income (loss) from investment operations: |
| Net investment income1 |
| Net realized and unrealized gain (loss) |
| Total from investment operations |
| Less dividends and distributions from: |
| Net investment income |
| Net realized gain |
| Total dividends and distributions |
| Net asset value, end of period |
| Total return3 |
| Ratios and supplemental data: |
| Net assets, end of period (000 omitted) |
| Ratio of expenses to average net assets5 |
| Ratio of expenses to average net assets prior to fees waived5 |
| Ratio of net investment income to average net assets |
| Ratio of net investment income to average net assets prior to fees waived |
| Portfolio turnover |
| 1 | Calculated using average shares outstanding. |
| 2 | The per share amount of realized and unrealized gain (loss) on investments does not accord with the amounts reported in the Statements of Operations due to the timing of creation of Fund shares in relation to fluctuating market values. |
| 3 | Total return is based on the change in net asset value of a share during the period and assumes reinvestment of dividends and distributions at net asset value. |
| 4 | Total return during the period reflects a waiver by the manager and/or distributor. Performance would have been lower had the waiver not been in effect. |
| 5 | Expense ratios do not include expenses of the Underlying Funds in which the Fund invests. |
| 6 | The Fund’s portfolio turnover rate increased substantially during the year ended November 30, 2019 due to a change in the Fund’s portfolio managers and associated repositioning. |
See accompanying notes, which are an integral part of the financial statements.
82
| Year ended | ||||||||||||||||||||||
| 11/30/21 | 11/30/20 | 11/30/19 | 11/30/18 | 11/30/17 | ||||||||||||||||||
| $ | 14.76 | $ | 14.60 | $ | 13.46 | $ | 15.59 | $ | 12.88 | |||||||||||||
| 0.09 | 0.08 | 0.15 | 0.25 | 0.20 | ||||||||||||||||||
| 0.76 | 2 | 0.42 | 1.24 | (2.19 | ) | 2.75 | ||||||||||||||||
| 0.85 | 0.50 | 1.39 | (1.94 | ) | 2.95 | |||||||||||||||||
| (0.10 | ) | (0.14 | ) | (0.25 | ) | (0.19 | ) | (0.24 | ) | |||||||||||||
| (0.11 | ) | (0.20 | ) | — | — | — | ||||||||||||||||
| (0.21 | ) | (0.34 | ) | (0.25 | ) | (0.19 | ) | (0.24 | ) | |||||||||||||
| $ | 15.40 | $ | 14.76 | $ | 14.60 | $ | 13.46 | $ | 15.59 | |||||||||||||
| 5.75% | 4 | 3.53% | 4 | 10.72% | 4 | (12.58% | ) | 23.26% | ||||||||||||||
| $ | 4,941 | $ | 2,845 | $ | 3,472 | $ | 3,508 | $ | 3,440 | |||||||||||||
| 1.42% | 1.51% | 1.59% | 1.58% | 1.60% | ||||||||||||||||||
| 1.61% | 1.60% | 1.60% | 1.58% | 1.60% | ||||||||||||||||||
| 0.55% | 0.56% | 1.10% | 1.68% | 1.40% | ||||||||||||||||||
| 0.36% | 0.47% | 1.09% | 1.68% | 1.40% | ||||||||||||||||||
| 38% | 36% | 143% | 6 | 13% | 15% | |||||||||||||||||
83
Financial highlights
Delaware International Value Equity Fund Institutional Class
Selected data for each share of the Fund outstanding throughout each period were as follows:
| Net asset value, beginning of period |
| Income (loss) from investment operations: |
| Net investment income1 |
| Net realized and unrealized gain (loss) |
| Total from investment operations |
| Less dividends and distributions from: |
| Net investment income |
| Net realized gain |
| Total dividends and distributions |
| Net asset value, end of period |
| Total return3 |
| Ratios and supplemental data: |
| Net assets, end of period (000 omitted) |
| Ratio of expenses to average net assets5 |
| Ratio of expenses to average net assets prior to fees waived5 |
| Ratio of net investment income to average net assets |
| Ratio of net investment income to average net assets prior to fees waived |
| Portfolio turnover |
| 1 | Calculated using average shares outstanding. |
| 2 | The per share amount of realized and unrealized gain (loss) on investments does not accord with the amounts reported in the Statements of Operations due to the timing of creation of Fund shares in relation to fluctuating market values. |
| 3 | Total return is based on the change in net asset value of a share during the period and assumes reinvestment of dividends and distributions at net asset value. |
| 4 | Total return during the period reflects a waiver by the manager. Performance would have been lower had the waiver not been in effect. |
| 5 | Expense ratios do not include expenses of the Underlying Funds in which the Fund invests. |
| 6 | The Fund’s portfolio turnover rate increased substantially during the year ended November 30, 2019 due to a change in the Fund’s portfolio managers and associated repositioning. |
See accompanying notes, which are an integral part of the financial statements.
84
| Year ended | ||||||||||||||||||||||
| 11/30/21 | 11/30/20 | 11/30/19 | 11/30/18 | 11/30/17 | ||||||||||||||||||
| $ | 14.90 | $ | 14.74 | $ | 13.60 | $ | 15.74 | $ | 13.00 | |||||||||||||
| 0.17 | 0.15 | 0.22 | 0.33 | 0.28 | ||||||||||||||||||
| 0.75 | 2 | 0.43 | 1.25 | (2.20 | ) | 2.76 | ||||||||||||||||
| 0.92 | 0.58 | 1.47 | (1.87 | ) | 3.04 | |||||||||||||||||
| (0.16 | ) | (0.22 | ) | (0.33 | ) | (0.27 | ) | (0.30 | ) | |||||||||||||
| (0.11 | ) | (0.20 | ) | — | — | — | ||||||||||||||||
| (0.27 | ) | (0.42 | ) | (0.33 | ) | (0.27 | ) | (0.30 | ) | |||||||||||||
| $ | 15.55 | $ | 14.90 | $ | 14.74 | $ | 13.60 | $ | 15.74 | |||||||||||||
| 6.24% | 4 | 4.04% | 4 | 11.29% | 4 | (12.11% | ) | 23.87% | ||||||||||||||
| $ | 318,766 | $ | 248,810 | $ | 229,511 | $ | 220,747 | $ | 226,644 | |||||||||||||
| 0.92% | 1.01% | 1.09% | 1.08% | 1.10% | ||||||||||||||||||
| 1.11% | 1.10% | 1.10% | 1.08% | 1.10% | ||||||||||||||||||
| 1.05% | 1.06% | 1.60% | 2.18% | 1.90% | ||||||||||||||||||
| 0.86% | 0.97% | 1.59% | 2.18% | 1.90% | ||||||||||||||||||
| 38% | 36% | 143% | 6 | 13% | 15% | |||||||||||||||||
85
Financial highlights
Delaware International Value Equity Fund Class R6
Selected data for each share of the Fund outstanding throughout each period were as follows:
| Net asset value, beginning of period |
| Income (loss) from investment operations: |
| Net investment income2 |
| Net realized and unrealized gain (loss) |
| Total from investment operations |
| Less dividends and distributions from: |
| Net investment income |
| Net realized gain |
| Total dividends and distributions |
| Net asset value, end of period |
| Total return4 |
| Ratios and supplemental data: |
| Net assets, end of period (000 omitted) |
| Ratio of expenses to average net assets6 |
| Ratio of expenses to average net assets prior to fees waived6 |
| Ratio of net investment income to average net assets |
| Ratio of net investment income to average net assets prior to fees waived |
| Portfolio turnover |
| 1 | Date of commencement of operations; ratios have been annualized and total return has not been annualized. |
| 2 | Calculated using average shares outstanding. |
| 3 | The per share amount of realized and unrealized gain (loss) on investments does not accord with the amounts reported in the Statements of Operations due to the timing of creation of Fund shares in relation to fluctuating market values. |
| 4 | Total return is based on the change in net asset value of a share during the period and assumes reinvestment of dividends and distributions at net asset value. |
| 5 | Total return during the period reflects a waiver by the manager. Performance would have been lower had the waiver not been in effect. |
| 6 | Expense ratios do not include expenses of the Underlying Funds in which the Fund invests. |
| 7 | The Fund’s portfolio turnover rate increased substantially during the year ended November 30, 2019 due to a change in the Fund’s portfolio managers and associated repositioning. |
| 8 | Portfolio turnover is representative of the Fund for the entire period. |
See accompanying notes, which are an integral part of the financial statements.
86
| 3/29/181 | ||||||||||||||||
| Year ended | to | |||||||||||||||
| 11/30/21 | 11/30/20 | 11/30/19 | 11/30/18 | |||||||||||||
| $ | 14.91 | $ | 14.74 | $ | 13.60 | $ | 15.36 | |||||||||
| 0.18 | 0.15 | 0.24 | 0.25 | |||||||||||||
| 0.76 | 3 | 0.45 | 1.24 | (2.01 | ) | |||||||||||
| 0.94 | 0.60 | 1.48 | (1.76 | ) | ||||||||||||
| (0.18 | ) | (0.23 | ) | (0.34 | ) | — | ||||||||||
| (0.11 | ) | (0.20 | ) | — | — | |||||||||||
| (0.29 | ) | (0.43 | ) | (0.34 | ) | — | ||||||||||
| $ | 15.56 | $ | 14.91 | $ | 14.74 | $ | 13.60 | |||||||||
| 6.31% | 5 | 4.14% | 5 | 11.36% | 5 | (11.46% | ) | |||||||||
| $ | 3,732 | $ | 1,585 | $ | 2,091 | $ | 2 | |||||||||
| 0.86% | 0.95% | 1.03% | 1.02% | |||||||||||||
| 1.04% | 1.02% | 1.03% | 1.02% | |||||||||||||
| 1.11% | 1.12% | 1.66% | 2.47% | |||||||||||||
| 0.94% | 1.05% | 1.66% | 2.47% | |||||||||||||
| 38% | 36% | 143% | 7 | 13% | 8 | |||||||||||
87
| Notes to financial statements | |
| Delaware International Funds | November 30, 2021 |
Delaware Group® Global & International Funds (Trust) is organized as a Delaware statutory trust and offers three series: Delaware Emerging Markets Fund, Delaware International Small Cap Fund, and Delaware International Value Equity Fund (each, a Fund or collectively, the Funds). The Trust is an open-end investment company. Each Fund, except Delaware International Value Equity Fund, is considered diversified under the Investment Company Act of 1940, as amended (1940 Act), and offers Class A, Class C, Class R, Institutional Class, and Class R6 shares. Delaware International Value Equity fund is considered non-diversified under the 1940 Act. There is no front-end sales charge when you purchase $1,000,000 or more of Class A shares. However, if Delaware Distributors, L.P. (DDLP) paid your financial intermediary a commission on your purchase of $1,000,000 or more of Class A shares, for shares purchased prior to July 1, 2020, you will have to pay a limited contingent deferred sales charge (Limited CDSC) of 1.00% if you redeem these shares within the first year after your purchase and 0.50% if you redeem these shares within the second year; or for shares purchased on or after July 1, 2020, you will have to pay a Limited CDSC of 1.00% if you redeem these shares within the first 18 months after your purchase; unless a specific waiver of the Limited CDSC applies. Class C shares are sold with a contingent deferred sales charge (CDSC) of 1.00%, which will be incurred if redeemed during the first 12 months. Class R, Institutional Class, and Class R6 shares are not subject to a sales charge and are offered for sale exclusively to certain eligible investors. In addition, Class R6 shares do not pay any service fees, sub-accounting fees, and/or sub-transfer agency fees to any brokers, dealers, or other financial intermediaries.
1. Significant Accounting Policies
Each Fund follows accounting and reporting guidance under Financial Accounting Standards Board (FASB) Accounting Standards Codification Topic 946, Financial Services — Investment Companies. The following accounting policies are in accordance with US generally accepted accounting principles (US GAAP) and are consistently followed by the Funds.
Security Valuation — Equity securities and exchange-traded funds (ETFs), except those traded on the Nasdaq Stock Market LLC (Nasdaq), are valued at the last quoted sales price as of the time of the regular close of the New York Stock Exchange on the valuation date. Equity securities and ETFs traded on the Nasdaq are valued in accordance with the Nasdaq Official Closing Price, which may not be the last sales price. If, on a particular day, an equity security or ETF does not trade, the mean between the bid and ask prices will be used, which approximates fair value. Equity securities listed on a foreign exchange are normally valued at the last quoted sales price on the valuation date. Generally, other securities and assets for which market quotations are not readily available are valued at fair value as determined in good faith under the direction of the Trust’s Board of Trustees (Board). In determining whether market quotations are readily available or fair valuation will be used, various factors will be taken into consideration, such as market closures or suspension of trading in a security. The Funds may use fair value pricing more frequently for securities traded primarily in non-US markets because, among other things, most foreign markets close well before the Funds value their securities, generally as of 4:00pm Eastern Time. The earlier close of these foreign markets gives rise to the possibility that significant events, including broad market moves, government actions or pronouncements, aftermarket trading, or news events may have occurred in the interim. Whenever such a significant event occurs, the Funds may
88
value foreign securities using fair value prices based on third-party vendor modeling tools (international fair value pricing.) Restricted securities are valued at fair value using methods approved by the Board.
Federal and Foreign Income Taxes — No provision for federal income taxes has been made as each Fund intends to continue to qualify for federal income tax purposes as a regulated investment company under Subchapter M of the Internal Revenue Code of 1986, as amended, and make the requisite distributions to shareholders. Each Fund evaluates tax positions taken or expected to be taken in the course of preparing each Fund’s tax returns to determine whether the tax positions are “more-likely-than-not” of being sustained by the applicable tax authority. Tax positions not deemed to meet the “more-likely-than-not” threshold are recorded as a tax benefit or expense in the current year. Management has analyzed each Fund’s tax positions taken or expected to be taken on each Fund’s federal income tax returns through the year ended November 30, 2021, and for all open tax years (years ended November 30, 2018–November 30, 2020), and has concluded that no provision for federal income tax is required in each Fund’s financial statements. In regard to foreign taxes only, each Fund has open tax years in certain foreign countries in which it invests in that may date back to the inception of each Fund. If applicable, each Fund recognizes interest accrued on unrecognized tax benefits in interest expense and penalties in “Other” on the “Statements of operations.” During the year ended November 30, 2021, the Funds did not incur any interest or tax penalties.
Class Accounting — Investment income, common expenses, and realized and unrealized gain (loss) on investments are allocated to the various classes of each Fund on the basis of daily net assets of each class. Distribution expenses relating to a specific class are charged directly to that class. Class R6 shares will not be allocated any expenses related to service fees, sub-accounting fees, and/or sub-transfer agency fees paid to brokers, dealers, or other financial intermediaries.
Underlying Funds — The Funds may invest in other investment companies (Underlying Funds) to the extent permitted by the 1940 Act. The Underlying Funds in which the Funds may invest include ETFs. A Fund will indirectly bear the investment management fees and other expenses of the Underlying Funds.
Foreign Currency Transactions — Transactions denominated in foreign currencies are recorded at the prevailing exchange rates on the valuation date in accordance with each Fund’s prospectus. The value of all assets and liabilities denominated in foreign currencies is translated daily into US dollars at the exchange rate of such currencies against the US dollar. Transaction gains or losses resulting from changes in exchange rates during the reporting period or upon settlement of the foreign currency transaction are reported in operations for the current period. The Funds generally do not bifurcate that portion of realized gains and losses on investments which is due to changes in foreign exchange rates from that which is due to changes in market prices. These gains and losses are included on the “Statements of operations” under “Net realized gain (loss) on investments.” Each Fund reports certain foreign currency related transactions as components of realized gains (losses) for financial reporting purposes, whereas such components are treated as ordinary income (loss) for federal income tax purposes.
Use of Estimates — The preparation of financial statements in conformity with US GAAP requires management to make estimates and assumptions that affect the fair value of investments, the reported amounts of assets and liabilities and disclosure of contingent assets and liabilities at the date of the
89
Notes to financial statements
Delaware International Funds
1. Significant Accounting Policies (continued) financial statements, and the reported amounts of revenues and expenses during the reporting period. Actual results could differ from those estimates and the differences could be material.
Other — Expenses directly attributable to a Fund are charged directly to the Fund. Other expenses common to various funds within the Delaware Funds by Macquarie® (Delaware Funds) are generally allocated among such funds on the basis of average net assets. Management fees and certain other expenses are paid monthly. Security transactions are recorded on the date the securities are purchased or sold (trade date) for financial reporting purposes. Costs used in calculating realized gains and losses on the sale of investment securities are those of the specific securities sold. Dividend income is recorded on the ex-dividend date and interest income is recorded on the accrual basis. Discounts and premiums on debt securities are accreted or amortized to interest income, respectively, over the lives of the respective securities using the effective interest method. Taxable non-cash dividends are recorded as dividend income. Foreign dividends are also recorded on the ex-dividend date or as soon after the ex-dividend date that a Fund is aware of such dividends, net of all tax withholdings, a portion of which may be reclaimable. Withholding taxes and reclaims on foreign dividends have been recorded in accordance with each Fund’s understanding of the applicable country’s tax rules and rates. Each Fund may pay foreign capital gains taxes on certain foreign securities held, which are reported as components of realized losses for financial reporting purposes, whereas such components are treated as ordinary loss for federal income tax purposes. Each Fund will accrue such taxes as applicable based upon current interpretations of the tax rules and regulations that exist in the markets in which it invests. Each Fund declares and pays dividends from net investment income and distributions from net realized gain on investments, if any, annually. Each Fund may distribute more frequently, if necessary for tax purposes. Dividends and distributions, if any, are recorded on the ex-dividend date.
Each Fund receives earnings credits from its custodian when positive cash balances are maintained, which may be used to offset custody fees. There were no such earnings credits for the year ended November 30, 2021.
Each Fund receives earnings credits from its transfer agent when positive cash balances are maintained, which may be used to offset transfer agent fees. If the amount earned is greater than $1, the expenses paid under this arrangement are included on the “Statements of operations” under “Dividend disbursing and transfer agent fees and expenses” with the corresponding expenses offset included under “Less expenses paid indirectly.” For the year ended November 30, 2021, each Fund earned the following amounts under this arrangement:
| Fund | Earnings Credits | ||||
| Delaware Emerging Markets Fund | $ | 1,319 | |||
| Delaware International Small Cap Fund | 53 | ||||
| Delaware International Value Equity Fund | 496 | ||||
90
2. Investment Management, Administration Agreements, and Other Transactions with Affiliates
In accordance with the terms of its respective investment management agreement, each Fund pays Delaware Management Company (DMC), a series of Macquarie Investment Management Business Trust and the investment manager, an annual fee which is calculated daily and paid monthly, based on each Fund’s average daily net assets as follows:
| Delaware Emerging | Delaware International | Delaware International | ||||
| Markets Fund | Small Cap Fund | Value Equity Fund | ||||
| On the first $500 million | 1.2500% | 0.8500% | 0.8500% | |||
| On the next $500 million | 1.2000% | 0.8000% | 0.8000% | |||
| On the next $1.5 billion | 1.1500% | 0.7500% | 0.7500% | |||
| In excess of $2.5 billion | 1.1000% | 0.7000% | 0.7000% |
DMC has contractually agreed to waive all or a portion, if any, of its management fee and/or pay/reimburse expenses (excluding any distribution and service (12b-1) fees, acquired fund fees and expenses, taxes, interest, short sale dividend and interest expenses, brokerage fees, certain insurance costs, and nonroutine expenses or costs, including, but not limited to, those relating to reorganizations, litigation, conducting shareholder meetings, and liquidations), in order to prevent total annual fund operating expenses from exceeding the following specified percentages of average daily net assets of each Fund. The expense waivers were in effect from December 1, 2020 through November 30, 2021.* These waivers and reimbursements may only be terminated by agreement of DMC and the Funds. The waivers and reimbursements are accrued daily and received monthly.
| Operating expense | Operating expense | |||||||||
| limitation as | limitation as | |||||||||
| a percentage | a percentage | |||||||||
| of average | of average | |||||||||
| daily net assets | daily net assets | |||||||||
| (per annum) | (per annum) | |||||||||
| December 1, 2020- | March 30, 2021- | |||||||||
| Fund | March 29, 2021 | November 30, 2021 | ||||||||
| Delaware Emerging Markets Fund | 1.37 | %1 | 1.32 | %2 | ||||||
| Delaware International Small Cap Fund | 1.12 | %3 | 1.12 | %3 | ||||||
| Delaware International Value Equity Fund | 0.88 | %4 | 0.88 | %4 | ||||||
| 1 | The expense limitation was 1.25% for Class R6 shares. |
| 2 | The expense limitation is 1.20% for Class R6 shares. |
| 3 | The expense limitation is 1.00% for Class R6 shares. |
| 4 | The expense limitation is 0.82% for Class R6 shares. |
DMC may permit its affiliates, Macquarie Investment Management Global Limited (MIMGL) and Macquarie Funds Management Hong Kong Limited (together, the “Affiliated Sub-Advisors”), to execute Fund equity security trades on behalf of the Manager. The Manager may also seek quantitative support from MIMGL. Although the Affiliated Sub-Advisors serve as sub-advisors, DMC has ultimate
91
Notes to financial statements
Delaware International Funds
2. Investment Management, Administration Agreements, and Other Transactions with Affiliates (continued)
responsibility for all investment advisory services. For these services, DMC, not the Fund, may pay each Affiliated Sub-Advisor a portion of its investment management fee.
Delaware Investments Fund Services Company (DIFSC), an affiliate of DMC, provides fund accounting and financial administrative oversight services to each Fund. For these services, DIFSC’s fees are calculated daily and paid monthly, based on the aggregate daily net assets of all funds within the Delaware Funds at the following annual rates: 0.00475% of the first $35 billion; 0.0040% of the next $10 billion; and 0.0025% of aggregate average daily net assets in excess of $45 billion (Total Fee). Each fund in the Delaware Funds pays a minimum of $4,000, which, in aggregate, is subtracted from the Total Fee. Each fund then pays its portion of the remainder of the Total Fee on a relative NAV basis. These amounts are included on the “Statements of operations” under “Accounting and administration expenses.” For the year ended November 30, 2021, each Fund was charged for these services as follows:
| Fund | Fees | ||
| Delaware Emerging Markets Fund | $ | 237,697 | |
| Delaware International Small Cap Fund | 8,130 | ||
| Delaware International Value Equity Fund | 19,780 | ||
DIFSC is also the transfer agent and dividend disbursing agent of the Funds. For these services, DIFSC’s fees are calculated daily and paid monthly, based on the aggregate daily net assets of the retail funds within the Delaware Funds at the following annual rates: 0.014% of the first $20 billion; 0.011% of the next $5 billion; 0.007% of the next $5 billion; 0.005% of the next $20 billion; and 0.0025% of average daily net assets in excess of $50 billion. The fees payable to DIFSC under the shareholder services agreement described above are allocated among all retail funds in the Delaware Funds on a relative NAV basis. This amount is included on the “Statements of operations” under “Dividend disbursing and transfer agent fees and expenses.” For the year ended November 30, 2021, each Fund was charged for these services as follows:
| Fund | Fees | ||
| Delaware Emerging Markets Fund | $ | 571,126 | |
| Delaware International Small Cap Fund | 10,103 | ||
| Delaware International Value Equity Fund | 37,969 | ||
Pursuant to a sub-transfer agency agreement between DIFSC and BNY Mellon Investment Servicing (US) Inc. (BNYMIS), BNYMIS provides certain sub-transfer agency services to the Funds. Sub-transfer agency fees are paid by the Funds and are also included on the “Statements of operations” under “Dividend disbursing and transfer agent fees and expenses.” The fees that are calculated daily and paid as invoices are received on a monthly or quarterly basis.
Pursuant to a distribution agreement and distribution plan, each Fund pays DDLP, the distributor and an affiliate of DMC, an annual 12b-1 fee of 0.25%, 1.00%, and 0.50% of the average daily net assets of the
92
Class A, Class C, and Class R shares, respectively. The fees are calculated daily and paid monthly. Institutional Class and Class R6 shares do not pay 12b-1 fee.
As provided in the investment management agreement, each Fund bears a portion of the cost of certain resources shared with DMC, including the cost of internal personnel of DMC and/or its affiliates that provide legal and regulatory reporting services to the Funds. These amounts are included on the “Statements of operations” under “Legal fees.” For the year ended November 30, 2021, each Fund was charged for internal legal and regulatory reporting services provided by DMC and/or its affiliates’ employees as follows:
| Fund | Fees | ||
| Delaware Emerging Markets Fund | $ | 238,601 | |
| Delaware International Small Cap Fund | 10,350 | ||
| Delaware International Value Equity Fund | 18,866 | ||
For the year ended November 30, 2021, DDLP earned commissions on sales of Class A shares for each Fund as follows:
| Fund | Commissions | ||||
| Delaware Emerging Markets Fund | $ | 44,554 | |||
| Delaware International Small Cap Fund | 2,701 | ||||
| Delaware International Value Equity Fund | 11,191 | ||||
For the year ended November 30, 2021, DDLP received gross CDSC commissions on redemptions of each Fund’s Class A and Class C shares, and these commissions were entirely used to offset upfront commissions previously paid by DDLP to broker/dealers on sales of those shares. The amounts received were as follows:
| Fund | Class A | Class C | |||||
| Delaware Emerging Markets Fund | $ | 14 | $ | 8,277 | |||
| Delaware International Small Cap Fund | — | 35 | |||||
| Delaware International Value Equity Fund | 1 | 155 | |||||
Trustees’ fees include expenses accrued by each Fund for each Trustee’s retainer and meeting fees. Certain officers of DMC, DIFSC, and DDLP are officers and/or Trustees of the Trusts. These officers and Trustees are paid no compensation by the Funds.
| * | The aggregate contractual waiver period covering this report is from March 27, 2020 through March 31, 2022 for Delaware Emerging Markets Fund and Delaware International Small Cap Fund and July 31, 2020 through March 31, 2022 for Delaware International Value Equity Fund. |
93
Notes to financial statements
Delaware International Funds
3. Investments
For the year ended November 30, 2021, each Fund made purchases and sales of investment securities other than short-term investments as follows:
| Fund | Purchases | Sales | ||||
| Delaware Emerging Markets Fund | $ | 1,109,223,518 | $ | 287,801,940 | ||
| Delaware International Small Cap Fund | 110,158,616 | 132,539,724 | ||||
| Delaware International Value Equity Fund | 165,922,946 | 249,705,387 | ||||
The tax cost of investments and derivatives includes adjustments to net unrealized appreciation (depreciation), which may not necessarily be the final tax cost basis adjustments but which approximate the tax basis unrealized gains and losses that may be realized and distributed to shareholders. At November 30, 2021, the cost and unrealized appreciation (depreciation) of investments and derivatives for federal income tax purposes for each Fund were as follows:
| Aggregate | Aggregate | ||||||||||||
| unrealized | unrealized | Net unrealized | |||||||||||
| Cost of | appreciation | depreciation | appreciation | ||||||||||
| investments | of investments | of investments | of investments | ||||||||||
| Fund | and derivatives | and derivatives | and derivatives | and derivatives | |||||||||
| Delaware | |||||||||||||
| Emerging | |||||||||||||
| Markets | |||||||||||||
| Fund | $ | 5,016,551,100 | $ | 2,519,682,437 | $ | (1,074,921,419 | ) | $ | 1,444,761,018 | ||||
| Delaware | |||||||||||||
| International | |||||||||||||
| Small Cap | |||||||||||||
| Fund | 83,707,014 | 28,983,108 | (7,329,693 | ) | 21,653,415 | ||||||||
| Delaware | |||||||||||||
| International | |||||||||||||
| Value | |||||||||||||
| Equity | |||||||||||||
| Fund | 536,808,248 | 63,667,817 | (53,838,152 | ) | 9,829,665 | ||||||||
US GAAP defines fair value as the price that each Fund would receive to sell an asset or pay to transfer a liability in an orderly transaction between market participants at the measurement date under current market conditions. A three-level hierarchy for fair value measurements has been established based upon the transparency of inputs to the valuation of an asset or liability. Inputs may be observable or unobservable and refer broadly to the assumptions that market participants would use in pricing the asset or liability. Observable inputs reflect the assumptions market participants would use in pricing the asset or liability based on market data obtained from sources independent of the reporting entity. Unobservable inputs reflect the reporting entity’s own assumptions about the assumptions that market participants would use in pricing the asset or liability based on the best information available under the
94
circumstances. Each Fund’s investment in its entirety is assigned a level based upon the observability of the inputs which are significant to the overall valuation. The three-level hierarchy of inputs is summarized as follows:
| Level 1 – | Inputs are quoted prices in active markets for identical investments. (Examples: equity securities, open-end investment companies, futures contracts, and exchange-traded options contracts) |
| Level 2 – | Other observable inputs, including, but not limited to: quoted prices for similar assets or liabilities in markets that are active, quoted prices for identical or similar assets or liabilities in markets that are not active, inputs other than quoted prices that are observable for the assets or liabilities (such as interest rates, yield curves, volatilities, prepayment speeds, loss severities, credit risks, and default rates) or other market-corroborated inputs. (Examples: debt securities, government securities, swap contracts, foreign currency exchange contracts, foreign securities utilizing international fair value pricing, broker-quoted securities, and fair valued securities) |
| Level 3 – | Significant unobservable inputs, including each Fund’s own assumptions used to determine the fair value of investments. (Examples: broker-quoted securities and fair valued securities) |
Level 3 investments are valued using significant unobservable inputs. Each Fund may also use an income-based valuation approach in which the anticipated future cash flows of the investment are discounted to calculate fair value. Discounts may also be applied due to the nature or duration of any restrictions on the disposition of the investments. Valuations may also be based upon current market prices of securities that are comparable in coupon, rating, maturity, and industry. The derived value of a Level 3 investment may not represent the value which is received upon disposition and this could impact the results of operations.
The following tables summarize the valuation of each Fund’s investments by fair value hierarchy levels as of November 30, 2021:
| Delaware Emerging Markets Fund | |||||||||||||||
| Level 1 | Level 2 | Level 3 | Total | ||||||||||||
| Securities | |||||||||||||||
| Assets: | |||||||||||||||
| Common Stock | |||||||||||||||
| Argentina | $ | 13,440,212 | $ | 1,163,742 | $ | — | $ | 14,603,954 | |||||||
| Australia | 40,159,200 | — | — | 40,159,200 | |||||||||||
| Bahrain | 2,348,766 | — | — | 2,348,766 | |||||||||||
| Brazil | 257,922,139 | — | — | 257,922,139 | |||||||||||
| Chile | 68,209,681 | — | — | 68,209,681 | |||||||||||
| China | 608,875,184 | 1,333,461,507 | — | 1,942,336,691 | |||||||||||
| Hong Kong | 11,635,035 | — | — | 11,635,035 | |||||||||||
| India | 149,582,168 | 626,778,553 | — | 776,360,721 | |||||||||||
| Indonesia | — | 78,937,013 | — | 78,937,013 | |||||||||||
95
Notes to financial statements
Delaware International Funds
3. Investments (continued)
| Delaware Emerging Markets Fund | |||||||||||||||
| Level 1 | Level 2 | Level 3 | Total | ||||||||||||
| Malaysia | $ | 1,251,336 | $ | — | $ | — | $ | 1,251,336 | |||||||
| Mexico | 231,938,070 | — | — | 231,938,070 | |||||||||||
| Peru | 23,519,194 | — | — | 23,519,194 | |||||||||||
| Philippines | — | 16,341,610 | — | 16,341,610 | |||||||||||
| Republic of Korea | 261,068,400 | 838,689,573 | — | 1,099,757,973 | |||||||||||
| Russia | 61,436,793 | 355,829,129 | — | 1 | 417,265,922 | ||||||||||
| South Africa | 13,937,331 | — | — | 13,937,331 | |||||||||||
| Taiwan | — | 1,032,975,411 | — | 1,032,975,411 | |||||||||||
| Turkey | 33,358,943 | 3,396,219 | — | 36,755,162 | |||||||||||
| United Kingdom | — | 3,901,582 | — | 3,901,582 | |||||||||||
| United States | 252,311,000 | — | — | 252,311,000 | |||||||||||
| Exchange-Traded Fund | 5,213,339 | — | — | 5,213,339 | |||||||||||
| Participation Notes | — | — | — | 1 | — | ||||||||||
| Preferred Stock2 | 46,642,248 | 86,759,442 | — | 133,401,690 | |||||||||||
| Warrants | 229,298 | — | — | 229,298 | |||||||||||
| Total Value of Securities | $ | 2,083,078,337 | $ | 4,378,233,781 | $ | — | $ | 6,461,312,118 | |||||||
| 1 | The security that has been valued at zero on the “Schedule of investments” is considered to be Level 3 investment in this table. |
| 2 | Security type is valued across multiple levels. The amounts attributed to Level 1 investments and Level 2 investments represent 34.96% and 65.04%, respectively, of the total market value of this security type. Level 1 investments represent exchange-traded investments and Level 2 investments represent investments with observable inputs or matrix-priced investments. |
| Delaware International Small Cap Fund | ||||||||||
| Level 1 | Level 2 | Total | ||||||||
| Securities | ||||||||||
| Assets: | ||||||||||
| Common Stock | ||||||||||
| Australia | $ | — | $ | 4,117,786 | $ | 4,117,786 | ||||
| Austria | 418,032 | — | 418,032 | |||||||
| Brazil | 2,781,317 | — | 2,781,317 | |||||||
| Canada | 12,684,961 | — | 12,684,961 | |||||||
| Denmark | — | 627,871 | 627,871 | |||||||
| Finland | — | 1,258,625 | 1,258,625 | |||||||
| France | — | 1,364,925 | 1,364,925 | |||||||
| Germany | — | 8,412,650 | 8,412,650 | |||||||
| Hong Kong | — | 500,463 | 500,463 | |||||||
| India | — | 4,175,459 | 4,175,459 | |||||||
96
| Delaware International Small Cap Fund | ||||||||||||
| Level 1 | Level 2 | Total | ||||||||||
| Ireland | $ | 1,181,699 | $ | — | $ | 1,181,699 | ||||||
| Israel | 1,957,988 | — | 1,957,988 | |||||||||
| Italy | — | 4,547,945 | 4,547,945 | |||||||||
| Japan | — | 20,818,389 | 20,818,389 | |||||||||
| Mexico | 705,398 | — | 705,398 | |||||||||
| Norway | — | 1,540,071 | 1,540,071 | |||||||||
| Republic of Korea | — | 6,615,994 | 6,615,994 | |||||||||
| Russia | 2,102,498 | 767,211 | 2,869,709 | |||||||||
| South Africa | 1,211,575 | — | 1,211,575 | |||||||||
| Spain | — | 966,750 | 966,750 | |||||||||
| Sweden | 2,692,685 | 2,863,149 | 5,555,834 | |||||||||
| Taiwan | — | 2,327,434 | 2,327,434 | |||||||||
| United Kingdom | 6,693,392 | 9,663,249 | 16,356,641 | |||||||||
| Short-Term Investments | 2,372,497 | — | 2,372,497 | |||||||||
| Total Value of Securities | $ | 34,802,042 | $ | 70,567,971 | $ | 105,370,013 | ||||||
| Derivatives1 | ||||||||||||
| Liabilities: | ||||||||||||
| Foreign Currency Exchange Contracts | $ | — | $ | (9,584 | ) | $ | (9,584 | ) | ||||
| 1 | Foreign currency exchange contracts are valued at the unrealized appreciation (depreciation) on the instrument at the year end. |
| Delaware International Value Equity Fund | |||||||||||
| Level 1 | Level 2 | Total | |||||||||
| Securities | |||||||||||
| Assets: | |||||||||||
| Common Stock | $ | — | $ | 517,421,844 | $ | 517,421,844 | |||||
| Exchange-Traded Funds | 8,968,294 | — | 8,968,294 | ||||||||
| Short-Term Investments | 2,346,646 | — | 2,346,646 | ||||||||
| Securities Lending Collateral1 | 2,415,000 | 15,483,886 | 17,898,886 | ||||||||
| Total Value of Securities | $ | 13,729,940 | $ | 532,905,730 | $ | 546,635,670 | |||||
| Derivatives2 | |||||||||||
| Assets: | |||||||||||
| Foreign Currency Exchange Contracts | $ | — | $ | 12,563 | $ | 12,563 | |||||
| Liabilities: | |||||||||||
| Foreign Currency Exchange Contracts | $ | — | $ | (10,320 | ) | $ | (10,320 | ) | |||
97
Notes to financial statements
Delaware International Funds
3. Investments (continued)
| 1 | Security type is valued across multiple levels. The amounts attributed to Level 1 investments and Level 2 investments represent 13.49% and 86.51%, respectively, of the total market value of this security type. Level 1 investments represent exchange-traded investments and Level 2 investments represent investments with observable inputs. |
| 2 | Foreign currency exchange contracts are valued at the unrealized appreciation (depreciation) on the instrument at the year end. |
During the year ended November 30, 2021, there were no transfers into or out of Level 3 investments. Each Fund’s policy is to recognize transfers into or out of Level 3 investments based on fair value at the beginning of the reporting period.
A reconciliation of Level 3 investments is presented when a Fund has a significant amount of Level 3 investments at the beginning or end of the year in relation to that Fund’s net assets. Management has determined not to provide a reconciliation of Level 3 investments as the Level 3 investments were not considered significant to each Fund’s net assets at the beginning, interim, or end of the year. Management has determined not to provide additional disclosure on Level 3 inputs since the Level 3 investments are not considered significant to each Fund’s net assets at the end of the year.
During the year ended November 30, 2021, Delaware International Small Cap Fund and Delaware International Value Equity Fund had no Level 3 investments.
4. Dividend and Distribution Information
Income and long-term capital gain distributions are determined in accordance with federal income tax regulations, which may differ from US GAAP. Additionally, distributions from net gains on foreign currency transactions and net short-term gains on sales of investment securities are treated as ordinary income for federal income tax purposes. The tax character of dividends and distributions paid during the years ended November 30, 2021 and 2020 were as follows:
| Long-term | ||||||||||||
| Ordinary | capital | Return of | ||||||||||
| income | gains | capital | Total | |||||||||
| Year ended November 30, 2021: | ||||||||||||
| Delaware Emerging Markets Fund | $ | 10,224,841 | $ | 34,112,235 | $ | — | $ | 44,337,076 | ||||
| Delaware International Value Equity Fund | 3,303,244 | 2,388,057 | — | 5,691,301 | ||||||||
| Year ended November 30, 2020: | ||||||||||||
| Delaware Emerging Markets Fund | 43,709,471 | 427,030 | — | 44,136,501 | ||||||||
| Delaware International Small Cap Fund | 209,984 | — | 22,921 | 232,905 | ||||||||
| Delaware International Value Equity Fund | 4,330,566 | 4,213,609 | — | 8,544,175 | ||||||||
Delaware International Small Cap Fund did not pay any dividends and distributions for the year ending November 30, 2021.
98
5. Components of Net Assets on a Tax Basis
As of November 30, 2021, the components of net assets on a tax basis were as follows:
| Delaware Emerging | Delaware International | Delaware International | ||||||||||||||
| Markets Fund | Small Cap Fund | Value Equity Fund | ||||||||||||||
| Shares of beneficial interest | $ | 5,038,360,387 | $ | 79,041,676 | $ | 484,985,408 | ||||||||||
| Undistributed ordinary | ||||||||||||||||
| income | 144,014,052 | — | 5,152,165 | |||||||||||||
| Undistributed long-term | ||||||||||||||||
| capital gains | — | 5,675,438 | 33,387,657 | |||||||||||||
| Capital loss carryforwards | (206,627,548 | ) | — | — | ||||||||||||
| Unrealized appreciation | ||||||||||||||||
| (depreciation) of | ||||||||||||||||
| investments and foreign | ||||||||||||||||
| currencies | 1,444,761,018 | 21,653,415 | 9,829,665 | |||||||||||||
| Net assets | $ | 6,420,507,909 | $ | 106,370,529 | $ | 533,354,895 | ||||||||||
The differences between book basis and tax basis components of net assets are primarily attributable to tax deferral of losses on wash sales, tax treatment of forward currency contracts, tax treatment of passive foreign investment companies (PFICs), and securities no longer considered PFICs.
For financial reporting purposes, capital accounts are adjusted to reflect the tax character of permanent book/tax differences. Reclassifications are primarily due to net operating loss and wash sales from merger. Results of operations and net assets were not affected by these reclassifications. For the year ended November 30, 2021, the Funds recorded the following reclassifications:
| Delaware International | Delaware International | |||||||||||
| Small Cap Fund | Value Equity Fund | |||||||||||
| Paid-in capital | $ | (245,423 | ) | $ | 2,111,225 | |||||||
| Total distributable earnings | ||||||||||||
| (loss) | 245,423 | (2,111,225 | ) | |||||||||
Delaware Emerging Markets Fund had no reclassifications.
For federal income tax purposes, capital loss carryforwards may be carried forward and applied against future capital gains. At November 30, 2021, Delaware International Small Cap Fund utilized $14,868,377 capital loss carryforwards.
Delaware Emerging Markets Fund and Delaware International Value Equity Fund did not utilize capital loss carryforward for 2021.
99
Notes to financial statements
Delaware International Funds
5. Components of Net Assets on a Tax Basis (continued)
At November 30, 2021, capital loss carryforwards available to offset future realized capital gains were as follows:
| Loss carryforward character | |||||||||
| Short-term | Long-term | Total | |||||||
| Delaware Emerging | |||||||||
| Markets Fund | $ | 4,473,650 | $ | 202,153,898 | $ | 206,627,548 | |||
Delaware International Small Cap Fund and Delaware International Value Equity Fund had no capital loss carryforwards.
100
6. Capital Shares
Transactions in capital shares were as follows:
| Delaware Emerging | Delaware International | Delaware International | |||||||||||||||||
| Markets Fund | Small Cap Fund | Value Equity Fund | |||||||||||||||||
| Year ended | Year ended | Year ended | |||||||||||||||||
| 11/30/21 | 11/30/20 | 11/30/21 | 11/30/20 | 11/30/21 | 11/30/20 | ||||||||||||||
| Shares sold: | |||||||||||||||||||
| Class A | 3,504,915 | 3,800,155 | 325,112 | 166,626 | 3,662,429 | 601,892 | |||||||||||||
| Class C | 757,294 | 416,232 | 7,548 | 68,599 | 29,493 | 66,004 | |||||||||||||
| Class R | 323,745 | 336,451 | 960 | 28,214 | 218,407 | 108,335 | |||||||||||||
| Institutional Class | 63,660,609 | 59,484,711 | 978,951 | 2,181,691 | 4,469,948 | 7,806,680 | |||||||||||||
| Class R6 | 58,876,456 | 14,167,608 | 844,837 | 1,256,101 | 162,769 | 18,747 | |||||||||||||
| Shares from merger:1 | |||||||||||||||||||
| Class A | — | — | — | — | 7,352,351 | — | |||||||||||||
| Institutional Class | — | — | — | — | 7,755,262 | — | |||||||||||||
| Class R6 | — | — | — | — | 10,980 | — | |||||||||||||
| Shares issued upon reinvestment of dividends and distributions: | |||||||||||||||||||
| Class A | 83,142 | 96,611 | — | — | 61,789 | 114,423 | |||||||||||||
| Class C | 33,203 | — | — | — | 3,021 | 11,490 | |||||||||||||
| Class R | 9,242 | 6,517 | — | — | 2,660 | 5,718 | |||||||||||||
| Institutional Class | 1,109,857 | 1,376,861 | — | 26,670 | 300,524 | 451,416 | |||||||||||||
| Class R6 | 245,069 | 210,213 | — | 625 | 359 | 3,895 | |||||||||||||
| 128,603,532 | 79,895,359 | 2,157,408 | 3,728,526 | 24,029,992 | 9,188,600 | ||||||||||||||
| Shares redeemed: | |||||||||||||||||||
| Class A | (4,005,757 | ) | (6,631,977 | ) | (194,649 | ) | (844,513 | ) | (2,088,103 | ) | (920,232 | ) | |||||||
| Class C | (1,466,111 | ) | (2,624,550 | ) | (192,565 | ) | (234,152 | ) | (153,594 | ) | (250,099 | ) | |||||||
| Class R | (548,343 | ) | (1,003,053 | ) | (24,992 | ) | (1,161 | ) | (93,006 | ) | (159,139 | ) | |||||||
| Institutional Class | (82,650,556 | ) | (88,414,469 | ) | (3,777,033 | ) | (7,990,035 | ) | (8,724,301 | ) | (7,133,324 | ) | |||||||
| Class R6 | (16,613,895 | ) | (18,905,111 | ) | (75,349 | ) | (390,839 | ) | (40,620 | ) | (58,176 | ) | |||||||
| (105,284,662 | ) | (117,579,160 | ) | (4,264,588 | ) | (9,460,700 | ) | (11,099,624 | ) | (8,520,970 | ) | ||||||||
| Net increase | |||||||||||||||||||
| (decrease) | 23,318,870 | (37,683,801 | ) | (2,107,180 | ) | (5,732,174 | ) | 12,930,368 | 667,630 | ||||||||||
| 1 | See Note 7. |
101
Notes to financial statements
Delaware International Funds
6. Capital Shares (continued)
Certain shareholders may exchange shares of one class for shares of another class in the same Fund. These exchange transactions are included as subscriptions and redemptions in the table on the previous page and on the “Statements of changes in net assets.” For the years ended November 30, 2021 and 2020, each Fund had the following exchange transactions:
| Exchange Redemptions | Exchange Subscriptions | ||||||||||||||||
| Institutional | Institutional | ||||||||||||||||
| Class A | Class C | Class | Class R6 | Class A | Class | Class R6 | |||||||||||
| Shares | Shares | Shares | Shares | Shares | Shares | Shares | Value | ||||||||||
| Delaware Emerging Markets Fund | |||||||||||||||||
| Year ended | |||||||||||||||||
| 11/30/21 | 32,080 | 21,200 | 30,353,407 | 3,061,113 | 29,848 | 3,071,420 | 30,331,738 | $ | 830,172,974 | ||||||||
| 11/30/20 | 61,268 | 39,452 | 16,653 | 59,883 | 19,261 | 136,534 | 18,093 | 3,448,082 | |||||||||
| Delaware International Small Cap Fund | |||||||||||||||||
| Year ended | |||||||||||||||||
| 11/30/21 | 600 | 17,663 | — | — | 14,617 | 570 | — | 144,060 | |||||||||
| 11/30/20 | 1,259 | 1,133 | — | — | 943 | 1,198 | — | 16,136 | |||||||||
| Delaware International Value Equity Fund | |||||||||||||||||
| Year ended | |||||||||||||||||
| 11/30/21 | 129,231 | 17,859 | — | — | 17,752 | 128,609 | — | 2,404,406 | |||||||||
| 11/30/20 | 1 | 5,003 | — | — | 4,951 | 1 | — | 68,444 | |||||||||
7. Reorganization
On July 9, 2021, the Board approved a proposal to reorganize Delaware International Fund, a series of Delaware Group® Equity Funds IV (the “Acquired Fund”) with and into Delaware International Value Equity Fund (the “Acquiring Fund”), (the “Reorganization”). Pursuant to an Agreement and Plan of Reorganization (the “Plan”): (i) all of the property, assets, and goodwill of the Acquired Fund were acquired by the Acquiring Fund, and (ii) the Trust, on behalf of the Acquiring Fund, assumed the liabilities of the Acquired Fund, in exchange for shares of the Acquiring Fund. In accordance with the Plan, the Acquired Fund liquidated and dissolved following the Reorganization. The purpose of the transaction was to allow shareholders of the Acquired Fund to own shares of a Fund with a similar investment objective and style as, and potentially lower net expenses than the Acquired Fund. The Reorganization was accomplished by a tax-free exchange of shares on July 9, 2021. For financial reporting purposes, assets received and shares issued by the Acquiring Fund were recorded at fair value; however, the cost basis of the investments received from the Acquired Fund was carried forward to align ongoing reporting of the Acquiring Fund’s realized and unrealized gains and losses with amounts distributable to shareholders for tax purposes.
102
The share transactions associated with the Reorganization are as follows:
| Shares | ||||||||||||
| Acquired | Acquired | Converted | Acquiring | |||||||||
| Fund | Fund Shares | to Acquiring | Fund | Conversion | ||||||||
| Net Assets | Outstanding | Fund | Net Assets | Ratio | ||||||||
| Delaware International Value | ||||||||||||
| Delaware International Fund | Equity Fund | |||||||||||
| Class A | $ | 123,151,872 | 8,950,423 | 7,352,351 | $ | 108,216,266 | 0.8215 | |||||
| Institutional | ||||||||||||
| Class | 130,443,502 | 9,193,655 | 7,755,262 | 272,890,128 | 0.8435 | |||||||
| Class R6 | 184,692 | 12,928 | 10,980 | 2,036,414 | 0.8493 | |||||||
The net assets of the Acquiring Fund before the Reorganization were $394,025,097. The net assets of the Acquiring Fund immediately following the Reorganization were $647,805,163.
Assuming the Reorganization had been completed on December 1, 2020, the Acquiring Fund’s pro forma results of operations for the year ended November 30, 2021, would have been as follows:
| Delaware International Value Equity Fund | ||||||
| Net investment income | $ | 6,977,433 | ||||
| Net realized gain on investments | 51,709,316 | |||||
| Net change in unrealized appreciation (depreciation) | (566,877 | ) | ||||
| Net increase in net assets resulting from operations | $ | 58,119,872 | ||||
Because the combined investment portfolios have been managed as a single integrated portfolio since the acquisition was completed, it is not practical to separate the amounts of revenue and earnings of the Acquired Fund that have been included in the Acquiring Fund’s Statement of Operations since the Reorganization was consummated on July 9, 2021.
8. Line of Credit
Each Fund, along with certain other funds in the Delaware Funds (Participants), is a participant in a $225,000,000 revolving line of credit (Agreement) intended to be used for temporary or emergency purposes as an additional source of liquidity to fund redemptions of investor shares. Under the Agreement, the Participants are charged an annual commitment fee of 0.15% with the addition of an upfront fee of 0.05%, which is allocated across the Participants based on a weighted average of the respective net assets of each Participant. The Participants are permitted to borrow up to a maximum of one-third of their net assets under the Agreement. Each Participant is individually, and not jointly, liable for its particular advances, if any, under the line of credit. The line of credit available under the Agreement expired on November 1, 2021.
On November 1, 2021, each Fund, along with the other Participants, entered into an amendment to the agreement for a $355,000,000 revolving line of credit to be used as described above and operates in substantially the same manner as the original Agreement. Under the amendment to the agreement, the Participants are charged an annual commitment fee of 0.15%, with the addition of an upfront fee of
103
Notes to financial statements
Delaware International Funds
8. Line of Credit (continued)
0.05%, which is allocated across the Participants based on a weighted average of the respective net assets of each Participant. The line of credit available under the agreement expires on October 31, 2022.
Each Fund had no amounts outstanding as of November 30, 2021, or at any time during the year then ended.
9. Derivatives
US GAAP requires disclosures that enable investors to understand: (1) how and why an entity uses derivatives; (2) how they are accounted for; and (3) how they affect an entity’s results of operations and financial position.
Foreign Currency Exchange Contracts — Each Fund may enter into foreign currency exchange contracts and foreign cross currency exchange contracts as a way of managing foreign exchange rate risk. Each Fund may enter into these contracts to fix the US dollar value of a security that it has agreed to buy or sell for the period between the date the trade was entered into and the date the security is delivered and paid for. Each Fund may also use these contracts to hedge the US dollar value of securities it already owns that are denominated in foreign currencies. In addition, each Fund may enter into these contracts to facilitate or expedite the settlement of portfolio transactions. The change in value is recorded as an unrealized gain or loss. When the contract is closed, a realized gain or loss is recorded equal to the difference between the value of the contract at the time it was opened and the value at the time it was closed.
The use of foreign currency exchange contracts and foreign cross currency exchange contracts does not eliminate fluctuations in the underlying prices of the securities, but does establish a rate of exchange that can be achieved in the future. Although foreign currency exchange contracts and foreign cross currency exchange contracts limit the risk of loss due to an unfavorable change in the value of the hedged currency, they also limit any potential gain that might result should the value of the currency change favorably. In addition, each Fund could be exposed to risks if the counterparties to the contracts are unable to meet the terms of their contracts. Each Fund’s maximum risk of loss from counterparty credit risk is the value of its currency exchanged with the counterparty. The risk is generally mitigated by having a netting arrangement between each Fund and the counterparty and by the posting of collateral by the counterparty to the Fund to cover each Fund’s exposure to the counterparty.
During the year ended November 30, 2021, Delaware Emerging Markets Fund and Delaware International Small Cap Fund entered into foreign currency exchange contracts and foreign cross currency exchange contracts to facilitate or expedite the settlement of portfolio transactions. Delaware International Value Equity Fund entered into foreign currency exchange contracts and foreign cross currency contracts in order to fix the US dollar value of a security between trade date and settlement date.
During the year ended November 30, 2021, the Funds experienced net realized and unrealized gains or losses attributable to foreign currency holdings, which are disclosed on the “Statements of assets and liabilities” and “Statements of operations.”
104
The table below summarizes the average balance of derivative holdings by each Fund during the year ended November 30, 2021:
| Long Derivative Volume | ||||||||||||
| Delaware Emerging | Delaware International | Delaware International | ||||||||||
| Markets Fund | Small Cap Fund | Value Equity Fund | ||||||||||
| Foreign currency exchange | ||||||||||||
| contracts (average | ||||||||||||
| notional value) | $ | 732,254 | $ | 325,748 | $ | 468,877 | ||||||
| Short Derivative Volume | ||||||||||||
| Delaware Emerging | Delaware International | Delaware International | ||||||||||
| Markets Fund | Small Cap Fund | Value Equity Fund | ||||||||||
| Foreign currency exchange | ||||||||||||
| contracts (average | ||||||||||||
| notional value) | $ | 348,834 | $ | 399,640 | $ | 808,657 | ||||||
10. Offsetting
Each Fund entered into an International Swaps and Derivatives Association, Inc. Master Agreement (ISDA Master Agreement) or a similar agreement with certain of their derivative contract counterparties in order to better define their contractual rights and to secure rights that will help each Fund mitigate its counterparty risk. An ISDA Master Agreement is a bilateral agreement between each Fund and a counterparty that governs over-the-counter (OTC) derivatives and foreign exchange contracts and typically contains, among other things, collateral posting items and netting provisions in the event of a default and/or termination event. Under an ISDA Master Agreement, each Fund may, under certain circumstances, offset with the counterparty certain derivative financial instruments’ payables and/or receivables with collateral held and/or posted and create one single net payment. The provisions of the ISDA Master Agreement typically permit a single net payment in the event of default (close-out), including the bankruptcy or insolvency of the counterparty. However, bankruptcy or insolvency laws of a particular jurisdiction may impose restrictions on or prohibitions against the right of offset in bankruptcy, insolvency, or other events.
For financial reporting purposes, each Fund does not offset derivative assets and derivative liabilities that are subject to netting arrangements on the “Statements of assets and liabilities.”
105
Notes to financial statements
Delaware International Funds
10. Offsetting (continued)
At November 30, 2021, each Fund had the following assets and liabilities subject to offsetting provisions:
Offsetting of Financial Assets and Liabilities and Derivative Assets and Liabilities
Delaware International Small Cap Fund
| Gross Value of | Gross Value of | ||||||||||||||||
| Counterparty | Derivative Asset | Derivative Liability | Net Position | ||||||||||||||
| Bank of New York Mellon | $— | $(9,584) | $(9,584) | ||||||||||||||
| Fair Value of | Fair Value of | |||||||||||
| Non-Cash | Cash Collateral | Non-Cash | Cash Collateral | |||||||||
| Counterparty | Net Position | Collateral Received | Received(a) | Collateral Pledged | Pledged | Net Exposure(b) | ||||||
| Bank of New York Mellon | $(9,584) | $— | $— | $— | $— | $(9,584) |
Delaware International Value Equity Fund
| Gross Value of | Gross Value of | |||||
| Counterparty | Derivative Asset | Derivative Liability | Net Position | |||
| Bank of New York Mellon | $12,563 | $(10,320) | $2,243 |
| Fair Value of | Fair Value of | |||||||||||
| Non-Cash | Cash Collateral | Non-Cash | Cash Collateral | |||||||||
| Counterparty | Net Position | Collateral Received | Received(a) | Collateral Pledged | Pledged | Net Exposure(b) | ||||||
| Bank of New | ||||||||||||
| York Mellon | $2,243 | $— | $— | $— | $— | $2,243 |
Securities Lending
Securities lending transactions are entered into by the Funds under master securities lending agreements (each, an MSLA) which provide the right, in the event of default (including bankruptcy or insolvency), for the non-defaulting party to liquidate the collateral and calculate a net exposure to the defaulting party or request additional collateral. In the event that a borrower defaults, the Funds, as lender, would offset the market value of the collateral received against the market value of the securities loaned. When the value of the collateral is greater than that of the market value of the securities loaned, the lender is left with a net amount payable to the defaulting party. However, bankruptcy or insolvency laws of a particular jurisdiction may impose restrictions on or prohibitions against such a right of offset in the event of an MSLA counterparty’s bankruptcy or insolvency. Under the MSLA, the borrower can resell or re-pledge the loaned securities, and the Funds can reinvest cash collateral, or, upon an event of default, resell or re-pledge the collateral (see also Note 11).
106
As of November 30, 2021, the following table is a summary of the Fund’s securities lending agreements by counterparty which are subject to offset under an MSLA:
Delaware International Value Equity Fund
| Fair Value of | ||||||||||||||||||||||||||||
| Securities | Cash | Non-Cash | Net | |||||||||||||||||||||||||
| Loaned | Collateral | Collateral | Collateral | |||||||||||||||||||||||||
| Counterparty | at Value | Received(a) | Received | Received | Net Exposure(b) | |||||||||||||||||||||||
| Bank of New York | ||||||||||||||||||||||||||||
| Mellon | $ | 47,244,185 | $ | (14,912,239 | ) | $ | (32,331,946 | ) | $ | (47,244,185 | ) | $ | — | |||||||||||||||
| (a) | The value of the related collateral exceeded the value of the derivatives and securities lending transactions as of November 30, 2021, as applicable. |
| (b) | Net exposure represents the receivable (payable) that would be due from (to) the counterparty in the event of default. |
11. Securities Lending
Each Fund, along with other funds in the Delaware Funds, may lend its securities pursuant to a security lending agreement (Lending Agreement) with The Bank of New York Mellon (BNY Mellon). At the time a security is loaned, the borrower must post collateral equal to the required percentage of the market value of the loaned security, including any accrued interest. The required percentage is: (1) 102% with respect to US securities and foreign securities that are denominated and payable in US dollars; and (2) 105% with respect to foreign securities. With respect to each loan, if on any business day the aggregate market value of securities collateral plus cash collateral held is less than the aggregate market value of the securities which are the subject of such loan, the borrower will be notified to provide additional collateral by the end of the following business day, which, together with the collateral already held, will be not less than the applicable initial collateral requirements for such security loan. If the aggregate market value of securities collateral and cash collateral held with respect to a security loan exceeds the applicable initial collateral requirement, upon the request of the borrower, BNY Mellon must return enough collateral to the borrower by the end of the following business day to reduce the value of the remaining collateral to the applicable initial collateral requirement for such security loan. As a result of the foregoing, the value of the collateral held with respect to a loaned security on any particular day, may be more or less than the value of the security on loan. The collateral percentage with respect to the market value of the loaned security is determined by the security lending agent.
Cash collateral received by each fund of the Trust is generally invested in a series of individual separate accounts, each corresponding to a fund. The investment guidelines permit each separate account to hold certain securities that would be considered eligible securities for a money market fund. Cash collateral received is generally invested in government securities; certain obligations issued by government sponsored enterprises; repurchase agreements collateralized by US Treasury securities; obligations issued by the central government of any Organization for Economic Cooperation and Development (OECD) country or its agencies, instrumentalities, or establishments; obligations of supranational organizations; commercial paper, notes, bonds, and other debt obligations; certificates of deposit, time deposits, and other bank obligations; certain money market funds; and asset-backed
107
Notes to financial statements
Delaware International Funds
11. Securities Lending (continued)
securities as disclosed on the “Schedules of investments.” Securities purchased with cash collateral are valued at the market value. Each Fund can also accept US government securities and letters of credit (non-cash collateral) in connection with securities loans.
In the event of default or bankruptcy by the lending agent, realization and/or retention of the collateral may be subject to legal proceedings. In the event the borrower fails to return loaned securities and the collateral received is insufficient to cover the value of the loaned securities and provided such collateral shortfall is not the result of investment losses, the lending agent has agreed to pay the amount of the shortfall to each Fund or, at the discretion of the lending agent, replace the loaned securities. Each Fund continues to record dividends or interest, as applicable, on the securities loaned and is subject to changes in value of the securities loaned that may occur during the term of the loan. Each Fund has the right under the Lending Agreement to recover the securities from the borrower on demand. With respect to security loans collateralized by non-cash collateral, each Fund receives loan premiums paid by the borrower. With respect to security loans collateralized by cash collateral, the earnings from the collateral investments are shared among each Fund, the security lending agent, and the borrower. Each Fund records security lending income net of allocations to the security lending agent and the borrower.
Each Fund may incur investment losses as a result of investing securities lending collateral. This could occur if an investment in each collateral investment account defaulted or became impaired. Under those circumstances, the value of each Fund’s cash collateral account may be less than the amount each Fund would be required to return to the borrowers of the securities and each Fund would be required to make up for this shortfall.
The following table reflects a breakdown of transactions accounted for as secured borrowings, the gross obligation by the type of collateral pledged, and the remaining contractual maturity of those transactions as of November 30, 2021 for Delaware International Value Equity Fund:
| Overnight | |||||||||||||||||||||||||
| Securities Lending | and | Under | Between | Over | |||||||||||||||||||||
| Transactions | continuous | 30 days | 30 & 90 days | 90 Days | Total | ||||||||||||||||||||
| Certificates of | |||||||||||||||||||||||||
| Deposit and | |||||||||||||||||||||||||
| Repurchase | |||||||||||||||||||||||||
| Agreements | $ | 17,898,886 | $ | — | $ | — | $ | — | $ | 17,898,886 | |||||||||||||||
At November 30, 2021, the value of securities on loan for Delaware International Value Equity Fund was $47,244,185, for which the Fund received cash collateral of $17,898,360 and non-cash collateral with a fair value of $32,331,946. At November 30, 2021, the value of invested collateral was $17,898,886. Investments purchased with cash collateral are presented on the “Schedules of investments” under the caption “Securities Lending Collateral.”
During the year ended November 30, 2021, Delaware Emerging Markets Fund and Delaware International Small Cap Fund had no securities out on loan.
108
12. Credit and Market Risk
Beginning in January 2020, global financial markets have experienced and may continue to experience significant volatility resulting from the spread of a novel coronavirus known as COVID-19. The outbreak of COVID-19 has resulted in travel and border restrictions, quarantines, supply chain disruptions, lower consumer demand and general market uncertainty. The effects of COVID-19 have and may continue to adversely affect the global economy, the economies of certain nations, and individual issuers, all of which may negatively impact the Funds’ performance.
Investments in equity securities in general are subject to market risks that may cause their prices to fluctuate over time. Fluctuations in the value of equity securities in which the Funds invest will cause the NAV of the Funds to fluctuate.
Delaware Emerging Markets Fund invests a significant portion of its assets in the greater China region, which consists of Hong Kong, the People’s Republic of China, and Taiwan, among other countries. As a result, the Fund’s investments in the region are particularly susceptible to risks in that region. Adverse events in any one country within the region may impact the other countries in the region or Asia as a whole. As a result, adverse events in the region will generally have a greater effect on the Fund than if the Fund were more geographically diversified, which could result in greater volatility in the Fund’s net asset value and losses. Markets in the greater China region can experience significant volatility due to social, economic, regulatory, and political uncertainties.
Some countries in which the Funds may invest require governmental approval for the repatriation of investment income, capital, or the proceeds of sales of securities by foreign investors. In addition, if there is deterioration in a country’s balance of payments or for other reasons, a country may impose temporary restrictions on foreign capital remittances abroad.
The securities exchanges of certain foreign markets are substantially smaller, less liquid, and more volatile than the major securities markets in the US. Consequently, acquisition and disposition of securities by each Fund may be inhibited. In addition, a significant portion of the aggregate market value of securities listed on the major securities exchanges in emerging markets is held by a smaller number of investors. This may limit the number of shares available for acquisition or disposition by each Fund.
Each Fund may invest up to 15% of its net assets in illiquid securities, which may include securities with contractual restrictions on resale, securities exempt from registration under Rule 144A promulgated under the Securities Act of 1933, as amended, and other securities which may not be readily marketable. The relative illiquidity of these securities may impair each Fund from disposing of them in a timely manner and at a fair price when it is necessary or desirable to do so. While maintaining oversight, each Board has delegated to DMC, the day-to-day functions of determining whether individual securities are liquid for purposes of each Fund’s limitation on investments in illiquid securities. Securities eligible for resale pursuant to Rule 144A, which are determined to be liquid, are not subject to each Fund’s 15% limit on investments in illiquid securities. Rule 144A securities have been identified on the “Schedules of investments.”
109
Notes to financial statements
Delaware International Funds
13. Contractual Obligations
Each Fund enters into contracts in the normal course of business that contain a variety of indemnifications. Each Fund’s maximum exposure under these arrangements is unknown. However, each Fund has not had prior claims or losses pursuant to these contracts. Management has reviewed each Fund’s existing contracts and expects the risk of loss to be remote.
14. Subsequent Events
Management has determined that no material events or transactions occurred subsequent to November 30, 2021, that would require recognition or disclosure in the Funds’ financial statements.
110
Report of independent
registered public accounting firm
To the Board of Trustees of Delaware Group® Global & International Funds and Shareholders of Delaware Emerging Markets Fund, Delaware International Small Cap Fund and Delaware International Value Equity Fund
Opinions on the Financial Statements
We have audited the accompanying statements of assets and liabilities, including the schedules of investments, of Delaware Emerging Markets Fund, Delaware International Small Cap Fund and Delaware International Value Equity Fund (constituting Delaware Group® Global & International Funds, hereafter collectively referred to as the “Funds”) as of November 30, 2021, the related statements of operations for the year ended November 30, 2021, the statements of changes in net assets for each of the two years in the period ended November 30, 2021, including the related notes, and the financial highlights for each of the periods indicated therein (collectively referred to as the “financial statements”). In our opinion, the financial statements present fairly, in all material respects, the financial position of the Funds as of November 30, 2021, the results of each of their operations for the year then ended, the changes in each of their net assets for each of the two years in the period ended November 30, 2021 and each of the financial highlights for each of the periods indicated therein in conformity with accounting principles generally accepted in the United States of America.
Basis for Opinions
These financial statements are the responsibility of the Funds’ management. Our responsibility is to express an opinion on the Funds’ financial statements based on our audits. We are a public accounting firm registered with the Public Company Accounting Oversight Board (United States) (PCAOB) and are required to be independent with respect to the Funds in accordance with the U.S. federal securities laws and the applicable rules and regulations of the Securities and Exchange Commission and the PCAOB.
We conducted our audits of these financial statements in accordance with the standards of the PCAOB. Those standards require that we plan and perform the audit to obtain reasonable assurance about whether the financial statements are free of material misstatement, whether due to error or fraud.
Our audits included performing procedures to assess the risks of material misstatement of the financial statements, whether due to error or fraud, and performing procedures that respond to those risks. Such procedures included examining, on a test basis, evidence regarding the amounts and disclosures in the financial statements. Our audits also included evaluating the accounting principles used and significant estimates made by management, as well as evaluating the overall presentation of the financial statements. Our procedures included confirmation of securities owned as of November 30, 2021 by correspondence with the custodian, transfer agents and brokers; when replies were not received from brokers, we performed other auditing procedures. We believe that our audits provide a reasonable basis for our opinions.
/s/PricewaterhouseCoopers LLP
Philadelphia, Pennsylvania
January 21, 2022
We have served as the auditor of one or more investment companies in Delaware Funds by Macquarie® since 2010.
111
Other Fund information (Unaudited)
Delaware International Funds
Tax Information
The information set forth below is for each Fund’s fiscal year as required by federal income tax laws. Shareholders, however, must report distributions on a calendar year basis for income tax purposes, which may include distributions for portions of two fiscal years of the Fund. Accordingly, the information needed by shareholders for income tax purposes will be sent to them in January of each year. Please consult your tax advisor for proper treatment of this information.
All disclosures are based on financial information available as of the date of this annual report and, accordingly are subject to change. For any and all items requiring reporting, it is the intention of each Fund to report the maximum amount permitted under the Internal Revenue Code and the regulations thereunder.
For the fiscal year ended November 30, 2021, each Fund reports distributions paid during the year as follows:
| (A) | ||||||
| Long-Term | (B) | |||||
| Capital Gains | Ordinary Income | Total | ||||
| Distributions | Distributions | Distributions | ||||
| (Tax Basis)* | (Tax Basis) | (Tax Basis) | ||||
| Delaware Emerging Markets Fund | 76.94% | 23.06% | 100.00% | |||
| Delaware International Value Equity Fund | 41.96% | 58.04% | 100.00% |
| (A) and (B) are based on a percentage of the Fund’s total distributions. | |
* | For the fiscal year ended November 30, 2021, certain dividends paid by each Fund may be subject to a maximum tax rate of 20%. The percentage of dividends paid by each Fund from ordinary income reported as dividend income is listed below. Complete information will be computed and reported in conjunction with your 2021 Form 1099-DIV. |
| Delaware Emerging | Delaware International | ||
| Markets Fund | Value Equity Fund | ||
| 100.00% | 88.68% |
Each Fund intends to pass through foreign tax credits in the maximum amount as follows:
| Delaware Emerging | Delaware International | ||
| Markets Fund | Value Equity Fund | ||
| $18,630,268 | $421,846 |
The gross foreign source income earned during the fiscal year 2021 by each Fund was as follows:
| Delaware Emerging | Delaware International | ||
| Markets Fund | Value Equity Fund | ||
| $263,060,085 | $9,896,056 |
For the fiscal year ended November 30, 2021, certain interest income paid by each Fund, determined to be Qualified Short-Term Capital Gains may be subject to relief from US withholding for foreign shareholders, as provided by the American Jobs Creation Act of 2004; the Tax Relief Unemployment
112
Insurance Reauthorization, and Job Creations Act of 2010; and as extended by the American Taxpayer Relief Act of 2012. For the fiscal year ended November 30, 2021, Delaware International Value Equity Fund reported maximum distributions of Qualified Short-Term Capital Gains of $1,840,674.
Board consideration of Investment Advisory and Sub-Advisory Agreements for Delaware Emerging Markets Fund, Delaware International Small Cap Fund, and Delaware International Value Equity Fund at a meeting held August 10-12, 2021
At a meeting held on August 10-12, 2021 (the “Annual Meeting”), the Board of Trustees (the “Board”), including a majority of disinterested or independent Trustees, approved the renewal of the Investment Advisory and Sub-Advisory Agreements for each of Delaware Emerging Markets Fund, Delaware International Small Cap Fund, and Delaware International Value Equity (each, a “Fund” and together, the “Funds”). In making its decision, the Board considered information furnished at regular quarterly Board meetings, including reports detailing Fund performance, investment strategies, and expenses, as well as information prepared specifically in connection with the renewal of the investment advisory and sub-advisory contracts. Information furnished specifically in connection with the renewal of the Investment Management Agreement with Delaware Management Company (“DMC”), a series of Macquarie Investment Management Business Trust (“MIMBT”), and the Sub-Advisory Agreements with Macquarie Funds Management Hong Kong Limited (“MFMHK”), Macquarie Investment Management Europe Limited (“MIMEL”), Macquarie Investment Management Global Limited (“MIMGL”), Macquarie Investment Management Austria Kapitalanlage AG (“MIMAK”), (each, a “Sub-Adviser” and together, the “Sub-Advisers”), included materials provided by DMC and its affiliates (collectively, “Macquarie Asset Management”) and MFMHK, MIMEL, MIMGL, and MIMAK, as applicable, concerning, among other things, the nature, extent, and quality of services provided to the Funds; the costs of such services to the Funds; economies of scale; and the investment manager’s financial condition and profitability. In addition, in connection with the Annual Meeting, materials were provided to the Trustees in May 2021, including reports provided by Broadridge Financial Solutions (“Broadridge”). The Broadridge reports compared each Fund’s investment performance and expenses with those of other comparable mutual funds. The Independent Trustees reviewed and discussed the Broadridge reports with independent legal counsel to the Independent Trustees. In addition to the information noted above, the Board also requested and received information regarding DMC’s policy with respect to advisory fee levels and its breakpoint philosophy; the structure of portfolio manager compensation; comparative client fee information; and any constraints or limitations on the availability of securities for certain investment styles, which had in the past year inhibited, or which were likely in the future to inhibit, the investment manager’s ability to invest fully in accordance with Fund policies.
In considering information relating to the approval of each Fund’s advisory and sub-advisory agreements, the Independent Trustees received assistance and advice from and met separately with independent legal counsel to the Independent Trustees and also received assistance and advice from an experienced and knowledgeable independent fund consultant, JDL Consultants, LLC (“JDL”). Although the Board gave attention to all information furnished, the following discussion identifies, under separate headings, the primary factors taken into account by the Board during its contract renewal considerations.
113
Other Fund information (Unaudited)
Delaware International Funds
Board consideration of Investment Advisory and Sub-Advisory Agreements for Delaware Emerging Markets Fund, Delaware International Small Cap Fund, and Delaware International Value Equity Fund at a meeting held August 10-12, 2021 (continued)
Nature, extent, and quality of services. The Board considered the services provided by DMC to the Funds and their shareholders. In reviewing the nature, extent, and quality of services, the Board considered reports furnished to it throughout the year, which covered matters such as the relative performance of the Funds; compliance of portfolio managers with the investment policies, strategies, and restrictions for the Funds; compliance by DMC and Delaware Distributors, L.P. (together, “Management”) personnel with the Code of Ethics adopted throughout the Delaware Funds by Macquarie® (“Delaware Funds”); and adherence to fair value pricing procedures as established by the Board. The Board was pleased with the current staffing of DMC and the emphasis placed on research in the investment process. The Board recognized DMC’s receipt of certain favorable industry distinctions during the past several years. The Board gave favorable consideration to DMC’s efforts to control expenses while maintaining service levels committed to Fund matters. The Board also noted the benefits provided to Fund shareholders through (a) each shareholder’s ability to: (i) exchange an investment in one Delaware Fund for the same class of shares in another Delaware Fund without a sales charge, or (ii) reinvest Fund dividends into additional shares of the Fund or into additional shares of other Delaware Funds, and (b) the privilege to combine holdings in other Delaware Funds to obtain a reduced sales charge. The Board was satisfied with the nature, extent, and quality of the overall services provided by DMC.
Nature, extent, and quality of services. The Board considered the services provided by each Sub-Adviser to the Funds and their shareholders, as applicable. In reviewing the nature, extent, and quality of services, the Board considered reports furnished to it throughout the year at regular Board Meetings covering matters such as relative performance of the Funds; compliance of portfolio managers with the investment policies, strategies, and restrictions for the Funds; the compliance of Sub-Adviser personnel with its Code of Ethics; and adherence to fair value pricing procedures as established by the Board. The Board was pleased with the current staffing of each Sub-Adviser and the emphasis placed on research in the investment process. The Board was satisfied with the nature, extent, and quality of the overall services provided by each Sub-Adviser.
Investment performance. The Board placed significant emphasis on the investment performance of the Funds in view of the importance of investment performance to shareholders. Although the Board considered performance reports and discussions with portfolio managers at Investment Committee meetings throughout the year, the Board gave particular weight to the Broadridge reports furnished for the Annual Meeting. The Broadridge reports prepared for the Funds showed each Fund’s investment performance in comparison to a group of similar funds (the “Performance Universe”). A fund with the best performance ranked first, and a fund with the poorest performance ranked last. The highest/best performing 25% of funds in the Performance Universe make up the first quartile; the next 25%, the second quartile; the next 25%, the third quartile; and the poorest/worst performing 25% of funds in the Performance Universe make up the fourth quartile. Comparative annualized performance for each Fund was shown for the past 1-, 3-, 5-, and 10-year periods, to the extent applicable, ended December 31, 2020. The Board’s objective is that each Fund’s performance for the 1-, 3-, and 5-year periods be at or above the median of its Performance Universe.
114
Delaware Emerging Markets Fund – The Performance Universe for the Fund consisted of the Fund and all retail and institutional emerging markets funds as selected by Broadridge. The Broadridge report comparison showed that the Fund’s total return for the 1-, 5-, and 10-year periods was in the first quartile of its Performance Universe. The report further showed that the Fund’s total return for the 3-year period was in the second quartile of its Performance Universe. The Board was satisfied with performance.
Delaware International Small Cap Fund – The Performance Universe for the Fund consisted of the Fund and all retail and institutional international small-/mid-cap growth funds as selected by Broadridge. The Broadridge report comparison showed that the Fund’s total return for the 1- and 5-year periods was in the second quartile of its Performance Universe. The report further showed that the Fund’s total return for the 3- and 10-year periods was in the third quartile and first quartile, respectively, of its Performance Universe. The Board was satisfied with performance.
Delaware International Value Equity Fund – The Performance Universe for the Fund consisted of the Fund and all retail and institutional international large-cap core funds as selected by Broadridge. The Broadridge report comparison showed that the Fund’s total return for the 1-, 5-, and 10-year periods was in the third quartile of its Performance Universe. The report further showed that the Fund’s total return for the 3-year period was in the fourth quartile of its Performance Universe. The Board observed that the Fund’s performance results were not in line with the Board’s objective. In evaluating the Fund’s performance, the Board considered the performance attribution included in the Meeting materials, as well as the numerous investment and performance reports delivered by Management personnel to the Board’s Investments Committee. The Board was satisfied that Management was taking action to improve Fund performance and to meet the Board’s performance objective.
Comparative expenses. The Board considered expense data for the Delaware Funds. Management provided the Board with information on pricing levels and fee structures for each Fund as of its most recently completed fiscal year. The Board also focused on the comparative analysis of effective management fees and total expense ratios of each Fund versus effective management fees and total expense ratios of a group of similar funds as selected by Broadridge (the “Expense Group”). In reviewing comparative costs, each Fund’s contractual management fee and the actual management fee incurred by the Fund were compared with the contractual management fees (assuming all funds in the Expense Group were similar in size to the Fund) and actual management fees (as reported by each fund) within the Expense Group, taking into account any applicable breakpoints and fee waivers. Each Fund’s total expenses were also compared with those of its Expense Group. The Broadridge total expenses, for comparative consistency, were shown by Broadridge for Class A shares and comparative total expenses including 12b-1 and non-12b-1 service fees. The Board’s objective is for each Fund’s total expense ratio to be competitive with those of the peer funds within its Expense Group.
Delaware Emerging Markets Fund – The expense comparisons for the Fund showed that its actual management fee and total expenses were in the quartile with the highest expenses of its Expense Group. The Board noted that the Fund’s total expenses were not in line with the Board’s objective. In evaluating total expenses, the Board considered fee waivers in place through March 2022 and various initiatives implemented by Management, such as the negotiation of lower fees for fund accounting, fund accounting oversight, and custody services, which had created an opportunity for a further reduction in
115
Other Fund information (Unaudited)
Delaware International Funds
Board consideration of Investment Advisory and Sub-Advisory Agreements for Delaware Emerging Markets Fund, Delaware International Small Cap Fund, and Delaware International Value Equity Fund at a meeting held August 10-12, 2021 (continued)
expenses. The Board was satisfied with Management’s efforts to improve the Fund’s total expense ratio and to bring it in line with the Board’s objective.
Delaware International Small Cap Fund – The expense comparisons for the Fund showed that its actual management fee was in the quartile with the lowest expenses of its Expense Group and its and total expenses were in the quartile with the second highest expenses of its Expense Group. The Board gave favorable consideration to the Fund’s management fee but noted that the Fund’s total expenses were not in line with the Board’s objective. In evaluating total expenses, the Board considered fee waivers in place through March 2022 and various initiatives implemented by Management, such as the negotiation of lower fees for fund accounting, fund accounting oversight, and custody services, which had created an opportunity for a further reduction in expenses. The Board was satisfied with Management’s efforts to improve the Fund’s total expense ratio and to bring it in line with the Board’s objective.
Delaware International Value Equity Fund – The expense comparisons for the Fund showed that its actual management fee was in the quartile with the second highest expenses of its Expense Group and its total expenses were in the quartile with the highest expenses of its Expense Group. The Board noted that the Fund’s total expenses were not in line with the Board’s objective. In evaluating total expenses, the Board considered fee waivers in place through March 2022 and various initiatives implemented by Management, such as the negotiation of lower fees for fund accounting, fund accounting oversight, and custody services, which had created an opportunity for a further reduction in expenses. The Board was satisfied with Management’s efforts to improve the Fund’s total expense ratio and to bring it in line with the Board’s objective.
Management profitability. The Board considered the level of profits realized by DMC in connection with the operation of the Funds. In this respect, the Board reviewed the Investment Management Profitability Analysis that addressed the overall profitability of DMC’s business in providing management and other services to each of the individual funds and the Delaware Funds as a whole. Specific attention was given to the methodology used by DMC in allocating costs for the purpose of determining profitability. Management stated that the level of profits of DMC, to a certain extent, reflects recent operational cost savings and efficiencies initiated by DMC. The Board considered DMC’s efforts to improve services provided to Fund shareholders and to meet additional regulatory and compliance requirements resulting from recent industry-wide Securities and Exchange Commission initiatives. The Board also considered the extent to which DMC might derive ancillary benefits from fund operations, including the potential for procuring additional business as a result of the prestige and visibility associated with its role as service provider to the Delaware Funds and the benefits from allocation of fund brokerage to improve trading efficiencies. As part of its work, the Board also reviewed a report prepared by JDL regarding MIMBT profitability as compared to certain peer fund complexes and the Independent Trustees discussed with JDL personnel regarding DMC’s profitability in such context. The Board found that the management fees were reasonable in light of the services rendered and the level of profitability of DMC.
Management profitability. Trustees were also given available information on profits being realized by each Sub-Adviser in relation to the services being provided to the Funds, as applicable, and in relation to
116
each Sub-Adviser’s overall investment advisory business, but believed such information to be of limited relevance because the sub-advisory fees are paid by DMC out of its management fee, and changes in the level of sub-advisory fees have no impact on Fund expenses. The Board was also provided information on potential fall-out benefits derived or to be derived by each Sub-Adviser in connection with its relationship to the Funds, such as reputational enhancement, soft dollar arrangements, or commissions paid to affiliated broker/dealers, as applicable.
Economies of scale. The Trustees considered whether economies of scale are realized by DMC as each Fund’s assets increase and the extent to which any economies of scale are reflected in the level of management fees charged. The Trustees reviewed each Fund’s advisory fee pricing and structure, approved by the Board and shareholders, which includes breakpoints, and which applies to most funds in the Delaware Funds complex. Breakpoints in the advisory fee occur when the advisory fee rate is reduced on assets in excess of specified levels. Breakpoints result in a lower advisory fee than would otherwise be the case in the absence of breakpoints, when the asset levels specified in the breakpoints are exceeded. The Board noted that, as of March 31, 2021, the net assets for Delaware Emerging Markets Fund exceeded the final breakpoint level. The Board believed that, given the extent to which economies of scale might be realized by DMC and its affiliates, the schedule of fees under the Investment Management Agreements provides a sharing of benefits with the Funds and their shareholders. Although, as of March 31, 2021, Delaware International Small Cap Fund and Delaware International Value Equity Fund had each not reached a size at which it could take advantage of any breakpoints in the applicable fee schedule, the Board recognized that the fee was structured so that, if the Fund increases sufficiently in size, then economies of scale may be shared.
117
Board of trustees / directors and officers addendum
Delaware Funds by Macquarie®
A mutual fund is governed by a Board of Trustees/Directors (“Trustees”), which has oversight responsibility for the management of a fund’s business affairs. Trustees establish procedures and oversee and review the performance of the investment manager, the distributor, and others who perform services for the fund. The independent fund trustees, in particular, are advocates for shareholder interests. Each trustee has served in that capacity since he or she was elected to or appointed to the Board of Trustees, and will continue to serve until his or her retirement or the election of a new trustee in his or her place. The following is a list of the Trustees and Officers with certain background and related information.
| Number of | Other | |||||||||
| Principal | Portfolios in Fund | Directorships | ||||||||
| Name, | Position(s) | Occupation(s) | Complex Overseen | Held by | ||||||
| Address, | Held with | Length of Time | During the | by Trustee | Trustee | |||||
| and Birth Date | Fund(s) | Served | Past Five Years | or Officer | or Officer | |||||
| Interested Trustee | ||||||||||
| Shawn K. Lytle1 | President, | President and | Global Head of Macquarie | 150 | Trustee — UBS Relationship | |||||
| 610 Market Street | Chief Executive | Chief Executive | Investment Management2 | Funds, SMA Relationship Trust, | ||||||
| Philadelphia, PA | Officer, | Officer | (January 2019–Present) | and UBS Funds | ||||||
| 19106-2354 | and Trustee | since August 2015 | Head of Americas of | (May 2010–April 2015) | ||||||
| February 1970 | Trustee since | Macquarie Group | ||||||||
| September 2015 | (December 2017–Present) | |||||||||
| Deputy Global Head of | ||||||||||
| Macquarie Investment | ||||||||||
| Management | ||||||||||
| (2017–2019) | ||||||||||
| Head of Macquarie Investment | ||||||||||
| Management Americas | ||||||||||
| (2015–2017) |
118
| Number of | Other | |||||||||
| Principal | Portfolios in Fund | Directorships | ||||||||
| Name, | Position(s) | Occupation(s) | Complex Overseen | Held by | ||||||
| Address, | Held with | Length of Time | During the | by Trustee | Trustee | |||||
| and Birth Date | Fund(s) | Served | Past Five Years | or Officer | or Officer | |||||
| Independent Trustees | ||||||||||
| Jerome D. | Trustee | Since January 2019 | Managing Member, Stonebrook | 150 | None | |||||
| Abernathy | Capital Management, LLC | |||||||||
| 610 Market Street | (financial technology: macro | |||||||||
| Philadelphia, PA | factors and databases) | |||||||||
| 19106-2354 | (January 1993-Present) | |||||||||
| July 1959 | ||||||||||
| Thomas L. Bennett | Chair and Trustee | Trustee since March | Private Investor | 150 | None | |||||
| 610 Market Street | 2005 | (March 2004–Present) | ||||||||
| Philadelphia, PA | Chair since March | |||||||||
| 19106-2354 | 2015 | |||||||||
| October 1947 | ||||||||||
| Ann D. Borowiec | Trustee | Since March 2015 | Chief Executive Officer, Private | 150 | Director — Banco Santander | |||||
| 610 Market Street | Wealth Management | International | ||||||||
| Philadelphia, PA | (2011–2013) and Market | (October 2016–December 2019) | ||||||||
| 19106-2354 | Manager, New Jersey Private | Director — Santander Bank, N.A. | ||||||||
| November 1958 | Bank (2005–2011) — J.P. | (December 2016–December | ||||||||
| Morgan Chase & Co. | 2019) |
119
Board of trustees / directors and officers addendum
Delaware Funds by Macquarie®
| Number of | Other | |||||||||
| Principal | Portfolios in Fund | Directorships | ||||||||
| Name, | Position(s) | Occupation(s) | Complex Overseen | Held by | ||||||
| Address, | Held with | Length of Time | During the | by Trustee | Trustee | |||||
| and Birth Date | Fund(s) | Served | Past Five Years | or Officer | or Officer | |||||
| Joseph W. Chow | Trustee | Since January 2013 | Private Investor | 150 | Director and Audit Committee | |||||
| 610 Market Street | (April 2011–Present) | Member — Hercules Technology | ||||||||
| Philadelphia, PA | Growth Capital, Inc. | |||||||||
| 19106-2354 | (July 2004–July 2014) | |||||||||
| January 1953 |
120
| Number of | Other | |||||||||
| Principal | Portfolios in Fund | Directorships | ||||||||
| Name, | Position(s) | Occupation(s) | Complex Overseen | Held by | ||||||
| Address, | Held with | Length of Time | During the | by Trustee | Trustee | |||||
| and Birth Date | Fund(s) | Served | Past Five Years | or Officer | or Officer | |||||
| H. Jeffrey Dobbs3 | Trustee | Since December 2021 | Global Sector Chairman, | 150 | Director, Valparaiso University | |||||
| 610 Market Street | Industrial Manufacturing, | (2012–Present) | ||||||||
| Philadelphia, PA | KPMG LLP | Director, TechAccel LLC | ||||||||
| 19106-2354 | (2010-2015) | (2015–Present) (Tech R&D) | ||||||||
| May 1955 | Board Member, Kansas City | |||||||||
| Repertory Theatre | ||||||||||
| (2015–Present) | ||||||||||
| Board Member, Patients | ||||||||||
| Voices, Inc. (healthcare) | ||||||||||
| (2018–Present) | ||||||||||
| Kansas City Campus for Animal | ||||||||||
| Care (2018–Present) | ||||||||||
| Director, National Association of | ||||||||||
| Manufacturers (2010–2015) | ||||||||||
| Director, The Children’s Center | ||||||||||
| (2003–2015) | ||||||||||
| Director, Metropolitan Affairs | ||||||||||
| Coalition (2003–2015) | ||||||||||
| Director, Michigan Roundtable | ||||||||||
| for Diversity and Inclusion | ||||||||||
| (2003–2015) | ||||||||||
| Trustee, Ivy Funds Complex | ||||||||||
| (2019–2021) |
121
Board of trustees / directors and officers addendum
Delaware Funds by Macquarie®
| Number of | Other | |||||||||
| Principal | Portfolios in Fund | Directorships | ||||||||
| Name, | Position(s) | Occupation(s) | Complex Overseen | Held by | ||||||
| Address, | Held with | Length of Time | During the | by Trustee | Trustee | |||||
| and Birth Date | Fund(s) | Served | Past Five Years | or Officer | or Officer | |||||
| John A. Fry | Trustee | Since January 2001 | Drexel University | 150 | Director; Compensation | |||||
| 610 Market Street | (August 2010–Present) | Committee and Governance | ||||||||
| Philadelphia, PA | President — Franklin & Marshall | Committee Member — | ||||||||
| 19106-2354 | College | Community Health Systems | ||||||||
| May 1960 | (July 2002–June 2010) | (May 2004–Present) | ||||||||
| Director — Drexel Morgan & Co. | ||||||||||
| (2015–2019) | ||||||||||
| Director, Audit and | ||||||||||
| Compensation Committee | ||||||||||
| Member — vTv Therapeutics Inc. | ||||||||||
| (2017–Present) | ||||||||||
| Director and Audit Committee | ||||||||||
| Member — FS Credit Real Estate | ||||||||||
| Income Trust, Inc. | ||||||||||
| (2018–Present) | ||||||||||
| Director — Federal Reserve | ||||||||||
| Bank of Philadelphia | ||||||||||
| (January 2020–Present) |
122
| Number of | Other | |||||||||
| Principal | Portfolios in Fund | Directorships | ||||||||
| Name, | Position(s) | Occupation(s) | Complex Overseen | Held by | ||||||
| Address, | Held with | Length of Time | During the | by Trustee | Trustee | |||||
| and Birth Date | Fund(s) | Served | Past Five Years | or Officer | or Officer | |||||
| Joseph Harroz, Jr.3 | Trustee | Since December 2021 | President (2020–Present), Interim | 150 | Director, OU Medicine, Inc. | |||||
| 610 Market Street | President (2019–2020), Vice | (2020–Present) | ||||||||
| Philadelphia, PA | President (2010–2019) and Dean | Director and Shareholder, | ||||||||
| 19106-2354 | (2010–2019), College of Law, | Valliance Bank | ||||||||
| January 1967 | University of Oklahoma; | (2007–Present) | ||||||||
| Managing Member, Harroz | Director, Foundation Healthcare | |||||||||
| Investments, LLC, (commercial | (formerly Graymark HealthCare) | |||||||||
| enterprises) (1998–2019); | (2008–2017) | |||||||||
| Managing Member, St. Clair, | Trustee, the Mewbourne Family | |||||||||
| LLC (commercial enterprises) | Support Organization | |||||||||
| (2019–Present) | (2006–Present) (non-profit) | |||||||||
| Independent Director, LSQ | ||||||||||
| Manager, Inc. (real estate) | ||||||||||
| (2007–2016) | ||||||||||
| Director, Oklahoma Foundation | ||||||||||
| for Excellence (non-profit) | ||||||||||
| (2008–Present) | ||||||||||
| Trustee, Ivy Funds Complex | ||||||||||
| (1998–2021) |
123
Board of trustees / directors and officers addendum
Delaware Funds by Macquarie®
| Number of | Other | |||||||||
| Principal | Portfolios in Fund | Directorships | ||||||||
| Name, | Position(s) | Occupation(s) | Complex Overseen | Held by | ||||||
| Address, | Held with | Length of Time | During the | by Trustee | Trustee | |||||
| and Birth Date | Fund(s) | Served | Past Five Years | or Officer | or Officer | |||||
| Sandra A.J. | Trustee | Since December 2021 | Chief Administrative Officer, | 150 | Director, Hall Family Foundation | |||||
| Lawrence3 | Children’s Mercy Hospitals and | (1993–Present) | ||||||||
| 610 Market Street | Clinics | Director, Westar Energy (utility) | ||||||||
| Philadelphia, PA | (2016–2019); | (2004–2018) | ||||||||
| 19106-2354 | CFO, Children’s Mercy Hospitals | Trustee, Nelson-Atkins Museum | ||||||||
| September 1957 | and Clinics | of Art (non-profit) (2021–Present) | ||||||||
| (2005–2016) | (2007–2020) | |||||||||
| Director, Turn the Page KC | ||||||||||
| (non-profit) (2012–2016) | ||||||||||
| Director, Kansas Metropolitan | ||||||||||
| Business and Healthcare | ||||||||||
| Coalition (non-profit) (2017–2019) | ||||||||||
| Director, National Association of | ||||||||||
| Corporate Directors (non-profit) | ||||||||||
| National Board (2022–Present); | ||||||||||
| Regional Board (2017–2021) | ||||||||||
| Director, American Shared | ||||||||||
| Hospital Services (medical | ||||||||||
| device) (2017–2021) | ||||||||||
| Director, Evergy, Inc., Kansas | ||||||||||
| City Power & Light Company, | ||||||||||
| KCP&L Greater Missouri | ||||||||||
| Operations Company, Westar | ||||||||||
| Energy, Inc. and Kansas Gas and | ||||||||||
| Electric Company (related utility | ||||||||||
| companies) (2018–Present) |
124
| Number of | Other | |||||||||
| Principal | Portfolios in Fund | Directorships | ||||||||
| Name, | Position(s) | Occupation(s) | Complex Overseen | Held by | ||||||
| Address, | Held with | Length of Time | During the | by Trustee | Trustee | |||||
| and Birth Date | Fund(s) | Served | Past Five Years | or Officer | or Officer | |||||
| Sandra A.J. | Trustee | Since December 2021 | Chief Administrative Officer, | 150 | Director, Stowers (research) | |||||
| Lawrence3 | Children’s Mercy Hospitals and | (2018) | ||||||||
| (continued) | Clinics | Co-Chair, Women Corporate | ||||||||
| 610 Market Street | (2016–2019); | Directors (director education) | ||||||||
| Philadelphia, PA | CFO, Children’s Mercy Hospitals | (2018–2020) | ||||||||
| 19106-2354 | and Clinics | Trustee, Ivy Funds Complex | ||||||||
| September 1957 | (2005–2016) | (2019-2021) | ||||||||
| Director, Brixmor Property | ||||||||||
| Group Inc. | ||||||||||
| (2021–Present) | ||||||||||
| Director, Sera Prognostics Inc. | ||||||||||
| (biotechnology) | ||||||||||
| (2021–Present) | ||||||||||
| Director, Recology (resource | ||||||||||
| recovery) | ||||||||||
| (2021–Present) |
125
Board of trustees / directors and officers addendum
Delaware Funds by Macquarie®
| Number of | Other | |||||||||
| Principal | Portfolios in Fund | Directorships | ||||||||
| Name, | Position(s) | Occupation(s) | Complex Overseen | Held by | ||||||
| Address, | Held with | Length of Time | During the | by Trustee | Trustee | |||||
| and Birth Date | Fund(s) | Served | Past Five Years | or Officer | or Officer | |||||
| Frances A. | Trustee | Since September | Private Investor | 150 | Trust Manager and Audit | |||||
| Sevilla-Sacasa | 2011 | (January 2017–Present) | Committee Chair — Camden | |||||||
| 610 Market Street | Chief Executive Officer — Banco | Property Trust | ||||||||
| Philadelphia, PA | Itaú International | (August 2011–Present) | ||||||||
| 19106-2354 | (April 2012–December 2016) | Director; Audit | ||||||||
| January 1956 | Executive Advisor to Dean | and Compensation | ||||||||
| (August 2011–March 2012) and | Committee Member — | |||||||||
| Interim Dean | Callon Petroleum Company | |||||||||
| (January 2011–July 2011) — | (December 2019–Present) | |||||||||
| University of Miami School of | Director — New Senior | |||||||||
| Business Administration | Investment Group Inc. | |||||||||
| President — U.S. Trust, Bank of | (January 2021–September 2021) | |||||||||
| America Private Wealth | Director; Audit Committee | |||||||||
| Management (Private Banking) | Member — Carrizo Oil & Gas, | |||||||||
| (July 2007-December 2008) | Inc. (March 2018–December | |||||||||
| 2019) | ||||||||||
126
| Number of | Other | |||||||||
| Principal | Portfolios in Fund | Directorships | ||||||||
| Name, | Position(s) | Occupation(s) | Complex Overseen | Held by | ||||||
| Address, | Held with | Length of Time | During the | by Trustee | Trustee | |||||
| and Birth Date | Fund(s) | Served | Past Five Years | or Officer | or Officer | |||||
| Thomas K. Whitford | Trustee | Since January 2013 | Vice Chairman — PNC Financial | 150 | Director — HSBC North America | |||||
| 610 Market Street | Services Group | Holdings Inc. | ||||||||
| Philadelphia, PA | (2010–April 2013) | (December 2013–Present) | ||||||||
| 19106-2354 | Director — HSBC USA Inc. | |||||||||
| March 1956 | (July 2014–Present) | |||||||||
| Director — HSBC Bank USA, | ||||||||||
| National Association | ||||||||||
| (July 2014–March 2017) | ||||||||||
| Director — HSBC Finance | ||||||||||
| Corporation | ||||||||||
| (December 2013–April 2018) | ||||||||||
127
Board of trustees / directors and officers addendum
Delaware Funds by Macquarie®
| Number of | Other | |||||||||
| Principal | Portfolios in Fund | Directorships | ||||||||
| Name, | Position(s) | Occupation(s) | Complex Overseen | Held by | ||||||
| Address, | Held with | Length of Time | During the | by Trustee | Trustee | |||||
| and Birth Date | Fund(s) | Served | Past Five Years | or Officer | or Officer | |||||
| Christianna Wood | Trustee | Since January 2019 | Chief Executive Officer and | 150 | Director; Finance Committee and | |||||
| 610 Market Street | President — Gore Creek Capital, | Audit Committee Member — | ||||||||
| Philadelphia, PA | Ltd. (August 2009–Present) | H&R Block Corporation | ||||||||
| 19106-2354 | (July 2008–Present) | |||||||||
| August 1959 | Director; Investments | |||||||||
| Committee, Capital and Finance | ||||||||||
| Committee, and Audit | ||||||||||
| Committee Member — Grange | ||||||||||
| Insurance (2013–Present) | ||||||||||
| Trustee; Chair of Nominating and | ||||||||||
| Governance Committee and | ||||||||||
| Audit Committee Member — | ||||||||||
| The Merger Fund | ||||||||||
| (2013–October 2021), | ||||||||||
| The Merger Fund VL | ||||||||||
| (2013–October 2021); WCM | ||||||||||
| Alternatives: Event-Driven Fund | ||||||||||
| (2013–October 2021), and WCM | ||||||||||
| Alternatives: Credit Event Fund | ||||||||||
| (December 2017–October 2021) | ||||||||||
| Director; Chair of Governance | ||||||||||
| Committee and Audit Committee | ||||||||||
| Member — International | ||||||||||
| Securities Exchange (2010–2016) | ||||||||||
128
| Number of | Other | |||||||||
| Principal | Portfolios in Fund | Directorships | ||||||||
| Name, | Position(s) | Occupation(s) | Complex Overseen | Held by | ||||||
| Address, | Held with | Length of Time | During the | by Trustee | Trustee | |||||
| and Birth Date | Fund(s) | Served | Past Five Years | or Officer | or Officer | |||||
| Janet L. Yeomans | Trustee | Since April 1999 | Vice President and Treasurer | 150 | Director; Personnel and | |||||
| 610 Market Street | (January 2006–July 2012), Vice | Compensation Committee Chair; | ||||||||
| Philadelphia, PA | President — Mergers & | Member of Nominating, | ||||||||
| 19106-2354 | Acquisitions | Investments, and Audit | ||||||||
| July 1948 | (January 2003–January 2006), | Committees for various periods | ||||||||
| and Vice President and Treasurer | throughout directorship — | |||||||||
| (July 1995–January 2003) — 3M | Okabena Company (2009–2017) | |||||||||
| Company | ||||||||||
| Officers | ||||||||||
| David F. Connor | Senior Vice President, | Senior Vice President, | David F. Connor has served in | 150 | None4 | |||||
| 610 Market Street | General Counsel, and | since May 2013; | various capacities at different | |||||||
| Philadelphia, PA | Secretary | General Counsel | times at Macquarie Investment | |||||||
| 19106-2354 | since May 2015; | Management. | ||||||||
| December 1963 | Secretary since | |||||||||
| October 2005 | ||||||||||
| Daniel V. Geatens | Senior Vice President | Senior Vice President | Daniel V. Geatens has served in | 150 | None4 | |||||
| 610 Market Street | and Treasurer | and Treasurer since | various capacities at different | |||||||
| Philadelphia, PA | October 2007 | times at Macquarie Investment | ||||||||
| 19106-2354 | Management. | |||||||||
| October 1972 | ||||||||||
129
Board of trustees / directors and officers addendum
Delaware Funds by Macquarie®
| Number of | Other | |||||||||
| Principal | Portfolios in Fund | Directorships | ||||||||
| Name, | Position(s) | Occupation(s) | Complex Overseen | Held by | ||||||
| Address, | Held with | Length of Time | During the | by Trustee | Trustee | |||||
| and Birth Date | Fund(s) | Served | Past Five Years | or Officer | or Officer | |||||
| Richard Salus | Senior Vice President | Senior Vice President | Richard Salus has served in | 150 | None | |||||
| 610 Market Street | and Chief Financial | and Chief Financial | various capacities at different | |||||||
| Philadelphia, PA | Officer | Officer since | times at Macquarie Investment | |||||||
| 19106-2354 | November 2006 | Management. | ||||||||
| October 1963 | ||||||||||
| 1 | Shawn K. Lytle is considered to be an “Interested Trustee” because he is an executive officer of the Fund’s(s’) investment advisor. |
| 2 | Macquarie Investment Management is the marketing name for Macquarie Management Holdings, Inc. and its subsidiaries, including the Fund’s(s’) investment advisor, principal underwriter, and its transfer agent. |
| 3 | Messrs. Dobbs and Harroz and Ms. Lawrence were elected as Trustees of the Trust effective December 17, 2021. |
| 4 | David F. Connor serves as Senior Vice President and Secretary, and Daniel V. Geatens serves as Senior Vice President, Treasurer, and Chief Financial Officer, for the six portfolios of the Optimum Fund Trust, which have the same investment advisor, principal underwriter, and transfer agent as the registrant. Mr. Geatens also serves as the Chief Financial Officer and Treasurer for Macquarie Global Infrastructure Total Return Fund Inc. |
The Statement of Additional Information for the Fund(s) includes additional information about the Trustees and Officers and is available, without charge, upon request by calling 800 523-1918.
130
| Board of trustees | |||
Shawn K. Lytle Jerome D. Abernathy Thomas L. Bennett | Ann D. Borowiec Joseph W. Chow H. Jeffrey Dobbs | John A. Fry Joseph Harroz, Jr. Sandra A.J. Lawrence | Frances A. Sevilla-Sacasa Thomas K. Whitford Christianna Wood Janet L. Yeomans |
| Affiliated officers | |||
David F. Connor | Daniel V. Geatens | Richard Salus |
This annual report is for the information of Delaware Emerging Markets Fund, Delaware International Small Cap Fund, and Delaware International Value Equity Fund shareholders, but it may be used with prospective investors when preceded or accompanied by the Delaware Fund fact sheet for the most recently completed calendar quarter. These documents are available at delawarefunds.com/literature.
Each Fund files its complete schedule of portfolio holdings with the Securities and Exchange Commission (SEC) for the first and third quarters of each fiscal year on Form N-PORT. Each Fund’s Forms N-PORT, as well as a description of the policies and procedures that the Funds use to determine how to vote proxies (if any) relating to portfolio securities, are available without charge (i) upon request, by calling 800 523-1918; and (ii) on the SEC’s website at sec.gov. In addition, a description of the policies and procedures that the Funds use to determine how to vote proxies (if any) relating to portfolio securities and the Schedule of Investments included in the Funds’ most recent Form N-PORT are available without charge on the Funds’ website at delawarefunds.com/literature. Each Fund’s Forms N-PORT may be reviewed and copied at the SEC’s Public Reference Room in Washington, D.C.; information on the operation of the Public Reference Room may be obtained by calling 800 SEC-0330.
Information (if any) regarding how the Funds voted proxies relating to portfolio securities during the most recently disclosed 12-month period ended June 30 is available without charge (i) through the Funds’ website at delawarefunds.com/proxy; and (ii) on the SEC’s website at sec.gov.
131
Item 2. Code of Ethics
The registrant has adopted a code of ethics that applies to the registrant’s principal executive officer, principal financial officer, principal accounting officer or controller, or persons performing similar functions, regardless of whether these individuals are employed by the registrant or a third party. A copy of the registrant’s Code of Business Ethics has been posted on the Delaware Funds by Macquarie® Internet Web site at www.delawarefunds.com. Any amendments to the Code of Business Ethics, and information on any waiver from its provisions granted by the registrant, will also be posted on this Web site within five business days of such amendment or waiver and will remain on the Web site for at least 12 months.
Item 3. Audit Committee Financial Expert
The registrant’s Board of Trustees has determined that certain members of the registrant’s Audit Committee are audit committee financial experts, as defined below. For purposes of this item, an “audit committee financial expert” is a person who has the following attributes:
a. An understanding of generally accepted accounting principles and financial statements;
b. The ability to assess the general application of such principles in connection with the accounting for estimates, accruals, and reserves;
c. Experience preparing, auditing, analyzing, or evaluating financial statements that present a breadth and level of complexity of accounting issues that are generally comparable to the breadth and complexity of issues that can reasonably be expected to be raised by the registrant’s financial statements, or experience actively supervising one or more persons engaged in such activities;
d. An understanding of internal controls and procedures for financial reporting; and
e. An understanding of audit committee functions.
An “audit committee financial expert” shall have acquired such attributes through:
a. Education and experience as a principal financial officer, principal accounting officer, controller, public accountant, or auditor or experience in one or more positions that involve the performance of similar functions;
b. Experience actively supervising a principal financial officer, principal accounting officer, controller, public accountant, auditor, or person performing similar functions;
c. Experience overseeing or assessing the performance of companies or public accountants with respect to the preparation, auditing, or evaluation of financial statements; or
d. Other relevant experience.
The registrant’s Board of Trustees has also determined that each member of the registrant’s Audit Committee is independent. In order to be “independent” for purposes of this item, the Audit Committee member may not: (i) other than in his or her capacity as a member of the Board of Trustees or any committee thereof, accept directly or indirectly any consulting, advisory or other compensatory fee from the issuer; or (ii) be an “interested person” of the registrant as defined in Section 2(a)(19) of the Investment Company Act of 1940.
The names of the audit committee financial experts on the registrant’s Audit Committee are set forth below:
John A. Fry
Thomas K. Whitford, Chair
Item 4. Principal Accountant Fees and Services
(a) Audit fees.
The aggregate fees billed for services provided to the registrant by its independent auditors for the audit of the registrant’s annual financial statements and for services normally provided by the independent auditors in connection with statutory and regulatory filings or engagements were $84,942 for the fiscal year ended November 30, 2021.
The aggregate fees billed for services provided to the registrant by its independent auditors for the audit of the registrant’s annual financial statements and for services normally provided by the independent auditors in connection with statutory and regulatory filings or engagements were $94,380 for the fiscal year ended November 30, 2020.
(b) Audit-related fees.
The aggregate fees billed by the registrant’s independent auditors for services relating to the performance of the audit of the registrant’s financial statements and not reported under paragraph (a) of this Item were $0 for the fiscal year ended November 30, 2021.
The aggregate fees billed by the registrant’s independent auditors for services relating to the performance of the audit of the financial statements of the registrant’s investment adviser and other service providers under common control with the adviser and that relate directly to the operations or financial reporting of the registrant were $1,134,001 for the registrant’s fiscal year ended November 30, 2021. The percentage of these fees relating to services approved by the registrant’s Audit Committee pursuant to the de minimis exception from the pre-approval requirement in Rule 2-01(c)(7)(i)(C) of Regulation S-X was 0%. These audit-related services were as follows: year-end audit procedures; group reporting and subsidiary statutory audits.
The aggregate fees billed by the registrant’s independent auditors for services relating to the performance of the audit of the registrant’s financial statements and not reported under paragraph (a) of this Item were $0 for the fiscal year ended November 30, 2020.
The aggregate fees billed by the registrant’s independent auditors for services relating to the performance of the audit of the financial statements of the registrant’s investment adviser and other service providers under common control with the adviser and that relate directly to the operations or financial reporting of the registrant were $903,282 for the registrant’s fiscal year ended November 30, 2020. The percentage of these fees relating to services approved by the registrant’s Audit Committee pursuant to the de minimis exception from the pre-approval requirement in Rule 2-01(c)(7)(i)(C) of Regulation S-X was 0%. These audit-related services were as follows: year-end audit procedures; group reporting and subsidiary statutory audits.
(c) Tax fees.
The aggregate fees billed by the registrant’s independent auditors for tax-related services provided to the registrant were $17,847 for the fiscal year ended November 30, 2021. The percentage of these fees relating to services approved by the registrant’s Audit Committee pursuant to the de minimis exception from the pre-approval requirement in Rule 2-01(c)(7)(i)(C) of Regulation S-X was 0%. These tax-related services were as follows: review of income tax returns and review of annual excise distribution calculations.
The aggregate fees billed by the registrant’s independent auditors for tax-related services provided to the registrant’s investment adviser and other service providers under common control with the adviser and that relate directly to the operations or financial reporting of the registrant were $0 for the registrant’s fiscal year ended November 30, 2021.
The aggregate fees billed by the registrant’s independent auditors for tax-related services provided to the registrant were $19,830 for the fiscal year ended November 30, 2020. The percentage of these fees relating to services approved by the registrant’s Audit Committee pursuant to the de minimis exception from the pre-approval requirement in Rule 2-01(c)(7)(i)(C) of Regulation S-X was 0%. These tax-related services were as follows: review of income tax returns and review of annual excise distribution calculations.
The aggregate fees billed by the registrant’s independent auditors for tax-related services provided to the registrant’s investment adviser and other service providers under common control with the adviser and that relate directly to the operations or financial reporting of the registrant were $0 for the registrant’s fiscal year ended November 30, 2020.
(d) All other fees.
The aggregate fees billed for all services provided by the independent auditors to the registrant other than those set forth in paragraphs (a), (b) and (c) of this Item were $0 for the fiscal year ended November 30, 2021.
The aggregate fees billed for all services other than those set forth in paragraphs (b) and (c) of this Item provided by the registrant’s independent auditors to the registrant’s adviser and other service providers under common control with the adviser and that relate directly to the operations or financial reporting of the registrant were $0 for the registrant’s fiscal year ended November 30, 2021. The percentage of these fees relating to services approved by the registrant’s Audit Committee pursuant to the de minimis exception from the pre-approval requirement in Rule 2-01(c)(7)(i)(C) of Regulation S-X was 0%.
The aggregate fees billed for all services provided by the independent auditors to the registrant other than those set forth in paragraphs (a), (b) and (c) of this Item were $0 for the fiscal year ended November 30, 2020.
The aggregate fees billed for all services other than those set forth in paragraphs (b) and (c) of this Item provided by the registrant’s independent auditors to the registrant’s adviser and other service providers under common control with the adviser and that relate directly to the operations or financial reporting of the registrant were $0 for the registrant’s fiscal year ended November 30, 2020. The percentage of these fees relating to services approved by the registrant’s Audit Committee pursuant to the de minimis exception from the pre-approval requirement in Rule 2-01(c)(7)(i)(C) of Regulation S-X was 0%.
(e) The registrant’s Audit Committee has established pre-approval policies and procedures as permitted by Rule 2-01(c)(7)(i)(B) of Regulation S-X (the “Pre-Approval Policy”) with respect to services provided by the registrant’s independent auditors. Pursuant to the Pre-Approval Policy, the Audit Committee has pre-approved the services set forth in the table below with respect to the registrant up to the specified fee limits. Certain fee limits are based on aggregate fees to the registrant and other registrants within the Delaware Funds by Macquarie®.
| Service | Range of Fees |
| Audit Services | |
| Statutory audits or financial audits for new Funds | up to $50,000 per Fund |
| Services associated with SEC registration statements (e.g., Form N-1A, Form N-14, etc.), periodic reports and other documents filed with the SEC or other documents issued in connection with securities offerings (e.g., comfort letters for closed-end Fund offerings, consents), and assistance in responding to SEC comment letters | up to $10,000 per Fund |
| Consultations by Fund management as to the accounting or disclosure treatment of transactions or events and/or the actual or potential impact of final or proposed rules, standards or interpretations by the SEC, FASB, or other regulatory or standard-setting bodies (Note: Under SEC rules, some consultations may be considered “audit-related services” rather than “audit services”) | up to $25,000 in the aggregate |
| Audit-Related Services | |
| Consultations by Fund management as to the accounting or disclosure treatment of transactions or events and /or the actual or potential impact of final or proposed rules, standards or interpretations by the SEC, FASB, or other regulatory or standard-setting bodies (Note: Under SEC rules, some consultations may be considered “audit services” rather than “audit-related services”) | up to $25,000 in the aggregate |
| Tax Services | |
| U.S. federal, state and local and international tax planning and advice (e.g., consulting on statutory, regulatory or administrative developments, evaluation of Funds’ tax compliance function, etc.) | up to $25,000 in the aggregate |
| U.S. federal, state and local tax compliance (e.g., excise distribution reviews, etc.) | up to $5,000 per Fund |
| Review of federal, state, local and international income, franchise and other tax returns | up to $5,000 per Fund |
Under the Pre-Approval Policy, the Audit Committee has also pre-approved the services set forth in the table below with respect to the registrant’s investment adviser and other entities controlling, controlled by or under common control with the investment adviser that provide ongoing services to the registrant (the “Control Affiliates”) up to the specified fee limit. This fee limit is based on aggregate fees to the investment adviser and its Control Affiliates.
| Service | Range of Fees |
| Non-Audit Services | |
| Services associated with periodic reports and other documents filed with the SEC and assistance in responding to SEC comment letters | up to $10,000 in the aggregate |
The Pre-Approval Policy requires the registrant’s independent auditors to report to the Audit Committee at each of its regular meetings regarding all services initiated since the last such report was rendered, including those services authorized by the Pre-Approval Policy.
(f) Not applicable.
(g) The aggregate non-audit fees billed by the registrant’s independent auditors for services rendered to the registrant and to its investment adviser and other service providers under common control with the adviser were $9,044,000 and $8,455,000 for the registrant’s fiscal years ended November 30, 2021 and November 30, 2020, respectively.
(h) In connection with its selection of the independent auditors, the registrant’s Audit Committee has considered the independent auditors’ provision of non-audit services to the registrant’s investment adviser and other service providers under common control with the adviser that were not required to be pre-approved pursuant to Rule 2-01(c)(7)(ii) of Regulation S-X. The Audit Committee has determined that the independent auditors’ provision of these services is compatible with maintaining the auditors’ independence.
Item 5. Audit Committee of Listed Registrants
Not applicable.
Item 6. Investments
(a) Included as part of report to shareholders filed under Item 1 of this Form N-CSR.
(b) Divestment of securities in accordance with Section 13(c) of the Investment Company Act of 1940.
Not applicable.
Item 7. Disclosure of Proxy Voting Policies and Procedures for Closed-End Management Investment Companies
Not applicable.
Item 8. Portfolio Managers of Closed-End Management Investment Companies
Not applicable.
Item 9. Purchases of Equity Securities by Closed-End Management Investment Companies and Affiliated Purchasers
Not applicable.
Item 10. Submission of Matters to a Vote of Security Holders
Not applicable.
Item 11. Controls and Procedures
The registrant’s principal executive officer and principal financial officers, or persons performing similar functions, have concluded that the registrant’s disclosure controls and procedures (as defined in Rule 30a-3(c) under the Investment Company Act of 1940, as amended (17 CFR 270.30a-3(c))) are effective, as of a date within 90 days of the filing of this report, based on their evaluation of these controls and procedures required by Rule 30a-3(b) under the Investment Company Act of 1940 (17 CFR 270.30a-3(b)) and Rules 13a-15(b) or 15d-15(b) under the Securities Exchange Act of 1934, as amended (17 CFR 240.13a-15(b) or 240.15d-15(b)) and provide reasonable assurance that the information required to be disclosed by the registrant in its reports or statements filed under the Securities Exchange Act of 1934 is recorded, processed, summarized and reported within the time periods specified in the rules and forms of the Securities and Exchange Commission.
There were no significant changes in the registrant’s internal control over financial reporting (as defined in Rule 30a-3(d) under the Investment Company Act of 1940 (17 CFR 270.30a-3(d)) that occurred during the period covered by the report to stockholders included herein that have materially affected, or are reasonably likely to materially affect, the registrant’s internal control over financial reporting.
Item 12. Disclosure of Securities Lending Activities for Closed-End Management Investment Companies
Not applicable.
Item 13. Exhibits
(a) (1) Code of Ethics
Not applicable.
(3) Written solicitations to purchase securities pursuant to Rule 23c-1 under the Securities Exchange Act of 1934.
Not applicable.
SIGNATURES
Pursuant to the requirements of the Securities Exchange Act of 1934 and the Investment Company Act of 1940, the registrant has duly caused this report to be signed on its behalf, by the undersigned, thereunto duly authorized.
DELAWARE GROUP® GLOBAL & INTERNATIONAL FUNDS
| /s/SHAWN K. LYTLE | |
| By: | Shawn K. Lytle |
| Title: | President and Chief Executive Officer |
| Date: | February 4, 2022 |
Pursuant to the requirements of the Securities Exchange Act of 1934 and the Investment Company Act of 1940, this report has been signed below by the following persons on behalf of the registrant and in the capacities and on the dates indicated.
| /s/SHAWN K. LYTLE | |
| By: | Shawn K. Lytle |
| Title: | President and Chief Executive Officer |
| Date: | February 4, 2022 |
| /s/RICHARD SALUS | |
| By: | Richard Salus |
| Title: | Chief Financial Officer |
| Date: | February 4, 2022 |