Table of Contents
UNITED STATES SECURITIES AND EXCHANGE COMMISSION
Washington, D.C. 20549
FORM N-CSR
CERTIFIED SHAREHOLDER REPORT OF REGISTERED MANAGEMENT
INVESTMENT COMPANIES
| Investment Company Act file number: | 811-06324 |
| | |
| Exact name of registrant as specified in charter: | Delaware Group® Global & International Funds |
| | |
| Address of principal executive offices: | 610 Market Street Philadelphia, PA 19106 |
| | |
| Name and address of agent for service: | David F. Connor, Esq. 610 Market Street Philadelphia, PA 19106 |
| | |
| Registrant’s telephone number, including area code: | (800) 523-1918 |
| | |
| Date of fiscal year end: | November 30 |
| | |
| Date of reporting period: | November 30, 2022 |
| | |
Table of Contents
Item 1. Reports to Stockholders
Annual report
Global / international equity mutual funds
Delaware Emerging Markets Fund
Delaware International Small Cap Fund
Delaware International Value Equity Fund
November 30, 2022
Carefully consider the Funds’ investment objectives, risk factors, charges, and expenses before investing. This and other information can be found in the Funds’ prospectus and their summary prospectuses, which may be obtained by visiting delawarefunds.com/literature or calling 800 523-1918. Investors should read the prospectus and the summary prospectus carefully before investing.
You can obtain shareholder reports and prospectuses online instead of in the mail.
Visit delawarefunds.com/edelivery.
Table of Contents
Experience Delaware Funds by Macquarie®
Macquarie Asset Management (MAM) is a global asset manager that aims to deliver positive impact for everyone. MAM Public Investments traces its roots to 1929 and partners with institutional and individual clients to deliver specialist active investment capabilities across global equities, fixed income, and multi-asset solutions using a conviction-based, long-term approach to investing. In the US, retail investors recognize our Delaware Funds by Macquarie family of funds as one of the oldest mutual fund families.
If you are interested in learning more about creating an investment plan, contact your financial advisor.
You can learn more about Delaware Funds or obtain a prospectus for Delaware Emerging Markets Fund, Delaware International Small Cap Fund, and Delaware International Value Equity Fund at delawarefunds.com/literature.
Manage your account online
| ● | Check your account balance and transactions |
| ● | View statements and tax forms |
| ● | Make purchases and redemptions |
Visit delawarefunds.com/account-access.
Macquarie Asset Management (MAM) is the asset management division of Macquarie Group. MAM is a full-service asset manager offering a diverse range of products across public and private markets including fixed income, equities, multi-asset solutions, private credit, infrastructure, renewables, natural assets, real estate, and asset finance. The Public Investments business is a part of MAM and includes the following investment advisers: Macquarie Investment Management Business Trust (MIMBT), Macquarie Funds Management Hong Kong Limited, Macquarie Investment Management Austria Kapitalanlage AG, Macquarie Investment Management Global Limited, Macquarie Investment Management Europe Limited, and Macquarie Investment Management Europe S.A.
The Funds are distributed by Delaware Distributors, L.P. (DDLP), an affiliate of MIMBT and Macquarie Group Limited.
Other than Macquarie Bank Limited ABN 46 008 583 542 (“Macquarie Bank”), any Macquarie Group entity noted in this document is not an authorized deposit-taking institution for the purposes of the Banking Act 1959 (Commonwealth of Australia). The obligations of these other Macquarie Group entities do not represent deposits or other liabilities of Macquarie Bank. Macquarie Bank does not guarantee or otherwise provide assurance in respect of the obligations of these other Macquarie Group entities. In addition, if this document relates to an investment, (a) the investor is subject to investment risk including possible delays in repayment and loss of income and principal invested and (b) none of Macquarie Bank or any other Macquarie Group entity guarantees any particular rate of return on or the performance of the investment, nor do they guarantee repayment of capital in respect of the investment.
The Funds are governed by US laws and regulations.
This annual report is for the information of Delaware Emerging Markets Fund, Delaware International Small Cap Fund, and Delaware International Value Equity Fund shareholders, but it may be used with prospective investors when preceded or accompanied by the Delaware Fund fact sheet for the most recently completed calendar quarter. These documents are available at delawarefunds.com/literature.
Unless otherwise noted, views expressed herein are current as of November 30, 2022, and subject to change for events occurring after such date.
The Funds are not FDIC insured and are not guaranteed. It is possible to lose the principal amount invested.
Advisory services provided by Delaware Management Company, a series of MIMBT, a US registered investment advisor.
All third-party marks cited are the property of their respective owners.
© 2023 Macquarie Management Holdings, Inc.
Table of Contents
| Portfolio management review | |
| Delaware Emerging Markets Fund | November 30, 2022 (Unaudited) |
| | |
| Performance preview (for the year ended November 30, 2022) | | | | | |
| Delaware Emerging Markets Fund (Institutional Class shares) | | 1-year return | | | -23.76% |
| Delaware Emerging Markets Fund (Class A shares) | | 1-year return | | | -23.97% |
| MSCI Emerging Markets Index (net) | | 1-year return | | | -17.43% |
| MSCI Emerging Markets Index (gross) | | 1-year return | | | -17.07% |
Past performance does not guarantee future results.
For complete, annualized performance for Delaware Emerging Markets Fund, please see the table on page 10. Institutional Class shares are not subject to a sales charge and are offered for sale exclusively to certain eligible investors. In addition, Institutional Class shares pay no distribution and service fee.
The performance of Class A shares excludes the applicable sales charge. The performance of both Institutional Class shares and Class A shares reflects the reinvestment of all distributions.
Please see page 12 for a description of the index. Index performance returns do not reflect any management fees, transaction costs, or expenses. Indices are unmanaged and one cannot invest directly in an index.
Investment objective
The Fund seeks long-term capital appreciation.
Market review
The MSCI Emerging Markets Index lagged developed markets and declined 17.4% during the fiscal year ended November 30, 2022. Several factors influenced performance. First, geopolitical tension between Russia and Ukraine escalated to full-scale military conflict. As events unfolded, the US and the European Union imposed sanctions on certain Russian entities, corporations, and individuals, while MSCI eliminated all Russian stocks from the benchmark at a de minimis price. Second, China maintained its stringent zero-COVID policy, imposing lockdowns in major metropolitan areas that further dampened the economic outlook. Third, to combat inflationary pressure, the US Federal Reserve quickened the pace of monetary tightening, which contributed to rising US bond yields and a strengthening US dollar.
Returns across countries and sectors diverged significantly amid volatile market conditions. Latin America outperformed the most among geographic regions. Equities in Brazil and Peru, buoyed by rising commodities prices and currency appreciation, posted returns exceeding 20% in US dollar terms. Mexico also outperformed with notable strength in the financials and industrials sectors. Excluding the impact of Russia’s removal from the MSCI Emerging Markets Index, markets in the Europe, Middle East, and Africa (EMEA) region also outperformed. Rising energy prices supported equities in the Middle East, while in South Africa, the energy, industrials, and financials sectors bolstered performance. Equities rallied amid high inflation in Turkey.
In contrast, Asia relatively lagged, particularly the North Asian markets. Concern about slowing economic growth weighed on consumer-related stocks in China. Moreover, lingering uncertainty in the regulatory environment, both in China and the US, contributed to underperformance in the technology, communication services, and healthcare sectors. In Taiwan and South Korea, technology stocks underperformed as demand weakness appeared to spread beyond consumer-related applications to other end markets. Equities in South and Southeast Asia outperformed as domestic demand
1
Table of Contents
Portfolio management review
Delaware Emerging Markets Fund
helped insulate these economies from slowing global growth. Indonesia, Thailand, and India outperformed the most among Asian markets.
On a sector basis, utilities, financials, and industrials relatively outperformed. In contrast, communication services and healthcare underperformed the most.
Within the Fund
For the fiscal year ended November 30, 2022, Delaware Emerging Markets Fund underperformed it benchmark, the MSCI Emerging Markets Index. The Fund’s Institutional Class shares declined 23.76%. The Fund’s Class A shares declined 23.97% at net asset value and 28.34% at maximum offer price. These figures reflect all distributions reinvested. During the same period, the Fund’s benchmark, the MSCI Emerging Markets Index (net) declined 17.43%. For complete, annualized performance of Delaware Emerging Markets Fund, please see the table on page 10.
Among countries, Russia detracted the most from relative performance. The Fund’s investment process centers on identifying individual companies that we believe possess sustainable franchises and favorable long-term growth prospects, and trade at what we believe are significant discounts to their intrinsic value. Historically, we have found selective Russian companies attractive from a fundamental perspective. For example, in the energy sector, we believe that the oil resources of Rosneft Oil Co. PJSC have some of the lowest extraction costs globally, and that the company’s long-term growth opportunities and valuation compare favorably to peers. However, we have also recognized heightened risks associated with these investments and have sought to manage such risks through enhanced valuation discounts and limits to position sizes. On balance, the Fund has maintained a measured overweight position in Russia relative to its country weighting in the benchmark. While we closely monitored tensions between Russia and Ukraine as they ratcheted up in late 2021 and early 2022, the likelihood of a full-scale invasion appeared low in our assessment at that time.
After Russia’s incursion into Ukraine and the swift application of sanctions against certain Russian entities, trading on Moscow’s stock exchange was halted on February 28, 2022. Several Russian stocks listed offshore continued to trade but plunged in value before being suspended for trading on or around March 2, 2022. As of November 30, 2022, trading in Russian stocks remained suspended for foreign investors. Considering these trading suspensions and ongoing geopolitical uncertainty, the value of the Fund’s Russian holdings has been written down based on fair valuation protocols.
Outside of Russia, the Fund’s stock selection in South Korea and Taiwan was unfavorable. The Strategy holds large overweight positions in semiconductor stocks including MediaTek Inc., SK Hynix Inc., Taiwan Semiconductor Manufacturing Co. Ltd., and Samsung Electronics Co. Ltd. These stocks underperformed as deterioration in the demand outlook heightened investors’ concerns about rising inventories, price declines for semiconductor chips, and downward earnings estimate revisions.
On the positive side, the Fund’s position in Reliance Industries Ltd. in India outperformed as domestic consumption recovered. In Chile, shares of Sociedad Quimica y Minera de Chile SA outperformed as lithium prices rallied.
The prevailing sources of uncertainty – including inflation, rising interest rates, energy
2
Table of Contents
markets, and a potential slowdown of global growth – are unlikely to abate in the near term, in our view. Although we expect market conditions to remain volatile, we do not believe these uncertainties have derailed long-term growth opportunities that are underpinned by secular trends such as digitalization and consumption premiumization (consumers’ preference for high-quality, healthy, and premium products). Moreover, we believe that equity valuations across several pockets of the emerging markets universe appear attractive.
Among countries, we currently hold overweight positions in South Korea, Brazil, and Mexico. Conversely, we are currently underweight relative to the benchmark the Middle East, Southeast Asia, South Africa, and China. Sectors we currently favor include technology, consumer staples, and energy (largely due to the Fund’s holding in Reliance Industries). The Strategy is most underweight in financials and industrials
The Fund used foreign currency exchange contracts to facilitate the purchase and sale of equities traded on international exchanges. The effect of these contracts on performance was not material.
3
Table of Contents
| Portfolio management review | |
| Delaware International Small Cap Fund | November 30, 2022 (Unaudited) |
| | | | | | |
| Performance preview (for the year ended November 30, 2022) | | | | | |
| Delaware International Small Cap Fund (Institutional Class shares) | | 1-year return | | | -23.59% |
| Delaware International Small Cap Fund (Class A shares) | | 1-year return | | | -23.72% |
| MSCI ACWI (All Country World Index) ex USA Small Cap Index (net) | | 1-year return | | | -16.73% |
| MSCI ACWI (All Country World Index) ex USA Small Cap Index (gross) | | 1-year return | | | -16.30% |
Past performance does not guarantee future results.
For complete, annualized performance for Delaware International Small Cap Fund, please see the table on page 14.
Institutional Class shares are not subject to a sales charge and are offered for sale exclusively to certain eligible investors. In addition, Institutional Class shares pay no distribution and service fee.
The performance of Class A shares excludes the applicable sales charge. The performance of both Institutional Class shares and Class A shares reflects the reinvestment of all distributions.
Please see page 16 for a description of the index. Index performance returns do not reflect any management fees, transaction costs, or expenses. Indices are unmanaged and one cannot invest directly in an index.
Investment objective
The Fund seeks long-term capital appreciation.
Market review
The fiscal year ended November 30, 2022, was turbulent and challenging as a combination of macroeconomic and geopolitical events roiled financial markets. Historically high and persistent inflation was exacerbated by the impact of the Russia-Ukraine war on energy and commodity prices. In response, the US Federal Reserve and other major global central banks aggressively tightened monetary policy – significantly raising interest rates – to squeeze inflationary pressures out of the economy.
Other major global events and factors that weighed on financial markets included China’s zero-COVID lockdowns, which contributed to supply-chain disruptions and rising commodity prices; surging fixed income yields; and the sustained strength of the US dollar relative to other major currencies. Late in the period, political and economic volatility in the UK spiked when the newly formed government led by Prime Minister Liz Truss proposed a budget that was deeply unpopular. Within days the British pound plunged, and Prime Minister Truss resigned.
International value stocks significantly outperformed during the 12-month period while their growth counterparts sold off sharply on an indiscriminate basis.
Fund performance
For the fiscal year ended November 30, 2022, Delaware International Small Cap Fund underperformed its benchmark, the MSCI ACWI ex USA Small Cap Index (net). The Fund’s Institutional Class shares declined 23.59%. The Fund’s Class A shares declined 23.72% at net asset value and 28.10% at maximum offer price. These figures reflect all distributions reinvested. During the same period, the Fund’s benchmark (net) declined 16.73%. For complete, annualized performance of Delaware International Small Cap Fund, please see the table on page 14.
In an environment in which global macroeconomic forces rather than stock-specific fundamentals were the determining factor of stock performance, the Fund was at a
4
Table of Contents
distinct disadvantage. Nonetheless, we remained true to our process of bottom-up selection of individual companies undergoing positive, fundamental change that we believe have the potential to drive earnings growth beyond market expectations.
With that in mind, sectors that detracted the most from the Fund’s relative performance during the fiscal year were industrials and real estate. This and other aspects of performance attribution resulted from individual stock selection based on the Fund’s methodology.
Countries that detracted the most from the Fund’s relative performance were the UK, Japan, and Australia. The three largest individual detractors from performance were MIPS AB in Sweden, Future PLC in the UK, and InMode Ltd., based in Israel.
MIPS, a provider of helmet safety technology, underperformed despite the company’s solid financial results. Supply-chain issues, mainly attributable to lockdowns in China, were successfully mitigated. Although MIPS continued to see strong demand, it was hurt as investors rotated from growth to value stocks. We exited our position.
Future is a media publisher with a strong presence in specialty online and print magazine publishing. While Future reported continued trading momentum with digital advertising growth during the period, the shares suffered as growth companies fell out of favor. Although we reduced our weighting in Future, we still hold the stock since we believe the thesis remains intact. However, we continue to monitor the stock closely.
InMode has developed technologies that fill the treatment gap between non-invasive and invasive procedures within the large and growing aesthetics market. Despite reporting strong first-quarter financial results, the stock underperformed during the period. We did add to our position over the summer when the company continued to deliver strong financial results.
Sectors that added the most to the Fund’s performance relative to its benchmark included energy and consumer staples. Energy benefited from global supply shortages that led to both higher prices and profits. Canada, India, and Mexico were the countries that contributed the most to the Fund’s relative performance.
Among individual stocks, the three largest contributors to performance were Varun Beverages Ltd. in India, and Vermilion Energy Inc. and K+S AG, both in Canada.
Varun Beverages is one of the largest global franchisees of PepsiCo Inc. The company manufactures and distributes PepsiCo’s beverages in India as well as selected international markets. Varun outperformed as it benefited from strong in-home demand across its markets along with a rise in out-of-home demand. The company continued to expand its geographic presence, enhancing its distribution network.
Vermilion Energy is a Canada-based independent oil and gas exploration and production company, with operations in North America, Europe, and Australia. Vermilion’s diverse international exposure positioned it to benefit from higher commodity prices, improved cash flow, and merger and acquisition opportunities.
K+S is a leading global producer of potash fertilizer, and a leading distributor of agricultural chemicals. The company benefited from strong commodity prices, supported by global supply constraints. Potash prices remained elevated and K+S has remained positive about its near-term outlook. Recent constraints on Russian and Ukrainian
5
Table of Contents
Portfolio management review
Delaware International Small Cap Fund
agricultural exports have also pushed prices higher for soft commodities.
At the end of the Fund’s fiscal year, there is some optimism that China’s economy will reopen and that the Fed and other central banks will ease monetary constraints once inflation peaks. It would also be a boost to financial markets if we could achieve a so-called economic soft landing and avoid a recession. At the same time, there are plenty of ongoing concerns, including the Russia-Ukraine war, the potential for inflation to remain a concern longer than currently anticipated, uncertainty regarding a possible recession, and the impact of an economic slowdown on corporate earnings.
As previously noted, the Fund’s country and sector weights are driven primarily by bottom-up stock selection. As a result, relative to the Fund’s benchmark at the end of the fiscal year, the Fund was overweight Japan and Canada. From a sector perspective, the Fund’s largest overweight allocations were in industrials and energy. Conversely, Australia and Taiwan were the largest underweight country positions while materials and real estate were the Fund’s largest sector underweights at period end.
The Fund may use derivatives or structured products in limited situations. However, it did not use derivatives during the fiscal period.
6
Table of Contents
| Portfolio management review | |
| Delaware International Value Equity Fund | November 30, 2022 (Unaudited) |
| | |
| Performance preview (for the year ended November 30, 2022) | | | | | |
| Delaware International Value Equity Fund (Institutional Class shares) | | 1-year return | | | -13.23% |
| Delaware International Value Equity Fund (Class A shares) | | 1-year return | | | -13.46% |
| MSCI EAFE (Europe, Australasia, Far East) Index (net) | | 1-year return | | | -10.14% |
| MSCI EAFE (Europe, Australasia, Far East) Index (gross) | | 1-year return | | | -9.70% |
Past performance does not guarantee future results.
For complete, annualized performance for Delaware International Value Equity Fund, please see the table on page 18.
Institutional Class shares are not subject to a sales charge and are offered for sale exclusively to certain eligible investors. In addition, Institutional Class shares pay no distribution and service fee.
The performance of Class A shares excludes the applicable sales charge. The performance of both Institutional Class shares and Class A shares reflects the reinvestment of all distributions.
Please see page 20 for a description of the index. Index performance returns do not reflect any management fees, transaction costs, or expenses. Indices are unmanaged and one cannot invest directly in an index.
Investment objective
The Fund seeks long-term growth without undue risk to principal.
Market review
During the last months of 2021, investors focused their concern on supply-chain disruptions, rising energy prices, and inflation. At the time, it was unclear whether rising inflation would prove to be transitory, as the US Federal Reserve initially maintained, or tenacious. In its last meeting of the year, the Fed turned hawkish as inflation persisted, reaching the highest level seen in decades.
Market returns declined in the first quarter of 2022 as the Russian invasion of Ukraine, inflation, rising energy prices, and central bank interest rate increases worldwide resulted in a risk-off environment. Negative market returns persisted in the second quarter 2022 as China’s zero-COVID policy, mandating continued economic lockdowns, exacerbated disruptions to the already-fragile global supply chain.
In July we saw a strong rally triggered by expectations that the Fed would make a U-turn and reduce interest rates in 2023. The rally faltered, however, as an uncertain outlook for the global economy underpinned central banks’ commitment to reducing inflation by raising rates. Markets continued to decline in the third quarter of 2022, with all sectors in the red. Nonetheless, it appeared that the Fed’s policies were beginning to dampen inflation. In turn, investors worldwide looked to the US as a so-called safe haven, pushing a strong US dollar even higher against other major currencies, including the British pound sterling, euro, and Japanese yen.
Within the Fund
For the fiscal year ended November 30, 2022, Delaware International Value Equity Fund showed a loss and underperformed its benchmark, the MSCI EAFE Index (net). The Fund’s Institutional Class shares lost 13.23%. The Fund’s Class A shares declined 13.46% at net asset value (NAV) and declined 18.42% at maximum offer price. These figures reflect reinvestment of all distributions. During the same period, the Fund’s benchmark (net) lost 10.14%. For complete, annualized performance of Delaware International Value Equity Fund, please see the table on page 18.
7
Table of Contents
Portfolio management review
Delaware International Value Equity Fund
We invest with the mindset of long-term business owners. We seek to identify undervalued quality companies that have the potential to provide solid relative capital protection in challenging times. Therefore, the Fund’s portfolio is built bottom up (stock-by-stock) by selecting company stocks based on quantitative insights and qualitative assessments.
Within the benchmark, energy and financials provided the strongest sector returns during the fiscal year ended November 30, 2022, at 38.6% and -2.1%, respectively. The weakest performance came from information technology, real estate, and consumer discretionary with returns of -26.0%, -19.9%, and -17.6%, respectively.
Active sector allocation as well as stock selection had a negative effect on the Fund’s relative performance. The Fund had no investments in financials and energy, the two strongest sectors in the benchmark, and thus underperformed. Weak stock selection in healthcare and industrials also detracted from relative performance.
Contributions to relative performance came from stock selection in communication services and information technology as well as a lack of investment in real estate, which underperformed in the benchmark.
We had no investments in four out of 11 MSCI sectors: financials, energy, real estate, and utilities. In these sectors, we were unable to identify companies that possessed a business model consistent with our investment philosophy.
In terms of individual holdings, three of the largest contributors to performance were French facilities management company Sodexo SA, Danish multinational pharmaceutical company Novo Nordisk A/S, and French advertising company Publicis Groupe SA.
Sodexo’s third-quarter sales improved 18%, driven by strong volume recovery and upward price revisions in contracts. At period end, Sodexo’s business activity was at 97% of pre-COVID levels compared to 94% in the previous quarter. The recovery in activity was broad-based, across all lines of business and geographies. The Sport & Leisure segment not surprisingly posted the strongest rebound.
The successful Danish insulin producing company Novo Nordisk beat high expectations, growing both sales and earnings by double digits during the fiscal year. The company’s key franchises, diabetes and obesity care, demonstrated strong growth rates, benefiting from an attractive combination of large and expanding addressable markets with low current penetration. Novo Nordisk is a leader in both markets. The company upgraded its guidance, driven in part by a helpful tailwind from the strong US dollar.
The share-price movements of advertising agency conglomerates, like Publicis Groupe, often indicate what investors anticipate for the global economy and market performance. During the past twelve months, Publicis beat stock market estimates on several occasions and upgraded its guidance for organic growth, operating margin, and free cash flow, even though the company voiced concern that the macroeconomic environment might deteriorate. While consumers and marketers alike are feeling the pinch of inflation, rising interest rates, and slower economic growth, businesses are still spending on advertising, says Publicis CEO Arthur Sadoun, who notes that advertising is “essential” to growing a business.
8
Table of Contents
Three significant detractors from the Fund’s performance during the fiscal year were German sportswear manufacturer adidas AG, German global dialysis provider Fresenius Medical Care AG & Co. KGaA, and Spanish IT provider Amadeus IT Group SA.
A challenging trading environment in Greater China, caused by COVID-19 restrictions and industry-wide supply-chain disruptions, has hurt adidas’ shares. The company lowered its outlook for the year citing lower growth rates and margins than initially expected, largely due to China, which is both a very profitable market for adidas and an important source of materials. Its guidance indicates that its profit margin will be far below what the company earned in the past and what we believe it could earn in a more-normal operating environment. We believe the underlying margin potential to be substantially higher for adidas driven by operating leverage, more direct-to-consumer content, and cost-reductions following the sale of Reebok. Before higher margins can be achieved, however, adidas needs to clear some inventory at mark-down prices. That said, adidas is not alone in the industry; we think its peers face similar challenges.
The world’s leading kidney dialysis company, Fresenius Medical Care, was caught in a perfect storm together with its competitors. COVID-19 reduced the patient population, slowed clinic traffic, and increased the cost of serving patients. The industry works on a contract-basis and prices for dialysis services have yet to be adjusted higher to reflect inflation. In essence, Fresenius Medical Care must take the higher costs on its shoulders until prices are renegotiated. Management has withdrawn its 2025 targets. Despite all the headwinds, we think Fresenius Medical Care will remain a profitable business.
Amadeus IT Group is the global leader in ticketing software for the airline industry, with a market share above 40%. The company’s profits are driven by the number of tickets sold, not the ticket price, which provides Amadeus with more stability than its customers. Global air travel is now recovering from the pandemic. Second-quarter earnings confirmed that the travel industry worldwide is continuing to recover and is presently at 75% of pre-pandemic levels. The US market is somewhat stronger while the Asia-Pacific and European markets lag somewhat. Amadeus incurs little additional cost as ticket volumes increase. That is central to our case, which sees earnings improving rapidly as travel volumes recover. Pre-COVID Amadeus had earnings before interest, taxes, depreciation, and amortization (EBITDA) margins just above 40%. In the second quarter 2022 Amadeus again showed EBITDA margins of about 40% and cash flow of 182 million euros generated on revenues that were 17% below pre-COVID levels. Air traffic growth has historically proven resilient during recessions.
The Fund used foreign currency exchange contracts to facilitate the purchase and sale of equities traded on international exchanges. The effect of these contracts on performance was not material.
9
Table of Contents
| Performance summaries | |
| Delaware Emerging Markets Fund | November 30, 2022 (Unaudited) |
The performance quoted represents past performance and does not guarantee future results. Investment return and principal value of an investment will fluctuate so that shares, when redeemed, may be worth more or less than their original cost. Current performance may be lower or higher than the performance quoted. Performance data current to the most recent month end may be obtained by calling 800 523-1918 or visiting delawarefunds.com/performance.
| Fund and benchmark performance1,2 | Average annual total returns through November 30, 2022 |
| | | 1 year | | 5 year | | 10 year | | Lifetime |
| Class A (Est. June 10, 1996) | | | | | | | | |
| Excluding sales charge | | -23.97% | | -1.20% | | +3.96% | | — |
| Including sales charge | | -28.34% | | -2.36% | | +3.35% | | — |
| Class C (Est. June 10, 1996) | | | | | | | | |
| Excluding sales charge | | -24.56% | | -1.93% | | +3.18% | | — |
| Including sales charge | | -25.29% | | -1.93% | | +3.18% | | — |
| Class R (Est. August 31, 2009) | | | | | | | | |
| Excluding sales charge | | -24.15% | | -1.44% | | +3.70% | | — |
| Including sales charge | | -24.15% | | -1.44% | | +3.70% | | — |
| Institutional Class (Est. June 10, 1996) | | | | | | | | |
| Excluding sales charge | | -23.76% | | -0.95% | | +4.22% | | — |
| Including sales charge | | -23.76% | | -0.95% | | +4.22% | | — |
| Class R6 (Est. May 2, 2016) | | | | | | | | |
| Excluding sales charge | | -23.67% | | -0.83% | | — | | +5.81% |
| Including sales charge | | -23.67% | | -0.83% | | — | | +5.81% |
| MSCI Emerging Markets Index (net) | | -17.43% | | -0.42% | | +2.07% | | — |
| MSCI Emerging Markets Index (gross) | | -17.07% | | -0.04% | | +2.44% | | — |
| 1 | Returns reflect the reinvestment of all distributions and are presented both with and without the applicable sales charges described below. Returns do not reflect the deduction of taxes the shareholder would pay on Fund distributions or redemptions of Fund shares. |
Expense limitations were in effect for certain classes during some or all of the periods shown in the “Fund and benchmark performance” table. Expenses for each class are listed in the “Fund expense ratios” table on page 11. Performance would have been lower had expense limitations not been in effect.
Institutional Class shares are not subject to a sales charge and are offered for sale exclusively to certain eligible investors. In addition, Institutional Class shares pay no distribution and service (12b-1) fee.
Class A shares are sold with a maximum front-end sales charge of 5.75%, and have an annual 12b-1 fee of 0.25% of average daily net assets. Performance for Class A shares, excluding sales charges, assumes that no front-end sales charge applied.
Class C shares are sold with a contingent deferred sales charge (CDSC) of 1.00% if
10
Table of Contents
redeemed during the first 12 months. They are also subject to an annual 12b-1 fee of 1.00% of average daily net assets. Performance for Class C shares, excluding sales charges, assumes either that CDSCs did not apply or that the investment was not redeemed.
Class R shares are available only for certain retirement plan products. They are sold without a sales charge and have an annual 12b-1 fee of 0.50% of average daily net assets.
Class R6 shares are available only to certain investors. In addition, Class R6 shares do not pay any service fees, sub-accounting fees, and/or sub-transfer agency fees to any brokers, dealers, or other financial intermediaries. Class R6 shares pay no 12b-1 fee.
International investments entail risks including fluctuation in currency values, differences in accounting principles, or economic or political instability. Investing in emerging markets can be riskier than investing in established foreign markets due to increased volatility, lower trading volume, and higher risk of market closures. In many emerging markets, there is substantially less publicly available information and the available information may be incomplete or misleading. Legal claims are generally more difficult to pursue.
Investments in small and/or medium-sized companies typically exhibit greater risk and higher volatility than larger, more established companies.
The disruptions caused by natural disasters, pandemics, or similar events could prevent the Fund from executing advantageous investment decisions in a timely manner and could negatively impact the Fund’s ability to achieve its investment objective and the value of the Fund’s investments.
| 2 | The Fund’s expense ratios, as described in the most recent prospectus, are disclosed in the following “Fund expense ratios” table. The expense ratios below may differ from the expense ratios in the “Financial highlights” since they are based on different time periods and the expense ratios in the prospectus include acquired fund fees and expenses, if any. See Note 2 in “Notes to financial statements” for additional details. Please see the “Financial highlights” section in this report for the most recent expense ratios. |
| Fund expense ratios | | Class A | | Class C | | Class R | | Institutional
Class | | Class R6 |
Total annual operating expenses
(without fee waivers) | | 1.59% | | 2.34% | | 1.84% | | 1.34% | | 1.23% |
Net expenses (including fee
waivers, if any) | | 1.48% | | 2.23% | | 1.73% | | 1.23% | | 1.14% |
| Type of waiver | | Contractual | | Contractual | | Contractual | | Contractual | | Contractual |
11
Table of Contents
Performance summaries
Delaware Emerging Markets Fund
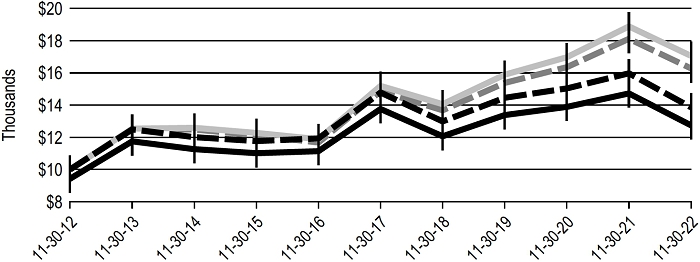
Performance of a $10,000 investment1
For the period November 30, 2012 through November 30, 2022

| | | | Starting value | | Ending value |
  | Delaware Emerging Markets Fund — Institutional Class
shares | | | $10,000 | | | | $15,123 | |
 | Delaware Emerging Markets Fund — Class A shares | | | $9,425 | | | | $13,898 | |
 | MSCI Emerging Markets Index (gross) | | | $10,000 | | | | $12,723 | |
  | MSCI Emerging Markets Index (net) | | | $10,000 | | | | $12,269 | |
| 1 | The “Performance of a $10,000 investment” graph assumes $10,000 invested in Institutional Class and Class A shares of the Fund on November 30, 2012, and includes the effect of a 5.75% front-end sales charge (for Class A shares) and the reinvestment of all distributions. The graph does not reflect the deduction of taxes the shareholders would pay on Fund distributions or redemptions of Fund shares. Expense limitations were in effect for some or all of the periods shown. Performance would have been lower had expense limitations not been in effect. Expenses are listed in the “Fund expense ratios” table on page 11. Please note additional details on pages 10 through 13. |
The graph also assumes $10,000 invested in the MSCI Emerging Markets Index as of November 30, 2012. The MSCI Emerging Markets Index represents large- and mid-cap stocks across emerging market countries worldwide. The index covers approximately 85% of the free float-adjusted market capitalization in each country. Index “net” return approximates the minimum possible dividend reinvestment, after deduction of withholding tax at the highest possible rate. Index “gross” return approximates the maximum possible dividend reinvestment.
Index performance returns do not reflect any management fees, transaction costs, or expenses. Indices are unmanaged and one cannot invest directly in an index. Past performance does not guarantee future results.
Performance of other Fund classes will vary due to different charges and expenses.
12
Table of Contents
| | | Nasdaq symbols | | CUSIPs |
| Class A | | | DEMAX | | | 245914841 |
| Class C | | | DEMCX | | | 245914825 |
| Class R | | | DEMRX | | | 245914569 |
| Institutional Class | | | DEMIX | | | 245914817 |
| Class R6 | | | DEMZX | | | 245914510 |
13
Table of Contents
| Performance summaries | |
| Delaware International Small Cap Fund | November 30, 2022 (Unaudited) |
The performance quoted represents past performance and does not guarantee future results. Investment return and principal value of an investment will fluctuate so that shares, when redeemed, may be worth more or less than their original cost. Current performance may be lower or higher than the performance quoted. Performance data current to the most recent month end may be obtained by calling 800 523-1918 or visiting delawarefunds.com/performance.
| Fund and benchmark performance1,2 | | Average annual total returns through November 30, 2022 |
| | | 1 year | | 5 year | | 10 year | | Lifetime |
| Class A (Est. December 29, 2008) | | | | | | | | |
| Excluding sales charge | | -23.72% | | -1.05% | | +5.31% | | — |
| Including sales charge | | -28.10% | | -2.22% | | +4.69% | | — |
| Class C (Est. December 29, 2010) | | | | | | | | |
| Excluding sales charge | | -24.39% | | -1.81% | | +4.51% | | — |
| Including sales charge | | -25.09% | | -1.81% | | +4.51% | | — |
| Class R (Est. December 29, 2010) | | | | | | | | |
| Excluding sales charge | | -23.91% | | -1.32% | | +5.04% | | — |
| Including sales charge | | -23.91% | | -1.32% | | +5.04% | | — |
| Institutional Class (Est. December 29, 2008) | | | | | | | | |
| Excluding sales charge | | -23.59% | | -0.81% | | +5.57% | | — |
| Including sales charge | | -23.59% | | -0.81% | | +5.57% | | — |
| Class R6 (Est. June 30, 2017) | | | | | | | | |
| Excluding sales charge | | -23.41% | | -0.72% | | — | | +2.44% |
| Including sales charge | | -23.41% | | -0.72% | | — | | +2.44% |
| MSCI ACWI ex USA Small Cap Index (net) | | -16.73% | | +1.25% | | +5.64% | | — |
MSCI ACWI ex USA Small Cap Index
(gross) | | -16.30% | | +1.66% | | +6.05% | | — |
| 1 | Returns reflect the reinvestment of all distributions and are presented both with and without the applicable sales charges described below. Returns do not reflect the deduction of taxes the shareholder would pay on Fund distributions or redemptions of Fund shares. |
Expense limitations were in effect for certain classes during some or all of the periods shown in the “Fund and benchmark performance” table. Expenses for each class are listed in the “Fund expense ratios” table on page 15. Performance would have been lower had expense limitations not been in effect.
Institutional Class shares are not subject to a sales charge and are offered for sale exclusively to certain eligible investors. In addition, Institutional Class shares pay no distribution and service (12b-1) fee.
Class A shares are sold with a maximum front-end sales charge of 5.75%, and have an annual 12b-1 fee of 0.25% of average daily net assets. Performance for Class A shares, excluding sales charges, assumes that no front-end sales charge applied.
14
Table of Contents
Class C shares are sold with a contingent deferred sales charge (CDSC) of 1.00% if redeemed during the first 12 months. They are also subject to an annual 12b-1 fee of 1.00% of average daily net assets. Performance for Class C shares, excluding sales charges, assumes either that CDSCs did not apply or that the investment was not redeemed.
Class R shares are available only for certain retirement plan products. They are sold without a sales charge and have an annual 12b-1 fee of 0.50% of average daily net assets.
Class R6 shares are available only to certain investors. In addition, Class R6 shares do not pay any service fees, sub-accounting fees, and/or sub-transfer agency fees to any brokers, dealers, or other financial intermediaries. Class R6 shares pay no 12b-1 fee.
International investments entail risks including fluctuation in currency values, differences in accounting principles, or economic or political instability. Investing in emerging markets can be riskier than investing in established foreign markets due to increased volatility, lower trading volume, and higher risk of market closures. In many emerging markets, there is substantially less publicly available information and the available information may be incomplete or misleading. Legal claims are generally more difficult to pursue.
Investments in small and/or medium-sized companies typically exhibit greater risk and higher volatility than larger, more established companies.
The disruptions caused by natural disasters, pandemics, or similar events could prevent the Fund from executing advantageous investment decisions in a timely manner and could negatively impact the Fund’s ability to achieve its investment objective and the value of the Fund’s investments.
| 2 | The Fund’s expense ratios, as described in the most recent prospectus, are disclosed in the following “Fund expense ratios” table. The expense ratios below may differ from the expense ratios in the “Financial highlights” since they are based on different time periods and the expense ratios in the prospectus include acquired fund fees and expenses, if any. See Note 2 in “Notes to financial statements” for additional details. Please see the “Financial highlights” section in this report for the most recent expense ratios. |
| Fund expense ratios | | Class A | | Class C | | Class R | | Institutional
Class | | Class R6 |
Total annual operating expenses
(without fee waivers) | | 1.48% | | 2.23% | | 1.73% | | 1.23% | | 1.13% |
Net expenses (including fee
waivers, if any) | | 1.37% | | 2.12% | | 1.62% | | 1.12% | | 1.00% |
| Type of waiver | | Contractual | | Contractual | | Contractual | | Contractual | | Contractual |
15
Table of Contents
Performance summaries
Delaware International Small Cap Fund
Performance of a $10,000 investment1
For the period November 30, 2012 through November 30, 2022

| | | | Starting value | | Ending value |
| MSCI ACWI ex USA Small Cap Index (gross) | | | $10,000 | | | | $17,986 | |
| | MSCI ACWI ex USA Small Cap Index (net) | | | $10,000 | | | | $17,315 | |
| | Delaware International Small Cap Fund — Institutional
Class shares | | | $10,000 | | | | $17,195 | |
| Delaware International Small Cap Fund — Class A shares | | | $9,425 | | | | $15,808 | |
| 1 | The “Performance of a $10,000 investment” graph assumes $10,000 invested in Institutional Class and Class A shares of the Fund on November 30, 2012, and includes the effect of a 5.75% front-end sales charge (for Class A shares) and the reinvestment of all distributions. The graph does not reflect the deduction of taxes the shareholders would pay on Fund distributions or redemptions of Fund shares. Expense limitations were in effect for some or all of the periods shown. Performance would have been lower had expense limitations not been in effect. Expenses are listed in the “Fund expense ratios” table on page 15. Please note additional details on pages 14 through 17. |
The graph also assumes $10,000 invested in the MSCI ACWI ex USA Small Cap Index as of November 30, 2012. The MSCI ACWI (All Country World Index) ex USA Small Cap Index represents small-cap stocks across 22 of 23 developed market countries (excluding the United States) and 24 emerging market countries. The index covers approximately 14% of the global equity opportunity set outside the US. Index “net” return approximates the minimum possible dividend reinvestment, after deduction of withholding tax at the highest possible rate. Index “gross” return approximates the maximum possible dividend reinvestment.
Index performance returns do not reflect any management fees, transaction costs, or expenses. Indices are unmanaged and one cannot invest directly in an index. Past performance does not guarantee future results.
Performance of other Fund classes will vary
16
Table of Contents
due to different charges and expenses.
| | | Nasdaq symbols | | CUSIPs |
| Class A | | | DGGAX | | | 246118541 |
| Class C | | | DGGCX | | | 246118533 |
| Class R | | | DGGRX | | | 246118525 |
| Institutional Class | | | DGGIX | | | 246118517 |
| Class R6 | | | DGRRX | | | 245914486 |
17
Table of Contents
| Performance summaries | |
| Delaware International Value Equity Fund | November 30, 2022 (Unaudited) |
The performance quoted represents past performance and does not guarantee future results. Investment return and principal value of an investment will fluctuate so that shares, when redeemed, may be worth more or less than their original cost. Current performance may be lower or higher than the performance quoted. Performance data current to the most recent month end may be obtained by calling 800 523-1918 or visiting delawarefunds.com/performance.
| Fund and benchmark performance1,2 | Average annual total returns through November 30, 2022 |
| | | 1 year | | 5 year | | 10 year | | Lifetime |
| Class A (Est. October 31, 1991) | | | | | | | | |
| Excluding sales charge | | -13.46% | | -1.52% | | +3.06% | | — |
| Including sales charge | | -18.42% | | -2.68% | | +2.45% | | — |
| Class C (Est. November 29, 1995) | | | | | | | | |
| Excluding sales charge | | -14.07% | | -2.25% | | +2.29% | | — |
| Including sales charge | | -14.87% | | -2.25% | | +2.29% | | — |
| Class R (Est. June 2, 2003) | | | | | | | | |
| Excluding sales charge | | -13.68% | | -1.77% | | +2.80% | | — |
| Including sales charge | | -13.68% | | -1.77% | | +2.80% | | — |
| Institutional Class (Est. November 9, 1992) | | | | | | | | |
| Excluding sales charge | | -13.23% | | -1.27% | | +3.32% | | — |
| Including sales charge | | -13.23% | | -1.27% | | +3.32% | | — |
| Class R6 (Est. March 29, 2018) | | | | | | | | |
| Excluding sales charge | | -13.17% | | — | | — | | -1.14% |
| Including sales charge | | -13.17% | | — | | — | | -1.14% |
| MSCI EAFE Index (net) | | -10.14% | | +1.85% | | +4.99% | | — |
| MSCI EAFE Index (gross) | | -9.70% | | +2.34% | | +5.48% | | — |
| 1 | Returns reflect the reinvestment of all distributions and are presented both with and without the applicable sales charges described below. Returns do not reflect the deduction of taxes the shareholder would pay on Fund distributions or redemptions of Fund shares. |
Expense limitations were in effect for certain classes during some or all of the periods shown in the “Fund and benchmark performance” table. Expenses for each class are listed in the “Fund expense ratios” table on page 19. Performance would have been lower had expense limitations not been in effect.
Institutional Class shares are not subject to a sales charge and are offered for sale exclusively to certain eligible investors. In addition, Institutional Class shares pay no distribution and service (12b-1) fee.
Class A shares are sold with a maximum front-end sales charge of 5.75%, and have an annual 12b-1 fee of 0.25% of average daily net assets. Performance for Class A shares, excluding sales charges, assumes that no front-end sales charge applied.
Class C shares are sold with a contingent deferred sales charge (CDSC) of 1.00% if
18
Table of Contents
redeemed during the first 12 months. They are also subject to an annual 12b-1 fee of 1.00% of average daily net assets. Performance for Class C shares, excluding sales charges, assumes either that CDSCs did not apply or that the investment was not redeemed.
Class R shares are available only for certain retirement plan products. They are sold without a sales charge and have an annual 12b-1 fee of 0.50% of average daily net assets.
Class R6 shares are available only to certain investors. In addition, Class R6 shares do not pay any service fees, sub-accounting fees, and/or sub-transfer agency fees to any brokers, dealers, or other financial intermediaries. Class R6 shares pay no 12b-1 fee.
International investments entail risks including fluctuation in currency values, differences in accounting principles, or economic or political instability. Investing in emerging markets can be riskier than investing in established foreign markets due to increased volatility, lower trading volume, and higher risk of market closures. In many emerging markets, there is substantially less publicly available information and the available information may be incomplete or misleading. Legal claims are generally more difficult to pursue.
The disruptions caused by natural disasters, pandemics, or similar events could prevent the Fund from executing advantageous investment decisions in a timely manner and could negatively impact the Fund’s ability to achieve its investment objective and the value of the Fund’s investments.
| 2 | The Fund’s expense ratios, as described in the most recent prospectus, are disclosed in the following “Fund expense ratios” table. The expense ratios below may differ from the expense ratios in the “Financial highlights” since they are based on different time periods and the expense ratios in the prospectus include acquired fund fees and expenses, if any. See Note 2 in “Notes to financial statements” for additional details. Please see the “Financial highlights” section in this report for the most recent expense ratios. |
| Fund expense ratios | | Class A | | Class C | | Class R | | Institutional
Class | | Class R6 |
Total annual operating expenses
(without fee waivers) | | 1.32% | | 2.07% | | 1.57% | | 1.07% | | 1.00% |
Net expenses (including fee
waivers, if any) | | 1.13% | | 1.88% | | 1.38% | | 0.88% | | 0.81% |
| Type of waiver | | Contractual | | Contractual | | Contractual | | Contractual | | Contractual |
19
Table of Contents
Performance summaries
Delaware International Value Equity Fund
Performance of a $10,000 investment1
For the period November 30, 2012 through November 30, 2022
| | | | Starting value | | Ending value |
| MSCI EAFE Index (gross) | | | $10,000 | | | | $17,056 | |
| | MSCI EAFE Index (net) | | | $10,000 | | | | $16,279 | |
| | Delaware International Value Equity Fund — Institutional
Class shares | | | $10,000 | | | | $13,860 | |
| | Delaware International Value Equity Fund — Class A
shares | | | $9,425 | | | | $12,741 | |
| 1 | The “Performance of a $10,000 investment” graph assumes $10,000 invested in Institutional Class and Class A shares of the Fund on November 30, 2012, and includes the effect of a 5.75% front-end sales charge (for Class A shares) and the reinvestment of all distributions. The graph does not reflect the deduction of taxes the shareholders would pay on Fund distributions or redemptions of Fund shares. Expense limitations were in effect for some or all of the periods shown. Performance would have been lower had expense limitations not been in effect. Expenses are listed in the “Fund expense ratios” table on page 19. Please note additional details on pages 18 through 21. |
The graph also assumes $10,000 invested in the MSCI EAFE Index as of November 30, 2012. The MSCI EAFE (Europe, Australasia, Far East) Index represents large- and mid-cap stocks across 21 developed markets, excluding the United States and Canada. The index covers approximately 85% of the free float-adjusted market capitalization in each country. Index “net” return approximates the minimum possible dividend reinvestment, after deduction of withholding tax at the highest possible rate. Index “gross” return approximates the maximum possible dividend reinvestment.
Index performance returns do not reflect any management fees, transaction costs, or expenses. Indices are unmanaged and one cannot invest directly in an index. Past performance does not guarantee future results.
Performance of other Fund classes will vary
20
Table of Contents
due to different charges and expenses.
| | | Nasdaq symbols | | CUSIPs |
| Class A | | | DEGIX | | | 245914106 |
| Class C | | | DEGCX | | | 245914858 |
| Class R | | | DIVRX | | | 245914577 |
| Institutional Class | | | DEQIX | | | 245914403 |
| Class R6 | | | DEQRX | | | 245914478 |
21
Table of Contents
Disclosure of Fund expenses
For the six-month period from June 1, 2022 to November 30, 2022 (Unaudited)
As a shareholder of a Fund, you incur two types of costs: (1) transaction costs, including sales charges (loads) on purchase payments, reinvested dividends, or other distributions; redemption fees; and exchange fees; and (2) ongoing costs, including management fees; distribution and service (12b-1) fees; and other Fund expenses. The following examples are intended to help you understand your ongoing costs (in dollars) of investing in a Fund and to compare these costs with the ongoing costs of investing in other mutual funds.
The examples are based on an investment of $1,000 invested at the beginning of the period and held for the entire six-month period from June 1, 2022 to November 30, 2022.
Actual expenses
The first section of the tables shown, “Actual Fund return,” provides information about actual account values and actual expenses. You may use the information in this section of the table, together with the amount you invested, to estimate the expenses that you paid over the period. Simply divide your account value by $1,000 (for example, an $8,600 account value divided by $1,000 = 8.6), then multiply the result by the number in the first section under the heading entitled “Expenses Paid During Period” to estimate the expenses you paid on your account during this period.
Hypothetical example for comparison purposes
The second section of the tables shown, “Hypothetical 5% return,” provides information about hypothetical account values and hypothetical expenses based on the Funds’ actual expense ratio and an assumed rate of return of 5% per year before expenses, which is not the Funds’ actual return. The hypothetical account values and expenses may not be used to estimate the actual ending account balance or expenses you paid for the period. You may use this information to compare the ongoing costs of investing in each Fund and other funds. To do so, compare this 5% hypothetical example with the 5% hypothetical examples that appear in the shareholder reports of the other funds.
Please note that the expenses shown in the tables are meant to highlight your ongoing costs only and do not reflect any transactional costs, such as sales charges (loads), redemption fees, or exchange fees. Therefore, the second section of each table is useful in comparing ongoing costs only, and will not help you determine the relative total costs of owning different funds. In addition, if these transactional costs were included, your costs would have been higher. The Funds’ expenses shown in the tables reflect fee waivers in effect and assume reinvestment of all dividends and distributions.
22
Table of Contents
Delaware Emerging Markets Fund
Expense analysis of an investment of $1,000
| | | Beginning
Account Value
6/1/22 | | Ending
Account Value
11/30/22 | | Annualized
Expense Ratio | | Expenses
Paid During Period
6/1/22 to 11/30/22* |
| Actual Fund return† | | | | | | | | | | | | |
| Class A | | | $1,000.00 | | | | $892.10 | | | | 1.48 | % | | | $7.02 | |
| Class C | | | 1,000.00 | | | | 888.90 | | | | 2.23 | % | | | 10.56 | |
| Class R | | | 1,000.00 | | | | 891.30 | | | | 1.73 | % | | | 8.20 | |
| Institutional Class | | | 1,000.00 | | | | 893.40 | | | | 1.23 | % | | | 5.84 | |
| Class R6 | | | 1,000.00 | | | | 894.00 | | | | 1.14 | % | | | 5.41 | |
| Hypothetical 5% return (5% return before expenses) |
| Class A | | | $1,000.00 | | | | $1,017.65 | | | | 1.48 | % | | | $7.49 | |
| Class C | | | 1,000.00 | | | | 1,013.89 | | | | 2.23 | % | | | 11.26 | |
| Class R | | | 1,000.00 | | | | 1,016.39 | | | | 1.73 | % | | | 8.74 | |
| Institutional Class | | | 1,000.00 | | | | 1,018.90 | | | | 1.23 | % | | | 6.23 | |
| Class R6 | | | 1,000.00 | | | | 1,019.35 | | | | 1.14 | % | | | 5.77 | |
Delaware International Small Cap Fund
Expense analysis of an investment of $1,000
| | | Beginning
Account Value
6/1/22 | | Ending
Account Value
11/30/22 | | Annualized
Expense Ratio | | Expenses
Paid During Period
6/1/22 to 11/30/22* |
| Actual Fund return† | | | | | | | | | | | | | | | | |
| Class A | | | $1,000.00 | | | | $920.80 | | | | 1.35 | % | | | $6.50 | |
| Class C | | | 1,000.00 | | | | 917.10 | | | | 2.10 | % | | | 10.09 | |
| Class R | | | 1,000.00 | | | | 918.30 | | | | 1.60 | % | | | 7.69 | |
| Institutional Class | | | 1,000.00 | | | | 921.40 | | | | 1.10 | % | | | 5.30 | |
| Class R6 | | | 1,000.00 | | | | 921.80 | | | | 1.00 | % | | | 4.82 | |
| Hypothetical 5% return (5% return before expenses) |
| Class A | | | $1,000.00 | | | | $1,018.30 | | | | 1.35 | % | | | $6.83 | |
| Class C | | | 1,000.00 | | | | 1,014.54 | | | | 2.10 | % | | | 10.61 | |
| Class R | | | 1,000.00 | | | | 1,017.05 | | | | 1.60 | % | | | 8.09 | |
| Institutional Class | | | 1,000.00 | | | | 1,019.55 | | | | 1.10 | % | | | 5.57 | |
| Class R6 | | | 1,000.00 | | | | 1,020.05 | | | | 1.00 | % | | | 5.06 | |
23
Table of Contents
Disclosure of Fund expenses
For the six-month period from June 1, 2022 to November 30, 2022 (Unaudited)
Delaware International Value Equity Fund
Expense analysis of an investment of $1,000
| | | Beginning
Account Value
6/1/22 | | Ending
Account Value
11/30/22 | | Annualized
Expense Ratio | | Expenses
Paid During Period
6/1/22 to 11/30/22* |
| Actual Fund return† | | | | | | | | | | | | |
| Class A | | | $1,000.00 | | | | $939.50 | | | | 1.13 | % | | | $5.49 | |
| Class C | | | 1,000.00 | | | | 936.60 | | | | 1.88 | % | | | 9.13 | |
| Class R | | | 1,000.00 | | | | 938.50 | | | | 1.38 | % | | | 6.71 | |
| Institutional Class | | | 1,000.00 | | | | 941.30 | | | | 0.88 | % | | | 4.28 | |
| Class R6 | | | 1,000.00 | | | | 941.30 | | | | 0.81 | % | | | 3.94 | |
| Hypothetical 5% return (5% return before expenses) |
| Class A | | | $1,000.00 | | | | $1,019.40 | | | | 1.13 | % | | | $5.72 | |
| Class C | | | 1,000.00 | | | | 1,015.64 | | | | 1.88 | % | | | 9.50 | |
| Class R | | | 1,000.00 | | | | 1,018.15 | | | | 1.38 | % | | | 6.98 | |
| Institutional Class | | | 1,000.00 | | | | 1,020.66 | | | | 0.88 | % | | | 4.46 | |
| Class R6 | | | 1,000.00 | | | | 1,021.01 | | | | 0.81 | % | | | 4.10 | |
| * | “Expenses Paid During Period” are equal to the relevant Fund’s annualized expense ratio, multiplied by the average account value over the period, multiplied by 183/365 (to reflect the one-half year period). |
| † | Because actual returns reflect only the most recent six-month period, the returns shown may differ significantly from fiscal year returns. |
In addition to the Fund’s expenses reflected above, each Fund also indirectly bears its portion of the fees and expenses of any investment companies (Underlying Funds) in which it invests, including exchange-traded funds. The tables above do not reflect the expenses of any Underlying Funds.
24
Table of Contents
| Security type / country and sector allocations |
| Delaware Emerging Markets Fund | As of November 30, 2022 (Unaudited) |
Sector designations may be different from the sector designations presented in other Fund materials. The sector designations may represent the investment manager’s internal sector classifications, which may result in the sector designations for one fund being different than another fund’s sector designations.
| Security type / country | | Percentage of net assets |
| Common Stocks by Country | | | 98.51 | % |
| Argentina | | | 0.45 | % |
| Australia | | | 1.73 | % |
| Bahrain | | | 0.06 | % |
| Brazil | | | 5.90 | % |
| Chile | | | 1.78 | % |
| China | | | 27.29 | % |
| Hong Kong | | | 0.24 | % |
| India | | | 15.88 | % |
| Indonesia | | | 1.57 | % |
| Malaysia | | | 0.02 | % |
| Mexico | | | 4.96 | % |
| Peru | | | 0.55 | % |
| Republic of Korea | | | 18.95 | % |
| Russia | | | 0.01 | % |
| South Africa | | | 0.29 | % |
| Taiwan | | | 15.79 | % |
| Turkey | | | 1.26 | % |
| United Kingdom | | | 0.06 | % |
| United States | | | 1.72 | % |
| Preferred Stocks | | | 1.88 | % |
| Rights | | | 0.02 | % |
| Warrants | | | 0.01 | % |
| Exchange-Traded Fund | | | 0.21 | % |
| Participation Notes | | | 0.00 | % |
| Short-Term Investments | | | 0.09 | % |
| Total Value of Securities | | | 100.72 | % |
| Liabilities Net of Receivables and Other Assets | | | (0.72 | %) |
| Total Net Assets | | | 100.00 | % |
25
Table of Contents
Security type / country and sector allocations
Delaware Emerging Markets Fund
Common stock, participation notes, and
preferred stock by sector t | | Percentage of net assets |
| Communication Services | | | 11.99 | % |
| Consumer Discretionary | | | 11.79 | % |
| Consumer Staples | | | 12.96 | % |
| Energy | | | 11.80 | % |
| Financials | | | 5.62 | % |
| Healthcare | | | 1.33 | % |
| Industrials | | | 1.17 | % |
| Information Technology* | | | 35.92 | % |
| Materials | | | 7.07 | % |
| Real Estate | | | 0.15 | % |
| Utilities | | | 0.59 | % |
| Total | | | 100.39 | % |
| t | Narrow industries are utilized for compliance purposes for concentration whereas broad sectors are used for financial reporting. |
| * | To monitor compliance with the Fund’s concentration guidelines as described in the Fund’s Prospectus and Statement of Additional Information, the Information Technology sector (as disclosed herein for financial reporting purposes) is subdivided into a variety of “industries” (in accordance with the requirements of the Investment Company Act of 1940, as amended). The Information Technology sector consisted of Commercial Services, Computers, Electronics, Electronic Components-Semiconductors, Internet, Investment Companies, Retail, Semiconductor Components-Integrated Circuits, and Software. As of November 30, 2022, such amounts, as a percentage of total net assets were 0.09%, 1.97%, 0.17%, 18.04%, 0.69%, 3.65%, 0.01%, 10.48%, and 0.82%, respectively. The percentage in any such single industry will comply with the Fund’s concentration policy even if the percentage in the Information Technology sector for financial reporting purposes may exceed 25%. |
26
Table of Contents
| Security type / country and sector allocations |
| Delaware International Small Cap Fund | As of November 30, 2022 (Unaudited) |
Sector designations may be different from the sector designations presented in other Fund materials. The sector designations may represent the investment manager’s internal sector classifications, which may result in the sector designations for one fund being different than another fund’s sector designations.
| Security type / country | | Percentage of net assets |
| Common Stocks by Country | | | 97.28 | % |
| Argentina | | | 0.85 | % |
| Australia | | | 3.39 | % |
| Austria | | | 0.51 | % |
| Brazil | | | 4.63 | % |
| Canada | | | 11.54 | % |
| China | | | 1.09 | % |
| Denmark | | | 1.84 | % |
| Finland | | | 0.76 | % |
| France | | | 2.81 | % |
| Germany | | | 2.41 | % |
| India | | | 5.60 | % |
| Indonesia | | | 0.67 | % |
| Ireland | | | 0.88 | % |
| Israel | | | 1.16 | % |
| Italy | | | 3.33 | % |
| Japan | | | 26.29 | % |
| Malaysia | | | 0.37 | % |
| Mexico | | | 3.74 | % |
| Norway | | | 3.75 | % |
| Republic of Korea | | | 2.27 | % |
| Russia | | | 0.01 | % |
| South Africa | | | 2.64 | % |
| Spain | | | 2.03 | % |
| Sweden | | | 1.74 | % |
| Taiwan | | | 1.96 | % |
| Thailand | | | 0.69 | % |
| United Kingdom | | | 9.19 | % |
| United States | | | 1.13 | % |
| Short-Term Investments | | | 2.62 | % |
| Total Value of Securities | | | 99.90 | % |
| Receivables and Other Assets Net of Liabilities | | | 0.10 | % |
| Total Net Assets | | | 100.00 | % |
27
Table of Contents
Security type / country and sector allocations
Delaware International Small Cap Fund
| Common stocks by sector | | Percentage of net assets |
| Communication Services | | | 2.22 | % |
| Consumer Discretionary | | | 11.68 | % |
| Consumer Staples | | | 7.89 | % |
| Energy | | | 7.99 | % |
| Financials | | | 15.00 | % |
| Healthcare | | | 6.50 | % |
| Industrials | | | 24.36 | % |
| Information Technology | | | 9.29 | % |
| Materials | | | 4.96 | % |
| Real Estate | | | 5.38 | % |
| Utilities | | | 2.01 | % |
| Total | | | 97.28 | % |
28
Table of Contents
| Security type / country and sector allocations |
| Delaware International Value Equity Fund | As of November 30, 2022 (Unaudited) |
Sector designations may be different from the sector designations presented in other Fund materials. The sector designations may represent the investment manager’s internal sector classifications, which may result in the sector designations for one fund being different than another fund’s sector designations.
| Security type / country | | Percentage of net assets |
| Common Stocks by Country | | | 98.79 | % |
| Denmark | | | 4.64 | % |
| France | | | 17.64 | % |
| Germany | | | 12.66 | % |
| Japan | | | 9.96 | % |
| Netherlands | | | 6.11 | % |
| Spain | | | 5.62 | % |
| Sweden | | | 10.13 | % |
| Switzerland | | | 13.67 | % |
| United Kingdom | | | 18.36 | % |
| Exchange-Traded Funds | | | 0.44 | % |
| Securities Lending Collateral | | | 0.07 | % |
| Total Value of Securities | | | 99.30 | % |
| Obligation to Return Securities Lending Collateral | | | (0.07 | %) |
| Receivables and Other Assets Net of Liabilities | | | 0.77 | % |
| Total Net Assets | | | 100.00 | % |
| Common stocks by sector t | | Percentage of net assets |
| Communication Services | | | 5.30 | % |
| Consumer Discretionary | | | 14.15 | % |
| Consumer Staples* | | | 35.84 | % |
| Healthcare | | | 15.61 | % |
| Industrials | | | 12.02 | % |
| Information Technology | | | 10.41 | % |
| Materials | | | 5.46 | % |
| Total | | | 98.79 | % |
| t | Narrow industries are utilized for compliance purposes for concentration whereas broad sectors are used for financial reporting. |
29
Table of Contents
Security type / country and sector allocations
Delaware International Value Equity Fund
| * | To monitor compliance with the Fund’s concentration guidelines as described in the Fund’s Prospectus and Statement of Additional Information, the Consumer Staples sector (as disclosed herein for financial reporting purposes) is subdivided into a variety of “industries” (in accordance with the requirements of the Investment Company Act of 1940, as amended). The Consumer Staples sector consisted of Beverages, Cosmetics/Personal Care, and Food. As of November 30, 2022, such amounts, as a percentage of total net assets were 7.11%, 11.63%, and 17.10%, respectively. The percentage in any such single industry will comply with the Fund’s concentration policy even if the percentage in the Consumer Staples sector for financial reporting purposes may exceed 25%. |
30
Table of Contents
| Schedules of investments | |
| Delaware Emerging Markets Fund | November 30, 2022 |
| | | Number of
shares | | | Value (US $) |
| Common Stocks – 98.51%∆ | | | | | | | |
| Argentina – 0.45% | | | | | | | |
| Arcos Dorados Holdings Class A | | | 573,518 | | | $ | 4,295,650 |
| Cablevision Holding GDR | | | 443,972 | | | | 1,064,999 |
| Cresud ADR † | | | 1,624,384 | | | | 9,730,060 |
| Grupo Clarin GDR Class B 144A #, † | | | 131,213 | | | | 135,586 |
| IRSA Inversiones y Representaciones ADR | | | 1,474,962 | | | | 6,312,837 |
| | | | | | | | 21,539,132 |
| Australia – 1.73% | | | | | | | |
| BHP Group ADR | | | 380,000 | | | | 23,864,000 |
| Rio Tinto ADR | | | 800,000 | | | | 54,912,000 |
| Woodside Energy Group ADR | | | 137,332 | | | | 3,463,513 |
| | | | | | | | 82,239,513 |
| Bahrain – 0.06% | | | | | | | |
| Aluminium Bahrain GDR 144A # | | | 221,400 | | | | 2,977,454 |
| | | | | | | | 2,977,454 |
| Brazil – 5.90% | | | | | | | |
| Americanas | | | 10,770,362 | | | | 21,584,932 |
| Atacadao | | | 500,000 | | | | 1,540,655 |
| Banco Bradesco ADR | | | 16,000,000 | | | | 47,520,000 |
| Banco Santander Brasil ADR | | | 3,051,128 | | | | 16,262,512 |
| BRF ADR † | | | 6,850,000 | | | | 12,467,000 |
| Centrais Eletricas Brasileiras ADR | | | 989,541 | | | | 8,866,287 |
| Embraer ADR † | | | 420,704 | | | | 4,467,877 |
Getnet Adquirencia e Servicos para Meios de
Pagamento ADR | | | 381,391 | | | | 652,179 |
| Itau Unibanco Holding ADR | | | 7,170,000 | | | | 35,706,600 |
| Rumo | | | 1,905,351 | | | | 7,111,998 |
| Telefonica Brasil ADR | | | 2,050,000 | | | | 14,985,500 |
| TIM ADR | | | 1,244,820 | | | | 15,510,457 |
| Vale ADR | | | 5,430,000 | | | | 89,595,000 |
| XP Class A † | | | 211,715 | | | | 3,707,130 |
| | | | | | | | 279,978,127 |
| Chile – 1.78% | | | | | | | |
| Cia Cervecerias Unidas ADR | | | 410,528 | | | | 5,000,231 |
| Sociedad Quimica y Minera de Chile ADR | | | 800,000 | | | | 79,328,000 |
| | | | | | | | 84,328,231 |
| China – 27.29% | | | | | | | |
| Alibaba Group Holding † | | | 2,300,000 | | | | 25,031,274 |
| Alibaba Group Holding ADR † | | | 1,940,000 | | | | 169,866,400 |
| ANTA Sports Products | | | 2,317,600 | | | | 27,545,249 |
31
Table of Contents
Schedules of investments
Delaware Emerging Markets Fund
| | | Number of
shares | | | Value (US $) |
| Common Stocks∆ (continued) | | | | | | | |
| China (continued) | | | | | | | |
| Baidu ADR † | | | 420,000 | | | $ | 45,612,000 |
| BeiGene † | | | 1,615,700 | | | | 24,021,996 |
| China Petroleum & Chemical Class H | | | 30,000,000 | | | | 14,162,829 |
| DiDi Global ADR † | | | 1,278,300 | | | | 3,419,453 |
| Full Truck Alliance ADR † | | | 1,800,000 | | | | 15,354,000 |
| Guangshen Railway Class H † | | | 11,000,000 | | | | 1,726,635 |
| Hengan International Group | | | 2,000,000 | | | | 9,218,895 |
| iQIYI ADR † | | | 700,000 | | | | 2,079,000 |
| JD.com Class A | | | 226,190 | | | | 6,457,220 |
| JD.com ADR | | | 3,080,000 | | | | 176,114,400 |
| Joinn Laboratories China Class H 144A # | | | 85,848 | | | | 402,055 |
| Kangji Medical Holdings | | | 3,000 | | | | 3,030 |
| Kunlun Energy | | | 21,000,000 | | | | 16,292,754 |
| Kweichow Moutai Class A | | | 700,000 | | | | 157,750,699 |
| New Oriental Education & Technology Group ADR † | | | 700,000 | | | | 20,118,000 |
| PetroChina Class H | | | 18,000,000 | | | | 8,190,580 |
| Ping An Insurance Group Co. of China Class H | | | 4,000,000 | | | | 24,696,033 |
| Sohu.com ADR † | | | 2,219,642 | | | | 32,806,309 |
| Sun Art Retail Group | | | 15,079,500 | | | | 3,937,508 |
| TAL Education Group ADR † | | | 1,030,000 | | | | 6,149,100 |
| Tencent Holdings | | | 5,000,000 | | | | 189,081,579 |
| Tencent Music Entertainment Group ADR † | | | 950,000 | | | | 6,659,500 |
| Tianjin Development Holdings | | | 15,885,550 | | | | 3,027,346 |
| Tingyi Cayman Islands Holding | | | 13,000,000 | | | | 21,262,106 |
| Trip.com Group ADR † | | | 582,400 | | | | 18,607,680 |
| Tsingtao Brewery Class H | | | 7,000,000 | | | | 66,265,789 |
| Uni-President China Holdings | | | 31,186,000 | | | | 27,373,790 |
| Weibo ADR † | | | 960,481 | | | | 15,310,067 |
| Wuliangye Yibin Class A | | | 7,000,000 | | | | 155,740,016 |
| ZhongAn Online P&C Insurance Class H 144A #, † | | | 739,600 | | | | 1,937,344 |
| | | | | | | | 1,296,220,636 |
| Hong Kong – 0.24% | | | | | | | |
| Vinda International Holdings | | | 4,300,000 | | | | 11,194,391 |
| | | | | | | | 11,194,391 |
| India – 15.88% | | | | | | | |
| Aurobindo Pharma | | | 1,500,000 | | | | 8,666,021 |
| Glenmark Pharmaceuticals | | | 1,167,988 | | | | 6,188,228 |
| HCL Technologies | | | 2,800,000 | | | | 38,865,620 |
| Indiabulls Real Estate GDR † | | | 102,021 | | | | 104,356 |
| Infosys | | | 2,640,000 | | | | 53,660,408 |
32
Table of Contents
| | | Number of
shares | | | Value (US $) |
| Common Stocks∆ (continued) | | | | | | | |
| India (continued) | | | | | | | |
| Lupin | | | 2,500,000 | | | $ | 23,576,515 |
| Reliance Industries | | | 10,500,000 | | | | 353,194,000 |
| Reliance Industries GDR 144A # | | | 2,340,879 | | | | 155,779,650 |
| Tata Chemicals | | | 1,866,909 | | | | 23,847,954 |
| Tata Consultancy Services | | | 950,000 | | | | 39,895,722 |
| Tata Consumer Products | | | 2,128,276 | | | | 21,438,716 |
| United Breweries | | | 1,000,000 | | | | 20,737,297 |
| Zee Entertainment Enterprises | | | 2,530,000 | | | | 8,242,458 |
| | | | | | | | 754,196,945 |
| Indonesia – 1.57% | | | | | | | |
| Astra Agro Lestari | | | 9,132,500 | | | | 4,838,074 |
| Astra International | | | 180,000,000 | | | | 69,641,812 |
| | | | | | | | 74,479,886 |
| Malaysia – 0.02% | | | | | | | |
| UEM Sunrise † | | | 17,000,000 | | | | 1,077,630 |
| | | | | | | | 1,077,630 |
| Mexico – 4.96% | | | | | | | |
| America Movil ADR Class L | | | 1,369,199 | | | | 26,644,613 |
| Banco Santander Mexico ADR | | | 8,042,900 | | | | 48,337,829 |
| Cemex ADR † | | | 4,300,000 | | | | 19,651,000 |
| Coca-Cola Femsa ADR | | | 300,000 | | | | 20,493,000 |
| Fomento Economico Mexicano ADR | | | 688,329 | | | | 54,976,837 |
| Grupo Financiero Banorte Class O | | | 4,000,000 | | | | 32,103,244 |
| Grupo Televisa ADR | | | 6,017,000 | | | | 32,852,820 |
| Sitios Latinoamerica † | | | 1,369,199 | | | | 610,299 |
| | | | | | | | 235,669,642 |
| Peru – 0.55% | | | | | | | |
| Cia de Minas Buenaventura ADR | | | 3,217,400 | | | | 26,253,984 |
| | | | | | | | 26,253,984 |
| Republic of Korea – 18.95% | | | | | | | |
| Kakao | | | 200,000 | | | | 8,775,285 |
| Kakaopay † | | | 100,000 | | | | 4,113,459 |
| KB Financial Group ADR | | | 245,928 | | | | 9,692,022 |
| LG Uplus | | | 2,403,542 | | | | 22,218,980 |
| Lotte | | | 300,000 | | | | 7,538,309 |
| Lotte Chilsung Beverage | | | 44,000 | | | | 5,287,009 |
| Lotte Confectionery | | | 60,000 | | | | 5,901,996 |
| Samsung Electronics | | | 5,200,000 | | | | 249,854,549 |
| Samsung Life Insurance | | | 360,939 | | | | 20,262,424 |
33
Table of Contents
Schedules of investments
Delaware Emerging Markets Fund
| | | Number of
shares | | | Value (US $) |
| Common Stocks∆ (continued) | | | | | | | |
| Republic of Korea (continued) | | | | | | | |
| Shinhan Financial Group | | | 300,000 | | | $ | 8,697,038 |
| SK Hynix | | | 3,490,000 | | | | 230,340,105 |
| SK Square † | | | 5,981,465 | | | | 173,298,790 |
| SK Telecom | | | 2,175,168 | | | | 82,929,738 |
| SK Telecom ADR | | | 3,312,676 | | | | 71,056,900 |
| | | | | | | | 899,966,604 |
| Russia – 0.01% | | | | | | | |
| ENEL RUSSIA PJSC =, † | | | 1,058,050 | | | | 0 |
| Etalon Group GDR 144A #, = | | | 1,616,300 | | | | 0 |
| Gazprom PJSC = | | | 29,200,000 | | | | 0 |
| LUKOIL PJSC = | | | 492,501 | | | | 0 |
| Rosneft Oil PJSC = | | | 14,555,684 | | | | 0 |
| Sberbank of Russia PJSC =, † | | | 3,200,000 | | | | 0 |
| Sberbank of Russia PJSC =, † | | | 12,000,000 | | | | 0 |
| Surgutneftegas PJSC ADR =, † | | | 2,014,441 | | | | 0 |
| T Plus PJSC =, † | | | 36,096 | | | | 0 |
| VEON ADR † | | | 732,264 | | | | 439,358 |
| VK GDR =, † | | | 551,200 | | | | 0 |
| Yandex Class A =, † | | | 920,000 | | | | 0 |
| | | | | | | | 439,358 |
| South Africa – 0.29% | | | | | | | |
| Naspers Class N | | | 86,398 | | | | 13,241,714 |
| Sun International | | | 364,166 | | | | 755,443 |
| | | | | | | | 13,997,157 |
| Taiwan – 15.79% | | | | | | | |
| FIT Hon Teng 144A #, † | | | 38,000,000 | | | | 8,280,195 |
| MediaTek | | | 10,092,000 | | | | 243,861,168 |
| Taiwan Semiconductor Manufacturing | | | 31,000,000 | | | | 497,855,463 |
| | | | | | | | 749,996,826 |
| Turkey – 1.26% | | | | | | | |
| Akbank | | | 19,500,000 | | | | 18,110,581 |
| D-MARKET Elektronik Hizmetler ve Ticaret ADR † | | | 144,600 | | | | 100,020 |
| Turk Telekomunikasyon | | | 951,192 | | | | 892,537 |
| Turkcell Iletisim Hizmetleri | | | 2,427,827 | | | | 4,433,514 |
| Turkcell Iletisim Hizmetleri ADR | | | 4,449,485 | | | | 20,022,682 |
| Turkiye Sise ve Cam Fabrikalari | | | 7,651,443 | | | | 16,137,873 |
| | | | | | | | 59,697,207 |
34
Table of Contents
| | | Number of
shares | | | Value (US $) |
| Common Stocks∆ (continued) | | | | | | | |
| United Kingdom – 0.06% | | | | | | | |
| Griffin Mining † | | | 3,056,187 | | | $ | 2,615,263 |
| | | | | | | | 2,615,263 |
| United States – 1.72% | | | | | | | |
| Intel | | | 800,000 | | | | 24,056,000 |
| Micron Technology | | | 1,000,000 | | | | 57,650,000 |
| | | | | | | | 81,706,000 |
| Total Common Stocks (cost $5,018,208,721) | | | | | | | 4,678,573,986 |
| | | | | | | | |
| Preferred Stocks∆ – 1.88% | | | | | | | |
| Brazil – 0.81% | | | | | | | |
| Braskem Class A 6.95% ω | | | 1,470,000 | | | | 8,025,109 |
| Petroleo Brasileiro ADR 46.52% ω | | | 2,500,000 | | | | 25,625,000 |
Usinas Siderurgicas de Minas Gerais Usiminas
Class A 11.05% ω | | | 3,235,733 | | | | 4,832,384 |
| | | | | | | | 38,482,493 |
| Republic of Korea – 1.07% | | | | | | | |
| Samsung Electronics 2.66% ω | | | 1,183,100 | | | | 50,875,276 |
| | | | | | | | 50,875,276 |
| Russia – 0.00% | | | | | | | |
| Transneft PJSC =, ω | | | 12,000 | | | | 0 |
| | | | | | | | 0 |
| Total Preferred Stocks (cost $66,489,867) | | | | | | | 89,357,769 |
| | | | | | | | |
| Rights – 0.02% | | | | | | | |
| Brazil – 0.02% | | | | | | | |
| AES Brasil Energia | | | 516,085 | | | | 1,033,294 |
| Total Rights (cost $1,567,245) | | | | | | | 1,033,294 |
| | | | | | | | |
| Warrants – 0.01% | | | | | | | |
| Argentina – 0.01% | | | | | | | |
IRSA Inversiones y Representaciones,
exercise price $0.23, expiration date 3/5/26 † | | | 1,637,840 | | | | 376,539 |
| Total Warrants (cost $0) | | | | | | | 376,539 |
35
Table of Contents
Schedules of investments
Delaware Emerging Markets Fund
| | | Number of
shares | | | Value (US $) |
| Exchange-Traded Fund – 0.21% | | | | | | | |
| iShares MSCI Turkey ETF | | | 290,275 | | | $ | 9,956,433 |
Total Exchange-Traded Fund
(cost $13,207,352) | | | | | | | 9,956,433 |
| | | | | | | | |
| Participation Notes – 0.00% | | | | | | | |
Lehman Indian Oil
CW 12 LEPO =, † | | | 172,132 | | | | 0 |
Lehman Oil & Natural Gas
CW 12 LEPO =, † | | | 254,590 | | | | 0 |
Total Participation Notes
(cost $8,559,057) | | | | | | | 0 |
| | | | | | | | |
| Short-Term Investments – 0.09% | | | | | | | |
| Money Market Mutual Funds – 0.09% | | | | | | | |
BlackRock Liquidity FedFund – Institutional Shares
(seven-day effective yield 3.55%) | | | 1,020,171 | | | | 1,020,171 |
Fidelity Investments Money Market Government
Portfolio – Class I (seven-day effective yield
3.56%) | | | 1,020,171 | | | | 1,020,171 |
Goldman Sachs Financial Square Government Fund
– Institutional Shares (seven-day effective yield
3.80%) | | | 1,020,171 | | | | 1,020,171 |
Morgan Stanley Institutional Liquidity Funds
Government Portfolio – Institutional Class
(seven-day effective yield 3.62%) | | | 1,020,172 | | | | 1,020,172 |
| Total Short-Term Investments (cost $4,080,685) | | | | | | | 4,080,685 |
Total Value of Securities–100.72%
(cost $5,112,112,927) | | | | | | $ | 4,783,378,706 |
| ∆ | Securities have been classified by country of risk. Aggregate classification by business sector has been presented on page 25 in “Security type / country and sector allocations.” |
| † | Non-income producing security. |
| # | Security exempt from registration under Rule 144A of the Securities Act of 1933, as amended. At November 30, 2022, the aggregate value of Rule 144A securities was $169,512,284, which represents 3.57% of the Fund’s net assets. See Note 12 in “Notes to financial statements.” |
| = | The value of this security was determined using significant unobservable inputs and is reported as a Level 3 security in the disclosure table located in Note 3 in “Notes to financial statements.” |
36
Table of Contents
| ω | Perpetual security with no stated maturity date. |
Summary of abbreviations:
ADR – American Depositary Receipt
ETF – Exchange-Traded Fund
GDR – Global Depositary Receipt
LEPO – Low Exercise Price Option
MSCI – Morgan Stanley Capital International
PJSC – Private Joint Stock Company
See accompanying notes, which are an integral part of the financial statements.
37
Table of Contents
| Schedules of investments | |
| Delaware International Small Cap Fund | November 30, 2022 |
| | | Number of
shares | | | Value (US $) |
| Common Stocks – 97.28%∆ | | | | | | | |
| Argentina – 0.85% | | | | | | | |
| Arcos Dorados Holdings Class A | | | 80,785 | | | $ | 605,080 |
| | | | | | | | 605,080 |
| Australia – 3.39% | | | | | | | |
| HUB24 | | | 46,460 | | | | 865,580 |
| IPH | | | 101,309 | | | | 631,905 |
| Pro Medicus | | | 22,387 | | | | 922,819 |
| | | | | | | | 2,420,304 |
| Austria – 0.51% | | | | | | | |
Vienna Insurance Group AG Wiener Versicherung
Gruppe | | | 15,678 | | | | 367,424 |
| | | | | | | | 367,424 |
| Brazil – 4.63% | | | | | | | |
| 3R Petroleum Oleo e Gas † | | | 92,242 | | | | 655,018 |
| Arezzo Industria e Comercio | | | 18,741 | | | | 323,007 |
| Cielo | | | 395,963 | | | | 363,965 |
| Iguatemi | | | 76,806 | | | | 279,437 |
| Inter & Co. BDR | | | 53,043 | | | | 129,302 |
| JHSF Participacoes | | | 365,779 | | | | 390,495 |
| Petro Rio † | | | 120,251 | | | | 830,740 |
| SLC Agricola | | | 38,649 | | | | 333,659 |
| | | | | | | | 3,305,623 |
| Canada – 11.54% | | | | | | | |
| Aritzia † | | | 25,983 | | | | 988,403 |
| ATS † | | | 64,080 | | | | 2,135,126 |
| Capital Power | | | 41,727 | | | | 1,434,380 |
| Enerplus | | | 35,409 | | | | 658,350 |
| Granite Real Estate Investment Trust | | | 9,717 | | | | 575,659 |
| Jamieson Wellness | | | 27,059 | | | | 666,241 |
| Major Drilling Group International † | | | 88,584 | | | | 606,519 |
| SunOpta † | | | 72,879 | | | | 684,282 |
| Vermilion Energy | | | 25,351 | | | | 501,121 |
| | | | | | | | 8,250,081 |
| China – 1.09% | | | | | | | |
| CIMC Enric Holdings | | | 228,000 | | | | 246,266 |
| Xtep International Holdings | | | 464,500 | | | | 533,912 |
| | | | | | | | 780,178 |
38
Table of Contents
| | | Number of
shares | | | Value (US $) |
| Common Stocks∆ (continued) | | | | | | | |
| Denmark – 1.84% | | | | | | | |
| Jyske Bank † | | | 21,534 | | | $ | 1,318,072 |
| | | | | | | | 1,318,072 |
| Finland – 0.76% | | | | | | | |
| Valmet | | | 21,077 | | | | 544,812 |
| | | | | | | | 544,812 |
| France – 2.81% | | | | | | | |
| IPSOS | | | 15,156 | | | | 867,028 |
| Rothschild & Co. | | | 12,650 | | | | 496,027 |
| SOITEC † | | | 3,971 | | | | 645,954 |
| | | | | | | | 2,009,009 |
| Germany – 2.41% | | | | | | | |
| Befesa | | | 4,181 | | | | 178,645 |
| HUGO BOSS | | | 13,997 | | | | 787,393 |
| K+S | | | 34,182 | | | | 754,486 |
| | | | | | | | 1,720,524 |
| India – 5.60% | | | | | | | |
| Affle India † | | | 23,991 | | | | 373,923 |
| Federal Bank | | | 551,966 | | | | 897,024 |
| Varun Beverages | | | 146,224 | | | | 2,248,901 |
| Voltas | | | 47,422 | | | | 479,531 |
| | | | | | | | 3,999,379 |
| Indonesia – 0.67% | | | | | | | |
| AKR Corporindo | | | 5,436,000 | | | | 480,275 |
| | | | | | | | 480,275 |
| Ireland – 0.88% | | | | | | | |
| Glenveagh Properties † | | | 649,760 | | | | 626,106 |
| | | | | | | | 626,106 |
| Israel – 1.16% | | | | | | | |
| Inmode † | | | 21,618 | | | | 829,915 |
| | | | | | | | 829,915 |
| Italy – 3.33% | | | | | | | |
| Azimut Holding | | | 27,197 | | | | 554,268 |
| Brunello Cucinelli | | | 10,519 | | | | 696,343 |
| Reply | | | 6,232 | | | | 741,119 |
| Tinexta | | | 16,186 | | | | 388,969 |
| | | | | | | | 2,380,699 |
39
Table of Contents
Schedules of investments
Delaware International Small Cap Fund
| | | Number of
shares | | | Value (US $) |
| Common Stocks∆ (continued) | | | | | | | |
| Japan – 26.29% | | | | | | | |
| Amvis Holdings | | | 57,400 | | | $ | 1,357,300 |
| Asics | | | 71,700 | | | | 1,565,682 |
| BayCurrent Consulting | | | 27,000 | | | | 897,344 |
| dip | | | 26,300 | | | | 790,525 |
| DMG Mori | | | 64,600 | | | | 872,550 |
| Fujimi | | | 22,800 | | | | 1,181,115 |
| Fukuoka Financial Group | | | 70,300 | | | | 1,377,377 |
| IHI | | | 44,300 | | | | 1,222,524 |
| Insource | | | 36,700 | | | | 917,537 |
| JCR Pharmaceuticals | | | 20,300 | | | | 286,483 |
| JMDC | | | 16,300 | | | | 625,364 |
| Katitas | | | 25,100 | | | | 585,727 |
| Kissei Pharmaceutical | | | 18,500 | | | | 342,762 |
| Mebuki Financial Group | | | 609,100 | | | | 1,384,700 |
| Mitsui High-Tec | | | 10,100 | | | | 597,744 |
| SHO-BOND Holdings | | | 22,200 | | | | 982,906 |
| SMS | | | 33,900 | | | | 910,425 |
| TechnoPro Holdings | | | 54,900 | | | | 1,538,240 |
| Toho Titanium | | | 49,700 | | | | 1,001,310 |
| Tokyo Seimitsu | | | 10,800 | | | | 346,090 |
| | | | | | | | 18,783,705 |
| Malaysia – 0.37% | | | | | | | |
| Alliance Bank Malaysia | | | 300,700 | | | | 262,405 |
| | | | | | | | 262,405 |
| Mexico – 3.74% | | | | | | | |
| Banco del Bajio | | | 211,948 | | | | 688,661 |
| Corp. Inmobiliaria Vesta | | | 283,887 | | | | 634,015 |
| Grupo Aeroportuario del Centro Norte | | | 155,602 | | | | 1,350,771 |
| | | | | | | | 2,673,447 |
| Norway – 3.75% | | | | | | | |
| Aker Solutions | | | 156,404 | | | | 564,184 |
| Golar LNG † | | | 19,640 | | | | 492,375 |
| Subsea 7 | | | 63,809 | | | | 726,991 |
| TOMRA Systems | | | 46,805 | | | | 898,548 |
| | | | | | | | 2,682,098 |
| Republic of Korea – 2.27% | | | | | | | |
| CJ CheilJedang | | | 1,686 | | | | 508,532 |
| Hite Jinro | | | 17,912 | | | | 358,860 |
| LEENO Industrial | | | 3,557 | | | | 471,859 |
40
Table of Contents
| | | Number of
shares | | | Value (US $) |
| Common Stocks∆ (continued) | | | | | | | |
| Republic of Korea (continued) | | | | | | | |
| Samyang Foods | | | 3,297 | | | $ | 281,619 |
| | | | | | | | 1,620,870 |
| Russia – 0.01% | | | | | | | |
| Detsky Mir PJSC = | | | 188,399 | | | | 10,216 |
| | | | | | | | 10,216 |
| South Africa – 2.64% | | | | | | | |
| Clicks Group | | | 32,213 | | | | 549,956 |
| Motus Holdings | | | 97,723 | | | | 659,862 |
| Transaction Capital | | | 305,140 | | | | 674,855 |
| | | | | | | | 1,884,673 |
| Spain – 2.03% | | | | | | | |
| Banco de Sabadell | | | 901,876 | | | | 842,100 |
| Melia Hotels International † | | | 110,800 | | | | 609,120 |
| | | | | | | | 1,451,220 |
| Sweden – 1.74% | | | | | | | |
| Catena | | | 16,798 | | | | 597,794 |
| Fortnox | | | 142,273 | | | | 649,265 |
| | | | | | | | 1,247,059 |
| Taiwan – 1.96% | | | | | | | |
| Lotes | | | 31,000 | | | | 877,965 |
| Wafer Works | | | 342,000 | | | | 519,743 |
| | | | | | | | 1,397,708 |
| Thailand – 0.69% | | | | | | | |
| Land & Houses | | | 1,801,200 | | | | 490,331 |
| | | | | | | | 490,331 |
| United Kingdom – 9.19% | | | | | | | |
| Beazley | | | 107,599 | | | | 849,606 |
| Dechra Pharmaceuticals | | | 8,510 | | | | 281,061 |
| Future | | | 20,574 | | | | 352,163 |
| Grafton Group | | | 21,563 | | | | 202,730 |
| Inchcape | | | 93,947 | | | | 951,473 |
| Keywords Studios | | | 39,736 | | | | 1,421,740 |
| Pagegroup | | | 76,719 | | | | 443,248 |
| RS Group | | | 159,039 | | | | 1,768,758 |
| Savills | | | 25,719 | | | | 295,374 |
| | | | | | | | 6,566,153 |
41
Table of Contents
Schedules of investments
Delaware International Small Cap Fund
| | | Number of
shares | | | Value (US $) |
| Common Stocks∆ (continued) | | | | | | | |
| United States – 1.13% | | | | | | | |
| Noble † | | | 22,227 | | | $ | 807,022 |
| | | | | | | | 807,022 |
| Total Common Stocks (cost $64,169,587) | | | | | | | 69,514,388 |
| | | | | | | | |
| Short-Term Investments – 2.62% | | | | | | | |
| Money Market Mutual Funds – 2.62% | | | | | | | |
BlackRock Liquidity FedFund – Institutional Shares
(seven-day effective yield 3.55%) | | | 469,181 | | | | 469,181 |
Fidelity Investments Money Market Government
Portfolio – Class I (seven-day effective yield
3.56%) | | | 469,181 | | | | 469,181 |
Goldman Sachs Financial Square Government Fund
– Institutional Shares (seven-day effective yield
3.80%) | | | 469,181 | | | | 469,181 |
Morgan Stanley Institutional Liquidity Funds
Government Portfolio – Institutional Class
(seven-day effective yield 3.62%) | | | 469,181 | | | | 469,181 |
| Total Short-Term Investments (cost $1,876,724) | | | | | | | 1,876,724 |
Total Value of Securities–99.90%
(cost $66,046,311) | | | | | | $ | 71,391,112 |
| ∆ | Securities have been classified by country of risk. Aggregate classification by business sector has been presented on page 27 in “Security type / country and sector allocations.” |
| † | Non-income producing security. |
| = | The value of this security was determined using significant unobservable inputs and is reported as a Level 3 security in the disclosure table located in Note 3 in “Notes to financial statements.” |
The following foreign currency exchange contracts were outstanding at November 30, 2022:1
Foreign Currency Exchange Contracts
| Counterparty | | Currency to
Receive (Deliver) | | | In Exchange For | | | Settlement
Date | | Unrealized
Appreciation | | | Unrealized
Depreciation |
| BNYM | | JPY | (327,600) | | | USD | 2,366 | | | 12/1/22 | | $ | — | | | $ | (6) |
| BNYM | | JPY | (492,030) | | | USD | 3,527 | | | 12/2/22 | | | 1 | | | | — |
| Total Foreign Currency Exchange Contracts | | | | | $ | 1 | | | $ | (6) |
The use of foreign currency exchange contracts involves elements of market risk and risks in excess of the amounts disclosed in the financial statements. The foreign currency exchange contracts
42
Table of Contents
presented above represent the Fund’s total exposure in such contracts, whereas only the net unrealized appreciation (depreciation) is reflected in the Fund’s net assets.
| 1 | See Note 9 in “Notes to financial statements.” |
Summary of abbreviations:
AG – Aktiengesellschaft
BDR – Brazilian Depositary Receipt
BNYM – Bank of New York Mellon
PJSC – Private Joint Stock Company
Summary of currencies:
JPY – Japanese Yen
USD – US Dollar
See accompanying notes, which are an integral part of the financial statements.
43
Table of Contents
| Schedules of investments | |
| Delaware International Value Equity Fund | November 30, 2022 |
| | | |
Number of
shares | | | | Value (US $) |
| Common Stocks – 98.79%∆ | | | | | | | |
| Denmark – 4.64% | | | | | | | |
| Novo Nordisk Class B | | | 125,740 | | | $ | 15,772,591 |
| | | | | | | | 15,772,591 |
| France – 17.64% | | | | | | | |
| Air Liquide | | | 127,440 | | | | 18,554,131 |
| Danone | | | 231,170 | | | | 12,149,672 |
| Orange | | | 551,950 | | | | 5,608,451 |
| Publicis Groupe | | | 110,480 | | | | 7,271,399 |
| Sodexo | | | 171,060 | | | | 16,383,028 |
| | | | | | | | 59,966,681 |
| Germany – 12.66% | | | | | | | |
| adidas AG | | | 97,100 | | | | 12,516,966 |
| Fresenius Medical Care AG & Co. | | | 214,640 | | | | 6,713,241 |
| Knorr-Bremse | | | 132,280 | | | | 7,540,566 |
| SAP | | | 146,740 | | | | 16,281,780 |
| | | | | | | | 43,052,553 |
| Japan – 9.96% | | | | | | | |
| Asahi Group Holdings | | | 107,800 | | | | 3,457,348 |
| Kao | | | 316,300 | | | | 12,659,115 |
| KDDI | | | 172,100 | | | | 5,119,042 |
| Makita | | | 344,000 | | | | 7,924,234 |
| Seven & i Holdings | | | 115,100 | | | | 4,683,310 |
| | | | | | | | 33,843,049 |
| Netherlands – 6.11% | | | | | | | |
| Koninklijke Ahold Delhaize | | | 712,920 | | | | 20,775,994 |
| | | | | | | | 20,775,994 |
| Spain – 5.62% | | | | | | | |
| Amadeus IT Group † | | | 353,150 | | | | 19,093,942 |
| | | | | | | | 19,093,942 |
| Sweden – 10.13% | | | | | | | |
| Essity Class B | | | 534,990 | | | | 13,100,190 |
| H & M Hennes & Mauritz Class B | | | 552,770 | | | | 6,197,883 |
| Securitas Class B | | | 1,844,040 | | | | 15,126,419 |
| | | | | | | | 34,424,492 |
| Switzerland – 13.67% | | | | | | | |
| Nestle | | | 172,320 | | | | 20,510,148 |
| Roche Holding | | | 39,650 | | | | 12,950,637 |
| Swatch Group | | | 48,610 | | | | 13,007,399 |
| | | | | | | | 46,468,184 |
44
Table of Contents
| | | Number of
shares | | | Value (US $) |
| Common Stocks∆ (continued) | | | | | | | |
| United Kingdom – 18.36% | | | | | | | |
| Diageo | | | 448,930 | | | $ | 20,732,484 |
| Intertek Group | | | 209,500 | | | | 10,271,709 |
| Smith & Nephew | | | 1,338,210 | | | | 17,639,210 |
| Unilever | | | 275,560 | | | | 13,778,316 |
| | | | | | | | 62,421,719 |
| Total Common Stocks (cost $380,129,005) | | | | | | | 335,819,205 |
| | | | | | | | |
| Exchange-Traded Funds – 0.44% | | | | | | | |
| iShares MSCI EAFE ETF * | | | 1,030 | | | | 69,133 |
| iShares Trust iShares ESG Aware MSCI EAFE ETF * | | | 20,090 | | | | 1,352,057 |
| Vanguard FTSE Developed Markets ETF * | | | 1,580 | | | | 68,588 |
Total Exchange-Traded Funds
(cost $1,325,094) | | | | | | | 1,489,778 |
Total Value of Securities Before
Securities Lending Collateral–99.23%
(cost $381,454,099) | | | | | | | 337,308,983 |
| | | | | | | | |
| Securities Lending Collateral** – 0.07% | | | | | | | |
| Money Market Mutual Fund – 0.07% | | | | | | | |
Dreyfus Institutional Preference Government Money
Market Fund - Institutional Shares (seven-day
effective yield 3.88%) | | | 232,685 | | | | 232,685 |
Total Securities Lending Collateral
(cost $232,685) | | | | | | | 232,685 |
Total Value of Securities–99.30%
(cost $381,686,784) | | | | | | $ | 337,541,668■ |
| ∆ | Securities have been classified by country of risk. Aggregate classification by business sector has been presented on page 29 in “Security type / country and sector allocations.” |
| † | Non-income producing security. |
| * | Fully or partially on loan. |
| ** | See Note 11 in “Notes to financial statements” for additional information on securities lending collateral. |
| ■ | Includes $231,941 of securities loaned. |
45
Table of Contents
Schedules of investments
Delaware International Value Equity Fund
The following foreign currency exchange contracts were outstanding at November 30, 2022:1
Foreign Currency Exchange Contracts
| Counterparty | | Currency to
Receive (Deliver) | | | In Exchange For | | | Settlement
Date | | Unrealized
Appreciation | | | Unrealized
Depreciation | |
| BNYM | | CHF | (160,169) | | | USD | 168,444 | | | 12/2/22 | | $ | 296 | | | $ | — | |
| BNYM | | EUR | (254,704) | | | USD | 264,276 | | | 12/2/22 | | | 1,985 | | | | — | |
| BNYM | | GBP | (95,614) | | | USD | 114,307 | | | 12/1/22 | | | — | | | | (935 | ) |
| BNYM | | JPY | (22,055,588) | | | USD | 159,028 | | | 12/1/22 | | | — | | | | (708 | ) |
| BNYM | | SEK | (1,372,775) | | | USD | 130,202 | | | 12/2/22 | | | 1,460 | | | | — | |
| Total Foreign Currency Exchange Contracts | | | | | | | $ | 3,741 | | | $ | (1,643 | ) |
The use of foreign currency exchange contracts involves elements of market risk and risks in excess of the amounts disclosed in the financial statements. The foreign currency exchange contracts presented above represent the Fund’s total exposure in such contracts, whereas only the net unrealized appreciation (depreciation) is reflected in the Fund’s net assets.
| 1 | See Note 9 in “Notes to financial statements.” |
Summary of abbreviations:
AG – Aktiengesellschaft
BNYM – Bank of New York Mellon
EAFE – Europe, Australasia, and Far East
ESG – Environmental, Social, and Governance
ETF – Exchange-Traded Fund
FTSE – Financial Times Stock Exchange
MSCI – Morgan Stanley Capital International
Summary of currencies:
CHF – Swiss Franc
EUR – European Monetary Unit
GBP – British Pound Sterling
JPY – Japanese Yen
SEK – Swedish Krona
USD – US Dollar
See accompanying notes, which are an integral part of the financial statements.
46
Table of Contents
| Statement of assets and liabilities | |
| Delaware International Funds | November 30, 2022 |
| | |
| | | Delaware
Emerging
Markets Fund | | | Delaware
International
Small Cap Fund | | | Delaware
International
Value Equity Fund |
| Assets: | | | | | | | | |
| Investments, at value* | | $ | 4,783,378,706 | | | $ | 71,391,112 | | | $ | 337,308,983 |
Short-term investments held as
collateral for loaned securities, at
value= | | | — | | | | — | | | | 232,685 |
| Cash | | | 250,039 | | | | 2 | | | | — |
| Foreign currencies, at valueΔ | | | 1,950 | | | | 111,932 | | | | 311,345 |
| Receivable for fund shares sold | | | 21,786,754 | | | | 284,571 | | | | 588,966 |
| Dividends and interest receivable | | | 5,051,455 | | | | 137,744 | | | | 210,862 |
| Foreign tax reclaims receivable | | | 948,133 | | | | 125,700 | | | | 3,493,592 |
| Prepaid expenses | | | 17,841 | | | | 4,900 | | | | 4,154 |
| Receivable for securities sold | | | — | | | | — | | | | 839,989 |
Unrealized appreciation on foreign
currency exchange contracts | | | — | | | | 1 | | | | 3,741 |
| Securities lending income receivable | | | — | | | | — | | | | 7,214 |
| Other assets | | | 44,061 | | | | 723 | | | | 3,738 |
| Total Assets | | | 4,811,478,939 | | | | 72,056,685 | | | | 343,005,269 |
47
Table of Contents
Statement of assets and liabilities
Delaware International Funds
| | | Delaware
Emerging
Markets Fund | | | Delaware
International
Small Cap Fund | | | Delaware
International
Value Equity Fund | |
| Liabilities: | | | | | | | | | | | | |
| Due to custodian | | | — | | | | — | | | | 1,091,241 | |
| Payable for fund shares redeemed | | | 29,022,480 | | | | 161,955 | | | | 1,179,135 | |
Accrued capital gains taxes on
appreciated securities | | | 24,598,212 | | | | 278,925 | | | | — | |
| Other accrued expenses | | | 4,679,388 | | | | 114,070 | | | | 372,057 | |
Investment management fees
payable to affiliates | | | 3,649,226 | | | | 30,779 | | | | 164,325 | |
Administration expenses payable to
affiliates | | | 266,826 | | | | 9,377 | | | | 26,902 | |
| Distribution fees payable to affiliates | | | 100,032 | | | | 2,124 | | | | 32,708 | |
Obligation to return securities
lending collateral | | | — | | | | — | | | | 232,685 | |
Unrealized depreciation on foreign
currency exchange contracts | | | — | | | | 6 | | | | 1,643 | |
| Total Liabilities | | | 62,316,164 | | | | 597,236 | | | | 3,100,696 | |
| Total Net Assets | | $ | 4,749,162,775 | | | $ | 71,459,449 | | | $ | 339,904,573 | |
| Net Assets Consist of: | | | | | | | | | | | | |
| Paid-in capital | | $ | 5,127,305,429 | | | $ | 75,054,187 | | | $ | 395,690,078 | |
| Total distributable earnings (loss) | | | (378,142,654 | ) | | | (3,594,738 | ) | | | (55,785,505 | ) |
| Total Net Assets | | $ | 4,749,162,775 | | | $ | 71,459,449 | | | $ | 339,904,573 | |
48
Table of Contents
| | | Delaware
Emerging
Markets Fund | | | Delaware
International
Small Cap Fund | | | Delaware
International
Value Equity Fund | |
| Net Asset Value | | | | | | | | | | | | |
| Class A: | | | | | | | | | | | | |
| Net assets | | $ | 245,037,249 | | | $ | 6,653,456 | | | $ | 149,726,287 | |
Shares of beneficial interest
outstanding, unlimited authorization,
no par | | | 13,780,058 | | | | 970,224 | | | | 12,051,316 | |
| Net asset value per share | | $ | 17.78 | | | $ | 6.86 | | | $ | 12.42 | |
| Sales charge | | | 5.75 | % | | | 5.75 | % | | | 5.75 | % |
Offering price per share, equal to net
asset value per share /
(1 - sales charge) | | $ | 18.86 | | | $ | 7.28 | | | $ | 13.18 | |
| Class C: | | | | | | | | | | | | |
| Net assets | | $ | 56,937,664 | | | $ | 1,078,715 | | | $ | 3,312,773 | |
Shares of beneficial interest
outstanding, unlimited authorization,
no par | | | 3,505,737 | | | | 194,989 | | | | 270,275 | |
| Net asset value per share | | $ | 16.24 | | | $ | 5.53 | | | $ | 12.26 | |
| Class R: | | | | | | | | �� | | | | |
| Net assets | | $ | 21,501,663 | | | $ | 118,951 | | | $ | 1,454,243 | |
Shares of beneficial interest
outstanding, unlimited authorization,
no par | | | 1,203,393 | | | | 18,553 | | | | 117,530 | |
| Net asset value per share | | $ | 17.87 | | | $ | 6.41 | | | $ | 12.37 | |
| Institutional Class: | | | | | | | | | | | | |
| Net assets | | $ | 2,558,425,201 | | | $ | 50,571,765 | | | $ | 182,372,979 | |
Shares of beneficial interest
outstanding, unlimited authorization,
no par | | | 142,623,124 | | | | 6,956,079 | | | | 14,591,669 | |
| Net asset value per share | | $ | 17.94 | | | $ | 7.27 | | | $ | 12.50 | |
| Class R6: | | | | | | | | | | | | |
| Net assets | | $ | 1,867,260,998 | | | $ | 13,036,562 | | | $ | 3,038,291 | |
Shares of beneficial interest
outstanding, unlimited authorization,
no par | | | 103,935,694 | | | | 1,784,324 | | | | 242,822 | |
| Net asset value per share | | $ | 17.97 | | | $ | 7.31 | | | $ | 12.51 | |
| | | | | | | | | | | | | |
| * Investments, at cost | | $ | 5,112,112,927 | | | $ | 66,046,311 | | | $ | 381,454,099 | |
| † Including securities on loan | | | — | | | | — | | | | 231,941 | |
=Short-term investments held as collateral for
loaned securities, at cost | | | — | | | | — | | | | 232,685 | |
| ΔForeign currencies, at cost | | | 1,950 | | | | 104,787 | | | | 309,301 | |
See accompanying notes, which are an integral part of the financial statements.
49
Table of Contents
| Statements of operations | |
| Delaware International Funds | Year ended November 30, 2022 |
| | |
| | | Delaware Emerging
Markets Fund | | | Delaware
International
Small Cap Fund | | | Delaware
International
Value Equity Fund | |
| Investment Income: | | | | | | | | | | | | |
| Dividends | | $ | 237,356,471 | | | $ | 1,769,179 | | | $ | 11,323,473 | |
| Securities lending income | | | — | | | | — | | | | 78,290 | |
| Foreign tax withheld | | | (19,235,037 | ) | | | (200,644 | ) | | | (1,340,000 | ) |
| | | | 218,121,434 | | | | 1,568,535 | | | | 10,061,763 | |
| | | | | | | | | | | | | |
| Expenses: | | | | | | | | | | | | |
| Management fees | | | 61,282,918 | | | | 712,493 | | | | 3,565,941 | |
| Distribution expenses — Class A | | | 717,813 | | | | 18,312 | | | | 423,946 | |
| Distribution expenses — Class C | | | 780,067 | | | | 13,308 | | | | 38,493 | |
| Distribution expenses — Class R | | | 132,850 | | | | 645 | | | | 11,970 | |
| Custodian fees | | | 5,089,987 | | | | 57,290 | | | | 134,530 | |
Dividend disbursing and transfer
agent fees and expenses | | | 4,795,103 | | | | 128,110 | | | | 576,870 | |
| Accounting and administration expenses | | | 819,567 | | | | 50,758 | | | | 96,946 | |
Reports and statements to
shareholders expenses | | | 640,541 | | | | 19,448 | | | | 65,463 | |
| Legal fees | | | 319,717 | | | | 5,834 | | | | 28,382 | |
| Trustees’ fees and expenses | | | 233,375 | | | | 3,810 | | | | 21,716 | |
| Registration fees | | | 176,843 | | | | 38,932 | | | | 44,754 | |
| Audit and tax fees | | | 51,151 | | | | 39,381 | | | | 35,186 | |
| Other | | | 369,571 | | | | 38,061 | | | | 54,210 | |
| | | | 75,409,503 | | | | 1,126,382 | | | | 5,098,407 | |
| Less expenses waived | | | (7,717,166 | ) | | | (189,486 | ) | | | (926,789 | ) |
| Less expenses paid indirectly | | | (1,331 | ) | | | (53 | ) | | | (876 | ) |
| Total operating expenses | | | 67,691,006 | | | | 936,843 | | | | 4,170,742 | |
| Net Investment Income (Loss) | | | 150,430,428 | | | | 631,692 | | | | 5,891,021 | |
50
Table of Contents
| | | Delaware Emerging
Markets Fund | | | Delaware
International
Small Cap Fund | | | Delaware
International
Value Equity Fund | |
Net Realized and Unrealized Gain
(Loss): | | | | | | | | | | | | |
| Net realized gain (loss) on: | | | | | | | | | | | | |
| Investments | | $ | 110,727,506 | | | $ | (8,162,302 | ) | | $ | (11,603,515 | ) |
| Foreign currencies | | | (2,297,143 | ) | | | (1,411 | ) | | | 89,320 | |
Foreign currency exchange
contracts | | | (600,540 | ) | | | (140,067 | ) | | | (508,868 | ) |
| Net realized gain (loss) | | | 107,829,823 | | | | (8,303,780 | ) | | | (12,023,063 | ) |
| | | | | | | | | | | | | |
Net change in unrealized
appreciation (depreciation) on: | | | | | | | | | | | | |
| Investments1 | | | (1,799,369,698 | ) | | | (17,758,890 | ) | | | (58,193,754 | ) |
| Foreign currencies | | | (7,038 | ) | | | 183,692 | | | | (205,142 | ) |
Foreign currency exchange
contracts | | | — | | | | 9,579 | | | | (145 | ) |
Net change in unrealized
appreciation (depreciation) | | | (1,799,376,736 | ) | | | (17,565,619 | ) | | | (58,399,041 | ) |
Net Realized and Unrealized Gain
(Loss) | | | (1,691,546,913 | ) | | | (25,869,399 | ) | | | (70,422,104 | ) |
Net Increase (Decrease) in Net
Assets Resulting from Operations | | $ | (1,541,116,485 | ) | | $ | (25,237,707 | ) | | $ | (64,531,083 | ) |
| 1 | Includes $5,503 capital gains taxes paid and $24,598,212 increase in capital gains tax accrued for Delaware Emerging Markets Fund. Includes $59,258 capital gains taxes paid and $278,925 increase in capital gains tax accrued in Delaware International Small Cap Fund. |
See accompanying notes, which are an integral part of the financial statements.
51
Table of Contents
Statements of changes in net assets
Delaware Emerging Markets Fund
| | | Year ended | |
| | | 11/30/22 | | | 11/30/21 | |
| Increase (Decrease) in Net Assets from Operations: | | | | | | | | |
| Net investment income (loss) | | $ | 150,430,428 | | | $ | 156,538,358 | |
| Net realized gain (loss) | | | 107,829,823 | | | | (156,114,409 | ) |
| Net change in unrealized appreciation (depreciation) | | | (1,799,376,736 | ) | | | 92,516,904 | |
Net increase (decrease) in net assets resulting from
operations | | | (1,541,116,485 | ) | | | 92,940,853 | |
| | | | | | | | | |
| Dividends and Distributions to Shareholders from: | | | | | | | | |
| Distributable earnings: | | | | | | | | |
| Class A | | | (11,495,718 | ) | | | (2,191,579 | ) |
| Class C | | | (2,720,160 | ) | | | (777,266 | ) |
| Class R | | | (970,357 | ) | | | (233,457 | ) |
| Institutional Class | | | (126,884,607 | ) | | | (31,453,917 | ) |
| Class R6 | | | (77,102,849 | ) | | | (9,680,857 | ) |
| | | | (219,173,691 | ) | | | (44,337,076 | ) |
| | | | | | | | | |
| Capital Share Transactions: | | | | | | | | |
| Proceeds from shares sold: | | | | | | | | |
| Class A | | | 46,849,373 | | | | 92,377,068 | |
| Class C | | | 4,865,541 | | | | 18,657,537 | |
| Class R | | | 5,036,699 | | | | 8,550,198 | |
| Institutional Class | | | 1,368,023,503 | | | | 1,680,473,003 | |
| Class R6 | | | 792,353,512 | | | | 1,503,974,331 | |
| | | | | | | | | |
Net asset value of shares issued upon reinvestment of
dividends and distributions: | | | | | | | | |
| Class A | | | 10,843,302 | | | | 2,086,866 | |
| Class C | | | 2,673,584 | | | | 767,990 | |
| Class R | | | 968,937 | | | | 233,456 | |
| Institutional Class | | | 109,901,498 | | | | 28,046,095 | |
| Class R6 | | | 58,294,682 | | | | 6,192,889 | |
| | | | 2,399,810,631 | | | | 3,341,359,433 | |
52
Table of Contents
| | | Year ended | |
| | | 11/30/22 | | | 11/30/21 | |
| Capital Share Transactions (continued): | | | | | | | | |
| Cost of shares redeemed: | | | | | | | | |
| Class A | | $ | (79,423,854 | ) | | $ | (103,991,549 | ) |
| Class C | | | (29,368,263 | ) | | | (35,479,357 | ) |
| Class R | | | (9,850,103 | ) | | | (14,381,448 | ) |
| Institutional Class | | | (1,631,203,316 | ) | | | (2,119,024,485 | ) |
| Class R6 | | | (561,020,053 | ) | | | (427,423,318 | ) |
| | | | (2,310,865,589 | ) | | | (2,700,300,157 | ) |
Increase in net assets derived from capital share
transactions | | | 88,945,042 | | | | 641,059,276 | |
| Net Increase (Decrease) in Net Assets | | | (1,671,345,134 | ) | | | 689,663,053 | |
| | | | | | | | | |
| Net Assets: | | | | | | | | |
| Beginning of year | | | 6,420,507,909 | | | | 5,730,844,856 | |
| End of year | | $ | 4,749,162,775 | | | $ | 6,420,507,909 | |
See accompanying notes, which are an integral part of the financial statements.
53
Table of Contents
Statements of changes in net assets
Delaware International Small Cap Fund
| | | Year ended | |
| | | 11/30/22 | | | 11/30/21 | |
| Increase (Decrease) in Net Assets from Operations: | | | | | | | | |
| Net investment income (loss) | | $ | 631,692 | | | $ | (150,444 | ) |
| Net realized gain (loss) | | | (8,303,780 | ) | | | 20,996,217 | |
| Net change in unrealized appreciation (depreciation) | | | (17,565,619 | ) | | | (8,269,409 | ) |
Net increase (decrease) in net assets resulting from
operations | | | (25,237,707 | ) | | | 12,576,364 | |
| | | | | | | | | |
| Dividends and Distributions to Shareholders from: | | | | | | | | |
| Distributable earnings: | | | | | | | | |
| Class A | | | (537,844 | ) | | | — | |
| Class C | | | (134,364 | ) | | | — | |
| Class R | | | (9,570 | ) | | | — | |
| Institutional Class | | | (3,918,467 | ) | | | — | |
| Class R6 | | | (1,085,639 | ) | | | — | |
| | | | (5,685,884 | ) | | | — | |
| | | | | | | | | |
| Capital Share Transactions: | | | | | | | | |
| Proceeds from shares sold: | | | | | | | | |
| Class A | | | 749,135 | | | | 3,088,137 | |
| Class C | | | 135,109 | | | | 58,611 | |
| Class R | | | 1,690 | | | | 8,558 | |
| Institutional Class | | | 11,758,545 | | | | 9,773,696 | |
| Class R6 | | | 9,124,027 | | | | 8,484,030 | |
| | | | | | | | | |
Net asset value of shares issued upon reinvestment of
dividends and distributions: | | | | | | | | |
| Class A | | | 535,765 | | | | — | |
| Class C | | | 134,364 | | | | — | |
| Class R | | | 9,291 | | | | — | |
| Institutional Class | | | 3,207,637 | | | | — | |
| Class R6 | | | 926,317 | | | | — | |
| | | | 26,581,880 | | | | 21,413,032 | |
54
Table of Contents
| | | Year ended | |
| | | 11/30/22 | | | 11/30/21 | |
| Capital Share Transactions (continued): | | | | | | | | |
| Cost of shares redeemed: | | | | | | | | |
| Class A | | $ | (1,447,444 | ) | | $ | (1,863,927 | ) |
| Class C | | | (591,200 | ) | | | (1,507,039 | ) |
| Class R | | | (3,873 | ) | | | (218,860 | ) |
| Institutional Class | | | (16,937,244 | ) | | | (38,037,501 | ) |
| Class R6 | | | (11,589,608 | ) | | | (774,529 | ) |
| | | | (30,569,369 | ) | | | (42,401,856 | ) |
Decrease in net assets derived from capital share
transactions | | | (3,987,489 | ) | | | (20,988,824 | ) |
| Net Decrease in Net Assets | | | (34,911,080 | ) | | | (8,412,460 | ) |
| | | | | | | | | |
| Net Assets: | | | | | | | | |
| Beginning of year | | | 106,370,529 | | | | 114,782,989 | |
| End of year | | $ | 71,459,449 | | | $ | 106,370,529 | |
See accompanying notes, which are an integral part of the financial statements.
55
Table of Contents
Statements of changes in net assets
Delaware International Value Equity Fund
| | | Year ended | |
| | | 11/30/22 | | | 11/30/21 | |
| Increase (Decrease) in Net Assets from Operations: | | | | | | | | |
| Net investment income (loss) | | $ | 5,891,021 | | | $ | 4,313,241 | |
| Net realized gain (loss) | | | (12,023,063 | ) | | | 35,264,594 | |
| Net change in unrealized appreciation (depreciation) | | | (58,399,041 | ) | | | (37,804,581 | ) |
Net increase (decrease) in net assets resulting from
operations | | | (64,531,083 | ) | | | 1,773,254 | |
| | | | | | | | | |
| Dividends and Distributions to Shareholders from: | | | | | | | | |
| Distributable earnings: | | | | | | | | |
| Class A | | | (14,729,181 | ) | | | (962,517 | ) |
| Class C | | | (306,886 | ) | | | (45,886 | ) |
| Class R | | | (356,285 | ) | | | (40,540 | ) |
| Institutional Class | | | (23,946,215 | ) | | | (4,611,994 | ) |
| Class R6 | | | (285,342 | ) | | | (30,364 | ) |
| | | | (39,623,909 | ) | | | (5,691,301 | ) |
| | | | | | | | | |
| Capital Share Transactions: | | | | | | | | |
| Proceeds from shares sold: | | | | | | | | |
| Class A | | | 9,932,088 | | | | 60,313,862 | |
| Class C | | | 771,488 | | | | 472,619 | |
| Class R | | | 676,446 | | | | 3,436,609 | |
| Institutional Class | | | 69,276,100 | | | | 71,593,274 | |
| Class R6 | | | 2,079,275 | | | | 2,720,260 | |
| | | | | | | | | |
| Net assets from merger: | | | | | | | | |
| Class A | | | — | | | | 123,151,872 | |
| Institutional Class | | | — | | | | 130,443,502 | |
| Class R6 | | | — | | | | 184,692 | |
| | | | | | | | | |
Net asset value of shares issued upon reinvestment of
dividends and distributions: | | | | | | | | |
| Class A | | | 14,648,038 | | | | 943,519 | |
| Class C | | | 306,886 | | | | 45,884 | |
| Class R | | | 356,284 | | | | 40,540 | |
| Institutional Class | | | 23,920,676 | | | | 4,604,032 | |
| Class R6 | | | 179,980 | | | | 5,491 | |
| | | | 122,147,261 | | | | 397,956,156 | |
56
Table of Contents
| | | Year ended | |
| | | 11/30/22 | | | 11/30/21 | |
| Capital Share Transactions (continued): | | | | | | | | |
| Cost of shares redeemed: | | | | | | | | |
| Class A | | $ | (35,385,407 | ) | | $ | (34,560,175 | ) |
| Class C | | | (1,359,836 | ) | | | (2,430,458 | ) |
| Class R | | | (3,925,580 | ) | | | (1,496,630 | ) |
| Institutional Class | | | (168,887,802 | ) | | | (140,588,542 | ) |
| Class R6 | | | (1,883,966 | ) | | | (666,061 | ) |
| | | | (211,442,591 | ) | | | (179,741,866 | ) |
Increase (decrease) in net assets derived from capital
share transactions | | | (89,295,330 | ) | | | 218,214,290 | |
| Net Increase (Decrease) in Net Assets | | | (193,450,322 | ) | | | 214,296,243 | |
| | | | | | | | | |
| Net Assets: | | | | | | | | |
| Beginning of year | | | 533,354,895 | | | | 319,058,652 | |
| End of year | | $ | 339,904,573 | | | $ | 533,354,895 | |
See accompanying notes, which are an integral part of the financial statements.
57
Table of Contents
Financial highlights
Delaware Emerging Markets Fund Class A
Selected data for each share of the Fund outstanding throughout each period were as follows:
| Net asset value, beginning of period |
| |
| Income (loss) from investment operations: |
| Net investment income1 |
| Net realized and unrealized gain (loss) |
| Total from investment operations |
| |
| Less dividends and distributions from: |
| Net investment income |
| Net realized gain |
| Total dividends and distributions |
| |
| Net asset value, end of period |
| |
| Total return2 |
| |
| Ratios and supplemental data: |
| Net assets, end of period (000 omitted) |
| Ratio of expenses to average net assets4 |
| Ratio of expenses to average net assets prior to fees waived4 |
| Ratio of net investment income to average net assets |
| Ratio of net investment income to average net assets prior to fees waived |
| Portfolio turnover |
| 1 | Calculated using average shares outstanding. |
| 2 | Total return is based on the change in net asset value of a share during the period and assumes reinvestment of dividends and distributions at net asset value and does not reflect the impact of a sales charge. |
| 3 | Total return during the period reflects waivers by the manager and/or distributor. Performance would have been lower had the waivers not been in effect. |
| 4 | Expense ratios do not include expenses of any investment companies in which the Fund invests. |
See accompanying notes, which are an integral part of the financial statements.
58
Table of Contents
| | Year ended | |
| | 11/30/22 | | | 11/30/21 | | | 11/30/20 | | | 11/30/19 | | | 11/30/18 | |
| | $ | 24.14 | | | $ | 23.67 | | | $ | 19.13 | | | $ | 17.53 | | | $ | 20.10 | |
| | | | | | | | | | | | | | | | | | | | |
| | | | | | | | | | | | | | | | | | | | |
| | | 0.50 | | | | 0.54 | | | | 0.04 | | | | 0.11 | | | | 0.07 | |
| | | (6.09 | ) | | | 0.07 | | | | 4.62 | | | | 1.55 | | | | (2.32 | ) |
| | | (5.59 | ) | | | 0.61 | | | | 4.66 | | | | 1.66 | | | | (2.25 | ) |
| | | | | | | | | | | | | | | | | | | | |
| | | | | | | | | | | | | | | | | | | | |
| | | (0.77 | ) | | | — | | | | (0.12 | ) | | | (0.06 | ) | | | (0.32 | ) |
| | | — | | | | (0.14 | ) | | | — | | | | — | | | | — | |
| | | (0.77 | ) | | | (0.14 | ) | | | (0.12 | ) | | | (0.06 | ) | | | (0.32 | ) |
| | | | | | | | | | | | | | | | | | | | |
| | $ | 17.78 | | | $ | 24.14 | | | $ | 23.67 | | | $ | 19.13 | | | $ | 17.53 | |
| | | | | | | | | | | | | | | | | | | | |
| | | (23.97% | )3 | | | 2.57% | 3 | | | 24.44% | 3 | | | 9.50% | | | | (11.40% | ) |
| | | | | | | | | | | | | | | | | | | | |
| | | | | | | | | | | | | | | | | | | | |
| | $ | 245,037 | | | $ | 361,528 | | | $ | 364,314 | | | $ | 346,732 | | | $ | 353,094 | |
| | | 1.51% | | | | 1.57% | | | | 1.62% | | | | 1.63% | | | | 1.63% | |
| | | 1.66% | | | | 1.59% | | | | 1.63% | | | | 1.63% | | | | 1.63% | |
| | | 2.54% | | | | 2.08% | | | | 0.21% | | | | 0.62% | | | | 0.35% | |
| | | 2.39% | | | | 2.06% | | | | 0.20% | | | | 0.62% | | | | 0.35% | |
| | | 11% | | | | 4% | | | | 5% | | | | 10% | | | | 11% | |
59
Table of Contents
Financial highlights
Delaware Emerging Markets Fund Class C
Selected data for each share of the Fund outstanding throughout each period were as follows:
| Net asset value, beginning of period |
| |
| Income (loss) from investment operations: |
| Net investment income (loss)1 |
| Net realized and unrealized gain (loss) |
| Total from investment operations |
| |
| Less dividends and distributions from: |
| Net investment income |
| Net realized gain |
| Total dividends and distributions |
| |
| Net asset value, end of period |
| |
| Total return2 |
| |
| Ratios and supplemental data: |
| Net assets, end of period (000 omitted) |
| Ratio of expenses to average net assets4 |
| Ratio of expenses to average net assets prior to fees waived4 |
| Ratio of net investment income (loss) to average net assets |
| Ratio of net investment income (loss) to average net assets prior to fees waived |
| Portfolio turnover |
| 1 | Calculated using average shares outstanding. |
| 2 | Total return is based on the change in net asset value of a share during the period and assumes reinvestment of dividends and distributions at net asset value and does not reflect the impact of a sales charge. |
| 3 | Total return during the period reflects waivers by the manager and/or distributor. Performance would have been lower had the waivers not been in effect. |
| 4 | Expense ratios do not include expenses of any investment companies in which the Fund invests. |
See accompanying notes, which are an integral part of the financial statements.
60
Table of Contents
| | Year ended | |
| | 11/30/22 | | | 11/30/21 | | | 11/30/20 | | | 11/30/19 | | | 11/30/18 | |
| | $ | 22.09 | | | $ | 21.83 | | | $ | 17.67 | | | $ | 16.26 | | | $ | 18.68 | |
| | | | | | | | | | | | | | | | | | | | |
| | | | | | | | | | | | | | | | | | | | |
| | | 0.33 | | | | 0.32 | | | | (0.10 | ) | | | (0.02 | ) | | | (0.07 | ) |
| | | (5.60 | ) | | | 0.08 | | | | 4.26 | | | | 1.43 | | | | (2.16 | ) |
| | | (5.27 | ) | | | 0.40 | | | | 4.16 | | | | 1.41 | | | | (2.23 | ) |
| | | | | | | | | | | | | | | | | | | | |
| | | | | | | | | | | | | | | | | | | | |
| | | (0.58 | ) | | | — | | | | — | | | | — | | | | (0.19 | ) |
| | | — | | | | (0.14 | ) | | | — | | | | — | | | | — | |
| | | (0.58 | ) | | | (0.14 | ) | | | — | | | | — | | | | (0.19 | ) |
| | | | | | | | | | | | | | | | | | | | |
| | $ | 16.24 | | | $ | 22.09 | | | $ | 21.83 | | | $ | 17.67 | | | $ | 16.26 | |
| | | | | | | | | | | | | | | | | | | | |
| | | (24.56% | )3 | | | 1.82% | 3 | | | 23.54% | 3 | | | 8.67% | | | | (12.05% | ) |
| | | | | | | | | | | | | | | | | | | | |
| | | | | | | | | | | | | | | | | | | | |
| | $ | 56,938 | | | $ | 105,474 | | | $ | 118,977 | | | $ | 135,346 | | | $ | 152,857 | |
| | | 2.26% | | | | 2.32% | | | | 2.37% | | | | 2.38% | | | | 2.38% | |
| | | 2.41% | | | | 2.34% | | | | 2.38% | | | | 2.38% | | | | 2.38% | |
| | | 1.79% | | | | 1.33% | | | | (0.54% | ) | | | (0.13% | ) | | | (0.40% | ) |
| | | 1.64% | | | | 1.31% | | | | (0.55% | ) | | | (0.13% | ) | | | (0.40% | ) |
| | | 11% | | | | 4% | | | | 5% | | | | 10% | | | | 11% | |
61
Table of Contents
Financial highlights
Delaware Emerging Markets Fund Class R
Selected data for each share of the Fund outstanding throughout each period were as follows:
| Net asset value, beginning of period |
| |
| Income (loss) from investment operations: |
| Net investment income (loss)1 |
| Net realized and unrealized gain (loss) |
| Total from investment operations |
| |
| Less dividends and distributions from: |
| Net investment income |
| Net realized gain |
| Total dividends and distributions |
| |
| Net asset value, end of period |
| |
| Total return3 |
| |
| Ratios and supplemental data: |
| Net assets, end of period (000 omitted) |
| Ratio of expenses to average net assets5 |
| Ratio of expenses to average net assets prior to fees waived5 |
| Ratio of net investment income (loss) to average net assets |
| Ratio of net investment income (loss) to average net assets prior to fees waived |
| Portfolio turnover |
| 1 | Calculated using average shares outstanding. |
| 2 | Amount is less than $0.005 per share. |
| 3 | Total return is based on the change in net asset value of a share during the period and assumes reinvestment of dividends and distributions at net asset value. |
| 4 | Total return during the period reflects waivers by the manager and/or distributor. Performance would have been lower had the waivers not been in effect. |
| 5 | Expense ratios do not include expenses of any investment companies in which the Fund invests. |
See accompanying notes, which are an integral part of the financial statements.
62
Table of Contents
| | Year ended | |
| | 11/30/22 | | | 11/30/21 | | | 11/30/20 | | | 11/30/19 | | | 11/30/18 | |
| | $ | 24.24 | | | $ | 23.82 | | | $ | 19.25 | | | $ | 17.62 | | | $ | 20.21 | |
| | | | | | | | | | | | | | | | | | | | |
| | | | | | | | | | | | | | | | | | | | |
| | | 0.46 | | | | 0.48 | | | | (0.01 | ) | | | 0.07 | | | | 0.02 | |
| | | (6.14 | ) | | | 0.08 | | | | 4.64 | | | | 1.56 | | | | (2.34 | ) |
| | | (5.68 | ) | | | 0.56 | | | | 4.63 | | | | 1.63 | | | | (2.32 | ) |
| | | | | | | | | | | | | | | | | | | | |
| | | | | | | | | | | | | | | | | | | | |
| | | (0.69 | ) | | | — | | | | (0.06 | ) | | | — | 2 | | | (0.27 | ) |
| | | — | | | | (0.14 | ) | | | — | | | | — | | | | — | |
| | | (0.69 | ) | | | (0.14 | ) | | | (0.06 | ) | | | — | | | | (0.27 | ) |
| | | | | | | | | | | | | | | | | | | | |
| | $ | 17.87 | | | $ | 24.24 | | | $ | 23.82 | | | $ | 19.25 | | | $ | 17.62 | |
| | | | | | | | | | | | | | | | | | | | |
| | | (24.15% | )4 | | | 2.34% | 4 | | | 24.11% | 4 | | | 9.28% | | | | (11.64% | ) |
| | | | | | | | | | | | | | | | | | | | |
| | | | | | | | | | | | | | | | | | | | |
| | $ | 21,502 | | | $ | 34,148 | | | $ | 38,689 | | | $ | 43,962 | | | $ | 48,875 | |
| | | 1.76% | | | | 1.82% | | | | 1.87% | | | | 1.88% | | | | 1.88% | |
| | | 1.91% | | | | 1.84% | | | | 1.88% | | | | 1.88% | | | | 1.88% | |
| | | 2.29% | | | | 1.83% | | | | (0.04% | ) | | | 0.37% | | | | 0.10% | |
| | | 2.14% | | | | 1.81% | | | | (0.05% | ) | | | 0.37% | | | | 0.10% | |
| | | 11% | | | | 4% | | | | 5% | | | | 10% | | | | 11% | |
63
Table of Contents
Financial highlights
Delaware Emerging Markets Fund Institutional Class
Selected data for each share of the Fund outstanding throughout each period were as follows:
| Net asset value, beginning of period |
| |
| Income (loss) from investment operations: |
| Net investment income1 |
| Net realized and unrealized gain (loss) |
| Total from investment operations |
| |
| Less dividends and distributions from: |
| Net investment income |
| Net realized gain |
| Total dividends and distributions |
| |
| Net asset value, end of period |
| |
| Total return2 |
| |
| Ratios and supplemental data: |
| Net assets, end of period (000 omitted) |
| Ratio of expenses to average net assets4 |
| Ratio of expenses to average net assets prior to fees waived4 |
| Ratio of net investment income to average net assets |
| Ratio of net investment income to average net assets prior to fees waived |
| Portfolio turnover |
| 1 | Calculated using average shares outstanding. |
| 2 | Total return is based on the change in net asset value of a share during the period and assumes reinvestment of dividends and distributions at net asset value. |
| 3 | Total return during the period reflects waivers by the manager and/or distributor. Performance would have been lower had the waivers not been in effect. |
| 4 | Expense ratios do not include expenses of any investment companies in which the Fund invests. |
See accompanying notes, which are an integral part of the financial statements.
64
Table of Contents
| | Year ended | |
| | 11/30/22 | | | 11/30/21 | | | 11/30/20 | | | 11/30/19 | | | 11/30/18 | |
| | $ | 24.35 | | | $ | 23.85 | | | $ | 19.27 | | | $ | 17.67 | | | $ | 20.26 | |
| | | | | | | | | | | | | | | | | | | | |
| | | | | | | | | | | | | | | | | | | | |
| | | 0.55 | | | | 0.61 | | | | 0.09 | | | | 0.16 | | | | 0.12 | |
| | | (6.13 | ) | | | 0.07 | | | | 4.66 | | | | 1.55 | | | | (2.34 | ) |
| | | (5.58 | ) | | | 0.68 | | | | 4.75 | | | | 1.71 | | | | (2.22 | ) |
| | | | | | | | | | | | | | | | | | | | |
| | | | | | | | | | | | | | | | | | | | |
| | | (0.83 | ) | | | (0.04 | ) | | | (0.17 | ) | | | (0.11 | ) | | | (0.37 | ) |
| | | — | | | | (0.14 | ) | | | — | | | | — | | | | — | |
| | | (0.83 | ) | | | (0.18 | ) | | | (0.17 | ) | | | (0.11 | ) | | | (0.37 | ) |
| | | | | | | | | | | | | | | | | | | | |
| | $ | 17.94 | | | $ | 24.35 | | | $ | 23.85 | | | $ | 19.27 | | | $ | 17.67 | |
| | | | | | | | | | | | | | | | | | | | |
| | | (23.76% | )3 | | | 2.84% | 3 | | | 24.76% | 3 | | | 9.79% | | | | (11.21% | ) |
| | | | | | | | | | | | | | | | | | | | |
| | | | | | | | | | | | | | | | | | | | |
| | $ | 2,558,425 | | | $ | 3,728,519 | | | $ | 4,078,412 | | | $ | 3,826,272 | | | $ | 4,189,528 | |
| | | 1.26% | | | | 1.32% | | | | 1.37% | | | | 1.38% | | | | 1.38% | |
| | | 1.41% | | | | 1.34% | | | | 1.38% | | | | 1.38% | | | | 1.38% | |
| | | 2.79% | | | | 2.33% | | | | 0.46% | | | | 0.87% | | | | 0.60% | |
| | | 2.64% | | | | 2.31% | | | | 0.45% | | | | 0.87% | | | | 0.60% | |
| | | 11% | | | | 4% | | | | 5% | | | | 10% | | | | 11% | |
65
Table of Contents
Financial highlights
Delaware Emerging Markets Fund Class R6
Selected data for each share of the Fund outstanding throughout each period were as follows:
| Net asset value, beginning of period |
| |
| Income (loss) from investment operations: |
| Net investment income1 |
| Net realized and unrealized gain (loss) |
| Total from investment operations |
| |
| Less dividends and distributions from: |
| Net investment income |
| Net realized gain |
| Total dividends and distributions |
| |
| Net asset value, end of period |
| |
| Total return2 |
| |
| Ratios and supplemental data: |
| Net assets, end of period (000 omitted) |
| Ratio of expenses to average net assets4 |
| Ratio of expenses to average net assets prior to fees waived4 |
| Ratio of net investment income to average net assets |
| Ratio of net investment income to average net assets prior to fees waived |
| Portfolio turnover |
| 1 | Calculated using average shares outstanding. |
| 2 | Total return is based on the change in net asset value of a share during the period and assumes reinvestment of dividends and distributions at net asset value. |
| 3 | Total return during the period reflects waivers by the manager and/or distributor. Performance would have been lower had the waivers not been in effect. |
| 4 | Expense ratios do not include expenses of any investment companies in which the Fund invests. |
See accompanying notes, which are an integral part of the financial statements.
66
Table of Contents
| | Year ended | |
| | 11/30/22 | | | 11/30/21 | | | 11/30/20 | | | 11/30/19 | | | 11/30/18 | |
| | $ | 24.38 | | | $ | 23.88 | | | $ | 19.28 | | | $ | 17.69 | | | $ | 20.27 | |
| | | | | | | | | | | | | | | | | | | | |
| | | | | | | | | | | | | | | | | | | | |
| | | 0.57 | | | | 0.64 | | | | 0.12 | | | | 0.18 | | | | 0.14 | |
| | | (6.13 | ) | | | 0.07 | | | | 4.66 | | | | 1.54 | | | | (2.33 | ) |
| | | (5.56 | ) | | | 0.71 | | | | 4.78 | | | | 1.72 | | | | (2.19 | ) |
| | | | | | | | | | | | | | | | | | | | |
| | | | | | | | | | | | | | | | | | | | |
| | | (0.85 | ) | | | (0.07 | ) | | | (0.18 | ) | | | (0.13 | ) | | | (0.39 | ) |
| | | — | | | | (0.14 | ) | | | — | | | | — | | | | — | |
| | | (0.85 | ) | | | (0.21 | ) | | | (0.18 | ) | | | (0.13 | ) | | | (0.39 | ) |
| | | | | | | | | | | | | | | | | | | | |
| | $ | 17.97 | | | $ | 24.38 | | | $ | 23.88 | | | $ | 19.28 | | | $ | 17.69 | |
| | | | | | | | | | | | | | | | | | | | |
| | | (23.67% | )3 | | | 2.94% | 3 | | | 24.93% | 3 | | | 9.84% | | | | (11.04% | ) |
| | | | | | | | | | | | | | | | | | | | |
| | | | | | | | | | | | | | | | | | | | |
| | $ | 1,867,261 | | | $ | 2,190,839 | | | $ | 1,130,453 | | | $ | 1,000,200 | | | $ | 391,408 | |
| | | 1.16% | | | | 1.21% | | | | 1.25% | | | | 1.26% | | | | 1.26% | |
| | | 1.30% | | | | 1.23% | | | | 1.26% | | | | 1.26% | | | | 1.26% | |
| | | 2.89% | | | | 2.44% | | | | 0.58% | | | | 0.99% | | | | 0.72% | |
| | | 2.75% | | | | 2.42% | | | | 0.57% | | | | 0.99% | | | | 0.72% | |
| | | 11% | | | | 4% | | | | 5% | | | | 10% | | | | 11% | |
67
Table of Contents
Financial highlights
Delaware International Small Cap Fund Class A
Selected data for each share of the Fund outstanding throughout each period were as follows:
| Net asset value, beginning of period |
| |
| Income (loss) from investment operations: |
| Net investment income (loss)1 |
| Net realized and unrealized gain (loss) |
| Total from investment operations |
| |
| Less dividends and distributions from: |
| Net realized gain |
| Total dividends and distributions |
| |
| Net asset value, end of period |
| |
| Total return3 |
| |
| Ratios and supplemental data: |
| Net assets, end of period (000 omitted) |
| Ratio of expenses to average net assets4 |
| Ratio of expenses to average net assets prior to fees waived4 |
| Ratio of net investment income (loss) to average net assets |
| Ratio of net investment income (loss) to average net assets prior to fees waived |
| Portfolio turnover |
| 1 | Calculated using average shares outstanding. |
| 2 | Amount is less than $(0.005) per share. |
| 3 | Total return is based on the change in net asset value of a share during the period and assumes reinvestment of dividends and distributions at net asset value and does not reflect the impact of a sales charge. Total return during the period reflects waivers by the manager and/or distributor. Performance would have been lower had the waivers not been in effect. |
| 4 | Expense ratios do not include expenses of any investment companies in which the Fund invests. |
See accompanying notes, which are an integral part of the financial statements.
68
Table of Contents
| | Year ended | |
| | 11/30/22 | | | 11/30/21 | | | 11/30/20 | | | 11/30/19 | | | 11/30/18 | |
| | $ | 9.54 | | | $ | 8.63 | | | $ | 7.07 | | | $ | 6.66 | | | $ | 7.99 | |
| | | | | | | | | | | | | | | | | | | | |
| | | | | | | | | | | | | | | | | | | | |
| | | 0.04 | | | | (0.03 | ) | | | — | 2 | | | 0.01 | | | | 0.01 | |
| | | (2.18 | ) | | | 0.94 | | | | 1.56 | | | | 0.40 | | | | (1.02 | ) |
| | | (2.14 | ) | | | 0.91 | | | | 1.56 | | | | 0.41 | | | | (1.01 | ) |
| | | | | | | | | | | | | | | | | | | | |
| | | | | | | | | | | | | | | | | | | | |
| | | (0.54 | ) | | | — | | | | — | | | | — | | | | (0.32 | ) |
| | | (0.54 | ) | | | — | | | | — | | | | — | | | | (0.32 | ) |
| | | | | | | | | | | | | | | | | | | | |
| | $ | 6.86 | | | $ | 9.54 | | | $ | 8.63 | | | $ | 7.07 | | | $ | 6.66 | |
| | | | | | | | | | | | | | | | | | | | |
| | | (23.72% | ) | | | 10.55% | | | | 22.07% | | | | 6.16% | | | | (13.19% | ) |
| | | | | | | | | | | | | | | | | | | | |
| | | | | | | | | | | | | | | | | | | | |
| | $ | 6,653 | | | $ | 9,535 | | | $ | 7,499 | | | $ | 10,934 | | | $ | 10,154 | |
| | | 1.35% | | | | 1.35% | | | | 1.35% | | | | 1.34% | | | | 1.34% | |
| | | 1.58% | | | | 1.48% | | | | 1.52% | | | | 1.55% | | | | 1.72% | |
| | | 0.52% | | | | (0.35% | ) | | | (0.04% | ) | | | 0.16% | | | | 0.13% | |
| | | 0.29% | | | | (0.48% | ) | | | (0.21% | ) | | | (0.05% | ) | | | (0.25% | ) |
| | | 53% | | | | 95% | | | | 66% | | | | 97% | | | | 106% | |
69
Table of Contents
Financial highlights
Delaware International Small Cap Fund Class C
Selected data for each share of the Fund outstanding throughout each period were as follows:
| Net asset value, beginning of period |
| |
| Income (loss) from investment operations: |
| Net investment loss1 |
| Net realized and unrealized gain (loss) |
| Total from investment operations |
| |
| Less dividends and distributions from: |
| Net realized gain |
| Total dividends and distributions |
| |
| Net asset value, end of period |
| |
| Total return2 |
| |
| Ratios and supplemental data: |
| Net assets, end of period (000 omitted) |
| Ratio of expenses to average net assets3 |
| Ratio of expenses to average net assets prior to fees waived3 |
| Ratio of net investment loss to average net assets |
| Ratio of net investment loss to average net assets prior to fees waived |
| Portfolio turnover |
| 1 | Calculated using average shares outstanding. |
| 2 | Total return is based on the change in net asset value of a share during the period and assumes reinvestment of dividends and distributions at net asset value and does not reflect the impact of a sales charge. Total return during the period reflects waivers by the manager and/or distributor. Performance would have been lower had the waivers not been in effect. |
| 3 | Expense ratios do not include expenses of any investment companies in which the Fund invests. |
See accompanying notes, which are an integral part of the financial statements.
70
Table of Contents
| | Year ended | |
| | 11/30/22 | | | 11/30/21 | | | 11/30/20 | | | 11/30/19 | | | 11/30/18 | |
| | $ | 7.86 | | | $ | 7.16 | | | $ | 5.91 | | | $ | 5.61 | | | $ | 6.83 | |
| | | | | | | | | | | | | | | | | | | | |
| | | | | | | | | | | | | | | | | | | | |
| | | (0.01 | ) | | | (0.09 | ) | | | (0.05 | ) | | | (0.03 | ) | | | (0.04 | ) |
| | | (1.78 | ) | | | 0.79 | | | | 1.30 | | | | 0.33 | | | | (0.86 | ) |
| | | (1.79 | ) | | | 0.70 | | | | 1.25 | | | | 0.30 | | | | (0.90 | ) |
| | | | | | | | | | | | | | | | | | | | |
| | | | | | | | | | | | | | | | | | | | |
| | | (0.54 | ) | | | — | | | | — | | | | — | | | | (0.32 | ) |
| | | (0.54 | ) | | | — | | | | — | | | | — | | | | (0.32 | ) |
| | | | | | | | | | | | | | | | | | | | |
| | $ | 5.53 | | | $ | 7.86 | | | $ | 7.16 | | | $ | 5.91 | | | $ | 5.61 | |
| | | | | | | | | | | | | | | | | | | | |
| | | (24.39% | ) | | | 9.78% | | | | 21.15% | | | | 5.35% | | | | (13.86% | ) |
| | | | | | | | | | | | | | | | | | | | |
| | | | | | | | | | | | | | | | | | | | |
| | $ | 1,079 | | | $ | 1,955 | | | $ | 3,106 | | | $ | 3,541 | | | $ | 4,698 | |
| | | 2.10% | | | | 2.10% | | | | 2.10% | | | | 2.09% | | | | 2.09% | |
| | | 2.33% | | | | 2.23% | | | | 2.27% | | | | 2.30% | | | | 2.47% | |
| | | (0.23% | ) | | | (1.10% | ) | | | (0.79% | ) | | | (0.59% | ) | | | (0.62% | ) |
| | | (0.46% | ) | | | (1.23% | ) | | | (0.96% | ) | | | (0.80% | ) | | | (1.00% | ) |
| | | 53% | | | | 95% | | | | 66% | | | | 97% | | | | 106% | |
71
Table of Contents
Financial highlights
Delaware International Small Cap Fund Class R
Selected data for each share of the Fund outstanding throughout each period were as follows:
| Net asset value, beginning of period |
| |
| Income (loss) from investment operations: |
| Net investment income (loss)1 |
| Net realized and unrealized gain (loss) |
| Total from investment operations |
| |
| Less dividends and distributions from: |
| Net realized gain |
| Total dividends and distributions |
| |
| Net asset value, end of period |
| |
| Total return2 |
| |
| Ratios and supplemental data: |
| Net assets, end of period (000 omitted) |
| Ratio of expenses to average net assets3 |
| Ratio of expenses to average net assets prior to fees waived3 |
| Ratio of net investment income (loss) to average net assets |
| Ratio of net investment income (loss) to average net assets prior to fees waived |
| Portfolio turnover |
| 1 | Calculated using average shares outstanding. |
| 2 | Total return is based on the change in net asset value of a share during the period and assumes reinvestment of dividends and distributions at net asset value. Total return during the period reflects waivers by the manager and/or distributor. Performance would have been lower had the waivers not been in effect. |
| 3 | Expense ratios do not include expenses of any investment companies in which the Fund invests. |
See accompanying notes, which are an integral part of the financial statements.
72
Table of Contents
| | Year ended | |
| | 11/30/22 | | | 11/30/21 | | | 11/30/20 | | | 11/30/19 | | | 11/30/18 | |
| | $ | 8.97 | | | $ | 8.14 | | | $ | 6.68 | | | $ | 6.31 | | | $ | 7.61 | |
| | | | | | | | | | | | | | | | | | | | |
| | | | | | | | | | | | | | | | | | | | |
| | | 0.02 | | | | (0.05 | ) | | | (0.02 | ) | | | (0.01 | ) | | | (0.01 | ) |
| | | (2.04 | ) | | | 0.88 | | | | 1.48 | | | | 0.38 | | | | (0.97 | ) |
| | | (2.02 | ) | | | 0.83 | | | | 1.46 | | | | 0.37 | | | | (0.98 | ) |
| | | | | | | | | | | | | | | | | | | | |
| | | | | | | | | | | | | | | | | | | | |
| | | (0.54 | ) | | | — | | | | — | | | | — | | | | (0.32 | ) |
| | | (0.54 | ) | | | — | | | | — | | | | — | | | | (0.32 | ) |
| | | | | | | | | | | | | | | | | | | | |
| | $ | 6.41 | | | $ | 8.97 | | | $ | 8.14 | | | $ | 6.68 | | | $ | 6.31 | |
| | | | | | | | | | | | | | | | | | | | |
| | | (23.91% | ) | | | 10.20% | | | | 21.86% | | | | 5.86% | | | | (13.47% | ) |
| | | | | | | | | | | | | | | | | | | | |
| | | | | | | | | | | | | | | | | | | | |
| | $ | 119 | | | $ | 159 | | | $ | 340 | | | $ | 98 | | | $ | 87 | |
| | | 1.60% | | | | 1.60% | | | | 1.60% | | | | 1.59% | | | | 1.59% | |
| | | 1.83% | | | | 1.73% | | | | 1.77% | | | | 1.80% | | | | 1.97% | |
| | | 0.27% | | | | (0.60% | ) | | | (0.29% | ) | | | (0.09% | ) | | | (0.12% | ) |
| | | 0.04% | | | | (0.73% | ) | | | (0.46% | ) | | | (0.30% | ) | | | (0.50% | ) |
| | | 53% | | | | 95% | | | | 66% | | | | 97% | | | | 106% | |
73
Table of Contents
Financial highlights
Delaware International Small Cap Fund Institutional Class
Selected data for each share of the Fund outstanding throughout each period were as follows:
| Net asset value, beginning of period |
| |
| Income (loss) from investment operations: |
| Net investment income (loss)1 |
| Net realized and unrealized gain (loss) |
| Total from investment operations |
| |
| Less dividends and distributions from: |
| Net investment income |
| Net realized gain |
| Return of capital |
| Total dividends and distributions |
| |
| Net asset value, end of period |
| |
| Total return3 |
| |
| Ratios and supplemental data: |
| Net assets, end of period (000 omitted) |
| Ratio of expenses to average net assets4 |
| Ratio of expenses to average net assets prior to fees waived4 |
| Ratio of net investment income (loss) to average net assets |
| Ratio of net investment income (loss) to average net assets prior to fees waived |
| Portfolio turnover |
| 1 | Calculated using average shares outstanding. |
| 2 | Amount is less than $0.005 per share. |
| 3 | Total return is based on the change in net asset value of a share during the period and assumes reinvestment of dividends and distributions at net asset value. Total return during the period reflects waivers by the manager and/or distributor. Performance would have been lower had the waivers not been in effect. |
| 4 | Expense ratios do not include expenses of any investment companies in which the Fund invests. |
See accompanying notes, which are an integral part of the financial statements.
74
Table of Contents
| | Year ended | |
| | 11/30/22 | | | 11/30/21 | | | 11/30/20 | | | 11/30/19 | | | 11/30/18 | |
| | $ | 10.06 | | | $ | 9.07 | | | $ | 7.43 | | | $ | 6.98 | | | $ | 8.34 | |
| | | | | | | | | | | | | | | | | | | | |
| | | | | | | | | | | | | | | | | | | | |
| | | 0.06 | | | | (0.01 | ) | | | 0.02 | | | | 0.03 | | | | 0.03 | |
| | | (2.31 | ) | | | 1.00 | | | | 1.63 | | | | 0.42 | | | | (1.07 | ) |
| | | (2.25 | ) | | | 0.99 | | | | 1.65 | | | | 0.45 | | | | (1.04 | ) |
| | | | | | | | | | | | | | | | | | | | |
| | | | | | | | | | | | | | | | | | | | |
| | | — | | | | — | | | | (0.01 | ) | | | — | | | | — | |
| | | (0.54 | ) | | | — | | | | — | | | | — | | | | (0.32 | ) |
| | | — | | | | — | | | | — | 2 | | | — | | | | — | |
| | | (0.54 | ) | | | — | | | | (0.01 | ) | | | — | | | | (0.32 | ) |
| | | | | | | | | | | | | | | | | | | | |
| | $ | 7.27 | | | $ | 10.06 | | | $ | 9.07 | | | $ | 7.43 | | | $ | 6.98 | |
| | | | | | | | | | | | | | | | | | | | |
| | | (23.59% | ) | | | 10.92% | | | | 22.30% | | | | 6.45% | | | | (12.99% | ) |
| | | | | | | | | | | | | | | | | | | | |
| | | | | | | | | | | | | | | | | | | | |
| | $ | 50,572 | | | $ | 73,091 | | | $ | 91,340 | | | $ | 117,702 | | | $ | 60,124 | |
| | | 1.10% | | | | 1.10% | | | | 1.10% | | | | 1.09% | | | | 1.09% | |
| | | 1.33% | | | | 1.23% | | | | 1.27% | | | | 1.30% | | | | 1.47% | |
| | | 0.77% | | | | (0.10% | ) | | | 0.21% | | | | 0.41% | | | | 0.38% | |
| | | 0.54% | | | | (0.23% | ) | | | 0.04% | | | | 0.20% | | | | 0.00% | |
| | | 53% | | | | 95% | | | | 66% | | | | 97% | | | | 106% | |
75
Table of Contents
Financial highlights
Delaware International Small Cap Fund Class R6
Selected data for each share of the Fund outstanding throughout each period were as follows:
| Net asset value, beginning of period |
| |
| Income (loss) from investment operations: |
| Net investment income1 |
| Net realized and unrealized gain (loss) |
| Total from investment operations |
| |
| Less dividends and distributions from: |
| Net investment income |
| Net realized gain |
| Return of capital |
| Total dividends and distributions |
| |
| Net asset value, end of period |
| |
| Total return4 |
| |
| Ratios and supplemental data: |
| Net assets, end of period (000 omitted) |
| Ratio of expenses to average net assets5 |
| Ratio of expenses to average net assets prior to fees waived5 |
| Ratio of net investment income to average net assets |
| Ratio of net investment income (loss) to average net assets prior to fees waived |
| Portfolio turnover |
| 1 | Calculated using average shares outstanding. |
| 2 | Amount is less than $(0.005) per share. |
| 3 | Amount is less than $0.005 per share. |
| 4 | Total return is based on the change in net asset value of a share during the period and assumes reinvestment of dividends and distributions at net asset value. Total return during the period reflects waivers by the manager and/or distributor. Performance would have been lower had the waivers not been in effect. |
| 5 | Expense ratios do not include expenses of any investment companies in which the Fund invests. |
See accompanying notes, which are an integral part of the financial statements.
76
Table of Contents
| | Year ended | |
| | 11/30/22 | | | 11/30/21 | | | 11/30/20 | | | 11/30/19 | | | 11/30/18 | |
| | $ | 10.09 | | | $ | 9.10 | | | $ | 7.45 | | | $ | 6.99 | | | $ | 8.35 | |
| | | | | | | | | | | | | | | | | | | | |
| | | | | | | | | | | | | | | | | | | | |
| | | 0.07 | | | | — | 2 | | | 0.02 | | | | 0.04 | | | | 0.04 | |
| | | (2.31 | ) | | | 0.99 | | | | 1.65 | | | | 0.42 | | | | (1.08 | ) |
| | | (2.24 | ) | | | 0.99 | | | | 1.67 | | | | 0.46 | | | | (1.04 | ) |
| | | | | | | | | | | | | | | | | | | | |
| | | | | | | | | | | | | | | | | | | | |
| | | — | | | | — | | | | (0.02 | ) | | | — | | | | — | |
| | | (0.54 | ) | | | — | | | | — | | | | — | | | | (0.32 | ) |
| | | — | | | | — | | | | — | 3 | | | — | | | | — | |
| | | (0.54 | ) | | | — | | | | (0.02 | ) | | | — | | | | (0.32 | ) |
| | | | | | | | | | | | | | | | | | | | |
| | $ | 7.31 | | | $ | 10.09 | | | $ | 9.10 | | | $ | 7.45 | | | $ | 6.99 | |
| | | | | | | | | | | | | | | | | | | | |
| | | (23.41% | ) | | | 10.88% | | | | 22.48% | | | | 6.58% | | | | (12.98% | ) |
| | | | | | | | | | | | | | | | | | | | |
| | | | | | | | | | | | | | | | | | | | |
| | $ | 13,036 | | | $ | 21,631 | | | $ | 12,498 | | | $ | 3,780 | | | $ | 2,676 | |
| | | 1.00% | | | | 1.00% | | | | 1.00% | | | | 1.00% | | | | 1.00% | |
| | | 1.23% | | | | 1.13% | | | | 1.17% | | | | 1.21% | | | | 1.38% | |
| | | 0.87% | | | | 0.00% | | | | 0.31% | | | | 0.50% | | | | 0.47% | |
| | | 0.64% | | | | (0.13% | ) | | | 0.14% | | | | 0.29% | | | | 0.09% | |
| | | 53% | | | | 95% | | | | 66% | | | | 97% | | | | 106% | |
77
Table of Contents
Financial highlights
Delaware International Value Equity Fund Class A
Selected data for each share of the Fund outstanding throughout each period were as follows:
| Net asset value, beginning of period |
| |
| Income (loss) from investment operations: |
| Net investment income1 |
| Net realized and unrealized gain (loss) |
| Total from investment operations |
| |
| Less dividends and distributions from: |
| Net investment income |
| Net realized gain |
| Total dividends and distributions |
| |
| Net asset value, end of period |
| |
| Total return3 |
| |
| Ratios and supplemental data: |
| Net assets, end of period (000 omitted) |
| Ratio of expenses to average net assets5 |
| Ratio of expenses to average net assets prior to fees waived5 |
| Ratio of net investment income to average net assets |
| Ratio of net investment income to average net assets prior to fees waived |
| Portfolio turnover |
| 1 | Calculated using average shares outstanding. |
| 2 | The per share amount of realized and unrealized gain (loss) on investments does not accord with the amounts reported in the Statements of Operations due to the timing of creation of Fund shares in relation to fluctuating market values. |
| 3 | Total return is based on the change in net asset value of a share during the period and assumes reinvestment of dividends and distributions at net asset value and does not reflect the impact of a sales charge. |
| 4 | Total return during the period reflects waivers by the manager and/or distributor. Performance would have been lower had the waivers not been in effect. |
| 5 | Expense ratios do not include expenses of any investment companies in which the Fund invests. |
| 6 | The Fund’s portfolio turnover rate increased substantially during the year ended November 30, 2019 due to a change in the Fund’s portfolio managers and associated repositioning. |
See accompanying notes, which are an integral part of the financial statements.
78
Table of Contents
| | Year ended | |
| | 11/30/22 | | | 11/30/21 | | | 11/30/20 | | | 11/30/19 | | | 11/30/18 | |
| | $ | 15.47 | | | $ | 14.82 | | | $ | 14.66 | | | $ | 13.53 | | | $ | 15.66 | |
| | | | | | | | | | | | | | | | | | | | |
| | | | | | | | | | | | | | | | | | | | |
| | | 0.17 | | | | 0.13 | | | | 0.11 | | | | 0.19 | | | | 0.29 | |
| | | (2.08 | ) | | | 0.76 | 2 | | | 0.43 | | | | 1.23 | | | | (2.19 | ) |
| | | (1.91 | ) | | | 0.89 | | | | 0.54 | | | | 1.42 | | | | (1.90 | ) |
| | | | | | | | | | | | | | | | | | | | |
| | | | | | | | | | | | | | | | | | | | |
| | | (0.11 | ) | | | (0.13 | ) | | | (0.18 | ) | | | (0.29 | ) | | | (0.23 | ) |
| | | (1.03 | ) | | | (0.11 | ) | | | (0.20 | ) | | | — | | | | — | |
| | | (1.14 | ) | | | (0.24 | ) | | | (0.38 | ) | | | (0.29 | ) | | | (0.23 | ) |
| | | | | | | | | | | | | | | | | | | | |
| | $ | 12.42 | | | $ | 15.47 | | | $ | 14.82 | | | $ | 14.66 | | | $ | 13.53 | |
| | | | | | | | | | | | | | | | | | | | |
| | | (13.46% | )4 | | | 6.02% | 4 | | | 3.80% | 4 | | | 10.94% | 4 | | | (12.32% | ) |
| | | | | | | | | | | | | | | | | | | | |
| | | | | | | | | | | | | | | | | | | | |
| | $ | 149,727 | | | $ | 201,367 | | | $ | 59,692 | | | $ | 62,035 | | | $ | 63,604 | |
| | | 1.13% | | | | 1.17% | | | | 1.26% | | | | 1.34% | | | | 1.33% | |
| | | 1.35% | | | | 1.36% | | | | 1.35% | | | | 1.35% | | | | 1.33% | |
| | | 1.27% | | | | 0.80% | | | | 0.81% | | | | 1.35% | | | | 1.93% | |
| | | 1.05% | | | | 0.61% | | | | 0.72% | | | | 1.34% | | | | 1.93% | |
| | | 32% | | | | 38% | | | | 36% | | | | 143% | 6 | | | 13% | |
79
Table of Contents
Financial highlights
Delaware International Value Equity Fund Class C
Selected data for each share of the Fund outstanding throughout each period were as follows:
| Net asset value, beginning of period |
| |
| Income (loss) from investment operations: |
| Net investment income1 |
| Net realized and unrealized gain (loss) |
| Total from investment operations |
| |
| Less dividends and distributions from: |
| Net investment income |
| Net realized gain |
| Total dividends and distributions |
| |
| Net asset value, end of period |
| |
| Total return3 |
| |
| Ratios and supplemental data: |
| Net assets, end of period (000 omitted) |
| Ratio of expenses to average net assets5 |
| Ratio of expenses to average net assets prior to fees waived5 |
| Ratio of net investment income to average net assets |
| Ratio of net investment income (loss) to average net assets prior to fees waived |
| Portfolio turnover |
| 1 | Calculated using average shares outstanding. |
| 2 | The per share amount of realized and unrealized gain (loss) on investments does not accord with the amounts reported in the Statements of Operations due to the timing of creation of Fund shares in relation to fluctuating market values. |
| 3 | Total return is based on the change in net asset value of a share during the period and assumes reinvestment of dividends and distributions at net asset value and does not reflect the impact of a sales charge. |
| 4 | Total return during the period reflects waivers by the manager and/or distributor. Performance would have been lower had the waivers not been in effect. |
| 5 | Expense ratios do not include expenses of any investment companies in which the Fund invests. |
| 6 | The Fund’s portfolio turnover rate increased substantially during the year ended November 30, 2019 due to a change in the Fund’s portfolio managers and associated repositioning. |
See accompanying notes, which are an integral part of the financial statements.
80
Table of Contents
| | Year ended | |
| | 11/30/22 | | | 11/30/21 | | | 11/30/20 | | | 11/30/19 | | | 11/30/18 | |
| | $ | 15.28 | | | $ | 14.63 | | | $ | 14.48 | | | $ | 13.25 | | | $ | 15.36 | |
| | | | | | | | | | | | | | | | | | | | |
| | | | | | | | | | | | | | | | | | | | |
| | | 0.07 | | | | 0.01 | | | | 0.01 | | | | 0.08 | | | | 0.16 | |
| | | (2.06 | ) | | | 0.75 | 2 | | | 0.42 | | | | 1.25 | | | | (2.15 | ) |
| | | (1.99 | ) | | | 0.76 | | | | 0.43 | | | | 1.33 | | | | (1.99 | ) |
| | | | | | | | | | | | | | | | | | | | |
| | | | | | | | | | | | | | | | | | | | |
| | | — | | | | — | | | | (0.08 | ) | | | (0.10 | ) | | | (0.12 | ) |
| | | (1.03 | ) | | | (0.11 | ) | | | (0.20 | ) | | | — | | | | — | |
| | | (1.03 | ) | | | (0.11 | ) | | | (0.28 | ) | | | (0.10 | ) | | | (0.12 | ) |
| | | | | | | | | | | | | | | | | | | | |
| | $ | 12.26 | | | $ | 15.28 | | | $ | 14.63 | | | $ | 14.48 | | | $ | 13.25 | |
| | | | | | | | | | | | | | | | | | | | |
| | | (14.07% | )4 | | | 5.21% | 4 | | | 3.01% | 4 | | | 10.18% | 4 | | | (13.04% | ) |
| | | | | | | | | | | | | | | | | | | | |
| | | | | | | | | | | | | | | | | | | | |
| | $ | 3,313 | | | $ | 4,549 | | | $ | 6,127 | | | $ | 8,562 | | | $ | 8,734 | |
| | | 1.88% | | | | 1.92% | | | | 2.01% | | | | 2.09% | | | | 2.08% | |
| | | 2.10% | | | | 2.11% | | | | 2.10% | | | | 2.10% | | | | 2.08% | |
| | | 0.52% | | | | 0.05% | | | | 0.06% | | | | 0.60% | | | | 1.18% | |
| | | 0.30% | | | | (0.14% | ) | | | (0.03% | ) | | | 0.59% | | | | 1.18% | |
| | | 32% | | | | 38% | | | | 36% | | | | 143% | 6 | | | 13% | |
81
Table of Contents
Financial highlights
Delaware International Value Equity Fund Class R
Selected data for each share of the Fund outstanding throughout each period were as follows:
| Net asset value, beginning of period |
| |
| Income (loss) from investment operations: |
| Net investment income1 |
| Net realized and unrealized gain (loss) |
| Total from investment operations |
| |
| Less dividends and distributions from: |
| Net investment income |
| Net realized gain |
| Total dividends and distributions |
| |
| Net asset value, end of period |
| |
| Total return3 |
| |
| Ratios and supplemental data: |
| Net assets, end of period (000 omitted) |
| Ratio of expenses to average net assets5 |
| Ratio of expenses to average net assets prior to fees waived5 |
| Ratio of net investment income to average net assets |
| Ratio of net investment income to average net assets prior to fees waived |
| Portfolio turnover |
| 1 | Calculated using average shares outstanding. |
| 2 | The per share amount of realized and unrealized gain (loss) on investments does not accord with the amounts reported in the Statements of Operations due to the timing of creation of Fund shares in relation to fluctuating market values. |
| 3 | Total return is based on the change in net asset value of a share during the period and assumes reinvestment of dividends and distributions at net asset value. |
| 4 | Total return during the period reflects waivers by the manager and/or distributor. Performance would have been lower had the waivers not been in effect. |
| 5 | Expense ratios do not include expenses of any investment companies in which the Fund invests. |
| 6 | The Fund’s portfolio turnover rate increased substantially during the year ended November 30, 2019 due to a change in the Fund’s portfolio managers and associated repositioning. |
See accompanying notes, which are an integral part of the financial statements.
82
Table of Contents
| | Year ended | |
| | 11/30/22 | | | 11/30/21 | | | 11/30/20 | | | 11/30/19 | | | 11/30/18 | |
| | $ | 15.40 | | | $ | 14.76 | | | $ | 14.60 | | | $ | 13.46 | | | $ | 15.59 | |
| | | | | | | | | | | | | | | | | | | | |
| | | | | | | | | | | | | | | | | | | | |
| | | 0.14 | | | | 0.09 | | | | 0.08 | | | | 0.15 | | | | 0.25 | |
| | | (2.08 | ) | | | 0.76 | 2 | | | 0.42 | | | | 1.24 | | | | (2.19 | ) |
| | | (1.94 | ) | | | 0.85 | | | | 0.50 | | | | 1.39 | | | | (1.94 | ) |
| | | | | | | | | | | | | | | | | | | | |
| | | | | | | | | | | | | | | | | | | | |
| | | (0.06 | ) | | | (0.10 | ) | | | (0.14 | ) | | | (0.25 | ) | | | (0.19 | ) |
| | | (1.03 | ) | | | (0.11 | ) | | | (0.20 | ) | | | — | | | | — | |
| | | (1.09 | ) | | | (0.21 | ) | | | (0.34 | ) | | | (0.25 | ) | | | (0.19 | ) |
| | | | | | | | | | | | | | | | | | | | |
| | $ | 12.37 | | | $ | 15.40 | | | $ | 14.76 | | | $ | 14.60 | | | $ | 13.46 | |
| | | | | | | | | | | | | | | | | | | | |
| | | (13.68% | )4 | | | 5.75% | 4 | | | 3.53% | 4 | | | 10.72% | 4 | | | (12.58% | ) |
| | | | | | | | | | | | | | | | | | | | |
| | | | | | | | | | | | | | | | | | | | |
| | $ | 1,454 | | | $ | 4,941 | | | $ | 2,845 | | | $ | 3,472 | | | $ | 3,508 | |
| | | 1.38% | | | | 1.42% | | | | 1.51% | | | | 1.59% | | | | 1.58% | |
| | | 1.60% | | | | 1.61% | | | | 1.60% | | | | 1.60% | | | | 1.58% | |
| | | 1.01% | | | | 0.55% | | | | 0.56% | | | | 1.10% | | | | 1.68% | |
| | | 0.79% | | | | 0.36% | | | | 0.47% | | | | 1.09% | | | | 1.68% | |
| | | 32% | | | | 38% | | | | 36% | | | | 143% | 6 | | | 13% | |
83
Table of Contents
Financial highlights
Delaware International Value Equity Fund Institutional Class
Selected data for each share of the Fund outstanding throughout each period were as follows:
| Net asset value, beginning of period |
| |
| Income (loss) from investment operations: |
| Net investment income1 |
| Net realized and unrealized gain (loss) |
| Total from investment operations |
| |
| Less dividends and distributions from: |
| Net investment income |
| Net realized gain |
| Total dividends and distributions |
| |
| Net asset value, end of period |
| |
| Total return3 |
| |
| Ratios and supplemental data: |
| Net assets, end of period (000 omitted) |
| Ratio of expenses to average net assets5 |
| Ratio of expenses to average net assets prior to fees waived5 |
| Ratio of net investment income to average net assets |
| Ratio of net investment income to average net assets prior to fees waived |
| Portfolio turnover |
| 1 | Calculated using average shares outstanding. |
| 2 | The per share amount of realized and unrealized gain (loss) on investments does not accord with the amounts reported in the Statements of Operations due to the timing of creation of Fund shares in relation to fluctuating market values. |
| 3 | Total return is based on the change in net asset value of a share during the period and assumes reinvestment of dividends and distributions at net asset value. |
| 4 | Total return during the period reflects waivers by the manager and/or distributor. Performance would have been lower had the waivers not been in effect. |
| 5 | Expense ratios do not include expenses of any investment companies in which the Fund invests. |
| 6 | The Fund’s portfolio turnover rate increased substantially during the year ended November 30, 2019 due to a change in the Fund’s portfolio managers and associated repositioning. |
See accompanying notes, which are an integral part of the financial statements.
84
Table of Contents
| | Year ended | |
| | 11/30/22 | | | 11/30/21 | | | 11/30/20 | | | 11/30/19 | | | 11/30/18 | |
| | $ | 15.55 | | | $ | 14.90 | | | $ | 14.74 | | | $ | 13.60 | | | $ | 15.74 | |
| | | | | | | | | | | | | | | | | | | | |
| | | | | | | | | | | | | | | | | | | | |
| | | 0.20 | | | | 0.17 | | | | 0.15 | | | | 0.22 | | | | 0.33 | |
| | | (2.09 | ) | | | 0.75 | 2 | | | 0.43 | | | | 1.25 | | | | (2.20 | ) |
| | | (1.89 | ) | | | 0.92 | | | | 0.58 | | | | 1.47 | | | | (1.87 | ) |
| | | | | | | | | | | | | | | | | | | | |
| | | | | | | | | | | | | | | | | | | | |
| | | (0.13 | ) | | | (0.16 | ) | | | (0.22 | ) | | | (0.33 | ) | | | (0.27 | ) |
| | | (1.03 | ) | | | (0.11 | ) | | | (0.20 | ) | | | — | | | | — | |
| | | (1.16 | ) | | | (0.27 | ) | | | (0.42 | ) | | | (0.33 | ) | | | (0.27 | ) |
| | | | | | | | | | | | | | | | | | | | |
| | $ | 12.50 | | | $ | 15.55 | | | $ | 14.90 | | | $ | 14.74 | | | $ | 13.60 | |
| | | | | | | | | | | | | | | | | | | | |
| | | (13.23% | )4 | | | 6.24% | 4 | | | 4.04% | 4 | | | 11.29% | 4 | | | (12.11% | ) |
| | | | | | | | | | | | | | | | | | | | |
| | | | | | | | | | | | | | | | | | | | |
| | $ | 182,373 | | | $ | 318,766 | | | $ | 248,810 | | | $ | 229,511 | | | $ | 220,747 | |
| | | 0.88% | | | | 0.92% | | | | 1.01% | | | | 1.09% | | | | 1.08% | |
| | | 1.10% | | | | 1.11% | | | | 1.10% | | | | 1.10% | | | | 1.08% | |
| | | 1.52% | | | | 1.05% | | | | 1.06% | | | | 1.60% | | | | 2.18% | |
| | | 1.30% | | | | 0.86% | | | | 0.97% | | | | 1.59% | | | | 2.18% | |
| | | 32% | | | | 38% | | | | 36% | | | | 143% | 6 | | | 13% | |
85
Table of Contents
Financial highlights
Delaware International Value Equity Fund Class R6
Selected data for each share of the Fund outstanding throughout each period were as follows:
| Net asset value, beginning of period |
| |
| Income (loss) from investment operations: |
| Net investment income2 |
| Net realized and unrealized gain (loss) |
| Total from investment operations |
| |
| Less dividends and distributions from: |
| Net investment income |
| Net realized gain |
| Total dividends and distributions |
| |
| Net asset value, end of period |
| |
| Total return4 |
| |
| Ratios and supplemental data: |
| Net assets, end of period (000 omitted) |
| Ratio of expenses to average net assets6 |
| Ratio of expenses to average net assets prior to fees waived6 |
| Ratio of net investment income to average net assets |
| Ratio of net investment income to average net assets prior to fees waived |
| Portfolio turnover |
| 1 | Date of commencement of operations; ratios have been annualized and total return has not been annualized. |
| 2 | Calculated using average shares outstanding. |
| 3 | The per share amount of realized and unrealized gain (loss) on investments does not accord with the amounts reported in the Statements of Operations due to the timing of creation of Fund shares in relation to fluctuating market values. |
| 4 | Total return is based on the change in net asset value of a share during the period and assumes reinvestment of dividends and distributions at net asset value. |
| 5 | Total return during the period reflects waivers by the manager and/or distributor. Performance would have been lower had the waivers not been in effect. |
| 6 | Expense ratios do not include expenses of any investment companies in which the Fund invests. |
| 7 | The Fund’s portfolio turnover rate increased substantially during the year ended November 30, 2019 due to a change in the Fund’s portfolio managers and associated repositioning. |
| 8 | Portfolio turnover is representative of the Fund for the entire period. |
See accompanying notes, which are an integral part of the financial statements.
86
Table of Contents
| | Year ended | | 3/29/181
to | |
| | 11/30/22 | | | 11/30/21 | | | 11/30/20 | | | 11/30/19 | | | 11/30/18 | |
| | $ | 15.56 | | | $ | 14.91 | | | $ | 14.74 | | | $ | 13.60 | | | $ | 15.36 | |
| | | | | | | | | | | | | | | | | | | | |
| | | | | | | | | | | | | | | | | | | | |
| | | 0.21 | | | | 0.18 | | | | 0.15 | | | | 0.24 | | | | 0.25 | |
| | | (2.09 | ) | | | 0.76 | 3 | | | 0.45 | | | | 1.24 | | | | (2.01 | ) |
| | | (1.88 | ) | | | 0.94 | | | | 0.60 | | | | 1.48 | | | | (1.76 | ) |
| | | | | | | | | | | | | | | | | | | | |
| | | | | | | | | | | | | | | | | | | | |
| | | (0.14 | ) | | | (0.18 | ) | | | (0.23 | ) | | | (0.34 | ) | | | — | |
| | | (1.03 | ) | | | (0.11 | ) | | | (0.20 | ) | | | — | | | | — | |
| | | (1.17 | ) | | | (0.29 | ) | | | (0.43 | ) | | | (0.34 | ) | | | — | |
| | | | | | | | | | | | | | | | | | | | |
| | $ | 12.51 | | | $ | 15.56 | | | $ | 14.91 | | | $ | 14.74 | | | $ | 13.60 | |
| | | | | | | | | | | | | | | | | | | | |
| | | (13.17% | )5 | | | 6.31% | 5 | | | 4.14% | 5 | | | 11.36% | 5 | | | (11.46% | ) |
| | | | | | | | | | | | | | | | | | | | |
| | | | | | | | | | | | | | | | | | | | |
| | $ | 3,038 | | | $ | 3,732 | | | $ | 1,585 | | | $ | 2,091 | | | $ | 2 | |
| | | 0.81% | | | | 0.86% | | | | 0.95% | | | | 1.03% | | | | 1.02% | |
| | | 1.02% | | | | 1.04% | | | | 1.02% | | | | 1.03% | | | | 1.02% | |
| | | 1.59% | | | | 1.11% | | | | 1.12% | | | | 1.66% | | | | 2.47% | |
| | | 1.38% | | | | 0.94% | | | | 1.05% | | | | 1.66% | | | | 2.47% | |
| | | 32% | | | | 38% | | | | 36 | % | | | 143% | 7 | | | 13% | 8 |
87
Table of Contents
| Notes to financial statements | |
| Delaware International Funds | November 30, 2022 |
Delaware Group® Global & International Funds (Trust) is organized as a Delaware statutory trust and offers three series: Delaware Emerging Markets Fund, Delaware International Small Cap Fund, and Delaware International Value Equity Fund (each, a Fund or collectively, the Funds). The Trust is an open-end investment company. Each Fund, except Delaware International Value Equity Fund, is considered diversified under the Investment Company Act of 1940, as amended (1940 Act), and offers Class A, Class C, Class R, Institutional Class, and Class R6 shares. Delaware International Value Equity fund is considered non-diversified under the 1940 Act. There is no front-end sales charge when you purchase $1,000,000 or more of Class A shares. However, if Delaware Distributors, L.P. (DDLP) paid your financial intermediary a commission on your purchase of $1,000,000 or more of Class A shares, for shares purchased prior to July 1, 2020, you will have to pay a limited contingent deferred sales charge (Limited CDSC) of 1.00% if you redeem these shares within the first year after your purchase and 0.50% if you redeem these shares within the second year; or for shares purchased on or after July 1, 2020, you will have to pay a Limited CDSC of 1.00% if you redeem these shares within the first 18 months after your purchase; unless a specific waiver of the Limited CDSC applies. Class C shares have no upfront sales charge, but are sold with a contingent deferred sales charge (CDSC) of 1.00%, which will be incurred if redeemed during the first 12 months. Class R, Institutional Class, and Class R6 shares are not subject to a sales charge and are offered for sale exclusively to certain eligible investors. In addition, Class R6 shares do not pay any service fees, sub-accounting fees, and/or sub-transfer agency fees to any brokers, dealers, or other financial intermediaries.
1. Significant Accounting Policies
Each Fund follows accounting and reporting guidance under Financial Accounting Standards Board (FASB) Accounting Standards Codification Topic 946, Financial Services — Investment Companies. The following accounting policies are in accordance with US generally accepted accounting principles (US GAAP) and are consistently followed by the Funds.
Security Valuation — Equity securities and exchange-traded funds (ETFs), except those traded on the Nasdaq Stock Market LLC (Nasdaq), are valued at the last quoted sales price as of the time of the regular close of the New York Stock Exchange on the valuation date. Equity securities and ETFs traded on the Nasdaq are valued in accordance with the Nasdaq Official Closing Price, which may not be the last sales price. If, on a particular day, an equity security or ETF does not trade, the mean between the bid and the ask prices will be used, which approximates fair value. Equity securities listed on a foreign exchange are normally valued at the last quoted sales price on the valuation date. Foreign currency exchange contracts are valued at the mean between the bid and the ask prices, which approximates fair value. Interpolated values are derived when the settlement date of the contract is an interim date for which quotations are not available. Open-end investment companies, other than ETFs, are valued at their published net asset value (NAV). Generally, other securities and assets for which market quotations are not readily available are valued at fair value as determined in good faith by the Funds’ valuation designee, Delaware Management Company (DMC). Subject to the oversight of the Funds Board
88
Table of Contents
of Trustees (Board), DMC, as valuation designee, has adopted policies and procedures to fair value securities for which market quotations are not readily available consistent with the requirements of Rule 2a-5 under the 1940 Act. In determining whether market quotations are readily available or fair valuation will be used, various factors will be taken into consideration, such as market closures or suspension of trading in a security. Restricted securities are valued at fair value.
Federal Income Taxes — No provision for federal income taxes has been made as each Fund intends to continue to qualify for federal income tax purposes as a regulated investment company under Subchapter M of the Internal Revenue Code of 1986, as amended, and make the requisite distributions to shareholders. Each Fund evaluates tax positions taken or expected to be taken in the course of preparing each Fund’s tax returns to determine whether the tax positions are “more-likely-than-not” of being sustained by the applicable tax authority. Tax positions not deemed to meet the “more-likely-than-not” threshold are recorded as a tax benefit or expense in the current year. Management has analyzed each Fund’s tax positions taken or expected to be taken on each Fund’s federal income tax returns through the year ended November 30, 2022, and for all open tax years (years ended November 30, 2019-November 30, 2022), and has concluded that no provision for federal income tax is required in each Fund’s financial statements. In regard to foreign taxes only, each Fund has open tax years in certain foreign countries in which it invests in that may date back to the inception of each Fund. If applicable, each Fund recognizes interest accrued on unrecognized tax benefits in interest expense and penalties in “Other” on the “Statements of operations.” During the year ended November 30, 2022, the Funds did not incur any interest or tax penalties.
Class Accounting — Investment income, common expenses, and realized and unrealized gain (loss) on investments are allocated to the various classes of each Fund on the basis of daily net assets of each class. Distribution expenses relating to a specific class are charged directly to that class. Class R6 shares will not be allocated any expenses related to service fees, sub-accounting fees, and/or sub-transfer agency fees paid to brokers, dealers, or other financial intermediaries.
Underlying Funds — The Funds may invest in other investment companies (Underlying Funds) to the extent permitted by the 1940 Act. The Underlying Funds in which the Funds may invest include ETFs. A Fund will indirectly bear the investment management fees and other expenses of the Underlying Funds.
Foreign Currency Transactions — Transactions denominated in foreign currencies are recorded at the prevailing exchange rates on the valuation date in accordance with each Fund’s prospectus. The value of all assets and liabilities denominated in foreign currencies is translated daily into US dollars at the exchange rate of such currencies against the US dollar. Transaction gains or losses resulting from changes in exchange rates during the reporting period or upon settlement of the foreign currency transaction are reported in operations for the current period. The Funds generally do not bifurcate that portion of realized gains and losses on investments which is due to changes in foreign exchange rates from that which is due to changes in market
89
Table of Contents
Notes to financial statements
Delaware International Funds
1. Significant Accounting Policies (continued) prices. These gains and losses are included on the “Statements of operations” under “Net realized gain (loss) on investments.” Each Fund reports certain foreign currency related transactions as components of realized gains (losses) for financial reporting purposes, whereas such components are treated as ordinary income (loss) for federal income tax purposes.
Derivative Financial Instruments - The Funds may invest in various derivative financial instruments. These instruments are used to obtain exposure to a security, commodity, index, market, and/or other assets without owning or taking physical custody of securities, commodities and/or other referenced assets or to manage market, equity, credit, interest rate, foreign currency exchange rate, commodity and/or other risks. Derivative financial instruments may give rise to a form of economic leverage and involve risks, including the imperfect correlation between the value of a derivative financial instrument and the underlying asset, possible default of the counterparty to the transaction or illiquidity of the instrument. Pursuant to Rule 18f-4 under the 1940 Act, among other things, the Funds must either use derivative financial instruments with embedded leverage in a limited manner or comply with an outer limit on fund leverage risk based on value-at-risk. Each Fund’s successful use of a derivative financial instrument depends on the investment adviser’s ability to predict pertinent market movements accurately, which cannot be assured. The use of these instruments may result in losses greater than if they had not been used, may limit the amount of appreciation the Funds can realize on an investment and/or may result in lower distributions paid to shareholders. Each Fund’s investments in these instruments, if any, are discussed in detail in the Notes to Financial Statements.
Segregation and Collateralizations - In certain cases, based on requirements and agreements with certain exchanges and third-party broker-dealers, the Funds may deliver collateral in connection with certain investments (e.g., futures contracts, foreign currency exchange contracts, options written, securities with extended settlement periods, and swaps). Certain countries require that cash reserves be held while investing in companies incorporated in that country. These cash reserves and cash collateral that has been pledged/received to cover obligations of the Funds under derivative contracts, if any, will be reported separately on the “Statements of assets and liabilities” as cash collateral due to/from broker. Securities collateral pledged for the same purpose, if any, is noted on the “Schedules of investments.”
Use of Estimates — The preparation of financial statements in conformity with US GAAP requires management to make estimates and assumptions that affect the fair value of investments, the reported amounts of assets and liabilities and disclosure of contingent assets and liabilities at the date of the financial statements, and the reported amounts of revenues and expenses during the reporting period. Actual results could differ from those estimates and the differences could be material.
Other — Expenses directly attributable to a Fund are charged directly to each Fund. Other expenses common to various funds within the Delaware Funds by Macquarie® (Delaware Funds) are generally allocated among such funds on the basis of average net assets. Management fees and certain other expenses are paid monthly. Security transactions are recorded on the date the
90
Table of Contents
securities are purchased or sold (trade date) for financial reporting purposes. Costs used in calculating realized gains and losses on the sale of investment securities are those of the specific securities sold. Dividend income is recorded on the ex-dividend date and interest income is recorded on the accrual basis. Income and capital gain distributions from any investment companies (Underlying Funds) in which the fund invests are recorded on the ex-dividend date. Discounts and premiums on debt securities are accreted or amortized to interest income, respectively, over the lives of the respective securities using the effective interest method. Taxable non-cash dividends are recorded as dividend income. Foreign dividends are also recorded on the ex-dividend date or as soon after the ex-dividend date that a Fund is aware of such dividends, net of all tax withholdings, a portion of which may be reclaimable. Withholding taxes and reclaims on foreign dividends have been recorded in accordance with each Fund’s understanding of the applicable country’s tax rules and rates. Each Fund may pay foreign capital gains taxes on certain foreign securities held, which are reported as components of realized losses for financial reporting purposes, whereas such components are treated as ordinary loss for federal income tax purposes. Each Fund will accrue such taxes as applicable based upon current interpretations of the tax rules and regulations that exist in the markets in which it invests. Each Fund declares and pays dividends from net investment income and distributions from net realized gain on investments, if any, annually. Each Fund may distribute more frequently, if necessary for tax purposes. Dividends and distributions, if any, are recorded on the ex-dividend date.
Each Fund receives earnings credits from its transfer agent when positive cash balances are maintained, which may be used to offset transfer agent fees. If the amount earned is greater than $1, the expenses paid under this arrangement are included on the “Statements of operations” under “Dividend disbursing and transfer agent fees and expenses” with the corresponding expenses offset included under “Less expenses paid indirectly.
2. Investment Management, Administration Agreements, and Other Transactions with Affiliates
In accordance with the terms of its respective investment management agreement, each Fund pays DMC, a series of Macquarie Investment Management Business Trust and the investment manager, an annual fee which is calculated daily and paid monthly, based on each Fund’s average daily net assets as follows:
| | | Delaware Emerging
Markets Fund | | Delaware International
Small Cap Fund | | Delaware International
Value Equity Fund |
| On the first $500 million | | 1.2500% | | 0.8500% | | 0.8500% |
| On the next $500 million | | 1.2000% | | 0.8000% | | 0.8000% |
| On the next $1.5 billion | | 1.1500% | | 0.7500% | | 0.7500% |
| In excess of $2.5 billion | | 1.1000% | | 0.7000% | | 0.7000% |
DMC has contractually agreed to waive all or a portion of its management fee and/or pay/reimburse expenses (excluding any distribution and service (12b-1) fees, acquired fund fees
91
Table of Contents
Notes to financial statements
Delaware International Funds
2. Investment Management, Administration Agreements, and Other Transactions with Affiliates (continued) and expenses, taxes, interest, short sale dividend and interest expenses, brokerage fees, certain insurance costs, and non-routine expenses or costs, including, but not limited to, those relating to reorganizations, litigation, conducting shareholder meetings, and liquidations), in order to prevent total annual fund operating expenses from exceeding the following specified percentages of average daily net assets of each Fund. The expense waivers were in effect from December 1, 2021 through November 30, 2022. These waivers and reimbursements may only be terminated by agreement of DMC and the Funds. The waivers and reimbursements are accrued daily and received monthly.
| Fund | | Operating expense
limitation as
a percentage
of average
daily net assets
(per annum)
December 1, 2021-
March 29, 2022 | | Operating expense
limitation as
a percentage
of average
daily net assets
(per annum)
March 30, 2022-
November 30, 2022 |
| Delaware Emerging Markets Fund | | 1.32%1 | | 1.23%2 |
| Delaware International Small Cap Fund | | 1.12%3 | | 1.12%3 |
| Delaware International Value Equity Fund | | 0.88%4 | | 0.88%5 |
| 1 | The expense limitation was 1.20% for Class R6 shares. |
| 2 | The expense limitation is 1.14% for Class R6 shares. |
| 3 | The expense limitation is 1.00% for Class R6 shares. |
| 4 | The expense limitation was 0.82% for Class R6 shares. |
| 5 | The expense limitation is 0.81% for Class R6 shares. |
DMC may permit its affiliates, Macquarie Investment Management Global Limited (MIMGL) and Macquarie Funds Management Hong Kong Limited (together, the “Affiliated Sub-Advisors”), to execute Fund equity security trades on behalf of the Manager. The Manager may also seek quantitative support from MIMGL. Although the Affiliated Sub-Advisors serve as sub-advisors, DMC has ultimate responsibility for all investment advisory services. For these services, DMC, not the Funds, may pay each Affiliated Sub-Advisor a portion of its investment management fee.
Delaware Investments Fund Services Company (DIFSC), an affiliate of DMC, provides fund accounting and financial administrative oversight services to each Fund. For these services, DIFSC’s fees are calculated daily and paid monthly, based on the aggregate daily net assets of all funds within the Delaware Funds at the following annual rates: 0.00475% of the first $35 billion; 0.0040% of the next $10 billion; 0.0025% of the next $45 billion; and 0.0015% of aggregate average daily net assets in excess of $90 billion (Total Fee). Each fund in the Delaware Funds pays a minimum of $4,000, which, in aggregate, is subtracted from the Total Fee. Each fund then pays its portion of the remainder of the Total Fee on a relative NAV basis. These amounts are included on the “Statements of operations” under “Accounting and
92
Table of Contents
administration expenses.” For the year ended November 30, 2022, each Fund paid for these services as follows:
| Fund | | Fees |
| Delaware Emerging Markets Fund | | $ | 175,277 |
| Delaware International Small Cap Fund | | | 10,026 |
| Delaware International Value Equity Fund | | | 18,320 |
DIFSC is also the transfer agent and dividend disbursing agent of the Funds. For these services, DIFSC’s fees are calculated daily and paid monthly, based on the aggregate daily net assets of the retail funds within the Delaware Funds at the following annual rates: 0.014% of the first $20 billion; 0.011% of the next $5 billion; 0.007% of the next $5 billion; 0.004% of the next $20 billion; 0.002% of the next $25 billion; and 0.0015% of average daily net assets in excess of $75 billion. The fees payable to DIFSC under the shareholder services agreement described above are allocated among all retail funds in the Delaware Funds on a relative NAV basis. This amount is included on the “Statements of operations” under “Dividend disbursing and transfer agent fees and expenses.” For the year ended November 30, 2022, each Fund was charged for these services as follows:
| Fund | | Fees |
| Delaware Emerging Markets Fund | | $ | 531,760 |
| Delaware International Small Cap Fund | | | 7,652 |
| Delaware International Value Equity Fund | | | 40,675 |
Pursuant to a sub-transfer agency agreement between DIFSC and BNY Mellon Investment Servicing (US) Inc. (BNYMIS), BNYMIS provides certain sub-transfer agency services to the Funds. Sub-transfer agency fees are paid by the Funds and are also included on the “Statements of operations” under “Dividend disbursing and transfer agent fees and expenses.” The fees that are calculated daily and paid as invoices are received on a monthly or quarterly basis.
Pursuant to a distribution agreement and distribution plan, each Fund pays DDLP, the distributor and an affiliate of DMC, annual 12b-1 fee of 0.25%, 1.00%, and 0.50% of average daily net assets of the Class A, Class C, and Class R shares, respectively. The fees are calculated daily and paid monthly. Institutional Class and Class R6 shares do not pay 12b-1 fees.
As provided in the investment management agreement, each Fund bears a portion of the cost of certain resources shared with DMC, including the cost of internal personnel of DMC and/or its affiliates that provide legal and regulatory reporting services to the Funds. These amounts are included on the “Statements of operations” under “Legal fees.” For the year ended November 30, 2022, each Fund was charged for internal legal and regulatory reporting services provided by DMC and/or its affiliates’ employees as follows:
| Fund | | Fees |
| Delaware Emerging Markets Fund | | $ | 139,759 |
93
Table of Contents
Notes to financial statements
Delaware International Funds
2. Investment Management, Administration Agreements, and Other Transactions with Affiliates (continued)
| Fund | | Fees |
| Delaware International Small Cap Fund | | $ | 2,128 |
| Delaware International Value Equity Fund | | | 11,261 |
For the year ended November 30, 2022, DDLP earned commissions on sales of Class A shares for each Fund as follows:
| Fund | | Class A |
| Delaware Emerging Markets Fund | | $ | 13,485 |
| Delaware International Small Cap Fund | | | 755 |
| Delaware International Value Equity Fund | | | 16,156 |
For the year ended November 30, 2022, DDLP received gross CDSC commissions on redemptions of each Fund’s Class A and Class C shares, and these commissions were entirely used to offset upfront commissions previously paid by DDLP to broker/dealers on sales of those shares. The amounts received were as follows:
| Fund | | Class A | | | Class C |
| Delaware Emerging Markets Fund | | $ | 6,773 | | | $ | 7,003 |
| Delaware International Small Cap Fund | | | — | | | | 14 |
| Delaware International Value Equity Fund | | | 68 | | | | 93 |
Trustees’ fees include expenses accrued by each Fund for each Trustee’s retainer and meeting fees. Certain officers of DMC, DIFSC, and DDLP are officers and/or Trustees of the Trust. These officers and Trustees are paid no compensation by the Funds.
In addition to the management fees and other expenses of a Fund, a Fund indirectly bears the investment management fees and other expenses of any Underlying Funds in which it invests. The amount of these fees and expenses incurred indirectly by a Fund will vary based upon the expense and fee levels of any Underlying Funds and the number of shares that are owned of any Underlying Funds at different times.
| * | The aggregate contractual waiver period covering this report is from March 30, 2021 through March 31, 2023. |
3. Investments
For the year ended November 30, 2022, each Fund made purchases and sales of investment securities other than short-term investments as follows:
| Fund | | Purchases | | | Sales |
| Delaware Emerging Markets Fund | | $ | 581,777,105 | | | $ | 572,617,758 |
| Delaware International Small Cap Fund | | | 43,181,946 | | | | 51,082,933 |
| Delaware International Value Equity Fund | | | 146,344,497 | | | | 265,575,941 |
94
Table of Contents
The tax cost of investments and derivatives includes adjustments to net unrealized appreciation (depreciation) which may not necessarily be the final tax cost basis adjustments but which approximate the tax basis unrealized gains and losses that may be realized and distributed to shareholders. At November 30, 2022, the cost and unrealized appreciation (depreciation) of investments and derivatives for federal income tax purposes for each Fund were as follows:
| Fund | | Cost of
investments
and derivatives | | | Aggregate
unrealized
appreciation
of investments
and derivatives | | | Aggregate
unrealized
depreciation
of investments
and derivatives | | | Net unrealized
appreciation
(depreciation)
of investments
and derivatives | |
Delaware
Emerging
Markets
Fund | | $ | 5,113,894,993 | | | $ | 1,144,349,019 | | | $ | (1,474,865,306 | ) | | $ | (330,516,287 | ) |
Delaware
International
Small
Cap
Fund | | | 67,122,662 | | | | 8,963,015 | | | | (4,694,570 | ) | | | 4,268,445 | |
Delaware
International
Value
Equity
Fund | | | 391,130,648 | | | | 31,969,093 | | | | (85,555,975 | ) | | | (53,586,882 | ) |
US GAAP defines fair value as the price that each Fund would receive to sell an asset or pay to transfer a liability in an orderly transaction between market participants at the measurement date under current market conditions. A three-level hierarchy for fair value measurements has been established based upon the transparency of inputs to the valuation of an asset or liability. Inputs may be observable or unobservable and refer broadly to the assumptions that market participants would use in pricing the asset or liability. Observable inputs reflect the assumptions market participants would use in pricing the asset or liability based on market data obtained from sources independent of the reporting entity. Unobservable inputs reflect the reporting entity’s own assumptions about the assumptions that market participants would use in pricing the asset or liability based on the best information available under the circumstances. Each Fund’s investment in its entirety is assigned a level based upon the observability of the inputs which are significant to the overall valuation. The three-level hierarchy of inputs is summarized as follows:
| Level 1 | – | Inputs are quoted prices in active markets for identical investments. (Examples: equity securities, open-end investment companies, futures contracts, and exchange-traded options contracts) |
| | | |
| Level 2 | – | Other observable inputs, including, but not limited to: quoted prices for similar assets or liabilities in markets that are active, quoted prices for identical or similar assets or liabilities in markets that are not active, inputs other than quoted prices that are observable for the assets or liabilities (such as interest rates, yield curves, volatilities, |
95
Table of Contents
Notes to financial statements
Delaware International Funds
3. Investments (continued)
| | | prepayment speeds, loss severities, credit risks, and default rates) or other market-corroborated inputs. (Examples: debt securities, government securities, swap contracts, foreign currency exchange contracts, foreign securities utilizing international fair value pricing, broker-quoted securities, and fair valued securities) |
| | | |
| Level 3 | – | Significant unobservable inputs, including each Fund’s own assumptions used to determine the fair value of investments. (Examples: broker-quoted securities and fair valued securities) |
Level 3 investments are valued using significant unobservable inputs. Each Fund may also use an income-based valuation approach in which the anticipated future cash flows of the investment are discounted to calculate fair value. Discounts may also be applied due to the nature or duration of any restrictions on the disposition of the investments. Valuations may also be based upon current market prices of securities that are comparable in coupon, rating, maturity, and industry. The derived value of a Level 3 investment may not represent the value which is received upon disposition and this could impact the results of operations.
The following tables summarize the valuation of each Fund’s investments by fair value hierarchy levels as of November 30, 2022:
| | | Delaware Emerging Markets Fund |
| | | Level 1 | | | Level 2 | | | Level 3 | | | Total |
| Securities | | | | | | | | | | | | | | | |
| Assets: | | | | | | | | | | | | | | | |
| Common Stocks | | | | | | | | | | | | | | | |
| Argentina | | $ | 20,338,547 | | | $ | 1,200,585 | | | $ | — | | | $ | 21,539,132 |
| Australia | | | 82,239,513 | | | | — | | | | — | | | | 82,239,513 |
| Bahrain | | | 2,977,454 | | | | — | | | | — | | | | 2,977,454 |
| Brazil | | | 279,978,127 | | | | — | | | | — | | | | 279,978,127 |
| Chile | | | 84,328,231 | | | | — | | | | — | | | | 84,328,231 |
| China | | | 512,095,909 | | | | 784,124,727 | | | | — | | | | 1,296,220,636 |
| Hong Kong | | | — | | | | 11,194,391 | | | | — | | | | 11,194,391 |
| India | | | — | | | | 754,196,945 | | | | — | | | | 754,196,945 |
| Indonesia | | | — | | | | 74,479,886 | | | | — | | | | 74,479,886 |
| Malaysia | | | — | | | | 1,077,630 | | | | — | | | | 1,077,630 |
| Mexico | | | 235,669,642 | | | | — | | | | — | | | | 235,669,642 |
| Peru | | | 26,253,984 | | | | — | | | | — | | | | 26,253,984 |
| Republic of Korea | | | 80,748,922 | | | | 819,217,682 | | | | — | | | | 899,966,604 |
| Russia | | | 439,358 | | | | — | | | | —1,2 | | | | 439,358 |
| South Africa | | | 755,443 | | | | 13,241,714 | | | | — | | | | 13,997,157 |
| Taiwan | | | — | | | | 749,996,826 | | | | — | | | | 749,996,826 |
| Turkey | | | 38,233,283 | | | | 21,463,924 | | | | — | | | | 59,697,207 |
| United Kingdom | | | 2,615,263 | | | | — | | | | — | | | | 2,615,263 |
96
Table of Contents
| | | Delaware Emerging Markets Fund |
| | | Level 1 | | | Level 2 | | | Level 3 | | | Total |
| United States | | $ | 81,706,000 | | | $ | — | | | $ | — | | | $ | 81,706,000 |
| Exchange-Traded Fund | | | 9,956,433 | | | | — | | | | — | | | | 9,956,433 |
| Participation Notes | | | — | | | | — | | | | — | 2 | | | — |
| Preferred Stocks3 | | | 38,482,493 | | | | 50,875,276 | | | | — | 1,2 | | | 89,357,769 |
| Rights | | | 1,033,294 | | | | — | | | | — | | | | 1,033,294 |
| Warrants | | | 376,539 | | | | — | | | | — | | | | 376,539 |
| Short-Term Investments | | | 4,080,685 | | | | — | | | | — | | | | 4,080,685 |
| Total Value of Securities | | $ | 1,502,309,120 | | | $ | 3,281,069,586 | | | $ | — | | | $ | 4,783,378,706 |
| 1 | The value represents valuations of Russian Common Stocks for which Management has determined include significant unobservable inputs as of November 30, 2022. |
| 2 | The security that has been valued at zero on the “Schedule of investments” is considered to be Level 3 investment in this table. |
| 3 | Security type is valued across multiple levels. The amounts attributed to Level 1 investments and Level 2 investments represent 43.07% and 56.93%, respectively, of the total market value of this security type. Level 1 investments represent exchange-traded investments and Level 2 investments represent investments with observable inputs or matrix-priced investments. |
| | | Delaware International Small Cap Fund |
| | | Level 1 | | | Level 2 | | | Level 3 | | | Total |
| Securities | | | | | | | | | | | | | | | |
| Assets: | | | | | | | | | | | | | | | |
| Common Stocks | | | | | | | | | | | | | | | |
| Argentina | | $ | 605,080 | | | $ | — | | | $ | — | | | $ | 605,080 |
| Australia | | | — | | | | 2,420,304 | | | | — | | | | 2,420,304 |
| Austria | | | — | | | | 367,424 | | | | — | | | | 367,424 |
| Brazil | | | 3,305,623 | | | | — | | | | — | | | | 3,305,623 |
| Canada | | | 8,250,081 | | | | — | | | | — | | | | 8,250,081 |
| China | | | — | | | | 780,178 | | | | — | | | | 780,178 |
| Denmark | | | — | | | | 1,318,072 | | | | — | | | | 1,318,072 |
| Finland | | | — | | | | 544,812 | | | | — | | | | 544,812 |
| France | | | — | | | | 2,009,009 | | | | — | | | | 2,009,009 |
| Germany | | | — | | | | 1,720,524 | | | | — | | | | 1,720,524 |
| India | | | — | | | | 3,999,379 | | | | — | | | | 3,999,379 |
| Indonesia | | | — | | | | 480,275 | | | | — | | | | 480,275 |
| Ireland | | | 626,106 | | | | — | | | | — | | | | 626,106 |
| Israel | | | 829,915 | | | | — | | | | — | | | | 829,915 |
| Italy | | | — | | | | 2,380,699 | | | | — | | | | 2,380,699 |
| Japan | | | — | | | | 18,783,705 | | | | — | | | | 18,783,705 |
| Malaysia | | | — | | | | 262,405 | | | | — | | | | 262,405 |
| Mexico | | | 2,673,447 | | | | — | | | | — | | | | 2,673,447 |
| Norway | | | 492,375 | | | | 2,189,723 | | | | — | | | | 2,682,098 |
97
Table of Contents
Notes to financial statements
Delaware International Funds
3. Investments (continued)
| | | Delaware International Small Cap Fund |
| | | Level 1 | | | Level 2 | | | Level 3 | | | Total |
| Republic of Korea | | $ | — | | | $ | 1,620,870 | | | $ | — | | | $ | 1,620,870 | |
| Russia | | | — | | | | — | | | | 10,216 | 1 | | | 10,216 | |
| South Africa | | | 1,884,673 | | | | — | | | | — | | | | 1,884,673 | |
| Spain | | | — | | | | 1,451,220 | | | | — | | | | 1,451,220 | |
| Sweden | | | — | | | | 1,247,059 | | | | — | | | | 1,247,059 | |
| Taiwan | | | — | | | | 1,397,708 | | | | — | | | | 1,397,708 | |
| Thailand | | | 490,331 | | | | — | | | | — | | | | 490,331 | |
| United Kingdom | | | — | | | | 6,566,153 | | | | — | | | | 6,566,153 | |
| United States | | | 807,022 | | | | — | | | | — | | | | 807,022 | |
| Short-Term Investments | | | 1,876,724 | | | | — | | | | — | | | | 1,876,724 | |
| Total Value of Securities | | $ | 21,841,377 | | | $ | 49,539,519 | | | $ | 10,216 | | | $ | 71,391,112 | |
| | | | | | | | | | | | | | | | |
| Derivatives2 | | | | | | | | | | | | | | | |
| Assets: | | | | | | | | | | | | | | | |
| Foreign Currency Exchange Contracts | | $ | — | | | $ | 1 | | | $ | — | | | $ | 1 | |
| Liabilities: | | | | | | | | | | | | | | | |
| Foreign Currency Exchange Contracts | | $ | — | | | $ | (6 | ) | | $ | — | | | $ | (6 | ) |
| 1 | The value represents valuations of Russian Common Stocks for which Management has determined include significant unobservable inputs as of November 30, 2022. |
| 2 | Foreign currency exchange contracts are valued at the unrealized appreciation (depreciation) on the instrument at the year end. |
| | | Delaware International Value Equity Fund | |
| | | Level 1 | | | Level 2 | | | Total | |
| Securities | | | | | | | | | | | | |
| Assets: | | | | | | | | | | | | |
| Common Stocks | | $ | — | | | $ | 335,819,205 | | | $ | 335,819,205 | |
| Exchange-Traded Funds | | | 1,489,778 | | | | — | | | | 1,489,778 | |
| Securities Lending Collateral | | | 232,685 | | | | — | | | | 232,685 | |
| Total Value of Securities | | $ | 1,722,463 | | | $ | 335,819,205 | | | $ | 337,541,668 | |
| Derivatives1 | | | | | | | | | | | | |
| Assets: | | | | | | | | | | | | |
| Foreign Currency Exchange Contracts | | $ | — | | | $ | 3,741 | | | $ | 3,741 | |
| Liabilities: | | | | | | | | | | | | |
| Foreign Currency Exchange Contracts | | $ | — | | | $ | (1,643 | ) | | $ | (1,643 | ) |
| 1 | Foreign currency exchange contracts are valued at the unrealized appreciation (depreciation) on the instrument at the year end. |
98
Table of Contents
During the year ended November 30, 2022, there were no transfers into or out of Level 3 investments. Each Fund’s policy is to recognize transfers into or out of Level 3 investments based on fair value at the beginning of the reporting period.
A reconciliation of Level 3 investments is presented when a Fund has a significant amount of Level 3 investments at the beginning or end of the year in relation to that Fund’s net assets. Management has determined not to provide a reconciliation of Level 3 investments as the Level 3 investments were not considered significant to each Fund’s net assets at the beginning or end of the year. Management has determined not to provide additional disclosure on Level 3 inputs since the Level 3 investments are not considered significant to each Fund’s net assets at the end of the year.
During the year ended November 30, 2022, Delaware International Value Equity Fund had no Level 3 investments.
4. Dividend and Distribution Information
Income and long-term capital gain distributions are determined in accordance with federal income tax regulations, which may differ from US GAAP. Additionally, distributions from net gains on foreign currency transactions and net short-term gains on sales of investment securities are treated as ordinary income for federal income tax purposes. The tax character of dividends and distributions paid during the years ended November 30, 2022 and 2021 were as follows:
| | | Ordinary
income | | | Long-term
capital
gains | | | Total |
| Year ended November 30, 2022: | | | | | | | | | | | |
| Delaware Emerging Markets Fund | | $ | 219,173,691 | | | $ | — | | | $ | 219,173,691 |
| Delaware International Small Cap Fund | | | 10,446 | | | | 5,675,438 | | | | 5,685,884 |
| Delaware International Value Equity Fund | | | 6,236,252 | | | | 33,387,657 | | | | 39,623,909 |
| Year ended November 30, 2021: | | | | | | | | | | | |
| Delaware Emerging Markets Fund | | | 10,224,841 | | | | 34,112,235 | | | | 44,337,076 |
| Delaware International Small Cap Fund | | | — | | | | — | | | | — |
| Delaware International Value Equity Fund | | | 3,303,244 | | | | 2,388,057 | | | | 5,691,301 |
Delaware International Small Cap Fund did not pay any dividends and distributions for the year ending November 30, 2021.
99
Table of Contents
Notes to financial statements
Delaware International Funds
5. Components of Net Assets on a Tax Basis
As of November 30, 2022, the components of net assets on a tax basis were as follows:
| | | Delaware Emerging
Markets Fund | | | Delaware International
Small Cap Fund | | | Delaware International
Value Equity Fund | |
Shares of beneficial
interest | | $ | 5,127,305,429 | | | $ | 75,054,187 | | | $ | 395,690,078 | |
Undistributed ordinary
income | | | 72,979,389 | | | | 360,906 | | | | 4,383,117 | |
| Capital loss carryforwards | | | (95,911,582 | ) | | | (8,224,089 | ) | | | (6,348,787 | ) |
Unrealized appreciation
(depreciation) of
investments, foreign
currencies, and
derivatives | | | (355,210,461 | ) | | | 4,268,445 | | | | (53,819,835 | ) |
| Net assets | | $ | 4,749,162,775 | | | $ | 71,459,449 | | | $ | 339,904,573 | |
The differences between book basis and tax basis components of net assets are primarily attributable to tax deferral of losses on wash sales, tax treatment of forward currency contracts, tax treatment of passive foreign investment companies (PFICs), and securities no longer considered PFICs.
For financial reporting purposes, capital accounts are adjusted to reflect the tax character of permanent book/tax differences. Results of operations and net assets were not affected by these reclassifications. For the year ended November 30, 2022, the Funds have no reclassifications.
For federal income tax purposes, capital loss carryforwards may be carried forward and applied against future capital gains. At November 30, 2022, Delaware Emerging Markets Fund utilized 110,715,966 capital loss carryforwards.
Delaware International Small Cap Fund and Delaware International Value Equity Fund did not utilize capital loss carryforward for 2022.
100
Table of Contents
At November 30, 2022, capital loss carryforwards available to offset future realized capital gains were as follows:
| | | Loss carryforward character | | | | |
| | | Short-term | | | Long-term | | | Total | |
Delaware Emerging
Markets Fund | | $ | 12,586,798 | | | $ | 83,324,784 | | | $ | 95,911,582 | |
Delaware
International
Small Cap Fund | | | 6,888,440 | | | | 1,335,649 | | | | 8,224,089 | |
Delaware
International
Value Equity
Fund | | | 2,181,944 | | | | 4,166,843 | | | | 6,348,787 | |
101
Table of Contents
Notes to financial statements
Delaware International Funds
6. Capital Shares
Transactions in capital shares were as follows:
| | | Delaware Emerging
Markets Fund | | | Delaware International
Small Cap Fund | | | Delaware International
Value Equity Fund | |
| | | Year ended | | | | | | | | | | | | | |
| | | 11/30/22 | | | 11/30/21 | | | 11/30/22 | | | 11/30/21 | | | 11/30/22 | | | 11/30/21 | |
| Shares sold: | | | | | | | | | | | | | | | | | | | | | | | | |
| Class A | | | 2,384,624 | | | | 3,504,915 | | | | 102,221 | | | | 325,112 | | | | 751,706 | | | | 3,662,429 | |
| Class C | | | 260,415 | | | | 757,294 | | | | 24,980 | | | | 7,548 | | | | 59,235 | | | | 29,493 | |
| Class R | | | 251,660 | | | | 323,745 | | | | 231 | | | | 960 | | | | 47,401 | | | | 218,407 | |
Institutional
Class | | | 69,311,633 | | | | 63,660,609 | | | | 1,526,930 | | | | 978,951 | | | | 5,300,882 | | | | 4,469,948 | |
| Class R6 | | | 39,808,326 | | | | 58,876,456 | | | | 995,679 | | | | 844,837 | | | | 149,296 | | | | 162,769 | |
| | | | | | | | | | | | | | | | | | | | | | | | | |
| Shares from merger:1 | | | | | | | | | | | | | | | | | | | |
| Class A | | | — | | | | — | | | | — | | | | — | | | | — | | | | 7,352,351 | |
Institutional
Class | | | — | | | | — | | | | — | | | | — | | | | — | | | | 7,755,262 | |
| Class R6 | | | — | | | | — | | | | — | | | | — | | | | — | | | | 10,980 | |
| | | | | | | | | | | | | | | | | | | | | | | | | |
| Shares issued upon reinvestment of dividends and distributions: |
| Class A | | | 452,712 | | | | 83,142 | | | | 60,266 | | | | — | | | | 1,000,549 | | | | 61,789 | |
| Class C | | | 121,108 | | | | 33,203 | | | | 18,584 | | | | — | | | | 21,093 | | | | 3,021 | |
| Class R | | | 40,147 | | | | 9,242 | | | | 1,114 | | | | — | | | | 24,370 | | | | 2,660 | |
Institutional
Class | | | 4,559,885 | | | | 1,109,857 | | | | 340,875 | | | | — | | | | 1,628,365 | | | | 300,524 | |
| Class R6 | | | 2,417,840 | | | | 245,069 | | | | 98,023 | | | | — | | | | 12,244 | | | | 359 | |
| | | | 119,608,350 | | | | 128,603,532 | | | | 3,168,903 | | | | 2,157,408 | | | | 8,995,141 | | | | 24,029,992 | |
| | | | | | | | | | | | | | | | | | | | |
| Shares redeemed: | | | | | | | | | | | | | | | | | | | |
| Class A | | | (4,033,335 | ) | | | (4,005,757 | ) | | | (191,822 | ) | | | (194,649 | ) | | | (2,716,133 | ) | | | (2,088,103 | ) |
| Class C | | | (1,651,351 | ) | | | (1,466,111 | ) | | | (97,388 | ) | | | (192,565 | ) | | | (107,754 | ) | | | (153,594 | ) |
| Class R | | | (497,316 | ) | | | (548,343 | ) | | | (511 | ) | | | (24,992 | ) | | | (275,014 | ) | | | (93,006 | ) |
Institutional
Class | | | (84,350,652 | ) | | | (82,650,556 | ) | | | (2,180,790 | ) | | | (3,777,033 | ) | | | (12,839,638 | ) | | | (8,724,301 | ) |
| Class R6 | | | (28,135,314 | ) | | | (16,613,895 | ) | | | (1,452,337 | ) | | | (75,349 | ) | | | (158,496 | ) | | | (40,620 | ) |
| | | | (118,667,968 | ) | | | (105,284,662 | ) | | | (3,922,848 | ) | | | (4,264,588 | ) | | | (16,097,035 | ) | | | (11,099,624 | ) |
| Net increase (decrease) | | | 940,382 | | | | 23,318,870 | | | | (753,945 | ) | | | (2,107,180 | ) | | | (7,101,894 | ) | | | 12,930,368 | |
102
Table of Contents
Certain shareholders may exchange shares of one class for shares of another class in the same Fund. These exchange transactions are included as subscriptions and redemptions in the table on the previous page and on the “Statements of changes in net assets.” For the years ended November 30, 2022 and November 30, 2021, each Fund had the following exchange transactions:
| | | Exchange Redemptions | | | Exchange Subscriptions | | | |
| | | Class A
Shares | | | Class C
Shares | | | Institutional
Class
Shares | | | Class R6
Shares | | | Class A
Shares | | | Institutional
Class
Shares | | | Class R6
Shares | | | Value |
| | | | | | | | | | | | | | | | | | | | | | | | |
| Delaware Emerging Markets Fund |
| Year ended | | | | | | | | | | | | | | | | | | | | | | | | | | | | | | | |
| 11/30/22 | | | 41,481 | | | | 43,580 | | | | 19,286 | | | | — | | | | 30,736 | | | | 48,267 | | | | 21,290 | | | $ | 1,865,718 |
| 11/30/21 | | | 32,080 | | | | 21,200 | | | | 30,353,407 | | | | 3,061,113 | | | | 29,848 | | | | 3,071,420 | | | | 30,331,738 | | | | 830,172,974 |
| | | | | | | | | | | | | | | | | | | | | | | | | | | | | | | | |
| Delaware International Small Cap Fund |
| Year ended | | | | | | | | | | | | | | | | | | | | | | | | | | | | | | | |
| 11/30/22 | | | — | | | | 688 | | | | — | | | | — | | | | 557 | | | | — | | | | — | | | | 4,095 |
| 11/30/21 | | | 600 | | | | 17,663 | | | | — | | | | — | | | | 14,617 | | | | 570 | | | | — | | | | 144,060 |
| | | | | | | | | | | | | | | | | | | | | | | | | | | | | | | | |
| Delaware International Value Equity Fund |
| Year ended | | | | | | | | | | | | | | | | | | | | | | | | | | | | | | | |
| 11/30/22 | | | 2,231 | | | | 6,800 | | | | 758 | | | | — | | | | 7,495 | | | | 2,219 | | | | — | | | | 118,823 |
| 11/30/21 | | | 129,231 | | | | 17,859 | | | | — | | | | — | | | | 17,752 | | | | 128,609 | | | | — | | | | 2,404,406 |
7. Reorganization
On July 9, 2021, the Board approved a proposal to reorganize Delaware International Fund, a series of Delaware Group® Equity Funds IV (the “Acquired Fund”) with and into Delaware International Value Equity Fund (the “Acquiring Fund”), (the “Reorganization”). Pursuant to an Agreement and Plan of Reorganization (the “Plan”): (i) all of the property, assets, and goodwill of the Acquired Fund were acquired by the Acquiring Fund, and (ii) the Trust, on behalf of the Acquiring Fund, assumed the liabilities of the Acquired Fund, in exchange for shares of the Acquiring Fund. In accordance with the Plan, the Acquired Fund liquidated and dissolved following the Reorganization. The purpose of the transaction was to allow shareholders of the Acquired Fund to own shares of a Fund with a similar investment objective and style as, and potentially lower net expenses than the Acquired Fund. The Reorganization was accomplished by a tax-free exchange of shares on July 9, 2021. For financial reporting purposes, assets received and shares issued by the Acquiring Fund were recorded at fair value; however, the cost basis of the investments received from the Acquired Fund was carried forward to align ongoing reporting of the Acquiring Fund’s realized and unrealized gains and losses with amounts distributable to shareholders for tax purposes.
103
Table of Contents
Notes to financial statements
Delaware International Funds
7. Reorganization (continued)
The share transactions associated with the Reorganization are as follows:
| | | Acquired
Fund
Net Assets | | | Acquired
Fund Shares
Outstanding | | | Shares
Converted
to Acquiring
Fund | | | Acquiring
Fund
Net Assets | | | Conversion
Ratio |
| | | Delaware International Fund | | | Delaware International Value
Equity Fund | | | |
| Class A | | $ | 123,151,872 | | | | 8,950,423 | | | | 7,352,351 | | | $ | 108,216,266 | | | | 0.8215 |
Institutional
Class | | | 130,443,502 | | | | 9,193,655 | | | | 7,755,262 | | | | 272,890,128 | | | | 0.8435 |
| Class R6 | | | 184,692 | | | | 12,928 | | | | 10,980 | | | | 2,036,414 | | | | 0.8493 |
The net assets of the Acquiring Fund before the Reorganization were $394,025,097. The net assets of the Acquiring Fund immediately following the Reorganization were $647,805,163.
Assuming the Reorganization had been completed on December 1, 2020, the Acquiring Fund’s pro forma results of operations for the year ended November 30, 2021, would have been as follows:
| | Delaware International Value Equity Fund |
| Net investment income | | $ | 6,977,433 | |
| Net realized gain on investments | | | 51,709,316 | |
| Net change in unrealized appreciation (depreciation) | | | (566,877 | ) |
| Net increase in net assets resulting from operations | | $ | 58,119,872 | |
8. Line of Credit
Each Fund, along with certain other funds in the Delaware Funds (Participants), was a participant in a $355,000,000 revolving line of credit (Agreement) intended to be used for temporary or emergency purposes as an additional source of liquidity to fund redemptions of investor shares. Under the Agreement, the Participants were charged an annual commitment fee of 0.15%, which was allocated across the Participants based on a weighted average of the respective net assets of each Participant. The Participants were permitted to borrow up to a maximum of one-third of their net assets under the Agreement. Each Participant was individually, and not jointly, liable for its particular advances, if any, under the line of credit. The line of credit available under the Agreement expired on October 31, 2022.
On October 31, 2022, each Fund, along with the other Participants, entered into an amendment to the agreement for a $355,000,000 revolving line of credit to be used as described above. It operates in substantially the same manner as the Original Agreement. Under the amendment to the agreement, the Participants are charged an annual commitment fee of 0.15%, which is allocated across the Participants based on a weighted average of the respective net assets of each Participant. The line of credit available under the agreement expires on October 30, 2023.
104
Table of Contents
Each Fund had no amounts outstanding as of November 30, 2022, or at any time during the year then ended.
9. Derivatives
US GAAP requires disclosures that enable investors to understand: (1) how and why an entity uses derivatives; (2) how they are accounted for; and (3) how they affect an entity’s results of operations and financial position.
Foreign Currency Exchange Contracts — Each Fund may enter into foreign currency exchange contracts and foreign cross currency exchange contracts as a way of managing foreign exchange rate risk. Each Fund may enter into these contracts to fix the US dollar value of a security that it has agreed to buy or sell for the period between the date the trade was entered into and the date the security is delivered and paid for. Each Fund may also use these contracts to hedge the US dollar value of securities it already owns that are denominated in foreign currencies. In addition, each Fund may enter into these contracts to facilitate or expedite the settlement of portfolio transactions. The change in value is recorded as an unrealized gain or loss. When the contract is closed, a realized gain or loss is recorded equal to the difference between the value of the contract at the time it was opened and the value at the time it was closed.
The use of foreign currency exchange contracts and foreign cross currency exchange contracts does not eliminate fluctuations in the underlying prices of the securities, but does establish a rate of exchange that can be achieved in the future. Although foreign currency exchange contracts and foreign cross currency exchange contracts limit the risk of loss due to an unfavorable change in the value of the hedged currency, they also limit any potential gain that might result should the value of the currency change favorably. In addition, each Fund could be exposed to risks if the counterparties to the contracts are unable to meet the terms of their contracts. Each Fund’s maximum risk of loss from counterparty credit risk is the value of its currency exchanged with the counterparty. The risk is generally mitigated by having a netting arrangement between each Fund and the counterparty and by the posting of collateral by the counterparty to each Fund to cover each Fund’s exposure to the counterparty.
During the year ended November 30, 2022, Delaware Emerging Markets Fund and Delaware International Small Cap Fund entered into foreign currency exchange contracts and foreign cross currency exchange contracts to facilitate or expedite the settlement of portfolio transactions. Delaware International Value Equity Fund entered into foreign currency exchange contracts and foreign cross currency contracts in order to fix the US dollar value of a security between trade date and settlement date.
During the year ended November 30, 2022, the Funds experienced net realized and unrealized gains or losses attributable to foreign currency holdings, which are disclosed on the “Statements of assets and liabilities” and “Statements of operations.”
105
Table of Contents
Notes to financial statements
Delaware International Funds
9. Derivatives (continued)
The table below summarizes the average daily balance of derivative holdings by each Fund during the year ended November 30, 2022:
| | | Long Derivative Volume |
| | | Delaware Emerging
Markets Fund | | | Delaware International
Small Cap Fund | | | Delaware International
Value Equity Fund |
Foreign currency
exchange contracts
(average notional
value) | | $ | 324,754 | | | $ | 115,146 | | | $ | 370,220 |
| | | | | | | | | | | | |
| | | Short Derivative Volume |
| | | Delaware Emerging
Markets Fund | | | Delaware International
Small Cap Fund | | | Delaware International
Value Equity Fund |
Foreign currency
exchange contracts
(average notional
value) | | $ | 607,958 | | | $ | 128,475 | | | $ | 837,090 |
10. Offsetting
Each Fund entered into an International Swaps and Derivatives Association, Inc. Master Agreement (ISDA Master Agreement) or a similar agreement with certain of their derivative contract counterparties in order to better define their contractual rights and to secure rights that will help each Fund mitigate its counterparty risk. An ISDA Master Agreement is a bilateral agreement between each Fund and a counterparty that governs over-the-counter (OTC) derivatives and foreign exchange contracts and typically contains, among other things, collateral posting items and netting provisions in the event of a default and/or termination event. Under an ISDA Master Agreement, each Fund may, under certain circumstances, offset with the counterparty certain derivative financial instruments’ payables and/or receivables with collateral held and/or posted and create one single net payment. The provisions of the ISDA Master Agreement typically permit a single net payment in the event of default (close-out), including the bankruptcy or insolvency of the counterparty. However, bankruptcy or insolvency laws of a particular jurisdiction may impose restrictions on or prohibitions against the right of offset in bankruptcy, insolvency, or other events.
For financial reporting purposes, each Fund does not offset derivative assets and derivative liabilities that are subject to netting arrangements on the “Statements of assets and liabilities.”
Securities Lending
Securities lending transactions are entered into by the Funds under master securities lending agreements (each, an MSLA) which provide the right, in the event of default (including bankruptcy or insolvency), for the non-defaulting party to liquidate the collateral and calculate a net exposure to the defaulting party or request additional collateral. In the event that a borrower
106
Table of Contents
defaults, the Funds, as lender, would offset the market value of the collateral received against the market value of the securities loaned. When the value of the collateral is greater than that of the market value of the securities loaned, the lender is left with a net amount payable to the defaulting party. However, bankruptcy or insolvency laws of a particular jurisdiction may impose restrictions on or prohibitions against such a right of offset in the event of an MSLA counterparty’s bankruptcy or insolvency. Under the MSLA, the borrower can resell or re-pledge the loaned securities, and the Funds can reinvest cash collateral, or, upon an event of default, resell or re-pledge the collateral (see also Note 11).
As of November 30, 2022, the following table is a summary of each Fund’s securities lending agreements by counterparty which are subject to offset under an MSLA: Delaware International Value Equity Fund
| Counterparty | | Securities
Loaned
at Value | | | Cash
Collateral
Received(a) | | | Fair Value of
Non-Cash
Collateral
Received | | | Net
Collateral
Received | | | Net Exposure(b) |
| Bank of New York Mellon | | $ | 231,941 | | | $ | (231,941 | ) | | | $— | | | $ | (231,941 | ) | | | $— |
| (a) | The value of the related collateral exceeded the value of the derivatives and securities lending transactions as of November 30, 2022, as applicable. |
| (b) | Net exposure represents the receivable (payable) that would be due from (to) the counterparty in the event of default. |
11. Securities Lending
Each Fund, along with other funds in the Delaware Funds, may lend its securities pursuant to a security lending agreement (Lending Agreement) with The Bank of New York Mellon (BNY Mellon). At the time a security is loaned, the borrower must post collateral equal to the required percentage of the market value of the loaned security, including any accrued interest. The required percentage is: (1) 102% with respect to US securities and foreign securities that are denominated and payable in US dollars; and (2) 105% with respect to foreign securities. With respect to each loan, if on any business day the aggregate market value of securities collateral plus cash collateral held is less than the aggregate market value of the securities which are the subject of such loan, the borrower will be notified to provide additional collateral by the end of the following business day, which, together with the collateral already held, will be not less than the applicable initial collateral requirements for such security loan. If the aggregate market value of securities collateral and cash collateral held with respect to a security loan exceeds the applicable initial collateral requirement, upon the request of the borrower, BNY Mellon must return enough collateral to the borrower by the end of the following business day to reduce the value of the remaining collateral to the applicable initial collateral requirement for such security loan. As a result of the foregoing, the value of the collateral held with respect to a loaned security on any particular day, may be more or less than the value of the security on loan. The collateral percentage with respect to the market value of the loaned security is determined by the security lending agent.
107
Table of Contents
Notes to financial statements
Delaware International Funds
11. Securities Lending (continued)
Cash collateral received by each fund of the Trust is generally invested in a series of individual separate accounts, each corresponding to a fund. The investment guidelines permit each separate account to hold certain securities that would be considered eligible securities for a money market fund. Cash collateral received is generally invested in government securities; certain obligations issued by government sponsored enterprises; repurchase agreements collateralized by US Treasury securities; obligations issued by the central government of any Organization for Economic Cooperation and Development (OECD) country or its agencies, instrumentalities, or establishments; obligations of supranational organizations; commercial paper, notes, bonds, and other debt obligations; certificates of deposit, time deposits, and other bank obligations; certain money market funds; and asset-backed securities as disclosed on the “Schedules of investments.” Securities purchased with cash collateral are valued at the market value. Each Fund can also accept US government securities and letters of credit (non-cash collateral) in connection with securities loans.
In the event of default or bankruptcy by the lending agent, realization and/or retention of the collateral may be subject to legal proceedings. In the event the borrower fails to return loaned securities and the collateral received is insufficient to cover the value of the loaned securities and provided such collateral shortfall is not the result of investment losses, the lending agent has agreed to pay the amount of the shortfall to each Fund or, at the discretion of the lending agent, replace the loaned securities. Each Fund continues to record dividends or interest, as applicable, on the securities loaned and is subject to changes in value of the securities loaned that may occur during the term of the loan. Each Fund has the right under the Lending Agreement to recover the securities from the borrower on demand. With respect to security loans collateralized by non-cash collateral, each Fund receives loan premiums paid by the borrower. With respect to security loans collateralized by cash collateral, the earnings from the collateral investments are shared among each Fund, the security lending agent, and the borrower. Each Fund records security lending income net of allocations to the security lending agent and the borrower.
Each Fund may incur investment losses as a result of investing securities lending collateral. This could occur if an investment in each collateral investment account defaulted or became impaired. Under those circumstances, the value of each Fund’s cash collateral account may be less than the amount each Fund would be required to return to the borrowers of the securities and each Fund would be required to make up for this shortfall.
108
Table of Contents
The following table reflects a breakdown of transactions accounted for as secured borrowings, the gross obligation by the type of collateral pledged, and the remaining contractual maturity of those transactions as of November 30, 2022 for Delaware International Value Equity Fund:
Securities Lending
Transactions | | Overnight
and
continuous | | | Under
30 days | | | Between
30 & 90 days | | | Over
90 Days | | | Total |
Delaware
International
Value Equity
Fund | | | | | | | | | | | | | | | | | | | |
Money Market
Mutual Funds | | $ | 232,685 | | | | $— | | | | $— | | | | $— | | | $ | 232,685 |
At November 30, 2022, the value of securities on loan for Delaware International Value Equity Fund was $231,941 for which the Fund received cash collateral of $232,685. Investments purchased with cash collateral are presented on the “Schedules of investments” under the caption “Securities Lending Collateral.”
During the year ended November 30, 2022, Delaware Emerging Markets Fund and Delaware International Small Cap Fund had no securities out on loan.
12. Credit and Market Risk
An outbreak of infectious respiratory illness caused by a novel coronavirus known as COVID-19 was first detected in China in December 2019 and has now been detected globally. This coronavirus has resulted in travel restrictions, closed international borders, enhanced health screenings at ports of entry and elsewhere, disruption of and delays in healthcare service preparation and delivery, prolonged quarantines, cancellations, supply chain disruptions, and lower consumer demand, as well as general concern and uncertainty. The impact of COVID-19, and other infectious illness outbreaks that may arise in the future, could adversely affect the economies of many nations or the entire global economy, individual issuers and capital markets in ways that cannot necessarily be foreseen. In addition, the impact of infectious illnesses in emerging market countries may be greater due to generally less established healthcare systems. Public health crises caused by the COVID-19 outbreak may exacerbate other pre-existing political, social and economic risks in certain countries or globally. The duration of the COVID-19 outbreak and its effects cannot be determined with certainty.
Beginning in late February 2022, global financial markets have experienced and may continue to experience significant volatility related to military action by Russia in Ukraine. As a result of this military action, the US and many other countries have imposed sanctions on Russia and certain Russian individuals, banks and corporations. The ongoing hostilities and resulting sanctions are expected to have a severe adverse effect on the region’s economies and more globally, including significant negative impact on markets for certain securities and commodities, such as oil and natural gas. Any cessation of trading on the Russian securities markets will impact the value and liquidity of certain portfolio holdings. The extent and duration of military action, sanctions, and
109
Table of Contents
Notes to financial statements
Delaware International Funds
12. Credit and Market Risk (continued)
resulting market disruptions are impossible to predict, but could be substantial and prolonged and impact each Fund’s performance.
Investments in equity securities in general are subject to market risks that may cause their prices to fluctuate over time. Fluctuations in the value of equity securities in which the Funds invest will cause the NAV of the Funds to fluctuate.
Delaware Emerging Markets Fund invests a significant portion of its assets in the greater China region, which consists of Hong Kong, the People’s Republic of China, and Taiwan, among other countries. As a result, the Fund’s investments in the region are particularly susceptible to risks in that region. Adverse events in any one country within the region may impact the other countries in the region or Asia as a whole. As a result, adverse events in the region will generally have a greater effect on the Fund than if the Fund were more geographically diversified, which could result in greater volatility in the Fund’s net asset value and losses. Markets in the greater China region can experience significant volatility due to social, economic, regulatory, and political uncertainties.
Some countries in which the Funds may invest require governmental approval for the repatriation of investment income, capital, or the proceeds of sales of securities by foreign investors. In addition, if there is deterioration in a country’s balance of payments or for other reasons, a country may impose temporary restrictions on foreign capital remittances abroad.
The securities exchanges of certain foreign markets are substantially smaller, less liquid, and more volatile than the major securities markets in the US. Consequently, acquisition and disposition of securities by each Fund may be inhibited. In addition, a significant portion of the aggregate market value of securities listed on the major securities exchanges in emerging markets is held by a smaller number of investors. This may limit the number of shares available for acquisition or disposition by each Fund.
Each Fund may invest up to 15% of its net assets in illiquid securities, which may include securities with contractual restrictions on resale, securities exempt from registration under Rule 144A promulgated under the Securities Act of 1933, as amended, and other securities which may not be readily marketable. The relative illiquidity of these securities may impair each Fund from disposing of them in a timely manner and at a fair price when it is necessary or desirable to do so. While maintaining oversight, each Board has delegated to DMC, the day-to-day functions of determining whether individual securities are liquid for purposes of each Fund’s limitation on investments in illiquid securities. Securities eligible for resale pursuant to Rule 144A, which are determined to be liquid, are not subject to each Fund’s 15% limit on investments in illiquid securities. Rule 144A securities have been identified on the “Schedules of investments.”
110
Table of Contents
13. Contractual Obligations
Each Fund enters into contracts in the normal course of business that contain a variety of indemnifications. Each Fund’s maximum exposure under these arrangements is unknown. However, each Fund has not had prior claims or losses pursuant to these contracts. Management has reviewed each Fund’s existing contracts and expects the risk of loss to be remote.
14. Subsequent Events
Management has determined that no material events or transactions occurred subsequent to November 30, 2022, that would require recognition or disclosure in the Funds’ financial statements.
111
Table of Contents
Report of independent registered public accounting firm
To the Board of Trustees of Delaware Group® Global & International Funds and Shareholders of Delaware Emerging Markets Fund, Delaware International Small Cap Fund and Delaware International Value Equity Fund.
Opinions on the Financial Statements
We have audited the accompanying statements of assets and liabilities, including the schedules of investments, of Delaware Emerging Markets Fund, Delaware International Small Cap Fund and Delaware International Value Equity Fund (constituting Delaware Group® Global & International Funds, hereafter collectively referred to as the “Funds”) as of November 30, 2022, the related statements of operations for the year ended November 30, 2022, the statements of changes in net assets for each of the two years in the period ended November 30, 2022, including the related notes, and the financial highlights for each of the periods indicated therein (collectively referred to as the “financial statements”). In our opinion, the financial statements present fairly, in all material respects, the financial position of the Funds as of November 30, 2022, the results of each of their operations for the year then ended, the changes in each of their net assets for each of the two years in the period ended November 30, 2022 and each of the financial highlights for each of the periods indicated therein in conformity with accounting principles generally accepted in the United States of America.
Basis for Opinions
These financial statements are the responsibility of the Funds’ management. Our responsibility is to express an opinion on the Funds’ financial statements based on our audits. We are a public accounting firm registered with the Public Company Accounting Oversight Board (United States) (PCAOB) and are required to be independent with respect to the Funds in accordance with the U.S. federal securities laws and the applicable rules and regulations of the Securities and Exchange Commission and the PCAOB.
We conducted our audits of these financial statements in accordance with the standards of the PCAOB. Those standards require that we plan and perform the audit to obtain reasonable assurance about whether the financial statements are free of material misstatement, whether due to error or fraud.
Our audits included performing procedures to assess the risks of material misstatement of the financial statements, whether due to error or fraud, and performing procedures that respond to those risks. Such procedures included examining, on a test basis, evidence regarding the amounts and disclosures in the financial statements. Our audits also included evaluating the accounting principles used and significant estimates made by management, as well as evaluating the overall presentation of the financial statements. Our procedures included confirmation of securities owned as of November 30, 2022 by correspondence with the custodian, broker and transfer agents. We believe that our audits provide a reasonable basis for our opinions.
/s/PricewaterhouseCoopers LLP
Philadelphia, Pennsylvania
January 27, 2023
We have served as the auditor of one or more investment companies in Delaware Funds by Macquarie® since 2010.
112
Table of Contents
Other Fund information (Unaudited)
Delaware International Funds
Liquidity Risk Management Program
The Securities and Exchange Commission (the “SEC”) has adopted Rule 22e-4 under the Investment Company Act of 1940 (the “Liquidity Rule”), which requires all open-end funds (other than money market funds) to adopt and implement a program reasonably designed to assess and manage the fund’s “liquidity risk,” defined as the risk that the fund could not meet requests to redeem shares issued by the fund without significant dilution of remaining investors’ interests in the fund.
The Funds have adopted and implemented a liquidity risk management program in accordance with the Liquidity Rule (the “Program”). The Board has designated a member of the US Operational Risk Group of Macquarie Asset Management as the Program Administrator for each Fund in the Trust.
As required by the Liquidity Rule, the Program includes policies and procedures that provide for: (1) assessment, management, and review (no less frequently than annually) of each Fund’s liquidity risk; (2) classification of each of the Fund’s portfolio holdings into one of four liquidity categories (Highly Liquid, Moderately Liquid, Less Liquid, and Illiquid); (3) for funds that do not primarily hold assets that are Highly Liquid, establishing and maintaining a minimum percentage of each Fund’s net assets in Highly Liquid investments (called a “Highly Liquid Investment Minimum” or “HLIM”); and (4) prohibiting each Fund’s acquisition of Illiquid investments if, immediately after the acquisition, each Fund would hold more than 15% of its net assets in Illiquid assets. The Program also requires reporting to the SEC (on a non-public basis) and to the Board if each Fund’s holdings of Illiquid assets exceed 15% of each Fund’s net assets. Funds with HLIMs must have procedures for addressing HLIM shortfalls, including reporting to the Board and, with respect to HLIM shortfalls lasting more than seven consecutive calendar days, reporting to the SEC (on a non-public basis).
In assessing and managing each Fund’s liquidity risk, the Program Administrator considers, as relevant, a variety of factors, including: (1) each Fund’s investment strategy and liquidity of portfolio investments during both normal and reasonably foreseeable stressed conditions; (2) short-term and long-term cash flow projections for the Funds during both normal and reasonably foreseeable stressed conditions; and (3) each Fund’s holdings of cash and cash equivalents and any borrowing arrangements. Classification of each Fund’s portfolio holdings in the four liquidity categories is based on the number of days it is reasonably expected to take to convert the investment to cash (for Highly Liquid and Moderately Liquid holdings) or to sell or dispose of the investment (for Less Liquid and Illiquid investments), in current market conditions without significantly changing the investment’s market value. Each Fund primarily holds assets that are classified as Highly Liquid, and therefore is not required to establish an HLIM.
At a meeting of the Board held on May 17-19, 2022, the Program Administrator provided the required written annual report to the Board addressing the Program’s operation and assessing the adequacy and effectiveness of its implementation for the period from April 1, 2021 through March 31, 2022. The report concluded that the Program is appropriately designed and effectively implemented and that it meets the requirements of Rule 22e-4 and each Fund’s liquidity needs. Each Fund’s HLIM is set at an appropriate level and the Funds complied with their HLIM at all times during the reporting period.
113
Table of Contents
Other Fund information (Unaudited)
Delaware International Funds
Tax Information
The information set forth below is for each Fund’s fiscal year as required by federal income tax laws. Shareholders, however, must report distributions on a calendar year basis for income tax purposes, which may include distributions for portions of two fiscal years of each Fund. Accordingly, the information needed by shareholders for income tax purposes will be sent to them in January of each year. Please consult your tax advisor for proper treatment of this information.
All disclosures are based on financial information available as of the date of this annual report and, accordingly are subject to change. For any and all items requiring reporting, it is the intention of each Fund to report the maximum amount permitted under the Internal Revenue Code and the regulations thereunder.
For the fiscal year ended November 30, 2022, each Fund reports distributions paid during the year as follows:
| | | (A)
Long-Term
Capital Gains
Distributions
(Tax Basis) | | (B)
Ordinary Income
Distributions
(Tax Basis) | | Total
Distributions
(Tax Basis) |
Delaware
Emerging
Markets Fund | | | — | | | | 100.00 | % | | | 100.00 | % |
Delaware
International
Small Cap
Fund | | | 99.82 | % | | | 0.18 | % | | | 100.00 | % |
Delaware
International
Value Equity
Fund | | | 84.26 | % | | | 15.74 | % | | | 100.00 | % |
(A) and (B) are based on a percentage of each Fund’s total distributions.
| * | For the fiscal year ended November 30, 2022, certain dividends paid by each Fund may be subject to a maximum tax rate of 20%. The percentage of dividends paid by each Fund from ordinary income reported as dividend income is listed below. Complete information will be computed and reported in conjunction with your 2022 Form 1099-DIV. |
Delaware Emerging
Markets Fund | | Delaware International
Small Cap Fund | | Delaware International
Value Equity Fund |
| 78.52% | | 100.00% | | 100.00% |
114
Table of Contents
Each Fund intends to pass through foreign tax credits in the maximum amount and the gross foreign source income earned during the fiscal year 2022 by each Fund was as follows:
| | | Delaware Emerging
Markets Fund | | | Delaware International
Small Cap Fund | | | Delaware International
Value Equity Fund |
| Foreign Tax Credits | | | $ 11,172,541 | | | | $ 144,675 | | | | $ 576,797 |
Gross Foreign Source
Income Earned | | | 235,191,061 | | | | 1,739,968 | | | | 11,099,144 |
Board consideration of Investment Management Agreement and Sub-Advisory Agreements at a meeting held August 9-11, 2022
At a meeting held on August 9-11, 2022 (the “Annual Contract Renewal Meeting”), the Board of Trustees (the “Board”), including a majority of Trustees each of whom is not an “interested person” as defined under the Investment Company Act of 1940 (the “Independent Trustees”), approved the renewal of the Delaware Emerging Markets Fund, Delaware International Small Cap Fund and Delaware International Value Equity Fund (each, a “Fund” and together, the “Funds”) Investment Management Agreement with Delaware Management Company (“DMC”); and the Sub-Advisory Agreements with Macquarie Investment Management Global Limited (“MIMGL”) and Macquarie Funds Management Hong Kong Limited (“MFMHKL” and together with MIMGL, the “Affiliated Sub-Advisers”).
Prior to the Meeting, including at a Board meeting held in May 2022, the Trustees conferred extensively among themselves and with representatives of DMC about these matters. Also, the Board was assisted by the applicable Investment Committee, with each Investment Committee assisting the full Board in the discharge of its duties in reviewing investment performance and other matters throughout the year. The Independent Trustees were assisted in their evaluation of the Investment Management Agreement and the Sub-Advisory Agreements by independent legal counsel, from whom they received separate legal advice and with whom they met separately.
In providing information to the Board, DMC was guided by a detailed set of requests for information submitted to them by independent legal counsel on behalf of the Independent Trustees at the start of the Board’s annual contract renewal process earlier in 2022. In considering and approving the Investment Management Agreement and the Sub-Advisory Agreements, the Trustees considered the information they believed relevant, including but not limited to the information discussed below. The Board considered not only the specific information presented in connection with the Meeting, but also the knowledge gained over time through interaction with DMC about various topics. In this regard, the Board reviewed reports of DMC at each of its quarterly meetings, which included information about, among other things, Fund performance, investment strategies, and expenses. In addition, the Investment Committees confer with portfolio managers at various times throughout the year. In considering information relating to the approval of the Funds’ Investment Management Agreement and the Sub-Advisory Agreements, the Independent Trustees also received information from an independent fund consultant, JDL Consultants, LLC (“JDL”).
The Board did not identify any particular information or consideration that was all-important or controlling, and each individual Trustee may have attributed different weights to various factors.
115
Table of Contents
Other Fund information (Unaudited)
Delaware International Funds
Board consideration of Investment Management Agreement and Sub-Advisory Agreements at a meeting held August 9-11, 2022 (continued)
After its deliberations, the Board unanimously approved the continuation of the Investment Management Agreement and the Sub-Advisory Agreements for a one-year term. The following summarizes a number of important, but not necessarily all, factors considered by the Board in support of its approval.
Nature, extent, and quality of services. The Board received and considered various information regarding the nature, extent, and quality of the advisory services provided to the Funds by DMC under its Investment Management Agreement, and the experience of the officers and employees of DMC who provide these services, including the Funds’ portfolio managers. The Board’s review included consideration of DMC’s investment process and oversight and research and analysis capabilities, and its ability to attract and retain qualified investment professionals. The Board considered information regarding DMC’s programs for risk management, including investment, operational, liquidity, valuation, and compliance risks. The Board received information with respect to the cybersecurity program and business continuity plans of DMC and its affiliates. The Board also considered non-advisory services that DMC and its affiliates provide to the Delaware Funds, including third party oversight, transfer agent, internal audit, valuation, portfolio trading, and legal and compliance. The Board took into account the benefits to shareholders of investing in a Fund that is part of a family of funds managed by an affiliate of Macquarie Group Ltd. (“Macquarie”), the parent company of DMC, and the resources available to DMC as part of Macquarie’s global asset management business.
The Board received and considered various information with respect to the services provided by the Affiliated Sub-Advisers under the Sub-Advisory Agreements and the credentials and experience of the officers and employees of the Affiliated Sub-Advisers who provide these services. The Board considered the division of responsibilities between DMC and the Affiliated Sub-Advisers and the oversight provided by DMC. The Board considered the expertise of the Affiliated Sub-Advisers with respect to certain asset classes and/or investment styles. The Affiliated Sub-Advisers are part of Macquarie’s global investment platform that has offices and personnel that are located around the world. As a result, the Board noted that DMC had stated that the Affiliated Sub-Advisers can provide research, investment and trading analysis on the markets and economies of various countries in which the Funds may invest, make recommendations regarding securities and assist with security trades, as applicable. The Board took into account that the Sub-Advisory Agreements may benefit the Funds and their shareholders by permitting DMC to use the resources and talents of the Affiliated Sub-Advisers in managing the Funds.
The Board concluded that, overall, it was satisfied with the nature, extent and quality of services provided (and expected to be provided) to the Funds by DMC and the Affiliated Sub-Advisers.
Investment performance. The Board received and considered information with respect to the investment performance of the Funds, including performance reports and discussions with portfolio managers at meetings of the Board’s Investment Committees throughout the year as well as reports provided by Broadridge Financial Solutions, an independent investment company
116
Table of Contents
data provider (“Broadridge”), furnished for the Annual Contract Renewal Meeting. The Broadridge reports prepared for each Fund showed its investment performance in comparison to a group of similar funds (the “Performance Universe”). The Board received a description of the methodology used by Broadridge to select the funds in the Performance Universe. Comparative annualized performance for each Fund was shown for the past 1-, 3-, 5-, and 10-year periods and since inception, as applicable, ended December 31, 2021.
Delaware Emerging Markets Fund – The Performance Universe for the Fund consisted of the Fund and all retail and institutional emerging markets funds, regardless of asset size or primary channel of distribution. The Board noted that the Broadridge report comparison showed that the Fund’s total return for the 1-year period was in the third quartile, for the 3-year period was in the second quartile, and for the 5- and 10-year periods was in the first quartile of its Performance Universe. The Broadridge report comparison showed that the Fund’s total return for the 1-year period was below the median and for the 3-, 5-, and 10-year periods was above the median of its Performance Universe. The Board also noted that the Fund outperformed its benchmark index for the 1-, 3-, 5-, and 10-year periods. The Board noted that the Fund was generally performing in line with its Performance Universe and benchmark during the periods under review. The Board noted the explanations from DMC and the Affiliated Sub-Advisers concerning the reasons for the Fund’s relative performance versus the Performance Universe and its benchmark for the various periods.
Delaware International Small Cap Fund – The Performance Universe for the Fund consisted of the Fund and all retail and institutional international small-/mid-cap growth funds, regardless of asset size or primary channel of distribution. The Board noted that the Broadridge report comparison showed that the Fund’s total return for the 1-year period was in the third quartile and for the 3-, 5-, and 10-year periods was in the second quartile of its Performance Universe. The Broadridge report comparison showed that the Fund’s total return for the 1-year period was below the median and for the 3-, 5-, and 10-year periods was above the median of its Performance Universe. The Board also noted that the Fund underperformed its benchmark index for the 1-year period and outperformed its benchmark index for the 3-, 5-, and 10-year periods. The Board noted the explanations from DMC concerning the reasons for the Fund’s relative performance versus the Performance Universe and its benchmark for the various periods. The Board also noted that effective November 30, 2016, the Fund was repositioned as an international small-cap equity fund.
Delaware International Value Equity Fund – The Performance Universe for the Fund consisted of the Fund and all retail and institutional international multi-cap core funds, regardless of asset size or primary channel of distribution. The Board noted that the Broadridge report comparison showed that the Fund’s total return for the 1-, 3-, 5-, and 10-year periods was in the fourth quartile of its Performance Universe. The Broadridge report comparison showed that the Fund’s total return for the 1-, 3-, 5-, and 10-year periods was below the median of its Performance Universe. The Board also noted that the Fund underperformed its benchmark index for the 1-, 3-, 5-, and 10-year periods. The Board noted the explanations from DMC concerning the reasons for the Fund’s relative underperformance versus the Performance Universe and its benchmark for
117
Table of Contents
Other Fund information (Unaudited)
Delaware International Funds
Board consideration of Investment Management Agreement and Sub-Advisory Agreements at a meeting held August 9-11, 2022 (continued)
the various periods. The Board also noted that the investment performance of the current portfolio management team only began as of March 2019.
Comparative expenses. The Board received and considered expense data for the Funds. Management provided the Board with information on pricing levels and fee structures for each Fund as of its most recently completed fiscal year. The Board also considered the comparative analysis of contractual management fees and actual total expense ratios of each Fund versus contractual management fees and actual total expense ratios of a group of similar funds as selected by Broadridge (the “Expense Group”). In reviewing comparative costs, each Fund’s contractual management fee and the actual management fee incurred by each Fund were compared with the contractual management fees (assuming all funds were similar in size to each Fund) and actual management fees, taking into account any applicable breakpoints and fee waivers, with a Fund’s expense universe, which is comprised of each Fund, its Expense Group and all other similar institutional funds, excluding outliers (the “Expense Universe”). Each Fund’s total expenses were also compared with those of its Expense Universe. The Broadridge total expenses, for comparative consistency, were shown by Broadridge for Institutional Class shares and comparative total expenses including 12b-1 and non-12b-1 service fees.
Delaware Emerging Markets Fund – The expense comparisons for the Fund showed that its actual management fee was above the median of its Expense Universe and its actual total expenses were above its Expense Group average.
Delaware International Small Cap Fund – The expense comparisons for the Fund showed that its actual management fee was below the median of its Expense Universe and its actual total expenses were below its Expense Group average.
Delaware International Value Equity Fund – The expense comparisons for the Fund showed that its actual management fee was above the median of its Expense Universe and its actual total expenses were above its Expense Group average.
The Board also received and considered information about the nature and extent of services offered and fee rates charged by DMC to other types of clients with investment strategies similar to those of the Funds. In this regard, the Board received information about the significantly greater scope of services, and compliance, reporting and other legal burdens and risks of managing registered investment companies compared with those associated with managing assets of other types of clients, including third-party sub-advised fund clients, unregistered funds and separately managed accounts.
The Board noted that DMC, and not the Funds, pays the sub-advisory fees to the Affiliated Sub-Advisers and, accordingly, that the retention of the Affiliated Sub-Advisers does not increase the fees and expenses incurred by the Funds.
Based on its consideration of the factors and information it deemed relevant, including those described here, the Board determined that the compensation payable to DMC under the
118
Table of Contents
Investment Management Agreement and to the Affiliated Sub-Advisers under the Sub-Advisory Agreements was reasonable.
Economies of scale. The Board received and considered information about the potential for DMC to realize economies of scale in the provision of management services to the Funds, the difficulties of calculating economies of scale at an individual Fund level, and the extent to which potential scale benefits are shared with shareholders, including the extent to which any economies of scale are reflected in the level of management fees charged. DMC discussed its advisory fee pricing and structure for the Delaware Funds complex, including the current breakpoints. The Board noted that, as of March 31, 2022, the Delaware Emerging Markets Fund’s net assets exceeded its third breakpoint level and the Delaware International Value Equity Fund’s net assets exceeded its first breakpoint level, and that breakpoints result in a lower advisory fee than would otherwise be the case in the absence of breakpoints, when the asset levels specified in the breakpoints schedule are exceeded. The Board noted that the Funds may also benefit from economies of scale through initial fee setting, fee waivers and expense reimbursements, as well as DMC’s investment in its business, including investments in business infrastructure, technology and cybersecurity.
Management profitability. The Board received and considered the Investment Management Profitability Analysis that addressed the overall profitability of DMC’s business in providing management and other services to each Fund and the Delaware Funds as a whole, including the methodology used by DMC in allocating costs for the purpose of determining profitability. The Board also reviewed a report prepared by JDL regarding DMC’s profitability as compared to certain peer fund complexes and the Independent Trustees discussed DMC’s profitability in such context with representatives from JDL. Based on its review, the Board determined that DMC’s profitability was not excessive in light of the nature, extent and quality of the services provided to each Fund.
Ancillary benefits. The Board received and considered information regarding the extent to which DMC and its affiliates might derive ancillary benefits from fund operations, including the potential for procuring additional business as a result of the prestige and visibility associated with its role as investment manager to the Delaware Funds; the benefits from allocation of fund brokerage to improve trading efficiencies; and the fees that various affiliates received for serving as transfer agent and for overseeing fund accounting and financial administration services to the Delaware Funds. The Board received information from DMC regarding its view of the performance of its affiliates in providing transfer agent and fund accounting and financial administration oversight services and the organizational structure employed to provide these services pursuant to their contracts with the Funds.
Based on its consideration of the factors and information it deemed relevant, including the costs of providing investment management and other services to the Funds and the ongoing commitment of DMC and its affiliates to the Funds, the Board did not find that any ancillary benefits received by DMC and its affiliates were unreasonable.
Conclusion. Based on its review, consideration and evaluation of all factors it believed relevant, including the above-described factors and conclusions, the Board, including all of the
119
Table of Contents
Other Fund information (Unaudited)
Delaware International Funds
Board consideration of Investment Management Agreement and Sub-Advisory Agreements at a meeting held August 9-11, 2022 (continued)
Independent Trustees, approved the continuation of DMC’s Investment Management Agreement and of the Affiliated Sub-Advisers’ Sub-Advisory Agreements for an additional one-year period.
Form N-PORT and proxy voting information
Each Fund files its complete schedule of portfolio holdings with the Securities and Exchange Commission (SEC) for the first and third quarters of each fiscal year on Form N-PORT. Each Fund’s Forms N-PORT, as well as a description of the policies and procedures that the Funds use to determine how to vote proxies (if any) relating to portfolio securities, are available without charge (i) upon request, by calling 800 523-1918; and (ii) on the SEC’s website at sec.gov. In addition, a description of the policies and procedures that the Funds use to determine how to vote proxies (if any) relating to portfolio securities and the Schedule of investments included in the Funds’ most recent Form N-PORT are available without charge on the Funds’ website at delaware funds.com/literature.
Information (if any) regarding how the Funds voted proxies relating to portfolio securities during the most recently disclosed 12-month period ended June 30 is available without charge (i) through the Funds’ website at delaware funds.com/proxy; and (ii) on the SEC’s website at sec.gov.
120
Table of Contents
Board of trustees / directors and officers addendum
Delaware Funds by Macquarie®
A mutual fund is governed by a Board of Trustees/Directors (“Trustees”), which has oversight responsibility for the management of a fund’s business affairs. Trustees establish procedures and oversee and review the performance of the investment manager, the distributor, and others who perform services for the fund. The independent fund trustees, in particular, are advocates for shareholder interests. Each trustee has served in that capacity since he or she was elected to or appointed to the Board of Trustees, and will continue to serve until his or her retirement or the election of a new trustee in his or her place. The following is a list of the Trustees and Officers as of December 31, 2022 with certain background and related information.
Name,
Address,
and Birth Date | | Position(s)
Held with
the Trust | | Length of Time
Served1 | | Number of
Funds in Fund
Complex Overseen
by Trustee | | Principal
Occupation(s)
During the
Past Five Years | | Other
Directorships
Held by Trustee
During the
Past Five Years |
| Interested Trustee |
| | | | | | | | | | | |
Shawn K. Lytle2
100 Independence
610 Market Street
Philadelphia, PA
19106-2354
February 1970 | | President,
Chief Executive Officer,
and Trustee | | President and
Chief Executive
Officer
since August 2015 Trustee since
September 2015 | | 127 | | Macquarie Asset Management3 (2015–Present)
-Global Head of Macquarie Asset Management Public Investments (2019–Present)
-Head of Americas of Macquarie Group (2017–Present)
-Deputy Global Head of Macquarie Asset Management (2017–2019)
-Head of Macquarie Asset Management Americas (2015–2017) | | None |
121
Table of Contents
Board of trustees / directors and officers addendum
Delaware Funds by Macquarie®
Name,
Address,
and Birth Date | | Position(s)
Held with
the Trust | | Length of Time
Served1 | | Number of
Funds in Fund
Complex Overseen
by Trustee | | Principal
Occupation(s)
During the
Past Five Years | | Other
Directorships
Held by Trustee
During the
Past Five Years |
| Independent Trustees |
| | | | | | | | | | | |
Jerome D. Abernathy
100 Independence
610 Market Street
Philadelphia, PA
19106-2354
July 1959 | | Trustee | | Since January 2019 | | 127 | | Stonebrook Capital
Management, LLC
(financial technology: macro
factors and databases)
-Managing Member (1993-Present) | | None |
| | | | | | | | | | | |
Thomas L. Bennett4
100 Independence
610 Market Street
Philadelphia, PA
19106-2354
October 1947 | | Chair and Trustee | | Trustee since March 2005
Chair since March 2015 | | 127 | | Private Investor
(2004–Present) | | None |
| | | | | | | | | | | |
Ann D. Borowiec
100 Independence
610 Market Street
Philadelphia, PA
19106-2354
November 1958 | | Trustee | | Since March 2015 | | 127 | | J.P. Morgan Chase & Co.
(1987-2013)
-Chief Executive Officer, Private Wealth Management
(2011–2013) | | Banco Santander International
(2016–2019)
Santander Bank, N.A.
(2016-2019) |
122
Table of Contents
Name,
Address,
and Birth Date | | Position(s)
Held with
the Trust | | Length of Time
Served1 | | Number of
Funds in Fund
Complex Overseen
by Trustee | | Principal
Occupation(s)
During the
Past Five Years | | Other
Directorships
Held by Trustee
During the
Past Five Years |
| | | | | | | | | | | |
Joseph W. Chow
100 Independence
610 Market Street
Philadelphia, PA
19106-2354
January 1953 | | Trustee | | Since January 2013 | | 127 | | Private Investor
(2011–Present) | | None |
| | | | | | | | | | | |
H. Jeffrey Dobbs
100 Independence
610 Market Street
Philadelphia, PA
19106-2354
May 1955 | | Trustee | | Since April 20195 | | 127 | | KPMG LLP
(2002-2015)
-Global Sector Chairman, Industrial Manufacturing
(2010-2015) | | TechAccel LLC
(2015–Present)
PatientsVoices, Inc.
(2018–Present)
Valparaiso University Board
(2012-Present)
Ivy Funds Complex (2019-2021) |
123
Table of Contents
Board of trustees / directors and officers addendum
Delaware Funds by Macquarie®
Name,
Address,
and Birth Date | | Position(s)
Held with
the Trust | | Length of Time
Served1 | | Number of
Funds in Fund
Complex Overseen
by Trustee | | Principal
Occupation(s)
During the
Past Five Years | | Other
Directorships
Held by Trustee
During the
Past Five Years |
| | | | | | | | | | | |
John A. Fry
100 Independence
610 Market Street
Philadelphia, PA
19106-2354
May 1960 | | Trustee | | Since January 2001 | | 127 | | Drexel University
-President
(2010–Present) | | Federal Reserve
Bank of Philadelphia
(2020–Present)
FS Credit Real Estate Income
Trust, Inc. (2018–Present)
vTv Therapeutics Inc.
(2017–Present)
Community Health Systems
(2004–Present)
Drexel Morgan & Co.
(2015–2019) |
124
Table of Contents
Name,
Address,
and Birth Date | | Position(s)
Held with
the Trust | | Length of Time
Served1 | | Number of
Funds in Fund
Complex Overseen
by Trustee | | Principal
Occupation(s)
During the
Past Five Years | | Other
Directorships
Held by Trustee
During the
Past Five Years |
| | | | | | | | | | | |
Joseph Harroz, Jr.
100 Independence
610 Market Street
Philadelphia, PA
19106-2354
January 1967 | | Trustee | | Since November
19985 | | 127 | | University of Oklahoma
-President
(2020–Present)
-Interim President
(2019–2020)
-Vice President and Dean, College of Law
(2010–2019)
Brookhaven Investments LLC (commercial
enterprises)
-Managing Member
(2019–Present)
St. Clair, LLC
(commercial enterprises)
-Managing Member
(2019–Present) | | OU Medicine, Inc.
(2020–Present)
Big 12 Athletic Conference
(2019-Present)
Valliance Bank
(2007–Present)
Ivy Funds Complex
(1998-2021) |
125
Table of Contents
Board of trustees / directors and officers addendum
Delaware Funds by Macquarie®
Name,
Address,
and Birth Date | | Position(s)
Held with
the Trust | | Length of Time
Served1 | | Number of
Funds in Fund
Complex Overseen
by Trustee | | Principal
Occupation(s)
During the
Past Five Years | | Other
Directorships
Held by Trustee
During the
Past Five Years |
| | | | | | | | | | | |
Sandra A.J. Lawrence
100 Independence
610 Market Street
Philadelphia, PA
19106-2354
September 1957 | | Trustee | | Since April 20195 | | 127 | | Children’s Mercy
Hospitals and Clinics
(2005–2019)
-Chief Administrative
Officer
(2016–2019) | | Brixmor Property Group Inc.
(2021-Present)
Sera Prognostics Inc.
(biotechnology) (2021-Present)
Recology (resource recovery)
(2021-Present)
Evergy, Inc., Kansas City Power
& Light Company, KCP&L
Greater Missouri Operations
Company, Westar Energy, Inc.
and Kansas Gas and Electric
Company (related utility
companies) (2018-Present)
National Association of Corporate
Directors (2017-Present)
Ivy Funds Complex (2019-2021)
American Shared Hospital
Services (medical device)
(2017-2021)
Westar Energy (utility)
(2004-2018) |
126
Table of Contents
Name,
Address,
and Birth Date | | Position(s)
Held with
the Trust | | Length of Time
Served1 | | Number of
Funds in Fund
Complex Overseen
by Trustee | | Principal
Occupation(s)
During the
Past Five Years | | Other
Directorships
Held by Trustee
During the
Past Five Years |
| | | | | | | | | | | |
Frances A. Sevilla-Sacasa
100 Independence
610 Market Street
Philadelphia, PA
19106-2354
January 1956 | | Trustee | | Since September
2011 | | 127 | | Banco Itaú International
-Chief Executive Officer
(2012–2016) | | Florida Chapter of National
Association of Corporate
Directors (2021-Present)
Callon Petroleum Company
(2019-Present)
Camden Property Trust
(2011-Present)
New Senior Investment
Group Inc. (2021)
Carrizo Oil & Gas, Inc.
(2018-2019) |
| | | | | | | | | | | |
Thomas K. Whitford
100 Independence
610 Market Street
Philadelphia, PA
19106-2354
March 1956 | | Trustee | | Since January 2013 | | 127 | | PNC Financial Services
Group (1983–2013)
-Vice Chairman
(2009-2013) | | HSBC USA Inc.
(2014–2022)
HSBC North America
Holdings Inc.
(2013–2022)
HSBC Finance Corporation
(2013–2018) |
127
Table of Contents
Board of trustees / directors and officers addendum
Delaware Funds by Macquarie®
Name,
Address,
and Birth Date | | Position(s)
Held with
the Trust | | Length of Time
Served1 | | Number of
Funds in Fund
Complex Overseen
by Trustee | | Principal
Occupation(s)
During the
Past Five Years | | Other
Directorships
Held by Trustee
During the
Past Five Years |
| | | | | | | | | | | |
Christianna Wood
100 Independence
610 Market Street
Philadelphia, PA
19106-2354
August 1959 | | Trustee | | Since January 2019 | | 127 | | Gore Creek
Capital, Ltd.
-Chief Executive Officer
and President
(2009–Present) | | The Merger Fund
(2013–2021),
The Merger Fund VL
(2013–2021),
WCM Alternatives: Event-Driven
Fund (2013–2021),
and WCM Alternatives: Credit
Event Fund (2017–2021)
Grange Insurance
(2013–Present)
H&R Block Corporation
(2008–Present) |
128
Table of Contents
Name,
Address,
and Birth Date | | Position(s)
Held with
the Trust | | Length of Time
Served1 | | Number of
Funds in Fund
Complex Overseen
by Trustee | | Principal
Occupation(s)
During the
Past Five Years | | Other
Directorships
Held by Trustee
During the
Past Five Years |
| | | | | | | | | | | |
Janet L. Yeomans
100 Independence
610 Market Street
Philadelphia, PA
19106-2354
July 1948 | | Trustee | | Since April 1999 | | 127 | | 3M Company
(1995-2012)
-Vice President and
Treasurer (2006–2012) | | Okabena Company (2009–2017) |
| Officers |
| | | | | | | | | | | |
David F. Connor
100 Independence
610 Market Street
Philadelphia, PA
19106-2354
December 1963 | | Senior Vice President,
General Counsel, and
Secretary | | Senior Vice President,
since May 2013;
General Counsel
since May 2015;
Secretary since
October 2005 | | 127 | | David F. Connor has
served in various
capacities at different
times at Macquarie Asset
Management. | | None6 |
| | | | | | | | | | | |
Daniel V. Geatens
100 Independence
610 Market Street
Philadelphia, PA
19106-2354
October 1972 | | Senior Vice President
and Treasurer | | Senior Vice President
and Treasurer since
October 2007 | | 127 | | Daniel V. Geatens has
served in various
capacities at different
times at Macquarie Asset
Management. | | None6 |
129
Table of Contents
Board of trustees / directors and officers addendum
Delaware Funds by Macquarie®
Name,
Address,
and Birth Date | | Position(s)
Held with
the Trust | | Length of Time
Served1 | | Number of
Funds in Fund
Complex Overseen
by Trustee | | Principal
Occupation(s)
During the
Past Five Years | | Other
Directorships
Held by Trustee
During the
Past Five Years |
| | | | | | | | | | | |
Richard Salus
100 Independence
610 Market Street
Philadelphia, PA
19106-2354
October 1963 | | Senior Vice President
and Chief Financial
Officer | | Senior Vice President
and Chief Financial
Officer since
November 2006 | | 127 | | Richard Salus has
served in various
capacities at different
times at Macquarie Asset
Management. | | None |
| 1 | “Length of Time Served” refers to the time since the Trustee or officer began serving one or more of the Trusts in the Delaware Funds complex. |
| 2 | Shawn K. Lytle is considered to be an “Interested Trustee” because he is an executive officer of the Funds’ investment advisor. |
| 3 | Macquarie Asset Management is the marketing name for certain companies comprising the asset management division of Macquarie Group, including the Funds’ investment advisor, principal underwriter, and transfer agent. |
| 4 | Mr. Bennett retired from the Board effective December 31, 2022 and Mr. Whitford became Chair of the Board effective January 1, 2023. |
| 5 | Includes time served on the Board of Ivy Funds prior to the date when Ivy Funds joined the Delaware Funds complex. |
| 6 | David F. Connor serves as Senior Vice President and Secretary, and Daniel V. Geatens serves as Senior Vice President, Treasurer, and Chief Financial Officer, for the six portfolios of the Optimum Fund Trust, which have the same investment manager, principal underwriter, and transfer agent as the Funds. Mr. Geatens also serves as the Chief Financial Officer and Treasurer for Macquarie Global Infrastructure Total Return Fund Inc., which has the same investment manager as the Funds. |
The Statement of Additional Information for the Fund(s) includes additional information about the Trustees and Officers and is available, without charge, upon request by calling 800 523-1918.
130
Table of Contents
Item 2. Code of Ethics
The registrant has adopted a code of ethics that applies to the registrant’s principal executive officer, principal financial officer, principal accounting officer or controller, or persons performing similar functions, regardless of whether these individuals are employed by the registrant or a third party. A copy of the registrant’s Code of Business Ethics has been posted on the Delaware Funds by Macquarie® Internet Web site at www.delawarefunds.com. Any amendments to the Code of Business Ethics, and information on any waiver from its provisions granted by the registrant, will also be posted on this Web site within five business days of such amendment or waiver and will remain on the Web site for at least 12 months.
Item 3. Audit Committee Financial Expert
The registrant’s Board of Trustees has determined that certain members of the registrant’s Audit Committee are audit committee financial experts, as defined below. For purposes of this item, an “audit committee financial expert” is a person who has the following attributes:
a. An understanding of generally accepted accounting principles and financial statements;
b. The ability to assess the general application of such principles in connection with the accounting for estimates, accruals, and reserves;
c. Experience preparing, auditing, analyzing, or evaluating financial statements that present a breadth and level of complexity of accounting issues that are generally comparable to the breadth and complexity of issues that can reasonably be expected to be raised by the registrant’s financial statements, or experience actively supervising one or more persons engaged in such activities;
d. An understanding of internal controls and procedures for financial reporting; and
e. An understanding of audit committee functions.
An “audit committee financial expert” shall have acquired such attributes through:
a. Education and experience as a principal financial officer, principal accounting officer, controller, public accountant, or auditor or experience in one or more positions that involve the performance of similar functions;
b. Experience actively supervising a principal financial officer, principal accounting officer, controller, public accountant, auditor, or person performing similar functions;
c. Experience overseeing or assessing the performance of companies or public accountants with respect to the preparation, auditing, or evaluation of financial statements; or
d. Other relevant experience.
The registrant’s Board of Trustees has also determined that each member of the registrant’s Audit Committee is independent. In order to be “independent” for purposes of this item, the Audit Committee member may not: (i) other than in his or her capacity as a member of the Board of Trustees or any committee thereof, accept directly or indirectly any consulting,
Table of Contents
advisory or other compensatory fee from the issuer; or (ii) be an “interested person” of the registrant as defined in Section 2(a)(19) of the Investment Company Act of 1940.
The names of the audit committee financial experts on the registrant’s Audit Committee are set forth below:
H. Jeffrey Dobbs
Sandra Lawrence
Frances Sevilla-Sacasa, Chair
Item 4. Principal Accountant Fees and Services
(a) Audit fees.
The aggregate fees billed for services provided to the registrant by its independent auditors for the audit of the registrant’s annual financial statements and for services normally provided by the independent auditors in connection with statutory and regulatory filings or engagements were $92,587 for the fiscal year ended November 30, 2022.
The aggregate fees billed for services provided to the registrant by its independent auditors for the audit of the registrant’s annual financial statements and for services normally provided by the independent auditors in connection with statutory and regulatory filings or engagements were $84,942 for the fiscal year ended November 30, 2021.
(b) Audit-related fees.
The aggregate fees billed by the registrant’s independent auditors for services relating to the performance of the audit of the registrant’s financial statements and not reported under paragraph (a) of this Item were $0 for the fiscal year ended November 30, 2022.
The aggregate fees billed by the registrant’s independent auditors for services relating to the performance of the audit of the financial statements of the registrant’s investment adviser and other service providers under common control with the adviser and that relate directly to the operations or financial reporting of the registrant were $2,050,189 for the registrant’s fiscal year ended November 30, 2022. The percentage of these fees relating to services approved by the registrant’s Audit Committee pursuant to the de minimis exception from the pre-approval requirement in Rule 2-01(c)(7)(i)(C) of Regulation S-X was 0%. These audit-related services were as follows: year-end audit procedures; group reporting and subsidiary statutory audits.
The aggregate fees billed by the registrant’s independent auditors for services relating to the performance of the audit of the registrant’s financial statements and not reported under paragraph (a) of this Item were $0 for the fiscal year ended November 30, 2021.
The aggregate fees billed by the registrant’s independent auditors for services relating to the performance of the audit of the financial statements of the registrant’s investment adviser and other service providers under common control with the adviser and that relate directly to the operations or financial reporting of the registrant were $1,134,001 for the registrant’s fiscal year ended November 30, 2021. The percentage of these fees relating to services approved by the registrant’s Audit Committee pursuant to the de minimis exception from the pre-approval requirement in Rule 2-01(c)(7)(i)(C) of Regulation S-X was 0%. These audit-related services were as follows: year-end audit procedures; group reporting and subsidiary statutory audits.
Table of Contents
(c) Tax fees.
The aggregate fees billed by the registrant’s independent auditors for tax-related services provided to the registrant were $19,095 for the fiscal year ended November 30, 2022. The percentage of these fees relating to services approved by the registrant’s Audit Committee pursuant to the de minimis exception from the pre-approval requirement in Rule 2-01(c)(7)(i)(C) of Regulation S-X was 0%. These tax-related services were as follows: review of income tax returns and review of annual excise distribution calculations.
The aggregate fees billed by the registrant’s independent auditors for tax-related services provided to the registrant’s investment adviser and other service providers under common control with the adviser and that relate directly to the operations or financial reporting of the registrant were $0 for the registrant’s fiscal year ended November 30, 2022.
The aggregate fees billed by the registrant’s independent auditors for tax-related services provided to the registrant were $17,847 for the fiscal year ended November 30, 2021. The percentage of these fees relating to services approved by the registrant’s Audit Committee pursuant to the de minimis exception from the pre-approval requirement in Rule 2-01(c)(7)(i)(C) of Regulation S-X was 0%. These tax-related services were as follows: review of income tax returns and review of annual excise distribution calculations.
The aggregate fees billed by the registrant’s independent auditors for tax-related services provided to the registrant’s investment adviser and other service providers under common control with the adviser and that relate directly to the operations or financial reporting of the registrant were $0 for the registrant’s fiscal year ended November 30, 2021.
(d) All other fees.
The aggregate fees billed for all services provided by the independent auditors to the registrant other than those set forth in paragraphs (a), (b) and (c) of this Item were $0 for the fiscal year ended November 30, 2022.
The aggregate fees billed for all services other than those set forth in paragraphs (b) and (c) of this Item provided by the registrant’s independent auditors to the registrant’s adviser and other service providers under common control with the adviser and that relate directly to the operations or financial reporting of the registrant were $0 for the registrant’s fiscal year ended November 30, 2022. The percentage of these fees relating to services approved by the registrant’s Audit Committee pursuant to the de minimis exception from the pre-approval requirement in Rule 2-01(c)(7)(i)(C) of Regulation S-X was 0%.
The aggregate fees billed for all services provided by the independent auditors to the registrant other than those set forth in paragraphs (a), (b) and (c) of this Item were $0 for the fiscal year ended November 30, 2021.
The aggregate fees billed for all services other than those set forth in paragraphs (b) and (c) of this Item provided by the registrant’s independent auditors to the registrant’s adviser and other service providers under common control with the adviser and that relate directly to the operations or financial reporting of the registrant were $0 for the registrant’s fiscal year ended November 30, 2021. The percentage of these fees relating to services approved by the registrant’s
Table of Contents
Audit Committee pursuant to the de minimis exception from the pre-approval requirement in Rule 2-01(c)(7)(i)(C) of Regulation S-X was 0%.
(e) The registrant’s Audit Committee has established pre-approval policies and procedures as permitted by Rule 2-01(c)(7)(i)(B) of Regulation S-X (the “Pre-Approval Policy”) with respect to services provided by the registrant’s independent auditors. Pursuant to the Pre-Approval Policy, the Audit Committee has pre-approved the services set forth in the table below with respect to the registrant up to the specified fee limits. Certain fee limits are based on aggregate fees to the registrant and other registrants within the Delaware Funds by Macquarie®.
| Service | Range of Fees |
| Audit Services | |
| Statutory audits or financial audits for new Funds | up to $50,000 per Fund |
| Services associated with SEC registration statements (e.g., Form N-1A, Form N-14, etc.), periodic reports and other documents filed with the SEC or other documents issued in connection with securities offerings (e.g., comfort letters for closed-end Fund offerings, consents), and assistance in responding to SEC comment letters | up to $10,000 per Fund |
| Consultations by Fund management as to the accounting or disclosure treatment of transactions or events and/or the actual or potential impact of final or proposed rules, standards or interpretations by the SEC, FASB, or other regulatory or standard-setting bodies (Note: Under SEC rules, some consultations may be considered “audit-related services” rather than “audit services”) | up to $25,000 in the aggregate |
| Audit-Related Services | |
| Consultations by Fund management as to the accounting or disclosure treatment of transactions or events and /or the actual or potential impact of final or proposed rules, standards or interpretations by the SEC, FASB, or other regulatory or standard-setting bodies (Note: Under SEC rules, some consultations may be considered “audit services” rather than “audit-related services”) | up to $25,000 in the aggregate |
| Tax Services | |
| U.S. federal, state and local and international tax planning and advice (e.g., consulting on statutory, regulatory or administrative developments, evaluation of Funds’ tax compliance function, etc.) | up to $25,000 in the aggregate |
| U.S. federal, state and local tax compliance (e.g., excise distribution reviews, etc.) | up to $5,000 per Fund |
| Review of federal, state, local and international income, franchise and other tax returns | up to $5,000 per Fund |
Under the Pre-Approval Policy, the Audit Committee has also pre-approved the services set forth in the table below with respect to the registrant’s investment adviser and other entities controlling, controlled by or under common control with the investment adviser that provide ongoing services to the registrant (the “Control Affiliates”) up to the specified fee limit. This fee limit is based on aggregate fees to the investment adviser and its Control Affiliates.
| Service | Range of Fees |
| Non-Audit Services | |
| Services associated with periodic reports and other documents filed with the SEC and assistance in responding to SEC comment letters | up to $10,000 in the aggregate |
| | |
Table of Contents
The Pre-Approval Policy requires the registrant’s independent auditors to report to the Audit Committee at each of its regular meetings regarding all services initiated since the last such report was rendered, including those services authorized by the Pre-Approval Policy.
(f) Not applicable.
(g) The aggregate non-audit fees billed by the registrant’s independent auditors for services rendered to the registrant and to its investment adviser and other service providers under common control with the adviser were $9,044,000 and $9,044,000 for the registrant’s fiscal years ended November 30, 2022 and November 30, 2021, respectively.
(h) In connection with its selection of the independent auditors, the registrant’s Audit Committee has considered the independent auditors’ provision of non-audit services to the registrant’s investment adviser and other service providers under common control with the adviser that were not required to be pre-approved pursuant to Rule 2-01(c)(7)(ii) of Regulation S-X. The Audit Committee has determined that the independent auditors’ provision of these services is compatible with maintaining the auditors’ independence.
(i) Not applicable.
(j) Not applicable.
Item 5. Audit Committee of Listed Registrants
Not applicable.
Item 6. Investments
(a) Included as part of report to shareholders filed under Item 1 of this Form N-CSR.
(b) Divestment of securities in accordance with Section 13(c) of the Investment Company Act of 1940.
Not applicable.
Item 7. Disclosure of Proxy Voting Policies and Procedures for Closed-End Management Investment Companies
Not applicable.
Item 8. Portfolio Managers of Closed-End Management Investment Companies
Not applicable.
Item 9. Purchases of Equity Securities by Closed-End Management Investment Companies and Affiliated Purchasers
Not applicable.
Table of Contents
Item 10. Submission of Matters to a Vote of Security Holders
Not applicable.
Item 11. Controls and Procedures
The registrant’s principal executive officer and principal financial officers, or persons performing similar functions, have concluded that the registrant’s disclosure controls and procedures (as defined in Rule 30a-3(c) under the Investment Company Act of 1940, as amended (17 CFR 270.30a-3(c))) are effective, as of a date within 90 days of the filing of this report, based on their evaluation of these controls and procedures required by Rule 30a-3(b) under the Investment Company Act of 1940 (17 CFR 270.30a-3(b)) and Rules 13a-15(b) or 15d-15(b) under the Securities Exchange Act of 1934, as amended (17 CFR 240.13a-15(b) or 240.15d-15(b)) and provide reasonable assurance that the information required to be disclosed by the registrant in its reports or statements filed under the Securities Exchange Act of 1934 is recorded, processed, summarized and reported within the time periods specified in the rules and forms of the Securities and Exchange Commission.
There were no significant changes in the registrant’s internal control over financial reporting (as defined in Rule 30a-3(d) under the Investment Company Act of 1940 (17 CFR 270.30a-3(d)) that occurred during the period covered by the report to stockholders included herein that have materially affected, or are reasonably likely to materially affect, the registrant’s internal control over financial reporting.
Item 12. Disclosure of Securities Lending Activities for Closed-End Management Investment Companies
Not applicable.
Item 13. Exhibits
Not applicable.
(2) Certifications of Principal Executive Officer and Principal Financial Officer pursuant to Rule 30a-2 under the Investment Company Act of 1940 are attached hereto as Exhibit 99.CERT.
(3) Written solicitations to purchase securities pursuant to Rule 23c-1 under the Securities Exchange Act of 1934.
Not applicable.
Table of Contents
SIGNATURES
Pursuant to the requirements of the Securities Exchange Act of 1934 and the Investment Company Act of 1940, the registrant has duly caused this report to be signed on its behalf, by the undersigned, thereunto duly authorized.
DELAWARE GROUP® GLOBAL & INTERNATIONAL FUNDS
| /s/SHAWN K. LYTLE | |
| By: | Shawn K. Lytle | |
| Title: | President and Chief Executive Officer |
| Date: | February 3, 2023 | |
Pursuant to the requirements of the Securities Exchange Act of 1934 and the Investment Company Act of 1940, this report has been signed below by the following persons on behalf of the registrant and in the capacities and on the dates indicated.
| /s/SHAWN K. LYTLE | |
| By: | Shawn K. Lytle | |
| Title: | President and Chief Executive Officer |
| Date: | February 3, 2023 | |
| /s/RICHARD SALUS | |
| By: | Richard Salus | |
| Title: | Chief Financial Officer |
| Date: | February 3, 2023 | |
| | | |