UNITED STATES SECURITIES AND EXCHANGE COMMISSION
Washington, D.C. 20549
FORM N-CSR
CERTIFIED SHAREHOLDER REPORT OF REGISTERED MANAGEMENT
INVESTMENT COMPANIES
| Investment Company Act file number: | 811-06324 |
| | |
| Exact name of registrant as specified in charter: | Delaware Group® Global & International Funds |
| | |
| Address of principal executive offices: | 610 Market Street Philadelphia, PA 19106 |
| | |
| Name and address of agent for service: | David F. Connor, Esq. 610 Market Street Philadelphia, PA 19106 |
| | |
| Registrant’s telephone number, including area code: | (800) 523-1918 |
| | |
| Date of fiscal year end: | November 30 |
| | |
| Date of reporting period: | November 30, 2023 |
Table of Contents
Item 1. Reports to Stockholders
Annual report
Global / international equity mutual funds
Delaware Emerging Markets Fund
Delaware International Equity Fund
(formerly, Delaware International Value Equity Fund)
November 30, 2023
Carefully consider the Funds’ investment objectives, risk factors, charges, and expenses before investing. This and other information can be found in the Funds’ prospectus and their summary prospectuses, which may be obtained by visiting delawarefunds.com/literature or calling 800 523-1918. Investors should read the prospectus and the summary prospectus carefully before investing.
You can obtain shareholder reports and prospectuses online instead of in the mail. Visit delawarefunds.com/edelivery.
Experience Delaware Funds by Macquarie®
Macquarie Asset Management (MAM) is a global asset manager that aims to deliver positive impact for everyone. MAM's public markets businesses trace their roots to 1929 and partner with institutional and individual clients to deliver specialist active investment capabilities across global equities, fixed income, and multi-asset solutions using a conviction-based, long-term approach to investing. In the US, retail investors recognize our Delaware Funds by Macquarie family of funds as one of the oldest mutual fund families.
If you are interested in learning more about creating an investment plan, contact your financial advisor.
You can learn more about Delaware Funds or obtain a prospectus for Delaware Emerging Markets Fund and Delaware International Equity Fund at delawarefunds.com/literature.
Manage your account online
● Check your account balance and transactions
● View statements and tax forms
● Make purchases and redemptions
Visit delawarefunds.com/account-access.
Macquarie Asset Management (MAM) is the asset management division of Macquarie Group. MAM is an integrated asset manager and private markets offering a diverse range of capabilities, including real assets, real estate, credit, equities, and multi-asset solutions.
The Funds are advised by Delaware Management Company, a series of Macquarie Investment Management Business Trust (MIMBT), a US registered investment adviser, and distributed by Delaware Distributors, L.P. (DDLP), an affiliate of MIMBT and Macquarie Group Limited.
Other than Macquarie Bank Limited ABN 46 008 583 542 (“Macquarie Bank”), any Macquarie Group entity noted in this document is not an authorized deposit-taking institution for the purposes of the Banking Act 1959 (Commonwealth of Australia). The obligations of these other Macquarie Group entities do not represent deposits or other liabilities of Macquarie Bank. Macquarie Bank does not guarantee or otherwise provide assurance in respect of the obligations of these other Macquarie Group entities. In addition, if this document relates to an investment, (a) the investor is subject to investment risk including possible delays in repayment and loss of income and principal invested and (b) none of Macquarie Bank or any other Macquarie Group entity guarantees any particular rate of return on or the performance of the investment, nor do they guarantee repayment of capital in respect of the investment.
The Funds are governed by US laws and regulations.
This annual report is for the information of Delaware Emerging Markets Fund and Delaware International Equity Fund shareholders, but it may be used with prospective investors when preceded or accompanied by the Delaware Fund fact sheet for the most recently completed calendar quarter. These documents are available at delawarefunds.com/literature.
Unless otherwise noted, views expressed herein are current as of November 30, 2023, and subject to change for events occurring after such date. These views are not intended to be investment advice, to forecast future events, or to guarantee future results.
The Funds are not FDIC insured and are not guaranteed. It is possible to lose the principal amount invested.
All third-party marks cited are the property of their respective owners.
© 2024 Macquarie Management Holdings, Inc.
| Portfolio management reviews |
| Delaware Emerging Markets Fund | November 30, 2023 (Unaudited) |
| Performance preview (for the year ended November 30, 2023) | | |
| Delaware Emerging Markets Fund (Institutional Class shares) | 1-year return | +9.22% |
| Delaware Emerging Markets Fund (Class A shares) | 1-year return | +8.97% |
| MSCI Emerging Markets Index (net) | 1-year return | +4.21% |
| MSCI Emerging Markets Index (gross) | 1-year return | +4.65% |
Past performance does not guarantee future results.
For complete, annualized performance for Delaware Emerging Markets Fund, please see the table on page 8. Institutional Class shares are not subject to a sales charge and are offered for sale exclusively to certain eligible investors. In addition, Institutional Class shares pay no distribution and service fee.
The performance of Class A shares excludes the applicable sales charge. The performance of both Institutional Class shares and Class A shares reflects the reinvestment of all distributions.
Please see page 10 for a description of the index. Index performance returns do not reflect any management fees, transaction costs, or expenses. Indices are unmanaged and one cannot invest directly in an index.
Investment objective
The Fund seeks long-term capital appreciation.
Market review
The Fund’s benchmark, the MSCI Emerging Markets Index, rose 4.2% during the fiscal year ended November 30, 2023, lagging developed markets. Several factors contributed to emerging markets’ relative underperformance, including weaker-than-expected economic data in China, ongoing geopolitical tensions between China and the US, rising US bond yields, and US dollar strength.
Among geographic regions, Latin America outperformed the most. In Brazil, rising expectations for the easing of monetary policy supported equities, particularly in the financials sector. In addition, shares of Petroleo Brasileiro SA rallied since there were no negative surprises in the company’s new pricing policy.
Mexican equities likewise outperformed, led by the materials and consumer staples sectors. The Mexican economy has benefited from US businesses diversifying manufacturing away from China.
Performance was mixed in Asia during the 12-month period. Following the reversal of China’s zero-COVID policy, Chinese equities initially rallied. However, investor sentiment soon soured amid sluggish economic data and heightened geopolitical tension, contributing to China’s sizable underperformance relative to the benchmark.
In South Korea and Taiwan, stocks in the technology sector contributed to outperformance on expectations of increasing demand generated by applications linked to artificial intelligence (AI). Indian equities, supported by stronger-than-expected economic growth, also outperformed.
Performance in the Europe, the Middle East, and Africa (EMEA) region was mixed during the fiscal year. Equities in Poland, Hungary, and Greece posted returns exceeding 40% in US dollar terms, supported by improving macroeconomic data and rising expectations for monetary policy easing. Turkish equities rose as that country’s central bank raised interest rates aggressively to contain high inflation. In contrast, South African equities underperformed as electricity shortages weighed on the energy and mining sectors.
Portfolio management reviews
Delaware Emerging Markets Fund
In terms of sectors, information technology (IT), communication services, and energy outperformed the benchmark. In contrast, real estate, utilities, and materials underperformed.
Source: Bloomberg, unless otherwise noted.
Within the Fund
For the fiscal year ended November 30, 2023, Delaware Emerging Markets Fund outperformed its benchmark, the MSCI Emerging Markets Index. The Fund's Institutional Class shares gained 9.22%. The Fund’s Class A shares advanced 8.97% at net asset value and gained 2.73% at maximum offer price. These figures reflect all distributions reinvested. During the same period, the Fund’s benchmark, the MSCI Emerging Markets Index (net) advanced 4.21%. For complete, annualized performance of Delaware Emerging Markets Fund, please see the table on page 8.
The Fund’s positioning in the IT sector contributed to performance during the 12-month period. In South Korea, shares of SK Hynix Inc. and Samsung Electronics Co. Ltd. outperformed as memory-chip manufacturers announced reductions to their supply growth. We think these reductions may help the industry digest excess inventory and limit further price declines. Separately, rising demand for applications related to AI may bolster these companies’ sales of high-bandwidth memory chips. In Taiwan, robust demand for leading-edge semiconductors contributed to outperformance from Taiwan Semiconductor Manufacturing Co. Ltd. Shares of MediaTek Inc. outperformed because smartphone demand appeared to improve.
India was the largest detractor from relative performance from a country perspective. Shares of Reliance Industries Ltd. underperformed when the Indian government’s windfall taxes on the energy sector capped upside to the company’s refining margins. In addition, the pace of pricing improvement in the mobile telecommunications business has been slower than expected, while the company’s rising investment spending has contributed to higher debt levels. More broadly, the Fund’s lack of exposure to Indian stocks in the industrials and consumer discretionary sectors was unfavorable.
In China, shares of JD.com Inc. and Alibaba Group Holding Ltd. underperformed during the fiscal year. Amid flagging consumer confidence and limited policy stimulus measures, Chinese consumer preferences appeared to shift toward lower-end, value-for-money products. This trend contributed to JD.com and Alibaba ceding market share.
In Chile, shares of Sociedad Quimica Y Minera de Chile SA underperformed as concerns about electric-vehicle demand contributed to declining lithium prices. Potential changes to the Chilean government’s policy on the mining sector further contributed to volatility.
We believe that the near-term outlook for emerging market equities remains clouded by a host of issues, including concerns about US monetary policy, global economic growth, and escalating geopolitical tension. As a result, we expect market conditions to remain volatile. Nonetheless, we do not believe these uncertainties have derailed long-term growth opportunities underpinned by secular trends such as digitalization and consumption premiumization (consumers’ preference for high-quality, healthy, and premium products). Furthermore, we believe that equity valuations across several pockets of the emerging markets universe appear attractive.
Among countries, we currently hold overweight positions in South Korea and Mexico.
Conversely, we are currently underweight relative to the benchmark in the Middle East, Southeast Asia, China, and South Africa. Sectors we currently favor include technology, consumer staples, and energy (largely due to the Fund’s holding in Reliance Industries Ltd.). We are most underweight the financials, consumer discretionary, and materials sectors.
The Fund used foreign currency exchange contracts to facilitate the purchase and sale of equities traded on international exchanges. The effect of these contracts on performance was immaterial.
| Portfolio management reviews | |
| Delaware International Equity Fund | November 30, 2023 (Unaudited) |
| Performance preview (for the year ended November 30, 2023) | | |
| Delaware International Equity Fund (Institutional Class shares) | 1-year return | +10.33% |
| Delaware International Equity Fund (Class A shares) | 1-year return | +10.08% |
| MSCI EAFE (Europe, Australasia, Far East) Index (net) | 1-year return | +12.36% |
| MSCI EAFE (Europe, Australasia, Far East) Index (gross) | 1-year return | +12.96% |
| MSCI ACWI ex USA Index (net) | 1-year return | +9.26% |
| MSCI ACWI ex USA Index (gross) | 1-year return | +9.84% |
Past performance does not guarantee future results.
For complete, annualized performance for Delaware International Equity Fund, please see the table on page 12. Institutional Class shares are not subject to a sales charge and are offered for sale exclusively to certain eligible investors. In addition, Institutional Class shares pay no distribution and service fee.
The performance of Class A shares excludes the applicable sales charge. The performance of both Institutional Class shares and Class A shares reflects the reinvestment of all distributions.
Please see pages 14 and 15 for a description of the indices. Index performance returns do not reflect any management fees, transaction costs, or expenses. Indices are unmanaged and one cannot invest directly in an index.
Investment objective
The Fund seeks long-term growth without undue risk to principal.
Significant Fund events
On August 31, 2023, the portfolio management responsibilities of the Fund changed and commencing on that date Aditya Kapoor, Charles John, and Charles (Trey) Schorgl began to serve as portfolio managers of the Fund.
In addition, on October 31, 2023, the Fund’s name changed to Delaware International Equity Fund (formerly known as Delaware International Value Equity Fund) and on that same date the Fund’s benchmark changed from the MSCI EAFE (Europe, Australia, Far East) Index to the MSCI ACWI (All Country World Index) ex USA Index.
Market review
While international markets were volatile during the fiscal year ended November 30, 2023, performance was strong. Unlike US markets, international markets benefited little from the proliferation of artificial intelligence (AI). Because most AI development takes place in the US, the investment flow directed at the new technology came at the expense of global markets. Nonetheless, non-US markets benefited from certain structural forces that came into play as we note below.
Japan was one of the strongest-performing markets during the 12-month period. While dovish central bank policy led to weakness in the yen, the Japanese economy benefited from several tailwinds. Corporations have evolved to manage their businesses with more shareholder-friendly practices. After years of low return prospects and poor capital controls, global investors have welcomed this change. Japan has started to hint at future interest rate increases. We think this would help strengthen the yen and provide an additional tailwind for US investors.
European markets also performed well, particularly Denmark, which is home to Novo Nordisk A/S, a large pharmaceutical company. Novo Nordisk is one of two major players to manufacture and market a new class of diabetes and obesity drugs, GLP-1, which have had major success globally.
Within emerging markets, Brazil was strong, with the Brazilian stocks within the MSCI ACWI ex USA Index gaining more than 20%. However, the largest market in the emerging world, China, declined for the period. China has struggled to gain momentum after years of COVID-19-induced lockdowns. While China’s overall economy has held up since 2020, due to a massive wave of export activity, a lack of property-market growth and little government stimulus has hampered its domestic economy. Certain industries, like domestic travel, have regained momentum, but broad growth has still fallen short.
Source: Bloomberg, unless otherwise noted.
Within the Fund
For the entire fiscal year ended November 30, 2023, Delaware International Equity Fund outperformed its new benchmark, the MSCI ACWI ex USA Index, but underperformed its former benchmark, the MSCI EAFE Index. The Fund’s Institutional Class shares gained 10.33%. The Fund’s Class A shares advanced 10.08% at net asset value (NAV) and 3.73% at maximum offer price. These figures reflect reinvestment of all distributions. During the same period, the Fund’s new benchmark gained 9.26% (net), while its former benchmark returned 12.36% (net). For complete, annualized performance of Delaware International Equity Fund, please see the table on page 12.
For the period under prior portfolio management, from December 1, 2022, through August 31, 2023, Delaware International Equity Fund showed a positive result and outperformed its benchmark, the MSCI EAFE Index (net), during the period.
We sought to identify undervalued quality companies with the potential to provide solid relative capital protection in challenging times. Therefore, the Fund’s portfolio was built bottom-up (stock-by-stock) by selecting company stocks based on quantitative insights and qualitative assessments.
Within the benchmark, industrials and consumer discretionary provided the strongest sector returns during this period, 16.6% and 16.4%, respectively. The weakest performance came from communication services and energy, with respective returns of 4.9% and 5.0%.
Stock selection had a positive effect, whereas the active sector allocation had a negative effect on the Fund’s relative performance. Stock selection in consumer discretionary and healthcare contributed the most to relative performance. The Fund’s sizable overweight to one of the weaker-performing sectors, consumer staples, detracted from performance.
In terms of individual holdings, three of the largest contributors to performance were German sportswear manufacturer adidas AG, Spanish IT provider Amadeus IT Group SA, and German multinational enterprise resource planning (ERP) software company SAP SE.
Amadeus IT Group provides a software backbone for the global travel industry. We had invested in this category leader during the height of the pandemic, expecting the company to manage well through the situation and come out strong on the other side. So far, Amadeus IT Group has delivered on our expectations, and its third-quarter 2023 results were a repeat of past quarters. Global travel continued to experience a healthy recovery, and Amadeus IT Group’s profits have grown faster than revenues. All three of its business divisions have performed well.
SAP delivered on its migration to a subscription-based business model, which we think may provide higher profitability, more stability, and better scalability. We invested
Portfolio management reviews
Delaware International Equity Fund
early in this transformation three years ago and think management has executed well so far. Its first goal was to build an installed base of subscription customers. Its second goal is margin expansion, which is occurring now. Investors have rewarded the company for its higher and more stable margin on an expanding revenue base, and we continue to believe in SAP’s potential.
Notable detractors from the Fund’s performance during the first nine months of the Fund’s fiscal year included British multinational alcoholic beverage company Diageo PLC, Swedish global personal-product producer Essity AB, and Japanese producer of consumer and chemical products Kao Corp.
Diageo faced worsening business conditions in its Latin American and Caribbean business, which represents approximately 11% of group revenues. Diageo reduced its growth expectations for 2024, in part due to decreased consumer spending after a period of strong growth. This has slowed down the unwinding of currently high inventory levels in the region. We believe this may be a transitory issue, with the bigger risk being contagion to other regions. The bigger news from Diageo, in our view, was a change to its near-term growth algorithm. Earnings are now growing in line with revenues rather than faster than revenues. We believe the new CEO used this opportunity to lower the expectations she inherited from her predecessor. This may provide more flexibility when choosing between margin expansion and growth, and though the share price declined in the short term, we think the decision was wise.
The end of the COVID-19 pandemic did not bring the relief that Swedish-based personal-product producer Essity had hoped for. The company’s latest quarterly results revealed that it will have difficulty achieving flat volume levels for the full year. Management made the strategic decision to favor margins at the expense of volume, as it believed that strong brands, the company’s solid regional market positions, and robust relationships with distributors and retailers would expand margins even with price concessions from private-label competitors.
The Fund’s new portfolio managers began managing the Fund on August 31, 2023. During September and October 2023, Delaware International Equity Fund underperformed its benchmark, the MSCI EAFE Index. The greatest drag on performance was stock selection in consumer staples and healthcare as well as an overweight in consumer staples. At a stock level, HelloFresh SE, a German food delivery business, was the weakest performer. Although the company missed quarterly estimates, largely due to supply bottlenecks within the value chain, it maintained guidance. Koninklijke Ahold Delhaize NV, a European grocery company, was also a drag on performance. We sold the stock as we did not have conviction in the company going forward.
Within healthcare, Genmab A/S, a Denmark-based biopharmaceutical company, was the weakest performer. The company executed well, beating consensus on revenue for several quarters in a row, growing key products, and maintaining a strong pipeline that is undervalued by investors, in our opinion. The stock may be losing shareholder excitement as momentum shifted to companies producing drugs in the GLP-1 class, but we are keeping a close eye on the business.
On the positive side, Dollarama Inc., a Canadian dollar store, contributed to relative performance. Dollar stores tend to do well in periods of uncertainty. In addition, the
company beat quarterly estimates and raised its full-year guidance. Consumers have been trading down and seeking lower-priced goods, a trend that may continue to be a tailwind, in our view, as inflation has thinned consumers’ wallets.
During September and October, we exited many consumer staples holdings, bringing the portfolio’s exposure down considerably. We made other changes to bring the portfolio more in line with the strategy of the current investment team. The macroeconomic landscape did not influence our thinking or strategy during this time.
In November, the final month of the fiscal year, Delaware International Equity Fund underperformed its new benchmark, the MSCI ACWI ex USA Index. The consumer staples sector, due both to stock selection and an overweight, created the largest drag on performance. Stock selection in industrials also had a negative impact. On the positive side, stock selection in financials and information technology was the largest contributor to relative performance in November.
At a stock level, HelloFresh continued to weigh on performance. We continue to own the stock as we believe the company’s investment in marketing spend will ultimately be converted to future cash flow. Budweiser Brewing Co. APAC Ltd., the Hong Kong-based arm of Budweiser that brews and distributes beer in the region, was also a drag on performance. The company missed earnings in the recent quarter, leading to a small decline in November. However, sales in China are regaining momentum, and we believe the company is well positioned to reaccelerate after modestly negative earnings growth in 2022.
MercadoLibre Inc., an Argentinean ecommerce company with sales primarily in Brazil, Argentina, and Mexico, contributed to performance. The company is the leader in the region with major long-term structural growth tailwinds as more consumers gain access to credit and buy merchandise online. The company posted strong third-quarter results, which helped boost the stock during the month.
| Performance summaries | |
| Delaware Emerging Markets Fund | November 30, 2023 (Unaudited) |
The performance quoted represents past performance and does not guarantee future results. Investment return and principal value of an investment will fluctuate so that shares, when redeemed, may be worth more or less than their original cost. Current performance may be lower or higher than the performance quoted. Performance data current to the most recent month end may be obtained by calling 800 523-1918 or visiting delawarefunds.com/performance.
| Fund and benchmark performance1,2 | Average annual total returns through November 30, 2023 |
| | 1 year | 5 year | 10 year | Lifetime |
| Class A (Est. June 10, 1996) | | | | |
| Excluding sales charge | +8.97% | +2.98% | +2.86% | — |
| Including sales charge | +2.73% | +1.76% | +2.25% | — |
| Class C (Est. June 10, 1996) | | | | |
| Excluding sales charge | +8.13% | +2.20% | +2.09% | — |
| Including sales charge | +7.13% | +2.20% | +2.09% | — |
| Class R (Est. August 31, 2009) | | | | |
| Excluding sales charge | +8.69%* | +2.73% | +2.61% | — |
| Including sales charge | +8.69% | +2.73% | +2.61% | — |
| Institutional Class (Est. June 10, 1996) | | | | |
| Excluding sales charge | +9.22% | +3.24% | +3.12% | — |
| Including sales charge | +9.22% | +3.24% | +3.12% | — |
| Class R6 (Est. May 2, 2016) | | | | |
| Excluding sales charge | +9.28% | +3.33% | — | +6.26% |
| Including sales charge | +9.28% | +3.33% | — | +6.26% |
| MSCI Emerging Markets Index (net) | +4.21% | +2.34% | +2.12% | — |
| MSCI Emerging Markets Index (gross) | +4.65% | +2.73% | +2.50% | — |
*Total return for the report period presented in the table differs from the return in “Financial highlights.” The total return presented in the above table is calculated based on the net asset value at which shareholder transactions were processed. The total return presented in “Financial highlights” is calculated in the same manner but also takes into account certain adjustments that are necessary under US generally accepted accounting principles.
1Returns reflect the reinvestment of all distributions and are presented both with and without the applicable sales charges described below. Returns do not reflect the deduction of taxes the shareholder would pay on Fund distributions or redemptions of Fund shares.
Expense limitations were in effect for certain classes during some or all of the periods shown in the “Fund and benchmark performance” table. Expenses for each class are listed in the “Fund expense ratios” table on page 9. Performance would have been lower had expense limitations not been in effect.
Class A shares are sold with a maximum front-end sales charge of 5.75%, and have an annual distribution and service (12b-1) fee of
0.25% of average daily net assets. Performance for Class A shares, excluding sales charges, assumes that no front-end sales charge applied.
Class C shares are sold with a contingent deferred sales charge (CDSC) of 1.00% if redeemed within one year of purchase. They are also subject to an annual 12b-1 fee of 1.00% of average daily net assets. Performance for Class C shares, excluding sales charges, assumes either that CDSCs did not apply or that the investment was not redeemed.
Class R shares are available only for certain retirement plan products. They are sold without a sales charge and have an annual 12b-1 fee of 0.50% of average daily net assets.
Institutional Class shares are not subject to a sales charge and are offered for sale exclusively to certain eligible investors. In addition, Institutional Class shares pay no 12b-1 fee.
Class R6 shares are available only to certain investors. In addition, Class R6 shares do not pay any service fees, sub-accounting fees, and/or sub-transfer agency fees to any brokers, dealers, or other financial intermediaries. Class R6 shares pay no 12b-1 fee.
International investments entail risks including fluctuation in currency values, differences in accounting principles, or economic or political instability. Investing in emerging markets can be riskier than investing in established foreign markets due to increased volatility, lower trading volume, and higher risk of market closures. In many emerging markets, there is substantially less publicly available information and the available information may be incomplete or misleading. Legal claims are generally more difficult to pursue.
Investments in small and/or medium-sized companies typically exhibit greater risk and higher volatility than larger, more established companies.
The disruptions caused by natural disasters, pandemics, or similar events could prevent the Fund from executing advantageous investment decisions in a timely manner and could negatively impact the Fund’s ability to achieve its investment objective and the value of the Fund’s investments.
2The Fund’s expense ratios, as described in the most recent prospectus, are disclosed in the following “Fund expense ratios” table. The expense ratios below may differ from the expense ratios in the "Financial highlights" since they are based on different time periods and the expense ratios in the prospectus include acquired fund fees and expenses, if any. See Note 2 in "Notes to financial statements" for additional details. Please see the “Financial highlights” section in this report for the most recent expense ratios.
| | | | | Institutional | |
| Fund expense ratios | Class A | Class C | Class R | Class | Class R6 |
| Total annual operating expenses (without fee waivers) | 1.66% | 2.41% | 1.91% | 1.41% | 1.30% |
| Net expenses (including fee waivers, if any) | 1.45% | 2.20% | 1.70% | 1.20% | 1.12% |
| Type of waiver | Contractual | Contractual | Contractual | Contractual | Contractual |
Performance summaries
Delaware Emerging Markets Fund
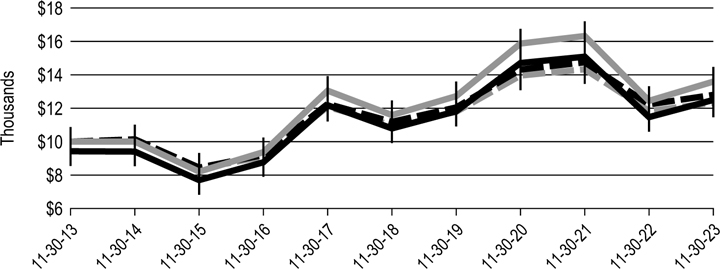
Performance of a $10,000 investment1
For the period November 30, 2013 through November 30, 2023
| | | | Starting value | | | Ending value | |
 | Delaware Emerging Markets Fund – Institutional Class shares | | $10,000 | | | $13,594 | |
 | MSCI Emerging Markets Index (gross) | | $10,000 | | | $12,800 | |
 | Delaware Emerging Markets Fund – Class A shares | | $ 9,425 | | | $12,498 | |
 | MSCI Emerging Markets Index (net) | | $10,000 | | | $12,334 | |
1The “Performance of a $10,000 investment” graph assumes $10,000 invested in Institutional Class and Class A shares of the Fund on November 30, 2013, and includes the effect of a 5.75% front-end sales charge (for Class A shares) and the reinvestment of all distributions. The graph does not reflect the deduction of taxes the shareholders would pay on Fund distributions or redemptions of Fund shares. Expense limitations were in effect for some or all of the periods shown. Performance would have been lower had expense limitations not been in effect. Expenses are listed in the “Fund expense ratios” table on page 9. Please note additional details on pages 8 through 11.
The graph also assumes $10,000 invested in the MSCI Emerging Markets Index as of November 30, 2013. The MSCI Emerging Markets Index represents large- and mid-cap stocks across emerging market countries worldwide. The index covers approximately 85% of the free float-adjusted market capitalization in each country. Index “net” return approximates the minimum possible dividend reinvestment, after deduction of withholding tax at the highest possible rate. Index “gross” return approximates the maximum possible dividend reinvestment.
Index performance returns do not reflect any management fees, transaction costs, or expenses. Indices are unmanaged and one cannot invest directly in an index. Past performance does not guarantee future results.
Performance of other Fund classes will vary due to different charges and expenses.
| | Nasdaq symbols | CUSIPs |
| Class A | DEMAX | 245914841 |
| Class C | DEMCX | 245914825 |
| Class R | DEMRX | 245914569 |
| Institutional Class | DEMIX | 245914817 |
| Class R6 | DEMZX | 245914510 |
| Performance summaries | |
| Delaware International Equity Fund | November 30, 2023 (Unaudited) |
The performance quoted represents past performance and does not guarantee future results. Investment return and principal value of an investment will fluctuate so that shares, when redeemed, may be worth more or less than their original cost. Current performance may be lower or higher than the performance quoted. Performance data current to the most recent month end may be obtained by calling 800 523-1918 or visiting delawarefunds.com/performance.
| Fund and benchmark performance1,2 | Average annual total returns through November 30, 2023 |
| | 1 year | 5 year | 10 year | Lifetime |
| Class A (Est. October 31, 1991) | | | | |
| Excluding sales charge | +10.08% | +3.07% | +1.79% | — |
| Including sales charge | +3.73% | +1.85% | +1.19% | — |
| Class C (Est. November 29, 1995) | | | | |
| Excluding sales charge | +9.23% | +2.31% | +1.04% | — |
| Including sales charge | +8.23% | +2.31% | +1.04% | — |
| Class R (Est. June 2, 2003) | | | | |
| Excluding sales charge | +9.79% | +2.81% | +1.53% | — |
| Including sales charge | +9.79% | +2.81% | +1.53% | — |
| Institutional Class (Est. November 9, 1992) | | | | |
| Excluding sales charge | +10.33% | +3.32% | +2.04% | — |
| Including sales charge | +10.33% | +3.32% | +2.04% | — |
| Class R6 (Est. March 29, 2018) | | | | |
| Excluding sales charge | +10.44% | +3.41% | — | +0.81% |
| Including sales charge | +10.44% | +3.41% | — | +0.81% |
| MSCI EAFE Index (net) | +12.36% | +5.99% | +3.89% | — |
| MSCI EAFE Index (gross) | +12.96% | +6.51% | +4.39% | — |
| MSCI ACWI ex USA Index (net) | +9.26% | +5.06% | +3.41% | — |
| MSCI ACWI ex USA Index (gross) | +9.84% | +5.57% | +3.90% | — |
1Returns reflect the reinvestment of all distributions and are presented both with and without the applicable sales charges described below. Returns do not reflect the deduction of taxes the shareholder would pay on Fund distributions or redemptions of Fund shares.
Expense limitations were in effect for certain classes during some or all of the periods shown in the “Fund and benchmark performance” table. Expenses for each class are listed in the “Fund expense ratios” table on page 13. Performance would have been lower had expense limitations not been in effect.
Class A shares are sold with a maximum front-end sales charge of 5.75%, and have an annual distribution and service (12b-1) fee of 0.25% of average daily net assets. Performance for Class A shares, excluding sales charges, assumes that no front-end sales charge applied.
Class C shares are sold with a contingent deferred sales charge (CDSC) of 1.00% if redeemed within one year of purchase. They are also subject to an annual 12b-1 fee of 1.00% of average daily net assets. Performance for Class C shares, excluding sales charges, assumes either that CDSCs did not apply or that the investment was not redeemed.
Class R shares are available only for certain retirement plan products. They are sold without a sales charge and have an annual 12b-1 fee of 0.50% of average daily net assets.
Institutional Class shares are not subject to a sales charge and are offered for sale exclusively to certain eligible investors. In addition, Institutional Class shares pay no 12b-1 fee.
Class R6 shares are available only to certain investors. In addition, Class R6 shares do not pay any service fees, sub-accounting fees, and/or sub-transfer agency fees to any brokers, dealers, or other financial intermediaries. Class R6 shares pay no 12b-1 fee.
International investments entail risks including fluctuation in currency values, differences in accounting principles, or economic or political instability. Investing in emerging markets can be riskier than investing in established foreign markets due to increased volatility, lower trading volume, and higher risk of market closures. In many emerging markets, there is substantially less publicly available information and the available information may be incomplete or misleading. Legal claims are generally more difficult to pursue.
The disruptions caused by natural disasters, pandemics, or similar events could prevent the Fund from executing advantageous investment decisions in a timely manner and could negatively impact the Fund’s ability to achieve its investment objective and the value of the Fund’s investments.
2The Fund’s expense ratios, as described in the most recent prospectus, are disclosed in the following “Fund expense ratios” table. The expense ratios below may differ from the expense ratios in the “Financial highlights” since they are based on different time periods and the expense ratios in the prospectus include acquired fund fees and expenses, if any. See Note 2 in “Notes to financial statements” for additional details. Please see the “Financial highlights” section in this report for the most recent expense ratios.
| | | | | Institutional | |
| Fund expense ratios | Class A | Class C | Class R | Class | Class R6 |
| Total annual operating expenses (without fee waivers) | 1.35% | 2.10% | 1.60% | 1.10% | 1.02% |
| Net expenses (including fee waivers, if any) | 1.13% | 1.88% | 1.38% | 0.88% | 0.79% |
| Type of waiver | Contractual | Contractual | Contractual | Contractual | Contractual |
Performance summaries
Delaware International Equity Fund
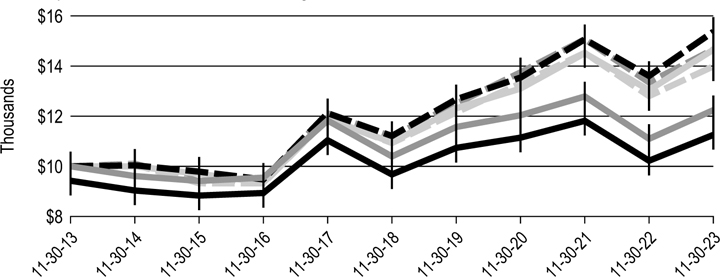
Performance of a $10,000 investment1
For the period November 30, 2013 through November 30, 2023
| | | | Starting value | | | Ending value | |
| MSCI EAFE Index (gross) | | $10,000 | | | $15,369 | |
| MSCI ACWI ex USA Index (gross) | | $10,000 | | | $14,662 | |
 | MSCI EAFE Index (net) | | $10,000 | | | $14,653 | |
 | MSCI ACWI ex USA Index (net) | | $10,000 | | | $13,987 | |
| Delaware International Equity Fund – Institutional Class shares | | $10,000 | | | $12,242 | |
| Delaware International Equity Fund – Class A shares | | $ 9,425 | | | $11,255 | |
1The “Performance of a $10,000 investment” graph assumes $10,000 invested in Institutional Class and Class A shares of the Fund on November 30, 2013, and includes the effect of a 5.75% front-end sales charge (for Class A shares) and the reinvestment of all distributions. The graph does not reflect the deduction of taxes the shareholders would pay on Fund distributions or redemptions of Fund shares. Expense limitations were in effect for some or all of the periods shown. Performance would have been lower had expense limitations not been in effect. Expenses are listed in the “Fund expense ratios” table on page 13. Please note additional details on pages 12 through 15.
The graph also assumes $10,000 invested in the MSCI ACWI ex USA Index and the MSCI EAFE Index as of November 30, 2013.
The MSCI ACWI (All Country World Index) ex USA Index represents large- and mid-cap stocks across developed and emerging markets worldwide, excluding the United States. The index covers approximately 85% of the global investable equity opportunity set outside the United States. Index “net” return approximates the minimum possible dividend reinvestment, after deduction of withholding tax at the highest possible rate. Index “gross” return approximates the maximum possible dividend reinvestment.
The MSCI EAFE (Europe, Australasia, Far East) Index represents large- and mid-cap stocks across 21 developed markets, excluding the United States and Canada. The index covers approximately 85% of the free float-adjusted market capitalization in each country. Index “net” return approximates the minimum possible dividend reinvestment, after deduction of withholding tax at the highest possible rate. Index “gross” return approximates the maximum possible dividend reinvestment.
Index performance returns do not reflect any management fees, transaction costs, or expenses. Indices are unmanaged and one cannot invest directly in an index. Past performance does not guarantee future results.
Performance of other Fund classes will vary due to different charges and expenses.
| | Nasdaq symbols | CUSIPs |
| Class A | DEGIX | 245914106 |
| Class C | DEGCX | 245914858 |
| Class R | DIVRX | 245914577 |
| Institutional Class | DEQIX | 245914403 |
| Class R6 | DEQRX | 245914478 |
Disclosure of Fund expenses
For the six-month period from June 1, 2023 to November 30, 2023 (Unaudited)
As a shareholder of a Fund, you incur two types of costs: (1) transaction costs, including sales charges (loads) on purchase payments, reinvested dividends, or other distributions; redemption fees; and exchange fees; and (2) ongoing costs, including management fees; distribution and service (12b-1) fees; and other Fund expenses. The following examples are intended to help you understand your ongoing costs (in dollars) of investing in a Fund and to compare these costs with the ongoing costs of investing in other mutual funds.
The examples are based on an investment of $1,000 invested at the beginning of the period and held for the entire six-month period from June 1, 2023 to November 30, 2023.
Actual expenses
The first section of the tables shown, “Actual Fund return,” provides information about actual account values and actual expenses. You may use the information in this section of the table, together with the amount you invested, to estimate the expenses that you paid over the period. Simply divide your account value by $1,000 (for example, an $8,600 account value divided by $1,000 = 8.6), then multiply the result by the number in the first section under the heading entitled “Expenses Paid During Period” to estimate the expenses you paid on your account during this period.
Hypothetical example for comparison purposes
The second section of the tables shown, “Hypothetical 5% return,” provides information about hypothetical account values and hypothetical expenses based on the Funds’ actual expense ratio and an assumed rate of return of 5% per year before expenses, which is not the Funds’ actual return. The hypothetical account values and expenses may not be used to estimate the actual ending account balance or expenses you paid for the period. You may use this information to compare the ongoing costs of investing in each Fund and other funds. To do so, compare this 5% hypothetical example with the 5% hypothetical examples that appear in the shareholder reports of the other funds.
Please note that the expenses shown in the tables are meant to highlight your ongoing costs only and do not reflect any transactional costs, such as sales charges (loads), redemption fees, or exchange fees. Therefore, the second section of each table is useful in comparing ongoing costs only, and will not help you determine the relative total costs of owning different funds. In addition, if these transactional costs were included, your costs would have been higher. The Funds’ expenses shown in the tables reflect fee waivers in effect and assume reinvestment of all dividends and distributions.
Delaware Emerging Markets Fund
Expense analysis of an investment of $1,000
| | Beginning | Ending | | Expenses |
| | Account Value | Account Value | Annualized | Paid During Period |
| | 6/1/23 | 11/30/23 | Expense Ratio | 6/1/23 to 11/30/23* |
| Actual Fund return† | | | | |
| Class A | $1,000.00 | $1,081.10 | 1.45% | $7.56 |
| Class C | 1,000.00 | 1,076.50 | 2.20% | 11.45 |
| Class R | 1,000.00 | 1,079.40 | 1.70% | 8.86 |
| Institutional Class | 1,000.00 | 1,082.20 | 1.20% | 6.26 |
| Class R6 | 1,000.00 | 1,082.70 | 1.12% | 5.85 |
| Hypothetical 5% return (5% return before expenses) |
| Class A | $1,000.00 | $1,017.80 | 1.45% | $7.33 |
| Class C | 1,000.00 | 1,014.04 | 2.20% | 11.11 |
| Class R | 1,000.00 | 1,016.55 | 1.70% | 8.59 |
| Institutional Class | 1,000.00 | 1,019.05 | 1.20% | 6.07 |
| Class R6 | 1,000.00 | 1,019.45 | 1.12% | 5.67 |
Delaware International Equity Fund
Expense analysis of an investment of $1,000
| | Beginning | Ending | | Expenses |
| | Account Value | Account Value | Annualized | Paid During Period |
| | 6/1/23 | 11/30/23 | Expense Ratio | 6/1/23 to 11/30/23* |
| Actual Fund return† | | | | |
| Class A | $1,000.00 | $993.30 | 1.13% | $5.65 |
| Class C | 1,000.00 | 989.60 | 1.88% | 9.38 |
| Class R | 1,000.00 | 991.90 | 1.38% | 6.89 |
| Institutional Class | 1,000.00 | 994.90 | 0.88% | 4.40 |
| Class R6 | 1,000.00 | 994.80 | 0.79% | 3.95 |
| Hypothetical 5% return (5% return before expenses) |
| Class A | $1,000.00 | $1,019.40 | 1.13% | $5.72 |
| Class C | 1,000.00 | 1,015.64 | 1.88% | 9.50 |
| Class R | 1,000.00 | 1,018.15 | 1.38% | 6.98 |
| Institutional Class | 1,000.00 | 1,020.66 | 0.88% | 4.46 |
| Class R6 | 1,000.00 | 1,021.11 | 0.79% | 4.00 |
*“Expenses Paid During Period” are equal to the relevant Fund's annualized expense ratio, multiplied by the average account value over the period, multiplied by 183/365 (to reflect the one-half year period).
Disclosure of Fund expenses
For the six-month period from June 1, 2023 to November 30, 2023 (Unaudited)
†Because actual returns reflect only the most recent six-month period, the returns shown may differ significantly from fiscal year returns.
In addition to the Fund's expenses reflected above, each Fund also indirectly bears its portion of the fees and expenses of any investment companies (Underlying Funds), including exchange-traded funds, in which it invests. The tables above do not reflect the expenses of any Underlying Funds.
Security type / country and sector allocations
| Delaware Emerging Markets Fund | As of November 30, 2023 (Unaudited) |
Sector designations may be different from the sector designations presented in other Fund materials. The sector designations may represent the investment manager’s internal sector classifications, which may result in the sector designations for one fund being different than another fund’s sector designations.
| Security type / country | | Percentage of net assets |
| Common Stocks by Country | | | 98.24 | % |
| Argentina | | | 0.60 | % |
| Australia | | | 0.30 | % |
| Bahrain | | | 0.06 | % |
| Brazil | | | 5.61 | % |
| Chile | | | 0.94 | % |
| China | | | 24.19 | % |
| Hong Kong | | | 0.23 | % |
| India | | | 14.59 | % |
| Indonesia | | | 1.34 | % |
| Malaysia | | | 0.05 | % |
| Mexico | | | 4.66 | % |
| Netherlands | | | 0.01 | % |
| Peru | | | 0.77 | % |
| Republic of Korea | | | 24.54 | % |
| Russia | | | 0.00 | % |
| South Africa | | | 0.33 | % |
| Taiwan | | | 17.53 | % |
| Turkey | | | 1.32 | % |
| United Kingdom | | | 0.07 | % |
| United States | | | 1.10 | % |
| Preferred Stocks | | | 2.08 | % |
| Rights | | | 0.03 | % |
| Warrants | | | 0.02 | % |
| Exchange-Traded Fund | | | 0.21 | % |
| Participation Notes | | | 0.00 | % |
| Total Value of Securities | | | 100.58 | % |
| Liabilities Net of Receivables and Other Assets | | | (0.58 | )% |
| Total Net Assets | | | 100.00 | % |
Security type / country and sector allocations
Delaware Emerging Markets Fund
| Common stocks, participation notes, and preferred stocks | | Percentage of net assets |
| Communication Services | | | 12.46 | % |
| Consumer Discretionary | | | 7.34 | % |
| Consumer Staples | | | 13.19 | % |
| Energy | | | 10.37 | % |
| Financials | | | 5.36 | % |
| Healthcare | | | 2.17 | % |
| Industrials | | | 8.86 | % |
| Information Technology* | | | 35.77 | % |
| Materials | | | 3.87 | % |
| Real Estate | | | 0.30 | % |
| Utilities | | | 0.63 | % |
| Total | | | 100.32 | % |
*To monitor compliance with the Fund's concentration guidelines as described in the Fund's Prospectus and Statement of Additional Information, the Information Technology sector (as disclosed herein for financial reporting purposes) is subdivided into a variety of “industries” (in accordance with the requirements of the Investment Company Act of 1940, as amended). The Information Technology sector consisted of Computers, Electronics, Electronic Components-Semiconductors, Internet, Semiconductor Components-Integrated Circuits, and Software. As of November 30, 2023, such amounts, as a percentage of total net assets were 1.13%, 0.12%, 21.34%, 0.37%, 11.88%, and 0.93%, respectively. The percentage in any such single industry will comply with the Fund's concentration policy even if the percentage in the Information Technology sector for financial reporting purposes may exceed 25%.
Security type / country and sector allocations
| Delaware International Equity Fund | As of November 30, 2023 (Unaudited) |
Sector designations may be different from the sector designations presented in other Fund materials. The sector designations may represent the investment manager’s internal sector classifications, which may result in the sector designations for one fund being different than another fund’s sector designations.
| Security type / country | | Percentage of net assets |
| Common Stocks by Country | | | 97.14 | % |
| Austria | | | 1.58 | % |
| Brazil | | | 3.26 | % |
| Canada | | | 2.84 | % |
| China | | | 4.96 | % |
| Denmark | | | 3.82 | % |
| France | | | 16.17 | % |
| Germany | | | 8.87 | % |
| Hong Kong | | | 1.52 | % |
| India | | | 2.85 | % |
| Italy | | | 1.85 | % |
| Japan | | | 13.29 | % |
| Netherlands | | | 7.77 | % |
| Singapore | | | 0.41 | % |
| Spain | | | 2.21 | % |
| Switzerland | | | 5.97 | % |
| Taiwan | | | 2.39 | % |
| United Kingdom | | | 6.30 | % |
| United States | | | 11.08 | % |
| Preferred Stock | | | 0.77 | % |
| Short-Term Investments | | | 1.05 | % |
| Total Value of Securities | | | 98.96 | % |
| Receivables and Other Assets Net of Liabilities | | | 1.04 | % |
| Total Net Assets | | | 100.00 | % |
Security type / country and sector allocations
Delaware International Equity Fund
| Common stocks and preferred stock by sector | | Percentage of net assets |
| Communication Services | | | 4.33 | % |
| Consumer Discretionary | | | 11.12 | % |
| Consumer Staples* | | | 25.12 | % |
| Energy | | | 5.64 | % |
| Financials | | | 17.91 | % |
| Healthcare | | | 8.45 | % |
| Industrials | | | 6.56 | % |
| Information Technology | | | 13.05 | % |
| Materials | | | 5.73 | % |
| Total | | | 97.91 | % |
*The Fund has adopted a fundamental policy to concentrate its investments in the Consumer Staples Sector as described in the Fund's Prospectus and Statement of Additional Information. The Consumer Staples Sector (as disclosed here for financial reporting purposes only) is subdivided into a variety of 'industries' (in accordance with the requirements of the Investment Company Act of 1940, as amended). The Consumer Staples sector consisted of Beverages, Cosmetics/Personal Care, Food, and Household Products/Wares. As of November 30, 2023, such amounts, as a percentage of total net assets were 4.87%, 6.93%, 9.87%, and 3.45%, respectively.
Schedules of investments
| Delaware Emerging Markets Fund | November 30, 2023 |
| | | Number of
shares | | | Value (US $) | |
| Common Stocks – 98.24%D | | | | | | | | |
| Argentina - 0.60% | | | | | | | | |
| Cablevision Holding GDR | | | 443,972 | | | $ | 1,628,984 | |
| Cresud ADR | | | 1,660,184 | | | | 14,991,462 | |
| Grupo Clarin GDR Class B 144A #, † | | | 131,213 | | | | 222,322 | |
| IRSA Inversiones y Representaciones ADR | | | 1,338,977 | | | | 11,890,116 | |
| | | | | | | | 28,732,884 | |
| Australia - 0.30% | | | | | | | | |
| Rio Tinto ADR | | | 166,832 | | | | 11,526,423 | |
| Woodside Energy Group ADR | | | 137,332 | | | | 2,791,959 | |
| | | | | | | | 14,318,382 | |
| Bahrain - 0.06% | | | | | | | | |
| Aluminium Bahrain GDR 144A # | | | 221,400 | | | | 3,171,245 | |
| | | | | | | | 3,171,245 | |
| Brazil - 5.61% | | | | | | | | |
| Atacadao | | | 500,000 | | | | 1,155,007 | |
| Banco Bradesco ADR | | | 13,700,000 | | | | 45,621,000 | |
| Banco Santander Brasil ADR | | | 2,751,128 | | | | 17,222,061 | |
| BRF ADR † | | | 6,850,000 | | | | 20,002,000 | |
| Centrais Eletricas Brasileiras ADR | | | 989,541 | | | | 8,193,399 | |
| Embraer ADR † | | | 420,704 | | | | 7,358,113 | |
| Itau Unibanco Holding ADR | | | 5,952,439 | | | | 38,095,610 | |
| Rumo | | | 1,905,351 | | | | 8,864,708 | |
| Telefonica Brasil ADR | | | 2,050,000 | | | | 21,935,000 | |
| TIM ADR | | | 1,244,820 | | | | 21,946,177 | |
| Vale ADR | | | 5,000,000 | | | | 75,000,000 | |
| XP Class A | | | 211,715 | | | | 4,930,842 | |
| | | | | | | | 270,323,917 | |
| Chile - 0.94% | | | | | | | | |
| Cia Cervecerias Unidas ADR | | | 410,528 | | | | 5,028,968 | |
| Sociedad Quimica y Minera de Chile ADR | | | 800,000 | | | | 40,192,000 | |
| | | | | | | | 45,220,968 | |
| China - 24.19% | | | | | | | | |
| Alibaba Group Holding † | | | 2,300,000 | | | | 21,420,890 | |
| Alibaba Group Holding ADR † | | | 1,940,000 | | | | 145,267,200 | |
| ANTA Sports Products | | | 1,700,000 | | | | 17,726,243 | |
| Baidu ADR † | | | 420,000 | | | | 49,837,200 | |
| BeiGene † | | | 1,615,700 | | | | 23,145,549 | |
| China Petroleum & Chemical Class H | | | 30,000,000 | | | | 15,439,171 | |
| China Tower Class H 144A # | | | 30,000,000 | | | | 3,110,878 | |
| DiDi Global ADR † | | | 1,278,300 | | | | 5,074,851 | |
Schedules of investments
Delaware Emerging Markets Fund
| | | Number of
shares | | | Value (US $) | |
| Common StocksD (continued) | | | | | | | | |
| China (continued) | | | | | | | | |
| Full Truck Alliance ADR † | | | 500,000 | | | $ | 3,745,000 | |
| Guangshen Railway Class H † | | | 11,000,000 | | | | 2,041,914 | |
| Hengan International Group | | | 2,000,000 | | | | 7,297,121 | |
| Innovent Biologics 144A #, † | | | 1,880,000 | | | | 11,023,005 | |
| iQIYI ADR † | | | 1,450,000 | | | | 6,510,500 | |
| JD.com ADR | | | 2,080,000 | | | | 57,054,400 | |
| Joinn Laboratories China Class H 144A # | | | 120,187 | | | | 209,869 | |
| Kangji Medical Holdings | | | 3,000 | | | | 2,865 | |
| Kunlun Energy | | | 21,000,000 | | | | 19,410,341 | |
| Kweichow Moutai Class A | | | 700,000 | | | | 175,861,392 | |
| Meituan Class B 144A #, † | | | 500,000 | | | | 5,799,291 | |
| New Oriental Education & Technology Group ADR † | | | 700,000 | | | | 56,966,000 | |
| PetroChina Class H | | | 18,000,000 | | | | 11,821,336 | |
| Ping An Insurance Group Co. of China Class H | | | 3,000,000 | | | | 13,826,124 | |
| Shanghai Junshi Biosciences Class H 144A #, † | | | 600,000 | | | | 1,801,237 | |
| Sohu.com ADR † | | | 2,219,642 | | | | 17,801,529 | |
| Sun Art Retail Group | | | 15,079,500 | | | | 2,567,528 | |
| TAL Education Group ADR † | | | 1,030,000 | | | | 12,905,900 | |
| Tencent Holdings | | | 4,800,000 | | | | 200,939,664 | |
| Tencent Music Entertainment Group ADR † | | | 950,000 | | | | 8,084,500 | |
| Tianjin Development Holdings | | | 15,885,550 | | | | 2,989,484 | |
| Tingyi Cayman Islands Holding | | | 13,000,000 | | | | 16,359,633 | |
| Trip.com Group ADR † | | | 582,400 | | | | 20,488,832 | |
| Tsingtao Brewery Class H | | | 7,000,000 | | | | 46,240,703 | |
| Uni-President China Holdings | | | 31,186,000 | | | | 19,962,106 | |
| Weibo ADR | | | 1,450,000 | | | | 14,659,500 | |
| Wuliangye Yibin Class A | | | 7,000,000 | | | | 146,412,094 | |
| ZhongAn Online P&C Insurance Class H 144A #, † | | | 739,600 | | | | 1,865,262 | |
| | | | | | | | 1,165,669,112 | |
| Hong Kong - 0.23% | | | | | | | | |
| Vinda International Holdings | | | 4,300,000 | | | | 11,009,691 | |
| | | | | | | | 11,009,691 | |
| India - 14.59% | | | | | | | | |
| Aurobindo Pharma | | | 1,500,000 | | | | 18,734,318 | |
| Glenmark Pharmaceuticals | | | 1,167,988 | | | | 10,923,747 | |
| HCL Technologies | | | 2,800,000 | | | | 45,021,599 | |
| Indiabulls Real Estate GDR † | | | 102,021 | | | | 101,417 | |
| Infosys | | | 2,640,000 | | | | 46,065,754 | |
| Jio Financial Services † | | | 10,500,000 | | | | 28,883,460 | |
| Lupin | | | 2,500,000 | | | | 38,399,161 | |
| | | Number of
shares | | | Value (US $) | |
| Common StocksD (continued) | | | | | | | | |
| India (continued) | | | | | | | | |
| Reliance Industries | | | 10,500,000 | | | $ | 299,341,677 | |
| Reliance Industries GDR 144A # | | | 2,340,879 | | | | 134,132,367 | |
| Tata Chemicals | | | 1,866,909 | | | | 21,725,151 | |
| Tata Consultancy Services | | | 200,000 | | | | 8,364,176 | |
| Tata Consumer Products | | | 2,128,276 | | | | 24,008,702 | |
| United Breweries | | | 1,000,000 | | | | 19,747,283 | |
| Zee Entertainment Enterprises † | | | 2,530,000 | | | | 7,678,549 | |
| | | | | | | | 703,127,361 | |
| Indonesia - 1.34% | | | | | | | | |
| Astra Agro Lestari | | | 3,732,300 | | | | 1,828,851 | |
| Astra International | | | 180,000,000 | | | | 62,669,246 | |
| | | | | | | | 64,498,097 | |
| Malaysia - 0.05% | | | | | | | | |
| UEM Sunrise | | | 17,000,000 | | | | 2,590,407 | |
| | | | | | | | 2,590,407 | |
| Mexico - 4.66% | | | | | | | | |
| America Movil ADR | | | 1,369,199 | | | | 24,878,346 | |
| Cemex ADR † | | | 4,300,000 | | | | 29,713,000 | |
| Coca-Cola Femsa ADR | | | 300,000 | | | | 25,395,000 | |
| Fomento Economico Mexicano ADR | | | 688,329 | | | | 87,342,067 | |
| Grupo Financiero Banorte Class O | | | 4,000,000 | | | | 37,221,407 | |
| Grupo Televisa ADR | | | 6,017,000 | | | | 19,374,740 | |
| Sitios Latinoamerica † | | | 1,369,199 | | | | 564,439 | |
| | | | | | | | 224,488,999 | |
| Netherlands - 0.01% | | | | | | | | |
| VEON ADR † | | | 29,290 | | | | 587,850 | |
| | | | | | | | 587,850 | |
| Peru - 0.77% | | | | | | | | |
| Cia de Minas Buenaventura ADR | | | 3,217,400 | | | | 30,693,996 | |
| Credicorp | | | 50,000 | | | | 6,276,500 | |
| | | | | | | | 36,970,496 | |
| Republic of Korea - 24.54% | | | | | | | | |
| Kakao | | | 200,000 | | | | 7,828,547 | |
| Kakaopay † | | | 100,000 | | | | 3,573,228 | |
| KB Financial Group ADR | | | 245,928 | | | | 9,905,980 | |
| LG Uplus | | | 2,403,542 | | | | 19,561,439 | |
| Lotte | | | 300,000 | | | | 6,510,871 | |
| Lotte Chilsung Beverage | | | 44,000 | | | | 5,040,654 | |
Schedules of investments
Delaware Emerging Markets Fund
| | | Number of
shares | | | Value (US $) | |
| Common StocksD (continued) | | | | | | | | |
| Republic of Korea (continued) | | | | | | | | |
| Lotte Wellfood | | | 60,000 | | | $ | 5,743,518 | |
| Samsung Electronics | | | 5,200,000 | | | | 293,423,245 | |
| Samsung Life Insurance | | | 360,939 | | | | 19,583,560 | |
| Shinhan Financial Group | | | 300,000 | | | | 8,580,398 | |
| SK Hynix | | | 3,490,000 | | | | 362,214,471 | |
| SK Square † | | | 7,031,497 | | | | 277,957,096 | |
| SK Telecom | | | 2,175,168 | | | | 88,008,193 | |
| SK Telecom ADR | | | 3,312,676 | | | | 74,535,210 | |
| | | | | | | | 1,182,466,410 | |
| Russia - 0.00% | | | | | | | | |
| EL5-ENERO PJSC =, † | | | 1,058,050 | | | | 0 | |
| Etalon Group GDR 144A #, =, † | | | 1,616,300 | | | | 0 | |
| Gazprom PJSC =, † | | | 29,200,000 | | | | 0 | |
| LUKOIL PJSC = | | | 492,501 | | | | 0 | |
| Rosneft Oil PJSC = | | | 14,555,684 | | | | 0 | |
| Sberbank of Russia PJSC = | | | 15,200,000 | | | | 0 | |
| Surgutneftegas PJSC ADR =, † | | | 2,014,441 | | | | 0 | |
| T Plus PJSC =, † | | | 36,096 | | | | 0 | |
| VK GDR =, † | | | 551,200 | | | | 0 | |
| Yandex Class A =, † | | | 920,000 | | | | 0 | |
| | | | | | | | 0 | |
| South Africa - 0.33% | | | | | | | | |
| Naspers Class N | | | 86,398 | | | | 15,919,781 | |
| | | | | | | | 15,919,781 | |
| Taiwan - 17.53% | | | | | | | | |
| FIT Hon Teng 144A #, † | | | 38,000,000 | | | | 5,740,402 | |
| MediaTek | | | 8,800,000 | | | | 266,197,183 | |
| Taiwan Semiconductor Manufacturing | | | 31,000,000 | | | | 572,567,221 | |
| | | | | | | | 844,504,806 | |
| Turkey - 1.32% | | | | | | | | |
| Akbank | | | 19,500,000 | | | | 22,717,726 | |
| D-MARKET Elektronik Hizmetler ve Ticaret ADR † | | | 144,600 | | | | 202,440 | |
| Turk Telekomunikasyon † | | | 951,192 | | | | 787,300 | |
| Turkcell Iletisim Hizmetleri † | | | 2,427,827 | | | | 4,864,020 | |
| Turkcell Iletisim Hizmetleri ADR † | | | 4,449,485 | | | | 22,158,435 | |
| Turkiye Sise ve Cam Fabrikalari | | | 7,651,443 | | | | 13,053,050 | |
| | | | | | | | 63,782,971 | |
| | | Number of
shares | | | Value (US $) | |
| Common StocksD (continued) | | | | | | | | |
| United Kingdom - 0.07% | | | | | | | | |
| Griffin Mining † | | | 3,056,187 | | | $ | 3,244,816 | |
| | | | | | | | 3,244,816 | |
| United States - 1.10% | | | | | | | | |
| Micron Technology | | | 700,000 | | | | 53,284,000 | |
| | | | | | | | 53,284,000 | |
| Total Common Stocks (cost $4,677,979,282) | | | | | | | 4,733,912,193 | |
| | | | | | | | | |
| Preferred Stocks – 2.08%D | | | | | | | | |
| Brazil - 0.98% | | | | | | | | |
| Braskem Class A †, w | | | 1,470,000 | | | | 5,749,129 | |
| Petroleo Brasileiro ADR w | | | 2,500,000 | | | | 36,375,000 | |
| Usinas Siderurgicas de Minas Gerais Usiminas Class A 3.97% w | | | 3,235,733 | | | | 5,167,128 | |
| | | | | | | | 47,291,257 | |
| Republic of Korea - 1.10% | | | | | | | | |
| Samsung Electronics 2.52% w | | | 1,183,100 | | | | 53,095,756 | |
| | | | | | | | 53,095,756 | |
| Russia - 0.00% | | | | | | | | |
| Transneft PJSC =, w | | | 12,000 | | | | 0 | |
| | | | | | | | 0 | |
| Total Preferred Stocks (cost $66,489,867) | | | | | | | 100,387,013 | |
| | | | | | | | | |
| Rights – 0.03% | | | | | | | | |
| Brazil - 0.03% | | | | | | | | |
| AES Brasil Energia † | | | 518,861 | | | | 1,144,814 | |
| Total Rights (cost $1,572,319) | | | | | | | 1,144,814 | |
| | | | | | | | | |
| Warrants – 0.02% | | | | | | | | |
| Argentina - 0.02% | | | | | | | | |
| IRSA Inversiones y Representaciones, exercise price $0.432, expiration date 3/5/26 † | | | 1,637,840 | | | | 917,190 | |
| Total Warrants (cost $0) | | | | | | | 917,190 | |
Schedules of investments
Delaware Emerging Markets Fund
| | | Number of
shares | | | Value (US $) | |
| Exchange-Traded Fund – 0.21% | | | | | | | | |
| iShares MSCI Turkey ETF | | | 290,275 | | | $ | 10,237,999 | |
| Total Exchange-Traded Fund | | | | | | | | |
| (cost $13,207,352) | | | | | | | 10,237,999 | |
| | | | | | | | | |
| Participation Notes – 0.00% | | | | | | | | |
| Lehman Indian Oil CW 12 LEPO =, † | | | 172,132 | | | | 0 | |
| Lehman Oil & Natural Gas CW 12 LEPO =, † | | | 254,590 | | | | 0 | |
| Total Participation Notes | | | | | | | | |
| (cost $8,559,057) | | | | | | | 0 | |
| Total Value of Securities-100.58% | | | | | | | | |
| (cost $4,767,807,877) | | | | | | $ | 4,846,599,209 | |
| D | Securities have been classified by country of risk. Aggregate classification by business sector has been presented on page 20 in “Security type / country and sector allocations.” |
| # | Security exempt from registration under Rule 144A of the Securities Act of 1933, as amended. At November 30, 2023, the aggregate value of Rule 144A securities was $167,075,878, which represents 3.47% of the Fund's net assets. See Note 9 in “Notes to financial statements.” |
| † | Non-income producing security. |
| = | The value of this security was determined using significant unobservable inputs and is reported as a Level 3 security in the disclosure table located in Note 3 in “Notes to financial statements.” |
| w | Perpetual security with no stated maturity date. |
Summary of abbreviations:
ADR – American Depositary Receipt
ETF – Exchange-Traded Fund
GDR – Global Depositary Receipt
LEPO – Low Exercise Price Option
MSCI – Morgan Stanley Capital International
PJSC – Private Joint Stock Company
See accompanying notes, which are an integral part of the financial statements.
Schedules of investments
| Delaware International Equity Fund | November 30, 2023 |
| | | Number of
shares | | | Value (US $) | |
| Common Stocks – 97.14%D | | | | | | | | |
| Austria - 1.58% | | | | | | | | |
| Mondi | | | 235,437 | | | $ | 4,181,990 | |
| | | | | | | | 4,181,990 | |
| Brazil - 3.26% | | | | | | | | |
| Banco do Brasil ADR | | | 422,470 | | | | 4,619,709 | |
| MercadoLibre † | | | 2,482 | | | | 4,021,982 | |
| | | | | | | | 8,641,691 | |
| Canada - 2.84% | | | | | | | | |
| Dollarama | | | 103,415 | | | | 7,510,629 | |
| | | | | | | | 7,510,629 | |
| China - 4.96% | | | | | | | | |
| Budweiser Brewing 144A # | | | 2,953,500 | | | | 5,225,426 | |
| China Mengniu Dairy † | | | 1,625,000 | | | | 5,096,783 | |
| Tencent Holdings | | | 67,200 | | | | 2,813,155 | |
| | | | | | | | 13,135,364 | |
| Denmark - 3.82% | | | | | | | | |
| Genmab † | | | 15,457 | | | | 4,877,250 | |
| Novo Nordisk Class B | | | 51,448 | | | | 5,224,691 | |
| | | | | | | | 10,101,941 | |
| France - 16.17% | | | | | | | | |
| Airbus | | | 44,826 | | | | 6,645,620 | |
| BNP Paribas | | | 68,032 | | | | 4,278,032 | |
| L'Oreal | | | 22,107 | | | | 10,372,559 | |
| LVMH Moet Hennessy Louis Vuitton | | | 9,846 | | | | 7,531,097 | |
| Thales | | | 36,823 | | | | 5,489,207 | |
| TotalEnergies | | | 81,419 | | | | 5,517,766 | |
| Vinci | | | 24,442 | | | | 2,987,755 | |
| | | | | | | | 42,822,036 | |
| Germany - 8.87% | | | | | | | | |
| Deutsche Telekom | | | 316,216 | | | | 7,563,819 | |
| Heidelberg Materials | | | 35,283 | | | | 2,872,735 | |
| HelloFresh † | | | 196,877 | | | | 3,004,495 | |
| SAP | | | 49,212 | | | | 7,792,965 | |
| Siemens | | | 13,455 | | | | 2,255,448 | |
| | | | | | | | 23,489,462 | |
| Hong Kong - 1.52% | | | | | | | | |
| Prudential | | | 369,873 | | | | 4,029,746 | |
| | | | | | | | 4,029,746 | |
Schedules of investments
Delaware International Equity Fund
| | | Number of
shares | | | Value (US $) | |
| Common StocksD (continued) | | | | | | | | |
| India - 2.85% | | | | | | | | |
| Axis Bank GDR | | | 54,350 | | | $ | 3,483,835 | |
| ICICI Bank ADR | | | 182,927 | | | | 4,055,492 | |
| | | | | | | | 7,539,327 | |
| Italy - 1.85% | | | | | | | | |
| Moncler | | | 88,659 | | | | 4,910,191 | |
| | | | | | | | 4,910,191 | |
| Japan - 13.29% | | | | | | | | |
| Asahi Group Holdings | | | 208,800 | | | | 7,682,477 | |
| Mitsubishi UFJ Financial Group | | | 582,000 | | | | 4,926,548 | |
| Mitsui Chemicals | | | 126,400 | | | | 3,689,864 | |
| Renesas Electronics † | | | 351,800 | | | | 6,177,737 | |
| Seven & i Holdings | | | 201,600 | | | | 7,471,955 | |
| Tokio Marine Holdings | | | 213,100 | | | | 5,243,415 | |
| | | | | | | | 35,191,996 | |
| Netherlands - 7.77% | | | | | | | | |
| Adyen 144A #, † | | | 2,978 | | | | 3,471,703 | |
| ASML Holding | | | 10,313 | | | | 6,993,612 | |
| ING Groep | | | 349,309 | | | | 4,896,510 | |
| Shell | | | 158,567 | | | | 5,198,717 | |
| | | | | | | | 20,560,542 | |
| Singapore - 0.41% | | | | | | | | |
| Sea ADR † | | | 29,660 | | | | 1,074,285 | |
| | | | | | | | 1,074,285 | |
| Spain - 2.21% | | | | | | | | |
| Banco Bilbao Vizcaya Argentaria | | | 632,274 | | | | 5,854,087 | |
| | | | | | | | 5,854,087 | |
| Switzerland - 5.97% | | | | | | | | |
| Alcon | | | 69,364 | | | | 5,245,999 | |
| Nestle | | | 93,144 | | | | 10,567,382 | |
| | | | | | | | 15,813,381 | |
| Taiwan - 2.39% | | | | | | | | |
| Taiwan Semiconductor Manufacturing ADR | | | 65,130 | | | | 6,337,800 | |
| | | | | | | | 6,337,800 | |
| United Kingdom - 6.30% | | | | | | | | |
| AstraZeneca | | | 38,929 | | | | 4,976,515 | |
| HSBC Holdings | | | 339,579 | | | | 2,581,212 | |
| | | Number of
shares | | | Value (US $) | |
| Common StocksD (continued) | | | | | | | | |
| United Kingdom (continued) | | | | | | | | |
| Reckitt Benckiser Group | | | 133,994 | | | $ | 9,131,296 | |
| | | | | | | | 16,689,023 | |
| United States - 11.08% | | | | | | | | |
| Haleon | | | 1,909,157 | | | | 7,954,916 | |
| Newmont | | | 110,417 | | | | 4,393,517 | |
| Schlumberger | | | 80,942 | | | | 4,212,222 | |
| Seagate Technology Holdings | | | 92,193 | | | | 7,292,466 | |
| Stellantis | | | 252,966 | | | | 5,480,085 | |
| | | | | | | | 29,333,206 | |
| Total Common Stocks (cost $252,994,979) | | | | | | | 257,216,697 | |
| | | | | | | | | |
| Preferred Stock – 0.77% | | | | | | | | |
| Germany - 0.77% | | | | | | | | |
| Sartorius 0.51% w | | | 6,336 | | | | 2,037,985 | |
| Total Preferred Stock (cost $1,919,101) | | | | | | | 2,037,985 | |
| | | | | | | | | |
| Short-Term Investments – 1.05% | | | | | | | | |
| Money Market Mutual Funds – 1.05% | | | | | | | | |
| BlackRock Liquidity FedFund – Institutional Shares (seven-day effective yield 5.25%) | | | 698,349 | | | | 698,349 | |
Fidelity Investments Money Market Government Portfolio – Class I
(seven-day effective yield 5.24%) | | | 698,350 | | | | 698,350 | |
Goldman Sachs Financial Square Government Fund – Institutional Shares
(seven-day effective yield 5.39%) | | | 698,350 | | | | 698,350 | |
| Morgan Stanley Institutional Liquidity Funds Government Portfolio – Institutional Class (seven-day effective yield 5.26%) | | | 698,349 | | | | 698,349 | |
| Total Short-Term Investments (cost $2,793,398) | | | | | | | 2,793,398 | |
| Total Value of Securities-98.96% | | | | | | | | |
| (cost $257,707,478) | | | | | | $ | 262,048,080 | |
| D | Securities have been classified by country of risk. Aggregate classification by business sector has been presented on page 22 in “Security type / country and sector allocations.” |
| † | Non-income producing security. |
Schedules of investments
Delaware International Equity Fund
| # | Security exempt from registration under Rule 144A of the Securities Act of 1933, as amended. At November 30, 2023, the aggregate value of Rule 144A securities was $8,697,129, which represents 3.28% of the Fund's net assets. See Note 9 in “Notes to financial statements.” |
| w | Perpetual security with no stated maturity date. |
Summary of abbreviations:
ADR – American Depositary Receipt
GDR – Global Depositary Receipt
See accompanying notes, which are an integral part of the financial statements.
Statements of assets and liabilities
| Delaware International Funds | November 30, 2023 |
| | | Delaware
Emerging
Markets Fund | | | Delaware
International
Equity Fund | |
| Assets: | | | | | | | | |
| Investments, at value* | | $ | 4,846,599,209 | | | $ | 262,048,080 | |
| Foreign currencies, at valueD | | | 3,448,860 | | | | 85,581 | |
| Cash | | | — | | | | 2,530 | |
| Receivable for securities sold | | | 13,503,791 | | | | 3,917,718 | |
| Receivable for fund shares sold | | | 8,079,843 | | | | 213,611 | |
| Dividends receivable | | | 5,273,323 | | | | 475,398 | |
| Prepaid expenses | | | 102,376 | | | | 49,995 | |
| Foreign tax reclaims receivable | | | 3,757 | | | | 3,160,036 | |
| Other assets | | | 44,061 | | | | 3,738 | |
| Total Assets | | | 4,877,055,220 | | | | 269,956,687 | |
| Liabilities: | | | | | | | | |
| Due to custodian | | | 8,779,609 | | | | — | |
| Accrued capital gains taxes on appreciated securities | | | 26,461,027 | | | | — | |
| Payable for fund shares redeemed | | | 13,103,161 | | | | 455,212 | |
| Investment management fees payable to affiliates | | | 7,697,784 | | | | 337,066 | |
| Other accrued expenses | | | 2,244,863 | | | | 228,975 | |
| Administration expenses payable to affiliates | | | 104,571 | | | | 45,969 | |
| Distribution fees payable to affiliates | | | 91,524 | | | | 31,822 | |
| Payable for securities purchased | | | — | | | | 3,550,258 | |
| Other liabilities | | | — | | | | 517,299 | |
| Total Liabilities | | | 58,482,539 | | | | 5,166,601 | |
| Total Net Assets | | $ | 4,818,572,681 | | | $ | 264,790,086 | |
| | | | | | | | | |
| Net Assets Consist of: | | | | | | | | |
| Paid-in capital | | $ | 4,868,538,239 | | | $ | 292,616,332 | |
| Total distributable earnings (loss) | | | (49,965,558 | ) | | | (27,826,246 | ) |
| Total Net Assets | | $ | 4,818,572,681 | | | $ | 264,790,086 | |
Statements of assets and liabilities
Delaware International Funds
| | | Delaware
Emerging
Markets Fund | | | Delaware
International
Equity Fund | |
| Net Asset Value | | | | | | | | |
| | | | | | | | | |
| Class A: | | | | | | | | |
| Net assets | | $ | 242,761,410 | | | $ | 143,998,193 | |
| Shares of beneficial interest outstanding, unlimited authorization, no par | | | 12,731,465 | | | | 10,714,538 | |
| Net asset value per share | | $ | 19.07 | | | $ | 13.44 | |
| Sales charge | | | 5.75 | % | | | 5.75 | % |
| Offering price per share, equal to net asset value per share / (1 - sales charge) | | $ | 20.23 | | | $ | 14.26 | |
| | | | | | | | | |
| Class C: | | | | | | | | |
| Net assets | | $ | 42,531,067 | | | $ | 2,837,555 | |
| Shares of beneficial interest outstanding, unlimited authorization, no par | | | 2,438,517 | | | | 213,911 | |
| Net asset value per share | | $ | 17.44 | | | $ | 13.27 | |
| | | | | | | | | |
| Class R: | | | | | | | | |
| Net assets | | $ | 19,766,887 | | | $ | 934,489 | |
| Shares of beneficial interest outstanding, unlimited authorization, no par | | | 1,030,873 | | | | 69,691 | |
| Net asset value per share | | $ | 19.17 | | | $ | 13.41 | |
| | | | | | | | | |
| Institutional Class: | | | | | | | | |
| Net assets | | $ | 2,525,330,396 | | | $ | 114,498,563 | |
| Shares of beneficial interest outstanding, unlimited authorization, no par | | | 131,331,328 | | | | 8,471,086 | |
| Net asset value per share | | $ | 19.23 | | | $ | 13.52 | |
| | | | | | | | | |
| Class R6: | | | | | | | | |
| Net assets | | $ | 1,988,182,921 | | | $ | 2,521,286 | |
| Shares of beneficial interest outstanding, unlimited authorization, no par | | | 103,272,647 | | | | 186,374 | |
| Net asset value per share | | $ | 19.25 | | | $ | 13.53 | |
| | | | | | | | | |
| *Investments, at cost | | $ | 4,767,807,877 | | | $ | 257,707,478 | |
| DForeign currencies, at cost | | | 3,368,415 | | | | 85,345 | |
See accompanying notes, which are an integral part of the financial statements.
Statements of operations
| Delaware International Funds | Year ended November 30, 2023 |
| | | Delaware
Emerging
Markets Fund | | | Delaware
International
Equity Fund | |
| Investment Income: | | | | | | | | |
| Dividends | | $ | 196,160,098 | | | $ | 8,076,380 | |
| Securities lending income | | | — | | | | 9,098 | |
| Reclaim income | | | — | | | | 1,273,404 | |
| Foreign tax withheld | | | (21,404,525 | ) | | | (971,150 | ) |
| | | | 174,755,573 | | | | 8,387,732 | |
| | | | | | | | | |
| Expenses: | | | | | | | | |
| Management fees | | | 54,273,252 | | | | 2,659,565 | |
| Distribution expenses — Class A | | | 599,420 | | | | 385,681 | |
| Distribution expenses — Class C | | | 496,304 | | | | 31,469 | |
| Distribution expenses — Class R | | | 104,288 | | | | 5,968 | |
| Dividend disbursing and transfer agent fees and expenses | | | 4,071,342 | | | | 321,144 | |
| Custodian fees | | | 1,165,603 | | | | 112,150 | |
| Accounting and administration expenses | | | 720,465 | | | | 86,794 | |
| Reports and statements to shareholders expenses | | | 391,883 | | | | 49,895 | |
| Trustees’ fees and expenses | | | 232,684 | | | | 21,663 | |
| Legal fees | | | 172,992 | | | | 15,326 | |
| Registration fees | | | 143,913 | | | | 45,649 | |
| Audit and tax fees | | | 65,052 | | | | 35,138 | |
| Other | | | 259,531 | | | | 31,751 | |
| | | | 62,696,729 | | | | 3,802,193 | |
| Less expenses waived | | | (5,578,176 | ) | | | (641,442 | ) |
| Less expenses paid indirectly | | | (493 | ) | | | (399 | ) |
| Total operating expenses | | | 57,118,060 | | | | 3,160,352 | |
| Net Investment Income (Loss) | | | 117,637,513 | | | | 5,227,380 | |
Statements of operations
Delaware International Funds
| | | Delaware
Emerging
Markets Fund | | | Delaware
International
Equity Fund | |
| Net Realized and Unrealized Gain (Loss): | | | | | | | | |
| Net realized gain (loss) on: | | | | | | | | |
| Investments1 | | $ | (108,433,175 | ) | | $ | (19,789,032 | ) |
| Foreign currencies | | | (966,214 | ) | | | (313,323 | ) |
| Net realized gain (loss) | | | (109,399,389 | ) | | | (20,102,355 | ) |
| | | | | | | | | |
| Net change in unrealized appreciation (depreciation) on: | | | | | | | | |
| Investments1 | | | 405,662,738 | | | | 48,485,718 | |
| Foreign currencies | | | 166,411 | | | | 240,941 | |
| Net change in unrealized appreciation (depreciation) | | | 405,829,149 | | | | 48,726,659 | |
| Net Realized and Unrealized Gain (Loss) | | | 296,429,760 | | | | 28,624,304 | |
| Net Increase (Decrease) in Net Assets Resulting from Operations | | $ | 414,067,273 | | | $ | 33,851,684 | |
| 1 | Includes $5,553 capital gains tax paid and $26,461,027 capital gains tax accrued for Delaware Emerging Markets Fund. |
See accompanying notes, which are an integral part of the financial statements.
Statements of changes in net assets
Delaware Emerging Markets Fund
| | | Year ended | |
| | | 11/30/23 | | | 11/30/22 | |
| Increase (Decrease) in Net Assets from Operations: | | | | | | | | |
| Net investment income (loss) | | $ | 117,637,513 | | | $ | 150,430,428 | |
| Net realized gain (loss) | | | (109,399,389 | ) | | | 107,829,823 | |
| Net change in unrealized appreciation (depreciation) | | | 405,829,149 | | | | (1,799,376,736 | ) |
| Net increase (decrease) in net assets resulting from operations | | | 414,067,273 | | | | (1,541,116,485 | ) |
| | | | | | | | | |
| Dividends and Distributions to Shareholders from: | | | | | | | | |
| Distributable earnings: | | | | | | | | |
| Class A | | | (3,701,092 | ) | | | (11,495,718 | ) |
| Class C | | | (371,522 | ) | | | (2,720,160 | ) |
| Class R | | | (258,570 | ) | | | (970,357 | ) |
| Institutional Class | | | (46,309,293 | ) | | | (126,884,607 | ) |
| Class R6 | | | (35,249,700 | ) | | | (77,102,849 | ) |
| | | | (85,890,177 | ) | | | (219,173,691 | ) |
| | | | | | | | | |
| Capital Share Transactions (See Note 6): | | | | | | | | |
| Proceeds from shares sold: | | | | | | | | |
| Class A | | | 41,297,648 | | | | 46,849,373 | |
| Class C | | | 4,214,114 | | | | 4,865,541 | |
| Class R | | | 4,040,279 | | | | 5,036,699 | |
| Institutional Class | | | 719,644,871 | | | | 1,368,023,503 | |
| Class R6 | | | 339,368,571 | | | | 792,353,512 | |
| | | | | | | | | |
| Net asset value of shares issued upon reinvestment of dividends and distributions: | | | | | | | | |
| Class A | | | 3,499,593 | | | | 10,843,302 | |
| Class C | | | 365,579 | | | | 2,673,584 | |
| Class R | | | 258,570 | | | | 968,937 | |
| Institutional Class | | | 40,244,270 | | | | 109,901,498 | |
| Class R6 | | | 28,763,821 | | | | 58,294,682 | |
| | | | 1,181,697,316 | | | | 2,399,810,631 | |
Statements of changes in net assets
Delaware Emerging Markets Fund
| | | Year ended | |
| | | 11/30/23 | | | 11/30/22 | |
| Capital Share Transactions (continued): | | | | | | | | |
| Cost of shares redeemed: | | | | | | | | |
| Class A | | $ | (63,847,608 | ) | | $ | (79,423,854 | ) |
| Class C | | | (22,113,722 | ) | | | (29,368,263 | ) |
| Class R | | | (7,476,551 | ) | | | (9,850,103 | ) |
| Institutional Class | | | (966,333,294 | ) | | | (1,631,203,316 | ) |
| Class R6 | | | (380,693,331 | ) | | | (561,020,053 | ) |
| | | | (1,440,464,506 | ) | | | (2,310,865,589 | ) |
| Increase (decrease) in net assets derived from capital share transactions | | | (258,767,190 | ) | | | 88,945,042 | |
| Net Increase (Decrease) in Net Assets | | | 69,409,906 | | | | (1,671,345,134 | ) |
| | | | | | | | | |
| Net Assets: | | | | | | | | |
| Beginning of year | | | 4,749,162,775 | | | | 6,420,507,909 | |
| End of year | | $ | 4,818,572,681 | | | $ | 4,749,162,775 | |
See accompanying notes, which are an integral part of the financial statements.
Statements of changes in net assets
Delaware International Equity Fund
| | | Year ended | |
| | | 11/30/23 | | | 11/30/22 | |
| Increase (Decrease) in Net Assets from Operations: | | | | | | | | |
| Net investment income (loss) | | $ | 5,227,380 | | | $ | 5,891,021 | |
| Net realized gain (loss) | | | (20,102,355 | ) | | | (12,023,063 | ) |
| Net change in unrealized appreciation (depreciation) | | | 48,726,659 | | | | (58,399,041 | ) |
| Net increase (decrease) in net assets resulting from operations | | | 33,851,684 | | | | (64,531,083 | ) |
| | | | | | | | | |
| Dividends and Distributions to Shareholders from: | | | | | | | | |
| Distributable earnings: | | | | | | | | |
| Class A | | | (2,497,245 | ) | | | (14,729,181 | ) |
| Class C | | | (30,847 | ) | | | (306,886 | ) |
| Class R | | | (17,821 | ) | | | (356,285 | ) |
| Institutional Class | | | (3,286,165 | ) | | | (23,946,215 | ) |
| Class R6 | | | (60,347 | ) | | | (285,342 | ) |
| | | | (5,892,425 | ) | | | (39,623,909 | ) |
| | | | | | | | | |
| Capital Share Transactions (See Note 6): | | | | | | | | |
| Proceeds from shares sold: | | | | | | | | |
| Class A | | | 9,989,295 | | | | 9,932,088 | |
| Class C | | | 783,197 | | | | 771,488 | |
| Class R | | | 86,550 | | | | 676,446 | |
| Institutional Class | | | 29,271,747 | | | | 69,276,100 | |
| Class R6 | | | 3,404,362 | | | | 2,079,275 | |
| | | | | | | | | |
| Net asset value of shares issued upon reinvestment of dividends and distributions: | | | | | | | | |
| Class A | | | 2,481,754 | | | | 14,648,038 | |
| Class C | | | 30,837 | | | | 306,886 | |
| Class R | | | 17,821 | | | | 356,284 | |
| Institutional Class | | | 3,280,539 | | | | 23,920,676 | |
| Class R6 | | | 31,974 | | | | 179,980 | |
| | | | 49,378,076 | | | | 122,147,261 | |
Statements of changes in net assets
Delaware International Equity Fund
| | | Year ended | |
| | | 11/30/23 | | | 11/30/22 | |
| Capital Share Transactions (continued): | | | | | | | | |
| Cost of shares redeemed: | | | | | | | | |
| Class A | | $ | (30,713,686 | ) | | $ | (35,385,407 | ) |
| Class C | | | (1,561,673 | ) | | | (1,359,836 | ) |
| Class R | | | (756,111 | ) | | | (3,925,580 | ) |
| Institutional Class | | | (115,001,229 | ) | | | (168,887,802 | ) |
| Class R6 | | | (4,419,123 | ) | | | (1,883,966 | ) |
| | | | (152,451,822 | ) | | | (211,442,591 | ) |
| Decrease in net assets derived from capital share transactions | | | (103,073,746 | ) | | | (89,295,330 | ) |
| Net Decrease in Net Assets | | | (75,114,487 | ) | | | (193,450,322 | ) |
| | | | | | | | | |
| Net Assets: | | | | | | | | |
| Beginning of year | | | 339,904,573 | | | | 533,354,895 | |
| End of year | | $ | 264,790,086 | | | $ | 339,904,573 | |
See accompanying notes, which are an integral part of the financial statements.
Financial highlights
Delaware Emerging Markets Fund Class A
Selected data for each share of the Fund outstanding throughout each period were as follows:
| Net asset value, beginning of period |
| |
| Income (loss) from investment operations: |
| Net investment income1 |
| Net realized and unrealized gain (loss) |
| Total from investment operations |
| |
| Less dividends and distributions from: |
| Net investment income |
| Net realized gain |
| Total dividends and distributions |
| |
| Net asset value, end of period |
| |
| Total return2 |
| |
| Ratios and supplemental data: |
| Net assets, end of period (000 omitted) |
| Ratio of expenses to average net assets4 |
| Ratio of expenses to average net assets prior to fees waived4 |
| Ratio of net investment income to average net assets |
| Ratio of net investment income to average net assets prior to fees waived |
| Portfolio turnover |
| 1 | Calculated using average shares outstanding. |
| 2 | Total return is based on the change in net asset value of a share during the period and assumes reinvestment of dividends and distributions at net asset value and does not reflect the impact of a sales charge. |
| 3 | Total return during the period reflects waivers by the manager and/or distributor (as applicable). Performance would have been lower had the waivers not been in effect. |
| 4 | Expense ratios do not include expenses of any investment companies in which the Fund invests. |
See accompanying notes, which are an integral part of the financial statements.
| Year ended | |
| 11/30/23 | | | 11/30/22 | | | 11/30/21 | | | 11/30/20 | | | 11/30/19 | |
| $ | 17.78 | | | $ | 24.14 | | | $ | 23.67 | | | $ | 19.13 | | | $ | 17.53 | |
| | | | | | | | | | | | | | | | | | | |
| | | | | | | | | | | | | | | | | | | |
| | 0.40 | | | | 0.50 | | | | 0.54 | | | | 0.04 | | | | 0.11 | |
| | 1.16 | | | | (6.09 | ) | | | 0.07 | | | | 4.62 | | | | 1.55 | |
| | 1.56 | | | | (5.59 | ) | | | 0.61 | | | | 4.66 | | | | 1.66 | |
| | | | | | | | | | | | | | | | | | | |
| | | | | | | | | | | | | | | | | | | |
| | (0.27 | ) | | | (0.77 | ) | | | — | | | | (0.12 | ) | | | (0.06 | ) |
| | — | | | | — | | | | (0.14 | ) | | | — | | | | — | |
| | (0.27 | ) | | | (0.77 | ) | | | (0.14 | ) | | | (0.12 | ) | | | (0.06 | ) |
| | | | | | | | | | | | | | | | | | | |
| $ | 19.07 | | | $ | 17.78 | | | $ | 24.14 | | | $ | 23.67 | | | $ | 19.13 | |
| | | | | | | | | | | | | | | | | | | |
| | 8.97 | %3 | | | (23.97 | )%3 | | | 2.57 | %3 | | | 24.44 | %3 | | | 9.50 | % |
| | | | | | | | | | | | | | | | | | | |
| | | | | | | | | | | | | | | | | | | |
| $ | 242,762 | | | $ | 245,037 | | | $ | 361,528 | | | $ | 364,314 | | | $ | 346,732 | |
| | 1.46 | % | | | 1.51 | % | | | 1.57 | % | | | 1.62 | % | | | 1.63 | % |
| | 1.59 | % | | | 1.66 | % | | | 1.59 | % | | | 1.63 | % | | | 1.63 | % |
| | 2.22 | % | | | 2.54 | % | | | 2.08 | % | | | 0.21 | % | | | 0.62 | % |
| | 2.09 | % | | | 2.39 | % | | | 2.06 | % | | | 0.20 | % | | | 0.62 | % |
| | 2 | % | | | 11 | % | | | 4 | % | | | 5 | % | | | 10 | % |
Financial highlights
Delaware Emerging Markets Fund Class C
Selected data for each share of the Fund outstanding throughout each period were as follows:
| Net asset value, beginning of period |
| |
| Income (loss) from investment operations: |
| Net investment income (loss)1 |
| Net realized and unrealized gain (loss) |
| Total from investment operations |
| |
| Less dividends and distributions from: |
| Net investment income |
| Net realized gain |
| Total dividends and distributions |
| |
| Net asset value, end of period |
| |
| Total return2 |
| |
| Ratios and supplemental data: |
| Net assets, end of period (000 omitted) |
| Ratio of expenses to average net assets4 |
| Ratio of expenses to average net assets prior to fees waived4 |
| Ratio of net investment income (loss) to average net assets |
| Ratio of net investment income (loss) to average net assets prior to fees waived |
| Portfolio turnover |
| 1 | Calculated using average shares outstanding. |
| 2 | Total return is based on the change in net asset value of a share during the period and assumes reinvestment of dividends and distributions at net asset value and does not reflect the impact of a sales charge. |
| 3 | Total return during the period reflects waivers by the manager and/or distributor (as applicable). Performance would have been lower had the waivers not been in effect. |
| 4 | Expense ratios do not include expenses of any investment companies in which the Fund invests. |
See accompanying notes, which are an integral part of the financial statements.
| Year ended | |
| 11/30/23 | | | 11/30/22 | | | 11/30/21 | | | 11/30/20 | | | 11/30/19 | |
| $ | 16.24 | | | $ | 22.09 | | | $ | 21.83 | | | $ | 17.67 | | | $ | 16.26 | |
| | | | | | | | | | | | | | | | | | | |
| | | | | | | | | | | | | | | | | | | |
| | 0.24 | | | | 0.33 | | | | 0.32 | | | | (0.10 | ) | | | (0.02 | ) |
| | 1.07 | | | | (5.60 | ) | | | 0.08 | | | | 4.26 | | | | 1.43 | |
| | 1.31 | | | | (5.27 | ) | | | 0.40 | | | | 4.16 | | | | 1.41 | |
| | | | | | | | | | | | | | | | | | | |
| | | | | | | | | | | | | | | | | | | |
| | (0.11 | ) | | | (0.58 | ) | | | — | | | | — | | | | — | |
| | — | | | | — | | | | (0.14 | ) | | | — | | | | — | |
| | (0.11 | ) | | | (0.58 | ) | | | (0.14 | ) | | | — | | | | — | |
| | | | | | | | | | | | | | | | | | | |
| $ | 17.44 | | | $ | 16.24 | | | $ | 22.09 | | | $ | 21.83 | | | $ | 17.67 | |
| | | | | | | | | | | | | | | | | | | |
| | 8.13 | %3 | | | (24.56 | )%3 | | | 1.82 | %3 | | | 23.54 | %3 | | | 8.67 | % |
| | | | | | | | | | | | | | | | | | | |
| | | | | | | | | | | | | | | | | | | |
| $ | 42,531 | | | $ | 56,938 | | | $ | 105,474 | | | $ | 118,977 | | | $ | 135,346 | |
| | 2.21 | % | | | 2.26 | % | | | 2.32 | % | | | 2.37 | % | | | 2.38 | % |
| | 2.34 | % | | | 2.41 | % | | | 2.34 | % | | | 2.38 | % | | | 2.38 | % |
| | 1.47 | % | | | 1.79 | % | | | 1.33 | % | | | (0.54 | )% | | | (0.13 | )% |
| | 1.34 | % | | | 1.64 | % | | | 1.31 | % | | | (0.55 | )% | | | (0.13 | )% |
| | 2 | % | | | 11 | % | | | 4 | % | | | 5 | % | | | 10 | % |
Financial highlights
Delaware Emerging Markets Fund Class R
Selected data for each share of the Fund outstanding throughout each period were as follows:
| Net asset value, beginning of period |
| |
| Income (loss) from investment operations: |
| Net investment income (loss)1 |
| Net realized and unrealized gain (loss) |
| Total from investment operations |
| |
| Less dividends and distributions from: |
| Net investment income |
| Net realized gain |
| Total dividends and distributions |
| |
| Net asset value, end of period |
| |
| Total return3 |
| |
| Ratios and supplemental data: |
| Net assets, end of period (000 omitted) |
| Ratio of expenses to average net assets5 |
| Ratio of expenses to average net assets prior to fees waived5 |
| Ratio of net investment income (loss) to average net assets |
| Ratio of net investment income (loss) to average net assets prior to fees waived |
| Portfolio turnover |
| 1 | Calculated using average shares outstanding. |
| 2 | Amount is less than $0.005 per share. |
| 3 | Total return is based on the change in net asset value of a share during the period and assumes reinvestment of dividends and distributions at net asset value. |
| 4 | Total return during the period reflects waivers by the manager and/or distributor (as applicable). Performance would have been lower had the waivers not been in effect. |
| 5 | Expense ratios do not include expenses of any investment companies in which the Fund invests. |
See accompanying notes, which are an integral part of the financial statements.
| Year ended | |
| 11/30/23 | | | 11/30/22 | | | 11/30/21 | | | 11/30/20 | | | 11/30/19 | |
| $ | 17.87 | | | $ | 24.24 | | | $ | 23.82 | | | $ | 19.25 | | | $ | 17.62 | |
| | | | | | | | | | | | | | | | | | | |
| | | | | | | | | | | | | | | | | | | |
| | 0.36 | | | | 0.46 | | | | 0.48 | | | | (0.01 | ) | | | 0.07 | |
| | 1.16 | | | | (6.14 | ) | | | 0.08 | | | | 4.64 | | | | 1.56 | |
| | 1.52 | | | | (5.68 | ) | | | 0.56 | | | | 4.63 | | | | 1.63 | |
| | | | | | | | | | | | | | | | | | | |
| | | | | | | | | | | | | | | | | | | |
| | (0.22 | ) | | | (0.69 | ) | | | — | | | | (0.06 | ) | | | — | 2 |
| | — | | | | — | | | | (0.14 | ) | | | — | | | | — | |
| | (0.22 | ) | | | (0.69 | ) | | | (0.14 | ) | | | (0.06 | ) | | | — | |
| | | | | | | | | | | | | | | | | | | |
| $ | 19.17 | | | $ | 17.87 | | | $ | 24.24 | | | $ | 23.82 | | | $ | 19.25 | |
| | | | | | | | | | | | | | | | | | | |
| | 8.64 | %4 | | | (24.15 | )%4 | | | 2.34 | %4 | | | 24.11 | %4 | | | 9.28 | % |
| | | | | | | | | | | | | | | | | | | |
| | | | | | | | | | | | | | | | | | | |
| $ | 19,767 | | | $ | 21,502 | | | $ | 34,148 | | | $ | 38,689 | | | $ | 43,962 | |
| | 1.71 | % | | | 1.76 | % | | | 1.82 | % | | | 1.87 | % | | | 1.88 | % |
| | 1.84 | % | | | 1.91 | % | | | 1.84 | % | | | 1.88 | % | | | 1.88 | % |
| | 1.97 | % | | | 2.29 | % | | | 1.83 | % | | | (0.04 | )% | | | 0.37 | % |
| | 1.84 | % | | | 2.14 | % | | | 1.81 | % | | | (0.05 | )% | | | 0.37 | % |
| | 2 | % | | | 11 | % | | | 4 | % | | | 5 | % | | | 10 | % |
Financial highlights
Delaware Emerging Markets Fund Institutional Class R
Selected data for each share of the Fund outstanding throughout each period were as follows:
| Net asset value, beginning of period |
| |
| Income (loss) from investment operations: |
| Net investment income1 |
| Net realized and unrealized gain (loss) |
| Total from investment operations |
| |
| Less dividends and distributions from: |
| Net investment income |
| Net realized gain |
| Total dividends and distributions |
| |
| Net asset value, end of period |
| |
| Total return2 |
| |
| Ratios and supplemental data: |
| Net assets, end of period (000 omitted) |
| Ratio of expenses to average net assets4 |
| Ratio of expenses to average net assets prior to fees waived4 |
| Ratio of net investment income to average net assets |
| Ratio of net investment income to average net assets prior to fees waived |
| Portfolio turnover |
| 1 | Calculated using average shares outstanding. |
| 2 | Total return is based on the change in net asset value of a share during the period and assumes reinvestment of dividends and distributions at net asset value. |
| 3 | Total return during the period reflects waivers by the manager. Performance would have been lower had the waivers not been in effect. |
| 4 | Expense ratios do not include expenses of any investment companies in which the Fund invests. |
See accompanying notes, which are an integral part of the financial statements.
| Year ended | |
| 11/30/23 | | | 11/30/22 | | | 11/30/21 | | | 11/30/20 | | | 11/30/19 | |
| $ | 17.94 | | | $ | 24.35 | | | $ | 23.85 | | | $ | 19.27 | | | $ | 17.67 | |
| | | | | | | | | | | | | | | | | | | |
| | | | | | | | | | | | | | | | | | | |
| | 0.45 | | | | 0.55 | | | | 0.61 | | | | 0.09 | | | | 0.16 | |
| | 1.16 | | | | (6.13 | ) | | | 0.07 | | | | 4.66 | | | | 1.55 | |
| | 1.61 | | | | (5.58 | ) | | | 0.68 | | | | 4.75 | | | | 1.71 | |
| | | | | | | | | | | | | | | | | | | |
| | | | | | | | | | | | | | | | | | | |
| | (0.32 | ) | | | (0.83 | ) | | | (0.04 | ) | | | (0.17 | ) | | | (0.11 | ) |
| | — | | | | — | | | | (0.14 | ) | | | — | | | | — | |
| | (0.32 | ) | | | (0.83 | ) | | | (0.18 | ) | | | (0.17 | ) | | | (0.11 | ) |
| | | | | | | | | | | | | | | | | | | |
| $ | 19.23 | | | $ | 17.94 | | | $ | 24.35 | | | $ | 23.85 | | | $ | 19.27 | |
| | | | | | | | | | | | | | | | | | | |
| | 9.22 | %3 | | | (23.76 | )%3 | | | 2.84 | %3 | | | 24.76 | %3 | | | 9.79 | % |
| | | | | | | | | | | | | | | | | | | |
| | | | | | | | | | | | | | | | | | | |
| $ | 2,525,330 | | | $ | 2,558,425 | | | $ | 3,728,519 | | | $ | 4,078,412 | | | $ | 3,826,272 | |
| | 1.21 | % | | | 1.26 | % | | | 1.32 | % | | | 1.37 | % | | | 1.38 | % |
| | 1.34 | % | | | 1.41 | % | | | 1.34 | % | | | 1.38 | % | | | 1.38 | % |
| | 2.47 | % | | | 2.79 | % | | | 2.33 | % | | | 0.46 | % | | | 0.87 | % |
| | 2.34 | % | | | 2.64 | % | | | 2.31 | % | | | 0.45 | % | | | 0.87 | % |
| | 2 | % | | | 11 | % | | | 4 | % | | | 5 | % | | | 10 | % |
Financial highlights
Delaware Emerging Markets Fund Class R6
Selected data for each share of the Fund outstanding throughout each period were as follows:
| Net asset value, beginning of period |
| |
| Income (loss) from investment operations: |
| Net investment income1 |
| Net realized and unrealized gain (loss) |
| Total from investment operations |
| |
| Less dividends and distributions from: |
| Net investment income |
| Net realized gain |
| Total dividends and distributions |
| |
| Net asset value, end of period |
| |
| Total return2 |
| |
| Ratios and supplemental data: |
| Net assets, end of period (000 omitted) |
| Ratio of expenses to average net assets4 |
| Ratio of expenses to average net assets prior to fees waived4 |
| Ratio of net investment income to average net assets |
| Ratio of net investment income to average net assets prior to fees waived |
| Portfolio turnover |
| 1 | Calculated using average shares outstanding. |
| 2 | Total return is based on the change in net asset value of a share during the period and assumes reinvestment of dividends and distributions at net asset value. |
| 3 | Total return during the period reflects waivers by the manager. Performance would have been lower had the waivers not been in effect. |
| 4 | Expense ratios do not include expenses of any investment companies in which the Fund invests. |
See accompanying notes, which are an integral part of the financial statements.
| Year ended | |
| 11/30/23 | | | 11/30/22 | | | 11/30/21 | | | 11/30/20 | | | 11/30/19 | |
| $ | 17.97 | | | $ | 24.38 | | | $ | 23.88 | | | $ | 19.28 | | | $ | 17.69 | |
| | | | | | | | | | | | | | | | | | | |
| | | | | | | | | | | | | | | | | | | |
| | 0.47 | | | | 0.57 | | | | 0.64 | | | | 0.12 | | | | 0.18 | |
| | 1.15 | | | | (6.13 | ) | | | 0.07 | | | | 4.66 | | | | 1.54 | |
| | 1.62 | | | | (5.56 | ) | | | 0.71 | | | | 4.78 | | | | 1.72 | |
| | | | | | | | | | | | | | | | | | | |
| | | | | | | | | | | | | | | | | | | |
| | (0.34 | ) | | | (0.85 | ) | | | (0.07 | ) | | | (0.18 | ) | | | (0.13 | ) |
| | — | | | | — | | | | (0.14 | ) | | | — | | | | — | |
| | (0.34 | ) | | | (0.85 | ) | | | (0.21 | ) | | | (0.18 | ) | | | (0.13 | ) |
| | | | | | | | | | | | | | | | | | | |
| $ | 19.25 | | | $ | 17.97 | | | $ | 24.38 | | | $ | 23.88 | | | $ | 19.28 | |
| | | | | | | | | | | | | | | | | | | |
| | 9.28 | %3 | | | (23.67 | )%3 | | | 2.94 | %3 | | | 24.93 | %3 | | | 9.84 | % |
| | | | | | | | | | | | | | | | | | | |
| | | | | | | | | | | | | | | | | | | |
| $ | 1,988,183 | | | $ | 1,867,261 | | | $ | 2,190,839 | | | $ | 1,130,453 | | | $ | 1,000,200 | |
| | 1.13 | % | | | 1.16 | % | | | 1.21 | % | | | 1.25 | % | | | 1.26 | % |
| | 1.22 | % | | | 1.30 | % | | | 1.23 | % | | | 1.26 | % | | | 1.26 | % |
| | 2.55 | % | | | 2.89 | % | | | 2.44 | % | | | 0.58 | % | | | 0.99 | % |
| | 2.44 | % | | | 2.75 | % | | | 2.42 | % | | | 0.57 | % | | | 0.99 | % |
| | 2 | % | | | 11 | % | | | 4 | % | | | 5 | % | | | 10 | % |
Financial highlights
Delaware International Equity Fund Class A
Selected data for each share of the Fund outstanding throughout each period were as follows:
| Net asset value, beginning of period |
| |
| Income (loss) from investment operations: |
| Net investment income1 |
| Net realized and unrealized gain (loss) |
| Total from investment operations |
| |
| Less dividends and distributions from: |
| Net investment income |
| Net realized gain |
| Total dividends and distributions |
| |
| Net asset value, end of period |
| |
| Total return2 |
| |
| Ratios and supplemental data: |
| Net assets, end of period (000 omitted) |
| Ratio of expenses to average net assets3 |
| Ratio of expenses to average net assets prior to fees waived3 |
| Ratio of net investment income to average net assets |
| Ratio of net investment income to average net assets prior to fees waived |
| Portfolio turnover |
| 1 | Calculated using average shares outstanding. |
| 2 | Total return is based on the change in net asset value of a share during the period and assumes reinvestment of dividends and distributions at net asset value and does not reflect the impact of a sales charge. Total return during the period reflects waivers by the manager and/or distributor (as applicable). Performance would have been lower had the waivers not been in effect. |
| 3 | Expense ratios do not include expenses of any investment companies in which the Fund invests. |
| 4 | The Fund's portfolio turnover rate increased substantially during the years ended November 30, 2023 and 2019 due to a change in the Fund's portfolio managers and associated repositioning. |
See accompanying notes, which are an integral part of the financial statements.
| Year ended | |
| 11/30/23 | | | 11/30/22 | | | 11/30/21 | | | 11/30/20 | | | 11/30/19 | |
| $ | 12.42 | | | $ | 15.47 | | | $ | 14.82 | | | $ | 14.66 | | | $ | 13.53 | |
| | | | | | | | | | | | | | | | | | | |
| | | | | | | | | | | | | | | | | | | |
| | 0.21 | | | | 0.17 | | | | 0.13 | | | | 0.11 | | | | 0.19 | |
| | 1.02 | | | | (2.08 | ) | | | 0.76 | | | | 0.43 | | | | 1.23 | |
| | 1.23 | | | | (1.91 | ) | | | 0.89 | | | | 0.54 | | | | 1.42 | |
| | | | | | | | | | | | | | | | | | | |
| | | | | | | | | | | | | | | | | | | |
| | (0.21 | ) | | | (0.11 | ) | | | (0.13 | ) | | | (0.18 | ) | | | (0.29 | ) |
| | — | | | | (1.03 | ) | | | (0.11 | ) | | | (0.20 | ) | | | — | |
| | (0.21 | ) | | | (1.14 | ) | | | (0.24 | ) | | | (0.38 | ) | | | (0.29 | ) |
| | | | | | | | | | | | | | | | | | | |
| $ | 13.44 | | | $ | 12.42 | | | $ | 15.47 | | | $ | 14.82 | | | $ | 14.66 | |
| | | | | | | | | | | | | | | | | | | |
| | 10.08 | % | | | (13.46 | )% | | | 6.02 | % | | | 3.80 | % | | | 10.94 | % |
| | | | | | | | | | | | | | | | | | | |
| | | | | | | | | | | | | | | | | | | |
| $ | 143,998 | | | $ | 149,727 | | | $ | 201,367 | | | $ | 59,692 | | | $ | 62,035 | |
| | 1.13 | % | | | 1.13 | % | | | 1.17 | % | | | 1.26 | % | | | 1.34 | % |
| | 1.33 | % | | | 1.35 | % | | | 1.36 | % | | | 1.35 | % | | | 1.35 | % |
| | 1.55 | % | | | 1.27 | % | | | 0.80 | % | | | 0.81 | % | | | 1.35 | % |
| | 1.35 | % | | | 1.05 | % | | | 0.61 | % | | | 0.72 | % | | | 1.34 | % |
| | 102 | %4 | | | 32 | % | | | 38 | % | | | 36 | % | | | 143 | %4 |
Financial highlights
Delaware International Equity Fund Class C
Selected data for each share of the Fund outstanding throughout each period were as follows:
| Net asset value, beginning of period |
| |
| Income (loss) from investment operations: |
| Net investment income1 |
| Net realized and unrealized gain (loss) |
| Total from investment operations |
| |
| Less dividends and distributions from: |
| Net investment income |
| Net realized gain |
| Total dividends and distributions |
| |
| Net asset value, end of period |
| |
| Total return2 |
| |
| Ratios and supplemental data: |
| Net assets, end of period (000 omitted) |
| Ratio of expenses to average net assets3 |
| Ratio of expenses to average net assets prior to fees waived3 |
| Ratio of net investment income to average net assets |
| Ratio of net investment income (loss) to average net assets prior to fees waived |
| Portfolio turnover |
| 1 | Calculated using average shares outstanding. |
| 2 | Total return is based on the change in net asset value of a share during the period and assumes reinvestment of dividends and distributions at net asset value and does not reflect the impact of a sales charge. Total return during the period reflects waivers by the manager and/or distributor (as applicable). Performance would have been lower had the waivers not been in effect. |
| 3 | Expense ratios do not include expenses of any investment companies in which the Fund invests. |
| 4 | The Fund's portfolio turnover rate increased substantially during the years ended November 30, 2023 and 2019 due to a change in the Fund's portfolio managers and associated repositioning. |
See accompanying notes, which are an integral part of the financial statements.
| Year ended | |
| 11/30/23 | | | 11/30/22 | | | 11/30/21 | | | 11/30/20 | | | 11/30/19 | |
| $ | 12.26 | | | $ | 15.28 | | | $ | 14.63 | | | $ | 14.48 | | | $ | 13.25 | |
| | | | | | | | | | | | | | | | | | | |
| | | | | | | | | | | | | | | | | | | |
| | 0.11 | | | | 0.07 | | | | 0.01 | | | | 0.01 | | | | 0.08 | |
| | 1.01 | | | | (2.06 | ) | | | 0.75 | | | | 0.42 | | | | 1.25 | |
| | 1.12 | | | | (1.99 | ) | | | 0.76 | | | | 0.43 | | | | 1.33 | |
| | | | | | | | | | | | | | | | | | | |
| | | | | | | | | | | | | | | | | | | |
| | (0.11 | ) | | | — | | | | — | | | | (0.08 | ) | | | (0.10 | ) |
| | — | | | | (1.03 | ) | | | (0.11 | ) | | | (0.20 | ) | | | — | |
| | (0.11 | ) | | | (1.03 | ) | | | (0.11 | ) | | | (0.28 | ) | | | (0.10 | ) |
| | | | | | | | | | | | | | | | | | | |
| $ | 13.27 | | | $ | 12.26 | | | $ | 15.28 | | | $ | 14.63 | | | $ | 14.48 | |
| | | | | | | | | | | | | | | | | | | |
| | 9.23 | % | | | (14.07 | )% | | | 5.21 | % | | | 3.01 | % | | | 10.18 | % |
| | | | | | | | | | | | | | | | | | | |
| | | | | | | | | | | | | | | | | | | |
| $ | 2,838 | | | $ | 3,313 | | | $ | 4,549 | | | $ | 6,127 | | | $ | 8,562 | |
| | 1.88 | % | | | 1.88 | % | | | 1.92 | % | | | 2.01 | % | | | 2.09 | % |
| | 2.08 | % | | | 2.10 | % | | | 2.11 | % | | | 2.10 | % | | | 2.10 | % |
| | 0.80 | % | | | 0.52 | % | | | 0.05 | % | | | 0.06 | % | | | 0.60 | % |
| | 0.60 | % | | | 0.30 | % | | | (0.14 | )% | | | (0.03 | )% | | | 0.59 | % |
| | 102 | %4 | | | 32 | % | | | 38 | % | | | 36 | % | | | 143 | %4 |
Financial highlights
Delaware International Equity Fund Class R
Selected data for each share of the Fund outstanding throughout each period were as follows:
| Net asset value, beginning of period |
| |
| Income (loss) from investment operations: |
| Net investment income1 |
| Net realized and unrealized gain (loss) |
| Total from investment operations |
| |
| Less dividends and distributions from: |
| Net investment income |
| Net realized gain |
| Total dividends and distributions |
| |
| Net asset value, end of period |
| |
| Total return2 |
| |
| Ratios and supplemental data: |
| Net assets, end of period (000 omitted) |
| Ratio of expenses to average net assets3 |
| Ratio of expenses to average net assets prior to fees waived3 |
| Ratio of net investment income to average net assets |
| Ratio of net investment income to average net assets prior to fees waived |
| Portfolio turnover |
| 1 | Calculated using average shares outstanding. |
| 2 | Total return is based on the change in net asset value of a share during the period and assumes reinvestment of dividends and distributions at net asset value. Total return during the period reflects waivers by the manager and/or distributor (as applicable). Performance would have been lower had the waivers not been in effect. |
| 3 | Expense ratios do not include expenses of any investment companies in which the Fund invests. |
| 4 | The Fund's portfolio turnover rate increased substantially during the years ended November 30, 2023 and 2019 due to a change in the Fund's portfolio managers and associated repositioning. |
See accompanying notes, which are an integral part of the financial statements.
| Year ended | |
| 11/30/23 | | | 11/30/22 | | | 11/30/21 | | | 11/30/20 | | | 11/30/19 | |
| $ | 12.37 | | | $ | 15.40 | | | $ | 14.76 | | | $ | 14.60 | | | $ | 13.46 | |
| | | | | | | | | | | | | | | | | | | |
| | | | | | | | | | | | | | | | | | | |
| | 0.18 | | | | 0.14 | | | | 0.09 | | | | 0.08 | | | | 0.15 | |
| | 1.01 | | | | (2.08 | ) | | | 0.76 | | | | 0.42 | | | | 1.24 | |
| | 1.19 | | | | (1.94 | ) | | | 0.85 | | | | 0.50 | | | | 1.39 | |
| | | | | | | | | | | | | | | | | | | |
| | | | | | | | | | | | | | | | | | | |
| | (0.15 | ) | | | (0.06 | ) | | | (0.10 | ) | | | (0.14 | ) | | | (0.25 | ) |
| | — | | | | (1.03 | ) | | | (0.11 | ) | | | (0.20 | ) | | | — | |
| | (0.15 | ) | | | (1.09 | ) | | | (0.21 | ) | | | (0.34 | ) | | | (0.25 | ) |
| | | | | | | | | | | | | | | | | | | |
| $ | 13.41 | | | $ | 12.37 | | | $ | 15.40 | | | $ | 14.76 | | | $ | 14.60 | |
| | | | | | | | | | | | | | | | | | | |
| | 9.79 | % | | | (13.68 | )% | | | 5.75 | % | | | 3.53 | % | | | 10.72 | % |
| | | | | | | | | | | | | | | | | | | |
| | | | | | | | | | | | | | | | | | | |
| $ | 934 | | | $ | 1,454 | | | $ | 4,941 | | | $ | 2,845 | | | $ | 3,472 | |
| | 1.38 | % | | | 1.38 | % | | | 1.42 | % | | | 1.51 | % | | | 1.59 | % |
| | 1.58 | % | | | 1.60 | % | | | 1.61 | % | | | 1.60 | % | | | 1.60 | % |
| | 1.30 | % | | | 1.01 | % | | | 0.55 | % | | | 0.56 | % | | | 1.10 | % |
| | 1.10 | % | | | 0.79 | % | | | 0.36 | % | | | 0.47 | % | | | 1.09 | % |
| | 102 | %4 | | | 32 | % | | | 38 | % | | | 36 | % | | | 143 | %4 |
Financial highlights
Delaware International Equity Fund Institutional Class
Selected data for each share of the Fund outstanding throughout each period were as follows:
| Net asset value, beginning of period |
| |
| Income (loss) from investment operations: |
| Net investment income1 |
| Net realized and unrealized gain (loss) |
| Total from investment operations |
| |
| Less dividends and distributions from: |
| Net investment income |
| Net realized gain |
| Total dividends and distributions |
| |
| Net asset value, end of period |
| |
| Total return2 |
| |
| Ratios and supplemental data: |
| Net assets, end of period (000 omitted) |
| Ratio of expenses to average net assets3 |
| Ratio of expenses to average net assets prior to fees waived3 |
| Ratio of net investment income to average net assets |
| Ratio of net investment income to average net assets prior to fees waived |
| Portfolio turnover |
| 1 | Calculated using average shares outstanding. |
| 2 | Total return is based on the change in net asset value of a share during the period and assumes reinvestment of dividends and distributions at net asset value. Total return during the period reflects waivers by the manager. Performance would have been lower had the waivers not been in effect. |
| 3 | Expense ratios do not include expenses of any investment companies in which the Fund invests. |
| 4 | The Fund's portfolio turnover rate increased substantially during the years ended November 30, 2023 and 2019 due to a change in the Fund's portfolio managers and associated repositioning. |
See accompanying notes, which are an integral part of the financial statements.
| Year ended | |
| 11/30/23 | | | 11/30/22 | | | 11/30/21 | | | 11/30/20 | | | 11/30/19 | |
| $ | 12.50 | | | $ | 15.55 | | | $ | 14.90 | | | $ | 14.74 | | | $ | 13.60 | |
| | | | | | | | | | | | | | | | | | | |
| | | | | | | | | | | | | | | | | | | |
| | 0.24 | | | | 0.20 | | | | 0.17 | | | | 0.15 | | | | 0.22 | |
| | 1.02 | | | | (2.09 | ) | | | 0.75 | | | | 0.43 | | | | 1.25 | |
| | 1.26 | | | | (1.89 | ) | | | 0.92 | | | | 0.58 | | | | 1.47 | |
| | | | | | | | | | | | | | | | | | | |
| | | | | | | | | | | | | | | | | | | |
| | (0.24 | ) | | | (0.13 | ) | | | (0.16 | ) | | | (0.22 | ) | | | (0.33 | ) |
| | — | | | | (1.03 | ) | | | (0.11 | ) | | | (0.20 | ) | | | — | |
| | (0.24 | ) | | | (1.16 | ) | | | (0.27 | ) | | | (0.42 | ) | | | (0.33 | ) |
| | | | | | | | | | | | | | | | | | | |
| $ | 13.52 | | | $ | 12.50 | | | $ | 15.55 | | | $ | 14.90 | | | $ | 14.74 | |
| | | | | | | | | | | | | | | | | | | |
| | 10.33 | % | | | (13.23 | )% | | | 6.24 | % | | | 4.04 | % | | | 11.29 | % |
| | | | | | | | | | | | | | | | | | | |
| | | | | | | | | | | | | | | | | | | |
| $ | 114,499 | | | $ | 182,373 | | | $ | 318,766 | | | $ | 248,810 | | | $ | 229,511 | |
| | 0.88 | % | | | 0.88 | % | | | 0.92 | % | | | 1.01 | % | | | 1.09 | % |
| | 1.08 | % | | | 1.10 | % | | | 1.11 | % | | | 1.10 | % | | | 1.10 | % |
| | 1.80 | % | | | 1.52 | % | | | 1.05 | % | | | 1.06 | % | | | 1.60 | % |
| | 1.60 | % | | | 1.30 | % | | | 0.86 | % | | | 0.97 | % | | | 1.59 | % |
| | 102 | %4 | | | 32 | % | | | 38 | % | | | 36 | % | | | 143 | %4 |
Financial highlights
Delaware International Equity Fund Class R6
Selected data for each share of the Fund outstanding throughout each period were as follows:
| Net asset value, beginning of period |
| |
| Income (loss) from investment operations: |
| Net investment income1 |
| Net realized and unrealized gain (loss) |
| Total from investment operations |
| |
| Less dividends and distributions from: |
| Net investment income |
| Net realized gain |
| Total dividends and distributions |
| |
| Net asset value, end of period |
| |
| Total return2 |
| |
| Ratios and supplemental data: |
| Net assets, end of period (000 omitted) |
| Ratio of expenses to average net assets3 |
| Ratio of expenses to average net assets prior to fees waived3 |
| Ratio of net investment income to average net assets |
| Ratio of net investment income to average net assets prior to fees waived |
| Portfolio turnover |
| 1 | Calculated using average shares outstanding. |
| 2 | Total return is based on the change in net asset value of a share during the period and assumes reinvestment of dividends and distributions at net asset value. Total return during the period reflects waivers by the manager. Performance would have been lower had the waivers not been in effect. |
| 3 | Expense ratios do not include expenses of any investment companies in which the Fund invests. |
| 4 | The Fund's portfolio turnover rate increased substantially during the years ended November 30, 2023 and 2019 due to a change in the Fund's portfolio managers and associated repositioning. |
See accompanying notes, which are an integral part of the financial statements.
| Year ended | |
| 11/30/23 | | | 11/30/22 | | | 11/30/21 | | | 11/30/20 | | | 11/30/19 | |
| $ | 12.51 | | | $ | 15.56 | | | $ | 14.91 | | | $ | 14.74 | | | $ | 13.60 | |
| | | | | | | | | | | | | | | | | | | |
| | | | | | | | | | | | | | | | | | | |
| | 0.26 | | | | 0.21 | | | | 0.18 | | | | 0.15 | | | | 0.24 | |
| | 1.02 | | | | (2.09 | ) | | | 0.76 | | | | 0.45 | | | | 1.24 | |
| | 1.28 | | | | (1.88 | ) | | | 0.94 | | | | 0.60 | | | | 1.48 | |
| | | | | | | | | | | | | | | | | | | |
| | | | | | | | | | | | | | | | | | | |
| | (0.26 | ) | | | (0.14 | ) | | | (0.18 | ) | | | (0.23 | ) | | | (0.34 | ) |
| | — | | | | (1.03 | ) | | | (0.11 | ) | | | (0.20 | ) | | | — | |
| | (0.26 | ) | | | (1.17 | ) | | | (0.29 | ) | | | (0.43 | ) | | | (0.34 | ) |
| | | | | | | | | | | | | | | | | | | |
| $ | 13.53 | | | $ | 12.51 | | | $ | 15.56 | | | $ | 14.91 | | | $ | 14.74 | |
| | | | | | | | | | | | | | | | | | | |
| | 10.44 | % | | | (13.17 | )% | | | 6.31 | % | | | 4.14 | % | | | 11.36 | % |
| | | | | | | | | | | | | | | | | | | |
| | | | | | | | | | | | | | | | | | | |
| $ | 2,521 | | | $ | 3,038 | | | $ | 3,732 | | | $ | 1,585 | | | $ | 2,091 | |
| | 0.80 | % | | | 0.81 | % | | | 0.86 | % | | | 0.95 | % | | | 1.03 | % |
| | 1.00 | % | | | 1.02 | % | | | 1.04 | % | | | 1.02 | % | | | 1.03 | % |
| | 1.88 | % | | | 1.59 | % | | | 1.11 | % | | | 1.12 | % | | | 1.66 | % |
| | 1.68 | % | | | 1.38 | % | | | 0.94 | % | | | 1.05 | % | | | 1.66 | % |
| | 102 | %4 | | | 32 | % | | | 38 | % | | | 36 | % | | | 143 | %4 |
| Notes to financial statements | |
| Delaware International Funds | November 30, 2023 |
Delaware Group® Global & International Funds (Trust) is organized as a Delaware statutory trust and offers two series: Delaware Emerging Markets Fund and Delaware International Equity Fund (formerly, Delaware International Value Equity Fund) (each, a Fund or collectively, the Funds). The Trust is an open-end investment company. Delaware Emerging Markets Fund is considered diversified and Delaware International Equity fund is considered non-diversified under the Investment Company Act of 1940, as amended (1940 Act), and offers Class A, Class C, Class R, Institutional Class, and Class R6 shares. Class A shares are sold with a maximum front-end sales charge of 5.75%. There is no front-end sales charge when you purchase $1 million or more of Class A shares. However, if Delaware Distributors, L.P. (DDLP) paid your financial intermediary a commission on your purchase of $1 million or more of Class A shares, you will have to pay a limited contingent deferred sales charge (Limited CDSC) of 1.00% if you redeem these shares within the first 18 months after your purchase, unless a specific waiver of the Limited CDSC applies. Class C shares have no upfront sales charge, but are sold with a contingent deferred sales charge (CDSC) of 1.00%, which will be incurred if redeemed during the first 12 months. Class R, Institutional Class, and Class R6 shares are not subject to a sales charge and are offered for sale exclusively to certain eligible investors. In addition, Class R6 shares do not pay any service fees, sub-accounting fees, and/or sub-transfer agency fees to any brokers, dealers, or other financial intermediaries.
1. Significant Accounting Policies
Each Fund follows accounting and reporting guidance under Financial Accounting Standards Board (FASB) Accounting Standards Codification Topic 946, Financial Services — Investment Companies. The following accounting policies are in accordance with US generally accepted accounting principles (US GAAP) and are consistently followed by the Funds.
Security Valuation — Equity securities and exchange-traded funds (ETFs), except those traded on the Nasdaq Stock Market LLC (Nasdaq), are valued at the last quoted sales price as of the time of the regular close of the New York Stock Exchange on the valuation date. Equity securities and ETFs traded on the Nasdaq are valued in accordance with the Nasdaq Official Closing Price, which may not be the last sales price. If, on a particular day, an equity security or ETF does not trade, the mean between the bid and the ask prices will be used, which approximates fair value. Equity securities listed on a foreign exchange are normally valued at the last quoted sales price on the valuation date. Forward foreign currency exchange contracts are valued at the mean between the bid and the ask prices, which approximates fair value. Interpolated values are derived when the settlement date of the contract is an interim date for which quotations are not available. Open-end investment companies, other than ETFs, are valued at their published net asset value (NAV). Generally, other securities and assets for which market quotations are not readily available are valued at fair value as determined in good faith by Delaware Management Company (DMC). Subject to the oversight of the Trust's Board of Trustees (Board), DMC, as valuation designee, has adopted policies and procedures to fair value securities for which market quotations are not readily available consistent with the requirements of Rule 2a-5 under the 1940 Act. In determining whether market quotations are readily available
or fair valuation will be used, various factors will be taken into consideration, such as market closures or suspension of trading in a security. Restricted securities and private placements are valued at fair value.
Federal and Foreign Income Taxes — No provision for federal income taxes has been made as each Fund intends to continue to qualify for federal income tax purposes as a regulated investment company under Subchapter M of the Internal Revenue Code of 1986, as amended, and make the requisite distributions to shareholders. Each Fund evaluates tax positions taken or expected to be taken in the course of preparing each Fund's tax returns to determine whether the tax positions are “more-likely-than-not” of being sustained by the applicable tax authority. Tax positions not deemed to meet the “more-likely-than-not” threshold are recorded as a tax benefit or expense in the current year. Management has analyzed each Fund's tax positions taken or expected to be taken on each Fund's federal income tax returns through the year ended November 30, 2023, and for all open tax years (years ended November 30, 2020–November 30, 2022), and has concluded that no provision for federal income tax is required in each Fund's financial statements. In regard to foreign taxes only, each Fund has open tax years in certain foreign countries in which it invests that may date back to the inception of each Fund. If applicable, each Fund recognizes interest accrued on unrecognized tax benefits in interest expense and penalties in “Other” on the “Statements of operations.” During the year ended November 30, 2023, the Funds did not incur any interest or tax penalties.
As a result of several court cases, in certain countries across the European Union, the Fund filed additional tax reclaims for previously withheld taxes on dividends earned in those countries (“EU reclaims”). Income recognized, if any, for EU reclaims is reflected as "Reclaim income" on the “Statements of operations.” Any fees associated with these filings are included on the “Statements of operations” under “Audit and tax fees.” For U.S. income tax purposes, EU reclaims received by the Fund, if any, reduce the amount of foreign taxes Fund shareholders can use as tax deductions or credits on their income tax returns.
Class Accounting — Investment income, common expenses, and realized and unrealized gain (loss) on investments are allocated to the various classes of each Fund on the basis of daily net assets of each class. Distribution expenses relating to a specific class are charged directly to that class. Class R6 shares will not be allocated any expenses related to service fees, sub-accounting fees, and/or sub-transfer agency fees paid to brokers, dealers, or other financial intermediaries.
Underlying Funds — The Funds may invest in other investment companies (Underlying Funds) to the extent permitted by the 1940 Act. The Underlying Funds in which the Funds may invest include ETFs. A Fund will indirectly bear the investment management fees and other expenses of the Underlying Funds.
Foreign Currency Transactions — Transactions denominated in foreign currencies are recorded at the prevailing exchange rates on the valuation date. The value of all assets and liabilities denominated in foreign currencies is translated daily into US dollars at the exchange rate of such currencies against the US dollar. Transaction gains or losses resulting from changes
| Notes to financial statements |
| Delaware International Funds |
1. Significant Accounting Policies (continued)
in exchange rates during the reporting period or upon settlement of the foreign currency transaction are reported in operations for the current period. The Funds generally do not bifurcate that portion of realized gains and losses on investments which is due to changes in foreign exchange rates from that which is due to changes in market prices. These realized gains and losses are included on the “Statements of operations” under “Net realized gain (loss) on investments.” Each Fund reports certain foreign currency related transactions as components of realized gains (losses) for financial reporting purposes, whereas such components are treated as ordinary income (loss) for federal income tax purposes.
Use of Estimates — The preparation of financial statements in conformity with US GAAP requires management to make estimates and assumptions that affect the fair value of investments, the reported amounts of assets and liabilities and disclosure of contingent assets and liabilities at the date of the financial statements, and the reported amounts of revenues and expenses during the reporting period. Actual results could differ from those estimates and the differences could be material.
Other — Expenses directly attributable to a Fund are charged directly to each Fund. Other expenses common to various funds within the Delaware Funds by Macquarie® (Delaware Funds) are generally allocated among such funds on the basis of average net assets. Management fees and certain other expenses are paid monthly. Security transactions are recorded on the date the securities are purchased or sold (trade date) for financial reporting purposes. Costs used in calculating realized gains and losses on the sale of investment securities are those of the specific securities sold. Dividend income is recorded on the ex-dividend date and interest income is recorded on an accrual basis. Income and capital gain distributions from any Underlying Funds in which each Fund invests are recorded on the ex-dividend date. Taxable non-cash dividends are recorded as dividend income. Foreign dividends are also recorded on the ex-dividend date or as soon after the ex-dividend date that a Fund is aware of such dividends, net of all tax withholdings, a portion of which may be reclaimable. Withholding taxes and reclaims on foreign dividends have been recorded in accordance with each Fund’s understanding of the applicable country’s tax rules and rates. Each Fund may pay foreign capital gains taxes on certain foreign securities held, which are reported as components of realized losses for financial reporting purposes, whereas such components are treated as ordinary loss for federal income tax purposes. Each Fund will accrue such taxes as applicable based upon current interpretations of the tax rules and regulations that exist in the markets in which it invests. Each Fund declares and pays dividends from net investment income and distributions from net realized gain on investments, if any, at least annually. Each Fund may distribute more frequently, if necessary for tax purposes. Dividends and distributions, if any, are recorded on the ex-dividend date.
Each Fund receives earnings credits from its transfer agent when positive cash balances are maintained, which may be used to offset transfer agent fees. If the amount earned is greater than $1, the expenses paid under this arrangement are included on the “Statements of operations”
under “Dividend disbursing and transfer agent fees and expenses” with the corresponding expenses offset included under “Less expenses paid indirectly.”
2. Investment Management, Administration Agreements, and Other Transactions with Affiliates
In accordance with the terms of its respective investment management agreement, each Fund pays DMC, a series of Macquarie Investment Management Business Trust and the investment manager, an annual fee which is calculated daily and paid monthly, based on each Fund's average daily net assets as follows:
| | | Delaware Emerging | | | Delaware International | |
| | | Markets Fund | | | Equity Fund | |
| On the first $500 million | | | 1.2500% | | | | 0.8500% | |
| On the next $500 million | | | 1.2000% | | | | 0.8000% | |
| On the next $1.5 billion | | | 1.1500% | | | | 0.7500% | |
| In excess of $2.5 billion | | | 1.1000% | | | | 0.7000% | |
DMC has contractually agreed to waive all or a portion of its management fees and/or pay/reimburse expenses (excluding any distribution and service (12b-1) fees, acquired fund fees and expenses, taxes, interest, short sale dividend and interest expenses, brokerage fees, certain insurance costs, and nonroutine expenses or costs, including, but not limited to, those relating to reorganizations, litigation, conducting shareholder meetings, and liquidations), in order to prevent total annual fund operating expenses from exceeding the following percentages of each Fund’s average daily net assets from December 1, 2022 (except as noted) through March 29, 2024. These waivers and reimbursements may only be terminated by agreement of DMC and each Fund. The waivers and reimbursements are accrued daily and received monthly.
| | | Operating expense | | | |
| | | limitation as a | | | |
| | | percentage of average | | Operating expense | |
| | | daily | | limitation as a | |
| | | net assets | | percentage of average | |
| | | all share classes | | daily | |
| | | other than | | net assets | |
| Fund | | Class R6 | | Class R6 | |
| Delaware Emerging Markets Fund | | 1.20%* | | | 1.12%* | |
| Delaware International Equity Fund | | 0.88% | | | 0.79%** | |
| * | Effective March 30, 2023. Prior to March 30, 2023, the expense limit in effect for all share classes other than Class R6 shares was 1.23% and Class R6 shares was 1.14%. |
| ** | Effective March 30, 2023. Prior to March 30, 2023, the expense limit in effect for Class R6 shares was 0.81%. |
| Notes to financial statements |
| Delaware International Funds |
2. Investment Management, Administration Agreements, and Other Transactions with Affiliates (continued)
After consideration of class specific expenses, including 12b-1 fees, the class level operating expense limitation as a percentage of average daily net assets for the period December 1, 2022 (except as noted) through March 29, 2024 is as follows:
| | | Operating expense limitation as a percentage of average daily net assets | |
| Fund | | Class A | | | Class C | | | Class R | | | Institutional Class | | | Class R6 | |
| Delaware Emerging Markets Fund | | | 1.45%* | | | | 2.20%* | | | | 1.70%* | | | | 1.20%* | | | | 1.12%* | |
| Delaware International Equity Fund | | | 1.13% | | | | 1.88% | | | | 1.38% | | | | 0.88% | | | | 0.79%** | |
| * | Effective March 30, 2023. Prior to March 30, 2023, the expense limit in effect for Class A, Class C, Class R, Institutional Class and Class R6 shares was 1.48%, 2.23%, 1.73%, 1.23%, and 1.14% respectively. |
| ** | Effective March 30, 2023. Prior to March 30, 2023, the expense limit in effect for Class R6 shares was 0.81%. |
DMC entered into a Sub-Advisory Agreement on behalf of the Funds with Macquarie Investment Management Global Limited, which is an affiliate of DMC (“Affiliated Sub-Advisor”). Pursuant to the terms of the Sub-Advisory Agreement, the investment sub-advisory fee is paid by DMC to the Affiliated Sub-Advisor based on the extent to which the Affiliated Sub-Advisor provides services to the Funds.
Delaware Investments Fund Services Company (DIFSC), an affiliate of DMC, provides fund accounting and financial administrative oversight services to each Fund. For these services, effective October 1, 2023, DIFSC’s fees are calculated daily and paid monthly, based on the aggregate daily net assets of all funds within the Delaware Funds at the following annual rates: 0.0050% of the first $60 billion; 0.00475% of the next $30 billion; and 0.0015% of aggregate average daily net assets in excess of $90 billion (Total Fee). Prior to October 1, 2023, DIFSC's fees were payable by the fund at the following annual rates: 0.00475% of the first $35 billion; 0.0040% of the next $10 billion; 0.0025% of the next $45 billion; and 0.0015% of aggregate average daily net assets in excess of $90 billion. Each fund in the Delaware Funds pays a minimum of $4,000, which, in aggregate, is subtracted from the Total Fee. Each fund then pays its portion of the remainder of the Total Fee on a relative NAV basis. These amounts are included on the “Statements of operations” under “Accounting and administration expenses.” For the year ended November 30, 2023, each Fund paid for these services as follows:
| Fund | | Fees | |
| Delaware Emerging Markets Fund | | $ | 151,548 | |
| Delaware International Equity Fund | | | 13,650 | |
DIFSC is also the transfer agent and dividend disbursing agent of the Funds. For these services, DIFSC’s fees are calculated daily and paid monthly, based on the aggregate daily net assets of the retail funds within the Delaware Funds at the following annual rates: 0.014% of the first $20 billion; 0.011% of the next $5 billion; 0.007% of the next $5 billion; 0.004% of the next $20 billion; 0.002% of the next $25 billion; and 0.0015% of average daily net assets in excess of $75 billion. The fees payable to DIFSC under the shareholder services agreement described above are allocated among all retail funds in the Delaware Funds on a relative NAV basis. These amounts are included on the “Statements of operations” under “Dividend disbursing and transfer agent fees and expenses.” For the year ended November 30, 2023, each Fund paid for these services as follows:
| Fund | | Fees | |
| Delaware Emerging Markets Fund | | $ | 305,994 | |
| Delaware International Equity Fund | | | 20,112 | |
Pursuant to a sub-transfer agency agreement between DIFSC and BNY Mellon Investment Servicing (US) Inc. (BNYMIS), BNYMIS provides certain sub-transfer agency services to the Funds. Sub-transfer agency fees are paid by the Funds and are also included on the “Statements of operations” under “Dividend disbursing and transfer agent fees and expenses.” These fees that are calculated daily and paid as invoices are received on a monthly or quarterly basis.
Pursuant to a distribution agreement and distribution plan, each Fund pays DDLP, the distributor and an affiliate of DMC, annual 12b-1 fee of 0.25%, 1.00%, and 0.50% of the average daily net assets of the Class A, Class C, and Class R shares, respectively. The fees are calculated daily and paid monthly. Institutional Class and Class R6 shares do not pay 12b-1 fees.
As provided in the investment management agreement, each Fund bears a portion of the cost of certain resources shared with DMC, including the cost of internal personnel of DMC and/or its affiliates that provide legal and regulatory reporting services to the Funds. These amounts are included on the “Statements of operations” under “Legal fees.” For the year ended November 30, 2023, each Fund paid for internal legal and regulatory reporting services provided by DMC and/or its affiliates’ employees as follows:
| Fund | | Fees | |
| Delaware Emerging Markets Fund | | $ | 138,842 | |
| Delaware International Equity Fund | | | 11,814 | |
For the year ended November 30, 2023, DDLP earned commissions on sales of Class A shares for each Fund as follows:
| Fund | | Class A | |
| Delaware Emerging Markets Fund | | $ | 8,908 | |
| Delaware International Equity Fund | | | 13,635 | |
| Notes to financial statements |
| Delaware International Funds |
2. Investment Management, Administration Agreements, and Other Transactions with Affiliates (continued)
For the year ended November 30, 2023, DDLP received gross CDSC commissions on redemptions of each Fund’s Class A and Class C shares, and these commissions were entirely used to offset upfront commissions previously paid by DDLP to broker/dealers on sales of those shares. The amounts received were as follows:
| Fund | | Class A | | | Class C | |
| Delaware Emerging Markets Fund | | $ | 18 | | | $ | 4,163 | |
| Delaware International Equity Fund | | | 79 | | | | 24 | |
Trustees’ fees include expenses accrued by each Fund for each Trustee’s retainer and meeting fees. Certain officers of DMC, DIFSC, and DDLP are officers and/or Trustees of the Trust. These officers and Trustees are paid no compensation by the Funds.
In addition to the management fees and other expenses of a Fund, a Fund indirectly bears the investment management fees and other expenses of any Underlying Funds, including ETFs, in which it invests. The amount of these fees and expenses incurred indirectly by a Fund will vary based upon the expense and fee levels of any Underlying Funds and the number of shares that are owned of any Underlying Funds at different times.
3. Investments
For the year ended November 30, 2023, each Fund made purchases and sales of investment securities other than short-term investments and US government securities as follows:
| Fund | | Purchases | | | Sales | |
| Delaware Emerging Markets Fund | | $ | 117,964,760 | | | $ | 349,629,158 | |
| Delaware International Equity Fund | | | 311,507,230 | | | | 418,257,676 | |
The tax cost of investments includes adjustments to net unrealized appreciation (depreciation) which may not necessarily be the final tax cost basis adjustments but which approximate the tax basis unrealized gains and losses that may be realized and distributed to shareholders.
At November 30, 2023, the cost and unrealized appreciation (depreciation) of investments for federal income tax purposes for each Fund were as follows:
| | | | | | Aggregate | | | Aggregate | | | Net unrealized | |
| | | | | | unrealized | | | unrealized | | | appreciation | |
| | | Cost of | | | appreciation | | | depreciation | | | (depreciation) | |
| Fund | | investments | | | of investments | | | of investments | | | of investments | |
| Delaware Emerging Markets Fund | | $ | 4,798,829,596 | | | $ | 1,651,734,040 | | | $ | (1,630,355,005 | ) | | $ | 21,379,035 | |
| Delaware International Equity Fund | | | 258,305,654 | | | | 17,555,434 | | | | (13,802,922 | ) | | | 3,752,512 | |
US GAAP defines fair value as the price that each Fund would receive to sell an asset or pay to transfer a liability in an orderly transaction between market participants at the measurement date under current market conditions. A three-level hierarchy for fair value measurements has been established based upon the transparency of inputs to the valuation of an asset or liability. Inputs may be observable or unobservable and refer broadly to the assumptions that market participants would use in pricing the asset or liability. Observable inputs reflect the assumptions market participants would use in pricing the asset or liability based on market data obtained from sources independent of the reporting entity. Unobservable inputs reflect the reporting entity’s own assumptions about the assumptions that market participants would use in pricing the asset or liability based on the best information available under the circumstances. Each Fund's investment in its entirety is assigned a level based upon the observability of the inputs which are significant to the overall valuation. The three-level hierarchy of inputs is summarized as follows:
| Level 1 – | Inputs are quoted prices in active markets for identical investments. (Examples: equity securities, open-end investment companies, futures contracts, and exchange-traded options contracts) |
| | |
| Level 2 – | Other observable inputs, including, but not limited to: quoted prices for similar assets or liabilities in markets that are active, quoted prices for identical or similar assets or liabilities in markets that are not active, inputs other than quoted prices that are observable for the assets or liabilities (such as interest rates, yield curves, volatilities, prepayment speeds, loss severities, credit risks, and default rates) or other market-corroborated inputs. (Examples: debt securities, government securities, swap contracts, forward foreign currency exchange contracts, foreign securities utilizing international fair value pricing, broker-quoted securities, and fair valued securities) |
| | |
| Level 3 – | Significant unobservable inputs, including each Fund's own assumptions used to determine the fair value of investments. (Examples: broker-quoted securities and fair valued securities) |
| Notes to financial statements |
| Delaware International Funds |
3. Investments (continued)
Level 3 investments are valued using significant unobservable inputs. Each Fund may also use an income-based valuation approach in which the anticipated future cash flows of the investment are discounted to calculate fair value. Discounts may also be applied due to the nature or duration of any restrictions on the disposition of the investments. Valuations may also be based upon current market prices of securities that are comparable in coupon, rating, maturity, and industry. The derived value of a Level 3 investment may not represent the value which is received upon disposition and this could impact the results of operations.
The following tables summarize the valuation of each Fund's investments by fair value hierarchy levels as of November 30, 2023:
| | | Delaware Emerging Markets Fund | |
| | | Level 1 | | | Level 2 | | | Level 3 | | | Total | |
| Securities | | | | | | | | | | | | | | | | |
| Assets: | | | | | | | | | | | | | | | | |
| Common Stocks | | | | | | | | | | | | | | | | |
| Argentina | | $ | 26,881,578 | | | $ | 1,851,306 | | | $ | — | | | $ | 28,732,884 | |
| Australia | | | 14,318,382 | | | | — | | | | — | | | | 14,318,382 | |
| Bahrain | | | 3,171,245 | | | | — | | | | — | | | | 3,171,245 | |
| Brazil | | | 270,323,917 | | | | — | | | | — | | | | 270,323,917 | |
| Chile | | | 45,220,968 | | | | — | | | | — | | | | 45,220,968 | |
| China | | | 1,165,669,112 | | | | — | | | | — | | | | 1,165,669,112 | |
| Hong Kong | | | 11,009,691 | | | | — | | | | — | | | | 11,009,691 | |
| India | | | 703,025,944 | | | | 101,417 | | | | — | | | | 703,127,361 | |
| Indonesia | | | 64,498,097 | | | | — | | | | — | | | | 64,498,097 | |
| Malaysia | | | 2,590,407 | | | | — | | | | — | | | | 2,590,407 | |
| Mexico | | | 224,488,999 | | | | — | | | | — | | | | 224,488,999 | |
| Netherlands | | | 587,850 | | | | — | | | | — | | | | 587,850 | |
| Peru | | | 36,970,496 | | | | — | | | | — | | | | 36,970,496 | |
| Republic of Korea | | | 1,182,466,410 | | | | — | | | | — | | | | 1,182,466,410 | |
| Russia | | | — | | | | — | | | | — | 1,2 | | | — | |
| South Africa | | | 15,919,781 | | | | — | | | | — | | | | 15,919,781 | |
| Taiwan | | | 844,504,806 | | | | — | | | | — | | | | 844,504,806 | |
| Turkey | | | 63,782,971 | | | | — | | | | — | | | | 63,782,971 | |
| United Kingdom | | | 3,244,816 | | | | — | | | | — | | | | 3,244,816 | |
| United States | | | 53,284,000 | | | | — | | | | — | | | | 53,284,000 | |
| Exchange-Traded Fund | | | 10,237,999 | | | | — | | | | — | | | | 10,237,999 | |
| Participation Notes | | | — | | | | — | | | | — | 2 | | | — | |
| Preferred Stocks | | | 100,387,013 | | | | — | | | | — | 1,2 | | | 100,387,013 | |
| Rights | | | 1,144,814 | | | | — | | | | — | | | | 1,144,814 | |
| Warrants | | | 917,190 | | | | — | | | | — | | | | 917,190 | |
| | | Delaware Emerging Markets Fund | |
| | | Level 1 | | | Level 2 | | | Level 3 | | | Total | |
| Total Value of Securities | | $ | 4,844,646,486 | | | $ | 1,952,723 | | | $ | — | | | $ | 4,846,599,209 | |
1The value represents valuations of Russian securities for which management has determined include significant unobservable inputs as of November 30, 2023.
2The security that has been valued at zero on the “Schedule of investments” is considered to be Level 3 investment in this table.
| | | Delaware International Equity Fund | |
| | | Level 1 | |
| Securities | | | | |
| Assets: | | | | |
| Common Stocks | | $ | 257,216,697 | |
| Preferred Stock | | | 2,037,985 | |
| Short-Term Investments | | | 2,793,398 | |
| Total Value of Securities | | $ | 262,048,080 | |
During the year ended November 30, 2023, there were no transfers into or out of Level 3 investments. Each Fund’s policy is to recognize transfers into or out of Level 3 investments based on fair value at the beginning of the reporting year.
A reconciliation of Level 3 investments is presented when a Fund has a significant amount of Level 3 investments at the beginning or end of the year in relation to that Fund’s net assets. Management has determined not to provide a reconciliation of Level 3 investments as the Level 3 investments were not considered significant to each Fund’s net assets at the beginning or end of the year. Management has determined not to provide additional disclosure on Level 3 inputs since the Level 3 investments are not considered significant to the Delaware Emerging Markets Fund’s net assets at the end of the year.
As of November 30, 2023, Delaware International Equity Fund had no Level 3 investments.
| Notes to financial statements |
| Delaware International Funds |
4. Dividend and Distribution Information
Income and long-term capital gain distributions are determined in accordance with federal income tax regulations, which may differ from US GAAP. Additionally, distributions from net gains on foreign currency transactions and net short-term gains on sales of investment securities are treated as ordinary income for federal income tax purposes. The tax character of dividends and distributions paid during the years ended November 30, 2023 and 2022 were as follows:
| | | | | | Long-term | | | | |
| | | Ordinary | | | capital | | | | |
| | | income | | | gains | | | Total | |
| Year ended November 30, 2023: | | | | | | | | | |
| Delaware Emerging Markets Fund | | $ | 85,890,177 | | | $ | — | | | $ | 85,890,177 | |
| Delaware International Equity Fund | | | 5,892,425 | | | | — | | | | 5,892,425 | |
| Year ended November 30, 2022: | | | | | | | | | | | | |
| Delaware Emerging Markets Fund | | | 219,173,691 | | | | — | | | | 219,173,691 | |
| Delaware International Equity Fund | | | 6,236,252 | | | | 33,387,657 | | | | 39,623,909 | |
5. Components of Net Assets on a Tax Basis
As of November 30, 2023, the components of net assets on a tax basis were as follows:
| | | Delaware Emerging | | | Delaware International | |
| | | Markets Fund | | | Equity Fund | |
| Shares of beneficial interest | | $ | 4,868,538,239 | | | $ | 292,616,332 | |
| Undistributed ordinary income | | | 133,019,133 | | | | 3,402,651 | |
| Capital loss carryforwards | | | (204,363,726 | ) | | | (34,981,409 | ) |
| Unrealized appreciation (depreciation) of investments | | | 21,379,035 | | | | 3,752,512 | |
| Net assets | | $ | 4,818,572,681 | | | $ | 264,790,086 | |
The differences between book basis and tax basis components of net assets are primarily attributable to tax deferral of losses on wash sales, tax treatment of passive foreign investment companies (PFICs), and securities no longer considered PFICs.
For financial reporting purposes, capital accounts are adjusted to reflect the tax character of permanent book/tax differences. Results of operations and net assets were not affected by these reclassifications. For the year ended November 30, 2023, the Funds had no reclassifications.
For federal income tax purposes, capital loss carryforwards may be carried forward and applied against future capital gains. At November 30, 2023, the Funds have capital loss carryforwards available to offset future realized capital gains as follows:
| | | Loss carryforward character | | | | |
| | | Short-term | | | Long-term | | | Total | |
| Delaware Emerging Markets Fund | | $ | 14,146,352 | | | $ | 190,217,374 | | | $ | 204,363,726 | |
| Delaware International Equity Fund | | | 5,966,312 | | | | 29,015,097 | | | | 34,981,409 | |
| Notes to financial statements |
| Delaware International Funds |
6. Capital Shares
Transactions in capital shares were as follows:
| | | Delaware Emerging | | | Delaware International | |
| | | Markets Fund | | | Equity Fund | |
| | | Year ended | | | Year ended | |
| | | 11/30/23 | | | 11/30/22 | | | 11/30/23 | | | 11/30/22 | |
| Shares sold: | | | | | | | | | | | | | | | | |
| Class A | | | 2,282,355 | | | | 2,384,624 | | | | 755,228 | | | | 751,706 | |
| Class C | | | 251,905 | | | | 260,415 | | | | 61,053 | | | | 59,235 | |
| Class R | | | 223,321 | | | | 251,660 | | | | 6,408 | | | | 47,401 | |
| Institutional Class | | | 39,750,135 | | | | 69,311,633 | | | | 2,174,860 | | | | 5,300,882 | |
| Class R6 | | | 18,682,191 | | | | 39,808,326 | | | | 256,975 | | | | 149,296 | |
| | | | | | | | | | | | | | | | | |
| Shares issued upon reinvestment of dividends and distributions: | | | | | | | | | | | | | |
| Class A | | | 206,953 | | | | 452,712 | | | | 204,934 | | | | 1,000,549 | |
| Class C | | | 23,465 | | | | 121,108 | | | | 2,561 | | | | 21,093 | |
| Class R | | | 15,174 | | | | 40,147 | | | | 1,472 | | | | 24,370 | |
| Institutional Class | | | 2,365,918 | | | | 4,559,885 | | | | 270,003 | | | | 1,628,365 | |
| Class R6 | | | 1,690,001 | | | | 2,417,840 | | | | 2,632 | | | | 12,244 | |
| | | | 65,491,418 | | | | 119,608,350 | | | | 3,736,126 | | | | 8,995,141 | |
| | | | | | | | | | | | | | | | | |
| Shares redeemed: | | | | | | | | | | | | | | | | |
| Class A | | | (3,537,901 | ) | | | (4,033,335 | ) | | | (2,296,940 | ) | | | (2,716,133 | ) |
| Class C | | | (1,342,590 | ) | | | (1,651,351 | ) | | | (119,978 | ) | | | (107,754 | ) |
| Class R | | | (411,015 | ) | | | (497,316 | ) | | | (55,719 | ) | | | (275,014 | ) |
| Institutional Class | | | (53,407,849 | ) | | | (84,350,652 | ) | | | (8,565,446) | | | | (12,839,638 | ) |
| Class R6 | | | (21,035,239 | ) | | | (28,135,314 | ) | | | (316,055 | ) | | | (158,496 | ) |
| | | | (79,734,594 | ) | | | (118,667,968 | ) | | | (11,354,138 | ) | | | (16,097,035 | ) |
| Net increase (decrease) | | | (14,243,176 | ) | | | 940,382 | | | | (7,618,012 | ) | | | (7,101,894 | ) |
Certain shareholders may exchange shares of one class for shares of another class in the same Fund. These exchange transactions are included as subscriptions and redemptions in the tables above and on the “Statements of changes in net assets.” For the years ended November 30, 2023 and 2022, each Fund had the following exchange transactions:
| | | Exchange Redemptions | | | Exchange Subscriptions | | | | |
| | | Class A Shares | | | Class C Shares | | | Institutional
Class
Shares | | | Class R6 Shares | | | Class A Shares | | | Institutional
Class
Shares | | | Class R6 Shares | | | Value | |
| | | | | | | | | | | | | | | | | | | | | | | | | | | | | | | | | |
| Delaware Emerging Markets Fund | | | | | | | | | | | | | | | | | | | | | | | |
| Year ended | | | | | | | | | | | | | | | | | | | | | | | | | | | | | |
| 11/30/23 | | | 182,371 | | | | 11,010 | | | | 612,114 | | | | 8,544 | | | | 43,393 | | | | 193,696 | | | | 574,693 | | | $ | 14,775,323 | |
| 11/30/22 | | | 41,481 | | | | 43,580 | | | | 19,286 | | | | — | | | | 30,736 | | | | 48,267 | | | | 21,290 | | | | 1,865,718 | |
| | | Exchange Redemptions | | | Exchange Subscriptions | | | | |
| | | | | | | | | Institutional | | | | | | | | | Institutional | | | | | | | |
| | | Class A | | | Class C | | | Class | | | Class R6 | | | Class A | | | Class | | | Class R6 | | | | |
| | | Shares | | | Shares | | | Shares | | | Shares | | | Shares | | | Shares | | | Shares | | | Value | |
| | | | | | | | | | | | | | | | | | | | | | | | | | | | | | | | | |
| Delaware International Equity Fund | | | | | | | | | | | | | | | | | | | | | | |
| Year ended | | | | | | | | | | | | | | | | | | | | | | | | | | | | | |
| 11/30/23 | | | 71,576 | | | | 2,321 | | | | 233,540 | | | | — | | | | 4,721 | | | | 70,421 | | | | 231,999 | | | $ | 4,066,804 | |
| 11/30/22 | | | 2,231 | | | | 6,800 | | | | 758 | | | | — | | | | 7,495 | | | | 2,219 | | | | — | | | | 118,823 | |
7. Line of Credit
Each Fund, along with certain other funds in the Delaware Funds (Participants), was a participant in a $355,000,000 revolving line of credit (Agreement) intended to be used for temporary or emergency purposes as an additional source of liquidity to fund redemptions of investor shares. Under the Agreement, the Participants were charged an annual commitment fee of 0.15%, which was allocated across the Participants based on a weighted average of the respective net assets of each Participant. The Participants were permitted to borrow up to a maximum of one-third of their net assets under the Agreement. Each Participant was individually, and not jointly, liable for its particular advances, if any, under the line of credit. The line of credit available under the Agreement expired on October 30, 2023.
On October 30, 2023, each Fund, along with the other Participants, entered into an amendment to the Agreement for a $335,000,000 revolving line of credit. It operates in substantially the same manner as the original Agreement. Under the amendment to the Agreement, the Participants are charged an annual commitment fee of 0.15%, which is allocated across the Participants based on a weighted average of the respective net assets of each Participant. The line of credit available under the Agreement expires on October 28, 2024.
Each Fund had no amounts outstanding as of November 30, 2023, or at any time during the year then ended.
8. Securities Lending
Each Fund, along with other funds in the Delaware Funds, may lend its securities pursuant to a security lending agreement (Lending Agreement) with The Bank of New York Mellon (BNY Mellon). At the time a security is loaned, the borrower must post collateral equal to the required percentage of the market value of the loaned security, including any accrued interest. The required percentage is: (1) 102% with respect to US securities and foreign securities that are denominated and payable in US dollars; and (2) 105% with respect to foreign securities. With respect to each loan, if on any business day the aggregate market value of securities collateral plus cash collateral held is less than the aggregate market value of the securities which are the subject of such loan, the borrower will be notified to provide additional collateral by the end of the following business day, which, together with the collateral already held, will be not less than the applicable initial collateral requirements for such security loan. If the aggregate market value of securities collateral and cash collateral held with respect to a security loan exceeds the
| Notes to financial statements |
| Delaware International Funds |
8. Securities Lending (continued)
applicable initial collateral requirement, upon the request of the borrower, BNY Mellon must return enough collateral to the borrower by the end of the following business day to reduce the value of the remaining collateral to the applicable initial collateral requirement for such security loan. As a result of the foregoing, the value of the collateral held with respect to a loaned security on any particular day, may be more or less than the value of the security on loan. The collateral percentage with respect to the market value of the loaned security is determined by the security lending agent.
Cash collateral received by each Fund of the Trust is generally invested in a series of individual separate accounts, each corresponding to a fund. The investment guidelines permit each separate account to hold certain securities that would be considered eligible securities for a money market fund. Cash collateral received is generally invested in government securities; certain obligations issued by government sponsored enterprises; repurchase agreements collateralized by US Treasury securities; obligations issued by the central government of any Organization for Economic Cooperation and Development (OECD) country or its agencies, instrumentalities, or establishments; obligations of supranational organizations; commercial paper, notes, bonds, and other debt obligations; certificates of deposit, time deposits, and other bank obligations; certain money market funds; and asset-backed securities. Each Fund can also accept US government securities and letters of credit (non-cash collateral) in connection with securities loans.
In the event of default or bankruptcy by the lending agent, realization and/or retention of the collateral may be subject to legal proceedings. In the event the borrower fails to return loaned securities and the collateral received is insufficient to cover the value of the loaned securities and provided such collateral shortfall is not the result of investment losses, the lending agent has agreed to pay the amount of the shortfall to each Fund or, at the discretion of the lending agent, replace the loaned securities. Each Fund continues to record dividends or interest, as applicable, on the securities loaned and is subject to changes in value of the securities loaned that may occur during the term of the loan. Each Fund has the right under the Lending Agreement to recover the securities from the borrower on demand. With respect to security loans collateralized by non-cash collateral, each Fund receives loan premiums paid by the borrower. With respect to security loans collateralized by cash collateral, the earnings from the collateral investments are shared among each Fund, the security lending agent, and the borrower. Each Fund records security lending income net of allocations to the security lending agent and the borrower.
Each Fund may incur investment losses as a result of investing securities lending collateral. This could occur if an investment in each collateral investment account defaulted or became impaired. Under those circumstances, the value of each Fund’s cash collateral account may be less than the amount each Fund would be required to return to the borrowers of the securities and each Fund would be required to make up for this shortfall.
At November 30, 2023, each Fund had no securities out on loan.
9. Credit and Market Risks
The impact of COVID-19, and other infectious illness outbreaks that may arise in the future, could adversely affect the economies of many nations or the entire global economy, individual issuers and capital markets in ways that cannot necessarily be foreseen.
Beginning in late February 2022, global financial markets have experienced and may continue to experience significant volatility related to military action by Russia in Ukraine. As a result of this military action, the US and many other countries have imposed sanctions on Russia and certain Russian individuals, banks and corporations. The ongoing hostilities and resulting sanctions are expected to have a severe adverse effect on the region’s economies and more globally, including significant negative impact on markets for certain securities and commodities, such as oil and natural gas. Any cessation of trading on the Russian securities markets will impact the value and liquidity of certain portfolio holdings. The extent and duration of military action, sanctions, and resulting market disruptions are impossible to predict, but could be substantial and prolonged and impact the Fund’s performance.
Investments in equity securities in general are subject to market risks that may cause their prices to fluctuate over time. Fluctuations in the value of equity securities in which the Funds invest will cause the NAV of the Funds to fluctuate.
Delaware Emerging Markets Fund invests a significant portion of its assets in the greater China region, which consists of Hong Kong, the People’s Republic of China, and Taiwan, among other countries. As a result, the Fund’s investments in the region are particularly susceptible to risks in that region. Adverse events in any one country within the region may impact the other countries in the region or Asia as a whole. As a result, adverse events in the region will generally have a greater effect on the Fund than if the Fund were more geographically diversified, which could result in greater volatility in the Fund’s net asset value and losses. Markets in the greater China region can experience significant volatility due to social, economic, regulatory, and political uncertainties.
Some countries in which the Funds may invest require governmental approval for the repatriation of investment income, capital, or the proceeds of sales of securities by foreign investors. In addition, if there is deterioration in a country’s balance of payments or for other reasons, a country may impose temporary restrictions on foreign capital remittances abroad.
The securities exchanges of certain foreign markets are substantially smaller, less liquid, and more volatile than the major securities markets in the US. Consequently, acquisition and disposition of securities by each Fund may be inhibited. In addition, a significant portion of the aggregate market value of securities listed on the major securities exchanges in emerging markets is held by a smaller number of investors. This may limit the number of shares available for acquisition or disposition by each Fund.
Each Fund may invest up to 15% of its net assets in illiquid securities, which may include securities with contractual restrictions on resale, securities exempt from registration under Rule 144A promulgated under the Securities Act of 1933, as amended, and other securities
| Notes to financial statements |
| Delaware International Funds |
9. Credit and Market Risks (continued)
which may not be readily marketable. The relative illiquidity of these securities may impair each Fund from disposing of them in a timely manner and at a fair price when it is necessary or desirable to do so. While maintaining oversight, each Board has delegated to DMC the day-to-day functions of determining whether individual securities are liquid for purposes of each Fund’s limitation on investments in illiquid securities. Securities eligible for resale pursuant to Rule 144A, which are determined to be liquid, are not subject to each Fund’s 15% limit on investments in illiquid securities. Rule 144A securities have been identified on the “Schedules of investments.”
10. Contractual Obligations
Each Fund enters into contracts in the normal course of business that contain a variety of indemnifications. Each Fund's maximum exposure under these arrangements is unknown. However, each Fund has not had prior claims or losses pursuant to these contracts. Management has reviewed each Fund's existing contracts and expects the risk of loss to be remote.
11. Subsequent Events
On January 16, 2024, the Board approved the reorganization of the Fund below into and with a substantially similar fund and class of another Delaware Fund (the “Reorganization”) as shown in the table below:
| Acquired Fund | Acquiring Fund |
| Delaware International Equity Fund, a series of the Trust | Delaware Ivy International Core Equity Fund, a series of Ivy Funds |
The Reorganization is subject to the approval of Fund shareholders at a special shareholder meeting anticipated to be held on March 25, 2024.
If the Reorganization is approved by shareholders at that March 25, 2024 special shareholder meeting, the Reorganization is expected to occur on or about April 26, 2024.
Management has determined that no other material events or transactions occurred subsequent to November 30, 2023, that would require recognition or disclosure in the Funds' financial statements.
Report of independent
registered public accounting firm
To the Board of Trustees of Delaware Group® Global & International Funds and Shareholders of Delaware Emerging Markets Fund and Delaware International Equity Fund
Opinions on the Financial Statements
We have audited the accompanying statements of assets and liabilities, including the schedules of investments, of Delaware Emerging Markets Fund and Delaware International Equity Fund (constituting Delaware Group® Global & International Funds, hereafter collectively referred to as the “Funds”) as of November 30, 2023, the related statements of operations for the year ended November 30, 2023, the statements of changes in net assets for each of the two years in the period ended November 30, 2023, including the related notes, and the financial highlights for each of the five years in the period ended November 30, 2023 (collectively referred to as the “financial statements”). In our opinion, the financial statements present fairly, in all material respects, the financial position of the Funds as of November 30, 2023, the results of each of their operations for the year then ended, the changes in each of their net assets for each of the two years in the period ended November 30, 2023 and each of the financial highlights for each of the five years in the period ended November 30, 2023 in conformity with accounting principles generally accepted in the United States of America.
Basis for Opinions
These financial statements are the responsibility of the Funds’ management. Our responsibility is to express an opinion on the Funds’ financial statements based on our audits. We are a public accounting firm registered with the Public Company Accounting Oversight Board (United States) (PCAOB) and are required to be independent with respect to the Funds in accordance with the U.S. federal securities laws and the applicable rules and regulations of the Securities and Exchange Commission and the PCAOB.
We conducted our audits of these financial statements in accordance with the standards of the PCAOB. Those standards require that we plan and perform the audit to obtain reasonable assurance about whether the financial statements are free of material misstatement, whether due to error or fraud.
Our audits included performing procedures to assess the risks of material misstatement of the financial statements, whether due to error or fraud, and performing procedures that respond to those risks. Such procedures included examining, on a test basis, evidence regarding the amounts and disclosures in the financial statements. Our audits also included evaluating the accounting principles used and significant estimates made by management, as well as evaluating the overall presentation of the financial statements. Our procedures included confirmation of securities owned as of November 30, 2023 by correspondence with the custodian, transfer agents and brokers; when replies were not received from brokers, we performed other auditing procedures. We believe that our audits provide a reasonable basis for our opinions.
/s/ PricewaterhouseCoopers LLP
Philadelphia, Pennsylvania
January 23, 2024
We have served as the auditor of one or more Macquarie investment companies since 2010.
| Other Fund information (Unaudited) |
| Delaware International Funds |
Liquidity Risk Management Program
The Securities and Exchange Commission (the “SEC”) has adopted Rule 22e-4 under the Investment Company Act of 1940 (the “Liquidity Rule”), which requires all open-end funds (other than money market funds) to adopt and implement a program reasonably designed to assess and manage the fund’s “liquidity risk,” defined as the risk that the fund could not meet requests to redeem shares issued by the fund without significant dilution of remaining investors’ interests in the fund.
The Funds have adopted and implemented a liquidity risk management program in accordance with the Liquidity Rule (the “Program”). The Board has designated a member of the US Operational Risk Group of Macquarie Asset Management as the Program Administrator for each Fund in the Trust.
As required by the Liquidity Rule, the Program includes policies and procedures that provide for: (1) assessment, management, and review (no less frequently than annually) of each Fund’s liquidity risk; (2) classification of each of the Fund’s portfolio holdings into one of four liquidity categories (Highly Liquid, Moderately Liquid, Less Liquid, and Illiquid); (3) for funds that do not primarily hold assets that are Highly Liquid, establishing and maintaining a minimum percentage of the Fund’s net assets in Highly Liquid investments (called a “Highly Liquid Investment Minimum” or “HLIM”); and (4) prohibiting each Fund’s acquisition of Illiquid investments if, immediately after the acquisition, each Fund would hold more than 15% of its net assets in Illiquid assets. The Program also requires reporting to the SEC (on a non-public basis) and to the Board if each Fund’s holdings of Illiquid assets exceed 15% of the Fund’s net assets. Funds with HLIMs must have procedures for addressing HLIM shortfalls, including reporting to the Board and, with respect to HLIM shortfalls lasting more than seven consecutive calendar days, reporting to the SEC (on a non-public basis).
In assessing and managing each Fund’s liquidity risk, the Program Administrator considers, as relevant, a variety of factors, including: (1) each Fund’s investment strategy and liquidity of portfolio investments during both normal and reasonably foreseeable stressed conditions; (2) short-term and long-term cash flow projections for the Funds during both normal and reasonably foreseeable stressed conditions; and (3) each Fund’s holdings of cash and cash equivalents and any borrowing arrangements. Classification of each Fund’s portfolio holdings in the four liquidity categories is based on the number of days it is reasonably expected to take to convert the investment to cash (for Highly Liquid and Moderately Liquid holdings) or to sell or dispose of the investment (for Less Liquid and Illiquid investments), in current market conditions without significantly changing the investment’s market value. Each Fund primarily holds assets that are classified as Highly Liquid, and therefore is not required to establish an HLIM.
At a meeting of the Board held on May 23-25, 2023, the Program Administrator provided a written report to the Board addressing the Program’s operation and assessing the adequacy and effectiveness of its implementation for the period from April 1, 2022 through March 31, 2023. The report concluded that the Program is appropriately designed and effectively implemented and that it meets the requirements of Rule 22e-4 and each Fund’s liquidity needs. Each Fund’s HLIM is set at an appropriate level and the Funds complied with their HLIM at all times during the reporting period.
Tax Information
The information set forth below is for each Fund’s fiscal year as required by federal income tax laws. Shareholders, however, must report distributions on a calendar year basis for income tax purposes, which may include distributions for portions of two fiscal years of each Fund. Accordingly, the information needed by shareholders for income tax purposes will be sent to them in January of each year. Please consult your tax advisor for proper treatment of this information.
All disclosures are based on financial information available as of the date of this annual report and, accordingly are subject to change. For any and all items requiring reporting, it is the intention of each Fund to report the maximum amount permitted under the Internal Revenue Code and the regulations thereunder.
For the fiscal year ended November 30, 2023, each Fund reports distributions paid during the year as follows:
| | | (A) | |
| | | Ordinary Income | |
| | | Distributions* | |
| | | (Tax Basis) | |
| Delaware Emerging Markets Fund | | | 100.00% | |
| Delaware International Equity Fund | | | 100.00% | |
(A) is based on a percentage of each Fund's total distributions.
*For the fiscal year ended November 30, 2023, certain dividends paid by each Fund may be subject to a maximum tax rate of 20%. The percentage of dividends paid by each Fund from ordinary income reported as qualified dividend income are reported below. Complete information will be computed and reported in conjunction with your 2023 Form 1099-DIV.
| | Delaware Emerging | | | Delaware International | |
| | Markets Fund | | | Equity Fund | |
| | | 100.00% | | | | 100.00% | |
Each Fund intends to pass through foreign tax credits in the maximum amount and the gross foreign source income earned during the fiscal year 2023 by each Fund was as follows:
| | | Delaware Emerging | |
| | | Markets Fund | |
| Foreign Tax Credits | | $ | 12,884,850 | |
| Gross Foreign Source Income Earned | | | 193,959,946 | |
| Other Fund information (Unaudited) |
| Delaware International Funds |
Board Consideration of Investment Management Agreement and Sub-Advisory Agreements at a Meeting Held on August 8-10, 2023
At a meeting held on August 8-10, 2023 (the “Annual Contract Renewal Meeting”), the Board of Trustees (the “Board”), including a majority of Trustees each of whom is not an “interested person” as defined under the Investment Company Act of 1940 (the “Independent Trustees”), approved the renewal of the Delaware Emerging Markets Fund and Delaware International Equity Fund (each, a “Fund” and together, the “Funds”) Investment Management Agreement with Delaware Management Company (“DMC”) and the Sub-Advisory Agreement with Macquarie Investment Management Global Limited (“MIMGL” or the “Affiliated Sub-Adviser”).
Prior to the Annual Contract Renewal Meeting, including at a Board meeting held in May 2023, the Trustees conferred extensively among themselves and with representatives of DMC about these matters. Also, the Board was assisted by the Equity Investments Committee and the Fixed Income Multi-Asset Sub-Advised Funds Investments Committee (each an “Investment Committee” and together, the “Investment Committees”), with each Investment Committee assisting the full Board in reviewing investment performance and other matters throughout the year. The Independent Trustees were also assisted in their evaluation of the Investment Management Agreement and the Sub-Advisory Agreement by independent legal counsel, from whom they received separate legal advice and with whom they met separately.
In providing information to the Board, DMC was guided by a detailed set of requests for information submitted to them by independent legal counsel on behalf of the Independent Trustees at the start of the Board’s annual contract renewal process earlier in 2023. Prior to the Annual Contract Renewal Meeting, and in response to the requests, the Board received and reviewed materials specifically relating to the renewal of the Investment Management Agreement and the Sub-Advisory Agreement. In considering and approving the Investment Management Agreement and the Sub-Advisory Agreement, the Trustees considered the information they believed relevant, including but not limited to the information discussed below. The Board considered not only the specific information presented in connection with the Annual Contract Renewal Meeting and the review process for the Investment Management Agreement and the Sub-Advisory Agreement, but also the knowledge gained over time through interaction with DMC about various topics. In this regard, the Board reviewed reports of DMC at each of its quarterly meetings, which included information about, among other things, Fund performance, investment strategies, and expenses. In addition, the Investment Committees confer with portfolio managers at various times throughout the year. In considering information relating to the approval of the Funds’ Investment Management Agreement and the Sub-Advisory Agreement, the Independent Trustees also received information from an independent fund consultant, JDL Consultants, LLC (“JDL”).
The Board did not identify any particular information or consideration that was all-important or controlling, and each individual Trustee may have attributed different weights to various factors.
After its deliberations, the Board, including the Independent Trustees, unanimously approved the continuation of the Investment Management Agreement and the Sub-Advisory Agreement for a
one-year term. The following summarizes a number of important, but not necessarily all, factors considered by the Board in support of its approval.
Nature, extent, and quality of services. The Board received and considered various information regarding the nature, extent, and quality of the advisory services provided to the Funds by DMC under its Investment Management Agreement and the experience of the officers and employees of DMC who provide these services, including each Fund’s portfolio managers. The Board’s review included consideration of DMC’s investment process and oversight and research and analysis capabilities, and its ability to attract and retain skilled investment professionals. The Board also considered information regarding DMC’s programs for risk management, including investment, operational, liquidity, derivatives (as applicable), valuation, and compliance risks. The Board received information with respect to the cybersecurity program and business continuity plans of DMC and its affiliates.
In addition, the Board considered certain non-advisory services that DMC and its affiliates provide to the Delaware Funds by Macquarie complex (the “Delaware Funds”). Among other things, these services include third party service provider oversight, transfer agency, internal audit, valuation, portfolio trading, and legal and compliance functions. The Board noted DMC’s responsibility for overseeing the preparation of the Delaware Funds’ registration statement and supplements thereto and shareholder reports; responsibility for periodic filings with regulators; organizing Board meetings and preparing materials for such Board meetings; and furnishing analytical and other support to assist the Board. The Board took into account the benefits to shareholders of investing in a Fund that is part of a family of funds managed by an affiliate of Macquarie Group Ltd. (“Macquarie”), the parent company of DMC, and the resources available to DMC as part of Macquarie’s global asset management business.
The Board received and considered various information with respect to the services provided by the Affiliated Sub-Adviser under the Sub-Advisory Agreement and the credentials and experience of the officers and employees of the Affiliated Sub-Adviser who provide these services. The Board considered the division of responsibilities between DMC and the Affiliated Sub-Adviser and the oversight provided by DMC. The Board also considered the expertise of the Affiliated Sub-Adviser with respect to certain asset classes and/or investment styles. The Board noted that the Affiliated Sub-Adviser is part of Macquarie’s global investment platform that has offices and personnel that are located around the world. The Affiliated Sub-Adviser provides research, investment and trading analysis on the markets and economies of various countries in which the Funds may invest, makes recommendations regarding securities, provides portfolio management services and assists with security trades, as applicable. The Board took into account that the Sub-Advisory Agreement may benefit the Funds and their shareholders by permitting DMC to use the resources and talents of the Affiliated Sub-Adviser in managing the Funds.
The Board also received and considered information about the nature and extent of services offered and fee rates charged by DMC to other types of clients with investment strategies similar to those of the Funds. In this regard, the Board received information about the significantly greater scope of services, and compliance, reporting and other legal and regulatory obligations and risks of managing registered investment companies compared with those associated with
| Other Fund information (Unaudited) |
| Delaware International Funds |
Board Consideration of Investment Management Agreement and Sub-Advisory Agreements at a Meeting Held on August 8-10, 2023 (continued)
managing assets of other types of clients, including third-party sub-advised fund clients, unregistered funds and separately managed accounts.
The Board concluded that, overall, it was satisfied with the nature, extent and quality of services provided (and expected to be provided) to the Funds by DMC and the Affiliated Sub-Adviser.
Investment performance. The Board received and considered information with respect to the investment performance of the Funds, including performance reports and discussions with portfolio managers at meetings of the Board’s Investment Committees throughout the year as well as reports provided by Broadridge Financial Solutions, Inc., an independent investment company data provider (“Broadridge”), furnished for the Annual Contract Renewal Meeting. The Broadridge reports prepared for each Fund’s institutional share class showed its investment performance in comparison to the institutional share class of a group of similar funds (the “Performance Universe”). The Board received a description of the methodology used by Broadridge to select the peer funds in the Performance Universe. Comparative annualized performance for each Fund was shown for the past 1-, 3-, 5-, and 10-year or since inception periods, as applicable, ended December 31, 2022.
Delaware Emerging Markets Fund. The Performance Universe for the Fund consisted of the Fund and all retail and institutional emerging markets funds, regardless of asset size or primary channel of distribution. The Board noted that the Broadridge report comparison showed that the Fund’s total return for the 1-year period was in the fourth quartile of its Performance Universe, for the 3- and 5-year periods was in the third quartile of its Performance Universe, and for the 10-year period was in the first quartile of its Performance Universe. The Broadridge report comparison showed that the Fund’s total return for the 1-, 3-, and 5-year periods was below the median of its Performance Universe and for the 10-year period was above the median of its Performance Universe. The Board also noted that the Fund underperformed its benchmark index for the 1-, 3-, and 5-year periods and outperformed its benchmark index for the 10-year period. The Board noted the explanations from DMC concerning the reasons for the Fund’s relative performance versus its Performance Universe and benchmark index for the various periods.
Delaware International Equity Fund. The Performance Universe for the Fund consisted of the Fund and all retail and institutional international multi-cap core funds, regardless of asset size or primary channel of distribution. The Board noted that the Broadridge report comparison showed that the Fund’s total return for the 1-, 3-, 5-, and 10-year periods was in the fourth quartile of its Performance Universe. The Broadridge report comparison showed that the Fund’s total return for 1-, 3-, 5-, and 10-year periods was below the median of its Performance Universe. The Board also noted that the Fund underperformed its benchmark index (gross and net of dividends) for the 1-, 3-, 5-, and 10-year periods. The Board, however, noted that the investment performance of the current portfolio management team only began as of March 2019 and the Fund’s other portfolio manager only began as of May 2020. The Board noted the explanations from DMC and from the Affiliated Sub-Adviser concerning the reasons for the Fund’s relative performance
versus its Performance Universe and benchmark index for the various periods. The Board also noted that the portfolio management team would change effective August 31, 2023.
Comparative expenses. The Board received and considered expense data for the Funds. DMC provided the Board with information on pricing levels and fee structures for each Fund as of its most recently completed fiscal year. The Broadridge total expenses, for comparative consistency, were shown by Broadridge for Institutional Class shares and comparative total expenses including 12b-1 and non-12b-1 service fees. The Board also considered the comparative analysis of contractual management fees and actual total expense ratios of each Fund versus contractual management fees and actual total expense ratios of a group of peer funds as selected by Broadridge (the “Expense Group”). In reviewing comparative costs, each Fund’s contractual management fee and the actual management fee incurred by each Fund were compared with the contractual management fees (assuming all funds in the Expense Group were similar in size to each Fund) and actual management fees, taking into account any applicable breakpoints and fee waivers, with a Fund’s expense universe, which is comprised of the Fund, its Expense Group and all other similar institutional funds, excluding outliers (the “Expense Universe”). Each Fund’s total expenses were also compared with those of its Expense Universe. The Board also received and considered information regarding the Fund’s net operating expense ratios and their various components, including actual management fees, custodian and other non-management fees, and Rule 12b-1 and non-Rule 12b-1 shareholder service fees.
Delaware Emerging Markets Fund. The expense comparisons for the Fund showed that its actual management fee was above the median of its Expense Universe and its actual total expenses were above its Expense Group average. It was noted that consistent with DMC’s waiver methodology, its advisory fee waivers, if any, were at the fund level and not class level.
Delaware International Equity Fund. The expense comparisons for the Fund showed that its actual management fee was below the median of its Expense Universe and its actual total expenses were above its Expense Group average. It was noted that consistent with DMC’s waiver methodology, its advisory fee waivers, if any, were at the fund level and not class level.
The Board noted that DMC, and not the Funds, pays the sub-advisory fees to the Affiliated Sub-Adviser and, accordingly, that the retention of the Affiliated Sub-Adviser does not increase the fees and expenses incurred by the Funds.
Based on its consideration of the factors and information it deemed relevant, including those described here, the Board determined that the compensation payable to DMC under the Investment Management Agreement and to the Affiliated Sub-Adviser under the Sub-Advisory Agreement was reasonable.
Economies of scale. The Board received and considered information about the potential for DMC to realize economies of scale in the provision of management services to the Funds, the difficulties of calculating economies of scale at an individual Fund level, and the extent to which potential scale benefits are shared with shareholders, including the extent to which any economies of scale are reflected in the level of management fees charged. DMC discussed its advisory fee pricing and structure for the Delaware Funds, including the current breakpoints. The Board noted that, as of March 31, 2023, Delaware Emerging Markets Fund’s net assets
| Other Fund information (Unaudited) |
| Delaware International Funds |
Board Consideration of Investment Management Agreement and Sub-Advisory Agreements at a Meeting Held on August 8-10, 2023 (continued)
exceeded its third breakpoint level and that breakpoints result in a lower advisory fee than would otherwise be the case in the absence of breakpoints, when the asset levels specified in the breakpoints schedule are exceeded. The Board noted that each Fund may also benefit from economies of scale through initial fee setting, fee waivers and expense reimbursements, as well as DMC’s investment in its business, including investments in business infrastructure, technology and cybersecurity.
Management profitability. The Board received and considered the Investment Management Profitability Analysis that addressed the overall profitability of DMC’s business in providing management and other services to each Fund and the Delaware Funds as a whole, including the methodology used by DMC in allocating costs for the purpose of determining profitability. The Board noted DMC’s changes to its cost allocation methodology for its profitability analysis and the explanations for such changes. The Board also reviewed a report prepared by JDL regarding DMC’s profitability as compared to certain peer fund complexes and the Independent Trustees discussed DMC’s profitability in such context with representatives from JDL. The Board recognized that calculating and comparing profitability at the individual fund level is difficult; that DMC’s profit, if any, can vary significantly depending on the particular fund; and that DMC’s support for, and commitment to, a fund are not solely dependent on the profits realized as to that fund.
The Board also received and considered information about the portion of the total management fee that was retained by DMC after payment of the fee to the Affiliated Sub-Adviser for sub-advisory services. In assessing the reasonableness of this amount, the Board received and evaluated information about the nature and extent of the responsibilities retained and risk assumed by DMC and not delegated to or assumed by the Affiliated Sub-Adviser. Given the affiliation between DMC and the Affiliated Sub-Adviser, the Board ascribed limited relevance to the allocation of fees between them.
Based on its review, the Board determined that DMC’s profitability was not excessive in light of the nature, extent and quality of the services provided to each Fund.
Ancillary benefits. The Board received and considered information regarding the extent to which DMC and its affiliates might derive ancillary benefits from fund operations, including the potential for procuring additional business as a result of the prestige and visibility associated with its role as investment manager to the Delaware Funds; the benefits from allocation of fund brokerage to improve trading efficiencies; the portfolio transactions executed through “soft dollar” arrangements; and the fees that various affiliates received for serving as transfer agent and for overseeing fund accounting and financial administration services to the Delaware Funds. The Board considered that it receives periodic reports from DMC that include a representation that any soft dollar arrangements are consistent with regulatory requirements. The Board received information from DMC regarding its view of the performance of its affiliates in providing transfer agent and fund accounting and financial administration oversight services and the organizational structure employed to provide these services pursuant to their contracts with the Funds.
Based on its consideration of the factors and information it deemed relevant, including the costs of providing investment management and other services to the Funds and the ongoing commitment of DMC and its affiliates to the Funds, the Board did not find that any ancillary benefits received by DMC and its affiliates, including the Affiliated Sub-Adviser, were unreasonable.
Conclusion. Based on its review, consideration and evaluation of all factors it believed relevant, including the above-described factors and conclusions, the Board, including all of the Independent Trustees, approved the continuation of DMC’s Investment Management Agreement and of the Affiliated Sub-Adviser’s Sub-Advisory Agreement for an additional one-year period.
Form N-PORT and proxy voting information
Each Fund files its complete schedule of portfolio holdings with the Securities and Exchange Commission (SEC) for the first and third quarters of each fiscal year on Forms N-PORT. Each Fund’s Forms N-PORT, as well as a description of the policies and procedures that the Funds use to determine how to vote proxies (if any) relating to portfolio securities, are available without charge (i) upon request, by calling 800 523-1918; and (ii) on the SEC’s website at sec.gov. In addition, a description of the policies and procedures that the Funds use to determine how to vote proxies (if any) relating to portfolio securities and the Schedule of Investments included in the Funds' most recent Form N-PORT are available without charge on the Funds' website at delawarefunds.com/literature.
Information (if any) regarding how the Funds voted proxies relating to portfolio securities during the most recently disclosed 12-month period ended June 30 is available without charge (i) through the Funds' website at delawarefunds.com/proxy; and (ii) on the SEC’s website at sec.gov.
| Board of trustees and officers addendum |
| Delaware Funds by Macquarie® |
A mutual fund is governed by a Board of Trustees (“Trustees”), which has oversight responsibility for the management of a fund’s business affairs. Trustees establish procedures and oversee and review the performance of the investment manager, the distributor, and others who perform services for the fund. The independent fund trustees, in particular, are advocates for shareholder interests. Each trustee has served in that capacity since he or she was elected to or appointed to the Board of Trustees, and will continue to serve until his or her retirement or the election of a new trustee in his or her place. The following is a list of the Trustees and Officers with certain background and related information.
| | | | | | Other |
| | | | Number of | Principal | Directorships |
| Name, | Position(s) | | Funds in Fund | Occupation(s) | Held by Trustee |
| Address, | Held with | Length of Time | Complex Overseen | During the | During the |
| and Birth Year | the Trust | Served1 | by Trustee | Past Five Years | Past Five Years |
| Interested Trustee | | | | |
| |
Shawn K. Lytle2
100 Independence
610 Market Street
Philadelphia, PA
19106-2354
1970 | President, Chief Executive Officer, and Trustee | President and Chief Executive Officer since August 2015 Trustee since September 2015 | 105 | Macquarie Asset Management3
(2015–Present)
-Head of Equities & Multi-Asset
(2023–Present)
-Head of Americas of Macquarie Group
(2017–Present)
-Global Head of Public Investments
(2019–2023) | None |
| | | | | | Other |
| | | | Number of | Principal | Directorships |
| Name, | Position(s) | | Funds in Fund | Occupation(s) | Held by Trustee |
| Address, | Held with | Length of Time | Complex Overseen | During the | During the |
| and Birth Year | the Trust | Served1 | by Trustee | Past Five Years | Past Five Years |
| Independent Trustees | | | | | |
| |
Jerome D.
Abernathy
100 Independence
610 Market Street
Philadelphia, PA
19106-2354
1959 | Trustee | Since January 2019 | 105 | Stonebrook Capital Management, LLC (financial technology: macro factors and databases) -Managing Member
(1993-Present) | None |
| |
Ann D. Borowiec
100 Independence
610 Market Street
Philadelphia, PA
19106-2354
1958 | Trustee | Since March 2015 | 105 | J.P. Morgan Chase & Co.
(1987-2013)
-Chief Executive Officer, Private Wealth Management
(2011–2013) | Banco Santander International
(2016–2019) Santander Bank, N.A.
(2016-2019) |
| Board of trustees and officers addendum |
| Delaware Funds by Macquarie® |
| | | | | | Other |
| | | | Number of | Principal | Directorships |
| Name, | Position(s) | | Funds in Fund | Occupation(s) | Held by Trustee |
| Address, | Held with | Length of Time | Complex Overseen | During the | During the |
| and Birth Year | the Trust | Served1 | by Trustee | Past Five Years | Past Five Years |
| |
Joseph W. Chow
100 Independence
610 Market Street
Philadelphia, PA
19106-2354
1953 | Trustee | Since January 2013 | 105 | Private Investor
(2011–Present)
State Street Bank and Trust Company
(1996-2011)
-Executive Vice President of Enterprise Risk Management and Emerging Economies Strategy; and Chief Risk and Corporate Administration Officer | None |
| |
H. Jeffrey Dobbs
100 Independence
610 Market Street
Philadelphia, PA
19106-2354
1955 | Trustee | Since April 20194 | 105 | KPMG LLP
(2002-2015)
-Global Sector Chairman, Industrial Manufacturing
(2010-2015) | TechAccel LLC
(2015–Present)
PatientsVoices, Inc.
(2018–Present)
Valparaiso University Board
(2012-Present)
Ivy Funds Complex (2019-2021) |
| | | | | | Other |
| | | | Number of | Principal | Directorships |
| Name, | Position(s) | | Funds in Fund | Occupation(s) | Held by Trustee |
| Address, | Held with | Length of Time | Complex Overseen | During the | During the |
| and Birth Year | the Trust | Served1 | by Trustee | Past Five Years | Past Five Years |
| | | | | | |
John A. Fry
100 Independence
610 Market Street
Philadelphia, PA
19106-2354
1960 | Trustee | Since January 2001 | 105 | Drexel University -President
(2010–Present) | Federal Reserve Bank of Philadelphia
(2020–Present) Kresge Foundation
(2018-Present) FS Credit Real Estate Income Trust, Inc. (2018–Present) vTv Therapeutics Inc.
(2017–Present) Community Health Systems
(2004–Present) Drexel Morgan & Co. (2015–2019) |
| Board of trustees and officers addendum |
| Delaware Funds by Macquarie® |
| | | | | | Other |
| | | | Number of | Principal | Directorships |
| Name, | Position(s) | | Funds in Fund | Occupation(s) | Held by Trustee |
| Address, | Held with | Length of Time | Complex Overseen | During the | During the |
| and Birth Year | the Trust | Served1 | by Trustee | Past Five Years | Past Five Years |
| | | | | | |
Joseph Harroz, Jr.
100 Independence
610 Market Street
Philadelphia, PA
19106-2354
1967 | Trustee | Since November 19984 | 105 | University of Oklahoma -President
(2020–Present) -Interim President
(2019–2020)
-Vice President and Dean, College of Law
(2010–2019)
Brookhaven Investments LLC (commercial enterprises) -Managing Member
(2019–Present)
St. Clair, LLC (commercial enterprises) -Managing Member
(2019–Present) | OU Medicine, Inc.
(2020–Present)
Big 12 Athletic Conference
(2019-Present) Valliance Bank
(2007–Present)
Ivy Funds Complex (1998-2021) |
| | | | | | Other |
| | | | Number of | Principal | Directorships |
| Name, | Position(s) | | Funds in Fund | Occupation(s) | Held by Trustee |
| Address, | Held with | Length of Time | Complex Overseen | During the | During the |
| and Birth Year | the Trust | Served1 | by Trustee | Past Five Years | Past Five Years |
| | | | | | |
Sandra A.J.
Lawrence
100 Independence
610 Market Street
Philadelphia, PA
19106-2354
1957 | Trustee | Since April 20194 | 105 | Children’s Mercy Hospitals and Clinics
(2005–2019)
-Chief Administrative Officer
(2016–2019) | Brixmor Property Group Inc.
(2021-Present)
Sera Prognostics Inc. (biotechnology)
(2021-Present)
Recology (resource recovery) (2021-2023) Evergy, Inc., Kansas City Power & Light Company, KCP&L Greater Missouri Operations Company, Westar Energy, Inc. and Kansas Gas and Electric Company (related utility companies) (2018-Present) National Association of Corporate Directors (2017-Present) American Shared Hospital Services (medical device)
(2017-2021) Ivy Funds Complex (2019-2021) |
| Board of trustees and officers addendum |
| Delaware Funds by Macquarie® |
| | | | | | Other |
| | | | Number of | Principal | Directorships |
| Name, | Position(s) | | Funds in Fund | Occupation(s) | Held by Trustee |
| Address, | Held with | Length of Time | Complex Overseen | During the | During the |
| and Birth Year | the Trust | Served1 | by Trustee | Past Five Years | Past Five Years |
| | | | | | |
Frances A.
Sevilla-Sacasa
100 Independence
610 Market Street
Philadelphia, PA
19106-2354
1956 | Trustee | Since September 2011 | 105 | Banco Itaú International -Chief Executive Officer
(2012–2016)
US Trust Bank of America Private Wealth Management -President (2007-2008) U.S. Trust Corp. -President & CEO
(2005-2007) | Invitation Homes Inc.
(2023-Present)
Florida Chapter of National Association of Corporate Directors (2021-Present) Callon Petroleum Company
(2019-Present)
Camden Property Trust (2011-Present) New Senior Investment Group Inc. (REIT) (2021) Carrizo Oil & Gas, Inc.
(2018-2019) |
| | | | | | |
Thomas K. Whitford
100 Independence
610 Market Street
Philadelphia, PA
19106-2354
1956 | Chair and Trustee | Trustee since January 2013 Chair since January 2023 | 105 | PNC Financial Services Group (1983–2013)
-Vice Chairman
(2009-2013) | HSBC USA Inc.
(2014–2022)
HSBC North America Holdings Inc.
(2013–2022) |
| | | | | | Other |
| | | | Number of | Principal | Directorships |
| Name, | Position(s) | | Funds in Fund | Occupation(s) | Held by Trustee |
| Address, | Held with | Length of Time | Complex Overseen | During the | During the |
| and Birth Year | the Trust | Served1 | by Trustee | Past Five Years | Past Five Years |
| | | | | | |
Christianna Wood
100 Independence
610 Market Street
Philadelphia, PA
19106-2354
1959 | Trustee | Since January 2019 | 105 | Gore Creek Capital, Ltd. -Chief Executive Officer and President
(2009–Present) Capital Z Asset Management -Chief Executive Officer
(2008-2009) California Public Employees' Retirement System (CalPERS) -Senior Investment Officer of Global Equity
(2002-2008) | The Merger Fund (2013–2021), The Merger Fund VL (2013–2021), WCM Alternatives: Event-Driven Fund (2013–2021), and WCM Alternatives: Credit Event Fund (2017–2021) Grange Insurance (2013–Present) H&R Block Corporation (2008–2022) |
| Officers | | | | | |
David F. Connor
100 Independence
610 Market Street
Philadelphia, PA
19106-2354
1963 | Senior Vice President, General Counsel, and Secretary | Senior Vice President,
since May 2013; General Counsel since May 2015; Secretary since October 2005 | 105 | David F. Connor has served in various capacities at different times at Macquarie Asset Management. | None5 |
| Board of trustees and officers addendum |
| Delaware Funds by Macquarie® |
| | | | | | Other |
| | | | Number of | Principal | Directorships |
| Name, | Position(s) | | Funds in Fund | Occupation(s) | Held by Trustee |
| Address, | Held with | Length of Time | Complex Overseen | During the | During the |
| and Birth Year | the Trust | Served1 | by Trustee | Past Five Years | Past Five Years |
| | | | | | |
Daniel V. Geatens
100 Independence
610 Market Street
Philadelphia, PA
19106-2354
1972 | Senior Vice President and Treasurer | Senior Vice President and Treasurer since October 2007 | 105 | Daniel V. Geatens has served in various capacities at different times at Macquarie Asset Management. | None5 |
| |
Richard Salus
100 Independence
610 Market Street
Philadelphia, PA
19106-2354
1963 | Senior Vice President and Chief Financial Officer | Senior Vice President and Chief Financial Officer since November 2006 | 105 | Richard Salus has served in various capacities at different times at Macquarie Asset Management. | None5 |
1 “Length of Time Served” refers to the time since the Trustee or officer began serving one or more of the Trusts in the Delaware Funds complex.
2 Shawn K. Lytle is considered to be an “Interested Trustee” because he is an executive officer of the Funds' investment advisor.
3 Macquarie Asset Management is the marketing name for certain companies comprising the asset management division of Macquarie Group, including the Funds' investment advisor, principal underwriter, and transfer agent.
4 Includes time served on the Board of the Ivy Funds complex prior to the date when the Ivy Funds joined the Delaware Funds complex.
5 David F. Connor and Daniel V. Geatens serve in similar capacities for the six portfolios of the Optimum Fund Trust, which have the same investment manager, principal underwriter, and transfer agent as the Funds. Mr. Connor also serves as Senior Vice President and Assistant Secretary for the three portfolios of the Macquarie ETF Trust, which have the same investment manager as the Funds. Mr. Geatens also serves as the Chief Financial Officer of the Optimum Fund Trust and as Senior Vice President and Treasurer for the Macquarie ETF Trust. Mr. Salus serves in a similar capacity for the Macquarie ETF Trust.
The Statement of Additional Information for the Fund(s) includes additional information about the Trustees and Officers and is available, without charge, upon request by calling 800 523-1918.
Item 2. Code of Ethics
The registrant has adopted a code of ethics that applies to the registrant’s principal executive officer, principal financial officer, principal accounting officer or controller, or persons performing similar functions, regardless of whether these individuals are employed by the registrant or a third party. A copy of the registrant’s Code of Business Ethics has been posted on the Delaware Funds by Macquarie® Internet Web site at www.delawarefunds.com. Any amendments to the Code of Business Ethics, and information on any waiver from its provisions granted by the registrant, will also be posted on this Web site within five business days of such amendment or waiver and will remain on the Web site for at least 12 months.
Item 3. Audit Committee Financial Expert
The registrant’s Board of Trustees has determined that certain members of the registrant’s Audit Committee are audit committee financial experts, as defined below. For purposes of this item, an “audit committee financial expert” is a person who has the following attributes:
a. An understanding of generally accepted accounting principles and financial statements;
b. The ability to assess the general application of such principles in connection with the accounting for estimates, accruals, and reserves;
c. Experience preparing, auditing, analyzing, or evaluating financial statements that present a breadth and level of complexity of accounting issues that are generally comparable to the breadth and complexity of issues that can reasonably be expected to be raised by the registrant’s financial statements, or experience actively supervising one or more persons engaged in such activities;
d. An understanding of internal controls and procedures for financial reporting; and
e. An understanding of audit committee functions.
An “audit committee financial expert” shall have acquired such attributes through:
a. Education and experience as a principal financial officer, principal accounting officer, controller, public accountant, or auditor or experience in one or more positions that involve the performance of similar functions;
b. Experience actively supervising a principal financial officer, principal accounting officer, controller, public accountant, auditor, or person performing similar functions;
c. Experience overseeing or assessing the performance of companies or public accountants with respect to the preparation, auditing, or evaluation of financial statements; or
d. Other relevant experience.
The registrant’s Board of Trustees has also determined that each member of the registrant’s Audit Committee is independent. In order to be “independent” for purposes of this item, the Audit Committee member may not: (i) other than in his or her capacity as a member of the Board of Trustees or any committee thereof, accept directly or indirectly any consulting,
advisory or other compensatory fee from the issuer; or (ii) be an “interested person” of the registrant as defined in Section 2(a)(19) of the Investment Company Act of 1940.
The names of the audit committee financial experts on the registrant’s Audit Committee are set forth below:
H. Jeffrey Dobbs
Frances Sevilla-Sacasa, Chair
Item 4. Principal Accountant Fees and Services
(a) Audit fees.
The aggregate fees billed for services provided to the registrant by its independent auditors for the audit of the registrant’s annual financial statements and for services normally provided by the independent auditors in connection with statutory and regulatory filings or engagements were $61,725 for the fiscal year ended November 30, 2023.
The aggregate fees billed for services provided to the registrant by its independent auditors for the audit of the registrant’s annual financial statements and for services normally provided by the independent auditors in connection with statutory and regulatory filings or engagements were $92,587 for the fiscal year ended November 30, 2022.
(b) Audit-related fees.
The aggregate fees billed by the registrant’s independent auditors for services relating to the performance of the audit of the registrant’s financial statements and not reported under paragraph (a) of this Item were $0 for the fiscal year ended November 30, 2023.
The aggregate fees billed by the registrant’s independent auditors for services relating to the performance of the audit of the financial statements of the registrant’s investment adviser and other service providers under common control with the adviser and that relate directly to the operations or financial reporting of the registrant were $1,362,878 for the registrant’s fiscal year ended November 30, 2023. The percentage of these fees relating to services approved by the registrant’s Audit Committee pursuant to the de minimis exception from the pre-approval requirement in Rule 2-01(c)(7)(i)(C) of Regulation S-X was 0%. These audit-related services were as follows: year-end audit procedures; group reporting and subsidiary statutory audits.
The aggregate fees billed by the registrant’s independent auditors for services relating to the performance of the audit of the registrant’s financial statements and not reported under paragraph (a) of this Item were $0 for the fiscal year ended November 30, 2022.
The aggregate fees billed by the registrant’s independent auditors for services relating to the performance of the audit of the financial statements of the registrant’s investment adviser and other service providers under common control with the adviser and that relate directly to the operations or financial reporting of the registrant were $2,050,189 for the registrant’s fiscal year ended November 30, 2022. The percentage of these fees relating to services approved by the registrant’s Audit Committee pursuant to the de minimis exception from the pre-approval requirement in Rule 2-01(c)(7)(i)(C) of Regulation S-X was 0%. These audit-related services were as follows: year-end audit procedures; group reporting and subsidiary statutory audits.
(c) Tax fees.
The aggregate fees billed by the registrant’s independent auditors for tax-related services provided to the registrant were $19,095 for the fiscal year ended November 30, 2023. The percentage of these fees relating to services approved by the registrant’s Audit Committee pursuant to the de minimis exception from the pre-approval requirement in Rule 2-01(c)(7)(i)(C) of Regulation S-X was 0%. These tax-related services were as follows: review of income tax returns and review of annual excise distribution calculations.
The aggregate fees billed by the registrant’s independent auditors for tax-related services provided to the registrant’s investment adviser and other service providers under common control with the adviser and that relate directly to the operations or financial reporting of the registrant were $0 for the registrant’s fiscal year ended November 30, 2023.
The aggregate fees billed by the registrant’s independent auditors for tax-related services provided to the registrant were $19,095 for the fiscal year ended November 30, 2022. The percentage of these fees relating to services approved by the registrant’s Audit Committee pursuant to the de minimis exception from the pre-approval requirement in Rule 2-01(c)(7)(i)(C) of Regulation S-X was 0%. These tax-related services were as follows: review of income tax returns and review of annual excise distribution calculations.
The aggregate fees billed by the registrant’s independent auditors for tax-related services provided to the registrant’s investment adviser and other service providers under common control with the adviser and that relate directly to the operations or financial reporting of the registrant were $0 for the registrant’s fiscal year ended November 30, 2022.
(d) All other fees.
The aggregate fees billed for all services provided by the independent auditors to the registrant other than those set forth in paragraphs (a), (b) and (c) of this Item were $7,250 for the fiscal year ended November 30, 2023.
The aggregate fees billed for all services other than those set forth in paragraphs (b) and (c) of this Item provided by the registrant’s independent auditors to the registrant’s adviser and other service providers under common control with the adviser and that relate directly to the operations or financial reporting of the registrant were $0 for the registrant’s fiscal year ended November 30, 2023. The percentage of these fees relating to services approved by the registrant’s Audit Committee pursuant to the de minimis exception from the pre-approval requirement in Rule 2-01(c)(7)(i)(C) of Regulation S-X was 100%.
The aggregate fees billed for all services provided by the independent auditors to the registrant other than those set forth in paragraphs (a), (b) and (c) of this Item were $0 for the fiscal year ended November 30, 2022.
The aggregate fees billed for all services other than those set forth in paragraphs (b) and (c) of this Item provided by the registrant’s independent auditors to the registrant’s adviser and other service providers under common control with the adviser and that relate directly to the operations or financial reporting of the registrant were $0 for the registrant’s fiscal year ended November 30, 2022. The percentage of these fees relating to services approved by the registrant’s Audit Committee pursuant to the de minimis exception from the pre-approval requirement in Rule 2-01(c)(7)(i)(C) of Regulation S-X was 0%.
(e) The registrant’s Audit Committee has established pre-approval policies and procedures as permitted by Rule 2-01(c)(7)(i)(B) of Regulation S-X (the “Pre-Approval Policy”) with respect to services provided by the registrant’s independent auditors. Pursuant to the Pre-Approval Policy, the Audit Committee has pre-approved the services set forth in the table below with respect to the registrant up to the specified fee limits. Certain fee limits are based on aggregate fees to the registrant and other registrants within the Delaware Funds by Macquarie®.
| Service | Range of Fees |
| Audit Services | |
| Statutory audits or financial audits for new Funds | up to $50,000 per Fund |
| Services associated with SEC registration statements (e.g., Form N-1A, Form N-14, etc.), periodic reports and other documents filed with the SEC or other documents issued in connection with securities offerings (e.g., comfort letters for closed-end Fund offerings, consents), and assistance in responding to SEC comment letters | up to $10,000 per Fund |
| Consultations by Fund management as to the accounting or disclosure treatment of transactions or events and/or the actual or potential impact of final or proposed rules, standards or interpretations by the SEC, FASB, or other regulatory or standard-setting bodies (Note: Under SEC rules, some consultations may be considered “audit-related services” rather than “audit services”) | up to $25,000 in the aggregate |
| Audit-Related Services | |
| Consultations by Fund management as to the accounting or disclosure treatment of transactions or events and /or the actual or potential impact of final or proposed rules, standards or interpretations by the SEC, FASB, or other regulatory or standard-setting bodies (Note: Under SEC rules, some consultations may be considered “audit services” rather than “audit-related services”) | up to $25,000 in the aggregate |
| Tax Services | |
| U.S. federal, state and local and international tax planning and advice (e.g., consulting on statutory, regulatory or administrative developments, evaluation of Funds’ tax compliance function, etc.) | up to $25,000 in the aggregate |
| U.S. federal, state and local tax compliance (e.g., excise distribution reviews, etc.) | up to $5,000 per Fund |
| Review of federal, state, local and international income, franchise and other tax returns | up to $5,000 per Fund |
Under the Pre-Approval Policy, the Audit Committee has also pre-approved the services set forth in the table below with respect to the registrant’s investment adviser and other entities controlling, controlled by or under common control with the investment adviser that provide ongoing services to the registrant (the “Control Affiliates”) up to the specified fee limit. This fee limit is based on aggregate fees to the investment adviser and its Control Affiliates.
| Service | Range of Fees |
| Non-Audit Services | |
| Services associated with periodic reports and other documents filed with the SEC and assistance in responding to SEC comment letters | up to $10,000 in the aggregate |
The Pre-Approval Policy requires the registrant’s independent auditors to report to the Audit Committee at each of its regular meetings regarding all services initiated since the last such report was rendered, including those services authorized by the Pre-Approval Policy.
(f) Not applicable.
(g) The aggregate non-audit fees billed by the registrant’s independent auditors for services rendered to the registrant and to its investment adviser and other service providers under common control with the adviser were $24,428,000 and $9,044,000 for the registrant’s fiscal years ended November 30, 2023 and November 30, 2022, respectively.
(h) In connection with its selection of the independent auditors, the registrant’s Audit Committee has considered the independent auditors’ provision of non-audit services to the registrant’s investment adviser and other service providers under common control with the adviser that were not required to be pre-approved pursuant to Rule 2-01(c)(7)(ii) of Regulation S-X. The Audit Committee has determined that the independent auditors’ provision of these services is compatible with maintaining the auditors’ independence.
(i) Not applicable.
(j) Not applicable.
Item 5. Audit Committee of Listed Registrants
Not applicable.
Item 6. Investments
(a) Included as part of report to shareholders filed under Item 1 of this Form N-CSR.
(b) Divestment of securities in accordance with Section 13(c) of the Investment Company Act of 1940.
Not applicable.
Item 7. Disclosure of Proxy Voting Policies and Procedures for Closed-End Management Investment Companies
Not applicable.
Item 8. Portfolio Managers of Closed-End Management Investment Companies
Not applicable.
Item 9. Purchases of Equity Securities by Closed-End Management Investment Companies and Affiliated Purchasers
Not applicable.
Item 10. Submission of Matters to a Vote of Security Holders
Not applicable.
Item 11. Controls and Procedures
The registrant’s principal executive officer and principal financial officers, or persons performing similar functions, have concluded that the registrant’s disclosure controls and procedures (as defined in Rule 30a-3(c) under the Investment Company Act of 1940, as amended (17 CFR 270.30a-3(c))) are effective, as of a date within 90 days of the filing of this report, based on their evaluation of these controls and procedures required by Rule 30a-3(b) under the Investment Company Act of 1940 (17 CFR 270.30a-3(b)) and Rules 13a-15(b) or 15d-15(b) under the Securities Exchange Act of 1934, as amended (17 CFR 240.13a-15(b) or 240.15d-15(b)) and provide reasonable assurance that the information required to be disclosed by the registrant in its reports or statements filed under the Securities Exchange Act of 1934 is recorded, processed, summarized and reported within the time periods specified in the rules and forms of the Securities and Exchange Commission.
There were no significant changes in the registrant’s internal control over financial reporting (as defined in Rule 30a-3(d) under the Investment Company Act of 1940 (17 CFR 270.30a-3(d)) that occurred during the period covered by the report to stockholders included herein that have materially affected, or are reasonably likely to materially affect, the registrant’s internal control over financial reporting.
Item 12. Disclosure of Securities Lending Activities for Closed-End Management Investment Companies
Not applicable.
Item 13. Recovery of Erroneously Awarded Compensation
Not applicable.
Item 14. Exhibits
Not applicable.
(2) Certifications of Principal Executive Officer and Principal Financial Officer pursuant to Rule 30a-2 under the Investment Company Act of 1940 are attached hereto as Exhibit 99.CERT.
(3) Written solicitations to purchase securities pursuant to Rule 23c-1 under the Securities Exchange Act of 1934.
Not applicable.
SIGNATURES
Pursuant to the requirements of the Securities Exchange Act of 1934 and the Investment Company Act of 1940, the registrant has duly caused this report to be signed on its behalf, by the undersigned, thereunto duly authorized.
DELAWARE GROUP® GLOBAL & INTERNATIONAL FUNDS
| /s/SHAWN K. LYTLE | |
| By: | Shawn K. Lytle | |
| Title: | President and Chief Executive Officer |
| Date: | February 2, 2024 | |
Pursuant to the requirements of the Securities Exchange Act of 1934 and the Investment Company Act of 1940, this report has been signed below by the following persons on behalf of the registrant and in the capacities and on the dates indicated.
| /s/SHAWN K. LYTLE | |
| By: | Shawn K. Lytle | |
| Title: | President and Chief Executive Officer |
| Date: | February 2, 2024 | |
| | | |
| /s/RICHARD SALUS | |
| By: | Richard Salus | |
| Title: | Chief Financial Officer | |
| Date: | February 2, 2024 | |