UNITED STATES SECURITIES AND EXCHANGE COMMISSION
Washington, D.C. 20549
FORM N-CSR
CERTIFIED SHAREHOLDER REPORT OF REGISTERED MANAGEMENT
INVESTMENT COMPANIES
| Investment Company Act file number: | 811-06324 |
| Exact name of registrant as specified in charter: | Delaware Group® Global & International |
| Funds | |
| Address of principal executive offices: | 2005 Market Street |
| Philadelphia, PA 19103 | |
| Name and address of agent for service: | David F. Connor, Esq. |
| 2005 Market Street | |
| Philadelphia, PA 19103 | |
| Registrant’s telephone number, including area code: | (800) 523-1918 |
| Date of fiscal year end: | November 30 |
| Date of reporting period: | November 30, 2016 |
Item 1. Reports to Stockholders
Table of Contents

Annual report
Global / international equity mutual funds
Delaware Emerging Markets Fund
Delaware Global Value Fund
Delaware International Value Equity Fund
November 30, 2016
Carefully consider the Funds’ investment objectives, risk factors, charges, and expenses before investing. This and other information can be found in the Funds’ prospectus and their summary prospectuses, which may be obtained by visiting delawareinvestments.com/literature or calling 800 523-1918. Investors should read the prospectus and the summary prospectus carefully before investing.
You can obtain shareholder reports and prospectuses online instead of in the mail.
Visit delawareinvestments.com/edelivery.
Table of Contents
Experience Delaware Investments
Delaware Investments is committed to the pursuit of consistently superior asset management and unparalleled client service. We believe in our investment processes, which seek to deliver consistent results, and in convenient services that help add value for our clients.
If you are interested in learning more about creating an investment plan, contact your financial advisor.
You can learn more about Delaware Investments or obtain a prospectus for Delaware Emerging Markets Fund, Delaware Global Value Fund, and Delaware International Value Equity Fund at delawareinvestments.com/literature.
Manage your investments online
| ● | 24-hour access to your account information |
| ● | Obtain share prices |
| ● | Check your account balance and recent transactions |
| ● | Request statements or literature |
| ● | Make purchases and redemptions |
Delaware Management Holdings, Inc. and its subsidiaries (collectively known by the marketing name of Delaware Investments) are wholly owned subsidiaries of Macquarie Group Limited, a global provider of banking, financial, advisory, investment and funds management services.
Neither Delaware Investments nor its affiliates referred to in this document are authorized deposit-taking institutions for the purpose of the Banking Act 1959 (Commonwealth of Australia). The obligations of these entities do not represent deposits or other liabilities of Macquarie Bank Limited (MBL), a subsidiary of Macquarie Group Limited and an affiliate of Delaware Investments. MBL does not guarantee or otherwise provide assurance in respect of the obligations of these entities, unless noted otherwise. The Funds are governed by U.S. laws and regulations.
| 1 | ||||
| 10 | ||||
| 22 | ||||
| 25 | ||||
| 31 | ||||
| 46 | ||||
| 50 | ||||
| 52 | ||||
| 58 | ||||
| 82 | ||||
| 103 | ||||
| 104 | ||||
| 110 | ||||
| 116 |
Unless otherwise noted, views expressed herein are current as of Nov. 30, 2016, and subject to change for events occurring after such date.
The Funds are not FDIC insured and are not guaranteed. It is possible to lose the principal amount invested.
Mutual fund advisory services provided by Delaware Management Company, a series of Delaware Management Business Trust, which is a registered investment advisor. Delaware Investments, a member of Macquarie Group, refers to Delaware Management Holdings, Inc. and its subsidiaries, including the Fund’s distributor, Delaware Distributors, L.P. Macquarie Group refers to Macquarie Group Limited and its subsidiaries and affiliates worldwide.
© 2017 Delaware Management Holdings, Inc.
All third-party marks cited are the property of their respective owners.
Table of Contents
| Portfolio management review | ||
| Delaware Emerging Markets Fund | December 6, 2016 |
| Performance preview (for the year ended November 30, 2016) | ||||||||
Delaware Emerging Markets Fund (Institutional Class shares) | 1-year return | +14.22% | ||||||
Delaware Emerging Markets Fund (Class A shares) | 1-year return | +13.87% | ||||||
MSCI Emerging Markets Index (Gross) | 1-year return | +8.86% | ||||||
MSCI Emerging Markets Index (Net) | 1-year return | +8.47% | ||||||
Past performance does not guarantee future results.
For complete, annualized performance for Delaware Emerging Markets Fund, please see the table on page 10.
Institutional Class shares are available without sales or asset-based distribution charges only to certain eligible accounts. The performance of Class A shares excludes the applicable sales charge. Both Institutional Class shares and Class A shares reflect the reinvestment of all distributions.
Please see page 12 for a description of the index. Index performance returns do not reflect any management fees, transaction costs, or expenses. Indices are unmanaged and one cannot invest directly in an index.
The Fund’s fiscal year began with slow global growth, weakness in commodity prices, and a rallying U.S. dollar, all of which caused emerging market equities to significantly lag developed markets early on. The U.S. Federal Reserve’s move to raise the federal funds rate for the first time in nine years in December 2015 further weighed on emerging markets.
Market volatility rose as concerns grew regarding the strength of the Chinese economy. However, financial markets rebounded after the European Central Bank lowered interest rates and expanded its quantitative easing program. Depreciation of the U.S. dollar versus many emerging market currencies, along with a rally in commodities prices, bolstered equity returns, particularly in commodity-exporting countries, including Russia and South Africa.
As the year progressed, emerging markets performance was bolstered by the impeachment of Brazil’s President Dilma Rousseff, the continued rebound in commodities prices, assurances by the Fed that it would go slowly on additional rate hikes, and signs of economic stabilization in China and Brazil.
Global volatility spiked briefly in June when the United Kingdom unexpectedly voted to leave the European Union. But the market shock was short-lived as the Bank of England quickly intervened,
injecting liquidity into the U.K. financial markets, easing investor anxiety.
Emerging markets lost some momentum late in the Fund’s fiscal year as the U.S. presidential election campaign, and its results, led to market uncertainty. This triggered a repricing of U.S. bond yields and the U.S. dollar, which in turn hurt emerging market equities and currencies. Adding to this was growing uncertainty regarding the trend toward rising populist anti-globalization sentiment.
Fund performance
For the fiscal year ended Nov. 30, 2016, Delaware Emerging Markets Fund Institutional Class shares returned +14.22%. The Fund’s Class A shares returned +13.87% at net asset value and +7.32% at maximum offer price. These figures reflect all distributions reinvested. During the same period, the Fund’s benchmark, the MSCI Emerging Markets Index (net), returned +8.47%. For complete, annualized performance of Delaware Emerging Markets Fund, please see the table on page 10.
Brazil was the main contributor to the Fund’s performance during the fiscal year. Shares of Petrobras rose as the company executed on its plan to reduce debt through asset sales. Financial stocks, such as Itau Unibanco and Banco
1
Table of Contents
Portfolio management review
Delaware Emerging Markets Fund
Santander Brasil, posted what we viewed as strong returns buoyed by signs of stabilization in the economy. Shares of Eletrobras rallied on expectations for likely improved operating performance following asset divestments and a management shakeup.
In Russia, Sberbank outperformed after reporting strong earnings and raising guidance. Declining credit costs have helped underpin a faster-than-expected profit recovery. Shares of Rosneft performed well due to stronger oil prices, improving sentiment toward Russia’s economy and geopolitical situation, recovering production, and strong cash flow generation. Shares of Internet company Yandex rose as the firm reported strong second-quarter earnings and suggested improving conditions in the advertising market. We believe that the long-term growth opportunity for Yandex appears promising.
Elsewhere, the Fund’s holdings in Argentina contributed to performance. Shares of Cresud rose on the back of improving investor economic sentiment. Additionally, shares of McDonald’s franchisee Arcos Dorados rose on improving quarterly results and recovering traffic in Brazil.
In contrast, in Taiwan, underperformance primarily stemmed from the Fund’s position in semiconductor company MediaTek, which declined as margins have compressed due to intense price competition and investment in technology development. MediaTek’s sales growth and margins appear poised to improve as 4G mobile penetration rises globally. Additionally, the Fund’s underweight position in Taiwan Semiconductor Manufacturing was unfavorable. We no longer find the stock’s valuation attractive.
In India, Reliance Communications underperformed due to lackluster operating performance. However, we believe that industry consolidation and deleveraging could prove beneficial to the company’s long-term profitability. Shares of Reliance Industries declined as refining margins contracted and the company’s launch of
4G telecommunication services was further delayed. We’re impressed with the company’s refining and petrochemical assets, which have among the lowest costs globally, and don’t believe the stock’s valuation fully reflects growth from capacity expansions in these businesses. Although shares of ICICI Bank declined as rising nonperforming loans led to concerns about asset quality, we believe the company appears well positioned for growth in India’s economy.
In Mexico, the Fund’s position in Grupo Televisa underperformed amid speculation that the company’s content licensing agreement with Univision may be renegotiated. More recently, shares of both Grupo Televisa and Grupo Financiero Santander Mexico fell as investor sentiment toward Mexico deteriorated and the peso depreciated following Donald Trump’s victory in the U.S. presidential election. We believe that Grupo Televisa’s ecosystem remains robust and that the company is well positioned to benefit if long-term growth in consumption and income continues. Grupo Financiero Santander Mexico has a strong consumer and small and medium enterprise (SME) franchise, and we expect new management will take steps designed to improve returns.
Among sectors, financials contributed the most to performance mainly due to the Fund’s positions in Itau Unibanco in Brazil and Sberbank in Russia. On the negative side, the technology sector detracted the most from performance due to Sohu.com and Baidu in China. Shares of Sohu.com declined after the company indicated weakness in its gaming and brand advertising businesses. We believe that Sohu.com’s search business has the potential to remain a key growth driver and that the stock is undervalued. Shares of Baidu underperformed following the government’s investigation into healthcare-related advertising on Baidu’s search results. The company subsequently lowered its guidance as it addresses these concerns. The underperformance from
2
Table of Contents
Sohu.com and Baidu was somewhat offset by SINA and Weibo. SINA operates an online portal and owns a majority stake in Weibo, a leading Internet social media platform. Shares of Weibo rose as the company has shown progress in generating advertising revenue on its platform, which has boosted SINA’s valuation.
Despite a challenging macroeconomic backdrop, we see pockets of opportunities for long-term stock appreciation potential driven by structural demographic shifts, technology adoption, implementation of government policy,
improvement in corporate governance, and industry consolidation. Our investment approach remains centered on identifying individual companies that we believe possess sustainable franchises and favorable long-term growth prospects trading at significant discounts to their intrinsic value. We are particularly focused on companies that we think should benefit from long-term changes in how people in emerging markets live and work. Sectors we currently favor include technology and telecommunications.
3
Table of Contents
| Portfolio management review | ||
| Delaware Global Value Fund | December 6, 2016 |
| Performance preview (for the year ended November 30, 2016) | ||||||||
Delaware Global Value Fund (Institutional Class shares) | 1-year return | +3.71% | ||||||
Delaware Global Value Fund (Class A shares) | 1-year return | +3.45% | ||||||
MSCI World Index (Gross) | 1-year return | +3.77% | ||||||
MSCI World Index (Net) | 1-year return | +3.15% | ||||||
Past performance does not guarantee future results.
For complete, annualized performance for Delaware Global Value Fund, please see the table on page 14.
Institutional Class shares are available without sales or asset-based distribution charges only to certain eligible accounts.
The performance of Class A shares excludes the applicable sales charge. Both Institutional Class shares and Class A shares reflect the reinvestment of all distributions.
Please see page 16 for a description of the index. Index performance returns do not reflect any management fees, transaction costs, or expenses. Indices are unmanaged and one cannot invest directly in an index.
The Fund’s fiscal year ended Nov. 30, 2016 may usefully be considered in two halves, each centered on a phase in shifting perceptions of the cycle of global interest rates and the corresponding implications for economic growth and inflation. These changing trends, with weakening economic expectations and declining bond yields in the first half of the year, followed by a gradual and subsequently more abrupt reversal in the second, were apparent in the pattern of relative performance observed across global equity markets.
Cyclical recoveries from distressed levels in commodity markets and emerging market equities and dramatic political events, such as the Brexit vote in late June and the U.S. elections, contributed to the shifting mindset over the past 12 months. The uncertainty of the fiscal year’s first half, in which stable growers and bond proxies excelled, set up a relatively stressed starting point against which to judge markets’ subsequent reactions, thereby making the relief rally since early July more readily comprehensible. One element of continuity that did support market expectations, however, was the ongoing commitment of monetary authorities to stem any tendencies toward deflation. Overall, after falling in the first half, interest rates rose modestly prior to the November election and more dramatically
afterward. Among stocks, financials, cyclical, and commodity-related segments led while defensive and yield-driven names fell behind.
● In the United Kingdom, the market’s volatile dislocations that followed the Brexit vote quickly eased, but the underlying concerns regarding implementation and the consequences for individual companies and the overall economy remained. As of this writing, the British pound still had not recovered from its dramatic swoon of late June, though bond yields have moved back up in tandem with other major developed markets. Despite the considerable advantage of sizable weightings in the strong energy and materials sectors, U.K. equities lagged the MSCI World Index for the year.
● After modest relative performance by U.S. stocks for most of the year, the United States dominated center stage in November with its election and aftermath. Dramatic jumps in Treasury bond yields following the surprise result were echoed in other countries, underpinning the strong rally in financial stocks worldwide. Cyclical names led the market even though employment data, business and consumer sentiment, and leading indicators failed to distinguish themselves meaningfully, positively or negatively, versus the moderate expectations of a few months earlier. Coupled with these moves, though, the U.S. dollar
4
Table of Contents
regained strength after the election, adding to the momentum since the Brexit vote.
● The surge and rapid fade of Japan’s equity performance early in July appeared as a near-perfect countercycle to the more Brexit-exposed economies in the U.K. and Europe. From early July onward, however, Japan’s similarities to Europe in terms of its accommodative monetary policy and positive exposure to easing cyclical stress helped to support strong relative returns into November. Since the U.S. election, though, both Japanese and European stocks have trailed the broader market, despite relatively good returns in local currencies, due to the U.S. dollar’s strong rally.
● Following very weak relative returns in 2015, emerging markets outperformed most of the developed world for much of the 12-month period. Though economic conditions remain extremely weak in Brazil and Russia and remain in a multiyear slowing trend in China, decelerating rates of decline in a number of metrics and slight upward ticks in others helped to underpin a recovery in equity valuations. This upward momentum survived the Brexit vote, as the brunt of its impact fell on Europe. The U.S. election, though, in raising changes in possibilities for global trade, cut into the emerging markets’ performance significantly.
Fund performance
For the fiscal year ended Nov. 30, 2016, Delaware Global Value Fund Institutional Class shares returned +3.71%. The Fund’s Class A shares returned +3.45% at net asset value and -2.49% at maximum offer price. These figures reflect all distributions reinvested. During the same period, the Fund’s benchmark, the MSCI World Index (net), returned +3.15%. For complete, annualized performance of Delaware Global Value Fund, please see the table on page 14. The Fund outperformed the benchmark primarily due to strong stock selection. On a sector basis,
strong stock selection in industrials, information technology, telecommunications, and consumer discretionary more than offset weak stock selection in financials and consumer staples. Overall sector allocation was negative, with the adverse effect from an underweight position in materials more than offsetting the positive effect from an overweight position in industrials. Among regions, strong stock selection in Japan, the U.S., the U.K., and the euro zone more than offset weak selection in Europe ex–euro zone. Overall regional allocation was negative, with overweight positions in Japan and the euro zone and an underweight position in the U.S. more than offsetting the positive effect from exposure to emerging markets. Net currency effect was positive, with an overweight exposure to the Japanese yen more than offsetting the adverse effect from an underweight to the U.S. dollar.
The Fund’s trading activity during the fiscal year has centered on paring back some of the Fund’s successful investments that were approaching their targets and redeploying the proceeds into what we viewed as more attractively valued stocks. This activity did not result in material changes to the Fund’s portfolio positioning overall.
The Fund employed foreign currency exchange contracts during the fiscal year, to facilitate the purchase and sale of securities in the Fund, which had a minor effect on performance (less than 0.50 percentage points).
While we are encouraged by the market’s strong performance beyond the volatility of February and June 2016, some elements of the global financial picture remain uncertain. Even after the November surge, bond yields remain historically low. This, combined with persistently slow growth, suggests to us an environment in which investment returns may be modest. The market has been facing a conundrum: both a scarcity of conviction that economies will reaccelerate along the lines of past cycles, as well as central bank efforts to prevent further weakness.
5
Table of Contents
Portfolio management review
Delaware Global Value Fund
Recent market action suggests a greater sense of optimism in the air, but much remains to be proven. At the current level of equity valuations (based on price-to-earnings ratios) the U.S. market is selling at a premium to the rest of the world, while Japan and Europe sell at discounts (source: Bloomberg). These gaps appear to reflect diverging expectations of growth potential and risk and have changed little since June. What also remains intact, though, is that for active managers, stocks reflect stakes in dynamic enterprises that can change and adapt to shifting circumstances. While the market presents us with uncertainty, we are confident that success in equity investing often reflects the varying ways in which company managements navigate these changes, and how efficient and focused they are in doing so. We believe that the qualities can be recognized and, if accompanied by attractive valuation metrics, can have the potential to reveal solid long-term investment opportunities.
6
Table of Contents
| Delaware International Value Equity Fund | December 6, 2016 |
| Performance preview (for the year ended November 30, 2016) | ||||||||
Delaware International Value Equity Fund (Institutional Class shares) | 1-year return | +1.41% | ||||||
Delaware International Value Equity Fund (Class A shares) | 1-year return | +1.15% | ||||||
MSCI EAFE Index (Gross) | 1-year return | -3.17% | ||||||
MSCI EAFE Index (Net) | 1-year return | -3.66% | ||||||
Past performance does not guarantee future results.
For complete, annualized performance for Delaware International Value Equity Fund, please see the table on page 18.
Institutional Class shares are available without sales or asset-based distribution charges only to certain eligible accounts. The performance of Class A shares excludes the applicable sales charge. Both Institutional Class shares and Class A shares reflect the reinvestment of all distributions.
Please see page 20 for a description of the index. Index performance returns do not reflect any management fees, transaction costs, or expenses. Indices are unmanaged and one cannot invest directly in an index.
The Fund’s fiscal year ended Nov. 30, 2016 may usefully be considered in two halves, each centered on a phase in the shifting perceptions of the cycle of global interest rates and the corresponding implications for economic growth and inflation. These changing trends, with weakening economic expectations and declining bond yields in the first half of the year, followed by a gradual and subsequently more abrupt reversal in the second, were apparent in the pattern of relative performance observed across global equity markets.
Cyclical recoveries from distressed levels in commodity markets and emerging market equities and dramatic political events, such as the Brexit vote in late June and the U.S. elections, contributed to the shifting mindset over the past 12 months. The uncertainty of the fiscal year’s first half, in which stable growers and bond proxies excelled, set up a relatively stressed starting point against which to judge markets’ subsequent reactions, thereby making the relief rally since early July more readily comprehensible. One element of continuity that did support market expectations, however, was the ongoing commitment of monetary authorities to stem any tendencies toward deflation. Overall, after falling in the first half, interest rates rose modestly prior to the November election and
more dramatically afterward. Among stocks, financials, cyclical, and commodity-related segments led while defensive and yield-driven names fell behind.
● In the United Kingdom, the market’s volatile dislocations that followed the Brexit vote quickly eased, but the underlying concerns regarding implementation and the consequences for individual companies and the overall economy remained. As of this writing, the British pound still had not recovered from its dramatic swoon of late June, though bond yields have moved back up in tandem with other major developed markets. Despite the considerable advantage of sizable weightings in the strong energy and materials sectors, U.K. equities lagged the MSCI World Index for the year.
● After modest relative performance by U.S. stocks for most of the year, the United States dominated center stage in November with its election and aftermath. Dramatic jumps in Treasury bond yields following the surprise result were echoed in other countries, underpinning the strong rally in financial stocks worldwide. Cyclical names led the market even though employment data, business and consumer sentiment, and leading indicators failed to distinguish themselves meaningfully, positively or negatively, versus the moderate expectations of a few months earlier.
7
Table of Contents
Performance management review
Delaware International Value Equity Fund
Coupled with these moves, though, the U.S. dollar regained strength after the election, adding to the momentum since the Brexit vote.
● The surge and rapid fade of Japan’s equity performance early in July appeared as a near-perfect countercycle to the more Brexit-exposed economies in the U.K. and Europe. From early July onward, however, Japan’s similarities to Europe in terms of its accommodative monetary policy and positive exposure to easing cyclical stress helped to support strong relative returns into November. Since the U.S. election, though, both Japanese and European stocks have trailed the broader market, despite relatively good returns in local currencies, due to the U.S. dollar’s strong rally.
● Following very weak relative returns in 2015, emerging markets outperformed most of the developed world for much of the 12-month period. Though economic conditions remain extremely weak in Brazil and Russia and remain in a multiyear slowing trend in China, decelerating rates of decline in a number of metrics and slight upward ticks in others helped to underpin a recovery in equity valuations. This upward momentum survived the Brexit vote, as the brunt of its impact fell on Europe. The U.S. election, though, in raising changes in possibilities for global trade, cut into the emerging markets’ performance significantly.
Fund performance
For the fiscal year ended Nov. 30, 2016, Delaware International Value Equity Fund Institutional Class shares returned +1.41%. The Fund’s Class A shares returned +1.15% at net asset value and -4.66% at maximum offer price. These figures reflect all distributions reinvested. During the same period, the Fund’s benchmark, the MSCI EAFE Index (net), returned -3.66%. For complete, annualized performance of Delaware International Value Equity Fund, please see the table on page 18.
The Fund outperformed the benchmark primarily due to strong stock selection. On a sector basis, strong stock selection in consumer discretionary, information technology, industrials, telecommunications, and materials more than offset weak stock selection in energy and financials. Overall sector allocation was negative, with the adverse effect from an underweight position in materials more than offsetting the favorable effect from an overweight position in industrials. Among regions, strong stock selection in the euro zone, Japan, and the U.K. more than offset weak selection in Europe ex–euro zone and Asia Pacific ex Japan. Overall regional allocation was positive, with the favorable effect from exposures to emerging markets and Canada more than offsetting the adverse effect of underweight exposures to the U.K. and Asia Pacific ex Japan. Net currency effect was positive, with a positive effect from an underweight exposure to the British pound more than offsetting the adverse effect from an underweight exposure to the Australian dollar.
The Fund’s trading activity during the year centered on paring back some of the Fund’s successful investments that were approaching their targets and redeploying the proceeds on what we viewed as more attractively valued stocks. This activity did not result in material changes to the Fund’s portfolio positioning overall.
The Fund employed foreign currency exchange contracts during the fiscal year, to facilitate the purchase and sale of securities in the Fund, which had a minor effect on performance (less than 0.50 percentage points).
While we are encouraged by the market’s strong performance beyond the volatility of February and June 2016, some elements of the global financial picture remain uncertain. Even after the November surge, bond yields remain historically low. This, combined with persistently slow growth, suggest to us an environment in which investment returns may be modest. The market has been facing a
8
Table of Contents
conundrum: both a scarcity of conviction that economies will reaccelerate along the lines of past cycles, as well as central bank efforts to prevent further weakness.
Recent market action suggests a greater sense of optimism in the air, but much remains to be proven. At the current level of equity valuations (based on price-to-earnings ratios) the U.S. market is selling at a premium to the rest of the world, while Japan and Europe sell at discounts (source: Bloomberg). These gaps appear to reflect diverging expectations of growth potential and risk and have changed little since June. What also remains intact, though, is that for active managers, stocks reflect stakes in dynamic enterprises that can change and adapt to shifting circumstances. While the market presents us with uncertainty, we are confident that success in equity investing often reflects the varying ways in which company managements navigate these changes, and how efficient and focused they are in doing so. We believe that the qualities can be recognized and, if accompanied by attractive valuation metrics, can have the potential to reveal solid long-term investment opportunities.
9
Table of Contents
| Performance summaries | ||
| Delaware Emerging Markets Fund | November 30, 2016 |
The performance data quoted represent past performance; past performance does not guarantee future results. Investment return and principal value will fluctuate so your shares, when redeemed, may be worth more or less than their original cost. Please obtain the performance data current for the most recent month end by calling 800 523-1918 or visiting our website at delawareinvestments.com/performance. Current performance may be lower or higher than the performance data quoted.
| Fund and benchmark performance1,2 | Average annual total returns through November 30, 2016 | |||||||||||||||
1 year |
5 years |
10 years |
Lifetime | |||||||||||||
Class A (Est. June 10, 1996) | ||||||||||||||||
Excluding sales charge | +13.87% | +3.56% | +4.07% | +7.15% | ||||||||||||
Including sales charge | +7.32% | +2.33% | +3.45% | +6.84% | ||||||||||||
Class C (Est. June 10, 1996) | ||||||||||||||||
Excluding sales charge | +13.00% | +2.77% | +3.29% | +6.36% | ||||||||||||
Including sales charge | +12.00% | +2.77% | +3.29% | +6.36% | ||||||||||||
Class R (Est. Aug. 31, 2009) | ||||||||||||||||
Excluding sales charge | +13.64% | +3.31% | n/a | +4.19% | ||||||||||||
Including sales charge | +13.64% | +3.31% | n/a | +4.19% | ||||||||||||
Institutional Class (Est. June 10, 1996) | ||||||||||||||||
Excluding sales charge | +14.22% | +3.81% | +4.33% | +7.44% | ||||||||||||
Including sales charge | +14.22% | +3.81% | +4.33% | +7.44% | ||||||||||||
Class R6 (Est. May 2, 2016) | ||||||||||||||||
Excluding sales charge | n/a | n/a | n/a | +8.41%* | ||||||||||||
Including sales charge | n/a | n/a | n/a | +8.41%* | ||||||||||||
MSCI Emerging Markets Index (gross) | +8.86% | +1.34% | +2.60% | +5.37%** | ||||||||||||
MSCI Emerging Markets Index (net) | +8.47% | +0.99% | +2.26% | +5.10%** | ||||||||||||
* Returns are as of the Fund’s Class R6 inception date. Returns for less than one year are not annualized. The benchmark lifetime returns were +4.64% (gross) and +4.38% (net) and are as of the month-end prior to the Class R6 inception date.
** The benchmark lifetime return is for Institutional Class share comparison only and is calculated using the last business day in the month of the Fund’s Institutional Class inception date.
1 Returns reflect the reinvestment of all distributions and are presented both with and without the applicable sales charges described below. Returns do not reflect the deduction of taxes the shareholder would pay on Fund distributions or redemptions of Fund shares.
Expense limitations were in effect for certain classes during some or all of the periods shown in the “Fund and benchmark performance” table. Expenses for each class are listed on the “Fund expense ratios” table on page 11. Performance would have been lower had expense limitations not been in effect.
10
Table of Contents
Institutional Class shares are available without sales or asset-based distribution charges only to certain eligible accounts.
Class A shares are sold with a maximum front-end sales charge of 5.75%, and have an annual distribution and service fee of 0.25% of average daily net assets. Performance for Class A shares, excluding sales charges, assumes that no front-end sales charge applied.
Class C shares are sold with a contingent deferred sales charge of 1.00% if redeemed during the first 12 months. They are also subject to an annual distribution and service fee of 1.00% of average daily net assets. Performance for C shares, excluding sales charges, assumes either that contingent deferred sales charges did not apply or that the investment was not redeemed. Class R shares are available only for certain retirement plan products. They are sold without a
sales charge and have an annual distribution and service fee of 0.50% of average daily net assets.
Class R6 shares are available only to certain investors.
International investments entail risks not ordinarily associated with U.S. investments including fluctuation in currency values, differences in accounting principles, or economic or political instability in other nations.
Investing in emerging markets can be riskier than investing in established foreign markets due to increased volatility and lower trading volume.
If and when the Fund invests in forward foreign currency contracts or uses other investments to hedge against currency risks, the Fund will be subject to special risks, including counterparty risk.
2The Fund’s expense ratios, as described in the most recent prospectus, are disclosed in the following “Fund expense ratios” table. Delaware Management Company has agreed to reimburse certain expenses and/or waive certain fees in order to prevent total annual fund operating expenses (excluding any 12b-1 fees, acquired fund fees and expenses, taxes, interest, short sale and dividend interest expenses, brokerage fees, certain insurance costs, and nonroutine expenses or costs, including, but not limited to, those relating to reorganizations, litigation, conducting shareholder meetings, and liquidations (collectively, nonroutine expenses)) from exceeding 1.45% of the Fund’s average daily net assets from May 2, 2016 through Nov. 30, 2016* for all share classes other than Class R6, and 1.32% of the Fund’s Class R6 shares’ average daily net assets from May 2, 2016 through Nov. 30, 2016.* Please see the most recent prospectus and any applicable supplement(s) for additional information on these fee waivers and/or reimbursements.
| Fund expense ratios | Class A | Class C | Class R | Institutional Class | Class R6 | |||||
Total annual operating expenses | 1.73% | 2.48% | 1.98% | 1.48% | 1.35% | |||||
(without fee waivers) | ||||||||||
Net expenses | 1.70% | 2.45% | 1.95% | 1.45% | 1.32% | |||||
(including fee waivers, if any) | ||||||||||
Type of waiver | Contractual | Contractual | Contractual | Contractual | Contractual |
*The aggregate contractual waiver period covering this report is from May 2, 2016 through May 2, 2017.
11
Table of Contents
Performance summaries
Delaware Emerging Markets Fund
Performance of a $10,000 investment1
Average annual total returns from Nov. 30, 2006, through Nov. 30, 2016
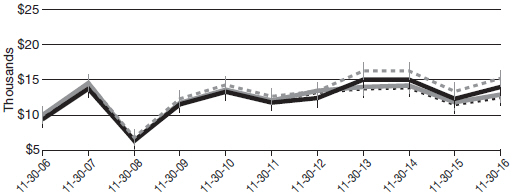
| For the period beginning Nov. 30, 2006, through Nov. 30, 2016 | Starting value | Ending value | ||||||||
| Delaware Emerging Markets Fund — Institutional Class shares | $10,000 | $15,280 | |||||||
| Delaware Emerging Markets Fund — Class A shares | $9,425 | $14,041 | |||||||
| MSCI Emerging Markets Index (gross) | $10,000 | $12,921 | |||||||
| MSCI Emerging Markets Index (net) | $10,000 | $12,509 | |||||||


1 The “Performance of a $10,000 investment” graph assumes $10,000 invested in Institutional Class and Class A shares of the Fund on Nov. 30, 2006, and includes the effect of a 5.75% front-end sales charge (for Class A shares) and the reinvestment of all distributions. The graph does not reflect the deduction of taxes the shareholders would pay on Fund distributions or redemptions of Fund shares. Expense limitations were in effect for some or all of the periods shown. Performance would have been lower had expense limitations not been in effect. Expenses are listed in the “Fund expense ratios” table on page 11. Please note additional details on pages 10 through 13.
The graph also assumes $10,000 invested in the MSCI Emerging Markets Index as of Nov. 30, 2006. The MSCI Emerging Markets Index measures equity market performance across emerging market countries worldwide. Index “gross” return approximates the maximum possible dividend reinvestment. Index “net” return
approximates the minimum possible dividend reinvestment, after deduction of withholding tax at the highest possible rate.
Index performance returns do not reflect any management fees, transaction costs, or expenses. Indices are unmanaged and one cannot invest directly in an index. Past performance is not a guarantee of future results.
Performance of other Fund classes will vary due to different charges and expenses.
12
Table of Contents
Nasdaq symbols
|
CUSIPs
| |||||||||||||
Class A | DEMAX | 245914841 | ||||||||||||
Class C | DEMCX | 245914825 | ||||||||||||
Class R | DEMRX | 245914569 | ||||||||||||
Institutional Class | DEMIX | 245914817 | ||||||||||||
Class R6
| DEMZX
|
| 245914510
|
| ||||||||||
13
Table of Contents
| Performance summaries | ||
| Delaware Global Value Fund | November 30, 2016 |
The performance data quoted represent past performance; past performance does not guarantee future results. Investment return and principal value will fluctuate so your shares, when redeemed, may be worth more or less than their original cost. Please obtain the performance data current for the most recent month end by calling 800 523-1918 or visiting our website at delawareinvestments.com/performance. Current performance may be lower or higher than the performance data quoted.
| Fund and benchmark performance1,2 | Average annual total returns through November 30, 2016 | |||||||||||||||
| 1 year | 5 years | 10 years | Lifetime | |||||||||||||
Class A (Est. Dec. 19, 1997) | ||||||||||||||||
Excluding sales charge | +3.45% | +7.51% | +1.81% | +6.44% | ||||||||||||
Including sales charge | -2.49% | +6.23% | +1.20% | +6.11% | ||||||||||||
Class C (Est. Sept. 28, 2001) | ||||||||||||||||
Excluding sales charge | +2.75% | +6.72% | +1.05% | +6.56% | ||||||||||||
Including sales charge | +1.75% | +6.72% | +1.05% | +6.56% | ||||||||||||
Institutional Class (Est. Dec. 19, 1997) | ||||||||||||||||
Excluding sales charge | +3.71% | +7.79% | +2.06% | +6.66% | ||||||||||||
Including sales charge | +3.71% | +7.79% | +2.06% | +6.66% | ||||||||||||
MSCI World Index (gross) | +3.77% | +10.51% | +4.38% | +5.62%* | ||||||||||||
MSCI World Index (net) | +3.15% | +9.88% | +3.79% | +5.11%* | ||||||||||||
* The benchmark lifetime return is for Institutional Class share comparison only and is calculated using the last business day in the month of the Fund’s Institutional Class inception date.
1 Returns reflect the reinvestment of all distributions and are presented both with and without the applicable sales charges described below. Returns do not reflect the deduction of taxes the shareholder would pay on Fund distributions or redemptions of Fund shares.
Expense limitations were in effect for certain classes during some or all of the periods shown in the “Fund and benchmark performance” table. Expenses for each class are listed on the “Fund expense ratios” table on page 15. Performance would have been lower had expense limitations not been in effect.
Institutional Class shares are available without sales or asset-based distribution charges only to certain eligible accounts.
Class A shares are sold with a maximum front-end sales charge of 5.75%, and have an annual distribution and service fee of 0.25% of average daily net assets. Performance for Class A shares, excluding sales charges, assumes that no front-end sales charge applied.
Class C shares are sold with a contingent deferred sales charge of 1.00% if redeemed during the first 12 months. They are also subject to an annual distribution and service fee of 1.00% of average daily net assets. Performance for Class C shares, excluding sales charges, assumes either that contingent deferred sales charges did not apply or that the investment was not redeemed.
International investments entail risks not ordinarily associated with U.S. investments including fluctuation in currency values, differences in
14
Table of Contents
accounting principles, or economic or political instability in other nations.
Investing in emerging markets can be riskier than investing in established foreign markets due to increased volatility and lower trading volume.
Investments in small and/or medium-sized companies typically exhibit greater risk and higher volatility than larger, more established companies.
2The Fund’s expense ratios, as described in the most recent prospectus, are disclosed in the following “Fund expense ratios” table. Delaware Management Company has agreed to reimburse certain expenses and/or waive certain fees in order to prevent total fund operating expenses (excluding any 12b-1 fees, acquired fund fees and expenses, taxes, interest, short sale and dividend interest expenses, brokerage fees, certain insurance costs, and nonroutine expenses or costs, including, but not limited to, those relating to reorganizations, litigation, conducting shareholder meetings, and liquidations (collectively nonroutine expenses)) from exceeding 1.30% of the Fund’s average daily net assets during the period from Dec. 1. 2015 through Nov. 30, 2016.* Please see the most recent prospectus and any applicable supplement(s) for additional information on these fee waivers and/or reimbursements.
| Fund expense ratios | Class A | Class C | Institutional Class | |||
Total annual operating expenses | 1.80% | 2.55% | 1.55% | |||
(without fee waivers) | ||||||
Net expenses | 1.55% | 2.30% | 1.30% | |||
(including fee waivers, if any) | ||||||
Type of waiver | Contractual | Contractual | Contractual |
*The aggregate contractual waiver period covering this report is from March 30, 2015 through May 2, 2017.
15
Table of Contents
Performance summaries
Delaware Global Value Fund
Performance of a $10,000 investment1
Average annual total returns from Nov. 30, 2006, through Nov. 30, 2016
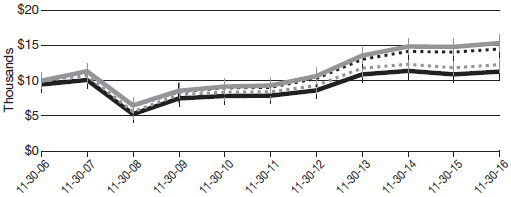
| For the period beginning Nov. 30, 2006, through Nov. 30, 2016 | Starting value | Ending value | ||||||||
| MSCI World Index (gross) | $10,000 | $15,347 | |||||||
| MSCI World Index (net) | $10,000 | $14,506 | |||||||
| Delaware Global Value Fund — Institutional Class shares | $10,000 | $12,257 | |||||||
| Delaware Global Value Fund — Class A shares | $9,425 | $11,271 | |||||||
1 The “Performance of a $10,000 investment” graph assumes $10,000 invested in Institutional Class and Class A shares of the Fund on Nov. 30, 2006, and includes the effect of a 5.75% front-end sales charge (for Class A shares) and the reinvestment of all distributions. The graph does not reflect the deduction of taxes the shareholders would pay on Fund distributions or redemptions of Fund shares. Expense limitations were in effect for some or all of the periods shown. Performance would have been lower had expense limitations not been in effect. Expenses are listed in the “Fund expense ratios” table on page 15. Please note additional details on pages 14 through 17.
The graph also assumes $10,000 invested in the MSCI World Index as of Nov. 30, 2006. The MSCI World Index is a free float-adjusted market capitalization
weighted index designed to measure equity market performance across developed markets worldwide. Index “gross” return approximates the maximum possible dividend reinvestment. Index “net” return approximates the
minimum possible dividend reinvestment, after deduction of withholding tax at the highest possible rate.
Index performance returns do not reflect any management fees, transaction costs, or expenses. Indices are unmanaged and one cannot invest directly in an index. Past performance is not a guarantee of future results.
Performance of other Fund classes will vary due to different charges and expenses.
16
Table of Contents
Nasdaq symbols
|
CUSIPs
| |||||||||||||
Class A | DABAX | 245914718 | ||||||||||||
Class C | DABCX | 245914684 | ||||||||||||
Institutional Class
| DABIX
|
| 245914676
|
| ||||||||||
17
Table of Contents
| Performance summaries | ||
| Delaware International Value Equity Fund | November 30, 2016 |
The performance data quoted represent past performance; past performance does not guarantee future results. Investment return and principal value will fluctuate so your shares, when redeemed, may be worth more or less than their original cost. Please obtain the performance data current for the most recent month end by calling 800 523-1918 or visiting our website at delawareinvestments.com/performance. Current performance may be lower or higher than the performance data quoted.
| Fund and benchmark performance1,2 | Average annual total returns through November 30, 2016 | |||||||||||||||
| 1 year | 5 years | 10 years | Lifetime | |||||||||||||
Class A (Est. Oct. 31, 1991) | ||||||||||||||||
Excluding sales charge | +1.15% | +5.43% | +0.48% | +5.76% | ||||||||||||
Including sales charge | -4.66% | +4.20% | -0.12% | +5.51% | ||||||||||||
Class C (Est. Nov. 29, 1995) | ||||||||||||||||
Excluding sales charge | +0.36% | +4.64% | -0.25% | +4.44% | ||||||||||||
Including sales charge | -0.63% | +4.64% | -0.25% | +4.44% | ||||||||||||
Class R (Est. June 2, 2003) | ||||||||||||||||
Excluding sales charge | +0.88% | +5.18% | +0.26% | +5.41% | ||||||||||||
Including sales charge | +0.88% | +5.18% | +0.26% | +5.41% | ||||||||||||
Institutional Class (Est. Nov. 9, 1992) | ||||||||||||||||
Excluding sales charge | +1.41% | +5.70% | +0.76% | +6.51% | ||||||||||||
Including sales charge | +1.41% | +5.70% | +0.76% | +6.51% | ||||||||||||
MSCI EAFE Index (gross) | -3.17% | +6.10% | +1.19% | +6.01%* | ||||||||||||
MSCI EAFE Index (net) | -3.66% | +5.62% | +0.72% | +5.61%* | ||||||||||||
* The benchmark lifetime return is for Institutional Class share comparison only and is calculated using the last business day in the month of the Fund’s Institutional Class inception date.
1 Returns reflect the reinvestment of all distributions and are presented both with and without the applicable sales charges described below. Returns do not reflect the deduction of taxes the shareholder would pay on Fund distributions or redemptions of Fund shares.
Expense limitations were in effect for certain classes during some or all of the periods shown in the “Fund and benchmark performance” table. Expenses for each class are listed on the “Fund expense ratios” table on page 19. Performance would have been lower had expense limitations not been in effect.
Institutional Class shares are available without sales or asset-based distribution charges only to certain eligible accounts.
Class A shares are sold with a maximum front-end sales charge of 5.75%, and have an annual distribution and service fee of 0.25% of average daily net assets. Performance for Class A shares, excluding sales charges, assumes that no front-end sales charge applied.
Class C shares are sold with a contingent deferred sales charge of 1.00% if redeemed during the first 12 months. They are also subject to an annual distribution and service fee of 1.00% of average
18
Table of Contents
daily net assets. Performance for Class C shares, excluding sales charges, assumes either that contingent deferred sales charges did not apply or that the investment was not redeemed.
Class R shares are available only for certain retirement plan products. They are sold without a sales charge and have an annual distribution and service fee of 0.50% of average daily net assets.
International investments entail risks not ordinarily associated with U.S. investments including fluctuation in currency values, differences in accounting principles, or economic or political instability in other nations.
Investing in emerging markets can be riskier than investing in established foreign markets due to increased volatility and lower trading volume.
2The Fund’s expense ratios, as described in the most recent prospectus, are disclosed in the following “Fund expense ratios” table. Delaware Management Company has agreed to reimburse certain expenses and/or waive certain fees in order to prevent total fund operating expenses (excluding any 12b-1 fees, acquired fund fees and expenses, taxes, interest, short sale and dividend interest expenses, brokerage fees, certain insurance costs, and nonroutine expenses or costs, including, but not limited to, those relating to reorganizations, litigation, conducting shareholder meetings, and liquidations (collectively nonroutine expenses)) from exceeding 1.21% of the Fund’s average daily net assets during the period from Dec. 1, 2015 through Nov. 30, 2016.* Please see the most recent prospectus and any applicable supplement(s) for additional information on these fee waivers and/or reimbursements.
| Fund expense ratios | Class A | Class C | Class R | Institutional Class | ||||
Total annual operating expenses | 1.36% | 2.11% | 1.61% | 1.11% | ||||
(without fee waivers) | ||||||||
Net expenses** | 1.36% | 2.11% | 1.61% | 1.11% | ||||
(including fee waivers, if any) | ||||||||
Type of waiver | Contractual | Contractual | Contractual | Contractual |
*The aggregate contractual waiver period covering this report is from March 30, 2015 through May 2, 2017.
**Fee waivers were in place, but due to the Fund’s expense level, the waivers had no impact.
19
Table of Contents
Performance summaries
Delaware International Value Equity Fund
Performance of a $10,000 investment1
Average annual total returns from Nov. 30, 2006, through Nov. 30, 2016

| For the period beginning Nov. 30, 2006, through Nov. 30, 2016 | Starting value | Ending value | ||||||||
| MSCI EAFE Index (gross) | $10,000 | $11,257 | |||||||
| Delaware International Value Equity Fund — Institutional Class shares | $10,000 | $10,782 | |||||||
| MSCI EAFE Index (net) | $10,000 | $10,744 | |||||||
| Delaware International Value Equity Fund — Class A shares | $9,425 | $9,885 | |||||||
1 The “Performance of a $10,000 investment” graph assumes $10,000 invested in Institutional Class and Class A shares of the Fund on Nov. 30, 2006, and includes the effect of a 5.75% front-end sales charge (for Class A shares) and the reinvestment of all distributions. The graph does not reflect the deduction of taxes the shareholders would pay on Fund distributions or redemptions of Fund shares. Expense limitations were in effect for some or all of the periods shown. Performance would have been lower had expense limitations not been in effect. Expenses are listed in the “Fund expense ratios” table on page 19. Please note additional details on pages 18 through 21.
The graph also assumes $10,000 invested in the MSCI EAFE Index as of Nov. 30, 2006. The MSCI EAFE (Europe, Australasia, Far East) Index is a free float-adjusted market capitalization weighted index designed to measure equity market performance of developed markets, excluding the
United States and Canada. Index “gross” return approximates the maximum possible dividend reinvestment. Index “net” return approximates the minimum possible dividend reinvestment, after deduction of withholding tax at the highest possible rate.
The MSCI World Index, mentioned on page 7, is a free float-adjusted market capitalization weighted index designed to measure equity market performance across developed markets worldwide.
Index performance returns do not reflect any management fees, transaction costs, or expenses. Indices are unmanaged and one cannot invest directly in an index. Past performance is not a guarantee of future results.
Performance of other Fund classes will vary due to different charges and expenses.
20
Table of Contents
Nasdaq symbols
|
CUSIPs
| |||||||||||||
Class A | DEGIX | 245914106 | ||||||||||||
Class C | DEGCX | 245914858 | ||||||||||||
Class R | DIVRX | 245914577 | ||||||||||||
Institutional Class
| DEQIX
|
| 245914403
|
| ||||||||||
21
Table of Contents
For the six-month period from June 1, 2016 to November 30, 2016 (Unaudited)
As a shareholder of a Fund, you incur two types of costs: (1) transaction costs, including sales charges (loads) on purchase payments, reinvested dividends, or other distributions; redemption fees; and exchange fees; and (2) ongoing costs, including management fees; distribution and/or service (12b-1) fees; and other Fund expenses. These following examples are intended to help you understand your ongoing costs (in dollars) of investing in a Fund and to compare these costs with the ongoing costs of investing in other mutual funds.
The examples are based on an investment of $1,000 invested at the beginning of the period and held for the entire six-month period from June 1, 2016 to Nov. 30, 2016.
Actual expenses
The first section of the tables shown, “Actual Fund return,” provides information about actual account values and actual expenses. You may use the information in this section of the table, together with the amount you invested, to estimate the expenses that you paid over the period. Simply divide your account value by $1,000 (for example, an $8,600 account value divided by $1,000 = 8.6), then multiply the result by the number in the first section under the heading entitled “Expenses Paid During Period” to estimate the expenses you paid on your account during this period.
Hypothetical example for comparison purposes
The second section of the tables shown, “Hypothetical 5% return,” provides information about hypothetical account values and hypothetical expenses based on the Funds’ actual expense ratios and an assumed rate of return of 5% per year before expenses, which is not the Funds’ actual return. The hypothetical account values and expenses may not be used to estimate the actual ending account balance or expenses you paid for the period. You may use this information to compare the ongoing costs of investing in the Fund and other funds. To do so, compare this 5% hypothetical example with the 5% hypothetical examples that appear in the shareholder reports of the other funds.
Please note that the expenses shown in the tables are meant to highlight your ongoing costs only and do not reflect any transactional costs, such as sales charges (loads), redemption fees, or exchange fees. Therefore, the second section of each table is useful in comparing ongoing costs only, and will not help you determine the relative total costs of owning different funds. In addition, if these transactional costs were included, your costs would have been higher. The Funds’ expenses shown in the tables reflect fee waivers in effect. The expenses shown in each table assume reinvestment of all dividends and distributions.
22
Table of Contents
Delaware Emerging Markets Fund
Expense analysis of an investment of $1,000
| Beginning Account Value 6/1/16 | Ending Account Value 11/30/16 | Annualized Expense Ratio | Expenses Paid During Period | |||||||||||||||||
Actual Fund return† | ||||||||||||||||||||
Class A | $1,000.00 | $1,128.60 | 1.70% | $9.05 | ||||||||||||||||
Class C | 1,000.00 | 1,124.40 | 2.45% | 13.01 | ||||||||||||||||
Class R | 1,000.00 | 1,127.70 | 1.95% | 10.37 | ||||||||||||||||
Institutional Class | 1,000.00 | 1,130.90 | 1.45% | 7.72 | ||||||||||||||||
Class R6 | 1,000.00 | 1,130.90 | 1.32% | 7.03 | ||||||||||||||||
Hypothetical 5% return (5% return before expenses) | ||||||||||||||||||||
Class A | $1,000.00 | $1,016.50 | 1.70% | $8.57 | ||||||||||||||||
Class C | 1,000.00 | 1,012.75 | 2.45% | 12.33 | ||||||||||||||||
Class R | 1,000.00 | 1,015.25 | 1.95% | 9.82 | ||||||||||||||||
Institutional Class | 1,000.00 | 1,017.75 | 1.45% | 7.31 | ||||||||||||||||
Class R6 | 1,000.00 | 1,018.40 | 1.32% | 6.66 | ||||||||||||||||
Delaware Global Value Fund Expense analysis of an investment of $1,000
| ||||||||||||||||||||
| Beginning Account Value 6/1/16 | Ending Account Value 11/30/16 | Annualized Expense Ratio | Expenses Paid During Period | |||||||||||||||||
Actual Fund return† | ||||||||||||||||||||
Class A | $1,000.00 | $1,045.60 | 1.55% | $7.93 | ||||||||||||||||
Class C | 1,000.00 | 1,041.90 | 2.30% | 11.74 | ||||||||||||||||
Institutional Class | 1,000.00 | 1,047.30 | 1.30% | 6.65 | ||||||||||||||||
Hypothetical 5% return (5% return before expenses) | ||||||||||||||||||||
Class A | $1,000.00 | $1,017.25 | 1.55% | $7.82 | ||||||||||||||||
Class C | 1,000.00 | 1,013.50 | 2.30% | 11.58 | ||||||||||||||||
Institutional Class | 1,000.00 | 1,018.50 | 1.30% | 6.56 | ||||||||||||||||
23
Table of Contents
Disclosure of Fund expenses
For the six-month period from June 1, 2016 to November 30, 2016 (Unaudited)
Delaware International Value Equity Fund
Expense analysis of an investment of $1,000
| Beginning Account Value 6/1/16 | Ending Account Value 11/30/16 | Annualized Expense Ratio | Expenses Paid During Period | |||||||||||||||||
Actual Fund return† | ||||||||||||||||||||
Class A | $1,000.00 | $1,015.70 | 1.36% | $6.85 | ||||||||||||||||
Class C | 1,000.00 | 1,012.00 | 2.11% | 10.61 | ||||||||||||||||
Class R | 1,000.00 | 1,014.20 | 1.61% | 8.11 | ||||||||||||||||
Institutional Class | 1,000.00 | 1,017.20 | 1.11% | 5.60 | ||||||||||||||||
Hypothetical 5% return (5% return before expenses) | ||||||||||||||||||||
Class A | $1,000.00 | $1,018.20 | 1.36% | $6.86 | ||||||||||||||||
Class C | 1,000.00 | 1,014.45 | 2.11% | 10.63 | ||||||||||||||||
Class R | 1,000.00 | 1,016.95 | 1.61% | 8.12 | ||||||||||||||||
Institutional Class | 1,000.00 | 1,019.45 | 1.11% | 5.60 | ||||||||||||||||
| * | “Expenses Paid During Period” are equal to the relevant Fund’s annualized expense ratio, multiplied by the average account value over the period, multiplied by 183/366 (to reflect the one-half year period). |
| † | Because actual returns reflect only the most recent six-month period, the returns shown may differ significantly from fiscal year returns. |
24
Table of Contents
| Security type / country and sector allocations | ||
Delaware Emerging Markets Fund | As of November 30, 2016 (Unaudited) | |
Sector designations may be different than the sector designations presented in other Fund materials. The sector designations may represent the investment manager’s internal sector classifications, which may result in the sector designations for one fund being different than another fund’s sector designations.
| Security type / country | Percentage of net assets | |||||||||
Common Stock by Country | 97.72 | % | ||||||||
Argentina | 3.64 | % | ||||||||
Bahrain | 0.05 | % | ||||||||
Brazil | 13.80 | % | ||||||||
Canada | 0.02 | % | ||||||||
Chile | 1.02 | % | ||||||||
China/Hong Kong | 31.07 | % | ||||||||
Cyprus | 0.26 | % | ||||||||
France | 0.07 | % | ||||||||
India | 7.67 | % | ||||||||
Indonesia | 0.79 | % | ||||||||
Malaysia | 0.20 | % | ||||||||
Mexico | 5.21 | % | ||||||||
Netherlands | 0.72 | % | ||||||||
Peru | 0.68 | % | ||||||||
Poland | 0.25 | % | ||||||||
Republic of Korea | 11.68 | % | ||||||||
Russia | 10.34 | % | ||||||||
South Africa | 0.48 | % | ||||||||
Taiwan | 5.72 | % | ||||||||
Turkey | 2.79 | % | ||||||||
United Kingdom | 0.11 | % | ||||||||
United States | 1.15 | % | ||||||||
Preferred Stock | 5.14 | % | ||||||||
Exchange-Traded Fund | 0.49 | % | ||||||||
Participation Notes | 0.00 | % | ||||||||
Total Value of Securities | 103.35 | % | ||||||||
Liabilities Net of Receivables and Other Assets | (3.35 | %) | ||||||||
Total Net Assets | 100.00 | % | ||||||||
25
Table of Contents
Security type / country and sector allocations
Delaware Emerging Markets Fund
| Common stock, participation notes, and preferred stock by sector² | Percentage of net assets | |||||||||
Consumer Discretionary | 8.88 | % | ||||||||
Consumer Staples | 10.70 | % | ||||||||
Energy | 14.56 | % | ||||||||
Financials | 9.73 | % | ||||||||
Healthcare | 0.98 | % | ||||||||
Industrials | 1.52 | % | ||||||||
Information Technology* | 34.63 | % | ||||||||
Materials | 5.09 | % | ||||||||
Real Estate | 2.25 | % | ||||||||
Telecommunication Services | 13.15 | % | ||||||||
Utilities | 1.37 | % | ||||||||
Total | 102.86 | % | ||||||||
| ² | Narrow industries are utilized for compliance purposes for diversification whereas broad sectors are used for financial reporting. |
| * | To monitor compliance with the Fund’s concentration guidelines as described in the Fund’s Prospectus and Statement of Additional Information, the Information Technology sector (as disclosed herein for financial reporting purposes) is divided into various sub-categories or “industries,” in this case, electronics, Internet, semiconductors, and software. As of Nov. 30, 2016, such amounts, as a percentage of total net assets, were 1.37%, 23.68%, 9.39% and 0.19%, respectively. The percentage in any such single industry will comply with the Fund’s concentration policy even if the percentage in the “Information Technology sector” for financial reporting purposes may exceed 25%. |
26
Table of Contents
Security type / country and sector allocations
| Delaware Global Value Fund | As of November 30, 2016 (Unaudited) |
Sector designations may be different than the sector designations presented in other Fund materials. The sector designations may represent the investment manager’s internal sector classifications, which may result in the sector designations for one fund being different than another fund’s sector designations.
Security type / country
| Percentage of net assets
| |||||||||
Common Stock by Country | 99.31% | |||||||||
Australia | 1.22% | |||||||||
Canada | 3.84% | |||||||||
France | 8.35% | |||||||||
Germany | 1.57% | |||||||||
Indonesia | 1.37% | |||||||||
Israel | 1.77% | |||||||||
Italy | 0.76% | |||||||||
Japan | 12.51% | |||||||||
Netherlands | 3.31% | |||||||||
Republic of Korea | 2.19% | |||||||||
Russia | 0.81% | |||||||||
Sweden | 1.58% | |||||||||
Switzerland | 1.83% | |||||||||
United Kingdom | 9.50% | |||||||||
United States | 48.70% | |||||||||
Short-Term Investments | 0.58% | |||||||||
Securities Lending Collateral | 5.77% | |||||||||
Total Value of Securities | 105.66% | |||||||||
Obligation to Return Securities Lending Collateral | (5.77% | ) | ||||||||
Receivables and Other Assets Net of Liabilities | 0.11% | |||||||||
Total Net Assets | 100.00% | |||||||||
27
Table of Contents
Security type / country and sector allocations
Delaware Global Value Fund
| Common stock by sector
| Percentage of net assets
| |||||||||
Consumer Discretionary | 13.87% | |||||||||
Consumer Staples | 7.01% | |||||||||
Energy | 5.33% | |||||||||
Financials | 22.56% | |||||||||
Healthcare | 10.58% | |||||||||
Industrials | 17.29% | |||||||||
Information Technology | 15.74% | |||||||||
Materials | 0.92% | |||||||||
Telecommunication Services | 6.01% | |||||||||
Total | 99.31% | |||||||||
28
Table of Contents
| Security type / country and sector allocations | ||
| Delaware International Value Equity Fund | As of November 30, 2016 (Unaudited) | |
Sector designations may be different than the sector designations presented in other Fund materials. The sector designations may represent the investment manager’s internal sector classifications, which may result in the sector designations for one fund being different than another fund’s sector designations.
Security type / country
| Percentage of net assets
| |||
Common Stock by Country | 96.41% | |||
Australia | 1.36% | |||
Canada | 4.81% | |||
China/Hong Kong | 6.20% | |||
Denmark | 1.88% | |||
France | 17.35% | |||
Germany | 5.97% | |||
Indonesia | 1.57% | |||
Israel | 2.34% | |||
Italy | 0.96% | |||
Japan | 23.96% | |||
Netherlands | 4.63% | |||
Republic of Korea | 3.13% | |||
Russia | 0.98% | |||
Sweden | 4.73% | |||
Switzerland | 4.69% | |||
United Kingdom | 11.85% | |||
Rights | 0.00% | |||
Short-Term Investments | 2.16% | |||
Securities Lending Collateral | 4.39% | |||
Total Value of Securities | 102.96% | |||
Obligation to Return Securities Lending Collateral | (4.39%) | |||
Receivables and Other Assets Net of Liabilities | 1.43% | |||
Total Net Assets | 100.00% | |||
29
Table of Contents
Security type / country and sector allocations
Delaware International Value Equity Fund
Common stock by sector
| Percentage of net assets
| |||
Consumer Discretionary | 17.35% | |||
Consumer Staples | 9.18% | |||
Energy | 5.48% | |||
Financials | 16.39% | |||
Healthcare | 11.69% | |||
Industrials | 19.99% | |||
Information Technology | 7.10% | |||
Materials | 2.40% | |||
Telecommunication Services | 5.74% | |||
Utilities | 1.09% | |||
Total | 96.41% | |||
30
Table of Contents
| Schedules of investments | ||
| Delaware Emerging Markets Fund | November 30, 2016 |
| Number of shares | Value (U.S. $) | |||||||
| ||||||||
Common Stock – 97.72%D | ||||||||
| ||||||||
Argentina – 3.64% | ||||||||
Arcos Dorados Holdings Class A † | 3,900,000 | $ | 23,010,000 | |||||
Cresud ADR † | 1,470,523 | 23,984,223 | ||||||
Grupo Clarin Class B GDR 144A # | 353,200 | 8,373,983 | ||||||
IRSA Inversiones y Representaciones ADR † | 883,986 | 16,132,745 | ||||||
|
| |||||||
| 71,500,951 | ||||||||
|
| |||||||
Bahrain – 0.05% | ||||||||
Aluminum Bahrain GDR 144A # | 221,400 | 904,397 | ||||||
|
| |||||||
| 904,397 | ||||||||
|
| |||||||
Brazil – 13.80% | ||||||||
Aes Tiete Energia | 508,806 | 2,211,514 | ||||||
B2W Cia Digital † | 8,507,600 | 28,500,793 | ||||||
Braskem ADR | 411,400 | 6,709,934 | ||||||
BRF ADR | 1,563,005 | 23,804,566 | ||||||
Centrais Eletricas Brasileiras † | 2,140,204 | 16,231,644 | ||||||
Cia Brasileira de Distribuicao ADR | 1,049,364 | 16,705,875 | ||||||
Gerdau | 2,764,900 | 7,741,933 | ||||||
Gol Linhas Aereas Inteligentes ADR † | 480,000 | 7,483,200 | ||||||
Hypermarcas | 2,500,000 | 19,196,937 | ||||||
Itau Unibanco Holding ADR | 4,961,000 | 51,296,740 | ||||||
JBS | 4,000,000 | 11,543,295 | ||||||
Rumo Logistica Operadora Multimodal † | 1,439,651 | 2,707,287 | ||||||
Telefonica Brasil ADR | 2,699,863 | 35,233,212 | ||||||
TIM Participacoes ADR | 2,640,000 | 32,102,400 | ||||||
Vale ADR | 1,131,557 | 9,606,919 | ||||||
|
| |||||||
| 271,076,249 | ||||||||
|
| |||||||
Canada – 0.02% | ||||||||
Gran Tierra Energy † | 134,900 | 391,210 | ||||||
|
| |||||||
| 391,210 | ||||||||
|
| |||||||
Chile – 1.02% | ||||||||
Cia Cervecerias Unidas ADR | 365,790 | 7,275,563 | ||||||
Latam Airlines Group ADR † | 236,800 | 2,055,424 | ||||||
Sociedad Quimica y Minera de Chile ADR | 370,000 | 10,589,400 | ||||||
Vina Concha y Toro | 39,250 | 62,563 | ||||||
|
| |||||||
| 19,982,950 | ||||||||
|
| |||||||
China/Hong Kong – 31.07% | ||||||||
58.com ADR † | 115,000 | 3,688,050 | ||||||
Alibaba Group Holding ADR † | 800,000 | 75,216,000 | ||||||
Baidu ADR † | 377,000 | 62,940,150 | ||||||
China Mengniu Dairy | 8,120,000 | 16,645,137 | ||||||
China Mobile ADR | 390,000 | 21,329,100 | ||||||
China Petroleum & Chemical | 30,000,000 | 20,963,063 | ||||||
China Telecom | 13,000,000 | 6,285,051 | ||||||
31
Table of Contents
Schedules of investments
Delaware Emerging Markets Fund
| Number of shares | Value (U.S. $) | |||||||
| ||||||||
Common StockD (continued) | ||||||||
| ||||||||
China/Hong Kong (continued) | ||||||||
China Unicom Hong Kong | 2,688,000 | $ | 3,264,483 | |||||
China Unicom Hong Kong ADR | 77,100 | 927,513 | ||||||
Ctrip.com International ADR † | 900,000 | 40,707,000 | ||||||
Guangshen Railway | 11,000,000 | 5,814,478 | ||||||
JD.com ADR † | 780,000 | 20,958,600 | ||||||
Kunlun Energy | 10,004,000 | 7,312,922 | ||||||
Qunar Cayman Islands ADR † | 204,441 | 6,139,363 | ||||||
SINA † | 1,594,800 | 122,895,288 | ||||||
Sinofert Holdings | 28,000,000 | 3,862,567 | ||||||
Sohu.com † | 1,770,401 | 61,308,987 | ||||||
Tencent Holdings | 2,000,000 | 49,945,207 | ||||||
Tianjin Development Holdings | 15,885,550 | 8,417,406 | ||||||
Tingyi Cayman Islands Holding | 22,288,000 | 26,493,310 | ||||||
Uni-President China Holdings | 30,000,000 | 20,924,386 | ||||||
Vipshop Holdings ADR † | 220,000 | 2,468,400 | ||||||
Weibo ADR † | 359,480 | 18,444,919 | ||||||
ZTO Express Cayman ADR † | 240,000 | 3,631,200 | ||||||
|
| |||||||
| 610,582,580 | ||||||||
|
| |||||||
Cyprus – 0.26% | ||||||||
QIWI ADR | 385,284 | 5,124,277 | ||||||
|
| |||||||
| 5,124,277 | ||||||||
|
| |||||||
France – 0.07% | ||||||||
Vallourec † | 258,011 | 1,454,496 | ||||||
|
| |||||||
| 1,454,496 | ||||||||
|
| |||||||
India – 7.67% | ||||||||
ICICI Bank | 4,700,000 | 18,233,808 | ||||||
Indiabulls Real Estate GDR † | 102,021 | 104,265 | ||||||
RattanIndia Infrastructure GDR =† | 300,961 | 13,410 | ||||||
Reliance Communications † | 10,114,849 | 5,578,399 | ||||||
Reliance Industries | 4,800,000 | 69,427,508 | ||||||
Reliance Industries GDR 144A # | 1,543,197 | 44,212,594 | ||||||
Tata Chemicals | 1,866,909 | 13,075,382 | ||||||
|
| |||||||
| 150,645,366 | ||||||||
|
| |||||||
Indonesia – 0.79% | ||||||||
Astra International | 28,000,000 | 15,598,598 | ||||||
|
| |||||||
| 15,598,598 | ||||||||
|
| |||||||
Malaysia – 0.20% | ||||||||
UEM Sunrise | 17,000,000 | 3,958,800 | ||||||
|
| |||||||
| 3,958,800 | ||||||||
|
| |||||||
32
Table of Contents
| Number of shares | Value (U.S. $) | |||||||
| ||||||||
Common StockD (continued) | ||||||||
| ||||||||
Mexico – 5.21% | ||||||||
America Movil ADR | 1,695,830 | $ | 20,536,497 | |||||
Cemex ADR † | 1,250,000 | 9,762,500 | ||||||
Coca-Cola Femsa ADR | 227,840 | 14,331,136 | ||||||
Fomento Economico Mexicano ADR | 120,022 | 9,367,717 | ||||||
Grupo Financiero Santander Mexico Class B ADR | 2,700,698 | 18,931,893 | ||||||
Grupo Lala | 3,000,000 | 4,519,829 | ||||||
Grupo Televisa ADR | 1,200,000 | 24,924,000 | ||||||
|
| |||||||
| 102,373,572 | ||||||||
|
| |||||||
Netherlands – 0.72% | ||||||||
VimpelCom ADR | 4,230,865 | 14,215,706 | ||||||
|
| |||||||
| 14,215,706 | ||||||||
|
| |||||||
Peru – 0.68% | ||||||||
Cia de Minas Buenaventura ADR | 1,200,000 | 13,404,000 | ||||||
|
| |||||||
| 13,404,000 | ||||||||
|
| |||||||
Poland – 0.25% | ||||||||
Jastrzebska Spolka Weglowa † | 254,155 | 5,005,818 | ||||||
|
| |||||||
| 5,005,818 | ||||||||
|
| |||||||
Republic of Korea – 11.68% | ||||||||
KB Financial Group ADR | 245,928 | 8,809,141 | ||||||
LG Uplus | 2,774,522 | 27,174,438 | ||||||
Lotte Chilsung Beverage | 12,500 | 16,755,057 | ||||||
Lotte Confectionery | 120,000 | 18,322,570 | ||||||
NAVER | 15,652 | 10,684,142 | ||||||
Samsung Electronics | 48,000 | 71,688,978 | ||||||
Samsung Life Insurance | 130,000 | 12,676,960 | ||||||
SK Telecom ADR | 2,985,650 | 63,295,780 | ||||||
|
| |||||||
| 229,407,066 | ||||||||
|
| |||||||
Russia – 10.34% | ||||||||
Chelyabinsk Zinc Plant GDR † | 143,300 | 1,373,645 | ||||||
Enel OGK-5 GDR † | 21,161 | 17,187 | ||||||
Etalon Group GDR 144A #= | 1,616,300 | 4,428,662 | ||||||
Gazprom ADR | 8,000,000 | 36,872,000 | ||||||
MegaFon GDR | 450,000 | 3,937,500 | ||||||
Mobile TeleSystems ADR | 1,200,000 | 9,396,000 | ||||||
Rosneft GDR | 7,730,000 | 40,659,800 | ||||||
Sberbank of Russia = | 12,000,000 | 29,698,246 | ||||||
Sberbank of Russia ADR | 1,400,000 | 14,035,000 | ||||||
Surgutneftegas ADR | 1,905,631 | 8,661,093 | ||||||
T Plus † | 36,096 | 253 | ||||||
X5 Retail Group GDR † | 526,952 | 15,808,560 | ||||||
Yandex Class A † | 2,010,000 | 38,210,100 | ||||||
|
| |||||||
| 203,098,046 | ||||||||
|
| |||||||
33
Table of Contents
Schedules of investments
Delaware Emerging Markets Fund
| Number of shares | Value (U.S. $) | |||||||
| ||||||||
Common StockD (continued) | ||||||||
| ||||||||
South Africa – 0.48% | ||||||||
Sun International | 290,543 | $ | 1,656,472 | |||||
Tongaat Hulett | 838,307 | 7,742,020 | ||||||
|
| |||||||
| 9,398,492 | ||||||||
|
| |||||||
Taiwan – 5.72% | ||||||||
Hon Hai Precision Industry | 10,500,000 | 27,013,460 | ||||||
MediaTek | 6,500,000 | 45,171,462 | ||||||
Taiwan Semiconductor Manufacturing | 7,000,000 | 40,190,757 | ||||||
|
| |||||||
| 112,375,679 | ||||||||
|
| |||||||
Turkey – 2.79% | ||||||||
Akbank | 15,000,000 | 32,962,715 | ||||||
Turk Telekomunikasyon | 951,192 | 1,531,010 | ||||||
Turkcell Iletisim Hizmetleri ADR † | 2,059,101 | 13,590,067 | ||||||
Turkiye Sise ve Cam Fabrikalari | 6,971,317 | 6,736,552 | ||||||
|
| |||||||
| 54,820,344 | ||||||||
|
| |||||||
United Kingdom – 0.11% | ||||||||
Griffin Mining † | 3,056,187 | 2,084,026 | ||||||
|
| |||||||
| 2,084,026 | ||||||||
|
| |||||||
United States – 1.15% | ||||||||
Yahoo † | 500,000 | 20,510,000 | ||||||
Yum China Holdings † | 77,400 | 2,176,488 | ||||||
|
| |||||||
| 22,686,488 | ||||||||
|
| |||||||
Total Common Stock (cost $2,209,517,022) | 1,920,089,111 | |||||||
|
| |||||||
| ||||||||
Preferred Stock – 5.14%D | ||||||||
| ||||||||
Brazil – 2.72% | ||||||||
Braskem Class A 3.84% | 1,470,000 | 11,952,810 | ||||||
Petroleo Brasileiro Class A ADR † | 4,000,000 | 37,520,000 | ||||||
Usinas Siderurgicas de Minas Gerais SA † | 3,235,733 | 3,970,459 | ||||||
|
| |||||||
| 53,443,269 | ||||||||
|
| |||||||
Republic of Korea – 1.40% | ||||||||
Samsung Electronics 1.50% | 23,662 | 27,445,936 | ||||||
|
| |||||||
| 27,445,936 | ||||||||
|
| |||||||
Russia – 1.02% | ||||||||
AK Transneft =† | 7,239 | 20,071,645 | ||||||
|
| |||||||
| 20,071,645 | ||||||||
|
| |||||||
Total Preferred Stock (cost $61,970,597) | 100,960,850 | |||||||
|
| |||||||
| ||||||||
Exchange-Traded Fund – 0.49% | ||||||||
| ||||||||
iShares MSCI Turkey ETF | 300,500 | 9,561,910 | ||||||
|
| |||||||
Total Exchange-Traded Fund (cost $13,682,561) | 9,561,910 | |||||||
|
| |||||||
34
Table of Contents
| Number of shares | Value (U.S. $) | |||||||
| ||||||||
Participation Notes – 0.00% | ||||||||
| ||||||||
Lehman Indian Oil | 172,132 | 0 | ||||||
Lehman Oil & Natural Gas | 254,590 | 0 | ||||||
|
| |||||||
Total Participation Notes (cost $8,559,057) | 0 | |||||||
|
| |||||||
Total Value of Securities – 103.35% | $ | 2,030,611,871 | ||||||
|
| |||||||
| # | Security exempt from registration under Rule 144A of the Securities Act of 1933, as amended. At Nov. 30, 2016, the aggregate value of Rule 144A securities was $57,919,636, which represents 2.95% of the Fund’s net assets. See Note 11 in “Notes to financial statements.” |
| = | Security is being fair valued in accordance with the Fund’s fair valuation policy. At Nov. 30, 2016, the aggregate value of fair valued securities was $54,211,963, which represents 2.76% of the Fund’s net assets. See Note 1 in “Notes to financial statements.” |
| D | Securities have been classified by country of origin. Aggregate classification by business sectors has been presented on page 26 in “Security type / country and sector allocations.” |
| † | Non-income-producing security. |
The following foreign currency exchange contracts were outstanding at Nov. 30, 2016:1
Foreign Currency Exchange Contracts
Counterparty | Contracts to Receive (Deliver) | In Exchange For | Settlement Date | Unrealized Appreciation (Depreciation) | ||||||
BNYM | BRL 445,610 | USD (131,627) | 12/1/16 | $ | 91 | |||||
The use of foreign currency exchange contracts involves elements of market risk and risks in excess of the amounts disclosed in the financial statements. The foreign currency exchange contracts presented above represents the Fund’s total exposure in such contracts, whereas only the net unrealized appreciation (depreciation) is reflected in the Fund’s net assets.
1See Note 8 in “Notes to financial statements.”
Summary of abbreviations:
ADR – American Depositary Receipt
BNYM – BNY Mellon
BRL – Brazilian Real
ETF – Exchange-Traded Fund
GDR – Global Depositary Receipt
LEPO – Low Exercise Price Option
USD – U.S. Dollar
See accompanying notes, which are an integral part of the financial statements.
35
Table of Contents
| Schedules of investments | ||
| Delaware Global Value Fund | November 30, 2016 |
| , | Number of shares | Value (U.S. $) | ||||||
| ||||||||
Common Stock – 99.31%D | ||||||||
| ||||||||
Australia – 1.22% | ||||||||
Coca-Cola Amatil | 31,231 | $ | 221,170 | |||||
|
| |||||||
| 221,170 | ||||||||
|
| |||||||
Canada – 3.84% | ||||||||
CGI Group Class A † | 7,548 | 357,537 | ||||||
Suncor Energy * | 10,710 | 341,081 | ||||||
|
| |||||||
| 698,618 | ||||||||
|
| |||||||
France – 8.35% | ||||||||
AXA | 13,501 | 318,090 | ||||||
Sanofi | 5,175 | 417,442 | ||||||
TOTAL | 6,021 | 286,874 | ||||||
Valeo | 4,048 | 225,711 | ||||||
Vinci | 4,165 | 270,286 | ||||||
|
| |||||||
| 1,518,403 | ||||||||
|
| |||||||
Germany – 1.57% | ||||||||
Bayerische Motoren Werke | 3,342 | 284,814 | ||||||
|
| |||||||
| 284,814 | ||||||||
|
| |||||||
Indonesia – 1.37% | ||||||||
Bank Rakyat Indonesia Persero | 309,281 | 248,748 | ||||||
|
| |||||||
| 248,748 | ||||||||
|
| |||||||
Israel – 1.77% | ||||||||
Teva Pharmaceutical Industries ADR | 8,530 | 321,581 | ||||||
|
| |||||||
| 321,581 | ||||||||
|
| |||||||
Italy – 0.76% | ||||||||
UniCredit | 64,860 | 138,996 | ||||||
|
| |||||||
| 138,996 | ||||||||
|
| |||||||
Japan – 12.51% | ||||||||
East Japan Railway | 3,670 | 313,284 | ||||||
ITOCHU | 21,078 | 287,783 | ||||||
Japan Tobacco | 12,595 | 434,420 | ||||||
Minebea | 22,020 | 218,266 | ||||||
Mitsubishi UFJ Financial Group | 27,924 | 163,485 | ||||||
Nippon Telegraph & Telephone | 7,276 | 294,144 | ||||||
Sumitomo Rubber Industries | 20,730 | 342,284 | ||||||
Toyota Motor | 3,820 | 222,011 | ||||||
|
| |||||||
| 2,275,677 | ||||||||
|
| |||||||
Netherlands – 3.31% | ||||||||
ING Groep CVA | 28,878 | �� | 393,292 | |||||
Koninklijke Philips | 7,262 | 208,887 | ||||||
|
| |||||||
| 602,179 | ||||||||
|
| |||||||
36
Table of Contents
| Number of shares | Value (U.S. $) | |||||||
| ||||||||
Common StockD (continued) | ||||||||
| ||||||||
Republic of Korea – 2.19% | ||||||||
Samsung Electronics | 267 | $ | 398,770 | |||||
|
| |||||||
| 398,770 | ||||||||
|
| |||||||
Russia – 0.81% | ||||||||
Mobile TeleSystems ADR | 18,945 | 148,339 | ||||||
|
| |||||||
| 148,339 | ||||||||
|
| |||||||
Sweden – 1.58% | ||||||||
Tele2 Class B * | 37,675 | 287,787 | ||||||
|
| |||||||
| 287,787 | ||||||||
|
| |||||||
Switzerland – 1.83% | ||||||||
Aryzta † | 7,826 | 333,454 | ||||||
|
| |||||||
| 333,454 | ||||||||
|
| |||||||
United Kingdom – 9.50% | ||||||||
Meggitt | 52,636 | 311,114 | ||||||
Playtech | 30,801 | 331,043 | ||||||
Rio Tinto | 4,475 | 167,414 | ||||||
Shire | 5,681 | 331,236 | ||||||
Standard Chartered † | 37,478 | 300,628 | ||||||
Tesco † | 109,560 | 286,089 | ||||||
|
| |||||||
| 1,727,524 | ||||||||
|
| |||||||
United States – 48.70% | ||||||||
American Airlines Group * | 11,305 | 525,004 | ||||||
Apple | 5,455 | 602,887 | ||||||
AT&T | 9,395 | 362,929 | ||||||
Caterpillar * | 4,465 | 426,675 | ||||||
Cintas | 2,280 | 261,288 | ||||||
Delphi Automotive | 4,365 | 279,360 | ||||||
Goldman Sachs Group | 2,575 | 564,672 | ||||||
Halliburton | 6,425 | 341,103 | ||||||
International Business Machines | 1,585 | 257,119 | ||||||
Johnson & Johnson | 2,670 | 297,171 | ||||||
JPMorgan Chase & Co. | 6,840 | 548,363 | ||||||
Lowe’s | 3,175 | 223,996 | ||||||
Mylan † | 5,355 | 196,046 | ||||||
NASDAQ OMX Group | 8,330 | 533,870 | ||||||
Omnicom Group | 3,970 | 345,152 | ||||||
Oracle | 13,785 | 554,019 | ||||||
Pfizer | 11,210 | 360,289 | ||||||
Target | 5,655 | 436,792 | ||||||
Travelers | 3,770 | 427,329 | ||||||
Viacom Class B | 4,365 | 163,600 | ||||||
Wells Fargo & Co. | 8,825 | 467,019 | ||||||
37
Table of Contents
Schedules of investments
Delaware Global Value Fund
| Number of shares | Value (U.S. $) | |||||||
| ||||||||
Common StockD (continued) | ||||||||
| ||||||||
United States (continued) | ||||||||
WESCO International † | 4,760 | $ | 323,204 | |||||
Western Union * | 17,160 | 360,875 | ||||||
|
| |||||||
| 8,858,762 | ||||||||
|
| |||||||
Total Common Stock (cost $16,880,879) | 18,064,822 | |||||||
|
| |||||||
| Principal amount° | ||||||||
| ||||||||
Short-Term Investments – 0.58% | ||||||||
| ||||||||
Discount Notes – 0.50%≠ | ||||||||
Federal Home Loan Bank | ||||||||
0.26% 12/20/16 | 10,146 | 10,145 | ||||||
0.284% 12/21/16 | 69,306 | 69,299 | ||||||
0.39% 2/3/17 | 10,146 | 10,138 | ||||||
|
| |||||||
| 89,582 | ||||||||
|
| |||||||
Repurchase Agreements – 0.08% | ||||||||
Bank of America Merrill Lynch | 5,519 | 5,519 | ||||||
Bank of Montreal | 9,199 | 9,199 | ||||||
BNP Paribas | 282 | 282 | ||||||
|
| |||||||
| 15,000 | ||||||||
|
| |||||||
Total Short-Term Investments (cost $104,579) | 104,582 | |||||||
|
| |||||||
Total Value of Securities Before Securities Lending Collateral – 99.89% |
| 18,169,404 | ||||||
|
| |||||||
38
Table of Contents
| Number of shares | Value (U.S. $) | |||||||
| ||||||||
Securities Lending Collateral – 5.77%** | ||||||||
| ||||||||
Certificates of Deposit – 1.29%≠ | ||||||||
Australia & New Zealand Banking Group (London) | 47,000 | $ | 47,000 | |||||
Canadian Imperial Bank of Commerce (Cayman) | 47,000 | 47,000 | ||||||
National Australia Bank (Cayman) 0.30% 12/1/16 | 47,000 | 47,000 | ||||||
National Bank of Canada (Montreal) 0.30% 12/1/16 | 47,000 | 47,000 | ||||||
Royal Bank of Canada (Toronto) 0.30% 12/1/16 | 47,000 | 47,000 | ||||||
|
| |||||||
| 235,000 | ||||||||
|
| |||||||
Repurchase Agreements – 4.48%≠ | ||||||||
Bank of Montreal 0.26%, dated 11/30/16, to be repurchased on 12/1/16, | 244,552 | 244,552 | ||||||
Bank of Nova Scotia | 244,552 | 244,552 | ||||||
BNP Paribas | 244,552 | 244,552 | ||||||
Merrill Lynch, Pierce, Fenner & Smith | 82,038 | 82,038 | ||||||
|
| |||||||
| 815,694 | ||||||||
|
| |||||||
Total Securities Lending Collateral (cost $1,050,694) | 1,050,694 | |||||||
|
| |||||||
Total Value of Securities – 105.66% |
| $ | 19,220,098∎ | |||||
|
| |||||||
| * | Fully or partially on loan. |
| ** | See Note 10 in “Notes to financial statements” for additional information on securities lending collateral and non-cash collateral. |
| ≠ | The rate shown is the effective yield at the time of purchase. |
| ∎ | Includes $1,562,207 of securities loaned. |
39
Table of Contents
Schedules of investments
Delaware Global Value Fund
| ° | Principal amount shown is stated in U.S. dollars unless noted that the security is denominated in another currency. |
| D | Securities have been classified by country of origin. Aggregate classification by business sectors has been presented on page 28 in “Security type / country and sector allocations.” |
| † | Non-income-producing security. |
Summary of abbreviations:
ADR – American Depositary Receipt
CVA – Dutch Certificate
See accompanying notes, which are an integral part of the financial statements.
40
Table of Contents
| Schedules of investments | ||
| Delaware International Value Equity Fund | November 30, 2016 |
| Number of shares | Value (U.S. $) | |||||||
| ||||||||
Common Stock – 96.41%D | ||||||||
| ||||||||
Australia – 1.36% | ||||||||
Coca-Cola Amatil | 466,430 | $ | 3,303,134 | |||||
|
| |||||||
| 3,303,134 | ||||||||
|
| |||||||
Canada – 4.81% | ||||||||
Alamos Gold * | 231,695 | 1,474,721 | ||||||
CGI Group Class A † | 103,373 | 4,896,616 | ||||||
Suncor Energy * | 138,700 | 4,417,171 | ||||||
Yamana Gold | 307,572 | 918,160 | ||||||
|
| |||||||
| 11,706,668 | ||||||||
|
| |||||||
China/Hong Kong – 6.20% | ||||||||
CNOOC | 3,112,000 | 3,923,852 | ||||||
Techtronic Industries | 1,158,000 | 4,516,148 | ||||||
Yue Yuen Industrial Holdings | 1,852,000 | 6,673,551 | ||||||
|
| |||||||
| 15,113,551 | ||||||||
|
| |||||||
Denmark – 1.88% | ||||||||
Carlsberg Class B | 53,908 | 4,584,255 | ||||||
|
| |||||||
| 4,584,255 | ||||||||
|
| |||||||
France – 17.35% | ||||||||
AXA | 272,176 | 6,412,593 | ||||||
Kering | 19,008 | 4,129,854 | ||||||
Publicis Groupe | 33,336 | 2,163,327 | ||||||
Rexel | 155,324 | 2,401,808 | ||||||
Sanofi | 101,178 | 8,161,542 | ||||||
Teleperformance | 43,152 | 4,213,990 | ||||||
TOTAL | 105,244 | 5,014,409 | ||||||
Valeo | 53,236 | 2,968,371 | ||||||
Vinci | 104,552 | 6,784,862 | ||||||
|
| |||||||
| 42,250,756 | ||||||||
|
| |||||||
Germany – 5.97% | ||||||||
Bayerische Motoren Werke | 59,772 | 5,093,922 | ||||||
Deutsche Post | 196,561 | 6,143,509 | ||||||
STADA Arzneimittel | 67,810 | 3,312,416 | ||||||
|
| |||||||
| 14,549,847 | ||||||||
|
| |||||||
Indonesia – 1.57% | ||||||||
Bank Rakyat Indonesia Persero | 4,756,600 | 3,825,637 | ||||||
|
| |||||||
| 3,825,637 | ||||||||
|
| |||||||
Israel – 2.34% | ||||||||
Teva Pharmaceutical Industries ADR | 151,400 | 5,707,780 | ||||||
|
| |||||||
| 5,707,780 | ||||||||
|
| |||||||
Italy – 0.96% | ||||||||
UniCredit* | 1,091,365 | 2,338,813 | ||||||
|
| |||||||
| 2,338,813 | ||||||||
|
| |||||||
41
Table of Contents
Schedules of investments
Delaware International Value Equity Fund
| Number of shares | Value (U.S. $) | |||||||
| ||||||||
Common StockD (continued) | ||||||||
| ||||||||
Japan – 23.96% | ||||||||
East Japan Railway | 76,944 | $ | 6,568,202 | |||||
ITOCHU | 593,460 | 8,102,657 | ||||||
Japan Tobacco | 171,100 | 5,901,496 | ||||||
Minebea | 449,000 | 4,450,557 | ||||||
Mitsubishi UFJ Financial Group | 1,539,457 | 9,012,965 | ||||||
Nippon Telegraph & Telephone | 188,656 | 7,626,712 | ||||||
Nitori Holdings | 35,894 | 3,746,116 | ||||||
Sumitomo Rubber Industries | 290,300 | 4,793,293 | ||||||
Toyota Motor | 140,500 | 8,165,591 | ||||||
|
| |||||||
| 58,367,589 | ||||||||
|
| |||||||
Netherlands – 4.63% | ||||||||
ING Groep CVA | 409,583 | 5,578,141 | ||||||
Koninklijke Philips | 198,466 | 5,708,741 | ||||||
|
| |||||||
| 11,286,882 | ||||||||
|
| |||||||
Republic of Korea – 3.13% | ||||||||
Samsung Electronics | 5,099 | 7,615,460 | ||||||
|
| |||||||
| 7,615,460 | ||||||||
|
| |||||||
Russia – 0.98% | ||||||||
Mobile TeleSystems ADR | 305,200 | 2,389,716 | ||||||
|
| |||||||
| 2,389,716 | ||||||||
|
| |||||||
Sweden – 4.73% | ||||||||
Nordea Bank | 717,347 | 7,536,857 | ||||||
Tele2 Class B * | 520,149 | 3,973,251 | ||||||
|
| |||||||
| 11,510,108 | ||||||||
|
| |||||||
Switzerland – 4.69% | ||||||||
Aryzta *† | 109,405 | 4,661,576 | ||||||
Novartis | 97,878 | 6,762,988 | ||||||
|
| |||||||
| 11,424,564 | ||||||||
|
| |||||||
United Kingdom – 11.85% | ||||||||
Meggitt | 729,557 | 4,312,170 | ||||||
National Grid | 232,015 | 2,650,994 | ||||||
Playtech | 445,815 | 4,791,534 | ||||||
Rio Tinto | 92,319 | 3,453,735 | ||||||
Shire | 77,640 | 4,526,872 | ||||||
Standard Chartered † | 649,395 | 5,209,085 | ||||||
Tesco † | 1,500,381 | 3,917,876 | ||||||
|
| |||||||
| 28,862,266 | ||||||||
|
| |||||||
Total Common Stock (cost $240,203,557) | 234,837,026 | |||||||
|
| |||||||
42
Table of Contents
| Number of shares | Value (U.S. $) | |||||||
| ||||||||
Rights – 0.00% | ||||||||
| ||||||||
Yamana Gold | ||||||||
exercise price CAD 3.25 | ||||||||
expiration date 12/21/16 †
|
| 19,223
|
| $
| 4,722
|
| ||
|
| |||||||
Total Rights (cost $0) | 4,722 | |||||||
|
| |||||||
| Principal amount° | ||||||||
| ||||||||
Short-Term Investments – 2.16% | ||||||||
| ||||||||
Discount Notes – 1.81%≠ | ||||||||
Federal Home Loan Bank | ||||||||
0.26% 12/20/16 | 397,853 | 397,815 | ||||||
0.289% 12/21/16 | 2,462,287 | 2,462,041 | ||||||
0.31% 1/25/17 | 362,785 | 362,596 | ||||||
0.38% 1/27/17 | 795,705 | 795,277 | ||||||
0.39% 2/3/17 | 397,853 | 397,534 | ||||||
|
| |||||||
| 4,415,263 | ||||||||
|
| |||||||
Repurchase Agreements – 0.35% | ||||||||
Bank of America Merrill Lynch | 311,292 | 311,292 | ||||||
Bank of Montreal | 518,820 | 518,820 | ||||||
BNP Paribas | 15,888 | 15,888 | ||||||
|
| |||||||
| 846,000 | ||||||||
|
| |||||||
Total Short-Term Investments (cost $5,261,106) | 5,261,263 | |||||||
|
| |||||||
Total Value of Securities Before Securities Lending Collateral – 98.57% |
| 240,103,011 | ||||||
|
| |||||||
43
Table of Contents
Schedules of investments
Delaware International Value Equity Fund
| Number of shares | Value (U.S. $) | |||||||
| ||||||||
Securities Lending Collateral – 4.39%** | ||||||||
| ||||||||
Certificates of Deposit – 0.99%≠ | ||||||||
Australia & New Zealand Banking Group (London) | 481,000 | $ | 481,000 | |||||
Canadian Imperial Bank of Commerce (Cayman) | 481,000 | 481,000 | ||||||
National Australia Bank (Cayman) 0.30% 12/1/16 | 481,000 | 481,000 | ||||||
National Bank of Canada (Montreal) 0.30% 12/1/16 | 481,000 | 481,000 | ||||||
Royal Bank of Canada (Toronto) 0.30% 12/1/16 | 481,000 | 481,000 | ||||||
|
| |||||||
| 2,405,000 | ||||||||
|
| |||||||
Repurchase Agreements – 3.40%≠ | ||||||||
Bank of Montreal | 2,490,053 | 2,490,053 | ||||||
Bank of Nova Scotia | 2,490,053 | 2,490,053 | ||||||
BNP Paribas | 2,490,053 | 2,490,053 | ||||||
Merrill Lynch, Pierce, Fenner & Smith | 823,076 | 823,076 | ||||||
|
| |||||||
| 8,293,235 | ||||||||
|
| |||||||
Total Securities Lending Collateral (cost $10,698,235) | 10,698,235 | |||||||
|
| |||||||
Total Value of Securities – 102.96% | $ | 250,801,246∎ | ||||||
|
| |||||||
| * | Fully or partially on loan. |
| ** | See Note 10 in “Notes to financial statements” for additional information on securities lending collateral and non-cash collateral. |
| ≠ | The rate shown is the effective yield at the time of purchase. |
| ∎ | Includes $10,369,802 of securities loaned. |
44
Table of Contents
| ° | Principal amount shown is stated in U.S. dollars unless noted that the security is denominated in another currency. |
| D | Securities have been classified by country of origin. Aggregate classification by business sectors has been presented on page 30 in “Security type / country and sector allocations.” |
| † | Non-income-producing security. |
Summary of abbreviations:
ADR – American Depositary Receipt
CAD – Canadian Dollar
CVA – Dutch Certificate
See accompanying notes, which are an integral part of the financial statements.
45
Table of Contents
Statements of assets and liabilities
November 30, 2016
Delaware Markets Fund | Delaware Value Fund | Delaware International Value Equity Fund | ||||||||||||||||||
Assets: | ||||||||||||||||||||
Investments, at value1, 2 | $ | 2,030,611,871 | $ | 18,064,822 | $ | 234,841,748 | ||||||||||||||
Short-term investments, at value3 | — | 104,582 | 5,261,263 | |||||||||||||||||
Short-term investments held as collateral for loaned securities, at value4 | — | 1,050,694 | 10,698,235 | |||||||||||||||||
Foreign currencies, at value5 | 4,280,922 | 11,674 | 318,003 | |||||||||||||||||
Cash | — | 719 | 825 | |||||||||||||||||
Receivable for securities sold | 8,975,522 | — | — | |||||||||||||||||
Receivable for fund shares sold | 8,918,214 | 130 | 2,625,855 | |||||||||||||||||
Dividends and interest receivable | 1,811,501 | 47,244 | 626,498 | |||||||||||||||||
Foreign tax reclaims receivable | 107,858 | 9,120 | 544,380 | |||||||||||||||||
Securities lending income receivable | — | 230 | 1,581 | |||||||||||||||||
Unrealized appreciation on foreign currency exchange contracts | 91 | — | — | |||||||||||||||||
|
|
|
|
|
| |||||||||||||||
Total assets | 2,054,705,979 | 19,289,215 | 254,918,388 | |||||||||||||||||
|
|
|
|
|
| |||||||||||||||
Liabilities: | ||||||||||||||||||||
Cash overdraft | 75,736,918 | — | — | |||||||||||||||||
Payable for fund shares redeemed | 5,078,568 | 15,368 | 302,852 | |||||||||||||||||
Payable for securities purchased | 4,813,517 | — | — | |||||||||||||||||
Obligation to return securities lending collateral | — | 1,050,449 | 10,695,947 | |||||||||||||||||
Investment management fees payable to affiliates | 1,788,718 | 10,744 | 169,903 | |||||||||||||||||
Other accrued expenses | 1,156,450 | 16,492 | 132,009 | |||||||||||||||||
Distribution fees payable to affiliates | 209,941 | 5,866 | 29,977 | |||||||||||||||||
Dividend disbursing and transfer agent fees and expenses payable to affiliates | 32,375 | 299 | 4,052 | |||||||||||||||||
Trustees’ fees and expenses payable | 13,485 | 118 | 1,654 | |||||||||||||||||
Accounting and administration expenses payable to affiliates | 7,529 | 70 | 942 | |||||||||||||||||
Legal fees payable to affiliates | 3,399 | 32 | 413 | |||||||||||||||||
Reports and statements to shareholders payable to affiliates | 1,425 | 13 | 177 | |||||||||||||||||
Deferred capital gains tax | 1,213,706 | — | — | |||||||||||||||||
Other liabilities | — | 257 | 2,452 | |||||||||||||||||
|
|
|
|
|
| |||||||||||||||
Total liabilities | 90,056,031 | 1,099,708 | 11,340,378 | |||||||||||||||||
|
|
|
|
|
| |||||||||||||||
Total Net Assets | $ | 1,964,649,948 | $ | 18,189,507 | $ | 243,578,010 | ||||||||||||||
|
|
|
|
|
| |||||||||||||||
46
Table of Contents
Delaware Markets Fund | Delaware Value Fund | Delaware International Value Equity Fund | ||||||||||
Net Assets Consist of: | ||||||||||||
Paid-in capital | $ | 2,323,309,169 | $ | 29,314,524 | $ | 372,196,601 | ||||||
Undistributed (distributions in excess of) net investment income | (13,846,504 | ) | 284,100 | 5,165,041 | ||||||||
Accumulated net realized loss on investments | (80,462,473 | ) | (12,591,041 | ) | (128,332,050 | ) | ||||||
Net unrealized appreciation (depreciation) of investments | (264,331,072 | ) | 1,183,946 | (5,361,652 | ) | |||||||
Net unrealized appreciation (depreciation) of foreign currencies | (19,263 | ) | (2,022 | ) | (89,930 | ) | ||||||
Net unrealized appreciation (depreciation) of foreign currency exchange contracts | 91 | — | — | |||||||||
|
|
|
|
|
| |||||||
Total Net Assets | $ | 1,964,649,948 | $ | 18,189,507 | $ | 243,578,010 | ||||||
|
|
|
|
|
| |||||||
Net Asset Value | ||||||||||||
Class A: | ||||||||||||
Net assets | $ | 461,123,995 | $ | 12,459,632 | $ | 54,966,543 | ||||||
Shares of beneficial interest outstanding, unlimited authorization, no par | 31,642,995 | 1,087,013 | 4,248,833 | |||||||||
Net asset value per share | $ | 14.57 | $ | 11.46 | $ | 12.94 | ||||||
Sales charge | 5.75 | % | 5.75 | % | 5.75 | % | ||||||
Offering price per share, equal to net asset value per share / (1 – sales charge) | $ | 15.46 | $ | 12.16 | $ | 13.73 | ||||||
Class C: | ||||||||||||
Net assets | $ | 120,306,392 | $ | 4,115,573 | $ | 21,671,750 | ||||||
Shares of beneficial interest outstanding, unlimited authorization, no par | 8,870,838 | 367,504 | 1,707,381 | |||||||||
Net asset value per share | $ | 13.56 | $ | 11.20 | $ | 12.69 | ||||||
Class R: | ||||||||||||
Net assets | $ | 36,590,649 | $ | — | $ | 1,578,378 | ||||||
Shares of beneficial interest outstanding, unlimited authorization, no par | 2,496,699 | — | 122,522 | |||||||||
Net asset value per share | $ | 14.66 | $ | — | $ | 12.88 | ||||||
47
Table of Contents
Statements of assets and liabilities
Delaware Markets Fund | Delaware Value Fund | Delaware International Value Equity Fund | ||||||||||
Institutional Class: | ||||||||||||
Net assets | $ | 1,346,361,360 | $ | 1,614,302 | $ | 165,361,339 | ||||||
Shares of beneficial interest outstanding, unlimited authorization, no par | 91,667,951 | 140,220 | 12,718,696 | |||||||||
Net asset value per share | $ | 14.69 | $ | 11.51 | $ | 13.00 | ||||||
Class R6: | ||||||||||||
Net assets | $ | 267,552 | $ | — | $ | — | ||||||
Shares of beneficial interest outstanding, unlimited authorization, no par | 18,211 | — | — | |||||||||
Net asset value per share | $ | 14.69 | $ | — | $ | — | ||||||
| ||||||||||||
1 Investments, at cost | $ | 2,293,729,237 | $ | 16,880,879 | $ | 240,203,557 | ||||||
2 Including securities on loan | — | 1,562,207 | 10,369,802 | |||||||||
3 Short-term investments, at cost | — | 104,579 | 5,261,106 | |||||||||
4 Short-term investments held as collateral for loaned securities, at cost | — | 1,050,694 | 10,698,235 | |||||||||
5 Foreign currencies, at cost | 4,299,814 | 11,724 | 322,677 | |||||||||
See accompanying notes, which are an integral part of the financial statements.
48
Table of Contents
This page intentionally left blank.
Table of Contents
| Statements of operations | ||
| Delaware International Funds | Year ended November 30, 2016 | |
Delaware Fund | Delaware Fund | Delaware International Value Equity Fund | ||||||||||
Investment Income: | ||||||||||||
Dividends | $ | 35,871,007 | $ | 515,894 | $ | 7,873,423 | ||||||
Interest | 6,700 | 471 | 10,748 | |||||||||
Securities lending income | — | 3,734 | 35,033 | |||||||||
Foreign tax withheld | (2,733,118 | ) | (32,304 | ) | (818,604 | ) | ||||||
|
|
|
|
|
| |||||||
| 33,144,589 | 487,795 | 7,100,600 | ||||||||||
|
|
|
|
|
| |||||||
Expenses: | ||||||||||||
Management fees | 18,925,585 | 161,612 | 2,105,161 | |||||||||
Distribution expenses — Class A | 766,417 | 32,366 | 150,533 | |||||||||
Distribution expenses — Class C | 1,196,056 | 42,908 | 237,165 | |||||||||
Distribution expenses — Class R | 149,421 | — | 7,512 | |||||||||
Dividend disbursing and transfer agent fees and expenses | 2,987,537 | 33,518 | 328,106 | |||||||||
Custodian fees | 883,289 | 7,133 | 60,372 | |||||||||
Accounting and administration expenses | 507,084 | 6,120 | 79,962 | |||||||||
Registration fees | 261,846 | 43,927 | 63,589 | |||||||||
Legal fees | 226,287 | 1,733 | 20,189 | |||||||||
Reports and statements to shareholders | 158,834 | 4,175 | 30,235 | |||||||||
Trustees’ fees and expenses | 78,048 | 943 | 12,308 | |||||||||
Audit and tax | 58,717 | 38,378 | 38,426 | |||||||||
Other | 64,619 | 12,206 | 21,568 | |||||||||
|
|
|
|
|
| |||||||
| 26,263,740 | 385,019 | 3,155,126 | ||||||||||
Less expenses waived | (614,624 | ) | (62,177 | ) | — | |||||||
Less expense paid indirectly | (3,095 | ) | (110 | ) | (457 | ) | ||||||
|
|
|
|
|
| |||||||
Total operating expenses | 25,646,021 | 322,732 | 3,154,669 | |||||||||
|
|
|
|
|
| |||||||
Net Investment Income | 7,498,568 | 165,063 | 3,945,931 | |||||||||
|
|
|
|
|
| |||||||
50
Table of Contents
Delaware Fund | Delaware Fund | Delaware International Value Equity Fund | ||||||||||||||||||
Net Realized and Unrealized Gain (Loss): | ||||||||||||||||||||
Net realized gain (loss) on: | ||||||||||||||||||||
Investments | $ | (10,480,599 | ) | $ | 530,253 | $ | 7,268,343 | |||||||||||||
Foreign currencies | 508,208 | 3,511 | 29,323 | |||||||||||||||||
Foreign currency exchange contracts | 718,858 | 116,197 | 1,228,312 | |||||||||||||||||
|
|
|
|
|
| |||||||||||||||
Net realized gain (loss) | (9,253,533 | ) | 649,961 | 8,525,978 | ||||||||||||||||
|
|
|
|
|
| |||||||||||||||
Net change in unrealized appreciation (depreciation) of: | ||||||||||||||||||||
Investments1 | 181,937,016 | (309,129 | ) | (9,076,803 | ) | |||||||||||||||
Foreign currencies | (7,667 | ) | (987 | ) | (50,016 | ) | ||||||||||||||
Foreign currency exchange contracts | 91 | — | — | |||||||||||||||||
|
|
|
|
|
| |||||||||||||||
Net change in unrealized appreciation (depreciation) | 181,929,440 | (310,116 | ) | (9,126,819 | ) | |||||||||||||||
|
|
|
|
|
| |||||||||||||||
Net Realized and Unrealized Gain (Loss) | 172,675,907 | 339,845 | (600,841 | ) | ||||||||||||||||
|
|
|
|
|
| |||||||||||||||
Net Increase in Net Assets Resulting from Operations | $ | 180,174,475 | $ | 504,908 | $ | 3,345,090 | ||||||||||||||
|
|
|
|
|
| |||||||||||||||
1Includes $125,706 decrease in capital gains tax accrued for Delaware Emerging Markets Fund.
See accompanying notes, which are an integral part of the financial statements.
51
Table of Contents
Statements of changes in net assets
Delaware Emerging Markets Fund
| Year ended | ||||||||
| 11/30/16 | 11/30/15 | |||||||
Increase (Decrease) in Net Assets from Operations: | ||||||||
Net investment income | $ | 7,498,568 | $ | 1,568,531 | ||||
Net realized loss | (9,253,533 | ) | (45,885,925 | ) | ||||
Net change in unrealized appreciation (depreciation) | 181,929,440 | (512,167,865 | ) | |||||
|
|
|
| |||||
Net increase (decrease) in net assets resulting from operations | 180,174,475 | (556,485,259 | ) | |||||
|
|
|
| |||||
Dividends and Distributions to Shareholders from: | ||||||||
Net investment income: | ||||||||
Class A | (84,127 | ) | (1,603,971 | ) | ||||
Class R | — | (21,450 | ) | |||||
Institutional Class | (3,161,089 | ) | (15,526,139 | ) | ||||
Return of capital: | ||||||||
Class A | — | (334,544 | ) | |||||
Class C | — | (171,542 | ) | |||||
Class R | — | (29,430 | ) | |||||
Institutional Class | — | (1,518,749 | ) | |||||
Net realized gain: | ||||||||
Class A | — | (8,253,184 | ) | |||||
Class C | — | (4,341,441 | ) | |||||
Class R | — | (295,110 | ) | |||||
Institutional Class | — | (49,453,826 | ) | |||||
|
|
|
| |||||
| (3,245,216 | ) | (81,549,386 | ) | |||||
|
|
|
| |||||
52
Table of Contents
| Year ended | ||||||||
| 11/30/16 | 11/30/15 | |||||||
Capital Share Transactions: | ||||||||
Proceeds from shares sold: | ||||||||
Class A | $ | 320,861,555 | $ | 88,623,991 | ||||
Class C | 11,210,598 | 23,043,605 | ||||||
Class R | 15,921,415 | 18,689,087 | ||||||
Institutional Class | 559,676,114 | 661,781,543 | ||||||
Class R6 | 313,729 | — | ||||||
Net asset value of shares issued upon reinvestment of dividends and distributions: | ||||||||
Class A | 81,518 | 9,332,668 | ||||||
Class C | — | 4,336,236 | ||||||
Class R | — | 345,702 | ||||||
Institutional Class | 2,509,155 | 48,825,603 | ||||||
|
|
|
| |||||
| 910,574,084 | 854,978,435 | |||||||
|
|
|
| |||||
Cost of shares redeemed: | ||||||||
Class A | (159,186,373 | ) | (165,314,154 | ) | ||||
Class C | (36,467,120 | ) | (53,166,527 | ) | ||||
Class R | (7,742,810 | ) | (4,930,704 | ) | ||||
Institutional Class | (603,723,575 | ) | (1,409,738,748 | ) | ||||
Class R6 | (25,146 | ) | — | |||||
|
|
|
| |||||
| (807,145,024 | ) | (1,633,150,133 | ) | |||||
|
|
|
| |||||
Increase in net assets derived from capital share transactions | 103,429,060 | (778,171,698 | ) | |||||
|
|
|
| |||||
Net Increase (Decrease) in Net Assets | 280,358,319 | (1,416,206,343 | ) | |||||
Net Assets: | ||||||||
Beginning of year | 1,684,291,629 | 3,100,497,972 | ||||||
|
|
|
| |||||
End of year | $ | 1,964,649,948 | $ | 1,684,291,629 | ||||
|
|
|
| |||||
Distributions in excess of net investment income | $ | (13,846,504 | ) | $ | (26,113,770 | ) | ||
|
|
|
| |||||
See accompanying notes, which are an integral part of the financial statements.
53
Table of Contents
Statements of changes in net assets
Delaware Global Value Fund
| Year ended | ||||||||
| 11/30/16 | 11/30/15 | |||||||
Increase (Decrease) in Net Assets from Operations: | ||||||||
Net investment income | $ | 165,063 | $ | 132,847 | ||||
Net realized gain | 649,961 | 1,336,754 | ||||||
Net change in unrealized appreciation (depreciation) | (310,116 | ) | (2,479,852 | ) | ||||
|
|
|
| |||||
Net increase (decrease) in net assets resulting from operations | 504,908 | (1,010,251 | ) | |||||
|
|
|
| |||||
Dividends and Distributions to Shareholders from: | ||||||||
Net investment income: | ||||||||
Class A | (104,081 | ) | (75,087 | ) | ||||
Institutional Class | (20,540 | ) | (15,983 | ) | ||||
|
|
|
| |||||
| (124,621 | ) | (91,070 | ) | |||||
|
|
|
| |||||
Capital Share Transactions: | ||||||||
Proceeds from shares sold: | ||||||||
Class A | 729,328 | 1,205,345 | ||||||
Class C | 329,276 | 825,664 | ||||||
Institutional Class | 172,714 | 289,535 | ||||||
Net asset value of shares issued upon reinvestment of dividends and distributions: | ||||||||
Class A | 100,258 | 70,874 | ||||||
Institutional Class | 17,485 | 13,960 | ||||||
|
|
|
| |||||
| 1,349,061 | 2,405,378 | |||||||
|
|
|
| |||||
54
Table of Contents
| Year ended | ||||||||
| 11/30/16 | 11/30/15 | |||||||
Capital Share Transactions (continued): | ||||||||
Cost of shares redeemed: | ||||||||
Class A | $ | (3,077,056 | ) | $ | (3,025,305 | ) | ||
Class C | (911,456 | ) | (1,355,317 | ) | ||||
Institutional Class | (650,267 | ) | (483,191 | ) | ||||
|
|
|
| |||||
| (4,638,779 | ) | (4,863,813 | ) | |||||
|
|
|
| |||||
Decrease in net assets derived from capital share transactions | (3,289,718 | ) | (2,458,435 | ) | ||||
|
|
|
| |||||
Net Decrease in Net Assets | (2,909,431 | ) | (3,559,756 | ) | ||||
Net Assets: | ||||||||
Beginning of year | 21,098,938 | 24,658,694 | ||||||
|
|
|
| |||||
End of year | $ | 18,189,507 | $ | 21,098,938 | ||||
|
|
|
| |||||
Undistributed net investment income | $ | 284,100 | $ | 123,950 | ||||
|
|
|
| |||||
See accompanying notes, which are an integral part of the financial statements.
55
Table of Contents
Statements of changes in net assets
Delaware International Value Equity Fund
| Year ended | ||||||||
| 11/30/16 | 11/30/15 | |||||||
Increase (Decrease) in Net Assets from Operations: | ||||||||
Net investment income | $ | 3,945,931 | $ | 3,496,810 | ||||
Net realized gain | 8,525,978 | 12,906,383 | ||||||
Net change in unrealized appreciation (depreciation) | (9,126,819 | ) | (22,248,353 | ) | ||||
|
|
|
| |||||
Net increase (decrease) in net assets resulting from operations | 3,345,090 | (5,845,160 | ) | |||||
|
|
|
| |||||
Dividends and Distributions to Shareholders from: | ||||||||
Net investment income: | ||||||||
Class A | (843,910 | ) | (1,451,343 | ) | ||||
Class C | (133,918 | ) | (350,383 | ) | ||||
Class R | (16,051 | ) | (39,553 | ) | ||||
Institutional Class | (2,426,729 | ) | (3,998,532 | ) | ||||
|
|
|
| |||||
| (3,420,608 | ) | (5,839,811 | ) | |||||
|
|
|
| |||||
Capital Share Transactions: | ||||||||
Proceeds from shares sold: | ||||||||
Class A | 9,364,853 | 9,250,945 | ||||||
Class C | 1,698,895 | 4,251,688 | ||||||
Class R | 601,854 | 501,786 | ||||||
Institutional Class | 50,653,860 | 43,438,290 | ||||||
Net asset value of shares issued upon reinvestment of dividends and distributions: | ||||||||
Class A | 822,166 | 1,411,159 | ||||||
Class C | 129,562 | 337,636 | ||||||
Class R | 16,050 | 39,553 | ||||||
Institutional Class | 2,410,920 | 3,967,791 | ||||||
|
|
|
| |||||
| 65,698,160 | 63,198,848 | |||||||
|
|
|
| |||||
56
Table of Contents
| Year ended | ||||||||
| 11/30/16 | 11/30/15 | |||||||
Capital Share Transactions (continued): | ||||||||
Cost of shares redeemed: | ||||||||
Class A | $ | (21,479,373 | ) | $ | (14,968,607 | ) | ||
Class C | (6,402,105 | ) | (5,615,616 | ) | ||||
Class R | (476,291 | ) | (1,328,545 | ) | ||||
Institutional Class | (49,791,088 | ) | (60,368,997 | ) | ||||
|
|
|
| |||||
| (78,148,857 | ) | (82,281,765 | ) | |||||
|
|
|
| |||||
Decrease in net assets derived from capital share transactions | (12,450,697 | ) | (19,082,917 | ) | ||||
|
|
|
| |||||
Net Decrease in Net Assets | (12,526,215 | ) | (30,767,888 | ) | ||||
Net Assets: | ||||||||
Beginning of year | 256,104,225 | 286,872,113 | ||||||
|
|
|
| |||||
End of year | $ | 243,578,010 | $ | 256,104,225 | ||||
|
|
|
| |||||
Undistributed net investment income | $ | 5,165,041 | $ | 3,382,083 | ||||
|
|
|
| |||||
See accompanying notes, which are an integral part of the financial statements.
57
Table of Contents
Delaware Emerging Markets Fund Class A
Selected data for each share of the Fund outstanding throughout each period were as follows:
Net asset value, beginning of period |
Income (loss) from investment operations: |
Net investment income (loss)1 |
Net realized and unrealized gain (loss) |
Total from investment operations |
Less dividends and distributions from: |
Net investment income |
Return of capital |
Net realized gain |
Total dividends and distributions |
Net asset value, end of period |
Total return2 |
Ratios and supplemental data: |
Net assets, end of period (000 omitted) |
Ratio of expenses to average net assets |
Ratio of expenses to average net assets prior to fees waived |
Ratio of net investment income (loss) to average net assets |
Ratio of net investment income (loss) to average net assets prior to fees waived |
Portfolio turnover |
| 1 | The average shares outstanding method has been applied for per share information. |
| 2 | Total investment return is based on the change in net asset value of a share during the period and assumes reinvestment of dividends and distributions at net asset value and does not reflect the impact of a sales charge. Total investment return during some of the periods shown reflects a waiver by the manager and/or distributor. Performance would have been lower had the waiver not been in effect. |
See accompanying notes, which are an integral part of the financial statements.
58
Table of Contents
| Year ended | ||||||||||||||||||||||
|
| |||||||||||||||||||||
| 11/30/16 | 11/30/15 | 11/30/14 | 11/30/13 | 11/30/12 | ||||||||||||||||||
|
| |||||||||||||||||||||
| $ | 12.800 | $ | 16.080 | $ | 16.230 | $ | 13.500 | $ | 13.050 | |||||||||||||
| 0.050 | (0.010 | ) | 0.008 | 0.023 | 0.077 | |||||||||||||||||
| 1.724 | (2.857 | ) | (0.041 | ) | 2.816 | 0.642 | ||||||||||||||||
|
|
|
|
|
|
|
|
|
| |||||||||||||
| 1.774 | (2.867 | ) | (0.033 | ) | 2.839 | 0.719 | ||||||||||||||||
|
|
|
|
|
|
|
|
|
| |||||||||||||
| (0.004 | ) | (0.065 | ) | (0.117 | ) | (0.109 | ) | (0.130 | ) | |||||||||||||
| — | (0.016 | ) | — | — | — | |||||||||||||||||
| — | (0.332 | ) | — | — | (0.139 | ) | ||||||||||||||||
|
|
|
|
|
|
|
|
|
| |||||||||||||
| (0.004 | ) | (0.413 | ) | (0.117 | ) | (0.109 | ) | (0.269 | ) | |||||||||||||
|
|
|
|
|
|
|
|
|
| |||||||||||||
| $ | 14.570 | $ | 12.800 | $ | 16.080 | $ | 16.230 | $ | 13.500 | |||||||||||||
|
|
|
|
|
|
|
|
|
| |||||||||||||
| 13.87% | (18.15% | ) | (0.20% | ) | 21.16% | 5.67% | ||||||||||||||||
| $ | 461,124 | $ | 274,075 | $ | 423,620 | $ | 498,686 | $ | 470,670 | |||||||||||||
| 1.74% | 1.75% | 1.69% | 1.71% | 1.70% | ||||||||||||||||||
| 1.78% | 1.75% | 1.69% | 1.75% | 1.75% | ||||||||||||||||||
| 0.35% | (0.08% | ) | 0.01% | 0.16% | 0.59% | |||||||||||||||||
| 0.31% | (0.08% | ) | 0.01% | 0.12% | 0.54% | |||||||||||||||||
| 25% | 12% | 26% | 24% | 15% | ||||||||||||||||||
59
Table of Contents
Financial highlights
Delaware Emerging Markets Fund Class C
Selected data for each share of the Fund outstanding throughout each period were as follows:
Net asset value, beginning of period |
Income (loss) from investment operations: |
Net investment loss1 |
Net realized and unrealized gain (loss) |
Total from investment operations |
Less dividends and distributions from: |
Net investment income |
Return of capital |
Net realized gain |
Total dividends and distributions |
Net asset value, end of period |
Total return2 |
Ratios and supplemental data: |
Net assets, end of period (000 omitted) |
Ratio of expenses to average net assets |
Ratio of expenses to average net assets prior to fees waived |
Ratio of net investment loss to average net assets |
Ratio of net investment loss to average net assets prior to fees waived |
Portfolio turnover |
| 1 | The average shares outstanding method has been applied for per share information. |
| 2 | Total investment return is based on the change in net asset value of a share during the period and assumes reinvestment of dividends and distributions at net asset value and does not reflect the impact of a sales charge. Total investment return during some of the periods shown reflects a waiver by the manager. Performance would have been lower had the waiver not been in effect. |
See accompanying notes, which are an integral part of the financial statements.
60
Table of Contents
| Year ended | ||||||||||||||||||||||
|
| |||||||||||||||||||||
| 11/30/16 | 11/30/15 | 11/30/14 | 11/30/13 | 11/30/12 | ||||||||||||||||||
|
| |||||||||||||||||||||
| $ | 12.000 | $ | 15.140 | $ | 15.300 | $ | 12.740 | $ | 12.320 | |||||||||||||
| (0.050 | ) | (0.108 | ) | (0.116 | ) | (0.083 | ) | (0.020 | ) | |||||||||||||
| 1.610 | (2.684 | ) | (0.032 | ) | 2.660 | 0.605 | ||||||||||||||||
|
|
|
|
|
|
|
|
|
| |||||||||||||
| 1.560 | (2.792 | ) | (0.148 | ) | 2.577 | 0.585 | ||||||||||||||||
|
|
|
|
|
|
|
|
|
| |||||||||||||
| — | — | (0.012 | ) | (0.017 | ) | (0.026 | ) | |||||||||||||||
| — | (0.016 | ) | — | — | — | |||||||||||||||||
| — | (0.332 | ) | — | — | (0.139 | ) | ||||||||||||||||
|
|
|
|
|
|
|
|
|
| |||||||||||||
| — | (0.348 | ) | (0.012 | ) | (0.017 | ) | (0.165 | ) | ||||||||||||||
|
|
|
|
|
|
|
|
|
| |||||||||||||
| $ | 13.560 | $ | 12.000 | $ | 15.140 | $ | 15.300 | $ | 12.740 | |||||||||||||
|
|
|
|
|
|
|
|
|
| |||||||||||||
| 13.00% | (18.74% | ) | (0.97% | ) | 20.25% | 4.85% | ||||||||||||||||
| $ | 120,306 | $ | 131,724 | $ | 198,428 | $ | 180,168 | $ | 155,040 | |||||||||||||
| 2.49% | 2.50% | 2.44% | 2.46% | 2.45% | ||||||||||||||||||
| 2.53% | 2.50% | 2.44% | 2.46% | 2.45% | ||||||||||||||||||
| (0.40% | ) | (0.83% | ) | (0.74% | ) | (0.59% | ) | (0.16% | ) | |||||||||||||
| (0.44% | ) | (0.83% | ) | (0.74% | ) | (0.59% | ) | (0.16% | ) | |||||||||||||
| 25% | 12% | 26% | 24% | 15% | ||||||||||||||||||
61
Table of Contents
Financial highlights
Delaware Emerging Markets Fund Class R
Selected data for each share of the Fund outstanding throughout each period were as follows:
Net asset value, beginning of period |
Income from investment operations: |
Net investment income (loss)1 |
Net realized and unrealized gain (loss) |
Total from investment operations |
Less dividends and distributions from: |
Net investment income |
Return of capital |
Net realized gain |
Total dividends and distributions |
Net asset value, end of period |
Total return2 |
Ratios and supplemental data: |
Net assets, end of period (000 omitted) |
Ratio of expenses to average net assets |
Ratio of expenses to average net assets prior to fees waived |
Ratio of net investment income (loss) to average net assets |
Ratio of net investment income (loss) to average net assets prior to fees waived |
Portfolio turnover |
| 1 | The average shares outstanding method has been applied for per share information. |
| 2 | Total investment return is based on the change in net asset value of a share during the period and assumes reinvestment of dividends and distributions at net asset value. Total investment return during some of the periods shown reflects waivers by the manager and/or distributor. Performance would have been lower had the waivers not been in effect. |
See accompanying notes, which are an integral part of the financial statements.
62
Table of Contents
| Year ended | ||||||||||||||||||||||
|
| |||||||||||||||||||||
| 11/30/16 | 11/30/15 | 11/30/14 | 11/30/13 | 11/30/12 | ||||||||||||||||||
|
| |||||||||||||||||||||
$ |
12.900 |
| $ | 16.200 | $ | 16.350 | $ | 13.600 | $ | 13.140 | ||||||||||||
| 0.015 | (0.045 | ) | (0.055 | ) | (0.014 | ) | 0.044 | |||||||||||||||
| 1.745 | (2.884 | ) | (0.018 | ) | 2.839 | 0.649 | ||||||||||||||||
|
|
|
|
|
|
|
|
|
| |||||||||||||
| 1.760 | (2.929 | ) | (0.073 | ) | 2.825 | 0.693 | ||||||||||||||||
|
|
|
|
|
|
|
|
|
| |||||||||||||
| — | (0.023 | ) | (0.077 | ) | (0.075 | ) | (0.094 | ) | ||||||||||||||
| — | (0.016 | ) | — | — | — | |||||||||||||||||
| — | (0.332 | ) | — | — | (0.139 | ) | ||||||||||||||||
|
|
|
|
|
|
|
|
|
| |||||||||||||
| — | (0.371 | ) | (0.077 | ) | (0.075 | ) | (0.233 | ) | ||||||||||||||
|
|
|
|
|
|
|
|
|
| |||||||||||||
| $ | 14.660 | $ | 12.900 | $ | 16.200 | $ | 16.350 | $ | 13.600 | |||||||||||||
|
|
|
|
|
|
|
|
|
| |||||||||||||
| 13.64% | (18.37% | ) | (0.44% | ) | 20.86% | 5.41% | ||||||||||||||||
| $ | 36,591 | $ | 24,299 | $ | 14,173 | $ | 5,282 | $ | 2,691 | |||||||||||||
| 1.99% | 2.00% | 1.94% | 1.96% | 1.95% | ||||||||||||||||||
| 2.03% | 2.00% | 1.94% | 2.04% | 2.05% | ||||||||||||||||||
| 0.10% | (0.33% | ) | (0.24% | ) | (0.09% | ) | 0.34% | |||||||||||||||
| 0.06% | (0.33% | ) | (0.24% | ) | (0.17% | ) | 0.24% | |||||||||||||||
| 25% | 12% | 26% | 24% | 15% | ||||||||||||||||||
63
Table of Contents
Financial highlights
Delaware Emerging Markets Fund Institutional Class
Selected data for each share of the Fund outstanding throughout each period were as follows:
Net asset value, beginning of period |
Income (loss) from investment operations: |
Net investment income1 |
Net realized and unrealized gain (loss) |
Total from investment operations |
Less dividends and distributions from: |
Net investment income |
Return of capital |
Net realized gain |
Total dividends and distributions |
Net asset value, end of period |
Total return2 |
Ratios and supplemental data: |
Net assets, end of period (000 omitted) |
Ratio of expenses to average net assets |
Ratio of expenses to average net assets prior to fees waived |
Ratio of net investment income to average net assets |
Ratio of net investment income to average net assets prior to fees waived |
Portfolio turnover |
| 1 | The average shares outstanding method has been applied for per share information. |
| 2 | Total investment return is based on the change in net asset value of a share during the period and assumes reinvestment of dividends and distributions at net asset value. Total investment return during some of the periods shown reflects a waiver by the manager. Performance would have been lower had the waiver not been in effect. |
See accompanying notes, which are an integral part of the financial statements.
64
Table of Contents
| Year ended | ||||||||||||||||||||||
|
| |||||||||||||||||||||
| 11/30/16 | 11/30/15 | 11/30/14 | 11/30/13 | 11/30/12 | ||||||||||||||||||
|
| |||||||||||||||||||||
$ |
12.900 |
| $ | 16.210 | $ | 16.360 | $ | 13.600 | $ | 13.160 | ||||||||||||
| 0.082 | 0.024 | 0.039 | 0.061 | 0.111 | ||||||||||||||||||
| 1.746 | (2.880 | ) | (0.035 | ) | 2.841 | 0.635 | ||||||||||||||||
|
|
|
|
|
|
|
|
|
| |||||||||||||
| 1.828 | (2.856 | ) | 0.004 | 2.902 | 0.746 | |||||||||||||||||
|
|
|
|
|
|
|
|
|
| |||||||||||||
| (0.038 | ) | (0.106 | ) | (0.154 | ) | (0.142 | ) | (0.167 | ) | |||||||||||||
| — | (0.016 | ) | — | — | — | |||||||||||||||||
| — | (0.332 | ) | — | — | (0.139 | ) | ||||||||||||||||
|
|
|
|
|
|
|
|
|
| |||||||||||||
| (0.038 | ) | (0.454 | ) | (0.154 | ) | (0.142 | ) | (0.306 | ) | |||||||||||||
|
|
|
|
|
|
|
|
|
| |||||||||||||
| $ | 14.690 | $ | 12.900 | $ | 16.210 | $ | 16.360 | $ | 13.600 | |||||||||||||
|
|
|
|
|
|
|
|
|
| |||||||||||||
| 14.22% | (17.96% | ) | 0.04% | 21.50% | 5.86% | |||||||||||||||||
| $ | 1,346,361 | $ | 1,254,194 | $ | 2,464,277 | $ | 1,974,807 | $ | 1,217,065 | |||||||||||||
| 1.49% | 1.50% | 1.44% | 1.46% | 1.45% | ||||||||||||||||||
| 1.53% | 1.50% | 1.44% | 1.46% | 1.45% | ||||||||||||||||||
| 0.60% | 0.17% | 0.26% | 0.41% | 0.84% | ||||||||||||||||||
| 0.56% | 0.17% | 0.26% | 0.41% | 0.84% | ||||||||||||||||||
| 25% | 12% | 26% | 24% | 15% | ||||||||||||||||||
65
Table of Contents
Financial highlights
Delaware Emerging Markets Fund Class R6
Selected data for each share of the Fund outstanding throughout each period were as follows:
5/2/161 to 11/30/16
| ||||
| ||||
Net asset value, beginning of period | $13.550 | |||
Income (loss) from investment operations: | ||||
Net investment income2 | 0.075 | |||
Net realized and unrealized gain | 1.065 | |||
|
| |||
Total from investment operations | 1.140 | |||
|
| |||
Net asset value, end of period | $14.690 | |||
|
| |||
Total return3 | 8.41% | |||
Ratios and supplemental data: | ||||
Net assets, end of period (000 omitted) | $ 268 | |||
Ratio of expenses to average net assets | 1.32% | |||
Ratio of expenses to average net assets prior to fees waived | 1.37% | |||
Ratio of net investment income to average net assets | 0.85% | |||
Ratio of net investment income to average net assets prior to fees waived | 0.80% | |||
Portfolio turnover | 25% | 4 | ||
| 1 | Date of commencement of operations; ratios have been annualized and total return has not been annualized. |
| 2 | The average shares outstanding method has been applied for per share information. |
| 3 | Total investment return is based on the change in net asset value of a share during the period and assumes reinvestment of dividends and distributions at net asset value. Total investment return shown reflects a waiver by the manager. Performance would have been lower had the waiver not been in effect. |
| 4 | Portfolio turnover is representative of the Fund for the entire year ended Nov. 30, 2016. |
See accompanying notes, which are an integral part of the financial statements.
66
Table of Contents
This page intentionally left blank.
Table of Contents
Financial highlights
Delaware Global Value Fund Class A
Selected data for each share of the Fund outstanding throughout each period were as follows:
Net asset value, beginning of period |
Income (loss) from investment operations: |
Net investment income1 |
Net realized and unrealized gain (loss) |
Total from investment operations |
Less dividends and distributions from: |
Net investment income |
Total dividends and distributions |
Net asset value, end of period |
Total return2 |
Ratios and supplemental data: |
Net assets, end of period (000 omitted) |
Ratio of expenses to average net assets |
Ratio of expenses to average net assets prior to fees waived |
Ratio of net investment income to average net assets |
Ratio of net investment income to average net assets prior to fees waived |
Portfolio turnover |
| 1 | The average shares outstanding method has been applied for per share information. |
| 2 | Total investment return is based on the change in net asset value of a share during the period and assumes reinvestment of dividends and distributions at net asset value and does not reflect the impact of a sales charge. Total investment return during all of the periods shown reflects waivers by the manager and/or distributor. Performance would have been lower had the waivers not been in effect. |
See accompanying notes, which are an integral part of the financial statements.
68
Table of Contents
| Year ended | ||||||||||||||||||||||
|
| |||||||||||||||||||||
| 11/30/16 | 11/30/15 | 11/30/14 | 11/30/13 | 11/30/12 | ||||||||||||||||||
|
| |||||||||||||||||||||
$ |
11.160 |
| $ | 11.710 | $ | 11.270 | $ | 9.010 | $ | 8.310 | ||||||||||||
| 0.110 | 0.082 | 0.067 | 0.075 | 0.093 | ||||||||||||||||||
| 0.270 | (0.580 | ) | 0.444 | 2.286 | 0.699 | |||||||||||||||||
|
|
|
|
|
|
|
|
|
| |||||||||||||
| 0.380 | (0.498 | ) | 0.511 | 2.361 | 0.792 | |||||||||||||||||
|
|
|
|
|
|
|
|
|
| |||||||||||||
| (0.080 | ) | (0.052 | ) | (0.071 | ) | (0.101 | ) | (0.092 | ) | |||||||||||||
|
|
|
|
|
|
|
|
|
| |||||||||||||
| (0.080 | ) | (0.052 | ) | (0.071 | ) | (0.101 | ) | (0.092 | ) | |||||||||||||
|
|
|
|
|
|
|
|
|
| |||||||||||||
| $ | 11.460 | $ | 11.160 | $ | 11.710 | $ | 11.270 | $ | 9.010 | |||||||||||||
|
|
|
|
|
|
|
|
|
| |||||||||||||
| 3.45% | (4.27% | ) | 4.57% | 26.46% | 9.65% | |||||||||||||||||
| $ | 12,460 | $ | 14,457 | $ | 16,950 | $ | 16,951 | $ | 16,479 | |||||||||||||
| 1.55% | 1.64% | 1.55% | 1.55% | 1.55% | ||||||||||||||||||
| 1.88% | 1.89% | 1.80% | 1.82% | 1.81% | ||||||||||||||||||
| 1.01% | 0.71% | 0.58% | 0.75% | 1.08% | ||||||||||||||||||
| 0.69% | 0.46% | 0.32% | 0.48% | 0.82% | ||||||||||||||||||
| 12% | 14% | 43% | 27% | 69% | ||||||||||||||||||
69
Table of Contents
Financial highlights
Delaware Global Value Fund Class C
Selected data for each share of the Fund outstanding throughout each period were as follows:
Net asset value, beginning of period |
Income (loss) from investment operations: |
Net investment income (loss)1 |
Net realized and unrealized gain (loss) |
Total from investment operations |
Less dividends and distributions from: |
Net investment income |
Total dividends and distributions |
Net asset value, end of period |
Total return2 |
Ratios and supplemental data: |
Net assets, end of period (000 omitted) |
Ratio of expenses to average net assets |
Ratio of expenses to average net assets prior to fees waived |
Ratio of net investment income (loss) to average net assets |
Ratio of net investment income (loss) to average net assets prior to fees waived |
Portfolio turnover |
| 1 | The average shares outstanding method has been applied for per share information. |
| 2 | Total investment return is based on the change in net asset value of a share during the period and assumes reinvestment of dividends and distributions at net asset value and does not reflect the impact of a sales charge. Total investment return during all of the periods shown reflects a waiver by the manager. Performance would have been lower had the waiver not been in effect. |
| 3 | Amount is less than (0.01%). |
See accompanying notes, which are an integral part of the financial statements.
70
Table of Contents
| Year ended | ||||||||||||||||||||||
|
| |||||||||||||||||||||
| 11/30/16 | 11/30/15 | 11/30/14 | 11/30/13 | 11/30/12 | ||||||||||||||||||
|
| |||||||||||||||||||||
$ |
10.900 |
| $ | 11.480 | $ | 11.060 | $ | 8.850 | $ | 8.150 | ||||||||||||
| 0.028 | (0.004 | ) | (0.020 | ) | (0.001 | ) | 0.028 | |||||||||||||||
| 0.272 | (0.576 | ) | 0.440 | 2.248 | 0.698 | |||||||||||||||||
|
|
|
|
|
|
|
|
|
| |||||||||||||
| 0.300 | (0.580 | ) | 0.420 | 2.247 | 0.726 | |||||||||||||||||
|
|
|
|
|
|
|
|
|
| |||||||||||||
| — | — | — | (0.037 | ) | (0.026 | ) | ||||||||||||||||
|
|
|
|
|
|
|
|
|
| |||||||||||||
| — | — | — | (0.037 | ) | (0.026 | ) | ||||||||||||||||
|
|
|
|
|
|
|
|
|
| |||||||||||||
| $ | 11.200 | $ | 10.900 | $ | 11.480 | $ | 11.060 | $ | 8.850 | |||||||||||||
|
|
|
|
|
|
|
|
|
| |||||||||||||
| 2.75% | (5.05% | ) | 3.80% | 25.48% | 8.94% | |||||||||||||||||
| $ | 4,116 | $ | 4,601 | $ | 5,361 | $ | 5,882 | $ | 5,878 | |||||||||||||
| 2.30% | 2.39% | 2.30% | 2.30% | 2.30% | ||||||||||||||||||
| 2.63% | 2.64% | 2.55% | 2.53% | 2.51% | ||||||||||||||||||
| 0.26% | (0.04% | ) | (0.17% | ) | 0.00% | 3 | 0.33% | |||||||||||||||
| (0.06% | ) | (0.29% | ) | (0.43% | ) | (0.23% | ) | 0.12% | ||||||||||||||
| 12% | 14% | 43% | 27% | 69% | ||||||||||||||||||
71
Table of Contents
Financial highlights
Delaware Global Value Fund Institutional Class
Selected data for each share of the Fund outstanding throughout each period were as follows:
Net asset value, beginning of period |
Income (loss) from investment operations: |
Net investment income1 |
Net realized and unrealized gain (loss) |
Total from investment operations |
Less dividends and distributions from: |
Net investment income |
Total dividends and distributions |
Net asset value, end of period |
Total return2 |
Ratios and supplemental data: |
Net assets, end of period (000 omitted) |
Ratio of expenses to average net assets |
Ratio of expenses to average net assets prior to fees waived |
Ratio of net investment income to average net assets |
Ratio of net investment income to average net assets prior to fees waived |
Portfolio turnover |
| 1 | The average shares outstanding method has been applied for per share information. |
| 2 | Total investment return is based on the change in net asset value of a share during the period and assumes reinvestment of dividends and distributions at net asset value. Total investment return during all of the periods shown reflects a waiver by the manager. Performance would have been lower had the waiver not been in effect. |
See accompanying notes, which are an integral part of the financial statements.
72
Table of Contents
| Year ended | ||||||||||||||||||||||
|
| |||||||||||||||||||||
| 11/30/16 | 11/30/15 | 11/30/14 | 11/30/13 | 11/30/12 | ||||||||||||||||||
|
| |||||||||||||||||||||
$ |
11.210 |
| $ | 11.770 | $ | 11.320 | $ | 9.050 | $ | 8.340 | ||||||||||||
| 0.137 | 0.112 | 0.096 | 0.101 | 0.115 | ||||||||||||||||||
| 0.272 | (0.591 | ) | 0.451 | 2.291 | 0.709 | |||||||||||||||||
|
|
|
|
|
|
|
|
|
| |||||||||||||
| 0.409 | (0.479 | ) | 0.547 | 2.392 | 0.824 | |||||||||||||||||
|
|
|
|
|
|
|
|
|
| |||||||||||||
| (0.109 | ) | (0.081 | ) | (0.097 | ) | (0.122 | ) | (0.114 | ) | |||||||||||||
|
|
|
|
|
|
|
|
|
| |||||||||||||
| (0.109 | ) | (0.081 | ) | (0.097 | ) | (0.122 | ) | (0.114 | ) | |||||||||||||
|
|
|
|
|
|
|
|
|
| |||||||||||||
| $ | 11.510 | $ | 11.210 | $ | 11.770 | $ | 11.320 | $ | 9.050 | |||||||||||||
|
|
|
|
|
|
|
|
|
| |||||||||||||
| 3.71% | (4.09% | ) | 4.88% | 26.75% | 10.03% | |||||||||||||||||
| $ | 1,614 | $ | 2,041 | $ | 2,348 | $ | 2,112 | $ | 1,932 | |||||||||||||
| 1.30% | 1.39% | 1.30% | 1.30% | 1.30% | ||||||||||||||||||
| 1.63% | 1.64% | 1.55% | 1.53% | 1.51% | ||||||||||||||||||
| 1.26% | 0.96% | 0.83% | 1.00% | 1.33% | ||||||||||||||||||
| 0.94% | 0.71% | 0.57% | 0.77% | 1.12% | ||||||||||||||||||
| 12% | 14% | 43% | 27% | 69% | ||||||||||||||||||
73
Table of Contents
Financial highlights
Delaware International Value Equity Fund Class A
Selected data for each share of the Fund outstanding throughout each period were as follows:
Net asset value, beginning of period |
Income (loss) from investment operations: |
Net investment income1 |
Net realized and unrealized gain (loss) |
Total from investment operations |
Less dividends and distributions from: |
Net investment income |
Total dividends and distributions |
Net asset value, end of period |
Total return2 |
Ratios and supplemental data: |
Net assets, end of period (000 omitted) |
Ratio of expenses to average net assets |
Ratio of expenses to average net assets prior to fees waived |
Ratio of net investment income to average net assets |
Ratio of net investment income to average net assets prior to fees waived |
Portfolio turnover |
| 1 | The average shares outstanding method has been applied for per share information. |
| 2 | Total investment return is based on the change in net asset value of a share during the period and assumes reinvestment of dividends and distributions at net asset value and does not reflect the impact of a sales charge. Total investment return during some of the periods shown reflects waivers by the manager and/or distributor. Performance would have been lower had the waivers not been in effect. |
See accompanying notes, which are an integral part of the financial statements.
74
Table of Contents
| Year ended | ||||||||||||||||||||||
|
| |||||||||||||||||||||
| 11/30/16 | 11/30/15 | 11/30/14 | 11/30/13 | 11/30/12 | ||||||||||||||||||
|
| |||||||||||||||||||||
$ |
12.960 |
| $ | 13.530 | $ | 14.260 | $ | 11.590 | $ | 10.710 | ||||||||||||
| 0.189 | 0.166 | 0.272 | 0.169 | 0.164 | ||||||||||||||||||
| (0.045 | ) | (0.469 | ) | (0.857 | ) | 2.654 | 0.909 | |||||||||||||||
|
|
|
|
|
|
|
|
|
| |||||||||||||
| 0.144 | (0.303 | ) | (0.585 | ) | 2.823 | 1.073 | ||||||||||||||||
|
|
|
|
|
|
|
|
|
| |||||||||||||
| (0.164 | ) | (0.267 | ) | (0.145 | ) | (0.153 | ) | (0.193 | ) | |||||||||||||
|
|
|
|
|
|
|
|
|
| |||||||||||||
| (0.164 | ) | (0.267 | ) | (0.145 | ) | (0.153 | ) | (0.193 | ) | |||||||||||||
|
|
|
|
|
|
|
|
|
| |||||||||||||
| $ | 12.940 | $ | 12.960 | $ | 13.530 | $ | 14.260 | $ | 11.590 | |||||||||||||
|
|
|
|
|
|
|
|
|
| |||||||||||||
| 1.15% | (2.23% | ) | (4.13% | ) | 24.64% | 10.25% | ||||||||||||||||
| $ | 54,967 | $ | 66,785 | $ | 74,118 | $ | 104,289 | $ | 93,440 | |||||||||||||
| 1.36% | 1.40% | 1.42% | 1.45% | 1.47% | ||||||||||||||||||
| 1.36% | 1.40% | 1.42% | 1.51% | 1.50% | ||||||||||||||||||
| 1.50% | 1.24% | 1.85% | 1.31% | 1.49% | ||||||||||||||||||
| 1.50% | 1.24% | 1.85% | 1.25% | 1.46% | ||||||||||||||||||
| 13% | 13% | 26% | 30% | 34% | ||||||||||||||||||
|
| |||||||||||||||||||||
75
Table of Contents
Financial highlights
Delaware International Value Equity Fund Class C
Selected data for each share of the Fund outstanding throughout each period were as follows:
Net asset value, beginning of period |
Income (loss) from investment operations: |
Net investment income1 |
Net realized and unrealized gain (loss) |
Total from investment operations |
Less dividends and distributions from: |
Net investment income |
Total dividends and distributions |
Net asset value, end of period |
Total return2 |
Ratios and supplemental data: |
Net assets, end of period (000 omitted) |
Ratio of expenses to average net assets |
Ratio of expenses to average net assets prior to fees waived |
Ratio of net investment income to average net assets |
Ratio of net investment income to average net assets prior to fees waived |
Portfolio turnover |
| 1 | The average shares outstanding method has been applied for per share information. |
| 2 | Total investment return is based on the change in net asset value of a share during the period and assumes reinvestment of dividends and distributions at net asset value and does not reflect the impact of a sales charge. Total investment return during some of the periods shown reflects a waiver by the manager. Performance would have been lower had the waiver not been in effect. |
See accompanying notes, which are an integral part of the financial statements.
76
Table of Contents
| Year ended | ||||||||||||||||||||||
|
| |||||||||||||||||||||
| 11/30/16 | 11/30/15 | 11/30/14 | 11/30/13 | 11/30/12 | ||||||||||||||||||
|
| |||||||||||||||||||||
|
$12.710 |
| $ | 13.270 | $ | 13.990 | $ | 11.380 | $ | 10.510 | ||||||||||||
| 0.093 | 0.064 | 0.158 | 0.071 | 0.083 | ||||||||||||||||||
| (0.048 | ) | (0.461 | ) | (0.828 | ) | 2.612 | 0.896 | |||||||||||||||
|
|
|
|
|
|
|
|
|
| |||||||||||||
| 0.045 | (0.397 | ) | (0.670 | ) | 2.683 | 0.979 | ||||||||||||||||
|
|
|
|
|
|
|
|
|
| |||||||||||||
| (0.065 | ) | (0.163 | ) | (0.050 | ) | (0.073 | ) | (0.109 | ) | |||||||||||||
|
|
|
|
|
|
|
|
|
| |||||||||||||
| (0.065 | ) | (0.163 | ) | (0.050 | ) | (0.073 | ) | (0.109 | ) | |||||||||||||
|
|
|
|
|
|
|
|
|
| |||||||||||||
| $ | 12.690 | $ | 12.710 | $ | 13.270 | $ | 13.990 | $ | 11.380 | |||||||||||||
|
|
|
|
|
|
|
|
|
| |||||||||||||
| 0.36% | (2.99% | ) | (4.80% | ) | 23.60% | 9.53% | ||||||||||||||||
| $ | 21,672 | $ | 26,402 | $ | 28,609 | $ | 33,566 | $ | 30,510 | |||||||||||||
| 2.11% | 2.15% | 2.17% | 2.20% | 2.20% | ||||||||||||||||||
| 2.11% | 2.15% | 2.17% | 2.22% | 2.20% | ||||||||||||||||||
| 0.75% | 0.49% | 1.10% | 0.56% | 0.76% | ||||||||||||||||||
| 0.75% | 0.49% | 1.10% | 0.54% | 0.76% | ||||||||||||||||||
| 13% | 13% | 26% | 30% | 34% | ||||||||||||||||||
|
| |||||||||||||||||||||
77
Table of Contents
Financial highlights
Delaware International Value Equity Fund Class R
Selected data for each share of the Fund outstanding throughout each period were as follows:
Net asset value, beginning of period |
Income (loss) from investment operations: |
Net investment income1 |
Net realized and unrealized gain (loss) |
Total from investment operations |
Less dividends and distributions from: |
Net investment income |
Total dividends and distributions |
Net asset value, end of period |
Total return2 |
Ratios and supplemental data: |
Net assets, end of period (000 omitted) |
Ratio of expenses to average net assets |
Ratio of expenses to average net assets prior to fees waived |
Ratio of net investment income to average net assets |
Ratio of net investment income to average net assets prior to fees waived |
Portfolio turnover |
| 1 | The average shares outstanding method has been applied for per share information. |
| 2 | Total investment return is based on the change in net asset value of a share during the period and assumes reinvestment of dividends and distributions at net asset value. Total investment return during some of the periods shown reflects waivers by the manager and/or distributor. Performance would have been lower had the waivers not been in effect. |
See accompanying notes, which are an integral part of the financial statements.
78
Table of Contents
| Year ended | ||||||||||||||||||||||
|
| |||||||||||||||||||||
| 11/30/16 | 11/30/15 | 11/30/14 | 11/30/13 | 11/30/12 | ||||||||||||||||||
|
| |||||||||||||||||||||
$ |
12.900 |
| $ | 13.470 | $ | 14.200 | $ | 11.540 | $ | 10.660 | ||||||||||||
| 0.158 | 0.132 | 0.233 | 0.136 | 0.138 | ||||||||||||||||||
| (0.048 | ) | (0.470 | ) | (0.851 | ) | 2.651 | 0.911 | |||||||||||||||
|
|
|
|
|
|
|
|
|
| |||||||||||||
| 0.110 | (0.338 | ) | (0.618 | ) | 2.787 | 1.049 | ||||||||||||||||
|
|
|
|
|
|
|
|
|
| |||||||||||||
| (0.130 | ) | (0.232 | ) | (0.112 | ) | (0.127 | ) | (0.169 | ) | |||||||||||||
|
|
|
|
|
|
|
|
|
| |||||||||||||
| (0.130 | ) | (0.232 | ) | (0.112 | ) | (0.127 | ) | (0.169 | ) | |||||||||||||
|
|
|
|
|
|
|
|
|
| |||||||||||||
| $ | 12.880 | $ | 12.900 | $ | 13.470 | $ | 14.200 | $ | 11.540 | |||||||||||||
|
|
|
|
|
|
|
|
|
| |||||||||||||
| 0.88% | (2.50% | ) | (4.37% | ) | 24.28% | 10.13% | ||||||||||||||||
| $ | 1,578 | $ | 1,449 | $ | 2,317 | $ | 2,898 | $ | 2,288 | |||||||||||||
| 1.61% | 1.65% | 1.67% | 1.70% | 1.70% | ||||||||||||||||||
| 1.61% | 1.65% | 1.67% | 1.80% | 1.80% | ||||||||||||||||||
| 1.25% | 0.99% | 1.60% | 1.06% | 1.26% | ||||||||||||||||||
| 1.25% | 0.99% | 1.60% | 0.96% | 1.16% | ||||||||||||||||||
| 13% | 13% | 26% | 30% | 34% | ||||||||||||||||||
|
| |||||||||||||||||||||
79
Table of Contents
Financial highlights
Delaware International Value Equity Fund Institutional Class
Selected data for each share of the Fund outstanding throughout each period were as follows:
Net asset value, beginning of period |
Income (loss) from investment operations: |
Net investment income1 |
Net realized and unrealized gain (loss) |
Total from investment operations |
Less dividends and distributions from: |
Net investment income |
Total dividends and distributions |
Net asset value, end of period |
Total return2 |
Ratios and supplemental data: |
Net assets, end of period (000 omitted) |
Ratio of expenses to average net assets |
Ratio of expenses to average net assets prior to fees waived |
Ratio of net investment income to average net assets |
Ratio of net investment income to average net assets prior to fees waived |
Portfolio turnover |
| 1 | The average shares outstanding method has been applied for per share information. |
| 2 | Total investment return is based on the change in net asset value of a share during the period and assumes reinvestment of dividends and distributions at net asset value. Total investment return during some of the periods shown reflects a waiver by the manager. Performance would have been lower had the waiver not been in effect. |
See accompanying notes, which are an integral part of the financial statements.
80
Table of Contents
| Year ended | ||||||||||||||||||||||
|
| |||||||||||||||||||||
| 11/30/16 | 11/30/15 | 11/30/14 | 11/30/13 | 11/30/12 | ||||||||||||||||||
|
| |||||||||||||||||||||
$ |
13.020 |
| $ | 13.600 | $ | 14.330 | $ | 11.650 | $ | 10.770 | ||||||||||||
| 0.222 | 0.200 | 0.300 | 0.203 | 0.194 | ||||||||||||||||||
| (0.045 | ) | (0.478 | ) | (0.852 | ) | 2.659 | 0.916 | |||||||||||||||
|
|
|
|
|
|
|
|
|
| |||||||||||||
| 0.177 | (0.278 | ) | (0.552 | ) | 2.862 | 1.110 | ||||||||||||||||
|
|
|
|
|
|
|
|
|
| |||||||||||||
| (0.197 | ) | (0.302 | ) | (0.178 | ) | (0.182 | ) | (0.230 | ) | |||||||||||||
|
|
|
|
|
|
|
|
|
| |||||||||||||
| (0.197 | ) | (0.302 | ) | (0.178 | ) | (0.182 | ) | (0.230 | ) | |||||||||||||
|
|
|
|
|
|
|
|
|
| |||||||||||||
| $ | 13.000 | $ | 13.020 | $ | 13.600 | $ | 14.330 | $ | 11.650 | |||||||||||||
|
|
|
|
|
|
|
|
|
| |||||||||||||
| 1.41% | (2.03% | ) | (3.88% | ) | 24.91% | 10.59% | ||||||||||||||||
| $ | 165,361 | $ | 161,468 | $ | 181,828 | $ | 178,614 | $ | 107,817 | |||||||||||||
| 1.11% | 1.15% | 1.17% | 1.20% | 1.20% | ||||||||||||||||||
| 1.11% | 1.15% | 1.17% | 1.22% | 1.20% | ||||||||||||||||||
| 1.75% | 1.49% | 2.10% | 1.56% | 1.76% | ||||||||||||||||||
| 1.75% | 1.49% | 2.10% | 1.54% | 1.76% | ||||||||||||||||||
| 13% | 13% | 26% | 30% | 34% | ||||||||||||||||||
|
| |||||||||||||||||||||
81
Table of Contents
| Notes to financial statements | ||
Delaware International Funds | November 30, 2016 |
Delaware Group® Global and International Funds (Trust) is organized as a Delaware statutory trust and offers five series: Delaware Asia Select Fund (formerly, Delaware Macquarie Asia Select Fund), Delaware Emerging Markets Fund, Delaware International Small Cap Fund (formerly, Delaware Focus Global Growth Fund), Delaware Global Value Fund, and Delaware International Value Equity Fund. These financial statements and the related notes pertain to Delaware Emerging Markets Fund, Delaware Global Value Fund, and Delaware International Value Equity Fund (each, a Fund or collectively, the Funds). The Trust is an open-end investment company. Each Fund is considered diversified under the Investment Company Act of 1940, as amended, and offers Class A, Class C, Class R, and Institutional Class shares. As of May 2, 2016, Emerging Markets Fund also offers Class R6 shares. As of Nov. 30, 2016, Delaware Global Value Fund has not commenced operations of its Class R shares. Class A shares are sold with a maximum front-end sales charge of 5.75%. Class A share purchases of $1,000,000 or more will incur a contingent deferred sales charge (CDSC) instead of a front-end sales charge of 1.00% if redeemed during the first year and 0.50% during the second year, provided that Delaware Distributors, L.P. (DDLP) paid a financial advisor a commission on the purchase of those shares. Class C shares are sold with a CDSC of 1.00%, if redeemed during the first 12 months. Class R, Institutional Class, and Class R6 shares are not subject to a sales charge and are offered for sale exclusively to certain eligible investors. In addition, Class R6 shares do not pay any service fees, sub-accounting fees, and/or sub-transfer agency fees.
The investment objective of Delaware Emerging Markets Fund and Delaware Global Value Fund is to seek long-term capital appreciation.
The investment objective of Delaware International Value Equity Fund is to seek long-term growth without undue risk to principal.
1. Significant Accounting Policies
The following accounting policies are in accordance with U.S. generally accepted accounting principles (U.S. GAAP) and are consistently followed by the Funds.
Security Valuation – Equity securities and exchange-traded funds (ETFs), except those traded on the Nasdaq Stock Market LLC (Nasdaq), are valued at the last quoted sales price as of the time of the regular close of the New York Stock Exchange on the valuation date. Equity securities and ETFs traded on the Nasdaq are valued in accordance with the Nasdaq Official Closing Price, which may not be the last sales price. If, on a particular day, an equity security or ETF does not trade, the mean between the bid and ask prices will be used, which approximates fair value. Equity securities listed on a foreign exchange are normally valued at the last quoted sales price on the valuation date. Open-end investment company securities are valued at net asset value per share, as reported by the underlying investment company. U.S. government and agency securities are valued at the mean between the bid and ask prices, which approximates fair value. Foreign currency exchange contracts and foreign cross currency exchange contracts are valued at the mean between the bid and ask prices, which approximates fair value. Interpolated values are derived when the settlement date of the contract is an interim date for which quotations are not available. Generally, other securities and assets for which market quotations are not readily available are valued at fair value as determined in good faith under the direction of the Trust’s Board of Trustees (Board). In determining whether market quotations are readily available or fair valuation will be used, various factors will be taken into consideration, such as market closures or
82
Table of Contents
suspension of trading in a security. The Funds may use fair value pricing more frequently for securities traded primarily in non-U.S. markets because, among other things, most foreign markets close well before the Funds value their securities, generally as of 4:00 p.m. Eastern time. The earlier close of these foreign markets gives rise to the possibility that significant events, including broad market moves, government actions or pronouncements, aftermarket trading, or news events may have occurred in the interim. Whenever such a significant event occurs, the Funds may value foreign securities using fair value prices based on third-party vendor modeling tools (international fair value pricing).
Federal and Foreign Income Taxes – No provision for federal income taxes has been made as each Fund intends to continue to qualify for federal income tax purposes as a regulated investment company under Subchapter M of the Internal Revenue Code of 1986, as amended, and make the requisite distributions to shareholders. Each Fund evaluates tax positions taken or expected to be taken in the course of preparing each Fund’s tax returns to determine whether the tax positions are “more-likely-than-not” of being sustained by the applicable tax authority. Tax positions not deemed to meet the “more-likely-than-not” threshold are recorded as a tax benefit or expense in the current year. Management has analyzed each Fund’s tax positions taken for all open federal income tax years (Nov. 30, 2013–Nov. 30, 2016), and has concluded that no provision for federal income tax is required in any Fund’s financial statements. In regard to foreign taxes only, each Fund has open tax years in certain foreign countries in which it invests that may date back to the inception of each Fund.
Class Accounting – Investment income, common expenses, and realized and unrealized gain (loss) on investments are allocated to the various classes of each Fund on the basis of daily net assets of each class. Distribution expenses relating to a specific class are charged directly to that class. R6 shares will not be allocated any expenses related to service fees, sub-accounting fees, and/or sub-transfer agency fees paid to brokers, dealers, or other financial intermediaries.
Repurchase Agreements – Each Fund may purchase certain U.S. government securities subject to the counterparty’s agreement to repurchase them at an agreed upon date and price. The counterparty will be required on a daily basis to maintain the value of the collateral subject to the agreement at not less than the repurchase price (including accrued interest). The agreements are conditioned upon the collateral being deposited under the Federal Reserve book-entry system with each Fund’s custodian or a third-party sub-custodian. In the event of default or bankruptcy by the other party to the agreement, retention of the collateral may be subject to legal proceedings. All open repurchase agreements as of the date of this report were entered into on Nov. 30, 2016, and matured on the next business day.
Foreign Currency Transactions – Transactions denominated in foreign currencies are recorded at the prevailing exchange rates on the valuation date in accordance with each Fund’s prospectus. The value of all assets and liabilities denominated in foreign currencies is translated daily into U.S. dollars at the exchange rate of such currencies against the U.S. dollar. Transaction gains or losses resulting from changes in exchange rates during the reporting period or upon settlement of the foreign currency transaction are reported in operations for the current period. The Funds generally do not bifurcate that portion of realized gains and losses on investments which is due to changes in foreign exchange rates from that which is due to changes in market prices. These gains and losses are included on the “Statements of operations” under “Net realized and unrealized gain (loss) on investments.” Each Fund reports certain foreign currency related transactions as components of realized gains (losses) for
83
Table of Contents
Notes to financial statements
Delaware International Funds
1. Significant Accounting Policies (continued)
financial reporting purposes, whereas such components are treated as ordinary income (loss) for federal income tax purposes.
Use of Estimates – Each Fund is an investment company, whose financial statements are prepared in conformity with U.S. GAAP. Therefore, each Fund follows the accounting and reporting guidelines for investment companies. The preparation of financial statements in conformity with U.S. GAAP requires management to make estimates and assumptions that affect the fair value of investments, the reported amounts of assets and liabilities and disclosure of contingent assets and liabilities at the date of the financial statements, and the reported amounts of revenues and expenses during the reporting period. Actual results could differ from those estimates and the differences could be material.
Other – Expenses directly attributable to a Fund are charged directly to the Fund. Other expenses common to various funds within the Delaware Investments® Family of Funds are generally allocated among such funds on the basis of average net assets. Management fees and some other expenses are paid monthly. Security transactions are recorded on the date the securities are purchased or sold (trade date) for financial reporting purposes. Costs used in calculating realized gains and losses on the sale of investment securities are those of the specific securities sold. Dividend income is recorded on the ex-dividend date and interest income is recorded on the accrual basis. Discounts and premiums on debt securities are accreted or amortized to interest income, respectively, over the lives of the respective securities using the effective interest method. Taxable non-cash dividends are recorded as dividend income. Foreign dividends are also recorded on the ex-dividend date or as soon after the ex-dividend date that a Fund is aware of such dividends, net of all tax withholdings, a portion of which may be reclaimable. Withholding taxes and reclaims on foreign dividends have been recorded in accordance with each Fund’s understanding of the applicable country’s tax rules and rates. Each Fund may pay foreign capital gains taxes on certain foreign securities held, which are reported as components of realized losses for financial reporting purposes, whereas such components are treated as ordinary loss for federal income tax purposes.
Each Fund declares and pays dividends from net investment income and distributions from net realized gain on investments, if any, annually. Each Fund may distribute more frequently, if necessary for tax purposes. Dividends and distributions, if any, are recorded on the ex-dividend date.
Each Fund may receive earnings credits from its custodian when positive cash balances are maintained, which may be used to offset custody fees. There were no such earnings credits for the year ended Nov. 30, 2016.
84
Table of Contents
Each Fund receives earnings credits from its transfer agent when positive cash balances are maintained, which may be used to offset transfer agent fees. If the amount earned is greater than one dollar, the expense paid under this arrangement is included on the “Statements of operations” under “Dividend disbursing and transfer agent fees and expenses” with the corresponding expense offset shown under “Less expense paid indirectly.” For the year ended Nov. 30, 2016, each Fund earned the following amounts under this agreement:
Delaware Emerging Markets Fund | Delaware Global Value Fund | Delaware International Value Equity Fund | ||
| $3,095 | $110 | $457 | ||
During the year ended Nov. 30, 2016, Delaware Emerging Markets Fund frequently maintained a negative cash balance with its custodian, which is considered a form of borrowing or leverage. If that Fund maintains a negative cash balance and the Fund’s investments decrease in value, the Fund’s losses will be greater than if the Fund did not maintain a negative cash balance. Each Fund is required to pay interest to the custodian on negative cash balances. During the year ended Nov. 30, 2016, Delaware Emerging Markets Fund had an average outstanding overdraft balance equal to 1.88% of its average net assets for which it was charged interest of $317,970, which is included on the “Statements of operations” under “Custodian fees.” The average borrowing rate charged on the overdraft was 1.07%.
2. Investment Management, Administration Agreements, and Other Transactions with Affiliates
In accordance with the terms of its respective Investment Management Agreement, each Fund pays Delaware Management Company (DMC), a series of Delaware Management Business Trust and the investment manager, an annual fee based on each Fund’s average daily net assets as follows:
| Delaware Emerging Markets Fund | Delaware Global Value Fund | Delaware International Value Equity Fund | |||||||||||||||||
On the first $500 million | 1.25 | % | 0.85 | % | 0.85 | % | |||||||||||||
On the next $500 million | 1.20 | % | 0.80 | % | 0.80 | % | |||||||||||||
On the next $1.5 billion | 1.15 | % | 0.75 | % | 0.75 | % | |||||||||||||
In excess of $2.5 billion | 1.10 | % | 0.70 | % | 0.70 | % | |||||||||||||
DMC has contractually agreed to waive that portion, if any, of its management fee and reimburse the Funds to the extent necessary to ensure that annual operating expenses (excluding any 12b-1 fees, taxes, interest, short sale and dividend interest expenses, acquired fund fees and expenses, brokerage fees, certain insurance costs, and nonroutine expenses or costs, including, but not limited to, those relating to reorganizations, litigation, conducting shareholder meetings, and liquidations), do not exceed specified percentages of average daily net assets of each Fund as shown below. The expense waivers were in effect from Dec.1, 2015 through Nov. 30, 2016* for Delaware Global Value Fund and Delaware International Value Equity Fund and May 2, 2016 through Nov. 30, 2016** for Delaware Emerging Markets Fund. Prior to May 2, 2016, Delaware Emerging Markets Fund had no management fee waiver. For purposes of these waivers and reimbursements, nonroutine expenses may also include such additional costs and expenses as may be agreed upon from time to time by the Funds’ Board and DMC. These expense waivers and reimbursements apply only to expenses paid directly by the Funds and may only be terminated by agreement of DMC and the Funds.
85
Table of Contents
Notes to financial statements
Delaware International Funds
| 2. | Investment Management, Administration Agreements, and Other Transactions with Affiliates (continued) |
| Delaware Emerging Markets Fund | Delaware Global Value Fund | Delaware International Value Equity Fund | |||||||||||||||||
| Operating expense limitation as a percentage of average daily net assets (per annum) | 1.45 | %1 | 1.30 | % | 1.21 | % | |||||||||||||
1The expense limitation is 1.32% for Class R6.
Delaware Investments Fund Services Company (DIFSC), an affiliate of DMC, provides fund accounting and financial administration oversight services to each Fund. For these services, DIFSC’s fees are calculated based on the aggregate daily net assets of the Delaware Investments® Family of Funds at the following annual rate: 0.0050% of the first $30 billion; 0.0045% of the next $10 billion; 0.0040% of the next $10 billion; and 0.0025% of aggregate average daily net assets in excess of $50 billion. The fees payable to DIFSC under the service agreement described above are allocated among all retail funds in the Delaware Investments Family of Funds on a relative net asset value (NAV) basis. These amounts are included on the “Statements of operations” under “Accounting and administration expenses.” For the year ended Nov. 30, 2016, each Fund was charged for these services as follows:
Delaware Emerging Markets Fund | Delaware Global Value Fund | Delaware International Value Equity Fund | ||
$74,824 | $901 | $11,734 | ||
DIFSC is also the transfer agent and dividend disbursing agent of each Fund. For these services, DIFSC’s fees are calculated based on the aggregate daily net assets of the retail funds within the Delaware Investments Family of Funds at the following annual rate: 0.025% of the first $20 billion; 0.020% of the next $5 billion; 0.015% of the next $5 billion; and 0.013% on average daily net assets in excess of $30 billion. The fees payable to DIFSC under the service agreement described above are allocated among all retail funds in the Delaware Investments Family of Funds on a relative NAV basis. These amounts are included on the “Statements of operations” under “Dividend disbursing and transfer agent fees and expenses.” For the year ended Nov. 30, 2016, each Fund was charged for these services as follows:
Delaware Emerging Markets Fund | Delaware Global Value Fund | Delaware International Value Equity Fund | ||
$325,230 | $3,923 | $51,082 | ||
Pursuant to a sub-transfer agency agreement between DIFSC and BNY Mellon Investment Servicing (US) Inc. (BNYMIS), BNYMIS provides certain sub-transfer agency services to the Funds. Sub-transfer agency fees are paid by the Funds and are also included on the “Statements of operations” under “Dividend disbursing and transfer agent fees and expenses.”
Pursuant to a distribution agreement and distribution plan, each Fund pays DDLP, the distributor and an affiliate of DMC, an annual distribution and service fee of 0.25% of the average daily net assets of the Class A shares, 1.00% of the average daily net assets of the Class C shares, and 0.50% of the average
86
Table of Contents
daily net assets of the Class R shares. Institutional Class and Class R6 shares pay no distribution and service expenses.
As provided in the investment management agreement, each Fund bears a portion of the cost of certain resources shared with DMC, including the cost of internal personnel of DMC and/or its affiliates that provide legal, tax, and regulatory reporting services to the Funds. These amounts are included on the “Statements of operations” under “Legal Fees.” For the year ended Nov. 30, 2016, each Fund was charged for internal legal, tax, and regulatory reporting services provided by DMC and/or its affiliates’ employees as follows:
Delaware Emerging Markets Fund | Delaware Global Value Fund | Delaware International Value Equity Fund | ||
| $33,070 | $407 | $5,256 | ||
For the year ended Nov. 30, 2016, DDLP earned commissions on sales of Class A shares for each Fund as follows:
Delaware Emerging Markets Fund | Delaware Global | Delaware International | ||
| $28,350 | $2,017 | $4,741 | ||
For the year ended Nov. 30, 2016, DDLP received gross CDSC commissions on redemptions of each Fund’s Class A and Class C shares, and these commissions were entirely used to offset upfront commissions previously paid by DDLP to broker/dealers on sales of those shares. The amounts received were as follows:
Delaware Emerging | Delaware Global | Delaware International | |||||||||||||
Class A | $ | 1,013 | $ | 167 | $ | — | |||||||||
Class C | 9,717 | 183 | 1,309 | ||||||||||||
Trustees’ fees include expenses accrued by each Fund for each Trustee’s retainer and meeting fees. Certain officers of DMC, DIFSC, and DDLP are officers and/or Trustees of the Trust. These officers and Trustees are paid no compensation by the Funds.
* The aggregate contractual waiver period covering this report is from March 30, 2015 through May 2, 2017.
**The aggregate contractual waiver period covering this report is from May 2, 2016 through May 2, 2017.
87
Table of Contents
Notes to financial statements
Delaware International Funds
2. Investment Management, Administration Agreements, and Other Transactions with Affiliates (continued)
Cross trades for the year ended Nov. 30, 2016, were executed by the Funds pursuant to procedures adopted by the Board designed to ensure compliance with Rule 17a-7 under the 1940 Act. Cross trading is the buying or selling of portfolio securities between funds of investment companies, or between a fund of an investment company and another entity, that are or could be considered affiliates by virtue of having a common investment advisor (or affiliated investment advisors), common directors/trustees and/or common officers. At its regularly scheduled meetings, the Board reviews such transactions for compliance with the procedures adopted by the Board. Pursuant to these procedures, for the year ended Nov. 30, 2016, the Funds engaged in securities purchases and securities sales, which resulted in the following net realized gains (losses):
| Purchases | Sales | Net realized gain (loss) | |||||||||||||
Delaware Emerging Markets Fund | $ | 5,512,670 | $ | — | $ | — | |||||||||
Delaware Global Value Fund | — | 25,907 | (2 | ) | |||||||||||
3. Investments
For the year ended Nov. 30, 2016, each Fund made purchases and sales of investment securities other than short-term investments as follows:
Delaware Emerging | Delaware Global | Delaware International | |||||||||||||
Purchases | $ | 507,847,242 | $ | 2,269,487 | $ | 32,523,904 | |||||||||
Sales | 405,958,698 | 5,319,507 | 48,142,731 | ||||||||||||
At Nov. 30, 2016, the cost and unrealized appreciation (depreciation) of investments for federal income tax purposes for each Fund were as follows:
Delaware Emerging | Delaware Global | Delaware International | |||||||||||||
Cost of investments | $ | 2,321,660,751 | $ | 18,084,516 | $ | 262,466,891 | |||||||||
|
|
|
|
|
| ||||||||||
Aggregate unrealized appreciation of investments | $ | 236,305,572 | $ | 3,754,946 | $ | 45,258,591 | |||||||||
Aggregate unrealized depreciation of investments | (527,354,452 | ) | (2,619,364 | ) | (56,924,236 | ) | |||||||||
|
|
|
|
|
| ||||||||||
Net unrealized appreciation (depreciation) of investments | $ | (291,048,880 | ) | $ | 1,135,582 | $ | (11,665,645 | ) | |||||||
|
|
|
|
|
| ||||||||||
88
Table of Contents
U.S. GAAP defines fair value as the price that each Fund would receive to sell an asset or pay to transfer a liability in an orderly transaction between market participants at the measurement date under current market conditions. A three-level hierarchy for fair value measurements has been established based upon the transparency of inputs to the valuation of an asset or liability. Inputs may be observable or unobservable and refer broadly to the assumptions that market participants would use in pricing the asset or liability. Observable inputs reflect the assumptions market participants would use in pricing the asset or liability based on market data obtained from sources independent of the reporting entity. Unobservable inputs reflect the reporting entity’s own assumptions about the assumptions that market participants would use in pricing the asset or liability based on the best information available under the circumstances. Each Fund’s investment in its entirety is assigned a level based upon the observability of the inputs which are significant to the overall valuation. The three-level hierarchy of inputs is summarized below.
| Level 1 | – | Inputs are quoted prices in active markets for identical investments. (Examples: equity securities, open-end investment companies, futures contracts, exchange-traded options contracts) | ||
| Level 2 | – | Other observable inputs, including, but not limited to: quoted prices for similar assets or liabilities in markets that are active, quoted prices for identical or similar assets or liabilities in markets that are not active, inputs other than quoted prices that are observable for the assets or liabilities (such as interest rates, yield curves, volatilities, prepayment speeds, loss severities, credit risks, and default rates) or other market-corroborated inputs. (Examples: debt securities, government securities, swap contracts, foreign currency exchange contracts, foreign securities utilizing international fair value pricing, broker-quoted securities, fair valued securities) | ||
| Level 3 | – | Significant unobservable inputs, including each Fund’s own assumptions used to determine the fair value of investments. (Examples: broker-quoted securities, fair valued securities) | ||
Level 3 investments are valued using significant unobservable inputs. Each Fund may also use an income-based valuation approach in which the anticipated future cash flows of the investment are discounted to calculate fair value. Discounts may also be applied due to the nature or duration of any restrictions on the disposition of the investments. Valuations may also be based upon current market prices of securities that are comparable in coupon, rating, maturity, and industry. The derived value of a Level 3 investment may not represent the value which is received upon disposition and this could impact the results of operations.
89
Table of Contents
Notes to financial statements
Delaware International Funds
3. Investments (continued)
The following tables summarize the valuation of each Fund’s investments by fair value hierarchy levels as of Nov. 30, 2016:
Delaware Emerging Markets Fund | ||||||||||||||||||||
Securities | Level 1 | Level 2 | Level 3 | Total | ||||||||||||||||
Common Stock | ||||||||||||||||||||
Argentina | $ | 63,126,968 | $ | 8,373,983 | $ | — | $ | 71,500,951 | ||||||||||||
Bahrain | — | 904,397 | — | 904,397 | ||||||||||||||||
Brazil | 271,076,249 | — | — | 271,076,249 | ||||||||||||||||
Canada | 391,210 | — | — | 391,210 | ||||||||||||||||
Chile | 19,982,950 | — | — | 19,982,950 | ||||||||||||||||
China/Hong Kong | 610,582,580 | — | — | 610,582,580 | ||||||||||||||||
Cyprus | 5,124,277 | — | — | 5,124,277 | ||||||||||||||||
France | 1,454,496 | — | — | 1,454,496 | ||||||||||||||||
India | 150,631,956 | 13,410 | — | 150,645,366 | ||||||||||||||||
Indonesia | 15,598,598 | — | — | 15,598,598 | ||||||||||||||||
Malaysia | 3,958,800 | — | — | 3,958,800 | ||||||||||||||||
Mexico | 102,373,572 | — | — | 102,373,572 | ||||||||||||||||
Netherlands | 14,215,706 | — | — | 14,215,706 | ||||||||||||||||
Peru | 13,404,000 | — | — | 13,404,000 | ||||||||||||||||
Poland | 5,005,818 | — | — | 5,005,818 | ||||||||||||||||
Republic of Korea | 229,407,066 | — | — | 229,407,066 | ||||||||||||||||
Russia | 168,953,951 | 34,144,095 | — | 203,098,046 | ||||||||||||||||
South Africa | 9,398,492 | — | — | 9,398,492 | ||||||||||||||||
Taiwan | 112,375,679 | — | — | 112,375,679 | ||||||||||||||||
Turkey | 54,820,344 | — | — | 54,820,344 | ||||||||||||||||
United Kingdom | 2,084,026 | — | — | 2,084,026 | ||||||||||||||||
United States | 22,686,488 | — | — | 22,686,488 | ||||||||||||||||
Preferred Stock1 | 80,889,205 | 20,071,645 | — | 100,960,850 | ||||||||||||||||
Exchange-Traded Fund | 9,561,910 | — | — | 9,561,910 | ||||||||||||||||
Participation Notes | — | — | — | — | ||||||||||||||||
|
|
|
|
|
|
|
| |||||||||||||
Total Value of Securities | $ | 1,967,104,341 | $ | 63,507,530 | $ | — | $ | 2,030,611,871 | ||||||||||||
|
|
|
|
|
|
|
| |||||||||||||
Foreign Currency Exchange Contracts | $ | — | $ | 91 | $ | — | $ | 91 | ||||||||||||
1Security type is valued across multiple levels. The amounts attributed to Level 1 investments and Level 2 investments represent 80.12% and 19.88%, respectively, of the total market value of this security type. Level 1 investments represent exchange traded investments and Level 2 investments represent investments with observable inputs.
90
Table of Contents
Delaware Global Value Fund | |||||||||||||||
Securities | Level 1 | Level 2 | Total | ||||||||||||
Common Stock | $ | 18,064,822 | $ | — | $ | 18,064,822 | |||||||||
Short-Term Investments | — | 104,582 | 104,582 | ||||||||||||
Securities Lending Collateral | — | 1,050,694 | 1,050,694 | ||||||||||||
|
|
|
|
|
| ||||||||||
Total Value of Securities | $ | 18,064,822 | $ | 1,155,276 | $ | 19,220,098 | |||||||||
|
|
|
|
|
| ||||||||||
Delaware International Value Equity Fund | |||||||||||||||
Securities | Level 1 | Level 2 | Total | ||||||||||||
Common Stock | $ | 234,837,026 | $ | — | $ | 234,837,026 | |||||||||
Rights | 4,722 | — | 4,722 | ||||||||||||
Short-Term Investments | — | 5,261,263 | 5,261,263 | ||||||||||||
Securities Lending Collateral | — | 10,698,235 | 10,698,235 | ||||||||||||
|
|
|
|
|
| ||||||||||
Total Value of Securities | $ | 234,841,748 | $ | 15,959,498 | $ | 250,801,246 | |||||||||
|
|
|
|
|
| ||||||||||
The securities that have been valued at zero on the “Schedules of investments” are considered to be Level 3 securities in these tables.
During the year ended Nov. 30, 2016, there were no transfers between Level 1 investments, Level 2 investments, or Level 3 investments that had a significant impact to each Fund. This does not include transfers between Level 1 investments and Level 2 investments due to each Fund utilizing international fair value pricing during the period. In accordance with the fair valuation procedures described in Note 1, international fair value pricing of securities in each Fund occurs when market volatility exceeds an established rolling threshold. If the threshold is exceeded on a given date, then prices of international securities (those that traded on exchanges that close at a different time than the time that each Fund’s net asset value is determined) are established using a separate pricing feed from a third party vendor designed to establish a price for each such security as of the time that each Fund’s net asset value is determined. Further, international fair value pricing uses other observable market-based inputs in place of the closing exchange price due to the events occurring after the close of the exchange or market on which the investment is principally traded, causing a change in classification between levels. Each Fund’s policy is to recognize transfers between levels at the beginning of the reporting period.
A reconciliation of Level 3 investments is presented when a Fund has a significant amount of Level 3 investments at the beginning, interim, or end of the period in relation to the Fund’s net assets. Management has determined not to provide a reconciliation of Level 3 investments as they were not considered significant to each Fund’s net assets at the beginning, interim, or end of the year. Management has determined not to provide additional disclosure on Level 3 inputs since the Level 3 investments are not considered significant to each Fund’s net assets at the end of the year.
During the year ended Nov. 30, 2016, Delaware Global Value Fund and Delaware International Value Equity Fund had no Level 3 investments.
91
Table of Contents
Notes to financial statements
Delaware International Funds
4. Dividend and Distribution Information
Income and long-term capital gain distributions are determined in accordance with federal income tax regulations, which may differ from U.S. GAAP. Additionally, distributions from net gains on foreign currency transactions and net short-term gains on sales of investment securities are treated as ordinary income for federal income tax purposes. The tax character of dividends and distributions paid during the years ended Nov. 30, 2016 and 2015 was as follows:
| Delaware Emerging Markets Fund | Delaware Global Value Fund | Delaware International Value Equity Fund | |||||||||||||
Year ended Nov. 30, 2016 | |||||||||||||||
Ordinary income | $ | 3,245,216 | $124,621 | $ | 3,420,608 | ||||||||||
Year ended Nov. 30, 2015 | |||||||||||||||
Ordinary income | $ | 26,798,002 | $ 91,070 | $ | 5,839,811 | ||||||||||
Long-term capital gains | 52,697,119 | — | — | ||||||||||||
Return of capital | 2,054,265 | — | — | ||||||||||||
|
|
|
|
|
| ||||||||||
Total | $ | 81,549,386 | $ 91,070 | $ | 5,839,811 | ||||||||||
|
|
|
|
|
| ||||||||||
5. Components of Net Assets on a Tax Basis
As of Nov. 30, 2016, the components of net assets on a tax basis were as follows:
| Delaware Emerging Markets Fund | Delaware Global Value Fund | Delaware International Value Equity Fund | ||||||||||
Shares of beneficial interest | $2,323,309,169 | $ 29,314,524 | $ 372,196,601 | |||||||||
Undistributed ordinary income | 13,473,321 | 284,100 | 5,165,041 | |||||||||
Capital loss carryforwards | (79,850,784 | ) | (12,542,677 | ) | (122,028,057 | ) | ||||||
Unrealized appreciation (depreciation) of investments and foreign currencies | (292,281,758 | ) | 1,133,560 | (11,755,575 | ) | |||||||
|
|
|
|
|
| |||||||
Net assets | $1,964,649,948 | $ 18,189,507 | $ 243,578,010 | |||||||||
|
|
|
|
|
| |||||||
The differences between book basis and tax basis components of net assets are primarily attributable to tax deferral of losses on wash sales, and tax recognition of unrealized gain on passive foreign investment companies.
For financial reporting purposes, capital accounts are adjusted to reflect the tax character of permanent book/tax differences. Reclassifications are primarily due to tax treatment of gain (loss) on foreign currency transactions, foreign capital gains tax, dividends and distributions, expiring capital loss carryforwards, and passive foreign investment companies. Results of operations and net assets were not affected by these reclassifications.
92
Table of Contents
For year ended Nov. 30, 2016, the Funds recorded the following reclassifications:
| Delaware Emerging Markets Fund | Delaware Global Value Fund | Delaware International Value Equity Fund | |||||||||||||
Undistributed (distributions in excess of) net investment income | $ | 8,013,914 | $ | 119,708 | $ | 1,257,635 | |||||||||
Accumulated net realized loss on investments | (8,013,914 | ) | 8,243,114 | 42,621,169 | |||||||||||
Paid in capital | — | (8,362,822 | ) | (43,878,804 | ) | ||||||||||
For federal income tax purposes, capital loss carryforwards may be carried forward and applied against future capital gains.
In 2016, the Funds utilized capital loss carryforwards as follows:
Delaware Global Value Fund | $ | 520,994 | ||
Delaware International Value Equity Fund | 6,244,549 |
Capital loss carryforwards remaining at Nov. 30, 2016 will expire as follows:
| Delaware Global Value Fund | Delaware International Value Equity Fund | |||||||||
Year of expiration | ||||||||||
2017 | $ | 12,542,677 | $ | 113,289,581 | ||||||
2019 | — | 8,738,476 | ||||||||
|
|
|
| |||||||
Total | $ | 12,542,677 | $ | 122,028,057 | ||||||
|
|
|
| |||||||
On Dec. 22, 2010, the Regulated Investment Company Modernization Act of 2010 (Act) was enacted, which changed various technical rules governing the tax treatment of regulated investment companies. The changes were generally effective for taxable years beginning after the date of enactment. Under the Act, each Fund is permitted to carry forward capital losses incurred in taxable years beginning after the date of enactment for an unlimited period. However, any losses incurred during those future taxable years will be required to be utilized prior to the losses incurred in pre-enactment taxable years, which carry an expiration date. As a result of this ordering rule, pre-enactment capital loss carryforwards may be more likely to expire unused. Additionally, post-enactment capital loss carryforwards will retain their character as either short-term or long-term capital losses rather than being considered all short-term as permitted under previous regulation.
93
Table of Contents
Notes to financial statements
Delaware International Funds
5. Components of Net Assets on a Tax Basis (continued)
Losses incurred that will be carried forward under the Act are as follows:
| Loss carryforward character | ||||||||||
Short-term | Long-term | |||||||||
Delaware Emerging Markets Fund | $ | 22,129,072 | $ | 57,721,712 | ||||||
6. Capital Shares
Transactions in capital shares were as follows:
| Delaware Emerging Markets Fund | Delaware Global Value Fund | Delaware International Value Equity Fund | ||||||||||||||||||||||
| Year | Year | Year | Year | Year | Year | |||||||||||||||||||
| ended | ended | ended | ended | ended | ended | |||||||||||||||||||
| 11/30/16 | 11/30/15 | 11/30/16 | 11/30/15 | 11/30/16 | 11/30/15 | |||||||||||||||||||
Shares sold: | ||||||||||||||||||||||||
Class A | 22,072,538 | 6,347,742 | 67,302 | 104,296 | 741,691 | 688,161 | ||||||||||||||||||
Class C | 894,709 | 1,743,497 | 30,520 | 73,821 | 137,781 | 322,130 | ||||||||||||||||||
Class R | 1,181,426 | 1,337,364 | — | — | 47,872 | 37,840 | ||||||||||||||||||
Institutional Class | 40,955,057 | 47,267,532 | 15,937 | 25,026 | 4,054,883 | 3,214,516 | ||||||||||||||||||
Class R6 | 19,949 | — | — | — | — | — | ||||||||||||||||||
Shares issued upon reinvestment of dividends and distributions: | ||||||||||||||||||||||||
Class A | 6,537 | 639,662 | 9,275 | 6,136 | 65,407 | 109,477 | ||||||||||||||||||
Class C | — | 314,905 | — | — | 10,423 | 26,523 | ||||||||||||||||||
Class R | — | 23,453 | — | — | 1,279 | 3,076 | ||||||||||||||||||
Institutional Class | 200,093 | 3,328,262 | 1,614 | 1,207 | 191,191 | 307,105 | ||||||||||||||||||
|
|
|
|
|
|
|
|
|
|
|
| |||||||||||||
| 65,330,309 | 61,002,417 | 124,648 | 210,486 | 5,250,527 | 4,708,828 | |||||||||||||||||||
|
|
|
|
|
|
|
|
|
|
|
| |||||||||||||
Shares redeemed: | ||||||||||||||||||||||||
Class A | (11,845,045 | ) | (11,916,634 | ) | (285,311 | ) | (261,616 | ) | (1,712,335 | ) | (1,120,263 | ) | ||||||||||||
Class C | (3,001,592 | ) | (4,183,293 | ) | (85,071 | ) | (118,728 | ) | (517,950 | ) | (427,070 | ) | ||||||||||||
Class R | (568,075 | ) | (352,306 | ) | — | — | (38,932 | ) | (100,574 | ) | ||||||||||||||
Institutional Class | (46,678,696 | ) | (105,391,312 | ) | (59,402 | ) | (43,643 | ) | (3,926,023 | ) | (4,489,914 | ) | ||||||||||||
Class R6 | (1,738 | ) | — | — | — | — | — | |||||||||||||||||
|
|
|
|
|
|
|
|
|
|
|
| |||||||||||||
| (62,095,146 | ) | (121,843,545 | ) | (429,784 | ) | (423,987 | ) | (6,195,240 | ) | (6,137,821 | ) | |||||||||||||
|
|
|
|
|
|
|
|
|
|
|
| |||||||||||||
Net increase (decrease) | 3,235,163 | (60,841,128 | ) | (305,136 | ) | (213,501 | ) | (944,713 | ) | (1,428,993 | ) | |||||||||||||
|
|
|
|
|
|
|
|
|
|
|
| |||||||||||||
94
Table of Contents
For each Fund, certain shareholders may exchange shares of one class of shares for shares of another class in the same Fund. For the years ended Nov. 30, 2016 and 2015, exchange transactions were as follows:
Year ended 11/30/16 | ||||||||||||||||||||||
| Exchange Redemptions | Exchange Subscriptions | |||||||||||||||||||||
Class A Shares | Class C | Institutional Class Shares | Class A Shares | Institutional | Value | |||||||||||||||||
Delaware Emerging Markets Fund | 206,437 | 9,708 | 358 | 361 | 214,112 | $2,932,645 | ||||||||||||||||
Delaware International Value Equity Fund | 385 | 46,154 | — | — | 45,659 | 582,118 | ||||||||||||||||
Year ended 11/30/15 | ||||||||||||||||||||||
| Exchange Redemptions | Exchange Subscriptions | |||||||||||||||||||||
Class A | Class C | Institutional | Class A | Institutional | Value | |||||||||||||||||
Delaware Emerging Markets Fund | 12,941 | 18,540 | 7,274 | 10,623 | 26,891 | $529,639 | ||||||||||||||||
Delaware International Value Equity Fund | — | 6,404 | — | — | 6,277 | 85,559 | ||||||||||||||||
These exchange transactions are included as subscriptions and redemptions in the tables on the previous page and the “Statements of changes in net assets.” For the years ended Nov. 30, 2016 and 2015, Delaware Global Value Fund had no exchange transactions.
7. Line of Credit
Each Fund, along with certain other funds in the Delaware Investments® Family of Funds (Participants), was a participant in a $155,000,000 revolving line of credit intended to be used for temporary or emergency purposes as an additional source of liquidity to fund redemptions of investor shares. Under the agreement, the Participants were charged an annual commitment fee of 0.10%, which was allocated across the Participants on the basis of relative net assets of each Participant’s allocation of the entire facility. The Participants were permitted to borrow up to a maximum of one third of their net assets under the agreement. Each Participant was individually, and not jointly, liable for its particular advances, if any, under the line of credit. The line of credit available under the agreement expired on Nov. 7, 2016.
On Nov. 7, 2016, each Fund along with the other Participants, entered into an amendment to the agreement for a $155,000,000 revolving line of credit. The line of credit is to be used as described above and operates in substantially the same manner as the original agreement, with the exception of the annual commitment fee. Under the amendment to the agreement, the Participants are charged an annual commitment fee of 0.15%, which is allocated across the Participants on the basis of relative net assets of each Participant’s allocation of the entire facility. The line of credit available under the agreement expires on Nov. 6, 2017.
95
Table of Contents
Notes to financial statements
Delaware International Funds
7. Line of Credit (continued)
The Funds had no amounts outstanding as of Nov. 30, 2016, or at any time during the year then ended.
8. Derivatives
U.S. GAAP requires disclosures that enable investors to understand: (1) how and why an entity uses derivatives; (2) how they are accounted for; and (3) how they affect an entity���s results of operations and financial position.
Foreign Currency Exchange Contracts – Each Fund may enter into foreign currency exchange contracts and foreign cross currency exchange contracts as a way of managing foreign exchange rate risk. Each Fund may enter into these contracts to fix the U.S. dollar value of a security that it has agreed to buy or sell for the period between the date the trade was entered into and the date the security is delivered and paid for. Each Fund may also use these contracts to hedge the U.S. dollar value of securities it already owns that are denominated in foreign currencies. In addition, each Fund may enter into these contracts to facilitate or expedite the settlement of portfolio transactions. The change in value is recorded as an unrealized gain or loss. When the contract is closed, a realized gain or loss is recorded equal to the difference between the value of the contract at the time it was opened and the value at the time it was closed.
The use of foreign currency exchange contracts and foreign cross currency exchange contracts does not eliminate fluctuations in the underlying prices of the securities, but does establish a rate of exchange that can be achieved in the future. Although foreign currency exchange contracts and foreign cross currency exchange contracts limit the risk of loss due to an unfavorable change in the value of the hedged currency, they also limit any potential gain that might result should the value of the currency change favorably. In addition, each Fund could be exposed to risks if the counterparties to the contracts are unable to meet the terms of their contracts. Each Fund’s maximum risk of loss from counterparty credit risk is the value of its currency exchanged with the counterparty. The risk is generally mitigated by having a netting arrangement between each Fund and the counterparty and by the posting of collateral by the counterparty to the Fund to cover the Fund’s exposure to the counterparty.
During the year ended Nov. 30, 2016, Delaware Emerging Markets Fund entered into foreign currency exchange contracts and foreign cross currency exchange contracts to facilitate or expedite the settlement of portfolio transactions. Delaware Global Value Fund and Delaware International Value Equity Fund entered into foreign currency exchange contracts and foreign cross currency contracts in order to fix the U.S. dollar value of a security between the trade date and settlement date and to facilitate or expedite the settlement of portfolio transactions.
At Nov. 30, 2016, the Funds experienced net realized and unrealized gains or losses attributable to foreign currency holdings, which are disclosed on the “Statements of assets and liabilities” and “Statements of operations.”
96
Table of Contents
Derivatives Generally. The table below summarizes the average balance of derivative holdings by each Fund during the year ended Nov. 30, 2016.
| Long Derivatives Volume | ||||||
Delaware Emerging | Delaware Global | Delaware International | ||||
| Foreign currency exchange contracts (average cost) | $234,491 | $5,245 | $81,092 | |||
| Short Derivatives Volume | ||||||
Delaware Emerging | Delaware Global | Delaware International | ||||
| Foreign currency exchange contracts (average cost) | $602,158 | $15,447 | $191,742 | |||
9. Offsetting
In December 2011, the Financial Accounting Standards Board (FASB) issued guidance that expanded disclosure requirements on the offsetting of certain assets and liabilities. The disclosures are required for investments and derivative financial instruments subject to master netting or similar agreements which are eligible for offset on the “Statements of assets and liabilities” and requires an entity to disclose both gross and net information about such investments and transactions in the financial statements. In January 2013, the FASB issued guidance that clarified which investments and transactions are subject to the offsetting disclosure requirements. The scope of the disclosure requirements for offsetting is limited to derivative instruments, repurchase agreements and reverse repurchase agreements, and securities borrowing.
In order to better define its contractual rights and to secure rights that will help each Fund mitigate its counterparty risk, the Funds entered into an International Swaps and Derivatives Association, Inc. Master Agreement (ISDA Master Agreement) or a similar agreement with certain of their derivative contract counterparties. An ISDA Master Agreement is a bilateral agreement between each Fund and a counterparty that governs certain over-the-counter (OTC) derivatives and foreign exchange contracts and typically contains, among other things, collateral posting items and netting provisions in the event of a default and/or termination event. Under an ISDA Master Agreement, each Fund may, under certain circumstances, offset with the counterparty certain derivative financial instrument’s payables and/or receivables with collateral held and/or posted and create one single net payment. The provisions of the ISDA Master Agreement typically permit a single net payment in the event of default (close-out), including the bankruptcy or insolvency of the counterparty. However, bankruptcy or insolvency laws of a particular jurisdiction may impose restrictions on or prohibitions against the right of offset in bankruptcy, insolvency, or other events.
For financial reporting purposes, the Funds do not offset derivative assets and derivative liabilities that are subject to netting arrangements on the “Statements of assets and liabilities.”
97
Table of Contents
Notes to financial statements
Delaware International Funds
9. Offsetting (continued)
At Nov. 30, 2016, The Funds had the following assets and liabilities subject to offsetting provisions:
Offsetting of Financial Assets and Liabilities and Derivative Assets and Liabilities
| Delaware Emerging Markets Fund | |||||||||||||||
| Gross Value of | Gross Value of | ||||||||||||||
| Counterparty | Derivative Asset | Derivative Liability | Net Position | ||||||||||||
BNY Mellon | $ | 91 | $ | — | $91 | ||||||||||
|
|
|
|
|
| ||||||||||
Fair Value of | Cash Collateral | Fair Value of | Cash Collateral | Net | ||||||||||||||||||||||||||
Counterparty | Net Position | Received | Received | Pledged | Pledged | Exposure(b) | ||||||||||||||||||||||||
BNY Mellon | $91 | $ | — | $ | — | $ | — | $ | — | $91 | ||||||||||||||||||||
|
|
|
|
|
|
|
|
|
|
|
| |||||||||||||||||||
| Delaware Global Value Fund | ||||||||||||||||||||
| Master Repurchase Agreements | Repurchase | Fair Value of Non-Cash Collateral | Cash Collateral | Net Collateral | Net | |||||||||||||||
Counterparty | Agreements | Received(a) | Received | Received | Exposure(b) | |||||||||||||||
Bank of America Merrill Lynch | $ 5,519 | $ (5,519 | ) | $— | $ (5,519 | ) | $— | |||||||||||||
Bank of Montreal | 9,199 | (9,199 | ) | — | (9,199 | ) | — | |||||||||||||
BNP Paribas | 282 | (282 | ) | — | (282 | ) | — | |||||||||||||
|
|
|
|
|
|
|
|
|
| |||||||||||
Total | $15,000 | $(15,000 | ) | $— | $(15,000 | ) | $— | |||||||||||||
|
|
|
|
|
|
|
|
|
| |||||||||||
| Delaware International Value Equity Fund | ||||||||||||||||||||
| Master Repurchase Agreements | Repurchase | Fair Value of Non-Cash Collateral | Cash Collateral | Net Collateral | Net | |||||||||||||||
Counterparty | Agreements | Received(a) | Received | Received | Exposure(b) | |||||||||||||||
Bank of America Merrill Lynch | $311,292 | $(311,292 | ) | $— | $(311,292 | ) | $— | |||||||||||||
Bank of Montreal | 518,820 | (518,820 | ) | — | (518,820 | ) | — | |||||||||||||
BNP Paribas | 15,888 | (15,888 | ) | — | (15,888 | ) | — | |||||||||||||
|
|
|
|
|
|
|
|
|
| |||||||||||
Total | $846,000 | $(846,000 | ) | $— | $(846,000 | ) | $— | |||||||||||||
|
|
|
|
|
|
|
|
|
| |||||||||||
Securities Lending
Securities lending transactions are entered into by the Funds under Master Securities Lending Agreements (each, an “MSLA”) which provide the right, in the event of default (including bankruptcy or insolvency), for the non-defaulting party to liquidate the collateral and calculate a net exposure to the defaulting party or request additional collateral. In the event that a borrower defaults, the Funds, as lender, would offset the market value of the collateral received against the market value of the securities loaned. When the value of the collateral is greater than that of the market value of the securities loaned, the lender is left with a net amount payable to the defaulting party. However, bankruptcy or insolvency laws of a particular jurisdiction may impose restrictions on or prohibitions against such a right of offset in the event of an MSLA counterparty’s bankruptcy or insolvency. Under the MSLA, the borrower can resell
98
Table of Contents
or re-pledge the loaned securities, and the Fund can reinvest cash collateral, or, upon an event of default, resell or re-pledge the collateral.
As of Nov. 30, 2016, the following tables are a summary of the Funds’ securities lending agreements by counterparty which are subject to offset under an MSLA:
| Delaware Global Value Fund | ||||||||
Counterparty | Securities Loaned at Value | Cash Collateral Received | Fair Value of Non-Cash Collateral Received | Net Exposure(b) | ||||
BNY Mellon | $1,562,207 | $(1,021,349) | $(540,858) | $— | ||||
| Delaware International Value Equity Fund | ||||||||
Counterparty | Securities Loaned at Value | Cash Collateral Received | Fair Value of Non-Cash Collateral Received | Net Exposure(b) | ||||
BNY Mellon | $10,369,802 | $(10,369,802) | $— | $— | ||||
(a) The value of the related collateral received exceeded the value of the repurchase agreements as of Nov. 30, 2016.
(b) Net exposure represents the receivable (payable) that would be due from (to) the counterparty in the event of default.
10. Securities Lending
Each Fund, along with other funds in the Delaware Investments® Family of Funds, may lend its securities pursuant to a security lending agreement (Lending Agreement) with The Bank of New York Mellon (BNY Mellon). At the time a security is loaned, the borrower must post collateral equal to the required percentage of the market value of the loaned security, including any accrued interest. The required percentage is: (1) 102% with respect to U.S. securities and foreign securities that are denominated and payable in U.S. dollars; and (2) 105% with respect to foreign securities. With respect to each loan, if on any business day the aggregate market value of securities collateral plus cash collateral held is less than the aggregate market value of the securities which are the subject of such loan, the borrower will be notified to provide additional collateral by the end of the following business day which, together with the collateral already held, will be not less than the applicable initial collateral requirements for such security loan. If the aggregate market value of securities collateral and cash collateral held with respect to a security loan exceeds the applicable initial collateral requirement, upon request of the borrower, BNY Mellon must return enough collateral to the borrower by the end of the following business day to reduce the value of the remaining collateral to the applicable initial collateral requirement for such security loan. As a result of the foregoing, the value of the collateral held with respect to a loaned security on any particular day may be more or less than the value of the security on loan.
Prior to Dec. 29, 2015, cash collateral received was generally invested in the Delaware Investments Collateral Fund No. 1 (Collective Trust), a pooled account established by BNY Mellon for the use of funds managed by DMC that participate in BNY Mellon’s securities lending program. The Collective Trust sought to maintain a NAV per unit of $1.00.
99
Table of Contents
Notes to financial statements
Delaware International Funds
10. Securities Lending (continued)
On Dec. 29, 2015, the assets in the Collective Trust were transferred to a series of individual separate accounts, each corresponding to a Fund. The investment guidelines permit each separate account to hold certain securities that would be considered eligible securities for a money market fund. Cash collateral received is generally invested in government securities; certain obligations issued by government sponsored enterprises; repurchase agreements collateralized by U.S. Treasury securities; obligations issued by the central government of any Organization for Economic Cooperation and Development (OECD) country or its agencies, instrumentalities or establishments; obligations of supranational organizations, commercial paper, notes, bonds and other debt obligations; certificates of deposit, time deposits and other bank obligations; and asset-backed securities as disclosed on the “Schedules of investments.” Securities purchased with cash collateral are valued at market value.
In the event of default or bankruptcy by the lending agent, realization and/or retention of the collateral may be subject to legal proceedings. In the event the borrower fails to return loaned securities and the collateral received is insufficient to cover the value of the loaned securities and provided such collateral shortfall is not the result of investment losses, the lending agent has agreed to pay the amount of the shortfall to each Fund or, at the discretion of the lending agent, replace the loaned securities. Each Fund continues to record dividends or interest, as applicable, on the securities loaned and are subject to changes in value of the securities loaned that may occur during the term of the loan. Each Fund has the right under the Lending Agreement to recover the securities from the borrower on demand. With respect to security loans collateralized by non-cash collateral, each Fund receives loan premiums paid by the borrower. With respect to security loans collateralized by cash collateral, the earnings from the collateral investments are shared among each Fund, the security lending agent, and the borrower. Each Fund records security lending income net of allocations to the security lending agent and the borrower.
Each Fund may incur investment losses as a result of investing securities lending collateral. This could occur if an investment in the collateral investment account defaulted or became impaired. Under those circumstances, the value of each Fund’s cash collateral account may be less than the amount each Fund would be required to return to the borrowers of the securities and each Fund would be required to make up for this shortfall.
100
Table of Contents
The following table reflects a breakdown of transactions accounted for as secured borrowings, the gross obligation by the type of collateral pledged, and the remaining contractual maturity of those transactions as of Nov. 30, 2016:
Remaining Contractual Maturity of the Agreements as of Nov. 30, 2016 | |||||||||||||||||||||||||
Securities Lending Transactions | Overnight and Continuous | Under 30 days | Between 30 & 90 days | Over 90 days | Total | ||||||||||||||||||||
Delaware Global Value Fund | |||||||||||||||||||||||||
Common stocks | $ | 1,050,694 | $ | — | $ | — | $ | — | $ | 1,050,694 | |||||||||||||||
Delaware International Value Equity Fund | |||||||||||||||||||||||||
Common stocks | 10,698,235 | — | — | — | 10,698,235 | ||||||||||||||||||||
At Nov. 30, 2016, the values of securities on loan and the values of invested collateral for each Fund are presented below, for which cash collateral was received and invested in accordance with the MSLA. These investments are presented on the “Schedules of investments” under the caption “Securities Lending Collateral.”
| Delaware Emerging Markets Fund | Delaware Global Value Fund | Delaware International Value Equity Fund | |||||||||||||
Values of securities on loan | $ | — | $ | 1,562,207 | $ | 10,369,802 | |||||||||
Values of non-cash collateral | — | 540,858 | — | ||||||||||||
Values of invested collateral | — | 1,050,694 | 10,698,235 | ||||||||||||
11. Credit and Market Risk
Some countries in which the Funds may invest require governmental approval for the repatriation of investment income, capital, or the proceeds of sales of securities by foreign investors. In addition, if there is deterioration in a country’s balance of payments or for other reasons, a country may impose temporary restrictions on foreign capital remittances abroad.
The securities exchanges of certain foreign markets are substantially smaller, less liquid, and more volatile than the major securities markets in the United States. Consequently, acquisition and disposition of securities by each Fund may be inhibited. In addition, a significant portion of the aggregate market value of equity securities listed on the major securities exchanges in emerging markets is held by a smaller number of investors. This may limit the number of shares available for acquisition or disposition by each Fund.
Each Fund may invest up to 15% of its net assets in illiquid securities, which may include securities with contractual restrictions on resale, securities exempt from registration under Rule 144A promulgated under the Securities Act of 1933, as amended, and other securities which may not be readily marketable. The relative illiquidity of these securities may impair each Fund from disposing of them in a timely manner and at a fair price when it is necessary or desirable to do so. While maintaining oversight, each
101
Table of Contents
Notes to financial statements
Delaware International Funds
11. Credit and Market Risk (continued)
Fund’s Board has delegated to DMC, the day-to-day functions of determining whether individual securities are liquid for purposes of each Fund’s limitation on investments in illiquid securities. Securities eligible for resale pursuant to Rule 144A, which are determined to be liquid, are not subject to each Fund’s 15% limit on investments in illiquid securities. When monitoring compliance with the Funds’ illiquid limit, certain holdings that are common to multiple clients of the investment manager may be aggregated and considered illiquid in the aggregate solely for monitoring purposes. For purposes of determining illiquidity for financial reporting purposes, only the holdings of each Fund will be considered. Rule 144A securities have been identified on the “Schedules of investments.”
12. Contractual Obligations
Each Fund enters into contracts in the normal course of business that contain a variety of indemnifications. Each Fund’s maximum exposure under these arrangements is unknown. However, the Funds have not had prior claims or losses pursuant to these contracts. Management has reviewed each Fund’s existing contracts and expects the risk of loss to be remote.
13. Recent Accounting Pronouncements
On Oct. 13, 2016, the Securities and Exchange Commission amended existing rules intended to modernize reporting and disclosure of information. These amendments relate to Regulation S-X which sets forth the form and content of financial statements. At this time, management is evaluating the implications of adopting these amendments and their impact on the financial statements and accompanying notes.
14. Subsequent Events
Management has determined that no material events or transactions occurred subsequent to Nov. 30, 2016 that would require recognition or disclosure in the Funds’ financial statements.
102
Table of Contents
Registered Public Accounting Firm
To the Board of Trustees of Delaware Group® Global & International Funds
and Shareholders of the Funds, as defined:
In our opinion, the accompanying statements of assets and liabilities, including the schedules of investments, and the related statements of operations and of changes in net assets and the financial highlights present fairly, in all material respects, the financial position of Delaware Emerging Markets Fund, Delaware Global Value Fund and Delaware International Value Equity Fund (three of the series constituting Delaware Group® Global & International Funds, hereafter collectively referred to as the “Funds”) as of November 30, 2016, the results of each of their operations for the year then ended, the changes in each of their net assets for each of the two years in the period then ended and the financial highlights for each of the periods indicated, in conformity with accounting principles generally accepted in the United States of America. These financial statements and financial highlights (hereafter referred to as “financial statements”) are the responsibility of the Funds’ management. Our responsibility is to express an opinion on these financial statements based on our audits. We conducted our audits of these financial statements in accordance with the standards of the Public Company Accounting Oversight Board (United States). Those standards require that we plan and perform the audit to obtain reasonable assurance about whether the financial statements are free of material misstatement. An audit includes examining, on a test basis, evidence supporting the amounts and disclosures in the financial statements, assessing the accounting principles used and significant estimates made by management, and evaluating the overall financial statement presentation. We believe that our audits, which included confirmation of securities as of November 30, 2016 by correspondence with the custodian and brokers, provide a reasonable basis for our opinion.
PricewaterhouseCoopers LLP
Philadelphia, Pennsylvania
January 23, 2017
103
Table of Contents
Other Fund information (Unaudited)
Delaware International Funds
Tax Information (Unaudited)
The information set forth below is for each Fund’s fiscal year as required by federal income tax laws. Shareholders, however, must report distributions on a calendar year basis for income tax purposes, which may include distributions for portions of two fiscal years of a fund. Accordingly, the information needed by shareholders for income tax purposes will be sent to them in January of each year. Please consult your tax advisor for proper treatment of this information.
All disclosures are based on financial information available as of the date of this annual report and, accordingly is subject to change. For any and all items requiring reporting, it is the intention of each Fund to report the maximum amount permitted under the Internal Revenue Code and the regulations thereunder.
For the fiscal year ended Nov. 30, 2016, each Fund reports distributions paid during the year as follows:
| (A) | |||||||||||||||
| Ordinary | |||||||||||||||
| Income | Total | (B) | |||||||||||||
| Distributions* | Distributions | Qualifying | |||||||||||||
| (Tax Basis) | (Tax Basis) | Dividends1 | |||||||||||||
| Delaware Emerging Markets Fund | 100.00 | % | 100.00 | % | — | ||||||||||
| Delaware Global Value Fund | 100.00 | % | 100.00 | % | 99.78 | % | |||||||||
| Delaware International Value Equity Fund | 100.00 | % | 100.00 | % | — | ||||||||||
(A) is based on a percentage of each Fund’s total distributions.
(B) is based on a percentage of each Fund’s ordinary income distributions.
| 1 | Qualifying dividends represent dividends which qualify for the corporate dividends received deduction. |
| * | For the fiscal year ended Nov. 30, 2016, certain dividends paid by each Fund may be subject to a maximum tax rate of 20%. The percentage of dividends paid by each Fund from ordinary income reported as dividend income is listed below. Complete information will be computed and reported in conjunction with your 2016 Form 1099-DIV. |
| Delaware | ||||
| Delaware Emerging | Delaware Global | International | ||
| Markets Fund | Value Fund | Value Equity Fund | ||
| 100.00% | 100.00% | 100.00% |
104
Table of Contents
Each Fund intends to pass through foreign tax credits in the maximum amount as follows:
| Delaware | ||||
| Delaware Emerging | Delaware Global | International | ||
| Markets Fund | Value Fund | Value Equity Fund | ||
| $1,811,717 | $— | $447,775 |
The gross foreign source income earned during the fiscal year 2016 by each Fund was as follows:
| Delaware | ||||
| Delaware Emerging | Delaware Global | International | ||
| Markets Fund | Value Fund | Value Equity Fund | ||
| $35,601,514 | $— | $7,873,423 |
Board consideration of Delaware Emerging Markets Fund, Delaware Global Value Fund, and Delaware International Value Equity Fund investment advisory agreements
At a meeting held on Aug. 16–18, 2016 (the “Annual Meeting”), the Board approved the renewal of the Investment Advisory Agreements for Delaware Emerging Markets Fund, Delaware Global Value Fund, and Delaware International Value Equity Fund (each, a “Fund” and together, the “Funds”). In making its decision, the Board considered information furnished at regular quarterly Board meetings, including reports detailing Fund performance, investment strategies, and expenses, as well as information prepared specifically in connection with the renewal of the investment advisory and sub-advisory contracts. Information furnished specifically in connection with the renewal of the Investment Management Agreement with DMC included materials provided by DMC and its affiliates (“Delaware Investments”) concerning, among other things, the nature, extent, and quality of services provided to the Funds; the costs of such services to the Funds; economies of scale; and the investment manager’s financial condition and profitability. In addition, in connection with the Annual Meeting, reports were provided to the Trustees in May 2016 and included reports provided by Broadridge Financial Solutions (“Broadridge”). The Broadridge reports compared each Fund’s investment performance and expenses with those of other comparable mutual funds. The Independent Trustees reviewed and discussed the Broadridge reports with independent legal counsel to the Independent Trustees. In addition to the information noted above, the Board also requested and received information regarding DMC’s policy with respect to advisory fee levels and its breakpoint philosophy; the structure of portfolio manager compensation; comparative client fee information; and any constraints or limitations on the availability of securities for certain investment styles, which had in the past year inhibited, or which were likely in the future to inhibit, the investment manager’s ability to invest fully in accordance with Fund policies.
In considering information relating to the approval of each Fund’s advisory agreement, the Independent Trustees received assistance and advice from and met separately with independent legal counsel to the Independent Trustees. Although the Board gave attention to all information furnished, the following discussion identifies, under separate headings, the primary factors taken into account by the Board during its contract renewal considerations.
Nature, extent, and quality of service. The Board considered the services provided by DMC to the Funds and their shareholders. In reviewing the nature, extent, and quality of services, the Board considered reports furnished to it throughout the year, which covered matters such as the relative
105
Table of Contents
Other Fund information (Unaudited)
Delaware International Funds
performance of the Funds; compliance of portfolio managers with the investment policies, strategies, and restrictions for the Funds; compliance by DMC and Delaware Distributors, L.P. (together, “Management”) personnel with the Code of Ethics adopted throughout the Delaware Investments® Family of Funds complex; and adherence to fair value pricing procedures as established by the Board. The Board was pleased with the current staffing of the Funds’ investment advisor and the emphasis placed on research in the investment process. The Board recognized DMC’s receipt of several industry distinctions during the past several years. The Board gave favorable consideration to DMC’s efforts to control expenditures while maintaining service levels committed to Fund matters. The Board also noted the benefits provided to Fund shareholders through each shareholder’s ability to exchange an investment in one Delaware Investments fund for the same class of shares in another Delaware Investments fund without a sales charge, to reinvest Fund dividends into additional shares of the Fund or into additional shares of other Delaware Investments funds, and the privilege to combine holdings in other Delaware Investments funds to obtain a reduced sales charge. The Board was satisfied with the nature, extent, and quality of the overall services provided by DMC.
Investment performance. The Board placed significant emphasis on the investment performance of the Funds in view of the importance of investment performance to shareholders. Although the Board gave appropriate consideration to performance reports and discussions with portfolio managers at Investment Committee meetings throughout the year, the Board gave particular weight to the Broadridge reports furnished for the Annual Meeting. The Broadridge reports prepared for each Fund showed the investment performance of its Class A shares in comparison to a group of similar funds as selected by Broadridge (the “Performance Universe”). A fund with the best performance ranked first, and a fund with the poorest performance ranked last. The highest/best performing 25% of funds in the Performance Universe make up the first quartile; the next 25%, the second quartile; the next 25%, the third quartile; and the poorest/worst performing 25% of funds in the Performance Universe make up the fourth quartile. Comparative annualized performance for each Fund was shown for the past 1-, 3-, 5-, and 10-year periods, to the extent applicable, ended Jan. 31, 2016. The Board’s objective is that each Fund’s performance for the periods considered be at or above the median of its Performance Universe.
Delaware Emerging Markets Fund – The Performance Universe for the Fund consisted of the Fund and all retail and institutional emerging markets funds as selected by Broadridge. The Broadridge report comparison showed that the Fund’s total return for the 1-year period was in the third quartile of its Performance Universe. The report further showed that the Fund’s total return for the 3-, 5-, and 10-year periods was in the second quartile of its Performance Universe. The Board was satisfied with performance.
Delaware Global Value Fund – The Performance Universe for the Fund consisted of the Fund and all retail and institutional global multi-cap value funds as selected by Broadridge. The Broadridge report comparison showed that the Fund’s total return for the 1-year period was in the second quartile of its Performance Universe. The report further showed that the Fund’s total return for the 3-, 5-, and 10-year periods was in the third quartile of its Performance Universe. The Board observed that the Fund’s intermediate- and long-term performance was not in line with the Board’s objective. In evaluating the Fund’s performance, the Board considered the Fund’s short-term performance results, which were strong, and consequently, the Board was satisfied with performance.
106
Table of Contents
Delaware International Value Equity Fund – The Performance Universe for the Fund consisted of the Fund and all retail and institutional international multi-cap value funds as selected by Broadridge. The Broadridge report comparison showed that the Fund’s total return for the 1-year period was in the first quartile of its Performance Universe. The report further showed that the Fund’s total return for the 3-year period was in the second quartile of its Performance Universe and the Fund’s total return for the 5- and 10-year periods was in the third quartile of its Performance Universe. The Board was satisfied with performance.
Comparative expenses. The Board considered expense comparison data for the Delaware Investments® Family of Funds. Management provided the Board with information on pricing levels and fee structures for each Fund as of its most recently completed fiscal year. The Board also focused on the comparative analysis of effective management fees and total expense ratios of each Fund versus effective management fees and expense ratios of a group of similar funds as selected by Broadridge (the “Expense Group”). In reviewing comparative costs, each Fund’s contractual management fee and the actual management fee incurred by the Fund were compared with the contractual management fees (assuming all funds in the Expense Group were similar in size to the Fund) and actual management fees (as reported by each fund) within the Expense Group, taking into account any applicable breakpoints and fee waivers. Each Fund’s total expenses were also compared with those of its Expense Group. The Broadridge total expenses, for comparative consistency, were shown by Broadridge for Class A shares and comparative total expenses including 12b-1 and non-12b-1 service fees. The Board’s objective is to limit each Fund’s total expense ratio to be competitive with that of the Expense Group.
Delaware Emerging Markets Fund – The expense comparisons for the Fund showed that its actual management fee and total expenses were in the quartile with the second highest expenses of its Expense Group. The Board noted that the Fund’s management fee and total expenses were not in line with the Board’s objective. In evaluating total expenses, the Board considered fee waivers in place through May 2, 2017 and various initiatives implemented by Management, such as the negotiation of lower fees for fund accounting services, which had created an opportunity for a further reduction in expenses. The Board was satisfied with Management’s efforts to improve the Fund’s total expense ratio and to bring it in line with the Board’s objective.
Global Value Fund – The expense comparisons for the Fund showed that its actual management fee was in the quartile with the lowest expenses of its Expense Group and its total expenses were in the quartile with the second highest expenses of its Expense Group. The Board gave favorable consideration to the Fund’s management fee, but noted that the Fund’s total expenses were not in line with the Board’s objective. In evaluating total expenses, the Board considered fee waivers in place through May 2, 2017 and various initiatives implemented by Management, such as the outsourcing the negotiation of lower fees for fund accounting services, which had created an opportunity for a further reduction in expenses. The Board was satisfied with Management’s efforts to improve the Fund’s total expense ratio and to bring it in line with the Board’s objective.
Delaware International Value Equity Fund – The expense comparisons for the Fund showed that its actual management fee was in the quartile with the highest expenses of its Expense Group and its total expenses were in the quartile with the second lowest expenses of its Expense Group. The Board was
107
Table of Contents
Other Fund information (Unaudited)
Delaware International Funds
satisfied with the total expenses of the Fund in comparison to those of both Expense Groups as shown in the Broadridge report.
Management profitability. The Board considered the level of profits realized by DMC in connection with the operation of the Funds. In this respect, the Board reviewed the Investment Management Profitability Analysis that addressed the overall profitability of DMC’s business in providing management and other services to each of the individual funds and the Delaware Investments® Family of Funds as a whole. Specific attention was given to the methodology followed in allocating costs for the purpose of determining profitability. Management stated that the level of profits of DMC, to a certain extent, reflects recent operational cost savings and efficiencies initiated by DMC. The Board considered DMC’s efforts to improve services provided to fund shareholders and to meet additional regulatory and compliance requirements resulting from recent industry-wide Securities and Exchange Commission initiatives. The Board also considered the extent to which DMC might derive ancillary benefits from fund operations, including the potential for procuring additional business as a result of the prestige and visibility associated with its role as service provider to the Delaware Investments Family of Funds and the benefits from allocation of fund brokerage to improve trading efficiencies. The Board found that the management fees were reasonable in light of the services rendered and the level of profitability of DMC.
Economies of scale. The Trustees considered whether economies of scale are realized by DMC as each Fund’s assets increase and the extent to which any economies of scale are reflected in the level of management fees charged. The Trustees reviewed the standardized advisory fee pricing and structure, approved by the Board and shareholders, which includes breakpoints, and which applies to most funds in the Delaware Investments Family of Funds complex. Breakpoints in the advisory fee occur when the advisory fee rate is reduced on assets in excess of specified levels. Breakpoints result in a lower advisory fee than would otherwise be the case in the absence of breakpoints, when the asset levels specified in the breakpoints are exceeded. The Board noted that the fee under each Fund’s management contract fell within the standardized fee pricing structure. The Board also noted that, as of May 31, 2016, Delaware Emerging Markets Fund’s assets exceeded the final breakpoint level. The Board believed that, given the extent to which economies of scale might be realized by the advisor and its affiliates, the schedule of fees under the Investment Management Agreement provides a sharing of benefits with the Fund and its shareholders. Although Delaware Global Value Fund and Delaware International Value Equity Fund have not reached a size at which they can take advantage of any breakpoints in the applicable fee schedule, the Board recognized that each Fund’s fee was structured so that if the Fund grows, economies of scale may be shared.
108
Table of Contents
This page intentionally left blank.
Table of Contents
Board of trustees / directors and officers addendum
Delaware Investments® Family of Funds
A mutual fund is governed by a Board of Trustees/Directors (“Trustees”), which has oversight responsibility for the management of a fund’s business affairs. Trustees establish procedures and oversee and review the performance of the investment manager, the distributor, and others who perform services for the fund. The independent fund trustees, in particular, are advocates
| Name, Address, | Position(s) | Length of | ||||
| and Birth Date | Held with Fund(s) | Time Served | ||||
Interested Trustee
| ||||||
Shawn K. Lytle1, 3 | President, | Trustee since | ||||
2005 Market Street | Chief Executive Officer, | September 2015 | ||||
Philadelphia, PA 19103 | and Trustee | |||||
February 1970 | President and | |||||
| Chief Executive Officer | ||||||
| since August 2015 | ||||||
Independent Trustees
| ||||||
Thomas L. Bennett | Chairman and Trustee | Trustee since | ||||
2005 Market Street | March 2005 | |||||
Philadelphia, PA 19103 | ||||||
October 1947 | Chairman since | |||||
March 2015
| ||||||
Ann D. Borowiec | Trustee | Since March 2015 | ||||
2005 Market Street | ||||||
Philadelphia, PA 19103 | ||||||
November 1958 | ||||||
Joseph W. Chow | Trustee | Since January 2013 | ||||
2005 Market Street | ||||||
Philadelphia, PA 19103 | ||||||
January 1953 | ||||||
| 1 | Shawn K. Lytle is considered to be an “Interested Trustee” because he is an executive officer of the Fund’s(s’) investment advisor. |
110
Table of Contents
for shareholder interests. Each trustee has served in that capacity since he or she was elected to or appointed to the Board of Trustees, and will continue to serve until his or her retirement or the election of a new trustee in his or her place. The following is a list of the Trustees and Officers with certain background and related information.
| Number of Portfolios in | ||||
| Principal Occupation(s) | Fund Complex Overseen | Other Directorships | ||
| During the Past Five Years | by Trustee or Officer | Held by Trustee or Officer | ||
| ||||
Shawn K. Lytle has served as | 62 | Trustee — UBS | ||
President of | Relationship Funds, | |||
Delaware Investments2 | SMA Relationship | |||
since June 2015 and was the | Trust, and UBS Funds | |||
Regional Head of Americas for | (May 2010–April 2015) | |||
UBS Global Asset | ||||
Management from | ||||
2010 through 2015. | ||||
| ||||
Private Investor | 62 | Director — | ||
(March 2004–Present) | Bryn Mawr Bank Corp. (BMTC) | |||
| (2007–2011) | ||||
Chief Executive Officer | 62 | Director — | ||
Private Wealth Management | Banco Santander International | |||
(2011–2013) and | Since October 2016 | |||
Market Manager, | ||||
New Jersey Private | Director — | |||
Bank (2005–2011) — | Santander Bank, N.A. | |||
J.P. Morgan Chase & Co.
| Since December 2016 | |||
Executive Vice President | 62 | Director and Audit Committee | ||
(Emerging Economies | Member — Hercules | |||
Strategies, Risks, and | Technology Growth | |||
Corporate Administration) | Capital, Inc. | |||
State Street Corporation | (2004–2014) | |||
(July 2004–March 2011)
|
| 2 | Delaware Investments is the marketing name for Delaware Management Holdings, Inc. and its subsidiaries, including the Fund’s(s’) investment advisor, principal underwriter, and its transfer agent. |
111
Table of Contents
Board of trustees / directors and officers addendum
Delaware Investments® Family of Funds
| Name, Address, | Position(s) | Length of | ||
| and Birth Date | Held with Fund(s) | Time Served | ||
Independent Trustees (continued)
| ||||
John A. Fry | Trustee | Since January 2001 | ||
2005 Market Street | ||||
Philadelphia, PA 19103 | ||||
May 1960 | ||||
Lucinda S. Landreth | Trustee | Since March 2005 | ||
2005 Market Street | ||||
Philadelphia, PA 19103 | ||||
June 1947
| ||||
Frances A. Sevilla-Sacasa | Trustee | Since September 2011 | ||
2005 Market Street | ||||
Philadelphia, PA 19103 | ||||
January 1956 | ||||
112
Table of Contents
| Number of Portfolios in | ||||
| Principal Occupation(s) | Fund Complex Overseen | Other Directorships | ||
| During the Past Five Years | by Trustee or Officer | Held by Trustee or Officer | ||
| ||||
President — | 62 | Director, Audit | ||
Drexel University | and Governance Committee | |||
(August 2010–Present) | Member — Community | |||
| Health Systems | ||||
President — | ||||
Franklin & Marshall College | Director — Drexel | |||
(July 2002–July 2010) | Morgan & Co. | |||
| Director, Audit Committee | ||||
| Member — vTv | ||||
| Therapeutics LLC | ||||
Private Investor | 62 | None | ||
(2004–Present)
| ||||
Chief Executive Officer — | 62 | Trust Manager and | ||
Banco Itaú | Audit Committee | |||
International | Member — Camden | |||
(April 2012–December 2016) | Property Trust | |||
Executive Advisor to Dean | ||||
(August 2011–March 2012) and Interim Dean | ||||
(January 2011–July 2011) — | ||||
University of Miami School of | ||||
Business Administration | ||||
President — U.S. Trust, | ||||
Bank of America Private | ||||
Wealth Management | ||||
(Private Banking) | ||||
(July 2007–December 2008)
| ||||
113
Table of Contents
Board of trustees / directors and officers addendum
Delaware Investments® Family of Funds
| Name, Address, | Position(s) | Length of | ||
| and Birth Date | Held with Fund(s) | Time Served | ||
Independent Trustees (continued)
| ||||
Thomas K. Whitford | Trustee | Since January 2013 | ||
2005 Market Street | ||||
Philadelphia, PA 19103 | ||||
March 1956 | ||||
Janet L. Yeomans | Trustee | Since April 1999 | ||
2005 Market Street | ||||
Philadelphia, PA 19103 | ||||
July 1948 | ||||
Officers
| ||||
| David F. Connor | Senior Vice President, | Senior Vice President | ||
| 2005 Market Street | General Counsel, | since May 2013; | ||
| Philadelphia, PA 19103 | and Secretary | General Counsel | ||
| December 1963 | since May 2015; | |||
| Secretary since | ||||
October 2005
| ||||
| Daniel V. Geatens | Vice President | Treasurer since October 2007 | ||
| 2005 Market Street | and Treasurer | |||
| Philadelphia, PA 19103 | ||||
| October 1972 | ||||
| Richard Salus | Senior Vice President | Chief Financial Officer | ||
| 2005 Market Street | and Chief Financial Officer | since November 2006 | ||
| Philadelphia, PA 19103 | ||||
| October 1963 | ||||
The Statement of Additional Information for the Fund(s) includes additional information about the Trustees and Officers and is available, without charge, upon request by calling 800 523-1918.
114
Table of Contents
| Principal Occupation(s) | Number of Portfolios in Fund Complex Overseen | Other Directorships | ||
| During the Past Five Years | by Trustee or Officer | Held by Trustee or Officer | ||
| ||||
| Vice Chairman | 62 | Director — HSBC Finance | ||
| (2010–April 2013) and | Corporation and HSBC | |||
| Chief Administrative | North America Holdings Inc. | |||
| Officer (2008–2010) — | ||||
| PNC Financial | Director — | |||
Services Group
| HSBC Bank
| |||
| Vice President and Treasurer | 62 | Director, Personnel and | ||
| (January 2006–July 2012), | Compensation Committee | |||
| Vice President — | Chair, Audit Committee | |||
| Mergers & Acquisitions | Member and Governance | |||
| (January 2003–January 2006), | Committee Member — | |||
| and Vice President | Okabena Company | |||
| and Treasurer | ||||
| (July 1995–January 2003) — | ||||
| 3M Company | ||||
| ||||
| David F. Connor has served | 62 | None3 | ||
in various capacities at different times at | ||||
| Delaware Investments. | ||||
| Daniel V. Geatens has served | 62 | None3 | ||
in various capacities at different times at | ||||
| Delaware Investments. | ||||
| Richard Salus has served | 62 | None3 | ||
in various capacities at different times at | ||||
| Delaware Investments. | ||||
| 3 | Shawn K. Lytle, David F. Connor, Daniel V. Geatens, and Richard Salus serve in similar capacities for the six portfolios of the Optimum Fund Trust, which have the same investment advisor, principal underwriter, and transfer agent as the registrant. |
115
Table of Contents
Board of trustees
| ||||||
| Shawn K. Lytle | Ann D. Borowiec | John A. Fry | Frances A. | |||
| President and | Former Chief Executive | President | Sevilla-Sacasa | |||
| Chief Executive Officer | Officer | Drexel University | Chief Executive Officer | |||
| Delaware Investments® | Private Wealth Management | Philadelphia, PA | Banco Itaú | |||
| Family of Funds | J.P. Morgan Chase & Co. | International | ||||
| Philadelphia, PA | New York, NY | Lucinda S. Landreth | Miami, FL | |||
| Former Chief Investment | ||||||
| Thomas L. Bennett | Joseph W. Chow | Officer | Thomas K. Whitford | |||
| Chairman of the Board | Former Executive Vice | Assurant, Inc. | Former Vice Chairman | |||
| Delaware Investments | President | New York, NY | PNC Financial Services Group | |||
| Family of Funds | State Street Corporation | Pittsburgh, PA | ||||
| Private Investor | Boston, MA | |||||
| Rosemont, PA | Janet L. Yeomans | |||||
| Former Vice President and | ||||||
| Treasurer | ||||||
| 3M Company | ||||||
| St. Paul, MN | ||||||
| Affiliated officers | ||||||
| David F. Connor | Daniel V. Geatens | Richard Salus | ||||
| Senior Vice President, | Vice President and | Senior Vice President and | ||||
| General Counsel, | Treasurer | Chief Financial Officer | ||||
| and Secretary | Delaware Investments | Delaware Investments | ||||
| Delaware Investments | Family of Funds | Family of Funds | ||||
| Family of Funds | Philadelphia, PA | Philadelphia, PA | ||||
| Philadelphia, PA | ||||||
This annual report is for the information of Delaware Emerging Markets Fund, Delaware Global Value Fund, and Delaware International Value Equity Fund shareholders, but it may be used with prospective investors when preceded or accompanied by the Delaware Investments Fund fact sheet for the most recently completed calendar quarter. These documents are available at delawareinvestments.com/literature.
Delaware Investments is the marketing name of Delaware Management Holdings, Inc. and its subsidiaries.
Each Fund files its complete schedule of portfolio holdings with the Securities and Exchange Commission (SEC) for the first and third quarters of each fiscal year on Form N-Q. Each Fund’s Forms N-Q, as well as a description of the policies and procedures that the Funds use to determine how to vote proxies (if any) relating to portfolio securities are available without charge (i) upon request, by calling 800 523-1918; and (ii) on the SEC’s website at sec.gov. In addition, a description of the policies and procedures that the Funds use to determine how to vote proxies (if any) relating to portfolio securities and the Schedules of Investments included in the Funds’ most recent Forms N-Q are available without charge on the Funds’ website at delawareinvestments.com/literature. Each Fund’s Forms N-Q may be reviewed and copied at the SEC’s Public Reference Room in Washington, D.C.; information on the operation of the Public Reference Room may be obtained by calling 800 SEC-0330.
Information (if any) regarding how the Funds voted proxies relating to portfolio securities during the most recently disclosed 12-month period ended June 30 is available without charge (i) through the Funds’ website at delawareinvestments.com/proxy; and (ii) on the SEC’s website at sec.gov.
116
Table of Contents

Annual report
Global / international equity mutual fund
Delaware Asia Select Fund
(formerly, Delaware Macquarie Asia Select Fund)
November 30, 2016
Carefully consider the Fund’s investment objectives, risk factors, charges, and expenses before investing. This and other information can be found in the Fund’s prospectus and its summary prospectus, which may be obtained by visiting delawareinvestments.com/literature or calling 800 523-1918. Investors should read the prospectus and the summary prospectus carefully before investing.
You can obtain shareholder reports and prospectuses online instead of in the mail.
Visit delawareinvestments.com/edelivery.
Table of Contents
Experience Delaware Investments
Delaware Investments is committed to the pursuit of consistently superior asset management and unparalleled client service. We believe in our investment processes, which seek to deliver consistent results, and in convenient services that help add value for our clients.
If you are interested in learning more about creating an investment plan, contact your financial advisor.
You can learn more about Delaware Investments or obtain a prospectus for Delaware Asia Select Fund at delawareinvestments.com/literature.
Manage your investments online
| ● | 24-hour access to your account information |
| ● | Obtain share prices |
| ● | Check your account balance and recent transactions |
| ● | Request statements or literature |
| ● | Make purchases and redemptions |
Delaware Management Holdings, Inc. and its subsidiaries (collectively known by the marketing name of Delaware Investments) are wholly owned subsidiaries of Macquarie Group Limited, a global provider of banking, financial, advisory, investment, and funds management services.
Neither Delaware Investments nor its affiliates referred to in this document are authorized deposit-taking institutions for the purpose of the Banking Act 1959 (Commonwealth of Australia). The obligations of these entities do not represent deposits or other liabilities of Macquarie Bank Limited (MBL), a subsidiary of Macquarie Group Limited and an affiliate of Delaware Investments. MBL does not guarantee or otherwise provide assurance in respect of the obligations of these entities, unless noted otherwise. The Fund is governed by U.S. laws and regulations.
| 1 | ||||
| 4 | ||||
| 8 | ||||
| 10 | ||||
| 11 | ||||
| 16 | ||||
| 18 | ||||
| 19 | ||||
| 20 | ||||
| 22 | ||||
| 35 | ||||
| 36 | ||||
| 40 | ||||
| 46 |
Unless otherwise noted, views expressed herein are current as of Nov. 30, 2016, and subject to change for events occurring after such date.
The Fund is not FDIC insured and is not guaranteed. It is possible to lose the principal amount invested. Mutual fund advisory services provided by Delaware Management Company, a series of Delaware Management Business Trust, which is a registered investment advisor. Delaware Investments, a member of Macquarie Group, refers to Delaware Management Holdings, Inc. and its subsidiaries, including the Fund’s distributor, Delaware Distributors, L.P. Macquarie Group refers to Macquarie Group Limited and its subsidiaries and affiliates worldwide.
© 2017 Delaware Management Holdings, Inc.
All third-party marks cited are the property of their respective owners.
Table of Contents
| Portfolio management review | ||
| Delaware Asia Select Fund | December 6, 2016 |
| Performance preview (for the period ended November 30, 2016) | ||||
Delaware Asia Select Fund (Institutional Class shares) | -4.27%* | |||
Delaware Asia Select Fund (Class A shares) | -4.51%* | |||
MSCI All Country Asia ex Japan Index (gross) | +8.71%* | |||
MSCI All Country Asia ex Japan Index (net) | +8.39%* |
Past performance does not guarantee future results.
For complete, annualized performance for Delaware Asia Select Fund, please see the table on page 4.
Institutional Class shares are available without sales or asset-based distribution charges only to certain eligible accounts.
The performance of Class A shares excludes the applicable sales charge. Both Institutional Class shares and Class A shares reflect the reinvestment of all distributions.
Please see page 6 for a description of the index. Index performance returns do not reflect any management fees, transaction costs, or expenses. Indices are unmanaged and one cannot invest directly in an index.
*Fund and benchmark returns are as of the Fund’s inception date (Dec. 21, 2015). Returns for less than one year are not annualized.
Since the inception of Delaware Asia Select Fund on Dec. 21, 2015, there has been considerable volatility in Asian equity markets. January 2016 saw the weakest start to a year for global markets since 2009. The driving forces behind this global risk-off mood were fears that the U.S. Federal Reserve would tighten interest rates and concerns over Chinese policy making. Consequently, this volatility was acutely felt in the Asian region.
China’s currency policies and the resulting renminbi (RMB) depreciation, combined with changes to other arms of Chinese policy, precipitated a sudden and unrestrained market reaction in January. The market sold off in a number of sectors, in particular pharmaceuticals, insurance, and diversified financials.
Asian markets have staged a recovery since mid-February as a result of fading expectations of U.S. monetary tightening and an oil-driven commodity rebound. Greater China markets (China, Hong Kong, and Taiwan) led this recovery as Chinese economic data continued to produce positive surprises. There were increased investment flows through the Shanghai-Hong Kong stock connection, and sentiment continued to improve with the newly opened Shenzhen connection; both connections helped give markets in China and Hong Kong an added boost.
The Fund retains its quality bias favoring companies that we think are conservatively capitalized with a long-term track record of profitable growth. Our key tilt is towards companies addressing consumer and domestic demand. We believe this positioning has the potential to perform well based on our conviction in the region’s long-term structural growth characteristics.
| 1 |
Table of Contents
| Portfolio management review | ||
| Delaware Asia Select Fund |
Outside Greater China, Thailand saw the strongest performance. Earnings had been downgraded for the past three years, and growing evidence of an earnings rebound resulted in positive investment flows into the Thai market.
The market rally was generally dominated by cyclical sectors and favored companies with large market capitalizations. In the Asia ex Japan region, large-cap stocks had the strongest performance in 2016, outperforming both mid-cap and small-cap indexes.
These market conditions affected the Fund’s performance. While we retained our investment approach, process, and focus on quality, it was necessary to make certain changes within the portfolio as a reaction to market conditions.
Although Chinese life insurance companies experienced strong growth in premiums, we identified risks within the policies. Essentially, the key issue was that holders of policies (liabilities) had been guaranteed returns in long-term products such as savings and annuities. On the asset side, however, the investment returns the Chinese insurers had been earning were below that guaranteed rate. The risk of that negative interest spread significantly reduced the value of the new business (policies) being written. Further, we think that put a portion of their capital at risk. This balance sheet risk — that is, a mismatch between the higher rates insurance firms were required to pay on their liabilities and the lower rates likely to be received from their assets — was overlaid with the expectation that, in the future, Chinese insurers may need to digest local government debt and even municipal bonds — that is to say, a potential debt-for-equity swap scenario whereby the insurance firms could be required to take on these debt securities, which is expected to be detrimental to the quality of their assets. While this has not yet occurred, we were still concerned that the rates earned on these investments were lower than those guaranteed to policy holders. We reduced the Fund’s position in Chinese insurers after significant analysis and meetings with all the
major companies as well as the Chinese insurance regulator.
It should also be noted that China was not the only country to experience volatility at the start of the calendar year. Korea Kolmar, for example, sold off during a market rotation out of Korean consumer positions. We maintained our conviction in the company, and the stock progressed from being a significant detractor in the first quarter of 2016 to being the largest contributor to outperformance in the third quarter.
Fund performance
From its inception on Dec. 21, 2015 to the fiscal year ended Nov. 30, 2016, Delaware Asia Select Fund’s Institutional Class shares returned -4.27%. The Fund’s Class A shares returned -4.51% at net asset value and -10.01% at maximum offer price (both figures reflect all distributions reinvested). During the same period, the Fund’s benchmark, the MSCI All Country Asia ex Japan Index (net, U.S. dollars) returned +8.39%. For complete annualized performance for Delaware Asia Select Fund, please see the table on page 4.
A number of factors worked against the Fund over the course of the fiscal period. A broad-based risk rally combined with an increased market allocation to passive investments resulted in increased demand for large benchmark constituents operating in cyclical industries. The Fund retained a bias toward high-quality, mid-cap companies; these market conditions primarily led to the Fund’s underperformance versus the benchmark.
Positions in Chinese companies detracted from performance during the period. In the first three months of 2016, sentiment soured toward Chinese insurance firms as a result of the liquidity issues experienced within local governments. Both China Taiping Insurance Group and China Pacific Insurance suffered, and the Fund exited its
| 2 |
Table of Contents
positions in these companies as a result of the changed environment, and for the reasons discussed earlier.
Notwithstanding the volatility experienced during the first three months of 2016, Nexteer Automotive Group reported a strong first half 2016 result that beat consensus estimates by 24%. This was supported by what we viewed as solid top-line growth across all geographies and strong margin expansion. Nexteer Automotive Group made a solid contribution to the Fund’s overall return and was a key highlight for the fiscal period.
The Fund’s underweight allocation to China during the cyclical rally, which characterized much of 2016, significantly detracted from performance. Enduring concerns surrounding the health of Chinese companies and their ability to fund ongoing debt obligations were the key reason for the Fund’s underweight to China. Korean positions also detracted from performance with turbulence in government politics affecting a number of the Fund’s key positions. Korea Kolmar and Hyundai Department Store performed poorly after media reports suggested China would impose quotas on its citizens in an effort to reduce travel to Korea. Chinese tourists comprise a large customer base for these and other consumer-centric companies in Korea. We believe that quotas on Chinese tourists will be difficult to implement, however, and that they will continue to travel.
Holdings in Hong Kong outperformed and contributed to the Fund’s performance. This was led by Macau exposures such as Galaxy Entertainment Group, which benefited as the market upgraded expectations for the Macau gaming sector. The sector experienced a significant turnaround following a period of 26 consecutive months of gambling revenue declines that resulted from China’s anti-graft campaign.
The Thai market experienced strong gains, and a number of the Fund’s positions outperformed. Chief among these was Charoen Pokphand Foods. The company reported earnings that strongly beat the market’s expectations. Charoen Pokphand Foods experienced a strong improvement in gross profit margins, largely due to a recovery in its shrimp and livestock businesses. Digital Telecommunications Infrastructure Fund produced a strong full-year 2015 result, and positive sentiment continued in 2016 as the market viewed the firm to be a key beneficiary of additional leases made available for telecommunications towers. Airports of Thailand continued to benefit from Thailand’s position as a key tourist destination for Chinese tourists, generating revenues from both air traffic and duty free shopping. The Fund retains its quality bias favoring companies that we think are conservatively capitalized with a long-term track record of profitable growth. Our key tilt is towards companies addressing consumer and domestic demand. We believe this positioning has the potential to perform well based on our conviction in the region’s long-term structural growth characteristics.
| 3 |
Table of Contents
| Performance summary | ||
| Delaware Asia Select Fund | November 30, 2016 |
The performance data quoted represent past performance; past performance does not guarantee future results. Investment return and principal value will fluctuate so your shares, when redeemed, may be worth more or less than their original cost. Please obtain the performance data current for the most recent month end by calling 800 523-1918 or visiting our website at delawareinvestments.com/performance. Current performance may be lower or higher than the performance data quoted.
| Fund and benchmark performance1,2 | Total returns through November 30, 2016 | |||
| Lifetime | ||||
Class A (Est. Dec. 21, 2015) | ||||
Excluding sales charge | -4.51 | % | ||
Including sales charge | -10.01 | % | ||
Class C (Est. Dec. 21, 2015) | ||||
Excluding sales charge | -5.10 | % | ||
Including sales charge | -6.05 | % | ||
Institutional Class (Est. Dec. 21, 2015) | ||||
Excluding sales charge | -4.27 | % | ||
Including sales charge | -4.27 | % | ||
MSCI All Country Asia ex Japan Index (gross) | +8.71 | %* | ||
MSCI All Country Asia ex Japan Index (net) | +8.39 | %* | ||
* The benchmark lifetime return is for Class A share comparison only and is calculated using the last business day in the month of the Fund’s Class A inception date.
1 Returns reflect the reinvestment of all distributions and are presented both with and without the applicable sales charges described below. Returns do not reflect the deduction of taxes the shareholder would pay on Fund distributions or redemptions of Fund shares.
Expense limitations were in effect for certain classes during some or all of the periods shown in the “Fund and benchmark performance” table. Expenses for each class are listed on the “Fund expense ratios” table on page 5. Performance would have been lower had expense limitations not been in effect.
Institutional Class shares are available without sales or asset-based distribution charges only to certain eligible accounts.
Class A shares are sold with a maximum front-end sales charge of 5.75%, and have an annual distribution and service fee of 0.25% of average daily net assets. Performance for Class A shares, excluding sales charges, assumes that no front-end sales charge applied.
Class C shares are sold with a contingent deferred sales charge of 1.00% if redeemed during the first 12 months. They are also subject to an annual distribution and service fee of 1.00% of average daily net assets. Performance for Class C shares, excluding sales charges, assumes either that contingent deferred sales charges did not apply or that the investment was not redeemed.
International investments entail risks not ordinarily associated with U.S. investments including fluctuation in currency values, differences in accounting principles, or economic or political instability in other nations.
| 4 |
Table of Contents
Investing in emerging markets can be riskier than investing in established foreign markets due to increased volatility and lower trading volume.
Investments in small and/or medium-sized companies typically exhibit greater risk and higher volatility than larger, more established companies.
If and when the Fund invests in forward foreign currency contracts or uses other investments to hedge against currency risks, the Fund will be subject to special risks, including counterparty risk.
2 The Fund’s expense ratios, as described in the most recent prospectus, are disclosed in the following “Fund expense ratios” table. Delaware Management Company has agreed to reimburse certain expenses and/or waive certain fees in order to prevent total fund operating expenses (excluding any 12b-1 fees, acquired fund fees and expenses, taxes, interest, short sale and dividend interest expenses, brokerage fees, certain insurance costs, and nonroutine expenses or costs, including, but not limited to, those relating to reorganizations, litigation, conducting shareholder meetings, and liquidations (collectively, nonroutine expenses)) from exceeding 1.30% of the Fund’s average daily net assets during the period from Dec. 1, 2015, through Nov. 30, 2016.* Please see the most recent prospectus and any applicable supplement(s) for additional information on these fee waivers and/or reimbursements.
| Fund expense ratios | Class A | Class C | Institutional Class | |||||||||
Total annual operating expenses | 2.93% | 3.68% | 2.68% | |||||||||
(without fee waivers) | ||||||||||||
Net expenses | 1.55% | 2.30% | 1.30% | |||||||||
(including fee waivers, if any) | ||||||||||||
Type of waiver | Contractual | Contractual | Contractual | |||||||||
* The aggregate contractual waiver period covering this report is from Dec. 1, 2015 through May 2, 2017.
| 5 |
Table of Contents
| Performance summary | ||
| Delaware Asia Select Fund |
Performance of a $10,000 investment1
Average annual total returns from Dec. 21, 2015 (Fund’s inception), through Nov. 30, 2016
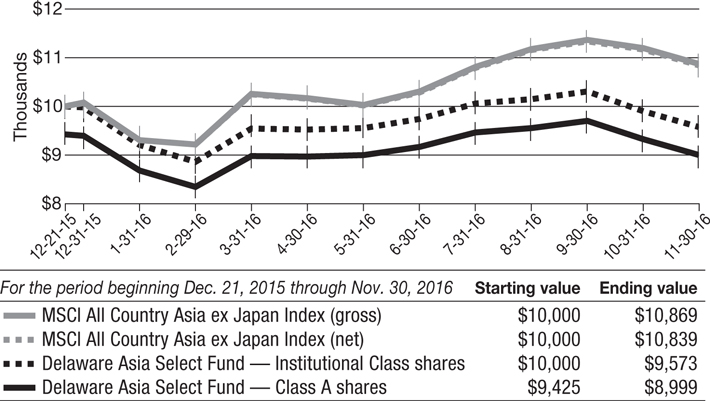
1 The “Performance of a $10,000 investment” graph assumes $10,000 invested in Institutional Class and Class A shares of the Fund on Dec. 21, 2015, and includes the effect of a 5.75% front-end sales charge (for Class A shares) and the reinvestment of all distributions. The graph does not reflect the deduction of taxes the shareholders would pay on Fund distributions or redemptions of Fund shares. Expense limitations were in effect for some or all of the periods shown. Performance would have been lower had expense limitations not been in effect. Expenses are listed in the “Fund expense ratios” table on page 5. Please note additional details on pages 4 through 7.
The graph also assumes $10,000 invested in the MSCI All Country Asia ex Japan Index as of Dec. 21, 2015. The MSCI All Country Asia ex Japan Index represents large- and mid-cap stocks across two of three developed market countries in Asia (Hong Kong and Singapore, not Japan)
and eight emerging market countries in Asia (China, India, Indonesia, Korea, Malaysia, the Philippines, Taiwan, and Thailand). The index covers approximately 85% of the free float-adjusted market capitalization in each country. Index “gross” return approximates the maximum possible dividend reinvestment. Index “net” return approximates the minimum possible dividend reinvestment, after deduction of withholding tax at the highest possible rate.
Index performance returns do not reflect any management fees, transaction costs, or expenses. Indices are unmanaged and one cannot invest directly in an index. Past performance is not a guarantee of future results.
Performance of other Fund classes will vary due to different charges and expenses.
| 6 |
Table of Contents
| Nasdaq symbols | CUSIPs | |||
Class A | DMAAX | 24610H401 | ||
Class C | DMACX | 24610H500 | ||
Institutional Class
| DMSIX
| 24610H609
|
| 7 |
Table of Contents
| Disclosure of Fund expenses | ||
| For the period from June 1, 2016 to November 30, 2016 (Unaudited) |
As a shareholder of the Fund, you incur two types of costs: (1) transaction costs, including sales charges (loads) on purchase payments, reinvested dividends, or other distributions; redemption fees; and exchange fees; and (2) ongoing costs, including management fees; distribution and/or service (12b-1) fees; and other Fund expenses. This example is intended to help you understand your ongoing costs (in dollars) of investing in the Fund and to compare these costs with the ongoing costs of investing in other mutual funds.
The example is based on an investment of $1,000 invested at the beginning of the period and held for the entire six-month period from June 1, 2016 to Nov. 30, 2016.
Actual expenses
The first section of the table shown, “Actual Fund return,” provides information about actual account values and actual expenses. You may use the information in this section of the table, together with the amount you invested, to estimate the expenses that you paid over the period. Simply divide your account value by $1,000 (for example, an $8,600 account value divided by $1,000 = 8.6), then multiply the result by the number in the first section under the heading entitled “Expenses Paid During Period” to estimate the expenses you paid on your account during this period.
Hypothetical example for comparison purposes
The second section of the table shown, “Hypothetical 5% return,” provides information about hypothetical account values and hypothetical expenses based on the Fund’s actual expense ratio and an assumed rate of return of 5% per year before expenses, which is not the Fund’s actual return. The hypothetical account values and expenses may not be used to estimate the actual ending account balance or expenses you paid for the period. You may use this information to compare the ongoing costs of investing in the Fund and other funds. To do so, compare this 5% hypothetical example with the 5% hypothetical examples that appear in the shareholder reports of the other funds.
Please note that the expenses shown in the table are meant to highlight your ongoing costs only and do not reflect any transactional costs, such as sales charges (loads), redemption fees, or exchange fees. Therefore, the second section of the table is useful in comparing ongoing costs only, and will not help you determine the relative total costs of owning different funds. In addition, if these transactional costs were included, your costs would have been higher. The Fund’s expenses shown in the table reflect fee waivers in effect. The expenses shown in the table assume reinvestment of all dividends and distributions.
| 8 |
Table of Contents
Delaware Asia Select Fund
Expense analysis of an investment of $1,000
| Beginning Account Value 6/1/16 | Ending Account Value 11/30/16 | Annualized Expense Ratio | Expenses Paid During Period 6/1/16 to 11/30/16* | |||||
Actual Fund return† | ||||||||
Class A | $1,000.00 | $1,000.00 | 1.55% | $7.75 | ||||
Class C | 1,000.00 | 997.50 | 2.30% | 11.49 | ||||
Institutional Class | 1,000.00 | 1,002.50 | 1.30% | 6.51 | ||||
Hypothetical 5% return (5% return before expenses) | ||||||||
Class A | $1,000.00 | $1,017.25 | 1.55% | $7.82 | ||||
Class C | 1,000.00 | 1,013.50 | 2.30% | 11.58 | ||||
Institutional Class | 1,000.00 | 1,018.50 | 1.30% | 6.56 | ||||
* “Expenses Paid During Period” are equal to the Fund’s annualized expense ratio, multiplied by the average account value over the period, multiplied by 183/366 (to reflect the one-half year period).
† Because actual returns reflect only the recent six-month period, the returns shown may differ significantly from fiscal year returns.
| 9 |
Table of Contents
| Security type / country and sector allocations | ||
| Delaware Asia Select Fund | As of November 30, 2016 (Unaudited) |
Sector designations may be different than the sector designations presented in other Fund materials. The sector designations may represent the investment manager’s internal sector classifications.
| Security type / country | Percentage of net assets | |||||
Common Stock by Country | 86.80% | |||||
China/Hong Kong | 44.10% | |||||
India | 1.97% | |||||
Indonesia | 3.48% | |||||
Malaysia | 0.98% | |||||
Philippines. | 0.77% | |||||
Republic of Korea | 16.84% | |||||
Singapore | 2.24% | |||||
Taiwan | 13.97% | |||||
Thailand | 2.45% | |||||
Exchange-Traded Funds | 7.01% | |||||
Short-Term Investments | 5.98% | |||||
Total Value of Securities | 99.79% | |||||
Receivables and Other Assets Net of Liabilities | 0.21% | |||||
Total Net Assets | 100.00% | |||||
Common stock by sector | Percentage of net assets | |||||
Consumer Discretionary | 23.76% | |||||
Consumer Staples | 10.30% | |||||
Financials | 12.86% | |||||
Healthcare | 3.55% | |||||
Industrials | 9.17% | |||||
Information Technology | 17.57% | |||||
Real Estate | 1.03% | |||||
Telecommunication Services | 8.56% | |||||
Total | 86.80% | |||||
| 10 |
Table of Contents
| Schedule of investments | ||
| Delaware Asia Select Fund | November 30, 2016 |
| Number of shares | Value (U.S. $) | |||||||
| ||||||||
Common Stock – 86.80%D | ||||||||
| ||||||||
China/Hong Kong – 44.10% | ||||||||
AIA Group | 15,000 | $ | 91,472 | |||||
Autohome ADR † | 1,400 | 38,612 | ||||||
Beijing Capital International Airport Class H | 152,000 | 149,913 | ||||||
BYD Class H | 16,500 | 99,342 | ||||||
China Mobile | 9,000 | 98,221 | ||||||
China Resources Beer Holdings † | 38,000 | 80,443 | ||||||
China State Construction International Holdings | 34,000 | 54,968 | ||||||
CK Hutchison Holdings | 3,000 | 36,550 | ||||||
CSPC Pharmaceutical Group | 94,000 | 100,950 | ||||||
Ctrip.com International ADR † | 3,000 | 135,690 | ||||||
Galaxy Entertainment Group | 41,000 | 203,507 | ||||||
GF Securities Class H | 23,600 | 55,254 | ||||||
Great Wall Motor Class H | 54,500 | 51,292 | ||||||
Haier Electronics Group | 32,000 | 53,385 | ||||||
Hengan International Group | 3,000 | 23,612 | ||||||
HKT Trust & HKT * | 20,000 | 26,094 | ||||||
Link REIT | 7,500 | 51,634 | ||||||
MTR | 9,500 | 47,521 | ||||||
PICC Property & Casualty Class H | 60,000 | 100,561 | ||||||
Ping An Insurance Group of China Class H | 19,000 | 105,086 | ||||||
Sands China | 19,600 | 96,528 | ||||||
Shenzhou International Group Holdings | 8,000 | 49,197 | ||||||
SINA † | 1,100 | 84,766 | ||||||
Tencent Holdings | 6,900 | 172,311 | ||||||
TravelSky Technology | 11,000 | 23,059 | ||||||
Want Want China Holdings | 86,000 | 54,883 | ||||||
WH Group 144A # | 91,000 | 75,672 | ||||||
Yue Yuen Industrial Holdings | 13,000 | 46,845 | ||||||
|
| |||||||
| 2,207,368 | ||||||||
|
| |||||||
India – 1.97% | ||||||||
HDFC Bank ADR | 1,526 | 98,458 | ||||||
|
| |||||||
| 98,458 | ||||||||
|
| |||||||
Indonesia – 3.48% | ||||||||
Indofood Sukses Makmur | 114,300 | 63,887 | ||||||
Matahari Department Store | 18,300 | 19,444 | ||||||
Telekomunikasi Indonesia Persero | 325,800 | 90,871 | ||||||
|
| |||||||
| 174,202 | ||||||||
|
| |||||||
Malaysia – 0.98% | ||||||||
Westports Holdings | 50,300 | 49,219 | ||||||
|
| |||||||
| 49,219 | ||||||||
|
| |||||||
| 11 |
Table of Contents
Schedule of investments | ||
| Delaware Asia Select Fund |
| Number of shares | Value (U.S. $) | |||||||
| ||||||||
Common StockD (continued) | ||||||||
| ||||||||
Philippines – 0.77% | ||||||||
Security Bank | 10,630 | $ | 38,720 | |||||
|
| |||||||
| 38,720 | ||||||||
|
| |||||||
Republic of Korea – 16.84% | ||||||||
Amorepacific | 246 | 69,020 | ||||||
Hanon Systems | 8,755 | 73,092 | ||||||
Hyundai Department Store | 1,251 | 115,571 | ||||||
Hyundai Marine & Fire Insurance | 928 | 28,895 | ||||||
Korea Kolmar | 1,177 | 67,858 | ||||||
LG Household & Health Care | 70 | 47,124 | ||||||
Mando | 156 | 33,427 | ||||||
Orion | 57 | 33,155 | ||||||
S-1 | 281 | 22,811 | ||||||
Samsung Card | 1,335 | 47,734 | ||||||
Samsung Electronics | 167 | 249,418 | ||||||
Samsung Fire & Marine Insurance | 219 | 54,888 | ||||||
|
| |||||||
| 842,993 | ||||||||
|
| |||||||
Singapore – 2.24% | ||||||||
ComfortDelGro | 41,300 | 72,610 | ||||||
Singapore Telecommunications | 15,000 | 39,558 | ||||||
|
| |||||||
| 112,168 | ||||||||
|
| |||||||
Taiwan – 13.97% | ||||||||
Cub Elecparts | 99 | 826 | ||||||
Far EasTone Telecommunications | 43,000 | 99,564 | ||||||
Gourmet Master | 13,800 | 114,953 | ||||||
Hota Industrial Manufacturing | 13,000 | 49,964 | ||||||
Pou Chen | 37,000 | 46,260 | ||||||
St Shine Optical | 4,000 | 76,554 | ||||||
Taiwan Semiconductor Manufacturing | 46,000 | 264,111 | ||||||
Vanguard International Semiconductor | 25,000 | 47,140 | ||||||
|
| |||||||
| 699,372 | ||||||||
|
| |||||||
Thailand – 2.45% | ||||||||
Bangkok Airways | 37,600 | 25,503 | ||||||
Digital Telecommunications Infrastructure Fund Class F | 185,900 | 73,986 | ||||||
Krungthai Card-Foreign Class F | 5,600 | 22,915 | ||||||
|
| |||||||
| 122,404 | ||||||||
|
| |||||||
Total Common Stock (cost $4,251,945) | 4,344,904 | |||||||
|
| |||||||
| ||||||||
Exchange-Traded Funds – 7.01% | ||||||||
| ||||||||
iShares India 50 ETF | 6,487 | 178,782 | ||||||
iShares MSCI India ETF | 6,400 | 172,352 | ||||||
|
| |||||||
Total Exchange-Traded Funds (cost $348,162) | 351,134 | |||||||
|
| |||||||
| 12 |
Table of Contents
| Principal amount° | Value (U.S. $) | |||||||
| ||||||||
Short-Term Investments – 5.98% | ||||||||
| ||||||||
Discount Notes – 3.66%¹ | ||||||||
Federal Home Loan Bank | ||||||||
0.261% 12/20/16 | 16,577 | $ | 16,576 | |||||
0.29% 12/21/16 | 104,029 | 104,018 | ||||||
0.31% 1/25/17 | 13,069 | 13,062 | ||||||
0.38% 1/27/17 | 33,154 | 33,137 | ||||||
0.39% 2/3/17 | 16,577 | 16,564 | ||||||
|
| |||||||
| 183,357 | ||||||||
|
| |||||||
Repurchase Agreements – 2.32% | ||||||||
Bank of America Merrill Lynch | 42,683 | 42,683 | ||||||
Bank of Montreal | 71,138 | 71,138 | ||||||
BNP Paribas | 2,179 | 2,179 | ||||||
|
| |||||||
| 116,000 | ||||||||
|
| |||||||
Total Short-Term Investments (cost $299,350) | 299,357 | |||||||
|
| |||||||
Total Value of Securities – 99.79% | $ | 4,995,395 | ||||||
|
| |||||||
| # | Security exempt from registration under Rule 144A of the Securities Act of 1933, as amended. At Nov. 30, 2016, the aggregate value of Rule 144A securities was $75,672, which represents 1.51% of the Fund’s net assets. See Note 11 in “Notes to financial statements.” |
| * | A stapled security consists of two or more securities that are contractually bound to form a single salable unit and cannot be bought and sold separately. |
| ¹ | The rate shown is the effective yield at the time of purchase. |
| ° | Principal amount shown is stated in U.S. dollars unless noted that the security is denominated in another currency. |
| D | Securities have been classified by country of origin. Aggregate classification by business sectors has been presented on page 10 in “Security type / country and sector allocations.” |
| † | Non-income-producing security. |
| 13 |
Table of Contents
Schedule of investments | ||
| Delaware Asia Select Fund |
Summary of abbreviations:
ADR – American Depositary Receipt
ETF – Exchange-Traded Fund
REIT – Real Estate Investment Trust
See accompanying notes, which are an integral part of the financial statements.
| 14 |
Table of Contents
This page intentionally left blank.
Table of Contents
| Statement of assets and liabilities | ||
| Delaware Asia Select Fund | November 30, 2016 |
Assets: | ||||
Investments, at value1 | $ | 4,696,038 | ||
Short-term investments, at value2 | 299,357 | |||
Cash | 703 | |||
Investment management fees receivable from affiliates | 39,088 | |||
Receivable for securities sold | 14,228 | |||
Prepaid expenses | 3,315 | |||
Dividends and interest receivable | 1,880 | |||
|
| |||
Total assets | 5,054,609 | |||
|
| |||
Liabilities: | ||||
Other accrued expenses | 26,306 | |||
Payable for securities purchased | 13,911 | |||
Foreign currencies | 8,470 | |||
Dividend disbursing and transfer agent fees and expenses payable to affiliates | 84 | |||
Reports and statements to shareholders expenses payable to affiliates | 67 | |||
Distribution fees payable to affiliates | 50 | |||
Trustees’ fees and expenses payable | 34 | |||
Accounting and administration expenses payable to affiliates | 20 | |||
Legal fees payable to affiliates | 8 | |||
|
| |||
Total liabilities | 48,950 | |||
|
| |||
Total Net Assets | $ | 5,005,659 | ||
|
| |||
Net Assets Consist of: | ||||
Paid-in capital | $ | 5,218,358 | ||
Undistributed net investment income | 24,162 | |||
Accumulated net realized loss on investments | (332,868 | ) | ||
Net unrealized appreciation of investments | 95,938 | |||
Net unrealized appreciation of foreign currencies | 69 | |||
|
| |||
Total Net Assets | $ | 5,005,659 | ||
|
| |||
| 16 |
Table of Contents
Net Asset Value | ||||
Class A: | ||||
Net assets | $ | 223,569 | ||
Shares of beneficial interest outstanding, unlimited authorization, no par | 27,558 | |||
Net asset value per share | $ | 8.11 | ||
Sales charge | 5.75 | % | ||
Offering price per share, equal to net asset value per share / (1 – sales charge) | $ | 8.60 | ||
Class C: | ||||
Net assets | $ | 5,080 | ||
Shares of beneficial interest outstanding, unlimited authorization, no par | 630 | |||
Net asset value per share | $ | 8.06 | ||
Institutional Class: | ||||
Net assets | $ | 4,777,010 | ||
Shares of beneficial interest outstanding, unlimited authorization, no par | 587,716 | |||
Net asset value per share | $ | 8.13 | ||
1 Investments, at cost | $ | 4,600,107 | ||
2 Short-term investments, at cost | 299,350 | |||
See accompanying notes, which are an integral part of the financial statements.
| 17 |
Table of Contents
| Statement of operations | ||
| Delaware Asia Select Fund | December 21, 2015* to November 30, 2016 |
Investment Income: | ||||
Dividends | $ | 104,661 | ||
Foreign tax withheld | (10,162 | ) | ||
|
| |||
| 94,499 | ||||
|
| |||
Expenses: | ||||
Legal fees | 91,993 | |||
Registration fees | 81,123 | |||
Management fees | 44,568 | |||
Audit and tax fees | 32,450 | |||
Reports and statements to shareholders expenses | 24,309 | |||
Custodian fees | 21,847 | |||
Dividend disbursing and transfer agent fees and expenses | 1,714 | |||
Accounting and administration expenses | 1,507 | |||
Distribution expenses – Class A | 354 | |||
Distribution expenses – Class C | 48 | |||
Trustees’ fees and expenses | 226 | |||
Other | 12,964 | |||
|
| |||
| 313,103 | ||||
Less expenses waived | (251,682 | ) | ||
Less waived distribution expenses – Class A | (1 | ) | ||
Less waived distribution expenses – Class C | (4 | ) | ||
Less expense paid indirectly | (2 | ) | ||
|
| |||
Total operating expenses | 61,414 | |||
|
| |||
Net Investment Income | 33,085 | |||
|
| |||
Net Realized and Unrealized Gain (Loss): | ||||
Net realized gain (loss) on: | ||||
Investments | (327,498 | ) | ||
Foreign currencies | 677 | |||
Foreign currency exchange contracts | (10,857 | ) | ||
|
| |||
Net realized loss | (337,678 | ) | ||
|
| |||
Net unrealized appreciation (depreciation) of: | ||||
Investments | 95,938 | |||
Foreign currencies | 69 | |||
|
| |||
Net unrealized appreciation | 96,007 | |||
|
| |||
Net Realized and Unrealized Loss | (241,671 | ) | ||
|
| |||
Net Decrease in Net Assets Resulting from Operations | $ | (208,586 | ) | |
|
| |||
* Date of commencement of operations.
See accompanying notes, which are an integral part of the financial statements.
| 18 |
Table of Contents
| Statement of changes in net assets | ||
| Delaware Asia Select Fund |
12/21/15* to 11/30/16 | ||||
Increase (Decrease) in Net Assets from Operations: | ||||
Net investment income | $ | 33,085 | ||
Net realized loss | (337,678 | ) | ||
Net unrealized appreciation | 96,007 | |||
|
| |||
Net decrease in net assets resulting from operations | (208,586 | ) | ||
|
| |||
Dividends and Distributions to Shareholders from: | ||||
Net investment income: | ||||
Class A | (4 | ) | ||
Class C | (4 | ) | ||
Institutional Class | (4,110 | ) | ||
|
| |||
| (4,118 | ) | |||
|
| |||
Capital Share Transactions: | ||||
Proceeds from shares sold: | ||||
Class A | 217,587 | |||
Class C | 5,334 | |||
Institutional Class | 4,994,516 | |||
Net asset value of shares issued upon reinvestment of dividends and distributions: | ||||
Class A | 4 | |||
Class C | 4 | |||
Institutional Class | 3,493 | |||
|
| |||
| 5,220,938 | ||||
|
| |||
Cost of shares redeemed: | ||||
Institutional Class | (2,575 | ) | ||
|
| |||
| (2,575 | ) | |||
|
| |||
Increase in net assets derived from capital share transactions | 5,218,363 | |||
|
| |||
Net Increase in Net Assets | 5,005,659 | |||
Net Assets: | ||||
Beginning of period | — | |||
|
| |||
End of period | $ | 5,005,659 | ||
|
| |||
Undistributed net investment income | $ | 24,162 | ||
|
| |||
* Date of commencement of operations.
See accompanying notes, which are an integral part of the financial statements.
| 19 |
Table of Contents
Delaware Asia Select Fund
Selected data for each share of the Fund outstanding throughout each period were as follows:
|
Net asset value, beginning of period |
Income (loss) from investment operations: |
Net investment income (loss)2 |
Net realized and unrealized loss |
Total from investment operations |
Less dividends and distributions from: |
Net investment income |
Total dividends and distributions |
Net asset value, end of period |
Total return3 |
Ratios and supplemental data: |
Net assets, end of period (000 omitted) |
Ratio of expenses to average net assets |
Ratio of expenses to average net assets prior to fees waived |
Ratio of net investment income (loss) to average net assets |
Ratio of net investment loss to average net assets prior to fees waived |
Portfolio turnover |
|
| 1 | Date of commencement of operations; ratios have been annualized and total return and portfolio turnover have not been annualized. |
| 2 | The average shares outstanding method has been applied for per share information. |
| 3 | Total investment return is based on the change in net asset value of a share during the period and assumes reinvestment of dividends and distributions at net asset value and does not reflect the impact of a sales charge. Total investment return reflects a waiver by the manager and distributor. Performance would have been lower had the waivers not been in effect. |
See accompanying notes, which are an integral part of the financial statements.
| 20 |
Table of Contents
| Class A 12/21/151 to 11/30/16 | Class C 11/30/16 | Institutional Class to 11/30/16 | ||||||||||||||||||||||
| $ | 8.500 | $ | 8.500 | $ | 8.500 | |||||||||||||||||||
| 0.037 | (0.016 | ) | 0.055 | |||||||||||||||||||||
| (0.420 | ) | (0.417 | ) | (0.418 | ) | |||||||||||||||||||
|
|
|
|
|
| |||||||||||||||||||
| (0.383 | ) | (0.433 | ) | (0.363 | ) | |||||||||||||||||||
|
|
|
|
|
| |||||||||||||||||||
| (0.007 | ) | (0.007 | ) | (0.007 | ) | |||||||||||||||||||
|
|
|
|
|
| |||||||||||||||||||
| (0.007 | ) | (0.007 | ) | (0.007 | ) | |||||||||||||||||||
|
|
|
|
|
| |||||||||||||||||||
| $ | 8.11 | $ | 8.06 | $ | 8.13 | |||||||||||||||||||
|
|
|
|
|
| |||||||||||||||||||
| (4.51% | ) | (5.10% | ) | (4.27% | ) | |||||||||||||||||||
| $ | 224 | $ | 5 | $ | 4,777 | |||||||||||||||||||
| 1.55% | 2.21% | 1.30% | ||||||||||||||||||||||
| 6.91% | 7.66% | 6.66% | ||||||||||||||||||||||
| 0.46% | (0.20% | ) | 0.71% | |||||||||||||||||||||
| (4.90% | ) | (5.65% | ) | (4.65% | ) | |||||||||||||||||||
| 88% | 88% | 88% | ||||||||||||||||||||||
| 21 |
Table of Contents
| Notes to financial statements | ||
| Delaware Asia Select Fund | November 30, 2016 |
Delaware Group® Global and International Funds (Trust) is organized as a Delaware statutory trust and offers five series: Delaware Asia Select Fund (formerly, Delaware Macquarie Asia Select Fund), Delaware Emerging Markets Fund, Delaware Global Value Fund, Delaware International Small Cap Fund (formerly, Delaware Focus Global Growth Fund), and Delaware International Value Equity Fund. These financial statements and the related notes pertain to Delaware Asia Select Fund (Fund). The Trust is an open-end investment company. The Fund is considered diversified under the Investment Company Act of 1940, as amended, and offers Class A, Class C, and Institutional Class shares. Class A shares are sold with a maximum front-end sales charge of 5.75%. Class A share purchases of $1,000,000 or more will incur a contingent deferred sales charge (CDSC) instead of a front-end sales charge of 1.00%, if redeemed during the first year, and 0.50% during the second year, provided that Delaware Distributors, L.P. (DDLP) paid a financial advisor a commission on the purchase of those shares. Class C shares are sold with a CDSC of 1.00%, if redeemed during the first 12 months. Institutional Class shares are not subject to a sales charge and are offered for sale exclusively to certain eligible investors.
The investment objective of the Fund is to seek long-term capital appreciation.
1. Significant Accounting Policies
The following accounting policies are in accordance with U.S. generally accepted accounting principles (U.S. GAAP) and are consistently followed by the Fund.
Security Valuation — Equity securities and exchange-traded funds (ETFs), except those traded on the Nasdaq Stock Market LLC (Nasdaq), are valued at the last quoted sales price as of the time of the regular close of the New York Stock Exchange on the valuation date. Equity securities and ETFs traded on the Nasdaq are valued in accordance with the Nasdaq Official Closing Price, which may not be the last sales price. If, on a particular day, an equity security or ETF does not trade, the mean between the bid and ask prices will be used, which approximates fair value. Equity securities listed on a foreign exchange are normally valued at the last quoted sales price on the valuation date. U.S. government and agency securities are valued at the mean between the bid and ask prices, which approximates fair value. Foreign currency exchange contracts are valued at the mean between the bid and ask prices, which approximates fair value. Interpolated values are derived when the settlement date of the contract is an interim date for which quotations are not available. Generally, other securities and assets for which market quotations are not readily available are valued at fair value as determined in good faith under the direction of the Trust’s Board of Trustees (Board). In determining whether market quotations are readily available or fair valuation will be used, various factors will be taken into consideration, such as market closures, or suspension of trading in a security. The Fund may use fair value pricing more frequently for securities traded primarily in non-U.S. markets because, among other things, most foreign markets close well before the Fund values its securities, generally as of 4:00 p.m. Eastern time. The earlier close of these foreign markets gives rise to the possibility that significant events, including broad market moves, government actions or pronouncements, aftermarket trading, or news events may have occurred in the interim. Whenever such a significant event occurs, the Fund may value foreign securities using fair value prices based on third-party vendor modeling tools (international fair value pricing).
Federal and Foreign Income Taxes — No provision for federal income taxes has been made as the Fund intends to qualify for federal income tax purposes as a regulated investment company under Subchapter M of the Internal Revenue Code of 1986, as amended, and make the requisite distributions
| 22 |
Table of Contents
to shareholders. The Fund evaluates tax positions taken or expected to be taken in the course of preparing the Fund’s tax returns to determine whether the tax positions are more-likely-than-not of being sustained by the applicable tax authority. Tax positions not deemed to meet the “more-likely-than-not” threshold are recorded as a tax benefit or expense in the current year. The Fund did not record any tax benefits or expenses in the current period. Management has analyzed the Fund’s tax position taken for the open federal income tax year ended Nov. 30, 2016, and has concluded that no position for federal income tax is required in the Fund’s financial statements.
Class Accounting — Investment income, common expenses, and realized and unrealized gain (loss) on investments are allocated to the various classes of the Fund on the basis of daily net assets of each class. Distribution expenses relating to a specific class are charged directly to that class.
Repurchase Agreements — The Fund may purchase certain U.S. government securities subject to the counterparty’s agreement to repurchase them at an agreed upon date and price. The counterparty will be required on a daily basis to maintain the value of the collateral subject to the agreement at not less than the repurchase price (including accrued interest). The agreements are conditioned upon the collateral being deposited under the Federal Reserve book-entry system with the Fund’s custodian or a third-party sub-custodian. In the event of default or bankruptcy by the other party to the agreement, retention of the collateral may be subject to legal proceedings. All open repurchase agreements as of the date of this report were entered into on Nov. 30, 2016, and matured on the next business day.
Foreign Currency Transactions — Transactions denominated in foreign currencies are recorded at the prevailing exchange rates on the valuation date in accordance with the Fund’s prospectus. The value of all assets and liabilities denominated in foreign currencies is translated daily into U.S. dollars at the exchange rate of such currencies against the U.S. dollar. Transaction gains or losses resulting from changes in exchange rates during the reporting period or upon settlement of the foreign currency transaction are reported in operations for the current period. The Fund generally does not bifurcate that portion of realized gains and losses on investments which is due to changes in foreign exchange rates from that which is due to changes in market prices. These gains and losses are included on the “Statement of operations” under “Net realized and unrealized gain (loss) on investments.” The Fund reports certain foreign currency related transactions as components of realized gains (losses) for financial reporting purposes, whereas such components are treated as ordinary income (loss) for federal income tax purposes.
Use of Estimates — The Fund is an investment company, whose financial statements are prepared in conformity with U.S. GAAP. Therefore, the Fund follows the accounting and reporting guidelines for investment companies. The preparation of financial statements in conformity with U.S. GAAP requires management to make estimates and assumptions that affect the fair value of investments, the reported amounts of assets and liabilities and disclosure of contingent assets and liabilities at the date of the financial statements, and the reported amounts of revenues and expenses during the reporting period. Actual results could differ from those estimates and the differences could be material.
Other — Expenses directly attributable to the Fund are charged directly to the Fund. Other expenses common to various funds within the Delaware Investments® Family of Funds are generally allocated among such funds on the basis of average net assets. Management fees and some other expenses are paid monthly. Security transactions are recorded on the date the securities are purchased or sold (trade
| 23 |
Table of Contents
| Notes to financial statements | ||
| Delaware Asia Select Fund |
1. Significant Accounting Policies (continued)
date) for financial reporting purposes. Costs used in calculating realized gains and losses on the sale of investment securities are those of the specific securities sold. Dividend income is recorded on the ex-dividend date and interest income is recorded on the accrual basis. Discounts and premiums on debt securities are accreted or amortized to interest income, respectively, over the lives of the respective securities using the effective interest method. Foreign dividends are also recorded on the ex-dividend date or as soon after the ex-dividend date that the Fund is aware of such dividends, net of all tax withholdings, a portion of which may be reclaimable. Withholding taxes and reclaims on foreign dividends have been recorded in accordance with the Fund’s understanding of the applicable country’s tax rules and rates. The Fund declares and pays dividends from net investment income and distributions from net realized gain on investments, if any, annually. The Fund may distribute more frequently, if necessary for tax purposes. Dividends and distributions, if any, are recorded on the ex-dividend date.
The Fund may receive earnings credits from its custodian when positive cash balances are maintained, which may be used to offset custody fees. There were no such earnings credits for the period Dec. 21, 2015* through Nov. 30, 2016.
The Fund receives earnings credits from its transfer agent when positive cash balances are maintained, which may be used to offset transfer agent fees. If the amount earned is greater than $1.00, the expense paid under this arrangement is included on the “Statement of operations” under “Dividend disbursing and transfer agent fees and expenses” with the corresponding expense offset shown under “Less expense paid indirectly.” For the period Dec. 21, 2015* through Nov. 30, 2016, the Fund earned $2 under this agreement.
*Date of commencement of operations.
2. Investment Management, Administration Agreements, and Other Transactions with Affiliates
In accordance with the terms of its investment management agreement, the Fund pays Delaware Management Company (DMC), a series of Delaware Management Business Trust and the investment manager, an annual fee which is calculated daily at the rate of 0.95% on the first $500 million of the average daily net assets of the Fund, 0.90% on the next $500 million, 0.85% on the next $1.5 billion, and 0.80% on the average daily net assets in excess of $2.5 billion.
DMC has contractually agreed to waive all or a portion of its management fee and/or pay/reimburse the Fund to the extent necessary to ensure that total annual operating expenses (excluding any distribution and service (12b-1) fees, acquired fund fees and expenses, taxes, interest, short sale and dividend interest expenses, brokerage fees, certain insurance costs, and nonroutine expenses or costs, including, but not limited to, those relating to reorganizations, litigation, conducting shareholder meetings, and liquidations (collectively, nonroutine expenses)) do not exceed 1.30% of the Fund’s average daily net assets from Dec. 1, 2015 through Nov. 30, 2016.** For purposes of this waiver and reimbursement, nonroutine expenses may also include such additional costs and expenses as may be agreed upon from time to time by the Fund’s Board and DMC. This expense waiver and reimbursement may only be terminated by agreement of DMC and the Fund.
| 24 |
Table of Contents
Delaware Investments Fund Services Company (DIFSC), an affiliate of DMC, provides fund accounting and financial administration oversight services to the Fund. For these services, DIFSC’s fees are calculated based on the aggregate daily net assets of the Delaware Investments® Family of Funds at the following annual rate: 0.0050% of the first $30 billion; 0.0045% of the next $10 billion; 0.0040% of the next $10 billion; and 0.0025% of aggregate average daily net assets in excess of $50 billion. The fees payable to DIFSC under the service agreement described above are allocated among all retail funds in the Delaware Investments Family of Funds on a relative net asset value (NAV) basis. For the period Dec. 21, 2015* through Nov. 30, 2016, the Fund was charged $222 for these services. This amount is included on the “Statement of operations” under “Accounting and administration expenses.”
DIFSC is also the transfer agent and dividend disbursing agent of the Fund. For these services, DIFSC’s fees are calculated based on the aggregate daily net assets of the retail funds within the Delaware Investments Family of Funds at the following annual rate: 0.025% of the first $20 billion; 0.020% of the next $5 billion; 0.015% of the next $5 billion; and 0.013% of average daily net assets in excess of $30 billion. The fees payable to DIFSC under the service agreement described above are allocated among all retail funds in the Delaware Investments Family of Funds on a relative NAV basis. For the period Dec. 21, 2015* through Nov. 30, 2016, the Fund was charged $966 for these services. This amount is included on the “Statement of operations” under “Dividend disbursing and transfer agent fees and expenses.” Pursuant to a sub-transfer agency agreement between DIFSC and BNY Mellon Investment Servicing (US) Inc. (BNYMIS), BNYMIS provides certain sub-transfer agency services to the Fund. Sub-transfer agency fees are paid by the Fund and are also included on the “Statement of operations” under “Dividend disbursing and transfer agent fees and expenses.”
Pursuant to a distribution agreement and distribution plan, the Fund pays DDLP, the distributor and an affiliate of DMC, an annual 12b-1 fees of 0.25% of the average daily net assets of the Class A shares and 1.00% of the average daily net assets of the Class C shares. Institutional Class shares pay no 12b-1 fee. Prior to Jan. 25, 2016, DDLP had voluntarily agreed to waive 12b-1 fees to 0.00% of the average daily net assets for both Class A and Class C shares.
As provided in the investment management agreement, the Fund bears a portion of the cost of certain resources shared with DMC, including the cost of internal personnel of DMC and/or its affiliates that provide legal, tax, and regulatory reporting services to the Fund. For the period Dec. 21, 2015* through Nov. 30, 2016, the Fund was charged $49,329 for internal legal, tax, and regulatory reporting services provided by DMC and/or its affiliates’ employees. This amount is included on the “Statement of operations” under “Legal fees.”
Trustees’ fees include expenses accrued by the Fund for each Trustee’s retainer and meeting fees. Certain officers of DMC, DIFSC, and DDLP are officers and/or Trustees of the Trust. These officers and Trustees are paid no compensation by the Fund.
*Date of commencement of operations.
**The aggregate contractual waiver period covering this report is from Dec. 1, 2015 through May 2, 2017.
| 25 |
Table of Contents
| Notes to financial statements | ||
| Delaware Asia Select Fund |
3. Investments
For the period Dec. 21, 2015* through Nov. 30, 2016, the Fund made purchases and sales of investment securities other than short-term investments as follows:
Purchases | $ | 8,687,688 | ||
Sales | 3,760,082 |
At Nov. 30, 2016, the cost and unrealized appreciation (depreciation) of investments for federal income tax purposes were as follows:
Cost of investments | $ | 4,917,012 | ||
|
| |||
Aggregate unrealized appreciation of investments | $ | 287,190 | ||
Aggregate unrealized depreciation of investments | (208,807 | ) | ||
|
| |||
Net unrealized appreciation of investments | $ | 78,383 | ||
|
|
U.S. GAAP defines fair value as the price that the Fund would receive to sell an asset or pay to transfer a liability in an orderly transaction between market participants at the measurement date under current market conditions. A three-level hierarchy for fair value measurements has been established based upon the transparency of inputs to the valuation of an asset or liability. Inputs may be observable or unobservable and refer broadly to the assumptions that market participants would use in pricing the asset or liability. Observable inputs reflect the assumptions market participants would use in pricing the asset or liability based on market data obtained from sources independent of the reporting entity. Unobservable inputs reflect the reporting entity’s own assumptions about the assumptions that market participants would use in pricing the asset or liability based on the best information available under the circumstances. The Fund’s investment in its entirety is assigned a level based upon the observability of the inputs which are significant to the overall valuation. The three-level hierarchy of inputs is summarized below.
| Level 1 – | Inputs are quoted prices in active markets for identical investments. (Examples: equity securities, open-end investment companies, futures contracts, exchange-traded options contracts) | |
| Level 2 – | Other observable inputs, including, but not limited to: quoted prices for similar assets or liabilities in markets that are active, quoted prices for identical or similar assets or liabilities in markets that are not active, inputs other than quoted prices that are observable for the assets or liabilities (such as interest rates, yield curves, volatilities, prepayment speeds, loss severities, credit risks, and default rates) or other market-corroborated inputs. (Examples: debt securities, government securities, swap contracts, foreign currency exchange contracts, foreign securities utilizing international fair value pricing, broker-quoted securities, fair valued securities) | |
| Level 3 – | Significant unobservable inputs, including the Fund’s own assumptions used to determine the fair value of investments. (Examples: broker-quoted securities, fair valued securities) | |
Level 3 investments are valued using significant unobservable inputs. The Fund may also use an income-based valuation approach in which the anticipated future cash flows of the investment are discounted to calculate fair value. Discounts may also be applied due to the nature or duration of any restrictions on the disposition of the investments. Valuations may also be based upon current market
| 26 |
Table of Contents
prices of securities that are comparable in coupon, rating, maturity, and industry. The derived value of a Level 3 investment may not represent the value which is received upon disposition and this could impact the results of operations.
The following table summarizes the valuation of the Fund’s investments by fair value hierarchy levels as of Nov. 30, 2016:
Securities | Level 1 | Level 2 | Total | |||||||||
Common Stock | ||||||||||||
China/Hong Kong | 2,207,368 | — | 2,207,368 | |||||||||
India | 98,458 | — | 98,458 | |||||||||
Indonesia | 174,202 | — | 174,202 | |||||||||
Malaysia | 49,219 | — | 49,219 | |||||||||
Philippines | — | 38,720 | 38,720 | |||||||||
Republic of Korea | 842,993 | — | 842,993 | |||||||||
Singapore | 112,168 | — | 112,168 | |||||||||
Taiwan | 699,372 | — | 699,372 | |||||||||
Thailand | 122,404 | — | 122,404 | |||||||||
Exchange-Traded Funds | 351,134 | — | 351,134 | |||||||||
Short-Term Investments | — | 299,357 | 299,357 | |||||||||
|
|
|
|
|
| |||||||
Total Value of Securities | $ | 4,657,318 | $ | 338,077 | $ | 4,995,395 | ||||||
|
|
|
|
|
| |||||||
During the period Dec. 21, 2015* through Nov. 30, 2016, there were no transfers between Level 1 investments, Level 2 investments, or Level 3 investments that had a significant impact to the Fund. This does not include transfers between Level 1 investments and Level 2 investments due to the Fund utilizing international fair value pricing during the period. In accordance with the fair valuation procedures described in Note 1, international fair value pricing of securities in the Fund occurs when market volatility exceeds an established rolling threshold. If the threshold is exceeded on a given date, then prices of international securities (those that traded on exchanges that close at a different time than the time that the Fund’s NAV is determined) are established using a separate pricing feed from a third-party vendor designed to establish a price for each such security as of the time that the Fund’s NAV is determined. Further, international fair value pricing uses other observable market-based inputs in place of the closing exchange price due to the events occurring after the close of the exchange or market on which the investment is principally traded, causing a change in classification between levels. The Fund’s policy is to recognize transfers between levels at the beginning of the reporting period.
A reconciliation of Level 3 investments is presented when the Fund has a significant amount of Level 3 investments at the beginning, interim, or end of the period in relation to net assets. At Nov. 30, 2016, there were no Level 3 investments.
*Date of commencement of operations.
| 27 |
Table of Contents
| Notes to financial statements | ||
| Delaware Asia Select Fund |
4. Dividend and Distribution Information
Income and long-term capital gain distributions are determined in accordance with federal income tax regulations, which may differ from U.S. GAAP. Additionally, distributions from net gains on foreign currency transactions and net short-term gains on sales of investment securities are treated as ordinary income for federal income tax purposes. The tax character of dividends and distributions paid during the period Dec. 21, 2015* through Nov. 30, 2016 was as follows:
| 12/21/15* to 11/30/16 | ||||
Ordinary income | $4,118 | |||
* Date of commencement of operations.
5. Components of Net Assets on a Tax Basis
As of Nov. 30, 2016, the components of net assets on a tax basis were as follows:
Shares of beneficial interest | $ | 5,218,358 | ||
Undistributed ordinary income | 40,835 | |||
Capital loss carryforwards | (331,986 | ) | ||
Net unrealized appreciation of investments and foreign currencies | 78,452 | |||
|
| |||
Net assets | $ | 5,005,659 | ||
|
|
The differences between book basis and tax basis components of net assets are primarily attributable to tax deferral of losses on wash sales and tax recognition of unrealized gain on passive foreign investment companies (PFIC).
For financial reporting purposes, capital accounts are adjusted to reflect the tax character of permanent book/tax differences. Reclassifications are primarily due to tax treatment of gain (loss) on foreign currency transactions, disallowed expenses and PFIC. Results of operations and net assets were not affected by these reclassifications. For the period from Dec 21, 2015* to Nov. 30, 2016, the Fund recorded the following reclassifications:
Undistributed net investment income | $ | (4,805 | ) | |
Accumulated net realized loss | 4,810 | |||
Paid-in capital | (5 | ) |
On Dec. 22, 2010, the Regulated Investment Company Modernization Act of 2010 (Act) was enacted, which changed various technical rules governing the tax treatment of regulated investment companies. The changes were generally effective for taxable years beginning after the date of enactment. Under the Act, the Fund is permitted to carry forward capital losses incurred in taxable years beginning after the date of enactment for an unlimited period. Additionally, post-enactment capital loss carryforwards will retain their character as either short-term or long-term capital losses rather than being considered all short-term as permitted under previous regulation.
| 28 |
Table of Contents
Losses incurred that will be carried forward under the Act are as follows:
| Loss carryforward character | ||||||||
| Short-term | Long-term | |||||||
| $331,986 | $— | |||||||
6. Capital Shares
Transactions in capital shares were as follows:
| 12/21/15* to 11/30/16 | ||||
Shares sold: | ||||
Class A | 27,558 | |||
Class C | 630 | |||
Institutional Class | 587,616 | |||
Shares issued upon reinvestment of dividends and distributions: | ||||
Class A | — | ** | ||
Class C | — | ** | ||
Institutional Class | 414 | |||
|
| |||
| 616,218 | ||||
|
| |||
Shares redeemed: | ||||
Institutional Class | (314 | ) | ||
|
| |||
| (314 | ) | |||
|
| |||
Net increase | 615,904 | |||
|
| |||
* Date of commencement of operations.
** Amount is less than 0.50 share.
7. Line of Credit
The Fund, along with certain other funds in the Delaware Investments® Family of Funds (Participants), was a participant in a $155,000,000 revolving line of credit intended to be used for temporary or emergency purposes as an additional source of liquidity to fund redemptions of investor shares. Under the agreement, the Participants were charged an annual commitment fee of 0.10%, which was allocated across the Participants on the basis of relative net assets of each Participant’s allocation of the entire facility. The Participants were permitted to borrow up to a maximum of one third of their net assets under the agreement. Each Participant was individually, and not jointly, liable for its particular advances, if any, under the line of credit. The line of credit available under the agreement expired on Nov. 7, 2016.
On Nov. 7, 2016, the Fund along with the other Participants, entered into an amendment to the agreement for a $155,000,000 revolving line of credit. The line of credit is to be used as described above and operates in substantially the same manner as the original agreement, with the exception of the annual commitment fee. Under the amendment to the agreement, the Participants are charged an annual commitment fee of 0.15%, which is allocated across the Participants on the basis of relative net assets
| 29 |
Table of Contents
| Notes to financial statements | ||
| Delaware Asia Select Fund |
7. Line of Credit (continued)
of each Participant’s allocation of the entire facility. The line of credit available under the agreement expires on Nov. 6, 2017.
The Fund had no amounts outstanding as of Nov. 30, 2016, or at any time during the period then ended.
8. Derivatives
U.S. GAAP requires disclosures that enable investors to understand: (1) how and why an entity uses derivatives; (2) how they are accounted for; and (3) how they affect an entity’s results of operations and financial position.
Foreign Currency Exchange Contracts — The Fund may enter into foreign currency exchange contracts as a way of managing foreign exchange rate risk. The Fund may enter into these contracts to fix the U.S. dollar value of a security that it has agreed to buy or sell for the period between the date the trade was entered into and the date the security is delivered and paid for. The Fund may also use these contracts to hedge the U.S. dollar value of securities it already owns that are denominated in foreign currencies. In addition, the Fund may enter into these contracts to facilitate or expedite the settlement of portfolio transactions. The change in value is recorded as an unrealized gain or loss. When the contract is closed, a realized gain or loss is recorded equal to the difference between the value of the contract at the time it was opened and the value at the time it was closed.
The use of foreign currency exchange contracts does not eliminate fluctuations in the underlying prices of the securities, but does establish a rate of exchange that can be achieved in the future. Although foreign currency exchange contracts limit the risk of loss due to an unfavorable change in the value of the hedged currency, they also limit any potential gain that might result should the value of the currency change favorably. In addition, the Fund could be exposed to risks if the counterparties to the contracts are unable to meet the terms of their contracts. The Fund’s maximum risk of loss from counterparty credit risk is the value of its currency exchanged with the counterparty. The risk is generally mitigated by having a netting arrangement between the Fund and the counterparty and by the posting of collateral by the counterparty to the Fund to cover the Fund’s exposure to the counterparty.
During the period Dec. 21, 2015* through Nov. 30, 2016, the Fund entered into foreign currency exchange contracts to hedge the U.S. dollar value of securities it already owns that are denominated in foreign currencies.
During the period Dec. 21, 2015* through Nov. 30, 2016, the Fund experienced net realized losses attributable to foreign currency holdings, which are reflected on the “Statement of operations” under “Net realized gain (loss) on foreign currency exchange contracts.”
Derivatives Generally. The table below summarizes the average balance of derivative holdings by the Fund during the period Dec. 21, 2015* through Nov. 30, 2016.
| Long Derivatives Volume | Short Derivatives Volume | |||||||||||||||
Foreign currency exchange contracts (average cost) | USD | 8,923 | USD | 8,487 | ||||||||||||
* Date of commencement of operations.
| 30 |
Table of Contents
9. Offsetting
In December 2011, the Financial Accounting Standards Board (FASB) issued guidance that expanded disclosure requirements on the offsetting of certain assets and liabilities. The disclosures are required for investments and derivative financial instruments subject to master netting or similar agreements which are eligible for offset on the “Statement of assets and liabilities” and requires an entity to disclose both gross and net information about such investments and transactions in the financial statements. In January 2013, the FASB issued guidance that clarified which investments and transactions are subject to the offsetting disclosure requirements. The scope of the disclosure requirements for offsetting is limited to derivative instruments, repurchase agreements and reverse repurchase agreements, and securities borrowing.
In order to better define its contractual rights and to secure rights that will help the Fund mitigate its counterparty risk, the Fund entered into an International Swaps and Derivatives Association, Inc. Master Agreement (ISDA Master Agreement) or a similar agreement with certain of its derivative contract counterparties. An ISDA Master Agreement is a bilateral agreement between the Fund and a counterparty that governs certain over-the-counter (OTC) derivatives and foreign exchange contracts and typically contains, among other things, collateral posting items and netting provisions in the event of a default and/or termination event. Under an ISDA Master Agreement, the Fund may, under certain circumstances, offset with the counterparty certain derivative financial instruments’ payables and/or receivables with collateral held and/or posted and create one single net payment. The provisions of the ISDA Master Agreement typically permit a single net payment in the event of default (close-out), including the bankruptcy or insolvency of the counterparty. However, bankruptcy or insolvency laws of a particular jurisdiction may impose restrictions on or prohibitions against the right of offset in bankruptcy, insolvency, or other events.
For financial reporting purposes, the Fund does not offset derivative assets and derivative liabilities that are subject to netting arrangements on the “Statement of assets and liabilities.”
Master Repurchase Agreements
| Fair Value of | Cash | Net | ||||||||||||||||||
| Repurchase | Non-cash | Collateral | Collateral | Net | ||||||||||||||||
Counterparty | Agreements | Collateral Received(a) | Received | Received | Exposure(b) | |||||||||||||||
Bank of America Merrill Lynch | $ | 42,683 | $ | (42,683 | ) | $ | — | $ | (42,683 | ) | $ | — | ||||||||
Bank of Montreal | 71,138 | (71,138 | ) | — | (71,138 | ) | — | |||||||||||||
BNP Paribas | 2,179 | (2,179 | ) | — | (2,179 | ) | — | |||||||||||||
|
|
|
|
|
|
|
|
|
| |||||||||||
Total | $ | 116,000 | $ | (116,000 | ) | $ | — | $ | (116,000 | ) | $ | — | ||||||||
|
|
|
|
|
|
|
|
|
| |||||||||||
(a)The value of the related collateral received exceeded the value of the repurchase agreements as of Nov. 30, 2016.
(b)Net exposure represents the receivable (payable) that would be due from (to) the counterparty in the event of default.
10. Securities Lending
The Fund, along with other funds in the Delaware Investments® Family of Funds, may lend its securities pursuant to a security lending agreement (Lending Agreement) with The Bank of New York Mellon (BNY Mellon). At the time a security is loaned, the borrower must post collateral equal to the required
| 31 |
Table of Contents
| Notes to financial statements | ||
| Delaware Asia Select Fund |
10. Securities Lending (continued)
percentage of the market value of the loaned security, including any accrued interest. The required percentage is: (1) 102% with respect to U.S. securities and foreign securities that are denominated and payable in U.S. dollars; and (2) 105% with respect to foreign securities. With respect to each loan, if on any business day the aggregate market value of securities collateral plus cash collateral held is less than the aggregate market value of the securities which are the subject of such loan, the borrower will be notified to provide additional collateral by the end of the following business day which, together with the collateral already held, will be not less than the applicable initial collateral requirements for such security loan. If the aggregate market value of securities collateral and cash collateral held with respect to a security loan exceeds the applicable initial collateral requirement, upon request of the borrower, BNY Mellon must return enough collateral to the borrower by the end of the following business day to reduce the value of the remaining collateral to the applicable initial collateral requirement for such security loan. As a result of the foregoing, the value of the collateral held with respect to a loaned security on any particular day may be more or less than the value of the security on loan.
Prior to Dec. 29, 2015, cash collateral received was generally invested in the Delaware Investments Collateral Fund No. 1 (Collective Trust), a pooled account established by BNY Mellon for the use of funds managed by DMC that participate in BNY Mellon’s securities lending program. The Collective Trust sought to maintain a NAV per unit of $1.00.
On Dec. 29, 2015, the assets in the Collective Trust were transferred to a series of individual separate accounts, each corresponding to a Fund. The investment guidelines permit each separate account to hold certain securities that would be considered eligible securities for a money market fund. Cash collateral received is generally invested in government securities; certain obligations issued by government sponsored enterprises; repurchase agreements collateralized by U.S. Treasury securities; obligations issued by the central government of any Organization for Economic Cooperation and Development (OECD) country or its agencies, instrumentalities, or establishments; obligations of supranational organizations, commercial paper, notes, bonds, and other debt obligations; certificates of deposit, time deposits, and other bank obligations; and asset-backed securities.
In the event of default or bankruptcy by the lending agent, realization and/or retention of the collateral may be subject to legal proceedings. In the event the borrower fails to return loaned securities and the collateral received is insufficient to cover the value of the loaned securities and provided such collateral shortfall is not the result of investment losses, the lending agent has agreed to pay the amount of the shortfall to the Fund or, at the discretion of the lending agent, replace the loaned securities. The Fund continues to record dividends or interest, as applicable, on the securities loaned and is subject to changes in value of the securities loaned that may occur during the term of the loan. The Fund has the right under the Lending Agreement to recover the securities from the borrower on demand. With respect to security loans collateralized by non-cash collateral, the Fund receives loan premiums paid by the borrower. With respect to security loans collateralized by cash collateral, the earnings from the collateral investments are shared among the Fund, the security lending agent, and the borrower. The Fund records security lending income net of allocations to the security lending agent, and the borrower.
The Fund may incur investment losses as a result of investing securities lending collateral. This could occur if an investment in the collateral investment account defaulted or became impaired. Under those
| 32 |
Table of Contents
circumstances, the value of the Fund’s cash collateral account may be less than the amount the Fund would be required to return to the borrowers of the securities and the Fund would be required to make up for this shortfall.
During the period Dec. 21, 2015* through Nov. 30, 2016, the Fund had no securities out on loan.
* Date of commencement of operations.
11. Credit and Market Risk
Some countries in which the Fund may invest require governmental approval for the repatriation of investment income, capital, or the proceeds of sales of securities by foreign investors. In addition, if there is deterioration in a country’s balance of payments, or for other reasons, a country may impose temporary restrictions on foreign capital remittances abroad.
The securities exchanges of certain foreign markets are substantially smaller, less liquid and more volatile than the major securities markets in the United States. Consequently, acquisition and disposition of securities by the Fund may be inhibited. In addition, a significant portion of the aggregate market value of equity securities listed on the major securities exchanges in emerging markets is held by a smaller number of investors. This may limit the number of shares available for acquisition or disposition by the Fund.
The Fund may invest up to 15% of its net assets in illiquid securities, which may include securities with contractual restrictions on resale, securities exempt from registration under Rule 144A promulgated under the Securities Act of 1933, as amended, and other securities which may not be readily marketable. The relative illiquidity of these securities may impair the Fund from disposing of them in a timely manner and at a fair price when it is necessary or desirable to do so. While maintaining oversight, the Fund’s Board has delegated to DMC, the day-to-day functions of determining whether individual securities are liquid for purposes of the Fund’s limitation on investments in illiquid securities. Securities eligible for resale pursuant to Rule 144A, which are determined to be liquid, are not subject to the Fund’s 15% limit on investments in illiquid securities. As of Nov. 30, 2016, no securities have been determined to be illiquid under the Fund’s Liquidity Procedures. Rule 144A securities have been identified on the “Schedule of investments.” When monitoring compliance with the Fund’s illiquid limit, certain holdings that are common to multiple clients of the investment manager may be aggregated and considered illiquid in the aggregate solely for monitoring purposes. For purposes of determining illiquidity for financial reporting purposes, only the holdings of this Fund will be considered.
12. Contractual Obligations
The Fund enters into contracts in the normal course of business that contain a variety of indemnifications. The Fund’s maximum exposure under these arrangements is unknown. However, the Fund has not had prior claims or losses pursuant to these contracts. Management has reviewed the Fund’s existing contracts and expects the risk of loss to be remote.
| 33 |
Table of Contents
| Notes to financial statements | ||
| Delaware Asia Select Fund |
13. Recent Accounting Pronouncements
On Oct. 13, 2016, the Securities and Exchange Commission amended existing rules intended to modernize reporting and disclosure of information. These amendments relate to Regulation S-X which sets forth the form and content of financial statements. At this time, management is evaluating the implications of adopting these amendments and their impact on the financial statements and accompanying notes.
14. Subsequent Events
Management has determined that no material events or transactions occurred subsequent to Nov. 30, 2016 that would require recognition or disclosure in the Fund’s financial statements.
| 34 |
Table of Contents
registered public accounting firm
To the Board of Trustees of Delaware Group® Global & International Funds
and Shareholders of Delaware Asia Select Fund :
In our opinion, the accompanying statement of assets and liabilities, including the schedule of investments, and the related statements of operations and of changes in net assets and the financial highlights present fairly, in all material respects, the financial position of Delaware Asia Select Fund (one of the series constituting Delaware Group® Global & International Funds, hereafter referred to as the “Fund”) as of November 30, 2016, the results of its operations, the changes in its net assets and the financial highlights for the period December 21, 2015 (commencement of operations) through November 30, 2016, in conformity with accounting principles generally accepted in the United States of America. These financial statements and financial highlights (hereafter referred to as “financial statements”) are the responsibility of the Fund’s management. Our responsibility is to express an opinion on these financial statements based on our audits. We conducted our audits of these financial statements in accordance with the standards of the Public Company Accounting Oversight Board (United States). Those standards require that we plan and perform the audit to obtain reasonable assurance about whether the financial statements are free of material misstatement. An audit includes examining, on a test basis, evidence supporting the amounts and disclosures in the financial statements, assessing the accounting principles used and significant estimates made by management, and evaluating the overall financial statement presentation. We believe that our audits, which included confirmation of securities as of November 30, 2016 by correspondence with the custodian and brokers, provide a reasonable basis for our opinion.
PricewaterhouseCoopers LLP
Philadelphia, Pennsylvania
January 23, 2017
| 35 |
Table of Contents
Other Fund information (Unaudited)
Delaware Asia Select Fund
Tax Information
The information set forth below is for the Fund’s fiscal year as required by federal income tax laws. Shareholders, however, must report distributions on a calendar year basis for income tax purposes, which may include distributions for portions of two fiscal years of the Fund. Accordingly, the information needed by shareholders for income tax purposes will be sent to them in January of each year. Please consult your tax advisor for proper treatment of this information.
All disclosures are based on financial information available as of the date of this annual report and, accordingly are subject to change. For any and all items requiring reporting, it is the intention of the Fund to report the maximum amount permitted under the Internal Revenue Code and the regulations thereunder.
For the period Dec. 21, 2015** through Nov. 30, 2016, the Fund reports distributions paid during the year as follows:
(A) Ordinary Income Distributions* (Tax Basis) | 100.00 | % | ||
(B) Qualified Dividends1 | 0.00 | % |
(A) is based on a percentage of the Fund’s total distributions.
(B) is based on a percentage of the Fund’s ordinary income distributions.
| 1 | Qualifying dividends represent dividends which qualify for the corporate dividends received deduction. |
| * | For the period Dec. 21, 2015** through Nov. 30, 2016, certain dividends paid by the Fund may be subject to a maximum tax rate of 20%. The percentage of dividends paid by the Fund from ordinary income reported as qualified dividend income is 98.46%. Complete information will be computed and reported in conjunction with your 2016 Form 1099-DIV. |
**Date of commencement of operations.
Board consideration of Delaware Asia Select Fund investment advisory agreement
At a meeting held on Nov. 17–19, 2015, the Board of Trustees (the “Board”), including a majority of disinterested or independent Trustees, approved an Investment Advisory Agreement with Delaware Management Company (“DMC”) and an Investment Sub-Advisory Agreement with Macquarie Funds Management Hong Kong Limited (“Macquarie Hong Kong”) for Delaware Asia Select Fund (the “Fund”).
In reaching the decision to approve the advisory and sub-advisory agreements, the Board considered and reviewed information provided by DMC and Macquarie Hong Kong, including its personnel, operations, and financial condition. The Board also reviewed a memorandum from DMC reviewing the terms of the advisory and sub-advisory agreements, the proposed advisory and sub-advisory fees, and the various services proposed to be provided by DMC and Macquarie Hong Kong; information concerning Macquarie Hong Kong’s organizational structure and the experience of its investment management personnel; copies of DMC’s and Macquarie Hong Kong’s Form ADV, compliance policies and procedures, and its Code of Ethics; and a copy of the proposed advisory and sub-advisory agreements.
In considering such information and materials, the Independent Trustees received assistance and advice from and met separately with independent legal counsel. The materials prepared by Management
| 36 |
Table of Contents
specifically in connection with the approval of the advisory and sub-advisory agreements were provided to the Independent Trustees in advance of the Meeting. Although attention was given to all information furnished, the following discussion addressed some primary factors relevant to the Board’s decision. This discussion of the information and factors considered by the Board is not intended to be exhaustive, but rather summarizes certain factors considered by the Board.
Nature, extent, and quality of service of DMC. The Board considered the services to be provided by DMC to the Fund and its shareholders. In doing so, the Board drew on its extensive knowledge of the comparable services provided by DMC to other funds in the Delaware Investments® Family of Funds (“DIFF”) complex. In reviewing the nature, extent, and quality of services, the Board noted that DMC will furnish to the Board reports throughout the year at regular Board meetings covering matters such as relative performance of the Fund; compliance of portfolio managers with the investment policies, strategies, and restrictions for the Fund; compliance by DMC and Delaware Distributors, L.P. (“DDLP”) (together, “Management”) personnel with the Code of Ethics adopted throughout the DIFF complex; and adherence to fair value pricing procedures as established by the Board. The Board was pleased with the current staffing of the Fund’s investment advisor and the emphasis placed on research in the investment process. The Board gave favorable consideration to DMC’s efforts to control expenditures while maintaining service levels committed to Delaware Investments fund matters. The Board also noted the benefits that will be provided to Fund shareholders through each shareholder’s ability to exchange an investment in one Delaware Investments fund for the same class of shares in another Delaware Investments fund without a sales charge, to reinvest Fund dividends into additional shares of the Fund or into additional shares of other Delaware Investments funds and the privilege to combine holdings in other Delaware Investments funds to obtain a reduced sales charge. The Board was satisfied with the nature, extent, and quality of the overall services provided by DMC.
Nature, extent, and quality of service of Macquarie Hong Kong. The Board considered the services to be provided by Macquarie Hong Kong to the Fund and its shareholders. In reviewing the nature, extent, and quality of services, the Board took account of reports that will be furnished to it throughout the year at regular Board Meetings covering matters such as relative performance of the Fund; compliance of portfolio managers with the investment policies, strategies, and restrictions for the Fund; the compliance of Macquarie Hong Kong personnel with its Code of Ethics; and adherence to fair value pricing procedures as established by the Board. The Board was pleased with the current staffing of Macquarie Hong Kong and the emphasis placed on fundamental analysis in the investment process. The Board was satisfied with the nature, extent, and quality of the overall services provided by Macquarie Hong Kong.
Investment performance. The Board considered the investment performance of strategies managed by Macquarie Hong Kong that are similar to the Fund’s strategy. The Board also noted the Asian region expertise of Macquarie Hong Kong.
Comparative expenses. The Board considered management fee and total expense comparison data, including applicable fee waivers and expense reimbursements, for the Fund, as presented in the Board materials. The Board was satisfied with the proposed management fee and total expenses of the Fund.
| 37 |
Table of Contents
| Other Fund information (Unaudited) | ||
| Delaware Asia Select Fund |
Board consideration of Delaware Asia Select Fund investment advisory agreement (continued)
Management profitability of DMC. The Board considered the level of potential profits to be realized by Delaware Investments in connection with the operation of the Fund. In this respect, the Board reviewed certain pro forma expense information for the Fund included in the Board materials. The Board also considered the extent to which Delaware Investments might derive ancillary benefits from Delaware Investments fund operations, including the potential for procuring additional business as a result of the prestige and visibility associated with its role as service provider to the Delaware Investments® Family of Funds and the benefits from allocation of Delaware Investments fund brokerage to improve trading efficiencies. The Board found that the proposed level of management fees was reasonable in light of the services rendered and the level of profitability of Delaware Investments.
Management profitability of Macquarie Hong Kong. Trustees were also given available information on potential profits by Macquarie Hong Kong in relation to the services to be provided to the Fund or in relation to Macquarie Hong Kong’s overall investment advisory business, but believed such information to be of limited relevance because the sub-advisory fees are paid by DMC out of its management fee, and changes in the level of sub-advisory fees have no impact on total Fund expenses. The Board was also provided information on potential fall-out benefits derived or to be derived by Macquarie Hong Kong in connection with its relationship to the Fund, such as reputational enhancement, soft dollar arrangements, or commissions paid to affiliated broker/dealers, as applicable.
Economies of scale. The Trustees considered whether economies of scale are expected to be realized by Delaware Investments as the Fund’s assets increase and the extent to which any economies of scale are reflected in the level of management fees charged. The Trustees considered the standardized advisory fee pricing and structure approved by the Board. The Board noted that the fee of 95 basis points (for assets under management up to $500 million) under the Fund’s proposed management contract is between the standard fee for international equity funds and special international equity funds, in keeping with the nature of the securities within the Fund’s portfolio. Management believed, and the Board agreed, that the Fund was priced with an appropriate management fee.
| 38 |
Table of Contents
This page intentionally left blank.
Table of Contents
| Board of trustees / directors and officers addendum | ||
| Delaware Investments® Family of Funds |
A mutual fund is governed by a Board of Trustees/Directors (“Trustees”), which has oversight responsibility for the management of a fund’s business affairs. Trustees establish procedures and oversee and review the performance of the investment manager, the distributor, and others who perform services for the fund. The independent fund trustees, in particular, are advocates
Name, Address, and Birth Date | Position(s) Held with Fund(s) | Length of Time Served | ||
Interested Trustee
| ||||
Shawn K. Lytle1, 3 | President, | Trustee since | ||
2005 Market Street | Chief Executive Officer, | September 2015 | ||
Philadelphia, PA 19103 | and Trustee | |||
February 1970 | President and | |||
| Chief Executive Officer | ||||
| since August 2015 | ||||
Independent Trustees
| ||||
Thomas L. Bennett | Chairman and Trustee | Trustee since | ||
2005 Market Street | March 2005 | |||
Philadelphia, PA 19103 | ||||
October 1947 | Chairman since | |||
March 2015
| ||||
Ann D. Borowiec | Trustee | Since March 2015 | ||
2005 Market Street | ||||
Philadelphia, PA 19103 | ||||
November 1958 | ||||
Joseph W. Chow | Trustee | Since January 2013 | ||
2005 Market Street | ||||
Philadelphia, PA 19103 | ||||
January 1953 | ||||
| 1 | Shawn K. Lytle is considered to be an “Interested Trustee“ because he is an executive officer of the Fund’s(s’) investment advisor. |
| 40 |
Table of Contents
for shareholder interests. Each trustee has served in that capacity since he or she was elected to or appointed to the Board of Trustees, and will continue to serve until his or her retirement or the election of a new trustee in his or her place. The following is a list of the Trustees and Officers with certain background and related information.
Principal Occupation(s) During the Past Five Years | Number of Portfolios in Fund Complex Overseen by Trustee or Officer | Other Directorships Held by Trustee or Officer | ||
Shawn K. Lytle has served as | 62 | Trustee — UBS | ||
President of | Relationship Funds, | |||
Delaware Investments2 | SMA Relationship | |||
since June 2015 and was the | Trust, and UBS Funds | |||
Regional Head of Americas for | (May 2010–April 2015) | |||
UBS Global Asset | ||||
Management from | ||||
2010 through 2015. | ||||
Private Investor | 62 | Director — | ||
(March 2004–Present) | Bryn Mawr Bank Corp. (BMTC) | |||
| (2007–2011) | ||||
Chief Executive Officer | 62 | Director — | ||
Private Wealth Management | Banco Santander International | |||
(2011–2013) and | Since October 2016 | |||
Market Manager, | ||||
New Jersey Private | Director — | |||
Bank (2005–2011) — | Santander Bank, N.A. | |||
J.P. Morgan Chase & Co.
| Since December 2016 | |||
Executive Vice President | 62 | Director and Audit Committee | ||
| (Emerging Economies | Member — Hercules | |||
| Strategies, Risks, and | Technology Growth | |||
Corporate Administration) | Capital, Inc. | |||
State Street Corporation | (2004–2014) | |||
(July 2004–March 2011)
|
| 2 | Delaware Investments is the marketing name for Delaware Management Holdings, Inc. and its subsidiaries, including the Fund’s(s’) investment advisor, principal underwriter, and its transfer agent. |
| 41 |
Table of Contents
| Board of trustees / directors and officers addendum | ||
| Delaware Investments® Family of Funds |
| Name, Address, and Birth Date | Position(s) Held with Fund(s) | Length of Time Served | ||
Independent Trustees (continued)
| ||||
John A. Fry | Trustee | Since January 2001 | ||
2005 Market Street | ||||
Philadelphia, PA 19103 | ||||
May 1960 | ||||
Lucinda S. Landreth | Trustee | Since March 2005 | ||
2005 Market Street | ||||
Philadelphia, PA 19103 | ||||
June 1947 | ||||
Frances A. Sevilla-Sacasa | Trustee | Since September 2011 | ||
2005 Market Street | ||||
Philadelphia, PA 19103 | ||||
January 1956 | ||||
| 42 |
Table of Contents
| Principal Occupation(s) During the Past Five Years | Number of Portfolios in Fund Complex Overseen by Trustee or Officer | Other Directorships Held by Trustee or Officer | ||
President — | 62 | Director, Audit | ||
Drexel University | and Governance Committee | |||
(August 2010–Present) | Member — Community | |||
| Health Systems | ||||
President — | ||||
Franklin & Marshall College | Director — Drexel | |||
(July 2002–July 2010) | Morgan & Co. | |||
| Director, Audit Committee | ||||
| Member — vTv | ||||
| Therapeutics LLC | ||||
Private Investor | 62 | None | ||
(2004–Present) | ||||
Chief Executive Officer — | 62 | Trust Manager and | ||
Banco Itaú | Audit Committee | |||
International | Member — Camden | |||
(April 2012–December 2016) | Property Trust | |||
Executive Advisor to Dean | ||||
(August 2011–March | ||||
(January 2011–July 2011) — | ||||
University of Miami School of | ||||
Business Administration | ||||
President — U.S. Trust, | ||||
Bank of America Private | ||||
Wealth Management | ||||
(Private Banking) | ||||
(July 2007–December 2008)
| ||||
| 43 |
Table of Contents
| Board of trustees / directors and officers addendum | ||
| Delaware Investments® Family of Funds |
| Name, Address, and Birth Date | Position(s) Held with Fund(s) | Length of Time Served | ||
Independent Trustees (continued)
| ||||
Thomas K. Whitford | Trustee | Since January 2013 | ||
2005 Market Street | ||||
Philadelphia, PA 19103 | ||||
March 1956 | ||||
Janet L. Yeomans | Trustee | Since April 1999 | ||
2005 Market Street | ||||
Philadelphia, PA 19103 | ||||
July 1948 | ||||
Officers
| ||||
David F. Connor | Senior Vice President, | Senior Vice President | ||
2005 Market Street | General Counsel, | since May 2013; | ||
Philadelphia, PA 19103 | and Secretary | General Counsel | ||
December 1963 | since May 2015; | |||
| Secretary since | ||||
| October 2005 | ||||
Daniel V. Geatens | Vice President | Treasurer since October 2007 | ||
2005 Market Street | and Treasurer | |||
Philadelphia, PA 19103 | ||||
October 1972 | ||||
Richard Salus | Senior Vice President | Chief Financial Officer | ||
2005 Market Street | and Chief Financial Officer | since November 2006 | ||
Philadelphia, PA 19103 | ||||
October 1963 | ||||
The Statement of Additional Information for the Fund(s) includes additional information about the Trustees and Officers and is available, without charge, upon request by calling 800 523-1918.
| 44 |
Table of Contents
Principal Occupation(s) During the Past Five Years | Number of Portfolios in Fund Complex Overseen by Trustee or Officer | Other Directorships Held by Trustee or Officer | ||
Vice Chairman | 62 | Director — HSBC Finance | ||
(2010–April 2013) and | Corporation and HSBC | |||
Chief Administrative | North America Holdings Inc. | |||
Officer (2008–2010) — | ||||
PNC Financial | Director — | |||
Services Group | HSBC Bank | |||
Vice President and Treasurer | 62 | Director, Personnel and | ||
(January 2006–July 2012), | Compensation Committee | |||
Vice President — | Chair, Audit Committee | |||
Mergers & Acquisitions | Member and Governance | |||
(January 2003–January 2006), | Committee Member — | |||
and Vice President | Okabena Company | |||
and Treasurer | ||||
(July 1995–January 2003) — | ||||
3M Company | ||||
David F. Connor has served | 62 | None3 | ||
in various capacities at
| ||||
Daniel V. Geatens has served | 62 | None3 | ||
in various capacities at
| ||||
Richard Salus has served | 62 | None3 | ||
in various capacities at
|
| 3 | Shawn K. Lytle, David F. Connor, Daniel V. Geatens, and Richard Salus serve in similar capacities for the six portfolios of the Optimum Fund Trust, which have the same investment advisor, principal underwriter, and transfer agent as the registrant. |
| 45 |
Table of Contents
Board of trustees
| ||||||
Shawn K. Lytle President and Chief Executive Officer Delaware Investments ® Family of Funds Philadelphia, PA
Thomas L. Bennett Chairman of the Board Delaware Investments Family of Funds Private Investor Rosemont, PA | Ann D. Borowiec Former Chief Executive Officer Private Wealth Management J.P. Morgan Chase & Co. New York, NY
Joseph W. Chow Former Executive Vice President State Street Corporation Boston, MA | John A. Fry President Drexel University Philadelphia, PA
Lucinda S. Landreth Former Chief Investment Officer Assurant, Inc. New York, NY | Frances A. Sevilla-Sacasa Chief Executive Officer Banco Itaú International Miami, FL
Thomas K. Whitford Former Vice Chairman PNC Financial Services Group Pittsburgh, PA
Janet L. Yeomans Former Vice President and Treasurer 3M Company St. Paul, MN | |||
| Affiliated officers | ||||||
David F. Connor Senior Vice President, General Counsel, and Secretary Delaware Investments Family of Funds Philadelphia, PA | Daniel V. Geatens Vice President and Treasurer Delaware Investments Family of Funds Philadelphia, PA | Richard Salus Senior Vice President and Chief Financial Officer Delaware Investments Family of Funds Philadelphia, PA | ||||
This annual report is for the information of Delaware Asia Select Fund shareholders, but it may be used with prospective investors when preceded or accompanied by the Delaware Investments Fund fact sheet for the most recently completed calendar quarter. These documents are available at delawareinvestments.com/literature.
Delaware Investments is the marketing name of Delaware Management Holdings, Inc. and its subsidiaries.
The Fund files its complete schedule of portfolio holdings with the Securities and Exchange Commission (SEC) for the first and third quarters of each fiscal year on Form N-Q. The Fund’s Forms N-Q, as well as a description of the policies and procedures that the Fund uses to determine how to vote proxies (if any) relating to portfolio securities are available without charge (i) upon request, by calling 800 523-1918; and (ii) on the SEC’s website at sec.gov. In addition, a description of the policies and procedures that the Fund uses to determine how to vote proxies (if any) relating to portfolio securities and the Schedules of Investments included in the Fund’s most recent Form N-Q are available without charge on the Fund’s website at delawareinvestments.com/literature. The Fund’s Forms N-Q may be reviewed and copied at the SEC’s Public Reference Room in Washington, D.C.; information on the operation of the Public Reference Room may be obtained by calling 800 SEC-0330.
Information (if any) regarding how the Funds voted proxies relating to portfolio securities during the most recently disclosed 12-month period ended June 30 is available without charge (i) through the Funds’ website at delawareinvestments.com/proxy; and (ii) on the SEC’s website at sec.gov.
| 46 |
Table of Contents

Annual report
Global / international equity mutual fund
Delaware International Small Cap Fund
(formerly, Delaware Focus Global Growth Fund)
November 30, 2016
Carefully consider the Fund’s investment objectives, risk factors, charges, and expenses before investing. This
and other information can be found in the Fund’s prospectus and its summary prospectus, which may be obtained by visiting delawareinvestments.com/literature or calling 800 523-1918. Investors should read the prospectus and the summary prospectus carefully before investing.
You can obtain shareholder reports and prospectuses online instead of in the mail.
Visit delawareinvestments.com/edelivery.
Table of Contents
Experience Delaware Investments
Delaware Investments is committed to the pursuit of consistently superior asset management and unparalleled client service. We believe in our investment processes, which seek to deliver consistent results, and in convenient services that help add value for our clients.
If you are interested in learning more about creating an investment plan, contact your financial advisor.
You can learn more about Delaware Investments or obtain a prospectus for Delaware International Small Cap Fund at delawareinvestments.com/literature.
Manage your investments online
| ● | 24-hour access to your account information |
| ● | Obtain share prices |
| ● | Check your account balance and recent transactions |
| ● | Request statements or literature |
| ● | Make purchases and redemptions |
Delaware Management Holdings, Inc. and its subsidiaries (collectively known by the marketing name of Delaware Investments) are wholly owned subsidiaries of Macquarie Group Limited, a global provider of banking, financial, advisory, investment, and funds management services.
Neither Delaware Investments nor its affiliates referred to in this document are authorized deposit-taking institutions for the purpose of the Banking Act 1959 (Commonwealth of Australia). The obligations of these entities do not represent deposits or other liabilities of Macquarie Bank Limited (MBL), a subsidiary of Macquarie Group Limited and an affiliate of Delaware Investments. MBL does not guarantee or otherwise provide assurance in respect of the obligations of these entities, unless noted otherwise. The Fund is governed by U.S. laws and regulations.
| 1 | ||||
| 4 | ||||
| 8 | ||||
| 10 | ||||
| 12 | ||||
| 18 | ||||
| 20 | ||||
| 22 | ||||
| 24 | ||||
| 32 | ||||
| 46 | ||||
| 47 | ||||
| 52 | ||||
| 58 |
Unless otherwise noted, views expressed herein are current as of Nov. 30, 2016, and subject to change for events occurring after such date.
The Fund is not FDIC insured and is not guaranteed. It is possible to lose the principal amount invested.
Mutual fund advisory services provided by Delaware Management Company, a series of Delaware Management Business Trust, which is a registered investment advisor. Delaware Investments, a member of Macquarie Group, refers to Delaware Management Holdings, Inc. and its subsidiaries, including the Funds’ distributor, Delaware Distributors, L.P. Macquarie Group refers to Macquarie Group Limited and its subsidiaries and affiliates worldwide.
© 2017 Delaware Management Holdings, Inc.
All third-party marks cited are the property of their respective owners.
Table of Contents
| Portfolio management review | ||
| Delaware International Small Cap Fund | December 6, 2016 |
Performance preview (for the year ended November 30, 2016) | ||||||||
Delaware International Small Cap Fund (Institutional Class shares)* | 1-year return | -0.48 | % | |||||
Delaware International Small Cap Fund (Class A shares)* | 1-year return | -0.75 | % | |||||
MSCI ACWI ex USA Small Cap Index (gross) (current benchmark) | 1-year return | +2.22 | % | |||||
MSCI ACWI ex USA Small Cap Index (net) (current benchmark) | 1-year return | +1.85 | % | |||||
MSCI World Index (gross) (former benchmark) | 1-year return | +3.77 | % | |||||
MSCI World Index (net) (former benchmark) | 1-year return | +3.15 | % |
Past performance does not guarantee future results.
For complete, annualized performance for Delaware International Small Cap Fund, please see the table on page 4. Institutional Class shares are available without sales or asset-based distribution charges only to certain eligible accounts. The performance of Class A shares excludes the applicable sales charge. Both Institutional Class shares and Class A shares reflect the reinvestment of all distributions.
Please see page 6 for a description of the index. Index performance returns do not reflect any management fees, transaction costs, or expenses. Indices are unmanaged and one cannot invest directly in an index.
*Total returns for the report period presented in the table differ from the returns in “Financial highlights.” The total returns presented in the above table are calculated based on the net asset value (NAV) at which shareholder transactions were processed. The total returns presented in “Financial highlights” are calculated in the same manner, but also take into account certain adjustments that are necessary under U.S. generally accepted accounting principles (U.S. GAAP) required in the annual report.
Effective Nov. 30, 2016, the investment strategies for Delaware Focus Global Growth Fund changed and the Fund was repositioned as an international small-cap fund. In connection with the repositioning, the Fund’s name changed to Delaware International Small Cap Fund. In addition, the Global Ex-U.S. Equity team of Delaware Management Company replaced the Fund’s sub-advisor, Jackson Square Partners, LLC. These changes may result in higher portfolio turnover in the near future. Please see the Fund’s prospectus for more information.
Markets in the United States set the stage for shifting monetary policies during the Fund’s fiscal year ended Nov. 30, 2016 as the U.S. Federal Reserve raised the nation’s federal funds rate in December 2015 for the first time in nearly a decade. In the U.S., despite stabilizing energy prices and robust job growth, global geopolitical concerns and a fractious election campaign led to increased economic uncertainty.
Short-term interest rates remained stable throughout the fiscal year, despite an uptick in
wages and a first-half decline in gasoline prices. Concern about global growth, a correction in foreign trade, and the seemingly ever-present specter of a recession muted American investors’ enthusiasm for a good part of the spring. Domestic consumers opened their pocketbooks mid-year, which helped mitigate choppy payroll numbers, but not as much as hoped. The economy paused in early fall as the world watched with baited breath while the U.S. endured one of the most tumultuous presidential election cycles in recent history. Despite the unexpected result, U.S. markets rallied. The S&P 500® Index jumped significantly in the final weeks of the fiscal period, gaining a healthy 8.06% for the fiscal year. Around the same time, the Fed signaled its intent to resume rate hikes in December 2016.
Across the globe, China suffered stock market losses early in the calendar year, particularly as the government took strides to bolster the yuan,
| 1 |
Table of Contents
| Portfolio management review | ||
| Delaware International Small Cap Fund |
which had suffered a swift devaluation earlier in 2015. In other emerging economies, Brazil struggled to recover from a wide-spread, decade-long public scandal that uncovered a long-standing trend toward cronyism among high-ranking public officials and semi-public multinational energy corporation Petrobras. The nation seemingly faces a long road toward economic recovery.
Toward the end of the fiscal year, several emerging market economies reacted sharply to the U.S. election result. Mexican stocks tumbled on concern that the long-standing North American Free Trade Agreement may be renegotiated. Russian stocks, meanwhile, rallied on the expectation of a stronger future relationship with the U.S. Overall, emerging markets gained 8.47% during the fiscal period, as measured by the MSCI Emerging Markets Index.
Developed international markets, meanwhile, didn’t fare as well. Amid economic turbulence, the United Kingdom unexpectedly voted to leave the European Union on June 23. Caught unaware, global financial markets struggled to make sense of how — and how much — the British exit would affect local and global economies. In mid-summer, both the European Central Bank (ECB) and the Bank of England resumed quantitative easing programs. In response, European markets bounced back somewhat. Still, the populist movements that swept first through England and then the U.S. have left many investors watching for potential changes to the political landscapes in Italy, France, Germany, and the Netherlands — each of which has an upcoming election.
Japan continued its long-standing battle against deflation and stagnant growth throughout the period, primarily through steadfast adherence to Prime Minister Shinzo Abe’s three-pronged economic stimulus. Toward fall, policy meetings among the Fed, ECB, and Bank of Japan led to positive outcomes for international bond markets. International developed markets lagged global
markets overall as the MSCI EAFE Index fell 3.66% for the fiscal period.
Within the Fund
For the fiscal year ended Nov. 30, 2016, Delaware International Small Cap Fund Institutional Class shares returned -0.48%*. The Fund’s Class A shares returned -0.75%* at net asset value and -6.47%* at maximum offer price. These figures reflect all distributions reinvested. During the same period, the Fund’s benchmark, the MSCI ACWI ex USA Small Cap Index (net), returned +1.85%. For complete, annualized performance of Delaware International Small Cap Fund, please see the table on page 4.
Strong relative performance in the information technology sector was unable to overcome weak performance in the healthcare and consumer discretionary sectors.
ARM Holdings was a positive contributor to performance during the period. In July, Softbank announced that it would acquire ARM Holdings for $32 billion. ARM is the leading semiconductor licensing firm that designs many of the CPUs used in mobile devices today. Softbank is a vertically integrated communications company, owning the third-largest communications company in Japan and a majority stake in Sprint. The combined company will be able to white label smartphones that can be used in its own network and sold in bundles. Additionally, ARM is the leading provider of technology that supports the Internet of Things (a proposed development of the Internet in which everyday objects have network connectivity). Given what we believe to be the significant premium of the sale — in which an acquirer realized the “full” intrinsic value of the business — we decided to exit the position.
Localiza Rent a Car contributed positively to performance during the period. The stock experienced weakness earlier in the period as investors avoided Brazilian equities. However, despite broader market sentiment, the company
| 2 |
Table of Contents
has grown rental-car utilization rates through better information and predictive modeling. In addition, Localiza Rent a Car has shown its ability to shift from managing for growth to generating high cash flow streams in uncertain economic periods, which generally has allowed it to earn positive returns on capital in a variety of macro environments. Given the positive performance, we decided to exit the position and redeploy the capital into new ideas.
TripAdvisor detracted from performance during the period. The company lowered guidance for 2016 due to headwinds from macro events (Brexit, terrorism, and overall travel reduction) and from the ongoing transition of Instant Booking (IB), which enables users to book hotel stays directly from listings on its site and app. We believe the company is getting better at optimizing the mix between meta and IB offerings (that is, knowing when to display IB prominently and when not to,
based on the property, traveler history, and pricing). Visitors to the desktop site and users of the app still need to be educated about IB. While the company has a massive amount of user traffic that historically has been undermonetized, the company is making a strategic push to better monetize this business. These efforts may create near-term pain for the stock, but, we believe, they have the potential to help TripAdvisor become a powerful network effect business going forward.
Allergan also detracted from performance during the period. The stock suffered when the proposed merger between Pfizer and Allergan was called off in early April and more recently due to a generic drug maker challenging one of its medicines earlier than anticipated. We continue to believe that Allergan operates at a high level driven by the core ophthalmology franchise as well as by the broader use of Botox in both cosmetic and other medical indications.
| 3 |
Table of Contents
| Performance summary | ||
| Delaware International Small Cap Fund | November 30, 2016 |
The performance data quoted represent past performance; past performance does not guarantee future results. Investment return and principal value will fluctuate so your shares, when redeemed, may be worth more or less than their original cost. Please obtain the performance data current for the most recent month end by calling 800 523-1918 or visiting our website at delawareinvestments.com/performance. Current performance may be lower or higher than the performance data quoted.
| Fund and benchmark performance1,2 | Average annual total returns through November 30, 2016 | |||||||||||
| 1 year | 5 years | Lifetime | ||||||||||
Class A (Est. Dec. 29, 2008) | ||||||||||||
Excluding sales charge | -0.75%* | +7.80% | +13.37% | |||||||||
Including sales charge | -6.47%* | +6.53% | +12.52% | |||||||||
Class C (Est. Dec. 29, 2010) | ||||||||||||
Excluding sales charge | -1.47%* | +7.01% | +5.45% | |||||||||
Including sales charge | -2.42%* | +7.01% | +5.45% | |||||||||
Class R (Est. Dec. 29, 2010) | ||||||||||||
Excluding sales charge | -0.96%* | +7.54% | +5.97% | |||||||||
Including sales charge | -0.96%* | +7.54% | +5.97% | |||||||||
Institutional Class (Est. Dec. 29, 2008) | ||||||||||||
Excluding sales charge | -0.48%* | +8.08% | +13.59% | |||||||||
Including sales charge | -0.48%* | +8.08% | +13.59% | |||||||||
MSCI ACWI ex USA Small Cap Index (gross) | +2.22% | +7.28% | +11.86%** | |||||||||
MSCI ACWI ex USA Small Cap Index (net) | +1.85% | +6.90% | +11.48%** | |||||||||
MSCI World Index (gross) | +3.77% | +10.51% | +11.10%** | |||||||||
MSCI World Index (net) | +3.15% | +9.88% | +10.47%** | |||||||||
*Total returns for the report period presented in the table differ from the returns in “Financial highlights.” The total returns presented in the above table are calculated based on the net asset value (NAV) at which shareholder transactions were processed. The total returns presented in “Financial highlights” are calculated in the same manner, but also take into account certain adjustments that are necessary under U.S. generally accepted accounting principles (U.S. GAAP) required in the annual report.
**The benchmark lifetime return is for Institutional Class share comparison only and is calculated using the last business day in the month of the Fund’s Institutional Class inception date.
1 Returns reflect the reinvestment of all distributions and are presented both with and without the applicable sales charges described below. Returns do not reflect the deduction of taxes the shareholder would pay on Fund distributions or redemptions of Fund shares.
Expense limitations were in effect for certain classes during some or all of the periods shown in
the “Fund and benchmark performance” table. Expenses for each class are listed on the “Fund expense ratios” table on page 5. Performance would have been lower had expense limitations not been in effect.
Institutional Class shares are available without sales or asset-based distribution charges only to certain eligible institutional accounts.
| 4 |
Table of Contents
Class A shares are sold with a maximum front-end sales charge of 5.75%, and have an annual distribution and service fee of 0.25% of average daily net assets. Performance for Class A shares, excluding sales charges, assumes that no front-end sales charge applied.
Class C shares are sold with a contingent deferred sales charge of 1.00% if redeemed during the first 12 months. They are also subject to an annual distribution and service fee of 1.00% of average daily net assets. Performance for Class C shares, excluding sales charges, assumes either that contingent deferred sales charges did not apply or that the investment was not redeemed.
Class R shares are available only for certain retirement plan products. They are sold without
a sales charge and have an annual distribution and service fee of 0.50% of average daily net assets.
International investments entail risks not ordinarily associated with U.S. investments including fluctuation in currency values, differences in accounting principles, or economic or political instability in other nations.
Investing in emerging markets can be riskier than investing in established foreign markets due to increased volatility and lower trading volume.
Investments in small and/or medium-sized companies typically exhibit greater risk and higher volatility than larger, more established companies.
2 The Fund’s expense ratios, as described in the most recent prospectus, are disclosed in the following “Fund expense ratios” table. Delaware Management Company has agreed to reimburse certain expenses and/or waive certain fees in order to prevent total fund operating expenses (excluding any 12b-1 fees, taxes, interest, short sale and dividend interest expenses, brokerage fees, certain insurance costs, acquired fund fees and expenses, and nonroutine expenses or costs, including, but not limited to, those relating to reorganizations, litigation, conducting shareholder meetings, and liquidations (collectively, nonroutine expenses)) from exceeding 1.30% of the Fund’s average daily net assets during the period from Dec. 1, 2015, through Nov. 29, 2016. Effective Nov. 30, 2016, this limit was reduced to 1.18% of the Fund’s average daily net assets.* Please see the most recent prospectus and any applicable supplement(s) for additional information on these fee waivers and/or reimbursements.
| Fund expense ratios | Class A | Class C | Class R | Institutional Class | ||||
Total annual operating expenses | 1.44% | 2.19% | 1.69% | 1.19% | ||||
(without fee waivers) | ||||||||
Net expenses | 1.43% | 2.18% | 1.68% | 1.18% | ||||
(including fee waivers, if any) | ||||||||
Type of waiver | Contractual | Contractual | Contractual | Contractual |
*The aggregate contractual waiver period covering this report is from March 30, 2015 through Nov. 30, 2017.
| 5 |
Table of Contents
| Performance summary | ||
| Delaware International Small Cap Fund |
Performance of a $10,000 investment1
Average annual total returns from Dec. 29, 2008 (Fund’s inception), through Nov. 30, 2016
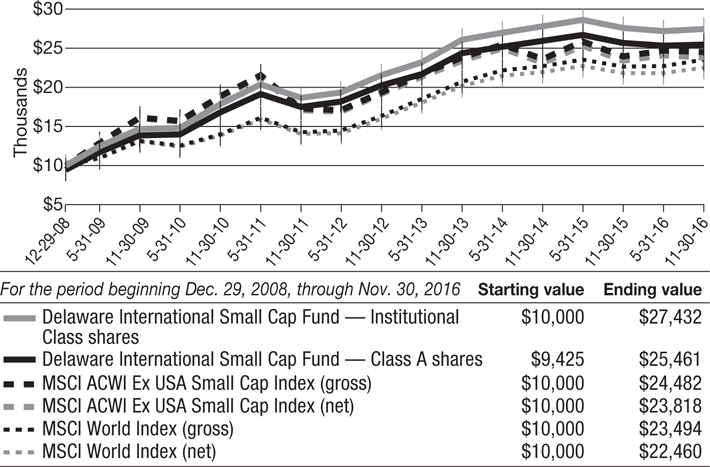
1 The “Performance of a $10,000 investment” graph assumes $10,000 invested in Institutional Class and Class A shares of the Fund on Dec. 29, 2008, and includes the effect of a 5.75% front-end sales charge and the reinvestment of all distributions. The graph does not reflect the deduction of taxes the shareholders would pay on Fund distributions or redemptions of Fund shares. Expense limitations were in effect for some or all of the periods shown. Performance would have been lower had expense limitations not been in effect. Expenses are listed in the “Fund expense ratios” table on page 5. Please note additional details on pages 4 through 7.
The graph also assumes $10,000 invested in the MSCI ACWI ex USA Small Cap Index and the MSCI World Index as of Dec. 29, 2008. The MSCI ACWI ex USA Small Cap Index captures small-cap representation across 22 of 23 developed market
countries (excluding the United States) and 23 emerging market countries. The index covers approximately 14% of the global equity opportunity set outside the U.S. Index “gross” return approximates the maximum possible dividend reinvestment. Index “net” return approximates the minimum possible dividend reinvestment, after deduction of withholding tax at the highest possible rate.
The MSCI World Index is a free float-adjusted market capitalization weighted index designed to measure equity market performance across developed markets worldwide. Index “gross” return approximates the maximum possible dividend reinvestment. Index “net” return approximates the minimum possible dividend reinvestment, after deduction of withholding tax at the highest possible rate.
| 6 |
Table of Contents
The S&P 500 Index, mentioned on page 1, measures the performance of 500 mostly large-cap stocks weighted by market value, and is often used to represent performance of the U.S. stock market.
The MSCI EAFE (Europe, Australasia, Far East) Index, mentioned on page 2, is a free float-adjusted market capitalization weighted index designed to measure equity market performance of developed markets, excluding the United States and Canada. Index “net” return approximates the minimum possible dividend reinvestment, after deduction of withholding tax at the highest possible rate.
The MSCI Emerging Markets Index, mentioned on page 2, is a free float-adjusted market capitalization index designed to measure equity market performance across emerging market countries worldwide. Index “net” return approximates the minimum possible dividend reinvestment, after deduction of withholding tax at the highest possible rate.
Index performance returns do not reflect any management fees, transaction costs, or expenses. Indices are unmanaged and one cannot invest directly in an index. Past performance is not a guarantee of future results.
Performance of other Fund classes will vary due to different charges and expenses.
| Nasdaq symbols | CUSIPs | |||||
Class A | DGGAX | 246118541 | ||||
Class C | DGGCX | 246118533 | ||||
Class R | DGGRX | 246118525 | ||||
Institutional Class
| DGGIX
| 246118517
|
| 7 |
Table of Contents
| Disclosure of Fund expenses | ||
| For the six-month period from June 1, 2016 to November 30, 2016 (Unaudited) |
As a shareholder of the Fund, you incur two types of costs: (1) transaction costs, including sales charges (loads) on purchase payments, reinvested dividends, or other distributions; redemption fees; and exchange fees; and (2) ongoing costs, including management fees; distribution and/or service (12b-1) fees; and other Fund expenses. This example is intended to help you understand your ongoing costs (in dollars) of investing in the Fund and to compare these costs with the ongoing costs of investing in other mutual funds.
The example is based on an investment of $1,000 invested at the beginning of the period and held for the entire six-month period from June 1, 2016 to Nov. 30, 2016.
Actual expenses
The first section of the table shown, “Actual Fund return,” provides information about actual account values and actual expenses. You may use the information in this section of the table, together with the amount you invested, to estimate the expenses that you paid over the period. Simply divide your account value by $1,000 (for example, an $8,600 account value divided by $1,000 = 8.6), then multiply the result by the number in the first section under the heading entitled “Expenses Paid During Period” to estimate the expenses you paid on your account during this period.
Hypothetical example for comparison purposes
The second section of the table shown, “Hypothetical 5% return,” provides information about hypothetical account values and hypothetical expenses based on the Fund’s actual expense ratio and an assumed rate of return of 5% per year before expenses, which is not the Fund’s actual return. The hypothetical account values and expenses may not be used to estimate the actual ending account balance or expenses you paid for the period. You may use this information to compare the ongoing costs of investing in the Fund and other funds. To do so, compare this 5% hypothetical example with the 5% hypothetical examples that appear in the shareholder reports of the other funds.
Please note that the expenses shown in the table are meant to highlight your ongoing costs only and do not reflect any transactional costs, such as sales charges (loads), redemption fees, or exchange fees. Therefore, the second section of the table is useful in comparing ongoing costs only, and will not help you determine the relative total costs of owning different funds. In addition, if these transactional costs were included, your costs would have been higher. The expenses shown in the table assume reinvestment of all dividends and distributions.
| 8 |
Table of Contents
Delaware International Small Cap Fund
Expense analysis of an investment of $1,000
Beginning
Account Value
6/1/16 | Ending
Account Value
11/30/16 | Annualized
Expense Ratio | Expenses
Paid During Period
6/1/16 to 11/30/16* | |||||||||||||
Actual Fund return† | ||||||||||||||||
Class A | $ | 1,000.00 | $ | 1,011.20 | 1.51% | $7.59 | ||||||||||
Class C | 1,000.00 | 1,007.70 | 2.26% | 11.34 | ||||||||||||
Class R | 1,000.00 | 1,009.70 | 1.76% | 8.84 | ||||||||||||
Institutional Class | 1,000.00 | 1,013.10 | 1.26% | 6.34 | ||||||||||||
Hypothetical 5% return (5% return before expenses) |
| |||||||||||||||
Class A | $ | 1,000.00 | $ | 1,017.45 | 1.51% | $7.62 | ||||||||||
Class C | 1,000.00 | 1,013.70 | 2.26% | 11.38 | ||||||||||||
Class R | 1,000.00 | 1,016.20 | 1.76% | 8.87 | ||||||||||||
Institutional Class | 1,000.00 | 1,018.70 | 1.26% | 6.36 | ||||||||||||
| * | “Expenses Paid During Period” are equal to the Fund’s annualized expense ratio, multiplied by the average account value over the period, multiplied by 183/366 (to reflect the one-half year period). |
| † | Because actual returns reflect only the most recent six-month period, the returns shown may differ significantly from fiscal year returns. |
| 9 |
Table of Contents
| Security type / country and sector allocations | ||
| Delaware International Small Cap Fund | As of November 30, 2016 (Unaudited) | |
Sector designations may be different than the sector designations presented in other Fund materials. The sector designations may represent the investment manager’s internal sector classifications.
| Security type / country | Percentage of net assets | |||
Common Stock by Country | 99.35% | |||
Australia | 5.44% | |||
Austria | 2.37% | |||
Canada | 7.33% | |||
China/Hong Kong | 10.04% | |||
Denmark | 1.13% | |||
Faroe Islands | 1.65% | |||
Finland | 2.58% | |||
France | 5.19% | |||
Germany | 2.32% | |||
Indonesia | 1.14% | |||
Italy | 5.49% | |||
Japan | 26.36% | |||
Netherlands | 1.97% | |||
Norway | 2.81% | |||
Spain | 0.55% | |||
Sweden | 3.88% | |||
Switzerland | 8.06% | |||
United Kingdom | 11.04% | |||
Short-Term Investments | 2.52% | |||
Total Value of Securities | 101.87% | |||
Liabilities Net of Receivables and Other Assets | (1.87%) | |||
Total Net Assets | 100.00% | |||
| 10 |
Table of Contents
Common stock by sector | Percentage of net assets | |||
Consumer Discretionary | 20.24% | |||
Consumer Staples | 10.48% | |||
Energy | 4.47% | |||
Financials | 4.22% | |||
Healthcare | 3.74% | |||
Industrials | 17.43% | |||
Information Technology | 17.70% | |||
Materials | 17.58% | |||
Real Estate | 3.49% | |||
Total | 99.35% |
| 11 |
Table of Contents
| Schedule of investments | ||
| Delaware International Small Cap Fund | November 30, 2016 |
| Number of shares | Value (U.S. $) | |||||||
| ||||||||
Common Stock – 99.35%D | ||||||||
| ||||||||
Australia – 5.44% | ||||||||
Aristocrat Leisure | 113,295 | $ | 1,254,940 | |||||
Bellamy’s Australia | 19,298 | 175,283 | ||||||
BlueScope Steel | 63,593 | 423,581 | ||||||
Star Entertainment Group | 49,398 | 192,604 | ||||||
|
| |||||||
| 2,046,408 | ||||||||
|
| |||||||
Austria – 2.37% | ||||||||
Buwog † | 14,136 | 328,481 | ||||||
Lenzing | 4,401 | 562,060 | ||||||
|
| |||||||
| 890,541 | ||||||||
|
| |||||||
Canada – 7.33% | ||||||||
Birchcliff Energy † | 64,600 | 436,662 | ||||||
Descartes Systems Group † | 25,000 | 555,163 | ||||||
Enerplus | 11,821 | 102,256 | ||||||
Norbord | 19,100 | 478,033 | ||||||
Pan American Silver | 19,400 | 326,823 | ||||||
Parex Resources † | 28,100 | 366,913 | ||||||
Raging River Exploration † | 26,000 | 205,747 | ||||||
Silver Standard Resources † | 28,600 | 282,955 | ||||||
|
| |||||||
| 2,754,552 | ||||||||
|
| |||||||
China/Hong Kong – 10.04% | ||||||||
Lee & Man Paper Manufacturing | 540,000 | 414,929 | ||||||
Man Wah Holdings | 826,000 | 576,118 | ||||||
Shougang Fushan Resources Group | 1,816,000 | 390,991 | ||||||
Sinotrans Shipping † | 1,902,000 | 411,959 | ||||||
Sunny Optical Technology Group Co. | 178,000 | 896,139 | ||||||
Tongda Group Holdings | 3,680,000 | 1,081,725 | ||||||
|
| |||||||
| 3,771,861 | ||||||||
|
| |||||||
Denmark – 1.13% | ||||||||
Dfds | 5,000 | 205,830 | ||||||
Spar Nord Bank | 20,897 | 218,783 | ||||||
|
| |||||||
| 424,613 | ||||||||
|
| |||||||
Faroe Islands – 1.65% | ||||||||
Bakkafrost | 14,743 | 621,673 | ||||||
|
| |||||||
| 621,673 | ||||||||
|
| |||||||
Finland – 2.58% | ||||||||
Huhtamaki | 10,691 | 402,246 | ||||||
Valmet | 37,096 | 566,546 | ||||||
|
| |||||||
| 968,792 | ||||||||
|
| |||||||
France – 5.19% | ||||||||
Criteo ADR † | 10,675 | 440,557 | ||||||
| 12 |
Table of Contents
| Number of shares | Value (U.S. $) | |||||||
| ||||||||
Common StockD (continued) | ||||||||
| ||||||||
France (continued) | ||||||||
Elior Group Loan 144A # | 10,000 | $ | 207,466 | |||||
Remy Cointreau | 7,191 | 603,842 | ||||||
Teleperformance | 7,173 | 700,476 | ||||||
|
| |||||||
| 1,952,341 | ||||||||
Germany – 2.32% | ||||||||
Gerresheimer | 2,200 | 160,535 | ||||||
Nemetschek | 4,878 | 270,130 | ||||||
Scout24 144A #† | 4,172 | 150,117 | ||||||
Sixt | 5,526 | 291,255 | ||||||
| 872,037 | ||||||||
Indonesia – 1.14% | ||||||||
Waskita Karya Persero | 2,278,300 | 428,679 | ||||||
| 428,679 | ||||||||
Italy – 5.49% | ||||||||
Amplifon | 44,155 | 423,519 | ||||||
Brembo | 12,353 | 708,295 | ||||||
Buzzi Unicem | 35,765 | 760,006 | ||||||
Moncler | 10,636 | 172,921 | ||||||
| 2,064,741 | ||||||||
Japan – 26.36% | ||||||||
Ain Holdings | 6,400 | 446,974 | ||||||
Daifuku Co. | 11,400 | 220,218 | ||||||
FP | 12,000 | 596,827 | ||||||
Fujikura | 65,000 | 350,553 | ||||||
Fukuoka Financial Group | 92,000 | 398,059 | ||||||
Gurunavi | 17,800 | 377,455 | ||||||
Harmonic Drive Systems | 14,300 | 376,858 | ||||||
Ichigo | 257,400 | 983,207 | ||||||
Matsumotokiyoshi Holdings Co. | 8,600 | 410,437 | ||||||
Seria Co. | 8,500 | 610,725 | ||||||
Shimizu | 86,000 | 792,308 | ||||||
SMS Co. | 16,200 | 404,699 | ||||||
Start Today Co. | 81,015 | 1,244,206 | ||||||
Sugi Holdings Co. | 7,200 | 336,069 | ||||||
TechnoPro Holdings | 15,600 | 495,660 | ||||||
Temp Holdings Co. | 43,200 | 665,342 | ||||||
Trusco Nakayama | 8,800 | 398,444 | ||||||
Yonex Co. | 5,500 | 263,450 | ||||||
Zenkoku Hosho Co. | 15,800 | 535,160 | ||||||
| 9,906,651 | ||||||||
Netherlands – 1.97% | ||||||||
Corbion | 18,155 | 450,253 | ||||||
| 13 |
Table of Contents
| Schedule of investments | ||
| Delaware International Small Cap Fund |
| Number of shares | Value (U.S. $) | |||||||
| ||||||||
Common StockD (continued) | ||||||||
| ||||||||
Netherlands (continued) | ||||||||
Wessanen | 24,254 | $ | 291,116 | |||||
|
| |||||||
| 741,369 | ||||||||
Norway – 2.81% | ||||||||
Norway Royal Salmon | 9,195 | 214,925 | ||||||
Salmar | 8,721 | 273,501 | ||||||
TGS Nopec Geophysical Co. | 28,868 | 567,276 | ||||||
|
| |||||||
| 1,055,702 | ||||||||
|
| |||||||
Spain – 0.55% | ||||||||
Cie Automotive | 11,096 | 206,625 | ||||||
|
| |||||||
| 206,625 | ||||||||
|
| |||||||
Sweden – 3.88% | ||||||||
Axactor † | 1,214,435 | 435,067 | ||||||
Scandic Hotels Group 144A #† | 50,155 | 394,266 | ||||||
SSAB Class A † | 162,586 | 628,463 | ||||||
|
| |||||||
| 1,457,796 | ||||||||
|
| |||||||
Switzerland – 8.06% | ||||||||
Autoneum Holding | 1,956 | 486,739 | ||||||
Forbo Holding Class REG † | 320 | 412,629 | ||||||
Georg Fischer Class REG | 757 | 647,772 | ||||||
Logitech International Class R | 10,055 | 247,741 | ||||||
Temenos Group Class REG † | 11,945 | 827,115 | ||||||
Ypsomed Holding Class REG † | 2,176 | 406,221 | ||||||
|
| |||||||
| 3,028,217 | ||||||||
|
| |||||||
United Kingdom – 11.04% | ||||||||
Abcam | 40,276 | 417,509 | ||||||
boohoo.com † | 297,974 | 466,031 | ||||||
Dignity | 6,529 | 199,408 | ||||||
Domino’s Pizza Group | 48,214 | 211,139 | ||||||
Fevertree Drinks | 42,085 | 563,427 | ||||||
Halma | 27,680 | 326,591 | ||||||
Just Eat † | 98,780 | 723,640 | ||||||
Micro Focus International | 13,276 | 350,657 | ||||||
RPC Group | 66,019 | 889,634 | ||||||
|
| |||||||
| 4,148,036 | ||||||||
|
| |||||||
Total Common Stock (cost $36,996,235) | 37,340,634 | |||||||
|
| |||||||
| 14 |
Table of Contents
| Principal amount° | Value (U.S. $) | |||||||
| ||||||||
Short-Term Investments – 2.52% | ||||||||
| ||||||||
Repurchase Agreements – 2.52% | ||||||||
Bank of America Merrill Lynch | ||||||||
0.22%, dated 11/30/16, to be repurchased on 12/1/16, repurchase price $348,090 (collateralized by U.S. government obligations 2.625% 7/15/17;market value $355,049) | 348,088 | $ | 348,088 | |||||
Bank of Montreal | ||||||||
0.25%, dated 11/30/16, to be repurchased on 12/1/16, repurchase price $580,150 (collateralized by U.S. government obligations 1.125%–3.75% 1/15/17–8/15/45; market value $591,749) | 580,146 | 580,146 | ||||||
BNP Paribas | ||||||||
0.27%, dated 11/30/16, to be repurchased on 12/1/16, repurchase price $17,767 (collateralized by U.S. government obligations 3.00% 11/15/45; market value $18,122) | 17,766 | 17,766 | ||||||
|
| |||||||
Total Short-Term Investments (cost $946,000) | 946,000 | |||||||
|
| |||||||
Total Value of Securities – 101.87% | $ | 38,286,634 | ||||||
|
| |||||||
| # | Security exempt from registration under Rule 144A of the Securities Act of 1933, as amended. At Nov. 30, 2016, the aggregate value of Rule 144A securities was $751,849, which represents 2.00% of the Fund’s net assets. See Note 11 in “Notes to financial statements.” |
| ° | Principal amount shown is stated in U.S. dollars unless noted that the security is denominated in another currency. |
| D | Securities have been classified by country of origin. Aggregate classification by business sectors has been presented on page 10 in “Security type / country and sector allocations.” |
| † | Non-income-producing security. |
| 15 |
Table of Contents
| Schedule of investments | ||
| Delaware International Small Cap Fund |
The following foreign currency exchange contracts were outstanding at Nov. 30, 2016:1
Foreign Currency Exchange Contracts
Counterparty | Contracts to Receive (Deliver) | In Exchange For | Settlement Date | Unrealized Appreciation (Depreciation) | ||||||||||||||||||||
BNYM | AUD | 2,825,957 | USD | (2,105,451 | ) | 12/2/16 | $ | (18,744 | ) | |||||||||||||||
BNYM | HKD | 29,776,494 | USD | (3,839,326 | ) | 12/2/16 | (384 | ) | ||||||||||||||||
BNYM | HKD | (9,021,365 | ) | USD | 1,163,199 | 12/2/16 | 116 | |||||||||||||||||
BNYM | JPY | (786,042 | ) | USD | 6,879 | 12/5/16 | 8 | |||||||||||||||||
|
| |||||||||||||||||||||||
| $ | (19,004 | ) | ||||||||||||||||||||||
|
| |||||||||||||||||||||||
The use of foreign currency exchange contracts involves elements of market risk and risks in excess of the amounts disclosed in the financial statements. The foreign currency exchange contracts presented above represent the Fund’s total exposure in such contracts, whereas only the net unrealized appreciation (depreciation) is reflected in the Fund’s net assets.
1See Note 8 in “Notes to financial statements.”
Summary of abbreviations:
ADR – American Depositary Receipt
AUD – Australian Dollar
BNYM – BNY Mellon
HKD – Hong Kong Dollar
JPY – Japanese Yen
USD – U.S. Dollar
See accompanying notes, which are an integral part of the financial statements.
| 16 |
Table of Contents
This page intentionally left blank.
Table of Contents
| Statement of assets and liabilities | ||
| Delaware International Small Cap Fund | November 30, 2016 |
Assets: | ||||
Investments, at value1 | $ | 37,340,634 | ||
Short-term investments, at value2 | 946,000 | |||
Foreign currencies, at value3 | 151,150 | |||
Cash | 966 | |||
Receivable for securities sold | 40,500,786 | |||
Dividends and interest receivable | 44,742 | |||
Receivable for fund shares sold | 10,951 | |||
Foreign tax reclaims receivable | 74,541 | |||
Unrealized appreciation on foreign currency exchange contracts | 124 | |||
|
| |||
Total assets | 79,069,894 | |||
|
| |||
Liabilities: | ||||
Payable for securities purchased | 36,398,640 | |||
Payable for fund shares redeemed | 4,953,354 | |||
Other accrued expenses | 99,962 | |||
Distribution fees payable to affiliates | 6,934 | |||
Investment management fees payable to affiliates | 5,963 | |||
Unrealized depreciation on foreign currency exchange contracts | 19,128 | |||
Dividend disbursing and transfer agent fees and expenses payable to affiliates | 793 | |||
Trustees’ fees and expenses payable | 413 | |||
Reports and statements to shareholders expenses payable to affiliates | 30 | |||
Accounting and administration expenses payable to affiliates | 184 | |||
Legal fees payable to affiliates | 105 | |||
|
| |||
Total liabilities | 41,485,506 | |||
|
| |||
Total Net Assets | $ | 37,584,388 | ||
|
| |||
Net Assets Consist of: | ||||
Paid-in capital | $ | 21,340,566 | ||
Distributions in excess of net investment income | (8 | ) | ||
Accumulated net realized gain on investments | 15,926,653 | |||
Net unrealized appreciation of investments | 344,399 | |||
Net unrealized depreciation of foreign currencies | (8,218 | ) | ||
Net unrealized depreciation of foreign currency exchange contracts | (19,004 | ) | ||
|
| |||
Total Net Assets | $ | 37,584,388 | ||
|
| |||
| 18 |
Table of Contents
Net Asset Value | ||||
Class A: | ||||
Net assets | $ | 15,158,556 | ||
Shares of beneficial interest outstanding, unlimited authorization, no par | 796,621 | |||
Net asset value per share | $ | 19.03 | ||
Sales charge | 5.75 | % | ||
Offering price per share, equal to net asset value per share / (1 – sales charge) | $ | 20.19 | ||
Class C: | ||||
Net assets | $ | 4,416,624 | ||
Shares of beneficial interest outstanding, unlimited authorization, no par | 242,140 | |||
Net asset value per share | $ | 18.24 | ||
Class R: | ||||
Net assets | $ | 50,852 | ||
Shares of beneficial interest outstanding, unlimited authorization, no par | 2,709 | |||
Net asset value per share | $ | 18.77 | ||
Institutional Class: | ||||
Net assets | $ | 17,958,356 | ||
Shares of beneficial interest outstanding, unlimited authorization, no par | 931,707 | |||
Net asset value per share | $ | 19.27 | ||
1Investments, at cost | $ | 36,996,235 | ||
2Short-term investments, at cost | 946,000 | |||
3Foreign currencies, at cost | 149,877 | |||
See accompanying notes, which are an integral part of the financial statements.
| 19 |
Table of Contents
| Statement of operations | ||
| Delaware International Small Cap Fund | Year ended November 30, 2016 |
Investment Income: | ||||
Dividends | $ | 1,480,768 | ||
Interest | 4,687 | |||
Foreign tax withheld | (57,250 | ) | ||
|
| |||
| 1,428,205 | ||||
|
| |||
Expenses: | ||||
Management fees | 871,646 | |||
Distribution expenses – Class A | 51,335 | |||
Distribution expenses – Class C | 49,515 | |||
Distribution expenses – Class R | 275 | |||
Dividend disbursing and transfer agent fees and expenses | 139,149 | |||
Legal fees | 62,415 | |||
Audit and tax fees | 54,677 | |||
Registration fees | 44,222 | |||
Reports and statements to shareholders | 38,658 | |||
Accounting and administration expenses | 33,058 | |||
Custodian fees | 25,468 | |||
Trustees’ fees and expenses | 5,162 | |||
Other | 15,509 | |||
|
| |||
| 1,391,089 | ||||
Less expenses waived | (29,573 | ) | ||
Less expense paid indirectly | (103 | ) | ||
|
| |||
Total operating expenses | 1,361,413 | |||
|
| |||
Net Investment Income | 66,792 | |||
|
| |||
Net Realized and Unrealized Gain (Loss): | ||||
Net realized gain (loss) on: | ||||
Investments | 16,361,366 | |||
Foreign currencies | (65,164 | ) | ||
Foreign currency exchange contracts | 20,320 | |||
|
| |||
Net realized gain | 16,316,522 | |||
|
| |||
Net change in unrealized appreciation (depreciation) of: | ||||
Investments | (15,969,757 | ) | ||
Foreign currencies | 8,108 | |||
Foreign currency exchange contracts | (18,227 | ) | ||
|
| |||
Net change in unrealized appreciation (depreciation) | (15,979,876 | ) | ||
|
| |||
Net Realized and Unrealized Gain | 336,646 | |||
|
| |||
Net Increase in Net Assets Resulting from Operations | $ | 403,438 | ||
|
| |||
| See | accompanying notes, which are an integral part of the financial statements. |
| 20 |
Table of Contents
This page intentionally left blank.
Table of Contents
| Statements of changes in net assets | ||
| Delaware International Small Cap Fund |
| Year ended | ||||||||
| 11/30/16 | 11/30/15 | |||||||
Increase (Decrease) in Net Assets from Operations: | ||||||||
Net investment income (loss) | $ | 66,792 | $ | (105,259 | ) | |||
Net realized gain | 16,316,522 | 5,824,654 | ||||||
Net change in unrealized appreciation (depreciation) | (15,979,876 | ) | (6,599,389 | ) | ||||
|
|
|
| |||||
Net increase (decrease) in net assets resulting from operations | 403,438 | (879,994 | ) | |||||
|
|
|
| |||||
Dividends and Distributions to Shareholders from: | ||||||||
Net investment income: | ||||||||
Class A | — | (109,681 | ) | |||||
Class R | — | (217 | ) | |||||
Institutional Class | — | (605,037 | ) | |||||
Net realized gain: | ||||||||
Class A | (908,814 | ) | — | |||||
Class C | (192,191 | ) | — | |||||
Class R | (1,918 | ) | — | |||||
Institutional Class | (3,094,350 | ) | — | |||||
|
|
|
| |||||
| (4,197,273 | ) | (714,935 | ) | |||||
|
|
|
| |||||
Capital Share Transactions: | ||||||||
Proceeds from shares sold: | ||||||||
Class A | 3,595,888 | 3,949,273 | ||||||
Class C | 506,935 | 1,211,543 | ||||||
Class R | 3,856 | 31,354 | ||||||
Institutional Class | 8,282,179 | 15,465,793 | ||||||
Net asset value of shares issued upon reinvestment of dividends and distributions: | ||||||||
Class A | 847,004 | 101,162 | ||||||
Class C | 191,962 | — | ||||||
Class R | 1,917 | 217 | ||||||
Institutional Class | 3,094,111 | 605,037 | ||||||
|
|
|
| |||||
| 16,523,852 | 21,364,379 | |||||||
|
|
|
| |||||
| 22 |
Table of Contents
| Year ended | ||||||||
| 11/30/16 | 11/30/15 | |||||||
Capital Share Transactions (continued): | ||||||||
Cost of shares redeemed: | ||||||||
Class A | $ | (14,864,370 | ) | $ | (5,194,785 | ) | ||
Class C | (1,434,702 | ) | (1,432,163 | ) | ||||
Class R | (59,568 | ) | (63,876 | ) | ||||
Institutional Class | (85,410,690 | ) | (19,739,221 | ) | ||||
|
|
|
| |||||
| (101,769,330 | ) | (26,430,045 | ) | |||||
|
|
|
| |||||
Decrease in net assets derived from capital share transactions | (85,245,478 | ) | (5,065,666 | ) | ||||
|
|
|
| |||||
Net Decrease in Net Assets | (89,039,313 | ) | (6,660,595 | ) | ||||
Net Assets: | ||||||||
Beginning of year | 126,623,701 | 133,284,296 | ||||||
|
|
|
| |||||
End of year | $ | 37,584,388 | $ | 126,623,701 | ||||
|
|
|
| |||||
Distributions in excess of net investment income | $ | (8 | ) | $ | (35,227 | ) | ||
|
|
|
| |||||
See accompanying notes, which are an integral part of the financial statements.
| 23 |
Table of Contents
| Financial highlights | ||
| Delaware International Small Cap Fund Class A |
Selected data for each share of the Fund outstanding throughout each period were as follows:
Net asset value, beginning of period |
Income (loss) from investment operations: |
Net investment income (loss)1 |
Net realized and unrealized gain (loss) |
Total from investment operations |
Less dividends and distributions from: |
Net investment income |
Net realized gain |
Total dividends and distributions |
Net asset value, end of period |
Total return2 |
Ratios and supplemental data: |
Net assets, end of period (000 omitted) |
Ratio of expenses to average net assets |
Ratio of expenses to average net assets prior to fees waived |
Ratio of net investment income (loss) to average net assets |
Ratio of net investment income (loss) to average net assets prior to fees waived |
Portfolio turnover |
| 1 | The average shares outstanding method has been applied for per share information. |
| 2 | Total investment return is based on the change in net asset value of a share during the period and assumes reinvestment of dividends and distributions at net asset value and does not reflect the impact of a sales charge. Total investment return during some of the periods shown reflects a waiver by the manager and/or distributor. Performance would have been lower had the waiver not been in effect. |
See accompanying notes, which are an integral part of the financial statements.
24
Table of Contents
| Year ended | ||||||||||||||||||||||||||||||||||
|
| |||||||||||||||||||||||||||||||||
| 11/30/16 | 11/30/15 | 11/30/14 | 11/30/13 | 11/30/12 | ||||||||||||||||||||||||||||||
| ||||||||||||||||||||||||||||||||||
| $ | 19.780 | $ | 20.060 | $ | 19.180 | $ | 15.900 | $ | 13.880 | |||||||||||||||||||||||||
| (0.016 | ) | (0.046 | ) | 0.104 | 0.031 | (0.002 | ) | |||||||||||||||||||||||||||
| (0.066 | ) | (0.158 | ) | 1.099 | 3.249 | 2.133 | ||||||||||||||||||||||||||||
|
|
|
|
|
|
|
|
|
| |||||||||||||||||||||||||
| (0.082 | ) | (0.204 | ) | 1.203 | 3.280 | 2.131 | ||||||||||||||||||||||||||||
|
|
|
|
|
|
|
|
|
| |||||||||||||||||||||||||
| — | (0.076 | ) | — | — | — | |||||||||||||||||||||||||||||
| (0.668 | ) | — | (0.323 | ) | — | (0.111 | ) | |||||||||||||||||||||||||||
|
|
|
|
|
|
|
|
|
| |||||||||||||||||||||||||
| (0.668 | ) | (0.076 | ) | (0.323 | ) | — | (0.111 | ) | ||||||||||||||||||||||||||
|
|
|
|
|
|
|
|
|
| |||||||||||||||||||||||||
| $ | 19.030 | $ | 19.780 | $ | 20.060 | $ | 19.180 | $ | 15.900 | |||||||||||||||||||||||||
|
|
|
|
|
|
|
|
|
| |||||||||||||||||||||||||
| (0.38% | ) | (1.02%) | 6.37% | 20.63% | 15.49% | |||||||||||||||||||||||||||||
| $ | 15,158 | $ | 27,046 | $ | 28,583 | $ | 46,830 | $ | 16,753 | |||||||||||||||||||||||||
| 1.48% | 1.45% | 1.40% | 1.51% | 1.55% | ||||||||||||||||||||||||||||||
| 1.51% | 1.45% | 1.40% | 1.55% | 1.76% | ||||||||||||||||||||||||||||||
| (0.09% | ) | (0.23%) | 0.54% | 0.18% | (0.02%) | |||||||||||||||||||||||||||||
| (0.12% | ) | (0.23%) | 0.54% | 0.14% | (0.23%) | |||||||||||||||||||||||||||||
| 66% | 41% | 26% | 36% | 37% | ||||||||||||||||||||||||||||||
25
Table of Contents
| Financial highlights | ||
| Delaware International Small Cap Fund Class C |
Selected data for each share of the Fund outstanding throughout each period were as follows:
Net asset value, beginning of period |
Income (loss) from investment operations: |
Net investment loss1 |
Net realized and unrealized gain (loss) |
Total from investment operations. |
Less dividends and distributions from: |
Net realized gain |
Total dividends and distributions |
Net asset value, end of period |
Total return2 |
Ratios and supplemental data: |
Net assets, end of period (000 omitted) |
Ratio of expenses to average net assets |
Ratio of expenses to average net assets prior to fees waived |
Ratio of net investment loss to average net assets |
Ratio of net investment loss to average net assets prior to fees waived |
Portfolio turnover |
| 1 | The average shares outstanding method has been applied for per share information. |
| 2 | Total investment return is based on the change in net asset value of a share during the period and assumes reinvestment of dividends and distributions at net asset value and does not reflect the impact of a sales charge. Total investment return during some of the periods shown reflect a waiver by the manager. Performance would have been lower had the waiver not been in effect. |
See accompanying notes, which are an integral part of the financial statements.
26
Table of Contents
| Year ended | ||||||||||||||||||||||||||||
|
| |||||||||||||||||||||||||||
| 11/30/16 | 11/30/15 | 11/30/14 | 11/30/13 | 11/30/12 | ||||||||||||||||||||||||
| ||||||||||||||||||||||||||||
| $ | 19.130 | $ | 19.470 | $ | 18.760 | $ | 15.670 | $ | 13.780 | |||||||||||||||||||
| (0.151 | ) | (0.189 | ) | (0.039 | ) | (0.097 | ) | (0.113 | ) | |||||||||||||||||||
| (0.071 | ) | (0.151 | ) | 1.072 | 3.187 | 2.114 | ||||||||||||||||||||||
|
|
|
|
|
|
|
|
|
| |||||||||||||||||||
| (0.222 | ) | (0.340 | ) | 1.033 | 3.090 | 2.001 | ||||||||||||||||||||||
|
|
|
|
|
|
|
|
|
| |||||||||||||||||||
| (0.668 | ) | — | (0.323 | ) | — | (0.111 | ) | |||||||||||||||||||||
|
|
|
|
|
|
|
|
|
| |||||||||||||||||||
| (0.668 | ) | — | (0.323 | ) | — | (0.111 | ) | |||||||||||||||||||||
|
|
|
|
|
|
|
|
|
| |||||||||||||||||||
| $ | 18.240 | $ | 19.130 | $ | 19.470 | $ | 18.760 | $ | 15.670 | |||||||||||||||||||
| (1.15% | ) | (1.75% | ) | 5.59% | 19.72% | 14.66% | ||||||||||||||||||||||
| $ | 4,417 | $ | 5,424 | $ | 5,759 | $ | 5,863 | $ | 1,594 | |||||||||||||||||||
| 2.23% | 2.20% | 2.15% | 2.26% | 2.30% | ||||||||||||||||||||||||
| 2.26% | 2.20% | 2.15% | 2.26% | 2.46% | ||||||||||||||||||||||||
| (0.84% | ) | (0.98% | ) | (0.21% | ) | (0.57% | ) | (0.77% | ) | |||||||||||||||||||
| (0.87% | ) | (0.98% | ) | (0.21% | ) | (0.57% | ) | (0.93% | ) | |||||||||||||||||||
| 66% | 41% | 26% | 36% | 37% | ||||||||||||||||||||||||
27
Table of Contents
| Financial highlights | ||
| Delaware International Small Cap Fund Class R |
Selected data for each share of the Fund outstanding throughout each period were as follows:
Net asset value, beginning of period |
Income (loss) from investment operations: |
Net investment income (loss)1 |
Net realized and unrealized gain (loss) |
Total from investment operations. |
Less dividends and distributions from: |
Net investment income |
Net realized gain |
Total dividends and distributions |
Net asset value, end of period |
Total return2 |
Ratios and supplemental data: |
Net assets, end of period (000 omitted) |
Ratio of expenses to average net assets |
Ratio of expenses to average net assets prior to fees waived |
Ratio of net investment income (loss) to average net assets |
Ratio of net investment income (loss) to average net assets prior to fees waived |
Portfolio turnover |
| 1 | The average shares outstanding method has been applied for per share information. |
| 2 | Total investment return is based on the change in net asset value of a share during the period and assumes reinvestment of dividends and distributions at net asset value. Total investment return during some of the periods shown reflects waivers by the manager and/or distributor. Performance would have been lower had the waivers not been in effect. |
See accompanying notes, which are an integral part of the financial statements.
28
Table of Contents
| Year ended | ||||||||||||||||||||||||||||
|
| |||||||||||||||||||||||||||
| 11/30/16 | 11/30/15 | 11/30/14 | 11/30/13 | 11/30/12 | ||||||||||||||||||||||||
| ||||||||||||||||||||||||||||
| $ | 19.570 | $ | 19.850 | $ | 19.030 | $ | 15.810 | $ | 13.840 | |||||||||||||||||||
| (0.063 | ) | (0.095 | ) | 0.056 | (0.013 | ) | (0.040 | ) | ||||||||||||||||||||
| (0.069 | ) | (0.157 | ) | 1.087 | 3.233 | 2.121 | ||||||||||||||||||||||
|
|
|
|
|
|
|
|
|
| |||||||||||||||||||
| (0.132 | ) | (0.252 | ) | 1.143 | 3.220 | 2.081 | ||||||||||||||||||||||
|
|
|
|
|
|
|
|
|
| |||||||||||||||||||
| — | (0.028 | ) | — | — | — | |||||||||||||||||||||||
| (0.668 | ) | — | (0.323 | ) | — | (0.111 | ) | |||||||||||||||||||||
|
|
|
|
|
|
|
|
|
| |||||||||||||||||||
| (0.668 | ) | (0.028 | ) | (0.323 | ) | — | (0.111 | ) | ||||||||||||||||||||
|
|
|
|
|
|
|
|
|
| |||||||||||||||||||
| $ | 18.770 | $ | 19.570 | $ | 19.850 | $ | 19.030 | $ | 15.810 | |||||||||||||||||||
|
|
|
|
|
|
|
|
|
| |||||||||||||||||||
| (0.65% | ) | (1.27% | ) | 6.10% | 20.37% | 15.17% | ||||||||||||||||||||||
| $ | 51 | $ | 107 | $ | 141 | �� | $ | 129 | $ | 61 | ||||||||||||||||||
| 1.73% | 1.70% | 1.65% | 1.76% | 1.80% | ||||||||||||||||||||||||
| 1.76% | 1.70% | 1.65% | 1.84% | 2.06% | ||||||||||||||||||||||||
| (0.34% | ) | (0.48% | ) | 0.29% | (0.07% | ) | (0.27% | ) | ||||||||||||||||||||
| (0.37% | ) | (0.48% | ) | 0.29% | (0.15% | ) | (0.53% | ) | ||||||||||||||||||||
| 66% | 41% | 26% | 36% | 37% | ||||||||||||||||||||||||
29
Table of Contents
| Financial highlights | ||
| Delaware International Small Cap Fund Institutional Class |
Selected data for each share of the Fund outstanding throughout each period were as follows:
Net asset value, beginning of period |
Income (loss) from investment operations: |
Net investment income1 |
Net realized and unrealized gain (loss) |
Total from investment operations |
Less dividends and distributions from: |
Net investment income |
Net realized gain |
Total dividends and distributions |
Net asset value, end of period |
Total return2 |
Ratios and supplemental data: |
Net assets, end of period (000 omitted) |
Ratio of expenses to average net assets |
Ratio of expenses to average net assets prior to fees waived |
Ratio of net investment income to average net assets |
Ratio of net investment income (loss) to average net assets prior to fees waived |
Portfolio turnover |
| 1 | The average shares outstanding method has been applied for per share information. |
| 2 | Total investment return is based on the change in net asset value of a share during the period and assumes reinvestment of dividends and distributions at net asset value. Total investment return during some of the periods shown reflects a waiver by the manager. Performance would have been lower had the waiver not been in effect. |
See accompanying notes, which are an integral part of the financial statements.
30
Table of Contents
Year ended | ||||||||||||||||||||||||||||||||
| 11/30/16 | 11/30/15 | 11/30/14 | 11/30/13 | 11/30/12 | ||||||||||||||||||||||||||||
| ||||||||||||||||||||||||||||||||
| $19.970 | $ | 20.250 | $ | 19.320 | $ | 15.970 | $ | 13.910 | ||||||||||||||||||||||||
| 0.031 | 0.003 | 0.154 | 0.075 | 0.035 | ||||||||||||||||||||||||||||
| (0.063) | (0.159 | ) | 1.113 | 3.275 | 2.136 | |||||||||||||||||||||||||||
|
|
|
|
|
|
|
|
| ||||||||||||||||||||||||
| (0.032) | (0.156 | ) | 1.267 | 3.350 | 2.171 | |||||||||||||||||||||||||||
|
|
|
|
|
|
|
|
| ||||||||||||||||||||||||
| — | (0.124 | ) | (0.014 | ) | — |
| —
|
| ||||||||||||||||||||||||
| (0.668) | — | (0.323 | ) | — | (0.111 | ) | ||||||||||||||||||||||||||
|
|
|
|
|
|
|
|
| ||||||||||||||||||||||||
| (0.668) | (0.124 | ) | (0.337 | ) | — | (0.111 | ) | |||||||||||||||||||||||||
|
|
|
|
|
|
|
|
| ||||||||||||||||||||||||
| $19.270 | $ | 19.970 | $ | 20.250 | $ | 19.320 | $ | 15.970 | ||||||||||||||||||||||||
|
|
|
|
|
|
|
|
| ||||||||||||||||||||||||
| (0.12%) | (0.77%) | 6.66% | 20.98% | 15.75% | ||||||||||||||||||||||||||||
| $17,958 | $ | 94,047 | $ | 98,801 | $ | 34,541 | $ | 11,699 | ||||||||||||||||||||||||
| 1.23% | 1.20% | 1.15% | 1.26% | 1.30% | ||||||||||||||||||||||||||||
| 1.26% | 1.20% | 1.15% | 1.26% | 1.46% | ||||||||||||||||||||||||||||
| 0.16% | 0.02% | 0.79% | 0.43% | 0.23% | ||||||||||||||||||||||||||||
| 0.13% | 0.02% | 0.79% | 0.43% | 0.07% | ||||||||||||||||||||||||||||
| 66% | 41% | 26% | 36% | 37% | ||||||||||||||||||||||||||||
31
Table of Contents
| Notes to financial statements | ||
Delaware International Small Cap Fund | November 30, 2016 | |
Delaware Group® Global & International Funds (Trust) is organized as a Delaware statutory trust and offers five series: Delaware Asia Select Fund (formerly, Delaware Macquarie Asia Select Fund), Delaware Emerging Markets Fund, Delaware International Small Cap Fund (formerly, Delaware Focus Global Growth Fund), Delaware Global Value Fund, and Delaware International Value Equity Fund. These financial statements and the related notes pertain to Delaware International Small Cap Fund (Fund). The Trust is an open-end investment company. The Fund is considered diversified under the Investment Company Act of 1940, as amended, and offers Class A, Class C, Class R, and Institutional Class shares. Class A shares are sold with a maximum front-end sales charge of 5.75%. Class A share purchases of $1,000,000 or more will incur a contingent deferred sales charge (CDSC) of 1.00%, if redeemed during the first year, and 0.50% during the second year, provided that Delaware Distributors, L.P. (DDLP) paid a financial advisor a commission on the purchase of those shares. Class C shares are sold with a CDSC of 1.00%, if redeemed during the first 12 months. Class R and Institutional Class shares are not subject to a sales charge and are offered for sale exclusively to certain eligible investors.
The investment objective of the Fund is to seek long-term capital appreciation.
1. Significant Accounting Policies
The following accounting policies are in accordance with U.S. generally accepted accounting principles
(U.S. GAAP) and are consistently followed by the Fund.
Security Valuation – Equity securities, except those traded on the Nasdaq Stock Market LLC (Nasdaq), are valued at the last quoted sales price as of the time of the regular close of the New York Stock Exchange on the valuation date. Equity securities traded on the Nasdaq are valued in accordance with the Nasdaq Official Closing Price, which may not be the last sales price. If, on a particular day, an equity security does not trade, the mean between the bid and ask prices will be used, which approximates fair value. Securities listed on a foreign exchange are normally valued at the last quoted sales price on the valuation date. U.S. government and agency securities are valued at the mean between the bid and ask prices, which approximates fair value. Foreign currency exchange contracts and foreign cross currency exchange contracts are valued at the mean between the bid and ask prices, which approximates fair value. Interpolated values are derived when the settlement date of the contract is an interim date for which quotations are not available. Generally, other securities and assets for which market quotations are not readily available are valued at fair value as determined in good faith under the direction of the Trust’s Board of Trustees (Board). In determining whether market quotations are readily available or fair valuation will be used, various factors will be taken into consideration, such as market closures, or suspension of trading in a security. The Fund may use fair value pricing more frequently for securities traded primarily in non-U.S. markets because, among other things, most foreign markets close well before the Fund values its securities, generally as of 4:00 p.m. Eastern time. The earlier close of these foreign markets gives rise to the possibility that significant events, including broad market moves, government actions or pronouncements, aftermarket trading, or news events may have occurred in the interim. Whenever such a significant event occurs, the Fund may value foreign securities using fair value prices based on third-party vendor modeling tools (international fair value pricing).
Federal and Foreign Income Taxes – No provision for federal income taxes has been made as the Fund intends to continue to qualify for federal income tax purposes as a regulated investment company under Subchapter M of the Internal Revenue Code of 1986, as amended, and make the requisite
32
Table of Contents
distributions to shareholders. The Fund evaluates tax positions taken or expected to be taken in the course of preparing the Fund’s tax returns to determine whether the tax positions are “more-likely-than-not” of being sustained by the applicable tax authority. Tax positions not deemed to meet the “more-likely-than-not” threshold are recorded as a tax benefit or expense in the current year. Management has analyzed the Fund’s tax positions taken for all open federal income tax years (Nov. 30, 2013–Nov. 30, 2016), and has concluded that no provision for federal income tax is required in the Fund’s financial statements. In regard to foreign taxes only, the Fund has open tax years in certain foreign countries in which it invests in that may date back to the inception of the Fund.
Class Accounting – Investment income, common expenses, and realized and unrealized gain (loss) on investments are allocated to the various classes of the Fund on the basis of daily net assets of each class. Distribution expenses relating to a specific class are charged directly to that class.
Repurchase Agreements – The Fund may purchase certain U.S. government securities subject to the counterparty’s agreement to repurchase them at an agreed upon date and price. The counterparty will be required on a daily basis to maintain the value of the collateral subject to the agreement at not less than the repurchase price (including accrued interest). The agreements are conditioned upon the collateral being deposited under the Federal Reserve book-entry system with the Fund’s custodian or a third-party sub-custodian. In the event of default or bankruptcy by the other party to the agreement, retention of the collateral may be subject to legal proceedings. All open repurchase agreements as of the date of this report were entered on Nov. 30, 2016 and matured the following business day.
Foreign Currency Transactions – Transactions denominated in foreign currencies are recorded at the prevailing exchange rates on the valuation date in accordance with the Fund’s prospectus. The value of all assets and liabilities denominated in foreign currencies is translated daily into U.S. dollars at the exchange rate of such currencies against the U.S. dollar. Transaction gains or losses resulting from changes in exchange rates during the reporting period or upon settlement of the foreign currency transaction are reported in operations for the current period. The Fund generally does not bifurcate that portion of realized gains and losses on investments which is due to changes in foreign exchange rates from that which is due to changes in market prices. These gains and losses are included on the “Statement of operations” under “Net realized and unrealized gain (loss) on investments.” The Fund reports certain foreign currency related transactions as components of realized gains (losses) for financial reporting purposes, whereas such components are treated as ordinary income (loss) for federal income tax purposes.
Use of Estimates – The Fund is an investment company, whose financial statements are prepared in conformity with U.S. GAAP. Therefore, the Fund follows the accounting and reporting guidelines for investment companies. The preparation of financial statements in conformity with U.S. GAAP requires management to make estimates and assumptions that affect the fair value of investments, the reported amounts of assets and liabilities and disclosure of contingent assets and liabilities at the date of the financial statements, and the reported amounts of revenues and expenses during the reporting period. Actual results could differ from those estimates and the differences could be material.
Other – Expenses directly attributable to the Fund are charged directly to the Fund. Other expenses common to various funds within the Delaware Investments® Family of Funds are generally allocated among such funds on the basis of average net assets. Management fees and some other expenses are
33
Table of Contents
| Notes to financial statements | ||
| Delaware International Small Cap Fund |
1. Significant Accounting Policies (continued)
paid monthly. Security transactions are recorded on the date the securities are purchased or sold (trade date) for financial reporting purposes. Costs used in calculating realized gains and losses on the sale of investment securities are those of the specific securities sold. Dividend income is recorded on the ex-dividend date and interest income is recorded on the accrual basis. Discounts and premiums on debt securities are accreted or amortized to interest income, respectively over the lives of the respective securities using the effective interest method. Foreign dividends are also recorded on the ex-dividend date or as soon after the ex-dividend date that the Fund is aware of such dividends, net of all tax withholdings, a portion of which may be reclaimable. Withholding taxes and reclaims on foreign dividends have been recorded in accordance with the Fund’s understanding of the applicable country’s tax rules and rates. The Fund pays foreign capital gain taxes on certain foreign securities held, which are reported as components of realized and unrealized losses for financial reporting purposes, whereas such components are treated as ordinary loss for federal income tax purposes. The Fund declares and pays dividends from net investment income and distributions from net realized gain on investments, if any, annually. The Fund may distribute more frequently, if necessary for tax purposes. Dividends and distributions, if any, are recorded on the ex-dividend date.
The Fund may receive earnings credits from its custodian when positive cash balances are maintained, which may be used to offset custody fees. There were no such earnings credits for the year ended Nov. 30, 2016.
The Fund receives earnings credits from its transfer agent when positive cash balances are maintained, which may be used to offset transfer agent fees. If the amount earned is greater than $1.00, the expense paid under this arrangement is included on the “Statement of operations” under “Dividend disbursing and transfer agent fees and expenses” with the corresponding expense offset shown under “Less expense paid indirectly.” For the year ended Nov. 30, 2016, the Fund earned $103 under this agreement.
2. Investment Management, Administration Agreements, and Other Transactions with Affiliates
In accordance with the terms of its investment management agreement, the Fund pays Delaware Management Company (DMC), a series of Delaware Management Business Trust and the investment manager, an annual fee which is calculated daily at the rate of 0.85% on the first $500 million of average daily net assets of the Fund, 0.80% on the next $500 million, 0.75% on the next $1.5 billion, and 0.70% on the average daily net assets in excess of $2.5 billion.
DMC has contractually agreed to waive that portion, if any, of its management fee and/or pay/reimburse the Fund to the extent necessary to ensure that total annual fund operating expenses (excluding any 12b-1 fees, acquired fund fees and expenses, taxes, interest, short sale and dividend interest expenses, brokerage fees, certain insurance costs, and nonroutine expenses or costs including, but not limited to, those relating to reorganizations, litigation, conducting shareholder meetings, and liquidations (collectively, nonroutine expenses)) do not exceed 1.30% of the Fund’s average daily net assets from Dec. 1, 2015 through Nov. 29, 2016. Effective Nov. 30, 2016, this limit was reduced to 1.18% of the Fund’s average daily net assets.* For purposes of this waiver and reimbursement, nonroutine expenses may also include such additional costs and expenses as may be agreed upon from time to time by the Fund’s Board and DMC. This expense waiver and reimbursement may only be terminated by agreement of DMC and the Fund.
34
Table of Contents
Until Nov. 29, 2016, Jackson Square Partners, LLC (JSP), a related party of DMC, furnished investment sub-advisory services to the Fund. For these services, DMC, not the Fund, paid JSP fees based on the aggregate average daily net assets of the Fund at the following annual rate: 0.425% of the first $500 million; 0.40% of the next $500 million; 0.375% of the next $1.5 billion; and 0.35% of aggregate average daily net assets in excess of $2.5 billion.
Delaware Investments Fund Services Company (DIFSC), an affiliate of DMC, provides fund accounting and financial administration oversight services to the Fund. For these services, DIFSC’s fees are calculated based on the aggregate daily net assets of the Delaware Investments® Family of Funds at the following annual rate: 0.0050% of the first $30 billion; 0.0045% of the next $10 billion; 0.0040% of the next $10 billion; and 0.0025% of aggregate average daily net assets in excess of $50 billion. The fees payable to DIFSC under the service agreement described above are allocated among all retail funds in the Delaware Investments Family of Funds on a relative net asset value (NAV) basis. For the year ended Nov. 30, 2016, the Fund was charged $4,862 for these services. This amount is included on the “Statement of operations” under “Accounting and administration expenses.”
DIFSC is also the transfer agent and dividend disbursing agent of the Fund. For these services, DIFSC’s fees are calculated based on the aggregate daily net assets of the retail funds within the Delaware Investments Family of Funds at the following annual rate: 0.025% of the first $20 billion; 0.020% of the next $5 billion; 0.015% of the next $5 billion; and 0.013% of average daily net assets in excess of $30 billion. The fees payable to DIFSC under the service agreement described above are allocated among all retail funds in the Delaware Investments Family of Funds on a relative NAV basis. This amount is included on the “Statement of operations” under “Dividend disbursing and transfer agent fees and expenses.” For the year ended Nov. 30, 2016, the amount charged by DIFSC was $21,191. Pursuant to a sub-transfer agency agreement between DIFSC and BNY Mellon Investment Servicing (US) Inc. (BNYMIS), BNYMIS provides certain sub-transfer agency services to the Fund. Sub-transfer agency fees are paid by the Fund and are also included on the “Statement of operations” under “Dividend disbursing and transfer agent fees and expenses.”
Pursuant to a distribution agreement and distribution plan, the Fund pays DDLP, the distributor and an affiliate of DMC, an annual distribution and service fee of 0.25% of the average daily net assets of the Class A shares, 1.00% of the average daily net assets of the Class C shares, and 0.50% of the average daily net assets of the Class R shares. Institutional Class shares pay no distribution and service fee.
As provided in the investment management agreement, the Fund bears a portion of the cost of resources shared with DMC, including the cost of internal personnel of DMC and/or its affiliates that provide legal, tax, and regulatory reporting services to the Fund. For the year ended Nov. 30, 2016, the Fund was charged $7,407 for internal legal, tax, and regulatory reporting services provided by DMC and/or its affiliates’ employees. This amount is included on the “Statement of operations” under “Legal fees.”
For the year ended Nov. 30, 2016, DDLP earned $2,514 for commissions on sales of the Fund’s Class A shares. For the year ended Nov. 30, 2016, DDLP received gross CDSC commissions of $122 on redemptions of the Fund’s Class C shares, and these commissions were entirely used to offset upfront commissions previously paid by DDLP to broker/dealers on sales of those shares.
35
Table of Contents
| Notes to financial statements | ||
| Delaware International Small Cap Fund |
2. Investment Management, Administration Agreements, and Other Transactions with Affiliates (continued)
Trustees’ fees include expenses accrued by the Fund for each Trustee’s retainer and meeting fees. Certain officers of DMC, DIFSC, and DDLP are officers and/or Trustees of the Trust. These officers and Trustees are paid no compensation by the Fund.
Cross trades for the year ended Nov. 30, 2016 were executed by the Fund pursuant to procedures adopted by the Board designed to ensure compliance with Rule 17a-7 under the 1940 Act. Cross trading is the buying or selling of portfolio securities between funds of investment companies, or between a fund of an investment company and another entity, that are or could be considered affiliates by virtue of having a common investment advisor (or affiliated investment advisors), common directors/trustees and/or common officers. At its regularly scheduled meetings, the Board reviews such transactions for compliance with the procedures adopted by the Board. Pursuant to these procedures, for the year ended Nov. 30, 2016, the Fund engaged in securities sales of $122,565, which resulted in net realized gains of $4.
*The aggregate contractual waiver period covering this report is from March 30, 2015 through Nov. 30, 2017.
3. Investments
For the year ended Nov. 30, 2016, the Fund made purchases and sales of investment securities other than short-term investments as follows:
Purchases | $ | 65,696,787 | ||
Sales | 154,274,215 |
At Nov. 30, 2016, the cost of investments and unrealized appreciation (depreciation) for federal income tax purposes were as follows:
Cost of investments | $ | 37,951,723 | ||
|
| |||
Aggregate unrealized appreciation of investments | $ | 667,748 | ||
Aggregate unrealized depreciation of investments | (332,837 | ) | ||
|
| |||
Net unrealized appreciation of investments | $ | 334,911 | ||
|
|
U.S. GAAP defines fair value as the price that the Fund would receive to sell an asset or pay to transfer a liability in an orderly transaction between market participants at the measurement date under current market conditions. A three-level hierarchy for fair value measurements has been established based upon the transparency of inputs to the valuation of an asset or liability. Inputs may be observable or unobservable and refer broadly to the assumptions that market participants would use in pricing the asset or liability. Observable inputs reflect the assumptions market participants would use in pricing the asset or liability based on market data obtained from sources independent of the reporting entity. Unobservable inputs reflect the reporting entity’s own assumptions about the assumptions that market participants would use in pricing the asset or liability based on the best information available under the circumstances. The Fund’s investment in its entirety is assigned a level based upon the observability of
| 36 |
Table of Contents
the inputs which are significant to the overall valuation. The three-level hierarchy of inputs is summarized below.
| Level 1 – | Inputs are quoted prices in active markets for identical investments. (Examples: equity securities, open-end investment companies, futures contracts, exchange-traded options contracts) | |
| Level 2 – | Other observable inputs, including, but not limited to: quoted prices for similar assets or liabilities in markets that are active, quoted prices for identical or similar assets or liabilities in markets that are not active, inputs other than quoted prices that are observable for the assets or liabilities (such as interest rates, yield curves, volatilities, prepayment speeds, loss severities, credit risks, and default rates), or other market-corroborated inputs. (Examples: debt securities, government securities, swap contracts, foreign currency exchange contracts, foreign securities utilizing international fair value pricing, broker-quoted securities, fair valued securities) | |
| Level 3 – | Significant unobservable inputs, including the Fund’s own assumptions used to determine the fair value of investments. (Examples: broker-quoted securities, fair valued securities) | |
Level 3 investments are valued using significant unobservable inputs. The Fund may also use an income-based valuation approach in which the anticipated future cash flows of the investment are discounted to calculate fair value. Discounts may also be applied due to the nature or duration of any restrictions on the disposition of the investments. Valuations may also be based upon current market prices of securities that are comparable in coupon, rating, maturity, and industry. The derived value of a Level 3 investment may not represent the value which is received upon disposition and this could impact the results of operations.
| 37 |
Table of Contents
| Notes to financial statements | ||
| Delaware International Small Cap Fund |
3. Investments (continued)
The following table summarizes the valuation of the Fund’s investments by fair value hierarchy levels as of Nov. 30, 2016:
Securities | Level 1 | Level 2 | Total | |||||||||
Common Stock | ||||||||||||
Australia | 2,046,408 | — | 2,046,408 | |||||||||
Austria | 890,541 | — | 890,541 | |||||||||
Canada | 2,754,552 | — | 2,754,552 | |||||||||
China/Hong Kong | 3,771,861 | — | 3,771,861 | |||||||||
Denmark | 424,613 | — | 424,613 | |||||||||
Faroe Islands | 621,673 | — | 621,673 | |||||||||
Finland | 968,792 | — | 968,792 | |||||||||
France | 1,952,341 | — | 1,952,341 | |||||||||
Germany | 872,037 | — | 872,037 | |||||||||
Indonesia | 428,679 | — | 428,679 | |||||||||
Italy | 2,064,741 | — | 2,064,741 | |||||||||
Japan | 9,906,651 | — | 9,906,651 | |||||||||
Netherlands | 741,369 | — | 741,369 | |||||||||
Norway | 1,055,702 | — | 1,055,702 | |||||||||
Spain | 206,625 | — | 206,625 | |||||||||
Sweden | 1,457,796 | — | 1,457,796 | |||||||||
Switzerland | 3,028,217 | — | 3,028,217 | |||||||||
United Kingdom | 4,148,036 | — | 4,148,036 | |||||||||
Short-Term Investments | — | 946,000 | 946,000 | |||||||||
|
|
|
|
|
| |||||||
Total Value of Securities | $ | 37,340,634 | $ | 946,000 | $ | 38,286,634 | ||||||
|
|
|
|
|
| |||||||
Foreign Currency Exchange Contracts | $ | — | $ | (19,004) | $ | (19,004) | ||||||
During the year ended Nov. 30, 2016, there were no transfers between Level 1 investments, Level 2 investments, or Level 3 investments that had a significant impact to the Fund. This does not include transfers between Level 1 investments and Level 2 investments due to the Fund utilizing international fair value pricing during the period. In accordance with the fair valuation procedures described in Note 1, international fair value pricing of securities in the Fund occurs when market volatility exceeds an established rolling threshold. If the threshold is exceeded on a given date, then prices of international securities (those that traded on exchanges that close at a different time than the time that the Fund’s NAV is determined) are established using a separate pricing feed from a third-party vendor designed to establish a price for each such security as of the time that the Fund’s NAV is determined. Further, international fair value pricing uses other observable market-based inputs in place of the closing exchange price due to the events occurring after the close of the exchange or market on which the investment is principally traded, causing a change in classification between levels. The Fund’s policy is to recognize transfers between levels at the beginning of the reporting period.
| 38 |
Table of Contents
A reconciliation of Level 3 investments is presented when the Fund has a significant amount of Level 3 investments at the beginning, interim, or end of the period in relation to net assets. At Nov. 30, 2016, there were no Level 3 investments.
4. Dividend and Distribution Information
Income and long-term capital gain distributions are determined in accordance with federal income tax regulations, which may differ from U.S. GAAP. Additionally, distributions from net gains on foreign currency transactions and net short-term gains on sales of investment securities are treated as ordinary income for federal income tax purposes. The tax character of dividends and distributions paid during the years ended Nov. 30, 2016 and 2015 was as follows:
| Year ended | ||||||||
| 11/30/16 | 11/30/15 | |||||||
Ordinary income | $ | — | $ | 705,607 | ||||
Long-term capital gain | 4,197,261 | 9,328 | ||||||
|
|
|
| |||||
Total | $ | 4,197,261 | $ | 714,935 | ||||
|
|
|
| |||||
5. Components of Net Assets on a Tax Basis
As of Nov. 30, 2016, the components of net assets on a tax basis were as follows:
Shares of beneficial interest | $ | 21,340,566 | ||
Undistributed ordinary income | 2,420,791 | |||
Undistributed long-term capital gains | 13,515,350 | |||
Net unrealized appreciation of investments, foreign currencies, and derivatives | 307,681 | |||
|
| |||
Net assets | $ | 37,584,388 | ||
|
|
The differences between book basis and tax basis components of net assets are primarily attributable to tax deferral of losses on wash sales.
For financial reporting purposes, capital accounts are adjusted to reflect the tax character of permanent book/tax differences. Reclassifications are primarily due to tax treatment of gain (loss) on foreign currency transactions. Results of operations and net assets were not affected by these reclassifications. For the year ended Nov. 30, 2016, the Fund recorded the following reclassifications:
Distributions in excess of net investment income | $ | (31,561 | ) | |
Accumulated net realized gain | 31,561 |
For federal income tax purposes, capital loss carryforwards may be carried forward and applied against future capital gains. There were no capital loss carryforwards remaining at Nov. 30, 2016.
On Dec. 22, 2010 the Regulated Investment Company Modernization Act of 2010 (Act) was enacted, which changed various technical rules governing the tax treatment of regulated investment companies. The changes were generally effective for taxable years beginning after the date of enactment. Under the Act, the Fund is permitted to carry forward capital losses incurred in taxable years beginning after the date of enactment for an unlimited period. Additionally, post-enactment capital loss carryforwards will retain their character as either short-term or long-term capital losses rather than being considered all
| 39 |
Table of Contents
| Notes to financial statements | ||
| Delaware International Small Cap Fund |
5. Components of Net Assets on a Tax Basis (continued)
short-term as permitted under previous regulation. At Nov. 30, 2016, no capital loss carryforwards were incurred under the Act.
6. Capital Shares
Transactions in capital shares were as follows:
| Year ended | ||||||||||||
| 11/30/16 | 11/30/15 | |||||||||||
Shares sold: | ||||||||||||
Class A | 189,509 | 199,663 | ||||||||||
Class C | 27,705 | 62,707 | ||||||||||
Class R | 214 | 1,588 | ||||||||||
Institutional Class | 443,941 | 780,574 | ||||||||||
Shares issued upon reinvestment of dividends and distributions: | ||||||||||||
Class A | 44,982 | 5,071 | ||||||||||
Class C | 10,559 | — | ||||||||||
Class R | 103 | 11 | ||||||||||
Institutional Class | 162,677 | 30,131 | ||||||||||
|
|
|
| |||||||||
| 879,690 | 1,079,745 | |||||||||||
|
|
|
| |||||||||
Shares redeemed: | ||||||||||||
Class A | (805,041 | ) | (262,376 | ) | ||||||||
Class C | (79,700 | ) | (74,939 | ) | ||||||||
Class R | (3,089 | ) | (3,222 | ) | ||||||||
Institutional Class | (4,385,221 | ) | (980,618 | ) | ||||||||
|
|
|
| |||||||||
| (5,273,051 | ) | (1,321,155 | ) | |||||||||
|
|
|
| |||||||||
Net decrease | (4,393,361 | ) | (241,410 | ) | ||||||||
|
|
|
| |||||||||
Certain shareholders may exchange shares of one class for shares of another class in the same Fund. For the year ended Nov. 30, 2016, the Fund had the following exchange transactions:
Year ended | ||||||
Exchange Redemptions | Exchange Subscriptions Institutional | |||||
Class A | Class C | Class | ||||
Shares | Shares | Shares | Value | |||
32,858 | 3,365 | 35,717 | $676,986 | |||
There were no exchange transactions for the year ended Nov. 30, 2015.
These exchange transactions are included as subscriptions and redemptions in the table on the previous page and the “Statements of changes in net assets.”
| 40 |
Table of Contents
7. Line of Credit
The Fund, along with certain other funds in the Delaware Investments® Family of Funds (Participants), was a participant in a $155,000,000 revolving line of credit intended to be used for temporary or emergency purposes as an additional source of liquidity to fund redemptions of investor shares. Under the agreement, the Participants were charged an annual commitment fee of 0.10%, which was allocated across the Participants on the basis of relative net assets of each Participant’s allocation of the entire facility. The Participants were permitted to borrow up to a maximum of one-third of their net assets under the agreement. Each Participant was individually, and not jointly, liable for its particular advances, if any, under the line of credit. The line of credit available under the agreement expired on Nov. 7, 2016.
On Nov. 7, 2016, the Fund, along with the other Participants, entered into an amendment to the agreement for a $155,000,000 revolving line of credit. The line of credit is to be used as described above and operates in substantially the same manner as the original agreement, with the exception of the annual commitment fee. Under the amendment to the agreement, the Participants are charged an annual commitment fee of 0.15%, which is allocated across the Participants on the basis of relative net assets of each Participant’s allocation of the entire facility. The line of credit available under the agreement expires on Nov. 6, 2017.
The Fund had no amounts outstanding as of Nov. 30, 2016, or at any time during the year then ended.
8. Derivatives
U.S. GAAP requires disclosures that enable investors to understand: (1) how and why an entity uses derivatives; (2) how they are accounted for; and (3) how they affect an entity’s results of operations and financial position.
Foreign Currency Exchange Contracts – The Fund may enter into foreign currency exchange contracts and foreign cross currency exchange contracts as a way of managing foreign exchange rate risk. The Fund may enter into these contracts to fix the U.S. dollar value of a security that it has agreed to buy or sell for the period between the date the trade was entered into and the date the security is delivered and paid for. The Fund may also use these contracts to hedge the U.S. dollar value of securities it already owns that are denominated in foreign currencies. In addition, the Fund may enter into these contracts to facilitate or expedite the settlement of portfolio transactions. The change in value is recorded as an unrealized gain or loss. When the contract is closed, a realized gain or loss is recorded equal to the difference between the value of the contract at the time it was opened and the value at the time it was closed.
The use of foreign currency exchange contracts and foreign cross currency exchange contracts does not eliminate fluctuations in the underlying prices of the securities, but does establish a rate of exchange that can be achieved in the future. Although foreign currency exchange contracts and foreign cross currency exchange contracts limit the risk of loss due to an unfavorable change in the value of the hedged currency, they also limit any potential gain that might result should the value of the currency change favorably. In addition, the Fund could be exposed to risks if the counterparties to the contracts are unable to meet the terms of their contracts. The Fund’s maximum risk of loss from counterparty credit risk is the value of its currency exchanged with the counterparty. The risk is generally mitigated by having
| 41 |
Table of Contents
| Notes to financial statements | ||
| Delaware International Small Cap Fund |
8. Derivatives (continued)
a netting arrangement between the Fund and the counterparty and by the posting of collateral by the counterparty to the Fund to cover the Fund’s exposure to the counterparty.
During the year ended Nov. 30, 2016, the Fund held foreign currency exchange contracts which produced net realized gains and are reflected on the “Statement of operations” under “Net realized gain on foreign currency exchange contracts.”
During the year ended Nov. 30, 2016, the Fund entered into foreign currency exchange contracts to hedge the U.S. dollar value of securities it already owned that were denominated in foreign currencies.
Derivatives Generally. The table below summarizes the average balance of derivative holdings by the Fund during the year ended Nov. 30, 2016.
| Long Derivatives | Short Derivatives | |||||||
| Volume | Volume | |||||||
Foreign currency exchange contracts (average cost) | $ | 18,433 | $ | 174,206 | ||||
9. Offsetting
In December 2011, the Financial Accounting Standards Board (FASB) issued guidance that expanded disclosure requirements on the offsetting of certain assets and liabilities. The disclosures are required for investments and derivative financial instruments subject to master netting or similar agreements which are eligible for offset on the “Statement of assets and liabilities” and requires an entity to disclose both gross and net information about such investments and transactions in the financial statements. In January 2013, the FASB issued guidance that clarified which investments and transactions are subject to the offsetting disclosure requirements. The scope of the disclosure requirements for offsetting is limited to derivative instruments, repurchase agreements and reverse repurchase agreements, and securities borrowing.
In order to better define its contractual rights and to secure rights that will help the Fund mitigate its counterparty risk, the Fund entered into an International Swaps and Derivatives Association, Inc. Master Agreement (ISDA Master Agreement) or a similar agreement with certain of its derivative contract counterparties. An ISDA Master Agreement is a bilateral agreement between the Fund and a counterparty that governs certain over-the-counter (OTC) derivatives and foreign exchange contracts and typically contains, among other things, collateral posting items and netting provisions in the event of a default and/or termination event. Under an ISDA Master Agreement, the Fund may, under certain circumstances, offset with the counterparty certain derivative financial instruments’ payables and/or receivables with collateral held and/or posted and create one single net payment. The provisions of the ISDA Master Agreement typically permit a single net payment in the event of default (close-out), including the bankruptcy or insolvency of the counterparty. However, bankruptcy or insolvency laws of a particular jurisdiction may impose restrictions on or prohibitions against the right of offset in bankruptcy, insolvency, or other events.
For financial reporting purposes, the Fund does not offset derivative assets and derivative liabilities that are subject to netting arrangements on the “Statement of assets and liabilities.”
| 42 |
Table of Contents
At Nov. 30, 2016, the Fund had the following assets and liabilities subject to offsetting provisions:
Offsetting of Financial Assets and Liabilities and Derivative Assets and Liabilities
Counterparty | Gross Value of | Gross Value of | Net Position | |||||||||||||||||||||
BNY Mellon |
| $124 | $(19,128) | $(19,004) | ||||||||||||||||||||
Counterparty | Net Position | Fair Value of Non-Cash Collateral Received | Cash Collateral Received | Fair Value of Non-Cash Collateral Pledged | Cash Collateral Pledged | Net Exposure(b) | ||||||||||||||||||
BNY Mellon | $ | (19,004) | $— | $— | $— | $— | $ | (19,004) | ||||||||||||||||
Master Repurchase Agreements
Counterparty | Repurchase Agreements | Fair Value of Non-cash Collateral Received(a) | Cash Collateral Received | Net Collateral Received | Net Exposure(b) | |||||||||||||||
Bank of America Merrill Lynch | $348,088 | $(348,088) | $— | $(348,088) | $— | |||||||||||||||
Bank of Montreal | 580,146 | (580,146) | — | (580,146) | — | |||||||||||||||
BNP Paribas | 17,766 | (17,766) | — | (17,766) | — | |||||||||||||||
|
|
|
|
|
|
|
|
|
| |||||||||||
Total | $946,000 | $(946,000) | $— | $(946,000) | $— | |||||||||||||||
|
|
|
|
|
|
|
|
|
| |||||||||||
(a)The value of the related collateral received exceeded the value of the repurchase agreements as of Nov. 30, 2016.
(b)Net exposure represents the receivable (payable) that would be due from (to) the counterparty in the event of default.
10. Securities Lending
The Fund, along with other funds in the Delaware Investments® Family of Funds, may lend its securities pursuant to a security lending agreement (Lending Agreement) with The Bank of New York Mellon (BNY Mellon). At the time a security is loaned, the borrower must post collateral equal to the required percentage of the market value of the loaned security, including any accrued interest. The required percentage is: (1) 102% with respect to U.S. securities and foreign securities that are denominated and payable in U.S. dollars; and (2) 105% with respect to foreign securities. With respect to each loan, if on any business day the aggregate market value of securities collateral plus cash collateral held is less than the aggregate market value of the securities which are the subject of such loan, the borrower will be notified to provide additional collateral by the end of the following business day which, together with the collateral already held, will be not less than the applicable initial collateral requirements for such security loan. If the aggregate market value of securities collateral and cash collateral held with respect to a security loan exceeds the applicable initial collateral requirement, upon request of the borrower, BNY Mellon must return enough collateral to the borrower by the end of the following business day to reduce the value of the remaining collateral to the applicable initial collateral requirement for such security loan. As a result of the foregoing, the value of the collateral held with respect to a loaned security on any particular day may be more or less than the value of the security on loan.
Prior to Dec. 29, 2015, cash collateral received was generally invested in the Delaware Investments Collateral Fund No. 1 (Collective Trust), a pooled account established by BNY Mellon for the use of funds managed by DMC that participate in BNY Mellon’s securities lending program. The Collective Trust
| 43 |
Table of Contents
| Notes to financial statements | ||
| Delaware International Small Cap Fund |
10. Securities Lending (continued)
sought to maintain a NAV per unit of $1.00. Under the previous investment guidelines, the Collective Trust was permitted to invest in U.S. government securities and high-quality corporate debt, asset-backed and other money market securities, and in repurchase agreements collateralized by such securities, provided that the Collective Trust would generally have a dollar-weighted average portfolio maturity of 60 days or less.
On Dec. 29, 2015, the assets in the Collective Trust were transferred to a series of individual separate accounts, each corresponding to a Fund. The investment guidelines permit each separate account to hold certain securities that would be considered eligible securities for a money market fund. Cash collateral received is generally invested in government securities; certain obligations issued by government sponsored enterprises; repurchase agreements collateralized by U.S. Treasury securities; obligations issued by the central government of any Organization for Economic Cooperation and Development (OECD) country or its agencies, instrumentalities or establishments; obligations of supranational organizations, commercial paper, notes, bonds and other debt obligations; certificates of deposit, time deposits and other bank obligations; and asset-backed securities.
In the event of default or bankruptcy by the lending agent, realization and/or retention of the collateral may be subject to legal proceedings. In the event the borrower fails to return loaned securities and the collateral received is insufficient to cover the value of the loaned securities and provided such collateral shortfall is not the result of investment losses, the lending agent has agreed to pay the amount of the shortfall to the Fund or, at the discretion of the lending agent, replace the loaned securities. The Fund continues to record dividends or interest, as applicable, on the securities loaned and is subject to changes in value of the securities loaned that may occur during the term of the loan. The Fund has the right under the Lending Agreement to recover the securities from the borrower on demand. With respect to security loans collateralized by non-cash collateral, the Fund receives loan premiums paid by the borrower. With respect to security loans collateralized by cash collateral, the earnings from the collateral investments are shared among the Fund, the security lending agent, and the borrower. The Fund records security lending income net of allocations to the security lending agent and the borrower.
The Fund may incur investment losses as a result of investing securities lending collateral. This could occur if an investment in the collateral investment account defaulted or became impaired. Under those circumstances, the value of a Fund’s cash collateral account may be less than the amount the Fund would be required to return to the borrowers of the securities and the Fund would be required to make up for this shortfall.
During the year ended Nov. 30, 2016, the Fund had no securities out on loan.
11. Credit and Market Risk
Some countries in which the Fund may invest require governmental approval for the repatriation of investment income, capital, or the proceeds of sales of securities by foreign investors. In addition, if there is deterioration in a country’s balance of payments, or for other reasons, a country may impose temporary restrictions on foreign capital remittances abroad.
| 44 |
Table of Contents
The securities exchanges of certain foreign markets are substantially smaller, less liquid and more volatile than the major securities markets in the United States. Consequently, acquisition and disposition of securities by the Fund may be inhibited. In addition, a significant portion of the aggregate market value of equity securities listed on the major securities exchanges in emerging markets is held by a smaller number of investors. This may limit the number of shares available for acquisition or disposition by the Fund.
The Fund may invest up to 15% of its net assets in illiquid securities, which may include securities with contractual restrictions on resale, securities exempt from registration under Rule 144A, promulgated under the Securities Act of 1933, as amended, and other securities which may not be readily marketable. The relative illiquidity of these securities may impair the Fund from disposing of them in a timely manner and at a fair price when it is necessary or desirable to do so. While maintaining oversight, the Fund’s Board has delegated to DMC, the day-to-day functions of determining whether individual securities are liquid for purposes of the Fund’s limitation on investments in illiquid securities. Securities eligible for resale pursuant to Rule 144A, which are determined to be liquid, are not subject to the Fund’s 15% limit on investments in illiquid securities. As of Nov. 30, 2016, no securities have been determined to be illiquid under the Fund’s Liquidity Procedures. Rule 144A securities have been identified on the “Schedule of investments. When monitoring compliance with the Fund’s illiquid limit, certain holdings that are common to multiple clients of the investment manager may be aggregated and considered illiquid in the aggregate solely for monitoring purposes. For purposes of determining illiquidity for financial reporting purposes, only the holdings of this Fund will be considered.
12. Contractual Obligations
The Fund enters into contracts in the normal course of business that contain a variety of indemnifications. The Fund’s maximum exposure under these arrangements is unknown. However, the Fund has not had prior claims or losses pursuant to these contracts. Management has reviewed the Fund’s existing contracts and expects the risk of loss to be remote.
13. Recent Accounting Pronouncements
On Oct. 13, 2016, the Securities and Exchange Commission amended existing rules intended to modernize reporting and disclosure of information. These amendments relate to Regulation S-X which sets forth the form and content of financial statements. At this time, management is evaluating the implications of adopting these amendments and their impact on the financial statements and accompanying notes.
14. Fund Repositioning
Effective Nov. 30, 2016, the investment strategies for Delaware Focus Global Growth Fund changed and the Fund was repositioned as an international small-cap fund. In connection with the repositioning, the Fund’s name changed to Delaware International Small Cap Fund.
15. Subsequent Events
Management has determined that no material events or transactions occurred subsequent to Nov. 30, 2016 that would require recognition or disclosure in the Fund’s financial statements.
| 45 |
Table of Contents
registered public accounting firm
To the Board of Trustees of Delaware Group® Global & International Funds and Shareholders of Delaware International Small Cap Fund:
In our opinion, the accompanying statement of assets and liabilities, including the schedule of investments, and the related statements of operations and of changes in net assets and the financial highlights present fairly, in all material respects, the financial position of Delaware International Small Cap Fund (one of the series constituting Delaware Group® Global & International Funds, hereafter referred to as the “Fund”) as of November 30, 2016, the results of its operations for the year then ended, the changes in its net assets for each of the two years in the period then ended and the financial highlights for each of the five years in the period then ended, in conformity with accounting principles generally accepted in the United States of America. These financial statements and financial highlights (hereafter referred to as “financial statements”) are the responsibility of the Fund’s management. Our responsibility is to express an opinion on these financial statements based on our audits. We conducted our audits of these financial statements in accordance with the standards of the Public Company Accounting Oversight Board (United States). Those standards require that we plan and perform the audit to obtain reasonable assurance about whether the financial statements are free of material misstatement. An audit includes examining, on a test basis, evidence supporting the amounts and disclosures in the financial statements, assessing the accounting principles used and significant estimates made by management, and evaluating the overall financial statement presentation. We believe that our audits, which included confirmation of securities as of November 30, 2016 by correspondence with the custodian and brokers, provide a reasonable basis for our opinion.
PricewaterhouseCoopers LLP
Philadelphia, Pennsylvania
January 23, 2017
| 46 |
Table of Contents
Other Fund information (Unaudited)
Delaware International Small Cap Fund
Tax Information
The information set forth below is for the Fund’s fiscal year as required by federal income tax laws. Shareholders, however, must report distributions on a calendar year basis for income tax purposes, which may include distributions for portions of two fiscal years of the Fund. Accordingly, the information needed by shareholders for income tax purposes will be sent to them in January of each year. Please consult your tax advisor for proper treatment of this information.
All disclosures are based on financial information available as of the date of this annual report and, accordingly are subject to change. For any and all items requiring reporting, it is the intention of the Fund to report the maximum amount permitted under the Internal Revenue Code and the regulations thereunder.
For the fiscal year ended Nov. 30, 2016, the Fund reports distributions paid during the year as follows:
(A) Long-Term Capital Gain Distributions (Tax Basis) | 100.00 | % | ||
Total Distributions (Tax Basis) | 100.00 | % |
(A) is based on a percentage of the Fund’s total distributions.
| 47 |
Table of Contents
| Other Fund information (Unaudited) | ||
| Delaware International Small Cap Fund |
Board consideration of Delaware International Small Cap Fund investment advisory agreement
At a meeting held on Aug. 16–18, 2016 (the “Annual Meeting”), the Board of Trustees (the “Board”), including a majority of disinterested or independent Trustees, approved the renewal of the Investment Advisory Agreement for Delaware Focus Global Growth Fund (the “Fund”).* In making its decision, the Board considered information furnished at regular quarterly Board meetings, including reports detailing Fund performance, investment strategies, and expenses, as well as information prepared specifically in connection with the renewal of the investment advisory and sub-advisory contracts. Information furnished specifically in connection with the renewal of the Investment Management Agreement with Delaware Management Company (“DMC”) included materials provided by DMC and its affiliates (“Delaware Investments”) concerning, among other things, the nature, extent, and quality of services provided to the Fund; the costs of such services to the Fund; economies of scale; and the investment manager’s financial condition and profitability. In addition, in connection with the Annual Meeting, reports were provided to the Trustees in May 2016 and included reports provided by Broadridge Financial Solutions (“Broadridge”). The Broadridge reports compared the Fund’s investment performance and expenses with those of other comparable mutual funds. The Independent Trustees reviewed and discussed the Broadridge reports with independent legal counsel to the Independent Trustees. In addition to the information noted above, the Board also requested and received information regarding DMC’s policy with respect to advisory fee levels and its breakpoint philosophy; the structure of portfolio manager compensation; comparative client fee information; and any constraints or limitations on the availability of securities for certain investment styles, which had in the past year inhibited, or which were likely in the future to inhibit, the investment manager’s ability to invest fully in accordance with Fund policies.
In considering information relating to the approval of the Fund’s advisory agreement, the Independent Trustees received assistance and advice from and met separately with independent legal counsel to the Independent Trustees. Although the Board gave attention to all information furnished, the following discussion identifies, under separate headings, the primary factors taken into account by the Board during its contract renewal considerations.
Nature, extent, and quality of service. The Board considered the services provided by DMC to the Fund and its shareholders. In reviewing the nature, extent, and quality of services, the Board considered reports furnished to it throughout the year, which covered matters such as the relative performance of the Fund; compliance of portfolio managers with the investment policies, strategies, and restrictions for the Fund; compliance by DMC and Delaware Distributors, L.P. (together, “Management”) personnel with the Code of Ethics adopted throughout the Delaware Investments® Family of Funds complex; and adherence to fair value pricing procedures as established by the Board. The Board was pleased with the current staffing of the Fund’s investment advisor and the emphasis placed on research in the investment process. The Board recognized DMC’s receipt of several industry distinctions during the past several years. The Board gave favorable consideration to DMC’s efforts to control expenditures while maintaining service levels committed to Fund matters. The Board also noted the benefits provided to
*Until Nov. 29, 2016, Jackson Square Partners, LLC, a related party of DMC, furnished investment sub-advisory services to the Fund.
| 48 |
Table of Contents
Fund shareholders through each shareholder’s ability to exchange an investment in one Delaware Investments fund for the same class of shares in another Delaware Investments fund without a sales charge, to reinvest Fund dividends into additional shares of the Fund or into additional shares of other Delaware Investments funds, and the privilege to combine holdings in other Delaware Investments funds to obtain a reduced sales charge. The Board was satisfied with the nature, extent, and quality of the overall services provided by DMC.
Investment performance. The Board placed significant emphasis on the investment performance of the Fund in view of the importance of investment performance to shareholders. Although the Board gave appropriate consideration to performance reports and discussions with portfolio managers at Investment Committee meetings throughout the year, the Board gave particular weight to the Broadridge reports furnished for the Annual Meeting. The Broadridge reports prepared for the Fund showed the investment performance of its Class A shares in comparison to a group of similar funds as selected by Broadridge (the “Performance Universe”). A fund with the best performance ranked first, and a fund with the poorest performance ranked last. The highest/best performing 25% of funds in the Performance Universe make up the first quartile; the next 25%, the second quartile; the next 25%, the third quartile; and the poorest/ worst performing 25% of funds in the Performance Universe make up the fourth quartile. Comparative annualized performance for the Fund was shown for the past 1-, 3-, 5- and 10-year periods, to the extent applicable, ended Jan. 31, 2016. The Board’s objective is that the Fund’s performance for the periods considered be at or above the median of its Performance Universe.
The Performance Universe for the Fund consisted of the Fund and all retail and institutional global multi-cap growth funds as selected by Broadridge. The Broadridge report comparison showed that the Fund’s total return for the 1- and 5-year periods was in the second quartile of its Performance Universe. The report further showed that the Fund’s total return for the 3-year period was in the fourth quartile of its Performance Universe. Overall, the Board was satisfied with performance.
Comparative expenses. The Board considered expense comparison data for the Delaware Investments® Family of Funds. Management provided the Board with information on pricing levels and fee structures for the Fund as of its most recently completed fiscal year. The Board also focused on the comparative analysis of effective management fees and total expense ratios of the Fund versus effective management fees and expense ratios of a group of similar funds as selected by Broadridge (the “Expense Group”). In reviewing comparative costs, the Fund’s contractual management fee and the actual management fee incurred by the Fund were compared with the contractual management fees (assuming all funds in the Expense Group were similar in size to the Fund) and actual management fees (as reported by each fund) within the Expense Group, taking into account any applicable breakpoints and fee waivers. The Fund’s total expenses were also compared with those of its Expense Group. The Broadridge total expenses, for comparative consistency, were shown by Broadridge for Class A shares and comparative total expenses including 12b-1 and non-12b-1 service fees. The Board’s objective is to limit the Fund’s total expense ratio to be competitive with that of the Expense Group.
The expense comparisons for the Fund showed that its actual management fee was in the quartile with the second highest expenses of its Expense Group and its total expenses were in the quartile with the lowest expenses of its Expense Group. The Board was satisfied with the total expenses of the Fund in comparison to those of its Expense Group as shown in the Broad ridge report.
| 49 |
Table of Contents
| Other Fund information (Unaudited) | ||
| Delaware International Small Cap Fund |
Board consideration of Delaware International Small Cap Fund investment advisory agreement (continued)
Management profitability. The Board considered the level of profits realized by DMC in connection with the operation of the Fund. In this respect, the Board reviewed the Investment Management Profitability Analysis that addressed the overall profitability of DMC’s business in providing management and other services to each of the individual funds and the Delaware Investments® Family of Funds as a whole. Specific attention was given to the methodology followed in allocating costs for the purpose of determining profitability. Management stated that the level of profits of DMC, to a certain extent, reflects recent operational cost savings and efficiencies initiated by DMC. The Board considered DMC’s efforts to improve services provided to fund shareholders and to meet additional regulatory and compliance requirements resulting from recent industry-wide Securities and Exchange Commission initiatives. The Board also considered the extent to which DMC might derive ancillary benefits from fund operations, including the potential for procuring additional business as a result of the prestige and visibility associated with its role as service provider to the Delaware Investments Family of Funds and the benefits from allocation of fund brokerage to improve trading efficiencies. The Board found that the management fees were reasonable in light of the services rendered and the level of profitability of DMC.
Economies of scale. The Trustees considered whether economies of scale are realized by DMC as the Fund’s assets increase and the extent to which any economies of scale are reflected in the level of management fees charged. The Trustees reviewed the standardized advisory fee pricing and structure, approved by the Board and shareholders, which includes breakpoints, and which applies to most funds in the Delaware Investments Family of Funds complex. Breakpoints in the advisory fee occur when the advisory fee rate is reduced on assets in excess of specified levels. Breakpoints result in a lower advisory fee than would otherwise be the case in the absence of breakpoints, when the asset levels specified in the breakpoints are exceeded. The Board noted that the fee under the Fund’s management contract fell within the standardized fee pricing structure. Although, as of May 31, 2016, the Fund had not reached a size at which it can take advantage of any breakpoints in the applicable fee schedule, the Board recognized that the fee was structured so that if the Fund grows, economies of scale may be shared.
| 50 |
Table of Contents
This page intentionally left blank.
Table of Contents
| Board of trustees / directors and officers addendum | ||
| Delaware Investments® Family of Funds |
A mutual fund is governed by a Board of Trustees/Directors (“Trustees”), which has oversight responsibility for the management of a fund’s business affairs. Trustees establish procedures and oversee and review the performance of the investment manager, the distributor, and others who perform services for the fund. The independent fund trustees, in particular, are advocates
Name, Address,
| Position(s) Held with Fund(s) | Length of Time Served | ||
Interested Trustee
| ||||
Shawn K. Lytle1, 3 | President, | Trustee since | ||
2005 Market Street | Chief Executive Officer, | September 2015 | ||
Philadelphia, PA 19103 | and Trustee | |||
February 1970 | President and | |||
| Chief Executive Officer | ||||
| since August 2015 | ||||
Independent Trustees | ||||
Thomas L. Bennett | Chairman and Trustee | Trustee since | ||
2005 Market Street | March 2005 | |||
Philadelphia, PA 19103 | ||||
October 1947 | Chairman since | |||
March 2015
| ||||
Ann D. Borowiec | Trustee | Since March 2015 | ||
2005 Market Street | ||||
Philadelphia, PA 19103 | ||||
November 1958 | ||||
Joseph W. Chow | Trustee | Since January 2013 | ||
2005 Market Street | ||||
Philadelphia, PA 19103 | ||||
January 1953 | ||||
| 1 | Shawn K.Lytle is considered to be an “Interested Trustee“ because he is an executive officer of the Fund’s(s’) investment advisor. |
| 52 |
Table of Contents
for shareholder interests. Each trustee has served in that capacity since he or she was elected to or appointed to the Board of Trustees, and will continue to serve until his or her retirement or the election of a new trustee in his or her place. The following is a list of the Trustees and Officers with certain background and related information.
| Principal Occupation(s) During the Past Five Years | Number of Portfolios in Fund Complex Overseen by Trustee or Officer | Other Directorships Held by Trustee or Officer | ||
Shawn K. Lytle has served as | 62 | Trustee — UBS | ||
President of | Relationship Funds, | |||
Delaware Investments2 | SMA Relationship | |||
since June 2015 and was the | Trust, and UBS Funds | |||
Regional Head of Americas for | (May 2010–April 2015) | |||
UBS Global Asset | ||||
Management from | ||||
2010 through 2015. | ||||
Private Investor | 62 | Director — | ||
(March 2004–Present) | Bryn Mawr Bank Corp. (BMTC) | |||
| (2007–2011) | ||||
Chief Executive Officer | 62 | Director — | ||
Private Wealth Management | Banco Santander International | |||
(2011–2013) and | Since October 2016 | |||
Market Manager, | ||||
New Jersey Private | Director — | |||
Bank (2005–2011) — | Santander Bank, N.A. | |||
J.P. Morgan Chase & Co. | Since December 2016
| |||
Executive Vice President | 62 | Director and Audit Committee | ||
(Emerging Economies | Member — Hercules | |||
Strategies, Risks, and | Technology Growth | |||
Corporate Administration) | Capital, Inc. | |||
State Street Corporation | (2004–2014) | |||
(July 2004–March 2011) |
| 2 | Delaware Investments is the marketing name for Delaware Management Holdings, Inc. and its subsidiaries, including the Fund’s(s’) investment advisor, principal underwriter, and its transfer agent. |
| 53 |
Table of Contents
| Board of trustees / directors and officers addendum | ||
| Delaware Investments® Family of Funds |
| Name, Address, and Birth Date | Position(s) Held with Fund(s) | Length of Time Served | ||
Independent Trustees (continued) | ||||
John A. Fry | Trustee | Since January 2001 | ||
2005 Market Street | ||||
Philadelphia, PA 19103 | ||||
May 1960 | ||||
Lucinda S. Landreth | Trustee | Since March 2005 | ||
2005 Market Street | ||||
Philadelphia, PA 19103 | ||||
June 1947 | ||||
Frances A. Sevilla-Sacasa | Trustee | Since September 2011 | ||
2005 Market Street | ||||
Philadelphia, PA 19103 | ||||
January 1956 | ||||
| 54 |
Table of Contents
| Principal Occupation(s) During the Past Five Years | Number of Portfolios in Fund Complex Overseen by Trustee or Officer | Other Directorships Held by Trustee or Officer | ||
President — | 62 | Director, Audit | ||
Drexel University | and Governance Committee | |||
(August 2010–Present) | Member — Community | |||
| Health Systems | ||||
President — | ||||
Franklin & Marshall College | Director — Drexel | |||
(July 2002–July 2010) | Morgan & Co. | |||
| Director, Audit Committee | ||||
| Member — vTv | ||||
| Therapeutics LLC | ||||
Private Investor | 62 | None | ||
(2004–Present) | ||||
Chief Executive Officer — | 62 | Trust Manager and | ||
Banco Itaú | Audit Committee | |||
International | Member — Camden | |||
(April 2012–December 2016) | Property Trust | |||
Executive Advisor to Dean | ||||
(August 2011–March 2012)and Interim Dean | ||||
(January 2011–July 2011) — | ||||
University of Miami School of | ||||
Business Administration | ||||
President — U.S. Trust, | ||||
Bank of America Private | ||||
Wealth Management | ||||
(Private Banking) | ||||
(July 2007–December 2008)
| ||||
| 55 |
Table of Contents
| Board of trustees / directors and officers addendum | ||
| Delaware Investments® Family of Funds |
| Name, Address, and Birth Date | Position(s) Held with Fund(s) | Length of Time Served | ||
Independent Trustees (continued) | ||||
Thomas K. Whitford | Trustee | Since January 2013 | ||
2005 Market Street | ||||
Philadelphia, PA 19103 | ||||
March 1956 | ||||
Janet L. Yeomans | Trustee | Since April 1999 | ||
2005 Market Street | ||||
Philadelphia, PA 19103 | ||||
July 1948 | ||||
Officers | ||||
David F. Connor | Senior Vice President, | Senior Vice President | ||
2005 Market Street | General Counsel, | since May 2013; | ||
Philadelphia, PA 19103 | and Secretary | General Counsel | ||
December 1963 | since May 2015; | |||
| Secretary since | ||||
October 2005
| ||||
Daniel V. Geatens | Vice President | Treasurer since October 2007 | ||
2005 Market Street | and Treasurer | |||
Philadelphia, PA 19103 | ||||
October 1972 | ||||
Richard Salus | Senior Vice President | Chief Financial Officer | ||
2005 Market Street | and Chief Financial Officer | since November 2006 | ||
Philadelphia, PA 19103 | ||||
October 1963 | ||||
The Statement of Additional Information for the Fund(s) includes additional information about the Trustees and Officers and is available, without charge, upon request by calling 800 523-1918.
| 56 |
Table of Contents
| Principal Occupation(s) During the Past Five Years | Number of Portfolios in Fund Complex Overseen by Trustee or Officer | Other Directorships Held by Trustee or Officer | ||
Vice Chairman | 62 | Director — HSBC Finance Corporation and HSBC North America Holdings Inc. | ||
PNC Financial | Director —
| |||
Vice President and Treasurer
| 62 | Director, Personnel and Compensation Committee Chair, Audit Committee Member and Governance Committee Member — Okabena Company | ||
David F. Connor has served | 62 | None3 | ||
in various capacities at different times at Delaware Investments. | ||||
Daniel V. Geatens has served | 62 | None3 | ||
in various capacities at | ||||
different times at | ||||
Richard Salus has served | 62 | None3 | ||
in various capacities at | ||||
different times at | ||||
| 3 | Shawn K. Lytle, David F. Connor, Daniel V. Geatens, and Richard Salus serve in similar capacities for the six portfolios of the Optimum Fund Trust, which have the same investment advisor, principal underwriter, and transfer agent as the registrant. |
| 57 |
Table of Contents
About the organization
Board of trustees
| ||||||
Shawn K. Lytle President and Chief Executive Officer Delaware Investments ® Family of Funds Philadelphia, PA
Thomas L. Bennett Chairman of the Board | Ann D. Borowiec Former Chief Executive
Joseph W. Chow Former Executive Vice | John A. Fry President
Lucinda S. Landreth Former Chief Investment | Frances A. Sevilla-Sacasa Chief Executive Officer
Thomas K. Whitford Former Vice Chairman
Janet L. Yeomans Former Vice President and Treasurer | |||
| Affiliated officers | ||||||
David F. Connor Senior Vice President, | Daniel V. Geatens Vice President and | Richard Salus Senior Vice President and | ||||
This annual report is for the information of Delaware International Small Cap Fund shareholders, but it may be used with prospective investors when preceded or accompanied by the Delaware Investments Fund fact sheet for the most recently completed calendar quarter. These documents are available at delawareinvestments.com/literature.
Delaware Investments is the marketing name of Delaware Management Holdings, Inc. and its subsidiaries.
The Fund files its complete schedule of portfolio holdings with the Securities and Exchange Commission (SEC) for the first and third quarters of each fiscal year on Form N-Q. The Fund’s Forms N-Q, as well as a description of the policies and procedures that the Fund uses to determine how to vote proxies (if any) relating to portfolio securities are available without charge (i) upon request, by calling 800 523-1918; and (ii) on the SEC’s website at sec.gov. In addition, a description of the policies and procedures that the Fund uses to determine how to vote proxies (if any) relating to portfolio securities and the Schedules of Investments included in the Fund’s most recent Form N-Q are available without charge on the Fund’s website at delawareinvestments.com/literature. The Fund’s Forms N-Q may be reviewed and copied at the SEC’s Public Reference Room in Washington, D.C.; information on the operation of the Public Reference Room may be obtained by calling 800 SEC-0330.
Information (if any) regarding how the Funds voted proxies relating to portfolio securities during the most recently disclosed 12-month period ended June 30 is available without charge (i) through the Fund’s website at delawareinvestments.com/proxy; and (ii) on the SEC’s website at sec.gov.
| 58 |
Item 2. Code of Ethics
The registrant has adopted a code of ethics that applies to the registrant’s principal executive officer, principal financial officer, principal accounting officer or controller, or persons performing similar functions, regardless of whether these individuals are employed by the registrant or a third party. A copy of the registrant’s Code of Business Ethics has been posted on the Delaware Investments Internet Web site at www.delawareinvestments.com. Any amendments to the Code of Business Ethics, and information on any waiver from its provisions granted by the registrant, will also be posted on this Web site within five business days of such amendment or waiver and will remain on the Web site for at least 12 months.
Item 3. Audit Committee Financial Expert
The registrant’s Board of Trustees/Directors has determined that certain members of the registrant’s Audit Committee are audit committee financial experts, as defined below. For purposes of this item, an “audit committee financial expert” is a person who has the following attributes:
a. An understanding of generally accepted accounting principles and financial statements;
b. The ability to assess the general application of such principles in connection with the accounting for estimates, accruals, and reserves;
c. Experience preparing, auditing, analyzing, or evaluating financial statements that present a breadth and level of complexity of accounting issues that are generally comparable to the breadth and complexity of issues that can reasonably be expected to be raised by the registrant’s financial statements, or experience actively supervising one or more persons engaged in such activities;
d. An understanding of internal controls and procedures for financial reporting; and
e. An understanding of audit committee functions.
An “audit committee financial expert” shall have acquired such attributes through:
a. Education and experience as a principal financial officer, principal accounting officer, controller, public accountant, or auditor or experience in one or more positions that involve the performance of similar functions;
b. Experience actively supervising a principal financial officer, principal accounting officer, controller, public accountant, auditor, or person performing similar functions;
c. Experience overseeing or assessing the performance of companies or public accountants with respect to the preparation, auditing, or evaluation of financial statements; or
d. Other relevant experience.
The registrant’s Board of Trustees/Directors has also determined that each member of the registrant’s Audit Committee is independent. In order to be “independent” for purposes of this item, the Audit Committee member may not: (i) other than in his or her capacity as a member of the Board of Trustees/Directors or any committee thereof, accept directly or indirectly any consulting, advisory or other compensatory fee from the issuer; or (ii) be an “interested person” of the registrant as defined in Section 2(a)(19) of the Investment Company Act of 1940.
The names of the audit committee financial experts on the registrant’s Audit Committee are set forth below:
Ann D. Borowiec
Joseph W. Chow
Lucinda S. Landreth1
Item 4. Principal Accountant Fees and Services
(a) Audit fees.
PricewaterhouseCoopers LLP (“PwC”), the Independent Accountant to the series portfolios of Delaware Group Global & International Funds (“Funds”), has advised the Audit Committee of the Board of Trustees of the Funds (“Audit Committee”) that, as of the date of the filing of this Annual Report on Form N-CSR, it is in discussions with the staff of the Securities and Exchange Commission (“SEC Staff”), or the SEC, regarding the interpretation and application of Rule 2-01(c)(1)(ii)(A) of Regulation S-X, or the Loan Rule.
The Loan Rule prohibits accounting firms, such as PwC, from having certain financial relationships with their audit clients and affiliated entities. Specifically, the Loan Rule provides, in relevant part, that an accounting firm generally would not be independent if it receives a loan from a lender that is a “record or beneficial owner of more than ten percent of the audit client’s equity securities.” Under the SEC Staff’s interpretation of the Loan Rule, based on information provided to us by PwC, some of PwC’s relationships with its lenders who also own shares of one or more funds within the Delaware Investments Family of Funds investment company complex implicate the Loan Rule, calling into question PwC’s independence with respect to the Funds. PwC believes that, in light of the facts of these lending relationships, its ability to exercise objective judgment with respect to the audit of the Funds has not been impaired.
The Audit Committee has considered the lending relationships described by PwC and has concluded that (1) the lending relationships did not affect PwC’s application of objective judgment in conducting its audits and issuing reports on the Funds’ financial statements; and (2) a reasonable investor with knowledge of the lending relationships described by PwC would reach the same conclusion. In making this determination, the Audit Committee considered, among other things, PwC’s description of the relevant lending relationships and PwC’s representation that its objectivity was not impaired in conducting its audit of the Funds’ financial statements. In connection with this determination, PwC advised the Audit Committee that it believes PwC is independent and it continues to have discussions with the SEC Staff.
1 The instructions to Form N-CSR require disclosure on the relevant experience of persons who qualify as audit committee financial experts based on “other relevant experience.” The Board of Trustees/Directors has determined that Ms. Landreth qualifies as an audit committee financial expert by virtue of her experience as a financial analyst, her Chartered Financial Analyst (CFA) designation, and her service as an audit committee chairperson for a non-profit organization.
If the SEC were ultimately to determine that PwC was not independent with respect to the Funds for certain time periods, the Funds’ filings with the SEC that contain the Funds’ financial statements for such periods would be non-compliant with the applicable securities laws. If the SEC determines that PwC was not independent, among other things, the Funds could be required to have independent audits conducted on the Funds’ previously audited financial statements by another registered public accounting firm for the affected periods. The time involved to conduct such independent audits may impair the Funds’ ability to issue shares. Any of the foregoing possible outcomes potentially could have a material adverse effect on the Funds.
The aggregate fees billed for services provided to the registrant by its independent auditors for the audit of the registrant’s annual financial statements and for services normally provided by the independent auditors in connection with statutory and regulatory filings or engagements were $147,989 for the fiscal year ended November 30, 2016.
The aggregate fees billed for services provided to the registrant by its independent auditors for the audit of the registrant’s annual financial statements and for services normally provided by the independent auditors in connection with statutory and regulatory filings or engagements were $118,060 for the fiscal year ended November 30, 2015.
(b) Audit-related fees.
The aggregate fees billed by the registrant’s independent auditors for services relating to the performance of the audit of the registrant’s financial statements and not reported under paragraph (a) of this Item were $0 for the fiscal year ended November 30, 2016.
The aggregate fees billed by the registrant’s independent auditors for services relating to the performance of the audit of the financial statements of the registrant’s investment adviser and other service providers under common control with the adviser and that relate directly to the operations or financial reporting of the registrant were $667,000 for the registrant’s fiscal year ended November 30, 2016. The percentage of these fees relating to services approved by the registrant’s Audit Committee pursuant to the de minimis exception from the pre-approval requirement in Rule 2-01(c)(7)(i)(C) of Regulation S-X was 0%. These audit-related services were as follows: year-end audit procedures; group reporting and subsidiary statutory audits.
The aggregate fees billed by the registrant’s independent auditors for services relating to the performance of the audit of the registrant’s financial statements and not reported under paragraph (a) of this Item were $0 for the fiscal year ended November 30, 2015.
The aggregate fees billed by the registrant’s independent auditors for services relating to the performance of the audit of the financial statements of the registrant’s investment adviser and other service providers under common control with the adviser and that relate directly to the operations or financial reporting of the registrant were $612,000 for the registrant’s fiscal year ended November 30, 2015. The percentage of these fees relating to services approved by the registrant’s Audit Committee pursuant to the de minimis exception from the pre-approval requirement in Rule 2-01(c)(7)(i)(C) of Regulation S-X was 0%. These audit-related services were as follows: year-end audit procedures; group reporting and subsidiary statutory audits.
(c) Tax fees.
The aggregate fees billed by the registrant’s independent auditors for tax-related services provided to the registrant were $30,596 for the fiscal year ended November 30, 2016. The percentage of these fees relating to services approved by the registrant’s Audit Committee pursuant to the de minimis exception from the pre-approval requirement in Rule 2-01(c)(7)(i)(C) of Regulation S-X was 0%. These tax-related services were as follows: review of income tax returns and review of annual excise distribution calculations.
The aggregate fees billed by the registrant’s independent auditors for tax-related services provided to the registrant’s investment adviser and other service providers under common control with the adviser and that relate directly to the operations or financial reporting of the registrant were $0 for the registrant’s fiscal year ended November 30, 2016.
The aggregate fees billed by the registrant’s independent auditors for tax-related services provided to the registrant were $25,438 for the fiscal year ended November 30, 2015. The percentage of these fees relating to services approved by the registrant’s Audit Committee pursuant to the de minimis exception from the pre-approval requirement in Rule 2-01(c)(7)(i)(C) of Regulation S-X was 0%. These tax-related services were as follows: review of income tax returns and review of annual excise distribution calculations.
The aggregate fees billed by the registrant’s independent auditors for tax-related services provided to the registrant’s investment adviser and other service providers under common control with the adviser and that relate directly to the operations or financial reporting of the registrant were $0 for the registrant’s fiscal year ended November 30, 2015.
(d) All other fees.
The aggregate fees billed for all services provided by the independent auditors to the registrant other than those set forth in paragraphs (a), (b) and (c) of this Item were $0 for the fiscal year ended November 30, 2016.
The aggregate fees billed for all services other than those set forth in paragraphs (b) and (c) of this Item provided by the registrant’s independent auditors to the registrant’s adviser and other service providers under common control with the adviser and that relate directly to the operations or financial reporting of the registrant were $0 for the registrant’s fiscal year ended November 30, 2016. The percentage of these fees relating to services approved by the registrant’s Audit Committee pursuant to the de minimis exception from the pre-approval requirement in Rule 2-01(c)(7)(i)(C) of Regulation S-X was 0%.
The aggregate fees billed for all services provided by the independent auditors to the registrant other than those set forth in paragraphs (a), (b) and (c) of this Item were $0 for the fiscal year ended November 30, 2015.
The aggregate fees billed for all services other than those set forth in paragraphs (b) and (c) of this Item provided by the registrant’s independent auditors to the registrant’s adviser and other service providers under common control with the adviser and that relate directly to the operations or financial reporting of the registrant were $0 for the registrant’s fiscal year ended November 30, 2015. The percentage of these fees relating to services approved by the registrant’s Audit Committee pursuant to the de minimis exception from the pre-approval requirement in Rule 2-01(c)(7)(i)(C) of Regulation S-X was 0%.
(e) The registrant’s Audit Committee has established pre-approval policies and procedures as permitted by Rule 2-01(c)(7)(i)(B) of Regulation S-X (the “Pre-Approval Policy”) with respect to services provided by the registrant’s independent auditors. Pursuant to the Pre-Approval Policy, the Audit Committee has pre-approved the services set forth in the table below with respect to the registrant up to the specified fee limits. Certain fee limits are based on aggregate fees to the registrant and other registrants within the Delaware Investments Family of Funds.
| Service | Range of Fees |
| Audit Services | |
| Statutory audits or financial audits for new Funds | up to $40,000 per Fund |
Services associated with SEC registration statements (e.g., Form N-1A, Form N-14, etc.), periodic reports and other documents filed with the SEC or other documents issued in connection with securities offerings (e.g., comfort letters for closed-end Fund offerings, consents), and assistance in responding to SEC comment letters | up to $10,000 per Fund |
| Consultations by Fund management as to the accounting or disclosure treatment of transactions or events and/or the actual or potential impact of final or proposed rules, standards or interpretations by the SEC, FASB, or other regulatory or standard-setting bodies (Note: Under SEC rules, some consultations may be considered “audit-related services” rather than “audit services”) | up to $25,000 in the aggregate |
Audit-Related Services | |
Consultations by Fund management as to the accounting or disclosure treatment of transactions or events and /or the actual or potential impact of final or proposed rules, standards or interpretations by the SEC, FASB, or other regulatory or standard-setting bodies (Note: Under SEC rules, some consultations may be considered “audit services” rather than “audit-related services”) | up to $25,000 in the aggregate |
Tax Services | |
U.S. federal, state and local and international tax planning and advice (e.g., consulting on statutory, regulatory or administrative developments, evaluation of Funds’ tax compliance function, etc.) | up to $25,000 in the aggregate |
U.S. federal, state and local tax compliance (e.g., excise distribution reviews, etc.) | up to $5,000 per Fund |
Review of federal, state, local and international income, franchise and other tax returns | up to $5,000 per Fund |
Under the Pre-Approval Policy, the Audit Committee has also pre-approved the services set forth in the table below with respect to the registrant’s investment adviser and other entities controlling, controlled by or under common control with the investment adviser that provide ongoing services to the registrant (the “Control Affiliates”) up to the specified fee limit. This fee limit is based on aggregate fees to the investment adviser and its Control Affiliates.
| Service | Range of Fees |
| Non-Audit Services | |
| Services associated with periodic reports and other documents filed with the SEC and assistance in responding to SEC comment letters | up to $10,000 in the aggregate |
The Pre-Approval Policy requires the registrant’s independent auditors to report to the Audit Committee at each of its regular meetings regarding all services initiated since the last such report was rendered, including those services authorized by the Pre-Approval Policy.
(f) Not applicable.
(g) The aggregate non-audit fees billed by the registrant’s independent auditors for services rendered to the registrant and to its investment adviser and other service providers under common control with the adviser were $8,665,000 and $11,111,212 for the registrant’s fiscal years ended November 30, 2016 and November 30, 2015, respectively.
(h) In connection with its selection of the independent auditors, the registrant’s Audit Committee has considered the independent auditors’ provision of non-audit services to the registrant’s investment adviser and other service providers under common control with the adviser that were not required to be pre-approved pursuant to Rule 2-01(c)(7)(ii) of Regulation S-X. The Audit Committee has determined that the independent auditors’ provision of these services is compatible with maintaining the auditors’ independence.
Item 5. Audit Committee of Listed Registrants
Not applicable.
Item 6. Investments
(a) Included as part of report to shareholders filed under Item 1 of this Form N-CSR.
(b) Divestment of securities in accordance with Section 13(c) of the Investment Company Act of 1940.
Not applicable.
Item 7. Disclosure of Proxy Voting Policies and Procedures for Closed-End Management Investment Companies
Not applicable.
Item 8. Portfolio Managers of Closed-End Management Investment Companies
Not applicable.
Item 9. Purchases of Equity Securities by Closed-End Management Investment Company and Affiliated Purchasers
Not applicable.
Item 10. Submission of Matters to a Vote of Security Holders
Not applicable.
Item 11. Controls and Procedures
The registrant’s principal executive officer and principal financial officer have evaluated the registrant’s disclosure controls and procedures within 90 days of the filing of this report and have concluded that they are effective in providing reasonable assurance that the information required to be disclosed by the registrant in its reports or statements filed under the Securities Exchange Act of 1934 is recorded, processed, summarized and reported within the time periods specified in the rules and forms of the Securities and Exchange Commission.
There were no significant changes in the registrant’s internal control over financial reporting that occurred during the second fiscal quarter of the period covered by the report to stockholders included herein (i.e., the registrant’s fourth fiscal quarter) that have materially affected, or are reasonably likely to materially affect, the registrant’s internal control over financial reporting.
Item 12. Exhibits
| (a) | (1) Code of Ethics |
Not applicable. | |
| (2) Certifications of Principal Executive Officer and Principal Financial Officer pursuant to Rule 30a-2 under the Investment Company Act of 1940 are attached hereto as Exhibit 99.CERT. | |
| (3) Written solicitations to purchase securities pursuant to Rule 23c-1 under the Securities Exchange Act of 1934. | |
Not applicable. | |
| (b) | Certifications pursuant to Section 906 of the Sarbanes-Oxley Act of 2002 are furnished herewith as Exhibit 99.906CERT. |
SIGNATURES
Pursuant to the requirements of the Securities Exchange Act of 1934 and the Investment Company Act of 1940, the registrant has duly caused this report to be signed on its behalf, by the undersigned, thereunto duly authorized.
DELAWARE GROUP® GLOBAL & INTERNATIONAL FUNDS
| /s/ SHAWN K. LYTLE | |
| By: | Shawn K. Lytle |
| Title: | President and Chief Executive Officer |
| Date: | February 3, 2017 |
Pursuant to the requirements of the Securities Exchange Act of 1934 and the Investment Company Act of 1940, this report has been signed below by the following persons on behalf of the registrant and in the capacities and on the dates indicated.
| /s/ SHAWN K. LYTLE | |
| By: | Shawn K. Lytle |
| Title: | President and Chief Executive Officer |
| Date: | February 3, 2017 |
| /s/ RICHARD SALUS | |
| By: | Richard Salus |
| Title: | Chief Financial Officer |
| Date: | February 3, 2017 |