UNITED STATES SECURITIES AND EXCHANGE COMMISSION
Washington, D.C. 20549
FORM N-CSR
CERTIFIED SHAREHOLDER REPORT OF REGISTERED MANAGEMENT
INVESTMENT COMPANIES
| Investment Company Act file number: | | 811-06324 |
| | |
| Exact name of registrant as specified in charter: | | Delaware Group® Global & International Funds |
| | |
| Address of principal executive offices: | | 2005 Market Street |
| | Philadelphia, PA 19103 |
| | |
| Name and address of agent for service: | | David F. Connor, Esq. |
| | 2005 Market Street |
| | Philadelphia, PA 19103 |
| | |
| Registrant’s telephone number, including area code: | | (800) 523-1918 |
| | |
| Date of fiscal year end: | | November 30 |
| | |
| Date of reporting period: | | November 30, 2011 |
Item 1. Reports to Stockholders

Annual report Delaware International Value Equity Fund
Delaware Emerging Markets Fund Delaware Global Value Fund November 30, 2011 Global / international equity mutual funds |
| Carefully consider the Funds’ investment objectives, risk factors, charges, and expenses before investing. This and other information can be found in the Funds’ prospectuses and, if available, their summary prospectuses, which may be obtained by visiting www.delawareinvestments.com or calling 800 523-1918. Investors should read the prospectus and, if available, the summary prospectus carefully before investing. |
You can obtain shareholder reports and prospectuses online instead of in the mail.
Visit www.delawareinvestments.com/edelivery. |
Experience Delaware Investments
Delaware Investments is committed to the pursuit of consistently superior asset management and unparalleled client service. We believe in our investment processes, which seek to deliver consistent results, and in convenient services that help add value for our clients.
If you are interested in learning more about creating an investment plan, contact your financial advisor.
You can learn more about Delaware Investments or obtain a prospectus for Delaware International Value Equity Fund, Delaware Emerging Markets Fund, and Delaware Global Value Fund at www.delawareinvestments.com.
| Manage your investments online |
- 24-hour access to your account information
- Obtain share prices
- Check your account balance and recent transactions
- Request statements or literature
- Make purchases and redemptions
|
Delaware Management Holdings, Inc. and its subsidiaries (collectively known by the marketing name of Delaware Investments) are wholly owned subsidiaries of Macquarie Group Limited, a global provider of banking, financial, advisory, investment and funds management services.
Investments in Delaware International Value Equity Fund, Delaware Emerging Markets Fund, and Delaware Global Value Fund are not and will not be deposits with or liabilities of Macquarie Bank Limited ABN 46 008 583 542 and its holding companies, including their subsidiaries or related companies (Macquarie Group), and are subject to investment risk, including possible delays in repayment and loss of income and capital invested. No Macquarie Group company guarantees or will guarantee the performance of the Funds, the repayment of capital from the Funds, or any particular rate of return.
| Table of contents | |
| Portfolio management review | 1 |
| Performance summaries | 10 |
| Disclosure of Fund expenses | 20 |
| Security type/country/sector allocations | 23 |
| Statements of net assets | 29 |
| Statements of operations | 50 |
| Statements of changes in net assets | 52 |
| Financial highlights | 58 |
| Notes to financial statements | 86 |
| Report of independent registered | |
| public accounting firm | 104 |
| Other Fund information | 105 |
| Board of trustees/directors and | |
| officers addendum | 110 |
| About the organization | 120 |
Unless otherwise noted, views expressed herein are current as of Nov. 30, 2011, and subject to change.
Funds are not FDIC insured and are not guaranteed. It is possible to lose the principal amount invested.
Mutual fund advisory services provided by Delaware Management Company, a series of Delaware Management Business Trust, which is a registered investment advisor. Delaware Investments, a member of Macquarie Group, refers to Delaware Management Holdings, Inc. and its subsidiaries, including the Funds’ distributor, Delaware Distributors, L.P. Macquarie Group refers to Macquarie Group Limited and its subsidiaries and affiliates worldwide.
© 2012 Delaware Management Holdings, Inc.
All third-party trademarks cited are the property of their respective owners.
Portfolio management review
| Delaware International Value Equity Fund | December 6, 2011 |
| Performance preview (for the year ended November 30, 2011) | | | | |
| Delaware International Value Equity Fund (Class A shares) | | 1-year return | | -6.64% |
| MSCI EAFE Index (gross) | | 1-year return | | -3.68% |
| MSCI EAFE Index (net) | | 1-year return | | -4.12% |
Past performance does not guarantee future results.
For complete, annualized performance for Delaware International Value Equity Fund, please see the table on page 10.
The performance of Class A shares excludes the applicable sales charge and reflects the reinvestment of all distributions.
Index performance returns do not reflect any management fees, transaction costs, or expenses. Indices are unmanaged and one cannot invest directly in an index.
International equity markets traced an uneven pattern over the Fund’s fiscal year, driven mostly by the shifting outlook for the euro-zone debt crisis. As the fiscal year began on Dec. 1, 2010, most international stocks were in the later stages of a rally that had started several months earlier, when European leaders averted a potentially destabilizing default on Greek sovereign debt. Investors also were generally encouraged by indications that the pace of economic growth seemed to remain reasonably strong.
That optimism began to wane in early spring 2011, however, as a series of events lowered forecasts for global growth. First, a devastating earthquake, tsunami, and nuclear crisis in Japan further weakened an economy that already was struggling to escape stagnation and deflation. The tragedy also disrupted global production and supply chains, particularly in the automotive and technology industries.
Meanwhile, emerging market stocks were treading water, despite much higher growth rates in emerging economies than in developed ones. Besides spillover from the Japanese disaster and the follow-on effects from the euro-zone credit crisis, developing economies suffered from rising food, energy, and industrial metals prices. Those heightened inflationary pressures caused authorities to institute a concurrent set of tightening measures, most notably in China, Brazil, and India.
The pattern of monetary tightening lowered expectations for economic growth in developing countries and contributed to a sharp selloff in emerging equity markets. After peaking in May 2011, the MSCI Emerging Markets Index tumbled approximately 30% over the next several months, with the decline accelerating when another sovereign debt crisis erupted in Europe. Eventually, bailouts were required to keep Ireland and Portugal from defaulting; later, yields on Italian and Spanish debt also climbed to what we viewed as unsustainable levels.
As the Fund’s fiscal year ended, however, most international equity markets had begun to rally, albeit amid extraordinary volatility, as many investors appeared to assume that European leaders would ultimately do whatever was necessary to stabilize the euro zone.
1
Portfolio management review
Delaware International Value Equity Fund
Fund performance
For the fiscal year ended Nov. 30, 2011, Delaware International Value Equity Fund returned -6.64% at net asset value and -12.04% at maximum offer price (both figures are for Class A shares with all distributions reinvested). The Fund’s benchmark, the MSCI EAFE Index (net), returned -4.12% for the same period. For the Fund’s complete, annualized performance information, please see the table on page 10.
Most of the Fund’s underperformance can be attributed to severe weakness in several economically sensitive euro-zone sectors in the third quarter of 2011.
For the full fiscal year, our underweight allocation to Japan and our overweight allocation to non-euro-zone healthcare stocks contributed to relative performance. While European industrials and emerging market technology stocks detracted from Fund performance, the Fund benefited from pockets of strong stock picking, particularly within technology in Canada and healthcare companies in Switzerland and Scandinavia.
In our opinion, returns from international equity markets are likely to depend heavily on achieving a benign resolution to the euro zone’s financial crisis. Europe’s equity market capitalization (including countries not in the euro zone) accounts for almost two-thirds of the MSCI EAFE Index, and the euro area is the world’s largest importer of goods and services. Although we are encouraged that European policy makers appear to grasp the magnitude of the problem, we believe liquidity must first be provided to euro-zone money and fixed income markets before the structural issues that gave rise to the region’s crisis can be addressed.
We believe that credit spreads, which widened to historic extremes relative to Germany late in the fiscal year, must decline significantly in order to restore a measure of stability. This is particularly urgent, in our view, given that Italy is scheduled to roll over a massive amount of government debt in 2012. There was a meaningful tightening of spreads during the last few weeks of the Fund’s fiscal year, but we believe those gains should be considered tenuous until proven otherwise.
If liquidity risks are dampened, we believe the focus of policy makers and investors should shift to the more daunting challenges regarding solvency of the region’s banks and peripheral governments. The markets have recognized that the debt service for many euro-zone nations is increasing faster than underlying economic growth. To address the solvency issue, there must be structural fiscal deficit reduction over the long term — without triggering another recession over the near term. This will not be easy to accomplish; excessive austerity measures could trigger a downward spiral in which even lower borrowing costs dwarf underlying growth rates.
We believe that the interplay between fiscal policy makers and the European Central Bank (ECB) could be crucial in sustaining market confidence. Germany currently opposes any expansion of the ECB’s mandate that would allow it to finance sovereign debt with “printed” money, much as the Federal Reserve has done with its two quantitative easing programs. Yet some ECB involvement might be necessary if sovereign bond yields — particularly in Spain and Italy — remain much above the crucial 6% threshold. Clearly, this is an issue that will take time — perhaps years — to be fully resolved. In the meantime,
2
there remains the possibility that periodic crises could disrupt the orderly functioning of financial markets.
Elsewhere, we believe Japan is likely to remain trapped in a slow-growth, deflationary environment. Yet despite dismal demographics, inefficient capital allocation, and debt levels that actually exceed those of the euro zone, there is no crisis atmosphere attending the Japanese equity market, which outperformed during the market selloff in the third quarter of 2011. This was largely due to the fact that the country has its own currency and central bank, which allows it to fund its budget deficit.
We believe that the outlook in China — and for emerging markets generally — is more hopeful. Recent data suggest that inflationary pressures in China have waned, though not necessarily to the degree that authorities would like. Still, monetary policy appears likely to loosen, which could help to maintain a growth rate roughly quadruple that of the developed world, while providing a badly needed export market for struggling developed economies.
Given the intense focus on macroeconomic and political factors, correlations between individual stocks have increased markedly in recent years, making traditional stock-picking less rewarding at times. We cannot predict when this trend will end. We are cognizant of so-called value traps, in which some stocks might appear cheap by certain financial metrics, but whose weak underlying fundamentals may make them even cheaper. For that reason, we remain underweight to European financials, a sector that has sold off dramatically, but which faces possible nationalization and equity dilution.
Overall, however, we are confident that positive individual company characteristics elsewhere could once again become the main driver of relative stock performance and that attractive opportunities for long-term, value-oriented investors should emerge as the dust from the euro-zone financial crisis finally settles.
3
| Portfolio management review | |
| Delaware Emerging Markets Fund | December 6, 2011 |
| Performance preview (for the year ended November 30, 2011) | | | | |
| Delaware Emerging Markets Fund (Class A shares) | | 1-year return | | -11.70% |
| MSCI Emerging Markets Index (gross) | | 1-year return | | -11.26% |
| MSCI Emerging Markets Index (net) | | 1-year return | | -13.87% |
Past performance does not guarantee future results.
For complete, annualized performance for Delaware Emerging Markets Fund, please see the table on page 13.
The performance of Class A shares excludes the applicable sales charge and reflects the reinvestment of all distributions.
Index performance returns do not reflect any management fees, transaction costs, or expenses. Indices are unmanaged and one cannot invest directly in an index.
Emerging market stocks dropped sharply over the final months of the Fund’s fiscal year, ended Nov. 30, 2011, amid escalating fears of another recession in the United States and Europe, as well as a possible breakup of the 17-country euro zone itself. Market conditions were highly volatile as many investors struggled on a near-daily basis to anticipate decisions by seemingly deadlocked political entities on both sides of the Atlantic. Until very late in the Fund’s fiscal year, China continued its policy of incremental monetary tightening in an effort to curb stubbornly high inflation without damaging the country’s financial system, which we believe remains highly exposed to its property sector. Through it all, however, economic growth rates in many developing economies remained several percentage points above their developed-market counterparts.
As the fiscal year began, in December 2010, emerging market equities were in the later stages of a strong rally that had started in summer 2010, driven first by a temporary resolution to a sovereign debt crisis in Greece and subsequently by the Federal Reserve’s second round of quantitative easing, or the purchase of $600 billion Treasury securities, which began in November 2010 using newly minted money. Dubbed QE2, the Fed policy was widely viewed as backstopping the U.S. economy, and by implication, world economic growth as well.
Beginning in spring 2011, however, renewed concerns about Greek solvency — this time accompanied by bailouts of Ireland and Portugal, and worries about financial contagion spreading to Italy and Spain — ignited a bear market in emerging market stocks. The selloff was also related to decelerating U.S. economic growth and a high-stakes round of political brinksmanship in Washington D.C. that nearly triggered a technical default on U.S. debt in early August. Selling intensified late in the Fund’s fiscal year as bond yields rose in core European countries, including Germany, Austria, Belgium, and France, perhaps portending an imminent breakup of the euro zone — or dramatic moves by political and monetary authorities that would rescue the single currency.
The global economic and political turmoil did not affect all emerging markets equally. Overall, Latin American equities generally detracted from Fund performance, mostly because of concerns about consumer credit as well as a sharp rise in the value of the Brazilian currency (the real), which acted as a brake on the country’s economic growth. Brazil also experienced weakness in commodities and increased inflation.
4
Increasing concerns about China’s economic growth contributed to that market’s underperformance. These concerns stemmed mainly from high inflation, policy tightening, weakness in the property market, and high local government debt levels. The prospect of slower growth in China, and the potential for a hard landing, affected the performance of broader emerging markets, particularly in commodities.
As the Fund’s fiscal year ended, however, there were encouraging signs that Chinese inflation was beginning to recede, even as economic growth remained robust and policy makers hinted at an imminent relaxation of monetary policy.
Fund performance
For the fiscal year ended Nov. 30, 2011, Delaware Emerging Markets Fund returned -11.70% at net asset value (NAV) and -16.80% at maximum offer price (both figures are for Class A shares with all distributions reinvested). The Fund’s benchmark, the MSCI Emerging Markets Index (net), declined by -13.87% for the same period. For the Fund’s complete, annualized performance information, please see the table on page 13.
The Fund’s underweight allocation to China contributed to performance. Among individual Chinese stocks, the Fund’s position in China Unicom (Hong Kong), one of China’s largest mobile telecommunications operators, performed strongly due largely to encouraging 3G subscriber acquisitions. The Fund’s large overweight to another telecommunications business, South Africa–based Vodacom Group, also contributed to relative and nominal performance.
In addition, the Fund benefited from significant gains in Lotte Chilsung Beverage, a South Korea–based producer and distributor of carbonated and alcoholic drinks, coffees, teas, and mineral water. Though Lotte Chilsung Beverage shares soared during the Fund’s fiscal year, we believe the stock still trades at a discount to our estimates of its intrinsic value. Despite extreme volatility, the Fund’s holdings in the state-owned Russian energy company Gazprom contributed to relative performance as well. We believe the company still has an inexpensive valuation.
Conversely, the Fund’s stock selection in Brazil detracted from performance. At the individual stock level, detractors included the Fund’s holdings in the Brazilian pharmaceutical company Hypermarcas S/A, which fell sharply as the firm’s organic growth rate declined, in part because of inventory destocking. We remain positive about the stock’s longer-term outlook and continue to hold it in the Fund. The Fund’s position in Cemex, a Mexico-based cement manufacturer, also detracted from performance, primarily because of concerns about the company’s high leverage and continued weakness in the U.S. housing market.
The Fund’s holdings in Avon Products, one of the top positions in the Fund, underperformed due to disappointing earnings and ongoing investigations by the U.S. Securities and Exchange Commission. We continue to believe that Avon has one of the best models for capitalizing on consumers in emerging markets. Despite the company’s setbacks, we believe that the strength of the franchise remains intact and that the stock trades at a discount to our estimates of its intrinsic value.
5
Portfolio management review
Delaware Emerging Markets Fund
Over the near term, we believe that emerging markets will remain highly volatile as the euro-zone sovereign debt crisis plays out, global economic growth decelerates, and risk aversion continues unabated. However, the steep decline in many emerging markets during the last several months of the Fund’s fiscal year caused nominal and relative valuations to contract to levels that may already discount some or all of these headwinds.
It is important to note that the Fund maintains a long-term investment horizon that looks beyond transitory issues at both the macroeconomic and microeconomic levels. From that perspective, we believe the secular backdrop for emerging market equities remains bright. In coming years, we expect economic growth rates in most developing economies to stay significantly above those in the U.S., Europe, and Japan, bolstered by less government debt, positive fiscal and trade balances, rising disposable incomes, high levels of infrastructure spending, meaningful economic reform, greater political and financial transparency, and improved corporate governance.
While many investors are understandably nervous about the unsettled global economic environment and its effects on stock prices, the Fund’s investment managers are committed to a disciplined process of seeking to identify businesses with strong franchises and positive long-term growth prospects — and which trade at discounts to our estimates of their intrinsic value. We believe that these types of companies may have the potential to not only survive in today’s turbulent world economic environment but to thrive when markets become more stable.
6
| Delaware Global Value Fund | December 6, 2011 |
| Performance preview (for the year ended November 30, 2011) | | | | |
| Delaware Global Value Fund (Class A shares) | | 1-year return | | +0.55% |
| MSCI World Index (gross) | | 1-year return | | +2.02% |
| MSCI World Index (net) | | 1-year return | | -0.36% |
Past performance does not guarantee future results.
For complete, annualized performance for Delaware Global Value Fund, please see the table on page 16.
The performance of Class A shares excludes the applicable sales charge and reflects the reinvestment of all distributions.
Index performance returns do not reflect any management fees, transaction costs, or expenses. Indices are unmanaged and one cannot invest directly in an index.
Global equity markets in general finished the Fund’s fiscal year moderately lower, as solutions to serious debt issues in the United States and Europe failed to materialize. The deteriorating economic backdrop seemed to cause a change in market leadership from economically sensitive sectors to more defensive industries.
As the Fund’s fiscal year began, however, renewed confidence in the global economic recovery provided additional fuel for a sharp rally in global equity prices that started with the apparent resolution of the Greek sovereign debt crisis several months earlier. The Federal Reserve’s second round of quantitative easing, dubbed QE2, which formally began on Nov. 1, 2010, also bolstered investor sentiment. With QE2 exerting downward pressure on the U.S. dollar, commodity markets moved broadly higher, providing additional support for resource-rich emerging markets. Even Japan, stuck in a deflationary spiral for nearly two decades, appeared poised for recovery, aided by a leveling off of the fast-rising yen and indications that a global reflation cycle was under way.
By early spring 2011, however, clouds had begun to appear on the economic horizon. Though euro-zone debt issues were making fewer headlines, the region’s problems were never entirely resolved. Even after Greece was saved from default, bailouts were subsequently required for Ireland and Portugal, even as fears of inflation caused the European Central Bank (ECB) to tighten monetary policy and resist becoming the lender of last resort to the region’s struggling bond markets. Authorities in several emerging economies — mostly notably China — followed suit. Meanwhile, a tragic earthquake, tsunami, and nuclear crisis in Japan sent the country’s equity market sharply lower and disrupted global supply chains, particularly in the automotive and technology sectors. Rising commodity prices, in part the result of popular upheaval in the Middle East and Africa, also restrained consumer spending, as did political disarray, dysfunction, and gridlock in both Europe and the U.S.
The accumulated weight of these problems, along with weakening economic data and concerns about another credit crunch in Europe, eventually reached critical mass during summer and early fall 2011, which triggered extraordinary volatility and a steep selloff in global equity prices. Japan was the least affected, however, due to its geographic location and continuing economic rebound from the spring earthquake and tsunami. By October 2011, the future of the euro zone itself was in some doubt, with credit
7
Portfolio management review
Delaware Global Value Fund
spreads in Italy and Spain widening to what we believed were unsustainable levels and financing rates in Germany, France, and Belgium also moving higher.
As the Fund’s fiscal year drew to a close, key European political and institutional leaders engaged in urgent efforts to find a mutually agreeable solution to the debt crisis, which by then had also begun posing significant threats to the region’s banks. As the crisis lingered, global equity markets remained volatile, pushed to the upside by continued solid earnings growth and erroneous signs of a permanent euro-zone resolution, and to the downside by the increasingly plausible worst-case scenario involving the breakup of the euro zone.
Fund performance
For the fiscal year, ended Nov. 30, 2011, Delaware Global Value Fund returned +0.55% at net asset value (NAV) and -5.27% at maximum offer price (both figures are for Class A shares with all distributions reinvested). The Fund’s benchmark, the MSCI World Index (net), returned -0.36% for the same period. For the Fund’s complete, annualized performance information, please see the table on page 16.
In general, the modest contribution to performance by stock selection was offset by the negative effects of the Fund’s country allocations. The Fund’s holdings in Canada, Sweden, Japan, and Switzerland were primary contributors, while positions in the euro zone and Asia generally detracted from nominal and relative performance.
Notably, the Fund arrives at its country and sector allocations indirectly, as a result of identifying companies whose share prices are significantly below our estimates of their intrinsic values. By definition, these types of businesses are often viewed as being out of favor, and thus particularly suitable for a longer-term, buy-and-hold approach.
In the absence of a worst-case outcome in the euro zone, we believe that global equity markets in late October 2011 may have reached at least an interim low. But without a clear and favorable resolution to the sovereign debt crisis, volatility and risk aversion is likely to remain elevated. In the context of an unusually sluggish and uneven global economic recovery, we believe that corporate earnings estimates for 2012 are too high and may need to be adjusted downward. If we are correct, such downgrades would likely act as a headwind on stock prices. Notably, additional moves by the Fed to stimulate the U.S. economy — perhaps with the introduction of a third round of quantitative easing — could meet explicit opposition from some members of Congress. However, there does appear to be scope for monetary easing in Europe, especially given a recent change in leadership at the ECB.
While investor sentiment has remained focused on macroeconomic and political factors for an unusually extended period, history has shown that business-specific fundamentals tend to prevail over time. As always, the Fund’s strategy will be to identify and understand each company’s degree of exposure to the myriad changing risk factors in the global economy, favoring those businesses whose unique competitive strengths outweigh their risk exposures, while seeking to avoid those whose prospects largely rest on speculative political or economic outcomes, no matter how compelling those outcomes may be.
8
It is important to view the current unsettled economic environment as a potential opportunity to acquire companies that are globally competitive, financially flexible, and expertly managed. Over the near term, of course, enthusiasm for such companies should be tempered by the sober realization that the economic and political dislocations that created those opportunities are deeply rooted. Still, we believe that constructing a portfolio of sound businesses trading at what are attractive prices to us could provide a solid foundation for long-term performance potential as the global economic storm weakens and fades into history.
9
| Performance summaries | |
| Delaware International Value Equity Fund | November 30, 2011 |
The performance data quoted represent past performance; past performance does not guarantee future results. Investment return and principal value will fluctuate so your shares, when redeemed, may be worth more or less than their original cost. Please obtain the performance data current for the most recent month end by calling 800 523-1918 or visiting our website at www.delawareinvestments.com/performance. Current performance may be lower or higher than the performance data quoted.
| Fund performance1,2 | Average annual total returns through November 30, 2011 |
| | 1 year | | 5 years | | 10 years | | Lifetime | |
| Class A (Est. Oct. 31, 1991) | | | | | | | | | |
| Excluding sales charge | | -6.64% | | -4.24% | | +4.97% | | n/a | |
| Including sales charge | | -12.04% | | -5.37% | | +4.35% | | n/a | |
| Class B (Est. Sept. 6, 1994) | | | | | | | | | |
| Excluding sales charge | | -7.35% | | -4.93% | | +4.38% | | n/a | |
| Including sales charge | | -11.04% | | -5.30% | | +4.38% | | n/a | |
| Class C (Est. Nov. 29, 1995) | | | | | | | | | |
| Excluding sales charge | | -7.35% | | -4.92% | | +4.23% | | n/a | |
| Including sales charge | | -8.27% | | -4.92% | | +4.23% | | n/a | |
| Class R (Est. June 2, 2003) | | | | | | | | | |
| Excluding sales charge | | -6.85% | | -4.43% | | n/a | | +5.54% | |
| Including sales charge | | -6.85% | | -4.43% | | n/a | | +5.54% | |
| Institutional Class (Est. Nov. 9, 1992) | | | | | | | | | |
| Excluding sales charge | | -6.36% | | -3.95% | | +5.28% | | n/a | |
| Including sales charge | | -6.36% | | -3.95% | | +5.28% | | n/a | |
1 Returns reflect the reinvestment of all distributions and are presented both with and without the applicable sales charges described below. Returns do not reflect the deduction of taxes the shareholder would pay on Fund distributions or redemptions of Fund shares.
Expense limitations were in effect for certain classes during some or all of the periods shown in the “Fund performance” chart. The current expenses for each class are listed on the “Fund expense ratios” table on page 11. Performance would have been lower had expense limitations not been in effect.
Class A shares are sold with a maximum front-end sales charge of up to 5.75%, and have an annual distribution and service fee of up to 0.30% of average daily net assets.
Class B shares may be purchased only through dividend reinvestment and certain permitted exchanges as described in the prospectus. Please see the prospectus for additional information on Class B shares. Class B shares have a contingent deferred sales charge that declines from 4.00% to zero depending on the period of time the shares are held. They are also subject to an annual distribution and service fee of up to 1.00% of average daily net assets. Class B shares will automatically convert to Class A shares on a quarterly basis
10
approximately eight years after purchase. Ten-year and lifetime performance figures for Class B shares reflect conversion to Class A shares after approximately eight years.
Class C shares are sold with a contingent deferred sales charge of 1.00% if redeemed during the first 12 months. They are also subject to an annual distribution and service fee of up to 1.00% of average daily net assets.
Performance for Class B and C shares, excluding sales charges, assumes either that contingent deferred sales charges did not apply or that the investment was not redeemed.
Class R shares are available only for certain retirement plan products. They are sold without a sales charge and have an annual distribution and service fee of up to 0.60% of average daily net assets, which has been limited contractually to 0.50% from March 30, 2011, through March 29, 2012.
Institutional Class shares are available without sales or asset-based distribution charges only to certain eligible institutional accounts.
The “Fund performance” table and the “Performance of a $10,000 investment” graph do not reflect the deduction of taxes the shareholder would pay on Fund distributions or redemptions of Fund shares.
International investments entail risks not ordinarily associated with U.S. investments including fluctuation in currency values, differences in accounting principles, or economic or political instability in other nations. Investing in emerging markets can be riskier than investing in established foreign markets due to increased volatility and lower trading volume.
2 The Fund’s expense ratios, as described in the most recent prospectus, are disclosed in the following “Fund expense ratios” table. Delaware Investments has agreed to reimburse certain expenses and/or waive certain fees in order to prevent total fund operating expenses (excluding certain fees and expenses) from exceeding 1.30% of the Fund’s average daily net assets from March 30, 2011, through March 29, 2012. Please see the most recent prospectus and any applicable supplement(s) for additional information on these fee waivers and/or reimbursements.
| Fund expense ratios | Class A | | Class B | | Class C | | Class R | | Institutional Class |
| Total annual operating expenses | 1.69 | % | | 2.39 | % | | 2.39 | % | | 1.99 | % | | 1.39 | % |
| (without fee waivers) | | | | | | | | | | | | | | |
| Net expenses | 1.60 | % | | 2.30 | % | | 2.30 | % | | 1.80 | % | | 1.30 | % |
| (including fee waivers, if any) | | | | | | | | | | | | | | |
| Type of waiver | Contractual | | Contractual | | Contractual | | Contractual | | Contractual |
11
Performance summaries
Delaware International Value Equity Fund
Performance of a $10,000 investment1
Average annual total returns from Nov. 30, 2001, through Nov. 30, 2011
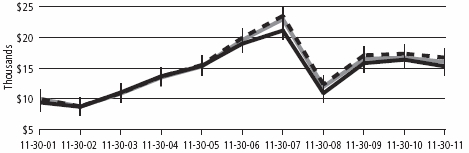
| For period beginning Nov. 30, 2001, through Nov. 30, 2011 | Starting value | Ending value |
| | MSCI EAFE Index (gross) | $10,000 | $16,731 |
| | MSCI EAFE Index (net) | $10,000 | $16,023 |
| | Delaware International Value Equity Fund —
Class A Shares | $9,425 | $15,303 |
1 The “Performance of a $10,000 investment” graph assumes $10,000 invested in Class A shares of the Fund on Nov. 30, 2001, and includes the effect of a 5.75% front-end sales charge and the reinvestment of all distributions. The graph does not reflect the deduction of taxes the shareholders would pay on Fund distributions or redemptions of Fund shares. Expense limitations were in effect for some or all of the periods shown. Performance would have been lower had expense limitations not been in effect. Current expenses are listed in the “Fund expense ratios” table on page 11. Please note additional details on pages 10 through 12.
The chart also assumes $10,000 invested in the MSCI EAFE Index as of Nov. 30, 2001. The MSCI EAFE Index measures equity market performance across developed market countries in Europe, Australasia, and the Far East. Index “gross” return approximates the maximum possible dividend reinvestment. Index “net” return approximates the minimum possible dividend reinvestment, after deduction of withholding tax at the highest possible rate.
Index performance returns do not reflect any management fees, transaction costs, or expenses. Indices are unmanaged and one cannot invest directly in an index. Past performance is not a guarantee of future results.
Performance of other Fund classes will vary due to different charges and expenses.
| | Nasdaq symbols | | CUSIPs | |
| Class A | | | DEGIX | | | 245914106 | |
| Class B | | | DEIEX | | | 245914700 | |
| Class C | | | DEGCX | | | 245914858 | |
| Class R | | | DIVRX | | | 245914577 | |
| Institutional Class | | | DEQIX | | | 245914403 | |
12
| Delaware Emerging Markets Fund | November 30, 2011 |
The performance data quoted represent past performance; past performance does not guarantee future results. Investment return and principal value will fluctuate so your shares, when redeemed, may be worth more or less than their original cost. Please obtain the performance data current for the most recent month end by calling 800 523-1918 or visiting our website at www.delawareinvestments.com/performance. Current performance may be lower or higher than the performance data quoted.
| Fund performance1,2 | Average annual total returns through November 30, 2011 |
| | 1 year | | 5 years | | 10 years | | Lifetime | |
| Class A (Est. June 10, 1996) | | | | | | | | | |
| Excluding sales charge | | -11.70% | | +4.58% | | +16.24% | | n/a | |
| Including sales charge | | -16.80% | | +3.35% | | +15.56% | | n/a | |
| Class B (Est. June 10, 1996) | | | | | | | | | |
| Excluding sales charge | | -12.36% | | +3.81% | | +15.56% | | n/a | |
| Including sales charge | | -15.80% | | +3.58% | | +15.56% | | n/a | |
| Class C (Est. June 10, 1996) | | | | | | | | | |
| Excluding sales charge | | -12.31% | | +3.81% | | +15.39% | | n/a | |
| Including sales charge | | -13.19% | | +3.81% | | +15.39% | | n/a | |
| Class R (Est. Aug. 31, 2009) | | | | | | | | | |
| Excluding sales charge | | -11.93% | | n/a | | n/a | | +6.16% | |
| Including sales charge | | -11.93% | | n/a | | n/a | | +6.16% | |
| Institutional Class (Est. June 10, 1996) | | | | | | | |
| Excluding sales charge | | -11.42% | | +4.85% | | +16.55% | | n/a | |
| Including sales charge | | -11.42% | | +4.85% | | +16.55% | | n/a | |
1 Returns reflect the reinvestment of all distributions and are presented both with and without the applicable sales charges described below. Returns do not reflect the deduction of taxes the shareholder would pay on Fund distributions or redemptions of Fund shares.
Expense limitations were in effect for certain classes during some or all of the periods shown in the “Fund performance” chart. The current expenses for each class are listed on the “Fund expense ratios” table on page 14. Performance would have been lower had expense limitations not been in effect.
Class A shares are sold with a maximum front-end sales charge of up to 5.75%, and have an annual distribution and service fee of up to 0.30% of average daily net assets. This fee has been contractually limited to 0.25% of average daily net assets from March 30, 2011, through March 29, 2012.
Class B shares may be purchased only through dividend reinvestment and certain permitted exchanges as described in the prospectus. Please see the prospectus for additional information on Class B shares. Class B shares have a contingent deferred sales charge that declines from 4.00% to zero depending on the period of time the shares are held. They are also subject to an annual distribution and service fee of up to 1.00% of average daily
13
Performance summaries
Delaware Emerging Markets Fund
net assets. Class B shares will automatically convert to Class A shares on a quarterly basis approximately eight years after purchase. Ten-year and lifetime performance figures for Class B shares reflect conversion to Class A shares after approximately eight years.
Class C shares are sold with a contingent deferred sales charge of 1.00% if redeemed during the first 12 months. They are also subject to an annual distribution and service fee of up to 1.00% of average daily net assets.
Performance for Class B and C shares, excluding sales charges, assumes either that contingent deferred sales charges did not apply or that the investment was not redeemed.
Class R shares are available only for certain retirement plan products. They are sold without a sales charge and have an annual distribution and service fee of up to 0.60% of average daily net assets, which has been limited contractually to 0.50% from March 30, 2011, through March 29, 2012.
Institutional Class shares are available without sales or asset-based distribution charges only to certain eligible institutional accounts.
The “Fund performance” table and the “Performance of a $10,000 investment” graph do not reflect the deduction of taxes the shareholder would pay on Fund distributions or redemptions of Fund shares.
International investments entail risks not ordinarily associated with U.S. investments including fluctuation in currency values, differences in accounting principles, or economic or political instability in other nations. Investing in emerging markets can be riskier than investing in established foreign markets due to increased volatility and lower trading volume.
High yielding, noninvestment grade bonds (junk bonds) involve higher risk than investment grade bonds. The high yield secondary market is particularly susceptible to liquidity problems when institutional investors, such as mutual funds and certain other financial institutions, temporarily stop buying bonds for regulatory, financial, or other reasons. In addition, a less liquid secondary market makes it more difficult for the Fund to obtain precise valuations of the high yield securities in its portfolio.
2 The Fund’s expense ratios, as described in the most recent prospectus, are disclosed in the following “Fund expense ratios” table. Delaware Investments has agreed to reimburse certain expenses and/or waive certain fees in order to prevent total fund operating expenses (excluding certain fees and expenses) from exceeding 1.60% of the Fund’s average daily net assets from March 30, 2011, through March 29, 2012. Please see the most recent prospectus and any applicable supplement(s) for additional information on these fee waivers and/or reimbursements.
| Fund expense ratios | Class A | | Class B | | Class C | | Class R | | Institutional Class |
| Total annual operating expenses | 1.90 | % | | 2.60 | % | | 2.60 | % | | 2.20 | % | | 1.60 | % |
| (without fee waivers) | | | | | | | | | | | | | | |
| Net expenses | 1.85 | % | | 2.60 | % | | 2.60 | % | | 2.10 | % | | 1.60 | % |
| (including fee waivers, if any) | | | | | | | | | | | | | | |
| Type of waiver | Contractual | | Contractual | | Contractual | | Contractual | | Contractual |
14
Performance of a $10,000 investment1
Average annual total returns from Nov. 30, 2001, through Nov. 30, 2011
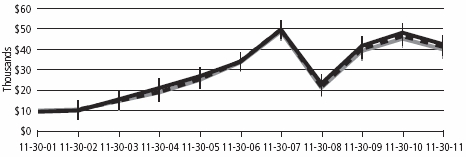
| For period beginning Nov. 30, 2001, through Nov. 30, 2011 | Starting value | Ending value |
| | Delaware Emerging Markets Fund — Class A Shares | $9,425 | $42,454 |
| | MSCI Emerging Markets Index (gross) | $10,000 | $41,203 |
| | MSCI Emerging Markets Index (net) | $10,000 | $39,975 |
1 The “Performance of a $10,000 investment” graph assumes $10,000 invested in Class A shares of the Fund on Nov. 30, 2001, and includes the effect of a 5.75% front-end sales charge and the reinvestment of all distributions. The graph does not reflect the deduction of taxes the shareholders would pay on Fund distributions or redemptions of Fund shares. Expense limitations were in effect for some or all of the periods shown. Performance would have been lower had expense limitations not been in effect. Current expenses are listed in the “Fund expense ratios” table on page 14. Please note additional details on pages 13 through 15.
The chart also assumes $10,000 invested in the MSCI Emerging Markets Index as of Nov. 30, 2001. The MSCI Emerging Markets Index measures equity market performance across emerging market countries worldwide. Index “gross” return approximates the maximum possible dividend reinvestment. Index “net” return approximates the minimum possible dividend reinvestment, after deduction of withholding tax at the highest possible rate.
Index performance returns do not reflect any management fees, transaction costs, or expenses. Indices are unmanaged and one cannot invest directly in an index. Past performance is not a guarantee of future results.
Performance of other Fund classes will vary due to different charges and expenses.
| | Nasdaq symbols | | CUSIPs | |
| Class A | | | DEMAX | | | 245914841 | |
| Class B | | | DEMBX | | | 245914833 | |
| Class C | | | DEMCX | | | 245914825 | |
| Class R | | | DEMRX | | | 245914569 | |
| Institutional Class | | | DEMIX | | | 245914817 | |
15
| Performance summaries | |
| Delaware Global Value Fund | November 30, 2011 |
The performance data quoted represent past performance; past performance does not guarantee future results. Investment return and principal value will fluctuate so your shares, when redeemed, may be worth more or less than their original cost. Please obtain the performance data current for the most recent month end by calling 800 523-1918 or visiting our website at www.delawareinvestments.com/performance. Current performance may be lower or higher than the performance data quoted.
| Fund performance1,2 | Average annual total returns through November 30, 2011 |
| | 1 year | | 5 years | | 10 years | | Lifetime | |
| Class A (Est. Dec. 19, 1997) | | | | | | | | | |
| Excluding sales charge | | +0.55% | | -3.59% | | +6.67% | | n/a | |
| Including sales charge | | -5.27% | | -4.73% | | +6.04% | | n/a | |
| Class B (Est. Sept. 28, 2001) | | | | | | | | | |
| Excluding sales charge | | -0.24% | | -4.30% | | +6.03% | | n/a | |
| Including sales charge | | -4.24% | | -4.64% | | +6.03% | | n/a | |
| Class C (Est. Sept. 28, 2001) | | | | | | | | | |
| Excluding sales charge | | -0.24% | | -4.32% | | +5.87% | | n/a | |
| Including sales charge | | -1.24% | | -4.32% | | +5.87% | | n/a | |
| Institutional Class (Est. Dec. 19, 1997) | | | | | | | | | |
| Excluding sales charge | | +0.65% | | -3.37% | | +6.94% | | n/a | |
| Including sales charge | | +0.65% | | -3.37% | | +6.94% | | n/a | |
1 Returns reflect the reinvestment of all distributions and are presented both with and without the applicable sales charges described below. Returns do not reflect the deduction of taxes the shareholder would pay on Fund distributions or redemptions of Fund shares.
Expense limitations were in effect for certain classes during some or all of the periods shown in the “Fund performance” chart. The current expenses for each class are listed on the “Fund expense ratios” table on page 17. Performance would have been lower had expense limitations not been in effect.
Class A shares are sold with a maximum front-end sales charge of up to 5.75%, and have an annual distribution and service fee of up to 0.30% of average daily net assets. This fee has been contractually limited to 0.25% of average daily net assets from March 30, 2011, through March 29, 2012.
Class B shares may be purchased only through dividend reinvestment and certain permitted exchanges as described in the prospectus. Please see the prospectus for additional information on Class B shares. Class B shares have a contingent deferred sales charge that declines from 4.00% to zero depending on the period of time the shares are held. They are also subject to an annual distribution and service fee of up to 1.00% of average daily net assets. Class B shares will automatically convert to Class A shares on a quarterly basis approximately eight years after purchase. Ten-year and lifetime performance figures for Class B shares reflect conversion to Class A shares after approximately eight years.
16
Class C shares are sold with a contingent deferred sales charge of 1.00% if redeemed during the first 12 months. They are also subject to an annual distribution and service fee of up to 1.00% of average daily net assets.
Performance for Class B and C shares, excluding sales charges, assumes either that contingent deferred sales charges did not apply or that the investment was not redeemed.
Institutional Class shares are available without sales or asset-based distribution charges only to certain eligible institutional accounts.
The “Fund performance” table and the “Performance of a $10,000 investment” graph do not reflect the deduction of taxes the shareholder would pay on Fund distributions or redemptions of Fund shares.
International investments entail risks not ordinarily associated with U.S. investments including fluctuation in currency values, differences in accounting principles, or economic or political instability in other nations. Investing in emerging markets can be riskier than investing in established foreign markets due to increased volatility and lower trading volume.
Investments in small and/or medium-sized companies typically exhibit greater risk and higher volatility than larger, more established companies.
2 The Fund’s expense ratios, as described in the most recent prospectus, are disclosed in the following “Fund expense ratios” table. Delaware Investments has agreed to reimburse certain expenses and/or waive certain fees in order to prevent total fund operating expenses (excluding certain fees and expenses) from exceeding 1.30% of the Fund’s average daily net assets from March 30, 2011, through March 29, 2012. Please see the most recent prospectus and any applicable supplement(s) for additional information on these fee waivers and/or reimbursements.
| Fund expense ratios | | Class A | | Class B | | Class C | | Institutional Class |
| Total annual operating expenses | | 2.07 | % | | 2.77 | % | | 2.77 | % | | 1.77 | % |
| (without fee waivers) | | | | | | | | | | | | |
| Net expenses | | 1.55 | % | | 2.30 | % | | 2.30 | % | | 1.30 | % |
| (including fee waivers, if any) | | | | | | | | | | | | |
| Type of waiver | | Contractual | | Contractual | | Contractual | | Contractual |
17
Performance summaries
Delaware Global Value Fund
Performance of a $10,000 investment1
Average annual total returns from Nov. 30, 2001, through Nov. 30, 2011
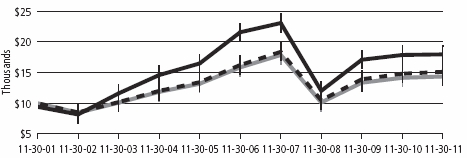
| For period beginning Nov. 30, 2001, through Nov. 30, 2011 | Starting value | Ending value |
| | Delaware Global Value Fund — Class A Shares | $9,425 | $17,972 |
| | MSCI World Index (gross) | $10,000 | $15,121 |
| | MSCI World Index (net) | $10,000 | $14,364 |
1 The “Performance of a $10,000 investment” graph assumes $10,000 invested in Class A shares of the Fund on Nov. 30, 2001, and includes the effect of a 5.75% front-end sales charge and the reinvestment of all distributions. The graph does not reflect the deduction of taxes the shareholders would pay on Fund distributions or redemptions of Fund shares. Expense limitations were in effect for some or all of the periods shown. Performance would have been lower had expense limitations not been in effect. Current expenses are listed in the “Fund expense ratios” table on page 17. Please note additional details on pages 16 through 18.
The chart also assumes $10,000 invested in the MSCI World Index as of Nov. 30, 2001. The MSCI World Index is a free float-adjusted market capitalization weighted index designed to measure equity market performance across developed markets worldwide. Index “gross” return approximates the maximum possible dividend reinvestment. Index “net” return approximates the minimum possible dividend reinvestment, after deduction of withholding tax at the highest possible rate.
Index performance returns do not reflect any management fees, transaction costs, or expenses. Indices are unmanaged and one cannot invest directly in an index. Past performance is not a guarantee of future results.
Performance of other Fund classes will vary due to different charges and expenses.
| | Nasdaq symbols | | CUSIPs | |
| Class A | | | DABAX | | | 245914718 | |
| Class B | | | DABBX | | | 245914692 | |
| Class C | | | DABCX | | | 245914684 | |
| Institutional Class | | | DABIX | | | 245914676 | |
18
Disclosure of Fund expenses
For the six-month period from June 1, 2011 to November 30, 2011
As a shareholder of a Fund, you incur two types of costs: (1) transaction costs, including sales charges (loads) on purchase payments, reinvested dividends, or other distributions; redemption fees; and exchange fees; and (2) ongoing costs, including management fees; distribution and/or service (12b-1) fees; and other Fund expenses. These following examples are intended to help you understand your ongoing costs (in dollars) of investing in a Fund and to compare these costs with the ongoing costs of investing in other mutual funds.
The examples are based on an investment of $1,000 invested at the beginning of the period and held for the entire six-month period from June 1, 2011 to November 30, 2011.
Actual expenses
The first section of the tables shown, “Actual Fund return,” provides information about actual account values and actual expenses. You may use the information in this section of the table, together with the amount you invested, to estimate the expenses that you paid over the period. Simply divide your account value by $1,000 (for example, an $8,600 account value divided by $1,000 = 8.6), then multiply the result by the number in the first section under the heading entitled “Expenses Paid During Period” to estimate the expenses you paid on your account during this period.
Hypothetical example for comparison purposes
The second section of the tables shown, “Hypothetical 5% return,” provides information about hypothetical account values and hypothetical expenses based on the Funds’ actual expense ratios and an assumed rate of return of 5% per year before expenses, which is not the Funds’ actual return. The hypothetical account values and expenses may not be used to estimate the actual ending account balance or expenses you paid for the period. You may use this information to compare the ongoing costs of investing in the Funds and other funds. To do so, compare this 5% hypothetical example with the 5% hypothetical examples that appear in the shareholder reports of the other funds.
Please note that the expenses shown in the tables are meant to highlight your ongoing costs only and do not reflect any transactional costs, such as sales charges (loads), redemption fees, or exchange fees. Therefore, the second section of each table is useful in comparing ongoing costs only, and will not help you determine the relative total costs of owning different funds. In addition, if these transactional costs were included, your costs would have been higher. The expenses shown in the tables reflect fee waivers in effect for Delaware International Value Equity and Delaware Global Value Fund. The expenses shown in each table assume reinvestment of all dividends and distributions.
20
Delaware International Value Equity Fund
Expense analysis of an investment of $1,000
| | Beginning | | Ending | | | | | | | Expenses |
| | Account Value | | Account Value | | Annualized | | Paid During Period |
| | 6/1/11 | | 11/30/11 | | Expense Ratio | | 6/1/11 to 11/30/11* |
| Actual Fund return | | | | | | | | | | | | | | | | | | | | |
| Class A | | | $ | 1,000.00 | | | | $ | 771.60 | | | | 1.56 | % | | | | $ | 6.93 | |
| Class B | | | | 1,000.00 | | | | | 767.90 | | | | 2.26 | % | | | | | 10.02 | |
| Class C | | | | 1,000.00 | | | | | 768.30 | | | | 2.26 | % | | | | | 10.02 | |
| Class R | | | | 1,000.00 | | | | | 770.20 | | | | 1.76 | % | | | | | 7.81 | |
| Institutional Class | | | | 1,000.00 | | | | | 772.60 | | | | 1.26 | % | | | | | 5.60 | |
| Hypothetical 5% return (5% return before expenses) | | | | | | | | | | | |
| Class A | | | $ | 1,000.00 | | | | $ | 1,017.25 | | | | 1.56 | % | | | | $ | 7.89 | |
| Class B | | | | 1,000.00 | | | | | 1,013.74 | | | | 2.26 | % | | | | | 11.41 | |
| Class C | | | | 1,000.00 | | | | | 1,013.74 | | | | 2.26 | % | | | | | 11.41 | |
| Class R | | | | 1,000.00 | | | | | 1,016.24 | | | | 1.76 | % | | | | | 8.90 | |
| Institutional Class | | | | 1,000.00 | | | | | 1,018.75 | | | | 1.26 | % | | | | | 6.38 | |
Delaware Emerging Markets Fund
Expense analysis of an investment of $1,000
| | Beginning | | Ending | | | | | | | Expenses |
| | Account Value | | Account Value | | Annualized | | Paid During Period |
| | 6/1/11 | | 11/30/11 | | Expense Ratio | | 6/1/11 to 11/30/11* |
| Actual Fund return | | | | | | | | | | | | | | | | | | | | |
| Class A | | | $ | 1,000.00 | | | | $ | 796.20 | | | | 1.75 | % | | | | $ | 7.88 | |
| Class B | | | | 1,000.00 | | | | | 794.20 | | | | 2.50 | % | | | | | 11.24 | |
| Class C | | | | 1,000.00 | | | | | 793.80 | | | | 2.50 | % | | | | | 11.24 | |
| Class R | | | | 1,000.00 | | | | | 795.40 | | | | 2.00 | % | | | | | 9.00 | |
| Institutional Class | | | | 1,000.00 | | | | | 797.60 | | | | 1.50 | % | | | | | 6.76 | |
| Hypothetical 5% return (5% return before expenses) | | | | | | | | | | | |
| Class A | | | $ | 1,000.00 | | | | $ | 1,016.29 | | | | 1.75 | % | | | | $ | 8.85 | |
| Class B | | | | 1,000.00 | | | | | 1,012.53 | | | | 2.50 | % | | | | | 12.61 | |
| Class C | | | | 1,000.00 | | | | | 1,012.53 | | | | 2.50 | % | | | | | 12.61 | |
| Class R | | | | 1,000.00 | | | | | 1,015.04 | | | | 2.00 | % | | | | | 10.10 | |
| Institutional Class | | | | 1,000.00 | | | | | 1,017.55 | | | | 1.50 | % | | | | | 7.59 | |
21
Disclosure of Fund expenses
Delaware Global Value Fund
Expense analysis of an investment of $1,000
| | Beginning | | Ending | | | | | | | Expenses |
| | Account Value | | Account Value | | Annualized | | Paid During Period |
| | 6/1/11 | | 11/30/11 | | Expense Ratio | | 6/1/11 to 11/30/11* |
| Actual Fund return | | | | | | | | | | | | | | | | | | | | |
| Class A | | | $ | 1,000.00 | | | | $ | 840.20 | | | | 1.55 | % | | | | $ | 7.15 | |
| Class B | | | | 1,000.00 | | | | | 836.80 | | | | 2.30 | % | | | | | 10.59 | |
| Class C | | | | 1,000.00 | | | | | 836.80 | | | | 2.30 | % | | | | | 10.59 | |
| Institutional Class | | | | 1,000.00 | | | | | 840.70 | | | | 1.30 | % | | | | | 6.00 | |
| Hypothetical 5% return (5% return before expenses) | | | | | | | | | | | |
| Class A | | | $ | 1,000.00 | | | | $ | 1,017.30 | | | | 1.55 | % | | | | $ | 7.84 | |
| Class B | | | | 1,000.00 | | | | | 1,013.54 | | | | 2.30 | % | | | | | 11.61 | |
| Class C | | | | 1,000.00 | | | | | 1,013.54 | | | | 2.30 | % | | | | | 11.61 | |
| Institutional Class | | | | 1,000.00 | | | | | 1,018.55 | | | | 1.30 | % | | | | | 6.58 | |
*“Expenses Paid During Period” are equal to the relevant Fund’s annualized expense ratio, multiplied by the average account value over the period, multiplied by 183/365 (to reflect the one-half year period).
22
| Security type/country/sector allocations | |
| Delaware International Value Equity Fund | As of November 30, 2011 |
Sector designations may be different than the sector designations presented in other Fund materials. The sector designations may represent the investment manager’s internal sector classifications, which may result in the sector designations for one fund being different than another fund’s sector designations.
| Security type/country | Percentage of net assets |
| Common Stock by Country | 97.04 | % |
| Australia | 2.47 | % |
| Brazil | 2.17 | % |
| Canada | 10.35 | % |
| China/Hong Kong | 7.13 | % |
| France | 18.41 | % |
| Germany | 3.95 | % |
| Israel | 3.63 | % |
| Japan | 13.24 | % |
| Netherlands | 0.57 | % |
| Panama | 1.03 | % |
| Republic of Korea | 0.98 | % |
| Russia | 1.35 | % |
| Spain | 0.25 | % |
| Sweden | 4.17 | % |
| Switzerland | 6.02 | % |
| Taiwan | 0.88 | % |
| Thailand | 0.53 | % |
| United Kingdom | 18.88 | % |
| United States | 1.03 | % |
| Short-Term Investments | 2.12 | % |
| Securities Lending Collateral | 2.75 | % |
| Total Value of Securities | 101.91 | % |
| Obligation to Return Securities Lending Collateral | (3.39 | %) |
| Receivables and Other Assets Net of Other Liabilities | 1.48 | % |
| Total Net Assets | 100.00 | % |
23
Security type/country/sector allocations
Delaware International Value Equity Fund
| Common Stock by Sector | Percentage of net assets |
| Consumer Discretionary | 13.75 | % |
| Consumer Staples | 11.87 | % |
| Energy | 7.80 | % |
| Financials | 7.89 | % |
| Healthcare | 11.77 | % |
| Industrials | 14.76 | % |
| Information Technology | 7.03 | % |
| Materials | 10.86 | % |
| Telecommunication Services | 7.65 | % |
| Utilities | 3.66 | % |
| Total | 97.04 | % |
24
| Delaware Emerging Markets Fund | As of November 30, 2011 |
Sector designations may be different than the sector designations presented in other Fund materials. The sector designations may represent the investment manager’s internal sector classifications, which may result in the sector designations for one fund being different than another fund’s sector designations.
| Security type/country | Percentage of net assets |
| Common Stock by Country | 96.13 | % |
| Argentina | 2.12 | % |
| Australia | 0.14 | % |
| Brazil | 15.54 | % |
| China/Hong Kong | 16.98 | % |
| Hungary | 0.37 | % |
| India | 3.31 | % |
| Indonesia | 0.19 | % |
| Israel | 0.33 | % |
| Kingdom of Bahrain | 0.07 | % |
| Malaysia | 1.91 | % |
| Mexico | 3.89 | % |
| Peru | 0.80 | % |
| Philippines | 0.36 | % |
| Poland | 0.59 | % |
| Republic of Korea | 15.44 | % |
| Russia | 5.98 | % |
| South Africa | 6.25 | % |
| Taiwan | 5.60 | % |
| Thailand | 2.10 | % |
| Turkey | 1.47 | % |
| United Kingdom | 1.06 | % |
| United States | 11.63 | % |
| Convertible Preferred Stock | 0.70 | % |
| Participation Notes | 0.00 | % |
| Preferred Stock | 2.64 | % |
| Securities Lending Collateral | 7.71 | % |
| Total Value of Securities | 107.18 | % |
| Obligation to Return Securities Lending Collateral | (7.72 | %) |
| Receivables and Other Assets Net of Other Liabilities | 0.54 | % |
| Total Net Assets | 100.00 | % |
25
Security type/country/sector allocations
Delaware Emerging Markets Fund
| Commons Stock, Convertible Preferred Stock, Participation Notes and Preferred Stock by Sector | Percentage of net assets |
| Consumer Discretionary | 4.14 | % |
| Consumer Staples | 16.14 | % |
| Energy | 14.71 | % |
| Financials | 14.10 | % |
| Healthcare | 0.12 | % |
| Industrials | 4.84 | % |
| Information Technology | 17.82 | % |
| Materials | 12.95 | % |
| Telecommunication Services | 12.53 | % |
| Utilities | 2.12 | % |
| Total | 99.47 | % |
26
| Delaware Global Value Fund | As of November 30, 2011 |
Sector designations may be different than the sector designations presented in other Fund materials. The sector designations may represent the investment manager’s internal sector classifications, which may result in the sector designations for one fund being different than another fund’s sector designations.
| Sector type/country | Percentage of net assets |
| Common Stock by Country | 99.28 | % |
| Australia | 1.52 | % |
| Brazil | 1.01 | % |
| Canada | 5.36 | % |
| China/Hong Kong | 3.91 | % |
| France | 8.52 | % |
| Germany | 1.83 | % |
| Israel | 2.31 | % |
| Japan | 6.64 | % |
| Netherlands | 0.36 | % |
| Panama | 0.69 | % |
| Republic of Korea | 0.64 | % |
| Russia | 0.89 | % |
| Spain | 0.25 | % |
| Sweden | 2.17 | % |
| Switzerland | 3.08 | % |
| Taiwan | 0.43 | % |
| Thailand | 0.36 | % |
| United Kingdom | 8.97 | % |
| United States | 50.34 | % |
| Short-Term Investment | 1.00 | % |
| Securities Lending Collateral | 1.41 | % |
| Total Value of Securities | 101.69 | % |
| Obligation to Return Securities Lending Collateral | (1.91 | %) |
| Receivables and Other Assets Net of Other Liabilities | 0.22 | % |
| Total Net Assets | 100.00 | % |
27
Security type/country/sector allocations
Delaware Global Value Fund
| Common Stock by Sector | Percentage of net assets |
| Consumer Discretionary | 11.86 | % |
| Consumer Staples | 9.14 | % |
| Energy | 6.79 | % |
| Financials | 9.80 | % |
| Healthcare | 14.64 | % |
| Industrials | 13.76 | % |
| Information Technology | 16.12 | % |
| Materials | 9.33 | % |
| Telecommunication Services | 6.34 | % |
| Utilities | 1.50 | % |
| Total | 99.28 | % |
28
| Statements of net assets | |
| Delaware International Value Equity Fund | November 30, 2011 |
| | | | Number of shares | | Value (U.S. $) |
| Common Stock – 97.04%Δ | | | | | |
| Australia – 2.47% | | | | | |
| Coca-Cola Amatil | | 473,002 | | $ | 5,772,088 |
| | | | | | 5,772,088 |
| Brazil – 2.17% | | | | | |
| Petroleo Brasileiro ADR | | 202,500 | | | 5,076,675 |
| | | | | | | 5,076,675 |
| Canada – 10.35% | | | | | |
| † | AuRico Gold | | 455,171 | | | 4,561,082 |
| † | CGI Group Class A | | 608,938 | | | 11,194,811 |
| Yamana Gold | | 500,336 | | | 8,437,866 |
| | | | | | 24,193,759 |
| China/Hong Kong – 7.13% | | | | | |
| CNOOC | | 2,731,000 | | | 5,305,204 |
| *† | Sohu.com | | 64,000 | | | 3,164,160 |
| * | Techtronic Industries | | 3,436,000 | | | 3,154,255 |
| Yue Yuen Industrial Holdings | | 1,730,000 | | | 5,041,847 |
| | | | | | 16,665,466 |
| France – 18.41% | | | | | |
| * | Alstom | | 97,755 | | | 3,385,114 |
| * | AXA | | 176,483 | | | 2,555,505 |
| Cie de Saint-Gobain | | 56,127 | | | 2,380,036 |
| * | Lafarge | | 47,580 | | | 1,739,217 |
| * | PPR | | 16,895 | | | 2,531,891 |
| Publicis Groupe | | 59,612 | | | 2,847,670 |
| Sanofi | | 104,895 | | | 7,337,259 |
| Teleperformance | | 247,446 | | | 4,882,522 |
| Total | | 127,890 | | | 6,598,419 |
| Vallourec | | 17,681 | | | 1,213,886 |
| Vivendi | | 327,147 | | | 7,546,271 |
| | | | | | 43,017,790 |
| Germany – 3.95% | | | | | |
| Bayerische Motoren Werke | | 51,469 | | | 3,901,859 |
| Deutsche Post | | 352,566 | | | 5,329,373 |
| | | | | | 9,231,232 |
| Israel – 3.63% | | | | | |
| Teva Pharmaceutical Industries ADR | | 214,200 | | | 8,484,462 |
| | | | | | 8,484,462 |
29
Statements of net assets
Delaware International Value Equity Fund
| | Number of shares | | Value (U.S. $) |
| Common Stock (continued) | | | | | | |
| Japan – 13.24% | | | | | | |
| | Asahi Glass | | | 286,900 | | $ | 2,456,287 |
| Don Quijote | | | 141,200 | | | 4,867,227 |
| East Japan Railway | | | 100,444 | | | 6,153,066 |
| ITOCHU | | | 487,660 | | | 4,956,431 |
| * | Mitsubishi UFJ Financial Group | | | 1,272,657 | | | 5,574,979 |
| Sumitomo Rubber Industries | | | 86,883 | | | 1,042,257 |
| Toyota Motor | | | 178,400 | | | 5,875,563 |
| | | | | | | 30,925,810 |
| Netherlands – 0.57% | | | | | | |
| Koninklijke Philips Electronics | | | 65,135 | | | 1,325,047 |
| | | | | | | 1,325,047 |
| Panama – 1.03% | | | | | | |
| Copa Holdings Class A | | | 37,300 | | | 2,408,088 |
| | | | | | | 2,408,088 |
| Republic of Korea – 0.98% | | | | | | |
| Hyundai Home Shopping Network | | | 22,855 | | | 2,290,276 |
| | | | | | | 2,290,276 |
| Russia – 1.35% | | | | | | |
| Mobile TeleSystems ADR | | | 181,700 | | | 3,139,776 |
| | | | | | | 3,139,776 |
| Spain – 0.25% | | | | | | |
| Promotora de Informaciones ADR | | | 110,842 | | | 586,354 |
| | | | | | | 586,354 |
| Sweden – 4.17% | | | | | | |
| Meda Class A | | | 514,871 | | | 5,022,346 |
| Nordea Bank | | | 593,000 | | | 4,721,098 |
| | | | | | | 9,743,444 |
| Switzerland – 6.02% | | | | | | |
| Aryzta | | | 153,519 | | | 7,411,766 |
| Novartis | | | 123,360 | | | 6,662,329 |
| | | | | | | 14,074,095 |
| Taiwan – 0.88% | | | | | | |
| HTC | | | 125,238 | | | 2,062,381 |
| | | | | | | 2,062,381 |
30
| | | Number of shares | | Value (U.S. $) |
| Common Stock (continued) | | | | | | | |
| Thailand – 0.53% | | | | | | | |
| Banpu NVDR | | | | 68,756 | | $ | 1,242,239 |
| | | | | | | | 1,242,239 |
| United Kingdom – 18.88% | | | | | | | |
| Greggs | | | | 934,954 | | | 7,307,019 |
| National Grid | | | | 869,871 | | | 8,551,758 |
| Rexam | | | | 1,270,010 | | | 6,889,147 |
| Rio Tinto | | | | 71,222 | | | 3,750,963 |
| Standard Chartered | | | | 256,401 | | | 5,584,191 |
| Tesco | | | | 1,135,736 | | | 7,254,014 |
| Vodafone Group | | | | 1,765,862 | | | 4,782,209 |
| | | | | | | | 44,119,301 |
| United States – 1.03% | | | | | | | |
| † | NII Holdings | | | | 104,700 | | | 2,409,147 |
| | | | | | | | 2,409,147 |
| Total Common Stock (cost $239,804,990) | | | | | | | 226,767,430 |
| | |
| | Principal | | | |
| | amount (U.S. $) | | | |
| Short-Term Investments – 2.12% | | | | | | | |
| ≠Discount Note – 0.11% | | | | | | | |
| Federal Home Loan Bank 0.01% 12/23/11 | | | $ | 269,359 | | | 269,357 |
| | | | | | | | 269,357 |
| Repurchase Agreement – 2.01% | | | | | | | |
| BNP Paribas 0.08%, dated 11/30/11, to be repurchased | | | | | | | |
| on 12/1/11, repurchase price $4,692,010 | | | | | | | |
| (collateralized by U.S. government obligations | | | | | | | |
| 0.00%-4.25% 1/13/12-5/15/21; | | | | | | | |
| market value $4,785,840) | | | | 4,692,000 | | | 4,692,000 |
| | | | | | | | 4,692,000 |
| Total Short-Term Investments (cost $4,961,357) | | | | | | | 4,961,357 |
| | | | | | | | |
| Total Value of Securities Before Securities | | | | | | | |
| Lending Collateral – 99.16% (cost $244,766,347) | | | | | | | 231,728,787 |
31
Statements of net assets
Delaware International Value Equity Fund
| | | Number of shares | | Value (U.S. $) | |
| Securities Lending Collateral** – 2.75% | | | | | | | |
| Investment Companies | | | | | | | |
| BNY Mellon SL DBT II Liquidating Fund | | | 603,586 | | $ | 583,426 | |
| Delaware Investments Collateral Fund No.1 | | | 5,849,075 | | | 5,849,075 | |
| @†Mellon GSL Reinvestment Trust II | | | 1,475,413 | | | 0 | |
| Total Securities Lending Collateral | | | | | | | |
| (cost $7,928,074) | | | | | | 6,432,501 | |
| | |
| Total Value of Securities – 101.91% | | | | | | | |
| (cost $252,694,421) | | | | | | 238,161,288 | © |
| Obligation to Return Securities | | | | | | | |
| Lending Collateral** – (3.39%) | | | | | | (7,928,074 | ) |
| Receivables and Other Assets | | | | | | | |
| Net of Other Liabilities – 1.48% | | | | | | 3,466,042 | |
| Net Assets Applicable to 21,848,749 | | | | | | | |
| Shares Outstanding – 100.00% | | | | | $ | 233,699,256 | |
| | |
| Net Asset Value – Delaware International Value Equity Fund | | | | | | | |
| Class A ($103,417,596 / 9,660,110 Shares) | | | | | | $10.71 | |
| Net Asset Value – Delaware International Value Equity Fund | | | | | | | |
| Class B ($4,703,571 / 446,910 Shares) | | | | | | $10.52 | |
| Net Asset Value – Delaware International Value Equity Fund | | | | | | | |
| Class C ($33,164,008 / 3,155,557 Shares) | | | | | | $10.51 | |
| Net Asset Value – Delaware International Value Equity Fund | | | | | | | |
| Class R ($2,320,840 / 217,616 Shares) | | | | | | $10.66 | |
| Net Asset Value – Delaware International Value Equity Fund | | | | | | | |
| Institutional Class ($90,093,241 / 8,368,556 Shares) | | | | | | $10.77 | |
| | |
| Components of Net Assets at November 30, 2011: | | | | | | | |
| Shares of beneficial interest (unlimited authorization – no par) | | | | | $ | 454,987,045 | |
| Undistributed net investment income | | | | | | 4,148,092 | |
| Accumulated net realized loss on investments | | | | | | (210,879,767 | ) |
| Net unrealized depreciation of investments and derivatives | | | | | | (14,556,114 | ) |
| Total net assets | | | | | $ | 233,699,256 | |
32
| | |
| Δ | Securities have been classified by country of origin. Classification by type of business has been presented on page 24 in “Security type/country/sector allocations.” |
| † | Non income producing security. |
| * | Fully or partially on loan. |
| ≠ | The rate shown is the effective yield at the time of purchase. |
| ** | See Note 9 in “Notes to financial statements for additional information on securities lending collateral.” |
| @ | Illiquid security. At November 30, 2011, the aggregate value of illiquid securities was $0, which represented 0.00% of the Fund’s net assets. See Note 10 in “Notes to financial statements.” |
| © | Includes $7,951,819 of securities loaned. |
| Net Asset Value and Offering Price Per Share – | | | |
| Delaware International Value Equity Fund | | | |
| Net asset value Class A (A) | | $ | 10.71 |
| Sales charge (5.75% of offering price) (B) | | | 0.65 |
| Offering price | | $ | 11.36 |
| (A) | Net asset value per share, as illustrated, is the amount which would be paid upon redemption or repurchase of shares. |
| (B) | See the current prospectus for purchases of $50,000 or more. |
The following foreign currency exchange contract was outstanding at November 30, 2011:1
Foreign Currency Exchange Contract
| | | | | | | | Unrealized |
| | | | | | | | Appreciation |
| Counterparty | | Contract to Receive (Deliver) | | In Exchange For | | Settlement Date | | (Depreciation) |
| MNB | | JPY (3,403,800) | | USD | 43,633 | | 12/1/11 | | $(260) |
The use of foreign currency exchange contracts involves elements of market risk and risks in excess of the amount recognized in the financial statements. The notional value presented above represents the Fund’s total exposure in such contracts, whereas only the net unrealized appreciation (depreciation) is reflected in the Fund’s net assets.
1See Note 8 in “Notes to financial statements.”
33
Statements of net assets
Delaware International Value Equity Fund
| |
Summary of abbreviations:
ADR — American Depositary Receipt
JPY — Japanese Yen
MNB — Mellon National Bank
NVDR — Non-Voting Depositary Receipt
USD — United States Dollar |
See accompanying notes, which are an integral part of the financial statements.
34
| Statements of net assets | |
| Delaware Emerging Markets Fund | November 30, 2011 |
| | | Number of shares | | Value (U.S. $) |
| Common Stock – 96.13%Δ | | | | | | |
| Argentina – 2.12% | | | | | | |
| @ | Cresud ADR | | | 1,442,769 | | $ | 15,870,459 |
| # | Grupo Clarin Class B 144A GDR | | | 353,200 | | | 1,715,280 |
| *@ | IRSA Inversiones y Representaciones ADR | | | 782,967 | | | 7,829,670 |
| Pampa Energia ADR | | | 95,300 | | | 1,120,728 |
| YPF ADR | | | 706,618 | | | 24,738,697 |
| | | | | | | 51,274,834 |
| Australia – 0.14% | | | | | | |
| † | Alara Resources | | | 200,832 | | | 59,901 |
| * | Alumina ADR | | | 500,000 | | | 2,950,000 |
| @† | Strike Resources | | | 1,618,461 | | | 340,676 |
| | | | | | | 3,350,577 |
| Brazil – 15.54% | | | | | | |
| @ | AES Tiete | | | 597,480 | | | 7,087,290 |
| B2W Cia Global Do Varejo | | | 1,117,800 | | | 6,274,219 |
| Banco Santander Brasil ADR | | | 2,325,000 | | | 17,949,000 |
| * | Brasil Foods ADR | | | 1,450,000 | | | 29,217,500 |
| * | Braskem ADR | | | 161,000 | | | 2,571,170 |
| Centrais Eletricas Brasileiras | | | 2,140,204 | | | 19,611,337 |
| * | Cia Brasileira de Distribuicao Grupo Pao de Acucar ADR | | | 432,500 | | | 15,812,200 |
| * | Cia Siderurgica Nacional ADR | | | 620,000 | | | 5,146,000 |
| Cyrela Brazil Realty Empreendimentos e Participacoes | | | 1,300,000 | | | 10,805,176 |
| * | Fibria Celulose ADR | | | 3,300,000 | | | 25,674,000 |
| @ | Gerdau | | | 2,764,900 | | | 17,721,170 |
| Gerdau ADR | | | 1,700,000 | | | 13,056,000 |
| * | Gol Linhas Aereas Inteligentes ADR | | | 2,648,900 | | | 20,078,662 |
| Hypermarcas | | | 4,000,000 | | | 18,027,982 |
| Itau Unibanco Holding ADR | | | 1,200,000 | | | 21,360,000 |
| † | Magazine Luiza | | | 378,700 | | | 2,282,713 |
| Marfrig Alimentos | | | 1,464,800 | | | 6,658,550 |
| Petroleo Brasileiro SA ADR | | | 3,225,000 | | | 87,042,751 |
| Petroleo Brasileiro SP ADR | | | 1,100,000 | | | 27,577,000 |
| * | Tim Participacoes ADR | | | 285,804 | | | 6,804,993 |
| Vale ADR | | | 680,000 | | | 15,810,000 |
| | | | | | | 376,567,713 |
| China/Hong Kong – 16.98% | | | | | | |
| * | Alibaba.com | | | 3,000,000 | | | 3,113,964 |
| Bank of China Class H | | | 30,000,000 | | | 9,781,337 |
| @† | Bitauto Holdings ADR | | | 205,400 | | | 1,000,298 |
35
Statements of net assets
Delaware Emerging Markets Fund
| | | Number of shares | | Value (U.S. $) |
| Common Stock (continued) | | | | | | |
| China/Hong Kong (continued) | | | | | | |
| China Coal Energy Class H | | | 11,000,000 | | $ | 13,109,779 |
| China Construction Bank Class H | | | 28,000,000 | | | 19,836,869 |
| * | China Huiyuan Juice Group | | | 9,998,000 | | | 3,804,421 |
| China Mengniu Dairy | | | 3,871,000 | | | 14,023,967 |
| China Mobile ADR | | | 900,000 | | | 44,703,001 |
| China Telecom | | | 40,000,000 | | | 24,536,974 |
| China Unicom Hong Kong | | | 9,998,979 | | | 21,708,224 |
| * | China Unicom Hong Kong ADR | | | 1,225,000 | | | 26,423,250 |
| CNOOC ADR | | | 144,000 | | | 27,838,080 |
| * | Datang International Power Generation Class H | | | 11,998,862 | | | 4,112,991 |
| First Pacific | | | 5,045,002 | | | 5,644,856 |
| † | Focus Media Holding ADR | | | 403,304 | | | 7,469,190 |
| Fosun International | | | 2,886,500 | | | 1,593,412 |
| *† | Foxconn International Holdings | | | 14,370,000 | | | 9,180,114 |
| Guangshen Railway Class H | | | 11,000,000 | | | 3,989,979 |
| *† | Hollysys Automation Technologies | | | 550,000 | | | 4,867,500 |
| *† | Huadian Power International | | | 22,932,000 | | | 4,301,010 |
| * | Huaneng Power International ADR | | | 400,000 | | | 8,512,000 |
| Industrial & Commercial Bank of China Class H | | | 35,000,000 | | | 20,407,012 |
| *† | Jiayuan.com International ADR | | | 46,557 | | | 343,591 |
| Kunlun Energy | | | 1,500,000 | | | 2,034,240 |
| * | PetroChina ADR | | | 120,000 | | | 15,690,000 |
| *† | Renren ADR | | | 1,039,800 | | | 3,847,260 |
| *†@ | Shanda Games ADR | | | 2,122,400 | | | 9,550,800 |
| *†@ | Shanda Interactive Entertainment ADR | | | 727,080 | | | 29,134,096 |
| *† | Sina | | | 300,000 | | | 19,824,000 |
| @ | Sinotrans Class H | | | 15,326,332 | | | 2,945,586 |
| *† | Sohu.com | | | 340,000 | | | 16,809,600 |
| @† | Tianjin Development Holdings | | | 15,559,550 | | | 7,219,030 |
| @† | Tom Group | | | 47,824,000 | | | 4,199,177 |
| @ | Travelsky Technology | | | 8,999,100 | | | 4,706,818 |
| *@ | Uni-President China Holdings | | | 28,000,000 | | | 15,426,008 |
| | | | | | | 411,688,434 |
| Hungary – 0.37% | | | | | | |
| * | OTP Bank | | | 600,000 | | | 8,912,656 |
| | | | | | | 8,912,656 |
36
| | | Number of shares | | Value (U.S. $) |
| Common Stock (continued) | | | | | | |
| India – 3.31% | | | | | | |
| Coal India | | | 383,581 | | $ | 2,446,870 |
| ICICI Bank ADR | | | 500,000 | | | 14,555,000 |
| Indiabulls Real Estate GDR | | | 102,021 | | | 120,629 |
| Oil India | | | 26,650 | | | 580,339 |
| @ | Ranbaxy Laboratories | | | 335,000 | | | 2,840,599 |
| # | Reliance Industries 144A GDR | | | 1,080,000 | | | 32,533,080 |
| Steel Authority of India | | | 6,000,000 | | | 9,431,536 |
| @ | United Spirits | | | 1,300,000 | | | 17,764,131 |
| | | | | | | 80,272,184 |
| Indonesia – 0.19% | | | | | | |
| Tambang Batubara Bukit Asam | | | 2,379,335 | | | 4,581,023 |
| | | | | | | 4,581,023 |
| Israel – 0.33% | | | | | | |
| Israel Chemicals | | | 750,000 | | | 8,075,742 |
| | | | | | | 8,075,742 |
| Kingdom of Bahrain – 0.07% | | | | | | |
| @# | Aluminum Bahrain 144A GDR | | | 221,400 | | | 1,614,781 |
| | | | | | | 1,614,781 |
| Malaysia – 1.91% | | | | | | |
| Eastern & Oriental | | | 4,877,550 | | | 2,203,643 |
| Hong Leong Bank | | | 3,059,889 | | | 10,168,863 |
| @ | KLCC Property Holdings | | | 5,000,000 | | | 4,923,555 |
| Oriental Holdings | | | 2,599,980 | | | 3,585,505 |
| Petronas Chemicals Group | | | 4,577,900 | | | 8,820,931 |
| † | UEM Land Holdings | | | 22,999,975 | | | 16,547,673 |
| | | | | | | 46,250,170 |
| Mexico – 3.89% | | | | | | |
| * | Cemex ADR | | | 5,150,000 | | | 23,999,000 |
| † | Empresas ICA | | | 4,500,000 | | | 5,886,774 |
| Fomento Economico Mexicano ADR | | | 146,122 | | | 9,966,982 |
| Grupo Financiero Banorte | | | 3,278,400 | | | 11,094,396 |
| Grupo Televisa ADR | | | 2,090,000 | | | 43,388,400 |
| | | | | | | 94,335,552 |
| Peru – 0.80% | | | | | | |
| Cia de Minas Buenaventura ADR | | | 450,000 | | | 17,617,500 |
| Credicorp | | | 16,672 | | | 1,810,913 |
| | | | | | | 19,428,413 |
37
Statements of net assets
Delaware Emerging Markets Fund
| | | Number of shares | | Value (U.S. $) |
| Common Stock (continued) | | | | | | |
| Philippines – 0.36% | | | | | | |
| Philippine Long Distance Telephone ADR | | | 159,960 | | $ | 8,829,792 |
| | | | | | | 8,829,792 |
| Poland – 0.59% | | | | | | |
| † | Jastrzebska Spolka Weglowa | | | 254,155 | | | 6,985,455 |
| † | Polski Koncern Naftowy Orlen | | | 600,000 | | | 7,229,076 |
| | | | | | | 14,214,531 |
| Republic of Korea – 15.44% | | | | | | |
| CJ | | | 200,000 | | | 14,351,105 |
| † | E-MART | | | 39,910 | | | 10,374,871 |
| Hyundai Elevator | | | 10,160 | | | 1,273,533 |
| *@ | KB Financial Group ADR | | | 950,000 | | | 33,155,000 |
| @ | KCC | | | 118,000 | | | 24,833,862 |
| † | Korea Electric Power ADR | | | 600,000 | | | 6,660,000 |
| KT | | | 226,764 | | | 7,275,899 |
| * | KT ADR | | | 1,867,480 | | | 29,973,054 |
| * | LG Display ADR | | | 1,000,000 | | | 11,750,000 |
| LG Uplus | | | 1,840,040 | | | 11,021,578 |
| @ | Lotte Chilsung Beverage | | | 23,000 | | | 28,035,385 |
| @ | Lotte Confectionery | | | 10,443 | | | 15,385,315 |
| Samsung Electronics | | | 95,000 | | | 86,624,357 |
| # | Samsung Life Insurance 144A | | | 400,000 | | | 29,849,378 |
| † | SK Communications | | | 171,609 | | | 2,309,020 |
| SK Holdings | | | 100,000 | | | 13,050,199 |
| SK Telecom | | | 49,221 | | | 6,607,952 |
| * | SK Telecom ADR | | | 2,822,330 | | | 41,742,261 |
| | | | | | | 374,272,769 |
| Russia – 5.98% | | | | | | |
| @† | Chelyabinsk Zink Plant GDR | | | 143,300 | | | 356,143 |
| @† | Enel OGK-5 GDR | | | 21,161 | | | 67,514 |
| =@#† | Etalon Group 144A | | | 1,616,300 | | | 7,670,960 |
| Gazprom ADR | | | 3,119,000 | | | 35,868,500 |
| LUKOIL ADR | | | 170,000 | | | 9,555,700 |
| LUKOIL ADR (London International Exchange) | | | 167,328 | | | 9,421,883 |
| MMC Norilsk Nickel ADR | | | 511,337 | | | 9,028,790 |
| Mobile TeleSystems ADR | | | 1,100,000 | | | 19,008,000 |
| Rosneft Oil GDR | | | 2,000,000 | | | 14,637,098 |
| @ | Sberbank | | | 6,716,817 | | | 18,941,424 |
| * | Surgutneftegaz ADR | | | 500,000 | | | 4,806,057 |
38
| | | Number of shares | | Value (U.S. $) |
| Common Stock (continued) | | | | | | |
| Russia (continued) | | | | | | |
| @† | TGK-5 GDR | | | 8,771 | | $ | 8,786 |
| * | VTB Bank GDR | | | 3,523,744 | | | 15,465,892 |
| | | | | | | 144,836,747 |
| South Africa – 6.25% | | | | | | |
| * | Anglo American Platinum | | | 120,000 | | | 8,190,748 |
| ArcelorMittal South Africa | | | 1,465,993 | | | 11,161,081 |
| Blue Label Telecoms | | | 1,770,000 | | | 1,272,568 |
| Gold Fields ADR | | | 500,000 | | | 8,470,000 |
| Impala Platinum Holdings | | | 500,000 | | | 10,638,524 |
| JD Group | | | 723,137 | | | 4,194,708 |
| MTN Group | | | 750,000 | | | 13,516,883 |
| Sasol | | | 400,000 | | | 19,198,360 |
| Standard Bank Group | | | 2,904,015 | | | 35,432,903 |
| @ | Sun International | | | 290,543 | | | 3,098,887 |
| @ | Tongaat Hulett | | | 1,000,000 | | | 11,991,369 |
| Vodacom Group | | | 2,148,460 | | | 24,305,855 |
| | | | | | | 151,471,886 |
| Taiwan – 5.60% | | | | | | |
| Cathay Financial Holding | | | 7,140,000 | | | 7,466,139 |
| Evergreen Marine | | | 6,753,968 | | | 3,331,177 |
| Formosa Chemicals & Fibre | | | 3,007,002 | | | 7,909,717 |
| Fubon Financial Holding | | | 5,249,728 | | | 5,473,369 |
| HON HAI Precision Industry | | | 16,300,000 | | | 44,339,183 |
| HTC | | | 524,213 | | | 8,632,607 |
| MStar Semiconductor | | | 330,267 | | | 1,775,966 |
| President Chain Store | | | 1,407,372 | | | 7,094,912 |
| Taiwan Semiconductor Manufacturing | | | 7,000,000 | | | 17,553,700 |
| United Microelectronics | | | 55,000,000 | | | 24,411,470 |
| * | United Microelectronics ADR | | | 2,000,000 | | | 4,580,000 |
| Walsin Lihwa | | | 10,711,756 | | | 3,264,576 |
| | | | | | | 135,832,816 |
| Thailand – 2.10% | | | | | | |
| Airports of Thailand - Foreign | | | 10,000,000 | | | 13,906,856 |
| Bangkok Bank - Foreign | | | 2,300,000 | | | 12,027,593 |
| PTT Exploration & Production - Foreign | | | 1,131,800 | | | 5,691,944 |
| Siam Cement NVDR | | | 1,843,843 | | | 19,250,695 |
| | | | | | | 50,877,088 |
39
Statements of net assets
Delaware Emerging Markets Fund
| | | | Number of shares | | Value (U.S. $) |
| Common Stock (continued) | | | | | |
| Turkey – 1.47% | | | | | |
| Alarko Gayrimenkul Yatirim Ortakligi | | 97,776 | | $ | 922,776 |
| * | Alarko Holding | | 1,970,440 | | | 3,243,254 |
| † | Turkcell Iletisim Hizmet | | 715,275 | | | 3,575,795 |
| † | Turkcell Iletisim Hizmet ADR | | 1,085,000 | | | 13,671,000 |
| * | Turkiye Is Bankasi Class C | | 1,020,914 | | | 2,114,419 |
| * | Turkiye Sise ve Cam Fabrikalari | | 4,601,738 | | | 7,783,645 |
| *@ | Yazicilar Holding Class A | | 832,584 | | | 4,316,937 |
| | | | | | 35,627,826 |
| United Kingdom – 1.06% | | | | | |
| Anglo American | | 401,546 | | | 15,335,672 |
| * | Anglo American ADR | | 450,000 | | | 8,563,860 |
| *@† | Griffin Mining | | 3,056,187 | | | 1,870,707 |
| † | Mwana Africa | | 781,129 | | | 50,572 |
| | | | | | 25,820,811 |
| United States – 11.63% | | | | | |
| Archer-Daniels-Midland | | 1,650,000 | | | 49,698,000 |
| Avon Products | | 6,450,000 | | | 109,650,000 |
| * | Bunge | | 200,000 | | | 12,500,000 |
| † | Google Class A | | 25,000 | | | 14,984,750 |
| † | MEMC Electronic Materials | | 2,850,000 | | | 11,884,500 |
| † | Yahoo | | 5,300,000 | | | 83,263,000 |
| | | | | | 281,980,250 |
| Total Common Stock (cost $2,682,553,558) | | | | | 2,330,116,595 |
| |
| Convertible Preferred Stock – 0.70%Δ | | | | | |
| Mexico – 0.70% | | | | | |
| # | Cemex 144A | | | | | |
| 3.25% exercise price $10.85, | | | | | |
| expiration date 3/15/16 | | 20,000,000 | | | 11,375,000 |
| 3.75% exercise price $10.85, | | | | | |
| expiration date 3/15/18 | | 10,000,000 | | | 5,712,500 |
| Total Convertible Preferred Stock (cost $27,847,088) | | | | | 17,087,500 |
40
| | | | Number of shares | | Value (U.S. $) | |
| Participation Notes – 0.00% | | | | | | |
| =@#† | Lehman Indian Oil CW 12 LEPO 144A | | 172,132 | | $ | 0 | |
| =#† | Lehman Oil & Natural Gas CW 12 LEPO 144A | | 254,590 | | | 0 | |
| Total Participation Notes (cost $8,559,056) | | | | | 0 | |
| | |
| Preferred Stock – 2.64%Δ | | | | | | |
| Brazil – 1.42% | | | | | | |
| | Braskem Class A 5.81% | | 541,994 | | | 4,193,163 | |
| Vale Class A 7.39% | | 1,400,000 | | | 30,217,331 | |
| | | | | | 34,410,494 | |
| Republic of Korea – 0.73% | | | | | | |
| Samsung Electronics 0.84% | | 31,362 | | | 17,520,817 | |
| | | | | | 17,520,817 | |
| Russia – 0.49% | | | | | | |
| =@ | AK Transneft 0.68% | | 7,239 | | | 11,943,554 | |
| | | | | | 11,943,554 | |
| Total Preferred Stock (cost $44,018,833) | | | | | 63,874,865 | |
| |
| Total Value of Securities Before Securities | | | | | | |
| Lending Collateral – 99.47% (cost $2,762,978,535) | | | | | 2,411,078,960 | |
| | |
| Securities Lending Collateral** – 7.71% | | | | | | |
| Investment Companies | | | | | | |
| BNY Mellon SL DBT II Liquidating Fund | | 201,050 | | | 194,335 | |
| Delaware Investments Collateral Fund No. 1 | | 186,576,736 | | | 186,576,736 | |
| @† | Mellon GSL Reinvestment Trust II | | 376,250 | | | 0 | |
| Total Securities Lending Collateral (cost $187,154,036) | | | | | 186,771,071 | |
| |
| Total Value of Securities – 107.18% | | | | | | |
| (cost $2,950,132,571) | | | | | 2,597,850,031 | © |
| Obligation to Return Securities | | | | | | |
| Lending Collateral** – (7.72%) | | | | | (187,154,036 | ) |
| Receivables and Other Assets | | | | | | |
| Net of Other Liabilities – 0.54% | | | | | 13,162,503 | |
| Net Assets Applicable to 185,618,852 | | | | | | |
| Shares Outstanding – 100.00% | | | | $ | 2,423,858,498 | |
41
Statements of net assets
Delaware Emerging Markets Fund
| | | | | |
| Net Asset Value – Delaware Emerging Markets Fund | | | | |
| | Class A ($542,207,487 / 41,534,522 Shares) | | | | $13.05 | |
| Net Asset Value – Delaware Emerging Markets Fund | | | | |
| Class B ($13,358,839 / 1,082,143 Shares) | | | | $12.34 | |
| Net Asset Value – Delaware Emerging Markets Fund | | | | |
| Class C ($194,124,032 / 15,760,270 Shares) | | | | $12.32 | |
| Net Asset Value – Delaware Emerging Markets Fund | | | | |
| | Class R ($1,500,169 / 114,129 Shares) | | | | $13.14 | |
| Net Asset Value – Delaware Emerging Markets Fund | | | | |
| Institutional Class ($1,672,667,971 / 127,127,788 Shares) | | | | $13.16 | |
| |
| Components of Net Assets at November 30, 2011: | | | | |
| Shares of beneficial interest (unlimited authorization – no par) | | $ | 2,741,433,918 | |
| Undistributed net investment income | | | 14,021,994 | |
| Accumulated net realized gain on investments | | | 20,445,518 | |
| Net unrealized depreciation of investments and derivatives | | | (352,042,932 | ) |
| Total net assets | | $ | 2,423,858,498 | |
| Δ | Securities have been classified by country of origin. Classification by type of business has been presented on page 26 in “Security type/country/sector allocations.” |
| @ | Illiquid security. At November 30, 2011, the aggregate value of illiquid securities was $311,849,987, which represented 12.87% of the Fund’s net assets. See Note 10 in “Notes to financial statements.” |
| # | Security exempt from registration under Rule 144A of the Securities Act of 1933, as amended. At November 30, 2011, the aggregate value of Rule 144A securities was $90,470,979, which represented 3.73% of the Fund’s net assets. See Note 10 in “Notes to financial statements.” |
| * | Fully or partially on loan. |
| † | Non income producing security. |
| = | Security is being fair valued in accordance with the Fund’s fair valuation policy. At November 30, 2011, the aggregate value of fair valued securities was $19,614,514, which represented 0.81% of the Fund’s net assets. See Note 1 in “Notes to financial statements.” |
| ** | See Note 9 in “Notes to financial statements for additional information on securities lending collateral.” |
| © | Includes $191,081,828 of securities loaned. See Note 9 in “Notes to financial statements.” |
42
| | | | |
| Net Asset Value and Offering Price Per Share – | | | |
| Delaware Emerging Markets Fund | | | |
| Net asset value Class A (A) | | $ | 13.05 |
| Sales charge (5.75% of offering price) (B) | | | 0.80 |
| Offering price | | $ | 13.85 |
(A) Net asset value per share, as illustrated, is the amount which would be paid upon redemption or repurchase of shares.
(B) See the current prospectus for purchases of $50,000 or more.
Summary of abbreviations:
ADR — American Depositary Receipt
GDR — Global Depositary Receipt
LEPO — Low Exercise Price Option
NVDR — Non-Voting Depositary Receipt
See accompanying notes, which are an integral part of the financial statements.
43
| Statements of net assets | |
| Delaware Global Value Fund | November 30, 2011 |
| | | | Number of shares | | Value (U.S. $) |
| Common Stock – 99.28%Δ | | | | | |
| Australia – 1.52% | | | | | |
| Coca-Cola Amatil | | 35,888 | | $ | 437,945 |
| | | | | | 437,945 |
| Brazil – 1.01% | | | | | |
| Petroleo Brasileiro ADR | | 11,600 | | | 290,812 |
| | | | | | 290,812 |
| Canada – 5.36% | | | | | |
| † | AuRico Gold | | 19,322 | | | 193,618 |
| † | CGI Group Class A | | 34,884 | | | 641,313 |
| Yamana Gold | | 41,896 | | | 706,551 |
| | | | | | 1,541,482 |
| China/Hong Kong – 3.91% | | | | | |
| CNOOC | | 188,000 | | | 365,206 |
| *† | Sohu.com | | 3,800 | | | 187,872 |
| * | Techtronic Industries | | 154,000 | | | 141,372 |
| Yue Yuen Industrial Holdings | | 148,000 | | | 431,326 |
| | | | | | 1,125,776 |
| France – 8.52% | | | | | |
| * | Alstom | | 7,954 | | | 275,435 |
| AXA | | 6,964 | | | 100,840 |
| Cie de Saint-Gobain | | 3,164 | | | 134,168 |
| * | Lafarge | | 2,432 | | | 88,898 |
| PPR | | 666 | | | 99,807 |
| Publicis Groupe | | 3,164 | | | 151,145 |
| Sanofi | | 6,367 | | | 445,363 |
| Teleperformance | | 11,325 | | | 223,461 |
| Total | | 7,393 | | | 381,438 |
| Vallourec | | 1,458 | | | 100,099 |
| Vivendi | | 19,588 | | | 451,834 |
| | | | | | 2,452,488 |
| Germany – 1.83% | | | | | |
| Bayerische Motoren Werke | | 3,014 | | | 228,491 |
| Deutsche Post | | 19,681 | | | 297,497 |
| | | | | | 525,988 |
| Israel – 2.31% | | | | | |
| Teva Pharmaceutical Industries ADR | | 16,800 | | | 665,448 |
| | | | | | 665,448 |
44
| | | | Number of shares | | Value (U.S. $) |
| Common Stock (continued) | | | | | |
| Japan – 6.64% | | | | | |
| Asahi Glass | | 17,500 | | $ | 149,826 |
| Don Quijote | | 11,100 | | | 382,622 |
| | East Japan Railway | | 7,700 | | | 471,692 |
| ITOCHU | | 27,853 | | | 283,090 |
| Mitsubishi UFJ Financial Group | | 43,754 | | | 191,668 |
| Sumitomo Rubber Industries | | 8,843 | | | 106,081 |
| Toyota Motor | | 9,950 | | | 327,701 |
| | | | | | 1,912,680 |
| Netherlands – 0.36% | | | | | |
| Koninklijke Philips Electronics | | 5,140 | | | 104,563 |
| | | | | | 104,563 |
| Panama – 0.69% | | | | | |
| Copa Holdings Class A | | 3,100 | | | 200,136 |
| | | | | | 200,136 |
| Republic of Korea – 0.64% | | | | | |
| Hyundai Home Shopping Network | | 1,834 | | | 183,783 |
| | | | | | 183,783 |
| Russia – 0.89% | | | | | |
| Mobile TeleSystems ADR | | 14,800 | | | 255,744 |
| | | | | | 255,744 |
| Spain – 0.25% | | | | | |
| Promotora de Informaciones ADR | | 13,400 | | | 70,886 |
| | | | | | 70,886 |
| Sweden – 2.17% | | | | | |
| Meda Class A | | 43,967 | | | 428,879 |
| Nordea Bank FDR | | 24,430 | | | 194,537 |
| | | | | | 623,416 |
| Switzerland – 3.08% | | | | | |
| Aryzta | | 9,245 | | | 446,341 |
| Novartis | | 8,168 | | | 441,131 |
| | | | | | 887,472 |
| Taiwan – 0.43% | | | | | |
| HTC | | 7,483 | | | 123,220 |
| | | | | | 123,220 |
45
Statements of net assets
Delaware Global Value Fund
| | | | Number of shares | | Value (U.S. $) |
| Common Stock (continued) | | | | | |
| Thailand – 0.36% | | | | | |
| Banpu NVDR | | 5,764 | | $ | 104,140 |
| | | | | | 104,140 |
| United Kingdom – 8.97% | | | | | |
| Greggs | | 65,574 | | | 512,486 |
| National Grid | | 44,001 | | | 432,577 |
| Rexam | | 53,030 | | | 287,660 |
| Rio Tinto | | 2,968 | | | 156,312 |
| Standard Chartered | | 13,220 | | | 287,920 |
| Tesco | | 78,786 | | | 503,211 |
| Vodafone Group | | 148,661 | | | 402,595 |
| | | | | | 2,582,761 |
| United States – 50.34% | | | | | |
| | Abbott Laboratories | | 11,000 | | | 600,050 |
| † | AGCO | | 4,600 | | | 210,450 |
| American Express | | 12,000 | | | 576,480 |
| Archer-Daniels-Midland | | 14,500 | | | 436,740 |
| AT&T | | 17,600 | | | 510,048 |
| Ball | | 13,500 | | | 473,985 |
| † | CACI International Class A | | 8,100 | | | 456,678 |
| Carnival | | 4,800 | | | 159,360 |
| Caterpillar | | 2,000 | | | 195,760 |
| Chesapeake Energy | | 14,600 | | | 369,964 |
| Chevron | | 4,300 | | | 442,126 |
| Cintas | | 11,400 | | | 346,560 |
| † | Convergys | | 32,400 | | | 418,608 |
| Cooper Industries | | 5,600 | | | 310,968 |
| Corning | | 23,300 | | | 309,191 |
| † | Dell | | 41,200 | | | 649,312 |
| Discover Financial Services | | 13,900 | | | 331,098 |
| Goldman Sachs Group | | 3,500 | | | 335,510 |
| Intel | | 16,700 | | | 415,997 |
| International Business Machines | | 4,200 | | | 789,600 |
| Johnson & Johnson | | 8,700 | | | 563,064 |
| JPMorgan Chase | | 12,000 | | | 371,640 |
| Lockheed Martin | | 3,700 | | | 289,155 |
| Lowe’s | | 22,400 | | | 537,824 |
| Microsoft | | 25,300 | | | 647,174 |
| † | Mylan | | 28,000 | | | 546,840 |
46
| | | | Number of shares | | Value (U.S. $) |
| Common Stock (continued) | | | | | | |
| United States (continued) | | | | | | |
| Newmont Mining | | | 11,300 | | $ | 778,344 |
| † | NII Holdings | | | 8,900 | | | 204,789 |
| Omnicom Group | | | 6,700 | | | 289,239 |
| Pfizer | | | 26,100 | | | 523,827 |
| | Stanley Black & Decker | | | 5,622 | | | 367,847 |
| Travelers | | | 7,700 | | | 433,125 |
| Viacom Class B | | | 6,800 | | | 304,368 |
| Walgreen | | | 8,700 | | | 293,364 |
| | | | | | | 14,489,085 |
| Total Common Stock (cost $27,132,208) | | | | | | 28,577,825 |
| |
| | | Principal | | | |
| | | amount (U.S. $) | | | |
| Short-Term Investment – 1.00% | | | | | | |
| Repurchase Agreement – 1.00% | | | | | | |
| BNP Paribas 0.08%, dated 11/30/11, | | | | | | |
| to be repurchased on 12/1/11, repurchase | | | | | | |
| price $288,001 (collateralized by U.S. government | | | | | | |
| obligations 0.00%-4.25% 1/13/12-5/15/21; | | | | | | |
| market value $293,760) | | $ | 288,000 | | | 288,000 |
| Total Short-Term Investment (cost $288,000) | | | | | | 288,000 |
| | |
| Total Value of Securities Before Securities Lending | | | | | | |
| Collateral – 100.28% (cost $27,420,208) | | | | | | 28,865,825 |
| |
| | | Number of shares | | | |
| Securities Lending Collateral** – 1.41% | | | | | | |
| Investment Companies | | | | | | |
| BNY Mellon SL DBT II Liquidating Fund | | | 75,791 | | | 73,260 |
| Delaware Investments Collateral Fund No. 1 | | | 332,419 | | | 332,419 |
| @†Mellon GSL Reinvestment Trust II | | | 142,101 | | | 0 |
| Total Securities Lending Collateral (cost $550,311) | | | | | | 405,679 |
47
Statements of net assets
Delaware Global Value Fund
| | | | | | |
| Total Value of Securities – 101.69% | | | | |
| (cost $27,970,519) | | $ | 29,271,504 | © |
| Obligation to Return Securities | | | | |
| Lending Collateral** – (1.91%) | | | (550,311 | ) |
| Receivables and Other Assets | | | | |
| Net of Other Liabilities – 0.22% | | | 63,112 | |
| Net Assets Applicable to 3,484,302 | | | | |
| Shares Outstanding – 100.00% | | $ | 28,784,305 | |
| |
| Net Asset Value – Delaware Global Value Fund | | | | |
| Class A ($17,989,457 / 2,165,011 Shares) | | | | $8.31 | |
| Net Asset Value – Delaware Global Value Fund | | | | |
| Class B ($2,364,711 / 290,074 Shares) | | | | $8.15 | |
| Net Asset Value – Delaware Global Value Fund | | | | |
| | Class C ($6,744,884 / 827,247 Shares) | | | | $8.15 | |
| Net Asset Value – Delaware Global Value Fund | | | | |
| Institutional Class ($1,685,253 / 201,970 Shares) | | | | $8.34 | |
| |
| Components of Net Assets at November 30, 2011: | | | | |
| Shares of beneficial interest (unlimited authorization – no par) | | $ | 56,359,752 | |
| Undistributed net investment income | | | 245,163 | |
| Accumulated net realized loss on investments | | | (29,121,528 | ) |
| Net unrealized appreciation of investments and derivatives | | | 1,300,918 | |
| Total net assets | | $ | 28,784,305 | |
| Δ | Securities have been classified by country of origin. Classification by type of business has been presented on page 28 in “Security type/country/sector allocations.” |
| † | Non income producing security. |
| * | Fully or partially on loan. |
| ** | See Note 9 in “Notes to financial statements for additional information on securities lending collateral.” |
| @ | Illiquid security. At November 30, 2011, the aggregate value of illiquid securities was $0, which represented 0.00% of the Fund’s net assets. See Note 10 in “Notes to financial statements.” |
| © | Includes $552,435 of securities loaned. |
48
| | | |
| Net Asset Value and Offering Price Per Share – | | |
| | Delaware Global Value Fund | | |
| Net asset value Class A (A) | $ | 8.31 |
| Sales charge (5.75% of offering price) (B) | | 0.51 |
| Offering price | $ | 8.82 |
(A) Net asset value per share, as illustrated, is the amount which would be paid upon redemption or repurchase of shares.
(B) See the current prospectus for purchases of $50,000 or more.
The following foreign currency exchange contract was outstanding at November 30, 2011:1
Foreign Currency Exchange Contract
| | | | | | | | | | Unrealized |
| | Contract to | | | | | | Appreciation |
| Counterparty | | | Receive (Deliver) | | In Exchange For | | Settlement Date | | (Depreciation) |
| MNB | | JPY | | (190,650) | | USD 2,444 | | 12/1/11 | | $(15) |
The use of foreign currency exchange contracts involves elements of market risk and risks in excess of the amount recognized in the financial statements. The notional value presented above represents the Fund’s total exposure in such contracts, whereas only the net unrealized appreciation (depreciation) is reflected in the Fund’s net assets.
1See Note 8 in “Notes to financial statements.”
Summary of abbreviations:
ADR — American Depositary Receipt
FDR — Fiduciary Depositary Receipt
JPY — Japanese Yen
MNB — Mellon National Bank
NVDR — Non-Voting Depository Receipt
USD — United States Dollar
See accompanying notes, which are an integral part of the financial statements.
49
| Statements of operations | | |
| Delaware International Funds | | Year Ended November 30, 2011 |
| | Delaware | | Delaware | | Delaware |
| | International | | Emerging | | Global |
| | Value Equity | | Markets | | Value |
| | Fund | | Fund | | Fund |
| Investment Income: | | | | | | | | | | | | |
| Dividends | | $ | 10,495,096 | | | $ | 56,912,958 | | | $ | 938,619 | |
| Securities lending income | | | 432,465 | | | | 2,633,190 | | | | 25,258 | |
| Interest | | | 2,213 | | | | 736,438 | | | | — | |
| Foreign tax withheld | | | (930,359 | ) | | | (3,748,557 | ) | | | (55,539 | ) |
| | | 9,999,415 | | | | 56,534,029 | | | | 908,338 | |
| |
| Expenses: | | | | | | | | | | | | |
| Management fees | | | 2,582,211 | | | | 27,742,872 | | | | 289,068 | |
| Dividend disbursing and transfer agent | | | | | | | | | | | | |
| fees and expenses | | | 906,415 | | | | 4,669,329 | | | | 117,953 | |
| Distribution expenses – Class A | | | 384,228 | | | | 1,892,930 | | | | 63,256 | |
| Distribution expenses – Class B | | | 68,320 | | | | 173,706 | | | | 30,042 | |
| Distribution expenses – Class C | | | 427,423 | | | | 2,386,983 | | | | 81,134 | |
| Distribution expenses – Class R | | | 17,456 | | | | 6,785 | | | | — | |
| Custodian fees | | | 123,772 | | | | 1,418,609 | | | | 25,658 | |
| Accounting and administration expenses | | | 119,429 | | | | 923,766 | | | | 13,369 | |
| Registration fees | | | 69,005 | | | | 342,206 | | | | 54,417 | |
| Reports and statements to shareholders | | | 45,407 | | | | 317,886 | | | | 10,132 | |
| Audit and tax | | | 23,665 | | | | 136,099 | | | | 12,339 | |
| Legal fees | | | 17,590 | | | | 168,911 | | | | 2,267 | |
| Trustees’ fees | | | 16,354 | | | | 125,290 | | | | 1,821 | |
| Dues and services | | | 11,004 | | | | 13,907 | | | | 7,947 | |
| Insurance fees | | | 7,160 | | | | 29,275 | | | | 756 | |
| Pricing fees | | | 3,359 | | | | 5,317 | | | | 3,061 | |
| Consulting fees | | | 3,046 | | | | 24,087 | | | | 335 | |
| Trustees’ expenses | | | 1,097 | | | | 7,050 | | | | 119 | |
| | | 4,826,941 | | | | 40,385,008 | | | | 713,674 | |
| Less fees waived | | | (13,312 | ) | | | — | | | | (96,482 | ) |
| Less waived distribution expenses – Class A | | | — | | | | (315,488 | ) | | | (10,542 | ) |
| Less waived distribution expenses – Class R | | | (2,909 | ) | | | (1,131 | ) | | | — | |
| Less expense paid indirectly | | | (1,048 | ) | | | (3,681 | ) | | | (188 | ) |
| Total operating expenses | | | 4,809,672 | | | | 40,064,708 | | | | 606,462 | |
| Net Investment Income | | | 5,189,743 | | | | 16,469,321 | | | | 301,876 | |
50
| | Delaware | | Delaware | | Delaware |
| | International | | Emerging | | Global |
| | Value Equity | | Markets | | Value |
| | Fund | | Fund | | Fund |
| Net Realized and Unrealized | | | | | | | | | | | | |
| Gain (Loss): | | | | | | | | | | | | |
| Net realized gain (loss) on: | | | | | | | | | | | | |
| Investments | | $ | (8,531,463 | ) | | $ | 27,658,316 | | | $ | 867,901 | |
| Foreign currencies | | | (179,502 | ) | | | (2,409,154 | ) | | | (8,758 | ) |
| Foreign currency exchange contracts | | | (855,840 | ) | | | (2,352,941 | ) | | | (46,060 | ) |
| Net realized gain (loss) | | | (9,566,805 | ) | | | 22,896,221 | | | | 813,083 | |
| Net change in unrealized | | | | | | | | | | | | |
| appreciation (depreciation) on: | | | | | | | | | | | | |
| Investments | | | (8,048,786 | ) | | | (460,376,061 | ) | | | (666,979 | ) |
| Foreign currencies | | | 31,357 | | | | (698,299 | ) | | | (15 | ) |
| Foreign currency exchange contracts | | | (260 | ) | | | 250,069 | | | | (3,451 | ) |
| Net change in unrealized | | | | | | | | | | | | |
| appreciation (depreciation) | | | (8,017,689 | ) | | | (460,824,291 | ) | | | (670,445 | ) |
| Net Realized and Unrealized Gain (Loss) | | | (17,584,494 | ) | | | (437,928,070 | ) | | | 142,638 | |
| |
| Net Increase (Decrease) in Net Assets | | | | | | | | | | | | |
| Resulting from Operations | | $ | (12,394,751 | ) | | $ | (421,458,749 | ) | | $ | 444,514 | |
See accompanying notes, which are an integral part of the financial statements.
51
Statements of changes in net assets
Delaware International Value Equity Fund
| | Year Ended |
| | 11/30/11 | | 11/30/10 |
| Increase (Decrease) in Net Assets from Operations: | | | | | | | | |
| Net investment income | | $ | 5,189,743 | | | $ | 4,072,115 | |
| Net realized gain (loss) | | | (9,566,805 | ) | | | 9,746,611 | |
| Net change in unrealized appreciation (depreciation) | | | (8,017,689 | ) | | | (941,935 | ) |
| Net increase (decrease) in net assets resulting | | | | | | | | |
| from operations | | | (12,394,751 | ) | | | 12,876,791 | |
| |
| Dividends and Distributions to Shareholders from: | | | | | | | | |
| Net investment income: | | | | | | | | |
| Class A | | | (1,173,093 | ) | | | (3,100,163 | ) |
| Class B | | | (17,757 | ) | | | (155,771 | ) |
| Class C | | | (105,750 | ) | | | (795,505 | ) |
| Class R | | | (21,894 | ) | | | (55,397 | ) |
| Institutional Class | | | (1,605,333 | ) | | | (3,166,321 | ) |
| | | (2,923,827 | ) | | | (7,273,157 | ) |
| |
| Capital Share Transactions: | | | | | | | | |
| Proceeds from shares sold: | | | | | | | | |
| Class A | | | 19,883,118 | | | | 11,233,986 | |
| Class B | | | 139,537 | | | | 173,613 | |
| Class C | | | 2,041,545 | | | | 2,896,279 | |
| Class R | | | 828,070 | | | | 752,628 | |
| Institutional Class | | | 33,455,671 | | | | 29,263,858 | |
| |
| Net asset value of shares issued upon reinvestment | | | | | | | | |
| of dividends and distributions: | | | | | | | | |
| Class A | | | 1,101,145 | | | | 2,840,064 | |
| Class B | | | 16,437 | | | | 143,120 | |
| Class C | | | 100,812 | | | | 747,519 | |
| Class R | | | 21,894 | | | | 55,397 | |
| Institutional Class | | | 1,572,059 | | | | 3,117,321 | |
| | | 59,160,288 | | | | 51,223,785 | |
52
| | Year Ended |
| | 11/30/11 | | 11/30/10 |
| Capital Share Transactions (continued): | | | | | | | | |
| Cost of shares repurchased: | | | | | | | | |
| Class A | | $ | (41,504,707 | ) | | $ | (39,399,111 | ) |
| Class B | | | (2,897,352 | ) | | | (3,516,795 | ) |
| Class C | | | (10,434,111 | ) | | | (14,708,670 | ) |
| Class R | | | (1,552,056 | ) | | | (688,411 | ) |
| Institutional Class | | | (75,801,677 | ) | | | (40,028,000 | ) |
| | | | (132,189,903 | ) | | | (98,340,987 | ) |
| Decrease in net assets derived from | | | | | | | | |
| capital share transactions | | | (73,029,615 | ) | | | (47,117,202 | ) |
| Net Decrease in Net Assets | | | (88,348,193 | ) | | | (41,513,568 | ) |
| |
| Net Assets: | | | | | | | | |
| Beginning of year | | | 322,047,449 | | | | 363,561,017 | |
| End of year | | $ | 233,699,256 | | | $ | 322,047,449 | |
| |
| Undistributed net investment income | | $ | 4,148,092 | | | $ | 2,917,518 | |
See accompanying notes, which are an integral part of the financial statements.
53
Statements of changes in net assets
Delaware Emerging Markets Fund
| | Year Ended |
| | 11/30/11 | | 11/30/10 |
| Increase (Decrease) in Net Assets from Operations: | | | | | | | | |
| Net investment income | | $ | 16,469,321 | | | $ | 9,574,162 | |
| Net realized gain | | | 22,896,221 | | | | 14,446,831 | |
| Net change in unrealized appreciation (depreciation) | | | (460,824,291 | ) | | | 106,045,960 | |
| Net increase (decrease) in net assets resulting | | | | | | | | |
| from operations | | | (421,458,749 | ) | | | 130,066,953 | |
| |
| Dividends and Distributions to Shareholders from: | | | | | | | | |
| Net investment income: | | | | | | | | |
| Class A | | | (3,194,266 | ) | | | (157,722 | )1 |
| Class R | | | (1,746 | ) | | | — | |
| Institutional Class | | | (5,624,704 | ) | | | (360,097 | ) |
| | | | (8,820,716 | ) | | | (517,819 | ) |
| |
| Capital Share Transactions: | | | | | | | | |
| Proceeds from shares sold: | | | | | | | | |
| Class A | | | 343,273,465 | | | | 282,988,286 | |
| Class B | | | 257,018 | | | | 687,127 | |
| Class C | | | 63,603,869 | | | | 76,058,758 | |
| Class R | | | 2,058,526 | | | | 443,415 | |
| Institutional Class | | | 1,787,746,622 | | | | 539,949,337 | |
| |
| Net asset value of shares issued upon reinvestment | | | | | | | | |
| of dividends and distributions: | | | | | | | | |
| Class A | | | 2,906,300 | | | | 143,191 | |
| Class R | | | 1,745 | | | | — | |
| Institutional Class | | | 2,798,475 | | | | 278,887 | |
| | | 2,202,646,020 | | | | 900,549,001 | |
54
| | Year Ended |
| | 11/30/11 | | 11/30/10 |
| Capital Share Transactions (continued): | | | | | | | | |
| Cost of shares repurchased: | | | | | | | | |
| Class A | | $ | (260,791,880 | ) | | $ | (200,070,325 | ) |
| Class B | | | (4,125,996 | ) | | | (4,267,451 | ) |
| Class C | | | (61,422,877 | ) | | | (35,088,651 | ) |
| Class R | | | (763,330 | ) | | | (9,594 | ) |
| Institutional Class | | | (465,416,121 | ) | | | (72,557,094 | ) |
| | | | (792,520,204 | ) | | | (311,993,115 | ) |
| Increase in net assets derived from | | | | | | | | |
| capital share transactions | | | 1,410,125,816 | | | | 588,555,886 | |
| Net Increase in Net Assets | | | 979,846,351 | | | | 718,105,020 | |
| |
| Net Assets: | | | | | | | | |
| Beginning of year | | | 1,444,012,147 | | | | 725,907,127 | |
| End of year | | $ | 2,423,858,498 | | | $ | 1,444,012,147 | |
| |
| Undistributed net investment income | | $ | 14,021,994 | | | $ | 6,999,680 | |
| 1For the year ended November 30, 2010, net investment income distributions of $0.005 per share was made by the Fund, which rounded to less than $1. |
See accompanying notes, which are an integral part of the financial statements.
55
Statements of changes in net assets
Delaware Global Value Fund
| Year Ended |
| 11/30/11 | | 11/30/10 |
| Increase (Decrease) in Net Assets from Operations: | | | | | | | |
| Net investment income | $ | 301,876 | | | $ | 217,641 | |
| Net realized gain | | 813,083 | | | | 277,100 | |
| Net change in unrealized appreciation (depreciation) | | (670,445 | ) | | | 964,932 | |
| Net increase in net assets resulting from operations | | 444,514 | | | | 1,459,673 | |
| |
| Dividends and Distributions to Shareholders from: | | | | | | | |
| Net investment income: | | | | | | | |
| Class A | | (94,193 | ) | | | (337,530 | ) |
| Class B | | — | | | | (32,321 | ) |
| Class C | | — | | | | (83,154 | ) |
| Institutional Class | | (11,418 | ) | | | (22,003 | ) |
| | (105,611 | ) | | | (475,008 | ) |
| |
| Capital Share Transactions: | | | | | | | |
| Proceeds from shares sold: | | | | | | | |
| Class A | | 3,344,875 | | | | 2,566,972 | |
| Class B | | 42,034 | | | | 37,287 | |
| Class C | | 841,540 | | | | 519,598 | |
| Institutional Class | | 454,434 | | | | 701,393 | |
| |
| Net asset value of shares issued upon reinvestment | | | | | | | |
| of dividends and distributions: | | | | | | | |
| Class A | | 82,808 | | | | 300,220 | |
| Class B | | — | | | | 26,324 | |
| Class C | | — | | | | 73,288 | |
| Institutional Class | | 10,965 | | | | 21,846 | |
| | 4,776,656 | | | | 4,246,928 | |
56
| Year Ended |
| 11/30/11 | | 11/30/10 |
| Capital Share Transactions (continued): | | | | | | | |
| Cost of shares repurchased: | | | | | | | |
| Class A | $ | (6,467,989 | ) | | $ | (7,492,107 | ) |
| Class B | | (870,342 | ) | | | (1,265,780 | ) |
| Class C | | (2,396,490 | ) | | | (3,466,665 | ) |
| Institutional Class | | (446,602 | ) | | | (469,771 | ) |
| | | (10,181,423 | ) | | | (12,694,323 | ) |
| Decrease in net assets derived from | | | | | | | |
| capital share transactions | | (5,404,767 | ) | | | (8,447,395 | ) |
| Net Decrease in Net Assets | | (5,065,864 | ) | | | (7,462,730 | ) |
| |
| Net Assets: | | | | | | | |
| Beginning of year | | 33,850,169 | | | | 41,312,899 | |
| End of year | $ | 28,784,305 | | | $ | 33,850,169 | |
| |
| Undistributed net investment income | $ | 245,163 | | | $ | 103,716 | |
See accompanying notes, which are an integral part of the financial statements.
57
Financial highlights
Delaware International Value Equity Fund Class A
Selected data for each share of the Fund outstanding throughout each period were as follows:
| Net asset value, beginning of period |
| |
| Income (loss) from investment operations: |
| Net investment income1 |
| Net realized and unrealized gain (loss) |
| Total from investment operations |
| |
| Less dividends and distributions from: |
| Net investment income |
| Net realized gain on investments |
| Total dividends and distributions |
| |
| Net asset value, end of period |
| |
| Total return2 |
| |
| Ratios and supplemental data: |
| Net assets, end of period (000 omitted) |
| Ratio of expenses to average net assets |
| Ratio of expenses to average net assets |
| prior to fees waived and expense paid indirectly |
| Ratio of net investment income to average net assets |
| Ratio of net investment income to average net assets |
| prior to fees waived and expense paid indirectly |
| Portfolio turnover |
1 The average shares outstanding method has been applied for per share information. |
2 Total investment return is based on the change in net asset value of a share during the period and assumes reinvestment of dividends and distributions at net asset value and does not reflect the impact of a sales charge. Total investment return during some of the periods shown reflects a waiver by the manager. Performance would have been lower had the waiver not been in effect. |
See accompanying notes, which are an integral part of the financial statements.
58
| | Year Ended | |
| | 11/30/11 | | | 11/30/10 | | | 11/30/09 | | | 11/30/08 | | | 11/30/07 | |
| | $11.570 | | | $11.400 | | | $8.120 | | | $16.750 | | | $16.010 | |
| | | |
| | | |
| | 0.211 | | | 0.136 | | | 0.212 | | | 0.288 | | | 0.205 | |
| | (0.966 | ) | | 0.266 | | | 3.375 | | | (7.995 | ) | | 1.504 | |
| | (0.755 | ) | | 0.402 | | | 3.587 | | | (7.707 | ) | | 1.709 | |
| | | |
| | | |
| | (0.105 | ) | | (0.232 | ) | | (0.307 | ) | | (0.204 | ) | | (0.174 | ) |
| | — | | | — | | | — | | | (0.719 | ) | | (0.795 | ) |
| | (0.105 | ) | | (0.232 | ) | | (0.307 | ) | | (0.923 | ) | | (0.969 | ) |
| | | |
| | $10.710 | | | $11.570 | | | $11.400 | | | $8.120 | | | $16.750 | |
| | | |
| | (6.64% | ) | | 3.60% | | | 44.76% | | | (48.60% | ) | | 11.24% | |
| | | |
| | | |
| | $103,418 | | | $130,865 | | | $154,721 | | | $178,072 | | | $472,533 | |
| | 1.59% | | | 1.65% | | | 1.52% | | | 1.40% | | | 1.40% | |
| | | |
| | 1.59% | | | 1.69% | | | 1.78% | | | 1.49% | | | 1.40% | |
| | 1.70% | | | 1.21% | | | 2.33% | | | 2.19% | | | 1.25% | |
| | | |
| | 1.70% | | | 1.17% | | | 2.07% | | | 2.10% | | | 1.25% | |
| | 42% | | | 37% | | | 35% | | | 32% | | | 26% | |
59
Financial highlights
Delaware International Value Equity Fund Class B
Selected data for each share of the Fund outstanding throughout each period were as follows:
| Net asset value, beginning of period |
| |
| Income (loss) from investment operations: |
| Net investment income1 |
| Net realized and unrealized gain (loss) |
| Total from investment operations |
| |
| Less dividends and distributions from: |
| Net investment income |
| Net realized gain on investments |
| Total dividends and distributions |
| |
| Net asset value, end of period |
| |
| Total return2 |
| |
| Ratios and supplemental data: |
| Net assets, end of period (000 omitted) |
| Ratio of expenses to average net assets |
| Ratio of expenses to average net assets |
| prior to fees waived and expense paid indirectly |
| Ratio of net investment income to average net assets |
| Ratio of net investment income to average net assets |
| prior to fees waived and expense paid indirectly |
| Portfolio turnover |
1 The average shares outstanding method has been applied for per share information. |
2 Total investment return is based on the change in net asset value of a share during the period and assumes reinvestment of dividends and distributions at net asset value and does not reflect the impact of a sales charge. Total investment return during some of the periods shown reflects a waiver by the manager. Performance would have been lower had the waiver not been in effect. |
See accompanying notes, which are an integral part of the financial statements.
60
| | Year Ended | |
| | 11/30/11 | | 11/30/10 | | 11/30/09 | | 11/30/08 | | 11/30/07 | |
| | $11.380 | | | $11.230 | | | $7.980 | | | $16.470 | | | $15.750 | | |
| | | |
| | | |
| | 0.123 | | | 0.057 | | | 0.149 | | | 0.197 | | | 0.092 | | |
| | (0.955 | ) | | 0.260 | | | 3.322 | | | (7.876 | ) | | 1.484 | | |
| | (0.832 | ) | | 0.317 | | | 3.471 | | | (7.679 | ) | | 1.576 | | |
| | | |
| | | |
| | (0.028 | ) | | (0.167 | ) | | (0.221 | ) | | (0.092 | ) | | (0.061 | ) | |
| | — | | | — | | | — | | | (0.719 | ) | | (0.795 | ) | |
| | (0.028 | ) | | (0.167 | ) | | (0.221 | ) | | (0.811 | ) | | (0.856 | ) | |
| | | |
| | $10.520 | | | $11.380 | | | $11.230 | | | $7.980 | | | $16.470 | | |
| | | |
| | (7.35% | ) | | 2.86% | | | 43.65% | | | (48.95% | ) | | 10.48% | | |
| | | |
| | | |
| | $4,703 | | | $7,670 | | | $10,796 | | | $11,227 | | | $34,520 | | |
| | 2.29% | | | 2.35% | | | 2.22% | | | 2.10% | | | 2.10% | | |
| | | |
| | 2.29% | | | 2.39% | | | 2.48% | | | 2.19% | | | 2.10% | | |
| | 1.00% | | | 0.51% | | | 1.63% | | | 1.49% | | | 0.55% | | |
| | | |
| | 1.00% | | | 0.47% | | | 1.37% | | | 1.40% | | | 0.55% | | |
| | 42% | | | 37% | | | 35% | | | 32% | | | 26% | | |
61
Financial highlights
Delaware International Value Equity Fund Class C
Selected data for each share of the Fund outstanding throughout each period were as follows:
| Net asset value, beginning of period |
| |
| Income (loss) from investment operations: |
| Net investment income1 |
| Net realized and unrealized gain (loss) |
| Total from investment operations |
| |
| Less dividends and distributions from: |
| Net investment income |
| Net realized gain on investments |
| Total dividends and distributions |
| |
| Net asset value, end of period |
| |
| Total return2 |
| |
| Ratios and supplemental data: |
| Net assets, end of period (000 omitted) |
| Ratio of expenses to average net assets |
| Ratio of expenses to average net assets |
| prior to fees waived and expense paid indirectly |
| Ratio of net investment income to average net assets |
| Ratio of net investment income to average net assets |
| prior to fees waived and expense paid indirectly |
| Portfolio turnover |
1 The average shares outstanding method has been applied for per share information. |
2 Total investment return is based on the change in net asset value of a share during the period and assumes reinvestment of dividends and distributions at net asset value and does not reflect the impact of a sales charge. Total investment return during some of the periods shown reflects a waiver by the manager. Performance would have been lower had the waiver not been in effect. |
See accompanying notes, which are an integral part of the financial statements.
62
| | Year Ended | |
| | 11/30/11 | | 11/30/10 | | 11/30/09 | | 11/30/08 | | 11/30/07 | |
| | $11.370 | | | $11.220 | | | $7.960 | | | $16.450 | | | $15.730 | | |
| | | |
| | | |
| | 0.122 | | | 0.056 | | | 0.149 | | | 0.197 | | | 0.092 | | |
| | (0.954 | ) | | 0.261 | | | 3.332 | | | (7.876 | ) | | 1.484 | | |
| | (0.832 | ) | | 0.317 | | | 3.481 | | | (7.679 | ) | | 1.576 | | |
| | | |
| | | |
| | (0.028 | ) | | (0.167 | ) | | (0.221 | ) | | (0.092 | ) | | (0.061 | ) | |
| | — | | | — | | | — | | | (0.719 | ) | | (0.795 | ) | |
| | (0.028 | ) | | (0.167 | ) | | (0.221 | ) | | (0.811 | ) | | (0.856 | ) | |
| | | |
| | $10.510 | | | $11.370 | | | $11.220 | | | $7.960 | | | $16.450 | | |
| | | |
| | (7.35% | ) | | 2.87% | | | 43.71% | | | (49.01% | ) | | 10.50% | | |
| | | |
| | | |
| | $33,164 | | | $43,620 | | | $54,235 | | | $51,420 | | | $144,106 | | |
| | 2.29% | | | 2.35% | | | 2.22% | | | 2.10% | | | 2.10% | | |
| | | |
| | 2.29% | | | 2.39% | | | 2.48% | | | 2.19% | | | 2.10% | | |
| | 1.00% | | | 0.51% | | | 1.63% | | | 1.49% | | | 0.55% | | |
| | |
| | 1.00% | | | 0.47% | | | 1.37% | | | 1.40% | | | 0.55% | | |
| | 42% | | | 37% | | | 35% | | | 32% | | | 26% | | |
63
Financial highlights
Delaware International Value Equity Fund Class R
Selected data for each share of the Fund outstanding throughout each period were as follows:
| Net asset value, beginning of period |
| |
| Income (loss) from investment operations: |
| Net investment income1 |
| Net realized and unrealized gain (loss) |
| Total from investment operations |
| |
| Less dividends and distributions from: |
| Net investment income |
| Net realized gain on investments |
| Total dividends and distributions |
| |
| Net asset value, end of period |
| |
| Total return2 |
| |
| Ratios and supplemental data: |
| Net assets, end of period (000 omitted) |
| Ratio of expenses to average net assets |
| Ratio of expenses to average net assets |
| prior to fees waived and expense paid indirectly |
| Ratio of net investment income to average net assets |
| Ratio of net investment income to average net assets |
| prior to fees waived and expense paid indirectly |
| Portfolio turnover |
1 The average shares outstanding method has been applied for per share information. |
2 Total investment return is based on the change in net asset value of a share during the period and assumes reinvestment of dividends and distributions at net asset value. Total investment return during some of the periods shown reflects waivers by the manager and distributor. Performance would have been lower had the waivers not been in effect. |
See accompanying notes, which are an integral part of the financial statements.
64
| | Year Ended | |
| | 11/30/11 | | 11/30/10 | | 11/30/09 | | 11/30/08 | | 11/30/07 | |
| | $11.520 | | | $11.360 | | | $8.080 | | | $16.670 | | | $15.930 | | |
| | | |
| | | |
| | 0.186 | | | 0.112 | | | 0.192 | | | 0.261 | | | 0.173 | | |
| | (0.965 | ) | | 0.259 | | | 3.370 | | | (7.960 | ) | | 1.504 | | |
| | (0.779 | ) | | 0.371 | | | 3.562 | | | (7.699 | ) | | 1.677 | | |
| | | |
| | | |
| | (0.081 | ) | | (0.211 | ) | | (0.282 | ) | | (0.172 | ) | | (0.142 | ) | |
| | — | | | — | | | — | | | (0.719 | ) | | (0.795 | ) | |
| | (0.081 | ) | | (0.211 | ) | | (0.282 | ) | | (0.891 | ) | | (0.937 | ) | |
| | | |
| | $10.660 | | | $11.520 | | | $11.360 | | | $8.080 | | | $16.670 | | |
| | | |
| | (6.85% | ) | | 3.32% | | | 44.55% | | | (48.70% | ) | | 11.07% | | |
| | | |
| | | |
| | $2,321 | | | $3,127 | | | $2,985 | | | $1,259 | | | $3,076 | | |
| | 1.79% | | | 1.85% | | | 1.72% | | | 1.60% | | | 1.60% | | |
| | | |
| | 1.89% | | | 1.99% | | | 2.08% | | | 1.79% | | | 1.70% | | |
| | 1.50% | | | 1.01% | | | 2.13% | | | 1.99% | | | 1.05% | | |
| | | |
| | 1.40% | | | 0.87% | | | 1.77% | | | 1.80% | | | 0.95% | | |
| | 42% | | | 37% | | | 35% | | | 32% | | | 26% | | |
65
Financial highlights
Delaware International Value Equity Fund Institutional Class
Selected data for each share of the Fund outstanding throughout each period were as follows:
| Net asset value, beginning of period |
| |
| Income (loss) from investment operations: |
| Net investment income1 |
| Net realized and unrealized gain (loss) |
| Total from investment operations |
| |
| Less dividends and distributions from: |
| Net investment income |
| Net realized gain on investments |
| Total dividends and distributions |
| |
| Net asset value, end of period |
| |
| Total return2 |
| |
| Ratios and supplemental data: |
| Net assets, end of period (000 omitted) |
| Ratio of expenses to average net assets |
| Ratio of expenses to average net assets |
| prior to fees waived and expense paid indirectly |
| Ratio of net investment income to average net assets |
| Ratio of net investment income to average net assets |
| prior to fees waived and expense paid indirectly |
| Portfolio turnover |
1 The average shares outstanding method has been applied for per share information. |
2 Total investment return is based on the change in net asset value of a share during the period and assumes reinvestment of dividends and distributions at net asset value. Total investment return during some of the periods shown reflects a waiver by the manager. Performance would have been lower had the waiver not been in effect. |
See accompanying notes, which are an integral part of the financial statements.
66
| | Year Ended | |
| | 11/30/11 | | 11/30/10 | | 11/30/09 | | 11/30/08 | | 11/30/07 | |
| | $11.630 | | | $11.450 | | | $8.170 | | | $16.850 | | | $16.100 | | |
| | | |
| | | |
| | 0.250 | | | 0.170 | | | 0.239 | | | 0.327 | | | 0.255 | | |
| | (0.972 | ) | | 0.270 | | | 3.385 | | | (8.034 | ) | | 1.513 | | |
| | (0.722 | ) | | 0.440 | | | 3.624 | | | (7.707 | ) | | 1.768 | | |
| | | |
| | | |
| | (0.138 | ) | | (0.260 | ) | | (0.344 | ) | | (0.254 | ) | | (0.223 | ) | |
| | — | | | — | | | — | | | (0.719 | ) | | (0.795 | ) | |
| | (0.138 | ) | | (0.260 | ) | | (0.344 | ) | | (0.973 | ) | | (1.018 | ) | |
| | | |
| | $10.770 | | | $11.630 | | | $11.450 | | | $8.170 | | | $16.850 | | |
| | | |
| | (6.36% | ) | | 3.93% | | | 45.13% | | | (48.44% | ) | | 11.59% | | |
| | | |
| | | |
| | $90,093 | | | $136,765 | | | $140,824 | | | $146,192 | | | $399,014 | | |
| | 1.29% | | | 1.35% | | | 1.22% | | | 1.10% | | | 1.10% | | |
| | | |
| | 1.29% | | | 1.39% | | | 1.48% | | | 1.19% | | | 1.10% | | |
| | 2.00% | | | 1.51% | | | 2.63% | | | 2.49% | | | 1.55% | | |
| | | |
| | 2.00% | | | 1.47% | | | 2.37% | | | 2.40% | | | 1.55% | | |
| | 42% | | | 37% | | | 35% | | | 32% | | | 26% | | |
67
Financial highlights
Delaware Emerging Markets Fund Class A
Selected data for each share of the Fund outstanding throughout each period were as follows:
| Net asset value, beginning of period |
| |
| Income (loss) from investment operations: |
| Net investment income1 |
| Net realized and unrealized gain (loss) |
| Total from investment operations |
| |
| Less dividends and distributions from: |
| Net investment income |
| Net realized gain on investments |
| Total dividends and distributions |
| |
| Net asset value, end of period |
| |
| Total return2 |
| |
| Ratios and supplemental data: |
| Net assets, end of period (000 omitted) |
| Ratio of expenses to average net assets |
| Ratio of expenses to average net assets |
| prior to fees waived and expense paid indirectly |
| Ratio of net investment income to average net assets |
| Ratio of net investment income to average net assets |
| prior to fees waived and expense paid indirectly |
| Portfolio turnover |
1 The average shares outstanding method has been applied for per share information. |
2 Total investment return is based on the change in net asset value of a share during the period and assumes reinvestment of dividends and distributions at net asset value and does not reflect the impact of a sales charge. Total investment return during some of the periods shown reflects waivers by the manager and distributor. Performance would have been lower had the waivers not been in effect. |
See accompanying notes, which are an integral part of the financial statements.
68
| | Year Ended | |
| | 11/30/11 | | 11/30/10 | | 11/30/09 | | 11/30/08 | | 11/30/07 | |
| | $14.860 | | | $12.880 | | | $7.940 | | | $22.760 | | | $21.280 | | |
| | | |
| | | |
| | 0.094 | | | 0.151 | | | 0.043 | | | 0.137 | | | 0.184 | | |
| | (1.819 | ) | | 1.834 | | | 5.736 | | | (9.242 | ) | | 7.117 | | |
| | (1.725 | ) | | 1.985 | | | 5.779 | | | (9.105 | ) | | 7.301 | | |
| | | |
| | | |
| | (0.085 | ) | | (0.005 | ) | | (0.016 | ) | | (0.234 | ) | | (0.523 | ) | |
| | — | | | — | | | (0.823 | ) | | (5.481 | ) | | (5.298 | ) | |
| | (0.085 | ) | | (0.005 | ) | | (0.839 | ) | | (5.715 | ) | | (5.821 | ) | |
| | | |
| | $13.050 | | | $14.860 | | | $12.880 | | | $7.940 | | | $22.760 | | |
| | | |
| | (11.70% | ) | | 15.42% | | | 79.84% | | | (53.37% | ) | | 46.11% | | |
| | | |
| | | |
| | $542,207 | | | $546,275 | | | $399,840 | | | $213,581 | | | $673,309 | | |
| | 1.78% | | | 1.85% | | | 1.91% | | | 1.83% | | | 1.97% | | |
| | | |
| | 1.83% | | | 1.90% | | | 1.98% | | | 1.88% | | | 2.02% | | |
| | 0.63% | | | 1.10% | | | 0.45% | | | 0.94% | | | 0.97% | | |
| | | |
| | 0.58% | | | 1.05% | | | 0.38% | | | 0.89% | | | 0.92% | | |
| | 19% | | | 27% | | | 37% | | | 37% | | | 108% | | |
69
Financial highlights
Delaware Emerging Markets Fund Class B
Selected data for each share of the Fund outstanding throughout each period were as follows:
| Net asset value, beginning of period |
| |
| Income (loss) from investment operations: |
| Net investment income (loss)1 |
| Net realized and unrealized gain (loss) |
| Total from investment operations |
| |
| Less dividends and distributions from: |
| Net investment income |
| Net realized gain on investments |
| Total dividends and distributions |
| |
| Net asset value, end of period |
| |
| Total return2 |
| |
| Ratios and supplemental data: |
| Net assets, end of period (000 omitted) |
| Ratio of expenses to average net assets |
| Ratio of expenses to average net assets |
| prior to fees waived and expense paid indirectly |
| Ratio of net investment income (loss) to average net assets |
| Ratio of net investment income (loss) to average net assets |
| prior to fees waived and expense paid indirectly |
| Portfolio turnover |
1 The average shares outstanding method has been applied for per share information. |
2 Total investment return is based on the change in net asset value of a share during the period and assumes reinvestment of dividends and distributions at net asset value and does not reflect the impact of a sales charge. Total investment return during some of the periods shown reflects a waiver by the manager. Performance would have been lower had the waiver not been in effect. |
See accompanying notes, which are an integral part of the financial statements.
70
| | Year Ended | |
| | 11/30/11 | | 11/30/10 | | 11/30/09 | | 11/30/08 | | 11/30/07 | |
| | $14.080 | | | $12.300 | | | $7.640 | | | $22.120 | | | $20.830 | | |
| | | |
| | | |
| | (0.018 | ) | | 0.046 | | | (0.025 | ) | | 0.030 | | | 0.045 | | |
| | (1.722 | ) | | 1.734 | | | 5.508 | | | (8.936 | ) | | 6.926 | | |
| | (1.740 | ) | | 1.780 | | | 5.483 | | | (8.906 | ) | | 6.971 | | |
| | | |
| | | |
| | — | | | — | | | — | | | (0.093 | ) | | (0.383 | ) | |
| | — | | | — | | | (0.823 | ) | | (5.481 | ) | | (5.298 | ) | |
| | — | | | — | | | (0.823 | ) | | (5.574 | ) | | (5.681 | ) | |
| | | |
| | $12.340 | | | $14.080 | | | $12.300 | | | $7.640 | | | $22.120 | | |
| | | |
| | (12.36% | ) | | 14.47% | | | 78.59% | | | (53.76% | ) | | 44.97% | | |
| | | |
| | | |
| | $13,359 | | | $19,030 | | | $20,022 | | | $14,620 | | | $45,978 | | |
| | 2.53% | | | 2.60% | | | 2.66% | | | 2.58% | | | 2.72% | | |
| | | |
| | 2.53% | | | 2.60% | | | 2.68% | | | 2.58% | | | 2.72% | | |
| | (0.12% | ) | | 0.35% | | | (0.30% | ) | | 0.19% | | | 0.22% | | |
| | | |
| | (0.12% | ) | | 0.35% | | | (0.32% | ) | | 0.19% | | | 0.22% | | |
| | 19% | | | 27% | | | 37% | | | 37% | | | 108% | | |
71
Financial highlights
Delaware Emerging Markets Fund Class C
Selected data for each share of the Fund outstanding throughout each period were as follows:
| Net asset value, beginning of period |
| |
| Income (loss) from investment operations: |
| Net investment income (loss)1 |
| Net realized and unrealized gain (loss) |
| Total from investment operations |
| |
| Less dividends and distributions from: |
| Net investment income |
| Net realized gain on investments |
| Total dividends and distributions |
| |
| Net asset value, end of period |
| |
| Total return2 |
| |
| Ratios and supplemental data: |
| Net assets, end of period (000 omitted) |
| Ratio of expenses to average net assets |
| Ratio of expenses to average net assets |
| prior to fees waived and expense paid indirectly |
| Ratio of net investment income (loss) to average net assets |
| Ratio of net investment income (loss) to average net assets |
| prior to fees waived and expense paid indirectly |
| Portfolio turnover |
1 The average shares outstanding method has been applied for per share information. |
2 Total investment return is based on the change in net asset value of a share during the period and assumes reinvestment of dividends and distributions at net asset value and does not reflect the impact of a sales charge. Total investment return during some of the periods shown reflects a waiver by the manager. Performance would have been lower had the waiver not been in effect. |
See accompanying notes, which are an integral part of the financial statements.
72
| | Year Ended | |
| | 11/30/11 | | 11/30/10 | | 11/30/09 | | 11/30/08 | | 11/30/07 | |
| | $14.050 | | | $12.270 | | | $7.630 | | | $22.090 | | | $20.800 | | |
| | |
| | |
| | (0.017 | ) | | 0.046 | | | (0.026 | ) | | 0.031 | | | 0.045 | | |
| | (1.713 | ) | | 1.734 | | | 5.489 | | | (8.917 | ) | | 6.926 | | |
| | (1.730 | ) | | 1.780 | | | 5.463 | | | (8.886 | ) | | 6.971 | | |
| | |
| | |
| | — | | | — | | | — | | | (0.093 | ) | | (0.383 | ) | |
| | — | | | — | | | (0.823 | ) | | (5.481 | ) | | (5.298 | ) | |
| | — | | | — | | | (0.823 | ) | | (5.574 | ) | | (5.681 | ) | |
| | |
| | $12.320 | | | $14.050 | | | $12.270 | | | $7.630 | | | $22.090 | | |
| | |
| | (12.31% | ) | | 14.51% | | | 78.68% | | | (53.75% | ) | | 45.03% | | |
| | |
| | |
| | $194,124 | | | $222,957 | | | $157,383 | | | $84,436 | | | $237,832 | | |
| | 2.53% | | | 2.60% | | | 2.66% | | | 2.58% | | | 2.72% | | |
| | |
| | 2.53% | | | 2.60% | | | 2.68% | | | 2.58% | | | 2.72% | | |
| | (0.12% | ) | | 0.35% | | | (0.30% | ) | | 0.19% | | | 0.22% | | |
| | |
| | (0.12% | ) | | 0.35% | | | (0.32% | ) | | 0.19% | | | 0.22% | | |
| | 19% | | | 27% | | | 37% | | | 37% | | | 108% | | |
73
Financial highlights
Delaware Emerging Markets Fund Class R
Selected data for each share of the Fund outstanding throughout each period were as follows:
| Net asset value, beginning of period |
| |
| Income (loss) from investment operations: |
| Net investment income (loss)2 |
| Net realized and unrealized gain (loss) |
| Total from investment operations |
| |
| Less dividends and distributions from: |
| Net investment income |
| Total dividends and distributions |
| |
| Net asset value, end of period |
| |
| Total return3 |
| |
| Ratios and supplemental data: |
| Net assets, end of period (000 omitted) |
| Ratio of expenses to average net assets |
| Ratio of expenses to average net assets |
| prior to fees waived and expense paid indirectly |
| Ratio of net investment income (loss) to average net assets |
| Ratio of net investment income (loss) to average net assets |
| prior to fees waived and expense paid indirectly |
| Portfolio turnover |
1 Date of commencement of operations; ratios have been annualized and total return has not been annualized. |
2 The average shares outstanding method has been applied for per share information. |
3 Total investment return is based on the change in net asset value of a share during the period and assumes reinvestment of dividends and distributions at net asset value. Total investment return during some of the periods shown reflects waivers by the manager and distributor. Performance would have been lower had the waivers not been in effect. |
4 Net assets were less than $500. |
5 Portfolio turnover is representative of the Fund for the entire year. |
See accompanying notes, which are an integral part of the financial statements.
74
| | Year Ended | | | 8/31/091 to | |
| | 11/30/11 | | 11/30/10 | | | 11/30/09 | |
| | $14.960 | | | $13.010 | | | | $11.520 | | |
| | |
| | |
| | 0.056 | | | 0.123 | | | | (0.030 | ) | |
| | (1.833 | ) | | 1.832 | | | | 1.520 | | |
| | (1.777 | ) | | 1.955 | | | | 1.490 | | |
| | |
| | |
| | (0.043 | ) | | (0.005 | ) | | | — | | |
| | (0.043 | ) | | (0.005 | ) | | | — | | |
| | |
| | $13.140 | | | $14.960 | | | | $13.010 | | |
| | |
| | (11.93% | ) | | 15.03% | | | | 12.93% | | |
| | |
| | |
| | $1,500 | | | $440 | | | | $—4 | | |
| | 2.03% | | | 2.10% | | | | 2.11% | | |
| | | | | | | | | | | | |
| | 2.13% | | | 2.20% | | | | 2.22% | | |
| | 0.38% | | | 0.85% | | | | (0.88% | ) | |
| | | | | | | | | | | |
| | 0.28% | | | 0.75% | | | | (0.99% | ) | |
| | 19% | | | 27% | | | | 37% | 5 | |
75
Financial highlights
Delaware Emerging Markets Fund Institutional Class
Selected data for each share of the Fund outstanding throughout each period were as follows:
| Net asset value, beginning of period |
| |
| Income (loss) from investment operations: |
| Net investment income1 |
| Net realized and unrealized gain (loss) |
| Total from investment operations |
| |
| Less dividends and distributions from: |
| Net investment income |
| Net realized gain on investments |
| Total dividends and distributions |
| |
| Net asset value, end of period |
| |
| Total return2 |
| |
| Ratios and supplemental data: |
| Net assets, end of period (000 omitted) |
| Ratio of expenses to average net assets |
| Ratio of expenses to average net assets |
| prior to fees waived and expense paid indirectly |
| Ratio of net investment income to average net assets |
| Ratio of net investment income to average net assets |
| prior to fees waived and expense paid indirectly |
| Portfolio turnover |
1 The average shares outstanding method has been applied for per share information. |
2 Total investment return is based on the change in net asset value of a share during the period and assumes reinvestment of dividends and distributions at net asset value. Total investment return during some of the periods shown reflects a waiver by the manager. Performance would have been lower had the waiver not been in effect. |
See accompanying notes, which are an integral part of the financial statements.
76
| | Year Ended | |
| | 11/30/11 | | 11/30/10 | | 11/30/09 | | 11/30/08 | | 11/30/07 | |
| | $14.970 | | | $12.980 | | | $8.000 | | | $22.910 | | | $21.390 | | |
| | |
| | |
| | 0.131 | | | 0.190 | | | 0.068 | | | 0.175 | | | 0.232 | | |
| | (1.821 | ) | | 1.831 | | | 5.786 | | | (9.321 | ) | | 7.157 | | |
| | (1.690 | ) | | 2.021 | | | 5.854 | | | (9.146 | ) | | 7.389 | | |
| | |
| | |
| | (0.120 | ) | | (0.031 | ) | | (0.051 | ) | | (0.283 | ) | | (0.571 | ) | |
| | — | | | — | | | (0.823 | ) | | (5.481 | ) | | (5.298 | ) | |
| | (0.120 | ) | | (0.031 | ) | | (0.874 | ) | | (5.764 | ) | | (5.869 | ) | |
| | |
| | $13.160 | | | $14.970 | | | $12.980 | | | $8.000 | | | $22.910 | | |
| | |
| | (11.42% | ) | | 15.69% | | | 80.39% | | | (53.30% | ) | | 46.49% | | |
| | |
| | |
| | $1,672,668 | | | $655,310 | | | $148,662 | | | $45,697 | | | $110,327 | | |
| | 1.53% | | | 1.60% | | | 1.66% | | | 1.58% | | | 1.72% | | |
| | |
| | 1.53% | | | 1.60% | | | 1.68% | | | 1.58% | | | 1.72% | | |
| | 0.88% | | | 1.35% | | | 0.70% | | | 1.19% | | | 1.22% | | |
| | |
| | 0.88% | | | 1.35% | | | 0.68% | | | 1.19% | | | 1.22% | | |
| | 19% | | | 27% | | | 37% | | | 37% | | | 108% | | |
77
Financial highlights
Delaware Global Value Fund Class A
Selected data for each share of the Fund outstanding throughout each period were as follows:
| Net asset value, beginning of period |
| |
| Income (loss) from investment operations: |
| Net investment income1 |
| Net realized and unrealized gain (loss) |
| Total from investment operations |
| |
| Less dividends and distributions from: |
| Net investment income |
| Net realized gain on investments |
| Total dividends and distributions |
| |
| Net asset value, end of period |
| |
| Total return2 |
| |
| Ratios and supplemental data: |
| Net assets, end of period (000 omitted) |
| Ratio of expenses to average net assets |
| Ratio of expenses to average net assets |
| prior to fees waived and expense paid indirectly |
| Ratio of net investment income to average net assets |
| Ratio of net investment income to average net assets |
| prior to fees waived and expense paid indirectly |
| Portfolio turnover |
1 The average shares outstanding method has been applied for per share information. |
2 Total investment return is based on the change in net asset value of a share during the period and assumes reinvestment of dividends and distributions at net asset value and does not reflect the impact of a sales charge. Total investment return during all of the periods shown reflects waivers by the manager and distributor. Performance would have been lower had the waivers not been in effect. |
See accompanying notes, which are an integral part of the financial statements.
78
| | Year Ended | |
| | 11/30/11 | | 11/30/10 | | 11/30/09 | | 11/30/08 | | 11/30/07 | |
| | $8.300 | | | $8.050 | | | $5.790 | | | $11.850 | | | $13.260 | | |
| | |
| | |
| | 0.101 | | | 0.067 | | | 0.106 | | | 0.172 | | | 0.145 | | |
| | (0.053 | ) | | 0.293 | | | 2.315 | | | (5.554 | ) | | 0.663 | | |
| | 0.048 | | | 0.360 | | | 2.421 | | | (5.382 | ) | | 0.808 | | |
| | |
| | |
| | (0.038 | ) | | (0.110 | ) | | (0.161 | ) | | (0.138 | ) | | (0.066 | ) | |
| | — | | | — | | | — | | | (0.540 | ) | | (2.152 | ) | |
| | (0.038 | ) | | (0.110 | ) | | (0.161 | ) | | (0.678 | ) | | (2.218 | ) | |
| | |
| | $8.310 | | | $8.300 | | | $8.050 | | | $5.790 | | | $11.850 | | |
| | |
| | 0.55% | | | 4.53% | | | 42.14% | | | (48.12% | ) | | 6.96% | | |
| | |
| | |
| | $17,989 | | | $20,844 | | | $24,823 | | | $22,034 | | | $66,024 | | |
| | 1.55% | | | 1.55% | | | 1.56% | | | 1.45% | | | 1.45% | | |
| | |
| | 1.88% | | | 2.07% | | | 2.09% | | | 1.76% | | | 1.57% | | |
| | 1.12% | | | 0.84% | | | 1.66% | | | 1.84% | | | 1.22% | | |
| | |
| | 0.79% | | | 0.32% | | | 1.13% | | | 1.53% | | | 1.10% | | |
| | 40% | | | 50% | | | 47% | | | 78% | | | 31% | | |
79
Financial highlights
Delaware Global Value Fund Class B
Selected data for each share of the Fund outstanding throughout each period were as follows:
| Net asset value, beginning of period |
| |
| Income (loss) from investment operations: | |
| Net investment income1 | |
| Net realized and unrealized gain (loss) | |
| Total from investment operations | |
| |
| Less dividends and distributions from: | |
| Net investment income | |
| Net realized gain on investments | |
| Total dividends and distributions | |
| |
| Net asset value, end of period | |
| |
| Total return2 | |
| |
| Ratios and supplemental data: | |
| Net assets, end of period (000 omitted) | |
| Ratio of expenses to average net assets | |
Ratio of expenses to average net assets
prior to fees waived and expense paid indirectly | |
| Ratio of net investment income to average net assets | |
Ratio of net investment income (loss) to average net assets
prior to fees waived and expense paid indirectly | |
| Portfolio turnover | |
1 The average shares outstanding method has been applied for per share information. |
2 Total investment return is based on the change in net asset value of a share during the period and assumes reinvestment of dividends and distributions at net asset value and does not reflect the impact of a sales charge. Total investment return during all of the periods shown reflects a waiver by the manager. Performance would have been lower had the waiver not been in effect. |
See accompanying notes, which are an integral part of the financial statements.
80
| | | Year Ended | |
| | | 11/30/11 | | 11/30/10 | | 11/30/09 | | 11/30/08 | | 11/30/07 | |
| | | $8.170 | | | $7.940 | | | $5.680 | | | $11.640 | | | $13.070 | | |
| | | | | |
| | | | | |
| | | 0.033 | | | 0.007 | | | 0.059 | | | 0.104 | | | 0.057 | | |
| | | (0.053 | ) | | 0.285 | | | 2.297 | | | (5.474 | ) | | 0.665 | | |
| | | (0.020 | ) | | 0.292 | | | 2.356 | | | (5.370 | ) | | 0.722 | | |
| | | | | |
| | | | | |
| | | — | | | (0.062 | ) | | (0.096 | ) | | (0.050 | ) | | — | | |
| | | — | | | — | | | — | | | (0.540 | ) | | (2.152 | ) | |
| | | — | | | (0.062 | ) | | (0.096 | ) | | (0.590 | ) | | (2.152 | ) | |
| | | | | |
| | | $8.150 | | | $8.170 | | | $7.940 | | | $5.680 | | | $11.640 | | |
| | | | | |
| | | (0.24% | ) | | 3.70% | | | 41.36% | | | (48.51% | ) | | 6.08% | | |
| | | | | |
| | | | | |
| | | $2,365 | | | $3,136 | | | $4,255 | | | $4,103 | | | $10,893 | | |
| | | 2.30% | | | 2.30% | | | 2.31% | | | 2.20% | | | 2.20% | | |
| | | | | |
| | | 2.58% | | | 2.77% | | | 2.79% | | | 2.46% | | | 2.27% | | |
| | | 0.37% | | | 0.09% | | | 0.91% | | | 1.09% | | | 0.47% | | |
| | | | | |
| | | 0.09% | | | (0.38% | ) | | 0.43% | | | 0.83% | | | 0.40% | | |
| | | 40% | | | 50% | | | 47% | | | 78% | | | 31% | | |
81
Financial highlights
Delaware Global Value Fund Class C
Selected data for each share of the Fund outstanding throughout each period were as follows:
| Net asset value, beginning of period |
| |
| Income (loss) from investment operations: | |
| Net investment income1 | |
| Net realized and unrealized gain (loss) | |
| Total from investment operations | |
| |
| Less dividends and distributions from: | |
| Net investment income | |
| Net realized gain on investments | |
| Total dividends and distributions | |
| |
| Net asset value, end of period | |
| |
| Total return2 | |
| |
| Ratios and supplemental data: | |
| Net assets, end of period (000 omitted) | |
| Ratio of expenses to average net assets | |
Ratio of expenses to average net assets
prior to fees waived and expense paid indirectly | |
| Ratio of net investment income to average net assets | |
Ratio of net investment income (loss) to average net assets
prior to fees waived and expense paid indirectly | |
| Portfolio turnover | |
1 The average shares outstanding method has been applied for per share information. |
2 Total investment return is based on the change in net asset value of a share during the period and assumes reinvestment of dividends and distributions at net asset value and does not reflect the impact of a sales charge. Total investment return during all of the periods shown reflects a waiver by the manager. Performance would have been lower had the waiver not been in effect. |
See accompanying notes, which are an integral part of the financial statements.
82
| | | Year Ended | |
| | | 11/30/11 | | 11/30/10 | | 11/30/09 | | 11/30/08 | | 11/30/07 | |
| | | $8.170 | | | $7.940 | | | $5.690 | | | $11.650 | | | $13.090 | | |
| | | | | |
| | | | | |
| | | 0.033 | | | 0.007 | | | 0.059 | | | 0.102 | | | 0.057 | | |
| | | (0.053 | ) | | 0.285 | | | 2.287 | | | (5.472 | ) | | 0.655 | | |
| | | (0.020 | ) | | 0.292 | | | 2.346 | | | (5.370 | ) | | 0.712 | | |
| | | | | |
| | | | | |
| | | — | | | (0.062 | ) | | (0.096 | ) | | (0.050 | ) | | — | | |
| | | — | | | — | | | — | | | (0.540 | ) | | (2.152 | ) | |
| | | — | | | (0.062 | ) | | (0.096 | ) | | (0.590 | ) | | (2.152 | ) | |
| | | | | |
| | | $8.150 | | | $8.170 | | | $7.940 | | | $5.690 | | | $11.650 | | |
| | | | | |
| | | (0.24% | ) | | 3.70% | | | 41.12% | | | (48.51% | ) | | 6.17% | | |
| | | | | |
| | | | | |
| | | $6,745 | | | $8,193 | | | $10,845 | | | $11,260 | | | $39,463 | | |
| | | 2.30% | | | 2.30% | | | 2.31% | | | 2.20% | | | 2.20% | | |
| | | | | |
| | | 2.58% | | | 2.77% | | | 2.79% | | | 2.46% | | | 2.27% | | |
| | | 0.37% | | | 0.09% | | | 0.91% | | | 1.09% | | | 0.47% | | |
| | | | | |
| | | 0.09% | | | (0.38% | ) | | 0.43% | | | 0.83% | | | 0.40% | | |
| | | 40% | | | 50% | | | 47% | | | 78% | | | 31% | | |
83
Financial highlights
Delaware Global Value Fund Institutional Class
Selected data for each share of the Fund outstanding throughout each period were as follows:
| Net asset value, beginning of period |
| |
| Income (loss) from investment operations: | |
| Net investment income1 | |
| Net realized and unrealized gain (loss) | |
| Total from investment operations | |
| |
| Less dividends and distributions from: | |
| Net investment income | |
| Net realized gain on investments | |
| Total dividends and distributions | |
| |
| Net asset value, end of period | |
| |
| Total return2 | |
| |
| Ratios and supplemental data: | |
| Net assets, end of period (000 omitted) | |
| Ratio of expenses to average net assets | |
Ratio of expenses to average net assets
prior to fees waived and expense paid indirectly | |
| Ratio of net investment income to average net assets | |
Ratio of net investment income (loss) to average net assets
prior to fees waived and expense paid indirectly | |
| Portfolio turnover | |
1 The average shares outstanding method has been applied for per share information. |
2 Total investment return is based on the change in net asset value of a share during the period and assumes reinvestment of dividends and distributions at net asset value. Total investment return during all of the periods shown reflects a waiver by the manager. Performance would have been lower had the waiver not been in effect. |
See accompanying notes, which are an integral part of the financial statements.
84
| | | Year Ended | |
| | | 11/30/11 | | 11/30/10 | | 11/30/09 | | 11/30/08 | | 11/30/07 | |
| | | $8.340 | | | $8.080 | | | $5.810 | | | $11.910 | | | $13.310 | | |
| | | | |
| | | | |
| | | 0.124 | | | 0.087 | | | 0.123 | | | 0.195 | | | 0.176 | | |
| | | (0.066 | ) | | 0.300 | | | 2.330 | | | (5.587 | ) | | 0.673 | | |
| | | 0.058 | | | 0.387 | | | 2.453 | | | (5.392 | ) | | 0.849 | | |
| | | | |
| | | | |
| | | (0.058 | ) | | (0.127 | ) | | (0.183 | ) | | (0.168 | ) | | (0.097 | ) | |
| | | — | | | — | | | — | | | (0.540 | ) | | (2.152 | ) | |
| | | (0.058 | ) | | (0.127 | ) | | (0.183 | ) | | (0.708 | ) | | (2.249 | ) | |
| | | | |
| | | $8.340 | | | $8.340 | | | $8.080 | | | $5.810 | | | $11.910 | | |
| | | | |
| | | 0.65% | | | 4.86% | | | 42.46% | | | (48.03% | ) | | 7.12% | | |
| | | | |
| | | | |
| | | $1,685 | | | $1,677 | | | $1,390 | | | $1,088 | | | $2,398 | | |
| | | 1.30% | | | 1.30% | | | 1.31% | | | 1.20% | | | 1.20% | | |
| | | | |
| | | 1.58% | | | 1.77% | | | 1.79% | | | 1.46% | | | 1.27% | | |
| | | 1.37% | | | 1.09% | | | 1.91% | | | 2.09% | | | 1.47% | | |
| | | | |
| | | 1.09% | | | 0.62% | | | 1.43% | | | 1.83% | | | 1.40% | | |
| | | 40% | | | 50% | | | 47% | | | 78% | | | 31% | | |
85
| Notes to financial statements | |
| Delaware International Funds | November 30, 2011 |
Delaware Group® Global & International Funds (Trust) is organized as a Delaware statutory trust and offers five series: Delaware International Value Equity Fund, Delaware Emerging Markets Fund, Delaware Global Value Fund, Delaware Focus Global Growth Fund and Delaware Macquarie Global Infrastructure Fund. These financial statements and the related notes pertain to Delaware International Value Equity Fund, Delaware Emerging Markets Fund and Delaware Global Value Fund (each, a Fund or collectively, the Funds). The Trust is an open-end investment company. Each Fund is considered diversified under the Investment Company Act of 1940, as amended, and offers Class A, Class B, Class C, Class R and Institutional Class shares. Class A shares are sold with a maximum front-end sales charge of up to 5.75%. Class A share purchases of $1,000,000 or more will incur a contingent deferred sales charge (CDSC) of 1% if redeemed during the first year and 0.50% during the second year, provided that Delaware Distributors, L.P. (DDLP) paid a financial advisor a commission on the purchase of those shares. Class B shares may be purchased only through dividend reinvestment and certain permitted exchanges. Prior to June 1, 2007, Class B shares were sold with a CDSC that declined from 4% to zero depending upon the period of time the shares were held. Class B shares will automatically convert to Class A shares on a quarterly basis approximately eight years after purchase. Class C shares are sold with a CDSC of 1%, if redeemed during the first twelve months. Class R and Institutional Class shares are not subject to a sales charge and are offered for sale exclusively to certain eligible investors. As of November 30, 2011, Delaware Global Value Fund has not commenced operations of its Class R shares.
The investment objective of Delaware International Value Equity Fund is to seek long-term growth without undue risk to principal.
The investment objective of Delaware Emerging Markets Fund and Delaware Global Value Fund is to seek long-term capital appreciation.
1. Significant Accounting Policies
The following accounting policies are in accordance with U.S. generally accepted accounting principles (U.S. GAAP) and are consistently followed by the Funds.
Security Valuation — Equity securities, except those traded on the Nasdaq Stock Market, Inc. (Nasdaq), are valued at the last quoted sales price as of the time of the regular close of the New York Stock Exchange (NYSE) on the valuation date. Securities traded on the Nasdaq are valued in accordance with the Nasdaq Official Closing Price, which may not be the last sales price. If on a particular day an equity security does not trade, then the mean between the bid and ask prices will be used, which approximates fair value. Securities listed on a foreign exchange are generally valued at the last quoted sales price on the valuation date. Short-term debt securities are valued at market value. Investment company securities are valued at net asset value per share. U.S. government and agency securities are valued at the mean between the bid and ask prices, which approximates fair value. Foreign currency exchange contracts are valued at the mean between the bid and ask prices, which approximates fair value. Interpolated values are derived when the settlement date of the contract is an interim date for which quotations are not available. Generally, other securities
86
and assets for which market quotations are not readily available are valued at fair value as determined in good faith under the direction of each Fund’s Board of Trustees (Board). In determining whether market quotations are readily available or fair valuation will be used, various factors will be taken into consideration, such as market closures, or suspension of trading in a security. The Funds may use fair value pricing more frequently for securities traded primarily in non-U.S. markets because, among other things, most foreign markets close well before each Fund values its securities, generally as of 4:00 p.m. Eastern time. The earlier close of these foreign markets gives rise to the possibility that significant events, including broad market moves, government actions or pronouncements, aftermarket trading, or news events may have occurred in the interim. To account for this, the Funds may frequently value foreign securities using fair value prices based on third-party vendor modeling tools (international fair value pricing).
Federal Income Taxes — No provision for federal income taxes has been made as the Fund intends to continue to qualify for federal income tax purposes as a regulated investment company under Subchapter M of the Internal Revenue Code of 1986, as amended, and make the requisite distributions to shareholders. The Funds evaluate tax positions taken or expected to be taken in the course of preparing the Funds’ tax returns to determine whether the tax positions are “more likely-than-not” of being sustained by the applicable tax authority. Tax positions not deemed to meet the more-likely-than-not threshold are recorded as a tax benefit or expense in the current year. Management has analyzed the Funds’ tax positions taken on federal income tax returns for all open tax years (November 30, 2008 – November 30, 2011), and has concluded that no provision for federal income tax is required in the Funds’ financial statements.
Class Accounting — Investment income, common expenses and realized and unrealized gain (loss) on investments are allocated to the various classes of the Funds on the basis of daily net assets of each class. Distribution expenses relating to a specific class are charged directly to that class.
Repurchase Agreements — Each Fund may purchase certain U.S. government securities subject to the counterparty’s agreement to repurchase them at an agreed upon date and price. The counterparty will be required on a daily basis to maintain the value of the collateral subject to the agreement at not less than the repurchase price (including accrued interest). The agreements are conditioned upon the collateral being deposited under the Federal Reserve book-entry system with the Funds’ custodian or a third party sub-custodian. In the event of default or bankruptcy by the other party to the agreement, retention of the collateral may be subject to legal proceedings. All open repurchase agreements as of the date of this report were entered into on November 30, 2011.
Foreign Currency Transactions — Transactions denominated in foreign currencies are recorded at the prevailing exchange rates on the valuation date in accordance with each Fund’s prospectus. The value of all assets and liabilities denominated in foreign currencies is translated into U.S. dollars at the exchange rate of such currencies against the U.S.
87
Notes to financial statements
Delaware International Funds
1. Significant Accounting Policies (continued)
dollar daily. Transaction gains or losses resulting from changes in exchange rates during the reporting period or upon settlement of the foreign currency transaction are reported in operations for the current period. The Funds generally do not isolate that portion of realized gains and losses on investments which is due to changes in foreign exchange rates from that which is due to changes in market prices. The changes are included with the net realized and unrealized gain or loss on investments. The Funds report certain foreign currency related transactions as components of realized gains (losses) for financial reporting purposes, whereas such components are treated as ordinary income (loss) for federal income tax purposes.
Use of Estimates — The preparation of financial statements in conformity with U.S. GAAP requires management to make estimates and assumptions that affect the fair value of investments, the reported amounts of assets and liabilities and disclosure of contingent assets and liabilities at the date of the financial statements and the reported amounts of revenues and expenses during the reporting period. Actual results could differ from those estimates and the differences could be material.
Other — Expenses directly attributable to the Funds are charged directly to the Funds. Other expenses common to various funds within the Delaware Investments® Family of Funds are generally allocated amongst such funds on the basis of average net assets. Management fees and some other expenses are paid monthly. Security transactions are recorded on the date the securities are purchased or sold (trade date) for the financial reporting purposes. Costs used in calculating realized gains and losses on the sale of investment securities are those of the specific securities sold. Dividend income is recorded on the ex-dividend date and interest income is recorded on the accrual basis. Taxable non-cash dividends are recorded as dividend income. Foreign dividends are also recorded on the ex-dividend date or as soon after the ex-dividend date that the Funds are aware of such dividends, net of all non-rebatable tax withholdings. Withholding taxes on foreign dividends have been recorded in accordance with each Fund’s understanding of the applicable country’s tax rules and rates. Each Fund declares and pays dividends from net investment income and distributions from net realized gain on investments, if any, annually. Dividends and distributions, if any, are recorded on the ex-dividend date. The Funds may distribute income dividends and capital gains more frequently, if necessary for tax purposes.
The Funds may receive earnings credits from their custodian when positive cash balances are maintained, which are used to offset custody fees. There were no earnings credits for the year ended November 30, 2011.
The Funds receive earnings credits from their transfer agent when positive cash balances are maintained, which are used to offset transfer agent fees. The expense paid under this arrangement is included in dividend disbursing and transfer agent fees and expenses on the statements of
88
operations with the corresponding expense offset shown as “expense paid indirectly.” For the year ended November 30, 2011, each Fund earned the following amounts under this agreement:
| Delaware International | | Delaware Emerging | | Delaware Global |
| Value Equity Fund | | Markets Fund | | Value Fund |
| $1,048 | | $3,681 | | $188 |
| 2. | Investment Management, Administration Agreements and Other Transactions with Affiliates |
In accordance with the terms of its respective Investment Management Agreement, each Fund pays Delaware Management Company (DMC), a series of Delaware Management Business Trust and the investment manager, an annual fee based on each Fund’s average daily net assets as follows:
| Delaware International | | Delaware Emerging | | Delaware Global |
| Value Equity Fund | | Markets Fund | | Value Fund |
| On the first $500 million | | 0.85 | % | | | | 1.25 | % | | | | 0.85 | % | |
| On the next $500 million | | 0.80 | % | | | | 1.20 | % | | | | 0.80 | % | |
| On the next $1.5 billion | | 0.75 | % | | | | 1.15 | % | | | | 0.75 | % | |
| In excess of $2.5 billion | | 0.70 | % | | | | 1.10 | % | | | | 0.70 | % | |
Effective March 30, 2011, DMC has contractually agreed to waive that portion, if any, of its management fee and reimburse each Fund to the extent necessary to ensure that total annual operating expenses, (excluding any 12b-1 plan expenses, taxes, interest, inverse floater program expenses, short sale and dividend interest expenses, brokerage fees, certain insurance costs, and nonroutine expenses or costs, including, but not limited to, those relating to reorganizations, litigation, conducting shareholder meetings, and liquidations) do not exceed specified percentages of average daily net assets through March 29, 2012 as shown below. These waivers and reimbursements may be terminated only by agreement of the Manager and the Funds.
| Delaware International | | Delaware Emerging | | Delaware Global |
| Value Equity Fund | | Markets Fund | | Value Fund |
| Effective March 30, 2011, operating | | | | | | | | | | | | | | |
| expense limitation as a percentage | | | | | | | | | | | | | | |
| of average daily net assets | | | | | | | | | | | | | | |
| (per annum) | | 1.30 | % | | | | 1.60 | % | | | | 1.30 | % | |
| Through March 29, 2011, operating | | | | | | | | | | | | | | |
| expense limitation as a percentage | | | | | | | | | | | | | | |
| of average daily net assets | | | | | | | | | | | | | | |
| (per annum) | | 1.35 | % | | | | 1.75 | % | | | | 1.30 | % | |
Delaware Service Company, Inc. (DSC), an affiliate of DMC, provides fund accounting and financial administration oversight services to the Funds. For these services, the Funds pay DSC fees based on the aggregate daily net assets of the Delaware Investments® Family of Funds at the
89
Notes to financial statements
Delaware International Funds
2. Investment Management, Administration Agreements and Other Transactions with Affiliates (continued)
following annual rate: 0.0050% of the first $30 billion; 0.0045% of the next $10 billion; 0.0040% of the next $10 billion; and 0.0025% of aggregate average daily net assets in excess of $50 billion. The fees payable to DSC under the service agreement described above are allocated among all Funds in the Delaware Investments® Family of Funds on a relative net asset value basis. For the year ended November 30, 2011, each Fund was charged for these services as follows:
| Delaware International | | Delaware Emerging | | Delaware Global |
| Value Equity Fund | | Markets Fund | | Value Fund |
| $15,031 | | $116,246 | | $1,683 |
DSC also provides dividend disbursing and transfer agency services. Effective July 18, 2011, the Funds pay DSC a monthly asset-based fee for these services. Prior to July 18, 2011, the Funds paid DSC a monthly fee based on the number of shareholder accounts for dividend disbursing and transfer agent services.
Pursuant to a distribution agreement and distribution plan, each Fund pays DDLP, the distributor and an affiliate of DMC, an annual distribution and service fee not to exceed 0.30% of the average daily net assets of the Class A shares, 1.00% of the average daily net assets of the Class B and Class C shares, and 0.60% of the average daily net assets of the Class R shares. Institutional Class shares pay no distribution and service expenses. DDLP has contracted to limit each Fund’s Class R shares’ 12b-1 fees through March 29, 2012 to no more than 0.50% of the Class R shares’ average daily net assets. For Delaware Emerging Markets Fund and Delaware Global Value Fund, DDLP has contracted to limit the Class A shares’ 12b-1 fees through March 29, 2012 to no more than 0.25% of the Class A shares’ average daily net assets.
At November 30, 2011, the Funds had liabilities payable to affiliates as follows:
| | Delaware International | | Delaware Emerging | | Delaware Global |
| | Value Equity Fund | | Markets Fund | | Value Fund |
| Investment management fees | | | | | | | | | | | | | | | |
| payable to DMC | | | $ | 162,332 | | | | $ | 2,379,743 | | | | $ | 20,273 | |
| Dividend disbursing, transfer | | | | | | | | | | | | | | | |
| agent and fund accounting | | | | | | | | | | | | | | | |
| oversight fees, and other | | | | | | | | | | | | | | | |
| expenses payable to DSC | | | | 5,761 | | | | | 58,222 | | | | | 678 | |
| Distribution fees payable to DDLP | | | | 57,435 | | | | | 285,897 | | | | | 11,151 | |
| Other expenses payable to DMC | | | | | | | | | | | | | | | |
| and affiliates* | | | | 10,727 | | | | | 94,636 | | | | | 1,193 | |
*DMC, as part of its administrative services, pays operating expenses on behalf of the Funds and is reimbursed on a periodic basis. Expenses include items such as printing of shareholder reports, fees for audit, legal and tax services, registration fees and trustees’ fees.
90
As provided in the investment management agreement, the Funds bear the cost of certain legal and tax services, including internal legal and tax services provided to the Funds by DMC and/or its affiliates’ employees. For the year ended November 30, 2011, the Funds were charged for internal legal and tax services provided by DMC and/or its affiliates’ employees as follows:
| Delaware International | | Delaware Emerging | | Delaware Global |
| Value Equity Fund | | Markets Fund | | Value Fund |
| $3,972 | | $71,238 | | $742 |
For the year ended November 30, 2011, DDLP earned commissions on sales of Class A shares for each Fund as follows:
| Delaware International | | Delaware Emerging | | Delaware Global |
| Value Equity Fund | | Markets Fund | | Value Fund |
| $23,879 | | $178,369 | | $4,587 |
For the year ended November 30, 2011, DDLP received gross CDSC commissions on redemptions of each Fund’s Class A, Class B and Class C shares, respectively, and these commissions were entirely used to offset up-front commissions previously paid by DDLP to broker/dealers on sales of those shares. The amounts received were as follows:
| | Delaware International | | Delaware Emerging | | Delaware Global |
| | Value Equity Fund | | Markets Fund | | Value Fund |
| Class A | | | $ | 21 | | | | $ | 1,255 | | | | $ | 28 | |
| Class B | | | | 4,762 | | | | | 5,258 | | | | | 2,920 | |
| Class C | | | | 1,066 | | | | | 25,665 | | | | | 98 | |
Trustees’ fees include expenses accrued by the Funds for each Trustee’s retainer and meeting fees. Certain officers of DMC, DSC and DDLP are officers and/or Trustees of the Trust. These officers and Trustees are paid no compensation by the Funds.
3. Investments
For year ended November 30, 2011, the Funds made purchases and sales of investment securities other than short-term investments as follows:
| | Delaware International | | Delaware Emerging | | Delaware Global |
| | Value Equity Fund | | Markets Fund | | Value Fund |
| Purchases | | | $ | 124,151,890 | | | | $ | 1,892,333,070 | | | | $ | 13,527,799 | |
| Sales | | | | 200,432,897 | | | | | 446,219,568 | | | | | 18,975,974 | |
91
Notes to financial statements
Delaware International Funds
3. Investments (continued)
At November 30, 2011, the cost of investments and unrealized appreciation (depreciation) for federal income tax purposes for each Fund were as follows:
| | Delaware International | | Delaware Emerging | | Delaware Global |
| | Value Equity Fund | | Markets Fund | | Value Fund |
| Cost of investments | | | $ | 262,383,098 | | | | $ | 2,966,959,094 | | | $ | 28,770,010 | |
| Aggregate unrealized appreciation | | | $ | 27,308,998 | | | | $ | 211,512,711 | | | $ | 3,789,960 | |
| Aggregate unrealized depreciation | | | | (51,530,808 | ) | | | | (580,621,774 | ) | | | (3,288,466 | ) |
| Net unrealized appreciation | | | | | | | | | | | | | | |
| (depreciation) | | | $ | (24,221,810 | ) | | | $ | (369,109,063 | ) | | $ | 501,494 | |
U.S. GAAP defines fair value as the price that each Fund would receive to sell an asset or pay to transfer a liability in an orderly transaction between market participants at the measurement date under current market conditions. A three level hierarchy for fair value measurements has been established based upon the transparency of inputs to the valuation of an asset or liability. Inputs may be observable or unobservable and refer broadly to the assumptions that market participants would use in pricing the asset or liability. Observable inputs reflect the assumptions market participants would use in pricing the asset or liability based on market data obtained from sources independent of the reporting entity. Unobservable inputs reflect the reporting entity’s own assumptions about the assumptions that market participants would use in pricing the asset or liability developed based on the best information available under the circumstances. Each Fund’s investment in its entirety is assigned a level based upon the observability of the inputs which are significant to the overall valuation. The three level hierarchy of inputs is summarized below.
| Level 1 – | inputs are quoted prices in active markets for identical investments (e.g., equity securities, open-end investment companies, futures contracts, options contracts) |
| |
| Level 2 – | other observable inputs (including, but not limited to: quoted prices for similar assets or liabilities in markets that are active, quoted prices for identical or similar assets or liabilities in markets that are not active, inputs other than quoted prices that are observable for the assets or liabilities (such as interest rates, yield curves, volatilities, prepayment speeds, loss severities, credit risks and default rates) or other market-corroborated inputs) (e.g., debt securities, government securities, swap contracts, foreign currency exchange contracts, foreign securities utilizing international fair value pricing) |
| |
| Level 3 – | inputs are significant unobservable inputs (including each Fund’s own assumptions used to determine the fair value of investments) (e.g., broker-quoted securities, fair valued securities) |
92
The following tables summarize the valuation of each Fund’s investments by fair value hierarchy levels as of November 30, 2011:
| | Delaware International Value Equity Fund |
| | Level 1 | | Level 2 | | Level 3 | | Total |
| Common Stock | | $ | 49,462,421 | | $ | 177,305,009 | | | | $ | — | | | $ | 226,767,430 | |
| Short-Term Investments | | | 4,692,000 | | | 269,357 | | | | | — | | | | 4,961,357 | |
| Securities Lending Collateral | | | — | | | 6,432,501 | | | | | — | | | | 6,432,501 | |
| Total | | $ | 54,154,421 | | $ | 184,006,867 | | | | $ | — | | | $ | 238,161,288 | |
| |
| Foreign Currency | | | | | | | | | | | | | | | | |
| Exchange Contract | | $ | — | | $ | (260 | ) | | | $ | — | | | $ | (260 | ) |
| | Delaware Emerging Markets Fund |
| | Level 1 | | Level 2 | | | Level 3 | | Total |
| Common Stock | | $ | 1,317,608,719 | | $ | 1,012,507,876 | | | $ | — | | $ | 2,330,116,595 |
| Convertible Preferred Stock | | | — | | | 17,087,500 | | | | — | | | 17,087,500 |
| Preferred Stock | | | 34,410,494 | | | 17,520,817 | | | | 11,943,554 | | | 63,874,865 |
| Securities Lending Collateral | | | — | | | 186,771,071 | | | | — | | | 186,771,071 |
| Total | | $ | 1,352,019,213 | | $ | 1,233,887,264 | | | $ | 11,943,554 | | $ | 2,597,850,031 |
| | Delaware Global Value Fund |
| | Level 1 | | Level 2 | | Level 3 | | Total |
| Common Stock | | $ | 17,701,465 | | $ | 10,876,360 | | | | $ | — | | | $ | 28,577,825 | |
| Short-Term Investment | | | 288,000 | | | — | | | | | — | | | | 288,000 | |
| Securities Lending Collateral | | | — | | | 405,679 | | | | | — | | | | 405,679 | |
| Total | | $ | 17,989,465 | | $ | 11,282,039 | | | | $ | — | | | $ | 29,271,504 | |
| |
| Foreign Currency | | | | | | | | | | | | | | | | |
| Exchange Contract | | $ | — | | $ | (15 | ) | | | $ | — | | | $ | (15 | ) |
For Delaware International Value Equity Fund and Delaware Global Value Fund, the value of Level 3 investments was zero at the beginning and end of the year and there was no change in unrealized appreciation/depreciation.
As a result of utilizing international fair value pricing at November 30, 2011, a portion of the portfolios was categorized as Level 2.
93
Notes to financial statements
Delaware International Funds
3. Investments (continued)
The following is a reconciliation of investments in which significant unobservable inputs (Level 3) were used in determining fair value:
| | Delaware Emerging Markets Fund |
| | Common | | | | | | | |
| | Stock | | Other | | Total |
| Balance as of 11/30/10 | | $ | 2,738,216 | | | $ | 700,104 | | $ | 3,438,320 | |
| Purchases | | | — | | | | 1,027,687 | | | 1,027,687 | |
| Transfers into Level 3 | | | — | | | | 9,017,308 | | | 9,017,308 | |
| Transfers out of Level 3 | | | (2,907,560 | ) | | | — | | | (2,907,560 | ) |
| Net change in unrealized | | | | | | | | | | | |
| appreciation (depreciation) | | | 169,344 | | | | 1,198,455 | | | 1,367,799 | |
| Balance as of 11/30/11 | | $ | — | | | $ | 11,943,554 | | $ | 11,943,554 | |
| |
| Net change in unrealized appreciation | | | | | | | | | | | |
| (depreciation) from investments still | | | | | | | | | | | |
| held as of 11/30/11 | | $ | — | | | $ | 1,405,345 | | $ | 1,405,345 | |
During the year ended November 30, 2011, there were no transfers between Level 1 investments and Level 2 investments that had a material impact to the Funds. This does not include transfers between Level 1 investments and Level 2 investments due to the Funds utilizing international fair value pricing during the year.
During the year ended November 30, 2011, transfers out of Level 3 investments into Level 2 investments were made in the amount of $2,907,560 for Delaware Emerging Markets Fund. The transfer was due to the Fund’s pricing vendor being able to supply a matrix price with observable inputs for an investment that had been utilizing a broker quoted price. During the year ended November 30, 2011, transfers into Level 3 investments from Level 1 investments were made in the amount of $9,017,308 for Delaware Emerging Markets Fund. The transfer was due to the Fund’s pricing vendor ceasing to provide the pricing for the investment. There were no transfers between Level 3 investments and Level 2 investments that had a material impact to the Delaware International Value Equity Fund or Delaware Global Value Fund.
The Funds’ policy is to recognize transfers between levels at the end of the reporting period.
94
4. Dividend and Distribution Information
Income and long-term capital gain distributions are determined in accordance with federal income tax regulations, which may differ from U.S. GAAP. Additionally, distributions from net gains on foreign currency transactions and net short-term gains on sales of investment securities are treated as ordinary income for federal income tax purposes. The tax character of dividends and distributions paid during the years ended November 30, 2011 and 2010 was as follows:
| | Delaware International | | Delaware Emerging | | Delaware Global |
| | Value Equity Fund | | Markets Fund | | Value Fund |
| Year Ended November 30, 2011: | | | | | | | | | | | | |
| Ordinary income | | | $ | 2,923,827 | | | | $ | 8,820,716 | | | | $ | 105,611 | |
| | |
| Year Ended November 30, 2010: | | | | | | | | | | | | | | | |
| Ordinary income | | | $ | 7,273,157 | | | | $ | 517,819 | | | | $ | 475,008 | |
5. Components of Net Assets on a Tax Basis
As of November 30, 2011, the components of net assets on a tax basis were as follows:
| | Delaware International | | Delaware Emerging | | Delaware Global |
| | Value Equity Fund | | Markets Fund | | Value Fund |
| Shares of beneficial interest | | | $ | 454,987,045 | | | | $ | 2,741,433,918 | | | | $ | 56,359,752 | | |
| Undistributed ordinary income | | | | 4,148,092 | | | | | 30,773,759 | | | | | 245,163 | | |
| Undistributed long-term capital gain | | | | — | | | | | 20,520,276 | | | | | — | | |
| Capital loss carryforwards | | | | (201,191,090 | ) | | | | — | | | | | (28,322,037 | ) | |
| Unrealized appreciation (depreciation) | | | | (24,244,791 | ) | | | | (368,869,455 | ) | | | | 501,427 | | |
| Net assets | | | $ | 233,699,256 | | | | $ | 2,423,858,498 | | | | $ | 28,784,305 | | |
The differences between book basis and tax basis components of net assets are primarily attributable to tax deferral of losses on wash sales, mark-to-market of foreign currency exchange contracts and tax recognition of unrealized gain on passive foreign investment companies.
For financial reporting purposes, capital accounts are adjusted to reflect the tax character of permanent book/tax differences. Reclassifications are primarily due to tax treatment of gain (loss) on foreign currency transactions, foreign capital gain taxes and passive foreign investment companies. Results of operations and net assets were not affected by these reclassifications. For the year ended November 30, 2011, the Funds recorded the following reclassifications:
| | Delaware International | | Delaware Emerging | | Delaware Global |
| | Value Equity Fund | | Markets Fund | | Value Fund |
| Undistributed net investment income | | | $ | (1,035,342 | ) | | | | $ | (626,291 | ) | | | | $ | (54,818 | ) | |
| Accumulated net realized gain (loss) | | | | 1,035,342 | | | | | | 626,291 | | | | | | 54,818 | | |
95
Notes to financial statements
Delaware International Funds
5. Components of Net Assets on a Tax Basis (continued)
For federal income tax purposes, capital loss carryforwards may be carried forward and applied against future capital gains. In 2011, the Funds utilized capital loss carryforwards as follows:
| Delaware Emerging | | Delaware Global |
| Markets Fund | | Value Fund |
| $745,923 | | $474,074 |
Capital loss carryforwards remaining at November 30, 2011 will expire as follows:
| | Delaware International | | Delaware Global |
| Years of Expiration | | | Value Equity Fund | | Value Fund |
| 2016 | | | $ | 79,163,033 | | | | $ | 15,779,360 | |
| 2017 | | | | 113,289,581 | | | | | 12,542,677 | |
| 2019 | | | | 8,738,476 | | | | | — | |
| Total | | | $ | 201,191,090 | | | | $ | 28,322,037 | |
On December 22, 2010, the Regulated Investment Company Modernization Act of 2010 (the Act) was enacted, which changed various technical rules governing the tax treatment of regulated investment companies. The changes are generally effective for taxable years beginning after the date of enactment. Under the Act, the Funds will be permitted to carry forward capital losses incurred in taxable years beginning after the date of enactment for an unlimited period. However, any losses incurred during those future taxable years will be required to be utilized prior to the losses incurred in pre-enactment taxable years, which carry an expiration date. As a result of this ordering rule, pre-enactment capital loss carryforwards may be more likely to expire unused. Additionally, post-enactment capital loss carryforwards will retain their character as either short-term or long-term capital losses rather than being considered all short-term as permitted under previous regulation.
96
6. Capital Shares
Transactions in capital shares were as follows:
| | Delaware International | | Delaware Emerging | | Delaware Global |
| | Value Equity Fund | | Markets Fund | | Value Fund |
| | Year Ended | | Year Ended | | Year Ended |
| | 11/30/11 | | 11/30/10 | | 11/30/11 | | 11/30/10 | | 11/30/11 | | 11/30/10 |
| Shares sold: | | | | | | | | | | | | | | | | | | |
| Class A | | 1,571,995 | | | 992,657 | | | 22,435,480 | | | 20,475,930 | | | 360,351 | | | 320,269 | |
| Class B | | 11,462 | | | 15,606 | | | 17,284 | | | 52,787 | | | 4,527 | | | 4,834 | |
| Class C | | 165,866 | | | 260,209 | | | 4,282,005 | | | 5,771,106 | | | 95,296 | | | 64,941 | |
| Class R | | 67,047 | | | 67,622 | | | 134,090 | | | 30,132 | | | — | | | — | |
| Institutional Class | | 2,668,680 | | | 2,733,521 | | | 115,664,664 | | | 37,574,228 | | | 49,619 | | | 85,786 | |
| |
| Shares issued upon reinvestment of dividends and distributions: | | | | | | | | | | |
| Class A | | 89,670 | | | 253,830 | | | 185,259 | | | 10,906 | | | 9,357 | | | 37,574 | |
| Class B | | 1,352 | | | 12,905 | | | — | | | — | | | — | | | 3,324 | |
| Class C | | 8,304 | | | 67,526 | | | — | | | — | | | — | | | 9,254 | |
| Class R | | 1,786 | | | 4,959 | | | 110 | | | — | | | — | | | — | |
| Institutional Class | | 127,602 | | | 277,836 | | | 177,343 | | | 21,128 | | | 1,237 | | | 2,731 | |
| | 4,713,764 | | | 4,686,671 | | | 142,896,235 | | | 63,936,217 | | | 520,387 | | | 528,713 | |
| |
| Shares repurchased: | | | | | | | | | | | | | | | | | | |
| Class A | | (3,314,357 | ) | | (3,506,179 | ) | | (17,847,326 | ) | | (14,757,297 | ) | | (714,809 | ) | | (932,217 | ) |
| Class B | | (239,798 | ) | | (315,580 | ) | | (286,461 | ) | | (329,599 | ) | | (98,098 | ) | | (160,702 | ) |
| Class C | | (856,596 | ) | | (1,324,816 | ) | | (4,390,030 | ) | | (2,730,006 | ) | | (270,297 | ) | | (438,711 | ) |
| Class R | | (122,619 | ) | | (63,869 | ) | | (49,489 | ) | | (728 | ) | | — | | | — | |
| Institutional Class | | (6,189,190 | ) | | (3,545,593 | ) | | (32,479,648 | ) | | (5,287,207 | ) | | (50,060 | ) | | (59,463 | ) |
| | (10,722,560 | ) | | (8,756,037 | ) | | (55,052,954 | ) | | (23,104,837 | ) | | (1,133,264 | ) | | (1,591,093 | ) |
| Net increase | | | | | | | | | | | | | | | | | | |
| (decrease) | | (6,008,796 | ) | | (4,069,366 | ) | | 87,843,281 | | | 40,831,380 | | | (612,877 | ) | | (1,062,380 | ) |
97
Notes to financial statements
Delaware International Funds
6. Capital Shares (continued)
For the years ended November 30, 2011 and 2010, the following shares and values were converted from Class B shares to Class A shares. The respective amounts are included in Class B redemptions and Class A subscriptions in the tables on the previous page and the statements of changes in net assets.
| | Year Ended | | Year Ended |
| | 11/30/11 | | 11/30/10 |
| | Class B | | Class A | | | | | Class B | | Class A | | | |
| | Shares | | Shares | | Value | | Shares | | Shares | | Value |
| Delaware International | | | | | | | | | | | | | | |
| Value Equity Fund | | 81,945 | | 80,709 | | $ | 986,737 | | 95,783 | | 94,510 | | $ | 1,065,389 |
| Delaware Emerging | | | | | | | | | | | | | | |
| Markets Fund | | 50,416 | | 47,803 | | | 713,921 | | 79,156 | | 75,316 | | | 1,017,499 |
| Delaware Global | | | | | | | | | | | | | | |
| Value Fund | | 17,503 | | 17,228 | | | 153,728 | | 38,386 | | 37,873 | | | 305,198 |
7. Line of Credit
Each Fund, along with certain other funds in the Delaware Investments® Family of Funds (Participants), was a participant in a $50,000,000 revolving line of credit to be used for temporary or emergency purposes as an additional source of liquidity to fund redemptions of investor shares. Under the agreement, the Participants were charged an annual commitment fee, which was allocated across the Participants on the basis of each Participant’s allocation of the entire facility. The Participants were permitted to borrow up to a maximum of one third of their net assets under the agreement. The line of credit expired on November 15, 2011.
On November 15, 2011, each Fund, along with the other Participants, entered into an agreement for a $125,000,000 revolving line of credit. The agreement is to be used as described above and operates in substantially the same manner as the original agreement. The agreement expires on November 13, 2012. The Funds had no amounts outstanding as of November 30, 2011 or at any time during the year then ended.
8. Derivatives
U.S. GAAP requires disclosures that enable investors to understand: 1) how and why an entity uses derivatives; 2) how they are accounted for; and 3) how they affect an entity’s results of operations and financial position.
Foreign Currency Exchange Contracts — Each Fund may enter into foreign currency exchange contracts as a way of managing foreign exchange rate risk. Each Fund may enter into these contracts to fix the U.S. dollar value of a security that it has agreed to buy or sell for the period between the date the trade was entered into and the date the security is delivered and paid for. Each Fund may also use these contracts to hedge the U.S. dollar value of securities it already owns that are denominated in foreign currencies. The change in value is recorded as an unrealized gain or loss. When the contract is closed, a realized gain or loss is recorded equal to the difference between the value of the contract at the time it was opened and the value at the time it was closed.
98
The use of foreign currency exchange contracts does not eliminate fluctuations in the underlying prices of the securities, but does establish a rate of exchange that can be achieved in the future. Although foreign currency exchange contracts limit the risk of loss due to an unfavorable change in the value of the hedged currency, they also limit any potential gain that might result should the value of the currency change favorably. In addition, the Funds could be exposed to risks if the counterparties to the contracts are unable to meet the terms of their contracts. The Funds’ maximum risk of loss from counterparty credit risk is the value of their currency exchanged with the counterparty. The risk is generally mitigated by having a netting arrangement between the Funds and the counterparty and by the posting of collateral by the counterparty to the Funds to cover the Funds’ exposure to the counterparty.
Derivatives Generally. The table below summarizes the average balance of derivative holdings by each Fund during the year ended November 30, 2011. The average balance of derivatives held is generally similar to the volume of derivative activity for the year ended November 30, 2011.
| | Delaware International | | Delaware Emerging | | Delaware Global |
| | Value Equity Fund | | Markets Fund | | Value Fund |
| Foreign Currency Exchange Contracts | | | | | | | | | | | | | | | |
| Purchased (Average Cost) | | | $ | 196,718 | | | | $ | 1,222,491 | | | | $ | 13,015 | |
| Foreign Currency Exchange Contracts | | | | | | | | | | | | | | | |
| Sold (Average Cost) | | | | 386,054 | | | | | 227,483 | | | | | 19,730 | |
9. Securities Lending
Each Fund, along with other funds in the Delaware Investments® Family of Funds, may lend its securities pursuant to a security lending agreement (Lending Agreement) with The Bank of New York Mellon (BNY Mellon). At the time a security is loaned, the borrower must post collateral equal to the required percentage of the market value of the loaned security, including any accrued interest. The required percentage is: (i) 102% with respect to U.S. securities and foreign securities that are denominated and payable in U.S. dollars; and (ii) 105% with respect to foreign securities. With respect to each loan, if on any business day the aggregate market value of securities collateral plus cash collateral held is less than the aggregate market value of the securities which are the subject of such loan, the borrower will be notified to provide additional collateral by the end of the following business day which, together with the collateral already held, will be not less than the applicable initial collateral requirements for such security loan. If the aggregate market value of securities collateral and cash collateral held with respect to a security loan exceeds the applicable initial collateral requirement, upon request of the borrower BNY Mellon must return enough collateral to the borrower by the end of the following business day to reduce the value of the remaining collateral to the applicable initial collateral requirement for such security loan. As a result of the foregoing, the value of the collateral held with respect to a loaned security may be temporarily more or less than the value of the security on loan.
Cash collateral received is generally invested in the Delaware Investments Collateral Fund No. 1 (Collective Trust) established by BNY Mellon for the purpose of investment on behalf of funds managed by DMC, that participate in BNY Mellon’s securities lending program. The Collective
99
Notes to financial statements
Delaware International Funds
9. Securities Lending (continued)
Trust may invest in U.S. government securities and high quality corporate debt, asset-backed and other money market securities and in repurchase agreements collateralized by such securities, provided that the Collective Trust will generally have a dollar-weighted average portfolio maturity of 60 days or less. The Collective Trust seeks to maintain a net asset value per unit of $1.00, but there can be no assurance that it will always be able to do so. The Funds may incur investment losses as a result of investing securities lending collateral in the Collective Trust or another collateral investment pool. This could occur if an investment in a collateral investment pool defaulted or if it were necessary to liquidate assets in the collateral investment pool to meet returns on outstanding security loans at a time when the collateral investment pool’s net asset value per unit was less than $1.00. Under those circumstances, the Funds may not receive an amount from the collateral investment pool that is equal in amount to the collateral the Funds would be required to return to the borrower of the securities and the Funds would be required to make up for this shortfall. Effective April 20, 2009, BNY Mellon transferred the assets of the Funds’ previous collateral investment pool other than cash and assets with a maturity of one business day or less to the BNY Mellon SL DBT II Liquidating Fund (Liquidating Fund), effectively bifurcating the previous collateral investment pool. The Funds’ exposure to the Liquidating Fund is expected to decrease as the Liquidating Fund’s assets mature or are sold. In October 2008, BNY Mellon transferred certain distressed securities from the previous collateral investment pool into the Mellon GSL Reinvestment Trust II. The Funds can also accept U.S. government securities and letters of credit (non-cash collateral) in connection with securities loans. In the event of default or bankruptcy by the lending agent, realization and/or retention of the collateral may be subject to legal proceedings. In the event the borrower fails to return loaned securities and the collateral received is insufficient to cover the value of the loaned securities and provided such collateral shortfall is not the result of investment losses, the lending agent has agreed to pay the amount of the shortfall to the Funds, or at the discretion of the lending agent, replace the loaned securities. The Funds continue to record dividends or interest, as applicable, on the securities loaned and are subject to change in value of the securities loaned that may occur during the term of the loan. The Funds have the right under the Lending Agreement to recover the securities from the borrower on demand. With respect to security loans collateralized by non-cash collateral, the Funds receive loan premiums paid by the borrower. With respect to security loans collateralized by cash collateral, the earnings from the collateral investments are shared among the Funds, the security lending agent and the borrower. The Funds record security lending income net of allocations to the security lending agent and the borrower.
100
At November 30, 2011, the values of securities on loan and the values of invested collateral for each Fund are presented below, for which cash collateral was received and invested in accordance with the Lending Agreement. These investments are presented on the statements of net assets under the caption “Securities Lending Collateral.”
| Delaware International | | Delaware Emerging | | Delaware Global |
| Value Equity Fund | | Markets Fund | | Value Fund |
| Values of securities on loan | $ | 7,951,819 | | | $ | 191,081,828 | | | $ | 552,435 | |
| Values of invested collateral | | 6,432,501 | | | | 186,771,071 | | | | 405,679 | |
10. Credit and Market Risk
Some countries in which the Funds invest require governmental approval for the repatriation of investment income, capital or the proceeds of sales of securities by foreign investors. In addition, if there is deterioration in a country’s balance of payments or for other reasons, a country may impose temporary restrictions on foreign capital remittances abroad.
The securities exchanges of certain foreign markets are substantially smaller, less liquid and more volatile than the major securities markets in the United States. Consequently, acquisition and disposition of securities by the Funds may be inhibited. In addition, a significant portion of the aggregate market value of equity securities listed on the major securities exchanges in emerging markets is held by a smaller number of investors. This may limit the number of shares available for acquisition or disposition by the Funds.
Each Fund may invest up to 15% of its net assets in illiquid securities, which may include securities with contractual restrictions on resale, securities exempt from registration under Rule 144A of the securities Act of 1933, as amended, and other securities which may not be readily marketable. The relative illiquidity of these securities may impair each Fund from disposing of them in a timely manner and at a fair price when it is necessary or desirable to do so. While maintaining oversight, the Funds’ Board has delegated to DMC the day-to-day functions of determining whether individual securities are liquid for purposes of the Funds’ limitation on investments in illiquid securities. Securities eligible for resale pursuant to Rule 144A, which are determined to be liquid, are not subject to the Funds’ 15% limit on investments in illiquid securities. Rule 144A and illiquid securities have been identified on the statements of net assets.
11. Contractual Obligations
The Funds enter into contracts in the normal course of business that contain a variety of indemnifications. Each Fund’s maximum exposure under these arrangements is unknown. However, the Funds have not had prior claims or losses pursuant to these contracts. Management has reviewed each Fund’s existing contracts and expects the risk of loss to be remote.
101
Notes to financial statements
Delaware International Funds
12. Subsequent Events
Management has determined that no material events or transactions occurred subsequent to November 30, 2011 that would require recognition or disclosure in the Funds’ financial statements.
13. Tax Information (Unaudited)
The information set forth below is for the Funds’ fiscal year as required by federal income tax laws. Shareholders, however, must report distributions on a calendar year basis for income tax purposes, which may include distributions for portions of two fiscal years of a fund. Accordingly, the information needed by shareholders for income tax purposes will be sent to them in January of each year. Please consult your tax advisor for proper treatment of this information.
All designations are based on financial information available as of the date of this annual report and, accordingly are subject to change. For any and all items requiring designation, it is the intention of each Fund to designate the maximum amount permitted under the Internal Revenue Code and the regulations thereunder.
For the fiscal year ended November 30, 2011, each Fund designates distributions paid during the year as follows:
| (A) | | |
| Ordinary | | |
| Income | | (B) |
| Distributions* | | Qualifying |
| (Tax Basis) | | Dividends1 |
| Delaware International Value Equity Fund | 100.00% | | 0.07% |
| Delaware Emerging Markets Fund | 100.00% | | 14.37% |
| Delaware Global Value Fund | 100.00% | | 100.00% |
(A) is based on a percentage of each Fund’s total distributions.
(B) is based on a percentage of each Fund’s ordinary income distributions.
1 Qualifying dividends represent dividends which qualify for the corporate dividends received deduction.
*For the fiscal year ended November 30, 2011, certain dividends paid by the Funds may be subject to a maximum tax rate of 15%, as provided for by the Jobs and Growth Tax Relief Reconciliation Act of 2003, and as extended by Tax Relief Unemployment Insurance Reauthorization and Job Creations Act of 2010. The Funds intend to designate the following amounts to be taxed at a maximum rate of 15%. Complete information will be computed and reported in conjunction with your 2011 Form 1099-DIV.
| Delaware International | | Delaware Emerging | | Delaware Global |
| Value Equity Fund | | Markets Fund | | Value Fund |
| $2,437 | | $1,232,942 | | $24,443 |
102
The Funds intend to pass through foreign tax credits in the maximum amount as follows:
| Delaware International | | Delaware Emerging |
| Value Equity Fund | | Markets Fund |
| $491,034 | | $1,199,066 |
The gross foreign source income earned during the fiscal year 2011 by the Funds was as follows:
| Delaware International | | Delaware Emerging |
| Value Equity Fund | | Markets Fund |
| $10,516,309 | | $25,846,635 |
For the fiscal year ended November 30, 2011, certain dividends paid by the Funds, have been determined to be interest related dividends and may be subject to relief from U.S. withholding for foreign shareholders, as provided by the American Jobs Creation Act of 2004, and as extended by Tax Relief Unemployment Insurance Reauthorization and Job Creations Act of 2010. For the fiscal year ended November 30 2011, the Funds have designated maximum Qualified Interest Income distributions as follows:
| Delaware International | | Delaware Emerging |
| Value Equity Fund | | Markets Fund |
| $106 | | $212,127 |
103
Report of independent
registered public accounting firm
To the Board of Trustees of Delaware Group® Global & International Funds
and Shareholders of Delaware International Value Equity Fund,
Delaware Emerging Markets Fund and Delaware Global Value Fund:
In our opinion, the accompanying statements of net assets and the related statements of operations and of changes in net assets and the financial highlights present fairly, in all material respects, the financial position of Delaware International Value Equity Fund, Delaware Emerging Markets Fund and Delaware Global Value Fund (three of the series constituting Delaware Group Global & International Funds, hereafter collectively referred to as the “Funds”) at November 30, 2011, the results of each of their operations for the year then ended and the changes in each of their net assets and the financial highlights for each of the two years in the period then ended, in conformity with accounting principles generally accepted in the United States of America. These financial statements and financial highlights (hereafter referred to as “financial statements”) are the responsibility of the Funds’ management; our responsibility is to express an opinion on these financial statements based on our audits. We conducted our audits of these financial statements in accordance with the standards of the Public Company Accounting Oversight Board (United States). Those standards require that we plan and perform the audit to obtain reasonable assurance about whether the financial statements are free of material misstatement. An audit includes examining, on a test basis, evidence supporting the amounts and disclosures in the financial statements, assessing the accounting principles used and significant estimates made by management, and evaluating the overall financial statement presentation. We believe that our audits, which included confirmation of securities at November 30, 2011 by correspondence with the custodian and brokers, provide a reasonable basis for our opinion. The financial highlights for each of the periods ended November 30, 2009 and prior were audited by other independent accountants whose report dated January 21, 2010 expressed an unqualified opinion on those statements.
PricewaterhouseCoopers LLP
Philadelphia, Pennsylvania
January 23, 2012
104
Other Fund information
(Unaudited)
Delaware International Funds
Board Consideration of Delaware International Funds Investment Advisory Agreement
At a meeting held on August 16-17, 2011 (the “Annual Meeting”), the Board of Trustees (the “Board”), including a majority of disinterested or independent Trustees, approved the renewal of the Investment Advisory Agreements for the Delaware Emerging Markets Fund, Delaware Global Value Fund and Delaware International Value Equity Fund (each, a “Fund” and together, the “Funds”). In making its decision, the Board considered information furnished specifically in connection with the renewal of the Investment Advisory Agreements with Delaware Management Company (“DMC”), which included materials provided by DMC and its affiliates (“Delaware Investments”) concerning, among other things, the nature, extent and quality of services provided to the Funds, the costs of such services to the Funds, economies of scale and the financial condition and profitability of Delaware Investments. In addition, in connection with the Annual Meeting, reports were provided in May 2011 and included independent historical and comparative reports provided by Lipper, Inc., an independent statistical compilation organization (“Lipper”). The Lipper reports compared each Fund’s investment performance and expenses with those of other comparable mutual funds. The independent Trustees reviewed and discussed the Lipper reports with independent legal counsel to the independent Trustees. The Board requested and received information regarding DMC’s policy with respect to advisory fee levels and its breakpoint philosophy; the structure of portfolio manager compensation; the investment manager’s profitability; and any constraints or limitations on the availability of securities in certain investment styles, which had in the past year inhibited, or which were likely in the future to inhibit, DMC’s ability to invest fully in accordance with Fund policies.
In considering information relating to the approval of each Fund’s advisory agreement, the independent Trustees received assistance and advice from and met separately with independent legal counsel to the independent Trustees. Although the Board gave attention to all information furnished, the following discussion identifies, under separate headings, the primary factors taken into account by the Board during its contract renewal considerations.
Nature, Extent and Quality of Service. The Board considered the services provided by Delaware Investments to the Funds and their shareholders. In reviewing the nature, extent and quality of services, the Board considered reports furnished to it throughout the year, which covered matters such as the relative performance of each Fund, compliance of portfolio managers with the investment policies, strategies and restrictions for each Fund, compliance by DMC and Delaware Distributors, L.P. (together, “Management”) personnel with the Code of Ethics adopted throughout the Delaware Investments® Family of Funds complex and adherence to fair value pricing procedures as established by the Board. The Board was pleased with the current staffing of the Funds’ investment advisor and the emphasis placed on research in the investment process. The Board gave favorable consideration to DMC’s efforts to control expenditures while maintaining service levels committed to fund matters. The Board noted that in July 2011 Management implemented measures to reduce overall costs and improve transfer agent and shareholder servicing functions through outsourcing. It is expected that such measures will improve the quality and lower the cost of delivering
105
Other Fund information
(Unaudited)
Delaware International Funds
Board Consideration of Delaware International Funds Investment Advisory Agreement (continued)
transfer agent and shareholder servicing services to the Funds. The Board once again noted the benefits provided to Fund shareholders through each shareholder’s ability to exchange an investment in one Delaware Investments fund for the same class of shares in another Delaware Investments fund without a sales charge, to reinvest Fund dividends into additional shares of the same Fund or into additional shares of other Delaware Investments funds and the privilege to combine holdings in other Delaware Investments funds to obtain a reduced sales charge. The Board was satisfied with the nature, extent and quality of the overall services provided by Delaware Investments.
Investment Performance. The Board placed significant emphasis on the investment performance of the Funds in view of its importance to shareholders. Although the Board gave appropriate consideration to performance reports and discussions with portfolio managers at Investment Committee meetings throughout the year, the Board gave particular weight to the Lipper reports furnished for the Annual Meeting. The Lipper reports prepared for each Fund showed the investment performance of its Class A shares in comparison to a group of similar funds as selected by Lipper (the “Performance Universe”). A fund with the best performance ranked first, and a fund with the poorest performance ranked last. The highest/best performing 25% of funds in the Performance Universe make up the first quartile; the next 25%, the second quartile; the next 25%, the third quartile; and the poorest/worst performing 25% of funds in the Performance Universe make up the fourth quartile. Comparative annualized performance for each Fund was shown for the past one-, three-, five- and ten-year periods, as applicable, ended March 31, 2011. The Board’s objective is that each Fund’s performance for the periods considered be at or above the median of its Performance Universe. The following paragraphs summarize the performance results for the Funds and the Board’s view of such performance.
Delaware Emerging Markets Fund — The Performance Universe for the Fund consisted of the Fund and all retail and institutional emerging markets funds as selected by Lipper. The Lipper report comparison showed that the Fund’s total return for the one-, three-, five- and ten-year periods was in the first quartile of its Performance Universe. The Board was satisfied with performance.
Delaware Global Value Fund — The Performance Universe for the Fund consisted of the Fund and all retail and institutional global multi-cap value funds as selected by Lipper. The Lipper report comparison showed that the Fund’s total return for the one- and ten-year periods was in the second quartile of its Performance Universe. The report further showed that the Fund’s total return for the three-year period was in the fourth quartile and the Fund’s total return for the five-year period was in the third quartile. The Board determined that the Fund’s performance results were mixed. Observing that the Fund’s one-year performance had improved, the Board was satisfied with performance.
Delaware International Value Equity Fund — The Performance Universe for the Fund consisted of the Fund and all retail and institutional international multi-cap value funds as selected by Lipper. The
106
Lipper report comparison showed that the Fund’s total return for the one-, three- and five-year periods was in the first quartile of its Performance Universe. The report further showed that the Fund’s total return for the ten-year period was in the second quartile. The Board was satisfies with performance.
Comparative Expenses. The Board considered expense comparison data for the Delaware Investments Family of Funds. Management provided the Board with information on pricing levels and fee structures for each Fund as of its most recently completed fiscal year. The Board also focused on the comparative analysis of effective management fees and total expense ratios of each Fund versus effective management fees and expense ratios of a group of similar funds as selected by Lipper (the “Expense Group”). In reviewing comparative costs, each Fund’s contractual management fee and the actual management fee incurred by the Fund were compared with the contractual management fees (assuming all funds in the Expense Group were similar in size to the Fund) and actual management fees (as reported by each fund) within the Expense Group, taking into account any applicable breakpoints and fee waivers. Each Fund’s total expenses were also compared with those of its Expense Group. The Lipper total expenses, for comparative consistency, were shown by Lipper for Class A shares and comparative total expenses including 12b-1 and non 12b-1 service fees. The Board considered fees paid to Delaware Investments for non-management services. The Board’s objective is to limit each Fund’s total expense ratio to be competitive with that of the Expense Group. The following paragraphs summarize the expense results for the Funds and the Board’s view of such expenses.
Delaware Emerging Markets Fund — The expense comparisons for the Fund showed that its actual management fee and total expenses were in the quartile with the highest expenses of its Expense Group. The Fund’s management fee and total expenses were not in line with the Board’s objective. In evaluating total expenses, the Board considered fee waivers in place through March 2012 and various initiatives implemented by Management, such as the outsourcing of certain transfer agency services, creating an opportunity for a reduction in expenses. The Board was satisfied with Management’s efforts to improve the Fund’s total expense ratio and bring it in line with the Board’s objective.
Delaware Global Value Fund — The expense comparisons for the Fund showed that its actual management fee was in the quartile with the lowest expenses of its Expense Group and its total expenses were in the quartile with the second highest expenses of its Expense Group. The Board gave favorable consideration to the Fund’s management fee, but noted that the Fund’s total expenses were not in line with the Board’s objective. In evaluating total expenses, the Board considered fee waivers in place through March 2012 and various initiatives implemented by Management, such as the outsourcing of certain transfer agency services, creating an opportunity for a reduction in expenses. The Board was satisfied with Management’s efforts to improve the Fund’s total expense ratio and bring it in line with the Board’s objective.
Delaware International Value Equity Fund — The expense comparisons for the Fund showed that its actual management fee was in the quartile with the second lowest expenses of its Expense Group and its total expenses were in the quartile with the highest expenses of its Expense Group. The Board gave favorable consideration to the Fund’s management fee, but noted that the Fund’s total expenses were not in line with the Board’s objective. In evaluating total expenses, the Board considered fee waivers
107
Other Fund information
(Unaudited)
Delaware International Funds
Board Consideration of Delaware International Funds Investment Advisory Agreement (continued)
in place through March 2012 and various initiatives implemented by Management, such as the outsourcing of certain transfer agency services, creating an opportunity for a reduction in expenses. The Board was satisfied with Management’s efforts to improve the Fund’s total expense ratio and bring it in line with the Board’s objective.
Management Profitability. The Board considered the level of profits realized by Delaware Investments in connection with the operation of the Funds. In this respect, the Board reviewed the Investment Management Profitability Analysis that addressed the overall profitability of Delaware Investments’ business in providing management and other services to each of the individual funds and the Delaware Investments Family of Funds as a whole. Specific attention was given to the methodology followed in allocating costs for the purpose of determining profitability. Management stated that the level of profits of Delaware Investments, to a certain extent, reflect recent operational cost savings and efficiencies initiated by Delaware Investments. The Board considered Delaware Investments’ efforts to improve services provided to fund shareholders and to meet additional regulatory and compliance requirements resulting from recent industry-wide Securities and Exchange Commission initiatives. The Board also considered the extent to which Delaware Investments might derive ancillary benefits from fund operations, including the potential for procuring additional business as a result of the prestige and visibility associated with its role as service provider to the Delaware Investments Family of Funds and the benefits from allocation of fund brokerage to improve trading efficiencies. The Board found that the management fees were reasonable in light of the services rendered and the level of profitability of Delaware Investments.
Economies of Scale. The Trustees considered whether economies of scale are realized by Delaware Investments as each Fund’s assets increase and the extent to which any economies of scale are reflected in the level of management fees charged. The Trustees reviewed the standardized advisory fee pricing and structure, approved by the Board and shareholders, which includes breakpoints. Breakpoints in the advisory fee occur when the advisory fee rate is reduced on assets in excess of specified levels. Breakpoints result in a lower advisory fee than would otherwise be the case on all assets when the asset levels specified are exceeded. The Board noted that the fee under each Fund’s management contract fell within the standard structure. The Board also noted that the Delaware Emerging Markets Fund’s assets exceeded the second breakpoint level. The Board believed that, given the extent to which economics of scale might be realized by the advisor and its affiliates, the schedule of fees under the Investment Advisory Agreement provides a sharing of benefits with the Fund and its shareholders. With respect to the Delaware Global Value Fund and Delaware International Value Equity Fund, although the Funds have not reached a size at which they can take advantage of breakpoints, the Board recognized that the fees were structured so that when the Funds grow, economies of scale may be shared.
108
Change in Independent Registered Public Accounting Firm
Due to independence matters under the Securities and Exchange Commission’s auditor independence rules relating to the January 4, 2010 acquisition of Delaware Investments (including DMC, DDLP and DSC) by Macquarie Group, Ernst & Young LLP (E&Y) has resigned as the independent registered public accounting firm for Delaware Group® Global & International Fund (the Trust) effective May 20, 2010. At a meeting held on May 20, 2010, the Board of Trustees of the Trust, upon recommendation of the Audit Committee, selected PricewaterhouseCoopers LLP (PwC) to serve as the independent registered public accounting firm for the Trust for the fiscal year ending November 30, 2010. During the fiscal years ended November 30, 2009 and 2008, E&Y’s audit reports on the financial statements of the Trust did not contain any adverse opinion or disclaimer of opinion, nor were they qualified or modified as to uncertainty, audit scope, or accounting principles. In addition, there were no disagreements between the Trust and E&Y on accounting principles, financial statements disclosures or audit scope, which, if not resolved to the satisfaction of E&Y, would have caused them to make reference to the disagreement in their reports. Neither the Trust nor anyone on its behalf has consulted with PwC at any time prior to their selection with respect to the application of accounting principles to a specified transaction, either completed or proposed, or the type of audit opinion that might be rendered on the Trust’s financial statements.
109
Board of trustees/directors and officers addendum
Delaware Investments® Family of Funds
A mutual fund is governed by a Board of Trustees/Directors (“Trustees”), which has oversight responsibility for the management of a fund’s business affairs. Trustees establish procedures and oversee and review the performance of the investment manager, the distributor, and others who perform services for the fund. The independent fund trustees, in particular, are advocates
| Name, Address, | | Position(s) | | Length of |
| and Birth Date | | Held with Fund(s) | | Time Served |
| Interested Trustees | | | | |
| | | | | |
| Patrick P. Coyne1 | | Chairman, President, | | Chairman and Trustee |
| 2005 Market Street | | Chief Executive Officer, | | since August 16, 2006 |
| Philadelphia, PA 19103 | | and Trustee | | |
| April 1963 | | | | President and |
| | | | | Chief Executive Officer |
| | | | | since August 1, 2006 |
| | | | | |
| | | | | |
| | | | | |
| | | | | |
| | | | | |
| | | | | |
| | | | | |
| | | | | |
| | | | | |
| | | | | |
| | | | | |
| | | | | |
| | | | | |
| | | | | |
| | | | | |
| | | | | |
| | | | | |
| | | | | |
1 Patrick P. Coyne is considered to be an “Interested Trustee” because he is an executive officer of the Fund’s(s’) investment advisor.
110
for shareholder interests. Each trustee has served in that capacity since he or she was elected to or appointed to the Board of Trustees, and will continue to serve until his or her retirement or the election of a new trustee in his or her place. The following is a list of the Trustees and Officers with certain background and related information.
| | Number of Portfolios in | | |
| Principal Occupation(s) | | Fund Complex Overseen | | Other Directorships |
| During Past 5 Years | | by Trustee or Officer | | Held by Trustee or Officer |
| |
| |
| Patrick P. Coyne has served in | | 74 | | Director and Audit |
| various executive capacities | | | | Committee Member |
| at different times at | | | | Kaydon Corp. |
| Delaware Investments.2 | | | | |
| | | | Board of Governors Member |
| | | | Investment Company |
| | | | Institute (ICI) |
| |
| | | | Finance Committee Member |
| | | | St. John Vianney Roman |
| | | | Catholic Church |
| |
| | | | Board of Trustees |
| | | | Agnes Irwin School |
| |
| | | | Member of Investment |
| | | | Committee |
| | | | Cradle of Liberty Council, |
| | | | BSA |
| | | | (2007–2010) |
| | | | |
| | | | |
| | | | |
2 Delaware Investments is the marketing name for Delaware Management Holdings, Inc. and its subsidiaries, including the Fund’s(s’) investment advisor, principal underwriter, and its transfer agent.
111
Board of trustees/directors and officers addendum
Delaware Investments® Family of Funds
| Name, Address, | | Position(s) | | Length of |
| and Birth Date | | Held with Fund(s) | | Time Served |
| Independent Trustees | | | | |
| |
| Thomas L. Bennett | | Trustee | | Since March 2005 |
| 2005 Market Street | | | | |
| Philadelphia, PA 19103 | | | | |
| October 1947 | | | | |
| |
| |
| |
| |
| |
| |
| |
| |
| |
| |
| |
| John A. Fry | | Trustee | | Since January 2001 |
| 2005 Market Street | | | | |
| Philadelphia, PA 19103 | | | | |
| May 1960 | | | | |
| |
| |
| |
| |
| |
| |
| |
| |
| |
| |
| |
| Anthony D. Knerr | | Trustee | | Since April 1990 |
| 2005 Market Street | | | | |
| Philadelphia, PA 19103 | | | | |
| December 1938 | | | | |
| |
| Lucinda S. Landreth | | Trustee | | Since March 2005 |
| 2005 Market Street | | | | |
| Philadelphia, PA 19103 | | | | |
| June 1947 | | | | |
| |
112
| | | Number of Portfolios in | | |
| Principal Occupation(s) | | Fund Complex Overseen | | Other Directorships |
| During Past 5 Years | | by Trustee or Officer | | Held by Trustee or Officer |
| | | | | |
| |
| Private Investor | | 74 | | Chairman of Investment |
| (March 2004–Present) | | | | Committee |
| | | | Pennsylvania Academy of |
| Investment Manager | | | | Fine Arts |
| Morgan Stanley & Co. | | | | |
| (January 1984–March 2004) | | | | Investment Committee and |
| | | | | Governance Committee |
| | | | | Member |
| | | | | Pennsylvania Horticultural |
| | | | | Society |
| | | | | |
| | | | | Director |
| | | | | Bryn Mawr Bank Corp. (BMTC) |
| | | | | (2007–2011) |
| |
| President | | 74 | | Board of Governors Member — |
| Drexel University | | | | NASDAQ OMX PHLX LLC |
| (August 2010–Present) | | | | |
| | | | | Director and Audit |
| President | | | | Committee Member |
| Franklin & Marshall College | | | | Community Health Systems |
| (July 2002–July 2010) | | | | |
| | | | | Director — Ecore |
| | | | International |
| | | | (2009–2010) |
| | | | |
| | | | Director — Allied |
| | | | Barton Securities Holdings |
| | | | (2005–2008) |
| |
| Managing Director | | 74 | | None |
| Anthony Knerr & Associates | | | | |
| (Strategic Consulting) | | | | |
| (1990–Present) | | | | |
| |
| Chief Investment Officer | | 74 | | None |
| Assurant, Inc. (Insurance) | | | | |
| (2002–2004) | | | | |
| | | | | |
| |
113
Board of trustees/directors and officers addendum
Delaware Investments® Family of Funds
| Name, Address, | | Position(s) | | Length of |
| and Birth Date | | Held with Fund(s) | | Time Served |
| Independent Trustees (continued) | | | | |
| |
| Ann R. Leven | | Trustee | | Since October 1989 |
| 2005 Market Street | | | | |
| Philadelphia, PA 19103 | | | | |
| November 1940 | | | | |
| |
| |
| |
| |
| |
| |
| |
| Frances A. Sevilla-Sacasa | | Trustee | | Since September 2011 |
| 2005 Market Street | | | | |
| Philadelphia, PA 19103 | | | | |
| January 1956 | | | | |
| |
| |
| |
| |
| |
| |
| |
| |
| |
| |
| |
| |
| |
| |
| |
| |
| |
| |
| |
| |
| |
| |
| |
| |
| |
| |
| |
114
| | Number of Portfolios in | | |
| Principal Occupation(s) | | Fund Complex Overseen | | Other Directorships |
| During Past 5 Years | | by Trustee or Officer | | Held by Trustee or Officer |
| |
| |
| Consultant | | 74 | | Director and Audit |
| ARL Associates | | | | Committee Chair |
| (Financial Planning) | | | | Systemax Inc. |
| (1983–Present) | | | | (2001–2009) |
| |
| | | | Director and Audit |
| | | | Committee Chairperson |
| | | | Andy Warhol Foundation |
| | | | (1999–2007) |
| | | | |
| Executive Advisor to Dean | | 74 | | Trust Manager — Camden |
| (since August 2011) and | | | | Property Trust |
| Interim Dean | | | | (since August 2011) |
| (January 2011–July 2011) — | | | | |
| University of Miami School of | | | | Board of Trustees |
| Business Administration | | | | Thunderbird School of |
| | | | | Global Management |
| President — U.S. Trust, | | | | (2007–2011) |
| Bank of America Private | | | | |
| Wealth Management | | | | Board of Trustees |
| (Private Banking) | | | | Carrollton School of the |
| (July 2007–December 2008) | | | | Sacred Heart |
| | | | | (since 2007) |
| President and Director | | | | |
| (November 2005–June 2007) and | | | | Board Member |
| Chief Executive Officer | | | | Foreign Policy Association |
| (April 2007–June 2007) — | | | | (since 2006) |
| U.S. Trust Company | | | | |
| (Private Banking) | | | | Board of Trustees |
| | | | Georgetown Preparatory School |
| | | | (2005–2011) |
| |
| | | | Board of Trustees |
| | | | Miami City Ballet |
| | | | (2000–2011) |
| |
| | | | Board of Trustees |
| | | | St. Thomas University |
| | | | (2005–2011) |
| | | | |
115
Board of trustees/directors and officers addendum
Delaware Investments® Family of Funds
| Name, Address, | | Position(s) | | Length of |
| and Birth Date | | Held with Fund(s) | | Time Served |
| Independent Trustees (continued) | | | | |
| |
| Janet L. Yeomans | | Trustee | | Since April 1999 |
| 2005 Market Street | | | | |
| Philadelphia, PA 19103 | | | | |
| July 1948 | | | | |
| |
| |
| |
| |
| J. Richard Zecher | | Trustee | | Since March 2005 |
| 2005 Market Street | | | | |
| Philadelphia, PA 19103 | | | | |
| July 1940 | | | | |
| |
| |
| | | | | |
| | | | | |
| | | | | |
| | | | | |
| | | | | |
| | | | | |
| | | | | |
| | | | | |
| | | | | |
| | | | | |
| | | | | |
| | | | | |
| | | | | |
| | | | | |
| |
116
| | Number of Portfolios in | | |
| Principal Occupation(s) | | Fund Complex Overseen | | Other Directorships |
| During Past 5 Years | | by Trustee or Officer | | Held by Trustee or Officer |
| |
| |
| Vice President and Treasurer | | 74 | | Director and Audit |
| (January 2006–Present) | | | | Committee Member |
| Vice President — Mergers & Acquisitions | | | | Okabena Company |
| (January 2003–January 2006), and | | | | |
| Vice President and Treasurer | | | | Chair — 3M |
| (July 1995–January 2003) | | | | Investment Management |
| 3M Corporation | | | | Company |
| | | | |
| Founder | | 74 | | Director and Audit |
| Investor Analytics | | | | Committee Member |
| (Risk Management) | | | | Investor Analytics |
| (May 1999–Present) | | | | |
| | | | | Director |
| Founder | | | | Oxigene, Inc. |
| Sutton Asset Management | | | | (2003–2008) |
| (Hedge Fund) | | | | |
| (September 1996–Present) | | | | |
| | | | | |
| | | | | |
| | | | | |
| | | | | |
| | | | | |
| | | | | |
| | | | | |
| | | | | |
| | | | | |
| | | | | |
| | | | | |
| | | | | |
117
Board of trustees/directors and officers addendum
Delaware Investments® Family of Funds
| Name, Address, | | Position(s) | | Length of |
| and Birth Date | | Held with Fund(s) | | Time Served |
| Officers | | | | |
| | | | | |
| David F. Connor | | Vice President, | | Vice President since |
| 2005 Market Street | | Deputy General | | September 2000 |
| Philadelphia, PA 19103 | | Counsel, and Secretary | | and Secretary since |
| December 1963 | | | | October 2005 |
| |
| |
| Daniel V. Geatens | | Vice President | | Treasurer |
| 2005 Market Street | | and Treasurer | | since October 2007 |
| Philadelphia, PA 19103 | | | | |
| October 1972 | | | | |
| |
| David P. O’Connor | | Senior Vice President, | | Senior Vice President, |
| 2005 Market Street | | General Counsel, | | General Counsel, and |
| Philadelphia, PA 19103 | | and Chief Legal Officer | | Chief Legal Officer |
| February 1966 | | | | since October 2005 |
| |
| Richard Salus | | Senior Vice President | | Chief Financial Officer |
| 2005 Market Street | | and Chief Financial Officer | | since November 2006 |
| Philadelphia, PA 19103 | | | | |
| October 1963 | | | | |
| |
The Statement of Additional Information for the Fund(s) includes additional information about the Trustees and Officers and is available, without charge, upon request by calling 800 523-1918.
118
| | Number of Portfolios in | | |
| Principal Occupation(s) | | Fund Complex Overseen | | Other Directorships |
| During Past 5 Years | | by Trustee or Officer | | Held by Trustee or Officer |
| |
| |
| David F. Connor has served as | | 74 | | None3 |
| Vice President and Deputy | | | | |
| General Counsel of | | | | |
| Delaware Investments | | | | |
| since 2000. | | | | |
| |
| Daniel V. Geatens has served | | 74 | | None3 |
| in various capacities at | | | | |
| different times at | | | | |
| Delaware Investments. | | | | |
| |
| David P. O’Connor has served in | | 74 | | None3 |
| various executive and legal | | | | |
| capacities at different times | | | | |
| at Delaware Investments. | | | | |
| |
| Richard Salus has served in | | 74 | | None3 |
| various executive capacities | | | | |
| at different times at | | | | |
| Delaware Investments. | | | | |
| |
3 David F. Connor, Daniel V. Geatens, David P. O’Connor, and Richard Salus serve in similar capacities for the six portfolios of the Optimum Fund Trust, which have the same investment advisor, principal underwriter, and transfer agent as the registrant.
119
About the organization
| Board of trustees |
Patrick P. Coyne
Chairman, President, and
Chief Executive Officer
Delaware Investments®
Family of Funds
Philadelphia, PA Thomas L. Bennett
Private Investor
Rosemont, PA John A. Fry
President
Drexel University
Philadelphia, PA | Anthony D. Knerr
Founder and Managing
Director
Anthony Knerr &
Associates
New York, NY Lucinda S. Landreth
Former Chief Investment
Officer
Assurant, Inc.
Philadelphia, PA | Ann R. Leven
Consultant
ARL Associates
New York, NY Frances A. Sevilla-Sacasa
Executive Advisor to Dean, University of Miami School of Business Administration Coral Gables, FL | Janet L. Yeomans
Vice President and
Treasurer
3M Corporation
St. Paul, MN J. Richard Zecher
Founder
Investor Analytics
Scottsdale, AZ |
| | | | |
| Affiliated officers |
David F. Connor
Vice President, Deputy
General Counsel, and
Secretary
Delaware Investments
Family of Funds
Philadelphia, PA | Daniel V. Geatens
Vice President and
Treasurer
Delaware Investments
Family of Funds
Philadelphia, PA | David P. O’Connor
Senior Vice President,
General Counsel,
and Chief Legal Officer
Delaware Investments
Family of Funds
Philadelphia, PA | Richard Salus
Senior Vice President and
Chief Financial Officer
Delaware Investments
Family of Funds
Philadelphia, PA |
| This annual report is for the information of Delaware International Value Equity Fund, Delaware Emerging Markets Fund, and Delaware Global Value Fund shareholders, but it may be used with prospective investors when preceded or accompanied by the Delaware Investments Fund fact sheet for the most recently completed calendar quarter. These documents are available at www.delawareinvestments.com. |
| Delaware Investments is the marketing name of Delaware Management Holdings, Inc. and its subsidiaries. |
Each Fund files its complete schedule of portfolio holdings with the Securities and Exchange Commission (SEC) for the first and third quarters of each fiscal year on Form N-Q. Each Fund’s Forms N-Q, as well as a description of the policies and procedures that each Fund uses to determine how to vote proxies (if any) relating to portfolio securities are available without charge (i) upon request, by calling 800 523-1918; and (ii) on the SEC’s website at www.sec.gov. In addition, a description of the policies and procedures that each Fund uses to determine how to vote proxies (if any) relating to portfolio securities and each Fund’s Schedule of Investments are available without charge on each Fund’s website at www.delawareinvestments.com. Each Fund’s Forms N-Q may be reviewed and copied at the SEC’s Public Reference Room in Washington, D.C.; information on the operation of the Public Reference Room may be obtained by calling 800 SEC-0330.
Information (if any) regarding how each Fund voted proxies relating to portfolio securities during the most recently disclosed 12-month period ended June 30 is available without charge (i) through each Funds’ website at www.delawareinvestments.com; and (ii) on the SEC’s website at www.sec.gov.
120
Annual report Delaware Focus Global Growth Fund
November 30, 2011 Global / international equity mutual fund |
Carefully consider the Fund’s investment objectives, risk factors, charges, and expenses before investing. This and other information can be found in the Fund’s prospectus and, if available, its summary prospectus, which may be obtained by visiting www.delawareinvestments.com or calling 800 523-1918. Investors should read the prospectus and, if available, the summary prospectus carefully before investing. |
You can obtain shareholder reports and prospectuses online instead of in the mail.
Visit www.delawareinvestments.com/edelivery. |
Experience Delaware Investments
Delaware Investments is committed to the pursuit of consistently superior asset management and unparalleled client service. We believe in our investment processes, which seek to deliver consistent results, and in convenient services that help add value for our clients.
If you are interested in learning more about creating an investment plan, contact your financial advisor.
You can learn more about Delaware Investments or obtain a prospectus for Delaware Focus Global Growth Fund at www.delawareinvestments.com.
| Manage your investments online |
- 24-hour access to your account information
- Obtain share prices
- Check your account balance and recent transactions
- Request statements or literature
- Make purchases and redemptions
|
Delaware Management Holdings, Inc. and its subsidiaries (collectively known by the marketing name of Delaware Investments) are wholly owned subsidiaries of Macquarie Group Limited, a global provider of banking, financial, advisory, investment and funds management services.
Investments in Delaware Focus Global Growth Fund are not and will not be deposits with or liabilities of Macquarie Bank Limited ABN 46 008 583 542 and its holding companies, including their subsidiaries or related companies (Macquarie Group), and are subject to investment risk, including possible delays in repayment and loss of income and capital invested. No Macquarie Group company guarantees or will guarantee the performance of the Fund, the repayment of capital from the Fund, or any particular rate of return.
| Table of contents | |
| Portfolio management review | 1 |
| Performance summary | 4 |
| Disclosure of Fund expenses | 8 |
| Security type/country and sector allocation | 10 |
| Statement of net assets | 11 |
| Statement of operations | 15 |
| Statements of changes in net assets | 16 |
| Financial highlights | 18 |
| Notes to financial statements | 24 |
| Report of independent registered | |
| public accounting firm | 35 |
| Other Fund information | 36 |
| Board of trustees/directors and | |
| officers addendum | 40 |
| About the organization | 50 |
Unless otherwise noted, views expressed herein are current as of Nov. 30, 2011, and subject to change.
Funds are not FDIC insured and are not guaranteed. It is possible to lose the principal amount invested.
Mutual fund advisory services provided by Delaware Management Company, a series of Delaware Management Business Trust, which is a registered investment advisor. Delaware Investments, a member of Macquarie Group, refers to Delaware Management Holdings, Inc. and its subsidiaries, including the Fund’s distributor, Delaware Distributors, L.P. Macquarie Group refers to Macquarie Group Limited and its subsidiaries and affiliates worldwide.
© 2012 Delaware Management Holdings, Inc.
All third-party trademarks cited are the property of their respective owners.
Portfolio management review
Delaware Focus Global Growth Fund | | December 6, 2011 |
| Performance preview (for the year ended November 30, 2011) | | |
| Delaware Focus Global Growth Fund (Class A shares) | 1-year return | | +4.28% |
| MSCI World Index (gross) | 1-year return | | +2.02% |
| MSCI World Index (net) | 1-year return | | +1.46% |
Past performance does not guarantee future results.
For complete, annualized performance for Delaware Focus Global Growth Fund, please see the table on page 4.
The performance of Class A shares excludes the applicable sales charge and reflects the reinvestment of all distributions.
Index performance returns do not reflect any management fees, transaction costs, or expenses. Indices are unmanaged and one cannot invest directly in an index. |
Global equity markets in general finished the Fund’s fiscal year moderately lower as solutions to serious debt issues in the United States and Europe failed to materialize. The deteriorating global economic backdrop seemed to cause a change in market leadership from economically sensitive sectors to more defensive industries.
At the beginning of the Fund’s fiscal year, global equity markets notched strong gains in response to several positive developments, including an apparent resolution of the Greek sovereign debt crisis and the Federal Reserve’s second round of quantitative easing, also referred to as QE2.
By early spring 2011, however, the economic outlook seemed to dim as the euro zone’s debt issues persisted. After saving Greece from default, the European Central Bank was forced to bail out Ireland and Portugal. Fears of inflation caused the European Central Bank to tighten monetary policy and resist becoming the lender of last resort to the region’s struggling bond markets. The governments of several emerging economies — most notably China — followed suit. Meanwhile, a tragic tsunami and nuclear crisis in Japan sent that country’s equity market sharply lower and disrupted global supply chains, particularly in the automotive and technology sectors. Rising commodity prices, in part the result of turmoil in the Middle East and Africa, also restrained consumer spending, as did political disarray, dysfunction, and gridlock in both European and the U.S. governments.
The accumulated weight of these problems, along with weakening economic data and concerns about another credit crunch in Europe eventually reached critical mass during the summer and early fall months of 2011, triggering extraordinary volatility and a steep selloff in global equity stocks. By October 2011, the future of the euro zone itself was in some doubt, with yields on Italian and Spanish government debt rising to what many viewed as unsustainable levels and financing rates in Germany, France, and Belgium also moving higher. As the Fund’s fiscal year drew to a close, key European political and institutional leaders engaged in urgent efforts to find a mutually agreeable solution to the debt crisis, which by then had also begun posing significant threats to the region’s banks. As the crisis lingered, equity markets remained volatile, pushed to the upside by continued solid earnings growth
1
Portfolio management review
Delaware Focus Global Growth Fund
and erroneous signs of a permanent euro zone resolution, and to the downside by the increasingly plausible worst-case scenario involving the breakup of the euro zone.
Fund performance
For the fiscal year ended Nov. 30, 2011, Delaware Focus Global Growth Fund Class A shares returned +4.28% at net asset value and -1.73% at maximum offer price (both figures reflect all distributions reinvested). For the same period, the Fund’s benchmark, the MSCI World Index returned +1.46 (net). As is typical of our long-term experience, stock selection drove the majority of the fund performance (as opposed to geographical or sector influences). Complete annualized performance for Delaware Focus Global Growth Fund is shown in the table on page 4.
MasterCard was one of the Fund’s top contributors to performance during its fiscal year. With the release of the Federal Reserve’s recommendations for debit card interchange rates and network exclusivity rules in June 2011, many key elements of uncertainty became clearer and generally allowed investors to focus on what we believe are the company’s strong fundamentals.
The original recommendations made by the Fed in December 2010, along with increased government scrutiny over credit card networks, weighed on this stock during the early part of the Fund’s fiscal year. We felt that MasterCard’s competitive position would allow it to potentially avoid the heavy pricing pressure that many investors feared. Based on this belief, we maintained the Fund’s position in the stock during December 2010’s significant selloff.
Perrigo was another strong contributor. The company reported solid earnings and demonstrated its attractiveness to investors concerned about economic growth. Perrigo has participated in the consumer buying trend towards private label purchases (as opposed to higher-priced branded products) and, if the trend continues, has secular growth characteristics that we believe may help shelter the company from economic headwinds.
Netherlands-based Core Laboratories also contributed to Fund performance. The company provides software and other technologies that help big energy companies analyze the core of oil and natural gas wells and determine the most effective ways to extract natural resources. We view this holding as a “buffered business model,” one we believe may potentially perform well in both good and bad energy markets.
Admiral Group, a provider of auto insurance products in the United Kingdom and other countries, was the greatest detractor from Fund performance. Unusually high insurance claims weighed on the stock, especially near the end of the Fund’s fiscal year. We continue to hold this stock in the Fund because we believe the company’s leadership possesses capable risk management skills, which may enable the company to help drive shareholder returns through solid capital allocation, including strong dividend payments.
Staples also detracted from performance for the fiscal year. Modest earnings reports increased investor concerns that the company’s small- and medium-sized business customer base is still struggling with an economy that hasn’t fully recovered.
2
We continue to hold the stock in the Fund because we believe in the company’s strategic plans to attempt to drive corporate profitability higher despite the economic conditions.
Finally, Strayer Education was a notable detractor. We think the stock continues to suffer, along with the rest of the for-profit education industry, because of increased scrutiny on federal loans that finance most student education. While this regulatory overhang resulted in stock volatility during the Fund’s fiscal year, we believe this industry could emerge from the controversy leaner and more transparent — potentially with stronger and more profitable survivors. We also believe Strayer is positioned better than most of its competitors in the market and therefore may be poised to benefit disproportionately from an improving industry dynamic.
Many investors appear increasingly concerned with a potential pause in the pace of global economic recovery and other external factors that threaten economic fundamentals (for example, the European sovereign debt crisis). While some fundamentals may still be trending in a positive direction (from a very low base during the global financial crisis in 2008-2009), we don’t believe we are entering into a typical post-recessionary boom cycle. Rather, we believe the lingering effects of the credit crisis could lead to moderate growth, at best, and an environment in which the quality of a company’s business model, competitive position, and management may be of utmost importance.
Regardless of the economic outcome, we remain consistent in our long-term investment philosophy: We want to own what we view as strong secular-growth companies with solid business models and competitive positions that we believe can grow market share and have the potential to deliver shareholder value in a variety of market environments.
3
| Performance summary | |
| Delaware Focus Global Growth Fund | November 30, 2011 |
The performance data quoted represent past performance; past performance does not guarantee future results. Investment return and principal value will fluctuate so your shares, when redeemed, may be worth more or less than their original cost. Please obtain the performance data current for the most recent month end by calling 800 523-1918 or visiting our website at www.delawareinvestments.com/performance. Current performance may be lower or higher than the performance data quoted.
| Fund performance1,2 | Average annual total returns through November 30, 2011 |
| | 1 year | | Lifetime | |
| Class A (Est. Dec. 29, 2008) | | | | | |
| Excluding sales charge | | +4.28% | | +23.56% | |
| Including sales charge | | -1.73% | | +21.07% | |
| Class C (Est. Dec. 29, 2010) | | | | | |
| Excluding sales charge | | n/a | | -2.41% | |
| Including sales charge | | n/a | | -3.38% | |
| Class R (Est. Dec. 29, 2010) | | | | | |
| Excluding sales charge | | n/a | | -1.98% | |
| Including sales charge | | n/a | | -1.98% | |
| Institutional Class (Est. Dec. 29, 2008) | | | | | |
| Excluding sales charge | | +4.51% | | +23.65% | |
| Including sales charge | | +4.51% | | +23.65% | |
1 Returns reflect the reinvestment of all distributions and are presented both with and without the applicable sales charges described below. Returns do not reflect the deduction of taxes the shareholder would pay on Fund distributions or redemptions of Fund shares.
Expense limitations were in effect for certain classes during some or all of the periods shown in the “Fund performance” chart. The current expenses for each class are listed on the “Fund expense ratios” table on page 5. Performance would have been lower had expense limitations not been in effect.
Class A shares are sold with a maximum front-end sales charge of up to 5.75%, and have an annual distribution and service fee of up to 0.30% of average daily net assets. This fee has been contractually limited to 0.25% of average daily net assets from March 30, 2011, through March 29, 2012.
Class C shares are sold with a contingent deferred sales charge of 1.00% if redeemed during the first 12 months. They are also subject to an annual distribution and service fee of up to 1.00% of average daily net assets.
Performance for Class C shares, excluding sales charges, assumes either that contingent deferred sales charges did not apply or that the investment was not redeemed.
Class R shares are available only for certain retirement plan products. They are sold without a sales charge and have an annual
4
distribution and service fee of up to 0.60% of average daily net assets, which has been limited contractually to 0.50% from March 30, 2011, through March 29, 2012.
Institutional Class shares are available without sales or asset-based distribution charges only to certain eligible institutional accounts.
The “Fund performance” table and the “Performance of a $10,000 investment” graph do not reflect the deduction of taxes the shareholder would pay on Fund distributions or redemptions of Fund shares.
Investments in small and/or medium-sized companies typically exhibit greater risk and higher volatility than larger, more established companies.
International investments entail risks not ordinarily associated with U.S. investments including fluctuation in currency values, differences in accounting principles, or economic or political instability in other nations.
Investing in emerging markets can be riskier than investing in established foreign markets due to increased volatility and lower trading volume.
Instances of high double-digit returns are unusual, cannot be sustained, and were primarily achieved during favorable market conditions.
2 The Fund’s expense ratios, as described in the most recent prospectus, are disclosed in the following “Fund expense ratios” table. Delaware Investments has agreed to reimburse certain expenses and/or waive certain fees in order to prevent total fund operating expenses (excluding certain fees and expenses) from exceeding 1.30% of the Fund’s average daily net assets from March 30, 2011, through March 29, 2012. Please see the most recent prospectus and any applicable supplement(s) for additional information on these fee waivers and/or reimbursements.
| Fund expense ratios | Class A | | Class C | | Class R | | Institutional Class |
| Total annual operating expenses | 2.04% | | 2.74% | | 2.34% | | 1.74% |
| (without fee waivers) | | | | | | | |
| Net expenses | 1.55% | | 2.30% | | 1.80% | | 1.30% |
| (including fee waivers, if any) | | | | | | | |
| Type of waiver | Contractual | | Contractual | | Contractual | | Contractual |
5
Performance summary
Delaware Focus Global Growth Fund
Performance of a $10,000 investment1
Average annual total returns from Dec. 29, 2008 (Fund’s inception), through Nov. 30, 2011
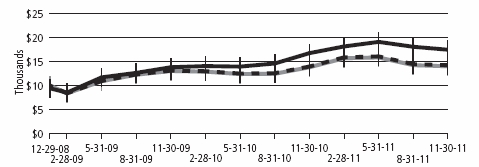
| For period beginning Dec. 29, 2008, through Nov. 30, 2011 | Starting value | Ending value |
| | Delaware Focus Global Growth Fund — Class A shares | | $9,425 | | $17,492 |
| | MSCI World Index (gross) | | $10,000 | | $14,257 |
| | MSCI World Index (net) | | $10,000 | | $14,024 |
1 The “Performance of a $10,000 investment” graph assumes $10,000 invested in Class A shares of the Fund on Dec. 29, 2008, and includes the effect of a 5.75% front-end sales charge and the reinvestment of all distributions. The graph does not reflect the deduction of taxes the shareholders would pay on Fund distributions or redemptions of Fund shares. Expense limitations were in effect for some or all of the periods shown. Performance would have been lower had expense limitations not been in effect. Current expenses are listed in the “Fund expense ratios” table on page 5. Please note additional details on pages 4 through 6.
The chart also assumes $10,000 invested in the MSCI World Index as of Dec. 29, 2008.
The MSCI World Index is a free float-adjusted market capitalization weighted index designed to measure equity market performance across developed markets worldwide. Index “gross” return approximates the maximum possible dividend reinvestment. Index “net” return approximates the minimum possible dividend reinvestment, after deduction of withholding tax at the highest possible rate.
Index performance returns do not reflect any management fees, transaction costs, or expenses. Indices are unmanaged and one cannot invest directly in an index. Past performance is not a guarantee of future results.
Performance of other Fund classes will vary due to different charges and expenses.
| | Nasdaq symbols | | CUSIPs | |
| Class A | | | DGGAX | | | 246118541 | |
| Class C | | | DGGCX | | | 246118533 | |
| Class R | | | DGGRX | | | 246118525 | |
| Institutional Class | | | DGGIX | | | 246118517 | |
6
Disclosure of Fund expenses
For the six-month period from June 1, 2011 to November 30, 2011
As a shareholder of the Fund, you incur two types of costs: (1) transaction costs, including sales charges (loads) on purchase payments, reinvested dividends, or other distributions; redemption fees; and exchange fees; and (2) ongoing costs, including management fees; distribution and/or service (12b-1) fees; and other Fund expenses. This example is intended to help you understand your ongoing costs (in dollars) of investing in the Fund and to compare these costs with the ongoing costs of investing in other mutual funds.
The example is based on an investment of $1,000 invested at the beginning of the period and held for the entire six-month period from June 1, 2011 to November 30, 2011.
Actual expenses
The first section of the table shown, “Actual Fund return,” provides information about actual account values and actual expenses. You may use the information in this section of the table, together with the amount you invested, to estimate the expenses that you paid over the period. Simply divide your account value by $1,000 (for example, an $8,600 account value divided by $1,000 = 8.6), then multiply the result by the number in the first section under the heading entitled “Expenses Paid During Period” to estimate the expenses you paid on your account during this period.
Hypothetical example for comparison purposes
The second section of the table shown, “Hypothetical 5% return,” provides information about hypothetical account values and hypothetical expenses based on the Fund’s actual expense ratio and an assumed rate of return of 5% per year before expenses, which is not the Fund’s actual return. The hypothetical account values and expenses may not be used to estimate the actual ending account balance or expenses you paid for the period. You may use this information to compare the ongoing costs of investing in the Fund and other funds. To do so, compare this 5% hypothetical example with the 5% hypothetical examples that appear in the shareholder reports of the other funds.
Please note that the expenses shown in the table are meant to highlight your ongoing costs only and do not reflect any transactional costs, such as sales charges (loads), redemption fees, or exchange fees. Therefore, the second section of the table is useful in comparing ongoing costs only, and will not help you determine the relative total costs of owning different funds. In addition, if these transactional costs were included, your costs would have been higher. The Fund’s expenses shown in the table reflect fee waivers in effect. The expenses shown in the table assume reinvestment of all dividends and distributions.
8
| Delaware Focus Global Growth Fund | | | | | | | | | | | |
| Expense analysis of an investment of $1,000 | | | | | | | |
| Beginning | | Ending | | | | Expenses |
| Account Value | | Account Value | | Annualized | | Paid During Period |
| 6/1/11 | | 11/30/11 | | Expense Ratio | | 6/1/11 to 11/30/11* |
| Actual Fund return | | | | | | | | | | | | | |
| Class A | $ | 1,000.00 | | | $ | 914.40 | | | 1.52% | | $ | 7.29 | |
| Class C | | 1,000.00 | | | | 910.80 | | | 2.30% | | | 11.02 | |
| Class R | | 1,000.00 | | | | 912.90 | | | 1.80% | | | 8.63 | |
| Institutional Class | | 1,000.00 | | | | 915.10 | | | 1.28% | | | 6.15 | |
| Hypothetical 5% return (5% return before expenses) | | | | | | | |
| Class A | $ | 1,000.00 | | | $ | 1,017.45 | | | 1.52% | | $ | 7.69 | |
| Class C | | 1,000.00 | | | | 1,013.54 | | | 2.30% | | | 11.61 | |
| Class R | | 1,000.00 | | | | 1,016.04 | | | 1.80% | | | 9.10 | |
| Institutional Class | | 1,000.00 | | | | 1,018.65 | | | 1.28% | | | 6.48 | |
| *“Expenses Paid During Period” are equal to the Fund’s annualized expense ratio, multiplied by the average account value over the period, multiplied by 183/365 (to reflect the one-half year period). |
9
| Security type/country and sector allocation | |
| Delaware Focus Global Growth Fund | As of November 30, 2011 |
Sector designations may be different than the sector designations presented in other Fund materials. The sector designations may represent the investment manager’s internal sector classifications, which may result in the sector designations for one fund being different than another fund’s sector designations.
| Security type/country | Percentage of net assets |
| Common Stock | 95.61 | % |
| Australia | 2.32 | % |
| Brazil | 4.87 | % |
| China | 2.18 | % |
| Denmark | 2.17 | % |
| France | 6.85 | % |
| India | 2.24 | % |
| Netherlands | 2.82 | % |
| Switzerland | 12.20 | % |
| Taiwan | 2.36 | % |
| United Kingdom | 9.37 | % |
| United States | 48.23 | % |
| Short-Term Investments | 4.64 | % |
| Total Value of Securities | 100.25 | % |
| Liabilities Net of Receivables and Other Assets | (0.25 | %) |
| Total Net Assets | 100.00 | % |
| | | |
| Common stock by sector | | |
| Consumer Discretionary | 16.40 | % |
| Consumer Staples | 2.60 | % |
| Energy | 2.82 | % |
| Financials | 17.90 | % |
| Healthcare | 10.20 | % |
| Industrials | 12.86 | % |
| Information Technology | 25.34 | % |
| Materials | 4.97 | % |
| Telecommunication Services | 2.52 | % |
| Total | 95.61 | % |
10
| Statement of net assets | |
| Delaware Focus Global Growth Fund | November 30, 2011 |
| | | Number of shares | | Value (U.S. $) |
| Common Stock – 95.61%Δ | | | | |
| Australia – 2.32% | | | | |
| BHP Billiton ADR | 4,825 | | $ | 362,695 |
| | | | | 362,695 |
| Brazil – 4.87% | | | | |
| BM&F Bovespa | 86,075 | | | 470,288 |
| | Brasil Brokers Participacoes | 86,601 | | | 291,655 |
| | | | | 761,943 |
| China – 2.18% | | | | |
| † | Ctrip.com International ADR | 12,520 | | | 340,544 |
| | | | | 340,544 |
| Denmark – 2.17% | | | | |
| Novo Nordisk Class B | 2,987 | | | 339,107 |
| | | | | 339,107 |
| France – 6.85% | | | | |
| Danone | 6,157 | | | 406,516 |
| Edenred | 12,853 | | | 342,169 |
| LVMH Moet Hennessy Louis Vuitton | 2,058 | | | 324,049 |
| | | | | 1,072,734 |
| India – 2.24% | | | | |
| Infosys Technologies ADR | 6,800 | | | 351,016 |
| | | | | 351,016 |
| Netherlands – 2.82% | | | | |
| Core Laboratories | 3,800 | | | 440,990 |
| | | | | 440,990 |
| Switzerland – 12.20% | | | | |
| Julius Baer Group | 8,841 | | | 316,603 |
| Kuehne & Nagel International | 3,203 | | | 391,081 |
| Roche Holding | 2,279 | | | 362,550 |
| SGS | 251 | | | 424,742 |
| Syngenta ADR | 7,050 | | | 415,386 |
| | | | | 1,910,362 |
| Taiwan – 2.36% | | | | |
| Taiwan Semiconductor Manufacturing ADR | 28,600 | | | 369,512 |
| | | | | 369,512 |
11
Statement of net assets
Delaware Focus Global Growth Fund
| | | Number of shares | | Value (U.S. $) |
| Common Stock (continued) | | | | | |
| United Kingdom – 9.37% | | | | | |
| † | Admiral Group | | 15,940 | | $ | 230,789 |
| Aggreko | | 14,218 | | | 424,010 |
| Compass Group | | 41,122 | | | 381,518 |
| Intertek Group | | 14,213 | | | 430,942 |
| | | | | | 1,467,259 |
| United States – 48.23% | | | | | |
| Allergan | | 5,600 | | | 468,832 |
| † | Apollo Group Class A | | 7,200 | | | 349,056 |
| † | Apple | | 1,630 | | | 622,985 |
| † | Crown Castle International | | 9,330 | | | 394,846 |
| † | Google Class A | | 935 | | | 560,430 |
| † | IntercontinentalExchange | | 3,250 | | | 395,590 |
| Intuit | | 8,160 | | | 434,438 |
| MasterCard Class A | | 1,630 | | | 610,516 |
| † | MSCI Class A | | 14,400 | | | 486,000 |
| NIKE Class B | | 3,550 | | | 341,439 |
| Perrigo | | 4,350 | | | 425,865 |
| † | Polycom | | 19,700 | | | 332,930 |
| † | priceline.com | | 1,000 | | | 485,890 |
| QUALCOMM | | 8,200 | | | 449,360 |
| Strayer Education | | 3,550 | | | 345,273 |
| † | Teradata | | 7,200 | | | 390,456 |
| † | VeriFone Systems | | 10,400 | | | 456,040 |
| | | | | | 7,549,946 |
| Total Common Stock (cost $13,018,629) | | | | | 14,966,108 |
| |
| | Principal amount (U.S. $) | | | |
| Short-Term Investments – 4.64% | | | | | |
| ≠Discount Note – 0.20% | | | | | |
| Federal Home Loan Bank 0.01% 12/23/11 | $ | 31,125 | | | 31,125 |
| | | | | | 31,125 |
12
| | | Principal amount (U.S. $) | | Value (U.S. $) |
| Short-Term Investments (continued) | | | | | | |
| Repurchase Agreement – 4.44% | | | | | | |
| BNP Paribas 0.08%, dated 11/30/11, | | | | | | |
| to be repurchased on 12/1/11, | | | | | | |
| | repurchase price $695,002 | | | | | | |
| (collateralized by U.S. government | | | | | | |
| obligations 0.00%-4.25% 1/13/12-5/15/21; | | | | | | |
| market value $708,900) | $ | 695,000 | | $ | 695,000 | |
| | | | | | 695,000 | |
| Total Short-Term Investments (cost $726,125) | | | | | 726,125 | |
| |
| Total Value of Securities – 100.25% | | | | | | |
| (cost $13,744,754) | | | | | 15,692,233 | |
| Liabilities Net of Receivables and | | | | | | |
| Other Assets – (0.25%) | | | | | (39,369 | ) |
| Net Assets Applicable to 1,126,656 | | | | | | |
| Shares Outstanding – 100.00% | | | | $ | 15,652,864 | |
| |
| Net Asset Value – Delaware Focus Global Growth Fund | | | | | | |
| Class A ($8,243,730 / 593,994 Shares) | | | | | | $13.88 | |
| Net Asset Value – Delaware Focus Global Growth Fund | | | | | | |
| Class C ($67,839 / 4,923 Shares) | | | | | | $13.78 | |
| Net Asset Value – Delaware Focus Global Growth Fund | | | | | | |
| Class R ($4,967 / 359 Shares) | | | | | | $13.84 | |
| Net Asset Value – Delaware Focus Global Growth Fund | | | | | | |
| Institutional Class ($7,336,328 / 527,380 Shares) | | | | | | $13.91 | |
| |
| Components of Net Assets at November 30, 2011: | | | | | | |
| Shares of beneficial interest (unlimited authorization – no par) | | | | $ | 13,602,854 | |
| Accumulated net realized gain on investments | | | | | 103,164 | |
| Net unrealized appreciation of investments and derivatives | | | | | 1,946,846 | |
| Total net assets | | | | $ | 15,652,864 | |
| Δ | Securities have been classified by country of origin. Classification by type of business has been presented on page 10 in “Security type/country and sector allocation.” |
| † | Non income producing security. |
| ≠ | The rate shown is the effective yield at the time of purchase. |
13
Statement of net assets
Delaware Focus Global Growth Fund
| | | |
| Net Asset Value and Offering Price Per Share – | | |
| Delaware Focus Global Growth Fund | | |
| Net asset value Class A (A) | $ | 13.88 |
| Sales charge (5.75% of offering price) (B) | | 0.85 |
| Offering price | $ | 14.73 |
(A) Net asset value per share, as illustrated, is the amount which would be paid upon redemption or repurchase of shares.
(B) See the current prospectus for purchases of $50,000 or more.
ADR — American Depositary Receipts
See accompanying notes, which are an integral part of the financial statements.
14
| Statement of operations | |
| Delaware Focus Global Growth Fund | Year Ended November 30, 2011 |
| Investment Income: | | | | | | |
| Dividends | $ | 163,031 | | | | |
| Interest | | 47 | | $ | 163,078 | |
| |
| Expenses: | | | | | | |
| Registration fees | | 99,470 | | | | |
| Management fees | | 90,536 | | | | |
| Reports and statements to shareholders | | 17,541 | | | | |
| Dividend disbursing and transfer agent fees and expenses | | 15,839 | | | | |
| Distribution expenses – Class A | | 14,647 | | | | |
| Distribution expenses – Class C | | 408 | | | | |
| Distribution expenses – Class R | | 28 | | | | |
| Audit and tax | | 12,034 | | | | |
| Custodian fees | | 9,910 | | | | |
| Dues and services | | 8,254 | | | | |
| Accounting and administration expenses | | 4,187 | | | | |
| Pricing fees | | 3,375 | | | | |
| Legal fees | | 1,565 | | | | |
| Trustees’ fees | | 566 | | | | |
| Insurance fees | | 144 | | | | |
| Consulting fees | | 89 | | | | |
| Trustees’ expenses | | 43 | | | 278,636 | |
| Less fees waived | | | | | (127,163 | ) |
| Less waived distribution expenses – Class A | | | | | (3,439 | ) |
| Less waived distribution expenses – Class R | | | | | (5 | ) |
| Less expense paid indirectly | | | | | (1 | ) |
| Total operating expenses | | | | | 148,028 | |
| Net Investment Income | | | | | 15,050 | |
| |
| Net Realized and Unrealized Gain (Loss): | | | | | | |
| Net realized gain (loss) on: | | | | | | |
| Investments | | | | | 114,165 | |
| Foreign currencies | | | | | (19,057 | ) |
| Foreign currency exchange contracts | | | | | (13,468 | ) |
| Net realized gain | | | | | 81,640 | |
| Net change in unrealized appreciation (depreciation) on: | | | | | | |
| Investments | | | | | (207,008 | ) |
| Foreign currencies | | | | | (1,068 | ) |
| Net change in unrealized appreciation (depreciation) | | | | | (208,076 | ) |
| Net Realized and Unrealized Loss | | | | | (126,436 | ) |
| |
| Net Decrease in Net Assets Resulting from Operations | | | | $ | (111,386 | ) |
See accompanying notes, which are an integral part of the financial statements.
15
Statements of changes in net assets
Delaware Focus Global Growth Fund
| Year Ended |
| 11/30/11 | | 11/30/10 |
| Increase (Decrease) in Net Assets from Operations: | | | | | | | |
| Net investment income | $ | 15,050 | | | $ | 11,304 | |
| Net realized gain on investments | | 81,640 | | | | 205,541 | |
| Unrealized appreciation/depreciation of investments | | (208,076 | ) | | | 920,455 | |
| Net increase (decrease) in net assets resulting from operations | | (111,386 | ) | | | 1,137,300 | |
| |
| Dividends and Distributions to Shareholders from: | | | | | | | |
| Net investment income: | | | | | | | |
| Class A | | (4,926 | ) | | | (5,410 | ) |
| Institutional Class | | (9,758 | ) | | | (5,056 | ) |
| |
| Net realized gain on investments: | | | | | | | |
| Class A | | (71,427 | ) | | | (234,429 | ) |
| Institutional Class | | (141,494 | ) | | | (219,092 | ) |
| | | (227,605 | ) | | | (463,987 | ) |
| Capital Share Transactions: | | | | | | | |
| Proceeds from shares sold: | | | | | | | |
| Class A | | 6,470,517 | | | | 2,501 | |
| Class C* | | 70,629 | | | | — | |
| Class R* | | 5,042 | | | | — | |
| Institutional Class | | 2,877,749 | | | | 1,775,510 | |
| |
| Net asset value of shares issued upon reinvestment | | | | | | | |
| of dividends and distributions: | | | | | | | |
| Class A | | 51,610 | | | | 171,593 | |
| Institutional Class | | 151,251 | | | | 224,148 | |
| | | 9,626,798 | | | | 2,173,752 | |
| Cost of shares repurchased: | | | | | | | |
| Class A | | (290,472 | ) | | | (485,708 | ) |
| Institutional Class | | (538,155 | ) | | | — | |
| | (828,627 | ) | | | (485,708 | ) |
| Increase in net assets derived from capital share transactions | | 8,798,171 | | | | 1,688,044 | |
| Net Increase in Net Assets | | 8,459,180 | | | | 2,361,357 | |
| |
| Net Assets: | | | | | | | |
| Beginning of year | | 7,193,684 | | | | 4,832,327 | |
| End of year (including undistributed net investment | | | | | | | |
| income of $– and $4,240, respectively) | $ | 15,652,864 | | | $ | 7,193,684 | |
*Class C and Class R commenced operations on December 29, 2010.
See accompanying notes, which are an integral part of the financial statements.
16
Financial highlights
Delaware Focus Global Growth Fund Class A
Selected data for each share of the Fund outstanding throughout each period were as follows:
| |
| Net asset value, beginning of period |
| |
| Income from investment operations: |
| Net investment income2 |
| Net realized and unrealized gain on investments |
| Total from investment operations |
| |
| Less dividends and distributions from: |
| Net investment income |
| Net realized gain on investments |
| Total dividends and distributions |
| |
| Net asset value, end of period |
| |
| Total return3 |
| |
| Ratios and supplemental data: |
| Net assets, end of period (000 omitted) |
| Ratio of expenses to average net assets |
| Ratio of expenses to average net assets |
| prior to fees waived |
| Ratio of net investment income to average net assets |
| Ratio of net investment loss to average net assets |
| prior to fees waived |
| Portfolio turnover |
1 Date of commencement of operations; ratios and portfolio turnover have been annualized and total return has not been annualized.
2 The average shares outstanding method has been applied for per share information.
3 Total investment return is based on the change in net asset value of a share during the period and assumes reinvestment of dividends and distributions at net asset value and does not reflect the impact of a sales charge. Total investment return during all of the periods shown reflects waivers by the manager and distributor. Performance would have been lower had the waivers not been in effect.
See accompanying notes, which are an integral part of the financial statements.
18
| | | | | | | | | 12/29/081 | |
| | Year Ended | | | to | |
| | 11/30/11 | | 11/30/10 | | | 11/30/09 | |
| | $13.720 | | | $12.470 | | | | $8.500 | | |
| | | |
| | | |
| | 0.000 | | | 0.025 | | | | 0.050 | | |
| | 0.594 | | | 2.422 | | | | 3.920 | | |
| | 0.594 | | | 2.447 | | | | 3.970 | | |
| | | |
| | | |
| | (0.028 | ) | | (0.027 | ) | | | 0.000 | | |
| | (0.406 | ) | | (1.170 | ) | | | 0.000 | | |
| | (0.434 | ) | | (1.197 | ) | | | 0.000 | | |
| | | |
| | $13.880 | | | $13.720 | | | | $12.470 | | |
| | | |
| | 4.28% | | | 21.31% | | | | 46.71% | | |
| | | |
| | | |
| | $8,244 | | | $2,413 | | | | $2,498 | | |
| | 1.51% | | | 1.20% | | | | 1.20% | | |
| | | |
| | 2.78% | | | 2.04% | | | | 2.54% | | |
| | 0.00% | | | 0.20% | | | | 0.52% | | |
| | | |
| | (1.27% | ) | | (0.64% | ) | | | (0.82% | ) | |
| | 18% | | | 30% | | | | 45% | | |
19
Financial highlights
Delaware Focus Global Growth Fund Class C
Selected data for each share of the Fund outstanding throughout the period was as follows:
| 12/29/101 |
| to |
| 11/30/11 |
| Net asset value, beginning of period | $ | 14.120 | |
| |
| Loss from investment operations: | | | |
| Net investment loss2 | | (0.108 | ) |
| Net realized and unrealized loss on investments | | (0.232 | ) |
| Total from investment operations | | (0.340 | ) |
| |
| Net asset value, end of period | $ | 13.780 | |
| |
| Total return3 | | (2.41% | ) |
| |
| Ratios and supplemental data: | | | |
| Net assets, end of period (000 omitted) | | $68 | |
| Ratio of expenses to average net assets | | 2.30% | |
| Ratio of expenses to average net assets | | | |
| prior to fees waived | | 3.52% | |
| Ratio of net investment loss to average net assets | | (0.85% | ) |
| Ratio of net investment loss to average net assets | | | |
| prior to fees waived | | (2.07% | ) |
| Portfolio turnover | | 18% | 4 |
1 Date of commencement of operations; ratios have been annualized and total return has not been annualized.
2 The average shares outstanding method has been applied for per share information.
3 Total investment return is based on the change in net asset value of a share during the period and assumes reinvestment of dividends and distributions at net asset value and does not reflect the impact of a sales charge. Total investment return during the period shown reflects a waiver by the manager. Performance would have been lower had the waiver not been in effect.
4 Portfolio turnover is representative of the Fund for the entire period from December 1, 2010 through November 30, 2011.
See accompanying notes, which are an integral part of the financial statements.
20
Delaware Focus Global Growth Fund Class R
Selected data for each share of the Fund outstanding throughout the period was as follows:
| | 12/29/101 | | |
| | to | | |
| | 11/30/11 | | |
| Net asset value, beginning of period | | $ | 14.120 | | |
| | |
| Loss from investment operations: | | | | | |
| Net investment loss2 | | | (0.043 | ) | |
| Net realized and unrealized loss on investments | | | (0.237 | ) | |
| Total from investment operations | | | (0.280 | ) | |
| | |
| Net asset value, end of period | | $ | 13.840 | | |
| | |
| Total return3 | | | (1.98% | ) | |
| | |
| Ratios and supplemental data: | | | | | |
| Net assets, end of period (000 omitted) | | | $5 | | |
| Ratio of expenses to average net assets | | | 1.80% | | |
| Ratio of expenses to average net assets | | | | | |
| prior to fees waived | | | 3.12% | | |
| Ratio of net investment loss to average net assets | | | (0.35% | ) | |
| Ratio of net investment loss to average net assets | | | | | |
| prior to fees waived | | | (1.67% | ) | |
| Portfolio turnover | | | 18% | 4 | |
1 Date of commencement of operations; ratios have been annualized and total return has not been annualized. |
2 The average shares outstanding method has been applied for per share information. |
3 Total investment return is based on the change in net asset value of a share during the period and assumes reinvestment of dividends and distributions at net asset value. Total investment return during the period shown reflects waivers by the manager and distributor. Performance would have been lower had the waivers not been in effect. |
4 Portfolio turnover is representative of the Fund for the entire period from December 1, 2010 through November 30, 2011. |
See accompanying notes, which are an integral part of the financial statements.
21
Financial highlights
Delaware Focus Global Growth Fund Institutional Class
Selected data for each share of the Fund outstanding throughout each period were as follows:
| |
| Net asset value, beginning of period |
| |
| Income from investment operations: |
| Net investment income2 |
| Net realized and unrealized gain on investments |
| Total from investment operations |
| |
| Less dividends and distributions from: |
| Net investment income |
| Net realized gain on investments |
| Total dividends and distributions |
| |
| Net asset value, end of period |
| |
| Total return3 |
| |
| Ratios and supplemental data: |
| Net assets, end of period (000 omitted) |
| Ratio of expenses to average net assets |
| Ratio of expenses to average net assets |
| prior to fees waived |
| Ratio of net investment income to average net assets |
| Ratio of net investment loss to average net assets |
| prior to fees waived |
| Portfolio turnover |
1 Date of commencement of operations; ratios and portfolio turnover have been annualized and total return has not been annualized. |
2 The average shares outstanding method has been applied for per share information. |
3 Total investment return is based on the change in net asset value of a share during the period and assumes reinvestment of dividends and distributions at net asset value. Total investment return during all of the periods shown reflects a waiver by the manager. Performance would have been lower had the waiver not been in effect. |
See accompanying notes, which are an integral part of the financial statements.
22
| | | | | | | | | 12/29/081 | | |
| Year Ended | | to | | |
| | 11/30/11 | | | 11/30/10 | | | 11/30/09 | | |
| | $13.720 | | | $ | 12.470 | | | | $8.500 | | |
| | | |
| | | |
| | 0.038 | | | | 0.025 | | | | 0.050 | | |
| | 0.586 | | | | 2.422 | | | | 3.920 | | |
| | 0.624 | | | | 2.447 | | | | 3.970 | | |
| | | |
| | | |
| | (0.028 | ) | | | (0.027 | ) | | | 0.000 | | |
| | (0.406 | ) | | | (1.170 | ) | | | 0.000 | | |
| | (0.434 | ) | | | (1.197 | ) | | | 0.000 | | |
| | | |
| | $13.910 | | | $ | 13.720 | | | $ | 12.470 | | |
| | | |
| | 4.51% | | | | 21.31% | | | | 46.71% | | |
| | | |
| | | |
| | $7,336 | | | | $4,781 | | | | $2,334 | | |
| | 1.28% | | | | 1.20% | | | | 1.20% | | |
| | | |
| | 2.47% | | | | 1.74% | | | | 2.24% | | |
| | 0.27% | | | | 0.20% | | | | 0.52% | | |
| | | |
| | (0.92% | ) | | | (0.34% | ) | | | (0.52% | ) | |
| | 18% | | | | 30% | | | | 45% | | |
23
| Notes to financial statements | |
| Delaware Focus Global Growth Fund | November 30, 2011 |
Delaware Group® Global & International Funds (Trust) is organized as a Delaware statutory trust and offers five series: Delaware Focus Global Growth Fund, Delaware International Value Equity Fund, Delaware Emerging Markets Fund, Delaware Global Value Fund and Delaware Macquarie Global Infrastructure Fund. These financial statements and the related notes pertain to the Delaware Focus Global Growth Fund (Fund). The Trust is an open-end investment company. The Fund is considered diversified under the Investment Company Act of 1940, as amended, and offers Class A, Class C, Class R and Institutional Class shares. Class A shares are sold with a maximum front-end sales charge of up to 5.75%. Class A share purchases of $1,000,000 or more will incur a contingent deferred sales charge (CDSC) if redeemed during the first two years, provided that Delaware Distributors, L.P. (DDLP) paid a financial advisor a commission on the purchase of those shares. Class C shares are sold with a CDSC of 1%, if redeemed during the first twelve months. Class R and Institutional Class shares are not subject to a sales charge and are offered for sale exclusively to certain eligible investors.
The investment objective of the Fund is to seek long-term capital appreciation.
1. Significant Accounting Policies
The following accounting policies are in accordance with U.S. generally accepted accounting principles (U.S. GAAP) and are consistently followed by the Fund.
Security Valuation — Equity securities, except those traded on the Nasdaq Stock Market, Inc. (Nasdaq), are valued at the last quoted sales price as of the time of the regular close of the New York Stock Exchange (NYSE) on the valuation date. Securities traded on the Nasdaq are valued in accordance with the Nasdaq Official Closing Price, which may not be the last sales price. If on a particular day an equity security does not trade, then the mean between the bid and ask prices will be used, which approximates fair value. Securities listed on a foreign exchange are normally valued at the last quoted sales price on the valuation date. Short-term debt securities are valued at market value. U.S. government and agency securities are valued at the mean between the bid and ask prices, which approximates fair value. Foreign currency exchange contracts are valued at the mean between the bid and ask prices, which approximates fair value. Interpolated values are derived when the settlement date of the contract is an interim date for which quotations are not available. Generally, other securities and assets for which market quotations are not readily available are valued at fair value as determined in good faith under the direction of the Fund’s Board of Trustees (Board). In determining whether market quotations are readily available or fair valuation will be used, various factors will be taken into consideration, such as market closures or suspension of trading in a security. The Fund may use fair value pricing more frequently for securities traded primarily in non-U.S. markets because, among other things, most foreign markets close well before the Fund values its securities generally as of 4:00 p.m. Eastern time. The earlier close of these foreign markets gives rise to the possibility that significant events, including broad market moves, government actions or pronouncements, aftermarket trading, or news events may have occurred in the interim. To account for this, the Fund may frequently value foreign securities using fair value prices based on third-party vendor modeling tools (international fair value pricing).
24
Federal Income Taxes — No provision for federal income taxes has been made as the Fund intends to continue to qualify for federal income tax purposes as a regulated investment company under Subchapter M of the Internal Revenue Code of 1986, as amended, and make the requisite distributions to shareholders. The Fund evaluates tax positions taken or expected to be taken in the course of preparing the Fund’s tax returns to determine whether the tax positions are “more-likely-than-not” of being sustained by the applicable tax authority. Tax positions not deemed to meet the more-likely-than-not threshold are recorded as a tax benefit or expense in the current year. Management has analyzed the Fund’s tax positions taken on federal income tax returns for all open tax years (November 30, 2009 – November 30, 2011), and has concluded that no provision for federal income tax is required in the Fund’s financial statements.
Class Accounting — Investment income, common expenses and realized and unrealized gain (loss) on investments are allocated to the various classes of the Fund on the basis of daily net assets of each class. Distribution expenses relating to a specific class are charged directly to that class.
Foreign Currency Transactions — Transactions denominated in foreign currencies are recorded at the prevailing exchange rates on the valuation date in accordance with the Fund’s prospectus. The value of all assets and liabilities denominated in foreign currencies is translated into U.S. dollars at the exchange rate of such currencies against the U.S. dollar daily. Transaction gains or losses resulting from changes in exchange rates during the reporting period or upon settlement of the foreign currency transaction are reported in operations for the current period. The Fund generally does not isolate that portion of realized gains and losses on investments which is due to changes in foreign exchange rates from that which is due to changes in market prices. The changes are included with the net realized and unrealized gain or loss on investments. The Fund reports certain foreign currency related transactions as components of realized gains (losses) for financial reporting purposes, whereas such components are treated as ordinary income (loss) for federal income tax purposes.
Repurchase Agreements — The Fund may purchase certain U.S. government securities subject to the counterparty’s agreement to repurchase them at an agreed upon date and price. The counterparty will be required on a daily basis to maintain the value of the collateral subject to the agreement at not less than the repurchase price (including accrued interest). The agreements are conditioned upon the collateral being deposited under the Federal Reserve book-entry system with the Fund’s custodian or a third party sub-custodian. In the event of default or bankruptcy by the other party to the agreement, retention of the collateral may be subject to legal proceedings. All open repurchase agreements as of the date of this report were entered into on November 30, 2011.
Use of Estimates — The preparation of financial statements in conformity with U.S. GAAP requires management to make estimates and assumptions that affect the fair value of investments, the reported amounts of assets and liabilities and disclosure of contingent assets and liabilities at the date of the financial statements and the reported amounts of revenues and expenses during the reporting period. Actual results could differ from those estimates and the differences could be material.
25
Notes to financial statements
Delaware Focus Global Growth Fund
1. Significant Accounting Policies (continued)
Other — Expenses directly attributable to the Fund are charged directly to the Fund. Other expenses common to various funds within the Delaware Investments® Family of Funds are generally allocated amongst such funds on the basis of average net assets. Management fees and some other expenses are paid monthly. Security transactions are recorded on the date the securities are purchased or sold (trade date) for financial reporting purposes. Costs used in calculating realized gains and losses on the sale of investment securities are those of the specific securities sold. Dividend income is recorded on the ex-dividend date and interest income is recorded on the accrual basis. Foreign dividends are also recorded on the ex-dividend date or as soon after the ex-dividend date that the Fund is aware of such dividends, net of all non-rebatable tax withholdings. Withholding taxes on foreign dividends have been recorded in accordance with the Fund’s understanding of the applicable country’s tax rules and rates. The Fund declares and pays dividends from net investment income and distributions from net realized gain on investments, if any, annually. The Fund may distribute income dividends and capital gains more frequently, if necessary for tax purposes. Dividends and distributions, if any, are recorded on the ex-dividend date.
The Fund may receive earnings credits from its custodian when positive cash balances are maintained, which are used to offset custody fees. There were no earnings credits for the year ended November 30, 2011.
The Fund receives earnings credits from its transfer agent when positive cash balances are maintained, which are used to offset transfer agent fees. The expense paid under this arrangement is included in dividend disbursing and transfer agent fees and expenses on the statement of operations with the corresponding expense offset shown as “expense paid indirectly.” For the year ended November 30, 2011, the Fund earned $1 under this agreement.
2. Investment Management, Administration Agreements and Other Transactions with Affiliates
In accordance with the terms of its investment management agreement, the Fund pays Delaware Management Company (DMC), a series of Delaware Management Business Trust and the investment manager, an annual fee which is calculated daily at the rate of 0.85% on the first $500 million of average daily net assets of the Fund, 0.80% on the next $500 million, 0.75% on the next $1.5 billion, and 0.70% on average daily net assets in excess of $2.5 billion.
Effective December 29, 2010, DMC has contractually agreed to waive that portion, if any, of its management fee and reimburse the Fund to the extent necessary to ensure that total annual operating expenses (excluding any 12b-1 plan and certain other expenses) do not exceed 1.30% of average daily net assets of the Fund through March 29, 2012. Prior to December 28, 2010, DMC had voluntary agreed to waive that portion, if any, of its management fee and reimburse the Fund to the extent necessary to ensure that total annual operating expenses, (excluding any 12b-1 plan expenses, taxes, interest, inverse floater program expenses, brokerage fees, certain
26
insurance costs, and nonroutine expenses or costs including, but not limited to, those relating to reorganizations, litigation, conducting shareholder meetings, and liquidations (collectively, nonroutine expenses)) did not exceed 1.20% of average daily net assets of the Fund. This expense waiver and reimbursement applies only to expenses paid directly by the Fund.
Delaware Service Company, Inc. (DSC), an affiliate of DMC, provides fund accounting and financial administration oversight services to the Fund. For these services, the Fund pays DSC fees based on the aggregate daily net assets of the Delaware Investments® Family of Funds at the following annual rate: 0.0050% of the first $30 billion; 0.0045% of the next $10 billion; 0.0040% of the next $10 billion; and 0.0025% of aggregate average daily net assets in excess of $50 billion. The fees payable to DSC under the service agreement described above are allocated among all Funds in the Delaware Investments® Family of Funds on a relative net asset value basis. For the year ended November 30, 2011, the Fund was charged $527 for these services.
DSC also provides dividend disbursing and transfer agent services. Prior to July 18, 2011, the Fund paid DSC a monthly fee based on the number of shareholder accounts for dividend disbursing and transfer agent services. Effective July 18, 2011, the Fund pays DSC a monthly asset-based fee for these services.
Pursuant to a distribution agreement and distribution plan, the Fund pays DDLP, the distributor and an affiliate of DMC, an annual distribution and service fee not to exceed 0.30% of the average daily net assets of the Class A shares, 1.00% of the average daily net assets of the Class C shares and 0.60% of the average daily net assets of Class R shares. Institutional Class shares pay no distribution and service expenses. DDLP had voluntarily agreed to waive all distribution and service fees through December 28, 2010. Effective December 29, 2010, DDLP has contracted to waive distribution and service fees through March 29, 2012 in order to prevent distribution and service fees of Class A and Class R shares from exceeding 0.25% and 0.50%, respectively, of average daily net assets.
At November 30, 2011, the Fund had receivables due from or liabilities payable to affiliates as follows:
| Receivable from DMC under expense limitation agreement | | $ | 16,708 |
| Dividend disbursing, transfer agent and fund accounting | | | |
| oversight fees and other expenses payable to DSC | | | 365 |
| Distribution fees payable to DDLP | | | 1,691 |
| Other expenses payable to DMC and affiliates* | | | 603 |
| *DMC, as part of its administrative services, pays operating expenses on behalf of the Fund and is reimbursed on a periodic basis. Expenses include items such as printing of shareholder reports, fees for audit, legal and tax services, stock exchange fees, custodian fees, and director fees. |
As provided in the investment management agreement, the Fund bears the cost of certain legal and tax services, including internal legal and tax services provided to the Fund by DMC and/or its affiliates’ employees. For the year ended November 30, 2011, the Fund was charged $227 for internal legal and tax services provided by DMC and/or its affiliates’ employees.
27
Notes to financial statements
Delaware Focus Global Growth Fund
| 2. | Investment Management, Administration Agreements and Other Transactions with Affiliates (continued) |
For the year ended November 30, 2011, DDLP earned $480 for commissions on sales of the Fund’s Class A shares.
Trustees’ fees include expenses accrued by the Fund for each Trustee’s retainer and meeting fees. Certain officers of DMC, DSC and DDLP are officers and/or Trustees of the Trust. These officers and Trustees are paid no compensation by the Fund.
3. Investments
For the year ended November 30, 2011, the Fund made purchases of $9,785,203 and sales of $1,830,499 of investment securities other than short-term investments.
At November 30, 2011, the cost of investments for federal income tax purposes was $13,748,701. At November 30, 2011, the net unrealized appreciation was $1,943,532, of which $ 2,635,366 related to unrealized appreciation of investments and $691,834 related to unrealized depreciation of investments.
U.S. GAAP defines fair value as the price that the Fund would receive to sell an asset or pay to transfer a liability in an orderly transaction between market participants at the measurement date under current market conditions. A three level hierarchy for fair value measurements has been established based upon the transparency of inputs to the valuation of an asset or liability. Inputs may be observable or unobservable and refer broadly to the assumptions that market participants would use in pricing the asset or liability. Observable inputs reflect the assumptions market participants would use in pricing the asset or liability based on market data obtained from sources independent of the reporting entity. Unobservable inputs reflect the reporting entity’s own assumptions about the assumptions that market participants would use in pricing the asset or liability developed based on the best information available under the circumstances. The Fund’s investment in its entirety is assigned a level based upon the observability of the inputs which are significant to the overall valuation. The three level hierarchy of inputs is summarized below.
| Level 1 | – | inputs are quoted prices in active markets for identical investments (e.g., equity securities, open-end investment companies, futures contracts, options contracts) |
| | | |
| Level 2 | – | other observable inputs (including, but not limited to: quoted prices for similar assets or liabilities in markets that are active, quoted prices for identical or similar assets or liabilities in markets that are not active, inputs other than quoted prices that are observable for the assets or liabilities (such as interest rates, yield curves, volatilities, prepayment speeds, loss severities, credit risks and default rates) or other market-corroborated inputs) (e.g., debt securities, government securities, swap contracts, foreign currency exchange contracts, foreign securities utilizing international fair value pricing.) |
| | | |
| Level 3 | – | inputs are significant unobservable inputs (including the Fund’s own assumptions used to determine the fair value of investments) (e.g., broker-quoted securities, fair valued securities) |
28
The following table summarizes the valuation of the Fund’s investments by fair value hierarchy levels as of November 30, 2011:
| | Level 1 | | Level 2 | | Total |
| Common Stock | | $ | 10,592,034 | | $ | 4,374,074 | | $ | 14,966,108 |
| Short-Term Investments | | | — | | | 726,125 | | | 726,125 |
| Total | | $ | 10,592,034 | | $ | 5,100,199 | | $ | 15,692,233 |
There were no unobservable inputs used to value investments at the beginning or end of the year.
During the year ended November 30, 2011, there were no transfers between Level 1 investments, Level 2 investments or Level 3 investments that had a material impact to the Fund. This does not include transfers between Level 1 investments and Level 2 investments due to the Fund utilizing international fair value pricing during the year.
4. Dividend and Distribution Information
Income and long-term capital gain distributions are determined in accordance with federal income tax regulations, which may differ from U.S. GAAP. Additionally, distributions from net gains on foreign currency transactions and net short-term gains on sales of investment securities are treated as ordinary income for federal income tax purposes. The tax character of dividends and distributions paid during the years ended November 30, 2011 and 2010 was as follows:
| | | Year Ended |
| | 11/30/11 | | 11/30/10 |
| Ordinary income | | $ | 85,591 | | $ | 463,987 |
| Long-term capital gain | | | 142,014 | | | — |
| | $ | 227,605 | | $ | 463,987 |
5. Components of Net Assets on a Tax Basis
As of November 30, 2011, the components of net assets on a tax basis were as follows:
| Shares of beneficial interest | | $ | 13,602,854 |
| Undistributed long-term capital gain | | | 107,111 |
| Unrealized appreciation of investments | | | 1,942,899 |
| Net assets | | $ | 15,652,864 |
The differences between book basis and tax basis components of net assets are primarily attributable to tax deferral of losses on wash sales.
29
Notes to financial statements
Delaware Focus Global Growth Fund
5. Components of Net Assets on a Tax Basis (continued)
For financial reporting purposes, capital accounts are adjusted to reflect the tax character of permanent book/tax differences. Reclassifications are primarily due to tax treatment of gain (loss) on foreign currency transactions. Results of operations and net assets were not affected by these reclassifications. For the year ended November 30, 2011, the Fund recorded the following reclassifications.
| Paid-in capital | $ | (17,475 | ) |
| Undistributed net investment loss | | (4,606 | ) |
| Accumulated net realized gain | | 22,081 | |
6. Capital Shares
Transactions in capital shares were as follows:
| | Year Ended |
| | 11/30/11 | | | 11/30/10 |
| Shares sold: | | | | | | |
| Class A | | 435,652 | | | 211 | |
| Class C* | | 4,923 | | | — | |
| Class R* | | 359 | | | — | |
| Institutional Class | | 207,834 | | | 142,041 | |
| |
| Shares issued upon reinvestment of dividends and distributions: | | | | | | |
| Class A | | 3,663 | | | 14,704 | |
| Institutional Class | | 10,734 | | | 19,207 | |
| | | 663,165 | | | 176,163 | |
| Shares repurchased: | | | | | | |
| Class A | | (21,250 | ) | | (39,352 | ) |
| Institutional Class | | (39,695 | ) | | — | |
| | | (60,945 | ) | | (39,352 | ) |
| Net increase | | 602,220 | | | 136,811 | |
*Class C and Class R commenced operations on December 29, 2010.
7. Line of Credit
The Fund, along with certain other funds in the Delaware Investments® Family of Funds (Participants), was a participant in a $50,000,000 revolving line of credit to be used for temporary or emergency purposes as an additional source of liquidity to fund redemptions of investor shares. Under the agreement, the Participants were charged an annual commitment fee, which was allocated across the Participants on the basis of each Participant’s allocation of the entire facility. The Participants were permitted to borrow up to a maximum of one third of their net assets under the agreement. The line of credit expired on November 15, 2011.
30
On November 15, 2011, the Fund, along with the other Participants, entered into an agreement for a $125,000,000 revolving line of credit. The agreement is to be used as described above and operates in substantially the same manner as the original agreement. The agreement expires on November 13, 2012. The Fund had no amounts outstanding as of November 30, 2011 or at any time during the year then ended.
8. Derivatives
U.S. GAAP requires disclosures that enable investors to understand: 1) how and why an entity uses derivatives, 2) how they are accounted for, and 3) how they affect an entity’s results of operations and financial position.
Foreign Currency Exchange Contracts — The Fund may enter into foreign currency exchange contracts as a way of managing foreign exchange rate risk. The Fund may enter into these contracts to fix the U.S. dollar value of a security that it has agreed to buy or sell for the period between the date the trade was entered into and the date the security is delivered and paid for. The Fund may also use these contracts to hedge the U.S. dollar value of securities it already owns that are denominated in foreign currencies. The change in value is recorded as an unrealized gain or loss. When the contract is closed, a realized gain or loss is recorded equal to the difference between the value of the contract at the time it was opened and the value at the time it was closed.
The use of foreign currency exchange contracts does not eliminate fluctuations in the underlying prices of the securities, but does establish a rate of exchange that can be achieved in the future. Although foreign currency exchange contracts limit the risk of loss due to an unfavorable change in the value of the hedged currency, they also limit any potential gain that might result should the value of the currency change favorably. In addition, the Fund could be exposed to risks if the counterparties to the contracts are unable to meet the terms of their contracts. The Fund’s maximum risk of loss from counterparty credit risk is the value of its currency exchanged with the counterparty. The risk is generally mitigated by having a netting arrangement between the Fund and the counterparty and by the posting of collateral by the counterparty to the Fund to cover the Fund’s exposure to the counterparty. No foreign currency exchange contracts were outstanding at November 30, 2011.
Derivatives Generally. The table below summarizes the average balance of derivative holdings by the Fund during the year ended November 30, 2011. The average balance of derivatives held is generally similar to the volume of derivative activity for the year ended November 30, 2011.
| | Asset Derivative | | Liability Derivative |
| | | Volume | | Volume |
| Forward foreign currency contracts (average cost) | | $9,779 | | $2,320 |
31
Notes to financial statements
Delaware Focus Global Growth Fund
9. Securities Lending
The Fund, along with other funds in the Delaware Investments® Family of Funds, may lend its securities pursuant to a security lending agreement (Lending Agreement) with The Bank of New York Mellon (BNY Mellon). At the time a security is loaned, the borrower must post collateral equal to the required percentage of the market value of the loaned security, including any accrued interest. The required percentage is: (i) 102% with respect to U.S. securities and foreign securities that are denominated and payable in U.S. dollars; and (ii) 105% with respect to foreign securities. With respect to each loan, if on any business day the aggregate market value of securities collateral plus cash collateral held is less than the aggregate market value of the securities which are the subject of such loan, the borrower will be notified to provide additional collateral by the end of the following business day which, together with the collateral already held, will be not less than the applicable initial collateral requirements for such security loan. If the aggregate market value of securities collateral and cash collateral held with respect to a security loan exceeds the applicable initial collateral requirement, upon request of the borrower BNY Mellon must return enough collateral to the borrower by the end of the following business day to reduce the value of the remaining collateral to the applicable initial collateral requirement for such security loan. As a result of the foregoing, the value of the collateral held with respect to a loaned security may be temporarily more or less than the value of security on loan.
Cash collateral received is generally invested in the Delaware Investments Collateral Fund No. 1 (Collective Trust) established by BNY Mellon for the purpose of investment on behalf of funds managed by DMC that participate in BNY Mellon’s securities lending program. The Collective Trust may invest in U.S. government securities and high quality corporate debt, asset-backed and other money market securities and in repurchase agreements collateralized by such securities, provided that the Collective Trust will generally have a dollar-weighted average portfolio maturity of 60 days or less. The Collective Trust seeks to maintain a net asset value per unit of $1.00, but there can be no assurance that it will always be able to do so. The Fund may incur investment losses as a result of investing securities lending collateral in the Collective Trust. This could occur if an investment in the Collective Trust defaulted or if it were necessary to liquidate assets in the Collective Trust to meet returns on outstanding security loans at a time when the Collective Trust’s net asset value per unit was less than $1.00. Under those circumstances, the Fund may not receive an amount from the Collective Trust that is equal in amount to the collateral the Fund would be required to return to the borrower of the securities and the Fund would be required to make up for this shortfall. The Fund can also accept U.S. government securities and letters of credit (non-cash collateral) in connection with securities loans. In the event of default or bankruptcy by the lending agent, realization and/or retention of the collateral may be subject to legal proceedings. In the event the borrower fails to return loaned securities and the collateral received is insufficient to cover the value of the loaned securities and provided such collateral shortfall is not the result of investment losses, the lending agent has agreed to pay the amount of the shortfall to the Fund, or at the discretion of the lending agent, replace the loaned securities. The Fund continues to record dividends or interest, as applicable, on the securities loaned and is subject to change in value of the securities loaned that may occur during the term of the loan. The Fund has the right under
32
the Lending Agreement to recover the securities from the borrower on demand. With respect to security loans collateralized by non-cash collateral, the Fund receives loan premiums paid by the borrower. With respect to security loans collateralized by cash collateral, the earnings from the collateral investments are shared among the Fund, the security lending agent and the borrower. The Fund records security lending income net of allocations to the security lending agent and the borrower. The Fund had no securities out on loan as of November 30, 2011.
10. Credit and Market Risk
Some countries in which the Fund may invest require governmental approval for the repatriation of investment income, capital or the proceeds of sales of securities by foreign investors. In addition, if there is deterioration in a country’s balance of payments or for other reasons, a country may impose temporary restrictions on foreign capital remittances abroad.
The securities exchanges of certain foreign markets are substantially smaller, less liquid and more volatile than the major securities markets in the United States. Consequently, acquisition and disposition of securities by the Fund may be inhibited. In addition, a significant portion of the aggregate market value of equity securities listed on the major securities exchanges in emerging markets are held by a smaller number of investors. This may limit the number of shares available for acquisition or disposition by the Fund.
The Fund may invest up to 15% of its net assets in illiquid securities, which may include securities with contractual restrictions on resale, securities exempt from registration under Rule 144A of the Securities Act of 1933, as amended, and other securities which may not be readily marketable. The relative illiquidity of these securities may impair the Fund from disposing of them in a timely manner and at a fair price when it is necessary or desirable to do so. While maintaining oversight, the Fund’s Board has delegated to DMC the day-to-day functions of determining whether individual securities are liquid for purposes of the Fund’s limitation on investments in illiquid securities. Securities eligible for resale pursuant to Rule 144A, which are determined to be liquid, are not subject to the Fund’s 15% limit on investments in illiquid securities. As of November 30, 2011, there were no Rule 144A securities and no securities have been determined to be illiquid under the Fund’s Liquidity Procedures.
11. Contractual Obligations
The Fund enters into contracts in the normal course of business that contain a variety of indemnifications. The Fund’s maximum exposure under these arrangements is unknown. However, the Fund has not had prior claims or losses pursuant to these contracts. Management has reviewed the Fund’s existing contracts and expects the risk of loss to be remote.
12. Subsequent Events
Management has determined that no material events or transactions occurred subsequent to November 30, 2011 that would require recognition or disclosure in the Fund’s financial statements.
33
Notes to financial statements
Delaware Focus Global Growth Fund
13. Tax Information (Unaudited)
The information set forth below is for the Fund’s fiscal year as required by federal laws. Shareholders, however, must report distributions on a calendar year basis for income tax purposes, which may include distributions for portions of two fiscal years of a fund. Accordingly, the information needed by shareholders for income tax purposes will be sent to them in January of each year. Please consult your tax advisor for proper treatment of the information. All designations are based on financial information available as of the date of this annual report and, accordingly are subject to change. For any and all items requiring designation, it is the intention of the Fund to designate the maximum amount permitted under the Internal Revenue Code and the regulations thereunder.
For the fiscal year ended November 30, 2011, the Fund designates distributions paid during the year as follows:
| (A) Long-Term Capital Gain Distribution (Tax Basis)* | 62.40% |
| (B) Ordinary Income Distributions (Tax Basis)* | 37.60% |
| Total Distributions (Tax Basis) | 100.00% |
| (C) Qualifying Dividends1 | 100.00% |
(A) and (B) are based on a percentage of the Fund’s total distributions.
(C) is based on a percentage of the Fund’s ordinary income distributions.
1Qualifying dividends represent dividends which qualify for the corporate dividends received deduction.
*For the fiscal year ended November 30, 2011, certain dividends paid by the Fund may be subject to a maximum tax rate of 15%, as provided for by the Jobs and Growth Tax Relief Reconciliation Act of 2003 and as extended by Tax Relief, Unemployment Insurance Reauthorization and Jobs Creation Act of 2010. The Fund intends to designate up to a maximum amount of $85,591 to be taxed at a maximum rate of 15%. Complete information will be computed and reported in conjunction with your 2011 Form 1099-DIV.
34
Report of independent
registered public accounting firm
To the Board of Trustees of Delaware Group Global & International Funds
and Shareholders of Delaware Focus Global Growth Fund:
In our opinion, the accompanying statement of net assets and the related statements of operations and of changes in net assets and the financial highlights present fairly, in all material respects, the financial position of Delaware Focus Global Growth Fund (one of the series constituting Delaware Group Global & International Funds, hereafter referred to as the “Fund”) at November 30, 2011, the results of its operations for the year then ended, the changes in its net assets for each of the two years in the period then ended and the financial highlights for each of the two periods ended November 30, 2011, in conformity with accounting principles generally accepted in the United States of America. These financial statements and financial highlights (hereafter referred to as “financial statements”) are the responsibility of the Fund’s management; our responsibility is to express an opinion on these financial statements based on our audits. We conducted our audits of these financial statements in accordance with the standards of the Public Company Accounting Oversight Board (United States). Those standards require that we plan and perform the audit to obtain reasonable assurance about whether the financial statements are free of material misstatement. An audit includes examining, on a test basis, evidence supporting the amounts and disclosures in the financial statements, assessing the accounting principles used and significant estimates made by management, and evaluating the overall financial statement presentation. We believe that our audits, which included confirmation of securities at November 30, 2011 by correspondence with the custodian and brokers, provide a reasonable basis for our opinion. The financial highlights for the period December 29, 2008 (commencement of operations) through November 30, 2009 were audited by other independent accountants whose report dated January 21, 2010 expressed an unqualified opinion on those statements.
PricewaterhouseCoopers LLP
Philadelphia, Pennsylvania
January 23, 2012
35
Other Fund information
(Unaudited)
Delaware Focus Global Growth Fund
Board Consideration of Delaware Focus Global Growth Fund Investment Advisory Agreement
At a meeting held on August 16-17, 2011 (the “Annual Meeting”), the Board of Trustees (the “Board”), including a majority of disinterested or independent Trustees, approved the renewal of the Investment Advisory Agreement for the Delaware Focus Global Growth Fund (the “Fund”). In making its decision, the Board considered information furnished specifically in connection with the renewal of the Investment Advisory Agreement with Delaware Management Company (“DMC”), which included materials provided by DMC and its affiliates (“Delaware Investments”) concerning, among other things, the nature, extent and quality of services provided to the Fund, the costs of such services to the Fund, economies of scale and the financial condition and profitability of Delaware Investments. In addition, in connection with the Annual Meeting, reports were provided in May 2011 and included independent historical and comparative reports provided by Lipper, Inc., an independent statistical compilation organization (“Lipper”). The Lipper reports compared the Fund’s investment performance and expenses with those of other comparable mutual funds. The independent Trustees reviewed and discussed the Lipper reports with independent legal counsel to the independent Trustees. The Board requested and received information regarding DMC’s policy with respect to advisory fee levels and its breakpoint philosophy; the structure of portfolio manager compensation; the investment manager’s profitability; and any constraints or limitations on the availability of securities in certain investment styles, which had in the past year inhibited, or which were likely in the future to inhibit, DMC’s ability to invest fully in accordance with Fund policies.
In considering information relating to the approval of the Fund’s advisory agreement, the independent Trustees received assistance and advice from and met separately with independent legal counsel to the independent Trustees. Although the Board gave attention to all information furnished, the following discussion identifies, under separate headings, the primary factors taken into account by the Board during its contract renewal considerations.
Nature, Extent and Quality of Service. The Board considered the services provided by Delaware Investments to the Fund and its shareholders. In reviewing the nature, extent and quality of services, the Board considered reports furnished to it throughout the year, which covered matters such as the relative performance of the Fund, compliance of portfolio managers with the investment policies, strategies and restrictions for the Fund, compliance by DMC and Delaware Distributors, L.P. (together, “Management”) personnel with the Code of Ethics adopted throughout the Delaware Investments® Family of Funds complex and adherence to fair value pricing procedures as established by the Board. The Board was pleased with the current staffing of the Fund’s investment advisor and the emphasis placed on research in the investment process. The Board gave favorable consideration to DMC’s efforts to control expenditures while maintaining service levels committed to fund matters. The Board noted that in July 2011 Management implemented measures to reduce overall costs and improve transfer agent and shareholder servicing functions through outsourcing. It is expected that such measures will improve the quality and lower the cost of delivering transfer agent and shareholder servicing services to the Fund. The Board once again noted the benefits provided to Fund shareholders
36
through each shareholder’s ability to exchange an investment in one Delaware Investments® fund for the same class of shares in another Delaware Investments fund without a sales charge, to reinvest Fund dividends into additional shares of the Fund or into additional shares of other Delaware Investments funds and the privilege to combine holdings in other Delaware Investments funds to obtain a reduced sales charge. The Board was satisfied with the nature, extent and quality of the overall services provided by Delaware Investments.
Investment Performance. The Board placed significant emphasis on the investment performance of the Fund in view of its importance to shareholders. Although the Board gave appropriate consideration to performance reports and discussions with portfolio managers at Investment Committee meetings throughout the year, the Board gave particular weight to the Lipper reports furnished for the Annual Meeting. The Lipper reports prepared for the Fund showed the investment performance of its Class A shares in comparison to a group of similar funds as selected by Lipper (the “Performance Universe”). A fund with the best performance ranked first, and a fund with the poorest performance ranked last. The highest/best performing 25% of funds in the Performance Universe make up the first quartile; the next 25%, the second quartile; the next 25%, the third quartile; and the poorest/worst performing 25% of funds in the Performance Universe make up the fourth quartile. Comparative annualized performance for the Fund was shown for the past one-, three-, five- and ten-year periods, as applicable, ended March 31, 2011. The Board’s objective is that the Fund’s performance for the periods considered be at or above the median of its Performance Universe. The following paragraph summarizes the performance results for the Fund and the Board’s view of such performance.
The Performance Universe for the Fund consisted of the Fund and all retail and institutional global multi-cap growth funds as selected by Lipper. The Lipper report comparison showed that the Fund’s total return for the one-year period was in the first quartile of its Performance Universe. The Board was satisfied with performance.
Comparative Expenses. The Board considered expense comparison data for the Delaware Investments Family of Funds. Management provided the Board with information on pricing levels and fee structures for the Fund as of its most recently completed fiscal year. The Board also focused on the comparative analysis of effective management fees and total expense ratios of the Fund versus effective management fees and expense ratios of a group of similar funds as selected by Lipper (the “Expense Group”). In reviewing comparative costs, the Fund’s contractual management fee and the actual management fee incurred by the Fund were compared with the contractual management fees (assuming all funds in the Expense Group were similar in size to the Fund) and actual management fees (as reported by each fund) within the Expense Group, taking into account any applicable breakpoints and fee waivers. The Fund’s total expenses were also compared with those of its Expense Group. The Lipper total expenses, for comparative consistency, were shown by Lipper for Class A shares and comparative total expenses including 12b-1 and non 12b-1 service fees. The Board considered fees paid to Delaware Investments for non-management services. The Board’s objective is to limit the Fund’s total expense ratio to be competitive with that of the Expense Group. The following paragraph summarizes the expense results for the Fund and the Board’s view of such expenses.
37
Other Fund information
(Unaudited)
Delaware Focus Global Growth Fund
Board Consideration of Delaware Focus Global Growth Fund Investment Advisory Agreement (continued)
The expense comparisons for the Fund showed that its actual management fee and total expenses were in the quartile with the lowest expenses of its Expense Group. The Board was satisfied with the management fee and total expenses of the Fund in comparison to those of its Expense Group as shown in the Lipper report.
Management Profitability. The Board considered the level of profits realized by Delaware Investments in connection with the operation of the Fund. In this respect, the Board reviewed the Investment Management Profitability Analysis that addressed the overall profitability of Delaware Investments’ business in providing management and other services to each of the individual funds and the Delaware Investments® Family of Funds as a whole. Specific attention was given to the methodology followed in allocating costs for the purpose of determining profitability. Management stated that the level of profits of Delaware Investments, to a certain extent, reflect recent operational cost savings and efficiencies initiated by Delaware Investments. The Board considered Delaware Investments’ efforts to improve services provided to fund shareholders and to meet additional regulatory and compliance requirements resulting from recent industry-wide Securities and Exchange Commission initiatives. The Board also considered the extent to which Delaware Investments might derive ancillary benefits from fund operations, including the potential for procuring additional business as a result of the prestige and visibility associated with its role as service provider to the Delaware Investments Family of Funds and the benefits from allocation of fund brokerage to improve trading efficiencies. The Board found that the management fees were reasonable in light of the services rendered and the level of profitability of Delaware Investments.
Economies of Scale. The Trustees considered whether economies of scale are realized by Delaware Investments as the Fund’s assets increase and the extent to which any economies of scale are reflected in the level of management fees charged. The Trustees reviewed the standardized advisory fee pricing and structure, approved by the Board and shareholders, which includes breakpoints. Breakpoints in the advisory fee occur when the advisory fee rate is reduced on assets in excess of specified levels. Breakpoints result in a lower advisory fee than would otherwise be the case on all assets when the asset levels specified are exceeded. The Board noted that the fee under the Fund’s management contract fell within the standard structure. Although the Fund has not reached a size at which it can take advantage of breakpoints, the Board recognized that the fee was structured so that when the Fund grows, economies of scale may be shared.
38
Change in Independent Registered Public Accounting Firm
Due to independence matters under the Securities and Exchange Commission’s auditor independence rules relating to the January 4, 2010 acquisition of Delaware Investments (including DMC, DDLP and DSC) by Macquarie Group, Ernst & Young LLP (E&Y) has resigned as the independent registered public accounting firm for Delaware Group® Global & International Funds (the Trust) effective May 20, 2010. At a meeting held on May 20, 2010, the Board of Trustees of the Trust, upon recommendation of the Audit Committee, selected PricewaterhouseCoopers LLP (PwC) to serve as the independent registered public accounting firm for the Trust for the fiscal year ending November 30, 2010. During the fiscal year ended November 30, 2009, E&Y’s audit reports on the financial statements of the Trust did not contain any adverse opinion or disclaimer of opinion, nor were they qualified or modified as to uncertainty, audit scope, or accounting principles. In addition, there were no disagreements between the Trust and E&Y on accounting principles, financial statements disclosures or audit scope, which, if not resolved to the satisfaction of E&Y, would have caused them to make reference to the disagreement in their reports. Neither the Trust nor anyone on its behalf has consulted with PwC at any time prior to their selection with respect to the application of accounting principles to a specified transaction, either completed or proposed, or the type of audit opinion that might be rendered on the Trust’s financial statements.
39
Board of trustees/directors and officers addendum
Delaware Investments® Family of Funds
A mutual fund is governed by a Board of Trustees/Directors (“Trustees”), which has oversight responsibility for the management of a fund’s business affairs. Trustees establish procedures and oversee and review the performance of the investment manager, the distributor, and others who perform services for the fund. The independent fund trustees, in particular, are advocates
| Name, Address, | | Position(s) | | Length of |
| and Birth Date | | Held with Fund(s) | | Time Served |
| Interested Trustees | | | | |
| | | | | |
| Patrick P. Coyne1 | | Chairman, President, | | Chairman and Trustee |
| 2005 Market Street | | Chief Executive Officer, | | since August 16, 2006 |
| Philadelphia, PA 19103 | | and Trustee | | |
| April 1963 | | | | President and |
| | | | | Chief Executive Officer |
| | | | | since August 1, 2006 |
| | | | | |
| | | | | |
| | | | | |
| | | | | |
| | | | | |
| | | | | |
| | | | | |
| | | | | |
| | | | | |
| | | | | |
| | | | | |
| | | | | |
| | | | | |
| | | | | |
| | | | | |
| | | | | |
| | | | | |
| | | | | |
1 Patrick P. Coyne is considered to be an “Interested Trustee” because he is an executive officer of the Fund’s(s’) investment advisor.
40
for shareholder interests. Each trustee has served in that capacity since he or she was elected to or appointed to the Board of Trustees, and will continue to serve until his or her retirement or the election of a new trustee in his or her place. The following is a list of the Trustees and Officers with certain background and related information.
| | Number of Portfolios in | | |
| Principal Occupation(s) | | Fund Complex Overseen | | Other Directorships |
| During Past 5 Years | | by Trustee or Officer | | Held by Trustee or Officer |
| |
| |
| Patrick P. Coyne has served in | | 74 | | Director and Audit |
| various executive capacities | | | | Committee Member |
| at different times at | | | | Kaydon Corp. |
| Delaware Investments.2 | | | | |
| | | | Board of Governors Member |
| | | | Investment Company |
| | | | Institute (ICI) |
| |
| | | | Finance Committee Member |
| | | | St. John Vianney Roman |
| | | | Catholic Church |
| |
| | | | Board of Trustees |
| | | | Agnes Irwin School |
| |
| | | | Member of Investment |
| | | | Committee |
| | | | Cradle of Liberty Council, |
| | | | BSA |
| | | | (2007–2010) |
| | | | |
| | | | |
| | | | |
2 Delaware Investments is the marketing name for Delaware Management Holdings, Inc. and its subsidiaries, including the Fund’s(s’) investment advisor, principal underwriter, and its transfer agent.
41
Board of trustees/directors and officers addendum
Delaware Investments® Family of Funds
| Name, Address, | | Position(s) | | Length of |
| and Birth Date | | Held with Fund(s) | | Time Served |
| Independent Trustees | | | | |
| |
| Thomas L. Bennett | | Trustee | | Since March 2005 |
| 2005 Market Street | | | | |
| Philadelphia, PA 19103 | | | | |
| October 1947 | | | | |
| |
| |
| |
| |
| |
| |
| |
| |
| |
| |
| |
| John A. Fry | | Trustee | | Since January 2001 |
| 2005 Market Street | | | | |
| Philadelphia, PA 19103 | | | | |
| May 1960 | | | | |
| |
| |
| |
| |
| |
| |
| |
| |
| |
| |
| |
| Anthony D. Knerr | | Trustee | | Since April 1990 |
| 2005 Market Street | | | | |
| Philadelphia, PA 19103 | | | | |
| December 1938 | | | | |
| |
| Lucinda S. Landreth | | Trustee | | Since March 2005 |
| 2005 Market Street | | | | |
| Philadelphia, PA 19103 | | | | |
| June 1947 | | | | |
| |
42
| | | Number of Portfolios in | | |
| Principal Occupation(s) | | Fund Complex Overseen | | Other Directorships |
| During Past 5 Years | | by Trustee or Officer | | Held by Trustee or Officer |
| | | | | |
| |
| Private Investor | | 74 | | Chairman of Investment |
| (March 2004–Present) | | | | Committee |
| | | | Pennsylvania Academy of |
| Investment Manager | | | | Fine Arts |
| Morgan Stanley & Co. | | | | |
| (January 1984–March 2004) | | | | Investment Committee and |
| | | | | Governance Committee |
| | | | | Member |
| | | | | Pennsylvania Horticultural |
| | | | | Society |
| | | | | |
| | | | | Director |
| | | | | Bryn Mawr Bank Corp. (BMTC) |
| | | | | (2007–2011) |
| |
| President | | 74 | | Board of Governors Member — |
| Drexel University | | | | NASDAQ OMX PHLX LLC |
| (August 2010–Present) | | | | |
| | | | | Director and Audit |
| President | | | | Committee Member |
| Franklin & Marshall College | | | | Community Health Systems |
| (July 2002–July 2010) | | | | |
| | | | | Director — Ecore |
| | | | International |
| | | | (2009–2010) |
| | | | |
| | | | Director — Allied |
| | | | Barton Securities Holdings |
| | | | (2005–2008) |
| |
| Managing Director | | 74 | | None |
| Anthony Knerr & Associates | | | | |
| (Strategic Consulting) | | | | |
| (1990–Present) | | | | |
| |
| Chief Investment Officer | | 74 | | None |
| Assurant, Inc. (Insurance) | | | | |
| (2002–2004) | | | | |
| | | | | |
| |
43
Board of trustees/directors and officers addendum
Delaware Investments® Family of Funds
| Name, Address, | | Position(s) | | Length of |
| and Birth Date | | Held with Fund(s) | | Time Served |
| Independent Trustees (continued) | | | | |
| |
| Ann R. Leven | | Trustee | | Since October 1989 |
| 2005 Market Street | | | | |
| Philadelphia, PA 19103 | | | | |
| November 1940 | | | | |
| |
| |
| |
| |
| |
| |
| |
| Frances A. Sevilla-Sacasa | | Trustee | | Since September 2011 |
| 2005 Market Street | | | | |
| Philadelphia, PA 19103 | | | | |
| January 1956 | | | | |
| |
| |
| |
| |
| |
| |
| |
| |
| |
| |
| |
| |
| |
| |
| |
| |
| |
| |
| |
| |
| |
| |
| |
| |
| |
| |
| |
44
| | Number of Portfolios in | | |
| Principal Occupation(s) | | Fund Complex Overseen | | Other Directorships |
| During Past 5 Years | | by Trustee or Officer | | Held by Trustee or Officer |
| |
| |
| Consultant | | 74 | | Director and Audit |
| ARL Associates | | | | Committee Chair |
| (Financial Planning) | | | | Systemax Inc. |
| (1983–Present) | | | | (2001–2009) |
| |
| | | | Director and Audit |
| | | | Committee Chairperson |
| | | | Andy Warhol Foundation |
| | | | (1999–2007) |
| | | | |
| Executive Advisor to Dean | | 74 | | Trust Manager — Camden |
| (since August 2011) and | | | | Property Trust |
| Interim Dean | | | | (since August 2011) |
| (January 2011–July 2011) — | | | | |
| University of Miami School of | | | | Board of Trustees |
| Business Administration | | | | Thunderbird School of |
| | | | | Global Management |
| President — U.S. Trust, | | | | (2007–2011) |
| Bank of America Private | | | | |
| Wealth Management | | | | Board of Trustees |
| (Private Banking) | | | | Carrollton School of the |
| (July 2007–December 2008) | | | | Sacred Heart |
| | | | | (since 2007) |
| President and Director | | | | |
| (November 2005–June 2007) and | | | | Board Member |
| Chief Executive Officer | | | | Foreign Policy Association |
| (April 2007–June 2007) — | | | | (since 2006) |
| U.S. Trust Company | | | | |
| (Private Banking) | | | | Board of Trustees |
| | | | Georgetown Preparatory School |
| | | | (2005–2011) |
| |
| | | | Board of Trustees |
| | | | Miami City Ballet |
| | | | (2000–2011) |
| |
| | | | Board of Trustees |
| | | | St. Thomas University |
| | | | (2005–2011) |
| | | | |
45
Board of trustees/directors and officers addendum
Delaware Investments® Family of Funds
| Name, Address, | | Position(s) | | Length of |
| and Birth Date | | Held with Fund(s) | | Time Served |
| Independent Trustees (continued) | | | | |
| |
| Janet L. Yeomans | | Trustee | | Since April 1999 |
| 2005 Market Street | | | | |
| Philadelphia, PA 19103 | | | | |
| July 1948 | | | | |
| |
| |
| |
| |
| J. Richard Zecher | | Trustee | | Since March 2005 |
| 2005 Market Street | | | | |
| Philadelphia, PA 19103 | | | | |
| July 1940 | | | | |
| |
| |
| | | | | |
| | | | | |
| | | | | |
| | | | | |
| | | | | |
| | | | | |
| | | | | |
| | | | | |
| | | | | |
| | | | | |
| | | | | |
| | | | | |
| | | | | |
| | | | | |
| |
46
| | Number of Portfolios in | | |
| Principal Occupation(s) | | Fund Complex Overseen | | Other Directorships |
| During Past 5 Years | | by Trustee or Officer | | Held by Trustee or Officer |
| |
| |
| Vice President and Treasurer | | 74 | | Director and Audit |
| (January 2006–Present) | | | | Committee Member |
| Vice President — Mergers & Acquisitions | | | | Okabena Company |
| (January 2003–January 2006), and | | | | |
| Vice President and Treasurer | | | | Chair — 3M |
| (July 1995–January 2003) | | | | Investment Management |
| 3M Corporation | | | | Company |
| | | | |
| Founder | | 74 | | Director and Audit |
| Investor Analytics | | | | Committee Member |
| (Risk Management) | | | | Investor Analytics |
| (May 1999–Present) | | | | |
| | | | | Director |
| Founder | | | | Oxigene, Inc. |
| Sutton Asset Management | | | | (2003–2008) |
| (Hedge Fund) | | | | |
| (September 1996–Present) | | | | |
| | | | | |
| | | | | |
| | | | | |
| | | | | |
| | | | | |
| | | | | |
| | | | | |
| | | | | |
| | | | | |
| | | | | |
| | | | | |
| | | | | |
47
Board of trustees/directors and officers addendum
Delaware Investments® Family of Funds
| Name, Address, | | Position(s) | | Length of |
| and Birth Date | | Held with Fund(s) | | Time Served |
| Officers | | | | |
| | | | | |
| David F. Connor | | Vice President, | | Vice President since |
| 2005 Market Street | | Deputy General | | September 2000 |
| Philadelphia, PA 19103 | | Counsel, and Secretary | | and Secretary since |
| December 1963 | | | | October 2005 |
| |
| |
| Daniel V. Geatens | | Vice President | | Treasurer |
| 2005 Market Street | | and Treasurer | | since October 2007 |
| Philadelphia, PA 19103 | | | | |
| October 1972 | | | | |
| |
| David P. O’Connor | | Senior Vice President, | | Senior Vice President, |
| 2005 Market Street | | General Counsel, | | General Counsel, and |
| Philadelphia, PA 19103 | | and Chief Legal Officer | | Chief Legal Officer |
| February 1966 | | | | since October 2005 |
| |
| Richard Salus | | Senior Vice President | | Chief Financial Officer |
| 2005 Market Street | | and Chief Financial Officer | | since November 2006 |
| Philadelphia, PA 19103 | | | | |
| October 1963 | | | | |
| |
The Statement of Additional Information for the Fund(s) includes additional information about the Trustees and Officers and is available, without charge, upon request by calling 800 523-1918.
48
| | Number of Portfolios in | | |
| Principal Occupation(s) | | Fund Complex Overseen | | Other Directorships |
| During Past 5 Years | | by Trustee or Officer | | Held by Trustee or Officer |
| |
| |
| David F. Connor has served as | | 74 | | None3 |
| Vice President and Deputy | | | | |
| General Counsel of | | | | |
| Delaware Investments | | | | |
| since 2000. | | | | |
| |
| Daniel V. Geatens has served | | 74 | | None3 |
| in various capacities at | | | | |
| different times at | | | | |
| Delaware Investments. | | | | |
| |
| David P. O’Connor has served in | | 74 | | None3 |
| various executive and legal | | | | |
| capacities at different times | | | | |
| at Delaware Investments. | | | | |
| |
| Richard Salus has served in | | 74 | | None3 |
| various executive capacities | | | | |
| at different times at | | | | |
| Delaware Investments. | | | | |
| |
3 David F. Connor, Daniel V. Geatens, David P. O’Connor, and Richard Salus serve in similar capacities for the six portfolios of the Optimum Fund Trust, which have the same investment advisor, principal underwriter, and transfer agent as the registrant.
49
About the organization
| Board of trustees |
Patrick P. Coyne
Chairman, President, and
Chief Executive Officer
Delaware Investments®
Family of Funds
Philadelphia, PA Thomas L. Bennett
Private Investor
Rosemont, PA John A. Fry
President
Drexel University
Philadelphia, PA | Anthony D. Knerr
Founder and Managing
Director
Anthony Knerr &
Associates
New York, NY Lucinda S. Landreth
Former Chief Investment
Officer
Assurant, Inc.
Philadelphia, PA | Ann R. Leven
Consultant
ARL Associates
New York, NY Frances A. Sevilla-Sacasa
Executive Advisor to Dean, University of Miami School of Business Administration Coral Gables, FL | Janet L. Yeomans
Vice President and
Treasurer
3M Corporation
St. Paul, MN J. Richard Zecher
Founder
Investor Analytics
Scottsdale, AZ |
| | | | |
| Affiliated officers |
David F. Connor
Vice President, Deputy
General Counsel, and
Secretary
Delaware Investments
Family of Funds
Philadelphia, PA | Daniel V. Geatens
Vice President and
Treasurer
Delaware Investments
Family of Funds
Philadelphia, PA | David P. O’Connor
Senior Vice President,
General Counsel,
and Chief Legal Officer
Delaware Investments
Family of Funds
Philadelphia, PA | Richard Salus
Senior Vice President and
Chief Financial Officer
Delaware Investments
Family of Funds
Philadelphia, PA |
| This annual report is for the information of Delaware Focus Global Growth Fund shareholders, but it may be used with prospective investors when preceded or accompanied by the Delaware Investments Fund fact sheet for the most recently completed calendar quarter. These documents are available at www.delawareinvestments.com. |
| Delaware Investments is the marketing name of Delaware Management Holdings, Inc. and its subsidiaries. |
The Fund files its complete schedule of portfolio holdings with the Securities and Exchange Commission (SEC) for the first and third quarters of each fiscal year on Form N-Q. The Fund’s Forms N-Q, as well as a description of the policies and procedures that the Fund uses to determine how to vote proxies (if any) relating to portfolio securities are available without charge (i) upon request, by calling 800 523-1918; and (ii) on the SEC’s website at www.sec.gov. In addition, a description of the policies and procedures that the Fund uses to determine how to vote proxies (if any) relating to portfolio securities and the Fund’s Schedule of Investments are available without charge on the Fund’s website at www.delawareinvestments.com. The Fund’s Forms N-Q may be reviewed and copied at the SEC’s Public Reference Room in Washington, D.C.; information on the operation of the Public Reference Room may be obtained by calling 800 SEC-0330.
Information (if any) regarding how the Fund voted proxies relating to portfolio securities during the most recently disclosed 12-month period ended June 30 is available without charge (i) through the Funds’ website at www.delawareinvestments.com; and (ii) on the SEC’s website at www.sec.gov.
50
Annual report Delaware Macquarie Global Infrastructure Fund November 30, 2011 Alternative / specialty mutual fund |
| Carefully consider the Fund’s investment objectives, risk factors, charges, and expenses before investing. This and other information can be found in the Fund’s prospectus and, if available, its summary prospectus, which may be obtained by visiting www.delawareinvestments.com or calling 800 523-1918. Investors should read the prospectus and, if available, the summary prospectus carefully before investing. |
You can obtain shareholder reports and prospectuses online instead of in the mail.
Visit www.delawareinvestments.com/edelivery. |
Experience Delaware Investments
Delaware Investments is committed to the pursuit of consistently superior asset management and unparalleled client service. We believe in our investment processes, which seek to deliver consistent results, and in convenient services that help add value for our clients.
If you are interested in learning more about creating an investment plan, contact your financial advisor.
You can learn more about Delaware Investments or obtain a prospectus for Delaware Macquarie Global Infrastructure Fund at www.delawareinvestments.com.
Manage your investments online
- 24-hour access to your account information
- Obtain share prices
- Check your account balance and recent transactions
- Request statements or literature
- Make purchases and redemptions
Delaware Management Holdings, Inc. and its subsidiaries (collectively known by the marketing name of Delaware Investments) are wholly owned subsidiaries of Macquarie Group Limited, a global provider of banking, financial, advisory, investment and funds management services.
Investments in Delaware Macquarie Global Infrastructure Fund are not and will not be deposits with or liabilities of Macquarie Bank Limited ABN 46 008 583 542 and its holding companies, including their subsidiaries or related companies (Macquarie Group), and are subject to investment risk, including possible delays in repayment and loss of income and capital invested. No Macquarie Group company guarantees or will guarantee the performance of the Fund, the repayment of capital from the Fund, or any particular rate of return.
Table of contents | | |
| Portfolio management review | | 1 |
| Performance summary | | 3 |
| Disclosure of Fund expenses | | 6 |
| Security type/country and sector allocations | | 8 |
| Statement of net assets | | 9 |
| Statement of operations | | 14 |
| Statements of changes in net assets | | 16 |
| Financial highlights | | 18 |
| Notes to financial statements | | 26 |
| Report of independent registered | | |
| public accounting firm | | 37 |
| Other Fund information | | 38 |
| Board of trustees/directors and | | |
| officers addendum | | 42 |
| About the organization | | 52 |
Unless otherwise noted, views expressed herein are current as of Nov. 30, 2011, and subject to change.
Funds are not FDIC insured and are not guaranteed. It is possible to lose the principal amount invested.
Mutual fund advisory services provided by Delaware Management Company, a series of Delaware Management Business Trust, which is a registered investment advisor. Delaware Investments, a member of Macquarie Group, refers to Delaware Management Holdings, Inc. and its subsidiaries, including the Fund’s distributor, Delaware Distributors, L.P. Macquarie Group refers to Macquarie Group Limited and its subsidiaries and affiliates worldwide.
© 2012 Delaware Management Holdings, Inc.
All third-party trademarks cited are the property of their respective owners.
| Portfolio management review |
| Delaware Macquarie Global Infrastructure Fund | December 6, 2011 |
| Performance preview (for the year ended November 30, 2011) | | | | |
| Delaware Macquarie Global Infrastructure Fund (Class A shares) | | 1-year return | | +4.05% |
| S&P Global Infrastructure Index (benchmark) | | 1-year return | | +4.89% |
Past performance does not guarantee future results.
For complete, annualized performance for Delaware Macquarie Global Infrastructure Fund, please see the table on page 3. The performance of Class A shares excludes the applicable sales charge and reflects the reinvestment of all distributions.
Index performance returns do not reflect any management fees, transaction costs, or expenses. Indices are unmanaged and one cannot invest directly in an index. |
After a strong start, infrastructure stocks step back
As the Fund’s fiscal year got under way in December 2010, concerns about sovereign finances in the euro area dominated headlines, as did the decision by the U.S. Federal Reserve to provide a new round of monetary stimulus (the program, referred to generally as “QE2,” involved purchasing $600 billion of Treasury securities).
Moving into the first few months of 2011, global financial markets remained generally positive, though optimism about global economic growth became increasingly overshadowed by concerns that included: (1) political unrest in the Middle East, (2) a cloud of uncertainty about European sovereign debt, and (3) a devastating tsunami in Japan that caused large-scale loss of life, destruction of property, and a crisis at one of the country’s nuclear power plants.
As the year progressed, investor apprehension took hold in earnest during the summer of 2011 and continued through the end of the Fund’s fiscal year as markets around the world exhibited increased volatility (led by sharp declines in Europe). Overall, investor confidence oscillated as the European debt crisis established itself as a deeply rooted and persistent problem. Meanwhile, in the United States, central bankers announced a strategy to lower longer-term interest rates and provide specific support for the mortgage market. Signals of economic strength were in short supply around the globe; even reliable engines of growth — China, most notably — showed signs of slowing down.
Throughout the challenges faced by broad equity markets during the Fund’s fiscal year, global infrastructure assets (as measured by major indices that include the S&P Global Infrastructure Index), generally outperformed traditional equity asset classes.
Fund performance relative to the S&P Global Infrastructure Index
For the fiscal year ended Nov. 30, 2011, Delaware Macquarie Global Infrastructure Fund Class A shares returned +4.05% at net asset value and -1.95% at maximum offer price (both returns assume reinvestment of all distributions). The Fund’s benchmark, the S&P Global Infrastructure Index, advanced 4.89% for the same period. For complete, annualized performance of the Fund, please see the table on page 3.
1
Portfolio management review
Delaware Macquarie Global Infrastructure Fund
When comparing the Fund’s total return against that of its benchmark, the Fund’s underperformance is explained by the negative effects of allocation weights in certain infrastructure sectors. Looking at the oil-and-gas-storage-and-transportation segment, for instance, the Fund’s performance was hindered by an underweight allocation in what was one of the strongest-performing sectors within the benchmark. (Index constituents advanced by more than 30% within this segment.) Another example was seen in the marine port and services segment, where the Fund was overweight in a sector that underperformed the benchmark.
The underperformance attributable to allocation weights was offset somewhat by the positive effects of individual security selection. In the electric utilities sector, for instance, the Fund’s holdings recorded an advance of more than 8%, well ahead of index constituents, which fell by more than 2% for the Fund’s fiscal year. Examples of notable performers included Australia-based Spark Infrastructure Group and the American company ITC Holdings. Shares of Spark Infrastructure responded favorably to factors that included a reorganization of the company’s management, while ITC advanced as the company continued a long-running trend of posting well-received financials. (During the Fund’s fiscal year, ITC shares reached what we believed to be an appropriate selling price, and all shares were switched into stocks that we viewed as having greater upside potential.)
The airport services sector was another example in which the Fund’s holdings performed well relative to its benchmark. Notable contributors here included the Australia-based MAp Group, which simplified its structure and continued to deliver what investors generally viewed as solid operating performance.
Cautious optimism amid continued market uncertainty
In the coming months, resolution of the European sovereign debt crisis appears to us to be a prerequisite for markets to once again focus primarily on fundamentals. There are signs that policy makers are working hard to achieve satisfactory economic and political outcomes, but until the answers are clear, we believe that macroeconomic developments will likely spur significant volatility in asset prices.
At the same time, we generally expect infrastructure earnings to continue to be more resilient than earnings of the broader equity markets, based upon the essential service nature of infrastructure assets and their potential to better withstand weak economic conditions.
2
| Performance summary |
| Delaware Macquarie Global Infrastructure Fund | November 30, 2011 |
The performance data quoted represent past performance; past performance does not guarantee future results. Investment return and principal value will fluctuate so your shares, when redeemed, may be worth more or less than their original cost. Please obtain the performance data current for the most recent month end by calling 800 523-1918 or visiting our website at www.delawareinvestments.com/performance. Current performance may be lower or higher than the performance data quoted.
| Fund performance1,2 | Average annual total returns through Nov. 30, 2011 |
| 1 year | | Lifetime |
| Class A (Est. Jan. 19, 2010) | | | |
| Excluding sales charge | +4.05% | | +2.49% |
| Including sales charge | -1.95% | | -0.69% |
| Class C (Est. Jan. 19, 2010) | | | |
| Excluding sales charge | +3.15% | | +1.70% |
| Including sales charge | +2.15% | | +1.70% |
| Class R (Est. Jan. 19, 2010) | | | |
| Excluding sales charge | +3.69% | | +2.20% |
| Including sales charge | +3.69% | | +2.20% |
| Institutional Class (Est. Dec. 31, 2009) | | | |
| Excluding sales charge | +4.22% | | +4.04% |
| Including sales charge | +4.22% | | +4.04% |
1 Returns reflect the reinvestment of all distributions and are presented both with and without the applicable sales charges described below. Returns do not reflect the deduction of taxes the shareholder would pay on Fund distributions or redemptions of Fund shares.
Expense limitations were in effect for certain classes during some or all of the periods shown in the “Fund performance” chart. The current expenses for each class are listed on the “Fund expense ratios” table on page 4. Performance would have been lower had expense limitations not been in effect.
Class A shares are sold with a maximum front-end sales charge of up to 5.75%, and have an annual distribution and service fee of up to 0.30% of average daily net assets. This fee has been contractually limited to 0.25% of average daily net assets from March 30, 2011, through March 29, 2012.
Class C shares are sold with a contingent deferred sales charge of 1.00% if redeemed during the first 12 months. They are also subject to an annual distribution and service fee of up to 1.00% of average daily net assets.
Performance for Class C shares, excluding sales charges, assumes either that contingent deferred sales charges did not apply or that the investment was not redeemed.
Class R shares are available only for certain retirement plan products. They are sold without a sales charge and have an annual distribution and service fee of up to 0.60% of average daily net assets, which has been limited contractually to 0.50% from March 30, 2011, through March 29, 2012.
Institutional Class shares are available without sales or asset-based distribution charges only to certain eligible institutional accounts.
3
Performance summary
Delaware Macquarie Global Infrastructure Fund
The “Fund performance” table and the “Performance of a $10,000 investment” graph do not reflect the deduction of taxes the shareholder would pay on Fund distributions or redemptions of Fund shares.
Narrowly focused investments may exhibit higher volatility than investments in multiple industry sectors. Because the Fund concentrates its investments in securities issued by companies principally engaged in the infrastructure industry, the Fund has greater exposure to the potential adverse economic, regulatory, political, and other changes affecting such entities.
International investments entail risks not ordinarily associated with U.S. investments including fluctuation in currency values, differences in accounting principles, or economic or political instability in other nations.
Investing in emerging markets can be riskier than investing in established foreign markets due to increased volatility and lower trading volume.
“Nondiversified” Funds may allocate more of their net assets to investments in single securities than “diversified” Funds. Resulting adverse effects may subject these Funds to greater risks and volatility.
2 The Fund’s expense ratios, as described in the most recent prospectus, are disclosed in the following “Fund expense ratios” table. Delaware Investments has agreed to reimburse certain expenses and/or waive certain fees in order to prevent total fund operating expenses (excluding certain fees and expenses) from exceeding 1.20% of the Fund’s average daily net assets from March 30, 2011, through March 29, 2012. Please see the most recent prospectus and any applicable supplement(s) for additional information on these fee waivers and/or reimbursements.
| Fund expense ratios | Class A | | Class C | | Class R | | Institutional Class |
| Total annual operating expenses | 12.01% | | 12.71% | | 12.31% | | 11.71% |
| (without fee waivers) | | | | | | | |
| Net expenses | 1.45% | | 2.20% | | 1.70% | | 1.20% |
| (including fee waivers, if any) | | | | | | | |
| Type of waiver | Contractual | | Contractual | | Contractual | | Contractual |
4
Performance of a $10,000 investment1
Average annual total returns from Jan. 19, 2010 (Fund’s inception), through Nov. 30, 2011
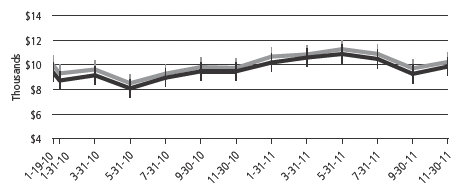
| For period beginning Jan. 19, 2010, through Nov. 30, 2011 | Starting value | Ending value |
| | S&P Global Infrastructure Index (gross) | $10,000 | $10,237 |
| | Delaware Macquarie Global Infrastructure Fund —
Class A shares | $9,425 | $9,868 |
1The “Performance of a $10,000 investment” graph assumes $10,000 invested in Class A shares of the Fund on Jan. 19, 2010, and includes the effect of a 5.75% front-end sales charge and the reinvestment of all distributions. The graph does not reflect the deduction of taxes the shareholders would pay on Fund distributions or redemptions of Fund shares. Expense limitations were in effect for some or all of the periods shown. Performance would have been lower had expense limitations not been in effect. Current expenses are listed in the “Fund expense ratios” table on page 4. Please note additional details on pages 3 through 5.
The chart also assumes $10,000 invested in the S&P Global Infrastructure Index as of Jan. 19, 2010. The S&P Global Infrastructure Index is composed of 75 of the largest publicly listed companies in the global infrastructure industry. The index has balanced weights across three distinct infrastructure clusters: transportation, utilities, and energy.
Index performance returns do not reflect any management fees, transaction costs, or expenses. Indices are unmanaged and one cannot invest directly in an index. Past performance is not a guarantee of future results.
Performance of other Fund classes will vary due to different charges and expenses.
| | | Nasdaq symbols | | CUSIPs | |
| Class A | | | DMGAX | | | 245914551 | |
| Class C | | | DMGCX | | | 245914544 | |
| Class R | | | DMGRX | | | 245914528 | |
| Institutional Class | | | DMGIX | | | 245914536 | |
5
Disclosure of Fund expenses
For the six-month period from June 1, 2011 to November 30, 2011
As a shareholder of the Fund, you incur two types of costs: (1) transaction costs, including sales charges (loads) on purchase payments, reinvested dividends, or other distributions; redemption fees; and exchange fees; and (2) ongoing costs, including management fees; distribution and/or service (12b-1) fees; and other Fund expenses. This example is intended to help you understand your ongoing costs (in dollars) of investing in the Fund and to compare these costs with the ongoing costs of investing in other mutual funds.
The example is based on an investment of $1,000 invested at the beginning of the period and held for the entire six-month period from June 1, 2011 to November 30, 2011.
Actual expenses
The first section of the table shown, “Actual Fund return,” provides information about actual account values and actual expenses. You may use the information in this section of the table, together with the amount you invested, to estimate the expenses that you paid over the period. Simply divide your account value by $1,000 (for example, an $8,600 account value divided by $1,000 = 8.6), then multiply the result by the number in the first section under the heading entitled “Expenses Paid During Period” to estimate the expenses you paid on your account during this period.
Hypothetical example for comparison purposes
The second section of the table shown, “Hypothetical 5% return,” provides information about hypothetical account values and hypothetical expenses based on the Fund’s actual expense ratio and an assumed rate of return of 5% per year before expenses, which is not the Fund’s actual return. The hypothetical account values and expenses may not be used to estimate the actual ending account balance or expenses you paid for the period. You may use this information to compare the ongoing costs of investing in the Fund and other funds. To do so, compare this 5% hypothetical example with the 5% hypothetical examples that appear in the shareholder reports of the other funds.
Please note that the expenses shown in the table are meant to highlight your ongoing costs only and do not reflect any transactional costs, such as sales charges (loads), redemption fees, or exchange fees. Therefore, the second section of the table is useful in comparing ongoing costs only, and will not help you determine the relative total costs of owning different funds. In addition, if these transactional costs were included, your costs would have been higher. The Fund’s expenses shown in the table reflect fee waivers in effect. The expenses shown in the table assume reinvestment of all dividends and distributions.
6
Delaware Macquarie Global Infrastructure Fund
Expense analysis of an investment of $1,000
| | Beginning | | Ending | | | | Expenses |
| | Account Value | | Account Value | | Annualized | | Paid During Period |
| | 6/1/11 | | 11/30/11 | | Expense Ratio | | 6/1/11 to 11/30/11* |
| Actual Fund return | | | | | | | | | | | | | | | |
| Class A | | $ | 1,000.00 | | | $ | 906.80 | | | 1.45% | | | $ | 6.93 | |
| Class C | | | 1,000.00 | | | | 903.20 | | | 2.20% | | | | 10.50 | |
| Class R | | | 1,000.00 | | | | 905.50 | | | 1.70% | | | | 8.12 | |
| Institutional Class | | | 1,000.00 | | | | 907.10 | | | 1.20% | | | | 5.74 | |
| Hypothetical 5% return (5% return before expenses) | | | | | | | | |
| Class A | | $ | 1,000.00 | | | $ | 1,017.80 | | | 1.45% | | | $ | 7.33 | |
| Class C | | | 1,000.00 | | | | 1,014.04 | | | 2.20% | | | | 11.11 | |
| Class R | | | 1,000.00 | | | | 1,016.55 | | | 1.70% | | | | 8.59 | |
| Institutional Class | | | 1,000.00 | | | | 1,019.05 | | | 1.20% | | | | 6.07 | |
*“Expenses Paid During Period” are equal to the Fund’s annualized expense ratio, multiplied by the average account value over the period, multiplied by 183/365 (to reflect the one-half year period).
7
Security type/country and sector allocations |
| Delaware Macquarie Global Infrastructure Fund | As of November 30, 2011 |
Sector designations may be different than the sector designations presented in other Fund materials. The sector designations may represent the investment manager’s internal sector classifications, which may result in the sector designations for one fund being different than another fund’s sector designations.
| Security type/country | Percentage of net assets |
| Common Stock | | 95.85 | % | |
| Australia | | 11.58 | % | |
| Brazil | | 2.92 | % | |
| Canada | | 6.69 | % | |
| China | | 9.99 | % | |
| France | | 9.18 | % | |
| Germany | | 6.95 | % | |
| Italy | | 6.05 | % | |
| Japan | | 3.71 | % | |
| Mexico | | 1.42 | % | |
| Netherlands | | 1.33 | % | |
| Portugal | | 0.09 | % | |
| Republic of Korea | | 1.03 | % | |
| Singapore | | 1.03 | % | |
| Spain | | 2.94 | % | |
| Switzerland | | 1.52 | % | |
| United Kingdom | | 5.92 | % | |
| United States | | 23.50 | % | |
| U.S. Master Limited Partnerships | | 2.03 | % | |
| Short-Term Investments | | 0.02 | % | |
| Total Value of Securities | | 97.90 | % | |
| Receivables and Other Assets Net of Liabilities | | 2.10 | % | |
| Total Net Assets | | 100.00 | % | |
| | |
| Common stock and limited partnerships by sector² | Percentage of net assets |
| Energy | | 17.12 | % | |
| Industrials | | 47.80 | % | |
| Telecommunication Services | | 0.94 | % | |
| Utilities | | 32.02 | % | |
| Total | | 97.88 | % | |
²Narrow industries are utilized for compliance purposes for diversification whereas broad sectors are used for financial reporting.
8
| Statement of net assets | |
| Delaware Macquarie Global Infrastructure Fund | November 30, 2011 |
| | | Number of shares | | | Value (U.S. $) |
| Common Stock – 95.85%Δ | | | | |
| Australia – 11.58% | | | | |
| Asciano | 293,758 | | $ | 477,757 |
| Australian Infrastructure Fund | 123,583 | | | 246,244 |
| † | MAp Group | 112,828 | | | 404,708 |
| # | Spark Infrastructure Group 144A | 348,001 | | | 461,159 |
| Transurban Group | 126,164 | | | 740,998 |
| | | | | 2,330,866 |
| Brazil – 2.92% | | | | |
| CCR | 14,000 | | | 89,421 |
| Energias do Brasil | 8,100 | | | 172,903 |
| † | LLX Logistica | 134,300 | | | 222,805 |
| Ultrapar Participacoes ADR | 5,780 | | | 102,711 |
| | | | | 587,840 |
| Canada – 6.69% | | | | |
| Enbridge | 17,894 | | | 634,071 |
| TransCanada | 16,955 | | | 712,845 |
| | | | | 1,346,916 |
| *China – 9.99% | | | | |
| Beijing Capital International Airport | 286,200 | | | 136,642 |
| Beijing Enterprises Holdings | 92,500 | | | 510,269 |
| China Merchants Holdings International | 70,397 | | | 207,191 |
| COSCO Pacific | 352,000 | | | 414,249 |
| Dalian Port PDA | 972,000 | | | 228,649 |
| Jiangsu Expressway | 358,300 | | | 320,655 |
| Zhejiang Expressway | 314,500 | | | 193,459 |
| | | | | 2,011,114 |
| France – 9.18% | | | | |
| Aeroports de Paris | 8,627 | | | 630,973 |
| GDF Suez | 22,644 | | | 634,867 |
| Groupe Eurotunnel | 16,574 | | | 126,009 |
| Vinci | 10,194 | | | 455,749 |
| | | | | 1,847,598 |
| Germany – 6.95% | | | | |
| E.ON | 30,449 | | | 753,753 |
| Fraport Frankfurt Airport Services Worldwide | 5,890 | | | 335,457 |
| Hamburger Hafen und Logistik | 10,128 | | | 308,335 |
| | | | | 1,397,545 |
9
Statement of net assets
Delaware Macquarie Global Infrastructure Fund
| | | Number of shares | | | Value (U.S. $) |
| Common Stock (continued) | | | | |
| Italy – 6.05% | | | | |
| Atlantia | 70,219 | | $ | 1,082,172 |
| Enel | 23,848 | | | 101,618 |
| SIAS | 4,400 | | | 33,349 |
| | | | | 1,217,139 |
| Japan – 3.71% | | | | |
| East Japan Railway | 2,472 | | | 151,431 |
| | Japan Airport Terminal | 5,800 | | | 85,328 |
| Mitsubishi Logistics | 16,000 | | | 165,525 |
| Tokyo Gas | 80,000 | | | 343,208 |
| | | | | 745,492 |
| Mexico – 1.42% | | | | |
| Grupo Aeroportuario del Pacifico ADR | 1,108 | | | 38,292 |
| Grupo Aeroportuario del Sureste ADR | 2,469 | | | 139,178 |
| † | OHL Mexico | 64,216 | | | 107,361 |
| | | | | 284,831 |
| Netherlands – 1.33% | | | | |
| Koninklijke Vopak | 4,872 | | | 267,919 |
| | | | | 267,919 |
| Portugal – 0.09% | | | | |
| Brisa Auto-Estradas de Portugal | 5,215 | | | 18,038 |
| | | | | 18,038 |
| Republic of Korea – 1.03% | | | | |
| † | Korea Electric Power ADR | 18,638 | | | 206,882 |
| | | | | 206,882 |
| Singapore – 1.03% | | | | |
| Hutchison Port Holdings Trust | 339,000 | | | 206,748 |
| | | | | 206,748 |
| Spain – 2.94% | | | | |
| Abertis Infraestructuras | 37,085 | | | 592,322 |
| | | | | 592,322 |
| Switzerland – 1.52% | | | | |
| Flughafen Zuerich | 837 | | | 305,893 |
| | | | | 305,893 |
| United Kingdom – 5.92% | | | | |
| Centrica | 65,918 | | | 313,459 |
| National Grid | 42,572 | | | 418,528 |
| Severn Trent | 6,296 | | | 153,060 |
10
| | | | Number of shares | | | Value (U.S. $) |
| Common Stock (continued) | | | | | |
| United Kingdom (continued) | | | | | |
| SSE | | 9,475 | | $ | 196,272 |
| United Utilities Group | | 11,112 | | | 110,047 |
| | | | | | 1,191,366 |
| United States – 23.50% | | | | | |
| American Electric Power | | 6,967 | | | 276,451 |
| † | American Tower Class A | | 900 | | | 53,100 |
| American Water Works | | 4,525 | | | 140,592 |
| † | Corrections Corporation of America | | 17,879 | | | 375,459 |
| † | Crown Castle International | | 3,200 | | | 135,424 |
| Dominion Resources | | 3,130 | | | 161,571 |
| El Paso | | 21,200 | | | 530,212 |
| Exelon | | 8,000 | | | 354,480 |
| FirstEnergy | | 4,100 | | | 182,327 |
| NextEra Energy | | 8,030 | | | 445,183 |
| PG&E | | 16,260 | | | 631,538 |
| Public Service Enterprise Group | | 4,390 | | | 144,607 |
| Southern | | 5,500 | | | 241,505 |
| Spectra Energy | | 12,240 | | | 360,101 |
| Williams | | 21,600 | | | 697,247 |
| | | | | | 4,729,797 |
| Total Common Stock (cost $20,610,709) | | | | | 19,288,306 |
| |
| U.S. Master Limited Partnerships – 2.03% | | | | | |
| El Paso Pipeline Partners | | 2,641 | | | 86,546 |
| Enbridge Energy Partners | | 2,600 | | | 80,522 |
| Enterprise Products Partners | | 3,165 | | | 143,975 |
| Magellan Midstream Partners | | 1,525 | | | 97,570 |
| Total U.S. Master Limited Partnerships (cost $224,396) | | | | | 408,613 |
| |
| | Principal | | | |
| | amount (U.S. $) | | | |
| Short-Term Investments – 0.02% | | | | | |
| Repurchase Agreements – 0.02% | | | | | |
| BNP Paribas 0.08%, dated 11/30/11, to be repurchased | | | | | |
| on 12/1/11, repurchase price $4,000 (collateralized | | | | | |
| by U.S. government obligations 0.00%-4.25% | | | | | |
| 1/13/12-5/15/21; market value $4,080) | | $4,000 | | | 4,000 |
| Total Short-Term Investments (cost $4,000) | | | | | 4,000 |
11
Statement of net assets
Delaware Macquarie Global Infrastructure Fund
| | |
| Total Value of Securities – 97.90% | | | | |
| (cost $20,839,105) | | $ | 19,700,919 | |
| Receivables and Other Assets | | | | |
| Net of Liabilities – 2.10% | | | 422,177 | |
| Net Assets Applicable to 2,288,516 | | | | |
| Shares Outstanding – 100.00% | | $ | 20,123,096 | |
| |
| Net Asset Value – Delaware Macquarie Global Infrastructure Fund | | | |
| Class A ($1,298,017 / 147,587 Shares) | | | $8.79 | |
| Net Asset Value – Delaware Macquarie Global Infrastructure Fund | | | |
| Class C ($502,872 / 57,271 Shares) | | | $8.78 | |
| Net Asset Value – Delaware Macquarie Global Infrastructure Fund | | | |
| Class R ($5,230 / 595 Shares) | | | $8.79 | |
| Net Asset Value – Delaware Macquarie Global Infrastructure Fund | | | |
| Institutional Class ($18,316,977 / 2,083,063 Shares) | | $8.79 | |
| |
| Components of Net Assets at November 30, 2011: | | | | |
| Shares of beneficial interest (unlimited authorization – no par) | | $ | 21,062,030 | |
| Undistributed net investment income | | | | 60,651 | |
| Accumulated net realized gain on investments | | | 139,105 | |
| Net unrealized depreciation of investments and derivatives | | | (1,138,690 | ) |
| Total net assets | | | $ | 20,123,096 | |
| Δ | Securities have been classified by country of origin. Classification by type of business has been presented on page 8 in “Security type/country and sector allocations.” |
| † | Non income producing security. |
| # | Security exempt from registration under Rule 144A of the Securities Act of 1933, as amended. At November 30, 2011, the aggregate value of Rule 144A securities was $461,159, which represented 2.29% of the Fund’s net assets. See Note 10 in “Notes to financial statements.” |
| * | Securities listed and traded on the Hong Kong Stock Exchange. |
12
| |
| Net Asset Value and Offering Price Per Share – | | |
| Delaware Macquarie Global Infrastructure Fund | | |
| Net asset value Class A (A) | | $8.79 |
| Sales charge (5.75% of offering price) (B) | | 0.54 |
| Offering price | | $9.33 |
| (A) | Net asset value per share, as illustrated, is the amount which would be paid upon redemption or repurchase of shares. |
| (B) | See the current prospectus for purchases of $50,000 or more. |
The following foreign currency exchange contracts were outstanding at November 30, 2011:1
Foreign Currency Exchange Contracts
| | | | | | | | Unrealized |
| | | | | | | | Appreciation |
| Counterparty | | Contracts to Deliver | | In Exchange For | | Settlement Date | | (Depreciation) |
| MNB | | AUD (19,296) | | USD 19,361 | | 12/2/11 | | $(479) |
The use of foreign currency exchange contracts involves elements of market risk and risks in excess of the amounts recognized in the financial statements. The notional values presented above represent the Fund’s total exposure in such contracts, whereas only the net unrealized appreciation (depreciation) is reflected in the Fund’s net assets.
1See Note 8 in “Notes to financial statements.”
Summary of abbreviations:
ADR — American Depositary Receipt
AUD — Australian Dollar
MNB — Mellon National Bank
USD — United States Dollar
See accompanying notes, which are an integral part of the financial statements.
13
| Statement of operations | |
| Delaware Macquarie Global Infrastructure Fund | Year Ended November 30, 2011 |
| Investment Income: | | | | | | | |
| Dividends | $ | 532,568 | | | | | |
| Interest | | 356 | | | | | |
| Foreign tax withheld | | (44,661 | ) | | $ | 488,263 | |
| |
| Expenses: | | | | | | | |
| Management fees | | 105,865 | | | | | |
| Registration fees | | 65,396 | | | | | |
| Dividend disbursing and transfer agent fees and expenses | | 27,333 | | | | | |
| Custodian fees | | 24,385 | | | | | |
| Audit and tax | | 11,286 | | | | | |
| Reports and statements to shareholders | | 9,611 | | | | | |
| Dues and services | | 8,491 | | | | | |
| Distribution expenses – Class A | | 3,372 | | | | | |
| Distribution expenses – Class C | | 3,288 | | | | | |
| Distribution expenses – Class R | | 32 | | | | | |
| Accounting and administration expenses | | 4,622 | | | | | |
| Pricing fees | | 2,788 | | | | | |
| Legal fees | | 1,370 | | | | | |
| Trustees’ fees | | 626 | | | | | |
| Consulting fees | | 131 | | | | | |
| Insurance fees | | 58 | | | | | |
| Trustees’ expenses | | 33 | | | | 268,687 | |
| Less fees waived | | | | | | (121,009 | ) |
| Less waived distribution expenses – Class A | | | | | | (560 | ) |
| Less waived distribution expenses – Class R | | | | | | (5 | ) |
| Less expense paid indirectly | | | | | | (18 | ) |
| Total operating expenses | | | | | | 147,095 | |
| Net Investment Income | | | | | | 341,168 | |
| |
| Net Realized and Unrealized Gain (Loss): | | | | | | | |
| Net realized gain (loss) on: | | | | | | | |
| Investments | | | | | | 169,713 | |
| Foreign currencies | | | | | | (37,553 | ) |
| Foreign currency exchange contracts | | | | | | (33,052 | ) |
| Net realized gain | | | | | | 99,108 | |
| Net change in unrealized appreciation (depreciation) on: | | | | | | | |
| Investments | | | | | | (1,202,235 | ) |
| Foreign currencies | | | | | | 21 | |
| Foreign currency exchange contracts | | | | | | (1,016 | ) |
| Net change in unrealized appreciation (depreciation) | | | | | | (1,203,230 | ) |
| Net Realized and Unrealized Loss | | | | | | (1,104,122 | ) |
| |
| Net Decrease in Net Assets Resulting from Operations | | | | | $ | (762,954 | ) |
See accompanying notes, which are an integral part of the financial statements.
14
Statements of changes in net assets
Delaware Macquarie Global Infrastructure Fund
| | Year | | 12/31/09* |
| | Ended | | to |
| | 11/30/11 | | 11/30/10 |
| Increase (Decrease) in Net Assets from Operations: | | | | | | | |
| Net investment income | | $ | 341,168 | | | $ | 48,719 | |
| Net realized gain (loss) | | | 99,108 | | | | (13,777 | ) |
| Net change in unrealized appreciation (depreciation) | | (1,203,230 | ) | | | 64,540 | |
| Net increase (decrease) in net assets resulting from operations | | (762,954 | ) | | | 99,482 | |
| |
| Dividends and Distributions to Shareholders from: | | | | | | | |
| Net investment income: | | | | | | | | |
| Class A | | | (20,230 | ) | | | (6,212 | ) |
| Class C | | | (3,307 | ) | | | (724 | ) |
| Class R | | | (85 | ) | | | (51 | ) |
| Institutional Class | | | (197,000 | ) | | | (27,833 | ) |
| |
| Net realized gain on investments: | | | | | | | | |
| Class A | | | (4,796 | ) | | | — | |
| Class C | | | (806 | ) | | | — | |
| Class R | | | (35 | ) | | | — | |
| Institutional Class | | | (14,568 | ) | | | — | |
| | | | (240,827 | ) | | | (34,820 | ) |
| |
| Capital Share Transactions: | | | | | | | | |
| Proceeds from shares sold: | | | | | | | | |
| Class A | | | 950,921 | | | | 816,198 | |
| Class C | | | 430,926 | | | | 107,355 | |
| Class R | | | 4 | | | | 5,020 | |
| Institutional Class | | | 18,990,254 | | | | 2,000,020 | |
| |
| Net asset value of shares issued upon reinvestment | | | | | | | |
| of dividends and distributions: | | | | | | | | |
| Class A | | | 24,679 | | | | 6,038 | |
| Class C | | | 4,073 | | | | 724 | |
| Class R | | | 120 | | | | 51 | |
| Institutional Class | | | 210,391 | | | | 27,833 | |
| | | 20,611,368 | | | | 2,963,239 | |
16
| | Year | | 12/31/09* |
| | Ended | | to |
| | 11/30/11 | | 11/30/10 |
| Capital Share Transactions (continued): | | | | | | | | |
| Cost of shares repurchased: | | | | | | | | |
| Class A | | $ | (305,655 | ) | | $ | (168,354 | ) |
| Class C | | | (21,208 | ) | | | (2,638 | ) |
| Institutional Class | | | (2,014,537 | ) | | | — | |
| | | (2,341,400 | ) | | | (170,992 | ) |
| Increase in net assets derived from capital share transactions | | | 18,269,968 | | | | 2,792,247 | |
| Net Increase in Net Assets | | | 17,266,187 | | | | 2,856,909 | |
| |
| Net Assets: | | | | | | | | |
| Beginning of year | | | 2,856,909 | | | | — | |
| End of year (including undistributed net investment | | | | | | | | |
| income of $60,651 and $7,807, respectively) | | $ | 20,123,096 | | | $ | 2,856,909 | |
*Date of commencement of operations for the Institutional Class. Class A, Class C, and Class R commenced operations on January 19, 2010.
See accompanying notes, which are an integral part of the financial statements.
17
Financial highlights
Delaware Macquarie Global Infrastructure Fund Class A
Selected data for each share of the Fund outstanding throughout each period were as follows:
| Net asset value, beginning of period |
| |
| Income (loss) from investment operations: |
| Net investment income2 |
| Net realized and unrealized gain (loss) |
| Total from investment operations |
| |
| Less dividends and distributions from: |
| Net investment income |
| Net realized gain on investments |
| Total dividends and distributions |
| |
| Net asset value, end of period |
| |
| Total return3 |
| |
| Ratios and supplemental data: |
| Net assets, end of period (000 omitted) |
| Ratio of expenses to average net assets |
| Ratio of expenses to average net assets |
| prior to fees waived and expense paid indirectly |
| Ratio of net investment income to average net assets |
| Ratio of net investment income (loss) to average net assets |
| prior to fees waived and expense paid indirectly |
| Portfolio turnover |
1 Date of commencement of operations; ratios have been annualized and total return has not been annualized.
2 The average shares outstanding method has been applied for per share information.
3 Total investment return is based on the change in net asset value of a share during the period and assumes reinvestment of dividends and distributions at net asset value and does not reflect the impact of a sales charge. Total investment return during all of the periods shown reflect waivers by the manager and distributor. Performance would have been lower had the waivers not been in effect.
See accompanying notes, which are an integral part of the financial statements.
18
| Year | | 1/19/101 | |
| Ended | | to | |
| 11/30/11 | | 11/30/10 | |
| $8.670 | | | $8.730 | | |
| | |
| | |
| 0.245 | | | 0.155 | | |
| 0.102 | | | (0.111 | ) | |
| 0.347 | | | 0.044 | | |
| | |
| | |
| | (0.166 | ) | | (0.104 | ) | |
| (0.061 | ) | | — | | |
| (0.227 | ) | | (0.104 | ) | |
| | |
| $8.790 | | | $8.670 | | |
| | |
| 4.05% | | | 0.63% | | |
| | |
| | |
| $1,298 | | | $667 | | |
| 1.45% | | | 1.45% | | |
| | |
| 2.53% | | | 12.24% | | |
| 2.70% | | | 2.15% | | |
| | |
| 1.62% | | | (8.64% | ) | |
| 33% | | | 87% | 4 | |
4 Portfolio turnover is representative of the Fund for the period December 31, 2009 through November 30, 2010.
19
Financial highlights
Delaware Macquarie Global Infrastructure Fund Class C
Selected data for each share of the Fund outstanding throughout each period were as follows:
| Net asset value, beginning of period |
| |
| Income (loss) from investment operations: |
| Net investment income2 |
| Net realized and unrealized gain (loss) |
| Total from investment operations |
| |
| Less dividends and distributions from: |
| Net investment income |
| Net realized gain on investments |
| Total dividends and distributions |
| |
| Net asset value, end of period |
| |
| Total return3 |
| |
| Ratios and supplemental data: |
| Net assets, end of period (000 omitted) |
| Ratio of expenses to average net assets |
| Ratio of expenses to average net assets |
| prior to fees waived and expense paid indirectly |
| Ratio of net investment income to average net assets |
| Ratio of net investment income (loss) to average net assets |
| prior to fees waived and expense paid indirectly |
| Portfolio turnover |
1 Date of commencement of operations; ratios have been annualized and total return has not been annualized.
2 The average shares outstanding method has been applied for per share information.
3 Total investment return is based on the change in net asset value of a share during the period and assumes reinvestment of dividends and distributions at net asset value and does not reflect the impact of a sales charge. Total investment return during all of the periods shown reflect a waiver by the manager. Performance would have been lower had the waiver not been in effect.
See accompanying notes, which are an integral part of the financial statements.
20
| Year | | 1/19/101 | |
| Ended | | to | |
| 11/30/11 | | 11/30/10 | |
| $8.660 | | | $8.730 | | |
| | |
| | |
| 0.177 | | | 0.102 | | |
| | 0.102 | | | (0.106 | ) | |
| 0.279 | | | (0.004 | ) | |
| | |
| | |
| (0.098 | ) | | (0.066 | ) | |
| (0.061 | ) | | — | | |
| (0.159 | ) | | (0.066 | ) | |
| | |
| $8.780 | | | $8.660 | | |
| | |
| 3.15% | | | 0.04% | | |
| | |
| | |
| $503 | | | $114 | | |
| 2.20% | | | 2.20% | | |
| | |
| 3.23% | | | 12.94% | | |
| 1.95% | | | 1.40% | | |
| | |
| 0.92% | | | (9.34% | ) | |
| 33% | | | 87% | 4 | |
4 Portfolio turnover is representative of the Fund for the period December 31, 2009 through November 30, 2010.
21
Financial highlights
Delaware Macquarie Global Infrastructure Fund Class R
Selected data for each share of the Fund outstanding throughout each period were as follows:
| Net asset value, beginning of period |
| |
| Income (loss) from investment operations: |
| Net investment income2 |
| Net realized and unrealized gain (loss) |
| Total from investment operations |
| |
| Less dividends and distributions from: |
| Net investment income |
| Net realized gain on investments |
| Total dividends and distributions |
| |
| Net asset value, end of period |
| |
| Total return3 |
| |
| Ratios and supplemental data: |
| Net assets, end of period (000 omitted) |
| Ratio of expenses to average net assets |
| Ratio of expenses to average net assets |
| prior to fees waived and expense paid indirectly |
| Ratio of net investment income to average net assets |
| Ratio of net investment income (loss) to average net assets |
| prior to fees waived and expense paid indirectly |
| Portfolio turnover |
1 Date of commencement of operations; ratios have been annualized and total return has not been annualized.
2 The average shares outstanding method has been applied for per share information.
3 Total investment return is based on the change in net asset value of a share during the period and assumes reinvestment of dividends and distributions at net asset value. Total investment return during all of the periods shown reflect waivers by the manager and distributor. Performance would have been lower had the waivers not been in effect.
See accompanying notes, which are an integral part of the financial statements.
22
| Year | | 1/19/101 | |
| Ended | | to | |
| 11/30/11 | | 11/30/10 | |
| $8.670 | | | $8.730 | | |
| | |
| | |
| 0.223 | | | 0.137 | | |
| | 0.103 | | | (0.108 | ) | |
| 0.326 | | | 0.029 | | |
| | |
| | |
| (0.145 | ) | | (0.089 | ) | |
| (0.061 | ) | | — | | |
| (0.206 | ) | | (0.089 | ) | |
| | |
| $8.790 | | | $8.670 | | |
| | |
| 3.69% | | | 0.45% | | |
| | |
| | |
| $5 | | | $5 | | |
| 1.70% | | | 1.70% | | |
| | |
| 2.83% | | | 12.54% | | |
| 2.45% | | | 1.90% | | |
| | |
| 1.32% | | | (8.94% | ) | |
| 33% | | | 87% | 4 | |
4 Portfolio turnover is representative of the Fund for the period December 31, 2009 through November 30, 2010.
23
Financial highlights
Delaware Macquarie Global Infrastructure Fund Institutional Class
Selected data for each share of the Fund outstanding throughout each period were as follows:
| Net asset value, beginning of period |
| |
| Income from investment operations: |
| Net investment income2 |
| Net realized and unrealized gain |
| Total from investment operations |
| |
| Less dividends and distributions from: |
| Net investment income |
| Net realized gain on investments |
| Total dividends and distributions |
| |
| Net asset value, end of period |
| |
| Total return3 |
| |
| Ratios and supplemental data: |
| Net assets, end of period (000 omitted) |
| Ratio of expenses to average net assets |
| Ratio of expenses to average net assets |
| prior to fees waived and expense paid indirectly |
| Ratio of net investment income to average net assets |
| Ratio of net investment income (loss) to average net assets |
| prior to fees waived and expense paid indirectly |
| Portfolio turnover |
1 Date of commencement of operations; ratios have been annualized and total return and portfolio turnover have not been annualized.
2 The average shares outstanding method has been applied for per share information.
3 Total investment return is based on the change in net asset value of a share during the period and assumes reinvestment of dividends and distributions at net asset value. Total investment return during all of the periods shown reflect a waiver by the manager. Performance would have been lower had the waiver not been in effect.
See accompanying notes, which are an integral part of the financial statements.
24
| Year | | 12/31/091 | |
| Ended | | to | |
| 11/30/11 | | 11/30/10 | |
| $8.670 | | | $8.500 | | |
| | |
| | |
| 0.266 | | | 0.170 | | |
| 0.106 | | | 0.118 | | |
| 0.372 | | | 0.288 | | |
| | |
| | |
| | (0.191 | ) | | (0.118 | ) | |
| (0.061 | ) | | — | | |
| (0.252 | ) | | (0.118 | ) | |
| | |
| $8.790 | | | $8.670 | | |
| | |
| 4.22% | | | 3.53% | | |
| | |
| | |
| $18,317 | | | $2,071 | | |
| 1.20% | | | 1.20% | | |
| | |
| 2.23% | | | 11.66% | | |
| 2.95% | | | 2.23% | | |
| | |
| 1.92% | | | (8.23% | ) | |
| 33% | | | 87% | | |
25
| Notes to financial statements |
| Delaware Macquarie Global Infrastructure Fund | November 30, 2011 |
Delaware Group® Global & International Funds (Trust) is organized as a Delaware statutory trust and offers five series: Delaware International Value Equity Fund, Delaware Emerging Markets Fund, Delaware Global Value Fund, Delaware Focus Global Growth Fund and Delaware Macquarie Global Infrastructure Fund. These financial statements and the related notes pertain to Delaware Macquarie Global Infrastructure Fund (Fund). The Trust is an open-end investment company. The Fund is considered diversified under the Investment Company Act of 1940, as amended, and offers Class A, Class C, Class R and Institutional Class shares. Class A shares are sold with a maximum front-end sales charge of up to 5.75%. Class A share purchases of $1,000,000 or more will incur a contingent deferred sales charge (CDSC) of 1% if redeemed during the first year and 0.50% during the second year, provided that Delaware Distributors, L.P. (DDLP) paid a financial advisor a commission on the purchase of those shares. Class C shares are sold with a CDSC of 1%, if redeemed during the first twelve months. Class R and Institutional Class shares are not subject to a sales charge and are offered for sale exclusively to certain eligible investors.
The investment objective of the Fund is to seek long-term capital appreciation and current income.
1. Significant Accounting Policies
The following accounting policies are in accordance with U.S. generally accepted accounting principles (U.S. GAAP) and are consistently followed by the Fund.
Security Valuation — Equity securities, except those traded on the Nasdaq Stock Market, Inc. (Nasdaq), are valued at the last quoted sales price as of the time of the regular close of the New York Stock Exchange (NYSE) on the valuation date. Securities traded on the Nasdaq are valued in accordance with the Nasdaq Official Closing Price, which may not be the last sales price. If on a particular day an equity security does not trade, then the mean between the bid and ask prices will be used, which approximates fair value. Securities listed on a foreign exchange are normally valued at the last quoted sales price on the valuation date. Short-term debt securities are valued at market value. Foreign currency exchange contracts are valued at the mean between the bid and ask prices, which approximates fair value. Interpolated values are derived when the settlement date of the contract is an interim date for which quotations are not available. Generally, other securities and assets for which market quotations are not readily available are valued at fair value as determined in good faith under the direction of the Fund’s Board of Trustees (Board). In determining whether market quotations are readily available or fair valuation will be used, various factors will be taken into consideration, such as market closures or suspension of trading in a security. The Fund may use fair value pricing more frequently for securities traded primarily in non-U.S. markets because, among other things, most foreign markets close well before the Fund values its securities, generally as of 4:00 p.m. Eastern time. The earlier close of these foreign markets gives rise to the possibility that significant events, including broad market moves, government actions or pronouncements, aftermarket trading, or news events may have occurred in the interim. To account for this, the Fund may frequently value foreign securities using fair value prices based on third-party vendor modeling tools (international fair value pricing).
26
Federal Income Taxes — No provision for federal income taxes has been made as the Fund intends to continue to qualify for federal income tax purposes as a regulated investment company under Subchapter M of the Internal Revenue Code of 1986, as amended, and make the requisite distributions to shareholders. The Fund evaluates tax positions taken or expected to be taken in the course of preparing the Fund’s tax returns to determine whether the tax positions are “more-likely-than-not” of being sustained by the applicable tax authority. Tax positions not deemed to meet the more-likely-than-not threshold are recorded as a tax benefit or expense in the current year. Management has analyzed the Fund’s tax positions taken on federal income tax returns for all open tax years (November 30, 2010 – November 30, 2011), and has concluded that no provision for federal income tax is required in the Fund’s financial statements.
Class Accounting — Investment income, common expenses and realized and unrealized gain (loss) on investments are allocated to the various classes of the Fund on the basis of daily net assets of each class. Distribution expenses relating to a specific class are charged directly to that class.
Repurchase Agreements — The Fund may purchase certain U.S. government securities subject to the counterparty’s agreement to repurchase them at an agreed upon date and price. The counterparty will be required on a daily basis to maintain the value of the collateral subject to the agreement at not less than the repurchase price (including accrued interest). The agreements are conditioned upon the collateral being deposited under the Federal Reserve book-entry system with the Fund’s custodian or a third party sub-custodian. In the event of default or bankruptcy by the other party to the agreement, retention of the collateral may be subject to legal proceedings. All open repurchase agreements as of the date of this report were entered into on November 30, 2011.
Foreign Currency Transactions — Transactions denominated in foreign currencies are recorded at the prevailing exchange rates on the valuation date in accordance with the Fund’s prospectus. The value of all assets and liabilities denominated in foreign currencies is translated into U.S. dollars at the exchange rate of such currencies against the U.S. dollar daily. Transaction gains or losses resulting from changes in exchange rates during the reporting period or upon settlement of the foreign currency transaction are reported in operations for the current period. The Fund generally does not isolate that portion of realized gains and losses on investments which are due to changes in foreign exchange rates from that which are due to changes in market prices. The changes are included with the net realized and unrealized gain or loss on investments. The Fund reports certain foreign currency related transactions as components of realized gains (losses) for financial reporting purposes, whereas such components are treated as ordinary income (loss) for federal income tax purposes.
Use of Estimates — The preparation of financial statements in conformity with U.S. GAAP requires management to make estimates and assumptions that affect the fair value of investments, the reported amounts of assets and liabilities and disclosure of contingent assets
27
Notes to financial statements
Delaware Macquarie Global Infrastructure Fund
1. Significant Accounting Policies (continued)
and liabilities at the date of the financial statements and the reported amounts of revenues and expenses during the reporting period. Actual results could differ from those estimates and the differences could be material.
Other — Expenses directly attributable to the Fund are charged directly to the Fund. Other expenses common to various funds within the Delaware Investments® Family of Funds are generally allocated amongst such funds on the basis of average net assets. Management fees and some other expenses are paid monthly. Security transactions are recorded on the date the securities are purchased or sold (trade date) for financial reporting purposes. Costs used in calculating realized gains and losses on the sale of investment securities are those of the specific securities sold. Dividend income is recorded on the ex-dividend date and interest income is recorded on the accrual basis. Foreign dividends are also recorded on the ex-dividend date or as soon after the ex-dividend date that the Fund is aware of such dividends, net of all non-rebatable tax withholdings. Withholding taxes on foreign dividends have been recorded in accordance with the Fund’s understanding of the applicable country’s tax rules and rates. The Fund declares and pays dividends from net investment income quarterly and distributions from net realized gain on investments, if any, annually. The Fund may distribute income dividends and capital gains more frequently, if necessary for tax purposes. Dividends and distributions, if any, are recorded on the ex-dividend date.
The Fund may receive earnings credits from its custodian when positive cash balances are maintained, which are used to offset custody fees. There were no earnings credits for the year ended November 30, 2011.
The Fund receives earnings credits from its transfer agent when positive cash balances are maintained, which may be used to offset transfer agent fees. The expense paid under this arrangement is included in dividend disbursing and transfer agent fees and expenses on the statement of operations with the corresponding expense offset shown as “expense paid indirectly.” For the year ended November 30, 2011, the Fund earned $18 under this agreement.
2. Investment Management, Administration Agreements and Other Transactions with Affiliates
In accordance with the terms of its investment management agreement, the Fund pays Delaware Management Company (DMC), a series of Delaware Management Business Trust and the investment manager, an annual fee which is calculated daily at the rate of 0.90% on the first $500 million of average daily net assets of the Fund, 0.85% on the next $500 million, 0.80% on the next $1.5 billion and 0.75% on average daily net assets in excess of $2.5 billion.
DMC, on behalf of the Fund, has entered into an investment sub-advisory agreement with Macquarie Capital Investment Management LLC (MCIM), which is an affiliate of DMC. Both DMC and MCIM are wholly owned subsidiaries of Macquarie. For its sub-advisory services, MCIM receives an asset-based fee from DMC. Such sub-advisory fee is paid by DMC, and not from the assets of the Fund.
28
DMC has contractually agreed to waive that portion, if any, of its management fee and reimburse the Fund to the extent necessary to ensure that total annual operating expenses (excluding any 12b-1 plan expenses and certain other expenses) do not exceed 1.20% of average daily net assets of the Fund through March 29, 2012. For purposes of this waiver and reimbursement, nonroutine expenses may also include such additional costs and expenses as may be agreed upon from time to time by the Fund’s Board and DMC.
Delaware Service Company, Inc. (DSC), an affiliate of DMC, provides fund accounting and financial administration oversight services to the Fund. For these services, the Fund pays DSC fees based on the aggregate daily net assets of the Delaware Investments® Family of Funds at the following annual rate: 0.0050% of the first $30 billion; 0.0045% of the next $10 billion; 0.0040% of the next $10 billion; and 0.0025% of aggregate average daily net assets in excess of $50 billion. The fees payable to DSC under the service agreement described above are allocated among all Funds in the Delaware Investments® Family of Funds on a relative net asset value basis. For the year ended November 30, 2011, the Fund was charged $ 582 for these services.
DSC also provides dividend disbursing and transfer agency services. Effective July 18, 2011, the Fund pays DSC a monthly asset-based fee for these services. Prior to July 18, 2011, the Fund paid DSC a monthly fee based on the number of shareholder accounts for dividend disbursing and transfer agent services.
Pursuant to a distribution agreement and distribution plan, the Fund pays DDLP, the distributor and an affiliate of DMC, an annual distribution and service fee not to exceed 0.30% of the average daily net assets of the Class A shares, 1.00% of the average daily net assets of the Class C shares and 0.60% of the average daily net assets of Class R shares. Institutional Class shares pay no distribution and service expenses. DDLP has contracted to waive distribution and service fees through March 29, 2012 to prevent distribution and service fees of Class A and Class R shares from exceeding 0.25% and 0.50%, respectively, of average daily net assets.
At November 30, 2011, the Fund had liabilities payable to affiliates as follows:
| Investment management fees payable to DMC | | $ | 7,201 |
| Dividend disbursing, transfer agent and fund accounting | | | |
| oversight fees and other expenses payable to DSC | | | 454 |
| Distribution fees payable to DDLP | | | 657 |
| Other expenses payable to DMC and affiliates* | | | 1,079 |
*DMC, as part of its administrative services, pays operating expenses on behalf of the Fund and is reimbursed on a periodic basis. Expenses include items such as printing of shareholder reports, fees for audit, legal and tax services, registration fees and trustees’ fees.
As provided in the investment management agreement, the Fund bears the cost of certain legal and tax services, including internal legal and tax services provided to the Fund by DMC and/or its affiliates’ employees. For the year ended November 30, 2011, the Fund was charged $346 for internal legal and tax services provided by DMC and/or its affiliates’ employees.
29
Notes to financial statements
Delaware Macquarie Global Infrastructure Fund
2. Investment Management, Administration Agreements and Other Transactions with Affiliates (continued)
For the year ended November 30, 2011, DDLP earned $4,258 for commissions on sales of the Fund’s Class A shares.
Trustees’ fees include expenses accrued by the Fund for each Trustee’s retainer and meeting fees. Certain officers of DMC, DSC and DDLP are officers and/or Trustees of the Trust. These officers and Trustees are paid no compensation by the Fund.
3. Investments
For the year ended November 30, 2011, the Fund made purchases of $22,009,254 and sales of $3,914,698 of investment securities other than short-term investments.
At November 30, 2011, the cost of investments for federal income tax purposes was $ 20,940,430. At November 30, 2011, net unrealized depreciation was $ 1,239,511, of which $ 788,636 related to unrealized appreciation of investments and $2,028,147 related to unrealized depreciation of investments.
U.S. GAAP defines fair value as the price that the Fund would receive to sell an asset or pay to transfer a liability in an orderly transaction between market participants at the measurement date under current market conditions. A three level hierarchy for fair value measurements has been established based upon the transparency of inputs to the valuation of an asset or liability. Inputs may be observable or unobservable and refer broadly to the assumptions that market participants would use in pricing the asset or liability. Observable inputs reflect the assumptions market participants would use in pricing the asset or liability based on market data obtained from sources independent of the reporting entity. Unobservable inputs reflect the reporting entity’s own assumptions about the assumptions that market participants would use in pricing the asset or liability developed based on the best information available under the circumstances. The Fund’s investment in its entirety is assigned a level based upon the observability of the inputs which are significant to the overall valuation. The three level hierarchy of inputs is summarized below.
| Level 1 | – | inputs are quoted prices in active markets for identical investments (e.g., equity securities, open-end investment companies, futures contracts, options contracts) |
| | | |
| Level 2 | – | other observable inputs (including, but not limited to: quoted prices for similar assets or liabilities in markets that are active, quoted prices for identical or similar assets or liabilities in markets that are not active, inputs other than quoted prices that are observable for the assets or liabilities (such as interest rates, yield curves, volatilities, prepayment speeds, loss severities, credit risks and default rates) or other market-corroborated inputs) (e.g., debt securities, government securities, swap contracts, foreign currency exchange contracts, foreign securities utilizing international fair value pricing) |
| | | |
| Level 3 | – | inputs are significant unobservable inputs (including the Fund’s own assumptions used to determine the fair value of investments) (e.g., broker-quoted securities, fair valued securities) |
30
The following table summarizes the valuation of the Fund’s investments by fair value hierarchy levels as of November 30, 2011:
| | Level 1 | | Level 2 | | Total |
| Common Stock | | $ | 7,156,267 | | $ | 12,132,039 | | | $ | 19,288,306 | |
| U.S. Master Limited Partnership | | | 408,613 | | | — | | | | 408,613 | |
| Short-Term Investments | | | — | | | 4,000 | | | | 4,000 | |
| Total | | $ | 7,564,880 | | $ | 12,136,039 | | | $ | 19,700,919 | |
| |
| Foreign Currency Exchange Contracts | | $ | — | | $ | (479 | ) | | $ | (479 | ) |
There were no unobservable inputs used to value investments at the beginning or end of the period.
As a result of utilizing international fair value pricing at November 30, 2011, the majority of the Fund was categorized as Level 2.
During the period ended November 30, 2011, there were no transfers between Level 1 investments, Level 2 investments, or Level 3 investments that had a material impact to the Fund. This does not include transfers between Level 1 investments and Level 2 investments due to the Fund utilizing international fair value pricing during the period.
4. Dividend and Distribution Information
Income and long-term capital gain distributions are determined in accordance with federal income tax regulations, which may differ from U.S. GAAP. Additionally, distributions from net gains on foreign currency transactions and net short-term gains on sales of investment securities are treated as ordinary income for federal income tax purposes. The tax character of dividends and distributions paid during the year ended November 30, 2011 and the period December 31, 2009 through November 30, 2010 was as follows:
| | Year | | 12/31/09* |
| | Ended | | to |
| | 11/30/11 | | 11/30/10 |
| Ordinary income | | $240,827 | | $34,820 |
*Date of commencement of operations.
5. Components of Net Assets on a Tax Basis
As of November 30, 2011, the components of net assets on a tax basis were as follows:
| Shares of beneficial interest | | $ | 21,062,030 | |
| Undistributed ordinary income | | | 153,061 | |
| Undistributed long-term capital gain | | | 148,020 | |
| Unrealized depreciation | | | (1,240,015 | ) |
| Net assets | | $ | 20,123,096 | |
31
Notes to financial statements
Delaware Macquarie Global Infrastructure Fund
5. Components of Net Assets on a Tax Basis (continued)
The differences between book basis and tax basis components of net assets are primarily attributable to tax deferral of losses on wash sales and tax treatment of passive foreign investment companies.
For financial reporting purposes, capital accounts are adjusted to reflect the tax character of permanent book/tax differences. Reclassifications are primarily due to tax treatment of passive foreign investment companies and gain (loss) on foreign currency transactions. Results of operations and net assets were not affected by these reclassifications. For the year ended November 30, 2011, the Fund recorded the following reclassifications:
| Undistributed net investment income | | $ | (67,702 | ) |
| Accumulated net realized gain | | | 67,887 | |
| Paid-in capital | | | (185 | ) |
6. Capital Shares
Transactions in capital shares were as follows:
| | Year | | 12/31/09* |
| | Ended | | to |
| | 11/30/11 | | 11/30/10 |
| Shares sold: | | | | | | |
| Class A | | 101,879 | | | 96,703 | |
| Class C | | 45,925 | | | 13,370 | |
| Class R | | — | | | 575 | |
| Institutional Class | | 2,050,346 | | | 235,296 | |
| |
| Shares issued upon reinvestment of dividends and distributions: | | | | | | |
| Class A | | 2,697 | | | 770 | |
| Class C | | 439 | | | 93 | |
| Class R | | 13 | | | 7 | |
| Institutional Class | | 23,049 | | | 3,525 | |
| | | 2,224,348 | | | 350,339 | |
| |
| Shares repurchased: | | | | | | |
| Class A | | (33,906 | ) | | (20,556 | ) |
| Class C | | (2,265 | ) | | (291 | ) |
| Institutional Class | | (229,153 | ) | | — | |
| | | (265,324 | ) | | (20,847 | ) |
| Net increase | | 1,959,024 | | | 329,492 | |
*Date of commencement of operations for the Institutional Class. Class A, Class C, and Class R commenced operations on January 19, 2010.
32
7. Line of Credit
The Fund, along with certain other funds in the Delaware Investments® Family of Funds (Participants), was a participant in a $50,000,000 revolving line of credit to be used for temporary or emergency purposes as an additional source of liquidity to fund redemptions of investor shares. Under the agreement, the Participants were charged an annual commitment fee, which was allocated across the Participants on the basis of each Participant’s allocation of the entire facility. The Participants were permitted to borrow up to a maximum of one third of their net assets under the agreement. The line of credit expired on November 15, 2011.
On November 15, 2011, the Fund, along with the other Participants, entered into an agreement for a $125,000,000 revolving line of credit. The agreement is to be used as described above and operates in substantially the same manner as the original agreement. The agreement expires on November 13, 2012. The Fund had no amounts outstanding as of November 30, 2011 or at any time during the year then ended.
8. Derivatives
U.S. GAAP requires disclosures that enable investors to understand: 1) how and why an entity uses derivatives; 2) how they are accounted for; and 3) how they affect an entity’s results of operations and financial position.
Foreign Currency Exchange Contracts — The Fund may enter into foreign currency exchange contracts as a way of managing foreign exchange rate risk. The Fund may enter into these contracts to fix the U.S. dollar value of a security that it has agreed to buy or sell for the period between the date the trade was entered into and the date the security is delivered and paid for. The Fund may also use these contracts to hedge the U.S. dollar value of securities it already owns that are denominated in foreign currencies. The change in value is recorded as an unrealized gain or loss. When the contract is closed, a realized gain or loss is recorded equal to the difference between the value of the contract at the time it was opened and the value at the time it was closed.
The use of foreign currency exchange contracts does not eliminate fluctuations in the underlying prices of the securities, but does establish a rate of exchange that can be achieved in the future. Although foreign currency exchange contracts limit the risk of loss due to an unfavorable change in the value of the hedged currency, they also limit any potential gain that might result should the value of the currency change favorably. In addition, the Fund could be exposed to risks if the counterparties to the contracts are unable to meet the terms of their contracts. The Fund’s maximum risk of loss from counterparty credit risk is the value of their currency exchanged with the counterparty. The risk is generally mitigated by having a netting arrangement between the Fund and the counterparty and by the posting of collateral by the counterparty to the Fund to cover the Fund’s exposure to the counterparty.
33
Notes to financial statements
Delaware Macquarie Global Infrastructure Fund
8. Derivatives (continued)
Derivatives Generally. The table below summarizes the average daily balance of derivatives by the Fund during the year ended November 30, 2011. The average balance of derivatives is generally similar to the volume of derivative activity for the year ended November 30, 2011.
| | Asset | | Liability |
| | Derivative | | Derivative |
| | Volume | | Volume |
| Forward foreign currency contracts (average cost) | | $32,033 | | $38,615 |
9. Securities Lending
The Fund, along with other funds in the Delaware Investments® Family of Funds, may lend its securities pursuant to a security lending agreement (Lending Agreement) with The Bank of New York Mellon (BNY Mellon). At the time a security is loaned, the borrower must post collateral equal to the required percentage of the market value of the loaned security, including any accrued interest. The required percentage is: (i) 102% with respect to U.S. securities and foreign securities that are denominated and payable in U.S. dollars; and (ii) 105% with respect to foreign securities. With respect to each loan, if on any business day the aggregate market value of securities collateral plus cash collateral held is less than the aggregate market value of the securities which are the subject of such loan, the borrower will be notified to provide additional collateral by the end of the following business day which, together with the collateral already held, will be not less than the applicable initial collateral requirements for such security loan. If the aggregate market value of securities collateral and cash collateral held with respect to a security loan exceeds the applicable initial collateral requirement, upon request of the borrower BNY Mellon must return enough collateral to the borrower by the end of the following business day to reduce the value of the remaining collateral to the applicable initial collateral requirement for such security loan. As a result of the foregoing, the value of the collateral held with respect to a loaned security may be temporarily more or less than the value of the security on loan.
Cash collateral received is generally invested in the Delaware Investments Collateral Fund No. 1 (Collective Trust) established by BNY Mellon for the purpose of investment on behalf of funds managed by Delaware Management Company (DMC), a series of Delaware Management Business Trust, that participate in BNY Mellon’s securities lending program. The Collective Trust may invest in U.S. government securities and high quality corporate debt, asset-backed and other money market securities and in repurchase agreements collateralized by such securities, provided that the Collective Trust will generally have a dollar-weighted average portfolio maturity of 60 days or less. The Collective Trust seeks to maintain a net asset value per unit of $1.00, but there can be no assurance that it will always be able to do so. The Fund may incur investment losses as a result of investing securities lending collateral in the Collective Trust. This could occur if an investment in a Collective Trust defaulted or if it were necessary to liquidate assets in the Collective Trust to meet returns on outstanding security loans at a time when the Collective Trust’s net asset value per unit was less than $1.00. Under those circumstances, the Fund may not receive an amount from the Collective Trust that is equal in amount to the collateral the Fund would be required
34
to return to the borrower of the securities and the Fund would be required to make up for this shortfall. The Fund can also accept U.S. government securities and letters of credit (non-cash collateral) in connection with securities loans. In the event of default or bankruptcy by the lending agent, realization and/or retention of the collateral may be subject to legal proceedings. In the event the borrower fails to return loaned securities and the collateral received is insufficient to cover the value of the loaned securities and provided such collateral shortfall is not the result of investment losses, the lending agent has agreed to pay the amount of the shortfall to the Fund or, at the discretion of the lending agent, replace the loaned securities. The Fund continues to record dividends or interest, as applicable, on the securities loaned and are subject to changes in value of the securities loaned that may occur during the term of the loan. The Fund has the right under the Lending Agreement to recover the securities from the borrower on demand. With respect to security loans collateralized by non-cash collateral, the Fund receives loan premiums paid by the borrower. With respect to security loans collateralized by cash collateral, the earnings from the collateral investments are shared among the Fund, the security lending agent and the borrower. The Fund records security lending income net of allocations to the security lending agent and the borrower. The Fund had no securities out on loan during the year ended November 30, 2011.
10. Credit and Market Risk
Some countries in which the Fund may invest require governmental approval for the repatriation of investment income, capital or the proceeds of sales of securities by foreign investors. In addition, if there is deterioration in a country’s balance of payments or for other reasons, a country may impose temporary restrictions on foreign capital remittances abroad.
The securities exchanges of certain foreign markets are substantially smaller, less liquid and more volatile than the major securities markets in the United States. Consequently, acquisition and disposition of securities by the Fund may be inhibited. In addition, a significant portion of the aggregate market value of equity securities listed on the major securities exchanges in emerging markets is held by a smaller number of investors. This may limit the number of shares available for acquisition or disposition by the Fund.
Because the Fund concentrates its investments in securities issued by companies principally engaged in the infrastructure industry, the Fund has greater exposure to the potential adverse economic, regulatory, political, and other changes affecting such entities.
The Fund may invest up to 15% of its net assets in illiquid securities, which may include securities with contractual restrictions on resale, securities exempt from registration under Rule 144A of the Securities Act of 1933, as amended, and other securities which may not be readily marketable. The relative illiquidity of these securities may impair the Fund from disposing of them in a timely manner and at a fair price when it is necessary or desirable to do so. While maintaining oversight, the Fund’s Board has delegated to DMC, the day-to-day functions of determining whether individual securities are liquid for purposes of the Fund’s limitation on investments in illiquid securities. Securities eligible for resale pursuant to Rule 144A, which are determined
35
Notes to financial statements
Delaware Macquarie Global Infrastructure Fund
10. Credit and Market Risk (continued)
to be liquid, are not subject to the Fund’s 15% limit on investments in illiquid securities. As of November 30, 2011, no securities have been determined to be illiquid under the Fund’s liquidity Procedures. Rule 144A securities have been identified on the statement of net assets.
11. Contractual Obligations
The Fund enters into contracts in the normal course of business that contain a variety of indemnifications. The Fund’s maximum exposure under these arrangements is unknown. However, the Fund has not had prior claims or losses pursuant to these contracts. Management has reviewed the Fund’s existing contracts and expects the risk of loss to be remote.
12. Subsequent Events
Management has determined that no material events or transactions occurred subsequent to November 30, 2011 that would require recognition or disclosure in the Fund’s financial statements.
13. Tax Information (Unaudited)
The information set forth below is for the Fund’s fiscal year as required by federal laws. Shareholders, however, must report distributions on a calendar year basis for income tax purposes, which may include distributions for portions of two fiscal years of a fund. Accordingly, the information needed by shareholders for income tax purposes will be sent to them in January of each year. Please consult your tax advisor for proper treatment of this information. All designations are based on financial information available as of the date of this annual report and, accordingly are subject to change. For any and all items requiring designation, it is the intention of the Fund to designate the maximum amount permitted under the Internal Revenue Code and the regulations thereunder.
For the fiscal year ended November 30, 2011, the Fund designates distributions paid during the year as follows:
| (A) | Long-Term Capital Gains Distributions (Tax Basis) | | 0% |
| (B) | Ordinary Income Distributions* (Tax Basis) | | 100% |
| | Total Distributions (Tax Basis) | | 100% |
| (C) | Qualifying Dividends1 | | 92% |
(A) and (B) are based on a percentage of the Fund’s total distributions.
(C) is based on a percentage of the Fund’s ordinary income distributions.
1Qualifying dividends represent dividends which qualify for the corporate dividends received deduction.
*For the fiscal year ended November 30, 2011, certain dividends paid by the Fund may be subject to a maximum tax rate of 15%, as provided for by the Jobs and Growth Tax Relief Reconciliation Act of 2003 and as extended by Tax Relief, Unemployment Insurance Reauthorization and Jobs Creation Act of 2010. The Fund intends to designate up to a maximum amount of $246,016 to be taxed at maximum rate of 15%. Complete information will be computed and reported in conjunction with your 2011 Form 1099-DIV.
The Fund intends to pass through foreign tax credits in the maximum amount of $ 33,472. The gross foreign source income earned during the fiscal year 2011 by the Fund was $ 438,091.
36
Report of independent
registered public accounting firm
To the Board of Trustees of Delaware Group Global & International Funds
and the Shareholders of Delaware Macquarie Global Infrastructure Fund:
In our opinion, the accompanying statement of net assets and related statements of operations and of changes in net assets and the financial highlights present fairly, in all material respects, the financial position of Delaware Macquarie Global Infrastructure Fund (one of the series constituting Delaware Group Global & International Funds, hereafter referred to as the “Fund”) at November 30, 2011, the results of its operations for the year then ended and the changes in its net assets and the financial highlights for each of the periods presented, in conformity with accounting principles generally accepted in the United States of America. These financial statements and financial highlights (hereafter referred to as “financial statements”) are the responsibility of the Fund’s management; our responsibility is to express an opinion on these financial statements based on our audits. We conducted our audits of these financial statements in accordance with the standards of the Public Company Accounting Oversight Board (United States). Those standards require that we plan and perform the audit to obtain reasonable assurance about whether the financial statements are free of material misstatement. An audit includes examining, on a test basis, evidence supporting the amounts and disclosures in the financial statements, assessing the accounting principles used and significant estimates made by management, and evaluating the overall financial statement presentation. We believe that our audits, which included confirmation of securities at November 30, 2011 by correspondence with the custodian and broker, provide a reasonable basis for our opinion.
PricewaterhouseCoopers LLP
Philadelphia, Pennsylvania
January 23, 2012
37
Other Fund information
(Unaudited)
Delaware Macquarie Global Infrastructure Fund
Board Consideration of Delaware Macquarie Global Infrastructure Fund Investment Advisory Agreement
At a meeting held on August 16-17, 2011 (the “Annual Meeting”), the Board of Trustees (the “Board”), including a majority of disinterested or independent Trustees, approved the renewal of the Investment Advisory Agreement for the Delaware Macquarie Global Infrastructure Fund (the “Fund”). In making its decision, the Board considered information furnished specifically in connection with the renewal of the Investment Advisory Agreement with Delaware Management Company (“DMC”) and Sub-advisory Agreement with Macquarie Capital Investment Management LLC (“MCIM”), which included materials provided by DMC and its affiliates (“Delaware Investments”) concerning, among other things, the nature, extent and quality of services provided to the Fund, the costs of such services to the Fund, economies of scale and the financial condition and profitability of Delaware Investments. In addition, in connection with the Annual Meeting, reports were provided in May 2011 and included independent historical and comparative reports provided by Lipper, Inc., an independent statistical compilation organization (“Lipper”). The Lipper reports compared the Fund’s investment performance and expenses with those of other comparable mutual funds. The independent Trustees reviewed and discussed the Lipper reports with independent legal counsel to the independent Trustees. The Board requested and received information regarding DMC’s policy with respect to advisory fee levels and its breakpoint philosophy; the structure of portfolio manager compensation; the investment manager’s profitability; and any constraints or limitations on the availability of securities in certain investment styles, which had in the past year inhibited, or which were likely in the future to inhibit, DMC’s or MCIM’s ability to invest fully in accordance with Fund policies.
In considering information relating to the approval of the Fund’s advisory and sub-advisory agreements, the independent Trustees received assistance and advice from and met separately with independent legal counsel to the independent Trustees. Although the Board gave attention to all information furnished, the following discussion identifies, under separate headings, the primary factors taken into account by the Board during its contract renewal considerations.
Nature, Extent and Quality of Service. The Board considered the services provided by Delaware Investments to the Fund and its shareholders. In reviewing the nature, extent and quality of services, the Board considered reports furnished to it throughout the year, which covered matters such as the relative performance of the Fund, compliance of portfolio managers with the investment policies, strategies and restrictions for the Fund, compliance by DMC and Delaware Distributors, L.P. (together, “Management”) personnel with the Code of Ethics adopted throughout the Delaware Investments Family of Funds complex and adherence to fair value pricing procedures as established by the Board. The Board was pleased with the current staffing of the Fund’s investment advisor and the emphasis placed on research in the investment process. The Board gave favorable consideration to DMC’s efforts to control expenditures while maintaining service levels committed to fund matters. The Board noted that in July 2011 Management implemented measures to reduce overall costs and improve transfer agent and shareholder servicing functions through outsourcing.
38
It is expected that such measures will improve the quality and lower the cost of delivering transfer agent and shareholder servicing services to the Fund. The Board once again noted the benefits provided to Fund shareholders through each shareholder’s ability to exchange an investment in one Delaware Investments fund for the same class of shares in another Delaware Investments fund without a sales charge, to reinvest Fund dividends into additional shares of the Fund or into additional shares of other Delaware Investments funds and the privilege to combine holdings in other Delaware Investments funds to obtain a reduced sales charge. The Board was satisfied with the nature, extent and quality of the overall services provided by Delaware Investments.
Nature, Extent and Quality of Service. The Board considered the services provided by MCIM to the Fund and its shareholders. In reviewing the nature, extent and quality of services, the Board noted that reports were furnished to it throughout the year at regular Board Meetings covering matters such as relative performance of the Fund, compliance of portfolio managers with the investment policies, strategies and restrictions for the Fund, and the compliance of MCIM personnel with the Code of Ethics. The Board was pleased with the current staffing of MCIM and the emphasis placed on research in the investment process. The Board was satisfied with the nature, extent and quality of the overall services provided by MCIM.
Investment Performance. The Board placed significant emphasis on the investment performance of the Fund in view of its importance to shareholders. Although the Board gave appropriate consideration to performance reports and discussions with portfolio managers at Investment Committee meetings throughout the year, the Board gave particular weight to the Lipper reports furnished for the Annual Meeting. The Lipper reports prepared for the Fund showed the investment performance of its Class A shares in comparison to a group of similar funds as selected by Lipper (the “Performance Universe”). A fund with the best performance ranked first, and a fund with the poorest performance ranked last. The highest/best performing 25% of funds in the Performance Universe make up the first quartile; the next 25%, the second quartile; the next 25%, the third quartile; and the poorest/ worst performing 25% of funds in the Performance Universe make up the fourth quartile. Comparative annualized performance for the Fund was shown for the past one-, three-, five- and ten-year periods, as applicable, ended March 31, 2011. The Board’s objective is that the Fund’s performance for the periods considered be at or above the median of its Performance Universe. The following paragraph summarizes the performance results for the Fund and the Board’s view of such performance.
The Performance Universe for the Fund consisted of the Fund and all retail and institutional specialty and miscellaneous funds as selected by Lipper. The Lipper report comparison showed that the Fund’s total return for the one-year period was in the third quartile of its Performance Universe. The Fund’s performance results were not in line with the Board’s objective. In evaluating the Fund’s performance, the Board considered the Fund’s recent inception. The Board
39
Other Fund information
(Unaudited)
Delaware Macquarie Global Infrastructure Fund
Board Consideration of Delaware Macquarie Global Infrastructure Fund Investment Advisory Agreement (continued)
also considered the numerous investment and performance reports delivered by Management personnel to the Board’s Investments Committee. The Board was satisfied that Management was taking action to improve Fund performance and meet the Board’s performance objective.
Comparative Expenses. The Board considered expense comparison data for the Delaware Investments Family of Funds. Management provided the Board with information on pricing levels and fee structures for the Fund as of its most recently completed fiscal year. The Board also focused on the comparative analysis of effective management fees and total expense ratios of the Fund versus effective management fees and expense ratios of a group of similar funds as selected by Lipper (the “Expense Group”). In reviewing comparative costs, the Fund’s contractual management fee and the actual management fee incurred by the Fund were compared with the contractual management fees (assuming all funds in the Expense Group were similar in size to the Fund) and actual management fees (as reported by each fund) within the Expense Group, taking into account any applicable breakpoints and fee waivers. The Fund’s total expenses were also compared with those of its Expense Group. The Lipper total expenses, for comparative consistency, were shown by Lipper for Class A shares and comparative total expenses including 12b-1 and non 12b-1 service fees. The Board considered fees paid to Delaware Investments for non-management services. The Board’s objective is to limit the Fund’s total expense ratio to be competitive with that of the Expense Group. The following paragraph summarizes the expense results for the Fund and the Board’s view of such expenses.
The expense comparisons for the Fund showed that its contractual management fee and total expenses were in the quartile with the second lowest expenses of its Expense Group. The Board was satisfied with the management fee and total expenses of the Fund in comparison to those of its Expense Group as shown in the Lipper report. The Board also considered the subadvisory fee charged by MCIM with respect to the Fund as well as information on the fees charged by MCIM to other open-end mutual funds it subadvises that utilize a similar investment strategy.
Management Profitability. The Board considered the level of profits realized by Delaware Investments in connection with the operation of the Fund. In this respect, the Board reviewed the Investment Management Profitability Analysis that addressed the overall profitability of Delaware Investments’ business in providing management and other services to each of the individual funds and the Delaware Investments Family of Funds as a whole. Specific attention was given to the methodology followed in allocating costs for the purpose of determining profitability. Management stated that the level of profits of Delaware Investments, to a certain extent, reflect recent operational cost savings and efficiencies initiated by Delaware Investments. The Board considered Delaware Investments’ efforts to improve services provided to fund shareholders and to meet additional regulatory and compliance requirements resulting from recent industry-wide Securities and Exchange Commission initiatives. The Board was also given proforma profitability information
40
provided by MCIM with respect to the Fund. The Board also considered the extent to which Delaware Investments and MCIM might derive ancillary benefits from fund operations, including the potential for procuring additional business as a result of the prestige and visibility associated with its role as service provider to the Delaware Investments Family of Funds and the benefits from allocation of fund brokerage to improve trading efficiencies. The Board found that the management fees were reasonable in light of the services rendered and the level of profitability of Delaware Investments.
Economies of Scale. The Trustees considered whether economies of scale are realized by Delaware Investments as the Fund’s assets increase and the extent to which any economies of scale are reflected in the level of management fees charged. The Trustees reviewed the standardized advisory fee pricing and structure, approved by the Board and shareholders, which includes breakpoints. Breakpoints in the advisory fee occur when the advisory fee rate is reduced on assets in excess of specified levels. Breakpoints result in a lower advisory fee than would otherwise be the case on all assets when the asset levels specified are exceeded. The Board noted that the fee under the Fund’s management contract did not fall within the standard structure. Management explained that, due to the unique nature of the infrastructure industry, the Fund’s pricing structure should fall between the standard fees for international equity funds and special international equity funds. Although the Fund has not reached a size at which it can take advantage of breakpoints, the Board recognized that the fee was structured so that when the Fund grows, economies of scale may be shared.
41
Board of trustees/directors and officers addendum
Delaware Investments® Family of Funds
A mutual fund is governed by a Board of Trustees/Directors (“Trustees”), which has oversight responsibility for the management of a fund’s business affairs. Trustees establish procedures and oversee and review the performance of the investment manager, the distributor, and others who perform services for the fund. The independent fund trustees, in particular, are advocates
| Name, Address, | | Position(s) | | Length of |
| and Birth Date | | Held with Fund(s) | | Time Served |
| Interested Trustees | | | | |
| | | | | |
| Patrick P. Coyne1 | | Chairman, President, | | Chairman and Trustee |
| 2005 Market Street | | Chief Executive Officer, | | since August 16, 2006 |
| Philadelphia, PA 19103 | | and Trustee | | |
| April 1963 | | | | President and |
| | | | | Chief Executive Officer |
| | | | | since August 1, 2006 |
| | | | | |
| | | | | |
| | | | | |
| | | | | |
| | | | | |
| | | | | |
| | | | | |
| | | | | |
| | | | | |
| | | | | |
| | | | | |
| | | | | |
| | | | | |
| | | | | |
| | | | | |
| | | | | |
| | | | | |
| | | | | |
1 Patrick P. Coyne is considered to be an “Interested Trustee” because he is an executive officer of the Fund’s(s’) investment advisor.
42
for shareholder interests. Each trustee has served in that capacity since he or she was elected to or appointed to the Board of Trustees, and will continue to serve until his or her retirement or the election of a new trustee in his or her place. The following is a list of the Trustees and Officers with certain background and related information.
| | Number of Portfolios in | | |
| Principal Occupation(s) | | Fund Complex Overseen | | Other Directorships |
| During Past 5 Years | | by Trustee or Officer | | Held by Trustee or Officer |
| |
| |
| Patrick P. Coyne has served in | | 74 | | Director and Audit |
| various executive capacities | | | | Committee Member |
| at different times at | | | | Kaydon Corp. |
| Delaware Investments.2 | | | | |
| | | | Board of Governors Member |
| | | | Investment Company |
| | | | Institute (ICI) |
| |
| | | | Finance Committee Member |
| | | | St. John Vianney Roman |
| | | | Catholic Church |
| |
| | | | Board of Trustees |
| | | | Agnes Irwin School |
| |
| | | | Member of Investment |
| | | | Committee |
| | | | Cradle of Liberty Council, |
| | | | BSA |
| | | | (2007–2010) |
| | | | |
| | | | |
| | | | |
2 Delaware Investments is the marketing name for Delaware Management Holdings, Inc. and its subsidiaries, including the Fund’s(s’) investment advisor, principal underwriter, and its transfer agent.
43
Board of trustees/directors and officers addendum
Delaware Investments® Family of Funds
| Name, Address, | | Position(s) | | Length of |
| and Birth Date | | Held with Fund(s) | | Time Served |
| Independent Trustees | | | | |
| |
| Thomas L. Bennett | | Trustee | | Since March 2005 |
| 2005 Market Street | | | | |
| Philadelphia, PA 19103 | | | | |
| October 1947 | | | | |
| |
| |
| |
| |
| |
| |
| |
| |
| |
| |
| |
| John A. Fry | | Trustee | | Since January 2001 |
| 2005 Market Street | | | | |
| Philadelphia, PA 19103 | | | | |
| May 1960 | | | | |
| |
| |
| |
| |
| |
| |
| |
| |
| |
| |
| |
| Anthony D. Knerr | | Trustee | | Since April 1990 |
| 2005 Market Street | | | | |
| Philadelphia, PA 19103 | | | | |
| December 1938 | | | | |
| |
| Lucinda S. Landreth | | Trustee | | Since March 2005 |
| 2005 Market Street | | | | |
| Philadelphia, PA 19103 | | | | |
| June 1947 | | | | |
| |
44
| | | Number of Portfolios in | | |
| Principal Occupation(s) | | Fund Complex Overseen | | Other Directorships |
| During Past 5 Years | | by Trustee or Officer | | Held by Trustee or Officer |
| | | | | |
| |
| Private Investor | | 74 | | Chairman of Investment |
| (March 2004–Present) | | | | Committee |
| | | | Pennsylvania Academy of |
| Investment Manager | | | | Fine Arts |
| Morgan Stanley & Co. | | | | |
| (January 1984–March 2004) | | | | Investment Committee and |
| | | | | Governance Committee |
| | | | | Member |
| | | | | Pennsylvania Horticultural |
| | | | | Society |
| | | | | |
| | | | | Director |
| | | | | Bryn Mawr Bank Corp. (BMTC) |
| | | | | (2007–2011) |
| |
| President | | 74 | | Board of Governors Member — |
| Drexel University | | | | NASDAQ OMX PHLX LLC |
| (August 2010–Present) | | | | |
| | | | | Director and Audit |
| President | | | | Committee Member |
| Franklin & Marshall College | | | | Community Health Systems |
| (July 2002–July 2010) | | | | |
| | | | | Director — Ecore |
| | | | International |
| | | | (2009–2010) |
| | | | |
| | | | Director — Allied |
| | | | Barton Securities Holdings |
| | | | (2005–2008) |
| |
| Managing Director | | 74 | | None |
| Anthony Knerr & Associates | | | | |
| (Strategic Consulting) | | | | |
| (1990–Present) | | | | |
| |
| Chief Investment Officer | | 74 | | None |
| Assurant, Inc. (Insurance) | | | | |
| (2002–2004) | | | | |
| | | | | |
| |
45
Board of trustees/directors and officers addendum
Delaware Investments® Family of Funds
| Name, Address, | | Position(s) | | Length of |
| and Birth Date | | Held with Fund(s) | | Time Served |
| Independent Trustees (continued) | | | | |
| |
| Ann R. Leven | | Trustee | | Since October 1989 |
| 2005 Market Street | | | | |
| Philadelphia, PA 19103 | | | | |
| November 1940 | | | | |
| |
| |
| |
| |
| |
| |
| |
| Frances A. Sevilla-Sacasa | | Trustee | | Since September 2011 |
| 2005 Market Street | | | | |
| Philadelphia, PA 19103 | | | | |
| January 1956 | | | | |
| |
| |
| |
| |
| |
| |
| |
| |
| |
| |
| |
| |
| |
| |
| |
| |
| |
| |
| |
| |
| |
| |
| |
| |
| |
| |
| |
46
| | Number of Portfolios in | | |
| Principal Occupation(s) | | Fund Complex Overseen | | Other Directorships |
| During Past 5 Years | | by Trustee or Officer | | Held by Trustee or Officer |
| |
| |
| Consultant | | 74 | | Director and Audit |
| ARL Associates | | | | Committee Chair |
| (Financial Planning) | | | | Systemax Inc. |
| (1983–Present) | | | | (2001–2009) |
| |
| | | | Director and Audit |
| | | | Committee Chairperson |
| | | | Andy Warhol Foundation |
| | | | (1999–2007) |
| | | | |
| Executive Advisor to Dean | | 74 | | Trust Manager — Camden |
| (since August 2011) and | | | | Property Trust |
| Interim Dean | | | | (since August 2011) |
| (January 2011–July 2011) — | | | | |
| University of Miami School of | | | | Board of Trustees |
| Business Administration | | | | Thunderbird School of |
| | | | | Global Management |
| President — U.S. Trust, | | | | (2007–2011) |
| Bank of America Private | | | | |
| Wealth Management | | | | Board of Trustees |
| (Private Banking) | | | | Carrollton School of the |
| (July 2007–December 2008) | | | | Sacred Heart |
| | | | | (since 2007) |
| President and Director | | | | |
| (November 2005–June 2007) and | | | | Board Member |
| Chief Executive Officer | | | | Foreign Policy Association |
| (April 2007–June 2007) — | | | | (since 2006) |
| U.S. Trust Company | | | | |
| (Private Banking) | | | | Board of Trustees |
| | | | Georgetown Preparatory School |
| | | | (2005–2011) |
| |
| | | | Board of Trustees |
| | | | Miami City Ballet |
| | | | (2000–2011) |
| |
| | | | Board of Trustees |
| | | | St. Thomas University |
| | | | (2005–2011) |
| | | | |
47
Board of trustees/directors and officers addendum
Delaware Investments® Family of Funds
| Name, Address, | | Position(s) | | Length of |
| and Birth Date | | Held with Fund(s) | | Time Served |
| Independent Trustees (continued) | | | | |
| |
| Janet L. Yeomans | | Trustee | | Since April 1999 |
| 2005 Market Street | | | | |
| Philadelphia, PA 19103 | | | | |
| July 1948 | | | | |
| |
| |
| |
| |
| J. Richard Zecher | | Trustee | | Since March 2005 |
| 2005 Market Street | | | | |
| Philadelphia, PA 19103 | | | | |
| July 1940 | | | | |
| |
| |
| | | | | |
| | | | | |
| | | | | |
| | | | | |
| | | | | |
| | | | | |
| | | | | |
| | | | | |
| | | | | |
| | | | | |
| | | | | |
| | | | | |
| | | | | |
| | | | | |
| |
48
| | Number of Portfolios in | | |
| Principal Occupation(s) | | Fund Complex Overseen | | Other Directorships |
| During Past 5 Years | | by Trustee or Officer | | Held by Trustee or Officer |
| |
| |
| Vice President and Treasurer | | 74 | | Director and Audit |
| (January 2006–Present) | | | | Committee Member |
| Vice President — Mergers & Acquisitions | | | | Okabena Company |
| (January 2003–January 2006), and | | | | |
| Vice President and Treasurer | | | | Chair — 3M |
| (July 1995–January 2003) | | | | Investment Management |
| 3M Corporation | | | | Company |
| | | | |
| Founder | | 74 | | Director and Audit |
| Investor Analytics | | | | Committee Member |
| (Risk Management) | | | | Investor Analytics |
| (May 1999–Present) | | | | |
| | | | | Director |
| Founder | | | | Oxigene, Inc. |
| Sutton Asset Management | | | | (2003–2008) |
| (Hedge Fund) | | | | |
| (September 1996–Present) | | | | |
| | | | | |
| | | | | |
| | | | | |
| | | | | |
| | | | | |
| | | | | |
| | | | | |
| | | | | |
| | | | | |
| | | | | |
| | | | | |
| | | | | |
49
Board of trustees/directors and officers addendum
Delaware Investments® Family of Funds
| Name, Address, | | Position(s) | | Length of |
| and Birth Date | | Held with Fund(s) | | Time Served |
| Officers | | | | |
| | | | | |
| David F. Connor | | Vice President, | | Vice President since |
| 2005 Market Street | | Deputy General | | September 2000 |
| Philadelphia, PA 19103 | | Counsel, and Secretary | | and Secretary since |
| December 1963 | | | | October 2005 |
| |
| |
| Daniel V. Geatens | | Vice President | | Treasurer |
| 2005 Market Street | | and Treasurer | | since October 2007 |
| Philadelphia, PA 19103 | | | | |
| October 1972 | | | | |
| |
| David P. O’Connor | | Senior Vice President, | | Senior Vice President, |
| 2005 Market Street | | General Counsel, | | General Counsel, and |
| Philadelphia, PA 19103 | | and Chief Legal Officer | | Chief Legal Officer |
| February 1966 | | | | since October 2005 |
| |
| Richard Salus | | Senior Vice President | | Chief Financial Officer |
| 2005 Market Street | | and Chief Financial Officer | | since November 2006 |
| Philadelphia, PA 19103 | | | | |
| October 1963 | | | | |
| |
The Statement of Additional Information for the Fund(s) includes additional information about the Trustees and Officers and is available, without charge, upon request by calling 800 523-1918.
50
| | Number of Portfolios in | | |
| Principal Occupation(s) | | Fund Complex Overseen | | Other Directorships |
| During Past 5 Years | | by Trustee or Officer | | Held by Trustee or Officer |
| |
| |
| David F. Connor has served as | | 74 | | None3 |
| Vice President and Deputy | | | | |
| General Counsel of | | | | |
| Delaware Investments | | | | |
| since 2000. | | | | |
| |
| Daniel V. Geatens has served | | 74 | | None3 |
| in various capacities at | | | | |
| different times at | | | | |
| Delaware Investments. | | | | |
| |
| David P. O’Connor has served in | | 74 | | None3 |
| various executive and legal | | | | |
| capacities at different times | | | | |
| at Delaware Investments. | | | | |
| |
| Richard Salus has served in | | 74 | | None3 |
| various executive capacities | | | | |
| at different times at | | | | |
| Delaware Investments. | | | | |
| |
3 David F. Connor, Daniel V. Geatens, David P. O’Connor, and Richard Salus serve in similar capacities for the six portfolios of the Optimum Fund Trust, which have the same investment advisor, principal underwriter, and transfer agent as the registrant.
51
About the organization
| Board of trustees |
Patrick P. Coyne
Chairman, President, and
Chief Executive Officer
Delaware Investments®
Family of Funds
Philadelphia, PA Thomas L. Bennett
Private Investor
Rosemont, PA John A. Fry
President
Drexel University
Philadelphia, PA | Anthony D. Knerr
Founder and Managing
Director
Anthony Knerr &
Associates
New York, NY Lucinda S. Landreth
Former Chief Investment
Officer
Assurant, Inc.
Philadelphia, PA | Ann R. Leven
Consultant
ARL Associates
New York, NY Frances A. Sevilla-Sacasa
Executive Advisor to Dean, University of Miami School of Business Administration Coral Gables, FL | Janet L. Yeomans
Vice President and
Treasurer
3M Corporation
St. Paul, MN J. Richard Zecher
Founder
Investor Analytics
Scottsdale, AZ |
| | | | |
| Affiliated officers |
David F. Connor
Vice President, Deputy
General Counsel, and
Secretary
Delaware Investments
Family of Funds
Philadelphia, PA | Daniel V. Geatens
Vice President and
Treasurer
Delaware Investments
Family of Funds
Philadelphia, PA | David P. O’Connor
Senior Vice President,
General Counsel,
and Chief Legal Officer
Delaware Investments
Family of Funds
Philadelphia, PA | Richard Salus
Senior Vice President and
Chief Financial Officer
Delaware Investments
Family of Funds
Philadelphia, PA |
| This annual report is for the information of Delaware Macquarie Global Infrastructure Fund shareholders, but it may be used with prospective investors when preceded or accompanied by the Delaware Investments Fund fact sheet for the most recently completed calendar quarter. These documents are available at www.delawareinvestments.com. |
| Delaware Investments is the marketing name of Delaware Management Holdings, Inc. and its subsidiaries. |
The Fund files its complete schedule of portfolio holdings with the Securities and Exchange Commission (SEC) for the first and third quarters of each fiscal year on Form N-Q. The Fund’s Forms N-Q, as well as a description of the policies and procedures that the Fund uses to determine how to vote proxies (if any) relating to portfolio securities are available without charge (i) upon request, by calling 800 523-1918; and (ii) on the SEC’s website at www.sec.gov. In addition, a description of the policies and procedures that the Fund uses to determine how to vote proxies (if any) relating to portfolio securities and the Fund’s Schedule of Investments are available without charge on the Fund’s website at www.delawareinvestments.com. The Fund’s Forms N-Q may be reviewed and copied at the SEC’s Public Reference Room in Washington, D.C.; information on the operation of the Public Reference Room may be obtained by calling 800 SEC-0330.
Information (if any) regarding how the Fund voted proxies relating to portfolio securities during the most recently disclosed 12-month period ended June 30 is available without charge (i) through the Funds’ website at www.delawareinvestments.com; and (ii) on the SEC’s website at www.sec.gov.
52
Item 2. Code of Ethics
The registrant has adopted a code of ethics that applies to the registrant’s principal executive officer, principal financial officer, principal accounting officer or controller, or persons performing similar functions, regardless of whether these individuals are employed by the registrant or a third party. A copy of the registrant’s Code of Business Ethics has been posted on the Delaware Investments Internet Web site at www.delawareinvestments.com. Any amendments to the Code of Business Ethics, and information on any waiver from its provisions granted by the registrant, will also be posted on this Web site within five business days of such amendment or waiver and will remain on the Web site for at least 12 months.
Item 3. Audit Committee Financial Expert
The registrant’s Board of Trustees/Directors has determined that certain members of the registrant’s Audit Committee are audit committee financial experts, as defined below. For purposes of this item, an “audit committee financial expert” is a person who has the following attributes:
a. An understanding of generally accepted accounting principles and financial statements;
b. The ability to assess the general application of such principles in connection with the accounting for estimates, accruals, and reserves;
c. Experience preparing, auditing, analyzing, or evaluating financial statements that present a breadth and level of complexity of accounting issues that are generally comparable to the breadth and complexity of issues that can reasonably be expected to be raised by the registrant’s financial statements, or experience actively supervising one or more persons engaged in such activities;
d. An understanding of internal controls and procedures for financial reporting; and
e. An understanding of audit committee functions.
An “audit committee financial expert” shall have acquired such attributes through:
a. Education and experience as a principal financial officer, principal accounting officer, controller, public accountant, or auditor or experience in one or more positions that involve the performance of similar functions;
b. Experience actively supervising a principal financial officer, principal accounting officer, controller, public accountant, auditor, or person performing similar functions;
c. Experience overseeing or assessing the performance of companies or public accountants with respect to the preparation, auditing, or evaluation of financial statements; or
d. Other relevant experience.
The registrant’s Board of Trustees/Directors has also determined that each member of the registrant’s Audit Committee is independent. In order to be “independent” for purposes of this item, the Audit Committee member may not: (i) other than in his or her capacity as a member of the Board of Trustees/Directors or any committee thereof, accept directly or indirectly any consulting, advisory or other compensatory fee from the issuer; or (ii) be an “interested person” of the registrant as defined in Section 2(a)(19) of the Investment Company Act of 1940.
The names of the audit committee financial experts on the registrant’s Audit Committee are set forth below:
John A. Fry
Frances A. Sevilla-Sacasa
Janet L. Yeomans
Item 4. Principal Accountant Fees and Services
(a) Audit fees.
The aggregate fees billed for services provided to the registrant by its independent auditors for the audit of the registrant’s annual financial statements and for services normally provided by the independent auditors in connection with statutory and regulatory filings or engagements were $139,570 for the fiscal year ended November 30, 2011.
The aggregate fees billed for services provided to the registrant by its independent auditors for the audit of the registrant’s annual financial statements and for services normally provided by the independent auditors in connection with statutory and regulatory filings or engagements were $94,300 for the fiscal year ended November 30, 2010.
(b) Audit-related fees.
The aggregate fees billed by the registrant’s independent auditors for services relating to the performance of the audit of the registrant’s financial statements and not reported under paragraph (a) of this Item were $0 for the fiscal year ended November 30, 2011.
The aggregate fees billed by the registrant’s independent auditors for services relating to the performance of the audit of the financial statements of the registrant’s investment adviser and other service providers under common control with the adviser and that relate directly to the operations or financial reporting of the registrant were $593,000 for the registrant’s fiscal year ended November 30, 2011. The percentage of these fees relating to services approved by the registrant’s Audit Committee pursuant to the de minimis exception from the pre-approval requirement in Rule 2-01(c)(7)(i)(C) of Regulation S-X was 0%. These audit-related services were as follows: year end audit procedures; reporting up and subsidiary statutory audits.
The aggregate fees billed by the registrant’s independent auditors for services relating to the performance of the audit of the registrant’s financial statements and not reported under paragraph (a) of this Item were $0 for the fiscal year ended November 30, 2010.
The aggregate fees billed by the registrant’s independent auditors for services relating to the performance of the audit of the financial statements of the registrant’s investment adviser and other service providers under common control with the adviser and that relate directly to the operations or financial reporting of the registrant were $84,000 for the registrant’s fiscal year ended November 30, 2010. The percentage of these fees relating to services approved by the registrant’s Audit Committee pursuant to the de minimis exception from the pre-approval requirement in Rule 2-01(c)(7)(i)(C) of Regulation S-X was 0%. These audit-related services were as follows: audit procedures performed on Delaware Investments for its consolidation into Macquarie’s financial statements as of March 31, 2010.
(c) Tax fees.
The aggregate fees billed by the registrant’s independent auditors for tax-related services provided to the registrant were $27,350 for the fiscal year ended November 30, 2011. The percentage of these fees relating to services approved by the registrant’s Audit Committee pursuant to the de minimis exception from the pre-approval requirement in Rule 2-01(c)(7)(i)(C) of Regulation S-X was 0%. These tax-related services were as follows: review of income tax returns and review of annual excise distribution calculations.
The aggregate fees billed by the registrant’s independent auditors for tax-related services provided to the registrant’s investment adviser and other service providers under common control with the adviser and that relate directly to the operations or financial reporting of the registrant were $0 for the registrant’s fiscal year ended November 30, 2011.
The aggregate fees billed by the registrant’s independent auditors for tax-related services provided to the registrant were $17,250 for the fiscal year ended November 30, 2010. The percentage of these fees relating to services approved by the registrant’s Audit Committee pursuant to the de minimis exception from the pre-approval requirement in Rule 2-01(c)(7)(i)(C) of Regulation S-X was 0%. These tax-related services were as follows: review of income tax returns and review of annual excise distribution calculations.
The aggregate fees billed by the registrant’s independent auditors for tax-related services provided to the registrant’s investment adviser and other service providers under common control with the adviser and that relate directly to the operations or financial reporting of the registrant were $10,000 for the registrant’s fiscal year ended November 30, 2010. The percentage of these fees relating to services approved by the registrant’s Audit Committee pursuant to the de minimis exception from the pre-approval requirement in Rule 2-01(c)(7)(i)(C) of Regulation S-X was 0%. These tax-related services were as follows: state and local tax services.
(d) All other fees.
The aggregate fees billed for all services provided by the independent auditors to the registrant other than those set forth in paragraphs (a), (b) and (c) of this Item were $0 for the fiscal year ended November 30, 2011.
The aggregate fees billed for all services other than those set forth in paragraphs (b) and (c) of this Item provided by the registrant’s independent auditors to the registrant’s adviser and other service providers under common control with the adviser and that relate directly to the operations or financial reporting of the registrant were $25,000 for the registrant’s fiscal year ended November 30, 2011. The percentage of these fees relating to services approved by the registrant’s Audit Committee pursuant to the de minimis exception from the pre-approval requirement in Rule 2-01(c)(7)(i)(C) of Regulation S-X was 0%. These other services were as follows: attest examination of management's assertion to the controls in place at the transfer agent to be in compliance with Rule 17ad-13(a)(3) of the Securities Exchange Act of 1934.
The aggregate fees billed for all services provided by the independent auditors to the registrant other than those set forth in paragraphs (a), (b) and (c) of this Item were $0 for the fiscal year ended November 30, 2010.
The aggregate fees billed for all services other than those set forth in paragraphs (b) and (c) of this Item provided by the registrant’s independent auditors to the registrant’s adviser and other service providers under common control with the adviser and that relate directly to the operations or financial reporting of the registrant were $0 for the registrant’s fiscal year ended November 30, 2010.
(e) The registrant’s Audit Committee has established pre-approval policies and procedures as permitted by Rule 2-01(c)(7)(i)(B) of Regulation S-X (the “Pre-Approval Policy”) with respect to services provided by the registrant’s independent auditors. Pursuant to the Pre-Approval Policy, the Audit Committee has pre-approved the services set forth in the table below with respect to the registrant up to the specified fee limits. Certain fee limits are based on aggregate fees to the registrant and other registrants within the Delaware Investments Family of Funds.
Service | Range of Fees |
| Audit Services | |
Statutory audits or financial audits for new Funds | up to $25,000 per Fund |
Services associated with SEC registration statements (e.g., Form N-1A, Form N-14, etc.), periodic reports and other documents filed with the SEC or other documents issued in connection with securities offerings (e.g., comfort letters for closed-end Fund offerings, consents), and assistance in responding to SEC comment letters | up to $10,000 per Fund |
Consultations by Fund management as to the accounting or disclosure treatment of transactions or events and/or the actual or potential impact of final or proposed rules, standards or interpretations by the SEC, FASB, or other regulatory or standard-setting bodies (Note: Under SEC rules, some consultations may be considered “audit-related services” rather than “audit services”) | up to $25,000 in the aggregate |
| Audit-Related Services | |
Consultations by Fund management as to the accounting or disclosure treatment of transactions or events and /or the actual or potential impact of final or proposed rules, standards or interpretations by the SEC, FASB, or other regulatory or standard-setting bodies (Note: Under SEC rules, some consultations may be considered “audit services” rather than “audit-related services”) | up to $25,000 in the aggregate |
| Tax Services | |
| U.S. federal, state and local and international tax planning and advice (e.g., consulting on statutory, regulatory or administrative developments, evaluation of Funds’ tax compliance function, etc.) | up to $25,000 in the aggregate |
| U.S. federal, state and local tax compliance (e.g., excise distribution reviews, etc.) | up to $5,000 per Fund |
| Review of federal, state, local and international income, franchise and other tax returns | up to $5,000 per Fund |
Under the Pre-Approval Policy, the Audit Committee has also pre-approved the services set forth in the table below with respect to the registrant’s investment adviser and other entities controlling, controlled by or under common control with the investment adviser that provide ongoing services to the registrant (the “Control Affiliates”) up to the specified fee limit. This fee limit is based on aggregate fees to the investment adviser and its Control Affiliates.
| Service | Range of Fees |
| Non-Audit Services | |
Services associated with periodic reports and other documents filed with the SEC and assistance in responding to SEC comment letters | up to $10,000 in the aggregate |
The Pre-Approval Policy requires the registrant’s independent auditors to report to the Audit Committee at each of its regular meetings regarding all services initiated since the last such report was rendered, including those services authorized by the Pre-Approval Policy.
(f) Not applicable.
(g) The aggregate non-audit fees billed by the registrant’s independent auditors for services rendered to the registrant and to its investment adviser and other service providers under common control with the adviser were $5,228,766 and $0 for the registrant’s fiscal years ended November 30, 2011 and November 30, 2010, respectively.
(h) In connection with its selection of the independent auditors, the registrant’s Audit Committee has considered the independent auditors’ provision of non-audit services to the registrant’s investment adviser and other service providers under common control with the adviser that were not required to be pre-approved pursuant to Rule 2-01(c)(7)(ii) of Regulation S-X. The Audit Committee has determined that the independent auditors’ provision of these services is compatible with maintaining the auditors’ independence.
Item 5. Audit Committee of Listed Registrants
Not applicable.
Item 6. Investments
(a) Included as part of report to shareholders filed under Item 1 of this Form N-CSR.
(b) Divestment of securities in accordance with Section 13(c) of the Investment Company Act of 1940.
Not applicable.
Item 7. Disclosure of Proxy Voting Policies and Procedures for Closed-End Management Investment Companies
Not applicable.
Item 8. Portfolio Managers of Closed-End Management Investment Companies
Not applicable.
Item 9. Purchases of Equity Securities by Closed-End Management Investment Company and Affiliated Purchasers
Not applicable.
Item 10. Submission of Matters to a Vote of Security Holders
Not applicable.
Item 11. Controls and Procedures
The registrant’s principal executive officer and principal financial officer have evaluated the registrant’s disclosure controls and procedures within 90 days of the filing of this report and have concluded that they are effective in providing reasonable assurance that the information required to be disclosed by the registrant in its reports or statements filed under the Securities Exchange Act of 1934 is recorded, processed, summarized and reported within the time periods specified in the rules and forms of the Securities and Exchange Commission.
There were no significant changes in the registrant’s internal control over financial reporting that occurred during the second fiscal quarter of the period covered by the report to stockholders included herein (i.e., the registrant’s fourth fiscal quarter) that have materially affected, or are reasonably likely to materially affect, the registrant’s internal control over financial reporting.
Item 12. Exhibits
| (a) | | (1) Code of Ethics |
| | |
| | Not applicable. |
| | |
| | (2) Certifications of Principal Executive Officer and Principal Financial Officer pursuant to Rule 30a-2 under the Investment Company Act of 1940 are attached hereto as Exhibit 99.CERT. |
| | |
| | (3) Written solicitations to purchase securities pursuant to Rule 23c-1 under the Securities Exchange Act of 1934. |
| | |
| | Not applicable. |
| | |
| (b) | | Certifications pursuant to Section 906 of the Sarbanes-Oxley Act of 2002 are furnished herewith as Exhibit 99.906CERT. |
SIGNATURES
Pursuant to the requirements of the Securities Exchange Act of 1934 and the Investment Company Act of 1940, the registrant has duly caused this report to be signed on its behalf, by the undersigned, thereunto duly authorized.
Name of Registrant: DELAWARE GROUP® GLOBAL & INTERNATIONAL FUNDS
| /s/ PATRICK P. COYNE |
| By: | Patrick P. Coyne |
| Title: | Chief Executive Officer |
| Date: | February 1, 2012 |
Pursuant to the requirements of the Securities Exchange Act of 1934 and the Investment Company Act of 1940, this report has been signed below by the following persons on behalf of the registrant and in the capacities and on the dates indicated.
| /s/ PATRICK P. COYNE |
| By: | Patrick P. Coyne |
| Title: | Chief Executive Officer |
| Date: | February 1, 2012 |
| /s/ RICHARD SALUS |
| By: | Richard Salus |
| Title: | Chief Financial Officer |
| Date: | February 1, 2012 |