UNITED STATES
SECURITIES AND EXCHANGE COMMISSION
Washington, D.C. 20549
FORM N-CSR
CERTIFIED SHAREHOLDER REPORT OF REGISTERED MANAGEMENT INVESTMENT COMPANIES
Investment Company Act file number_811-06336
__Franklin Templeton International Trust
(Exact name of registrant as specified in charter)
One Franklin Parkway, San Mateo, CA 94403-1906
(Address of principal executive offices) (Zip code)
Craig S. Tyle, One Franklin Parkway, San Mateo, CA 94403-1906
(Name and address of agent for service)
Registrant's telephone number, including area code:_650 312-2000
Date of fiscal year end: 10/31
Date of reporting period:_10/31/10
Item 1. Reports to Stockholders.

TEMPLETON
FOREIGN SMALLER COMPANIES FUND

Annual Report
Templeton Foreign Smaller Companies Fund
Your Fund’s Goal and Main Investments: Templeton Foreign Smaller Companies Fund seeks to provide long-term capital growth. Under normal market conditions, the Fund invests at least 80% of its net assets in investments of smaller companies located outside the U.S., including developing
markets.
Performance data represent past performance, which does not guarantee future results. Investment return and principal value will fluctuate, and you may have a gain or loss when you sell your shares. Current performance may differ from figures shown. Please visit franklintempleton.com or call (800) 342-5236 for most recent month-end performance.

We are pleased to bring you Templeton Foreign Smaller Companies Fund’s annual report for the fiscal year ended October 31, 2010.
Performance Overview
For the 12 months under review, Templeton Foreign Smaller Companies Fund – Class A delivered a cumulative total return of +21.71%. The Fund outperformed its benchmark, the Morgan Stanley Capital International (MSCI) Europe, Australasia, Far East (EAFE) Index, which had a total return
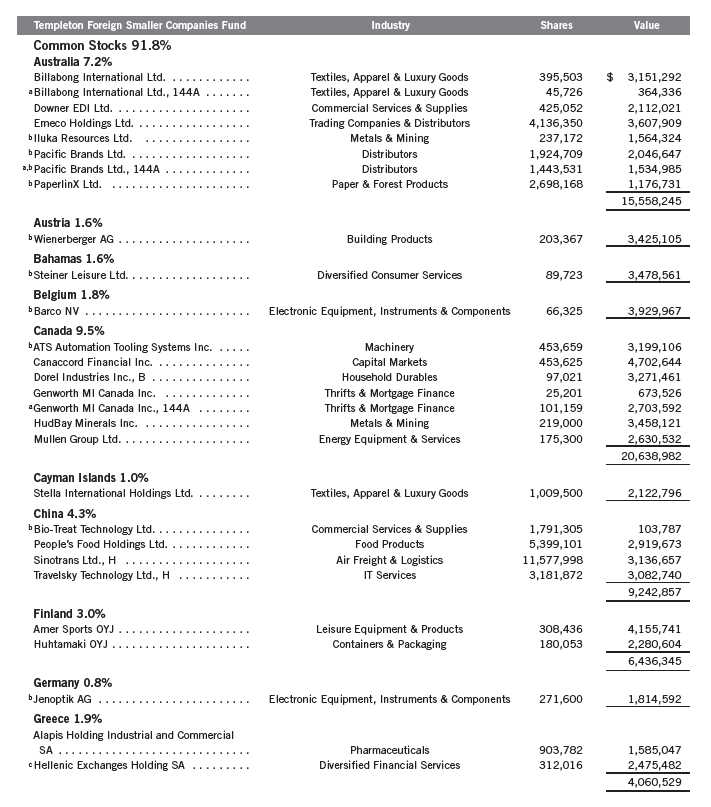
The dollar value, number of shares or principal amount, and names of all portfolio holdings are listed in the Fund’s Statement of Investments (SOI). The SOI begins on page 19.
Annual Report | 3
of +8.82% for the same period.1 Please note that index performance information is provided for reference and we do not attempt to track an index but rather undertake investments on the basis of fundamental research. You can find the Fund’s long-term performance data in the Performance Summary beginning on page 8.
Economic and Market Overview
During the 12-month period under review, equities generally advanced against a backdrop of heightened volatility and uneven global economic recovery. Emerging market regions enjoyed solid growth as they were unconstrained by the debt burdening western economies and benefited from strong local demand and significant capital inflows. Developed markets grew at a more subdued pace, with demand recovery and rising asset prices heavily underpinned by government sponsored, liquidity-enhancing measures. The official intervention took its toll on balance sheets of developed nations, and growing concerns of potential sovereign defaults in several European countries significantly roiled equity markets during the period. The European Central Bank responded by pledging 750 billion euros in the spring of 2010 to forestall defaults, stabilize markets and restore confidence in the euro. Most developed market policymakers kept interest rates at histo rically low levels and began quantitative easing programs, flooding the financial system with new money through direct asset purchases. The measures buoyed equities, headline growth continued to recover and corporate earnings rebounded sharply, but critical economic fundamentals such as employment, home prices and credit creation all remained substantially depressed, leading many investors to question the true health of the global economy and the sustainability of the recovery.
Although equities delivered solid gains during the period, heightened volatility reflected the anxiety underlying the market’s positive momentum. This anxiety was also expressed in general equity market performance trends. Although all market sectors delivered positive returns, gains were limited among most financial institutions, underscoring concerns about banks’ exposures to sovereign credit risk and maligned mortgage markets. Gains among energy stocks also lagged as a result of oil oversupply and the Gulf of Mexico spill disaster, while the already beleaguered health care sector was further weakened by threats of generic competition, increased regulation and reduced industry reimbursements from governments implementing austerity
1. Source: © 2010 Morningstar. All Rights Reserved. The information contained herein: (1) is proprietary to Morningstar and/or its content providers; (2) may not be copied or distributed; and (3) is not warranted to be accurate, complete or timely. Neither Morningstar nor its content providers are responsible for any damages or losses arising from any use of this information. The MSCI EAFE Index is a free float-adjusted, market capitalization-weighted index designed to measure equity market performance in global developed markets excluding the U.S. and Canada. The index is unmanaged and includes reinvested dividends. One cannot invest directly in an index, and an index is not representative of the Fund’s portfolio.
4 | Annual Report
measures. Market-leading sectors also illustrated broader trends that developed during the period. Low interest rates, government subsidies and aggressive stimulus helped spending recover, benefiting consumer discretionary stocks, while emerging market growth, state infrastructure programs and a corporate profit recovery helped buoy industrials sector equities. Strong returns from materials stocks resulted largely from robust emerging market commodity demand and growing concerns that stimulus-induced inflationary pressures could devalue currencies. The unresolved tension between inflationary and deflationary forces remained a constant backdrop during the period, with commodity and equity prices indicating the presence of the former and bond yields, personal incomes and property values suggesting the latter.
Investment Strategy
We take a bottom-up, value-oriented, long-term approach to investing. We focus our analysis on the market price of a company’s securities relative to our evaluation of the company’s long-term earnings, asset value and cash flow potential. We also consider a company’s price/earnings ratio, profit margins and liquidation value. We are patient investors and may hold a security for several years as we wait for the market to recognize a company’s true worth.
Manager’s Discussion
A majority of the Fund’s holdings posted positive total returns during the period under review. Three of our best-performing investments were Giordano International, Panalpina Welttransport Holding and Iluka Resources.
Hong Kong retailer and distributor Giordano International’s share price advanced strongly during the period due to favorable monthly operational data and an improving economic backdrop that raised investor expectations for its quarterly earnings results. This added to Giordano’s full-year results, announced earlier in the reporting period, that were well above consensus expectations due to sharply improved sales margins and an unexpected special dividend. According to our analysis, at period-end Giordano continued to be well managed with strong financial discipline.
The Fund’s shares of Swiss transportation logistics company Panalpina Welttransport performed well during the period as investors appeared to recognize its high correlation to reviving global trade flows. Freight forwarding is Panalpina’s core operation, accounting for about 87% of its revenue. It is also the world’s third-largest air freight forwarder and the fourth-largest ocean freight forwarder. Looking at the longer term, we considered the company’s fundamentals solid, supported by a strong balance sheet with net cash. In our
Top 10 Sectors/Industries
10/31/10
| | |
| | % of Total | |
| | Net Assets | |
| Commercial Banks | 8.5 | % |
| Capital Markets | 7.7 | % |
| Textiles, Apparel & Luxury Goods | 7.6 | % |
| Household Durables | 5.3 | % |
| Machinery | 4.2 | % |
| Leisure Equipment & Products | 4.0 | % |
| Air Freight & Logistics | 4.0 | % |
| | |
| Electronic Equipment, Instruments & | | |
| Components | 3.9 | % |
| Specialty Retail | 3.2 | % |
| Distributors | 2.8 | % |
Annual Report | 5
| | | |
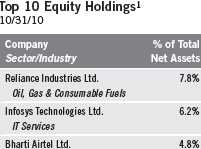
| Top 10 Equity Holdings | | |
| 10/31/10 | | | |
| |
| Company | | % of Total | |
| Sector/Industry, Country | Net Assets | |
| Panalpina Welttransport Holding AG | 2.5 | % |
| Air Freight & Logistics, Switzerland | | |
| Bank of Ayudhya Public Co. Ltd., fgn. | 2.4 | % |
| Commercial Banks, Thailand | | | |
| Canaccord Financial Inc. | | 2.2 | % |
| Capital Markets, Canada | | | |
| Dah Sing Financial Group | | 2.1 | % |
| Commercial Banks, Hong Kong | | | |
| TKH Group NV | | 1.9 | % |
| Communication Equipment, | | | |
| Netherlands | | | |
| Draka Holding NV | | 1.9 | % |
| Electrical Equipment, Netherlands | | |
| Mediq NV | | 1.9 | % |
| Health Care Providers & Services, | | |
| Netherlands | | | |
| Amer Sports OYJ | | 1.9 | % |
| | |
| Leisure Equipment & Products, Finland | | |
| Henderson Group PLC | 1.8 | % |
| Capital Markets, U.K. | | |
| Barco NV | 1.8 | % |
| Electronic Equipment, Instruments | | |
| & Components, Belgium | | |
6 | Annual Report
view, its business model is also asset light, high return and highly cash generative, and we believe the company has sufficient scale to maintain its competitive position.
Iluka Resources is a leading metals and mining firm with operations in its home base of Australia as well as in North America, Europe and Asia. The company’s core business involves the production and processing of mineral sands, but it also holds significant royalty interests in western Australia’s iron ore region. Iluka’s share price benefited from an improving demand outlook for industrial minerals, which triggered an increase in iron ore contract prices. Furthermore, new management has focused on divesting non-core assets while implementing a successful cost reduction program.
It is important to recognize the effect of currency movements on the Fund’s performance. In general, if the value of the U.S. dollar goes up compared with a foreign currency, an investment traded in that foreign currency will go down in value because it will be worth fewer U.S. dollars. This can have a negative effect on Fund performance. Conversely, when the U.S. dollar weakens in relation to a foreign currency, an investment traded in that foreign currency will increase in value, which can contribute to Fund performance. For the 12 months ended October 31, 2010, the U.S. dollar fell in value relative to most currencies. As a result, the Fund’s performance was positively affected by the portfolio’s predominant investment in securities with non-U.S. currency exposure. However, one cannot expect the same result in future periods.
In contrast, a few holdings disappointed during the Fund’s fiscal year under review. Three of our worst-performing investments were GAME Group, Niscayah Group and Pacific Brands.
U.K.-based GAME Group is Europe’s largest retailer of computer software, video games, electronic gaming consoles and related products. The company issued a weak trading statement during the period, with unit hardware sales increases unable to offset the effect of price cuts. Despite strong sales of the most popular new games, competition from supermarkets pressured GAME Group’s profit margins, and sales of less heavily supported games lagged. We believe GAME Group is a fundamentally strong company with a solid balance sheet and continued to hold it in the Fund’s portfolio at period-end.
Niscayah Group, formerly known as Securitas Systems, is a Swedish designer and installer of corporate security systems. Its top products include video surveillance, access control, intrusion protection and fire protection systems. Tepid economic conditions led to a drop in sales growth during the period, but the company undertook a large-scale restructuring program, which in our analysis has left it better positioned. Over the longer term, we believe Niscayah shows strong potential for margin growth as the business expands its installed security base and the number of associated service contracts.
Manufacturer and wholesaler Pacific Brands produces products for some of Australia’s most recognizable consumer labels. We believe Pacific is a well-run company with market-leading brands across all of its product categories, which are mostly defensive (non-cyclical) in nature. After strong performance at the beginning of the Fund’s fiscal year when investors focused on the potential for cost savings to drive company earnings higher during 2010, Pacific gave back some of its gains in the latter half of the fiscal year due to lackluster retail sales. However, we think recent company actions to cut costs and raise gross margins hold the potential to boost Pacific’s growth over the longer term.
Thank you for your continued participation in Templeton Foreign Smaller Companies Fund. We look forward to serving your future investment needs.


Bradley Radin, CFA

Harlan B. Hodes, CPA
Portfolio Management Team
Templeton Foreign Smaller Companies Fund
CFA® is a trademark owned by CFA Institute.
The foregoing information reflects our analysis, opinions and portfolio holdings as of October 31, 2010, the end of the reporting period. The way we implement our main investment strategies and the resulting portfolio holdings may change depending on factors such as market and economic conditions. These opinions may not be relied upon as investment advice or an offer for a particular security. The information is not a complete analysis of every aspect of any market, country, industry, security or the Fund. Statements of fact are from sources considered reliable, but the investment manager makes no representation or warranty as to their completeness or accuracy. Although historical performance is no guarantee of future results, these insights may help you understand our investment management philosophy.
Annual Report | 7
Performance Summary as of 10/31/10
Your dividend income will vary depending on dividends or interest paid by securities in the Fund’s portfolio, adjusted for operating expenses of each class. Capital gain distributions are net profits realized from the sale of portfolio securities. The performance table and graphs do not reflect any taxes that a shareholder would pay on Fund dividends, capital gain distributions, if any, or any realized gains on the sale of Fund shares. Total return reflects reinvestment of the Fund’s dividends and capital gain distributions, if any, and any unrealized gains or losses.
| | | | | | | | |
| Price and Distribution Information | | | | | | |
| |
| Class A (Symbol: FINEX) | | | | Change | | 10/31/10 | | 10/31/09 |
| Net Asset Value (NAV) | | | +$ | 2.65 | $ | 15.47 | $ | 12.82 |
| Distributions (11/1/09–10/31/10) | | | | | | | | |
| Dividend Income | $ | 0.1122 | | | | | | |
| Class B (Symbol: n/a) | | | | Change | | 10/31/10 | | 10/31/09 |
| Net Asset Value (NAV) | | | +$ | 2.49 | $ | 14.83 | $ | 12.34 |
| Distributions (11/1/09–10/31/10) | | | | | | | | |
| Dividend Income | $ | 0.0755 | | | | | | |
| Class C (Symbol: FCFSX) | | | | Change | | 10/31/10 | | 10/31/09 |
| Net Asset Value (NAV) | | | +$ | 2.50 | $ | 14.89 | $ | 12.39 |
| Distributions (11/1/09–10/31/10) | | | | | | | | |
| Dividend Income | $ | 0.0755 | | | | | | |
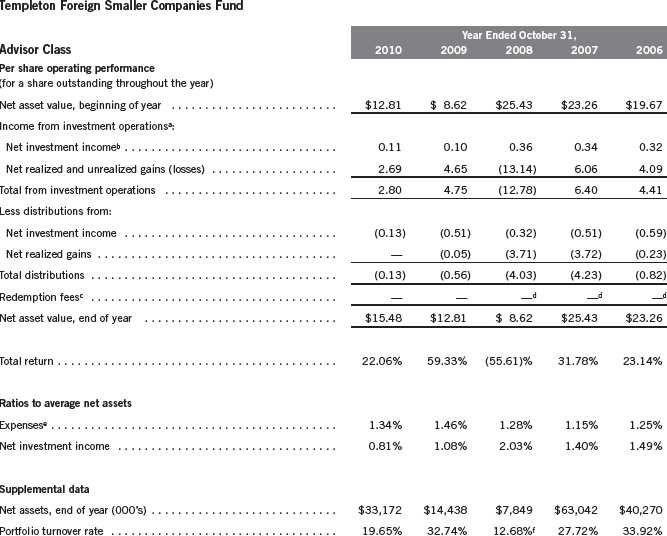
| Advisor Class (Symbol: FTFAX) | | | | Change | | 10/31/10 | | 10/31/09 |
| Net Asset Value (NAV) | | | +$ | 2.67 | $ | 15.48 | $ | 12.81 |
| Distributions (11/1/09–10/31/10) | | | | | | | | |
| Dividend Income | $ | 0.1311 | | | | | | |
8 | Annual Report
Performance Summary (continued)
Performance
Cumulative total return excludes sales charges. Average annual total returns and value of $10,000 investment include maximum sales charges. Class A: 5.75% maximum initial sales charge; Class B: contingent deferred sales charge (CDSC) declining from 4% to 1% over six years, and eliminated thereafter; Class C: 1% CDSC in first year only; Advisor Class: no sales charges.
| | | | | | | | | | | |
| Class A | | | | 1-Year | | | 5-Year | | | 10-Year | |
| Cumulative Total Return1 | | | + | 21.71 | % | + | 38.29 | % | + | 131.23 | % |
| Average Annual Total Return2 | | | + | 14.73 | % | + | 5.44 | % | + | 8.10 | % |
| Value of $10,000 Investment3 | | | $ | 11,473 | | $ | 13,031 | | $ | 21,793 | |
| Avg. Ann. Total Return (9/30/10)4 | | | + | 10.32 | % | + | 3.64 | % | + | 7.11 | % |
| Total Annual Operating Expenses5 | 1.71 | % | | | | | | | | | |
| Class B | | | | 1-Year | | | 5-Year | | | 10-Year | |
| Cumulative Total Return1 | | | + | 20.91 | % | + | 33.29 | % | + | 117.31 | % |
| Average Annual Total Return2 | | | + | 16.91 | % | + | 5.67 | % | + | 8.07 | % |
| Value of $10,000 Investment3 | | | $ | 11,691 | | $ | 13,175 | | $ | 21,731 | |
| Avg. Ann. Total Return (9/30/10)4 | | | + | 12.26 | % | + | 3.88 | % | + | 7.09 | % |
| Total Annual Operating Expenses5 | 2.45 | % | | | | | | | | | |
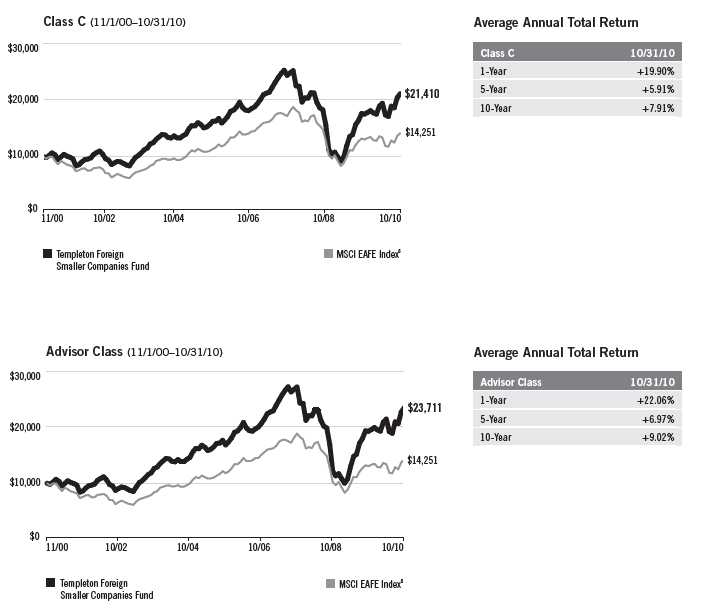
| Class C | | | | 1-Year | | | 5-Year | | | 10-Year | |
| Cumulative Total Return1 | | | + | 20.90 | % | + | 33.28 | % | + | 114.10 | % |
| Average Annual Total Return2 | | | + | 19.90 | % | + | 5.91 | % | + | 7.91 | % |
| Value of $10,000 Investment3 | | | $ | 11,990 | | $ | 13,328 | | $ | 21,410 | |
| Avg. Ann. Total Return (9/30/10)4 | | | + | 15.28 | % | + | 4.10 | % | + | 6.92 | % |
| Total Annual Operating Expenses5 | 2.46 | % | | | | | | | | | |
| Advisor Class | | | | 1-Year | | | 5-Year | | | 10-Year | |
| Cumulative Total Return1 | | | + | 22.06 | % | + | 40.09 | % | + | 137.11 | % |
| Average Annual Total Return2 | | | + | 22.06 | % | + | 6.97 | % | + | 9.02 | % |
| Value of $10,000 Investment3 | | | $ | 12,206 | | $ | 14,009 | | $ | 23,711 | |
| Avg. Ann. Total Return (9/3010)4 | | | + | 17.35 | % | + | 5.14 | % | + | 8.02 | % |
| Total Annual Operating Expenses5 | 1.46 | % | | | | | | | | | |
Performance data represent past performance, which does not guarantee future results. Investment return and principal value will fluctuate, and you may have a gain or loss when you sell your shares. Current performance may differ from figures shown. For most recent month-end performance, go to franklintempleton.com or call (800) 342-5236.
Annual Report | 9
Performance Summary (continued)
Total Return Index Comparison for a Hypothetical $10,000 Investment
Total return represents the change in value of an investment over the periods shown. It includes any current, applicable, maximum sales charge, Fund expenses, account fees and reinvested distributions. The unmanaged index includes reinvestment of any income or distributions. It differs from the Fund in composition and does not pay management fees or expenses. One cannot invest directly in an index.

10 | Annual Report
Performance Summary (continued)
Annual Report | 11
Performance Summary (continued)
Endnotes
Special risks are associated with foreign investing, including currency fluctuations, economic instability and political developments. Investments in emerging markets involve heightened risks related to the same factors, in addition to those associated with these markets’ smaller size and lesser liquidity. In addition, smaller company stocks have historically exhibited greater price volatility than large-company stocks, particularly over the short term. The Fund’s prospectus also includes a description of the main investment risks.
| |
Class B: Class C: | These shares have higher annual fees and expenses than Class A shares. Prior to 1/1/04, these shares were offered with an initial sales charge; thus actual total returns would have differed. These shares have higher annual fees and expenses than Class A shares. |
Advisor Class: | Shares are available to certain eligible investors as described in the prospectus. |
1. Cumulative total return represents the change in value of an investment over the periods indicated.
2. Average annual total return represents the average annual change in value of an investment over the periods indicated. 3. These figures represent the value of a hypothetical $10,000 investment in the Fund over the periods indicated.
4. In accordance with SEC rules, we provide standardized average annual total return information through the latest calendar quarter.
5. Figures are as stated in the Fund’s prospectus current as of the date of this report. In periods of market volatility, assets may decline significantly, causing total annual Fund operating expenses to become higher than the figures shown.
6. Source: © 2010 Morningstar. The MSCI EAFE Index is a free float-adjusted, market capitalization-weighted index designed to measure equity market performance in global developed markets excluding the U.S. and Canada.
12 | Annual Report
Your Fund’s Expenses
As a Fund shareholder, you can incur two types of costs:
- Transaction costs, including sales charges (loads) on Fund purchases; and
- Ongoing Fund costs, including management fees, distribution and service (12b-1) fees, and other Fund expenses. All mutual funds have ongoing costs, sometimes referred to as operating expenses.
The following table shows ongoing costs of investing in the Fund and can help you understand these costs and compare them with those of other mutual funds. The table assumes a $1,000 investment held for the six months indicated.
Actual Fund Expenses
The first line (Actual) for each share class listed in the table provides actual account values and expenses. The “Ending Account Value” is derived from the Fund’s actual return, which includes the effect of Fund expenses.
You can estimate the expenses you paid during the period by following these steps. Of course, your account value and expenses will differ from those in this illustration:
| 1. | Divide your account value by $1,000. |
| | If an account had an $8,600 value, then $8,600 ÷ $1,000 = 8.6. |
| 2. | Multiply the result by the number under the heading “Expenses Paid During Period.” |
| | If Expenses Paid During Period were $7.50, then 8.6 x $7.50 = $64.50. |
In this illustration, the estimated expenses paid this period are $64.50.
Hypothetical Example for Comparison with Other Funds
Information in the second line (Hypothetical) for each class in the table can help you compare ongoing costs of investing in the Fund with those of other mutual funds. This information may not be used to estimate the actual ending account balance or expenses you paid during the period. The hypothetical “Ending Account Value” is based on the actual expense ratio for each class and an assumed 5% annual rate of return before expenses, which does not represent the Fund’s actual return. The figure under the heading “Expenses Paid During Period” shows the hypothetical expenses your account would have incurred under this scenario. You can compare this figure with the 5% hypothetical examples that appear in shareholder reports of other funds.
Annual Report | 13
Your Fund’s Expenses (continued)
Please note that expenses shown in the table are meant to highlight ongoing costs and do not reflect any transaction costs, such as sales charges. Therefore, the second line for each class is useful in comparing ongoing costs only, and will not help you compare total costs of owning different funds. In addition, if transaction costs were included, your total costs would have been higher. Please refer to the Fund prospectus for additional information on operating expenses.
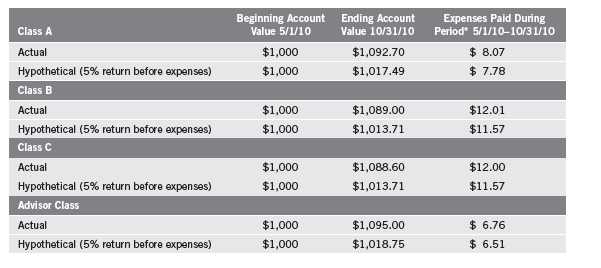
*Expenses are calculated using the most recent six-month expense ratio, annualized for each class (A: 1.53%; B: 2.28%; C: 2.28%; and Advisor: 1.28%), multiplied by the average account value over the period, multiplied by 184/365 to reflect the one-half year period.
14 | Annual Report
Franklin Templeton International Trust
Financial Highlights
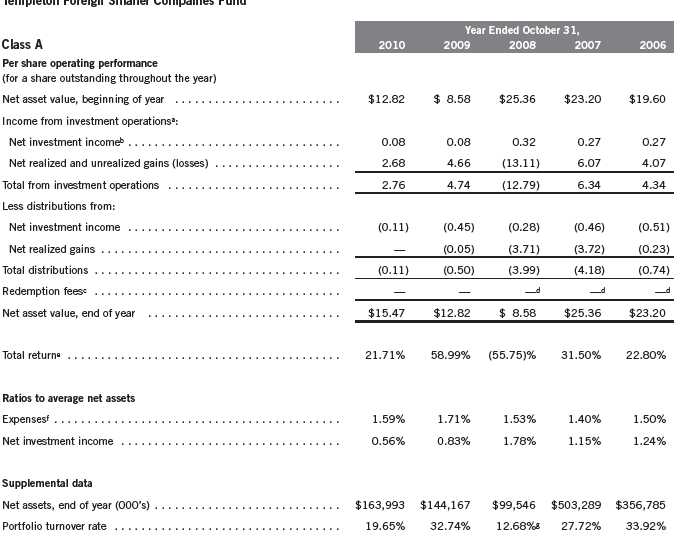

Annual Report | The accompanying notes are an integral part of these financial statements. | 15
Franklin Templeton International Trust
Financial Highlights (continued)
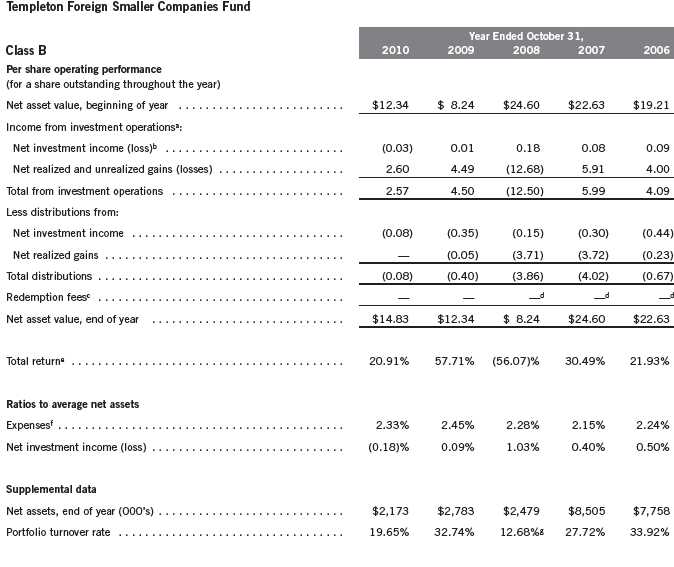

16 | The accompanying notes are an integral part of these financial statements. | Annual Report
Franklin Templeton International Trust
Financial Highlights (continued)
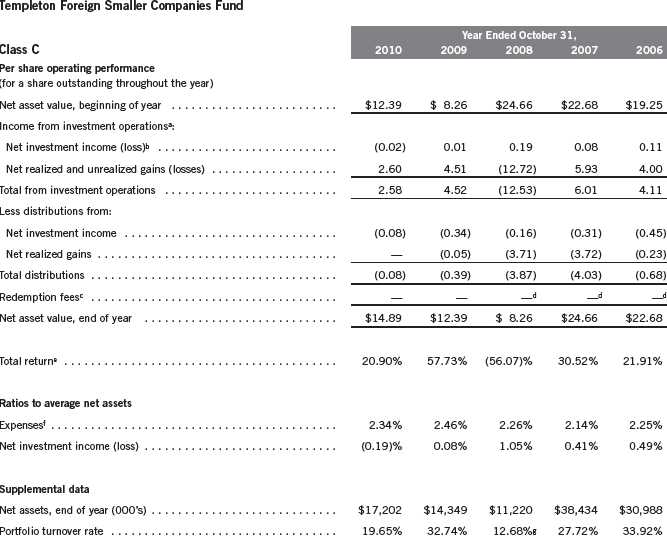
Annual Report | The accompanying notes are an integral part of these financial statements. | 17
Franklin Templeton International Trust
Financial Highlights (continued)

18 | The accompanying notes are an integral part of these financial statements. | Annual Report
Franklin Templeton International Trust
Statement of Investments, October 31, 2010
Annual Report | 19
Franklin Templeton International Trust
Statement of Investments, October 31, 2010 (continued)
| | | | |
| Templeton Foreign Smaller Companies Fund | Industry | Shares | | Value |
| Common Stocks (continued) | | | | |
| Hong Kong 8.7% | | | | |
| Asia Satellite Telecommunications Holdings | | | | |
| Ltd. | Diversified Telecommunication Services | 744,402 | $ | 1,334,863 |
| Dah Sing Financial Group | Commercial Banks | 650,069 | | 4,511,864 |
| bFountain Set (Holdings) Ltd. | Textiles, Apparel & Luxury Goods | 6,512,566 | | 1,159,432 |
| Giordano International Ltd. | Specialty Retail | 6,477,580 | | 3,885,796 |
| Hung Hing Printing Group Ltd. | Containers & Packaging | 1,030,260 | | 322,974 |
| Lerado Group (Holding) Co. Ltd. | Leisure Equipment & Products | 11,456,318 | | 2,172,584 |
| Texwinca Holdings Ltd. | Textiles, Apparel & Luxury Goods | 3,146,808 | | 3,430,372 |
| Yue Yuen Industrial Holdings Ltd. | Textiles, Apparel & Luxury Goods | 573,545 | | 2,056,963 |
| | | | | 18,874,848 |
| Japan 5.0% | | | | |
| Asics Corp. | Textiles, Apparel & Luxury Goods | 6,000 | | 64,790 |
| Descente Ltd. | Textiles, Apparel & Luxury Goods | 496,515 | | 2,517,280 |
| cen-japan Inc. | Professional Services | 1,416 | | 1,854,568 |
| Kobayashi Pharmaceutical Co. Ltd. | Personal Products | 68,379 | | 3,186,347 |
| bMEITEC Corp. | Professional Services | 41,048 | | 819,175 |
| cShinko Plantech Co. Ltd. | Energy Equipment & Services | 135,400 | | 1,255,153 |
| USS Co. Ltd. | Specialty Retail | 15,110 | | 1,175,379 |
| | | | | 10,872,692 |
| Netherlands 8.3% | | | | |
| Aalberts Industries NV | Machinery | 118,057 | | 2,156,746 |
| bDraka Holding NV | Electrical Equipment | 196,828 | | 4,191,663 |
| Mediq NV | Health Care Providers & Services | 207,886 | | 3,977,206 |
| SBM Offshore NV | Energy Equipment & Services | 84,008 | | 1,714,205 |
| TKH Group NV | Communications Equipment | 166,155 | | 4,139,754 |
| bUSG People NV | Professional Services | 92,854 | | 1,724,754 |
| | | | | 17,904,328 |
| Norway 0.9% | | | | |
| Tomra Systems ASA | Commercial Services & Supplies | 336,573 | | 2,050,873 |
| Singapore 0.2% | | | | |
| bHuan Hsin Holdings Ltd. | Electronic Equipment, Instruments & Components | 1,985,075 | | 429,388 |
| South Korea 6.5% | | | | |
| Binggrae Co. Ltd. | Food Products | 44,770 | | 2,165,841 |
| Busan Bank | Commercial Banks | 306,225 | | 3,812,494 |
| Daeduck Electronics Co. Ltd. | Electronic Equipment, Instruments & Components | 163,043 | | 1,213,579 |
| Daegu Bank Co. Ltd. | Commercial Banks | 156,515 | | 2,052,998 |
| INTOPS Co. Ltd. | Electronic Equipment, Instruments & Components | 48,182 | | 985,492 |
| Sindoh Co. Ltd. | Office Electronics | 50,366 | | 2,436,559 |
| Youngone Corp. | Textiles, Apparel & Luxury Goods | 137,199 | | 1,342,098 |
| | | | | 14,009,061 |
| Spain 2.3% | | | | |
| Antena 3 de Television SA | Media | 116,212 | | 1,187,285 |
| Sol Melia SA | Hotels, Restaurants & Leisure | 376,985 | | 3,751,787 |
| | | | | 4,939,072 |
20 | Annual Report
Franklin Templeton International Trust
Statement of Investments, October 31, 2010 (continued)

Annual Report | 21
Franklin Templeton International Trust
Statement of Investments, October 31, 2010 (continued)
| | |
| Templeton Foreign Smaller Companies Fund | | Value |
| Total Investments | | |
| (Cost $194,242,086) 99.9% | $ | 216,362,552 |
| Other Assets, less Liabilities 0.1% | | 176,892 |
| Net Assets 100.0% | $ | 216,539,444 |

22 | The accompanying notes are an integral part of these financial statements. | Annual Report
Franklin Templeton International Trust
Financial Statements
| | | |
| Statement of Assets and Liabilities | | | |
| October 31, 2010 | | | |
| |
| | | Templeton | |
| | | Foreign Smaller | |
| | | Companies Fund | |
| Assets: | | | |
| Investments in securities: | | | |
| Cost | $ | 194,242,086 | |
| Value | $ | 216,362,552 | |
| Cash | | 62,373 | |
| Receivables: | | | |
| Investment securities sold | | 121,139 | |
| Capital shares sold | | 1,545,392 | |
| Dividends | | 269,619 | |
| Other assets | | 129 | |
| Total assets | | 218,361,204 | |
| Liabilities: | | | |
| Payables: | | | |
| Investment securities purchased | | 979,226 | |
| Capital shares redeemed | | 521,423 | |
| Affiliates | | 237,067 | |
| Accrued expenses and other liabilities | | 84,044 | |
| Total liabilities | | 1,821,760 | |
| Net assets, at value | $ | 216,539,444 | |
| Net assets consist of: | | | |
| Paid-in capital | $ | 225,294,032 | |
| Undistributed net investment income | | 912,906 | |
| Net unrealized appreciation (depreciation) | | 22,121,766 | |
| Accumulated net realized gain (loss) | | (31,789,260 | ) |
| Net assets, at value | $ | 216,539,444 | |
Annual Report | The accompanying notes are an integral part of these financial statements. | 23
Franklin Templeton International Trust
Financial Statements (continued)
| | | |
| Statement of Assets and Liabilities (continued) | | | |
| October 31, 2010 | | | |
| | | | Templeton |
| | | | Foreign Smaller |
| | | | Companies Fund |
| Class A: | | | |
| Net assets, at value | $ | | 163,992,832 |
| Shares outstanding | | | 10,598,142 |
| Net asset value per sharea | | $ | 15.47 |
| Maximum offering price per share (net asset value per share ÷ 94.25%) | | $ | 16.41 |
| Class B: | | | |
| Net assets, at value | $ | | 2,172,520 |
| Shares outstanding | | | 146,482 |
| Net asset value and maximum offering price per sharea | | $ | 14.83 |
| Class C: | | | |
| Net assets, at value | $ | | 17,201,903 |
| Shares outstanding | | | 1,155,247 |
| Net asset value and maximum offering price per sharea | | $ | 14.89 |
| Advisor Class: | | | |
| Net assets, at value | $ | | 33,172,189 |
| Shares outstanding | | | 2,143,452 |
| Net asset value and maximum offering price per share | | $ | 15.48 |
| |
| |
| aRedemption price is equal to net asset value less contingent deferred sales charges, if applicable. | | | |
24 | The accompanying notes are an integral part of these financial statements. | Annual Report
Franklin Templeton International Trust
Financial Statements (continued)
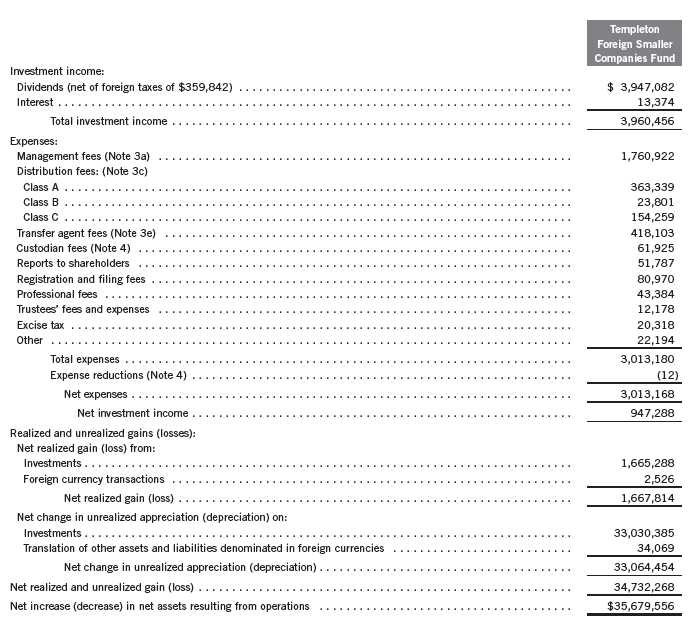
Statement of Operations
for the year ended October 31, 2010
Annual Report | The accompanying notes are an integral part of these financial statements. | 25
Franklin Templeton International Trust
Financial Statements (continued)
| | | | | | | |
| Statements of Changes in Net Assets | | | | | | | |
| |
| | | Templeton Foreign | |
| | | Smaller Companies Fund | |
| | | Year Ended October 31, | |
| | | 2010 | | | | 2009 | |
| Increase (decrease) in net assets: | | | | | | | |
| Operations: | | | | | | | |
| Net investment income | $ | 947,288 | | | $ | 950,844 | |
| Net realized gain (loss) from investments and foreign currency transactions | | 1,667,814 | | | | (33,529,373 | ) |
| Net change in unrealized appreciation (depreciation) on investments and translation of | | | | | | | |
| other assets and liabilities denominated in foreign currencies | | 33,064,454 | | | | 88,622,453 | |
| Net increase (decrease) in net assets resulting from operations | | 35,679,556 | | | | 56,043,924 | |
| Distributions to shareholders from: | | | | | | | |
| Net investment income: | | | | | | | |
| Class A | | (1,237,655 | ) | | | (4,845,849 | ) |
| Class B | | (14,248 | ) | | | (99,664 | ) |
| Class C | | (90,278 | ) | | | (419,438 | ) |
| Advisor Class | | (188,106 | ) | | | (456,682 | ) |
| Net realized gains: | | | | | | | |
| Class A | | — | | | | (566,949 | ) |
| Class B | | — | | | | (14,948 | ) |
| Class C | | — | | | | (64,824 | ) |
| Advisor Class | | — | | | | (46,998 | ) |
| Total distributions to shareholders | | (1,530,287 | ) | | | (6,515,352 | ) |
| Capital share transactions: (Note 2) | | | | | | | |
| Class A | | (6,410,149 | ) | | | 5,215,986 | |
| Class B | | (1,007,752 | ) | | | (588,011 | ) |
| Class C | | 31,276 | | | | (1,331,299 | ) |
| Advisor Class | | 14,039,405 | | | | 1,818,206 | |
| Total capital share transactions | | 6,652,780 | | | | 5,114,882 | |
| Net increase (decrease) in net assets | | 40,802,049 | | | | 54,643,454 | |
| Net assets: | | | | | | | |
| Beginning of year | | 175,737,395 | | | | 121,093,941 | |
| End of year | $ | 216,539,444 | | $ | 175,737,395 | |
| Undistributed net investment income included in net assets: | | | | | | | |
| End of year | $ | 912,906 | | | $ | 498,607 | |
26 | The accompanying notes are an integral part of these financial statements. | Annual Report
Franklin Templeton International Trust
Notes to Financial Statements
Templeton Foreign Smaller Companies Fund
1. ORGANIZATION AND SIGNIFICANT ACCOUNTING POLICIES
Franklin Templeton International Trust (Trust) is registered under the Investment Company Act of 1940, as amended, (1940 Act) as an open-end investment company, consisting of two separate funds. The Templeton Foreign Smaller Companies Fund (Fund) is included in this report. The financial statements of the remaining fund in the Trust are presented separately. The Fund offers four classes of shares: Class A, Class B, Class C, and Advisor Class. Each class of shares differs by its initial sales load, contingent deferred sales charges, distribution fees, voting rights on matters affecting a single class and its exchange privilege.
The following summarizes the Fund’s significant accounting policies.
a. Financial Instrument Valuation
The Fund values its investments in securities and other assets and liabilities carried at fair value daily. Fair value is the price that would be received to sell an asset or paid to transfer a liability in an orderly transaction between market participants on the measurement date. Under procedures approved by the Fund’s Board of Trustees, the Fund may utilize independent pricing services, quotations from securities and financial instrument dealers, and other market sources to determine fair value.
Equity securities listed on an exchange or on the NASDAQ National Market System are valued at the last quoted sale price or the official closing price of the day, respectively. Foreign equity securities are valued as of the close of trading on the foreign stock exchange on which the security is primarily traded, or the NYSE, whichever is earlier. The value is then converted into its U.S. dollar equivalent at the foreign exchange rate in effect at the close of the NYSE on the day that the value of the security is determined. Over-the-counter securities are valued within the range of the most recent quoted bid and ask prices. Securities that trade in multiple markets or on multiple exchanges are valued according to the broadest and most representative market. Certain equity securities are valued based upon fundamental characteristics or relationships to similar securities.
Debt securities generally trade in the over-the-counter market rather than on a securities exchange. The Fund’s pricing services use multiple valuation techniques to determine fair value. In instances where sufficient market activity exists, the pricing services may utilize a market-based approach through which quotes from market makers are used to determine fair value. In instances where sufficient market activity may not exist or is limited, the pricing services also utilize proprietary valuation models which may consider market characteristics such as benchmark yield curves, option-adjusted spreads, credit spreads, estimated default rates, coupon rates, anticipated timing of principal repayments, underlying collateral, and other unique security features in order to estimate the relevant cash flows, which are then discounted to calculate the fair value.
Annual Report | 27
Franklin Templeton International Trust
Notes to Financial Statements (continued)
Templeton Foreign Smaller Companies Fund
| 1. | ORGANIZATION AND SIGNIFICANT ACCOUNTING POLICIES (continued) |
| a. | Financial Instrument Valuation (continued) |
The Fund has procedures to determine the fair value of securities and other financial instruments for which market prices are not readily available or which may not be reliably priced. Under these procedures, the Fund primarily employs a market-based approach which may use related or comparable assets or liabilities, recent transactions, market multiples, book values, and other relevant information for the investment to determine the fair value of the investment. The Fund may also use an income-based valuation approach in which the anticipated future cash flows of the investment are discounted to calculate fair value. Discounts may also be applied due to the nature or duration of any restrictions on the disposition of the investments. Due to the inherent uncertainty of valuations of such investments, the fair values may differ significantly from the values that would have been used had an active market existed.
Trading in securities on foreign exchanges and over-the-counter markets may be completed before the daily close of business on the NYSE. Occasionally, events occur between the time at which trading in a foreign security is completed and the close of the NYSE that might call into question the reliability of the value of a portfolio security held by the Fund. As a result, differences may arise between the value of the Fund’s portfolio securities as determined at the foreign market close and the latest indications of value at the close of the NYSE. In order to minimize the potential for these differences, the investment manager monitors price movements following the close of trading in foreign stock markets through a series of country specific market proxies (such as baskets of American Depository Receipts, futures contracts and exchange traded funds). These price movements are measured against established trigger thresholds for ea ch specific market proxy to assist in determining if an event has occurred that may call into question the reliability of the values of the foreign securities held by the Fund. If such an event occurs, the securities may be valued using fair value procedures, which may include the use of independent pricing services.
b. Foreign Currency Translation
Portfolio securities and other assets and liabilities denominated in foreign currencies are translated into U.S. dollars based on the exchange rate of such currencies against U.S. dollars on the date of valuation. The Fund may enter into foreign currency exchange contracts to facilitate transactions denominated in a foreign currency. Purchases and sales of securities, income and expense items denominated in foreign currencies are translated into U.S. dollars at the exchange rate in effect on the transaction date. Portfolio securities and assets and liabilities denominated in foreign currencies contain risks that those currencies will decline in value relative to the U.S. dollar. Occasionally, events may impact the availability or reliability of foreign exchange rates used to convert the U.S. dollar equivalent value. If such an event occurs, the foreign exchange rate will be valued at fair value using procedures established and approv ed by the Trust’s Board of Trustees.
28 | Annual Report
Franklin Templeton International Trust
Notes to Financial Statements (continued)
Templeton Foreign Smaller Companies Fund
| 1. | ORGANIZATION AND SIGNIFICANT ACCOUNTING POLICIES (continued) |
| b. | Foreign Currency Translation (continued) |
The Fund does not separately report the effect of changes in foreign exchange rates from changes in market prices on securities held. Such changes are included in net realized and unrealized gain or loss from investments on the Statement of Operations.
Realized foreign exchange gains or losses arise from sales of foreign currencies, currency gains or losses realized between the trade and settlement dates on securities transactions and the difference between the recorded amounts of dividends, interest, and foreign withholding taxes and the U.S. dollar equivalent of the amounts actually received or paid. Net unrealized foreign exchange gains and losses arise from changes in foreign exchange rates on foreign denominated assets and liabilities other than investments in securities held at the end of the reporting period.
c. Securities Purchased on a Delayed Delivery Basis
The Fund may purchase securities on a delayed delivery basis, with payment and delivery scheduled for a future date. These transactions are subject to market fluctuations and are subject to the risk that the value at delivery may be more or less than the trade date purchase price. Although the Fund will generally purchase these securities with the intention of holding the securities, it may sell the securities before the settlement date. Sufficient assets have been segregated for these securities.
d. Income Taxes
It is the Fund’s policy to qualify as a regulated investment company under the Internal Revenue Code and to distribute to shareholders substantially all of its taxable income and net realized gains. As a result, no provision for U.S. federal income taxes is required. The Fund files U.S. income tax returns as well as tax returns in certain other jurisdictions. The Fund recognizes in its financial statements the effects including penalties and interest, if any, of a tax position taken on tax return (or expected to be taken) when it’s more likely than not (a greater than 50% probability), based on the technical merits, that the tax position will be sustained upon examination by the tax authorities. As of October 31, 2010, and for all open tax years, the Fund has determined that no provision for income tax is required in the Fund’s financial statements. Open tax years are those that remain subject to examination and are ba sed on each tax jurisdiction statute of limitation. The Fund is not aware of any tax position for which it is reasonably possible that the total amounts of unrecognized tax effects will significantly change in the next twelve months.
Foreign securities held by the Fund may be subject to foreign taxation on income received. Foreign taxes, if any, are recorded based on the tax regulations and rates that exist in the foreign markets in which the Fund invests.
Annual Report | 29
Franklin Templeton International Trust
Notes to Financial Statements (continued)
Templeton Foreign Smaller Companies Fund
| 1. | ORGANIZATION AND SIGNIFICANT ACCOUNTING POLICIES (continued) |
| e. | Security Transactions, Investment Income, Expenses and Distributions |
Security transactions are accounted for on trade date. Realized gains and losses on security transactions are determined on a specific identification basis. Interest income and estimated expenses are accrued daily. Dividend income is recorded on the ex-dividend date except that certain dividends from foreign securities are recognized as soon as the Fund is notified of the ex-dividend date. Distributions to shareholders are recorded on the ex-dividend date and are determined according to income tax regulations (tax basis). Distributable earnings determined on a tax basis may differ from earnings recorded in accordance with accounting principles generally accepted in the United States of America. These differences may be permanent or temporary. Permanent differences are reclassified among capital accounts to reflect their tax character. These reclassifications have no impact on net assets or the results of operations. Temporary differe nces are not reclassified, as they may reverse in subsequent periods.
Common expenses incurred by the Trust are allocated among the funds based on the ratio of net assets of each fund to the combined net assets of the Trust. Fund specific expenses are charged directly to the fund that incurred the expense.
Realized and unrealized gains and losses and net investment income, not including class specific expenses, are allocated daily to each class of shares based upon the relative proportion of net assets of each class. Differences in per share distributions, by class, are generally due to differences in class specific expenses.
f. Accounting Estimates
The preparation of financial statements in accordance with accounting principles generally accepted in the United States of America requires management to make estimates and assumptions that affect the reported amounts of assets and liabilities at the date of the financial statements and the amounts of income and expenses during the reporting period. Actual results could differ from those estimates.
g. Guarantees and Indemnifications
Under the Trust’s organizational documents, its officers and trustees are indemnified by the Trust against certain liabilities arising out of the performance of their duties to the Trust. Additionally, in the normal course of business, the Trust, on behalf of the Fund, enters into contracts with service providers that contain general indemnification clauses. The Trust’s maximum exposure under these arrangements is unknown as this would involve future claims that may be made against the Trust that have not yet occurred. Currently, the Trust expects the risk of loss to be remote.
30 | Annual Report
Franklin Templeton International Trust
Notes to Financial Statements (continued)
Templeton Foreign Smaller Companies Fund
2. SHARES OF BENEFICIAL INTEREST
At October 31, 2010, there were an unlimited number of shares authorized (without par value).
Transactions in the Fund’s shares were as follows:
| | | | | | | | | | | | |
| | | | | | Year Ended October 31, | | | | | |
| | 2010 | | | | | | 2009 | | |
| | Shares | | | | Amount | | Shares | | | | Amount | |
| Class A Shares: | | | | | | | | | | | | |
| Shares sold | 5,262,860 | | $ | 72,261,108 | | 4,908,970 | | $ | 53,223,699 | |
| Shares issued in reinvestment of | | | | | | | | | | | | |
| distributions | 88,283 | | | | 1,148,515 | | 614,237 | | | | 4,784,904 | |
| Shares redeemed | (6,001,418 | ) | | (79,819,772 | ) | (5,872,856 | ) | | (52,792,617 | ) |
| Net increase (decrease) | (650,275 | ) | $ | (6,410,149 | ) | (349,649 | ) | | $ | 5,215,986 | |
| Class B Shares: | | | | | | | | | | | | |
| Shares sold | 8,040 | | | $ | 111,885 | | 16,729 | | | $ | 184,829 | |
| Shares issued in reinvestment of | | | | | | | | | | | | |
| distributions | 1,026 | | | | 12,794 | | 13,115 | | | | 98,592 | |
| Shares redeemed | (88,122 | ) | | | (1,132,431 | ) | (105,014 | ) | | | (871,432 | ) |
| Net increase (decrease) | (79,056 | ) | $ | (1,007,752 | ) | (75,170 | ) | | $ | (588,011 | ) |
| Class C Shares: | | | | | | | | | | | | |
| Shares sold | 300,475 | | | $ | 3,994,518 | | 207,732 | | | $ | 2,121,523 | |
| Shares issued in reinvestment of | | | | | | | | | | | | |
| distributions | 6,504 | | | | 81,432 | | 54,826 | | | | 415,579 | |
| Shares redeemed | (309,533 | ) | | | (4,044,674 | ) | (462,568 | ) | | | (3,868,401 | ) |
| Net increase (decrease) | (2,554 | ) | | $ | 31,276 | | (200,010 | ) | $ | (1,331,299 | ) |
| Advisor Class Shares: | | | | | | | | | | | | |
| Shares sold | 2,234,716 | | $ | 30,240,581 | | 1,301,121 | | $ | 14,756,062 | |
| Shares issued in reinvestment of | | | | | | | | | | | | |
| distributions | 10,602 | | | | 138,030 | | 55,345 | | | | 430,030 | |
| Shares redeemed | (1,229,255 | ) | | (16,339,206 | ) | (1,139,542 | ) | | (13,367,886 | ) |
| Net increase (decrease) | 1,016,063 | | $ | 14,039,405 | | 216,924 | | | $ | 1,818,206 | |
3. TRANSACTIONS WITH AFFILIATES
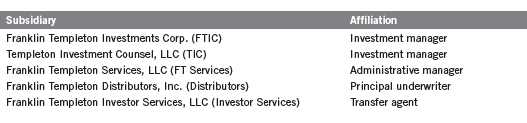
Franklin Resources, Inc. is the holding company for various subsidiaries that together are referred to as Franklin Templeton Investments. Certain officers and trustees of the Trust are also officers and/or directors of the following subsidiaries:
Annual Report | 31
Franklin Templeton International Trust
Notes to Financial Statements (continued)
Templeton Foreign Smaller Companies Fund
| 3. | TRANSACTIONS WITH AFFILIATES (continued) |
| a. | Management Fees |
The Fund pays an investment management fee to FTIC based on the average daily net assets of the Fund as follows:
| | |
| Annualized Fee Rate | | Net Assets |
| 1.000 | % | Up to and including $100 million |
| 0.900 | % | Over $100 million, up to and including $250 million |
| 0.800 | % | Over $250 million, up to and including $500 million |
| 0.750 | % | In excess of $500 million |
Under a subadvisory agreement, TIC, an affiliate of FTIC, provides subadvisory services to the Fund and receives from FTIC fees based on the average daily net assets of the Fund.
b. Administrative Fees
Under an agreement with FTIC, FT Services provides administrative services to the Fund. The fee is paid by FTIC based on average daily net assets, and is not an additional expense of the Fund.
c. Distribution Fees
The Trust’s Board of Trustees has adopted distribution plans for each share class, with the exception of Advisor Class shares, pursuant to Rule 12b-1 under the 1940 Act. Under the Fund’s Class A reimbursement distribution plan, the Fund reimburses Distributors for costs incurred in connection with the servicing, sale and distribution of the Fund’s shares up to the maximum annual plan rate. Under the Class A reimbursement distribution plan, costs exceeding the maximum for the current plan year cannot be reimbursed in subsequent periods.
In addition, under the Fund’s Class B and C compensation distribution plans, the Fund pays Distributors for costs incurred in connection with the servicing, sale and distribution of the Fund’s shares up to the maximum annual plan rate for each class.
The maximum annual plan rates, based on the average daily net assets, for each class, are as follows:
| | |
| Class A | 0.25 | % |
| Class B | 1.00 | % |
| Class C | 1.00 | % |
32 | Annual Report
Franklin Templeton International Trust
Notes to Financial Statements (continued)
Templeton Foreign Smaller Companies Fund
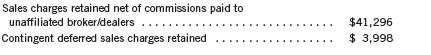
3. TRANSACTIONS WITH AFFILIATES (continued) d. Sales Charges/Underwriting Agreements
Distributors has advised the Fund of the following commission transactions related to the sales and redemptions of the Fund’s shares for the year:
e. Transfer Agent Fees
For the year ended October 31, 2010, the Fund paid transfer agent fees of $418,103, of which $228,092 was retained by Investor Services.
4. EXPENSE OFFSET ARRANGEMENT
The Fund has entered into an arrangement with its custodian whereby credits realized as a result of uninvested cash balances are used to reduce a portion of the Fund’s custodian expenses. During the year ended October 31, 2010, the custodian fees were reduced as noted in the Statement of Operations.
5. INCOME TAXES
For tax purposes, capital losses may be carried over to offset future capital gains, if any. At October 31, 2010, the Fund had tax basis capital losses of $31,789,260 expiring in 2017. During the year ended October 31, 2010, the Fund utilized $1,639,678 of capital loss carryforwards.
The tax character of distributions paid during the years ended October 31, 2010 and 2009, was as follows:
| | | | |
| | | 2010 | | 2009 |
| Distributions paid from: | | | | |
| Ordinary income | $ | 1,530,287 | $ | 5,822,346 |
| Long term capital gain | | — | | 693,006 |
| | $ | 1,530,287 | $ | 6,515,352 |
Annual Report | 33
Franklin Templeton International Trust
Notes to Financial Statements (continued)
Templeton Foreign Smaller Companies Fund
5. INCOME TAXES (continued)
At October 31, 2010, the cost of investments, net unrealized appreciation (depreciation) and undistributed ordinary income for income tax purposes were as follows:
| | | |
| Cost of investments | $ | 194,340,953 | |
| |
| Unrealized appreciation | $ | 49,812,794 | |
| Unrealized depreciation | | (27,791,195 | ) |
| Net unrealized appreciation (depreciation) | $ | 22,021,599 | |
| |
| |
| Distributable earnings - undistributed ordinary income | $ | 1,011,773 | |
Net investment income differs for financial statement and tax purposes primarily due to differing treatments of foreign currency transactions, passive foreign investment company shares, non-deductible expenses and regulatory settlements.
Net realized gains (losses) differ for financial statement and tax purposes primarily due to differing treatment of wash sales and foreign currency transactions.
6. INVESTMENT TRANSACTIONS
Purchases and sales of investments (excluding short term securities) for the year ended October 31, 2010, aggregated $33,538,603 and $37,793,347, respectively.
7. CONCENTRATION OF RISK
Investing in foreign securities may include certain risks and considerations not typically associated with investing in U.S. securities, such as fluctuating currency values and changing local and regional economic, political and social conditions, which may result in greater market volatility. In addition, certain foreign securities may not be as liquid as U.S. securities.
8. CREDIT FACILITY
The Fund, together with other U.S. registered and foreign investment funds (collectively “Borrowers”), managed by Franklin Templeton Investments, are borrowers in a joint syndicated senior unsecured credit facility totaling $750 million (Global Credit Facility) which matures on January 21, 2011. This Global Credit Facility provides a source of funds to the Borrowers for temporary and emergency purposes, including the ability to meet future unanticipated or unusually large redemption requests.
34 | Annual Report
Franklin Templeton International Trust
Notes to Financial Statements (continued)
Templeton Foreign Smaller Companies Fund
8. CREDIT FACILITY (continued)
Under the terms of the Global Credit Facility, the Fund shall, in addition to interest charged on any borrowings made by the Fund and other costs incurred by the Fund, pay its share of fees and expenses incurred in connection with the implementation and maintenance of the Global Credit Facility, based upon its relative share of the aggregate net assets of all of the Borrowers, including an annual commitment fee of 0.10% based upon the unused portion of the Global Credit Facility, which is reflected in other expenses on the Statement of Operations. During the year ended October 31, 2010, the Fund did not use the Global Credit Facility.
9. REGULATORY MATTERS
During the year ended October 31, 2010, the Fund received $9,287 resulting from a settlement between the SEC and Franklin Advisers, Inc. (an affiliate of the investment manager) relating to market-timing activities, as previously reported in the Fund’s financial statements during the years ended October 31, 2004 through October 31, 2007. This payment is included in capital shares transactions on the Statements of Changes in Net Assets.
10. FAIR VALUE MEASUREMENTS
The Trust follows a fair value hierarchy that distinguishes between market data obtained from independent sources (observable inputs) and the Trust’s own market assumptions (unobservable inputs). These inputs are used in determining the value of the Fund’s investments and are summarized in the following fair value hierarchy:
- Level 1 – quoted prices in active markets for identical securities
- Level 2 – other significant observable inputs (including quoted prices for similar securities, interest rates, prepayment speed, credit risk, etc.)
- Level 3 – significant unobservable inputs (including the Fund’s own assumptions in determining the fair value of investments)
The inputs or methodology used for valuing securities are not an indication of the risk associated with investing in those securities.
Annual Report | 35
Franklin Templeton International Trust
Notes to Financial Statements (continued)
Templeton Foreign Smaller Companies Fund
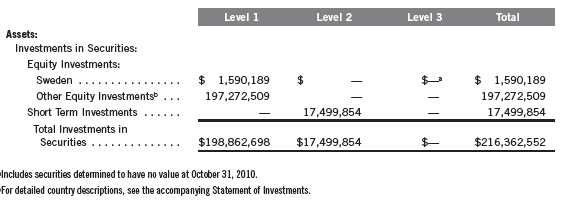
10. FAIR VALUE MEASUREMENTS (continued)
For movements between the levels within the fair value hierarchy, the Fund has adopted a policy of recognizing the transfers as of the date of the underlying event which caused the movement.
The following is a summary of the inputs used as of October 31, 2010, in valuing the Fund’s assets and liabilities carried at fair value:
11. SUBSEQUENT EVENTS
The Fund has evaluated subsequent events through the issuance of the financial statements and determined that no events have occurred that require disclosure.
ABBREVIATIONS
Selected Portfolio
FHLB - Federal Home Loan Bank
36 | Annual Report
Franklin Templeton International Trust
Report of Independent Registered Public Accounting Firm
To the Board of Trustees and Shareholders of Templeton Foreign Smaller Companies Fund
In our opinion, the accompanying statement of assets and liabilities, including the statement of investments, and the related statements of operations and of changes in net assets and the financial highlights present fairly, in all material respects, the financial position of the Templeton Foreign Smaller Companies Fund (one of the funds constituting Franklin Templeton International Trust, hereafter referred to as the “Fund”) at October 31, 2010, the results of its operations for the year then ended, the changes in its net assets for each of the two years in the period then ended and the financial highlights for each of the five years in the period then ended, in conformity with accounting principles generally accepted in the United States of America. These financial statements and financial highlights (hereafter referred to as “financial statements”) are the responsibility of the Fund’s management. Our respo nsibility is to express an opinion on these financial statements based on our audits. We conducted our audits of these financial statements in accordance with the standards of the Public Company Accounting Oversight Board (United States). Those standards require that we plan and perform the audit to obtain reasonable assurance about whether the financial statements are free of material misstatement. An audit includes examining, on a test basis, evidence supporting the amounts and disclosures in the financial statements, assessing the accounting principles used and significant estimates made by management, and evaluating the overall financial statement presentation. We believe that our audits, which included confirmation of securities at October 31, 2010 by correspondence with the custodian and brokers, provide a reasonable basis for our opinion.
PricewaterhouseCoopers LLP
San Francisco, California
December 17, 2010
Annual Report | 37
Franklin Templeton International Trust
Tax Designation (unaudited)
Templeton Foreign Smaller Companies Fund
Under Section 854(b)(2) of the Internal Revenue Code (Code), the Fund designates the maximum amount allowable but no less than $1,885,495 as qualified dividends for purposes of the maximum rate under Section 1(h)(11) of the Code for the fiscal year ended October 31, 2010. Distributions, including qualified dividend income, paid during calendar year 2010 will be reported to shareholders on Form 1099-DIV in January 2011. Shareholders are advised to check with their tax advisors for information on the treatment of these amounts on their individual income tax returns.
At October 31, 2010, more than 50% of the Fund’s total assets were invested in securities of foreign issuers. In most instances, foreign taxes were withheld from income paid to the Fund on these investments. As shown in the table below, the Fund designates to shareholders the foreign source income and foreign taxes paid, pursuant to Section 853 of the Code. This designation will allow shareholders of record on December 14, 2009, to treat their proportionate share of foreign taxes paid by the Fund as having been paid directly by them. The shareholder shall consider these amounts as foreign taxes paid in the tax year in which they receive the Fund distribution.
The following table provides a detailed analysis of foreign tax paid, foreign source income, and foreign qualified dividends as designated by the Fund, to Class A, Class B, Class C, and Advisor Class shareholders of record.
| | | | | | |
| | | Foreign Tax | | Foreign | | Foreign |
| | | Paid | | Source Income | | Qualified Dividends |
| Class | | Per Share | | Per Share | | Per Share |
| Class A | $ | 0.0241 | $ | 0.0956 | $ | 0.0535 |
| Class B | $ | 0.0241 | $ | 0.0159 | $ | 0.0090 |
| Class C | $ | 0.0241 | $ | 0.0258 | $ | 0.0146 |
| Advisor Class | $ | 0.0241 | $ | 0.1172 | $ | 0.0657 |
Foreign Tax Paid Per Share (Column 1) is the amount per share available to you, as a tax credit (assuming you held your shares in the Fund for a minimum of 16 days during the 31-day period beginning 15 days before the ex-dividend date of the Fund’s distribution to which the foreign taxes relate), or, as a tax deduction.
Foreign Source Income Per Share (Column 2) is the amount per share of income dividends paid to you that is attributable to foreign securities held by the Fund, plus any foreign taxes withheld on these dividends. The amounts reported include foreign source qualified dividends that have not been adjusted for the rate differential applicable to such dividend income.1
1Qualified dividends are taxed at reduced long term capital gain tax rates. In determining the amount of foreign tax credit that may be applied against the U.S. tax liability of individuals receiving foreign source qualified dividends, adjustments may be required to the foreign tax credit limitation calculation to reflect the rate differential applicable to such dividend income. The rules however permit certain individuals to elect not to apply the rate differential adjustments for capital gains and/or dividends for any taxable year. Please consult your tax advisor and the instructions to Form 1116 for more information.
38 | Annual Report
Franklin Templeton International Trust
Tax Designation (unaudited) (continued)
Foreign Qualified Dividends Per Share (Column 3) is the amount per share of foreign source qualified dividends the Fund paid to you, plus any foreign taxes withheld on these dividends. These amounts represent the portion of the Foreign Source Income reported to you in column 2 that were derived from qualified foreign securities held by the Fund.1
In January 2010, shareholders received Form 1099-DIV which included their share of taxes paid and foreign source income distributed during the calendar year 2009. The Foreign Source Income reported on Form 1099-DIV has not been adjusted for the rate differential on foreign source qualified dividend income. Shareholders are advised to check with their tax advisors for information on the treatment of these amounts on their 2009 individual income tax returns.
Annual Report | 39
Franklin Templeton International Trust
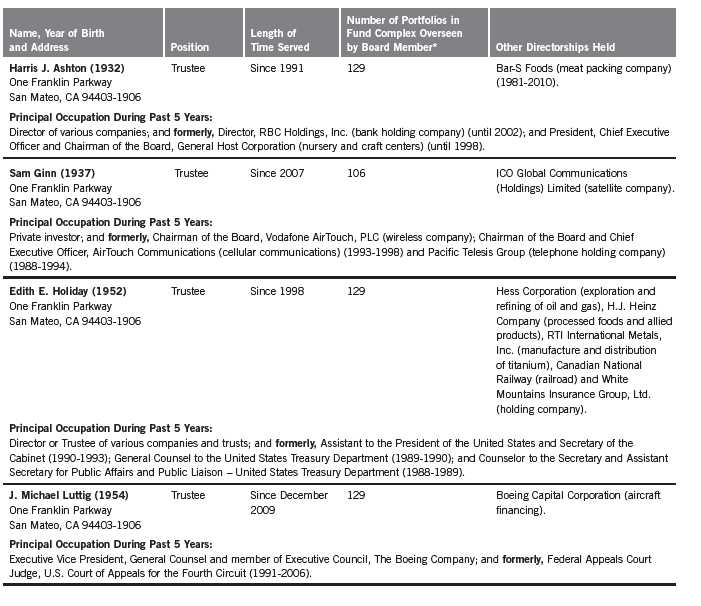
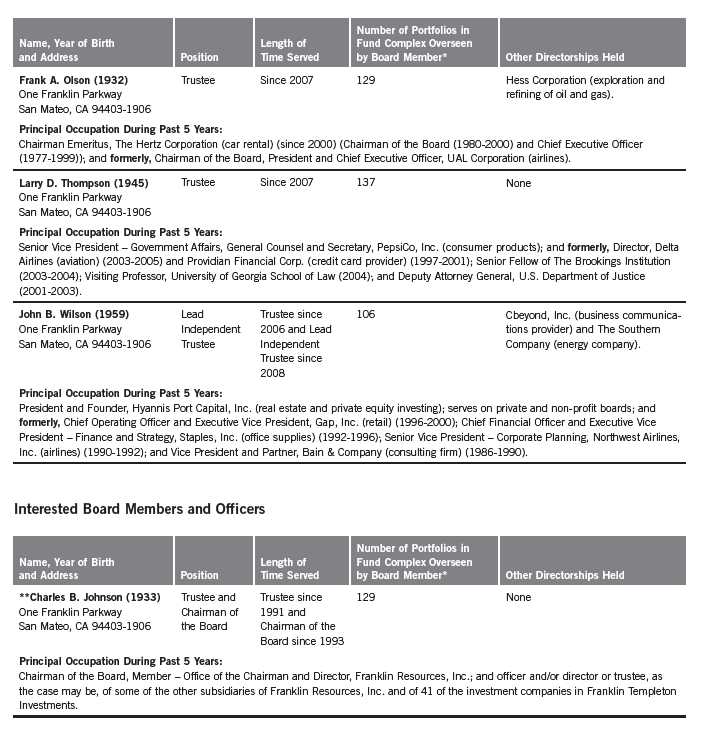
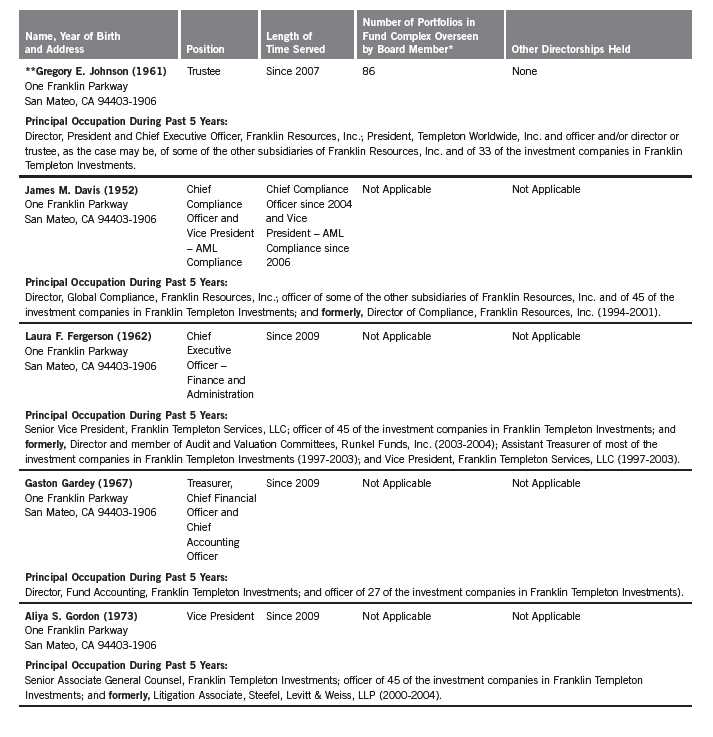
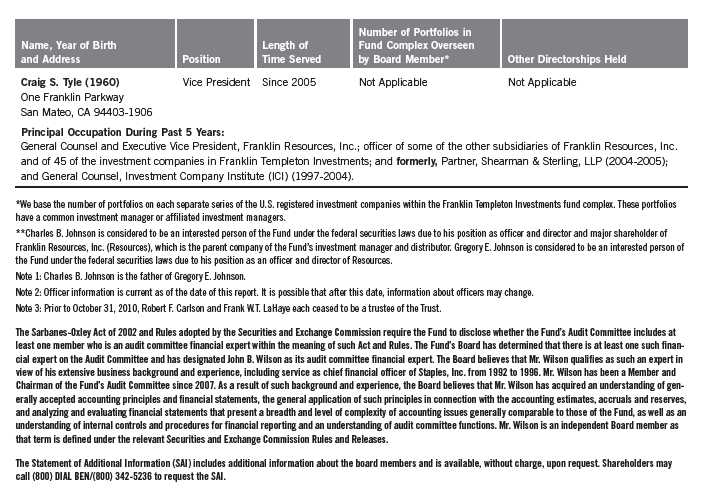
Board Members and Officers
The name, year of birth and address of the officers and board members, as well as their affiliations, positions held with the Trust, principal occupations during the past five years and number of U.S. registered portfolios overseen in the Franklin Templeton Investments fund complex are shown below. Generally, each board member serves until that person’s successor is elected and qualified.
Independent Board Members
40 | Annual Report
Annual Report | 41
42 | Annual Report

Annual Report | 43
44 | Annual Report
Franklin Templeton International Trust
Shareholder Information
Templeton Foreign Smaller Companies Fund
Proxy Voting Policies and Procedures
The Fund’s investment manager has established Proxy Voting Policies and Procedures (Policies) that the Fund uses to determine how to vote proxies relating to portfolio securities. Shareholders may view the Fund’s complete Policies online at franklintempleton.com. Alternatively, shareholders may request copies of the Policies free of charge by calling the Proxy Group collect at (954) 527-7678 or by sending a written request to: Franklin Templeton Companies, LLC, 500 East Broward Boulevard, Suite 1500, Fort Lauderdale, FL 33394, Attention: Proxy Group. Copies of the Fund’s proxy voting records are also made available online at franklintempleton.com and posted on the U.S. Securities and Exchange Commission’s website at sec.gov and reflect the most recent 12-month period ended June 30.
Quarterly Statement of Investments
The Fund files a complete statement of investments with the U.S. Securities and Exchange Commission for the first and third quarters for each fiscal year on Form N-Q. Shareholders may view the filed Form N-Q by visiting the Commission’s website at sec.gov. The filed form may also be viewed and copied at the Commission’s Public Reference Room in Washington, DC. Information regarding the operations of the Public Reference Room may be obtained by calling (800) SEC-0330.
Householding of Reports and Prospectuses
You will receive the Fund’s financial reports every six months as well as an annual updated summary prospectus (prospectus available upon request). To reduce Fund expenses, we try to identify related shareholders in a household and send only one copy of the financial reports and summary prospectus. This process, called “householding,” will continue indefinitely unless you instruct us otherwise. If you prefer not to have these documents householded, please call us at (800) 632-2301. At any time you may view current prospectuses/summary prospectuses and financial reports on our website. If you choose, you may receive these documents through electronic delivery.
Annual Report | 45
This page intentionally left blank.
This page intentionally left blank.
This page intentionally left blank.

INTERNATIONAL
FRANKLIN INDIA GROWTH FUND

Annual Report
Franklin India Growth Fund
Your Fund’s Goal and Main Investments: Franklin India Growth Fund seeks long-term capital appreciation by investing under normal market conditions at least 80% of its net assets in securities of “Indian companies,” which are defined as those organized under the laws of, with a principal office in, or for which the principal trading market for their securities is in India, that derive 50% or more of total revenue or profit from goods or services produced or sales made in India, or that have 50% or more of their assets in India.1

Annual Report | 3
quarter.3 Overall, the recovery’s strength prompted global and domestic institutions to raise economic growth expectations. Officials at the International Monetary Fund expect the Indian economy to grow by 9.7% in 2010 and 8.5% in 2011.
Corporate earnings reflected underlying economic strength, and improved financial market conditions helped companies raise funds for expansion. Strong growth prospects coupled with ample liquidity and low interest rates globally brought a surge in foreign institutional inflows. For the year to date as of October 31, 2010, foreign institutional investors bought $24.8 billion in Indian equities compared with $17.6 billion in 2009.4 Stock purchases boosted equity market performance, and India emerged as one of the world’s top performers during the reporting period. Strong economic growth coupled with high inflation levels led the Reserve Bank of India (RBI) to withdraw monetary stimulus. The RBI hiked rates several times in 2010, and to increase monetary policy effectiveness, it narrowed the difference between the rates at which banks borrowed from and lend to the RBI.
Fiscal policymakers remain focused on boosting economic growth through addressing infrastructure bottlenecks. Highly successful 3G and broadband spectrum auctions along with partial fuel price deregulation helped ease concerns about government finances. In addition, recent steps toward tax reforms were positive and should help support growth potential over the medium term.
India continued to demonstrate fundamental economic strength, particularly compared with developed economies. Because the economy is primarily driven by domestic demand, it is likely to be less vulnerable to swings in external demand. Increased government spending on various social sector and infrastructure development programs is viewed as positive for the economy, as it benefits economic growth and could stimulate all segments of the society. This along with increased capital expenditures by Indian companies has the potential to boost economic activity across the country over the coming years.
Investment Strategy
We are research-driven, fundamental investors pursuing a growth strategy. As bottom-up investors focusing primarily on individual securities, we seek to invest in companies whose current market price, in our opinion, does not reflect future growth prospects. We choose companies that have identifiable drivers
3. Source: Central Statistics Office, Government of India.
4. Source: Securities and Exchange Board of India.

4 | Annual Report
of future earnings growth and that present, in our opinion, the best trade-off between earnings growth potential, business and financial risk, and valuation. We rely on a team of analysts to help provide in-depth industry expertise and use both qualitative and quantitative analyses to evaluate companies for distinct and sustainable competitive advantages through leading-edge products, intellectual property, product positioning, unique market niches, brand identity, solid management teams, strong balance sheets, above-average or rising margins, and strong returns on capital invested in the business. In choosing equity investments, we also consider such factors as the company’s financial strength, management’s expertise, the company’s growth potential within the industry, and the industry’s growth potential.
Manager’s Discussion
A good portion of the portfolio is invested in domestic demand-driven companies that we think have strong market positions and the ability to take advantage of structural growth themes, consumption and investment within India.
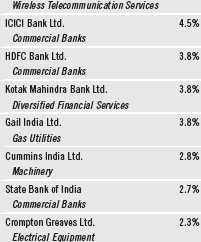
During the period under review, several industrials, financials, and information technology (IT) sector holdings added significantly to Fund performance.5 Industrial equipment manufacturer Cummins India was among the top contributors. The firm is one of the leading makers of engines required for power generation sets, earth-moving equipment and other infrastructure products. Cummins has been a key beneficiary of increased activity across various types of infrastructure projects.
As one of the world’s largest IT services companies, Infosys Technologies exhibited resilience during recent global turmoil and benefited from an ongoing recovery in global technology spending. In our analysis, the company’s strong branding and various strategic initiatives to enhance its business mix could bode well for future growth.
One of our largest banking holdings, ICICI Bank, also delivered strong returns. In our view, the bank’s favorable market position and widespread physical presence positioned it to take advantage of the opportunity posed by the need for financial products and services and an expanding target market. The bank’s presence in financial services segments such as asset management, securities brokerage firms and insurance companies can provide further opportunities to unlock future value.
5. The industrials sector comprises construction and engineering, electrical equipment, and machinery in the SOI. The financials sector comprises capital markets, commercial banks, diversified financial services, and thrifts and mortgage finance in the SOI. The IT sector comprises IT services in the SOI.
Annual Report | 5
It is important to recognize the effect of currency movements on the Fund’s performance. In general, if the value of the U.S. dollar goes up compared with a foreign currency, an investment traded in that foreign currency will go down in value because it will be worth fewer U.S. dollars. This can have a negative effect on Fund performance. Conversely, when the U.S. dollar weakens in relation to a foreign currency, an investment traded in that foreign currency will increase in value, which can contribute to Fund performance. For the 12 months ended October 31, 2010, the U.S. dollar declined in value relative to the Indian rupee. As a result, the Fund’s performance was positively affected by the portfolio’s predominant investment in securities denominated in the Indian rupee. However, one cannot expect the same result in future periods.
Although all sectors held in the Fund made gains during the period, we had some individual securities that declined in value. Some of the large holdings that detracted from performance included India Infoline, Steel Authority of India (SAIL) and NTPC. India Infoline is a company focused on meeting the shifting investor preferences for traditional bank deposits to market-linked instruments and equities. The company has become a financial supermarket that expanded into financing and financial distribution businesses to capitalize further from the trend. Unfortunately, it suffered from a decline in profitability due to a high volume of business in low-margin derivative products, which weighed on the stock’s performance.
SAIL is India’s largest steel company, and we think it is well poised to benefit from rising demand for metals resulting from infrastructure development in the region. Near-term concerns around cost structures and upcoming equity issuance constrained SAIL’s performance during the reporting period.
Weak operating performance in recent quarters impacted stock performance of NTPC, India’s largest power-generation utility. The company’s regulated business model provides a high degree of earnings visibility, and we think strong growth momentum could drive future performance.
6 | Annual Report
Thank you for your continued participation in Franklin India Growth Fund.
We look forward to serving your future investment needs.


Stephen H. Dover, CFA

Purav A. Jhaveri, CFA, FRM
Portfolio Management Team
Franklin India Growth Fund
CFA® is a trademark owned by CFA Institute.
The foregoing information reflects our analysis, opinions and portfolio holdings as of October 31, 2010, the end of the reporting period. The way we implement our main investment strategies and the resulting portfolio holdings may change depending on factors such as market and economic conditions. These opinions may not be relied upon as investment advice or an offer for a particular security. The information is not a complete analysis of every aspect of any market, country, industry, security or the Fund. Statements of fact are from sources considered reliable, but the investment manager makes no representation or warranty as to their completeness or accuracy. Although historical performance is no guarantee of future results, these insights may help you understand our investment management philosophy.
Annual Report | 7
Performance Summary as of 10/31/10
Your dividend income will vary depending on dividends or interest paid by securities in the Fund’s portfolio, adjusted for operating expenses of each class. Capital gain distributions are net profits realized from the sale of portfolio securities. The performance table and graphs do not reflect any taxes that a shareholder would pay on Fund dividends, capital gain distributions, if any, or any realized gains on the sale of Fund shares. Total return reflects reinvestment of the Fund’s dividends and capital gain distributions, if any, and any unrealized gains or losses.

8 | Annual Report
Performance Summary (continued)
Performance1
Cumulative total return excludes sales charges. Average annual total returns and value of $10,000 investment include maximum sales charges. Class A: 5.75% maximum initial sales charge; Class C: 1% contingent deferred sales charge in first year only; Advisor Class: no sales charges.
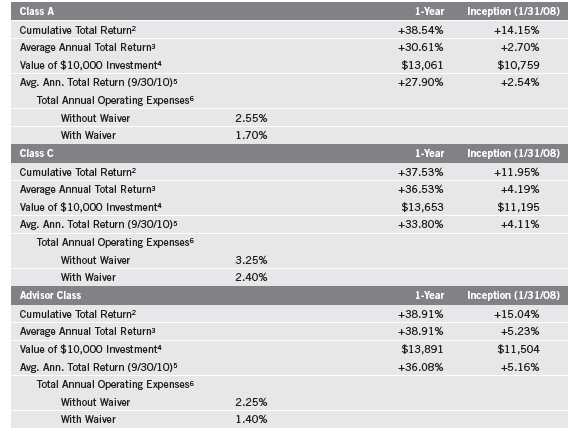
Performance data represent past performance, which does not guarantee future results. Investment return and principal value will fluctuate, and you may have a gain or loss when you sell your shares. Current performance may differ from figures shown. For most recent month-end performance, go to franklintempleton.com or call (800) 342-5236.
The investment manager and administrator have co ntractually agreed to waive or limit their respective fees and to assume as their own expense certain expenses otherwise payable by the Fund so that the common expenses (i.e., a combination of management fees, administrative fees, and other expenses, including the Fund’s share of FT (Mauritius) Offshore Investments Limited’s allocated expenses, but excluding distribution fees and other acquired Fund fees and expenses) for each class of the Fund do not exceed 1.40% (other than certain nonroutine expenses or costs, including those relating to litigation, indemnification, reorganizations and liquidations) until 2/28/11.
Annual Report | 9
Performance Summary (continued)
Total Return Index Comparison for a Hypothetical $10,000 Investment1
Total return represents the change in value of an investment over the periods shown. It includes any applicable maximum sales charge, Fund expenses, account fees and reinvested distributions. The unmanaged index includes reinvestment of any income or distributions. It differs from the Fund in composition and does not pay management fees or expenses. One cannot invest directly in an index.

10 | Annual Report
Performance Summary (continued)

| |
| Endnotes | |
| |
| Special risks are associated with foreign investing, including currency fluctuations, economic instability and |
| political developments. Investments in developing markets involve heightened risks related to the same factors, |
| in addition to risks associated with these companies’ smaller size, lesser liquidity and the potential lack of |
| established legal, political, business and social frameworks to support securities markets in the countries in |
| which they operate. The Fund may also experience greater volatility than a fund that is more broadly diversi- |
| fied geographically. The Fund is designed for the aggressive portion of a well-diversified portfolio. The Fund’s |
| prospectus also includes a description of the main investment risks. |
| |
| |
| Class C: | These shares have higher annual fees and expenses than Class A shares. |
| |
| Advisor Class: | Shares are available to certain eligible investors as described in the prospectus. |
| |
| |
| 1. If the manager and administrator had not waived fees, the Fund’s total returns would have been lower. |
| 2. Cumulative total return represents the change in value of an investment over the periods indicated. |
| 3. Average annual total return represents the average annual change in value of an investment over the periods |
| indicated. | |
| 4. These figures represent the value of a hypothetical $10,000 investment in the Fund over the periods indicated. |
| 5. In accordance with SEC rules, we provide standardized average annual total return information through the |
| latest calendar quarter. |
| 6. Figures are as stated in the Fund’s prospectus current as of the date of this report. In periods of market volatility, |
| assets may decline significantly, causing total annual Fund operating expenses to become higher than the figures |
| shown. | |
| 7. Source: MSCI, Inc. The MSCI India Index is a free float-adjusted, market capitalization-weighted index designed |
| to measure equity market performance in India. |
Your Fund’s Expenses
As a Fund shareholder, you can incur two types of costs:
- Transaction costs, including sales charges (loads) on Fund purchases; and
- Ongoing Fund costs, including management fees, distribution and service (12b-1) fees, and other Fund expenses. All mutual funds have ongoing costs, sometimes referred to as operating expenses.
The following table shows ongoing costs of investing in the Fund and can help you understand these costs and compare them with those of other mutual funds. The table assumes a $1,000 investment held for the six months indicated.
Actual Fund Expenses
The first line (Actual) for each share class listed in the table provides actual account values and expenses. The “Ending Account Value” is derived from the Fund’s actual return, which includes the effect of Fund expenses.
You can estimate the expenses you paid during the period by following these steps. Of course, your account value and expenses will differ from those in this illustration:
| 1. | Divide your account value by $1,000. |
| | If an account had an $8,600 value, then $8,600 ÷ $1,000 = 8.6. |
| 2. | Multiply the result by the number under the heading “Expenses Paid During Period.” |
| | If Expenses Paid During Period were $7.50, then 8.6 x $7.50 = $64.50. |
In this illustration, the estimated expenses paid this period are $64.50.
Hypothetical Example for Comparison with Other Funds
Information in the second line (Hypothetical) for each class in the table can help you compare ongoing costs of investing in the Fund with those of other mutual funds. This information may not be used to estimate the actual ending account balance or expenses you paid during the period. The hypothetical “Ending Account Value” is based on the actual expense ratio for each class and an assumed 5% annual rate of return before expenses, which does not represent the Fund’s actual return. The figure under the heading “Expenses Paid During Period” shows the hypothetical expenses your account would have incurred under this scenario. You can compare this figure with the 5% hypothetical examples that appear in shareholder reports of other funds.
12 | Annual Report
Your Fund’s Expenses (continued)
Please note that expenses shown in the table are meant to highlight ongoing costs and do not reflect any transaction costs, such as sales charges. Therefore, the second line for each class is useful in comparing ongoing costs only, and will not help you compare total costs of owning different funds. In addition, if transaction costs were included, your total costs would have been higher. Please refer to the Fund prospectus for additional information on operating expenses.
| | | | | | |
| | | Beginning Account | | Ending Account | | Expenses Paid During |
| Class A | | Value 5/1/10 | | Value 10/31/10 | | Period* 5/1/10–10/31/10 |
| Actual | $ | 1,000 | $ | 1,145.50 | $ | 9.19 |
| Hypothetical (5% return before expenses) | $ | 1,000 | $ | 1,016.64 | $ | 8.64 |
| Class C | | | | | | |
| Actual | $ | 1,000 | $ | 1,141.20 | $ | 12.95 |
| Hypothetical (5% return before expenses) | $ | 1,000 | $ | 1,013.11 | $ | 12.18 |
| Advisor Class | | | | | | |
| Actual | $ | 1,000 | $ | 1,147.90 | $ | 7.58 |
| Hypothetical (5% return before expenses) | $ | 1,000 | $ | 1,018.15 | $ | 7.12 |
*Expenses are calculated using the most recent six-month expense ratio, net of expense waivers, annualized for each class (A: 1.70%; C: 2.40%; and Advisor: 1.40%), multiplied by the average account value over the period, multiplied by 184/365 to reflect the one-half year period.
Annual Report | 13
Franklin Templeton International Trust
Financial Highlights
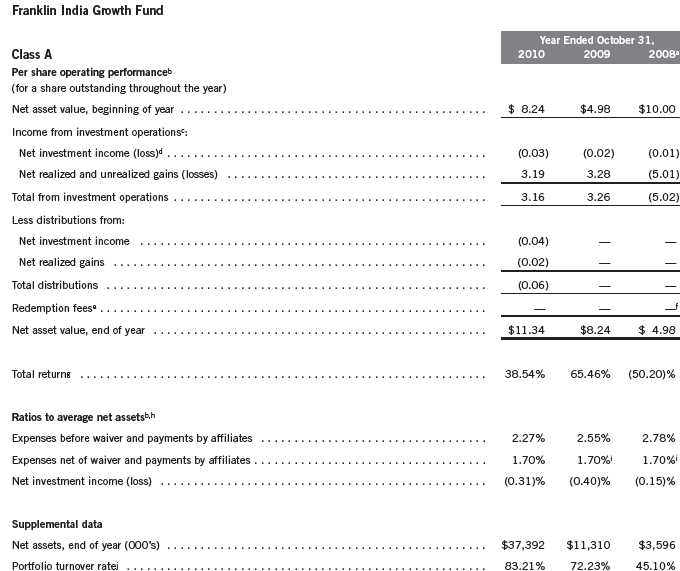
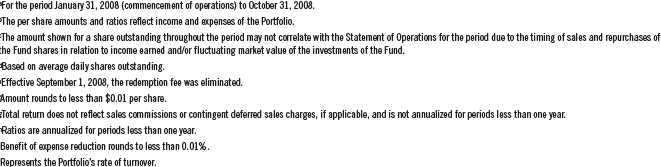
14 | The accompanying notes are an integral part of these financial statements. | Annual Report
Franklin Templeton International Trust
Financial Highlights (continued)
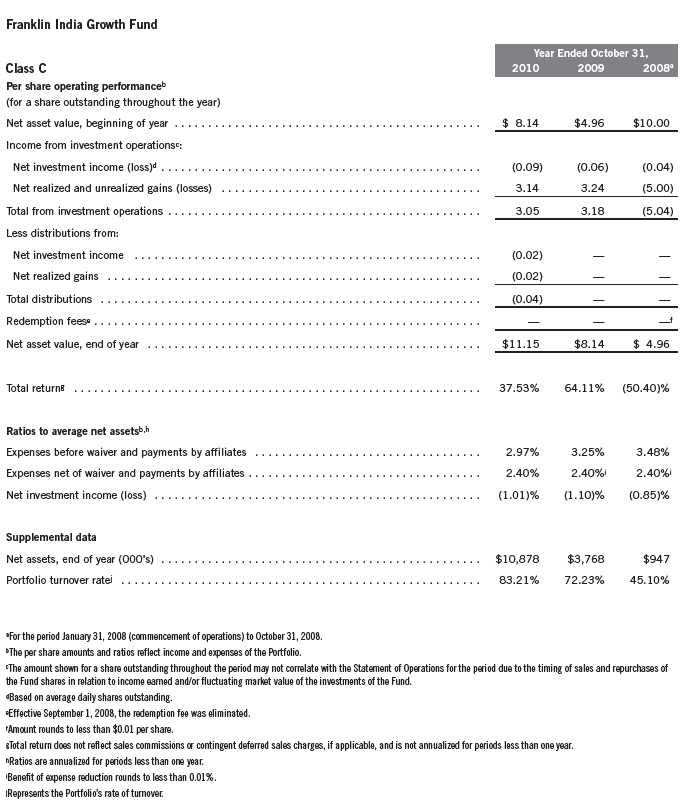
Annual Report | The accompanying notes are an integral part of these financial statements. | 15
Franklin Templeton International Trust
Financial Highlights (continued)
Franklin India Growth Fund
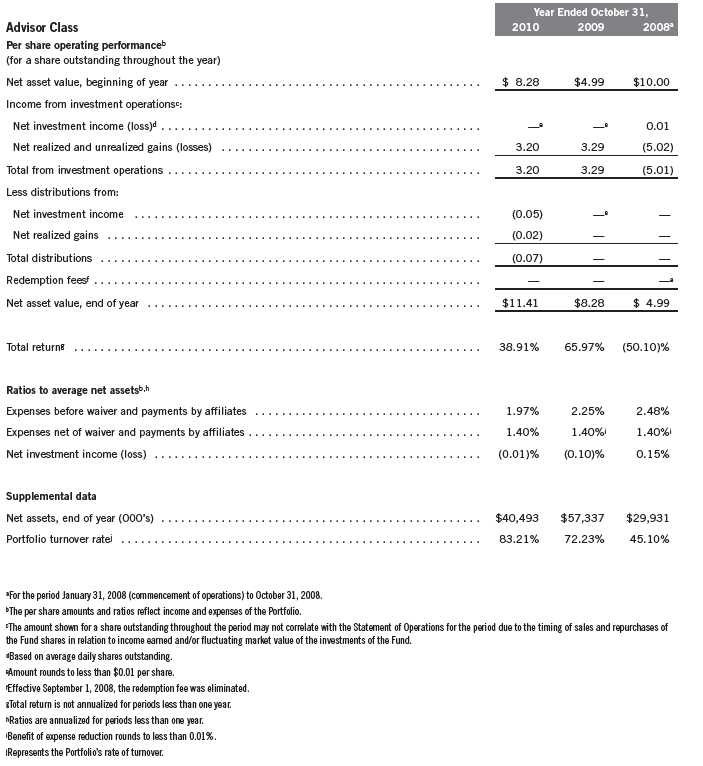
16 | The accompanying notes are an integral part of these financial statements. | Annual Report
Franklin Templeton International Trust
Financial Statements
Statement of Assets and Liabilities
October 31, 2010

Annual Report | The accompanying notes are an integral part of these financial statements. | 17
Franklin Templeton International Trust
Financial Statements (continued)
Statement of Operations
for the year ended October 31, 2010
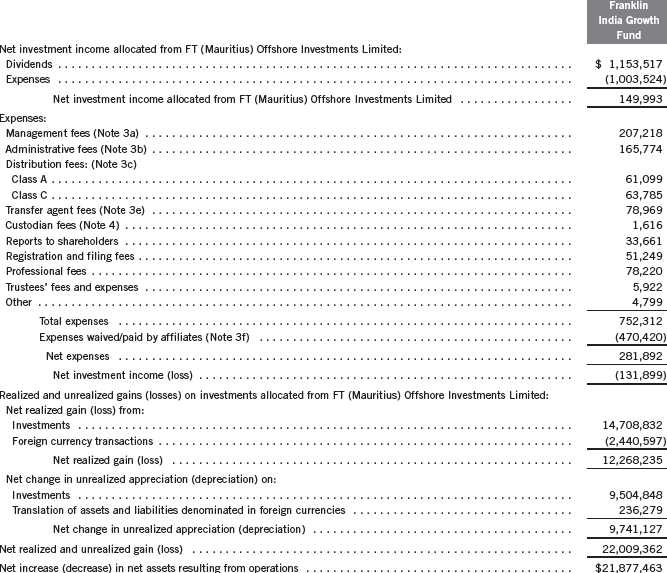
18 | The accompanying notes are an integral part of these financial statements. | Annual Report
Franklin Templeton International Trust
Financial Statements (continued)
| | | | | | | |
| Statements of Changes in Net Assets | | | | | | | |
| |
| |
| | | Franklin India Growth Fund | |
| | | Year Ended October 31, | |
| | | 2010 | | | | 2009 | |
| Increase (decrease) in net assets: | | | | | | | |
| Operations: | | | | | | | |
| Net investment income (loss) | $ | (131,899 | ) | | $ | (80,206 | ) |
| Net realized gain (loss) from investments and foreign currency transactions | | 12,268,235 | | | | (7,782,272 | ) |
| Net change in unrealized appreciation (depreciation) on investments and translation of other | | | | | | | |
| assets and liabilities denominated in foreign currencies | | 9,741,127 | | | | 31,989,078 | |
| Net increase (decrease) in net assets resulting from operations | | 21,877,463 | | | | 24,126,600 | |
| Distributions to shareholders from: | | | | | | | |
| Net investment income: | | | | | | | |
| Class A | | (56,742 | ) | | | — | |
| Class C | | (7,660 | ) | | | — | |
| Advisor Class | | (378,874 | ) | | | (7,786 | ) |
| Net realized gains: | | | | | | | |
| Class A | | (28,775 | ) | | | — | |
| Class C | | (9,764 | ) | | | — | |
| Advisor Class | | (145,648 | ) | | | — | |
| Total distributions to shareholders | | (627,463 | ) | | | (7,786 | ) |
| Capital share transactions: (Note 2) | | | | | | | |
| Class A | | 19,513,370 | | | | 4,802,598 | |
| Class C | | 5,120,596 | | | | 1,935,301 | |
| Advisor Class | | (29,535,856 | ) | | | 7,084,202 | |
| Total capital share transactions | | (4,901,890 | ) | | | 13,822,101 | |
| Net increase (decrease) in net assets | | 16,348,110 | | | | 37,940,915 | |
| Net assets: | | | | | | | |
| Beginning of year | | 72,414,224 | | | | 34,473,309 | |
| End of year | $ | 88,762,334 | | $ | 72,414,224 | |
| Undistributed net investment income (loss) included in net assets: | | | | | | | |
| End of year | $ | (526,573 | ) | | $ | (21,493 | ) |
Annual Report | The accompanying notes are an integral part of these financial statements. | 19
Franklin Templeton International Trust
Notes to Financial Statements
Franklin India Growth Fund
1. ORGANIZATION AND SIGNIFICANT ACCOUNTING POLICIES
Franklin Templeton International Trust (Trust) is registered under the Investment Company Act of 1940, as amended, (1940 Act) as an open-end investment company, consisting of two separate funds. The Franklin India Growth Fund (Fund) is included in this report. The financial statements of the remaining fund in the Trust are presented separately. The Fund offers three classes of shares: Class A, Class C, and Advisor Class. Each class of shares differs by its initial sales load, contingent deferred sales charges, distribution fees, voting rights on matters affecting a single class and its exchange privilege.
The Fund operates using a “master fund/feeder fund” structure and invests indirectly in the securities of Indian companies through FT (Mauritius) Offshore Investments Limited (Portfolio), an entity registered with and regulated by the Mauritius Financial Services Commission, which shares the same investment objective as the Fund. The accounting policies of the Portfolio, including the Portfolio’s security valuation policies, will directly affect the recorded value of the Fund’s investment in the Portfolio. The financial statements of the Portfolio, including the Statement of Investments, are included elsewhere in this report and should be read in conjunction with the Fund’s financial statements. At October 31, 2010, the Fund owned 100% of the outstanding shares of the Portfolio.
The following summarizes the Fund’s significant accounting policies.
a. Financial Instrument Valuation
The Fund’s investment in the Portfolio shares is valued at the Portfolio’s net asset value per share. Valuation of securities by the Portfolio is discussed in Note 1(a) of the Portfolio’s Notes to Financial Statements, which are included elsewhere in this report.
b. Income and Deferred Taxes
It is the Fund’s policy to qualify as a regulated investment company under the Internal Revenue Code and to distribute to shareholders substantially all of its taxable income and net realized gains. As a result, no provision for U.S. federal income taxes is required. The Fund files U.S. income tax returns as well as tax returns in certain other jurisdictions. The Fund recognizes in its financial statements the effects including penalties and interest, if any, of a tax position taken on tax return (or expected to be taken) when it’s more likely than not (a greater than 50% probability), based on the technical merits, that the tax position will be sustained upon examination by the tax authorities. As of October 31, 2010, and for all open tax years, the Fund has determined that no provision for income tax is required in the Fund’s financial statements. Open tax years are those that remain subject to examination and are ba sed on each tax jurisdiction statute of
20 | Annual Report
Franklin Templeton International Trust
Notes to Financial Statements (continued)
Franklin India Growth Fund
| 1. | ORGANIZATION AND SIGNIFICANT ACCOUNTING POLICIES (continued) |
| b. | Income and Deferred Taxes (continued) |
limitation. The Fund is not aware of any tax position for which it is reasonably possible that the total amounts of unrecognized tax effects will significantly change in the next twelve months.
The Fund’s investment in the Portfolio may be subject to income and withholding taxes in Mauritius and/or India which are discussed in Note 1(c) of the Portfolio’s Notes to Financial Statements.
c. Security Transactions, Investment Income, Expenses and Distributions
Security transactions, including investments in the Portfolio, are accounted for on trade date. Realized gains and losses on security transactions are determined on a specific identification basis. Estimated expenses are accrued daily. Dividend income is recorded on the ex-dividend date. Distributions to shareholders are recorded on the ex-dividend date and are determined according to income tax regulations (tax basis). Distributable earnings determined on a tax basis may differ from earnings recorded in accordance with accounting principles generally accepted in the United States of America. These differences may be permanent or temporary. Permanent differences are reclassified among capital accounts to reflect their tax character. These reclassifications have no impact on net assets or the results of operations. Temporary differences are not reclassified, as they may reverse in subsequent periods.
Common expenses incurred by the Trust are allocated among the funds based on the ratio of net assets of each fund to the combined net assets of the Trust. Fund specific expenses are charged directly to the fund that incurred the expense.
Realized and unrealized gains and losses and net investment income, not including class specific expenses, are allocated daily to each class of shares based upon the relative proportion of net assets of each class. Differences in per share distributions, by class, are generally due to differences in class specific expenses.
The Fund records its proportionate share of the Portfolio’s income, expenses and realized and unrealized gains and losses daily. In addition, the Fund accrues its own expenses.
d. Accounting Estimates
The preparation of financial statements in accordance with accounting principles generally accepted in the United States of America requires management to make estimates and assumptions that affect the reported amounts of assets and liabilities at the date of the financial statements and the amounts of income and expenses during the reporting period. Actual results could differ from those estimates.
Annual Report | 21
Franklin Templeton International Trust
Notes to Financial Statements (continued)
Franklin India Growth Fund
| 1. | ORGANIZATION AND SIGNIFICANT ACCOUNTING POLICIES (continued) |
| e. | Guarantees and Indemnifications |
Under the Trust’s organizational documents, its officers and directors are indemnified by the Trust against certain liabilities arising out of the performance of their duties to the Trust. Additionally, in the normal course of business, the Trust, on behalf of the Fund, enters into contracts with service providers that contain general indemnification clauses. The Trust’s maximum exposure under these arrangements is unknown as this would involve future claims that may be made against the Trust that have not yet occurred. Currently, the Trust expects the risk of loss to be remote.
2. CAPITAL STOCK
At October 31, 2010, there were an unlimited number of shares authorized (without par value).
Transactions in the Fund’s shares were as follows:

22 | Annual Report
Franklin Templeton International Trust
Notes to Financial Statements (continued)
Franklin India Growth Fund
3. TRANSACTIONS WITH AFFILIATES
Franklin Resources, Inc. is the holding company for various subsidiaries that together are referred to as Franklin Templeton Investments. Certain officers and trustees of the Trust are also officers and/or directors of the Portfolio and of the following subsidiaries:

The Fund pays an investment management fee to Advisers equal to 20% of the total management fee with the remainder to be paid by the Portfolio. The total management fee is paid based on the average daily net assets of the Fund as follows:
| | |
| Annualized Fee Rate | | Net Assets |
| 1.250 | % | Up to and including $1 billion |
| 1.200 | % | Over $1 billion, up to and including $5 billion |
| 1.150 | % | Over $5 billion, up to and including $10 billion |
| 1.100 | % | Over $10 billion, up to and including $15 billion |
| 1.050 | % | Over $15 billion, up to and including $20 billion |
| 1.000 | % | In excess of $20 billion |
Under a subadvisory agreement, FT India, an affiliate of Advisers, provides subadvisory services to the Fund. The subadvisory fee is paid by Advisers based on the average daily net assets, and is not an additional expense of the Fund.
b. Administrative Fees
The Fund pays an administrative fee to FT Services of 0.20% per year of the average daily net assets of the Fund.
c. Distribution Fees
The Trust’s Board of Trustees has adopted distribution plans for each share class, with the exception of Advisor Class shares, pursuant to Rule 12b-1 under the 1940 Act. Under the Fund’s Class A reimbursement distribution plan, the Fund reimburses Distributors for costs incurred in connection with the servicing, sale and distribution of the Fund’s shares up to the maximum annual plan rate. Under the Class A reimbursement distribution plan, costs exceeding the maximum for the current plan year cannot be reimbursed in subsequent periods.
Annual Report | 23
Franklin Templeton International Trust
Notes to Financial Statements (continued)
Franklin India Growth Fund
| 3. | TRANSACTIONS WITH AFFILIATES (continued) |
| c. | Distribution Fees (continued) |
In addition, under the Fund’s Class C compensation distribution plan, the Fund pays Distributors for costs incurred in connection with the servicing, sale and distribution of the Fund’s shares up to the maximum annual plan rate.
The maximum annual plan rates, based on the average daily net assets, for each class, are as follows:
The Board of Trustees has set the current rate at 0.30% per year for Class A shares until further notice and approval by the Board.
d. Sales Charges/Underwriting Agreements
Distributors has advised the Fund of the following commission transactions related to the sales and redemptions of the Fund’s shares for the year:
| | |
| Sales charges retained net of commissions paid to unaffiliated | | |
| broker/dealers | $ | 57,720 |
| Contingent deferred sales charges retained | $ | 2,962 |
| |
| e. Transfer Agent Fees | | |
For the year ended October 31, 2010, the Fund paid transfer agent fees of $78,969, of which $49,959 was retained by Investor Services.
f. Waiver and Expense Reimbursements
Advisers and FT Services have contractually agreed in advance to waive or limit their respective fees and to assume as their own expense certain expenses otherwise payable by the fund so that the common expenses (i.e. a combination of management fees, administrative fees, and other expenses, including the Fund’s share of the Portfolio’s allocated expenses, but excluding distribution fees, and acquired fund fees and expenses) for each class of the Fund do not exceed 1.40% (other than certain non-routine expenses or costs, including those relating to litigation, indemnification, reorganizations, and liquidations) until February 28, 2011.
4. EXPENSE OFFSET ARRANGEMENT
The Fund has entered into an arrangement with its custodian whereby credits realized as a result of uninvested cash balances are used to reduce a portion of the Fund’s custodian expenses.
During the year ended October 31, 2010, there were no credits earned.
24 | Annual Report
Franklin Templeton International Trust
Notes to Financial Statements (continued)
Franklin India Growth Fund
5. INCOME TAXES
During the year ended October 31, 2010, the Fund utilized $11,041,026 of capital loss carryforwards.
The tax character of distributions paid during the years ended October 31, 2010 and 2009, was as follows:
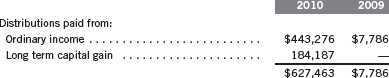
At October 31, 2010, the cost of investments, net unrealized appreciation (depreciation) and undistributed long term capital gains including the holdings of the Portfolio for income tax purposes were as follows:
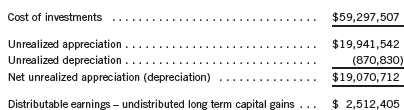
The Portfolio is a disregarded entity for United States Federal income tax purposes.
Net investment income (loss) differs for financial statement and tax purposes primarily due to differing treatments of foreign currency transactions, passive foreign investment company shares and offering costs.
Net realized gains (losses) differ for financial statement and tax purposes primarily due to differing treatments of wash sales, foreign currency transactions and passive foreign investment company shares.
6. CONCENTRATION OF RISK
Investing in Indian equity securities through the Portfolio may include certain risks and considerations not typically associated with investing in U.S. securities, such as fluctuating currency values, less liquidity, expropriation, confiscatory taxation, nationalization, exchange control regulations (including currency blockage), differing legal standards and changing local and regional economic, political and social conditions, which may result in greater market volatility.
Annual Report | 25
Franklin Templeton International Trust
Notes to Financial Statements (continued)
Franklin India Growth Fund
7. CREDIT FACILITY
The Fund, together with other U.S. registered and foreign investment funds (collectively “Borrowers”), managed by Franklin Templeton Investments, are borrowers in a joint syndicated senior unsecured credit facility totaling $750 million (Global Credit Facility) which matures on January 21, 2011. This Global Credit Facility provides a source of funds to the Borrowers for temporary and emergency purposes, including the ability to meet future unanticipated or unusually large redemption requests.
Under the terms of the Global Credit Facility, the Fund shall, in addition to interest charged on any borrowings made by the Fund and other costs incurred by the Fund, pay its share of fees and expenses incurred in connection with the implementation and maintenance of the Global Credit Facility, based upon its relative share of the aggregate net assets of all of the Borrowers, including an annual commitment fee of 0.10% based upon the unused portion of the Global Credit Facility, which is reflected in other expenses on the Statement of Operations. During the year ended October 31, 2010, the Fund did not use the Global Credit Facility.
8. FAIR VALUE MEASUREMENTS
The Fund follows a fair value hierarchy that distinguishes between market data obtained from independent sources (observable inputs) and the Fund’s own market assumptions (unobservable inputs). These inputs are used in determining the value of the Fund’s investments and are summarized in the following fair value hierarchy:
- Level 1 – quoted prices in active markets for identical securities
- Level 2 – other significant observable inputs (including quoted prices for similar securities, interest rates, prepayment speed, credit risk, etc.)
- Level 3 – significant unobservable inputs (including the Fund’s own assumptions in determining the fair value of investments)
The inputs or methodology used for valuing securities are not an indication of the risk associated with investing in those securities.
For movements between the levels within the fair value hierarchy, the Fund has adopted a policy of recognizing the transfers as of the date of the underlying event which caused the movement.
At October 31, 2010, all of the Fund’s investments in securities through the Portfolio carried at fair value were in Level 1 inputs.
26 | Annual Report
Franklin Templeton International Trust
Notes to Financial Statements (continued)
Franklin India Growth Fund
9. SUBSEQUENT EVENTS
The Fund has evaluated subsequent events through the issuance of the financial statements and determined that no events have occurred that require disclosure.
Annual Report | 27
Franklin Templeton International Trust
Report of Independent Registered Public Accounting Firm
To the Board of Directors and Shareholders of Franklin India Growth Fund
In our opinion, the accompanying statement of assets and liabilities, including the statement of investments, and the related statements of operations and of changes in net assets and the financial highlights present fairly, in all material respects, the financial position of Franklin India Growth Fund (the “Fund”) at October 31, 2010, the results of its operations for the year then ended, the changes in its net assets for each of the two years in the period then ended and the financial highlights for each of the periods presented, in conformity with accounting principles generally accepted in the United States of America. These financial statements and financial highlights (hereafter referred to as “financial statements”) are the responsibility of the Fund’s management. Our responsibility is to express an opinion on these financial statements based on our audits. We conducted our audits of these financial st atements in accordance with the standards of the Public Company Accounting Oversight Board (United States). Those standards require that we plan and perform the audit to obtain reasonable assurance about whether the financial statements are free of material misstatement. An audit includes examining, on a test basis, evidence supporting the amounts and disclosures in the financial statements, assessing the accounting principles used and significant estimates made by management, and evaluating the overall financial statement presentation. We believe that our audits provide a reasonable basis for our opinion.
PricewaterhouseCoopers LLP
San Francisco, California
December 17, 2010
28 | Annual Report
Franklin Templeton International Trust
Tax Designation (unaudited)
Franklin India Growth Fund
Under Section 852(b)(3)(C) of the Internal Revenue Code (Code), the Fund designates the maximum amount allowable but no less than $184,187 as a long term capital gain dividend for the fiscal year ended October 31, 2010.
Under Section 854(b)(2) of the Code, the Fund designates the maximum amount allowable but no less than $895,771 as qualified dividends for purposes of the maximum rate under Section 1(h)(11) of the Code for the fiscal year ended October 31, 2010. Distributions, including qualified dividend income, paid during calendar year 2010 will be reported to shareholders on Form 1099-DIV in January 2011. Shareholders are advised to check with their tax advisors for information on the treatment of these amounts on their individual income tax returns.
Annual Report | 29
Franklin Templeton International Trust
Board Members and Officers
The name, year of birth and address of the officers and board members, as well as their affiliations, positions held with the Trust, principal occupations during the past five years and number of portfolios overseen in the Franklin Templeton Investments fund complex are shown below. Generally, each board member serves until that person’s successor is elected and qualified.
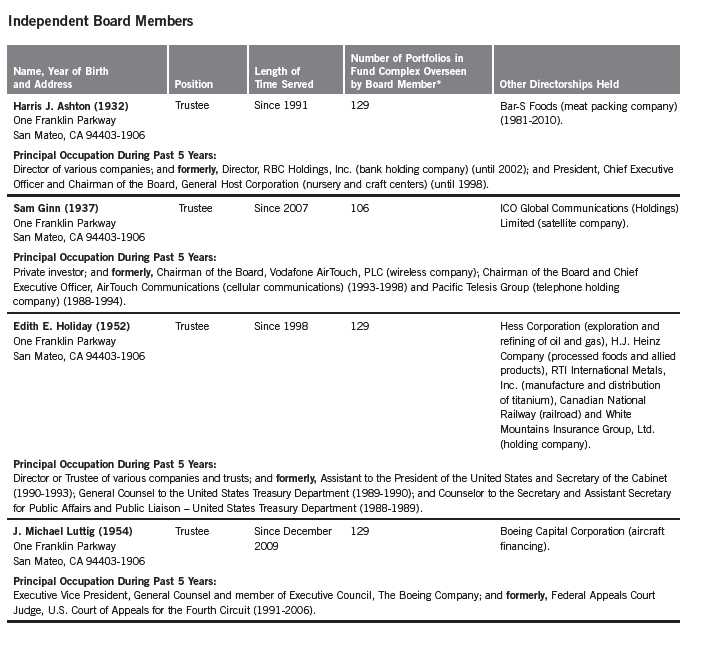
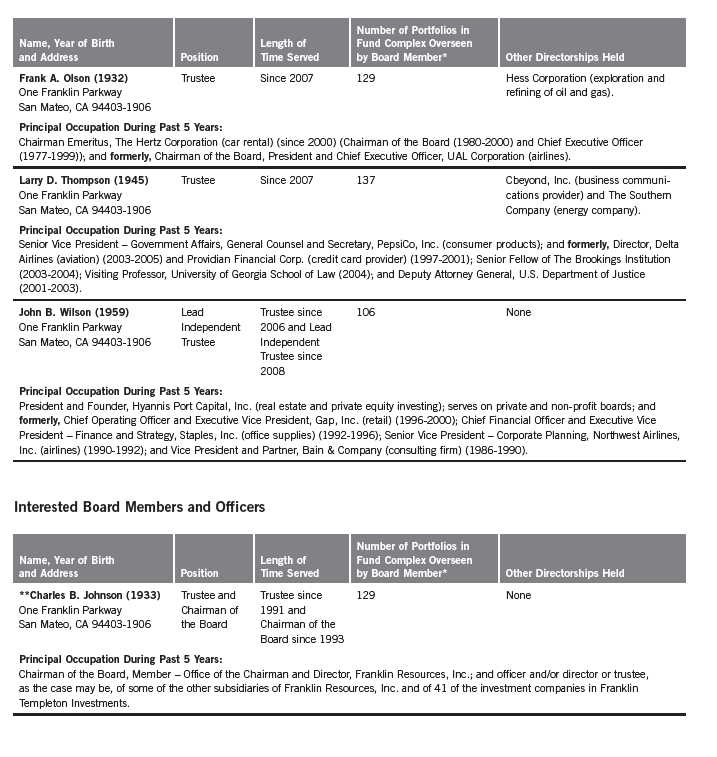
Annual Report | 31
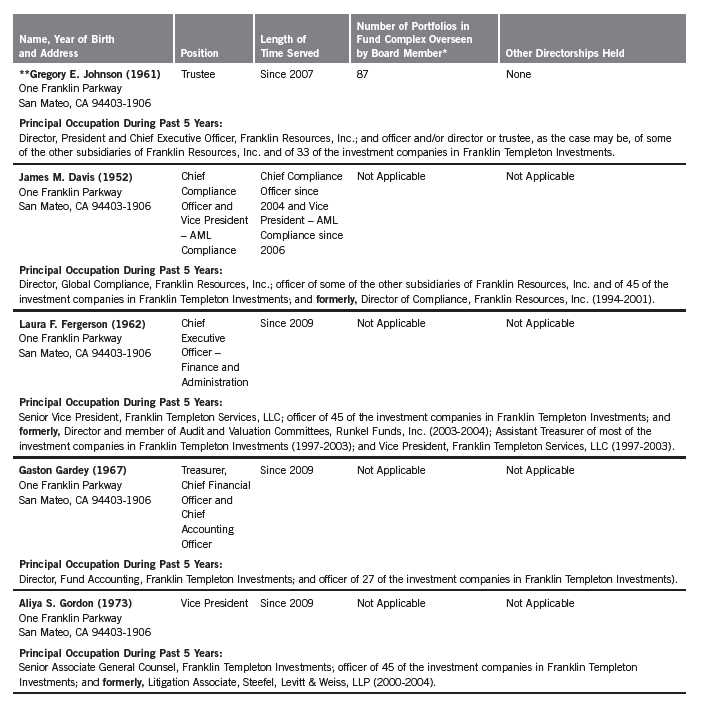
32 | Annual Report
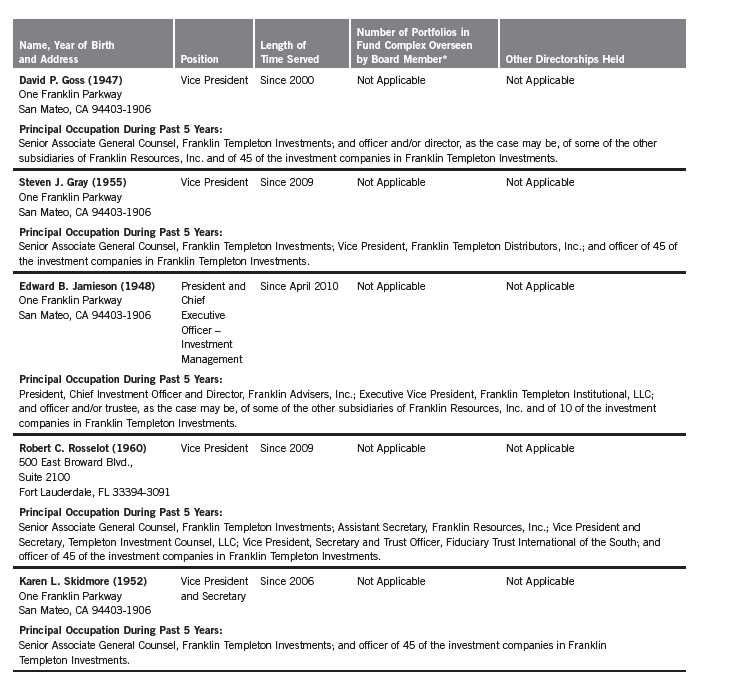
Annual Report | 33
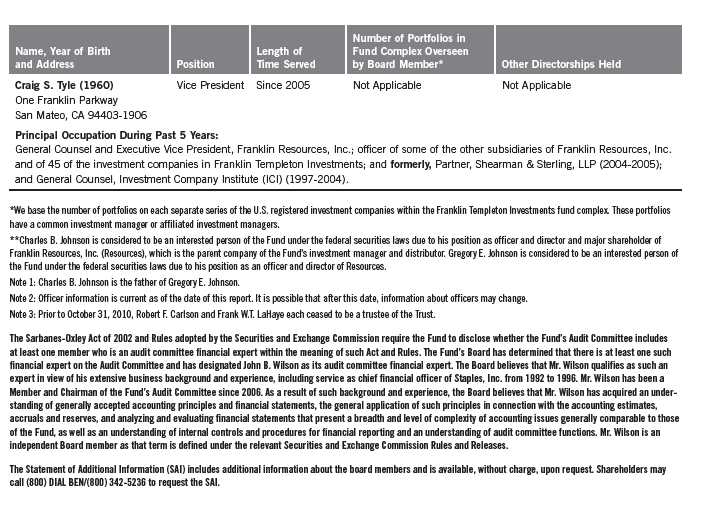
34 | Annual Report
FT (Mauritius) Offshore Investments Limited
Financial Highlights
(Expressed in U.S. Dollars)
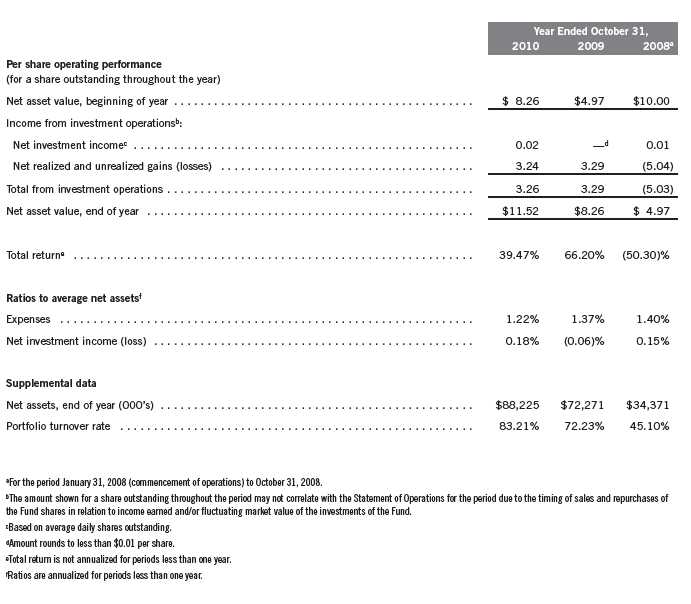
Annual Report | The accompanying notes are an integral part of these financial statements. | 35
FT (Mauritius) Offshore Investments Limited
Statement of Investments, October 31, 2010
(Expressed in U.S. Dollars)
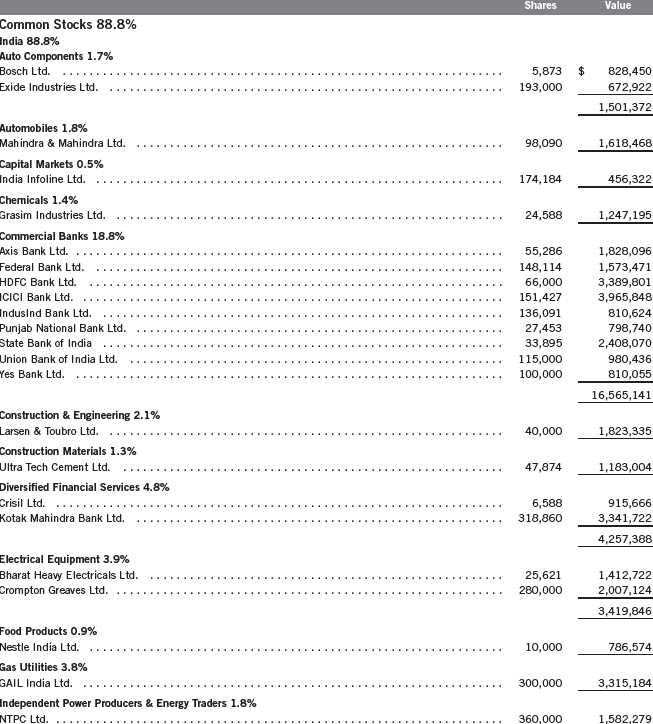
36 | Annual Report
FT (Mauritius) Offshore Investments Limited
Statement of Investments, October 31, 2010 (continued)
(Expressed in U.S. Dollars)
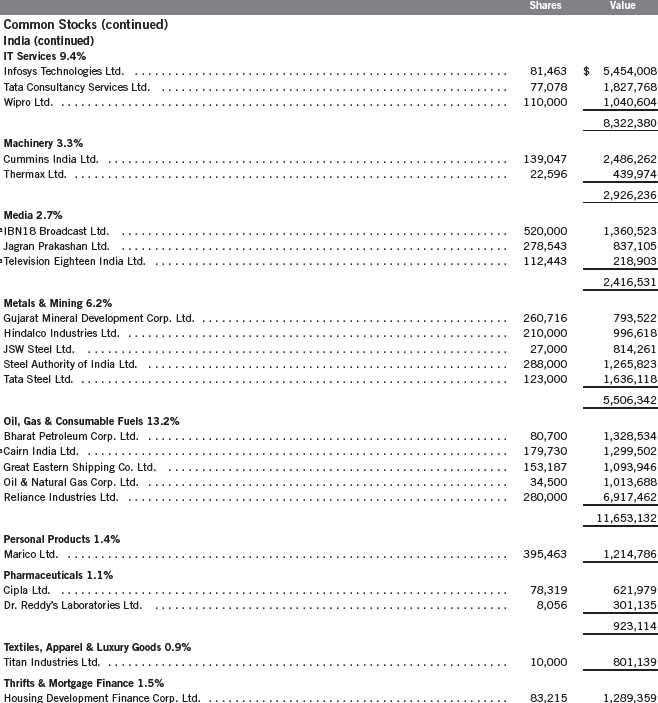
Annual Report | 37
FT (Mauritius) Offshore Investments Limited
Statement of Investments, October 31, 2010 (continued)
(Expressed in U.S. Dollars)
| | | | |
| | Shares | | | Value |
| Common Stocks (continued) | | | | |
| India (continued) | | | | |
| Wireless Telecommunication Services 6.3% | | | | |
| Bharti Airtel Ltd. | 580,000 | $ | | 4,258,956 |
| Idea Cellular Ltd. | 858,148 | | | 1,300,136 |
| | | | | 5,559,092 |
| Total Common Stocks (Cost $57,474,760) | | | | 78,368,219 |
| Other Assets, less Liabilities 11.2% | | | | 9,856,726 |
| Net Assets 100.0% | | | $ | 88,224,945 |
| |
| |
| aNon-income producing. | | | | |
38 | The accompanying notes are an integral part of these financial statements. | Annual Report
FT (Mauritius) Offshore Investments Limited
Financial Statements
(Expressed in U.S. Dollars)
Statement of Assets and Liabilities
October 31, 2010
| | |
| Assets: | | |
| Investments in securities: | | |
| Cost | $ | 57,474,760 |
| Value | $ | 78,368,219 |
| Cash | | 87,569 |
| Foreign currency, at value (cost $9,820,005) | | 9,813,364 |
| Receivables: | | |
| Capital shares sold | | 1,336,590 |
| Dividends | | 12,679 |
| Total assets | | 89,618,421 |
| Liabilities: | | |
| Payables: | | |
| Investment securities purchased | | 1,303,218 |
| Affiliates | | 75,415 |
| Accrued expenses and other liabilities | | 14,843 |
| Total liabilities | | 1,393,476 |
| Net assets, at value | $ | 88,224,945 |
| Shares outstanding | | 7,658,274 |
| Net asset value per share | $ | 11.52 |
Annual Report | The accompanying notes are an integral part of these financial statements. | 39
FT (Mauritius) Offshore Investments Limited
Financial Statements (continued)
(Expressed in U.S. Dollars)
Statement of Operations
for the year ended October 31, 2010

40 | The accompanying notes are an integral part of these financial statements. | Annual Report
FT (Mauritius) Offshore Investments Limited
Financial Statements (continued)
(Expressed in U.S. Dollars)

Annual Report | The accompanying notes are an integral part of these financial statements. | 41
FT (Mauritius) Offshore Investments Limited
Notes to Financial Statements
(Expressed in U.S. Dollars)
1. ORGANIZATION AND SIGNIFICANT ACCOUNTING POLICIES
FT (Mauritius) Offshore Investments Limited (Portfolio) is registered with and regulated by the Mauritius Financial Services Commission. The Portfolio was formed for the purpose of facilitating the Franklin India Growth Fund’s (Fund) purchase of securities of a wide selection of Indian companies, consistent with the Fund’s investment strategies and has elected to be treated as a disregarded entity for United States federal income tax purposes.
At October 31, 2010, the Fund owned 100% of the Portfolio.
The following summarizes the Portfolio’s significant accounting policies.
a. Financial Instrument Valuation
The Portfolio values its investments in securities and other assets and liabilities carried at fair value daily. Fair value is the price that would be received to sell an asset or paid to transfer a liability in an orderly transaction between market participants on the measurement date. Under procedures approved by the Fund’s Board of Trustees, the Portfolio may utilize independent pricing services, quotations from securities and financial instrument dealers, and other market sources to determine fair value.
Equity securities listed on an exchange or on the NASDAQ National Market System are valued at the last quoted sale price or the official closing price of the day, respectively. Foreign equity securities are valued as of the close of trading on the foreign stock exchange on which the security is primarily traded, or the NYSE, whichever is earlier. The value is then converted into its U.S. dollar equivalent at the foreign exchange rate in effect at the close of the NYSE on the day that the value of the security is determined. Over-the-counter securities are valued within the range of the most recent quoted bid and ask prices. Securities that trade in multiple markets or on multiple exchanges are valued according to the broadest and most representative market. Certain equity securities are valued based upon fundamental characteristics or relationships to similar securities.
The Portfolio follows the Fund’s procedures to determine the fair value of securities and other financial instruments for which market prices are not readily available or which may not be reliably priced. Under these procedures, the Portfolio primarily employs a market-based approach which may use related or comparable assets or liabilities, recent transactions, market multiples, book values, and other relevant information for the investment to determine the fair value of the investment. The Portfolio may also use an income-based valuation approach in which the anticipated future cash flows of the investment are discounted to calculate fair value. Discounts may also be applied due to the nature or duration of any restrictions on the disposition of the investments. Due to the inherent uncertainty of valuations of such investments, the fair values may differ significantly from the values that would have been used had an active mar ket existed.
42 | Annual Report
FT (Mauritius) Offshore Investments Limited
Notes to Financial Statements (continued)
(Expressed in U.S. Dollars)
| 1. | ORGANIZATION AND SIGNIFICANT ACCOUNTING POLICIES (continued) |
| a. | Financial Instrument Valuation (continued) |
Trading in securities on foreign exchanges and over-the-counter markets may be completed before the daily close of business on the NYSE. Occasionally, events occur between the time at which trading in a foreign security is completed and the close of the NYSE that might call into question the reliability of the value of a portfolio security held by the Portfolio. As a result, differences may arise between the value of the Portfolio’s portfolio securities as determined at the foreign market close and the latest indications of value at the close of the NYSE. In order to minimize the potential for these differences, the investment manager monitors price movements following the close of trading in foreign stock markets through a series of country specific market proxies (such as baskets of American Depository Receipts, futures contracts and exchange traded funds). These price movements are measured against established trigger thresho lds for each specific market proxy to assist in determining if an event has occurred that may call into question the reliability of the values of the foreign securities held by the Portfolio. If such an event occurs, the securities may be valued using fair value procedures, which may include the use of independent pricing services.
b. Foreign Currency Translation
Portfolio securities and other assets and liabilities denominated in foreign currencies are translated into U.S. dollars based on the exchange rate of such currencies against U.S. dollars on the date of valuation. The Portfolio may enter into foreign currency exchange contracts to facilitate transactions denominated in a foreign currency. Purchases and sales of securities, income and expense items denominated in foreign currencies are translated into U.S. dollars at the exchange rate in effect on the transaction date. Portfolio securities and assets and liabilities denominated in foreign currencies contain risks that those currencies will decline in value relative to the U.S. dollar. Occasionally, events may impact the availability or reliability of foreign exchange rates used to convert the U.S. dollar equivalent value. If such an event occurs, the foreign exchange rate will be valued at fair value using procedures established and a pproved by the Fund’s Board of Trustees.
The Portfolio does not separately report the effect of changes in foreign exchange rates from changes in market prices on securities held. Such changes are included in net realized and unrealized gain or loss from investments on the Statement of Operations.
Realized foreign exchange gains or losses arise from sales of foreign currencies, currency gains or losses realized between the trade and settlement dates on securities transactions and the difference between the recorded amounts of dividends, interest, and foreign withholding taxes and the U.S. dollar equivalent of the amounts actually received or paid. Net unrealized foreign exchange gains and losses arise from changes in foreign exchange rates on foreign denominated assets and liabilities other than investments in securities held at the end of the reporting period.
Annual Report | 43
FT (Mauritius) Offshore Investments Limited
Notes to Financial Statements (continued)
(Expressed in U.S. Dollars)
| 1. | ORGANIZATION AND SIGNIFICANT ACCOUNTING POLICIES (continued) |
| c. | Income Taxes |
The Portfolio conducts its investment activities in India as a tax resident of Mauritius and expects to obtain benefits under the double taxation treaty between Mauritius and India (Treaty). To obtain benefits under the Treaty, the Portfolio must meet certain tests and conditions, including the establishment of Mauritius tax residence and related requirements. The Portfolio has obtained a certificate from the Mauritius tax authorities and believes that such certification is evidence that it is a resident of Mauritius under the Treaty. A company which is a tax resident in Mauritius under the Treaty and has no branch or permanent establishment in India, will not be subject to capital gains tax in India on the sale of Indian securities but is subject to Indian withholding tax on interest earned on Indian securities at the rate of 21.115% (which includes surcharges). There is no withholding tax in India in respect of dividends paid by In dian companies and such dividends are exempt in the hands of the shareholders.
The Portfolio holds a Category 1 Global Business License for the purpose of the Financial Services Act 2007 and under current laws and regulations, is subject to tax in Mauritius at the rate of 15% on its net income. However, the Portfolio is entitled to a deemed tax credit equivalent to the higher of actual foreign tax suffered or a presumed foreign tax equivalent of 80% of the Mauritian tax on its foreign source income. Thus, the effective tax rate in Mauritius should not exceed 3% (i.e. 15% less 80% of 15%). Indian companies making distributions are, however, liable to a dividend distribution tax equivalent to 16.995% of the dividends distributed. A company holding at least 5% of the share capital of an Indian company and receiving dividends from that Indian company may claim a credit for tax paid by the Indian company on its profits out of which the dividends were distributed including the dividend distribution tax. No Mauritian capital gains tax is payable on profits arising from sale of securities, and any dividends and redemption proceeds paid by the Portfolio to its shareholders will be exempt from withholding or other tax.
The Portfolio continues to: (i) comply with the requirements of the Treaty; (ii) be a tax resident of Mauritius; and (iii) maintain that its central management and control resides in Mauritius, and therefore management believes that the Portfolio will be able to obtain the benefits of the Treaty. Accordingly, no provision for Indian income taxes has been made in the accompanying financial statements of the Portfolio for taxes related to capital gains or dividends.
The foregoing is based upon current interpretation and practice and is subject to future changes in Indian or Mauritian tax laws and in the Treaty.
44 | Annual Report
FT (Mauritius) Offshore Investments Limited
Notes to Financial Statements (continued)
(Expressed in U.S. Dollars)
| 1. | ORGANIZATION AND SIGNIFICANT ACCOUNTING POLICIES (continued) |
| d. | Security Transactions, Investment Income and Expenses |
Security transactions are accounted for on trade date. Realized gains and losses on security transactions are determined on a specific identification basis. Estimated expenses are accrued daily. Dividend income is recorded on the ex-dividend date except that certain dividends from foreign securities are recognized as soon as the Portfolio is notified of the ex-dividend date.
e. Accounting Estimates
The preparation of financial statements in accordance with accounting principles generally accepted in the United States of America requires management to make estimates and assumptions that affect the reported amounts of assets and liabilities at the date of the financial statements and the amounts of income and expenses during the reporting period. Actual results could differ from those estimates.
f. Guarantees and Indemnifications
Under the Portfolio’s organizational documents, the Portfolio’s officers and directors are indemnified by the Portfolio against certain liabilities arising out of the performance of their duties to the Portfolio. Additionally, in the normal course of business, the Portfolio enters into contracts with service providers that contain general indemnification clauses. The Portfolio’s maximum exposure under these arrangements is unknown as this would involve future claims that may be made against the Portfolio that have not yet occurred. Currently, the Portfolio expects the risk of loss to be remote.
2. CAPITAL STOCK
At October 31, 2010, there were an unlimited number of shares authorized (without par value).
Transactions in the Portfolio’s shares were as follows:
| | | | | | | | | | |
| | | | | Year Ended October 31, | | | | |
| | 2010 | | 2009 | |
| | Shares | | | Amount | | Shares | | | Amount | |
| Shares sold | 5,534,231 | | $ | 54,602,940 | | 1,960,260 | | $ | 14,423,326 | |
| Shares redeemed | (6,621,552 | ) | | (60,807,865 | ) | (130,528 | ) | | (703,324 | ) |
| Net increase (decrease) | (1,087,321 | ) | $ | (6,204,925 | ) | 1,829,732 | | $ | 13,720,002 | |
Annual Report | 45
FT (Mauritius) Offshore Investments Limited
Notes to Financial Statements (continued)
(Expressed in U.S. Dollars)
3. TRANSACTIONS WITH AFFILIATES
Franklin Resources, Inc. is the holding company of Franklin Advisers, Inc. (Advisers) which is the investment manager of the Portfolio.
a. Management Fees
The Portfolio pays an investment management fee to Advisers equal to 80% of the total management fee with the remainder to be paid by the Fund based on the average daily net assets of the Fund as follows:
| | |
| Annualized Fee Rate | | Net Assets |
| 1.250 | % | Up to and including $1 billion |
| 1.200 | % | Over $1 billion, up to and including $5 billion |
| 1.150 | % | Over $5 billion, up to and including $10 billion |
| 1.100 | % | Over $10 billion, up to and including $15 billion |
| 1.050 | % | Over $15 billion, up to and including $20 billion |
| 1.000 | % | In excess of $20 billion |
b. Administrative Fees
The Portfolio pays an administrative fee to International Financial Services Limited (IFS), a Mauritius company, an annual fee of $30,000 plus reimbursement of certain expenses. Certain directors of the Portfolio are also directors of IFS.
4. INVESTMENT TRANSACTIONS
Purchases and sales of investments (excluding short term securities) for the year ended October 31, 2010, aggregated $60,219,711 and $73,945,334, respectively.
5. CONCENTRATION OF RISK
Investing in Indian equity securities through the Portfolio may include certain risks and considerations not typically associated with investing in U.S. securities, such as fluctuating currency values, less liquidity, expropriation, confiscatory taxation, nationalization, exchange control regulations (including currency blockage), differing legal standards and changing local and regional economic, political and social conditions, which may result in greater market volatility.
46 | Annual Report
FT (Mauritius) Offshore Investments Limited
Notes to Financial Statements (continued)
(Expressed in U.S. Dollars)
6. FAIR VALUE MEASUREMENTS
The Portfolio follows a fair value hierarchy that distinguishes between market data obtained from independent sources (observable inputs) and the Portfolio’s own market assumptions (unobservable inputs). These inputs are used in determining the value of the Portfolio’s investments and are summarized in the following fair value hierarchy:
- Level 1 – quoted prices in active markets for identical securities
- Level 2 – other significant observable inputs (including quoted prices for similar securities, interest rates, prepayment speed, credit risk, etc.)
- Level 3 – significant unobservable inputs (including the Portfolio’s own assumptions in determining the fair value of investments)
The inputs or methodology used for valuing securities are not an indication of the risk associated with investing in those securities.
For movements between the levels within the fair value hierarchy, the Portfolio adopted a policy of recognizing the transfers as of the date of the underlying event which caused the movement.
At October 31, 2010, all of the Portfolio’s investments in securities carried at fair value were in Level 1 inputs. For detailed industry descriptions, see the accompanying Statement of Investments.
7. SUBSEQUENT EVENTS
The Portfolio has evaluated subsequent events through the issuance of the financial statements and determined that no events have occurred that require disclosure.
Annual Report | 47
FT (Mauritius) Offshore Investments Limited
Report of Independent Registered Public Accounting Firm
To the Board of Directors and Shareholder of FT (Mauritius) Offshore Investments Limited
In our opinion, the accompanying statement of assets and liabilities, including the statement of investments, and the related statements of operations and of changes in net assets and the financial highlights present fairly, in all material respects, the financial position of FT (Mauritius) Offshore Investments Limited (the “Portfolio”) at October 31, 2010, the results of its operations for the year then ended, the changes in its net assets for each of the two years in the period then ended and the financial highlights for each of the periods presented, in conformity with accounting principles generally accepted in the United States of America. These financial statements and financial highlights (hereafter referred to as “financial statements”) are the responsibility of the Fund’s management. Our responsibility is to express an opinion on these financial statements based on our audits. We conducted our audits of these financial statements in accordance with the standards of the Public Company Accounting Oversight Board (United States). Those standards require that we plan and perform the audit to obtain reasonable assurance about whether the financial statements are free of material misstatement. An audit includes examining, on a test basis, evidence supporting the amounts and disclosures in the financial statements, assessing the accounting principles used and significant estimates made by management, and evaluating the overall financial statement presentation. We believe that our audits, which included confirmation of securities at October 31, 2010 by correspondence with the custodian and brokers, provide a reasonable basis for our opinion.
PricewaterhouseCoopers LLP
San Francisco, California
December 17, 2010
48 | Annual Report
Franklin Templeton International Trust
Shareholder Information
Franklin India Growth Fund
Proxy Voting Policies and Procedures
The Fund’s investment manager has established Proxy Voting Policies and Procedures (Policies) that the Fund uses to determine how to vote proxies relating to portfolio securities. Shareholders may view the Fund’s complete Policies online at franklintempleton.com. Alternatively, shareholders may request copies of the Policies free of charge by calling the Proxy Group collect at (954) 527-7678 or by sending a written request to: Franklin Templeton Companies, LLC, 500 East Broward Boulevard, Suite 1500, Fort Lauderdale, FL 33394, Attention: Proxy Group. Copies of the Fund’s proxy voting records are also made available online at franklintempleton.com and posted on the U.S. Securities and Exchange Commission’s website at sec.gov and reflect the most recent 12-month period ended June 30.
Quarterly Statement of Investments
The Fund files a complete statement of investments with the U.S. Securities and Exchange Commission for the first and third quarters for each fiscal year on Form N-Q. Shareholders may view the filed Form N-Q by visiting the Commission’s website at sec.gov. The filed form may also be viewed and copied at the Commission’s Public Reference Room in Washington, DC. Information regarding the operations of the Public Reference Room may be obtained by calling (800) SEC-0330.
Householding of Reports and Prospectuses
You will receive the Fund’s financial reports every six months as well as an annual updated summary prospectus (prospectus available upon request). To reduce Fund expenses, we try to identify related shareholders in a household and send only one copy of the financial reports and summary prospectus. This process, called “householding,” will continue indefinitely unless you instruct us otherwise. If you prefer not to have these documents householded, please call us at (800) 632-2301. At any time you may view current prospectuses/summary prospectuses and financial reports on our website. If you choose, you may receive these documents through electronic delivery.
Annual Report | 49
This page intentionally left blank.
This page intentionally left blank.
This page intentionally left blank.
Item 2. Code of Ethics.
(a) The Registrant has adopted a code of ethics that applies to its principal executive officers and principal financial and accounting officer.
(c) N/A
(d) N/A
(f) Pursuant to Item 12(a)(1), the Registrant is attaching as an exhibit a copy of its code of ethics that applies to its principal executive officers and principal financial and accounting officer.
Item 3. Audit Committee Financial Expert.
(a)(1) The Registrant has an audit committee financial expert serving on its audit committee.
(2) The audit committee financial expert is John B. Wilson and he is "independent" as defined under the relevant Securities and Exchange Commission Rules and Releases.
Item 4. Principal Accountant Fees and Services.
(a) Audit Fees
The aggregate fees paid to the principal accountant for professional services rendered by the principal accountant for the audit of the registrant’s annual financial statements or for services that are normally provided by the principal accountant in connection with statutory and regulatory filings or engagements were $97,017 for the fiscal year ended October 31, 2010 and $121,452 for the fiscal year ended October 31, 2009.
(b) Audit-Related Fees
There were no fees paid to the principal accountant for assurance and related services rendered by the principal accountant to the registrant that are reasonably related to the performance of the audit of the registrant's financial statements and are not reported under paragraph (a) of Item 4.
There were no fees paid to the principal accountant for assurance and related services rendered by the principal accountant to the registrant's investment adviser and any entity controlling, controlled by or under common control with the investment adviser that provides ongoing services to the registrant that are reasonably related to the performance of the audit of their financial statements.
(c) Tax Fees
There were no fees paid to the principal accountant for professional services rendered by the principal accountant to the registrant for tax compliance, tax advice and tax planning.
The aggregate fees paid to the principal accountant for professional services rendered by the principal accountant to the registrant’s investment adviser and any entity controlling, controlled by or under common control with the investment adviser that provides ongoing services to the registrant for tax compliance, tax advice and tax planning were $35,000 for the fiscal year ended October 31, 2010 and $2,000 for the fiscal year ended October 31, 2009. The services for which these fees were paid included technical tax consultation for capital gain tax reporting to foreign governments and derivative instruments.
(d) All Other Fees
The aggregate fees paid to the principal accountant for products and services rendered by the principal accountant to the registrant not reported in paragraphs (a)-(c) of Item 4 were $105 for the fiscal year ended October 31, 2010 and $0 for the fiscal year ended October 31, 2009. The services for which these fees were paid include review of materials provided to the fund Board in connection with the investment management contract renewal process.
The aggregate fees paid to the principal accountant for products and services rendered by the principal accountant to the registrant’s investment adviser and any entity controlling, controlled by or under common control with the investment adviser that provides ongoing services to the registrant not reported in paragraphs (a)-(c) of Item 4 were $144,695 for the fiscal year ended October 31, 2010 and $0 for the fiscal year ended October 31, 2009. The services for which these fees were paid include review of materials provided to the fund Board in connection with the investment management contract renewal process.
(e) (1) The registrant’s audit committee is directly responsible for approving the services to be provided by the auditors, including:
(i) pre-approval of all audit and audit related services;
(ii) pre-approval of all non-audit related services to be provided to the Fund by the auditors;
(iii) pre-approval of all non-audit related services to be provided to the registrant by the auditors to the registrant’s investment adviser or to any entity that controls, is controlled by or is under common control with the registrant’s investment adviser and that provides ongoing services to the registrant where the non-audit services relate directly to the operations or financial reporting of the registrant; and
(iv) establishment by the audit committee, if deemed necessary or appropriate, as an alternative to committee pre-approval of services to be provided by the auditors, as required by paragraphs (ii) and (iii) above, of policies and procedures to permit such services to be pre-approved by other means, such as through establishment of guidelines or by action of a designated member or members of the committee; provided the policies and procedures are detailed as to the particular service and the committee is informed of each service and such policies and procedures do not include delegation of audit committee responsibilities, as contemplated under the Securities Exchange Act of 1934, to management; subject, in the case of (ii) through (iv), to any waivers, exceptions or exemptions that may be available under applicable law or rules.
(e) (2) None of the services provided to the registrant described in paragraphs (b)-(d) of Item 4 were approved by the audit committee pursuant to paragraph (c)(7)(i)(C) of Rule 2-01 of regulation S-X.
(f) No disclosures are required by this Item 4(f).
(g) The aggregate non-audit fees paid to the principal accountant for services rendered by the principal accountant to the registrant and the registrant’s investment adviser and any entity controlling, controlled by or under common control with the investment adviser that provides ongoing services to the registrant were $179,800 for the fiscal year ended October 31, 2010 and $2,000 for the fiscal year ended October 31, 2009.
(h) The registrant’s audit committee of the board has considered whether the provision of non-audit services that were rendered to the registrant’s investment adviser (not including any sub-adviser whose role is primarily portfolio management and is subcontracted with or overseen by another investment adviser), and any entity controlling, controlled by, or under common control with the investment adviser that provides ongoing services to the registrant that were not pre-approved pursuant to paragraph (c)(7)(ii) of Rule 2-01 of Regulation S-X is compatible with maintaining the principal accountant’s independence.
Item 5. Audit Committee of Listed Registrants. N/A
Item 6. Schedule of Investments. N/A
Item 7. Disclosure of Proxy Voting Policies and Procedures for Closed-End Management Investment Companies. N/A
Item 8. Portfolio Managers of Closed-End Management Investment Companies. N/A
Item 9. Purchases of Equity Securities by Closed-End Management Investment Company and Affiliated Purchasers. N/A
Item 10. Submission of Matters to a Vote of Security Holders.
There have been no changes to the procedures by which shareholders may recommend nominees to the Registrant's Board of Trustees that would require disclosure herein.
Item 11. Controls and Procedures.
(a) Evaluation of Disclosure Controls and Procedures. The Registrant maintains disclosure controls and procedures that are designed to ensure that information required to be disclosed in the Registrant’s filings under the Securities Exchange Act of 1934 and the Investment Company Act of 1940 is recorded, processed, summarized and reported within the periods specified in the rules and forms of the Securities and Exchange Commission. Such information is accumulated and communicated to the Registrant’s management, including its principal executive officer and principal financial officer, as appropriate, to allow timely decisions regarding required disclosure. The Registrant’s management, including the principal executive officer and the principal financial officer, recognizes that any set of controls and procedures, no matter how well designed and operated, can provide only reasonable assurance of achieving the desired control objectives.
Within 90 days prior to the filing date of this Shareholder Report on Form N-CSR, the Registrant had carried out an evaluation, under the supervision and with the participation of the Registrant’s management, including the Registrant’s principal executive officer and the Registrant’s principal financial officer, of the effectiveness of the design and operation of the Registrant’s disclosure controls and procedures. Based on such evaluation, the Registrant’s principal executive officer and principal financial officer concluded that the Registrant’s disclosure controls and procedures are effective.
(b) Changes in Internal Controls. There have been no significant changes in the Registrant’s internal controls or in other factors that could significantly affect the internal controls subsequent to the date of their evaluation in connection with the preparation of this Shareholder Report on Form N-CSR.
Item 12. Exhibits.
(a) (1) Code of Ethics
(a) (2) Certifications pursuant to Section 302 of the Sarbanes-Oxley Act of 2002 of Laura F. Fergerson, Chief Executive Officer - Finance and Administration, and Gaston Gardey, Chief Financial Officer and Chief Accounting Officer
(b) Certifications pursuant to Section 906 of the Sarbanes-Oxley Act of 2002 of Laura F. Fergerson, Chief Executive Officer - Finance and Administration, and Gaston Gardey, Chief Financial Officer and Chief Accounting Officer
SIGNATURES
Pursuant to the requirements of the Securities Exchange Act of 1934 and the Investment Company Act of 1940, the registrant has duly caused this report to be signed on its behalf by the undersigned, thereunto duly authorized.
FRANKLIN TEMPLETON INTERNATIONAL TRUST
By /s/LAURA F. FERGERSON
Laura F. Fergerson
Chief Executive Officer - Finance and Administration
Date December 28, 2010
Pursuant to the requirements of the Securities Exchange Act of 1934 and the Investment Company Act of 1940, this report has been signed below by the following persons on behalf of the registrant and in the capacities and on the dates indicated.
By /s/LAURA F. FERGERSON
Laura F. Fergerson
Chief Executive Officer - Finance and Administration
Date December 28, 2010
By /s/GASTON GARDEY
Gaston Gardey
Chief Financial Officer and Chief Accounting Officer
Date December 28, 2010