1
Annual Report
Franklin India Growth Fund
Your Fund’s Goal and Main Investments: Franklin India Growth Fund seeks long-term capital appreciation by investing under normal market conditions at least 80% of its net assets in securities of “Indian companies,” which are defined as those organized under the laws of, with a principal office in, or for which the principal trading market for their securities is in India, that derive 50% or more of total revenue or profit from goods or services produced or sales made in India, or that have 50% or
more of their assets in India.1
Performance data represent past performance, which does not guarantee future results. Investment return and principal value will fluctuate, and you may have a gain or loss when you sell your shares. Current performance may differ from figures shown. Please visit franklintempleton.com or call (800) 342-5236 for most recent month-end performance.
This annual report for Franklin India Growth Fund covers the fiscal year ended October 31, 2012.
Performance Overview
Franklin India Growth Fund – Class A had a -6.02% cumulative total return for the fiscal year ended October 31, 2012. The Fund underperformed the -4.73% total return of the benchmark MSCI India Index, which is designed to measure stock market performance in India.2 You can find more of the Fund’s performance data in the Performance Summary beginning on page 7.
Economic and Market Overview
India’s economy expanded at a modest pace during the review period. Real gross domestic product growth averaged 5.9% over the four quarters ended June 2012, compared to an annualized expansion rate of 8.3% over the five years ended December 2011.3 Weak investment spending and tight monetary policy stifled growth, which was visibly slower in the industrial and infrastructure sectors, mainly because of limited central bank policy options and a slowdown in project approvals. News reports and investors focused for most of the year on many of the near-term headwinds.
1. The Fund currently invests indirectly in Indian companies through FT (Mauritius) Offshore Investments Limited, a wholly owned, collective investment vehicle registered in the Republic of Mauritius.
2. Source: © 2012 Morningstar. All Rights Reserved. The information contained herein: (1) is proprietary to Morningstar and/or its content providers; (2) may not be copied or distributed; and (3) is not warranted to be accurate, complete or timely. Neither Morningstar nor its content providers are responsible for any damages or losses arising from any use of this information. The index is unmanaged and includes reinvested dividends. One cannot invest directly in an index, and an index is not representative of the Fund’s portfolio.
3. Source: Ministry of Statistics and Programme Implementation.
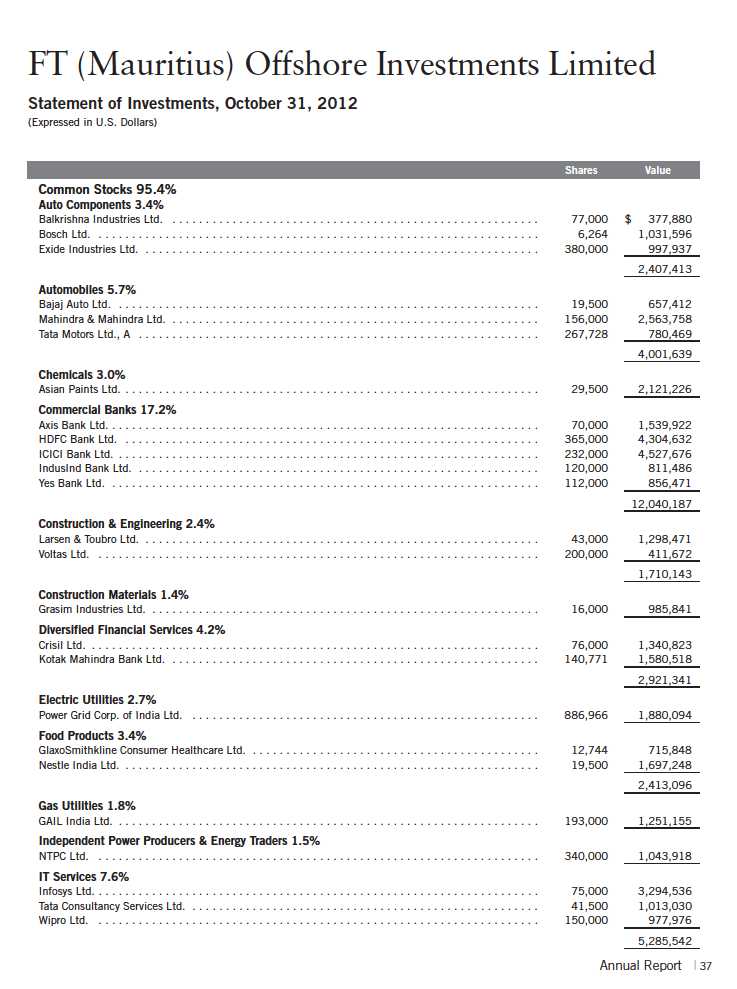
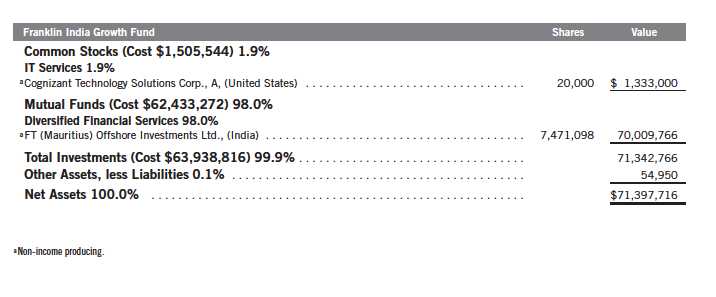
The dollar value, number of shares or principal amount, and names of all portfolio holdings are listed in the Fund’s Statement of Investments (SOI). The SOI begins on page 16.
Annual Report | 3

Despite the country’s moderating growth rate, the Reserve Bank of India maintained a cautious monetary policy stance. The central bank cut its benchmark policy rate 50 basis points in April 2012 to 8% from 8.50%, but has since refrained as inflation levels remained elevated. More importantly, the bank has been concerned about a high fiscal deficit and widening current account gap. The central bank has, however, reduced reserve requirements for banks to boost systemic liquidity and promote credit flow to productive sectors of the economy. This move helped corporate borrowing costs ease from peaks.
A key positive factor throughout the period was Indian corporations’ sustained strength. Although many Indian companies continued to report reasonably strong revenue growth, higher input and borrowing costs weighed on profitability. However, third quarter 2012 earnings data suggested margin pressures were peaking amid easing borrowing costs and raw material prices.
In September 2012, the government stepped up policy action and announced measures focused on boosting foreign capital investment and managing the fiscal deficit. The improved policy environment helped local equity markets and the rupee rebound. Strong foreign portfolio inflows also supported Indian stocks as a fresh round of stimulus from key developed market central banks and receding eurozone worries boosted global investor risk appetite. In terms of sectors, consumer staples and health care stocks generally outperformed broad markets during the period, while the metal and energy sectors declined in value.
Investment Strategy
We are research-driven, fundamental investors pursuing a growth strategy. As bottom-up investors focusing primarily on individual securities, we seek to invest in companies whose current market price, in our opinion, does not reflect future growth prospects. We choose companies that have identifiable drivers of future earnings growth and that present, in our opinion, the best trade-off between earnings growth potential, business and financial risk, and valuation. We rely on a team of analysts to help provide in-depth industry expertise and use both qualitative and quantitative analyses to evaluate companies for distinct and sustainable competitive advantages through leading-edge products, intellectual property, product positioning, unique market niches, brand identity, solid management teams, strong balance sheets, above-average or rising margins, and strong returns on capital invested in the business. In choosing equity investments, we also consider such factors as the company’s financial strength, management’s expertise, the company’s growth potential within the industry, and the industry’s growth potential.
4 | Annual Report
Manager’s Discussion
Our overall strategy has been to build a diversified portfolio covering the full market capitalization spectrum of companies we believe are well positioned to take advantage of Indian economic growth. The Fund has focused on companies that have been delivering growth across market cycles and benefiting from India’s structural growth drivers, consumption and investment.
The Fund’s absolute performance during the period was bolstered by gains from financials and industrials holdings.4 The top individual contributors to performance over the 12-month period included private banking firm HDFC Bank, personal care products company Marico and machinery firm Cummins India. HDFC Bank’s strong, low-cost deposit base and good asset quality profile helped the company maintain robust earnings. Hopes surrounding monetary easing also helped the stock rally along with other financial companies.
A combination of factors helped Marico stock appreciate during the period under review, including investor preference for defensive sectors such as consumer staples with a strong earnings profile. In addition, the firm purchased the personal care portfolio of Paras Pharmaceuticals in an effort to lay the foundation for the next level of growth. Strong demand for Cummins power generation equipment, along with stringent focus on costs, helped the company do well relative to its peers and benefited Fund performance.
In contrast, the Fund’s performance was hampered by declines for certain telecommunication services and information technology (IT) holdings.5 Regulatory issues continued to weigh on telecommunication stocks, and a slowdown in target markets dampened growth momentum for Indian IT services companies. As a result, wireless telecommunications industry leader Bharti Airtel and IT services firm Infosys were among the Fund’s largest detractors.
Reliance Industries’ stock price also declined. The company is one of India’s largest conglomerates with interests in upstream (exploration, development and production) oil and gas, refining and related petrochemicals. Reliance experienced issues with raising output at its key gas production block in the Krishna-Godavari basin. Notwithstanding the recent declines, at period-end these detractors remained among our favored long-term positions, and we believe their underlying fundamentals remain robust.
4. The financials sector comprises commercial banks and diversified financial services in the SOI. The industrials sector comprises construction and engineering, machinery and transportation infrastructure in the SOI.
5. The telecommunication services sector comprises wireless telecommunication services in the SOI. The IT sector comprises IT services in the SOI.

Annual Report | 5
It is important to recognize the effect of currency movements on the Fund’s performance. In general, if the value of the U.S. dollar goes up compared with a foreign currency, an investment traded in that foreign currency will go down in value because it will be worth fewer U.S. dollars. This can have a negative effect on Fund performance. Conversely, when the U.S. dollar weakens in relation to a foreign currency, an investment traded in that foreign currency will increase in value, which can contribute to Fund performance. For the 12 months ended October 31, 2012, the U.S. dollar rose in value relative to the Indian rupee. As a result, the Fund’s performance was negatively affected by the portfolio’s investment predominantly in securities denominated in the Indian rupee.
Thank you for your continued participation in Franklin India Growth Fund.
We look forward to serving your future investment needs.
6 | Annual Report
Performance Summary as of 10/31/12
Your dividend income will vary depending on dividends or interest paid by securities in the Fund’s portfolio, adjusted for operating expenses of each class. Capital gain distributions are net profits realized from the sale of portfolio securities. The performance table and graphs do not reflect any taxes that a shareholder would pay on Fund dividends, capital gain distributions, if any, or any realized gains on the sale of Fund shares. Total return reflects reinvestment of the Fund’s dividends and capital gain distributions, if any, and any unrealized gains or losses.

Annual Report | 7
Performance Summary (continued)
Performance1
Cumulative total return excludes sales charges. Average annual total returns and value of $10,000 investment include maximum sales charges. Class A: 5.75% maximum initial sales charge; Class C: 1% contingent deferred sales charge in first year only; Advisor Class: no sales charges.
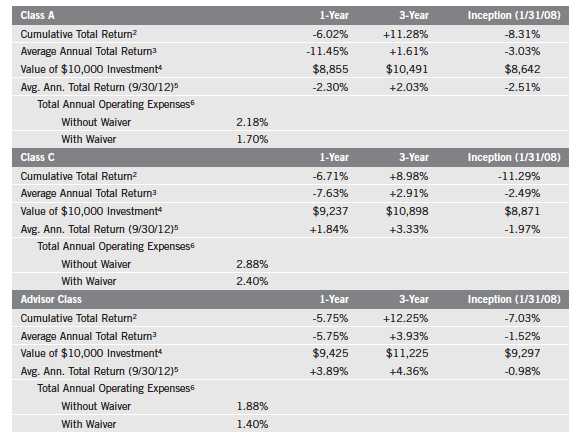
Performance data represent past performance, which does not guarantee future results. Investment return and principal value will fluctuate, and you may have a gain or loss when you sell your shares. Current performance may differ from figures shown. For most recent month-end performance, go to franklintempleton.com or call (800) 342-5236.
The investment manager and administrator have contractually agreed to waive or assume certain expenses so that the common expenses (including the expenses of FT (Mauritius) Offshore Investments Limited but excluding Rule 12b-1 fees) for each class of the Fund do not exceed 1.40% (other than certain nonroutine expenses) until 2/28/13.
8 | Annual Report
Performance Summary (continued)
Total Return Index Comparison for a Hypothetical $10,000 Investment1
Total return represents the change in value of an investment over the periods shown. It includes any applicable maximum sales charge, Fund expenses, account fees and reinvested distributions. The unmanaged index includes reinvestment of any income or distributions. It differs from the Fund in composition and does not pay management fees or expenses. One cannot invest directly in an index.

Annual Report | 9

10 | Annual Report
Your Fund’s Expenses
As a Fund shareholder, you can incur two types of costs:
- Transaction costs, including sales charges (loads) on Fund purchases; and
- Ongoing Fund costs, including management fees, distribution and service (12b-1) fees, and other Fund expenses. All mutual funds have ongoing costs, sometimes referred to as operating expenses.
The following table shows ongoing costs of investing in the Fund and can help you understand these costs and compare them with those of other mutual funds. The table assumes a $1,000 investment held for the six months indicated.
Actual Fund Expenses
The first line (Actual) for each share class listed in the table provides actual account values and expenses. The “Ending Account Value” is derived from the Fund’s actual return, which includes the effect of Fund expenses.
You can estimate the expenses you paid during the period by following these steps. Of course, your account value and expenses will differ from those in this illustration:
| 1. | Divide your account value by $1,000. |
| | If an account had an $8,600 value, then $8,600 ÷ $1,000 = 8.6. |
| 2. | Multiply the result by the number under the heading “Expenses Paid During Period.” |
| | If Expenses Paid During Period were $7.50, then 8.6 x $7.50 = $64.50. |
In this illustration, the estimated expenses paid this period are $64.50.
Hypothetical Example for Comparison with Other Funds
Information in the second line (Hypothetical) for each class in the table can help you compare ongoing costs of investing in the Fund with those of other mutual funds. This information may not be used to estimate the actual ending account balance or expenses you paid during the period. The hypothetical “Ending Account Value” is based on the actual expense ratio for each class and an assumed 5% annual rate of return before expenses, which does not represent the Fund’s actual return. The figure under the heading “Expenses Paid During Period” shows the hypothetical expenses your account would have incurred under this scenario. You can compare this figure with the 5% hypothetical examples that appear in shareholder reports of other funds.
Annual Report | 11
Your Fund’s Expenses (continued)
Please note that expenses shown in the table are meant to highlight ongoing costs and do not reflect any transaction costs, such as sales charges. Therefore, the second line for each class is useful in comparing ongoing costs only, and will not help you compare total costs of owning different funds. In addition, if transaction costs were included, your total costs would have been higher. Please refer to the Fund prospectus for additional information on operating expenses.
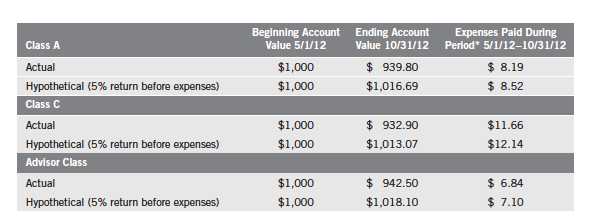
*Expenses are calculated using the most recent six-month expense ratio, net of expense waivers, annualized for each class (A: 1.68%; C: 2.40%; and Advisor: 1.40%), multiplied by the average account value over the period, multiplied by 184/366 to reflect the one-half year period.
12 | Annual Report
Franklin Templeton International Trust
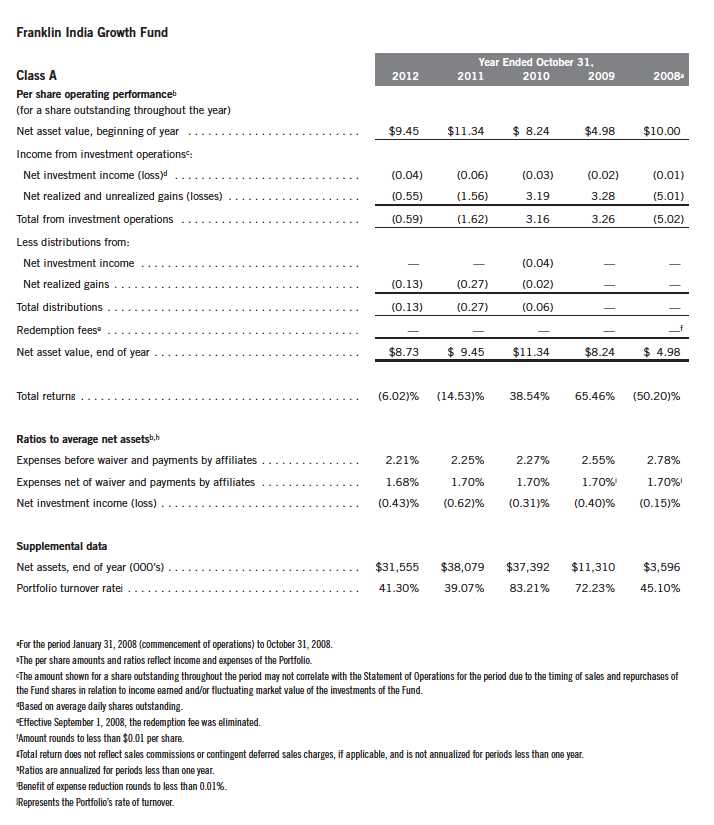
Financial Highlights
Annual Report | The accompanying notes are an integral part of these financial statements. | 13
Franklin Templeton International Trust
Financial Highlights (continued)

14 | The accompanying notes are an integral part of these financial statements. | Annual Report
Franklin Templeton International Trust
Financial Highlights (continued)

Annual Report | The accompanying notes are an integral part of these financial statements. | 15
Franklin Templeton International Trust
Statement of Investments, October 31, 2012
16 | The accompanying notes are an integral part of these financial statements. | Annual Report
Franklin Templeton International Trust
Financial Statements

aRedemption price is equal to net asset value less contingent deferred sales charges, if applicable.
Annual Report | The accompanying notes are an integral part of these financial statements. | 17
Franklin Templeton International Trust
Financial Statements (continued)

18 | The accompanying notes are an integral part of these financial statements. | Annual Report
Franklin Templeton International Trust
Financial Statements (continued)
Annual Report | The accompanying notes are an integral part of these financial statements. | 19
Franklin Templeton International Trust
Notes to Financial Statements
Franklin India Growth Fund
1. ORGANIZATION AND SIGNIFICANT ACCOUNTING POLICIES
Franklin Templeton International Trust (Trust) is registered under the Investment Company Act of 1940, as amended, (1940 Act) as an open-end investment company, consisting of four separate funds. The Franklin India Growth Fund (Fund) is included in this report. The financial statements of the remaining funds in the Trust are presented separately. The Fund offers three classes of shares: Class A, Class C, and Advisor Class. Each class of shares differs by its initial sales load, contingent deferred sales charges, distribution fees, voting rights on matters affecting a single class and its exchange privilege.
The Fund operates using a “master fund/feeder fund” structure and primarily invests indirectly in the securities of Indian companies through FT (Mauritius) Offshore Investments Limited (Portfolio), an entity registered with and regulated by the Mauritius Financial Services Commission, which shares the same investment objective as the Fund. The accounting policies of the Portfolio, including the Portfolio’s security valuation policies, will directly affect the recorded value of the Fund’s investment in the Portfolio. The financial statements of the Portfolio, including the Statement of Investments, are included elsewhere in this report and should be read in conjunction with the Fund’s financial statements. At October 31, 2012, the Fund owned 100% of the outstanding shares of the Portfolio.
The following summarizes the Fund’s significant accounting policies.
a. Financial Instrument Valuation
The Fund’s investments in financial instruments are carried at fair value daily. Fair value is the price that would be received to sell an asset or paid to transfer a liability in an orderly transaction between market participants on the measurement date. Under procedures approved by the Fund’s Board of Trustees (the Board), the Fund’s administrator, investment manager and other affiliates have formed the Valuation and Liquidity Oversight Committee (VLOC). The VLOC provides administration and oversight of the Fund’s valuation policies and procedures, which are approved annually by the Board. Among other things, these procedures allow the Fund to utilize independent pricing services, quotations from securities and financial instrument dealers, and other market sources to determine fair value.
Equity securities listed on an exchange or on the NASDAQ National Market System are valued at the last quoted sale price or the official closing price of the day, respectively. Over-the-counter (OTC) securities are valued within the range of the most recent quoted bid and ask prices. Securities that trade in multiple markets or on multiple exchanges are valued according to the broadest and most representative market. Certain equity securities are valued based upon fundamental characteristics or relationships to similar securities.
20 | Annual Report
Franklin Templeton International Trust
Notes to Financial Statements (continued)
Franklin India Growth Fund
| 1. | ORGANIZATION AND SIGNIFICANT ACCOUNTING POLICIES (continued) |
| a. | Financial Instrument Valuation (continued) |
The Fund has procedures to determine the fair value of financial instruments for which market prices are not reliable or readily available. Under these procedures, the VLOC convenes on a regular basis to review such financial instruments and considers a number of factors, including significant unobservable valuation inputs, when arriving at fair value. The VLOC primarily employs a market-based approach which may use related or comparable assets or liabilities, recent transactions, market multiples, book values, and other relevant information for the investment to determine the fair value of the investment. An income-based valuation approach may also be used in which the anticipated future cash flows of the investment are discounted to calculate fair value. Discounts may also be applied due to the nature or duration of any restrictions on the disposition of the investments. Due to the inherent uncertainty of valuations of such investments, the fair values may differ significantly from the values that would have been used had an active market existed. The VLOC employs various methods for calibrating these valuation approaches including a regular review of key inputs and assumptions, transactional back-testing or disposition analysis, and reviews of any related market activity.
The Fund’s investment in the Portfolio shares is valued at the Portfolio’s net asset value per share. Valuation of securities by the Portfolio is discussed in Note 1(a) of the Portfolio’s Notes to Financial Statements, which are included elsewhere in this report.
b. Income Taxes
It is the Fund’s policy to qualify as a regulated investment company under the Internal Revenue Code. The Fund intends to distribute to shareholders substantially all of its taxable income and net realized gains to relieve it from federal income and excise taxes. As a result, no provision for U.S. federal income taxes is required.
The Fund recognizes the tax benefits of uncertain tax positions only when the position is “more likely than not” to be sustained upon examination by the tax authorities based on the technical merits of the tax position. As of October 31, 2012, and for all open tax years, the Fund has determined that no liability for unrecognized tax benefits is required in the Fund’s financial statements related to uncertain tax positions taken on a tax return (or expected to be taken on future tax returns). Open tax years are those that remain subject to examination and are based on each tax jurisdiction statute of limitation.
The Fund’s investment in the Portfolio may be subject to income and withholding taxes in Mauritius and/or India which are discussed in Note 1(c) of the Portfolio’s Notes to Financial Statements.
Annual Report | 21
Franklin Templeton International Trust
Notes to Financial Statements (continued)
Franklin India Growth Fund
| 1. | ORGANIZATION AND SIGNIFICANT ACCOUNTING POLICIES (continued) |
| c. | Security Transactions, Investment Income, Expenses and Distributions |
Security transactions, including investments in the Portfolio, are accounted for on trade date. Realized gains and losses on security transactions are determined on a specific identification basis. Estimated expenses are accrued daily. Dividend income is recorded on the ex-dividend date. Distributions to shareholders are recorded on the ex-dividend date and are determined according to income tax regulations (tax basis). Distributable earnings determined on a tax basis may differ from earnings recorded in accordance with accounting principles generally accepted in the United States of America. These differences may be permanent or temporary. Permanent differences are reclassified among capital accounts to reflect their tax character. These reclassifications have no impact on net assets or the results of operations. Temporary differences are not reclassified, as they may reverse in subsequent periods.
Common expenses incurred by the Trust are allocated among the funds based on the ratio of net assets of each fund to the combined net assets of the Trust. Fund specific expenses are charged directly to the fund that incurred the expense.
Realized and unrealized gains and losses and net investment income, not including class specific expenses, are allocated daily to each class of shares based upon the relative proportion of net assets of each class. Differences in per share distributions, by class, are generally due to differences in class specific expenses.
The Fund records its proportionate share of the Portfolio’s income, expenses and realized and unrealized gains and losses daily. In addition, the Fund accrues its own expenses.
d. Accounting Estimates
The preparation of financial statements in accordance with accounting principles generally accepted in the United States of America requires management to make estimates and assumptions that affect the reported amounts of assets and liabilities at the date of the financial statements and the amounts of income and expenses during the reporting period. Actual results could differ from those estimates.
e. Guarantees and Indemnifications
Under the Trust’s organizational documents, its officers and directors are indemnified by the Trust against certain liabilities arising out of the performance of their duties to the Trust. Additionally, in the normal course of business, the Trust, on behalf of the Fund, enters into contracts with service providers that contain general indemnification clauses. The Trust’s maximum exposure under these arrangements is unknown as this would involve future claims that may be made against the Trust that have not yet occurred. Currently, the Trust expects the risk of loss to be remote.
22 | Annual Report
Franklin Templeton International Trust
Notes to Financial Statements (continued)
Franklin India Growth Fund
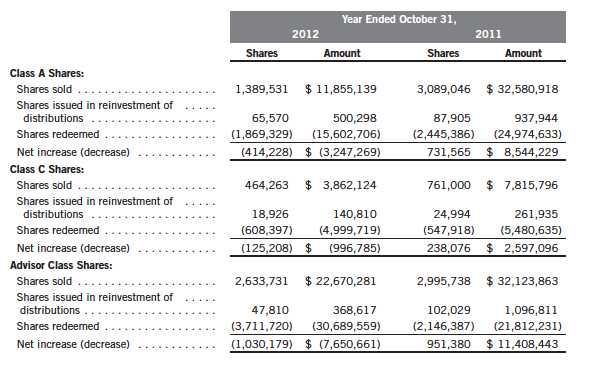
2. SHARES OF BENEFICIAL INTEREST
At October 31, 2012, there were an unlimited number of shares authorized (without par value).
Transactions in the Fund’s shares were as follows:
3. TRANSACTIONS WITH AFFILIATES
Franklin Resources, Inc. is the holding company for various subsidiaries that together are referred to as Franklin Templeton Investments. Certain officers and trustees of the Trust are also officers and/or directors of the Portfolio and of the following subsidiaries:

Annual Report | 23
Franklin Templeton International Trust
Notes to Financial Statements (continued)
Franklin India Growth Fund
| 3. | TRANSACTIONS WITH AFFILIATES (continued) |
| a. | Management Fees |
The Fund pays an investment management fee to Advisers equal to 20% of the total management fee with the remainder to be paid by the Portfolio. The total management fee is paid based on the average daily net assets of the Fund as follows:
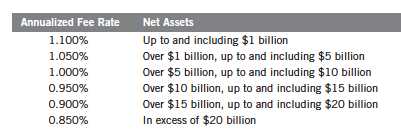
Under a subadvisory agreement, FT India, an affiliate of Advisers, provides subadvisory services to the Fund. The subadvisory fee is paid by Advisers based on the average daily net assets, and is not an additional expense of the Fund.
b. Administrative Fees
The Fund pays an administrative fee to FT Services of 0.20% per year of the average daily net assets of the Fund.
c. Distribution Fees
The Board has adopted distribution plans for each share class, with the exception of Advisor Class shares, pursuant to Rule 12b-1 under the 1940 Act. Distribution fees are not charged on shares held by affiliates. Under the Fund’s Class A reimbursement distribution plan, the Fund reimburses Distributors for costs incurred in connection with the servicing, sale and distribution of the Fund’s shares up to the maximum annual plan rate. Under the Class A reimbursement distribution plan, costs exceeding the maximum for the current plan year cannot be reimbursed in subsequent periods. In addition, under the Fund’s Class C compensation distribution plan, the Fund pays Distributors for costs incurred in connection with the servicing, sale and distribution of the Fund’s shares up to the maximum annual plan rate.
The maximum annual plan rates, based on the average daily net assets, for each class, are as follows:
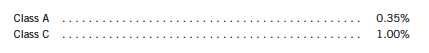
The Board has set the current rate at 0.30% per year for Class A shares until further notice and approval by the Board.
24 | Annual Report
Franklin Templeton International Trust
Notes to Financial Statements (continued)
Franklin India Growth Fund
| 3. | TRANSACTIONS WITH AFFILIATES (continued) |
| d. | Sales Charges/Underwriting Agreements |
Front-end sales charges and contingent deferred sales charges (CDSC) do not represent expenses of the Fund. These charges are deducted from the proceeds of sales of Fund shares prior to investment or from redemption proceeds prior to remittance, as applicable. Distributors has advised the Fund of the following commission transactions related to the sales and redemptions of the Fund’s shares for the year:

e. Transfer Agent Fees
For the year ended October 31, 2012, the Fund paid transfer agent fees of $172,468, of which $92,047 was retained by Investor Services.
f. Waiver and Expense Reimbursements
Advisers and FT Services have contractually agreed in advance to waive or limit their respective fees and to assume as their own expense certain expenses otherwise payable by the Fund so that the common expenses (i.e. a combination of management fees, administrative fees, transfer agent fees, and other expenses, including the Fund’s share of the Portfolio’s allocated expenses, but excluding distribution fees, and acquired fund fees and expenses) for each class of the Fund do not exceed 1.40% (other than certain non-routine expenses or costs, including those relating to litigation, indemnification, reorganizations, and liquidations) until February 28, 2013.
4. EXPENSE OFFSET ARRANGEMENT
The Fund has entered into an arrangement with its custodian whereby credits realized as a result of uninvested cash balances are used to reduce a portion of the Fund’s custodian expenses. During the year ended October 31, 2012, there were no credits earned.
5. INCOME TAXES
For tax purposes, capital losses may be carried over to offset future capital gains, if any. Under the Regulated Investment Company Modernization Act of 2010, capital losses incurred by the Fund in taxable years beginning after December 22, 2010 are not subject to expiration and such
Annual Report | 25
Franklin Templeton International Trust
Notes to Financial Statements (continued)
Franklin India Growth Fund
5. INCOME TAXES (continued)
losses retain their character as short-term or long-term. At October 31, 2012, capital loss carry-forwards were as follows:

For tax purposes, the Fund may elect to defer any portion of a late-year ordinary loss to the first day of the following fiscal year. At October 31, 2012, the Fund deferred late-year ordinary losses of $127,609.
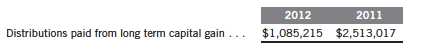
The tax character of distributions paid during the years ended October 31, 2012 and 2011, was as follows:
At October 31, 2012, the cost of investments, net unrealized appreciation (depreciation), including the holdings of the Portfolio for income tax purposes were as follows:

The Portfolio is a disregarded entity for United States Federal income tax purposes.
Differences between income and/or capital gains as determined on a book basis and a tax basis are primarily due to differing treatments of foreign currency transactions, non-deductible expenses, organization costs and wash sales.
6. INVESTMENT TRANSACTIONS
Purchases and sales of investments including transactions from the Portfolio (excluding short term securities) for the year ended October 31, 2012, aggregated $29,140,205 and $38,237,753, respectively.
26 | Annual Report
Franklin Templeton International Trust
Notes to Financial Statements (continued)
Franklin India Growth Fund
7. CONCENTRATION OF RISK
Investing in Indian equity securities through the Portfolio may include certain risks and considerations not typically associated with investing in U.S. securities, such as fluctuating currency values, less liquidity, expropriation, confiscatory taxation, nationalization, exchange control regulations (including currency blockage), differing legal standards and changing local and regional economic, political and social conditions, which may result in greater market volatility.
8. CREDIT FACILITY
The Fund, together with other U.S. registered and foreign investment funds (collectively, Borrowers), managed by Franklin Templeton Investments, are borrowers in a joint syndicated senior unsecured credit facility totaling $1.5 billion (Global Credit Facility) which matures on January 18, 2013. This Global Credit Facility provides a source of funds to the Borrowers for temporary and emergency purposes, including the ability to meet future unanticipated or unusually large redemption requests.
Under the terms of the Global Credit Facility, the Fund shall, in addition to interest charged on any borrowings made by the Fund and other costs incurred by the Fund, pay its share of fees and expenses incurred in connection with the implementation and maintenance of the Global Credit Facility, based upon its relative share of the aggregate net assets of all of the Borrowers, including an annual commitment fee of 0.08% based upon the unused portion of the Global Credit Facility, which is reflected in other expenses on the Statement of Operations. During the year ended October 31, 2012, the Fund did not use the Global Credit Facility.
9. FAIR VALUE MEASUREMENTS
The Fund follows a fair value hierarchy that distinguishes between market data obtained from independent sources (observable inputs) and the Fund’s own market assumptions (unobservable inputs). These inputs are used in determining the value of the Fund’s financial instruments and are summarized in the following fair value hierarchy:
- Level 1 – quoted prices in active markets for identical financial instruments
- Level 2 – other significant observable inputs (including quoted prices for similar financial instruments, interest rates, prepayment speed, credit risk, etc.)
- Level 3 – significant unobservable inputs (including the Fund’s own assumptions in deter- mining the fair value of financial instruments)
The inputs or methodology used for valuing financial instruments are not an indication of the risk associated with investing in those financial instruments.
Annual Report | 27
Franklin Templeton International Trust
Notes to Financial Statements (continued)
Franklin India Growth Fund
9. FAIR VALUE MEASUREMENTS (continued)
For movements between the levels within the fair value hierarchy, the Fund has adopted a policy of recognizing the transfers as of the date of the underlying event which caused the movement.
At October 31, 2012, all of the Fund’s investments in financial instruments and in financial instruments through the Portfolio carried at fair value were valued using Level 1 inputs. For detailed categories, see the accompanying Statement of Investments.
10. NEW ACCOUNTING PRONOUNCEMENTS
In December 2011, the Financial Accounting Standards Board (FASB) issued Accounting Standards Update (ASU) No. 2011-11, Balance Sheet (Topic 210): Disclosures about Offsetting Assets and Liabilities. The amendments in the ASU enhance disclosures about offsetting of financial assets and liabilities to enable investors to understand the effect of these arrangements on a fund’s financial position. The ASU is effective for interim and annual reporting periods beginning on or after January 1, 2013. The Fund believes the adoption of this ASU will not have a material impact on its financial statements.
11. SUBSEQUENT EVENTS
The Fund has evaluated subsequent events through the issuance of the financial statements and determined that no events have occurred that require disclosure.
28 | Annual Report
Franklin Templeton International Trust
Report of Independent Registered Public Accounting Firm
To the Board of Directors and Shareholders of Franklin India Growth Fund
In our opinion, the accompanying statement of assets and liabilities, including the statement of investments, and the related statements of operations and of changes in net assets and the financial highlights present fairly, in all material respects, the financial position of Franklin India Growth Fund (the “Fund”) at October 31, 2012, the results of its operations for the year then ended, the changes in its net assets for each of the two years in the period then ended and the financial highlights for the periods presented, in conformity with accounting principles generally accepted in the United States of America. These financial statements and financial highlights (hereafter referred to as “financial statements”) are the responsibility of the Fund’s management. Our responsibility is to express an opinion on these financial statements based on our audits.
We conducted our audits of these financial statements in accordance with the standards of the Public Company Accounting Oversight Board (United States). Those standards require that we plan and perform the audit to obtain reasonable assurance about whether the financial statements are free of material misstatement. An audit includes examining, on a test basis, evidence supporting the amounts and disclosures in the financial statements, assessing the accounting principles used and significant estimates made by management, and evaluating the overall financial statement presentation. We believe that our audits, which included confirmation of securities at October 31, 2012 by correspondence with the custodian and brokers, provide a reasonable basis for our opinion.
PricewaterhouseCoopers LLP
San Francisco, California
December 17, 2012
Annual Report | 29
Franklin Templeton International Trust
Tax Information (unaudited)
Franklin India Growth Fund
Under Section 852(b)(3)(C) of the Internal Revenue Code (Code), the Fund hereby reports the maximum amount allowable but no less than $1,085,215 as a long term capital gain dividend for the fiscal year ended October 31, 2012.
Under Section 854(b)(1)(B) of the Code, the Fund hereby reports the maximum amount allowable but no less than $748,567 as qualified dividends for purposes of the maximum rate under Section 1(h)(11) of the Code for the fiscal year ended October 31, 2012. Distributions, including qualified dividend income, paid during calendar year 2012 will be reported to shareholders on Form 1099-DIV by mid-February 2013. Shareholders are advised to check with their tax advisors for information on the treatment of these amounts on their individual income tax returns.
30 | Annual Report
Franklin Templeton International Trust
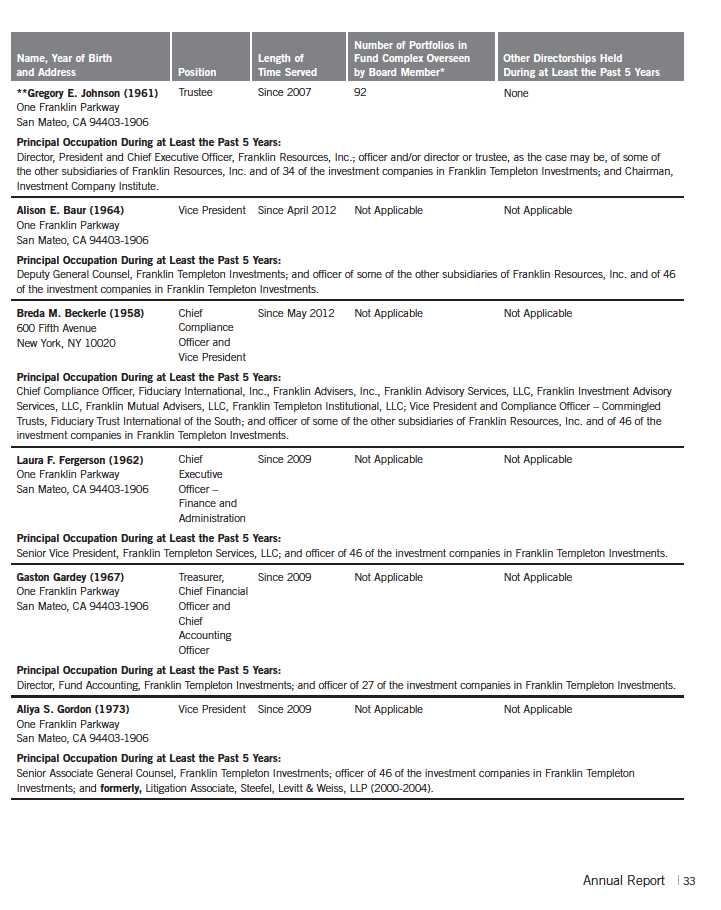
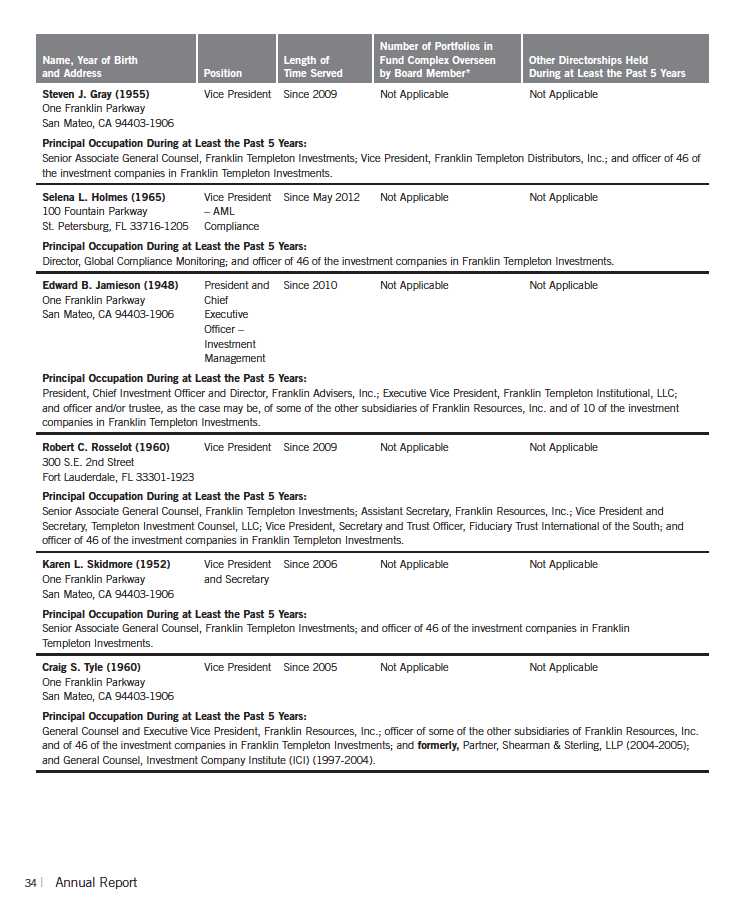
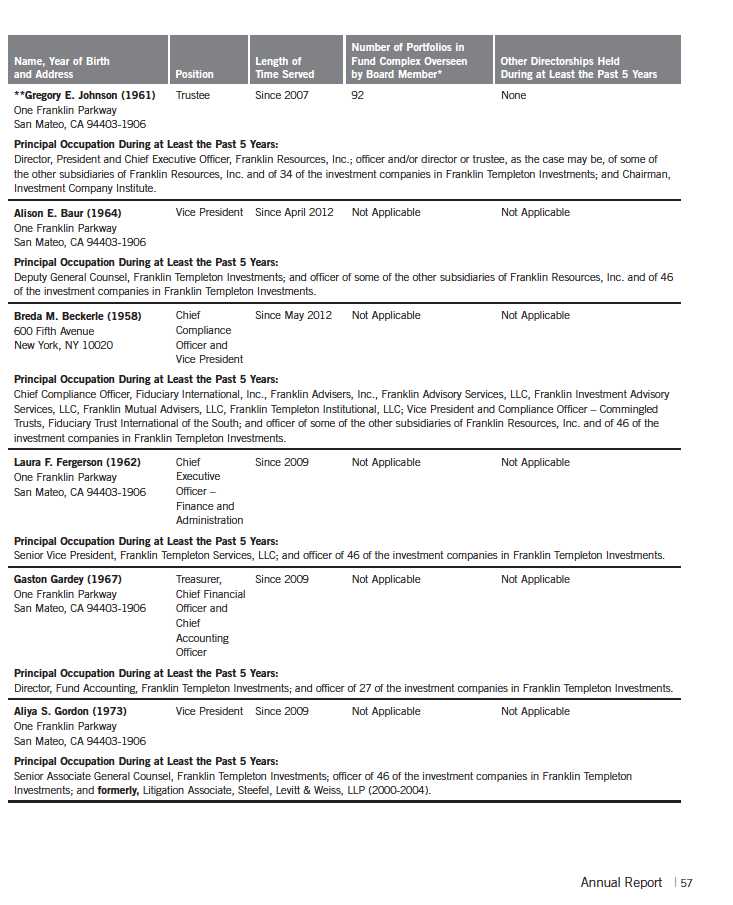
Board Members and Officers
The name, year of birth and address of the officers and board members, as well as their affiliations, positions held with the Trust, principal occupations during at least the past five years and number of portfolios overseen in the Franklin Templeton Investments fund complex are shown below. Generally, each board member serves until that person’s successor is elected and qualified.


32 | Annual Report

Annual Report | 35
36 | The accompanying notes are an integral part of these financial statements. | Annual Report

38 | The accompanying notes are an integral part of these financial statements. | Annual Report
Annual Report | The accompanying notes are an integral part of these financial statements. | 39

40 | The accompanying notes are an integral part of these financial statements. | Annual Report
Annual Report | The accompanying notes are an integral part of these financial statements. | 41
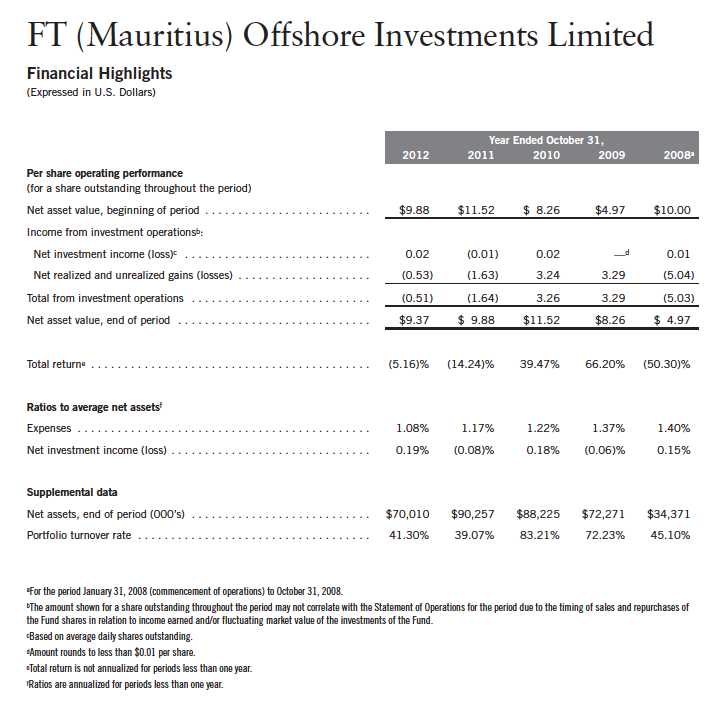
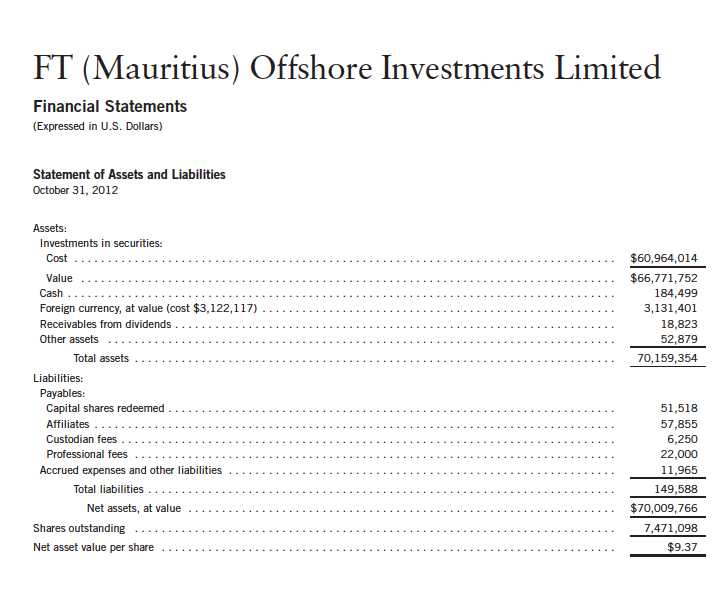
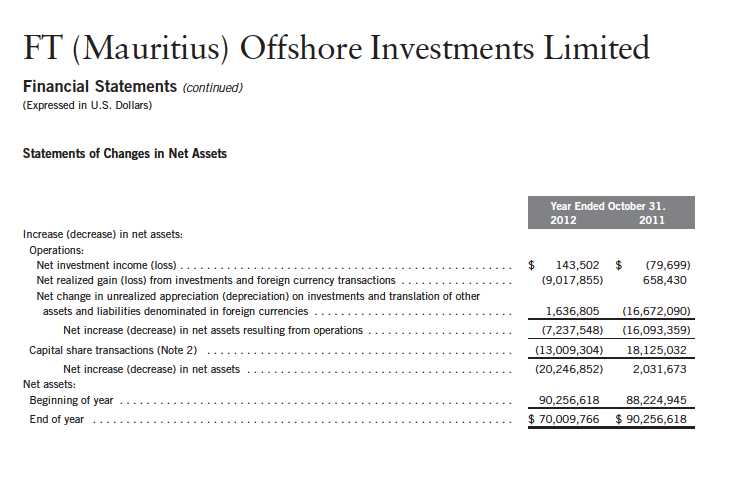
FT (Mauritius) Offshore Investments Limited
Notes to Financial Statements
(Expressed in U.S. Dollars)
1. ORGANIZATION AND SIGNIFICANT ACCOUNTING POLICIES
FT (Mauritius) Offshore Investments Limited (Portfolio) is registered with and regulated by the Mauritius Financial Services Commission. The Portfolio was formed for the purpose of facilitating the Franklin India Growth Fund’s (Fund) purchase of securities of a wide selection of Indian companies, consistent with the Fund’s investment strategies and has elected to be treated as a disregarded entity for United States federal income tax purposes.
At October 31, 2012, the Fund owned 100% of the Portfolio.
The following summarizes the Portfolio’s significant accounting policies.
a. Financial Instrument Valuation
The Portfolio’s investments in financial instruments are carried at fair value daily. Fair value is the price that would be received to sell an asset or paid to transfer a liability in an orderly transaction between market participants on the measurement date. Under procedures approved by the Fund’s Board of Trustees (the Board), the Fund’s administrator, investment manager and other affiliates have formed the Valuation and Liquidity Oversight Committee (VLOC). The VLOC provides administration and oversight of the Portfolio’s valuation policies and procedures, which are approved annually by the Board. Among other things, these procedures allow the Portfolio to utilize independent pricing services, quotations from securities and financial instrument dealers, and other market sources to determine fair value.
Equity securities listed on an exchange or on the NASDAQ National Market System are valued at the last quoted sale price or the official closing price of the day, respectively. Foreign equity securities are valued as of the close of trading on the foreign stock exchange on which the security is primarily traded, or the NYSE, whichever is earlier. The value is then converted into its U.S. dollar equivalent at the foreign exchange rate in effect at the close of the NYSE on the day that the value of the security is determined. Over-the-counter (OTC) securities are valued within the range of the most recent quoted bid and ask prices. Securities that trade in multiple markets or on multiple exchanges are valued according to the broadest and most representative market. Certain equity securities are valued based upon fundamental characteristics or relationships to similar securities.
The Portfolio follows the Fund’s procedures to determine the fair value of financial instruments for which market prices are not reliable or readily available. Under these procedures, the VLOC convenes on a regular basis to review such financial instruments and considers a number of factors, including significant unobservable valuation inputs, when arriving at fair value. The VLOC primarily employs a market-based approach which may use related or comparable assets or liabilities, recent transactions, market multiples, book values, and other relevant information for the investment to determine the fair value of the investment. An income-based valuation approach may also be used in which the anticipated future cash flows of the investment are discounted to calculate fair value. Discounts may also be applied due to the nature or duration of any restrictions on the disposition of the investments. Due to the inherent uncertainty of valuations of such
42 | Annual Report
FT (Mauritius) Offshore Investments Limited
Notes to Financial Statements (continued)
(Expressed in U.S. Dollars)
| 1. | ORGANIZATION AND SIGNIFICANT ACCOUNTING POLICIES (continued) |
| a. | Financial Instrument Valuation (continued) |
investments, the fair values may differ significantly from the values that would have been used had an active market existed. The VLOC employs various methods for calibrating these valuation approaches including a regular review of key inputs and assumptions, transactional back-testing or disposition analysis, and reviews of any related market activity.
Trading in securities on foreign securities stock exchanges and OTC markets may be completed before the daily close of business on the NYSE. Occasionally, events occur between the time at which trading in a foreign security is completed and the close of the NYSE that might call into question the reliability of the value of a portfolio security held by the Portfolio. As a result, differences may arise between the value of the Portfolio’s portfolio securities as determined at the foreign market close and the latest indications of value at the close of the NYSE. In order to minimize the potential for these differences, the VLOC monitors price movements following the close of trading in foreign stock markets through a series of country specific market proxies (such as baskets of American Depositary Receipts, futures contracts and exchange traded funds). These price movements are measured against established trigger thresholds for each specific market proxy to assist in determining if an event has occurred that may call into question the reliability of the values of the foreign securities held by the Portfolio. If such an event occurs, the securities may be valued using fair value procedures, which may include the use of independent pricing services.
b. Foreign Currency Translation
Portfolio securities and other assets and liabilities denominated in foreign currencies are translated into U.S. dollars based on the exchange rate of such currencies against U.S. dollars on the date of valuation. The Portfolio may enter into foreign currency exchange contracts to facilitate transactions denominated in a foreign currency. Purchases and sales of securities, income and expense items denominated in foreign currencies are translated into U.S. dollars at the exchange rate in effect on the transaction date. Portfolio securities and assets and liabilities denominated in foreign currencies contain risks that those currencies will decline in value relative to the U.S. dollar. Occasionally, events may impact the availability or reliability of foreign exchange rates used to convert the U.S. dollar equivalent value. If such an event occurs, the foreign exchange rate will be valued at fair value using procedures established and approved by the Board.
The Portfolio does not separately report the effect of changes in foreign exchange rates from changes in market prices on securities held. Such changes are included in net realized and unrealized gain or loss from investments on the Statement of Operations.
Realized foreign exchange gains or losses arise from sales of foreign currencies, currency gains or losses realized between the trade and settlement dates on securities transactions and the difference between the recorded amounts of dividends, interest, and foreign withholding taxes and
Annual Report | 43
FT (Mauritius) Offshore Investments Limited
Notes to Financial Statements (continued)
(Expressed in U.S. Dollars)
| 1. | ORGANIZATION AND SIGNIFICANT ACCOUNTING POLICIES (continued) |
| b. | Foreign Currency Translation (continued) |
the U.S. dollar equivalent of the amounts actually received or paid. Net unrealized foreign exchange gains and losses arise from changes in foreign exchange rates on foreign denominated assets and liabilities other than investments in securities held at the end of the reporting period.
c. Income Taxes
The Portfolio conducts its investment activities in India as a tax resident of Mauritius and expects to obtain benefits under the double taxation treaty between Mauritius and India (Treaty). To obtain benefits under the Treaty, the Portfolio must meet certain tests and conditions, including the establishment of Mauritius tax residence and related requirements. The Portfolio has obtained a certificate from the Mauritius tax authorities and believes that such certification is evidence that it is a resident of Mauritius under the Treaty. A company which is a tax resident in Mauritius under the Treaty and has no branch or permanent establishment in India, will not be subject to capital gains tax in India on the sale of Indian securities but is subject to Indian withholding tax on interest earned on Indian securities at the rate of 21.012% (which includes surcharges). There is no withholding tax in India in respect of dividends paid by Indian companies and such dividends are exempt in the hands of the shareholders.
The Portfolio holds a Category 1 Global Business License for the purpose of the Financial Services Act 2007 and under current laws and regulations, is subject to tax in Mauritius at the rate of 15% on its net income. However, the Portfolio is entitled to a deemed tax credit equivalent to the higher of actual foreign tax suffered or a presumed foreign tax equivalent of 80% of the Mauritian tax on its foreign source income. Thus, the effective tax rate in Mauritius should not exceed 3% (i.e. 15% less 80% of 15%). Indian companies making distributions are, however, liable to a dividend distribution tax equivalent to 16.225% of the dividends distributed. A company holding at least 5% of the share capital of an Indian company and receiving dividends from that Indian company may claim a credit for tax paid by the Indian company on its profits out of which the dividends were distributed including the dividend distribution tax. No Mauritian capital gains tax is payable on profits arising from sale of securities, and any dividends and redemption proceeds paid by the Portfolio to its shareholders will be exempt from withholding or other tax.
The Portfolio continues to: (i) comply with the requirements of the Treaty; (ii) be a tax resident of Mauritius; and (iii) maintain that its central management and control resides in Mauritius, and therefore management believes that the Portfolio will be able to obtain the benefits of the Treaty. Accordingly, no provision for Indian income taxes has been made in the accompanying financial statements of the Portfolio for taxes related to capital gains or dividends.
44 | Annual Report
FT (Mauritius) Offshore Investments Limited
Notes to Financial Statements (continued)
(Expressed in U.S. Dollars)
| 1. | ORGANIZATION AND SIGNIFICANT ACCOUNTING POLICIES (continued) |
| c. | Income Taxes (continued) |
The Indian Finance Minister announced the introduction of a General Anti Avoidance Rule (“GAAR”) in the Indian tax law in the 2012/2013 budget. Subsequently, following representations made by stakeholders, the implementation of the GAAR provisions has been deferred until April 1, 2013. A Committee has also been constituted by the Indian government to produce a set of rules and guidelines (Guidelines) with a view to providing clarity and certainty on the application of GAAR. Draft Guidelines and the Shome Report have since been issued, with a view to analyzing, finalizing and bringing more clarity to the GAAR provisions. In particular, it is noteworthy that the Shome Report has recommended that GAAR provisions should not be invoked to examine the genuineness of the residency of entities in Mauritius. However, as the reports are still under consideration, management is not in a position to assess the implications of any GAAR provisions on the Portfolio, including any potential Indian capital gains tax claim in 2013 until such time a formal stand is taken by the Government of India.
The Portfolio’s accounting policy in accordance with accounting principles generally accepted in the United States of America (U.S. GAAP) is to account for changes in tax laws when the laws are enacted.
The India tax law also includes provisions that impose tax on certain transfers of shares of non-Indian companies that substantially derive their value from Indian assets. Uncertainty exists with respect to the application of this law on investment structures such as the Portfolio and the Fund. However, based on judgment and analysis of the facts and circumstances, management currently believes that the provisions are not likely to have a material impact on the Portfolio and the Fund.
d. Security Transactions, Investment Income and Expenses
Security transactions are accounted for on trade date. Realized gains and losses on security transactions are determined on a specific identification basis. Estimated expenses are accrued daily. Dividend income is recorded on the ex-dividend date except that certain dividends from foreign securities are recognized as soon as the Portfolio is notified of the ex-dividend date.
e. Accounting Estimates
The preparation of financial statements in accordance with accounting principles generally accepted in the United States of America requires management to make estimates and assumptions that affect the reported amounts of assets and liabilities at the date of the financial statements and the amounts of income and expenses during the reporting period. Actual results could differ from those estimates.
Annual Report | 45
FT (Mauritius) Offshore Investments Limited
Notes to Financial Statements (continued)
(Expressed in U.S. Dollars)
| 1. | ORGANIZATION AND SIGNIFICANT ACCOUNTING POLICIES (continued) |
| f. | Guarantees and Indemnifications |
Under the Portfolio’s organizational documents, the Portfolio’s officers and directors are indemnified by the Portfolio against certain liabilities arising out of the performance of their duties to the Portfolio. Additionally, in the normal course of business, the Portfolio enters into contracts with service providers that contain general indemnification clauses. The Portfolio’s maximum exposure under these arrangements is unknown as this would involve future claims that may be made against the Portfolio that have not yet occurred. Currently, the Portfolio expects the risk of loss to be remote.
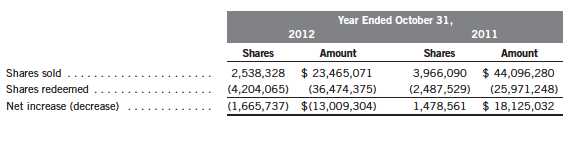
2. SHARES OF BENEFICIAL INTEREST
At October 31, 2012, there were an unlimited number of shares authorized (without par value).
Transactions in the Portfolio’s shares were as follows:
3. TRANSACTIONS WITH AFFILIATES
Franklin Resources, Inc. is the holding company of Franklin Advisers, Inc. (Advisers) which is the investment manager of the Portfolio.
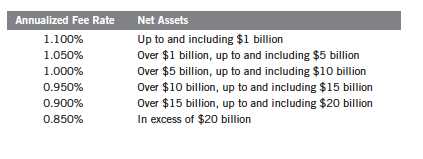
a. Management Fees
The Portfolio pays an investment management fee to Advisers equal to 80% of the total management fee with the remainder to be paid by the Fund based on the average daily net assets of the Fund as follows:
46 | Annual Report
FT (Mauritius) Offshore Investments Limited
Notes to Financial Statements (continued)
(Expressed in U.S. Dollars)
| 3. | TRANSACTIONS WITH AFFILIATES (continued) |
| b. | Administrative Fees |
The Portfolio pays an administrative fee to International Financial Services Limited (IFS), a Mauritius company, an annual fee of $30,000 plus reimbursement of certain expenses. Certain directors of the Portfolio are also directors of IFS.
4. INVESTMENT TRANSACTIONS
Purchases and sales of investments (excluding short term securities) for the year ended October 31, 2012, aggregated $29,140,205 and $38,237,753, respectively.
5. CONCENTRATION OF RISK
Investing in Indian equity securities through the Portfolio may include certain risks and considerations not typically associated with investing in U.S. securities, such as fluctuating currency values, less liquidity, expropriation, confiscatory taxation, nationalization, exchange control regulations (including currency blockage), differing legal standards and changing local and regional economic, political and social conditions, which may result in greater market volatility.
6. FAIR VALUE MEASUREMENTS
The Portfolio follows a fair value hierarchy that distinguishes between market data obtained from independent sources (observable inputs) and the Portfolio’s own market assumptions (unobservable inputs). These inputs are used in determining the value of the Portfolio’s financial instruments and are summarized in the following fair value hierarchy:
- Level 1 – quoted prices in active markets for identical financial instruments
- Level 2 – other significant observable inputs (including quoted prices for similar financial instruments, interest rates, prepayment speed, credit risk, etc.)
- Level 3 – significant unobservable inputs (including the Portfolio’s own assumptions in determining the fair value of financial instruments)
The inputs or methodology used for valuing financial instruments are not an indication of the risk associated with investing in those financial instruments.
For movements between the levels within the fair value hierarchy, the Portfolio has adopted a policy of recognizing the transfers as of the date of the underlying event which caused the movement.
At October 31, 2012, all of the Portfolio’s investments in financial instruments carried at fair value were valued using Level 1 inputs. For detailed categories, see the accompanying Statement of Investments.
Annual Report | 47
FT (Mauritius) Offshore Investments Limited
Notes to Financial Statements (continued)
(Expressed in U.S. Dollars)
7. NEW ACCOUNTING PRONOUNCEMENTS
In December 2011, the Financial Accounting Standards Board (FASB) issued Accounting Standards Update (ASU) No. 2011-11, Balance Sheet (Topic 210): Disclosures about Offsetting Assets and Liabilities. The amendments in the ASU enhance disclosures about offsetting of financial assets and liabilities to enable investors to understand the effect of these arrangements on a fund’s financial position. The ASU is effective for interim and annual reporting periods beginning on or after January 1, 2013. The Portfolio believes the adoption of this ASU will not have a material impact on its financial statements.
8. SUBSEQUENT EVENTS
The Portfolio has evaluated subsequent events through the issuance of the financial statements and determined that no events have occurred that require disclosure.
48 | Annual Report
FT (Mauritius) Offshore Investments Limited
Report of Independent Registered Public Accounting Firm
To the Board of Directors and Shareholders of FT (Mauritius) Offshore Investments Limited
In our opinion, the accompanying statement of assets and liabilities, including the statement of investments, and the related statements of operations and of changes in net assets and the financial highlights present fairly, in all material respects, the financial position of FT (Mauritius) Offshore Investments Limited (the “Portfolio”) at October 31, 2012, the results of its operations for the year then ended, the changes in its net assets for each of the two years in the period then ended and the financial highlights for the periods presented, in conformity with accounting principles generally accepted in the United States of America. These financial statements and financial highlights (hereafter referred to as “financial statements”) are the responsibility of the Fund’s management. Our responsibility is to express an opinion on these financial statements based on our audits. We conducted our audits of these financial statements in accordance with the standards of the Public Company Accounting Oversight Board (United States). Those standards require that we plan and perform the audit to obtain reasonable assurance about whether the financial statements are free of material misstatement. An audit includes examining, on a test basis, evidence supporting the amounts and disclosures in the financial statements, assessing the accounting principles used and significant estimates made by management, and evaluating the overall financial statement presentation. We believe that our audits, which included confirmation of securities at October 31, 2012 by correspondence with the custodian and brokers, provide a reasonable basis for our opinion.
PricewaterhouseCoopers LLP
San Francisco, California
December 17, 2012
Annual Report | 49
Franklin Templeton International Trust
Shareholder Information
Franklin India Growth Fund
Proxy Voting Policies and Procedures
The Fund’s investment manager has established Proxy Voting Policies and Procedures (Policies) that the Fund uses to determine how to vote proxies relating to portfolio securities. Shareholders may view the Fund’s complete Policies online at franklintempleton.com. Alternatively, shareholders may request copies of the Policies free of charge by calling the Proxy Group collect at (954) 527-7678 or by sending a written request to: Franklin Templeton Companies, LLC, 300 S.E. 2nd Street, Fort Lauderdale, FL 33301, Attention: Proxy Group. Copies of the Fund’s proxy voting records are also made available online at franklintempleton.com and posted on the U.S. Securities and Exchange Commission’s website at sec.gov and reflect the most recent 12-month period ended June 30.
Quarterly Statement of Investments
The Fund files a complete statement of investments with the U.S. Securities and Exchange Commission for the first and third quarters for each fiscal year on Form N-Q. Shareholders may view the filed Form N-Q by visiting the Commission’s website at sec.gov. The filed form may also be viewed and copied at the Commission’s Public Reference Room in Washington, DC. Information regarding the operations of the Public Reference Room may be obtained by calling (800) SEC-0330.
Householding of Reports and Prospectuses
You will receive the Fund’s financial reports every six months as well as an annual updated summary prospectus (prospectus available upon request). To reduce Fund expenses, we try to identify related shareholders in a household and send only one copy of the financial reports and summary prospectus. This process, called “householding,” will continue indefinitely unless you instruct us otherwise. If you prefer not to have these documents householded, please call us at (800) 632-2301. At any time you may view current prospectuses/summary prospectuses and financial reports on our website. If you choose, you may receive these documents through electronic delivery.
50 | Annual Report
This page intentionally left blank.
This page intentionally left blank.

| 1
Annual Report
Franklin World Perspectives Fund
Your Fund’s Goal and Main Investments: Franklin World Perspectives Fund seeks long-term capital appreciation. Under normal market conditions, the Fund invests primarily in equity securities in developed, emerging and frontier markets across the entire market capitalization spectrum.
Performance data represent past performance, which does not guarantee future results. Investment return and principal value will fluctuate, and you may have a gain or loss when you sell your shares. Current performance may differ from figures shown. Please visit franklintempleton.com or call (800) 342-5236 for most recent month-end performance.
This annual report for Franklin World Perspectives Fund covers the fiscal year ended October 31, 2012.
Performance Overview
Franklin World Perspectives Fund – Class A delivered a +5.97% cumulative total return for the 12-month period ended October 31, 2012. The Fund under-performed the +9.13% total return of its benchmark, the MSCI All Country World Index Plus Frontier Markets Index (ACWI FM), which measures stock performance in developed, emerging and frontier markets.1 You can find more of the Fund’s performance data in the Performance Summary beginning on page 14.
Economic and Market Overview
The global economy slowed during the 12 months under review, but emerging and frontier market economies generally continued to grow faster than their developed market counterparts. Nonetheless, economic reports from the largest economies proved inconsistent with some dire predictions of a severe global economic slowdown. Fears of European sovereign debt default and China’s potential “hard landing” dominated financial headlines in the first half of the period, contributing to heightened market volatility that led global stocks to a 2012 low in early June. Despite ongoing uncertainty, eurozone leaders made meaningful progress and began to implement policy solutions aimed at correcting structural issues. Globally, central bankers continued to pursue historically accommodative monetary policies. Among developed markets, the Bank of Japan and U.S. Federal Reserve Board (Fed) maintained their
1. Source: © 2012 Morningstar. All Rights Reserved. The information contained herein: (1) is proprietary to Morningstar and/or its content providers; (2) may not be copied or distributed; and (3) is not warranted to be accurate, complete or timely. Neither Morningstar nor its content providers are responsible for any damages or losses arising from any use of this information. The index is unmanaged and includes reinvested dividends. One cannot invest directly in an index, and an index is not representative of the Fund’s portfolio.
The dollar value, number of shares or principal amount, and names of all portfolio holdings are listed in the Fund’s Statement of Investments (SOI). The SOI begins on page 25.
Annual Report | 3
respective policy rates, while the European Central Bank (ECB) implemented a series of rate reductions.
In addition to rate adjustments, many central bankers employed a variety of policy tools. The Fed increased the average maturity of its Treasury holdings and in September announced plans to increase mortgage-backed securities holdings in a third round of quantitative easing. In September, the ECB announced its Outright Monetary Transactions program, which was designed to allow the central bank to purchase government bonds on the secondary market with the aim of easing borrowing pressures in the eurozone. The Bank of England and Bank of Japan expanded their respective asset purchase programs. Among emerging market countries, Brazil, China and India announced fiscal and monetary easing measures to support economic growth. Brazil unveiled a 133 billion real (approximately $66 billion) stimulus package in August. In addition to adopting a monetary easing policy and reducing the reserve requirement ratio, China launched a 1 trillion yuan (approximately $158 billion) stimulus package in September. The Indian government announced a series of reforms in September to boost investment and stimulate economic growth.
Global markets reached a period high in mid-September as investors became optimistic that monetary easing policies and fiscal stimulus measures would boost economic growth. However, momentum faltered toward period-end amid renewed investor concerns about economic growth, triggered by manufacturing weakness in some parts of Asia and Europe. Further weighing on investor sentiment was the U.S. “fiscal cliff,” when spending cuts and tax increases will take effect in January 2013 unless the U.S. Congress acts, which could threaten the fragile global economic health. Although global economic indicators remained generally weak throughout the period, U.S. data offered some relief, with increased consumer spending and notable improvements in housing and labor markets helping to offset slower manufacturing growth. Additionally, manufacturing in Canada and several emerging market countries, particularly Mexico, Russia and India, improved near period-end. In this environment, commodities and the euro declined for the period, while U.S. Treasuries and the U.S. dollar gained. Global developed, emerging and frontier market stocks, as represented by the MSCI ACWI FM, generated healthy returns for the 12 months ended October 31, 2012.
Investment Strategy
We manage the Fund using a multi-manager approach. While we have overall responsibility for the Fund’s investments, we consult with Franklin Templeton’s
4 | Annual Report
local asset management teams (subadvisors) to determine regional and country allocations, and each subadvisor is responsible for selecting investments for that portion of the Fund’s portfolio allocated to it. We work closely with the sub-advisors to develop local portfolios of securities seeking to outperform the relevant market of each region and combine those portfolios into a single global growth equity fund. The Fund’s actual exposure to various regions and markets will vary from time to time according to our and the subadvisors’ opinions as to the prevailing conditions and prospects for these markets.
Using a growth-oriented investment style, we seek to invest in growth-oriented equity securities of companies in developed, emerging and frontier regions and countries around the world. When choosing equity investments for the Fund, we and the subadvisors, with the benefit of local knowledge and market insight, apply a research-driven, bottom-up, fundamental long-term approach. We focus on the market price of a company’s securities relative to our and the sub-advisors’ evaluations of the company’s long-term earnings, asset value and cash flow potential. We seek to invest in financially strong companies with favorable growth potential and sustainable competitive advantages and also consider a company’s price/earnings ratio, profit margins and liquidation value.
Manager’s Discussion
Global markets seemingly remained driven primarily by economic headlines and investor expectations of the effects of monetary easing programs implemented by many developed and emerging market countries rather than by any clear indication of significant structural economic reforms. Although the investment climate was challenging, the backdrop seemed to improve toward period-end as data releases suggested potential stabilization in the global economy. Global manufacturing showed signs of improvement in September and October as the manufacturing sector in several countries expanded. Economic recovery in many developed market countries, however, remained somewhat restrained due to ongoing deleveraging, fiscal restraint and persistent pressure on sovereign debt markets, particularly in the eurozone.
Developed market stocks, led largely by the U.S., generally outperformed their emerging and frontier market counterparts for the 12 months ended October 31, 2012. As investor sentiment swung across the risk spectrum, emerging market stocks generally exhibited greater volatility than developed and frontier market stocks but still ended the period with positive returns. Within emerging markets, Asia Pacific (excluding Japan) generally outperformed Latin America and Europe, with the Philippines, Thailand and Malaysia among the best performers. In line with the broader equity markets, the Fund’s developed market
Annual Report | 5
holdings generally outperformed their emerging market counterparts. The Fund’s frontier market holdings delivered strong performance overall.
Europe
Stock selection in Europe was a key contributor to the Fund’s absolute and relative performance, compared with the MSCI ACWI FM, particularly in the U.K., the Netherlands, Italy and Switzerland. The Fund’s regional allocation was also favorable, notably the lack of exposure to Spain, whose market declined during the period, as well as an overweighted allocation to Belgium, one of the best performing European markets. In addition, our overweighted allocations to Denmark and Ireland helped relative performance as their markets outperformed the index. From a sector standpoint, key contributors included the Fund’s overweighting and stock selection in the U.K.’s financials and consumer discretionary sectors, as well as portfolio positioning in Belgium’s consumer staples, Italy’s industrials and the Netherlands’ energy sectors.2
The Fund’s off-benchmark holding in the U.K.-based short-term financing company International Personal Finance was a leading individual contributor to performance relative to the benchmark. After declining sharply in the second half of 2011, the company’s share price advanced in 2012 largely because of expanding customer and credit volumes. Following its report of encouraging earnings results, the company maintained its optimistic outlook that it expects to weather the global economic turmoil. An off-benchmark position in consumer discretionary company Carpetright, a U.K.-based floor covering specialist and carpet retailer, was another strong performer during the period. Although the company reported weak 2011 sales and profit margins resulting from delays in U.K. home purchases and remodeling, its share price rallied in the first half of 2012 as a result of optimism regarding the European Central Bank’s (ECB’s) monetary policy moves. In our assessment, Carpetright’s strengths included its balance sheet and leading position, which improved as many competitors struggled in the recent economic environment. The Fund also benefited from the strong share price gain of Belgium-based beverage company Anheuser-Busch InBev as it generated strong earnings and higher net profits attributable to its acquisition of a Chinese brewery, continued sales growth in Asia-Pacific
2. The financials sector comprises capital markets, commercial banks, consumer finance, diversified financial services, insurance, real estate investment trusts, real estate management and development, and thrifts and mortgage finance in the SOI. The consumer discretionary sector comprises auto components; automobiles; diversified consumer services; hotels, restaurants and leisure; household durables; Internet and catalog retail; leisure equipment and products; media; multiline retail; specialty retail; and textiles, apparel and luxury goods in the SOI. The consumer staples sector comprises beverages, food and staples retailing, food products, household products, personal products and tobacco in the SOI. The industrials sector comprises aerospace and defense, air freight and logistics, building products, commercial services and supplies, construction and engineering, electrical equipment, industrial conglomerates, machinery, road and rail, trading companies and distributors, and transportation infrastructure in the SOI. The energy sector comprises energy equipment and services; and oil, gas and consumable fuels in the SOI.
6 | Annual Report
beverage markets, and price increases in the U.S. and Brazil. The company announced in late June that it had reached an agreement to acquire the remaining stake in Grupo Modelo3 in a $20.1 billion deal expected to close in the first quarter of 2013, which will augment the world’s biggest brewer’s position in the fast-growing Mexican market. An off-benchmark holding in Savills, a U.K.-based property advisory company, also gained in value, largely from ongoing expansion into the U.S. real estate market amid increased interest in investment properties.
In contrast, stock selection in France weighed on relative performance, particularly our position in Neopost, a France-based information technology (IT) company, as its shares lost value during the first half of 2012.4 Neopost provides mailing and logistics solutions such as customized mail processing systems to corporate customers worldwide. Elsewhere, our off-benchmark position in Homeserve,3 a U.K. home repair and emergency services provider, declined in value during the first half of 2012 after the company decided to suspend all telephone sales and marketing activities and the Financial Services Authority announced it would launch an investigation into Homeserve’s sales practices.
Although the ECB implemented some programs during the period that we believe could help certain European countries surmount some longstanding sovereign debt issues, we still expect that many national governments will face some uncertainties ahead. Even though austerity measures fueled protests in Europe, increased investor optimism for improvement in the region’s sovereign debt crisis was evident amid the ECB’s commitment to buy government bonds of troubled countries in an unrestricted capacity. During the reporting period, we slightly increased our weighting in Europe and at fiscal year-end had a relatively neutral position relative to the benchmark. In particular, we increased our allocations to France, Italy and Switzerland. Conversely, we decreased our weightings in the Netherlands, Ireland and Austria.
North America
The Fund’s positioning in the North American materials sector and stock selection in the financials sector benefited relative performance as did our overweighted allocation to the U.S. industrials, consumer discretionary and IT sectors.5 On a security level, our overweighting in Apple, one of the top U.S. performers during the period, aided the Fund’s results. An off-benchmark
3. No longer held at period-end.
4. The IT sector comprises communications equipment; computers and peripherals; electronic equipment, instruments and components; Internet software and services; IT services; office electronics; semiconductors and semiconductor equipment; and software in the SOI.
5. The materials sector comprises chemicals, containers and packaging, and metals and mining in the SOI.
Annual Report | 7
position in Under Armour also helped performance as the sporting goods company reported increased sales, earnings and operating margins. The company’s higher 2012 guidance further supported the stock.
However, the Fund’s underweighted allocation to the U.S. detracted from relative returns, as U.S. stocks rallied amid investor optimism about the country’s economic recovery and stimulus measures announced by the U.S. Fed and other central banks. Additionally, one of the biggest overall detractors from the Fund’s relative returns was stock selection in the U.S., particularly in the IT, consumer discretionary, energy and industrials sectors. Among the holdings that hurt relative and absolute results were off-benchmark positions in software company Informatica3 and oil and gas company SM Energy. Informatica’s revenue and earnings were pressured by sales weakness in Europe. SM Energy’s share price suffered from a slowdown in crude oil demand stemming from weaker global economic growth.
Outside of the U.S., stock selection in Canada helped the Fund’s relative performance. Individual contributors included an off-benchmark position in energy equipment and services company URS Flint (formerly known as Flint Energy Services).3 In contrast, generally falling precious metals prices weighed on mining company Goldcorp’s share price, which hindered relative Fund performance.
Although the Fund’s U.S. allocation was less than the benchmark’s at fiscal year-end, we increased the weighting during the period, particularly in the health care, financials, consumer staples and consumer discretionary sectors.6 We continued to have no exposure to the telecommunication services and utilities sectors.7 In Canada, we remained overweighted throughout the reporting period as we increased our allocation to the consumer discretionary sector, reduced our allocation to energy, and continued to have no exposure to health care and utilities.
The U.S. market outperformed many of its developed market peers during the 12-month period, providing support to global equity indexes. In October, the Bureau of Economic Analysis released an estimate of third-quarter U.S. gross domestic product (GDP) growth that showed the economy improved as a result of stronger consumer spending, a recovering housing sector and increased
6. The health care sector comprises biotechnology, health care equipment and supplies, health care providers and services, health care technology, life sciences tools and services, and pharmaceuticals in the SOI.
7. The telecommunication services sector comprises diversified telecommunication services and wireless telecommunication services in the SOI. The utilities sector comprises electric utilities, gas utilities, independent power producers and energy traders, and water utilities in the SOI.
8 | Annual Report
defense spending. At period-end, many U.S. companies reported better-than-expected third-quarter earnings results despite softer overall earnings growth, and we continued to see signs of economic improvements. New home sales and home building grew at the fastest pace in recent years as home prices rose. At the same time, bank lending has been rising and household debt burdens have dropped significantly, providing further indications that the U.S. could continue to provide market leadership in the months ahead. We believe the housing sector plays a critical role in stimulating the economy because of its ability to create personal wealth, improve consumer confidence and potentially energize consumer spending — an important fuel for GDP growth. Although headwinds remain, these positive developments suggested to us that overall optimism about the U.S. economy may be well justified. Certain emerging market countries with strong fundamentals were also positioned to potentially benefit from a stabilization and recovery of the U.S. market, in our opinion.
Asia Pacific (excluding Japan)
Although this region overall detracted from the Fund’s relative results, stock selection in certain sectors benefited relative results, particularly in Taiwan’s IT and consumer discretionary, Malaysia’s consumer staples, India’s industrials and materials, and China’s financials. Key individual contributors included South Korean multinational conglomerate Samsung Electronics and Taiwanese IT company Taiwan Semiconductor Manufacturing. Samsung Electronics, one of Asia’s leading consumer electronics companies, delivered solid earnings results over the period. Our analysis led us to expect earnings momentum to likely remain intact given the company’s strong product leadership in component businesses. China Overseas Land & Investment (COLI), a large, Chinese real estate developer, demonstrated superior performance compared to its peers, with the company surpassing its full-year 2012 new sales target in October. This performance, alongside hopes of policy stimulus, helped COLI’s stock outperform during the period.
These favorable results could not offset the negative effects of the Fund’s overweighted allocations to India, China, South Korea and Taiwan, as well as stock selection in China and Australia. The Fund’s investment in Chinese automaker Dongfeng Motor Group, which has partnerships with major Japanese auto-makers Honda and Nissan, came under pressure as a territorial dispute between China and Japan caused Chinese consumers to boycott Japanese products. The Fund’s position in China Shenhua Energy, China’s largest coal producer and an integrated player focused on the coal and power business, also detracted from relative returns.

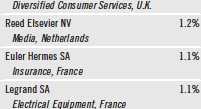
Annual Report | 9
Although the Asia Pacific (excluding Japan) region represented a large overweighted allocation, during the period we decreased our weighting, primarily in China, India, Australia and Indonesia.
Policymakers in China responded to reports of softening economic growth through a range of policy measures. In addition to lowering key interest rates to boost growth, Chinese authorities embarked on what might be referred to as selective easing or stimulus involving central bank support for inter-bank markets through increased liquidity injections. In September, the government launched a stimulus package totaling 1 trillion yuan (about US$158 billion) in infrastructure spending. In India, business and investor confidence was bolstered by the government’s announcement of reform measures designed to reduce the fiscal deficit and increase capital flows into the country, including liberalizing foreign holding caps in certain sectors and plans to divest some of the government’s stake in several state-owned companies. We viewed positively signs of a fundamental change in outlook and willingness by many emerging market governments to improve fiscal situations through policy action.
The region’s economic slowdown became a focus of investor attention in recent months. The International Monetary Fund and World Bank reduced their growth expectations for Asia for 2012 and 2013. However, despite the slowdown, the growth outlook for Asia remained healthier than for most developed market countries. Certain parts of Asia remained weak as export-reliant economies continued to experience soft demand in the recent market environment. Nevertheless, many of Asia’s largest economies — including China, India and Indonesia — continued to show relative resilience. In our opinion, Asia did not seem to have the same systemic risks that mature economies appeared to face. The relative lack of leverage along with a high savings rate in many Asian countries helped make the region less vulnerable to the debt problems confronting many developed market countries, in our view. Additionally, we think the investment case for Asia remained reasonably attractive, with recent price-to-earnings and price-to-book ratios in the region’s overall market well below their long-term averages. Notwithstanding these fundamental strengths, any reversal in global sentiment could have a significant bearing on the performance of local Asian equity markets.
Japan
An underweighted allocation to and stock selection in Japan helped relative performance. Specifically, positioning within the consumer discretionary, IT and utilities sectors proved beneficial. In contrast, positioning in the materials, telecommunication services and industrials sectors detracted from relative results. During the reporting period, we reduced our allocation to Japan, particularly in the materials, IT, industrials and telecommunication services sectors.
10 | Annual Report
The Japanese stock market was volatile during the period, staging a sharp rally at the beginning of 2012 before weakening noticeably during the latter part of the period amid renewed concerns over sovereign debt and banking systems in Europe. Japanese stocks rebounded somewhat in the first half of September after additional quantitative monetary easing announcements by the Bank of Japan and other central banks. Mounting concerns about Japanese companies’ weaker earnings weighed on the market, however, as did further signs of a global economic slowdown and anti-Japanese demonstrations in China. Although continued rebuilding efforts in the wake of the 2011 natural disasters provided a cushion for the Japanese economy, in our view, weakening external demand will likely have a negative impact.
Latin America
Stock selection in the Brazilian utilities, financials and materials sectors contributed to the Fund’s relative performance. Brazilian electric company Companhia Energe ·tica de Minas Gerais rallied during the period.3 In addition, an off-benchmark holding in Aliansce Shopping Centers boosted Fund performance. In contrast, the Fund’s overweighted allocation to Brazil detracted from relative returns. Individual detractors included metals and mining company Vale3 and financial conglomerate Itausa-Investimentos Itau. During the reporting period, our overall weighting in Brazil remained relatively unchanged. We eliminated our allocation to the materials, consumer discretionary and health care sectors, while increasing our allocations to financials and utilities.
After more than a year of sluggish economic activity, Brazil’s growth seemed to gain traction in the second half of 2012, with improvements in manufacturing as well as in business and consumer confidence. Overall, we think evidence has increased that Brazil has entered a period of moderate, but sustainable growth. Economic growth could accelerate in the coming quarters as the full impact of interest rate reductions takes hold, as well as the expected boost in investment for new infrastructure projects in preparation for the 2014 FIFA World Cup and 2016 summer Olympic Games. In addition to reducing interest rates, the government promoted several measures to spur economic activity, such as tax breaks for several sectors, efforts to reduce banks’ spreads and lower borrowing costs, and incentives to alleviate important logistics bottlenecks.
Middle East and North Africa (MENA)
The Fund’s positioning in the United Arab Emirates (UAE) and stock selection in Kuwait and Qatar helped relative performance. UAE stocks generally appreciated as monetary loosening initiatives in the U.S. and Europe filtered through to UAE-based banking and real estate-related companies. Individual contributors included First Gulf Bank, a commercial bank that engages in real estate brokerage and management, and Emaar Properties, a leader in UAE’s real estate and
Annual Report | 11
construction industries. In Kuwait, banking products and services provider Burgan Bank and real estate company Mabanee3 also aided the Fund. Our overall exposure to the MENA region was relatively unchanged during the period as we decreased our allocation to Kuwait and initiated a position in Egypt.
Recent commodity price declines reflected concerns about the ability of massive monetary easing to influence global economic recovery. Nevertheless, we remain confident in the long-term potential of the MENA region in general and Gulf Cooperation Council (GCC) countries in particular. Our strategy in this region has concentrated on companies and sectors that, in our view, are positioned to potentially benefit from increased infrastructure and consumer spending in the GCC. The possibility that Saudi Arabia may become more open to direct foreign investment and potentially attain MSCI emerging market status could provide a further catalyst for investment growth.
It is important to recognize the effect of currency movements on the Fund’s performance. In general, if the value of the U.S. dollar goes up compared with a foreign currency, an investment traded in that foreign currency will go down in value because it will be worth fewer U.S. dollars. This can have a negative effect on Fund performance. Conversely, when the U.S. dollar weakens in relation to a foreign currency, an investment traded in that foreign currency will increase in value, which can contribute to Fund performance. For the 12 months ended October 31, 2012, the U.S. dollar rose in value relative to most currencies. As a result, the Fund’s performance was negatively affected by the portfolio’s significant investment in securities with non-U.S. currency exposure.
Global economic growth concerns and diminishing inflationary pressures allowed many central banks to ease their monetary policies in the second half of the period, supporting stock markets worldwide. Synchronized global easing policy may also lead to a synchronized global recovery. Although some emerging market countries have shown slower growth rates recently, the main drivers of their economies will most likely continue to be the increase in infrastructure and consumer spending linked to the emergence of a middle class in these countries, which has led to a significant change in emerging market consumption patterns. We believe this trend bodes well for many global companies as well as home-grown emerging market companies. Many emerging markets were further buoyed by a sharp increase in global liquidity resulting from recent U.S. Fed and ECB actions to further loosen monetary policy. Within emerging markets, countries and sectors most closely tied to U.S. economic growth will likely benefit, in our opinion, while countries and sectors closely tied to China are likely to gain strong traction only when China provides greater clarity on internal politics and policy.
12 | Annual Report
Despite overall equity market strength over the past few months, we believe prices generally continued to reflect considerable pessimism and thus provided attractive entry points for investment in many companies we assessed as strong. At fiscal year-end, we maintain a favorable view on certain areas of the market, even though considerable risks remain — including any withdrawal of fiscal and monetary easing before a sustainable U.S. and global economic recovery is confirmed, a potential macro-level event in Europe, or a potential rise in inflationary pressures due to rising oil and food prices. Globally, our focus remains on investing in growth markets and in companies we believe have earnings resilience, could benefit from structural growth in their markets and are financially strong.
Thank you for your continued participation in Franklin World Perspectives Fund. We look forward to serving your future investment needs.

CFA® is a trademark owned by CFA Institute.
The foregoing information reflects our analysis, opinions and portfolio holdings as of October 31, 2012, the end of the reporting period. The way we implement our main investment strategies and the resulting portfolio holdings may change depending on factors such as market and economic conditions. These opinions may not be relied upon as investment advice or an offer for a particular security. The information is not a complete analysis of every aspect of any market, country, industry, security or the Fund. Statements of fact are from sources considered reliable, but the investment manager makes no representation or warranty as to their completeness or accuracy. Although historical performance is no guarantee of future results, these insights may help you understand our investment management philosophy.
Annual Report | 13
Performance Summary as of 10/31/12
Your dividend income will vary depending on dividends or interest paid by securities in the Fund’s portfolio, adjusted for operating expenses of each class. Capital gain distributions are net profits realized from the sale of portfolio securities. The performance table and graphs do not reflect any taxes that a shareholder would pay on Fund dividends, capital gain distributions, if any, or any realized gains on the sale of Fund shares. Total return reflects reinvestment of the Fund’s dividends and capital gain distributions, if any, and any unrealized gains or losses.

14 | Annual Report
Performance Summary (continued)
Performance1
Cumulative total return excludes sales charges. Average annual total returns and value of $10,000 investment include maximum sales charges. Class A: 5.75% maximum initial sales charge; Class C: 1% contingent deferred sales charge in first year only; Class R/Advisor Class: no sales charges.
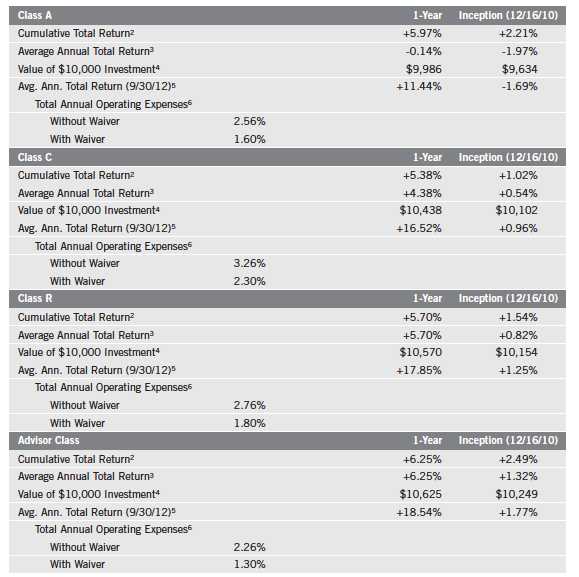
Performance data represent past performance, which does not guarantee future results. Investment return and principal value will fluctuate, and you may have a gain or loss when you sell your shares. Current performance may differ from figures shown. For most recent month-end performance, go to franklintempleton.com or call (800) 342-5236.
The investment manager and administrator have contractually agreed to waive or assume certain expenses so that common expenses (excluding Rule 12b-1 fees) for each class do not exceed 1.25% (other than certain nonroutine expenses) until 2/28/13.
Annual Report | 15
Performance Summary (continued)
Total Return Index Comparison for a Hypothetical $10,000 Investment1
Total return represents the change in value of an investment over the periods shown. It includes any applicable maximum sales charge, Fund expenses, account fees and reinvested distributions. The unmanaged index includes reinvestment of any income or distributions. It differs from the Fund in composition and does not pay management fees or expenses. One cannot invest directly in an index.

16 | Annual Report
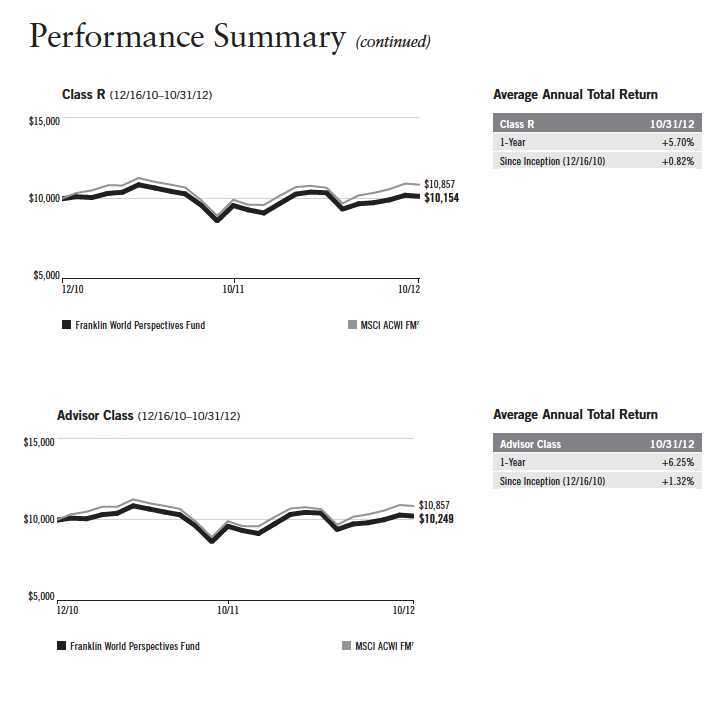
Annual Report | 17
Performance Summary (continued)
Endnotes
All investments involve risks, including possible loss of principal. Special risks are associated with foreign investing, including currency fluctuations, economic instability and political developments. Investments in emerging market countries involve heightened risks related to the same factors, in addition to those associated with these markets’ smaller size, lesser liquidity and lack of established legal, political, business and social frameworks to support securities markets. Smaller company stocks have historically had more price volatility than large-company stocks, particularly over the short term. The Fund is designed for the aggressive portion of a well-diversified portfolio. The Fund is actively managed but there is no guarantee that the manager’s investment decisions will produce the desired results. The Fund’s prospectus also includes a description of the main investment risks.
Class C: These shares have higher annual fees and expenses than Class A shares.
Advisor Class: Shares are available to certain eligible investors as described in the prospectus.
1. Fund investment results reflect the expense reduction, without which the results would have been lower.
2. Cumulative total return represents the change in value of an investment over the periods indicated.
3. Average annual total return represents the average annual change in value of an investment over the periods indicated.
4. These figures represent the value of a hypothetical $10,000 investment in the Fund over the periods indicated.
5. In accordance with SEC rules, we provide standardized average annual total return information through the latest calendar quarter.
6. Figures are as stated in the Fund’s prospectus current as of the date of this report. In periods of market volatility, assets may decline significantly,
causing total annual Fund operating expenses to become higher than the figures shown.
7. Source: © 2012 Morningstar. MSCI ACWI FM is a free float-adjusted, market capitalization-weighted index designed to measure equity market
performance of global developed, emerging and frontier markets.
18 | Annual Report
Your Fund’s Expenses
As a Fund shareholder, you can incur two types of costs:
- Transaction costs, including sales charges (loads) on Fund purchases; and
- Ongoing Fund costs, including management fees, distribution and service (12b-1) fees, and other Fund expenses. All mutual funds have ongoing costs, sometimes referred to as operating expenses.
The following table shows ongoing costs of investing in the Fund and can help you understand these costs and compare them with those of other mutual funds. The table assumes a $1,000 investment held for the six months indicated.
Actual Fund Expenses
The first line (Actual) for each share class listed in the table provides actual account values and expenses. The “Ending Account Value” is derived from the Fund’s actual return, which includes the effect of Fund expenses.
You can estimate the expenses you paid during the period by following these steps. Of course, your account value and expenses will differ from those in this illustration:
| 1. | Divide your account value by $1,000. |
| | If an account had an $8,600 value, then $8,600 ÷ $1,000 = 8.6. |
| 2. | Multiply the result by the number under the heading “Expenses Paid During Period.” |
| | If Expenses Paid During Period were $7.50, then 8.6 x $7.50 = $64.50. |
In this illustration, the estimated expenses paid this period are $64.50.
Hypothetical Example for Comparison with Other Funds
Information in the second line (Hypothetical) for each class in the table can help you compare ongoing costs of investing in the Fund with those of other mutual funds. This information may not be used to estimate the actual ending account balance or expenses you paid during the period. The hypothetical “Ending Account Value” is based on the actual expense ratio for each class and an assumed 5% annual rate of return before expenses, which does not represent the Fund’s actual return. The figure under the heading “Expenses Paid During Period” shows the hypothetical expenses your account would have incurred under this scenario. You can compare this figure with the 5% hypothetical examples that appear in shareholder reports of other funds.
Annual Report | 19
Your Fund’s Expenses (continued)
Please note that expenses shown in the table are meant to highlight ongoing costs and do not reflect any transaction costs, such as sales charges. Therefore, the second line for each class is useful in comparing ongoing costs only, and will not help you compare total costs of owning different funds. In addition, if transaction costs were included, your total costs would have been higher. Please refer to the Fund prospectus for additional information on operating expenses.

*Expenses are calculated using the most recent six-month expense ratio, net of expense waivers, annualized for each class (A: 1.33%; C: 2.01%; R: 1.75%; and Advisor: 1.25%), multiplied by the average account value over the period, multiplied by 184/366 to reflect the one-half year period.
20 | Annual Report
Franklin Templeton International Trust
Financial Highlights

Annual Report | The accompanying notes are an integral part of these financial statements. | 21
Franklin Templeton International Trust
Financial Highlights (continued)
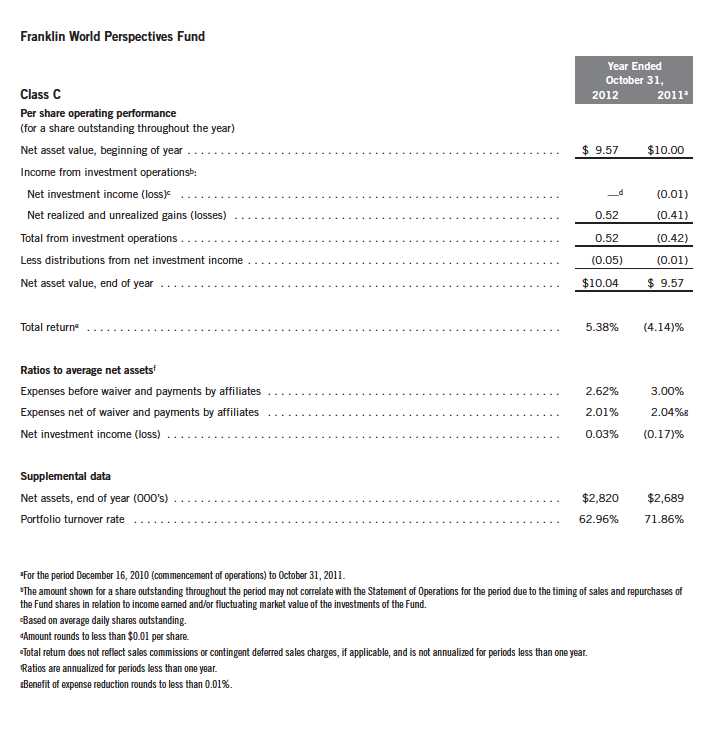
22 | The accompanying notes are an integral part of these financial statements. | Annual Report
Franklin Templeton International Trust
Financial Highlights (continued)

Annual Report | The accompanying notes are an integral part of these financial statements. | 23
Franklin Templeton International Trust
Financial Highlights (continued)

24 | The accompanying notes are an integral part of these financial statements. | Annual Report
Franklin Templeton International Trust
Statement of Investments, October 31, 2012
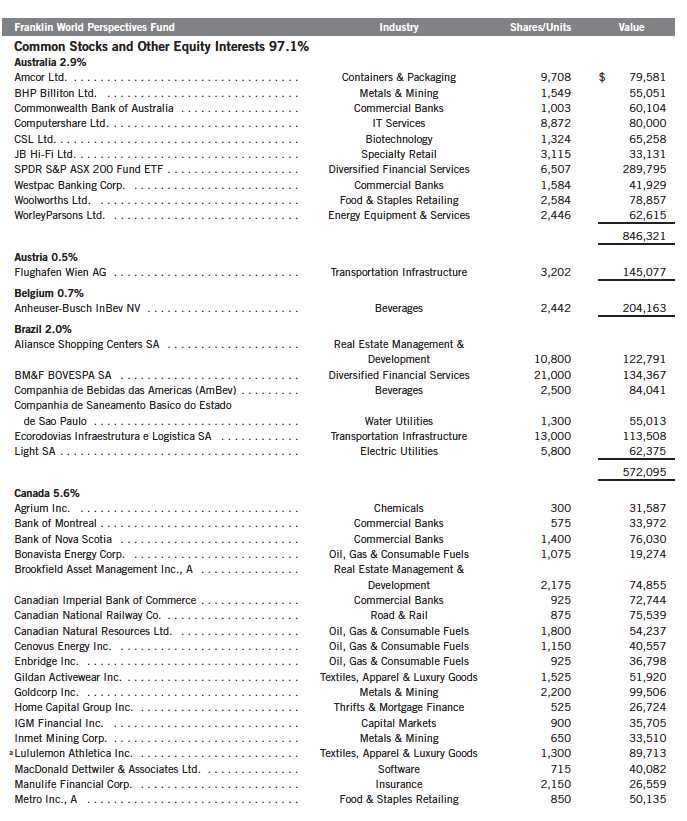
Annual Report | 25
Franklin Templeton International Trust
Statement of Investments, October 31, 2012 (continued)

26 | Annual Report
Franklin Templeton International Trust
Statement of Investments, October 31, 2012 (continued)

Annual Report | 27
Franklin Templeton International Trust
Statement of Investments, October 31, 2012 (continued)

Franklin Templeton International Trust
Statement of Investments, October 31, 2012 (continued)
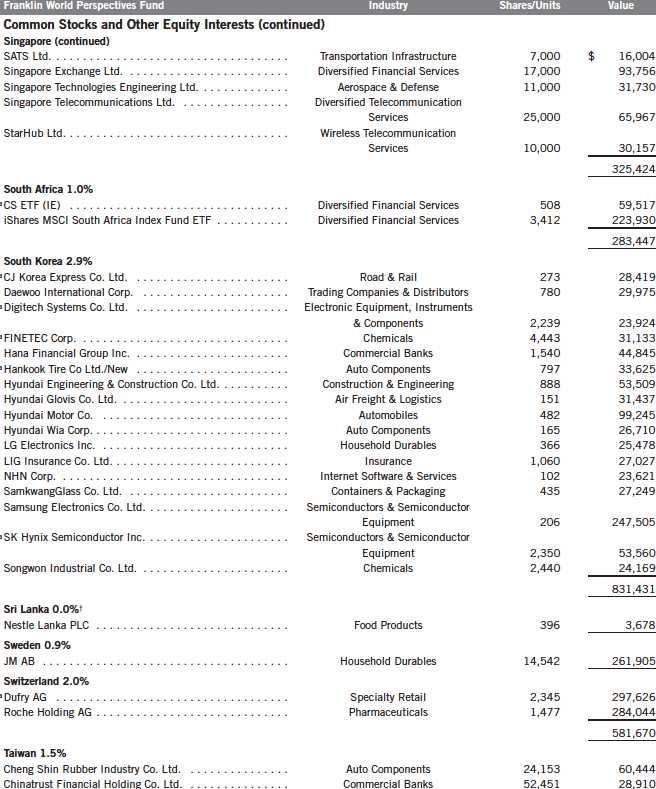
Annual Report | 29
Franklin Templeton International Trust
Statement of Investments, October 31, 2012 (continued)

30 | Annual Report
Franklin Templeton International Trust
Statement of Investments, October 31, 2012 (continued)

Annual Report | 31
Franklin Templeton International Trust
Statement of Investments, October 31, 2012 (continued)
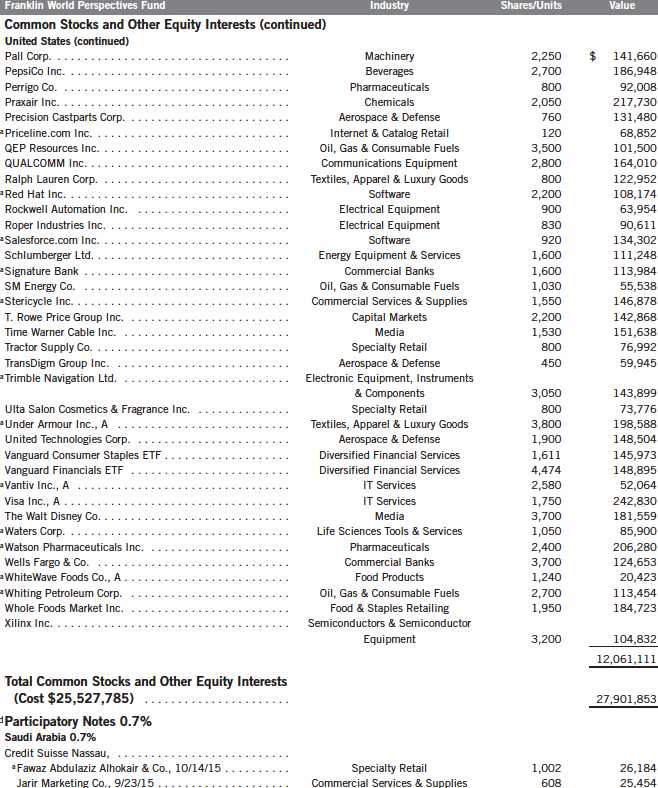
32 | Annual Report
Franklin Templeton International Trust
Statement of Investments, October 31, 2012 (continued)

Annual Report | 33
Franklin Templeton International Trust
Statement of Investments, October 31, 2012 (continued)
Franklin World Perspectives Fund
At October 31, 2012, the Fund had the following forward exchange contracts outstanding. See Note 1(c).
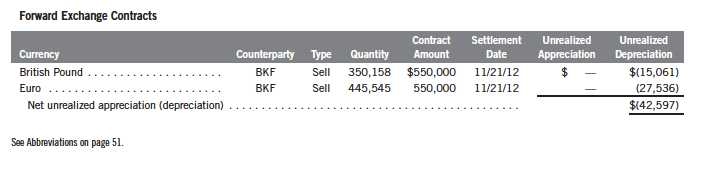
34 | The accompanying notes are an integral part of these financial statements. | Annual Report
Franklin Templeton International Trust
Financial Statements
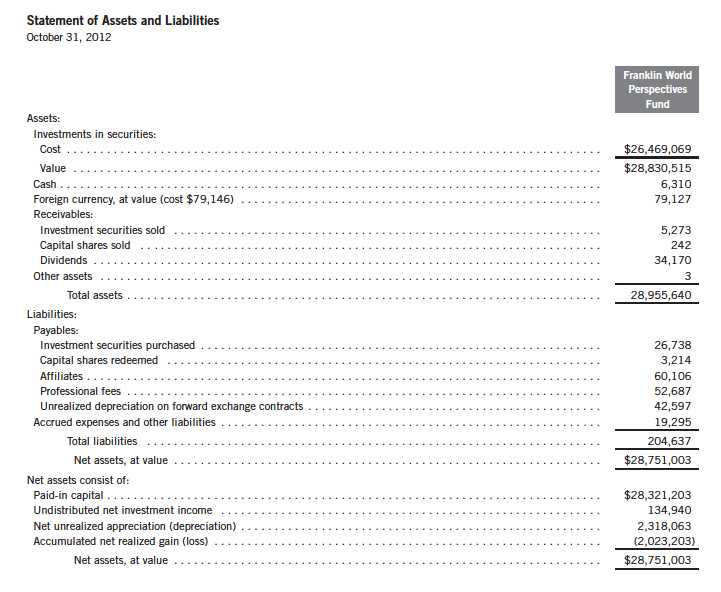
Annual Report | The accompanying notes are an integral part of these financial statements. | 35
Franklin Templeton International Trust
Financial Statements (continued)

36 | The accompanying notes are an integral part of these financial statements. | Annual Report
Franklin Templeton International Trust
Financial Statements (continued)
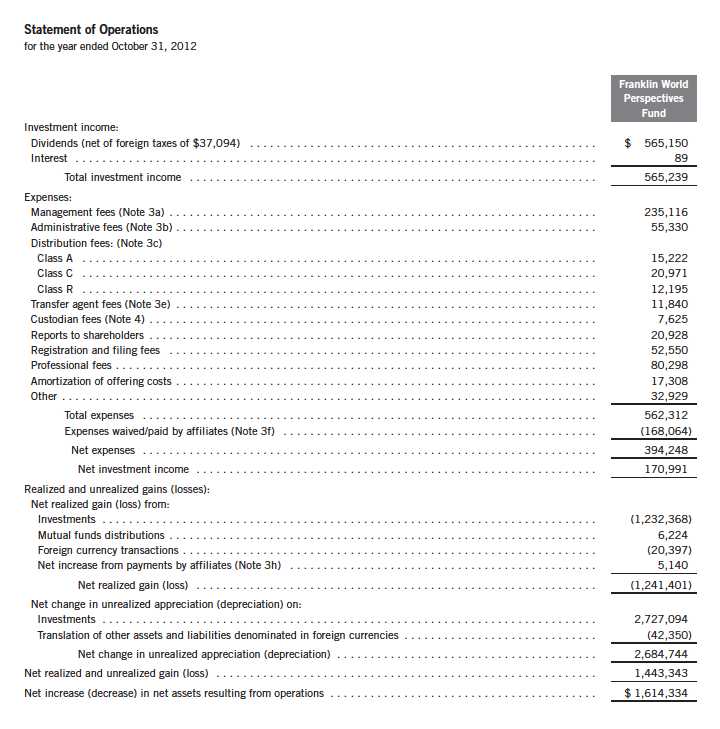
Annual Report | The accompanying notes are an integral part of these financial statements. | 37
Franklin Templeton International Trust
Financial Statements (continued)

38 | The accompanying notes are an integral part of these financial statements. | Annual Report
Franklin Templeton International Trust
Notes to Financial Statements
Franklin World Perspectives Fund
1. ORGANIZATION AND SIGNIFICANT ACCOUNTING POLICIES
Franklin Templeton International Trust (Trust) is registered under the Investment Company Act of 1940, as amended, (1940 Act) as an open-end investment company, consisting of four separate funds. The Franklin World Perspectives Fund (Fund) is included in this report. The financial statements of the remaining funds in the Trust are presented separately. The Fund offers four classes of shares: Class A, Class C, Class R, and Advisor Class. Each class of shares differs by its initial sales load, contingent deferred sales charges, distribution fees, voting rights on matters affecting a single class and its exchange privilege.
The following summarizes the Fund’s significant accounting policies.
a. Financial Instrument Valuation
The Fund’s investments in financial instruments are carried at fair value daily. Fair value is the price that would be received to sell an asset or paid to transfer a liability in an orderly transaction between market participants on the measurement date. Under procedures approved by the Trust’s Board of Trustees (the Board), the Fund’s administrator, investment manager and other affiliates have formed the Valuation and Liquidity Oversight Committee (VLOC). The VLOC provides administration and oversight of the Fund’s valuation policies and procedures, which are approved annually by the Board. Among other things, these procedures allow the Fund to utilize independent pricing services, quotations from securities and financial instrument dealers, and other market sources to determine fair value.
Equity securities and exchange traded funds listed on an exchange or on the NASDAQ National Market System are valued at the last quoted sale price or the official closing price of the day, respectively. Foreign equity securities are valued as of the close of trading on the foreign stock exchange on which the security is primarily traded, or the NYSE, whichever is earlier. The value is then converted into its U.S. dollar equivalent at the foreign exchange rate in effect at the close of the NYSE on the day that the value of the security is determined. Over-the-counter (OTC) securities are valued within the range of the most recent quoted bid and ask prices. Securities that trade in multiple markets or on multiple exchanges are valued according to the broadest and most representative market. Certain equity securities are valued based upon fundamental characteristics or relationships to similar securities. Investments in open-end mutual funds are valued at the closing net asset value.
Debt securities generally trade in the OTC market rather than on a securities exchange. The Fund’s pricing services use multiple valuation techniques to determine fair value. In instances where sufficient market activity exists, the pricing services may utilize a market-based approach through which quotes from market makers are used to determine fair value. In instances where sufficient market activity may not exist or is limited, the pricing services also utilize proprietary
Annual Report | 39
Franklin Templeton International Trust
Notes to Financial Statements (continued)
Franklin World Perspectives Fund
| 1. | ORGANIZATION AND SIGNIFICANT ACCOUNTING POLICIES (continued) |
| a. | Financial Instrument Valuation (continued) |
valuation models which may consider market characteristics such as benchmark yield curves, credit spreads, estimated default rates, anticipated market interest rate volatility, coupon rates, anticipated timing of principal repayments, underlying collateral, and other unique security features in order to estimate the relevant cash flows, which are then discounted to calculate the fair value. Securities denominated in a foreign currency are converted into their U.S. dollar equivalent at the foreign exchange rate in effect at the close of the NYSE on the date that the values of the foreign debt securities are determined.
Certain derivative financial instruments (derivatives) trade in the OTC market. The Fund’s pricing services use various techniques including industry standard option pricing models and proprietary discounted cash flow models to determine the fair value of those instruments. The Fund’s net benefit or obligation under the derivative contract, as measured by the fair market value of the contract, is included in net assets.
The Fund has procedures to determine the fair value of financial instruments for which market prices are not reliable or readily available. Under these procedures, the VLOC convenes on a regular basis to review such financial instruments and considers a number of factors, including significant unobservable valuation inputs, when arriving at fair value. The VLOC primarily employs a market-based approach which may use related or comparable assets or liabilities, recent transactions, market multiples, book values, and other relevant information for the investment to determine the fair value of the investment. An income-based valuation approach may also be used in which the anticipated future cash flows of the investment are discounted to calculate fair value. Discounts may also be applied due to the nature or duration of any restrictions on the disposition of the investments. Due to the inherent uncertainty of valuations of such investments, the fair values may differ significantly from the values that would have been used had an active market existed. The VLOC employs various methods for calibrating these valuation approaches including a regular review of key inputs and assumptions, transactional back-testing or disposition analysis, and reviews of any related market activity.
Trading in securities on foreign securities stock exchanges and OTC markets may be completed before the daily close of business on the NYSE. Occasionally, events occur between the time at which trading in a foreign security is completed and the close of the NYSE that might call into question the reliability of the value of a portfolio security held by the Fund. As a result, differences may arise between the value of the Fund’s portfolio securities as determined at the foreign market close and the latest indications of value at the close of the NYSE. In order to minimize the potential for these differences, the VLOC monitors price movements following the close of trading in foreign stock markets through a series of country specific market proxies (such as baskets of American Depositary Receipts, futures contracts and exchange traded funds). These price movements are measured against established trigger thresholds for each specific market
40 | Annual Report
Franklin Templeton International Trust
Notes to Financial Statements (continued)
Franklin World Perspectives Fund
| 1. | ORGANIZATION AND SIGNIFICANT ACCOUNTING POLICIES (continued) |
| a. | Financial Instrument Valuation (continued) |
proxy to assist in determining if an event has occurred that may call into question the reliability of the values of the foreign securities held by the Fund. If such an event occurs, the securities may be valued using fair value procedures, which may include the use of independent pricing services.
b. Foreign Currency Translation
Portfolio securities and other assets and liabilities denominated in foreign currencies are translated into U.S. dollars based on the exchange rate of such currencies against U.S. dollars on the date of valuation. The Fund may enter into foreign currency exchange contracts to facilitate transactions denominated in a foreign currency. Purchases and sales of securities, income and expense items denominated in foreign currencies are translated into U.S. dollars at the exchange rate in effect on the transaction date. Portfolio securities and assets and liabilities denominated in foreign currencies contain risks that those currencies will decline in value relative to the U.S. dollar. Occasionally, events may impact the availability or reliability of foreign exchange rates used to convert the U.S. dollar equivalent value. If such an event occurs, the foreign exchange rate will be valued at fair value using procedures established and approved by the Board.
The Fund does not separately report the effect of changes in foreign exchange rates from changes in market prices on securities held. Such changes are included in net realized and unrealized gain or loss from investments on the Statement of Operations.
Realized foreign exchange gains or losses arise from sales of foreign currencies, currency gains or losses realized between the trade and settlement dates on securities transactions and the difference between the recorded amounts of dividends, interest, and foreign withholding taxes and the U.S. dollar equivalent of the amounts actually received or paid. Net unrealized foreign exchange gains and losses arise from changes in foreign exchange rates on foreign denominated assets and liabilities other than investments in securities held at the end of the reporting period.
c. Derivative Financial Instruments
The Fund invested in derivatives in order to manage risk or gain exposure to various other investments or markets. Derivatives are financial contracts based on an underlying or notional amount, require no initial investment or an initial net investment that is smaller than would normally be required to have a similar response to changes in market factors, and require or permit net settlement. Derivatives contain various risks including the potential inability of the counterparty to fulfill their obligations under the terms of the contract, the potential for an illiquid secondary market, and/or the potential for market movements which expose the Fund to gains or losses in excess of the amounts shown on the Statement of Assets and Liabilities. Realized gain and loss and unrealized appreciation and depreciation on these contracts for the period are included in the Statement of Operations.
Annual Report | 41
Franklin Templeton International Trust
Notes to Financial Statements (continued)
Franklin World Perspectives Fund
| 1. | ORGANIZATION AND SIGNIFICANT ACCOUNTING POLICIES (continued) |
| c. | Derivative Financial Instruments (continued) |
The Fund investments in OTC derivatives are subject to the terms of International Swaps and Derivatives Association Master Agreements and other related agreements between the Fund and certain derivative counterparties. These agreements contain various provisions, including but not limited to collateral requirements, events of default, requirements for the Fund to maintain certain net asset levels and/or limit the decline in net assets over various periods of time. Should the Fund fail to meet any of these provisions, the derivative counterparty has the right to terminate the derivative contract and require immediate payment by the Fund for those OTC derivatives with that particular counterparty that are in a net liability position. At October 31, 2012, the Fund had OTC derivatives in a net liability position for such contracts of $42,597.
The Fund entered into OTC forward exchange contracts primarily to manage and/or gain exposure to certain foreign currencies. A forward exchange contract is an agreement between the Fund and a counterparty to buy or sell a foreign currency for a specific exchange rate on a future date. Pursuant to the terms of the forward exchange contracts, cash or securities may be required to be deposited as collateral. Unrestricted cash may be invested according to the Fund’s investment objectives.
See Note 9 regarding other derivative information.
d. Participatory Notes
The Fund invests in Participatory Notes (P-Notes). P-notes are promissory notes that are designed to offer a return linked to the performance of a particular underlying equity security or market. P-Notes are issued by banks or broker-dealers and allow the fund to gain exposure to common stocks in markets where direct investment is not allowed. Income received from P-Notes is recorded as dividend income in the Statement of Operations. P-Notes may contain various risks including the potential inability of the counterparty to fulfill their obligations under the terms of the contract. These securities may be more volatile and less liquid than other investments held by the Fund.
e. Income and Deferred Taxes
It is the Fund’s policy to qualify as a regulated investment company under the Internal Revenue Code. The Fund intends to distribute to shareholders substantially all of its taxable income and net realized gains to relieve it from federal income and if applicable, excise taxes. As a result, no provision for U.S. federal income taxes is required.
The Fund may be subject to foreign taxation related to income received, capital gains on the sale of securities and certain foreign currency transactions in the foreign jurisdictions in which it invests. Foreign taxes, if any, are recorded based on the tax regulations and rates that exist in the
42 | Annual Report
Franklin Templeton International Trust
Notes to Financial Statements (continued)
Franklin World Perspectives Fund
| 1. | ORGANIZATION AND SIGNIFICANT ACCOUNTING POLICIES (continued) |
| e. | Income and Deferred Taxes (continued) |
foreign markets in which the Fund invests. When a capital gain tax is determined to apply the Fund records an estimated deferred tax liability in an amount that would be payable if the securities were disposed of on the valuation date.
The Fund recognizes the tax benefits of uncertain tax positions only when the position is “more likely than not” to be sustained upon examination by the tax authorities based on the technical merits of the tax position. As of October 31, 2012, and for all open tax years, the Fund has determined that no liability for unrecognized tax benefits is required in the Fund’s financial statements related to uncertain tax positions taken on a tax return (or expected to be taken on future tax returns). Open tax years are those that remain subject to examination and are based on each tax jurisdiction statute of limitation.
f. Security Transactions, Investment Income, Expenses and Distributions
Security transactions are accounted for on trade date. Realized gains and losses on security transactions are determined on a specific identification basis. Interest income and estimated expenses are accrued daily. Amortization of premium and accretion of discount on debt securities are included in interest income. Dividend income is recorded on the ex-dividend date except that certain dividends from foreign securities are recognized as soon as the Fund is notified of the ex-dividend date. Distributions to shareholders are recorded on the ex-dividend date and are determined according to income tax regulations (tax basis). Distributable earnings determined on a tax basis may differ from earnings recorded in accordance with accounting principles generally accepted in the United States of America. These differences may be permanent or temporary. Permanent differences are reclassified among capital accounts to reflect their tax character. These reclassifications have no impact on net assets or the results of operations. Temporary differences are not reclassified, as they may reverse in subsequent periods.
Common expenses incurred by the Trust are allocated among the Funds based on the ratio of net assets of each fund to the combined net assets of the Trust. Fund specific expenses are charged directly to the fund that incurred the expense.
Realized and unrealized gains and losses and net investment income, not including class specific expenses, are allocated daily to each class of shares based upon the relative proportion of net assets of each class. Differences in per share distributions, by class, are generally due to differences in class specific expenses.
g. Offering Costs
Offering costs are amortized on a straight line basis over twelve months.
Annual Report | 43
Franklin Templeton International Trust
Notes to Financial Statements (continued)
Franklin World Perspectives Fund
| 1. | ORGANIZATION AND SIGNIFICANT ACCOUNTING POLICIES (continued) |
| h. | Accounting Estimates |
The preparation of financial statements in accordance with accounting principles generally accepted in the United States of America requires management to make estimates and assumptions that affect the reported amounts of assets and liabilities at the date of the financial statements and the amounts of income and expenses during the reporting period. Actual results could differ from those estimates.
i. Guarantees and Indemnifications
Under the Trust’s organizational documents, its officers and trustees are indemnified by the Trust against certain liabilities arising out of the performance of their duties to the Trust. Additionally, in the normal course of business, the Trust, on behalf of the Funds, enters into contracts with service providers that contain general indemnification clauses. The Trust’s maximum exposure under these arrangements is unknown as this would involve future claims that may be made against the Trust that have not yet occurred. Currently, the Trust expects the risk of loss to be remote.
2. SHARES OF BENEFICIAL INTEREST
At October 31, 2012, there were an unlimited number of shares authorized (without par value).
Transactions in the Fund’s shares were as follows:

44 | Annual Report
Franklin Templeton International Trust
Notes to Financial Statements (continued)

3. TRANSACTIONS WITH AFFILIATES
Franklin Resources, Inc. is the holding company for various subsidiaries that together are referred to as Franklin Templeton Investments. Certain officers and trustees of the Fund are also officers and/or directors of the following subsidiaries:
| |
Subsidiary Franklin Advisers, Inc. (Advisers) Franklin Templeton Asset Management (India) Private Limited (FT India) Franklin Templeton Investimentos (Brasil) Ltda. (FT Brazil) Franklin Templeton Investment Management Limited (FTIML) Franklin Templeton Investment Trust Management Co., Ltd. (FT Korea) Franklin Templeton Investments Corp. (FTIC) Franklin Templeton Investments Japan Limited (FT Japan) Franklin Templeton Services, LLC (FT Services) Franklin Templeton Distributors, Inc. (Distributors) Franklin Templeton Investor Services, LLC (Investor Services) | Affiliation Investment manager Investment manager Investment manager Investment manager Investment manager Investment manager Investment manager Administrative manager Principal underwriter Transfer agent |
a. Management Fees
The Fund pays an investment management fee to Advisers based on the average daily net assets of the Fund as follows:

Annual Report | 45
Franklin Templeton International Trust
Notes to Financial Statements (continued)
Franklin World Perspectives Fund
| 3. | TRANSACTIONS WITH AFFILIATES (continued) |
| a. | Management Fees (continued) |
Under a subadvisory agreement, FT India, FT Brazil, FTIML, FT Korea, FTIC and FT Japan, affiliates of Advisers, provide subadvisory services to the Fund. The subadvisory fee is paid by Advisers based on the average daily net assets, and is not an additional expense of the Fund. Effective December 1, 2012, FT Japan will no longer be an investment manager of the Fund.
b. Administrative Fees
The Fund pays an administrative fee to FT Services of 0.20% per year of the average daily net assets of the Fund.
c. Distribution Fees
The Board has adopted distribution plans for each share class, with the exception of Advisor Class shares, pursuant to Rule 12b-1 under the 1940 Act. Distribution fees are not charged on shares held by affiliates. Under the Fund’s Class A reimbursement distribution plan, the Fund reimburses Distributors for costs incurred in connection with the servicing, sale and distribution of the Fund’s shares up to the maximum annual plan rate. Under the Class A reimbursement distribution plan, costs exceeding the maximum for the current plan year cannot be reimbursed in subsequent periods. In addition, under the Fund’s Class C and R compensation distribution plans, the Fund pays Distributors for costs incurred in connection with the servicing, sale and distribution of the Fund’s shares up to the maximum annual plan rate for each class.
The maximum annual plan rates, based on the average daily net assets, for each class, are as follows:

d. Sales Charges/Underwriting Agreements
Front-end sales charges and contingent deferred sales charges (CDSC) do not represent expenses of the Fund. These charges are deducted from the proceeds of sales of Fund shares prior to investment or from redemption proceeds prior to remittance, as applicable. Distributors has advised the Fund of the following commission transactions related to the sales and redemptions of the Fund’s shares for the year:

46 | Annual Report
Franklin Templeton International Trust
Notes to Financial Statements (continued)
Franklin World Perspectives Fund
| 3. | TRANSACTIONS WITH AFFILIATES (continued) |
| e. | Transfer Agent Fees |
For the year ended October 31, 2012, the Fund paid transfer agent fees of $11,840, of which $6,141 was retained by Investor Services.
f. Waiver and Expense Reimbursements
Advisers and FT Services have contractually agreed in advance to waive or limit their respective fees and to assume as their own expense certain expenses otherwise payable by the Fund so that the common expenses (i.e. a combination of management fees, administrative fees, and other expenses, but excluding distribution fees, and acquired fund fees and expenses) for each class of the Fund do not exceed 1.25% (other than certain non-routine expenses or costs, including those relating to litigation, indemnification, reorganizations, and liquidations) until February 28, 2013.
g. Other Affiliated Transactions
At October 31, 2012, Franklin Resources, Inc. owned 87.81% of the Fund’s outstanding shares. Investment activities of this shareholder could have a material impact on the Fund.
h. Payments by Affiliates
During the year ended October 31, 2012, FT Services reimbursed the Fund $5,140 for a trading error which occurred during the year. The net effect of losses incurred and the reimbursement by FT Services had no impact on the total return.
4. EXPENSE OFFSET ARRANGEMENT
The Fund has entered into an arrangement with its custodian whereby credits realized as a result of uninvested cash balances are used to reduce a portion of the Fund’s custodian expenses. During the year ended October 31, 2012, there were no credits earned.
5. INCOME TAXES
For tax purposes, capital losses may be carried over to offset future capital gains, if any. Under the Regulated Investment Company Modernization Act of 2010, capital losses incurred by the Fund in taxable years beginning after December 22, 2010 are not subject to expiration and such losses retain their character as either short-term or long-term, rather than being considered short-term as under previous law. Post-enactment capital losses must be fully utilized prior to utilizing any losses incurred in pre-enactment tax years.
Annual Report | 47
Franklin Templeton International Trust
Notes to Financial Statements (continued)
Franklin World Perspectives Fund
5. INCOME TAXES (continued)
At October 31, 2012, capital loss carryforwards were as follows:
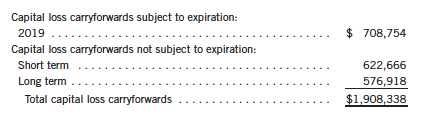
The tax character of distributions paid during the years ended October 31, 2012 and 2011, was as follows:
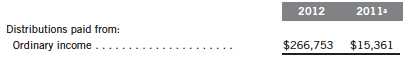
aFor the period December 16, 2010 (commencement of operations) to October 31, 2011.
At October 31, 2012, the cost of investments, net unrealized appreciation (depreciation) and undistributed ordinary income for income tax purposes were as follows:
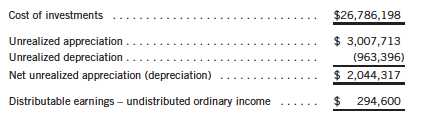
Differences between income and/or capital gains as determined on a book basis and a tax basis are primarily due to differing treatments of wash sales and passive foreign investment company shares.
6. INVESTMENT TRANSACTIONS
Purchases and sales of investments (excluding short term securities) for the year ended October 31, 2012, aggregated $18,340,304 and $16,994,596, respectively.
7. INVESTMENTS IN FRANKLIN INDIA GROWTH FUND
The Fund may invest in the Franklin India Growth Fund, an open-end investment company managed by Advisers. Management fees paid by the Fund are reduced on assets invested in Franklin India Growth Fund, in an amount not to exceed the management fees paid by the Franklin India Growth Fund.
48 | Annual Report
Franklin Templeton International Trust
Notes to Financial Statements (continued)
Franklin World Perspectives Fund
8. CONCENTRATION OF RISK
Investing in foreign securities may include certain risks and considerations not typically associated with investing in U.S. securities, such as fluctuating currency values and changing local and regional economic, political and social conditions, which may result in greater market volatility. In addition, certain foreign securities may not be as liquid as U.S. securities.
9. OTHER DERIVATIVE INFORMATION
At October 31, 2012, the Fund has invested in derivative contracts which are reflected on the Statement of Assets and Liabilities as follows:
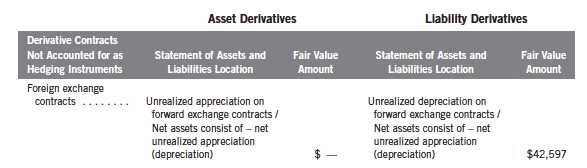
For the year ended October 31, 2012, the effect of derivative contracts on the Fund’s Statement of Operations was as follows:

For the year ended October 31, 2012, the average month end market value of derivatives represented 0.02% of average month end net assets. The average month end number of open derivative contracts for the year rounds to less than 1.
See Note 1(c) regarding derivative financial instruments.
Annual Report | 49
Franklin Templeton International Trust
Notes to Financial Statements (continued)
Franklin World Perspectives Fund
10. CREDIT FACILITY
The Fund, together with other U.S. registered and foreign investment funds (collectively, Borrowers), managed by Franklin Templeton Investments, are borrowers in a joint syndicated senior unsecured credit facility totaling $1.5 billion (Global Credit Facility) which matures on January 18, 2013. This Global Credit Facility provides a source of funds to the Borrowers for temporary and emergency purposes, including the ability to meet future unanticipated or unusually large redemption requests.
Under the terms of the Global Credit Facility, the Fund shall, in addition to interest charged on any borrowings made by the Fund and other costs incurred by the Fund, pay its share of fees and expenses incurred in connection with the implementation and maintenance of the Global Credit Facility, based upon its relative share of the aggregate net assets of all of the Borrowers, including an annual commitment fee of 0.08% based upon the unused portion of the Global Credit Facility, which is reflected in other expenses on the Statement of Operations. During the year ended October 31, 2012, the Fund did not use the Global Credit Facility.
11. FAIR VALUE MEASUREMENTS
The Fund follows a fair value hierarchy that distinguishes between market data obtained from independent sources (observable inputs) and the Fund’s own market assumptions (unobservable inputs). These inputs are used in determining the value of the Fund’s financial instruments and are summarized in the following fair value hierarchy:
- Level 1 – quoted prices in active markets for identical financial instruments
- Level 2 – other significant observable inputs (including quoted prices for similar financial instruments, interest rates, prepayment speed, credit risk, etc.)
- Level 3 – significant unobservable inputs (including the Fund’s own assumptions in determining the fair value of financial instruments)
The inputs or methodology used for valuing financial instruments are not an indication of the risk associated with investing in those financial instruments.
For movements between the levels within the fair value hierarchy, the Fund has adopted a policy of recognizing the transfers as of the date of the underlying event which caused the movement.
50 | Annual Report
Franklin Templeton International Trust
Notes to Financial Statements (continued)
Franklin World Perspectives Fund
| 11. | FAIR VALUE MEASUREMENTS (continued) |
| A | summary of inputs used as of October 31, 2012, in valuing the Fund’s assets and liabilities |
carried at fair value, is as follows:

alncludes common and preferred stocks as well as other equity investments.
bFor detailed categories, see the accompanying Statement of Investments.
A reconciliation of assets in which Level 3 inputs are used in determining fair value is presented when there are significant Level 3 investments at the end of the period.
12. NEW ACCOUNTING PRONOUNCEMENTS
In December 2011, the Financial Accounting Standards Board (FASB) issued Accounting Standards Update (ASU) No. 2011-11, Balance Sheet (Topic 210): Disclosures about Offsetting Assets and Liabilities. The amendments in the ASU enhance disclosures about offsetting of financial assets and liabilities to enable investors to understand the effect of these arrangements on a fund’s financial position. The ASU is effective for interim and annual reporting periods beginning on or after January 1, 2013. The Fund believes the adoption of this ASU will not have a material impact on its financial statements.
13. SUBSEQUENT EVENTS
The Fund has evaluated subsequent events through the issuance of the financial statements and determined that no events have occurred that require disclosure other than those already disclosed in the financial statements.

Annual Report | 51
Franklin Templeton International Trust
Report of Independent Registered Public Accounting Firm
To the Board of Trustees and Shareholders of Franklin World Perspectives Fund
In our opinion, the accompanying statement of assets and liabilities, including the statement of investments, and the related statements of operations and of changes in net assets and the financial highlights present fairly, in all material respects, the financial position of Franklin World Perspectives Fund (the “Fund”) at October 31, 2012, the results of its operations for the year then ended, the changes in its net assets and the financial highlights for the periods presented, in conformity with accounting principles generally accepted in the United States of America. These financial statements and financial highlights (hereafter referred to as “financial statements”) are the responsibility of the Fund’s management. Our responsibility is to express an opinion on these financial statements based on our audits. We conducted our audits of these financial statements in accordance with the standards of the Public Company Accounting Oversight Board (United States). Those standards require that we plan and perform the audit to obtain reasonable assurance about whether the financial statements are free of material misstatement. An audit includes examining, on a test basis, evidence supporting the amounts and disclosures in the financial statements, assessing the accounting principles used and significant estimates made by management, and evaluating the overall financial statement presentation.
We believe that our audits, which included confirmation of securities at October 31, 2012 by correspondence with the custodian, transfer agent, and brokers, provide a reasonable basis for our opinion.
PricewaterhouseCoopers LLP
San Francisco, California
December 17, 2012
52 | Annual Report
Franklin Templeton International Trust
Tax Information (unaudited)
Franklin World Perspectives Fund
Under Section 854(b)(1)(A) of the Internal Revenue Code (Code), the Fund hereby reports 36.62% of the ordinary income dividends as income qualifying for the dividends received deduction for the fiscal year ended October 31, 2012.
Under Section 854(b)(1)(B) of the Code, the Fund hereby reports the maximum amount allowable but no less than $337,071 as qualified dividends for purposes of the maximum rate under Section 1(h)(11) of the Code for the fiscal year ended October 31, 2012. Distributions, including qualified dividend income, paid during calendar year 2012 will be reported to shareholders on Form 1099-DIV by mid-February 2013. Shareholders are advised to check with their tax advisors for information on the treatment of these amounts on their individual income tax returns.
At October 31, 2011, more than 50% of the Fund’s total assets were invested in securities of foreign issuers. In most instances, foreign taxes were withheld from income paid to the Fund on these investments. As shown in the table below, the Fund hereby reports to shareholders the foreign source income and foreign taxes paid, pursuant to Section 853 of the Code. This written statement will allow shareholders of record on December 14, 2011, to treat their proportionate share of foreign taxes paid by the Fund as having been paid directly by them. The shareholder shall consider these amounts as foreign taxes paid in the tax year in which they receive the Fund distribution.
The following table provides a detailed analysis of foreign tax paid, foreign source income, and foreign qualified dividends as reported by the Fund, to Class A, Class C, Class R, and Advisor Class shareholders of record.

Foreign Tax Paid Per Share (Column 1) is the amount per share available to you, as a tax credit (assuming you held your shares in the Fund for a minimum of 16 days during the 31-day period beginning 15 days before the ex-dividend date of the Fund’s distribution to which the foreign taxes relate), or, as a tax deduction.
Foreign Source Income Per Share (Column 2) is the amount per share of income dividends attributable to foreign securities held by the Fund, plus any foreign taxes withheld on these dividends. The amounts reported include foreign source qualified dividends that have not been adjusted for the rate differential applicable to such dividend income.1
Annual Report | 53
Franklin Templeton International Trust
Tax Information (unaudited) (continued)
Franklin World Perspectives Fund
Foreign Qualified Dividends Per Share (Column 3) is the amount per share of foreign source qualified dividends, plus any foreign taxes withheld on these dividends. These amounts represent the portion of the Foreign Source Income reported to you in column 2 that were derived from qualified foreign securities held by the Fund.1
By mid-February 2012, shareholders received Form 1099-DIV which included their share of taxes paid and foreign source income distributed during the calendar year 2011. The Foreign Source Income reported on Form 1099-DIV has not been adjusted for the rate differential on foreign source qualified dividend income. Shareholders are advised to check with their tax advisors for information on the treatment of these amounts on their 2011 individual income tax returns.
1Qualified dividends are taxed at reduced long term capital gains tax rates. In determining the amount of foreign tax credit that may be applied against the U.S. tax liability of individuals receiving foreign source qualified dividends, adjustments may be required to the foreign tax credit limitation calculation to reflect the rate differential applicable to such dividend income. The rules however permit certain individuals to elect not to apply the rate differential adjustments for capital gains and/or dividends for any taxable year. Please consult your tax advisor and the instructions to Form 1116 for more information.
54 | Annual Report
Franklin Templeton International Trust
Board Members and Officers
The name, year of birth and address of the officers and board members, as well as their affiliations, positions held with the Trust, principal occupations during at least the past five years and number of portfolios overseen in the Franklin Templeton Investments fund complex are shown below. Generally, each board member serves until that person’s successor is elected and qualified.
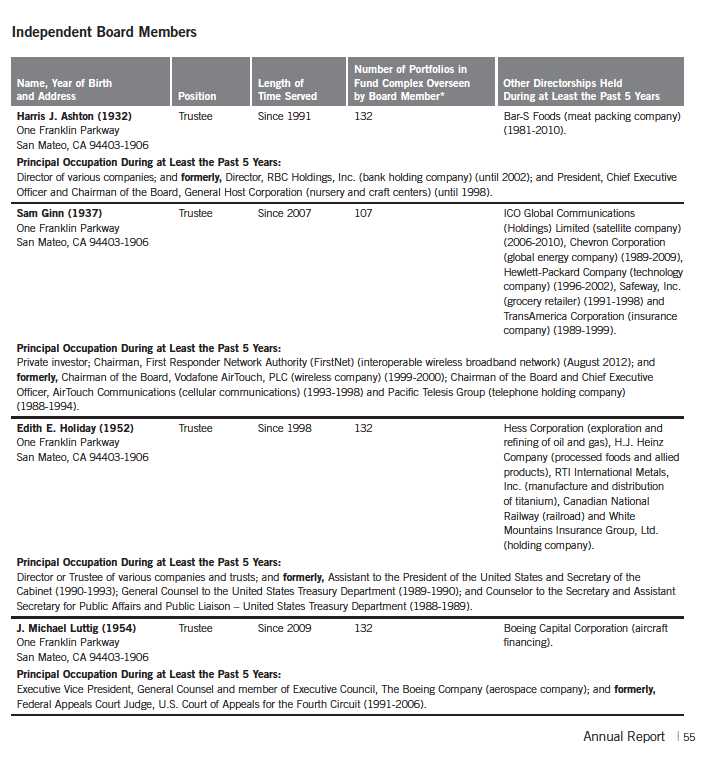

56 | Annual Report

58 | Annual Report

Annual Report | 59
Franklin Templeton International Trust
Shareholder Information
Franklin World Perspectives Fund
Proxy Voting Policies and Procedures
The Fund’s investment manager has established Proxy Voting Policies and Procedures (Policies) that the Fund uses to determine how to vote proxies relating to portfolio securities. Shareholders may view the Fund’s complete Policies online at franklintempleton.com. Alternatively, shareholders may request copies of the Policies free of charge by calling the Proxy Group collect at (954) 527-7678 or by sending a written request to: Franklin Templeton Companies, LLC, 300 S.E. 2nd Street, Fort Lauderdale, FL 33301, Attention: Proxy Group. Copies of the Fund’s proxy voting records are also made available online at franklintempleton.com and posted on the U.S. Securities and Exchange Commission’s website at sec.gov and reflect the most recent 12-month period ended June 30.
Quarterly Statement of Investments
The Fund files a complete statement of investments with the U.S. Securities and Exchange Commission for the first and third quarters for each fiscal year on Form N-Q. Shareholders may view the filed Form N-Q by visiting the Commission’s website at sec.gov. The filed form may also be viewed and copied at the Commission’s Public Reference Room in Washington, DC. Information regarding the operations of the Public Reference Room may be obtained by calling (800) SEC-0330.
Householding of Reports and Prospectuses
You will receive the Fund’s financial reports every six months as well as an annual updated summary prospectus (prospectus available upon request). To reduce Fund expenses, we try to identify related shareholders in a household and send only one copy of the financial reports and summary prospectus. This process, called “householding,” will continue indefinitely unless you instruct us otherwise. If you prefer not to have these documents householded, please call us at (800) 632-2301. At any time you may view current prospectuses/summary prospectuses and financial reports on our website. If you choose, you may receive these documents through electronic delivery.
60 | Annual Report


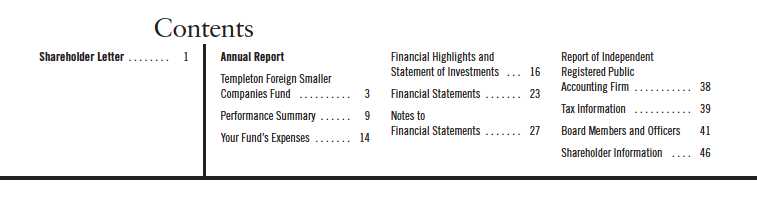
| 1
Annual Report
Templeton Foreign Smaller Companies Fund
Your Fund’s Goal and Main Investments: Templeton Foreign Smaller Companies Fund seeks to provide long-term capital growth. Under normal market conditions, the Fund invests at least 80% of its net assets in investments of smaller companies located outside the U.S., including emerging markets.
Performance data represent past performance, which does not guarantee future results. Investment return and principal value will fluctuate, and you may have a gain or loss when you sell your shares. Current performance may differ from figures shown. Please visit franklintempleton.com or call (800) 342-5236 for most recent month-end performance.
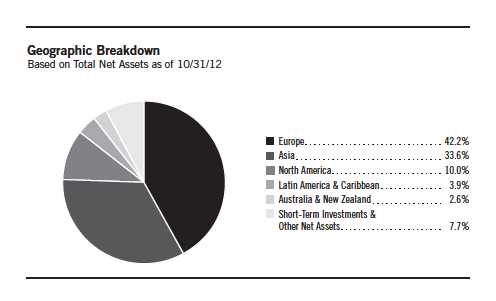
This annual report for Templeton Foreign Smaller Companies Fund covers the fiscal year ended October 31, 2012.
Performance Overview
For the 12 months under review, Templeton Foreign Smaller Companies Fund –Class A posted a +4.67% cumulative total return. The Fund underperformed the +5.02% total return of its benchmark, the MSCI All Country World Index (ACWI) ex USA Small Cap Index, which measures performance of international small capitalization stocks in developed and emerging markets, excluding the U.S.1 Please note index performance information is provided for reference
1. Source: © 2012 Morningstar. All Rights Reserved. The information contained herein: (1) is proprietary to Morningstar and/or its content providers; (2) may not be copied or distributed; and (3) is not warranted to be accurate, complete or timely. Neither Morningstar nor its content providers are responsible for any damages or losses arising from any use of this information. The index is unmanaged and includes reinvested dividends. One cannot invest directly in an index, and an index is not representative of the Fund’s portfolio.
The dollar value, number of shares or principal amount, and names of all portfolio holdings are listed in the Fund’s Statement of Investments (SOI). The SOI begins on page 20.
Annual Report | 3

and we do not attempt to track an index but rather undertake investments on the basis of fundamental research. You can find the Fund’s long-term performance data in the Performance Summary beginning on page 9.
Economic and Market Overview
The global economy slowed during the 12 months under review, but emerging market economies generally continued to grow faster than their developed market counterparts. Nonetheless, economic reports from the largest economies proved inconsistent with some dire predictions of a severe global economic slowdown. Fears of European sovereign debt default and China’s potential “hard landing” dominated financial headlines in the first half of the period, contributing to heightened market volatility that led global stocks to a 2012 low in early June. Despite ongoing uncertainty, eurozone leaders made meaningful progress and began to implement policy solutions aimed at correcting structural issues. Globally, central bankers continued to pursue historically accommodative monetary policies. Among developed markets, the Bank of Japan and U.S. Federal Reserve Board (Fed) maintained their respective policy rates, while the European Central Bank (ECB) implemented a series of rate reductions.
In addition to rate adjustments, many central bankers employed a variety of policy tools. The Fed increased the average maturity of its Treasury holdings and in September announced plans to increase mortgage-backed securities holdings in a third round of quantitative easing. In September, the ECB announced its Outright Monetary Transactions program, which was designed to allow the central bank to purchase government bonds on the secondary market with the aim of easing borrowing pressures in the eurozone. The Bank of England and Bank of Japan expanded their respective asset purchase programs. Among emerging market countries, Brazil, China and India announced fiscal and monetary easing measures to support economic growth. Brazil unveiled a 133 billion real (approximately $66 billion) stimulus package in August. In addition to adopting a monetary easing policy and reducing the reserve requirement ratio, China launched a 1 trillion yuan (approximately $158 billion) stimulus package in September. The Indian government announced a series of reforms in September to boost investment and stimulate economic growth.
4 | Annual Report
Global markets reached a period high in mid-September as investors became optimistic that monetary easing policies and fiscal stimulus measures would boost economic growth. However, momentum faltered toward period-end amid renewed investor concerns about economic growth, triggered by manufacturing weakness in some parts of Asia and Europe. Further weighing on investor sentiment was the U.S. “fiscal cliff,” when spending cuts and tax increases will take effect in January 2013 unless the U.S. Congress acts, which could threaten the fragile global economic health. Although global economic indicators remained generally weak throughout the period, U.S. data offered some relief, with increased consumer spending and notable improvements in housing and labor markets helping to offset slower manufacturing growth. Additionally, manufacturing in Canada and several emerging market countries, particularly Mexico, Russia and India, improved near period-end. In this environment, commodities and the euro declined for the period, while U.S. Treasuries and the U.S. dollar gained. Global developed and emerging market stocks, as represented by the MSCI ACWI, generated healthy returns for the 12 months ended October 31, 2012.
Investment Strategy
We take a bottom-up, value-oriented, long-term approach to investing. We focus our analysis on the market price of a company’s securities relative to our evaluation of the company’s long-term earnings, asset value and cash flow potential. We also consider a company’s price/earnings ratio, profit margins and liquidation value. We are patient investors and may hold a security for several years as we wait for the market to recognize a company’s true worth.
Manager’s Discussion
Several holdings performed well during the year under review and contributed to Fund performance. Hong Kong-based Techtronic Industries is a leading manufacturer of power tools and floor care appliances marketed under the Ryobi, Milwaukee, Homelite, AEG, Hoover, Dirt Devil and VAX brands. In the first half of its 2012 fiscal year, the company reported record sales and double-digit year-over-year growth in net profit and free cash flow. Strong organic growth in the power equipment division and margin improvement enabled Techtronic to simultaneously increase its dividend and decrease leverage. In our view, the company’s recent shift toward a strategy of organic growth should support expanded margins as acquisition-related restructuring charges decline.
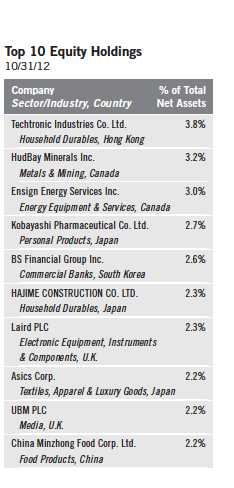
Annual Report | 5
U.K.-based Laird, a leading supplier of solutions for electronic devices needing antennae or shielding from electromagnetic interference and heat, also posted strong returns during the period. The company has a strong balance sheet and has taken meaningful measures, such as the announced sale of its handset antennae business, to protect margins. The company also took steps to widen its technical and customer base and appeared well positioned to benefit from growing demand for tablets and smartphones, which, in our view, should contribute to improved performance. In fiscal year 2011, the company reported growth in its operating profit, suggesting its restructuring efforts have gained traction.
Shares of Persimmon, a leading U.K. homebuilder, rallied as fundamentals improved and cash generation continued to be strong. In 2011, the company reported a 55% year-over-year increase in pre-tax profit on improving margins, allowing management to raise the annual dividend. Through the first half of 2012, pre-tax profits were up 65% year-over-year as margins remained strong and revenues grew. In our view, earnings should continue to improve as Persimmon works through its land bank and operations return to levels in line with historical trends. In July, British officials announced a program aimed at improving mortgage availability. The potential expansion of the pool of eligible buyers could be a major boost for U.K. construction companies.
During the 12 months under review, some Fund investments declined in value, detracting from performance. Canaccord Financial is an independent, full-service Canadian financial services firm focused on the wealth management and global capital markets businesses. In fiscal year 2012, Canaccord shares lost value as the company reported significant acquisition-related and restructuring charges arising from the purchase of a British financial advisory group amid concerns about the climate for global investment banking. To its credit, Canaccord used the recent market downturn to build out its geographic presence through acquisitions. In addition to expanding its European operations with the acquisition, Canaccord bolstered its Asia-Pacific presence with the acquisition of a 50% stake in an Australian boutique equities firm. The expansion of its investment banking capabilities should, in our view, enhance Canaccord’s ability to leverage its existing infrastructure and capture additional revenues.
6 | Annual Report
Kloeckner & Co. is a Germany-based multi-metal distributor operating in the European and North American markets. The company’s shares declined following the announcement of larger-than-expected losses through the first nine months of 2012 arising from weak European steel demand and declining prices. In the longer term, however, we view Kloeckner to be a leading company in its industry with what we believe to be sustainable competitive advantages, a track record of value-enhancing acquisitions and the potential for strong earnings growth given even modest assumptions of future growth in steel demand.
HudBay Minerals is an integrated Canadian zinc, copper and precious metals mining firm with assets in North and Central America. Although the company recently posted losses and underperformed, we believe HudBay’s stock offered an attractive risk-to-reward profile at recent prices and we added to our position during the 12 months under review. In our view, downside risk was limited by a high net cash position, which could potentially rise. We also believe increases in metals prices and announced acquisitions could potentially lead to a rise in production, reserves, net asset value and earnings.
It is important to recognize the effect of currency movements on the Fund’s performance. In general, if the value of the U.S. dollar goes up compared with a foreign currency, an investment traded in that foreign currency will go down in value because it will be worth fewer U.S. dollars. This can have a negative effect on Fund performance. Conversely, when the U.S. dollar weakens in relation to a foreign currency, an investment traded in that foreign currency will increase in value, which can contribute to Fund performance. For the 12 months ended October 31, 2012, the U.S. dollar increased in value relative to most major currencies. As a result, the Fund’s performance was negatively affected by the portfolio’s predominant investment in securities with non-U.S. currency exposure.
Annual Report | 7
Thank you for your continued participation in Templeton Foreign Smaller Companies Fund. We look forward to serving your future investment needs.

CFA® is a trademark owned by CFA Institute.
The foregoing information reflects our analysis, opinions and portfolio holdings as of October 31, 2012, the end of the reporting period. The way we implement our main investment strategies and the resulting portfolio holdings may change depending on factors such as market and economic conditions. These opinions may not be relied upon as investment advice or an offer for a particular security. The information is not a complete analysis of every aspect of any market, country, industry, security or the Fund. Statements of fact are from sources considered reliable, but the investment manager makes no representation or warranty as to their completeness or accuracy. Although historical performance is no guarantee of future results, these insights may help you understand our investment management philosophy.
8 | Annual Report
Performance Summary as of 10/31/12
Your dividend income will vary depending on dividends or interest paid by securities in the Fund’s portfolio, adjusted for operating expenses of each class. Capital gain distributions are net profits realized from the sale of portfolio securities. The performance table and graphs do not reflect any taxes that a shareholder would pay on Fund dividends, capital gain distributions, if any, or any realized gains on the sale of Fund shares. Total return reflects reinvestment of the Fund’s dividends and capital gain distributions, if any, and any unrealized gains or losses.
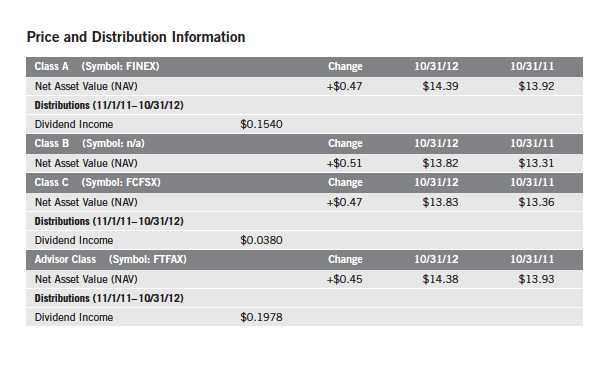
Annual Report | 9
Performance Summary (continued)
Performance
Cumulative total return excludes sales charges. Average annual total returns and value of $10,000 investment include maximum sales charges. Class A: 5.75% maximum initial sales charge; Class B: contingent deferred sales charge (CDSC) declining from 4% to 1% over six years, and eliminated thereafter; Class C: 1% CDSC in first year only; Advisor Class: no sales charges.

Performance data represent past performance, which does not guarantee future results. Investment return and principal value will fluctuate, and you may have a gain or loss when you sell your shares. Current performance may differ from figures shown. For most recent month-end performance, go to franklintempleton.com or call (800) 342-5236.
10 | Annual Report
Performance Summary (continued)
Total Return Index Comparison for a Hypothetical $10,000 Investment
Total return represents the change in value of an investment over the periods shown. It includes any current, applicable, maximum sales charge, Fund expenses, account fees and reinvested distributions. The unmanaged index includes reinvestment of any income or distributions. It differs from the Fund in composition and does not pay management fees or expenses. One cannot invest directly in an index.

Annual Report | 11
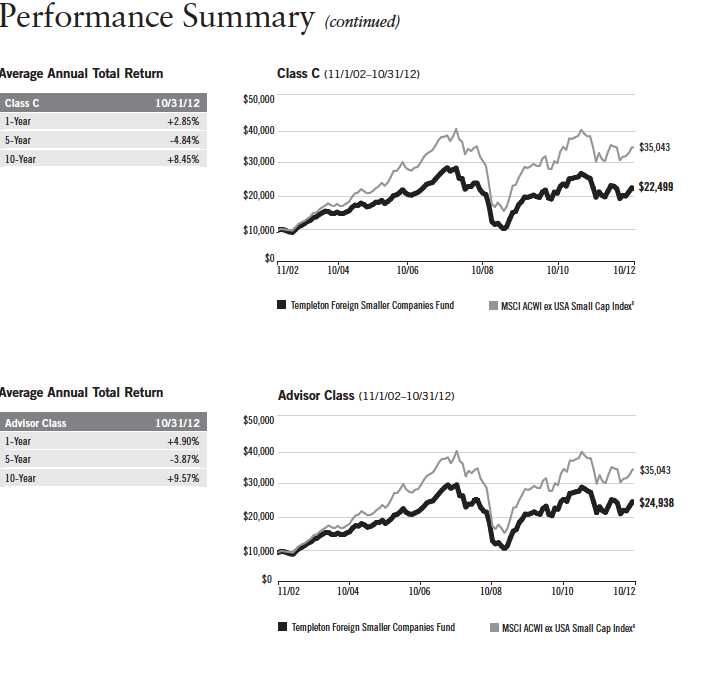

12 | Annual Report
Performance Summary (continued)
Endnotes
All investments involve risks, including possible loss of principal. Special risks are associated with foreign investing, including currency fluctuations, economic instability and political developments. Investments in emerging markets involve heightened risks related to the same factors, in addition to those associated with these markets’ smaller size and lesser liquidity. In addition, smaller company stocks have historically exhibited greater price volatility than large company stocks, particularly over the short term. The Fund is actively managed but there is no guarantee that the manager’s investment decisions will produce the desired results. The Fund’s prospectus also includes a description of the main investment risks.
| |
Class B: Class C: | These shares have higher annual fees and expenses than Class A shares. Prior to 1/1/04, these shares were offered with an initial sales charge; thus actual total returns would have differed. These shares have higher annual fees and expenses than Class A shares. |
Advisor Class: | Shares are available to certain eligible investors as described in the prospectus. |
1. Cumulative total return represents the change in value of an investment over the periods indicated.
2. Average annual total return represents the average annual change in value of an investment over the periods indicated. 3. These figures represent the value of a hypothetical $10,000 investment in the Fund over the periods indicated.
4. In accordance with SEC rules, we provide standardized average annual total return information through the latest calendar quarter.
5. Figures are as stated in the Fund’s prospectus current as of the date of this report. In periods of market volatility, assets may decline significantly, causing total annual Fund operating expenses to become higher than the figures shown.
6. Source: © 2012 Morningstar. The MSCI ACWI ex USA Small Cap Index is a free float-adjusted, market capitalization weighted index designed to measure the performance of small cap equity securities of global developed and emerging markets, excluding the U.S.
Annual Report | 13
Your Fund’s Expenses
As a Fund shareholder, you can incur two types of costs:
- Transaction costs, including sales charges (loads) on Fund purchases; and
- Ongoing Fund costs, including management fees, distribution and service (12b-1) fees, and other Fund expenses. All mutual funds have ongoing costs, sometimes referred to as operating expenses.
The following table shows ongoing costs of investing in the Fund and can help you understand these costs and compare them with those of other mutual funds. The table assumes a $1,000 investment held for the six months indicated.
Actual Fund Expenses
The first line (Actual) for each share class listed in the table provides actual account values and expenses. The “Ending Account Value” is derived from the Fund’s actual return, which includes the effect of Fund expenses.
You can estimate the expenses you paid during the period by following these steps. Of course, your account value and expenses will differ from those in this illustration:
| 1. | Divide your account value by $1,000. |
| | If an account had an $8,600 value, then $8,600 ÷ $1,000 = 8.6. |
| 2. | Multiply the result by the number under the heading “Expenses Paid During Period.” |
| | If Expenses Paid During Period were $7.50, then 8.6 x $7.50 = $64.50. |
In this illustration, the estimated expenses paid this period are $64.50.
Hypothetical Example for Comparison with Other Funds
Information in the second line (Hypothetical) for each class in the table can help you compare ongoing costs of investing in the Fund with those of other mutual funds. This information may not be used to estimate the actual ending account balance or expenses you paid during the period. The hypothetical “Ending Account Value” is based on the actual expense ratio for each class and an assumed 5% annual rate of return before expenses, which does not represent the Fund’s actual return. The figure under the heading “Expenses Paid During Period” shows the hypothetical expenses your account would have incurred under this scenario. You can compare this figure with the 5% hypothetical examples that appear in shareholder reports of other funds.
14 | Annual Report
Your Fund’s Expenses (continued)
Please note that expenses shown in the table are meant to highlight ongoing costs and do not reflect any transaction costs, such as sales charges. Therefore, the second line for each class is useful in comparing ongoing costs only, and will not help you compare total costs of owning different funds. In addition, if transaction costs were included, your total costs would have been higher. Please refer to the Fund prospectus for additional information on operating expenses.
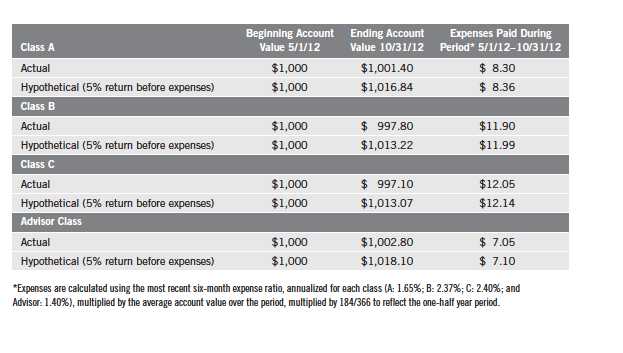
Annual Report | 15
Franklin Templeton International Trust
Financial Highlights

16 | The accompanying notes are an integral part of these financial statements. | Annual Report
Franklin Templeton International Trust
Financial Highlights (continued)
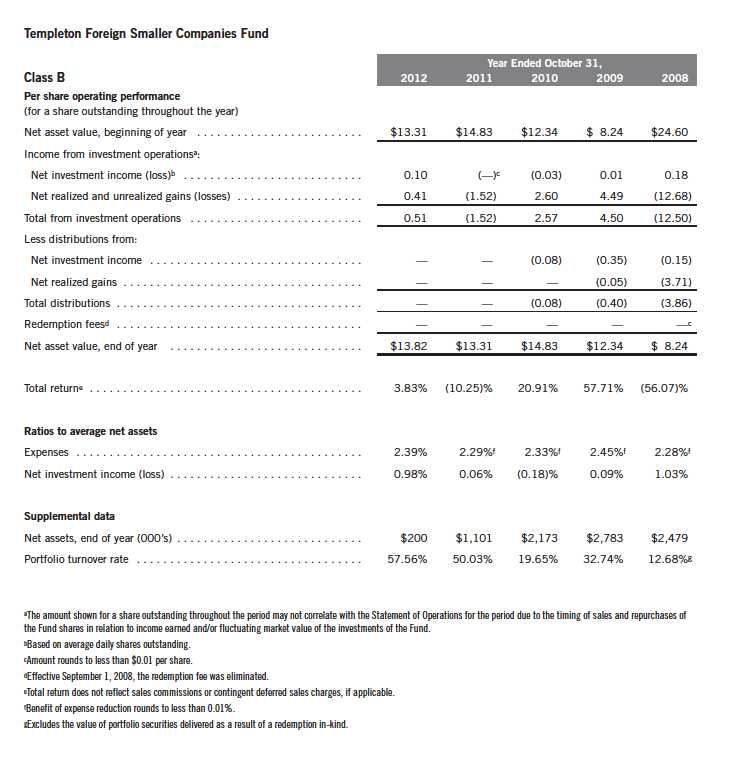
Annual Report | The accompanying notes are an integral part of these financial statements. | 17
Franklin Templeton International Trust
Financial Highlights (continued)

18 | The accompanying notes are an integral part of these financial statements. | Annual Report
Franklin Templeton International Trust
Financial Highlights (continued)

Annual Report | The accompanying notes are an integral part of these financial statements. | 19
Franklin Templeton International Trust
Statement of Investments, October 31, 2012

Franklin Templeton International Trust
Statement of Investments, October 31, 2012 (continued)

Annual Report | 21
Franklin Templeton International Trust
Statement of Investments, October 31, 2012 (continued)

Franklin Templeton International Trust
Financial Statements

Annual Report | The accompanying notes are an integral part of these financial statements. | 23
Franklin Templeton International Trust
Financial Statements (continued)
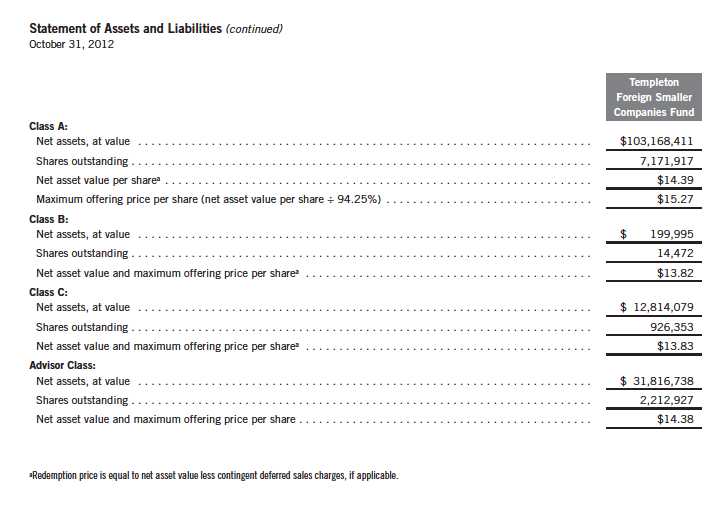
24 | The accompanying notes are an integral part of these financial statements. | Annual Report
Franklin Templeton International Trust
Financial Statements (continued)

Annual Report | The accompanying notes are an integral part of these financial statements. | 25
Franklin Templeton International Trust
Financial Statements (continued)
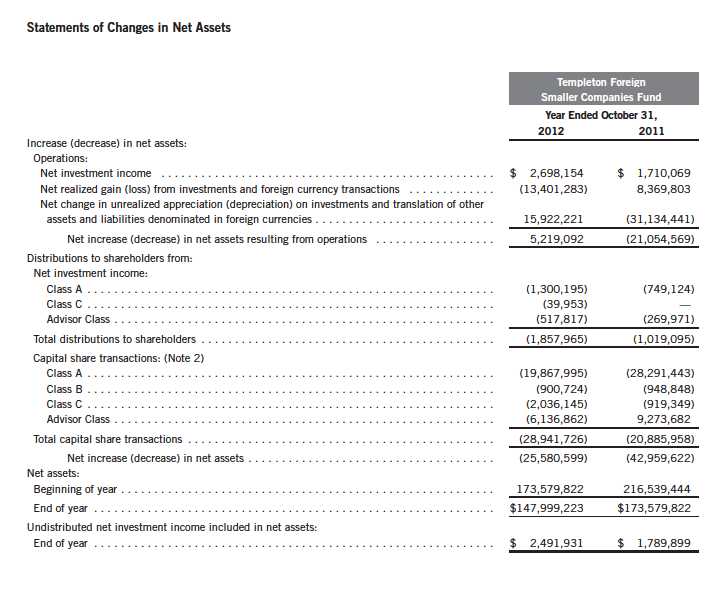
26 | The accompanying notes are an integral part of these financial statements. | Annual Report
Franklin Templeton International Trust
Notes to Financial Statements
Templeton Foreign Smaller Companies Fund
1. ORGANIZATION AND SIGNIFICANT ACCOUNTING POLICIES
Franklin Templeton International Trust (Trust) is registered under the Investment Company Act of 1940, as amended, (1940 Act) as an open-end investment company, consisting of four separate funds. The Templeton Foreign Smaller Companies Fund (Fund) is included in this report. The financial statements of the remaining funds in the Trust are presented separately. The Fund offers four classes of shares: Class A, Class B, Class C, and Advisor Class. Effective March 1, 2005, the Fund no longer offered Class B shares for purchase. As disclosed in the applicable prospectus Class B shares convert to Class A shares after eight years of investment, therefore all Class B shares will convert to Class A by March 2013. Each class of shares differs by its initial sales load, contingent deferred sales charges, distribution fees, voting rights on matters affecting a single class and its exchange privilege.
The following summarizes the Fund’s significant accounting policies.
a. Financial Instrument Valuation
The Fund’s investments in financial instruments are carried at fair value daily. Fair value is the price that would be received to sell an asset or paid to transfer a liability in an orderly transaction between market participants on the measurement date. Under procedures approved by the Trust’s Board of Trustees (the Board), the Fund’s administrator, investment manager and other affiliates have formed the Valuation and Liquidity Oversight Committee (VLOC). The VLOC provides administration and oversight of the Fund’s valuation policies and procedures, which are approved annually by the Board. Among other things, these procedures allow the Fund to utilize independent pricing services, quotations from securities and financial instrument dealers, and other market sources to determine fair value.
Equity securities listed on an exchange or on the NASDAQ National Market System are valued at the last quoted sale price or the official closing price of the day, respectively. Foreign equity securities are valued as of the close of trading on the foreign stock exchange on which the security is primarily traded, or the NYSE, whichever is earlier. The value is then converted into its U.S. dollar equivalent at the foreign exchange rate in effect at the close of the NYSE on the day that the value of the security is determined. Over-the-counter (OTC) securities are valued within the range of the most recent quoted bid and ask prices. Securities that trade in multiple markets or on multiple exchanges are valued according to the broadest and most representative market. Certain equity securities are valued based upon fundamental characteristics or relationships to similar securities. Investments in non-registered money market funds are valued at the closing net asset value.
The Fund has procedures to determine the fair value of financial instruments for which market prices are not reliable or readily available. Under these procedures, the VLOC convenes on a regular basis to review such financial instruments and considers a number of factors, including
Annual Report | 27
Franklin Templeton International Trust
Notes to Financial Statements (continued)
Templeton Foreign Smaller Companies Fund
| 1. | ORGANIZATION AND SIGNIFICANT ACCOUNTING POLICIES (continued) |
| a. | Financial Instrument Valuation (continued) |
significant unobservable valuation inputs, when arriving at fair value. The VLOC primarily employs a market-based approach which may use related or comparable assets or liabilities, recent transactions, market multiples, book values, and other relevant information for the investment to determine the fair value of the investment. An income-based valuation approach may also be used in which the anticipated future cash flows of the investment are discounted to calculate fair value. Discounts may also be applied due to the nature or duration of any restrictions on the disposition of the investments. Due to the inherent uncertainty of valuations of such investments, the fair values may differ significantly from the values that would have been used had an active market existed. The VLOC employs various methods for calibrating these valuation approaches including a regular review of key inputs and assumptions, transactional back-testing or disposition analysis, and reviews of any related market activity.
Trading in securities on foreign securities stock exchanges and OTC markets may be completed before the daily close of business on the NYSE. Occasionally, events occur between the time at which trading in a foreign security is completed and the close of the NYSE that might call into question the reliability of the value of a portfolio security held by the Fund. As a result, differences may arise between the value of the Fund’s portfolio securities as determined at the foreign market close and the latest indications of value at the close of the NYSE. In order to minimize the potential for these differences, the VLOC monitors price movements following the close of trading in foreign stock markets through a series of country specific market proxies (such as baskets of American Depositary Receipts, futures contracts and exchange traded funds). These price movements are measured against established trigger thresholds for each specific market proxy to assist in determining if an event has occurred that may call into question the reliability of the values of the foreign securities held by the Fund. If such an event occurs, the securities may be valued using fair value procedures, which may include the use of independent pricing services.
b. Foreign Currency Translation
Portfolio securities and other assets and liabilities denominated in foreign currencies are translated into U.S. dollars based on the exchange rate of such currencies against U.S. dollars on the date of valuation. The Fund may enter into foreign currency exchange contracts to facilitate transactions denominated in a foreign currency. Purchases and sales of securities, income and expense items denominated in foreign currencies are translated into U.S. dollars at the exchange rate in effect on the transaction date. Portfolio securities and assets and liabilities denominated in foreign currencies contain risks that those currencies will decline in value relative to the U.S. dollar. Occasionally, events may impact the availability or reliability of foreign exchange rates used to convert the U.S. dollar equivalent value. If such an event occurs, the foreign exchange rate will be valued at fair value using procedures established and approved by the Board.
28 | Annual Report
Franklin Templeton International Trust
Notes to Financial Statements (continued)
Templeton Foreign Smaller Companies Fund
| 1. | ORGANIZATION AND SIGNIFICANT ACCOUNTING POLICIES (continued) |
| b. | Foreign Currency Translation (continued) |
The Fund does not separately report the effect of changes in foreign exchange rates from changes in market prices on securities held. Such changes are included in net realized and unrealized gain or loss from investments on the Statement of Operations.
Realized foreign exchange gains or losses arise from sales of foreign currencies, currency gains or losses realized between the trade and settlement dates on securities transactions and the difference between the recorded amounts of dividends, interest, and foreign withholding taxes and the U.S. dollar equivalent of the amounts actually received or paid. Net unrealized foreign exchange gains and losses arise from changes in foreign exchange rates on foreign denominated assets and liabilities other than investments in securities held at the end of the reporting period.
c. Securities Purchased on a Delayed Delivery Basis
The Fund purchases securities on a delayed delivery basis, with payment and delivery scheduled for a future date. These transactions are subject to market fluctuations and are subject to the risk that the value at delivery may be more or less than the trade date purchase price. Although the Fund will generally purchase these securities with the intention of holding the securities, it may sell the securities before the settlement date. Sufficient assets have been segregated for these securities.
d. Securities Lending
The Fund participates in an agency based securities lending program. The Fund receives cash collateral against the loaned securities in an amount equal to at least 102% of the market value of the loaned securities. Collateral is maintained over the life of the loan in an amount not less than 100% of the market value of loaned securities, as determined at the close of fund business each day; any additional collateral required due to changes in security values is delivered to the Fund on the next business day. The collateral is invested in a non-registered money fund as indicated on the Statement of Investments. The Fund receives income from the investment of cash collateral, in addition to lending fees and rebates paid by the borrower. The Fund bears the market risk with respect to the collateral investment, securities loaned, and the risk that the agent may default on its obligations to the Fund. The securities lending agent has agreed to indemnify the Fund in the event of default by a third party borrower.
e. Income and Deferred Taxes
It is the Fund’s policy to qualify as a regulated investment company under the Internal Revenue Code. The Fund intends to distribute to shareholders substantially all of its taxable income and net realized gains to relieve it from federal income and excise taxes. As a result, no provision for U.S. federal income taxes is required.
Annual Report | 29
Franklin Templeton International Trust
Notes to Financial Statements (continued)
Templeton Foreign Smaller Companies Fund
| 1. | ORGANIZATION AND SIGNIFICANT ACCOUNTING POLICIES (continued) |
| e. | Income and Deferred Taxes (continued) |
The Fund may be subject to foreign taxation related to income received, capital gains on the sale of securities and certain foreign currency transactions in the foreign jurisdictions in which it invests. Foreign taxes, if any, are recorded based on the tax regulations and rates that exist in the foreign markets in which the Fund invests. When a capital gain tax is determined to apply the Fund records an estimated deferred tax liability in an amount that would be payable if the securities were disposed of on the valuation date.
The Fund recognizes the tax benefits of uncertain tax positions only when the position is “more likely than not” to be sustained upon examination by the tax authorities based on the technical merits of the tax position. As of October 31, 2012, and for all open tax years, the Fund has determined that no liability for unrecognized tax benefits is required in the Fund’s financial statements related to uncertain tax positions taken on a tax return (or expected to be taken on future tax returns). Open tax years are those that remain subject to examination and are based on each tax jurisdiction statute of limitation.
f. Security Transactions, Investment Income, Expenses and Distributions
Security transactions are accounted for on trade date. Realized gains and losses on security transactions are determined on a specific identification basis. Interest income and estimated expenses are accrued daily. Amortization of premium and accretion of discount on debt securities are included in interest income. Dividend income is recorded on the ex-dividend date except that certain dividends from foreign securities are recognized as soon as the Fund is notified of the ex-dividend date. Distributions to shareholders are recorded on the ex-dividend date and are determined according to income tax regulations (tax basis). Distributable earnings determined on a tax basis may differ from earnings recorded in accordance with accounting principles generally accepted in the United States of America. These differences may be permanent or temporary. Permanent differences are reclassified among capital accounts to reflect their tax character. These reclassifications have no impact on net assets or the results of operations. Temporary differences are not reclassified, as they may reverse in subsequent periods.
Common expenses incurred by the Trust are allocated among the funds based on the ratio of net assets of each fund to the combined net assets of the Trust. Fund specific expenses are charged directly to the fund that incurred the expense.
Realized and unrealized gains and losses and net investment income, not including class specific expenses, are allocated daily to each class of shares based upon the relative proportion of net assets of each class. Differences in per share distributions, by class, are generally due to differences in class specific expenses.
30 | Annual Report
Franklin Templeton International Trust
Notes to Financial Statements (continued)
Templeton Foreign Smaller Companies Fund
| 1. | ORGANIZATION AND SIGNIFICANT ACCOUNTING POLICIES (continued) |
| g. | Accounting Estimates |
The preparation of financial statements in accordance with accounting principles generally accepted in the United States of America requires management to make estimates and assumptions that affect the reported amounts of assets and liabilities at the date of the financial statements and the amounts of income and expenses during the reporting period. Actual results could differ from those estimates.
h. Guarantees and Indemnifications
Under the Trust’s organizational documents, its officers and trustees are indemnified by the Trust against certain liabilities arising out of the performance of their duties to the Trust. Additionally, in the normal course of business, the Trust, on behalf of the Fund, enters into contracts with service providers that contain general indemnification clauses. The Trust’s maximum exposure under these arrangements is unknown as this would involve future claims that may be made against the Trust that have not yet occurred. Currently, the Trust expects the risk of loss to be remote.
2. SHARES OF BENEFICIAL INTEREST
At October 31, 2012, there were an unlimited number of shares authorized (without par value).
Transactions in the Fund’s shares were as follows:
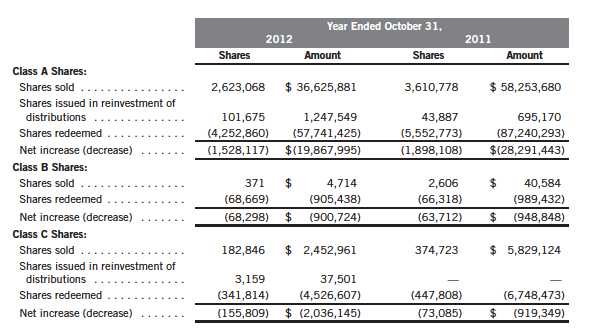
Annual Report | 31
Franklin Templeton International Trust
Notes to Financial Statements (continued)

3. TRANSACTIONS WITH AFFILIATES
Franklin Resources, Inc. is the holding company for various subsidiaries that together are referred to as Franklin Templeton Investments. Certain officers and trustees of the Trust are also officers and/or directors of the following subsidiaries:
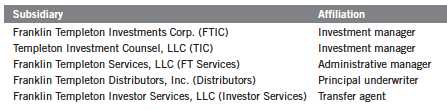
a. Management Fees
The Fund pays an investment management fee to FTIC based on the average daily net assets of the Fund as follows:

Under a subadvisory agreement, TIC, an affiliate of FTIC, provides subadvisory services to the Fund. The subadvisory fee is paid by FTIC based on the average daily net assets, and is not an additional expense of the Fund.
b. Administrative Fees
Under an agreement with FTIC, FT Services provides administrative services to the Fund. The fee is paid by FTIC based on average daily net assets, and is not an additional expense of the Fund.
32 | Annual Report
Franklin Templeton International Trust
Notes to Financial Statements (continued)
Templeton Foreign Smaller Companies Fund
| 3. | TRANSACTIONS WITH AFFILIATES (continued) |
| c. | Distribution Fees |
The Board has adopted distribution plans for each share class, with the exception of Advisor Class, pursuant to Rule 12b-1 under the 1940 Act. Distribution fees are not charged on shares held by affiliates. Under the Fund’s Class A reimbursement distribution plan, the Fund reimburses Distributors for costs incurred in connection with the servicing, sale and distribution of the Fund’s shares up to the maximum annual plan rate. Under the Class A reimbursement distribution plan, costs exceeding the maximum for the current plan year cannot be reimbursed in subsequent periods. In addition, under the Fund’s Class B and C compensation distribution plans, the Fund pays Distributors for costs incurred in connection with the servicing, sale and distribution of the Fund’s shares up to the maximum annual plan rate for each class.
The maximum annual plan rates, based on the average daily net assets, for each class, are as follows:

d. Sales Charges/Underwriting Agreements
Front-end sales charges and contingent deferred sales charges (CDSC) do not represent expenses of the Fund. These charges are deducted from the proceeds of sales of Fund shares prior to investment or from redemption proceeds prior to remittance, as applicable. Distributors has advised the Fund of the following commission transactions related to the sales and redemptions of the Fund’s shares for the year:

e. Transfer Agent Fees
For the year ended October 31, 2012, the Fund paid transfer agent fees of $424,383, of which $196,959 was retained by Investor Services.
4. EXPENSE OFFSET ARRANGEMENT
The Fund has entered into an arrangement with its custodian whereby credits realized as a result of uninvested cash balances are used to reduce a portion of the Fund’s custodian expenses. During the year ended October 31, 2012, there were no credits earned.
Annual Report | 33
Franklin Templeton International Trust
Notes to Financial Statements (continued)
Templeton Foreign Smaller Companies Fund
5. INCOME TAXES
For tax purposes, capital losses may be carried over to offset future capital gains, if any. Under the Regulated Investment Company Modernization Act of 2010, capital losses incurred by the Fund in taxable years beginning after December 22, 2010 are not subject to expiration and such losses retain their character as either short-term or long-term, rather than being considered short-term as under previous law. Post-enactment capital losses must be fully utilized prior to utilizing any losses incurred in pre-enactment tax years.
At October 31, 2012, capital loss carryforwards were as follows:
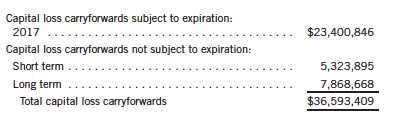
The tax character of distributions paid during the years ended October 31, 2012 and 2011, was as follows:
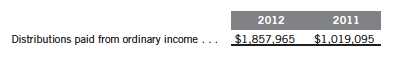
At October 31, 2012, the cost of investments, net unrealized appreciation (depreciation), undistributed ordinary income and undistributed long term capital gains for income tax purposes were as follows:
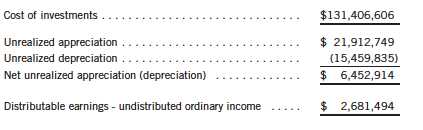
Differences between income and/or capital gains as determined on a book basis and a tax basis are primarily due to differing treatments of passive foreign investment company shares and wash sales.
6. INVESTMENT TRANSACTIONS
Purchases and sales of investments (excluding short term securities) for the year ended October 31, 2012, aggregated $87,223,901 and $115,913,386, respectively.
34 | Annual Report
Franklin Templeton International Trust
Notes to Financial Statements (continued)
Templeton Foreign Smaller Companies Fund
7. CONCENTRATION OF RISK
Investing in foreign securities may include certain risks and considerations not typically associated with investing in U.S. securities, such as fluctuating currency values and changing local and regional economic, political and social conditions, which may result in greater market volatility. In addition, certain foreign securities may not be as liquid as U.S. securities.
8. CREDIT FACILITY
The Fund, together with other U.S. registered and foreign investment funds (collectively, Borrowers), managed by Franklin Templeton Investments, are borrowers in a joint syndicated senior unsecured credit facility totaling $1.5 billion (Global Credit Facility) which matures on January 18, 2013. This Global Credit Facility provides a source of funds to the Borrowers for temporary and emergency purposes, including the ability to meet future unanticipated or unusually large redemption requests.
Under the terms of the Global Credit Facility, the Fund shall, in addition to interest charged on any borrowings made by the Fund and other costs incurred by the Fund, pay its share of fees and expenses incurred in connection with the implementation and maintenance of the Global Credit Facility, based upon its relative share of the aggregate net assets of all of the Borrowers, including an annual commitment fee of 0.08% based upon the unused portion of the Global Credit Facility, which is reflected in other expenses on the Statement of Operations. During the year ended October 31, 2012, the Fund did not use the Global Credit Facility.
9. FAIR VALUE MEASUREMENTS
The Fund follows a fair value hierarchy that distinguishes between market data obtained from independent sources (observable inputs) and the Fund’s own market assumptions (unobservable inputs). These inputs are used in determining the value of the Fund’s financial instruments and are summarized in the following fair value hierarchy:
- Level 1 – quoted prices in active markets for identical financial instruments
- Level 2 – other significant observable inputs (including quoted prices for similar financial instruments, interest rates, prepayment speed, credit risk, etc.)
- Level 3 – significant unobservable inputs (including the Fund’s own assumptions in deter- mining the fair value of financial instruments)
The inputs or methodology used for valuing financial instruments are not an indication of the risk associated with investing in those financial instruments.
Annual Report | 35
Franklin Templeton International Trust
Notes to Financial Statements (continued)
Templeton Foreign Smaller Companies Fund
9. FAIR VALUE MEASUREMENTS (continued)
For movements between the levels within the fair value hierarchy, the Fund has adopted a policy of recognizing the transfers as of the date of the underlying event which caused the movement.
A summary of inputs used as of October 31, 2012, in valuing the Fund’s assets carried at fair value, is as follows:
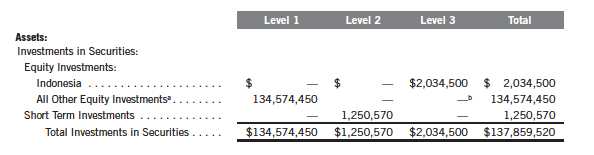
aFor detailed categories, see the accompanying Statement of Investments.
bIncludes securities determined to have no value at October 31, 2012.
A reconciliation of assets in which Level 3 inputs are used in determining fair value is presented when there are significant Level 3 investments at the end of the period. At October 31, 2012, the reconciliation of assets is as follows:
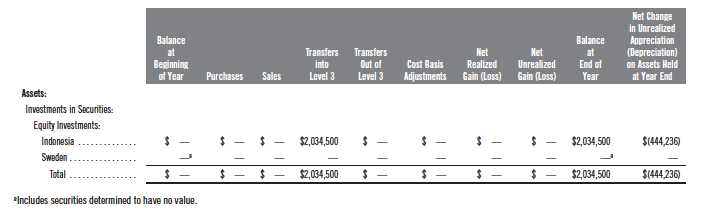
During the year ended October 31, 2012, the Fund recorded significant transfers of assets between Level 1 and Level 3 within the fair value hierarchy due to a trade halt.
36 | Annual Report
Franklin Templeton International Trust
Notes to Financial Statements (continued)
Templeton Foreign Smaller Companies Fund
9. FAIR VALUE MEASUREMENTS (continued)
Significant valuation inputs developed by the VLOC for material Level 3 investments as of October 31, 2012, are as follows:
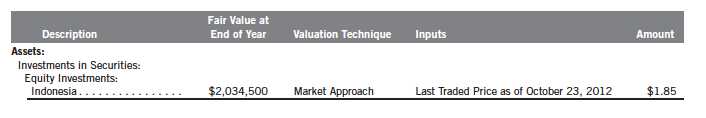
A significant and reasonable adjustment to the last trade price would result in a significant change to the fair value measurement, which may materially impact the net assets of the Fund.
10. NEW ACCOUNTING PRONOUNCEMENTS
In December 2011, the Financial Accounting Standards Board issued Accounting Standards Update (ASU) No. 2011-11, Balance Sheet (Topic 210): Disclosures about Offsetting Assets and Liabilities. The amendments in the ASU enhance disclosures about offsetting of financial assets and liabilities to enable investors to understand the effect of these arrangements on a fund’s financial position. The ASU is effective for interim and annual reporting periods beginning on or after January 1, 2013. The Fund believes the adoption of this ASU will not have a material impact on its financial statements.
11. SUBSEQUENT EVENTS
The Fund has evaluated subsequent events through the issuance of the financial statements and determined that no events have occurred that require disclosure.
ABBREVIATIONS
Selected Portfolio
SDR - Swedish Depositary Receipt
Annual Report | 37
Franklin Templeton International Trust
Report of Independent Registered Public Accounting Firm
To the Board of Trustees and Shareholders of Templeton Foreign Smaller Companies Fund
In our opinion, the accompanying statement of assets and liabilities, including the statement of investments, and the related statements of operations and of changes in net assets and the financial highlights present fairly, in all material respects, the financial position of Templeton Foreign Smaller Companies Fund (one of the funds constituting the Franklin Templeton International Trust, hereafter referred to as the “Fund”) at October 31, 2012, the results of its operations for the year then ended, the changes in its net assets for each of the two years in the period then ended and the financial highlights for each of the five years in the period then ended, in conformity with accounting principles generally accepted in the United States of America. These financial statements and financial highlights (hereafter referred to as “financial statements”) are the responsibility of the Fund’s management. Our responsibility is to express an opinion on these financial statements based on our audits. We conducted our audits of these financial statements in accordance with the standards of the Public Company Accounting Oversight Board (United States). Those standards require that we plan and perform the audit to obtain reasonable assurance about whether the financial statements are free of material misstatement. An audit includes examining, on a test basis, evidence supporting the amounts and disclosures in the financial statements, assessing the accounting principles used and significant estimates made by management, and evaluating the overall financial statement presentation.
We believe that our audits, which included confirmation of securities at October 31, 2012 by correspondence with the custodian and brokers, provide a reasonable basis for our opinion.
PricewaterhouseCoopers LLP
San Francisco, California
December 17, 2012
38 | Annual Report
Franklin Templeton International Trust
Tax Information (unaudited)
Templeton Foreign Smaller Companies Fund
Under Section 854(b)(1)(B) of the Internal Revenue Code (Code), the Fund hereby reports the maximum amount allowable but no less than $3,114,269 as qualified dividends for purposes of the maximum rate under Section 1(h)(11) of the Code for the fiscal year ended October 31, 2012. Distributions, including qualified dividend income, paid during calendar year 2012 will be reported to shareholders on Form 1099-DIV by mid-February 2013. Shareholders are advised to check with their tax advisors for information on the treatment of these amounts on their individual income tax returns.
At October 31, 2011, more than 50% of the Fund’s total assets were invested in securities of foreign issuers. In most instances, foreign taxes were withheld from income paid to the Fund on these investments. As shown in the table below, the Fund hereby reports to shareholders the foreign source income and foreign taxes paid, pursuant to Section 853 of the Code. This written statement will allow shareholders of record on December 14, 2011, to treat their proportionate share of foreign taxes paid by the Fund as having been paid directly by them. The shareholder shall consider these amounts as foreign taxes paid in the tax year in which they receive the Fund distribution.
The following table provides a detailed analysis of foreign tax paid, foreign source income, and foreign qualified dividends as reported by the Fund, to Class A, Class B, Class C, and Advisor Class shareholders of record.
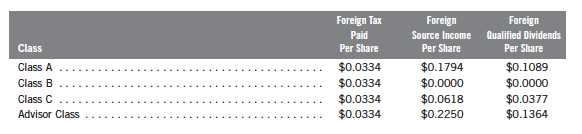
Foreign Tax Paid Per Share (Column 1) is the amount per share available to you, as a tax credit (assuming you held your shares in the Fund for a minimum of 16 days during the 31-day period beginning 15 days before the ex-dividend date of the Fund’s distribution to which the foreign taxes relate), or, as a tax deduction.
Foreign Source Income Per Share (Column 2) is the amount per share of income dividends attributable to foreign securities held by the Fund, plus any foreign taxes withheld on these dividends. The amounts reported include foreign source qualified dividends that have not been adjusted for the rate differential applicable to such dividend income.1
Foreign Qualified Dividends Per Share (Column 3) is the amount per share of foreign source qualified dividends, plus any foreign taxes withheld on these dividends. These amounts represent the portion of the Foreign Source Income reported to you in column 2 that were derived from qualified foreign securities held by the Fund.1
Annual Report | 39
Franklin Templeton International Trust
Tax Information (unaudited) (continued)
Templeton Foreign Smaller Companies Fund
By mid-February 2012, shareholders received Form 1099-DIV which included their share of taxes paid and foreign source income distributed during the calendar year 2011. The Foreign Source Income reported on Form 1099-DIV has not been adjusted for the rate differential on foreign source qualified dividend income. Shareholders are advised to check with their tax advisors for information on the treatment of these amounts on their 2011 individual income tax returns.
1Qualified dividends are taxed at reduced long term capital gains tax rates. In determining the amount of foreign tax credit that may be applied against the U.S. tax liability of individuals receiving foreign source qualified dividends, adjustments may be required to the foreign tax credit limitation calculation to reflect the rate differential applicable to such dividend income. The rules however permit certain individuals to elect not to apply the rate differential adjustments for capital gains and/or dividends for any taxable year. Please consult your tax advisor and the instructions to Form 1116 for more information.
40 | Annual Report
Franklin Templeton International Trust
Board Members and Officers
The name, year of birth and address of the officers and board members, as well as their affiliations, positions held with the Trust, principal occupations during at least the past five years and number of portfolios overseen in the Franklin Templeton Investments fund complex are shown below. Generally, each board member serves until that person’s successor is elected and qualified.

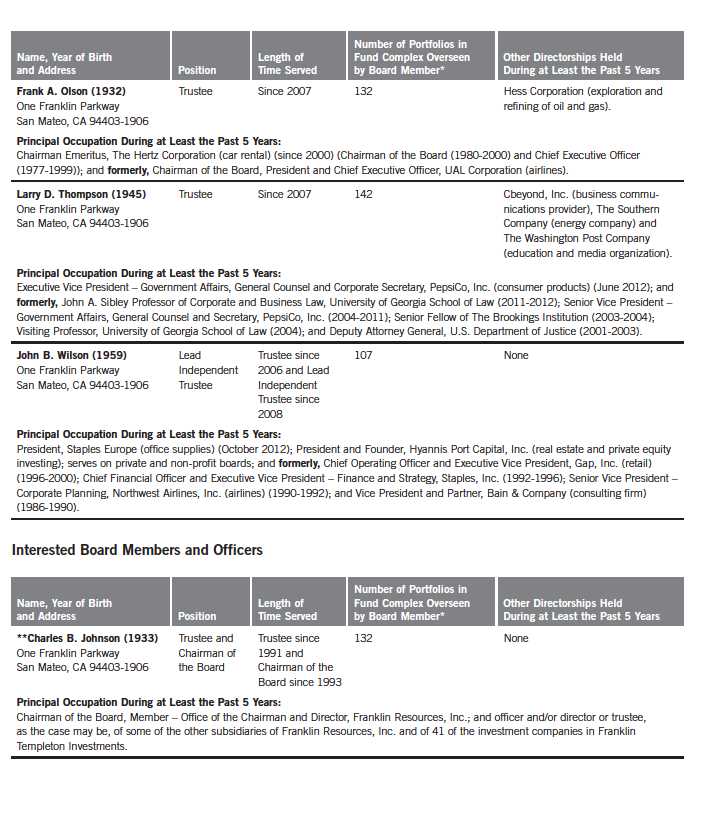
42 | Annual Report
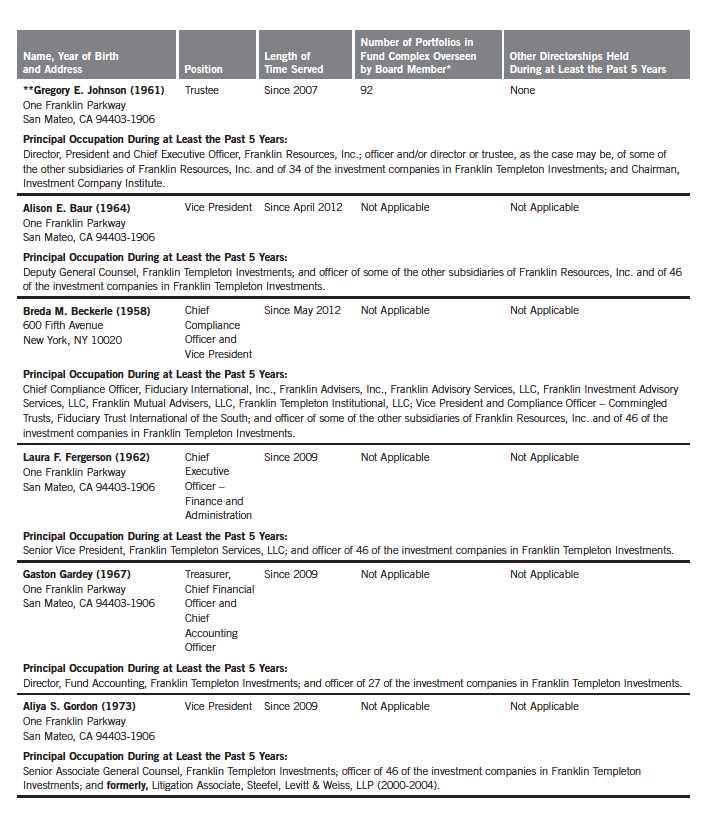
Annual Report | 43

44 | Annual Report
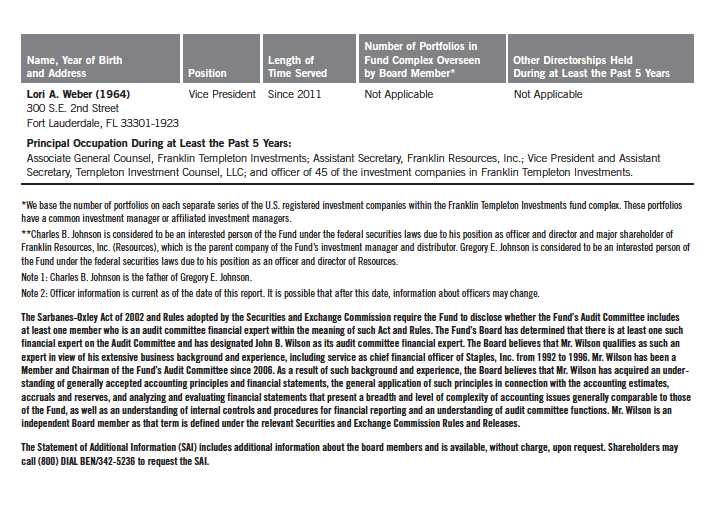
Annual Report | 45
Franklin Templeton International Trust
Shareholder Information
Templeton Foreign Smaller Companies Fund
Proxy Voting Policies and Procedures
The Fund’s investment manager has established Proxy Voting Policies and Procedures (Policies) that the Fund uses to determine how to vote proxies relating to portfolio securities. Shareholders may view the Fund’s complete Policies online at franklintempleton.com. Alternatively, shareholders may request copies of the Policies free of charge by calling the Proxy Group collect at (954) 527-7678 or by sending a written request to: Franklin Templeton Companies, LLC, 300 S.E. 2nd Street, Fort Lauderdale, FL 33301, Attention: Proxy Group. Copies of the Fund’s proxy voting records are also made available online at franklintempleton.com and posted on the U.S. Securities and Exchange Commission’s website at sec.gov and reflect the most recent 12-month period ended June 30.
Quarterly Statement of Investments
The Fund files a complete statement of investments with the U.S. Securities and Exchange Commission for the first and third quarters for each fiscal year on Form N-Q. Shareholders may view the filed Form N-Q by visiting the Commission’s website at sec.gov. The filed form may also be viewed and copied at the Commission’s Public Reference Room in Washington, DC. Information regarding the operations of the Public Reference Room may be obtained by calling (800) SEC-0330.
Householding of Reports and Prospectuses
You will receive the Fund’s financial reports every six months as well as an annual updated summary prospectus (prospectus available upon request). To reduce Fund expenses, we try to identify related shareholders in a household and send only one copy of the financial reports and summary prospectus. This process, called “householding,” will continue indefinitely unless you instruct us otherwise. If you prefer not to have these documents householded, please call us at (800) 632-2301. At any time you may view current prospectuses/summary prospectuses and financial reports on our website. If you choose, you may receive these documents through electronic delivery.
46 | Annual Report
This page intentionally left blank.
This page intentionally left blank.
Item 2. Code of Ethics.
(a) The Registrant has adopted a code of ethics that applies to its principal executive officers and principal financial and accounting officer.
(c) N/A
(d) N/A
(f) Pursuant to Item 12(a)(1), the Registrant is attaching as an exhibit a copy of its code of ethics that applies to its principal executive officers and principal financial and accounting officer.
Item 3. Audit Committee Financial Expert.
(a)(1) The Registrant has an audit committee financial expert serving on its audit committee.
(2) The audit committee financial expert is John B. Wilson and he is "independent" as defined under the relevant Securities and Exchange Commission Rules and Releases.
Item 4. Principal Accountant Fees and Services.
(a) Audit Fees
The aggregate fees paid to the principal accountant for professional services rendered by the principal accountant for the audit of the registrant’s annual financial statements or for services that are normally provided by the principal accountant in connection with statutory and regulatory filings or engagements were $137,592 for the fiscal year ended October 31, 2012 and $140,360 for the fiscal year ended October 31, 2011.
(b) Audit-Related Fees
There were no fees paid to the principal accountant for assurance and related services rendered by the principal accountant to the registrant that are reasonably related to the performance of the audit of the registrant's financial statements and are not reported under paragraph (a) of Item 4.
There were no fees paid to the principal accountant for assurance and related services rendered by the principal accountant to the registrant's investment adviser and any entity controlling, controlled by or under common control with the investment adviser that provides ongoing services to the registrant that are reasonably related to the performance of the audit of their financial statements.
(c) Tax Fees
The aggregate fees paid to the principal accountant for professional services rendered by the principal accountant to the registrant for tax compliance, tax advice and tax planning were $1,377 the fiscal year ended October 31, 2012 and $0 for the fiscal year ended October 31,
2011. The services for which these fees were paid included preparation of tax returns for foreign governments.
The aggregate fees paid to the principal accountant for professional services rendered by the principal accountant to the registrant’s investment adviser and any entity controlling, controlled by or under common control with the investment adviser that provides ongoing services to the registrant for tax compliance, tax advice and tax planning were $29,600 for the fiscal year ended October 31, 2012 and $75,000 for the fiscal year ended October 31, 2011. The services for which these fees were paid included technical tax consultation for capital gain tax reporting to foreign governments, application of local country tax laws to investments and licensing securities with local country offices.
(d) All Other Fees
The aggregate fees paid to the principal accountant for products and services rendered by the principal accountant to the registrant not reported in paragraphs (a)-(c) of Item 4 were $97 for the fiscal year ended October 31, 2012 and $0 for the fiscal year ended October 31, 2011. The services for which these fees were paid include review of materials provided to the fund Board in connection with the investment management contract renewal process.
The aggregate fees paid to the principal accountant for products and services rendered by the principal accountant to the registrant’s investment adviser and any entity controlling, controlled by or under common control with the investment adviser that provides ongoing services to the registrant not reported in paragraphs (a)-(c) of Item 4 were $163,864 for the fiscal year ended October 31, 2012 and $0 for the fiscal year ended October 31, 2011. The services for which these fees were paid include review of materials provided to the fund Board in connection with the investment management contract renewal process.
(e) (1) The registrant’s audit committee is directly responsible for approving the services to be provided by the auditors, including:
(i) pre-approval of all audit and audit related services;
(ii) pre-approval of all non-audit related services to be provided to the Fund by the auditors;
(iii) pre-approval of all non-audit related services to be provided to the registrant by the auditors to the registrant’s investment adviser or to any entity that controls, is controlled by or is under common control with the registrant’s investment adviser and that provides ongoing services to the registrant where the non-audit services relate directly to the operations or financial reporting of the registrant; and
(iv) establishment by the audit committee, if deemed necessary or appropriate, as an alternative to committee pre-approval of services to be provided by the auditors, as required by paragraphs (ii) and (iii) above, of policies and procedures to permit such services to be pre-approved by other means, such as through establishment of guidelines or by action of a designated member or members of the committee; provided the policies and procedures are detailed as to the
particular service and the committee is informed of each service and such policies and procedures do not include delegation of audit committee responsibilities, as contemplated under the Securities Exchange Act of 1934, to management; subject, in the case of (ii) through (iv), to any waivers, exceptions or exemptions that may be available under applicable law or rules.
(e) (2) None of the services provided to the registrant described in paragraphs (b)-(d) of Item 4 were approved by the audit committee pursuant to paragraph (c)(7)(i)(C) of Rule 2-01 of regulation S-X.
(f) No disclosures are required by this Item 4(f).
(g) The aggregate non-audit fees paid to the principal accountant for services rendered by the principal accountant to the registrant and the registrant’s investment adviser and any entity controlling, controlled by or under common control with the investment adviser that provides ongoing services to the registrant were $194,938 for the fiscal year ended October 31, 2012 and $75,000 for the fiscal year ended October 31, 2011.
(h) The registrant’s audit committee of the board has considered whether the provision of non-audit services that were rendered to the registrant’s investment adviser (not including any sub-adviser whose role is primarily portfolio management and is subcontracted with or overseen by another investment adviser), and any entity controlling, controlled by, or under common control with the investment adviser that provides ongoing services to the registrant that were not pre-approved pursuant to paragraph (c)(7)(ii) of Rule 2-01 of Regulation S-X is compatible with maintaining the principal accountant’s independence.
Item 5. Audit Committee of Listed Registrants. N/A
Item 6. Schedule of Investments. N/A
Item 7. Disclosure of Proxy Voting Policies and Procedures for Closed-End Management Investment Companies. N/A
Item 8. Portfolio Managers of Closed-End Management Investment Companies. N/A
Item 9. Purchases of Equity Securities by Closed-End Management Investment Company and Affiliated Purchasers. N/A
Item 10. Submission of Matters to a Vote of Security Holders.
There have been no changes to the procedures by which shareholders may recommend nominees to the Registrant's Board of Trustees that would require disclosure herein.
Item 11. Controls and Procedures.
(a) Evaluation of Disclosure Controls and Procedures. The Registrant maintains disclosure controls and procedures that are designed to ensure that information required to be disclosed in the Registrant’s filings under the Securities Exchange Act of 1934 and the Investment Company Act of 1940 is recorded, processed, summarized and reported within the periods specified in the rules and forms of the Securities and Exchange Commission. Such information is accumulated and communicated to the Registrant’s management, including its principal executive officer and principal financial officer, as appropriate, to allow timely decisions regarding required disclosure. The Registrant’s management, including the principal executive officer and the principal financial officer, recognizes that any set of controls and procedures, no matter how well designed and operated, can provide only reasonable assurance of achieving the desired control objectives.
Within 90 days prior to the filing date of this Shareholder Report on Form N-CSR, the Registrant had carried out an evaluation, under the supervision and with the participation of the Registrant’s management, including the Registrant’s principal executive officer and the Registrant’s principal financial officer, of the effectiveness of the design and operation of the Registrant’s disclosure controls and procedures. Based on such evaluation, the Registrant’s principal executive officer and principal financial officer concluded that the Registrant’s disclosure controls and procedures are effective.
(b) Changes in Internal Controls. There have been no changes in the Registrant’s internal controls or in other factors that could materially affect the internal controls over financial reporting subsequent to the date of their evaluation in connection with the preparation of this Shareholder Report on Form N-CSR.
Item 12. Exhibits.
(a) (1) Code of Ethics
(a) (2) Certifications pursuant to Section 302 of the Sarbanes-Oxley Act of 2002 of Laura F. Fergerson, Chief Executive Officer - Finance and Administration, and Gaston Gardey, Chief Financial Officer and Chief Accounting Officer
(b) Certifications pursuant to Section 906 of the Sarbanes-Oxley Act of 2002 of Laura F. Fergerson, Chief Executive Officer - Finance and Administration, and Gaston Gardey, Chief Financial Officer and Chief Accounting Officer
SIGNATURES
Pursuant to the requirements of the Securities Exchange Act of 1934 and the Investment Company Act of 1940, the registrant has duly caused this report to be signed on its behalf by the undersigned, thereunto duly authorized.
FRANKLIN TEMPLETON INTERNATIONAL TRUST
By /s/LAURA F. FERGERSON
Laura F. Fergerson
Chief Executive Officer - Finance and Administration
Date December 26, 2012
Pursuant to the requirements of the Securities Exchange Act of 1934 and
the Investment Company Act of 1940, this report has been signed below
by the following persons on behalf of the registrant and in the
capacities and on the dates indicated.
By /s/LAURA F. FERGERSON
Laura F. Fergerson
Chief Executive Officer - Finance and Administration
Date December 26, 2012
By /s/GASTON GARDEY
Gaston Gardey
Chief Financial Officer and Chief Accounting Officer
Date December 26, 2012