UNITED STATES
SECURITIES AND EXCHANGE COMMISSION
Washington, D.C. 20549 |
|
FORM N-CSR |
|
CERTIFIED SHAREHOLDER REPORT OF REGISTERED MANAGEMENT INVESTMENT COMPANIES |
|
Investment Company Act file number_811-06336 |
|
__Franklin Templeton International Trust
(Exact name of registrant as specified in charter) |
|
One Franklin Parkway, San Mateo, CA 94403-1906
(Address of principal executive offices) (Zip code) |
|
Craig S. Tyle, One Franklin Parkway, San Mateo, CA 94403-1906
(Name and address of agent for service) |
|
Registrant's telephone number, including area code: _650 312-2000 |
|
Date of fiscal year end: 10/31 |
|
Date of reporting period: _10/31/13 |
|
Item 1. Reports to Stockholders. |

| 1
Annual Report
Franklin India Growth Fund
Your Fund’s Goal and Main Investments: Franklin India Growth Fund seeks long-term capital appreciation by investing under normal market conditions at least 80% of its net assets in securities of “Indian companies,” which are defined as those organized under the laws of, with a principal office in, or for which the principal trading market for their securities is in India, that derive 50% or more of total revenue or profit from goods or services produced or sales made in India, or that have 50% or more of their assets in India.1
Performance data represent
past performance, which does
not guarantee future results.
Investment return and principal
value will fluctuate, and you may
have a gain or loss when you sell
your shares. Current performance
may differ from figures shown.
Please visit franklintempleton.com
or call (800) 342-5236 for most
recent month-end performance.
This annual report for Franklin India Growth Fund covers the fiscal year ended October 31, 2013.
Performance Overview
Franklin India Growth Fund – Class A had a -2.06% cumulative total return for the 12 months ended October 31, 2013. In comparison, the MSCI India Index posted a +0.65% total return.2 You can find more of the Fund’s performance data in the Performance Summary beginning on page 7.
Economic and Market Overview
During the period under review, India’s economic growth, as measured by gross domestic product (GDP), continued to moderate as a combination of cyclical and policy issues weighed on investment spending, and consumer spending decreased in the wake of sustained high inflation. Real GDP grew 4.4% year-over-year in the second quarter of 2013, compared to 4.8% for the first quarter.3 For the fiscal year ended March 31, 2013, real GDP grew an estimated 5.0%, compared to 6.2% in the previous fiscal year.3 In recent months, exports recovered strongly and good monsoons improved prospects for a rise in farm production. Even as growth moderated, inflation levels remained
1. The Fund currently invests indirectly in Indian companies through FT (Mauritius) Offshore Investments Limited, a wholly owned, collective investment vehicle registered in the Republic of Mauritius.
2. Source: © 2013 Morningstar. All Rights Reserved. The information contained herein: (1) is proprietary to Morningstar and/or its content providers; (2) may not be copied or distributed; and (3) is not warranted to be accurate, complete or timely. Neither Morningstar nor its content providers are responsible for any damages or losses arising from any use of this information. The index is unmanaged and includes reinvested dividends. One cannot invest directly in an index, and an index is not representative of the Fund’s portfolio.
3. Source: Central Statistical Organization.
The dollar value, number of shares or principal amount, and names of all portfolio holdings are listed in the Fund’s Statement of Investments (SOI). The SOI begins on page 18.
Annual Report | 3
What is a current account?
A current account is that part of the balance of payments where all of one country’s international transactions in goods and services are recorded.
What is balance of payments?
Balance of payments is a record of all of a country’s exports and imports of goods and services, borrowing and lending with the rest of the world during a particular time period. It helps a country evaluate its competitive strengths and weaknesses and forecast the strength of its currency.
elevated, especially for consumers who struggled with higher food prices and the pass-through effects of currency depreciation on imports as the rupee fell 12.46% against the U.S. dollar.4
India’s central bank, the Reserve Bank of India (RBI), implemented a range of measures in an effort to curb rupee volatility and contain the current account deficit. These included tightening rupee liquidity, raising short-term borrowing costs, setting up currency swap facilities and increasing import costs for gold. The combination of domestic policy support and a return of global risk appetite helped the rupee rebound somewhat. Toward the end of the period, the RBI gradually unwound most of the extraordinary measures it had taken to help boost the currency. The RBI, however, remained cautious about inflation and instituted two 25-basis-point (100 basis points equal one percentage point) increases to its benchmark repo rate after having previously cut rates.
The policy environment was broadly supportive of economic growth and development. During the period, the government approved reforms aimed at simplification of India’s foreign investment regime, fiscal consolidation and the repeal of archaic land acquisition laws, among others. The government also sought to expedite approvals for high value infrastructure projects in its effort to bolster investment spending and strengthen business confidence.
Significant divergence in global equity market performance characterized the period under review. Generally, while equity markets in developed economies climbed higher, emerging market equities lost ground based on concerns about a protracted economic slowdown and potential reduction in global liquidity if the U.S. Federal Reserve Board were to begin withdrawing stimulus. Indian equities were also subject to heightened volatility and made little gain over the 12-month period.
Investment Strategy
We are research-driven, fundamental investors pursuing a growth strategy. As bottom-up investors focusing primarily on individual securities, we seek to invest in companies whose current market price, in our opinion, does not reflect future growth prospects. We look for companies that have identifiable drivers of future earnings growth and that present, in our opinion, the best trade-off between potential earnings growth, business and financial risk, and valuation. Our philosophy includes favoring companies that have competitive advantages through leading-edge products, intellectual property, product positioning, unique market niches, brand identity, solid management teams, strong
4. Source: IDC/Exshare.
4 | Annual Report
balance sheets, above-average or rising margins, and strong returns on capital invested in the business. In choosing equity investments, we also consider such factors as the company’s financial strength, management’s expertise, the company’s growth potential within the industry, and the industry’s growth potential.
Manager’s Discussion
During the 12 months under review, a key contributor to the Fund’s absolute performance was Bharti Airtel, one of India’s leading telecommunications companies. Improved earnings growth trends and positive regulatory news-flow contributed to the stock’s strong gain. The company also raised equity from Qatar Foundation Endowment and used the funds to reduce debt. In our view, the Indian telecommunication services sector is on the cusp of consolidation as small, unprofitable companies exit and large, well-established firms such as Bharti Airtel continue to acquire market share.
Other significant contributors to the Fund’s absolute performance were information technology (IT) consulting services providers Infosys and Cognizant Technology Solutions (CTS). In general, currency depreciation and an improved outlook for demand bolstered IT stocks. In our view, Infosys and CTS are well positioned to capitalize on the longer term trend of developed world corporations increasingly outsourcing work to Indian IT consulting firms.
In contrast, key detractors from the Fund’s absolute performance included Gujarat Mineral Development Corporation (GMDC), one of India’s largest lignite producers, Cadila Healthcare, a pharmaceutical company, and Cummins India, the local arm of U.S. engine manufacturer Cummins. GMDC stock declined as investors remained cautious about the outlook for the Indian economy and particularly, the investment cycle. Lower volume growth also weighed on the company’s earnings in the past few quarters. Given its strong operational base and pricing power, the company, in our view, may be poised to benefit from structural growth in demand for resources as India expands.
Slower-than-expected earnings growth led to stock price declines for Cadila Healthcare and Cummins India. In our view, both companies represent quality franchises and at period-end we remained positive about their long-term growth potential.
It is important to recognize the effect of currency movements on the Fund’s performance. In general, if the value of the U.S. dollar goes up compared with a foreign currency, an investment traded in that foreign currency will go down in value because it will be worth fewer U.S. dollars. This can have a negative
Annual Report | 5
| | |
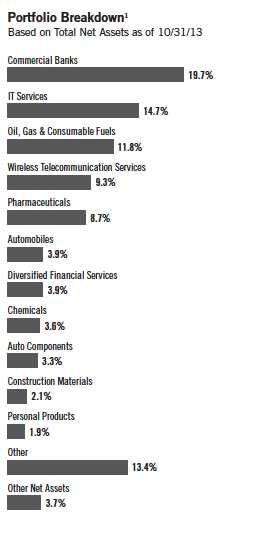
| Top 10 Equity Holdings1 | | |
| 10/31/13 | | |
| |
| Company | % of Total | |
| Sector/Industry | Net Assets | |
| Bharti Airtel Ltd. | 7.9 | % |
| Wireless Telecommunication Services | |
| HDFC Bank Ltd. | 6.6 | % |
| Commercial Banks | | |
| Infosys Ltd. | 6.5 | % |
| IT Services | | |
| ICICI Bank Ltd. | 6.3 | % |
| Commercial Banks | | |
| Reliance Industries Ltd. | 5.5 | % |
| Oil, Gas & Consumable Fuels | | |
| Dr. Reddy’s Laboratories Ltd. | 3.5 | % |
| Pharmaceuticals | | |
| Oil & Natural Gas Corp. Ltd. | 3.0 | % |
| Oil, Gas & Consumable Fuels | | |
| IndusInd Bank Ltd. | 2.9 | % |
| Commercial Banks | | |
| Asian Paints Ltd. | 2.5 | % |
| Chemicals | | |
| Yes Bank Ltd. | 2.4 | % |
| Commercial Banks | | |
effect on Fund performance. Conversely, when the U.S. dollar weakens in relation to a foreign currency, an investment traded in that foreign currency will increase in value, which can contribute to Fund performance. For the 12 months ended October 31, 2013, the U.S. dollar rose in value relative to the Indian rupee. As a result, the Fund’s performance was negatively affected by the portfolio’s investment predominantly in securities denominated in the Indian rupee.
Thank you for your continued participation in Franklin India Growth Fund.
We look forward to serving your future investment needs.


Stephen H. Dover, CFA

Purav A. Jhaveri, CFA, FRM
Portfolio Management Team
Franklin India Growth Fund
CFA® is a trademark owned by CFA Institute.
The foregoing information reflects our analysis, opinions and portfolio holdings as of October 31, 2013, the end of the reporting period. The way we implement our main investment strategies and the resulting portfolio holdings may change depending on factors such as market and economic conditions. These opinions may not be relied upon as investment advice or an offer for a particular security. The information is not a complete analysis of every aspect of any market, country, industry, security or the Fund. Statements of fact are from sources considered reliable, but the investment manager makes no representation or warranty as to their completeness or accuracy. Although historical performance is no guarantee of future results, these insights may help you understand our investment management philosophy.
6 | Annual Report
Performance Summary as of 10/31/13
Your dividend income will vary depending on dividends or interest paid by securities in the Fund’s portfolio, adjusted for operating expenses of each class. Capital gain distributions are net profits realized from the sale of portfolio securities. The performance table and graphs do not reflect any taxes that a shareholder would pay on Fund dividends, capital gain distributions, if any, or any realized gains on the sale of Fund shares. Total return reflects reinvestment of the Fund’s dividends and capital gain distributions, if any, and any unrealized gains or losses.
| | | | | | |
| Price Information | | | | | | |
| Class A (Symbol: FINGX) | | Change | | 10/31/13 | | 10/31/12 |
| Net Asset Value (NAV) | -$ | 0.18 | $ | 8.55 | $ | 8.73 |
| Class C (Symbol: FINDX) | | Change | | 10/31/13 | | 10/31/12 |
| Net Asset Value (NAV) | -$ | 0.23 | $ | 8.22 | $ | 8.45 |
| Class R6 (Symbol: n/a) | | Change | | 10/31/13 | | 5/1/13 |
| Net Asset Value (NAV) | -$ | 0.67 | $ | 8.68 | $ | 9.35 |
| Advisor Class (Symbol: FIGZX) | | Change | | 10/31/13 | | 10/31/12 |
| Net Asset Value (NAV) | -$ | 0.15 | $ | 8.68 | $ | 8.83 |
Annual Report | 7
Performance Summary (continued)
Performance1
Cumulative total return excludes sales charges. Aggregate and average annual total returns and value of $10,000 investment include maximum sales charges. Class A: 5.75% maximum initial sales charge; Class C: 1% contingent deferred sales charge in first year only; Class R6/Advisor Class: no sales charges.
| | | | | | | | | |
| Class A | | 1-Year | | | 5-Year | | | Inception (1/31/08) | |
| Cumulative Total Return2 | | -2.06 | % | + | 79.27 | % | | -10.72 | % |
| Average Annual Total Return3 | | -7.69 | % | + | 11.08 | % | | -2.96 | % |
| Value of $10,000 Investment4 | $ | 9,231 | | $ | 16,909 | | $ | 8,414 | |
| Avg. Ann. Total Return (9/30/13)5 | | -18.80 | % | + | 2.92 | % | | -4.61 | % |
| Total Annual Operating Expenses6 | | 1.68% (with waiver) | | | | | | 2.21% (without waiver) | |
| Class C | | 1-Year | | | 5-Year | | | Inception (1/31/08) | |
| Cumulative Total Return2 | | -2.72 | % | + | 72.92 | % | | -14.23 | % |
| Average Annual Total Return3 | | -3.72 | % | + | 11.58 | % | | -2.63 | % |
| Value of $10,000 Investment4 | $ | 9,628 | | $ | 17,292 | | $ | 8,577 | |
| Avg. Ann. Total Return (9/30/13)5 | | -15.24 | % | + | 3.40 | % | | -4.29 | % |
| Total Annual Operating Expenses6 | | 2.40% (with waiver) | | | | | | 2.93% (without waiver) | |
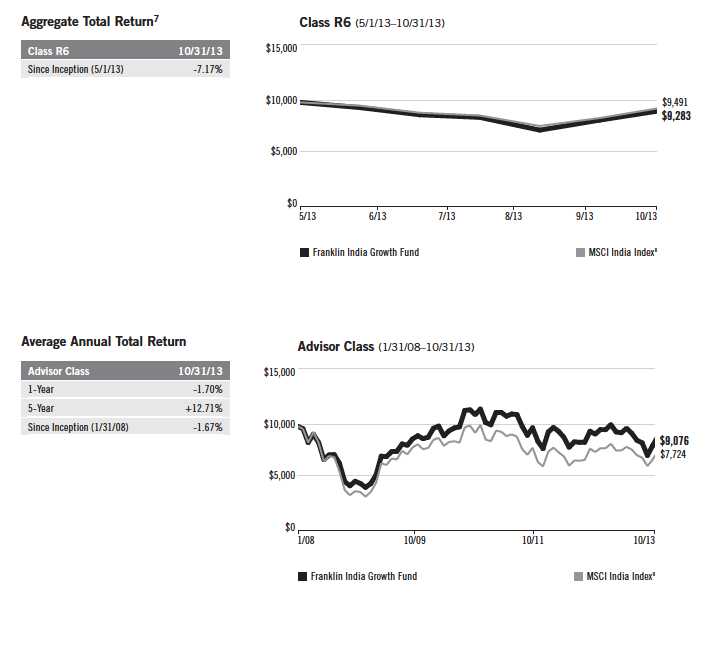
| Class R6 | | | | | | | | Inception (5/1/13) | |
| Cumulative Total Return2 | | | | | | | | -7.17 | % |
| Aggregate Annual Total Return7 | | | | | | | | -7.17 | % |
| Value of $10,000 Investment4 | | | | | | | $ | 9,283 | |
| Aggregate Total Return (9/30/13)5,7 | | | | | | | | -16.04 | % |
| Total Annual Operating Expenses6 | | 1.21% (with waiver) | | | | | | 1.74% (without waiver) | |
| Advisor Class | | 1-Year | | | 5-Year | | | Inception (1/31/08) | |
| Cumulative Total Return2 | | -1.70 | % | + | 81.88 | % | | -9.24 | % |
| Average Annual Total Return3 | | -1.70 | % | + | 12.71 | % | | -1.67 | % |
| Value of $10,000 Investment4 | $ | 9,830 | | $ | 18,188 | | $ | 9,076 | |
| Avg. Ann. Total Return (9/30/13)5 | | -13.66 | % | + | 4.42 | % | | -3.35 | % |
| Total Annual Operating Expenses6 | | 1.40% (with waiver) | | | | | | 1.93% (without waiver) | |
Performance data represent past performance, which does not guarantee future results. Investment return and principal value will fluctuate, and you may have a gain or loss when you sell your shares. Current performance may differ from figures shown. For most recent month-end performance, go to franklintempleton.com or call (800) 342-5236.
8 | Annual Report
Performance Summary (continued)
Total Return Index Comparison for a Hypothetical $10,000 Investment1
Total return represents the change in value of an investment over the periods shown. It includes any applicable maximum sales charge, Fund expenses, account fees and reinvested distributions. The unmanaged index includes reinvestment of any income or distributions. It differs from the Fund in composition and does not pay management fees or expenses. One cannot invest directly in an index.

Annual Report | 9
Performance Summary (continued)
10 | Annual Report
Performance Summary (continued)
Endnotes
All investments involve risks, including possible loss of principal. Special risks are associated with foreign investing, including currency fluctuations, economic instability and political developments. Investments in developing markets involve heightened risks related to the same factors, in addition to risks associated with these companies’ smaller size, lesser liquidity and the potential lack of established legal, political, business and social frameworks to support securities markets in the countries in which they operate. The Fund may also experience greater volatility than a fund that is more broadly diversified geographically. The Fund is designed for the aggressive portion of a well-diversified portfolio. The Fund is actively managed but there is no guarantee that the manager’s investment decisions will produce the desired results. The Fund’s prospectus also includes a description of the main investment risks.
| |
Class C: Class R6: Advisor Class: | These shares have higher annual fees and expenses than Class A shares. Shares are available to certain eligible investors as described in the prospectus. Shares are available to certain eligible investors as described in the prospectus. |
1. The Fund has an expense reduction contractually guaranteed through at least 2/28/14 and a fee waiver associated with its investments in a Franklin Templeton money fund, contractually guaranteed through at least its current fiscal year end. Fund investment results reflect the expense reduction and fee waiver, to the extent applicable; without these reductions, the results would have been lower.
2. Cumulative total return represents the change in value of an investment over the periods indicated.
3. Average annual total return represents the average annual change in value of an investment over the periods indicated. 4. These figures represent the value of a hypothetical $10,000 investment in the Fund over the periods indicated.
5. In accordance with SEC rules, we provide standardized average annual total return information through the latest calendar quarter.
6. Figures are as stated in the Fund’s current prospectus. In periods of market volatility, assets may decline significantly, causing total annual Fund operating expenses to become higher than the figures shown.
7. Aggregate total return represents the change in value of an investment for the period indicated. Since Class R6 shares have existed for less than one year, average annual total return is not available.
8. Source: © 2013 Morningstar. The MSCI India Index is a free float-adjusted, market capitalization-weighted index designed to measure equity market performance in India.
Annual Report | 11
Your Fund’s Expenses
As a Fund shareholder, you can incur two types of costs:
- Transaction costs, including sales charges (loads) on Fund purchases; and
- Ongoing Fund costs, including management fees, distribution and service (12b-1) fees, and other Fund expenses. All mutual funds have ongoing costs, sometimes referred to as operating expenses.
The following table shows ongoing costs of investing in the Fund and can help you understand these costs and compare them with those of other mutual funds. The table assumes a $1,000 investment held for the six months indicated.
Actual Fund Expenses
The first line (Actual) for each share class listed in the table provides actual account values and expenses. The “Ending Account Value” is derived from the Fund’s actual return, which includes the effect of Fund expenses.
You can estimate the expenses you paid during the period by following these steps. Of course, your account value and expenses will differ from those in this illustration:
| 1. | Divide your account value by $1,000. |
| | If an account had an $8,600 value, then $8,600 ÷ $1,000 = 8.6. |
| 2. | Multiply the result by the number under the heading “Expenses Paid During Period.” |
| | If Expenses Paid During Period were $7.50, then 8.6 x $7.50 = $64.50. |
In this illustration, the estimated expenses paid this period are $64.50.
Hypothetical Example for Comparison with Other Funds
Information in the second line (Hypothetical) for each class in the table can help you compare ongoing costs of investing in the Fund with those of other mutual funds. This information may not be used to estimate the actual ending account balance or expenses you paid during the period. The hypothetical “Ending Account Value” is based on the actual expense ratio for each class and an assumed 5% annual rate of return before expenses, which does not represent the Fund’s actual return. The figure under the heading “Expenses Paid During Period” shows the hypothetical expenses your account would have incurred under this scenario. You can compare this figure with the 5% hypothetical examples that appear in shareholder reports of other funds.
12 | Annual Report
Your Fund’s Expenses (continued)
Please note that expenses shown in the table are meant to highlight ongoing costs and do not reflect any transaction costs, such as sales charges. Therefore, the second line for each class is useful in comparing ongoing costs only, and will not help you compare total costs of owning different funds. In addition, if transaction costs were included, your total costs would have been higher. Please refer to the Fund prospectus for additional information on operating expenses.
| | | | | | |
| | | Beginning Account | | Ending Account | | Expenses Paid During |
| Class A | | Value 5/1/13 | | Value 10/31/13 | | Period* 5/1/13–10/31/13 |
| Actual | $ | 1,000 | $ | 927.30 | $ | 8.16 |
| Hypothetical (5% return before expenses) | $ | 1,000 | $ | 1,016.74 | $ | 8.54 |
| Class C | | | | | | |
| Actual | $ | 1,000 | $ | 923.60 | $ | 11.64 |
| Hypothetical (5% return before expenses) | $ | 1,000 | $ | 1,013.11 | $ | 12.18 |
| Class R6 | | | | | | |
| Actual | $ | 1,000 | $ | 928.30 | $ | 5.83 |
| Hypothetical (5% return before expenses) | $ | 1,000 | $ | 1,019.16 | $ | 6.11 |
| Advisor Class | | | | | | |
| Actual | $ | 1,000 | $ | 928.30 | $ | 6.80 |
| Hypothetical (5% return before expenses) | $ | 1,000 | $ | 1,018.15 | $ | 7.12 |
*Expenses are calculated using the most recent six-month expense ratio, net of expense waivers, annualized for each class (A: 1.68%; C: 2.40%; R6: 1.20%; Advisor: 1.40%), multiplied by the average account value over the period, multiplied by 184/365 to reflect the one-half year period.
Annual Report | 13
Franklin Templeton International Trust
Financial Highlights
| | | | | | | | | | | | | | | |
| Franklin India Growth Fund | | | | | | | | | | | | | | | |
| | | | | | Year Ended October 31, | | | | |
| Class A | | 2013 | | | 2012 | | | 2011 | | | 2010 | | | 2009 | |
| Per share operating performancea | | | | | | | | | | | | | | | |
| (for a share outstanding throughout the year) | | | | | | | | | | | | | | | |
| Net asset value, beginning of year | $ | 8.73 | | $ | 9.45 | | $ | 11.34 | | $ | 8.24 | | $ | 4.98 | |
| Income from investment operationsb: | | | | | | | | | | | | | | | |
| Net investment income (loss)c | | (0.01 | ) | | (0.04 | ) | | (0.06 | ) | | (0.03 | ) | | (0.02 | ) |
| Net realized and unrealized gains (losses) | | (0.17 | ) | | (0.55 | ) | | (1.56 | ) | | 3.19 | | | 3.28 | |
| Total from investment operations | | (0.18 | ) | | (0.59 | ) | | (1.62 | ) | | 3.16 | | | 3.26 | |
| Less distributions from: | | | | | | | | | | | | | | | |
| Net investment income | | — | | | — | | | — | | | (0.04 | ) | | — | |
| Net realized gains | | — | | | (0.13 | ) | | (0.27 | ) | | (0.02 | ) | | — | |
| Total distributions | | — | | | (0.13 | ) | | (0.27 | ) | | (0.06 | ) | | — | |
| Net asset value, end of year | $ | 8.55 | | $ | 8.73 | | $ | 9.45 | | $ | 11.34 | | $ | 8.24 | |
| |
| Total returnd | | (2.06 | )% | | (6.02 | )% | | (14.53 | )% | | 38.54 | % | | 65.46 | % |
| |
| Ratios to average net assetsa | | | | | | | | | | | | | | | |
| Expenses before waiver and payments by affiliates | | 2.26 | % | | 2.21 | % | | 2.25 | % | | 2.27 | % | | 2.55 | % |
| Expenses net of waiver and payments by affiliates | | 1.68 | % | | 1.68 | % | | 1.70 | % | | 1.70 | % | | 1.70 | %e |
| Net investment income (loss) | | (0.07 | )% | | (0.43 | )% | | (0.62 | )% | | (0.31 | )% | | (0.40 | )% |
| |
| Supplemental data | | | | | | | | | | | | | | | |
| Net assets, end of year (000’s) | $ | 25,025 | | $ | 31,555 | | $ | 38,079 | | $ | 37,392 | | $ | 11,310 | |
| Portfolio turnover ratef | | 16.95 | % | | 41.30 | % | | 39.07 | % | | 83.21 | % | | 72.23 | % |
aThe per share amounts and ratios reflect income and expenses of the Portfolio.
bThe amount shown for a share outstanding throughout the period may not correlate with the Statement of Operations for the period due to the timing of sales and repurchases of
the Fund shares in relation to income earned and/or fluctuating market value of the investments of the Fund.
cBased on average daily shares outstanding.
dTotal return does not reflect sales commissions or contingent deferred sales charges, if applicable.
eBenefit of expense reduction rounds to less than 0.01%.
fRepresents the Portfolio’s rate of turnover.
14 | The accompanying notes are an integral part of these financial statements. | Annual Report
Franklin Templeton International Trust
Financial Highlights (continued)
| | | | | | | | | | | | | | | |
| Franklin India Growth Fund | | | | | | | | | | | | | | | |
| | | | | | Year Ended October 31, | | | | |
| Class C | | 2013 | | | 2012 | | | 2011 | | | 2010 | | | 2009 | |
| Per share operating performancea | | | | | | | | | | | | | | | |
| (for a share outstanding throughout the year) | | | | | | | | | | | | | | | |
| Net asset value, beginning of year | $ | 8.45 | | $ | 9.22 | | $ | 11.15 | | $ | 8.14 | | $ | 4.96 | |
| Income from investment operationsb: | | | | | | | | | | | | | | | |
| Net investment income (loss)c | | (0.07 | ) | | (0.09 | ) | | (0.13 | ) | | (0.09 | ) | | (0.06 | ) |
| Net realized and unrealized gains (losses) | | (0.16 | ) | | (0.55 | ) | | (1.53 | ) | | 3.14 | | | 3.24 | |
| Total from investment operations | | (0.23 | ) | | (0.64 | ) | | (1.66 | ) | | 3.05 | | | 3.18 | |
| Less distributions from: | | | | | | | | | | | | | | | |
| Net investment income | | — | | | — | | | — | | | (0.02 | ) | | — | |
| Net realized gains | | — | | | (0.13 | ) | | (0.27 | ) | | (0.02 | ) | | — | |
| Total distributions | | — | | | (0.13 | ) | | (0.27 | ) | | (0.04 | ) | | — | |
| Net asset value, end of year | $ | 8.22 | | $ | 8.45 | | $ | 9.22 | | $ | 11.15 | | $ | 8.14 | |
| |
| Total returnd | | (2.72 | )% | | (6.71 | )% | | (15.06 | )% | | 37.53 | % | | 64.11 | % |
| |
| Ratios to average net assetsa | | | | | | | | | | | | | | | |
| Expenses before waiver and payments by affiliates | | 2.98 | % | | 2.93 | % | | 2.95 | % | | 2.97 | % | | 3.25 | % |
| Expenses net of waiver and payments by affiliates | | 2.40 | % | | 2.40 | % | | 2.40 | % | | 2.40 | % | | 2.40 | %e |
| Net investment income (loss) | | (0.79 | )% | | (1.15 | )% | | (1.32 | )% | | (1.01 | )% | | (1.10 | )% |
| |
| Supplemental data | | | | | | | | | | | | | | | |
| Net assets, end of year (000’s) | $ | 6,078 | | $ | 9,201 | | $ | 11,192 | | $ | 10,878 | | $ | 3,768 | |
| Portfolio turnover ratef | | 16.95 | % | | 41.30 | % | | 39.07 | % | | 83.21 | % | | 72.23 | % |
aThe per share amounts and ratios reflect income and expenses of the Portfolio.
bThe amount shown for a share outstanding throughout the period may not correlate with the Statement of Operations for the period due to the timing of sales and repurchases of
the Fund shares in relation to income earned and/or fluctuating market value of the investments of the Fund.
cBased on average daily shares outstanding.
dTotal return does not reflect sales commissions or contingent deferred sales charges, if applicable.
eBenefit of expense reduction rounds to less than 0.01%.
fRepresents the Portfolio’s rate of turnover.
Annual Report | The accompanying notes are an integral part of these financial statements. | 15
Franklin Templeton International Trust
Financial Highlights (continued)
| | | |
| Franklin India Growth Fund | | | |
| | | Period Ended | |
| | | October 31, | |
| Class R6 | | 2013 | a |
| Per share operating performanceb | | | |
| (for a share outstanding throughout the period) | | | |
| Net asset value, beginning of period | $ | 9.35 | |
| Income from investment operationsc: | | | |
| Net investment income (loss)d | | 0.02 | |
| Net realized and unrealized gains (losses) | | (0.69 | ) |
| Total from investment operations | | (0.67 | ) |
| Net asset value, end of period | $ | 8.68 | |
| |
| Total returne | | (7.17 | )% |
| |
| Ratios to average net assetsb,f | | | |
| Expenses before waiver and payments by affiliates | | 1.78 | % |
| Expenses net of waiver and payments by affiliates | | 1.20 | % |
| Net investment income (loss) | | 0.41 | % |
| |
| Supplemental data | | | |
| Net assets, end of period (000’s) | $ | 459 | |
| Portfolio turnover rateg | | 16.95 | % |
aFor the period May 1, 2013 (effective date) to October 31, 2013.
bThe per share amounts and ratios reflect income and expenses of the Portfolio.
cThe amount shown for a share outstanding throughout the period may not correlate with the Statement of Operations for the period due to the timing of sales and repurchases of
the Fund shares in relation to income earned and/or fluctuating market value of the investments of the Fund.
dBased on average daily shares outstanding.
eTotal return is not annualized for periods less than one year.
fRatios are annualized for periods less than one year.
gRepresents the Portfolio’s rate of turnover.
16 | The accompanying notes are an integral part of these financial statements. | Annual Report
Franklin Templeton International Trust
Financial Highlights (continued)
| | | | | | | | | | | | | | | |
| Franklin India Growth Fund | | | | | | | | | | | | | | | |
| | | | | | Year Ended October 31, | | | | |
| Advisor Class | | 2013 | | | 2012 | | | 2011 | | | 2010 | | | 2009 | |
| Per share operating performancea | | | | | | | | | | | | | | | |
| (for a share outstanding throughout the year) | | | | | | | | | | | | | | | |
| Net asset value, beginning of year | $ | 8.83 | | $ | 9.54 | | $ | 11.41 | | $ | 8.28 | | $ | 4.99 | |
| Income from investment operationsb: | | | | | | | | | | | | | | | |
| Net investment income (loss)c | | 0.02 | | | (0.01 | ) | | (0.03 | ) | | —d | | | —d | |
| Net realized and unrealized gains (losses) | | (0.17 | ) | | (0.57 | ) | | (1.57 | ) | | 3.20 | | | 3.29 | |
| Total from investment operations | | (0.15 | ) | | (0.58 | ) | | (1.60 | ) | | 3.20 | | | 3.29 | |
| Less distributions from: | | | | | | | | | | | | | | | |
| Net investment income | | — | | | — | | | — | | | (0.05 | ) | | — | |
| Net realized gains | | — | | | (0.13 | ) | | (0.27 | ) | | (0.02 | ) | | — | |
| Total distributions | | — | | | (0.13 | ) | | (0.27 | ) | | (0.07 | ) | | — | |
| Net asset value, end of year | $ | 8.68 | | $ | 8.83 | | $ | 9.54 | | $ | 11.41 | | $ | 8.28 | |
| |
| Total return | | (1.70 | )% | | (5.75 | )% | | (14.26 | )% | | 38.91 | % | | 65.97 | % |
| |
| Ratios to average net assetsa | | | | | | | | | | | | | | | |
| Expenses before waiver and payments by affiliates | | 1.98 | % | | 1.93 | % | | 1.95 | % | | 1.97 | % | | 2.25 | % |
| Expenses net of waiver and payments by affiliates | | 1.40 | % | | 1.40 | % | | 1.40 | % | | 1.40 | % | | 1.40 | %e |
| Net investment income (loss) | | 0.21 | % | | (0.15 | )% | | (0.32 | )% | | (0.01 | )% | | (0.10 | )% |
| |
| Supplemental data | | | | | | | | | | | | | | | |
| Net assets, end of year (000’s) | $ | 28,340 | | $ | 30,642 | | $ | 42,915 | | $ | 40,493 | | $ | 57,337 | |
| Portfolio turnover ratef | | 16.95 | % | | 41.30 | % | | 39.07 | % | | 83.21 | % | | 72.23 | % |
aThe per share amounts and ratios reflect income and expenses of the Portfolio.
bThe amount shown for a share outstanding throughout the period may not correlate with the Statement of Operations for the period due to the timing of sales and repurchases of
the Fund shares in relation to income earned and/or fluctuating market value of the investments of the Fund.
cBased on average daily shares outstanding.
dAmount rounds to less than $0.01 per share.
eBenefit of expense reduction rounds to less than 0.01%.
fRepresents the Portfolio’s rate of turnover.
Annual Report | The accompanying notes are an integral part of these financial statements. | 17
Franklin Templeton International Trust
Statement of Investments, October 31, 2013
| | | | |
| Franklin India Growth Fund | Shares | | Value | |
| Common Stocks (Cost $1,505,544) 2.9% | | | | |
| IT Services 2.9% | | | | |
| aCognizant Technology Solutions Corp., A (United States) | 20,000 | $ | 1,738,600 | |
| Mutual Funds (Cost $51,659,672) 97.2% | | | | |
| Diversified Financial Services 97.2% | | | | |
| aFT (Mauritius) Offshore Investments Ltd. (India) | 6,336,361 | | 58,205,719 | |
| Total Investments (Cost $53,165,216) 100.1% | | | 59,944,319 | |
| Other Assets, less Liabilities (0.1)% | | | (42,851 | ) |
| Net Assets 100.0% | | $ | 59,901,468 | |
| |
| |
| aNon-income producing. | | | | |
18 | The accompanying notes are an integral part of these financial statements. | Annual Report
Franklin Templeton International Trust
Financial Statements
Statement of Assets and Liabilities
October 31, 2013
| | | |
| | | Franklin | |
| | | India Growth | |
| | | Fund | |
| Assets: | | | |
| Investments in securities: | | | |
| Cost | $ | 1,505,544 | |
| Value | $ | 1,738,600 | |
| Investments in FT (Mauritius) Offshore Investments Limited (Note 1) | | 58,205,719 | |
| Total value of investments | $ | 59,944,319 | |
| Receivables: | | | |
| Investment securities sold | | 253,717 | |
| Capital shares sold | | 37,072 | |
| Affiliates | | 36,500 | |
| Other assets | | 8 | |
| Total assets | | 60,271,616 | |
| Liabilities: | | | |
| Payables: | | | |
| Capital shares redeemed | | 105,598 | |
| Distribution fees | | 10,854 | |
| Transfer agent fees | | 22,151 | |
| Funds advanced by custodian | | 203,717 | |
| Accrued expenses and other liabilities | | 27,828 | |
| Total liabilities | | 370,148 | |
| Net assets, at value | $ | 59,901,468 | |
| Net assets consist of: | | | |
| Paid-in capital | $ | 65,445,868 | |
| Undistributed net investment income (loss) | | (196,552 | ) |
| Net unrealized appreciation (depreciation) | | 5,329,144 | |
| Accumulated net realized gain (loss) | | (10,676,992 | ) |
| Net assets, at value | $ | 59,901,468 | |
Annual Report | The accompanying notes are an integral part of these financial statements. | 19
Franklin Templeton International Trust
Financial Statements (continued)
Statement of Assets and Liabilities (continued)
October 31, 2013
| | | |
| | | | Franklin |
| | | | India Growth |
| | | | Fund |
| Class A: | | | |
| Net assets, at value | $ | | 25,025,086 |
| Shares outstanding | | | 2,926,903 |
| Net asset value per sharea | | $ | 8.55 |
| Maximum offering price per share (net asset value per share ÷ 94.25%) | | $ | 9.07 |
| Class C: | | | |
| Net assets, at value | $ | | 6,077,529 |
| Shares outstanding | | | 739,298 |
| Net asset value and maximum offering price per sharea | | $ | 8.22 |
| Class R6: | | | |
| Net assets, at value | $ | | 459,171 |
| Shares outstanding | | | 52,876 |
| Net asset value and maximum offering price per share | | $ | 8.68 |
| Advisor Class: | | | |
| Net assets, at value | $ | | 28,339,682 |
| Shares outstanding | | | 3,266,273 |
| Net asset value and maximum offering price per share | | $ | 8.68 |
| |
| |
| aRedemption price is equal to net asset value less contingent deferred sales charges, if applicable. | | | |
20 | The accompanying notes are an integral part of these financial statements. | Annual Report
Franklin Templeton International Trust
Financial Statements (continued)
Statement of Operations
for the year ended October 31, 2013
| | | |
| | | Franklin | |
| | | India Growth | |
| | | Fund | |
| Net investment income allocated from FT (Mauritius) Offshore Investments Limited: | | | |
| Dividends | $ | 1,096,459 | |
| Expenses | | (726,144 | ) |
| Net investment income allocated from FT Mauritius) Offshore Investments Limited | | 370,315 | |
| Expenses: | | | |
| Management fees (Note 3a) | | 212,258 | |
| Administrative fees (Note 3b) | | 73,305 | |
| Distribution fees: (Note 3c) | | | |
| Class A | | 81,292 | |
| Class C | | 78,469 | |
| Transfer agent fees: (Note 3e) | | | |
| Class A | | 60,475 | |
| Class C | | 16,415 | |
| Class R6 | | 22 | |
| Advisor Class | | 64,492 | |
| Custodian fees (Note 4) | | 1,564 | |
| Reports to shareholders | | 30,206 | |
| Registration and filing fees | | 93,314 | |
| Professional fees | | 47,031 | |
| Trustees’ fees and expenses | | 3,797 | |
| Other | | 14,048 | |
| Total expenses | | 776,688 | |
| Expenses waived/paid by affiliates (Note 3f) | | (392,965 | ) |
| Net expenses | | 383,723 | |
| Net investment income (loss) | | (13,408 | ) |
| Realized and unrealized gains (losses) on investments allocated from FT (Mauritius) Offshore Investments Limited: | | | |
| Net realized gain (loss) from: | | | |
| Investments | | (1,584,622 | ) |
| Foreign currency transactions | | (255,385 | ) |
| Net realized gain (loss) | | (1,840,007 | ) |
| Net change in unrealized appreciation (depreciation) on: | | | |
| Investmentsa | | (281,142 | ) |
| Translation of assets and liabilities denominated in foreign currencies | | (68,654 | ) |
| Net change in unrealized appreciation (depreciation) | | (349,796 | ) |
| Net realized and unrealized gain (loss) | | (2,189,803 | ) |
| Net increase (decrease) in net assets resulting from operations | $ | (2,203,211 | ) |
| |
| |
| |
| aIncludes $405,600 of change in unrealized appreciation on other investments held by the India Growth Fund. | | | |
Annual Report | The accompanying notes are an integral part of these financial statements. | 21
Franklin Templeton International Trust
Financial Statements (continued)
| | | | | | |
| Statements of Changes in Net Assets | | | | | | |
| |
| |
| | | Franklin India Growth Fund | |
| | | Year Ended October 31, | |
| | | 2013 | | | 2012 | |
| Increase (decrease) in net assets: | | | | | | |
| Operations: | | | | | | |
| Net investment income (loss) | $ | (13,408 | ) | $ | (305,789 | ) |
| Net realized gain (loss) from investments and foreign currency transactions | | (1,840,007 | ) | | (9,017,855 | ) |
| Net change in unrealized appreciation (depreciation) on investments and translation of other | | | | | | |
| assets and liabilities denominated in foreign currencies | | (349,796 | ) | | 1,514,805 | |
| Net increase (decrease) in net assets resulting from operations | | (2,203,211 | ) | | (7,808,839 | ) |
| Distributions to shareholders from net realized gains: | | | | | | |
| Class A | | — | | | (528,432 | ) |
| Class C | | — | | | (153,932 | ) |
| Advisor Class | | — | | | (402,851 | ) |
| Total distributions to shareholders | | — | | | (1,085,215 | ) |
| Capital share transactions: (Note 2) | | | | | | |
| Class A | | (5,863,006 | ) | | (3,247,269 | ) |
| Class C | | (2,839,742 | ) | | (996,785 | ) |
| Class R6 | | 484,286 | | | — | |
| Advisor Class | | (1,074,575 | ) | | (7,650,661 | ) |
| Total capital share transactions | | (9,293,037 | ) | | (11,894,715 | ) |
| Net increase (decrease) in net assets | | (11,496,248 | ) | | (20,788,769 | ) |
| Net assets: | | | | | | |
| Beginning of year | | 71,397,716 | | | 92,186,485 | |
| End of year | $ | 59,901,468 | | $ | 71,397,716 | |
| Undistributed net investment income (loss) included in net assets: | | | | | | |
| End of year | $ | (196,552 | ) | $ | (163,609 | ) |
22 | The accompanying notes are an integral part of these financial statements. | Annual Report
Franklin Templeton International Trust
Notes to Financial Statements
Franklin India Growth Fund
1. ORGANIZATION AND SIGNIFICANT ACCOUNTING POLICIES
Franklin Templeton International Trust (Trust) is registered under the Investment Company Act of 1940, as amended, (1940 Act) as an open-end investment company, consisting of four separate funds. The Franklin India Growth Fund (Fund) is included in this report. The financial statements of the remaining funds in the Trust are presented separately. The Fund offers four classes of shares: Class A, Class C, Class R6, and Advisor Class. Effective May 1, 2013, the Fund began offering a new class of shares, Class R6. Each class of shares differs by its initial sales load, contingent deferred sales charges, voting rights on matters affecting a single class, its exchange privilege and fees primarily due to differing arrangements for distribution and transfer agent fees.
The Fund operates using a “master fund/feeder fund” structure and primarily invests indirectly in the securities of Indian companies through FT (Mauritius) Offshore Investments Limited (Portfolio), an entity registered with and regulated by the Mauritius Financial Services Commission, which shares the same investment objective as the Fund. The accounting policies of the Portfolio, including the Portfolio’s security valuation policies, will directly affect the recorded value of the Fund’s investment in the Portfolio. The financial statements of the Portfolio, including the Statement of Investments, are included elsewhere in this report and should be read in conjunction with the Fund’s financial statements. At October 31, 2013, the Fund owned 100% of the outstanding shares of the Portfolio.
The following summarizes the Fund’s significant accounting policies.
a. Financial Instrument Valuation
The Fund’s investments in financial instruments are carried at fair value daily. Fair value is the price that would be received to sell an asset or paid to transfer a liability in an orderly transaction between market participants on the measurement date. Under procedures approved by the Fund’s Board of Trustees (the Board), the Fund’s administrator, investment manager and other affiliates have formed the Valuation and Liquidity Oversight Committee (VLOC). The VLOC provides administration and oversight of the Fund’s valuation policies and procedures, which are approved annually by the Board. Among other things, these procedures allow the Fund to utilize independent pricing services, quotations from securities and financial instrument dealers, and other market sources to determine fair value.
Equity securities listed on an exchange or on the NASDAQ National Market System are valued at the last quoted sale price or the official closing price of the day, respectively. Over-the-counter (OTC) securities are valued within the range of the most recent quoted bid and ask prices. Securities that trade in multiple markets or on multiple exchanges are valued according to the broadest and most representative market. Certain equity securities are valued based upon fundamental characteristics or relationships to similar securities.
Annual Report | 23
Franklin Templeton International Trust
Notes to Financial Statements (continued)
Franklin India Growth Fund
| 1. | ORGANIZATION AND SIGNIFICANT ACCOUNTING POLICIES (continued) |
| a. | Financial Instrument Valuation (continued) |
The Fund has procedures to determine the fair value of financial instruments for which market prices are not reliable or readily available. Under these procedures, the VLOC convenes on a regular basis to review such financial instruments and considers a number of factors, including significant unobservable valuation inputs, when arriving at fair value. The VLOC primarily employs a market-based approach which may use related or comparable assets or liabilities, recent transactions, market multiples, book values, and other relevant information for the investment to determine the fair value of the investment. An income-based valuation approach may also be used in which the anticipated future cash flows of the investment are discounted to calculate fair value. Discounts may also be applied due to the nature or duration of any restrictions on the disposition of the investments. Due to the inherent uncertainty of valuations of such investments, the fair values may differ significantly from the values that would have been used had an active market existed. The VLOC employs various methods for calibrating these valuation approaches including a regular review of key inputs and assumptions, transactional back-testing or disposition analysis, and reviews of any related market activity.
The Fund’s investment in the Portfolio shares is valued at the Portfolio’s net asset value per share. Valuation of securities by the Portfolio is discussed in Note 1(a) of the Portfolio’s Notes to Financial Statements, which are included elsewhere in this report.
b. Income Taxes
It is the Fund’s policy to qualify as a regulated investment company under the Internal Revenue Code. The Fund intends to distribute to shareholders substantially all of its taxable income and net realized gains to relieve it from federal income and excise taxes. As a result, no provision for U.S. federal income taxes is required.
The Fund recognizes the tax benefits of uncertain tax positions only when the position is “more likely than not” to be sustained upon examination by the tax authorities based on the technical merits of the tax position. As of October 31, 2013, and for all open tax years, the Fund has determined that no liability for unrecognized tax benefits is required in the Fund’s financial statements related to uncertain tax positions taken on a tax return (or expected to be taken on future tax returns). Open tax years are those that remain subject to examination and are based on each tax jurisdiction statute of limitation.
The Fund’s investment in the Portfolio may be subject to income and withholding taxes in Mauritius and/or India which are discussed in Note 1(c) of the Portfolio’s Notes to Financial Statements.
24 | Annual Report
Franklin Templeton International Trust
Notes to Financial Statements (continued)
Franklin India Growth Fund
| 1. | ORGANIZATION AND SIGNIFICANT ACCOUNTING POLICIES (continued) |
| c. | Security Transactions, Investment Income, Expenses and Distributions |
Security transactions, including investments in the Portfolio, are accounted for on trade date. Realized gains and losses on security transactions are determined on a specific identification basis. Estimated expenses are accrued daily. Dividend income is recorded on the ex-dividend date. Distributions to shareholders are recorded on the ex-dividend date and are determined according to income tax regulations (tax basis). Distributable earnings determined on a tax basis may differ from earnings recorded in accordance with accounting principles generally accepted in the United States of America. These differences may be permanent or temporary. Permanent differences are reclassified among capital accounts to reflect their tax character. These reclassifications have no impact on net assets or the results of operations. Temporary differences are not reclassified, as they may reverse in subsequent periods.
Common expenses incurred by the Trust are allocated among the funds based on the ratio of net assets of each fund to the combined net assets of the Trust. Fund specific expenses are charged directly to the fund that incurred the expense.
Realized and unrealized gains and losses and net investment income, not including class specific expenses, are allocated daily to each class of shares based upon the relative proportion of net assets of each class. Differences in per share distributions, by class, are generally due to differences in class specific expenses.
The Fund records its proportionate share of the Portfolio’s income, expenses and realized and unrealized gains and losses daily. In addition, the Fund accrues its own expenses.
d. Accounting Estimates
The preparation of financial statements in accordance with accounting principles generally accepted in the United States of America requires management to make estimates and assumptions that affect the reported amounts of assets and liabilities at the date of the financial statements and the amounts of income and expenses during the reporting period. Actual results could differ from those estimates.
e. Guarantees and Indemnifications
Under the Trust’s organizational documents, its officers and directors are indemnified by the Trust against certain liabilities arising out of the performance of their duties to the Trust. Additionally, in the normal course of business, the Trust, on behalf of the Fund, enters into contracts with service providers that contain general indemnification clauses. The Trust’s maximum exposure under these arrangements is unknown as this would involve future claims that may be made against the Trust that have not yet occurred. Currently, the Trust expects the risk of loss to be remote.
Annual Report | 25
Franklin Templeton International Trust
Notes to Financial Statements (continued)
Franklin India Growth Fund
2. SHARES OF BENEFICIAL INTEREST
At October 31, 2013, there were an unlimited number of shares authorized (without par value).
Transactions in the Fund’s shares were as follows:
| | | | | | | | | | |
| | | | | Year Ended October 31, | | | | |
| | | | 2013 | | | | | 2012 | |
| | Shares | | | Amount | | Shares | | | Amount | |
| Class A Shares: | | | | | | | | | | |
| Shares sold | 950,756 | | $ | 8,160,865 | | 1,389,531 | | $ | 11,855,139 | |
| Shares issued in reinvestment of | | | | | | | | | | |
| distributions | — | | | — | | 65,570 | | | 500,298 | |
| Shares redeemed | (1,638,554 | ) | | (14,023,871 | ) | (1,869,329 | ) | | (15,602,706 | ) |
| Net increase (decrease) | (687,798 | ) | $ | (5,863,006 | ) | (414,228 | ) | $ | (3,247,269 | ) |
| Class C Shares: | | | | | | | | | | |
| Shares sold | 270,061 | | $ | 2,210,327 | | 464,263 | | $ | 3,862,124 | |
| Shares issued in reinvestment of | | | | | | | | | | |
| distributions | — | | | — | | 18,926 | | | 140,810 | |
| Shares redeemed | (619,059 | ) | | (5,050,069 | ) | (608,397 | ) | | (4,999,719 | ) |
| Net increase (decrease) | (348,998 | ) | $ | (2,839,742 | ) | (125,208 | ) | $ | (996,785 | ) |
| Class R6 Sharesa: | | | | | | | | | | |
| Shares soldb | 53,411 | | $ | 488,400 | | | | | | |
| Shares redeemed | (535 | ) | | (4,114 | ) | | | | | |
| Net increase (decrease) | 52,876 | | $ | 484,286 | | | | | | |
| Advisor Class Shares: | | | | | | | | | | |
| Shares sold | 830,148 | | $ | 7,447,876 | | 2,633,731 | | $ | 22,670,281 | |
| Shares issued in reinvestment of | | | | | | | | | | |
| distributions | — | | | — | | 47,810 | | | 368,617 | |
| Shares redeemedb | (1,032,537 | ) | | (8,522,451 | ) | (3,711,720 | ) | | (30,689,559 | ) |
| Net increase (decrease) | (202,389 | ) | $ | (1,074,575 | ) | (1,030,179 | ) | $ | (7,650,661 | ) |
| |
| aFor the period May 1, 2013 (effective date) to September 30, 2013. | | | | | | | | | |
| bEffective May 1, 2013, a portion of Advisor Class shares were exchanged into Class R6. | | | | | | |
3. TRANSACTIONS WITH AFFILIATES
Franklin Resources, Inc. is the holding company for various subsidiaries that together are referred to as Franklin Templeton Investments. Certain officers and trustees of the Trust are also officers, and/or directors of the Portfolio and of the following subsidiaries:
| | | |
| | | Subsidiary | Affiliation |
| | | Franklin Advisers, Inc. (Advisers) | Investment manager |
| | | Franklin Templeton Asset Management (India) Private Limited (FT India) | Investment manager |
| | | Franklin Templeton Services, LLC (FT Services) | Administrative manager |
| | | Franklin Templeton Distributors, Inc. (Distributors) | Principal underwriter |
| | | Franklin Templeton Investor Services, LLC (Investor Services) | Transfer agent |
| |
| 26 | | | Annual Report | |
Franklin Templeton International Trust
Notes to Financial Statements (continued)
Franklin India Growth Fund
| 3. | TRANSACTIONS WITH AFFILIATES (continued) |
| a. | Management Fees |
The Fund pays an investment management fee to Advisers. The total management fee is paid based on the average daily net assets of the Fund as follows:
| | |
| Annualized Fee Rate | | Net Assets |
| 1.300 | % | Up to and including $1 billion |
| 1.250 | % | Over $1 billion, up to and including $5 billion |
| 1.200 | % | Over $5 billion, up to and including $10 billion |
| 1.150 | % | Over $10 billion, up to and including $15 billion |
| 1.100 | % | Over $15 billion, up to and including $20 billion |
| 1.050 | % | In excess of $20 billion |
Effective May 1, 2013, the Fund combined its investment management and administration agreements as approved by the Board. The fees paid under the combined agreement do not exceed the aggregate fees that were paid under the separate agreements.
The Portfolio will pay Advisers a fee equal to 80% of the difference between the total management fee and the fee paid by Advisers to FT Services for its administrative services to the Fund.
Prior to May 1, 2013, the Fund paid fees to Advisers equal to 20% of the total management fee with the remainder to be paid by the Portfolio. The total management fee is paid based on the average daily net assets of the Fund as follows:
| | |
| Annualized Fee Rate | | Net Assets |
| 1.100 | % | Up to and including $1 billion |
| 1.050 | % | Over $1 billion, up to and including $5 billion |
| 1.000 | % | Over $5 billion, up to and including $10 billion |
| 0.950 | % | Over $10 billion, up to and including $15 billion |
| 0.900 | % | Over $15 billion, up to and including $20 billion |
| 0.850 | % | In excess of $20 billion |
Under a subadvisory agreement, FT India, an affiliate of Advisers, provides subadvisory services to the Fund. The subadvisory fee is paid by Advisers based on the average daily net assets, and is not an additional expense of the Fund.
b. Administrative Fees
Effective May 1, 2013, under an agreement with Advisers, FT Services provides administrative services to the Fund. The fee is paid by Advisers based on the Fund’s average daily net assets, and is not an additional expense of the Fund.
Prior to May 1, 2013, the Fund paid administrative fees to FT Services of 0.20% per year of the average daily net assets of the Fund.
Annual Report | 27
Franklin Templeton International Trust
Notes to Financial Statements (continued)
Franklin India Growth Fund
| 3. | TRANSACTIONS WITH AFFILIATES (continued) |
| c. | Distribution Fees |
The Board has adopted distribution plans for each share class, with the exception of Class R6 and Advisor Class shares, pursuant to Rule 12b-1 under the 1940 Act. Distribution fees are not charged on shares held by affiliates. Under the Fund’s Class A reimbursement distribution plan, the Fund reimburses Distributors for costs incurred in connection with the servicing, sale and distribution of the Fund’s shares up to the maximum annual plan rate. Under the Class A reimbursement distribution plan, costs exceeding the maximum for the current plan year cannot be reimbursed in subsequent periods. In addition, under the Fund’s Class C compensation distribution plan, the Fund pays Distributors for costs incurred in connection with the servicing, sale and distribution of the Fund’s shares up to the maximum annual plan rate. The plan year, for purposes of monitoring compliance with the maximum annual plan rate, is February 1 through January 31.
The maximum annual plan rates, based on the average daily net assets, for each class, are as follows:
The Board has set the current rate at 0.30% per year for Class A shares until further notice and approval by the Board.
d. Sales Charges/Underwriting Agreements
Front-end sales charges and contingent deferred sales charges (CDSC) do not represent expenses of the Fund. These charges are deducted from the proceeds of sales of Fund shares prior to investment or from redemption proceeds prior to remittance, as applicable. Distributors has advised the Fund of the following commission transactions related to the sales and redemptions of the Fund’s shares for the year:
| | |
| Sales charges retained net of commissions paid to unaffiliated | | |
| broker/dealers | $ | 18,051 |
| CDSC retained | $ | 6,412 |
e. Transfer Agent Fees
Each class of shares, except for Class R6, pays transfer agent fees to Investor Services for its performance of shareholder servicing obligations and reimburses Investor Services for out of pocket expenses incurred, including shareholding servicing fees paid to third parties. These fees are allocated daily based upon their relative proportion of such classes’ aggregate net assets. Class R6 pays Investor Services transfer agent fees specific to that class.
28 | Annual Report
Franklin Templeton International Trust
Notes to Financial Statements (continued)
Franklin India Growth Fund
| 3. | TRANSACTIONS WITH AFFILIATES (continued) |
| e. | Transfer Agent Fees (continued) |
For the year ended October 31, 2013, the Fund paid transfer agent fees of $141,404, of which $76,078 was retained by Investor Services.
f. Waiver and Expense Reimbursements
Advisers and FT Services have contractually agreed in advance to waive or limit their respective fees and to assume as their own expense certain expenses otherwise payable by the Fund so that the expenses, including the Fund’s share of the Portfolio’s allocated expenses, (excluding distribution fees, and acquired fund fees and expenses) for Class A, Class C and Advisor Class of the Fund do not exceed 1.40%, and Class R6 does not exceed 1.21% based on the average net assets of each class (other than certain non-routine expenses or costs, including those relating to litigation, indemnification, reorganizations, and liquidations) until February 28, 2014.
4. EXPENSE OFFSET ARRANGEMENT
The Fund has entered into an arrangement with its custodian whereby credits realized as a result of uninvested cash balances are used to reduce a portion of the Fund’s custodian expenses. During the year ended October 31, 2013, there were no credits earned.
5. INCOME TAXES
For tax purposes, capital losses may be carried over to offset future capital gains, if any. At October 31, 2013, the capital loss carryforwards were as follows:
| | |
| Capital loss carryforwards: | | |
| Short term | $ | 2,097,737 |
| Long term | | 6,945,165 |
| Total capital loss carryforwards | $ | 9,042,902 |
For tax purposes, the Fund may elect to defer any portion of a late-year ordinary loss to the first day of the following fiscal year. At October 31, 2013, the Fund deferred late-year ordinary losses of $144,603.
At October 31, 2013, the cost of investments, net unrealized appreciation (depreciation) including the holdings of the Portfolio for income tax purposes were as follows:
| | | |
| Cost of investments | $ | 53,939,372 | |
| |
| Unrealized appreciation | $ | 9,181,324 | |
| Unrealized depreciation | | (5,480,895 | ) |
| Net unrealized appreciation (depreciation) | $ | 3,700,429 | |
Annual Report | 29
Franklin Templeton International Trust
Notes to Financial Statements (continued)
Franklin India Growth Fund
5. INCOME TAXES (continued)
The Portfolio is a disregarded entity for United States Federal income tax purposes.
Differences between income and/or capital gains as determined on a book basis and a tax basis are primarily due to differing treatments of foreign currency transactions, passive foreign investment company shares, organization costs and wash sales.
6. INVESTMENT TRANSACTIONS
Purchases and sales of investments including transactions from the Portfolio (excluding short term securities) for the year ended October 31, 2013, aggregated $11,012,849 and $19,748,207, respectively.
7. CONCENTRATION OF RISK
Investing in Indian equity securities through the Portfolio may include certain risks and considerations not typically associated with investing in U.S. securities, such as fluctuating currency values, less liquidity, expropriation, confiscatory taxation, nationalization, exchange control regulations (including currency blockage), differing legal standards and changing local and regional economic, political and social conditions, which may result in greater market volatility.
8. CREDIT FACILITY
The Fund, together with other U.S. registered and foreign investment funds (collectively, Borrowers), managed by Franklin Templeton Investments, are borrowers in a joint syndicated senior unsecured credit facility totaling $1.5 billion (Global Credit Facility) which matures on January 17, 2014. This Global Credit Facility provides a source of funds to the Borrowers for temporary and emergency purposes, including the ability to meet future unanticipated or unusually large redemption requests.
Under the terms of the Global Credit Facility, the Fund shall, in addition to interest charged on any borrowings made by the Fund and other costs incurred by the Fund, pay its share of fees and expenses incurred in connection with the implementation and maintenance of the Global Credit Facility, based upon its relative share of the aggregate net assets of all of the Borrowers, including an annual commitment fee of 0.07% based upon the unused portion of the Global Credit Facility. These fees are reflected in other expenses on the Statement of Operations. During the year ended October 31, 2013, the Fund did not use the Global Credit Facility.
30 | Annual Report
Franklin Templeton International Trust
Notes to Financial Statements (continued)
Franklin India Growth Fund
9. FAIR VALUE MEASUREMENTS
The Fund follows a fair value hierarchy that distinguishes between market data obtained from independent sources (observable inputs) and the Fund’s own market assumptions (unobservable inputs). These inputs are used in determining the value of the Fund’s financial instruments and are summarized in the following fair value hierarchy:
- Level 1 – quoted prices in active markets for identical financial instruments
- Level 2 – other significant observable inputs (including quoted prices for similar financial instruments, interest rates, prepayment speed, credit risk, etc.)
- Level 3 – significant unobservable inputs (including the Fund’s own assumptions in determining the fair value of financial instruments)
The input levels are not necessarily an indication of the risk or liquidity associated with financial instruments at that level.
For movements between the levels within the fair value hierarchy, the Fund has adopted a policy of recognizing the transfers as of the date of the underlying event which caused the movement.
At October 31, 2013, all of the Fund’s investments in financial instruments carried at fair value were valued using Level 1 inputs. For detailed categories, see the accompanying Statement of Investments.
10. NEW ACCOUNTING PRONOUNCEMENTS
In December 2011, the Financial Accounting Standards Board (FASB) issued Accounting Standards Update (ASU) No. 2011-11, Balance Sheet (Topic 210): Disclosures about Offsetting Assets and Liabilities. The amendments in the ASU enhance disclosures about offsetting of financial assets and liabilities to enable investors to understand the effect of these arrangements on a fund’s financial position. In January 2013, FASB issued ASU No. 2013-01, Balance Sheet (Topic 210): Clarifying the Scope of Disclosures about Offsetting Assets and Liabilities. The amendments in ASU No. 2013-01 clarify the intended scope of disclosures required by ASU No. 2011-11. These ASUs are effective for interim and annual reporting periods beginning on or after January 1, 2013. The Fund believes the adoption of these ASUs will not have a material impact on its financial statements.
Annual Report | 31
Franklin Templeton International Trust
Notes to Financial Statements (continued)
Franklin India Growth Fund
10. NEW ACCOUNTING PRONOUNCEMENTS (continued)
In June 2013, FASB issued ASU No. 2013-08, Investment Companies (Topic 946): Amendments to the Scope, Measurement, and Disclosure Requirements. The ASU modifies the criteria used in defining an investment company under U.S. Generally Accepted Accounting Principles and also sets forth certain measurement and disclosure requirements. Under the ASU, an entity that is registered under the 1940 Act automatically qualifies as an investment company. The ASU is effective for interim and annual reporting periods beginning after December 15, 2013. The Fund is currently reviewing the requirements and believes the adoption of this ASU will not have a material impact on its financial statements.
11. SUBSEQUENT EVENTS
The Fund has evaluated subsequent events through the issuance of the financial statements and determined that no events have occurred that require disclosure.
32 | Annual Report
Franklin Templeton International Trust
Report of Independent Registered Public Accounting Firm
To the Board of Directors and Shareholders of Franklin India Growth Fund
In our opinion, the accompanying statement of assets and liabilities, including the statement of investments, and the related statements of operations and of changes in net assets and the financial highlights present fairly, in all material respects, the financial position of Franklin India Growth Fund (the “Fund”) at October 31, 2013, the results of its operations for the year then ended, the changes in its net assets for each of the two years in the period then ended and the financial highlights for each of the periods presented, in conformity with accounting principles generally accepted in the United States of America. These financial statements and financial highlights (hereafter referred to as “financial statements”) are the responsibility of the Fund’s management. Our responsibility is to express an opinion on these financial statements based on our audits. We conducted our audits of these financial statements in accordance with the standards of the Public Company Accounting Oversight Board (United States). Those standards require that we plan and perform the audit to obtain reasonable assurance about whether the financial statements are free of material misstatement. An audit includes examining, on a test basis, evidence supporting the amounts and disclosures in the financial statements, assessing the accounting principles used and significant estimates made by management, and evaluating the overall financial statement presentation. We believe that our audits, which included confirmation of securities at October 31, 2013 by correspondence with the custodian, transfer agent and brokers, provide a reasonable basis for our opinion.
PricewaterhouseCoopers LLP
San Francisco, California
December 17, 2013
Annual Report | 33
Franklin Templeton International Trust
Tax Information (unaudited)
Franklin India Growth Fund
Under Section 854(b)(1)(B) of the Internal Revenue Code (Code), the Fund hereby reports the maximum amount allowable but no less than $902,554 as qualified dividends for purposes of the maximum rate under Section 1(h)(11) of the Code for the fiscal year ended October 31, 2013. Distributions, including qualified dividend income, paid during calendar year 2013 will be reported to shareholders on Form 1099-DIV by mid-February 2014. Shareholders are advised to check with their tax advisors for information on the treatment of these amounts on their individual income tax returns.
34 | Annual Report
Franklin Templeton International Trust
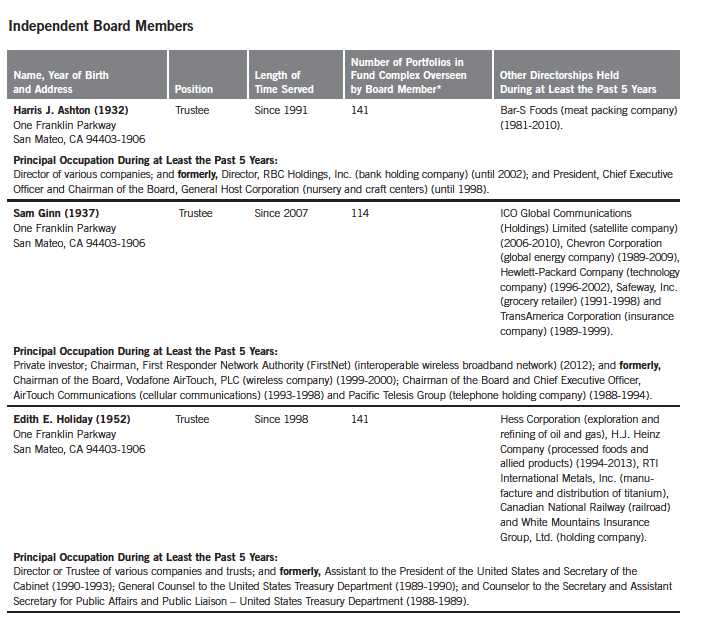
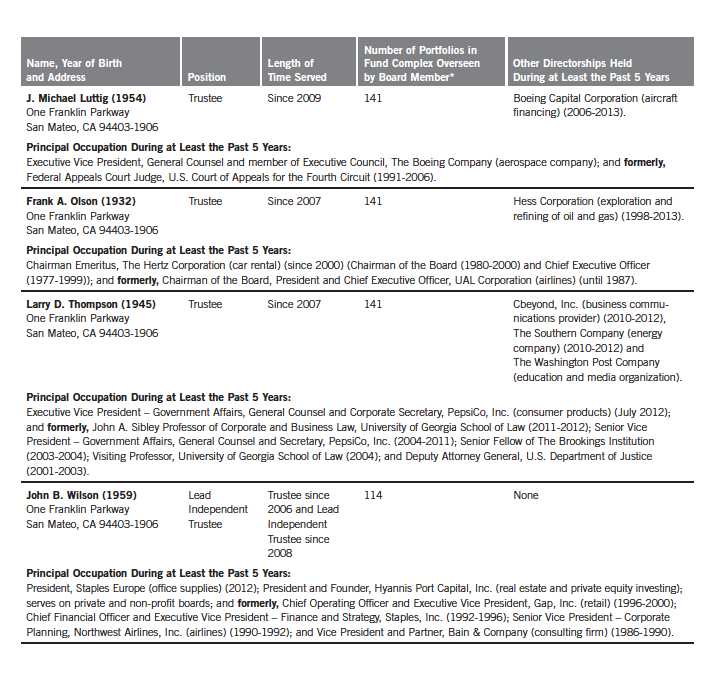
Board Members and Officers
The name, year of birth and address of the officers and board members, as well as their affiliations, positions held with the Trust, principal occupations during at least the past five years and number of portfolios overseen in the Franklin Templeton Investments fund complex are shown below. Generally, each board member serves until that person’s successor is elected and qualified.
Annual Report | 35
36 | Annual Report

Annual Report | 37

38 | Annual Report

Annual Report | 39
FT (Mauritius) Offshore Investments Limited
Financial Highlights
(Expressed in U.S. Dollars)
| | | | | | | | | | | | | | | |
| | | | | | Year Ended October 31, | | | | |
| | | 2013 | | | 2012 | | | 2011 | | | 2010 | | | 2009 | |
| Per share operating performance | | | | | | | | | | | | | | | |
| (for a share outstanding throughout the year) | | | | | | | | | | | | | | | |
| Net asset value, beginning of year | $ | 9.37 | | $ | 9.88 | | $ | 11.52 | | $ | 8.26 | | $ | 4.97 | |
| Income from investment operationsa: | | | | | | | | | | | | | | | |
| Net investment income (loss)b | | 0.06 | | | 0.02 | | | (0.01 | ) | | 0.02 | | | —c | |
| Net realized and unrealized gains (losses) | | (0.24 | ) | | (0.53 | ) | | (1.63 | ) | | 3.24 | | | 3.29 | |
| Total from investment operations | | (0.18 | ) | | (0.51 | ) | | (1.64 | ) | | 3.26 | | | 3.29 | |
| Net asset value, end of year | $ | 9.19 | | $ | 9.37 | | $ | 9.88 | | $ | 11.52 | | $ | 8.26 | |
| |
| Total return | | (1.92 | )% | | (5.16 | )% | | (14.24 | )% | | 39.47 | % | | 66.20 | % |
| |
| Ratios to average net assets | | | | | | | | | | | | | | | |
| Expenses | | 1.07 | % | | 1.08 | % | | 1.17 | % | | 1.22 | % | | 1.37 | % |
| Net investment income (loss) | | 0.54 | % | | 0.19 | % | | (0.08 | )% | | 0.18 | % | | (0.06 | )% |
| |
| Supplemental data | | | | | | | | | | | | | | | |
| Net assets, end of year (000’s) | $ | 58,206 | | $ | 70,010 | | $ | 90,257 | | $ | 88,225 | | $ | 72,271 | |
| Portfolio turnover rate | | 16.95 | % | | 41.30 | % | | 39.07 | % | | 83.21 | % | | 72.23 | % |
aThe amount shown for a share outstanding throughout the period may not correlate with the Statement of Operations for the period due to the timing of sales and repurchases of
the Fund shares in relation to income earned and/or fluctuating market value of the investments of the Fund.
bBased on average daily shares outstanding.
cAmount rounds to less than $0.01 per share.
40 | The accompanying notes are an integral part of these financial statements. | Annual Report
FT (Mauritius) Offshore Investments Limited
Statement of Investments, October 31, 2013
(Expressed in U.S. Dollars)
| | | |
| | Shares | | Value |
| Common Stocks 96.0% | | | |
| India 96.0% | | | |
| Auto Components 3.3% | | | |
| Balkrishna Industries Ltd. | 88,000 | $ | 393,279 |
| Bosch Ltd. | 5,937 | | 840,674 |
| Exide Industries Ltd. | 356,000 | | 715,487 |
| | | | 1,949,440 |
| Automobiles 4.0% | | | |
| Bajaj Auto Ltd. | 25,000 | | 857,486 |
| Mahindra & Mahindra Ltd. | 80,000 | | 1,144,947 |
| Tata Motors Ltd., A | 113,000 | | 351,537 |
| | | | 2,353,970 |
| Chemicals 3.7% | | | |
| Asian Paints Ltd. | 170,000 | | 1,474,569 |
| Pidilite Industries Ltd. | 145,000 | | 673,012 |
| | | | 2,147,581 |
| Commercial Banks 20.2% | | | |
| Axis Bank Ltd. | 44,000 | | 866,872 |
| HDFC Bank Ltd. | 360,000 | | 3,940,681 |
| ICICI Bank Ltd. | 210,000 | | 3,792,761 |
| IndusInd Bank Ltd. | 245,000 | | 1,760,601 |
| Yes Bank Ltd. | 239,000 | | 1,420,038 |
| | | | 11,780,953 |
| Construction & Engineering 2.0% | | | |
| Larsen & Toubro Ltd. | 74,000 | | 1,159,458 |
| Construction Materials 2.1% | | | |
| Grasim Industries Ltd. | 16,000 | | 726,304 |
| Ramco Cements Ltd. | 69,300 | | 199,121 |
| Shree Cements Ltd. | 4,500 | | 321,164 |
| | | | 1,246,589 |
| Diversified Financial Services 4.0% | | | |
| Credit Analysis and Research Ltd. | 40,000 | | 427,221 |
| Crisil Ltd. | 44,250 | | 800,686 |
| Kotak Mahindra Bank Ltd. | 91,000 | | 1,100,500 |
| | | | 2,328,407 |
| Food Products 1.5% | | | |
| Nestle India Ltd. | 9,500 | | 855,927 |
| Gas Utilities 0.2% | | | |
| GAIL India Ltd. | 24,352 | | 138,432 |
| Independent Power Producers & Energy Traders 1.8% | | | |
| NTPC Ltd. | 437,000 | | 1,046,896 |
Annual Report | 41
FT (Mauritius) Offshore Investments Limited
Statement of Investments, October 31, 2013 (continued)
(Expressed in U.S. Dollars)
| | | |
| | Shares | | Value |
| Common Stocks (continued) | | | |
| India (continued) | | | |
| IT Services 12.1% | | | |
| HCL Technologies Ltd. | 50,163 | $ | 883,516 |
| Infosys Ltd. | 72,500 | | 3,864,560 |
| Tata Consultancy Services Ltd. | 36,000 | | 1,222,745 |
| Wipro Ltd. | 140,000 | | 1,075,752 |
| | | | 7,046,573 |
| Machinery 1.4% | | | |
| Cummins India Ltd. | 123,000 | | 784,021 |
| Media 1.6% | | | |
| Jagran Prakashan Ltd. | 455,000 | | 629,674 |
| aTV18 Broadcast Ltd. | 800,000 | | 299,657 |
| | | | 929,331 |
| Metals & Mining 1.8% | | | |
| Gujarat Mineral Development Corp. Ltd. | 410,000 | | 683,322 |
| Hindalco Industries Ltd. | 182,000 | | 337,195 |
| | | | 1,020,517 |
| Oil, Gas & Consumable Fuels 12.2% | | | |
| Bharat Petroleum Corp. Ltd. | 100,500 | | 582,152 |
| Coal India Ltd. | 166,000 | | 768,477 |
| Great Eastern Shipping Co. Ltd. | 135,000 | | 605,065 |
| Oil & Natural Gas Corp. Ltd. | 385,000 | | 1,818,595 |
| Reliance Industries Ltd. | 225,000 | | 3,307,160 |
| | | | 7,081,449 |
| Personal Products 2.0% | | | |
| Marico Ltd. | 340,000 | | 1,163,716 |
| Pharmaceuticals 8.9% | | | |
| Cadila Healthcare Ltd. | 83,000 | | 886,616 |
| Dr. Reddy’s Laboratories Ltd. | 53,000 | | 2,097,040 |
| Lupin Ltd. | 40,000 | | 571,700 |
| Pfizer Ltd. | 31,305 | | 541,840 |
| Torrent Pharmaceuticals Ltd. | 151,000 | | 1,088,754 |
| | | | 5,185,950 |
| Textiles, Apparel & Luxury Goods 1.1% | | | |
| Titan Industries Ltd. | 143,778 | | 616,843 |
| Thrifts & Mortgage Finance 1.5% | | | |
| Housing Development Finance Corp. Ltd. | 64,000 | | 879,200 |
| Transportation Infrastructure 1.1% | | | |
| aGujarat Pipavav Port Ltd. | 780,000 | | 631,454 |
42 | Annual Report
FT (Mauritius) Offshore Investments Limited
Statement of Investments, October 31, 2013 (continued)
(Expressed in U.S. Dollars)
| | | |
| | Shares | | Value |
| Common Stocks (continued) | | | |
| India (continued) | | | |
| Wireless Telecommunication Services 9.5% | | | |
| Bharti Airtel Ltd. | 810,000 | $ | 4,758,527 |
| Idea Cellular Ltd. | 286,000 | | 795,967 |
| | | | 5,554,494 |
| Total Common Stocks (Cost $50,780,205) | | | 55,901,201 |
| Other Assets, less Liabilities 4.0% | | | 2,304,518 |
| Net Assets 100.0% | | $ | 58,205,719 |
| |
| |
| aNon-income producing. | | | |
Annual Report | The accompanying notes are an integral part of these financial statements. | 43
FT (Mauritius) Offshore Investments Limited
Financial Statements
(Expressed in U.S. Dollars)
Statement of Assets and Liabilities
October 31, 2013
| | |
| Assets: | | |
| Investments in securities: | | |
| Cost | $ | 50,780,205 |
| Value | $ | 55,901,201 |
| Cash | | 266,009 |
| Foreign currency, at value (cost $2,376,347) | | 2,351,470 |
| Receivables from dividends | | 4,715 |
| Total assets | | 58,523,395 |
| Liabilities: | | |
| Payables: | | |
| Capital shares redeemed | | 253,717 |
| Management fees | | 43,731 |
| Administrative fees | | 2,950 |
| Accrued expenses and other liabilities | | 17,278 |
| Total liabilities | | 317,676 |
| Net assets, at value | $ | 58,205,719 |
| Shares outstanding | | 6,336,361 |
| Net asset value per share | $ | 9.19 |
44 | The accompanying notes are an integral part of these financial statements. | Annual Report
FT (Mauritius) Offshore Investments Limited
Financial Statements (continued)
(Expressed in U.S. Dollars)
Statement of Operations
for the year ended October 31, 2013
| | | |
| Investment income: | | | |
| Dividends | $ | 1,096,459 | |
| Expenses: | | | |
| Management fees (Note 3a) | | 598,452 | |
| Administrative fees (Note 3b) | | 35,405 | |
| Custodian fees | | 55,367 | |
| Reports to shareholders | | 1,500 | |
| Professional fees | | 4,948 | |
| Directors’ fees and expenses | | 10,000 | |
| Other | | 20,472 | |
| Total expenses | | 726,144 | |
| Net investment income | | 370,315 | |
| Realized and unrealized gains (losses): | | | |
| Net realized gain (loss) from: | | | |
| Investments | | (1,584,622 | ) |
| Foreign currency transactions | | (255,385 | ) |
| Net realized gain (loss) | | (1,840,007 | ) |
| Net change in unrealized appreciation (depreciation) on: | | | |
| Investments | | (686,742 | ) |
| Translation of other assets and liabilities denominated in foreign currencies | | (68,654 | ) |
| Net change in unrealized appreciation (depreciation) | | (755,396 | ) |
| Net realized and unrealized gain (loss) | | (2,595,403 | ) |
| Net increase (decrease) in net assets resulting from operations | $ | (2,225,088 | ) |
Annual Report | The accompanying notes are an integral part of these financial statements. | 45
FT (Mauritius) Offshore Investments Limited
Financial Statements (continued)
(Expressed in U.S. Dollars)
| | | | | | | |
| Statements of Changes in Net Assets | | | | | | | |
| |
| |
| | | Year Ended October 31, | |
| | | 2013 | | | | 2012 | |
| Increase (decrease) in net assets: | | | | | | | |
| Operations: | | | | | | | |
| Net investment income | $ | 370,315 | | | $ | 143,502 | |
| Net realized gain (loss) from investments and foreign currency transactions | | (1,840,007 | ) | | | (9,017,855 | ) |
| Net change in unrealized appreciation (depreciation) on investments, translation of other assets | | | | | | | |
| and liabilities denominated in foreign currencies | | (755,396 | ) | | | 1,636,805 | |
| Net increase (decrease) in net assets resulting from operations | | (2,225,088 | ) | | | (7,237,548 | ) |
| Capital share transactions (Note 2) | | (9,578,959 | ) | | | (13,009,304 | ) |
| Net increase (decrease) in net assets | | (11,804,047 | ) | | | (20,246,852 | ) |
| Net assets: | | | | | | | |
| Beginning of year | | 70,009,766 | | | | 90,256,618 | |
| End of year | $ | 58,205,719 | | $ | 70,009,766 | |
46 | The accompanying notes are an integral part of these financial statements. | Annual Report
FT (Mauritius) Offshore Investments Limited
Notes to Financial Statements
(Expressed in U.S. Dollars)
1. ORGANIZATION AND SIGNIFICANT ACCOUNTING POLICIES
FT (Mauritius) Offshore Investments Limited (Portfolio) is registered with and regulated by the Mauritius Financial Services Commission. The Portfolio was formed for the purpose of facilitating the Franklin India Growth Fund’s (Fund) purchase of securities of a wide selection of Indian companies, consistent with the Fund’s investment strategies and has elected to be treated as a disregarded entity for United States federal income tax purposes.
At October 31, 2013, the Fund owned 100% of the Portfolio.
The following summarizes the Portfolio’s significant accounting policies.
a. Financial Instrument Valuation
The Portfolio’s investments in financial instruments are carried at fair value daily. Fair value is the price that would be received to sell an asset or paid to transfer a liability in an orderly transaction between market participants on the measurement date. Under procedures approved by the Fund’s Board of Trustees (the Board), the Fund’s administrator, investment manager and other affiliates have formed the Valuation and Liquidity Oversight Committee (VLOC). The VLOC provides administration and oversight of the Portfolio’s valuation policies and procedures, which are approved annually by the Board. Among other things, these procedures allow the Portfolio to utilize independent pricing services, quotations from securities and financial instrument dealers, and other market sources to determine fair value.
Equity securities listed on an exchange or on the NASDAQ National Market System are valued at the last quoted sale price or the official closing price of the day, respectively. Foreign equity securities are valued as of the close of trading on the foreign stock exchange on which the security is primarily traded, or the NYSE, whichever is earlier. The value is then converted into its U.S. dollar equivalent at the foreign exchange rate in effect at the close of the NYSE on the day that the value of the security is determined. Over-the-counter (OTC) securities are valued within the range of the most recent quoted bid and ask prices. Securities that trade in multiple markets or on multiple exchanges are valued according to the broadest and most representative market. Certain equity securities are valued based upon fundamental characteristics or relationships to similar securities.
The Portfolio follows the Fund’s procedures to determine the fair value of financial instruments for which market prices are not reliable or readily available. Under these procedures, the VLOC convenes on a regular basis to review such financial instruments and considers a number of factors, including significant unobservable valuation inputs, when arriving at fair value. The VLOC primarily employs a market-based approach which may use related or comparable assets or liabilities, recent transactions, market multiples, book values, and other relevant information for the investment to determine the fair value of the investment. An income-based valuation approach may also be used in which the anticipated future cash flows of the investment are discounted to
Annual Report | 47
FT (Mauritius) Offshore Investments Limited
Notes to Financial Statements (continued)
(Expressed in U.S. Dollars)
| 1. | ORGANIZATION AND SIGNIFICANT ACCOUNTING POLICIES (continued) |
| a. | Financial Instrument Valuation (continued) |
calculate fair value. Discounts may also be applied due to the nature or duration of any restrictions on the disposition of the investments. Due to the inherent uncertainty of valuations of such investments, the fair values may differ significantly from the values that would have been used had an active market existed. The VLOC employs various methods for calibrating these valuation approaches including a regular review of key inputs and assumptions, transactional back-testing or disposition analysis, and reviews of any related market activity.
Trading in securities on foreign securities stock exchanges and OTC markets may be completed before the daily close of business on the NYSE. Occasionally, events occur between the time at which trading in a foreign security is completed and the close of the NYSE that might call into question the reliability of the value of a portfolio security held by the Portfolio. As a result, differences may arise between the value of the Portfolio’s portfolio securities as determined at the foreign market close and the latest indications of value at the close of the NYSE. In order to minimize the potential for these differences, the VLOC monitors price movements following the close of trading in foreign stock markets through a series of country specific market proxies (such as baskets of American Depositary Receipts, futures contracts and exchange traded funds). These price movements are measured against established trigger thresholds for each specific market proxy to assist in determining if an event has occurred that may call into question the reliability of the values of the foreign securities held by the Portfolio. If such an event occurs, the securities may be valued using fair value procedures, which may include the use of independent pricing services.
In addition, certain foreign markets may be open on days that the NYSE is closed, which could result in differences between the value of the Portfolio’s portfolio securities on the last business day and the last calendar day of the reporting period. Any significant security valuation changes due to an open foreign market are adjusted and reflected by the Funds for financial reporting purposes.
b. Foreign Currency Translation
Portfolio securities and other assets and liabilities denominated in foreign currencies are translated into U.S. dollars based on the exchange rate of such currencies against U.S. dollars on the date of valuation. The Portfolio may enter into foreign currency exchange contracts to facilitate transactions denominated in a foreign currency. Purchases and sales of securities, income and expense items denominated in foreign currencies are translated into U.S. dollars at the exchange rate in effect on the transaction date. Portfolio securities and assets and liabilities denominated in foreign currencies contain risks that those currencies will decline in value relative to the U.S. dollar. Occasionally, events may impact the availability or reliability of foreign exchange rates used to convert the U.S. dollar equivalent value. If such an event occurs, the foreign exchange rate will be valued at fair value using procedures established and approved by the Board.
48 | Annual Report
FT (Mauritius) Offshore Investments Limited
Notes to Financial Statements (continued)
(Expressed in U.S. Dollars)
| 1. | ORGANIZATION AND SIGNIFICANT ACCOUNTING POLICIES (continued) |
| b. | Foreign Currency Translation (continued) |
The Portfolio does not separately report the effect of changes in foreign exchange rates from changes in market prices on securities held. Such changes are included in net realized and unrealized gain or loss from investments on the Statement of Operations.
Realized foreign exchange gains or losses arise from sales of foreign currencies, currency gains or losses realized between the trade and settlement dates on securities transactions and the difference between the recorded amounts of dividends, interest, and foreign withholding taxes and the U.S. dollar equivalent of the amounts actually received or paid. Net unrealized foreign exchange gains and losses arise from changes in foreign exchange rates on foreign denominated assets and liabilities other than investments in securities held at the end of the reporting period.
c. Income Taxes
The Portfolio conducts its investment activities in India as a tax resident of Mauritius and expects to obtain benefits under the double taxation treaty between Mauritius and India (Treaty). To obtain benefits under the Treaty, the Portfolio must meet certain tests and conditions, including the establishment of Mauritius tax residence and related requirements. The Portfolio has obtained a certificate from the Mauritius tax authorities and believes that such certification is evidence that it is a resident of Mauritius under the Treaty. A company which is a tax resident in Mauritius under the Treaty and has no branch or permanent establishment in India, will not be subject to capital gains tax in India on the sale of Indian securities but is subject to Indian withholding tax on interest earned on Indian securities up to maximum rate of 21.63% (which includes surcharges). There is no withholding tax in India in respect of dividends paid by Indian companies and such dividends are exempt in the hands of the shareholders.
The Portfolio holds a Category 1 Global Business License for the purpose of the Financial Services Act 2007 and under current laws and regulations, is subject to tax in Mauritius at the rate of 15% on its net income. However, the Portfolio is entitled to a deemed tax credit equivalent to the higher of actual foreign tax suffered or a presumed foreign tax equivalent of 80% of the Mauritian tax on its foreign source income. Thus, the effective tax rate in Mauritius should not exceed 3% (i.e. 15% less 80% of 15%). Indian companies making distributions are, however, liable to a dividend distribution tax equivalent to 16.995% of the dividends distributed. A company holding at least 5% of the share capital of an Indian company and receiving dividends from that Indian company may claim a credit for tax paid by the Indian company on its profits out of which the dividends were distributed including the dividend distribution tax. No Mauritian capital gains tax is payable on profits arising from sale of securities, and any dividends and redemption proceeds paid by the Portfolio to its shareholders will be exempt from withholding or other tax.
Annual Report | 49
FT (Mauritius) Offshore Investments Limited
Notes to Financial Statements (continued)
(Expressed in U.S. Dollars)
| 1. | ORGANIZATION AND SIGNIFICANT ACCOUNTING POLICIES (continued) |
| c. | Income Taxes (continued) |
The Portfolio continues to: (i) comply with the requirements of the Treaty; (ii) be a tax resident of Mauritius; and (iii) maintain that its central management and control resides in Mauritius, and therefore management believes that the Portfolio will be able to obtain the benefits of the Treaty. Accordingly, no provision for Indian income taxes has been made in the accompanying financial statements of the Portfolio for taxes related to capital gains or dividends.
The Indian Finance Minister announced the introduction of a General Anti Avoidance Rule (“GAAR”) in the Indian tax law in the 2012/2013 budget. Subsequently, following representations made by stakeholders, the implementation of the GAAR provisions has been deferred until assessment year April 1, 2016.
The Portfolio’s accounting policy in accordance with accounting principles generally accepted in the United States of America (U.S. GAAP) is to account for changes in tax laws when the laws are enacted.
The India tax law also includes provisions that impose tax on certain transfers of shares of non-Indian companies that substantially derive their value from Indian assets. Uncertainty exists with respect to the application of this law on investment structures such as the Portfolio and the Fund. However, based on judgment and analysis of the facts and circumstances, management currently believes that the provisions are not likely to have a material impact on the Portfolio and the Fund.
d. Security Transactions, Investment Income and Expenses
Security transactions are accounted for on trade date. Realized gains and losses on security transactions are determined on a specific identification basis. Estimated expenses are accrued daily. Dividend income is recorded on the ex-dividend date except that certain dividends from foreign securities are recognized as soon as the Portfolio is notified of the ex-dividend date.
e. Accounting Estimates
The preparation of financial statements in accordance with accounting principles generally accepted in the United States of America requires management to make estimates and assumptions that affect the reported amounts of assets and liabilities at the date of the financial statements and the amounts of income and expenses during the reporting period. Actual results could differ from those estimates.
50 | Annual Report
FT (Mauritius) Offshore Investments Limited
Notes to Financial Statements (continued)
(Expressed in U.S. Dollars)
| 1. | ORGANIZATION AND SIGNIFICANT ACCOUNTING POLICIES (continued) |
| f. | Guarantees and Indemnifications |
Under the Portfolio’s organizational documents, the Portfolio’s officers and directors are indemnified by the Portfolio against certain liabilities arising out of the performance of their duties to the Portfolio. Additionally, in the normal course of business, the Portfolio enters into contracts with service providers that contain general indemnification clauses. The Portfolio’s maximum exposure under these arrangements is unknown as this would involve future claims that may be made against the Portfolio that have not yet occurred. Currently, the Portfolio expects the risk of loss to be remote.
2. SHARES OF BENEFICIAL INTEREST
At October 31, 2013, there were an unlimited number of shares authorized (without par value).
Transactions in the Portfolio’s shares were as follows:
| | | | | | | | | | |
| | | | | Year Ended October 31, | | | | |
| | | | | 2013 | | 2012 | |
| | Shares | | | Amount | | Shares | | | Amount | |
| Shares sold | 784,648 | | $ | 7,545,873 | | 2,538,328 | | $ | 23,465,071 | |
| Shares redeemed | (1,919,385 | ) | | (17,124,832 | ) | (4,204,065 | ) | | (36,474,375 | ) |
| Net increase (decrease) | (1,134,737 | ) | $ | (9,578,959 | ) | (1,665,737 | ) | $ | (13,009,304 | ) |
3. TRANSACTIONS WITH AFFILIATES
Franklin Resources, Inc. is the holding company of Franklin Advisers, Inc. (Advisers) which is the investment manager of the Portfolio.
a. Management Fees
The Portfolio pays an investment management fee to Advisers equal to 80% of the total management fee with the remainder to be paid by the Fund based on the average daily net assets of the Fund as follows:
| | |
| Annualized Fee Rate | | Net Assets |
| 1.100 | % | Up to and including $1 billion |
| 1.050 | % | Over $1 billion, up to and including $5 billion |
| 1.000 | % | Over $5 billion, up to and including $10 billion |
| 0.950 | % | Over $10 billion, up to and including $15 billion |
| 0.900 | % | Over $15 billion, up to and including $20 billion |
| 0.850 | % | In excess of $20 billion |
Annual Report | 51
FT (Mauritius) Offshore Investments Limited
Notes to Financial Statements (continued)
(Expressed in U.S. Dollars)
| 3. | TRANSACTIONS WITH AFFILIATES (continued) |
| b. | Administrative Fees |
The Portfolio pays an administrative fee to International Financial Services Limited (IFS), a Mauritius company, an annual fee of $30,000 plus reimbursement of certain expenses. Certain directors of the Portfolio are also directors of IFS.
4. INVESTMENT TRANSACTIONS
Purchases and sales of investments (excluding short term securities) for the period ended October 31, 2013, aggregated $11,012,849 and $19,748,207, respectively.
5. CONCENTRATION OF RISK
Investing in Indian equity securities through the Portfolio may include certain risks and considerations not typically associated with investing in U.S. securities, such as fluctuating currency values, less liquidity, expropriation, confiscatory taxation, nationalization, exchange control regulations (including currency blockage), differing legal standards and changing local and regional economic, political and social conditions, which may result in greater market volatility.
6. FAIR VALUE MEASUREMENTS
The Portfolio follows a fair value hierarchy that distinguishes between market data obtained from independent sources (observable inputs) and the Portfolio’s own market assumptions (unobservable inputs). These inputs are used in determining the value of the Portfolio’s financial instruments and are summarized in the following fair value hierarchy:
- Level 1 – quoted prices in active markets for identical financial instruments
- Level 2 – other significant observable inputs (including quoted prices for similar financial instruments, interest rates, prepayment speed, credit risk, etc.)
- Level 3 – significant unobservable inputs (including the Portfolio’s own assumptions in determining the fair value of financial instruments)
The input levels are not necessarily an indication of the risk or liquidity associated with financial instruments at that level.
For movements between the levels within the fair value hierarchy, the Portfolio has adopted a policy of recognizing the transfers as of the date of the underlying event which caused the movement.
At October 31, 2013, all of the Portfolio’s investments in financial instruments carried at fair value were valued using Level 1 inputs. For detailed categories, see the accompanying Statement of Investments.
52 | Annual Report
FT (Mauritius) Offshore Investments Limited
Notes to Financial Statements (continued)
(Expressed in U.S. Dollars)
7. NEW ACCOUNTING PRONOUNCEMENTS
In December 2011, the Financial Accounting Standards Board (FASB) issued Accounting Standards Update (ASU) No. 2011-11, Balance Sheet (Topic 210): Disclosures about Offsetting Assets and Liabilities. The amendments in the ASU enhance disclosures about offsetting of financial assets and liabilities to enable investors to understand the effect of these arrangements on a fund’s financial position. In January 2013, FASB issued ASU No. 2013-01, Balance Sheet (Topic 210): Clarifying the Scope of Disclosures about Offsetting Assets and Liabilities. The amendments in ASU No. 2013-01 clarify the intended scope of disclosures required by ASU No. 2011-11. These ASUs are effective for interim and annual reporting periods beginning on or after January 1, 2013. The Portfolio believes the adoption of these ASUs will not have a material impact on its financial statements.
8. SUBSEQUENT EVENTS
The Portfolio has evaluated subsequent events through the issuance of the financial statements and determined that no events have occurred that require disclosure.
Annual Report | 53
FT (Mauritius) Offshore Investments Limited
Report of Independent Registered Public Accounting Firm
To the Board of Directors and Shareholders of FT (Mauritius) Offshore Investments Limited
In our opinion, the accompanying statement of assets and liabilities, including the statement of investments, and the related statements of operations and of changes in net assets and the financial highlights present fairly, in all material respects, the financial position of FT (Mauritius) Offshore Investments Limited (the “Portfolio”) at October 31, 2013, the results of its operations for the year then ended, the changes in its net assets for each of the two years in the period then ended and the financial highlights for each of the five years in the period then ended, in conformity with accounting principles generally accepted in the United States of America. These financial statements and financial highlights (hereafter referred to as “financial statements”) are the responsibility of the Portfolio’s management. Our responsibility is to express an opinion on these financial statements based on our audits. We conducted our audits of these financial statements in accordance with the standards of the Public Company Accounting Oversight Board (United States). Those standards require that we plan and perform the audit to obtain reasonable assurance about whether the financial statements are free of material misstatement. An audit includes examining, on a test basis, evidence supporting the amounts and disclosures in the financial statements, assessing the accounting principles used and significant estimates made by management, and evaluating the overall financial statement presentation. We believe that our audits, which included confirmation of securities at October 31, 2013 by correspondence with the custodian and brokers, provide a reasonable basis for our opinion.
PricewaterhouseCoopers LLP
San Francisco, California
December 17, 2013
54 | Annual Report
Franklin Templeton International Trust
Shareholder Information
Franklin India Growth Fund
Proxy Voting Policies and Procedures
The Fund’s investment manager has established Proxy Voting Policies and Procedures (Policies) that the Fund uses to determine how to vote proxies relating to portfolio securities. Shareholders may view the Fund’s complete Policies online at franklintempleton.com. Alternatively, shareholders may request copies of the Policies free of charge by calling the Proxy Group collect at (954) 527-7678 or by sending a written request to: Franklin Templeton Companies, LLC, 300 S.E. 2nd Street, Fort Lauderdale, FL 33301, Attention: Proxy Group. Copies of the Fund’s proxy voting records are also made available online at franklintempleton.com and posted on the U.S. Securities and Exchange Commission’s website at sec.gov and reflect the most recent 12-month period ended June 30.
Quarterly Statement of Investments
The Fund files a complete statement of investments with the U.S. Securities and Exchange Commission for the first and third quarters for each fiscal year on Form N-Q. Shareholders may view the filed Form N-Q by visiting the Commission’s website at sec.gov. The filed form may also be viewed and copied at the Commission’s Public Reference Room in Washington, DC. Information regarding the operations of the Public Reference Room may be obtained by calling (800) SEC-0330.
Householding of Reports and Prospectuses
You will receive the Fund’s financial reports every six months as well as an annual updated summary prospectus (prospectus available upon request). To reduce Fund expenses, we try to identify related shareholders in a household and send only one copy of the financial reports and summary prospectus. This process, called “householding,” will continue indefinitely unless you instruct us otherwise. If you prefer not to have these documents householded, please call us at (800) 632-2301. At any time you may view current prospectuses/summary prospectuses and financial reports on our website. If you choose, you may receive these documents through electronic delivery.
Annual Report | 55
This page intentionally left blank.

| 1
Annual Report
Franklin World Perspectives Fund
Your Fund’s Goal and Main Investments: Franklin World Perspectives Fund seeks long-term capital appreciation. Under normal market conditions, the Fund invests primarily in equity securities in developed, emerging and frontier markets across the entire market capitalization spectrum.
Performance data represent past performance, which does not guarantee future results. Investment return and principal value will fluctuate, and you may have a gain or loss when you sell your shares. Current performance may differ from figures shown. Please visit franklintempleton.com or call (800) 342-5236 for most recent month-end performance.
We are pleased to bring you Franklin World Perspectives Fund’s annual report for the fiscal year ended October 31, 2013.
Performance Overview
Franklin World Perspectives Fund – Class A delivered a +27.17% cumulative total return for the 12 months under review. In comparison, the Fund’s benchmark, the MSCI All Country World Plus Frontier Markets Index (ACWI FM), which measures stock performance in developed, emerging and frontier markets, produced a +23.96% total return.1 You can find more of the Fund’s performance data in the Performance Summary beginning on page 13.
Economic and Market Overview
The 12 months under review encompassed a period of reinvigorated policy support and economic recovery in the developed world, which offset a slowdown in emerging markets, periods of bond sell-offs and rising geopolitical tensions. Leadership transitions in some of the world’s largest economies, including the U.S., Germany, China and Japan, proceeded smoothly. The drama of electoral politics was replaced by that of fiscal politics as U.S. lawmakers struck a deal on New Year’s Day to partially avert automatic tax hikes and spending cuts. Late in the period, a partial U.S. federal government shutdown ended after Congress agreed to fund the government and raise the debt limit through early 2014. The U.S. Federal Reserve Board (Fed) noted that although the government’s fiscal policy may have restrained growth, the U.S. economy maintained its underlying strength.
1. Source: © 2013 Morningstar. All Rights Reserved. The information contained herein: (1) is proprietary to Morningstar and/or its content providers; (2) may not be copied or distributed; and (3) is not warranted to be accurate, complete or timely. Neither Morningstar nor its content providers are responsible for any damages or losses arising from any use of this information. The index is unmanaged and includes reinvested dividends. One cannot invest directly in an index, and an index is not representative of the Fund’s portfolio.
The dollar value, number of shares or principal amount, and names of all portfolio holdings are listed in the Fund’s Statement of Investments (SOI). The SOI begins on page 24.
Annual Report | 3

The stock market rally in developed markets accelerated in 2013 amid redoubled central bank commitments, continued corporate earnings strength and increasing signs of economic progress, although the recovery remained uneven. U.S. growth and employment trends generally exceeded expectations, and several major U.S. equity indexes reached new nominal highs. The eurozone emerged from its longest recession on record, while Japan’s growth improved but failed to meet analysts’ expectations. Growth in China and emerging markets, however, tended to slow.
Differences in global economic trends corresponded with increasingly divergent policy approaches. The Fed vowed to keep interest rates low until unemployment met its 6.5% target but sparked considerable volatility and a Treasury sell-off by suggesting it might taper monthly bond purchases should economic conditions warrant. Amid uncertainty about future Fed actions, the International Monetary Fund (IMF) adjusted downward its world growth forecasts for 2013 and 2014. The European Central Bank cut benchmark interest rates to a record low and pledged to maintain systemic support following political turmoil in Greece, Spain, Portugal and Italy. Germany’s re-election of Chancellor Angela Merkel was largely perceived as a vote of support for ongoing eurozone reform measures. In Asia, the Bank of Japan set an explicit inflation target and pledged to double bond purchases in an unprecedented wave of policy reform. Emerging market central banks were less accommodative, with Brazil’s central bank hiking interest rates amid rising inflation and China’s central bank taking measures to curb real estate and credit speculation. Chinese liquidity tightening rattled credit markets, and a spike in interbank lending rates underscored concerns about the country’s shadow banking system.
Volatility engulfed the broader emerging market region as protests roiled Turkey and Brazil, civil war threatened Egypt and international military intervention looked possible in Syria. Regional asset prices tumbled as many investors responded to rising bond rates by unwinding highly leveraged emerging market carry trades.2 In response, emerging market stocks recorded their biggest outflows on record and regional currencies sharply depreciated. However, emerging market stocks generally performed well late in the period, and oil staged a late rally based on supply concerns related to geopolitical turmoil. Gold, which had recorded its biggest price drop in four decades over the summer, recovered somewhat at period-end. Increasingly divergent economic and political circumstances during the period resulted in declining market correlations, which many bottom-up investors perceived as more favorable.
2. In a carry trade, an investor seeks to profit from an interest rate differential by borrowing low-yielding currencies and lending high-yielding currencies. The use of borrowed capital to facilitate the trade creates leverage for the borrower.
4 | Annual Report
Investment Strategy
While we have overall responsibility for the Fund’s investments, we manage the Fund using a multi-manager approach. We consult with Franklin Templeton’s local asset management teams (subadvisors) based in countries around the world to help determine regional and country allocations, and each subadvisor is responsible for selecting investments for that portion of the Fund’s portfolio allocated to it. We work closely with the subadvisors to develop local portfolios of securities seeking to outperform the relevant market of each region and combine those portfolios into a single global growth equity fund. The Fund’s actual exposure to various regions and markets will vary from time to time according to our and the subadvisors’ opinions as to the prevailing conditions and prospects for these markets.
Using a growth-oriented investment style, we seek to invest in growth-oriented equity securities of companies in developed, emerging and frontier regions and countries around the world. When choosing equity investments for the Fund, we and the subadvisors, with the benefit of local knowledge and market insight, apply a research-driven, bottom-up, fundamental long-term approach. We focus on the market price of a company’s securities relative to our and the sub-advisors’ evaluations of the company’s long-term earnings, asset value and cash flow potential. We seek to invest in financially strong companies with favorable growth potential and sustainable competitive advantages.
Manager’s Discussion
Led by the U.S. and Europe, developed market stocks, as measured by the MSCI World Index, generally delivered higher performance than their emerging market peers, as measured by the MSCI Emerging Markets Index, for the 12 months under review. Although frontier markets stocks, as measured by the MSCI Frontier Markets Index, generally delivered healthy performance during most of the period, they slightly underperformed developed markets as Europe and the U.S. gained ground near period-end. Despite their performance, European stocks generally exhibited the highest volatility, and dramatic movements in emerging market stocks also occurred as investors focused on the implications from potential changes in developed market monetary policy. Overall, the Fund’s emerging market holdings underperformed their developed market counterparts, mirroring the broader equity markets, and the Fund’s frontier market holdings delivered strong performance.
Uncertainty drove global stock markets as investors weighed the effects of potential monetary policy changes by major central banks and political gridlock in many countries. Although the investment climate remained challenging, in general the backdrop improved toward period-end with data increasingly suggesting stabilization in many parts of the global economy.
| | |
| Top 10 Countries | | |
| 10/31/13 | | |
| | % of Total | |
| | Net Assets | |
| U.S. | 44.7 | % |
| U.K. | 9.0 | % |
| Japan | 5.2 | % |
| Canada | 4.6 | % |
| France | 3.2 | % |
| Netherlands | 3.0 | % |
| Brazil | 2.3 | % |
| Australia | 2.3 | % |
| South Korea | 2.1 | % |
| Ireland | 2.0 | % |
Annual Report | 5
| | |
| Top 10 Industries | | |
| 10/31/13 | | |
| | % of Total | |
| | Net Assets | |
| Media | 7.0 | % |
| Commercial Banks | 5.0 | % |
| Energy Equipment & Services | 4.5 | % |
| Insurance | 4.4 | % |
| Biotechnology | 3.7 | % |
| Internet Software & Services | 3.7 | % |
| Beverages | 3.5 | % |
| Foreign Equity | 3.4 | % |
| Pharmaceuticals | 2.9 | % |
| Chemicals | 2.7 | % |
Europe
Stock selection in Europe benefited the Fund’s relative performance compared with the MSCI ACWI FM, particularly in the U.K, France, Sweden and Spain. The Fund’s overweighting in Ireland, as that market appreciated considerably during the period, and an overweighted allocation to the Netherlands were also favorable. From a sector standpoint, key contributors included the Fund’s overweighted allocation to and stock selection in the U.K.’s financials and consumer discretionary sectors, as well as Fund positioning in France’s financials and Sweden’s and Spain’s consumer discretionary sectors.3
France-based credit insurance company Euler Hermes was one of the leading individual contributors to relative and absolute performance.4 U.K.-based short-term financing company International Personal Finance (IPF) was another top performer as the company announced earnings that beat expectations.4 In our view, IPF allowed the Fund to gain exposure to credit creation growth in eastern European countries, and the company has a business model that operates in what we viewed as a well-protected niche. The Fund’s relative and absolute performance also benefited from Savills,4 a U.K.-based property advisory company, and Dignity,4 a U.K.-based company engaged in funeral services, crematoria and pre-arranged funeral plans. Elsewhere in Europe, a position in Mediaset Espana Comunicacion, a Spain-based broadcaster, helped relative performance.4 Positions in Dutch professional information provider Reed Elsevier and Swedish homebuilder JM4 also contributed to relative performance.
In contrast, stock selection in the Netherlands weighed on relative performance, including a position in Fugro, a geotechnical, geophysical and geoscience services company, which announced lower-than-expected earnings. Additionally, U.K.-based floor covering retailer Carpetright4 dampened relative returns after the company reported that its CEO would step down following a negative earnings surprise in the first half of 2013.
In late 2012, investor concerns regarding the U.S. fiscal cliff drove global volatility. The eurozone remained in a deep economic downturn, but its outlook had begun to improve. The sovereign debt crisis reemerged early in 2013 following Italy’s inconclusive election results and Cyprus’ potential exit from the eurozone resulting from uncertainty surrounding the rescue of the insolvent Cypriot banking sector. However, the eurozone economy emerged from recession in the second quarter of 2013 as its gross domestic product grew for the
3. The financials sector comprises capital markets, commercial banks, consumer finance, diversified financial services, insurance, real estate investment trusts, and real estate management and development in the SOI. The consumer discretionary sector comprises auto components; automobiles; diversified consumer services; hotels, restaurants and leisure; household durables; Internet and catalog retail; leisure equipment and products; media; multiline retail; specialty retail; and textiles, apparel and luxury goods in the SOI.
4. This holding is not an index component.

first time in seven quarters. Still, the European Central Bank pledged to consider additional stimulus if necessary against a backdrop of low but improving economic growth and mixed industrial readings. These events led European stocks generally to register double-digit returns during the third quarter of 2013. We believe the European economy will turn the corner, but it is likely to be a slow and uneven recovery.
During the reporting period, we slightly increased the Fund’s weighting in Europe and ended with a neutral position relative to the benchmark. In particular, we increased the allocations to the Netherlands, Germany, Ireland, Norway and Spain. Conversely, we decreased Fund weightings in the U.K., France, Italy and Sweden.
North America
Stock selection in the U.S. and Canada significantly contributed to relative performance. The Fund’s positioning in the U.S. information technology (IT), health care and energy sectors, as well as in Canada’s materials sector, had a particularly positive impact on relative performance.5 U.S.-based Celgene was among the top contributors as the stock price more than doubled during the period. IT companies Google and Facebook also helped relative performance, as did biotechnology companies Gilead Sciences and Biogen Idec.
However, the Fund’s overweighted allocation to Canada detracted from relative returns. In addition, stock selection in the U.S. financials sector, an overweighting in the U.S. IT sector and an underweighting in Canada’s health care sector weighed on relative performance. Notable detractors from absolute results included IT companies Apple and F5 Networks,6 Canadian gold miner Goldcorp6 and U.S. drug management company Express Scripts Holding.
The U.S. underperformed most global equity markets in late 2012 amid intensifying fiscal policy uncertainty, with the November election and faltering corporate earnings growth adding further pressure. Corporate profits ended 2012 having expanded for a third consecutive year and the Fed reaffirmed its commitment to continue its unprecedented monetary stimulus. U.S. stocks generally outpaced global developed and emerging market stocks, U.S. market volatility neared a six-year low and key U.S. economic indicators exceeded expectations during the review period. The housing market rebound grew more
5. The IT sector comprises communications equipment; computers and peripherals; electronic equipment, instruments and components; Internet software and services; IT services; office electronics; semiconductors and semiconductor equipment; and software in the SOI. The health care sector comprises biotechnology; health care equipment and supplies; health care providers and services; health care technology; life sciences, tools and services; and pharmaceuticals in the SOI. The energy sector comprises energy equipment and services; and oil, gas and consumable fuels in the SOI. The materials sector comprises chemicals, construction materials, containers and packaging, metals and mining, and paper and forest products in the SOI.
6. No longer held at period-end.
Annual Report | 7
entrenched, supporting household confidence. Consumer sentiment approached a five-year high, and consumers’ buying power remained intact amid relatively benign inflation reports. Despite periods of uncertainty, the economic recovery appeared on track in the U.S.
We increased the Fund’s exposure to the U.S. during the period under review, although we remained underweighted at period-end. Consumer discretionary, telecommunication services and energy sector allocations increased, while Fund weightings in consumer staples decreased.7 In Canada, we decreased our overall allocation during the period but remained overweighted. We decreased Fund weightings in telecommunication services, consumer discretionary and financials stocks, and increased the consumer staples weighting.8
Asia Pacific (excluding Japan)
In the Asia Pacific (excluding Japan) region, stock selection in Indonesia’s consumer discretionary and consumer staples, Singapore’s industrials and Taiwan’s IT and consumer discretionary sectors benefited relative performance.9 Individual contributors included an off-benchmark holding in Chinese search engine Baidu, which rallied following strong earnings and announcements of plans to move into the mobile search and gaming space through its acquisition of a Chinese mobile app distributor. Taiwan-based Giga Solar Materials4 which researches and develops optical storage media, Indonesia’s consumer goods manufacturer Unilever6 and South Korean automotive drive parts manufacturer Kyungchang Industrial4 also contributed to absolute and relative performance.
Conversely, the Fund’s overweighted allocations to Indonesia, Singapore and South Korea as well as stock selection in Malaysia and Hong Kong weighed on relative performance. An off-benchmark holding in Malaysia’s Nestle detracted from relative results, as did positions in Hong Kong-based pan-Asian retailer Dairy Farm International4 and coffee brand Gourmet Master.4
China’s growth policies attracted attention as policymakers appeared committed to rebalancing the economy, with an increased emphasis on boosting domestic consumption rather than fixed investments. After generally registering gains in the initial months of 2013 following encouraging signs in economic activity and a rise in manufacturing activity, emerging market stocks began
7. The telecommunication services sector comprises diversified telecommunication services and wireless telecommunication services in the SOI.
8. The consumer staples sector comprises beverages, food and staples retailing, food products, household products, personal products and tobacco in the SOI.
9. The industrials sector comprises aerospace and defense, air freight and logistics, commercial services and supplies, construction and engineering, electrical equipment, industrial conglomerates, machinery, marine, professional services, road and rail, trading companies and distributors, and transportation infrastructure in the SOI.
8 | Annual Report
to experience heightened volatility in May, and experienced strong currency movements amid concerns surrounding the potential impact of less accommodative monetary policies in key economies. A simultaneous headwind was the IMF’s downgrade of economic growth forecasts for many Asian economies. Many Asian central banks found themselves caught between balancing the needs to maintain export competitiveness and support growth while at the same time protecting against excessive currency weakness. China’s policymakers stated they would be comfortable compromising on a slower pace of growth going forward to correct economic imbalances and build a more sustainable consumer-based economy, focusing on quality of growth over quantity. Short-term fears over the potential negative impacts of lower global liquidity had mostly faded by period-end as key central banks reaffirmed their commitments to monetary easing. We remained positive about the medium- to long-term prospects of many Asian countries, given generally strong fundamentals such as high savings rates, favorable demographics and low household debt. Given the short-term focus on government policies that dominated the news over much of the past year, we closely monitored the Asia Pacific investment universe, as we believe uncertain times can provide opportunities to find long-term investments that can add value potential over market cycles.
The Fund remained overweighted in the Asia Pacific (excluding Japan) region, although country allocation adjustments were mixed. Fund allocations to Australia, China and Hong Kong decreased, while Fund weightings in India, Indonesia and Taiwan increased.
Japan
An underweighting and unfavorable stock selection in Japan weighed on relative performance. Specifically, industrials and utilities sector positions detracted from relative performance, and stock selection in financials and telecommunication services proved beneficial.10
Shinzo Abe’s election at the end of 2012 reinforced hope for a Japanese economic recovery. Abe announced a well-received program for reviving Japan’s anemic economy. His “three arrows” plan consisted of influencing the Bank of Japan (BOJ) to initiate further monetary easing, a large deficit-financed public works focused government budget and reforms aimed at stimulating private investment. The appointment of a new dovish BOJ governor, Haruhiko Kuroda, boosted expectations of ongoing monetary support for the economy. Japanese yen weakness during the period was seen as positive as it lifted prospects for corporate earnings, which in turn supported the stock market. Overall, Japanese stocks significantly increased in value during the review period’s first half, representing some of the world’s best performing stocks
10. The utilities sector comprises electric utilities, gas utilities and water utilities in the SOI.
| | | |
| Top 10 Equity Holdings | | | |
| 10/31/13 | | | |
| |
| Company | % of Total | |
| Sector/Industry, Country | Net Assets | |
| Apple Inc. | | 1.6 | % |
| Computers & Peripherals, U.S. | | | |
| Euler Hermes SA | | 1.4 | % |
| Insurance, France | | | |
| Google Inc., A | | 1.4 | % |
| Internet Software & Services, U.S. | | | |
| MasterCard Inc., A | | 1.2 | % |
| IT Services, U.S. | | | |
| TGS Nopec Geophysical Co. ASA | | 1.2 | % |
| Energy Equipment & Services, Norway | | |
| Franklin India Growth Fund, Class R6 | 1.2 | % |
| Foreign Equity, India | | | |
| Savills PLC | | 1.2 | % |
| Real Estate Management & Development, | |
| U.K. | | | |
| Gilead Sciences Inc. | | 1.2 | % |
| Biotechnology, U.S. | | | |
| Ecolab Inc. | | 1.1 | % |
| Chemicals, U.S. | | | |
| Reed Elsevier NV | | 1.1 | % |
| Media, Netherlands | | | |
Annual Report | 9
during the period, before pausing for most of the period’s second half. The initial catalysts for the pullback were uncertainty over U.S. monetary easing policies and a possible slowdown in Chinese economic activity. However, fears receded for an early tapering of the Fed’s asset purchase program, and a landslide election victory for the Abe-led coalition in the Upper House election relieved some of these concerns. Still, some observers cited the potential of a large sales tax increase as a headwind. In our view, the Japanese market could gradually make a foundation for the next phase of medium-term growth, although it may go through periods of short-term consolidation.
During the reporting period, we increased the Fund’s Japan weighting, although the Fund remained slightly underweighted at period-end. Our largest allocations were in the consumer discretionary, financials and industrials sectors, which also reflected our largest allocations at the beginning of the period.
Latin America
Although our overweighting in Brazil detracted from relative performance, the Fund benefited from stock selection, particularly in the consumer discretionary and consumer staples sectors. Brazil-based positions in education company Estacio Participacoes, beverage company Companhia de Bebidas das Americas (Ambev) and industrial and financial services company Itausa-Investimentos Itau had a positive impact. Conversely, our overweighted utilities sector allocation and stock selection in the financials sector detracted from relative performance.
Brazilian economic activity continued to recover in early 2013 with accelerating investment supported by a marginal increase in capital goods production. However, moderation in retail sales and job creation weighed on investor sentiment. Global headwinds such as late 2012 U.S. fiscal cliff uncertainty and a slowdown in China’s demand for raw materials also caused investor concern. Persistent price inflation in Brazil led to heightened expectations that the Brazilian central bank would hike interest rates in 2013. In June, a wave of street riots to protest rises in bus and train fares took on national significance and thousands of Brazilians protested publicly. After one week of protests, local governments reversed the increases in public transportation fares. The federal government also responded by announcing a commitment to fiscal austerity, political reform, urban public transportation improvements and investments in public health and education. Once the protests calmed, market attention turned to the potential for an early ending to the Fed’s asset purchase program, which resulted in significant depreciation of emerging market currencies, including Brazil’s real. The real rebounded and financial market volatility subsided after the Fed surprised markets in mid-September by committing to continue asset purchases for an extended period of time. Toward period-end, market participants continued to worry about Brazil’s inflation outlook and the potential for further economic slowdowns.
10 | Annual Report
During the reporting period, the Fund’s allocation to Brazil decreased, although the Fund remained overweighted. We decreased our weighting in the industrials, financials and energy sectors, and increased our weighting in the consumer staples and materials sectors.
Middle East and North Africa (MENA)
The Fund’s overweighted allocation to the United Arab Emirates (UAE) and underweighted allocations to Israel and South Africa helped relative performance, as did stock selection in Israel. Individual contributors included UAE real estate and construction firm Emaar Properties, Qatar-based holding company Gulf International Services4 and Kuwait-based financial, media and technology services company Kuwait Projects.
We viewed the MENA region’s performance during much of the period as satisfactory given the political uncertainties that affected emerging markets, especially the Middle East. The threat of possible U.S. and European airstrikes in Syria and continued social and political tensions in a number of countries including Egypt, Lebanon and Tunisia weighed on sentiment. Positive market performance during the period for Qatar and UAE followed upgrades to emerging markets status by MSCI, and Egypt’s stock market eventually rallied after the Egyptian army seized control of the government from the democratically elected president in July. Some political risks remained, associated with the civil war in Syria and periodic tension in Egypt. These factors led us to stay cautious in our regional outlook. However, we believed fundamentals in individual sectors in certain markets remained intact, and we diligently followed the markets in Qatar and the UAE so we could reassess as the situation became clearer. We continued to favor sectors such as financials and real estate, as well as select industrials and consumer discretionary companies, especially in Saudi Arabia.
Our overall exposure to the MENA region remained relatively unchanged during the period and we remained overweighted relative to the benchmark.
During the period, the U.S. recovery remained on track and, increasingly, Europe’s did as well, with the regions regaining more normal growth levels. However, some emerging markets experienced challenges. These obstacles were notable for countries with policy challenges and fragile finances such as current account deficits. Nevertheless, emerging markets continued to play a significant role in the global economy and their growth rates generally remained relatively strong. Emerging market countries often tend to have different growth drivers than many developed markets and may continue to be particularly sensitive to inflation, developed market policies and capital flows.
At period-end, we believed the European economy’s gathering momentum could potentially lead to earnings revisions. Outside the eurozone, leading economic indicators suggested to us a substantial pick-up in growth potential
What is a current account?
A current account is that part of the balance of payments where all of one country’s international transactions in goods and services are recorded.
What is balance of payments?
Balance of payments is a record of all of a country's exports and imports of goods and services, borrowing and lending with the rest of the world during a particular time period. It helps a country evaluate its competitive strengths and weaknesses and forecast the strength of its currency.
Annual Report | 11
over the coming months. A new Bank of England governor with a strong predilection for measures to reflate the economy was recently appointed, while the U.K. economy continued to benefit from quantitative easing.
In our view, Japan’s prospects likely depend on the proposed wide-ranging structural reform’s effectiveness. Some steps have been taken, such as increasing the sales tax next year to fund cuts in the corporate tax burden, but we believe more will be needed to reform the labor market and other aspects of the Japanese economy. We believe monetary easing may continue to influence other parts of Asia. Asia appears also likely to benefit if growth stabilizes in China and from the country’s increasing focus on domestic-driven growth.
Global markets may continue to be influenced by discussions on the timing of Fed tapering, but the overall easy monetary policy and the global economic backdrop remained favorable to stocks in general during the period. Our focus remains on investing in those companies we believe could have financial strength and growth potential in their markets.
We thank you for your participation in Franklin World Perspectives Fund and look forward to serving your future investment needs.

12 | Annual Report
Performance Summary as of 10/31/13
Your dividend income will vary depending on dividends or interest paid by securities in the Fund’s portfolio, adjusted for operating expenses of each class. Capital gain distributions are net profits realized from the sale of portfolio securities. The performance table and graphs do not reflect any taxes that a shareholder would pay on Fund dividends, capital gain distributions, if any, or any realized gains on the sale of Fund shares. Total return reflects reinvestment of the Fund’s dividends and capital gain distributions, if any, and any unrealized gains or losses.
| | | | | | | | |
| Price and Distribution Information | | | | | | |
| |
| Class A (Symbol: FWPAX) | | | | Change | | 10/31/13 | | 10/31/12 |
| Net Asset Value (NAV) | | | +$ | 2.60 | $ | 12.70 | $ | 10.10 |
| Distributions (11/1/12–10/31/13) | | | | | | | | |
| Dividend Income | $ | 0.1168 | | | | | | |
| Class C (Symbol: n/a) | | | | Change | | 10/31/13 | | 10/31/12 |
| Net Asset Value (NAV) | | | +$ | 2.57 | $ | 12.61 | $ | 10.04 |
| Distributions (11/1/12–10/31/13) | | | | | | | | |
| Dividend Income | $ | 0.0511 | | | | | | |
| Class R (Symbol: n/a) | | | | Change | | 10/31/13 | | 10/31/12 |
| Net Asset Value (NAV) | | | +$ | 2.58 | $ | 12.65 | $ | 10.07 |
| Distributions (11/1/12–10/31/13) | | | | | | | | |
| Dividend Income | $ | 0.0783 | | | | | | |
| Advisor Class (Symbol: FWPZX) | | | | Change | | 10/31/13 | | 10/31/12 |
| Net Asset Value (NAV) | | | +$ | 2.60 | $ | 12.72 | $ | 10.12 |
| Distributions (11/1/12–10/31/13) | | | | | | | | |
| Dividend Income | $ | 0.1279 | | | | | | |
Annual Report | 13
Performance Summary (continued)
Performance1
Cumulative total return excludes sales charges. Average annual total returns and value of $10,000 investment include maximum sales charges. Class A: 5.75% maximum initial sales charge; Class C: 1% contingent deferred sales charge in first year only; Class R/Advisor Class: no sales charges.
| | | | | | |
| Class A | | 1-Year | | | Inception (12/16/10) | |
| Cumulative Total Return2 | + | 27.17 | % | + | 29.99 | % |
| Average Annual Total Return3 | + | 19.82 | % | + | 7.32 | % |
| Value of $10,000 Investment4 | $ | 11,982 | | $ | 12,252 | |
| Avg. Ann. Total Return (9/30/13)5 | + | 15.01 | % | + | 6.23 | % |
| Total Annual Operating Expenses6 | | 1.59% (with waiver) | | | 2.20% (without waiver) | |
| Class C | | 1-Year | | | Inception (12/16/10) | |
| Cumulative Total Return2 | + | 26.22 | % | + | 27.50 | % |
| Average Annual Total Return3 | + | 25.22 | % | + | 8.82 | % |
| Value of $10,000 Investment4 | $ | 12,522 | | $ | 12,750 | |
| Avg. Ann. Total Return (9/30/13)5 | + | 20.17 | % | + | 7.79 | % |
| Total Annual Operating Expenses6 | | 2.29% (with waiver) | | | 2.90% (without waiver) | |
| Class R | | 1-Year | | | Inception (12/16/10) | |
| Cumulative Total Return2 | + | 26.58 | % | + | 28.52 | % |
| Average Annual Total Return3 | + | 26.58 | % | + | 9.12 | % |
| Value of $10,000 Investment4 | $ | 12,658 | | $ | 12,852 | |
| Avg. Ann. Total Return (9/30/13)5 | + | 21.53 | % | + | 8.10 | % |
| Total Annual Operating Expenses6 | | 1.79% (with waiver) | | | 2.40% (without waiver) | |
| Advisor Class | | 1-Year | | | Inception (12/16/10) | |
| Cumulative Total Return2 | + | 27.26 | % | + | 30.42 | % |
| Average Annual Total Return3 | + | 27.26 | % | + | 9.68 | % |
| Value of $10,000 Investment4 | $ | 12,726 | | $ | 13,042 | |
| Avg. Ann. Total Return (9/30/13)5 | + | 22.11 | % | + | 8.64 | % |
| Total Annual Operating Expenses6 | | 1.29% (with waiver) | | | 1.90% (without waiver) | |
Performance data represent past performance, which does not guarantee future results. Investment return and principal value will fluctuate, and you may have a gain or loss when you sell your shares. Current performance may differ from figures shown. For most recent month-end performance, go to franklintempleton.com or call (800) 342-5236.
14 | Annual Report
Performance Summary (continued)
Total Return Index Comparison for a Hypothetical $10,000 Investment1
Total return represents the change in value of an investment over the periods shown. It includes any applicable maximum sales charge, Fund expenses, account fees and reinvested distributions. The unmanaged index includes reinvestment of any income or distributions. It differs from the Fund in composition and does not pay management fees or expenses. One cannot invest directly in an index.

Annual Report | 15
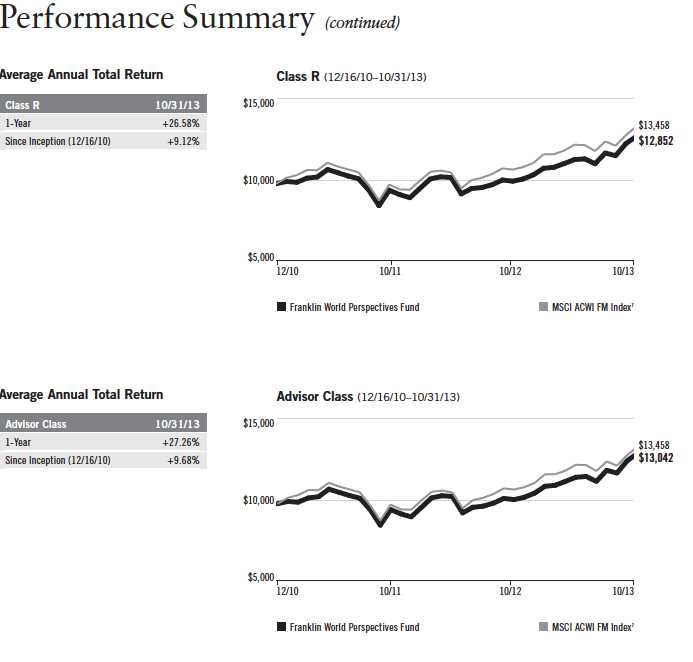
16 | Annual Report
Performance Summary (continued)
Endnotes
All investments involve risks, including possible loss of principal. Special risks are associated with foreign investing, including currency fluctuations, economic instability and political developments. Investments in emerging market countries involve heightened risks related to the same factors, in addition to those associated with these markets’ smaller size, lesser liquidity and lack of established legal, political, business and social frameworks to support securities markets. Smaller company stocks have historically had more price volatility than large-company stocks, particularly over the short term. The Fund is designed for the aggressive portion of a well-diversified portfolio. The Fund is actively managed but there is no guarantee that the manager’s investment decisions will produce the desired results. The Fund’s prospectus also includes a description of the main investment risks.
| |
Class C: Class R: | These shares have higher annual fees and expenses than Class A shares. Shares are available to certain eligible investors as described in the prospectus. These shares have higher annual fees and expenses than Class A shares. |
Advisor Class: | Shares are available to certain eligible investors as described in the prospectus. |
1. The Fund has an expense reduction contractually guaranteed through at least 2/28/14 and fee waivers associated with its investments in a Franklin Templeton money fund and in Franklin India Growth Fund, contractually guaranteed through at least its current fiscal year. Fund investment results reflect the expense reduction and fee waivers, to the extent applicable; without these reductions, the results would have been lower.
2. Cumulative total return represents the change in value of an investment over the periods indicated.
3. Average annual total return represents the average annual change in value of an investment over the periods indicated.
4. These figures represent the value of a hypothetical $10,000 investment in the Fund over the periods indicated.
5. In accordance with SEC rules, we provide standardized average annual total return information through the latest calendar quarter.
6. Figures are as stated in the Fund’s current prospectus. In periods of market volatility, assets may decline significantly, causing total annual Fund operating expenses to become higher than the figures shown.
7. Source: © 2013 Morningstar. The MSCI ACWI FM Index is a free float-adjusted, market capitalization-weighted index designed to measure equity market performance of global developed, emerging and frontier markets.
Annual Report | 17
Your Fund’s Expenses
As a Fund shareholder, you can incur two types of costs:
- Transaction costs, including sales charges (loads) on Fund purchases; and
- Ongoing Fund costs, including management fees, distribution and service (12b-1) fees, and other Fund expenses. All mutual funds have ongoing costs, sometimes referred to as operating expenses.
The following table shows ongoing costs of investing in the Fund and can help you understand these costs and compare them with those of other mutual funds. The table assumes a $1,000 investment held for the six months indicated.
Actual Fund Expenses
The first line (Actual) for each share class listed in the table provides actual account values and expenses. The “Ending Account Value” is derived from the Fund’s actual return, which includes the effect of Fund expenses.
You can estimate the expenses you paid during the period by following these steps. Of course, your account value and expenses will differ from those in this illustration:
| 1. | Divide your account value by $1,000. |
| | If an account had an $8,600 value, then $8,600 ÷ $1,000 = 8.6. |
| 2. | Multiply the result by the number under the heading “Expenses Paid During Period.” |
| | If Expenses Paid During Period were $7.50, then 8.6 x $7.50 = $64.50. |
In this illustration, the estimated expenses paid this period are $64.50.
Hypothetical Example for Comparison with Other Funds
Information in the second line (Hypothetical) for each class in the table can help you compare ongoing costs of investing in the Fund with those of other mutual funds. This information may not be used to estimate the actual ending account balance or expenses you paid during the period. The hypothetical “Ending Account Value” is based on the actual expense ratio for each class and an assumed 5% annual rate of return before expenses, which does not represent the Fund’s actual return. The figure under the heading “Expenses Paid During Period” shows the hypothetical expenses your account would have incurred under this scenario. You can compare this figure with the 5% hypothetical examples that appear in shareholder reports of other funds.
18 | Annual Report
Your Fund’s Expenses (continued)
Please note that expenses shown in the table are meant to highlight ongoing costs and do not reflect any transaction costs, such as sales charges. Therefore, the second line for each class is useful in comparing ongoing costs only, and will not help you compare total costs of owning different funds. In addition, if transaction costs were included, your total costs would have been higher. Please refer to the Fund prospectus for additional information on operating expenses.
| | | | | | | |
| | | Beginning Account | | Ending Account | | Expenses Paid During |
| Class A | | Value 5/1/13 | | Value 10/31/13 | | Period* 5/1/13–10/31/13 |
| Actual | $ | 1,000 | $ | 1,123.90 | | $ | 7.23 |
| Hypothetical (5% return before expenses) | $ | 1,000 | $ | 1,018.40 | | $ | 6.87 |
| Class C | | | | | | | |
| Actual | $ | 1,000 | $ | 1,119.90 | $ | 10.90 |
| Hypothetical (5% return before expenses) | $ | 1,000 | $ | 1,014.92 | $ | 10.36 |
| Class R | | | | | | | |
| Actual | $ | 1,000 | $ | 1,121.50 | | $ | 9.36 |
| Hypothetical (5% return before expenses) | $ | 1,000 | $ | 1,016.38 | | $ | 8.89 |
| Advisor Class | | | | | | | |
| Actual | $ | 1,000 | $ | 1,124.70 | | $ | 6.69 |
| Hypothetical (5% return before expenses) | $ | 1,000 | $ | 1,018.90 | | $ | 6.36 |
| *Expenses are calculated using the most recent six-month expense ratio, net of expense waivers, annualized for each class (A: 1.35%; C: 2.04%; |
| R: 1.75%; and Advisor: 1.25%), multiplied by the average account value over the period, multiplied by 184/365 to reflect the one-half year period. |
Franklin Templeton International Trust
Financial Highlights
| | | | | | | | | |
| Franklin World Perspectives Fund | | | | | | | | | |
| | | Year Ended October 31, | |
| Class A | | 2013 | | | 2012 | | | 2011 | a |
| Per share operating performance | | | | | | | | | |
| (for a share outstanding throughout the year) | | | | | | | | | |
| Net asset value, beginning of year | $ | 10.10 | | $ | 9.63 | | $ | 10.00 | |
| Income from investment operationsb: | | | | | | | | | |
| Net investment incomec | | 0.09 | | | 0.07 | | | 0.05 | |
| Net realized and unrealized gains (losses) | | 2.63 | | | 0.50 | | | (0.41 | ) |
| Total from investment operations | | 2.72 | | | 0.57 | | | (0.36 | ) |
| Less distributions from net investment income | | (0.12 | ) | | (0.10 | ) | | (0.01 | ) |
| Net asset value, end of year | $ | 12.70 | | $ | 10.10 | | $ | 9.63 | |
| |
| Total returnd | | 27.17 | % | | 5.97 | % | | (3.64 | )% |
| |
| Ratios to average net assetse | | | | | | | | | |
| Expenses before waiver and payments by affiliates | | 1.82 | % | | 1.98 | % | | 2.29 | % |
| Expenses net of waiver and payments by affiliates | | 1.35 | %f | | 1.37 | % | | 1.33 | %f |
| Net investment income | | 0.76 | % | | 0.67 | % | | 0.54 | % |
| |
| Supplemental data | | | | | | | | | |
| Net assets, end of year (000’s) | $ | 17,341 | | $ | 12,752 | | $ | 11,796 | |
| Portfolio turnover rate | | 66.56 | % | | 62.96 | % | | 71.86 | % |
aFor the period December 16, 2010 (commencement of operations) to October 31, 2011.
bThe amount shown for a share outstanding throughout the period may not correlate with the Statement of Operations for the period due to the timing of sales and repurchases of
the Fund shares in relation to income earned and/or fluctuating market value of the investments of the Fund.
cBased on average daily shares outstanding.
dTotal return does not reflect sales commissions or contingent deferred sales charges, if applicable, and is not annualized for periods less than one year.
eRatios are annualized for periods less than one year.
fBenefit of expense reduction rounds to less than 0.01%.
20 | The accompanying notes are an integral part of these financial statements. | Annual Report
Franklin Templeton International Trust
Financial Highlights (continued)
| | | | | | | | | |
| Franklin World Perspectives Fund | | | | | | | | | |
| | | Year Ended October 31, | |
| Class C | | 2013 | | | 2012 | | | 2011 | a |
| Per share operating performance | | | | | | | | | |
| (for a share outstanding throughout the year) | | | | | | | | | |
| Net asset value, beginning of year | $ | 10.04 | | $ | 9.57 | | $ | 10.00 | |
| Income from investment operationsb: | | | | | | | | | |
| Net investment income (loss)c | | 0.01 | | | —d | | | (0.01 | ) |
| Net realized and unrealized gains (losses) | | 2.61 | | | 0.52 | | | (0.41 | ) |
| Total from investment operations | | 2.62 | | | 0.52 | | | (0.42 | ) |
| Less distributions from net investment income | | (0.05 | ) | | (0.05 | ) | | (0.01 | ) |
| Net asset value, end of year | $ | 12.61 | | $ | 10.04 | | $ | 9.57 | |
| |
| Total returne | | 26.22 | % | | 5.38 | % | | (4.14 | )% |
| |
| Ratios to average net assetsf | | | | | | | | | |
| Expenses before waiver and payments by affiliates | | 2.51 | % | | 2.62 | % | | 3.00 | % |
| Expenses net of waiver and payments by affiliates | | 2.04 | %g | | 2.01 | % | | 2.04 | %g |
| Net investment income (loss) | | 0.07 | % | | 0.03 | % | | (0.17 | )% |
| |
| Supplemental data | | | | | | | | | |
| Net assets, end of year (000’s) | $ | 3,849 | | $ | 2,820 | | $ | 2,689 | |
| Portfolio turnover rate | | 66.56 | % | | 62.96 | % | | 71.86 | % |
aFor the period December 16, 2010 (commencement of operations) to October 31, 2011.
bThe amount shown for a share outstanding throughout the period may not correlate with the Statement of Operations for the period due to the timing of sales and repurchases of
the Fund shares in relation to income earned and/or fluctuating market value of the investments of the Fund.
cBased on average daily shares outstanding.
dAmount rounds to less than $0.01 per share.
eTotal return does not reflect sales commissions or contingent deferred sales charges, if applicable, and is not annualized for periods less than one year.
fRatios are annualized for periods less than one year.
gBenefit of expense reduction rounds to less than 0.01%.
Annual Report | The accompanying notes are an integral part of these financial statements. | 21
Franklin Templeton International Trust
Financial Highlights (continued)
| | | | | | | | | |
| Franklin World Perspectives Fund | | | | | | | | | |
| | | Year Ended October 31, | |
| Class R | | 2013 | | | 2012 | | | 2011 | a |
| Per share operating performance | | | | | | | | | |
| (for a share outstanding throughout the year) | | | | | | | | | |
| Net asset value, beginning of year | $ | 10.07 | | $ | 9.60 | | $ | 10.00 | |
| Income from investment operationsb: | | | | | | | | | |
| Net investment incomec | | 0.04 | | | 0.03 | | | 0.01 | |
| Net realized and unrealized gains (losses) | | 2.62 | | | 0.51 | | | (0.40 | ) |
| Total from investment operations | | 2.66 | | | 0.54 | | | (0.39 | ) |
| Less distributions from net investment income | | (0.08 | ) | | (0.07 | ) | | (0.01 | ) |
| Net asset value, end of year | $ | 12.65 | | $ | 10.07 | | $ | 9.60 | |
| |
| Total returnd | | 26.58 | % | | 5.70 | % | | (3.94 | )% |
| |
| Ratios to average net assetse | | | | | | | | | |
| Expenses before waiver and payments by affiliates | | 2.22 | % | | 2.36 | % | | 2.71 | % |
| Expenses net of waiver and payments by affiliates | | 1.75 | %f | | 1.75 | % | | 1.75 | %f |
| Net investment income | | 0.36 | % | | 0.29 | % | | 0.12 | % |
| |
| Supplemental data | | | | | | | | | |
| Net assets, end of year (000’s) | $ | 3,163 | | $ | 2,517 | | $ | 2,399 | |
| Portfolio turnover rate | | 66.56 | % | | 62.96 | % | | 71.86 | % |
aFor the period December 16, 2010 (commencement of operations) to October 31, 2011.
bThe amount shown for a share outstanding throughout the period may not correlate with the Statement of Operations for the period due to the timing of sales and repurchases of
the Fund shares in relation to income earned and/or fluctuating market value of the investments of the Fund.
cBased on average daily shares outstanding.
dTotal return is not annualized for periods less than one year.
eRatios are annualized for periods less than one year.
fBenefit of expense reduction rounds to less than 0.01%.
22 | The accompanying notes are an integral part of these financial statements. | Annual Report
Franklin Templeton International Trust
Financial Highlights (continued)
| | | | | | | | | |
| Franklin World Perspectives Fund | | | | | | | | | |
| | | Year Ended October 31, | |
| Advisor Class | | 2013 | | | 2012 | | | 2011 | a |
| Per share operating performance | | | | | | | | | |
| (for a share outstanding throughout the year) | | | | | | | | | |
| Net asset value, beginning of year | $ | 10.12 | | $ | 9.64 | | $ | 10.00 | |
| Income from investment operationsb: | | | | | | | | | |
| Net investment incomec | | 0.10 | | | 0.08 | | | 0.05 | |
| Net realized and unrealized gains (losses) | | 2.63 | | | 0.51 | | | (0.40 | ) |
| Total from investment operations | | 2.73 | | | 0.59 | | | (0.35 | ) |
| Less distributions from net investment income | | (0.13 | ) | | (0.11 | ) | | (0.01 | ) |
| Net asset value, end of year | $ | 12.72 | | $ | 10.12 | | $ | 9.64 | |
| |
| Total returnd | | 27.26 | % | | 6.25 | % | | (3.54 | )% |
| |
| Ratios to average net assetse | | | | | | | | | |
| Expenses before waiver and payments by affiliates | | 1.72 | % | | 1.86 | % | | 2.21 | % |
| Expenses net of waiver and payments by affiliates | | 1.25 | %f | | 1.25 | % | | 1.25 | %f |
| Net investment income | | 0.86 | % | | 0.79 | % | | 0.62 | % |
| |
| Supplemental data | | | | | | | | | |
| Net assets, end of year (000’s) | $ | 13,567 | | $ | 10,662 | | $ | 10,047 | |
| Portfolio turnover rate | | 66.56 | % | | 62.96 | % | | 71.86 | % |
aFor the period December 16, 2010 (commencement of operations) to October 31, 2011.
bThe amount shown for a share outstanding throughout the period may not correlate with the Statement of Operations for the period due to the timing of sales and repurchases of
the Fund shares in relation to income earned and/or fluctuating market value of the investments of the Fund.
cBased on average daily shares outstanding.
dTotal return is not annualized for periods less than one year.
eRatios are annualized for periods less than one year.
fBenefit of expense reduction rounds to less than 0.01%.
Annual Report | The accompanying notes are an integral part of these financial statements. | 23
Franklin Templeton International Trust
Statement of Investments, October 31, 2013
| | | | | | |
| | | | | Shares/ | | |
| | | Franklin World Perspectives Fund | Industry | Units/Rights | | Value |
| | | Common Stocks and Other Equity Interests 95.4% | | | | |
| | | Australia 2.3% | | | | |
| | | Amcor Ltd. | Containers & Packaging | 11,781 | $ | 120,772 |
| | | BHP Billiton Ltd. | Metals & Mining | 3,643 | | 129,746 |
| | | Brambles Ltd. | Commercial Services & Supplies | 9,590 | | 84,344 |
| | | Coca-Cola Amatil Ltd. | Beverages | 4,319 | | 52,690 |
| | | Commonwealth Bank of Australia | Commercial Banks | 816 | | 58,710 |
| | | Computershare Ltd. | IT Services | 10,739 | | 109,074 |
| | | CSL Ltd. | Biotechnology | 1,886 | | 123,959 |
| | | FlexiGroup Ltd. | Consumer Finance | 8,140 | | 36,180 |
| | | Rio Tinto Ltd. | Metals & Mining | 347 | | 20,999 |
| | | SAI Global Ltd. | Professional Services | 6,327 | | 24,592 |
| | | Woolworths Ltd. | Food & Staples Retailing | 2,398 | | 79,146 |
| | | WorleyParsons Ltd. | Energy Equipment & Services | 1,835 | | 38,282 |
| | | | | | | 878,494 |
| | | Belgium 0.9% | | | | |
| | | Anheuser-Busch InBev NV | Beverages | 3,154 | | 328,076 |
| | | Brazil 0.7% | | | | |
| | | Arteris SA | Transportation Infrastructure | 6,100 | | 54,191 |
| | | aCia de Saneamento do Parana, rts., 11/19/13 | Water Utilities | 1,268 | | — |
| | | Companhia de Saneamento Basico do Estado de Sao Paulo | Water Utilities | 4,300 | | 45,571 |
| | | Estacio Participacoes SA | Diversified Consumer Services | 5,500 | | 42,477 |
| | | Fleury SA | Health Care Providers & Services | 9,000 | | 69,708 |
| | | Porto Seguro SA | Insurance | 4,400 | | 55,294 |
| | | | | | | 267,241 |
| | | Canada 4.6% | | | | |
| | | Agrium Inc. | Chemicals | 250 | | 21,336 |
| | | Alimentation Couche-Tard Inc., B | Food & Staples Retailing | 375 | | 25,394 |
| | | ARC Resources Ltd. | Oil, Gas & Consumable Fuels | 1,175 | | 31,188 |
| | | Bank of Montreal | Commercial Banks | 550 | | 38,300 |
| | | Bank of Nova Scotia | Commercial Banks | 1,400 | | 85,099 |
| | | Bonavista Energy Corp. | Oil, Gas & Consumable Fuels | 1,675 | | 19,322 |
| | | Brookfield Asset Management Inc., A | Real Estate Management & | | | |
| | | | Development | 1,950 | | 77,188 |
| | | Calfrac Well Services Ltd. | Energy Equipment & Services | 525 | | 16,361 |
| | | Canadian Imperial Bank of Commerce | Commercial Banks | 900 | | 76,550 |
| | | Canadian National Railway Co. | Road & Rail | 850 | | 93,367 |
| | | Canadian Natural Resources Ltd. | Oil, Gas & Consumable Fuels | 2,050 | | 65,047 |
| | | Canadian Pacific Railway Ltd. | Road & Rail | 1,350 | | 193,144 |
| | | Canadian Pacific Railway Ltd. | Road & Rail | 100 | | 14,292 |
| | | Cenovus Energy Inc. | Oil, Gas & Consumable Fuels | 1,350 | | 40,105 |
| | | Enbridge Inc. | Oil, Gas & Consumable Fuels | 875 | | 37,925 |
| | | Franco-Nevada Corp. | Metals & Mining | 675 | | 30,363 |
| | | Gildan Activewear Inc. | Textiles, Apparel & Luxury Goods | 525 | | 25,302 |
| | | IGM Financial Inc. | Capital Markets | 875 | | 42,154 |
| | | MacDonald Dettwiler and Associates Ltd. | Aerospace & Defense | 565 | | 43,099 |
| | | Major Drilling Group International Inc. | Metals & Mining | 3,250 | | 25,617 |
| | | Manulife Financial Corp. | Insurance | 1,375 | | 24,353 |
| |
| 24 | | | Annual Report | | | | |
Franklin Templeton International Trust
Statement of Investments, October 31, 2013 (continued)
| | | | |
| | | Shares/ | | |
| Franklin World Perspectives Fund | Industry | Units/Rights | | Value |
| Common Stocks and Other Equity Interests (continued) | | | | |
| Canada (continued) | | | | |
| Metro Inc., A | Food & Staples Retailing | 825 | $ | 51,604 |
| Mullen Group Ltd. | Energy Equipment & Services | 700 | | 18,754 |
| aNuvista Energy Ltd. | Oil, Gas & Consumable Fuels | 7,325 | | 46,710 |
| Potash Corp. of Saskatchewan Inc. | Chemicals | 1,400 | | 43,496 |
| Power Corp. of Canada | Insurance | 1,625 | | 47,869 |
| Power Financial Corp. | Insurance | 1,450 | | 47,705 |
| Rogers Communications Inc., B | Wireless Telecommunication | | | |
| | Services | 1,075 | | 48,779 |
| Royal Bank of Canada | Commercial Banks | 950 | | 63,786 |
| Saputo Inc. | Food Products | 475 | | 23,498 |
| Savanna Energy Services Corp. | Energy Equipment & Services | 4,750 | | 35,710 |
| SNC-Lavalin Group Inc., A | Construction & Engineering | 1,475 | | 61,965 |
| Sun Life Financial Inc. | Insurance | 450 | | 15,155 |
| The Toronto-Dominion Bank | Commercial Banks | 700 | | 64,197 |
| Thomson Reuters Corp. | Media | 2,400 | | 90,168 |
| TransCanada Corp. | Oil, Gas & Consumable Fuels | 1,450 | | 65,336 |
| | | | | 1,750,238 |
| Chile 0.2% | | | | |
| iShares MSCI Chile Capped ETF | Foreign Equity | 1,248 | | 62,437 |
| China 1.8% | | | | |
| Airtac International Group | Machinery | 5,000 | | 36,100 |
| aBaidu Inc., ADR | Internet Software & Services | 580 | | 93,322 |
| China Construction Bank Corp., H | Commercial Banks | 101,000 | | 78,424 |
| China Merchants Bank Co. Ltd., H | Commercial Banks | 27,002 | | 53,635 |
| China Mobile Ltd. | Wireless Telecommunication | | | |
| | Services | 1,500 | | 15,749 |
| China Overseas Land & Investment Ltd. | Real Estate Management & | | | |
| | Development | 44,000 | | 135,922 |
| China Resources Gas Group Ltd. | Gas Utilities | 8,000 | | 20,689 |
| China Resources Land Ltd. | Real Estate Management & | | | |
| | Development | 12,000 | | 34,748 |
| China Shenhua Energy Co. Ltd., H | Oil, Gas & Consumable Fuels | 11,500 | | 34,932 |
| CNOOC Ltd. | Oil, Gas & Consumable Fuels | 6,000 | | 12,290 |
| Dongfeng Motor Group Co. Ltd., H | Automobiles | 72,000 | | 101,412 |
| Hengan International Group Co. Ltd. | Personal Products | 4,000 | | 49,014 |
| PetroChina Co. Ltd., H | Oil, Gas & Consumable Fuels | 14,000 | | 16,035 |
| | | | | 682,272 |
| Egypt 0.1% | | | | |
| aEzz Steel | Metals & Mining | 16,720 | | 31,045 |
| France 3.2% | | | | |
| Euler Hermes SA | Insurance | 3,985 | | 526,208 |
| Legrand SA | Electrical Equipment | 6,664 | | 378,536 |
| aLyxor UCITS ETF Eastern Europe (CECE NTR EUR) FC | Foreign Equity | 3,949 | | 104,194 |
| Neopost SA | Office Electronics | 1,734 | | 131,297 |
| Nexans SA | Electrical Equipment | 1,678 | | 74,967 |
| | | | | 1,215,202 |
| |
| | | | | Annual Report | 25 |
Franklin Templeton International Trust
Statement of Investments, October 31, 2013 (continued)
| | | | |
| | | Shares/ | | |
| Franklin World Perspectives Fund | Industry | Units/Rights | | Value |
| Common Stocks and Other Equity Interests (continued) | | | |
| Germany 1.8% | | | | |
| GFK AG | Media | 6,070 | $ | 354,851 |
| Takkt AG | Internet & Catalog Retail | 16,633 | | 330,219 |
| | | | | 685,070 |
| Hong Kong 1.2% | | | | |
| bAIA Group Ltd., 144A | Insurance | 18,200 | | 92,374 |
| Dairy Farm International Holdings Ltd. | Food & Staples Retailing | 9,900 | | 112,167 |
| First Pacific Co. Ltd. | Diversified Financial Services | 12,750 | | 14,505 |
| Gourmet Master Co. Ltd. | Hotels, Restaurants & Leisure | 8,000 | | 53,151 |
| Hong Kong Exchanges & Clearing Ltd. | Diversified Financial Services | 4,131 | | 66,763 |
| Sa Sa International Holdings Ltd. | Specialty Retail | 16,000 | | 17,521 |
| Samsonite International SA | Textiles, Apparel & Luxury Goods | 27,000 | | 73,656 |
| Techtronic Industries Co. Ltd. | Household Durables | 10,000 | | 25,177 |
| | | | | 455,314 |
| India 1.2% | | | | |
| a,cFranklin India Growth Fund, Class R6 | Foreign Equity | 52,876 | | 458,965 |
| Indonesia 0.4% | | | | |
| Astra International Tbk PT | Automobiles | 51,500 | | 30,361 |
| Bank Central Asia Tbk PT | Commercial Banks | 26,000 | | 24,087 |
| Bank Rakyat Indonesia Persero Tbk PT | Commercial Banks | 21,000 | | 14,707 |
| Kalbe Farma Tbk PT | Pharmaceuticals | 271,000 | | 31,232 |
| Surya Citra Media Tbk PT | Media | 196,985 | | 41,039 |
| | | | | 141,426 |
| Ireland 2.0% | | | | |
| aActavis PLC | Pharmaceuticals | 1,900 | | 293,702 |
| C&C Group PLC | Beverages | 49,950 | | 292,820 |
| DCC PLC | Industrial Conglomerates | 4,117 | | 184,824 |
| | | | | 771,346 |
| Italy 0.6% | | | | |
| Prysmian SpA | Electrical Equipment | 9,474 | | 231,574 |
| Japan 5.2% | | | | |
| CANON Inc. | Office Electronics | 1,958 | | 61,533 |
| Chubu Electric Power Co. Inc. | Electric Utilities | 4,329 | | 63,928 |
| Coca-Cola West Company Ltd. | Beverages | 6,478 | | 131,174 |
| FANUC Corp. | Machinery | 348 | | 55,638 |
| Fuji Heavy Industries Ltd. | Automobiles | 2,296 | | 62,371 |
| Hitachi Ltd. | Electronic Equipment, Instruments | | |
| | & Components | 9,273 | | 64,602 |
| INPEX Corp. | Oil, Gas & Consumable Fuels | 2,000 | | 23,066 |
| ITOCHU Corp. | Trading Companies & Distributors | 7,133 | | 85,458 |
| KDDI Corp. | Wireless Telecommunication | | | |
| | Services | 829 | | 44,770 |
| Keihin Electric Express Railway Co. Ltd. | Road & Rail | 10,297 | | 96,661 |
| Keyence Corp. | Electronic Equipment, Instruments | | |
| | & Components | 189 | | 80,732 |
26 | Annual Report
Franklin Templeton International Trust
Statement of Investments, October 31, 2013 (continued)
| | | | | |
| | | | Shares/ | | |
| Franklin World Perspectives Fund | Industry | Units/Rights | | Value |
| Common Stocks and Other Equity Interests (continued) | | | | |
| Japan (continued) | | | | | |
| Komatsu Ltd. | Machinery | | 2,420 | $ | 52,670 |
| Mitsubishi Corp. | Trading Companies & Distributors | | 4,512 | | 90,951 |
| Mitsubishi Estate Co. Ltd. | Real Estate Management & | | | | |
| | Development | | 3,630 | | 103,261 |
| Mitsubishi UFJ Financial Group Inc. | Commercial Banks | | 16,406 | | 103,450 |
| Nippon Steel Sumitomo Metal | Metals & Mining | | 15,578 | | 51,174 |
| Nomura Holdings Inc. | Capital Markets | | 6,120 | | 45,001 |
| Shin-Etsu Chemical Co. Ltd. | Chemicals | | 1,183 | | 66,534 |
| SOFTBANK Corp. | Wireless Telecommunication Services | 917 | | 68,081 |
| Sumitomo Mitsui Financial Group Inc. | Commercial Banks | | 2,078 | | 99,647 |
| T&D Holdings Inc. | Insurance | | 4,981 | | 59,524 |
| Takeda Pharmaceutical Co. Ltd. | Pharmaceuticals | | 2,508 | | 118,991 |
| Toyota Industries Corp. | Auto Components | | 2,465 | | 108,177 |
| Toyota Motor Corp. | Automobiles | | 2,342 | | 151,489 |
| Yokohama Rubber Co. Ltd. | Auto Components | | 9,407 | | 91,654 |
| | | | | | 1,980,537 |
| Kuwait 0.3% | | | | | |
| Agility Public Warehousing Co. KSC | Air Freight & Logistics | | 14,435 | | 36,324 |
| Burgan Bank SAK | Commercial Banks | | 15,363 | | 31,581 |
| Kuwait Projects Co. Holding KSC | Diversified Financial Services | | 22,740 | | 49,163 |
| | | | | | 117,068 |
| Luxembourg 0.1% | | | | | |
| L’Occitane International SA | Specialty Retail | | 20,500 | | 46,431 |
| Malaysia 0.3% | | | | | |
| Malayan Banking Bhd. | Commercial Banks | | 5,646 | | 17,387 |
| Nestle (Malaysia) Bhd. | Food Products | | 3,400 | | 72,950 |
| Public Bank Bhd., fgn. | Commercial Banks | | 3,500 | | 20,210 |
| | | | | | 110,547 |
| Mexico 0.4% | | | | | |
| iShares MSCI Mexico Capped ETF | Foreign Equity | | 2,155 | | 140,851 |
| Netherlands 3.0% | | | | | |
| Boskalis Westminster NV | Construction & Engineering | | 6,502 | | 313,179 |
| Fugro NV, IDR | Energy Equipment & Services | | 6,554 | | 410,157 |
| Reed Elsevier NV | Media | | 20,438 | | 411,727 |
| | | | | | 1,135,063 |
| Norway 1.2% | | | | | |
| TGS Nopec Geophysical Co. ASA | Energy Equipment & Services | | 16,859 | | 463,791 |
| Oman 0.1% | | | | | |
| Bank Muscat SAOG | Commercial Banks | | 28,100 | | 43,646 |
| Qatar 0.3% | | | | | |
| Gulf International Services QSC | Energy Equipment & Services | | 2,656 | | 42,759 |
| Industries Qatar QSC | Industrial Conglomerates | | 700 | | 30,673 |
| Qatar National Bank | Commercial Banks | | 849 | | 38,718 |
| | | | | | 112,150 |
| | | | | | Annual Report | 27 |
Franklin Templeton International Trust
Statement of Investments, October 31, 2013 (continued)
| | | | |
| | | Shares/ | | |
| Franklin World Perspectives Fund | Industry | Units/Rights | | Value |
| Common Stocks and Other Equity Interests (continued) | | | |
| Russia 0.7% | | | | |
| adb x-trackers MSCI Russia Capped Index ETF | Foreign Equity | 8,572 | $ | 269,804 |
| Singapore 0.8% | | | | |
| Ezion Holdings Ltd. | Energy Equipment & Services | 20,000 | | 36,065 |
| Global Logistic Properties Ltd. | Real Estate Management & | | | |
| | Development | 21,000 | | 52,238 |
| OSIM International Ltd. | Specialty Retail | 19,000 | | 32,273 |
| Parkson Retail Asia Ltd. | Multiline Retail | 2,000 | | 1,707 |
| bParkson Retail Asia Ltd., 144A | Multiline Retail | 9,000 | | 7,680 |
| Singapore Exchange Ltd. | Diversified Financial Services | 13,000 | | 76,815 |
| Singapore Technologies Engineering Ltd. | Aerospace & Defense | 6,000 | | 20,383 |
| Singapore Telecommunications Ltd. | Diversified Telecommunication | | | |
| | Services | 21,000 | | 63,903 |
| United Overseas Bank Ltd. | Commercial Banks | 1,000 | | 16,777 |
| | | | | 307,841 |
| South Africa 0.7% | | | | |
| aiShares MSCI South Africa - B UCITS ETF | Foreign Equity | 588 | | 71,539 |
| iShares MSCI South Africa ETF | Foreign Equity | 2,807 | | 184,195 |
| | | | | 255,734 |
| South Korea 2.0% | | | | |
| aAdvanced Nano Products Co. Ltd. | Chemicals | 1,541 | | 27,878 |
| E-Mart Co. Ltd. | Food & Staples Retailing | 128 | | 30,475 |
| Hana Financial Group Inc. | Commercial Banks | 1,350 | | 51,755 |
| Hankook Tire Co. Ltd. | Auto Components | 463 | | 27,037 |
| Hyundai Department Store Co. Ltd. | Multiline Retail | 168 | | 26,613 |
| Hyundai Engineering & Construction Co. Ltd. | Construction & Engineering | 478 | | 27,286 |
| Hyundai Marine & Fire Insurance Co. Ltd. | Insurance | 850 | | 24,181 |
| Hyundai Motor Co. | Automobiles | 264 | | 62,607 |
| Hyundai Wia Corp. | Auto Components | 175 | | 30,018 |
| Kia Motors Corp. | Automobiles | 858 | | 49,621 |
| aKorea Electric Power Corp. | Electric Utilities | 2,070 | | 55,007 |
| Korea Gas Corp. | Gas Utilities | 464 | | 27,792 |
| Kyungchang Industrial Co. Ltd. | Auto Components | 3,899 | | 35,194 |
| LG Chem Ltd. | Chemicals | 91 | | 25,547 |
| S&T Dynamics Co. Ltd. | Auto Components | 1,790 | | 23,825 |
| Samsung Electronics Co. Ltd. | Semiconductors & Semiconductor | | | |
| | Equipment | 162 | | 222,459 |
| Songwon Industrial Co. Ltd. | Chemicals | 1,680 | | 18,031 |
| | | | | 765,326 |
| Spain 0.9% | | | | |
| aMediaset Espana Comunicacion SA | Media | 29,259 | | 357,590 |
| Sri Lanka 0.0%† | | | | |
| Nestle Lanka PLC | Food Products | 1,070 | | 15,613 |
| Sweden 0.4% | | | | |
| JM AB | Household Durables | 5,788 | | 165,234 |
28 | Annual Report
Franklin Templeton International Trust
Statement of Investments, October 31, 2013 (continued)
| | | | |
| | | Shares/ | | |
| Franklin World Perspectives Fund | Industry | Units/Rights | | Value |
| Common Stocks and Other Equity Interests (continued) | | | |
| Switzerland 1.9% | | | | |
| aDufry AG | Specialty Retail | 2,029 | $ | 328,139 |
| Roche Holding AG | Pharmaceuticals | 1,371 | | 379,666 |
| | | | | 707,805 |
| Taiwan 1.7% | | | | |
| Epistar Corp. | Semiconductors & Semiconductor | | | |
| | Equipment | 32,000 | | 55,429 |
| aEvergreen Marine Corp. Ltd. | Marine | 24,000 | | 14,074 |
| FLEXium Interconnect Inc. | Electronic Equipment, Instruments | | |
| | & Components | 99 | | 307 |
| GeoVision Inc. | Electronic Equipment, Instruments | | |
| | & Components | 12,000 | | 78,303 |
| Giant Manufacturing Co. Ltd. | Leisure Equipment & Products | 6,000 | | 44,846 |
| Giga Solar Materials Corp. | Semiconductors & Semiconductor | | | |
| | Equipment | 5,600 | | 58,466 |
| Hiwin Technologies Corp. | Machinery | 2,000 | | 15,728 |
| Mega Financial Holding Co. Ltd. | Commercial Banks | 90,000 | | 77,489 |
| aMega Financial Holdings Co. Ltd., rts., 12/06/13 | Commercial Banks | 7,165 | | 947 |
| Poya Co. Ltd. | Multiline Retail | 3,090 | | 16,183 |
| Synnex Technology International Corp. | Electronic Equipment, Instruments | | |
| | & Components | 22,000 | | 35,012 |
| Taiwan Semiconductor Manufacturing Co. Ltd. | Semiconductors & Semiconductor | | | |
| | Equipment | 47,570 | | 176,567 |
| Wistron Corp. | Computers & Peripherals | 21,000 | | 19,647 |
| Yungtay Engineering Co. Ltd. | Machinery | 13,000 | | 38,117 |
| | | | | 631,115 |
| Thailand 0.5% | | | | |
| Bangkok Bank PCL, fgn. | Commercial Banks | 3,320 | | 21,924 |
| BEC World PCL, fgn. | Media | 11,000 | | 20,540 |
| CP ALL PCL, fgn. | Food & Staples Retailing | 5,100 | | 6,417 |
| Kasikornbank PCL, fgn. | Commercial Banks | 6,200 | | 38,558 |
| PTT PCL, fgn. | Oil, Gas & Consumable Fuels | 3,400 | | 34,550 |
| Siam Cement PCL, fgn. | Construction Materials | 2,300 | | 32,441 |
| Siam Commercial Bank PCL, fgn. | Commercial Banks | 4,790 | | 25,259 |
| | | | | 179,689 |
| United Arab Emirates 0.2% | | | | |
| Emaar Properties PJSC | Real Estate Management & | | | |
| | Development | 27,009 | | 44,708 |
| First Gulf Bank PJSC | Commercial Banks | 7,886 | | 34,782 |
| | | | | 79,490 |
| United Kingdom 9.0% | | | | |
| The Berkeley Group Holdings PLC | Household Durables | 9,553 | | 358,546 |
| aCarpetright PLC | Specialty Retail | 10,040 | | 100,425 |
| Cineworld Group PLC | Media | 61,672 | | 368,022 |
| Clarkson PLC | Marine | 9,488 | | 305,745 |
| De La Rue PLC | Commercial Services & Supplies | 5,439 | | 74,486 |
| |
| | | | | Annual Report | 29 |
Franklin Templeton International Trust
Statement of Investments, October 31, 2013 (continued)
| | | | | | |
| | | | | Shares/ | | |
| | | Franklin World Perspectives Fund | Industry | Units/Rights | | Value |
| | | Common Stocks and Other Equity Interests (continued) | | | |
| | | United Kingdom (continued) | | | | |
| | | Diageo PLC | Beverages | 2,791 | $ | 88,942 |
| | | Dignity PLC | Diversified Consumer Services | 14,871 | | 331,475 |
| | | Hiscox Ltd. | Insurance | 36,986 | | 392,785 |
| | | Imperial Tobacco Group PLC | Tobacco | 10,625 | | 396,906 |
| | | International Personal Finance PLC | Consumer Finance | 43,757 | | 405,049 |
| | | Reckitt Benckiser Group PLC | Household Products | 1,652 | | 128,404 |
| | | Savills PLC | Real Estate Management & | | | |
| | | | Development | 44,083 | | 458,434 |
| | | | | | | 3,409,219 |
| | | United States 44.7% | | | | |
| | | Abbott Laboratories | Health Care Equipment & Supplies 5,100 | | 186,405 |
| | | ACE Ltd. | Insurance | 2,350 | | 224,284 |
| | | Aflac Inc. | Insurance | 2,700 | | 175,446 |
| | | Airgas Inc. | Chemicals | 1,100 | | 119,977 |
| | | aAmazon.com Inc. | Internet & Catalog Retail | 820 | | 298,505 |
| | | American Tower Corp. | Real Estate Investment Trusts | | | |
| | | | (REITs) | 1,500 | | 119,025 |
| | | Amgen Inc. | Biotechnology | 1,500 | | 174,000 |
| | | Anadarko Petroleum Corp. | Oil, Gas & Consumable Fuels | 700 | | 66,703 |
| | | aANSYS Inc. | Software | 1,700 | | 148,665 |
| | | Apple Inc. | Computers & Peripherals | 1,150 | | 600,702 |
| | | aBiogen Idec Inc. | Biotechnology | 1,150 | | 280,818 |
| | | The Boeing Co. | Aerospace & Defense | 1,600 | | 208,800 |
| | | BorgWarner Inc. | Auto Components | 1,650 | | 170,164 |
| | | Bristol-Myers Squibb Co. | Pharmaceuticals | 5,330 | | 279,932 |
| | | aCelgene Corp. | Biotechnology | 2,600 | | 386,074 |
| | | aCerner Corp. | Health Care Technology | 3,000 | | 168,090 |
| | | aCharter Communications Inc., A | Media | 1,300 | | 174,512 |
| | | aChipotle Mexican Grill Inc. | Hotels, Restaurants & Leisure | 270 | | 142,282 |
| | | aCognizant Technology Solutions Corp., A | IT Services | 240 | | 20,863 |
| | | Cytec Industries Inc. | Chemicals | 1,100 | | 91,399 |
| | | Danaher Corp. | Industrial Conglomerates | 2,800 | | 201,852 |
| | | aDaVita HealthCare Partners Inc. | Health Care Providers & Services | 2,240 | | 125,910 |
| | | Dick’s Sporting Goods Inc. | Specialty Retail | 2,000 | | 106,420 |
| | | aDIRECTV | Media | 2,020 | | 126,230 |
| | | Discover Financial Services | Consumer Finance | 2,700 | | 140,076 |
| | | aDiscovery Communications Inc., C | Media | 2,930 | | 242,340 |
| | | aDollar General Corp. | Multiline Retail | 1,500 | | 86,670 |
| | | aeBay Inc. | Internet Software & Services | 3,700 | | 195,027 |
| | | Ecolab Inc. | Chemicals | 3,900 | | 413,400 |
| | | aExpress Scripts Holding Co. | Health Care Providers & Services | 1,740 | | 108,785 |
| | | aFacebook Inc., A | Internet Software & Services | 5,750 | | 288,995 |
| | | Fastenal Co. | Trading Companies & Distributors | 2,000 | | 99,600 |
| | | aGilead Sciences Inc. | Biotechnology | 6,300 | | 447,237 |
| | | aGoogle Inc., A | Internet Software & Services | 510 | | 525,596 |
| | | Honeywell International Inc. | Aerospace & Defense | 930 | | 80,659 |
| | | aHub Group Inc., A | Air Freight & Logistics | 2,920 | | 107,252 |
| |
| 30 | | | Annual Report | | | | |
Franklin Templeton International Trust
Statement of Investments, October 31, 2013 (continued)
| | | | | |
| | | | Shares/ | | |
| Franklin World Perspectives Fund | Industry | Units/Rights | | Value |
| Common Stocks and Other Equity Interests (continued) | | | | |
| United States (continued) | | | | | |
| aIllumina Inc. | Life Sciences Tools & Services | 1,650 | $ | 154,292 |
| aIntercontinentalExchange Inc. | Diversified Financial Services | 750 | | 144,548 |
| iShares Global Energy ETF | Energy | | 1,633 | | 69,860 |
| aJacobs Engineering Group Inc. | Construction & Engineering | 1,500 | | 91,230 |
| Kansas City Southern | Road & Rail | | 1,100 | | 133,672 |
| aLinkedIn Corp., A | Internet Software & Services | 750 | | 167,752 |
| MasterCard Inc., A | IT Services | | 650 | | 466,115 |
| McKesson Corp. | Health Care Providers & Services | 1,000 | | 156,340 |
| Mead Johnson Nutrition Co., A | Food Products | | 1,750 | | 142,905 |
| Microchip Technology Inc. | Semiconductors & Semiconductor | | | |
| | Equipment | | 5,000 | | 214,800 |
| aMonster Beverage Corp. | Beverages | | 1,500 | | 85,845 |
| National Oilwell Varco Inc. | Energy Equipment & Services | 1,800 | | 146,124 |
| aNetSuite Inc. | Software | | 1,900 | | 191,672 |
| Nielsen Holdings NV | Professional Services | | 3,600 | | 141,984 |
| NIKE Inc., B | Textiles, Apparel & Luxury Goods | 1,710 | | 129,550 |
| Noble Energy Inc. | Oil, Gas & Consumable Fuels | 2,500 | | 187,325 |
| Oceaneering International Inc. | Energy Equipment & Services | 1,200 | | 103,056 |
| Pall Corp. | Machinery | | 2,300 | | 185,196 |
| PepsiCo Inc. | Beverages | | 2,290 | | 192,566 |
| Praxair Inc. | Chemicals | | 1,250 | | 155,887 |
| Precision Castparts Corp. | Aerospace & Defense | | 1,100 | | 278,795 |
| aPriceline.com Inc. | Internet & Catalog Retail | | 170 | | 179,151 |
| QUALCOMM Inc. | Communications Equipment | 4,450 | | 309,141 |
| aQuintiles Transnational Holdings Inc. | Life Sciences Tools & Services | 2,400 | | 100,776 |
| Ralph Lauren Corp. | Textiles, Apparel & Luxury Goods | 950 | | 157,358 |
| Resmed Inc., CDI | Health Care Equipment & Supplies | 12,400 | | 63,559 |
| Rockwell Automation Inc. | Electrical Equipment | | 770 | | 85,016 |
| Roper Industries Inc. | Electrical Equipment | | 1,600 | | 202,896 |
| aSalesforce.com Inc. | Software | | 4,400 | | 234,784 |
| aSBA Communications Corp. | Wireless Telecommunication | | | |
| | Services | | 2,100 | | 183,687 |
| Schlumberger Ltd. | Energy Equipment & Services | 2,500 | | 234,300 |
| aServiceNow Inc. | Software | | 2,800 | | 152,908 |
| aSignature Bank/New York NY | Commercial Banks | | 2,900 | | 295,278 |
| Sirius XM Radio Inc. | Media | | 60,000 | | 226,200 |
| Starbucks Corp. | Hotels, Restaurants & Leisure | 2,300 | | 186,415 |
| aStericycle Inc. | Commercial Services & Supplies | 2,200 | | 255,640 |
| T. Rowe Price Group Inc. | Capital Markets | | 3,200 | | 247,712 |
| Tractor Supply Co. | Specialty Retail | | 2,400 | | 171,240 |
| aTrimble Navigation Ltd. | Electronic Equipment, Instruments | | | |
| | & Components | | 3,500 | | 99,995 |
| aTripAdvisor Inc. | Internet & Catalog Retail | | 1,000 | | 82,710 |
| aUnder Armour Inc., A | Textiles, Apparel & Luxury Goods | 1,520 | | 123,348 |
| Union Pacific Corp. | Road & Rail | | 1,300 | | 196,820 |
| aUnited Rentals Inc. | Trading Companies & Distributors | 3,500 | | 226,065 |
| Vanguard Energy ETF | Energy | | 680 | | 84,796 |
| Vanguard Financials ETF | Diversified Financial Services | 4,005 | | 169,452 |
| |
| | | | | | Annual Report | 31 |
Franklin Templeton International Trust
Statement of Investments, October 31, 2013 (continued)
| | | | | | |
| | | | | Shares/ | | |
| | | Franklin World Perspectives Fund | Industry | Units/Rights | | Value |
| | | Common Stocks and Other Equity Interests (continued) | | | |
| | | United States (continued) | | | | |
| | | aVantiv Inc., A | IT Services | 2,700 | $ | 74,250 |
| | | Visa Inc., A | IT Services | 1,530 | | 300,905 |
| | | The Walt Disney Co. | Media | 3,720 | | 255,155 |
| | | aWaters Corp. | Life Sciences Tools & Services | 800 | | 80,736 |
| | | Wells Fargo & Co. | Commercial Banks | 4,800 | | 204,912 |
| | | aWhiteWave Foods Co., A | Food Products | 5,000 | | 100,050 |
| | | Whole Foods Market Inc. | Food & Staples Retailing | 3,900 | | 246,207 |
| | | Wynn Resorts Ltd. | Hotels, Restaurants & Leisure | 1,050 | | 174,562 |
| | | Xilinx Inc. | Semiconductors & Semiconductor | | | |
| | | | Equipment | 4,900 | | 222,558 |
| | | aYahoo! Inc. | Internet Software & Services | 4,000 | | 131,720 |
| | | | | | | 16,932,511 |
| | | Total Common Stocks and Other Equity Interests | | | | |
| | | (Cost $27,645,832) | | | | 36,185,755 |
| | | dParticipatory Notes 0.7% | | | | |
| | | Saudi Arabia 0.7% | | | | |
| | | HSBC Bank PLC, | | | | |
| | | Al Rajhi Bank, 8/13/14 | Commercial Banks | 1,527 | | 29,722 |
| | | Banque Saudi Fransi, 2/23/15 | Commercial Banks | 3,374 | | 28,968 |
| | | aDar Al Arkan Real Estate Development Co., 8/10/15 | Real Estate Management & | | | |
| | | | Development | 11,809 | | 31,960 |
| | | bEtihad Etisalat Co., 144A, 12/05/14 | Wireless Telecommunication | | | |
| | | | Services | 1,417 | | 31,832 |
| | | National Industrialization Co., 8/13/14 | Industrial Conglomerates | 4,510 | | 32,950 |
| | | bSamba Financial Group, 144A, 8/13/14 | Commercial Banks | 2,260 | | 30,010 |
| | | bSaudi Basic Industries Corp., 144A, 8/04/14 | Chemicals | 1,253 | | 33,326 |
| | | Merrill Lynch International & Co. CV, Al Tayyar Travel Group, | | | | |
| | | 6/10/15 | Hotels, Restaurants & Leisure | 1,233 | | 30,411 |
| | | Total Participatory Notes (Cost $225,253) | | | | 249,179 |
| | | Preferred Stocks 1.7% | | | | |
| | | Brazil 1.6% | | | | |
| | | Alpargatas SA, pfd. | Textiles, Apparel & Luxury Goods | 5,900 | | 40,825 |
| | | Cia de Saneamento do Parana, pfd. | Water Utilities | 8,400 | | 25,912 |
| | | Companhia Brasileira de Distribuicao, pfd., A | Food & Staples Retailing | 1,100 | | 54,557 |
| | | Companhia de Bebidas das Americas (AmBev), pfd. | Beverages | 3,700 | | 138,037 |
| | | Itausa - Investimentos Itau SA, pfd. | Commercial Banks | 27,132 | | 116,883 |
| | | Suzano Papel e Celulose SA, pfd., A | Paper & Forest Products | 18,200 | | 73,773 |
| | | Vale SA, pfd., A | Metals & Mining | 12,500 | | 183,254 |
| | | | | | | 633,241 |
| | | South Korea 0.1% | | | | |
| | | Hyundai Motor Co., 2nd pfd. | Automobiles | 266 | | 29,920 |
| | | Total Preferred Stocks (Cost $631,603) | | | | 663,161 |
| | | Total Investments before Short Term Investments | | | | |
| | | (Cost $28,502,688) | | | | 37,098,095 |
| |
| 32 | | | Annual Report | | | | |
Franklin Templeton International Trust
Statement of Investments, October 31, 2013 (continued)
| | | | |
| Franklin World Perspectives Fund | | Principal Amount | | Value |
| Short Term Investments (Cost $195,000) 0.5% | | | | |
| U.S. Government and Agency Securities 0.5% | | | | |
| United States 0.5% | | | | |
| eFFCB, 11/01/13 | $ | 195,000 | $ | 195,000 |
| Total Investments (Cost $28,697,688) 98.3% | | | | 37,293,095 |
| Other Assets, less Liabilities 1.7% | | | | 627,249 |
| Net Assets 100.0% | | | $ | 37,920,344 |
†Rounds to less than 0.1% of net assets.
aNon-income producing.
bSecurity was purchased pursuant to Rule 144A under the Securities Act of 1933 and may be sold in transactions exempt from registration only to qualified institutional buyers or in
a public offering registered under the Securities Act of 1933. These securities have been deemed liquid under guidelines approved by the Trust’s Board of Trustees. At October 31,
2013, the aggregate value of these securities was $195,222, representing 0.51% of net assets.
cSee Note 7 regarding investments in Franklin India Growth Fund.
dSee Note 1(d) regarding Participatory Notes.
eThe security is traded on a discount basis with no stated coupon rate.
At October 31, 2013, the Fund had the following forward exchange contracts outstanding. See Note 1(c).
| | | | | | | | | | |
| Forward Exchange Contracts | | | | | | | | | | |
| |
| | | | | | Contract | Settlement | | Unrealized | | Unrealized |
| Currency | Counterparty | Type | Quantity | | Amount | Date | | Appreciation | | Depreciation |
| Japanese Yen | BKF | Sell | 126,535,500 | $ | 1,300,000 | 12/24/13 | $ | 12,598 | $ | — |
| Net unrealized appreciation (depreciation) | | | | | | $ | 12,598 | | |
| |
| See Abbreviations on page 51. | | | | | | | | | | |
Annual Report | The accompanying notes are an integral part of these financial statements. | 33
Franklin Templeton International Trust
Financial Statements
Statement of Assets and Liabilities
October 31, 2013
| | | |
| | | Franklin World | |
| | | Perspectives | |
| | | Fund | |
| Assets: | | | |
| Investments in securities: | | | |
| Cost | $ | 28,697,688 | |
| Value | $ | 37,293,095 | |
| Cash | | 420,338 | |
| Foreign currency, at value (cost $48,635) | | 48,432 | |
| Receivables: | | | |
| Investment securities sold | | 265,850 | |
| Capital shares sold | | 14,425 | |
| Dividends | | 33,807 | |
| Unrealized appreciation on forward exchange contracts | | 12,598 | |
| Other assets | | 29,772 | |
| Total assets | | 38,118,317 | |
| Liabilities: | | | |
| Payables: | | | |
| Investment securities purchased | | 140,566 | |
| Capital shares redeemed | | 4,994 | |
| Affiliates | | 23,648 | |
| Distribution fees | | 5,332 | |
| Transfer agent fees | | 1,943 | |
| Reports to shareholders | | 9,106 | |
| Accrued expenses and other liabilities | | 12,384 | |
| Total liabilities | | 197,973 | |
| Net assets, at value | $ | 37,920,344 | |
| Net assets consist of: | | | |
| Paid-in capital | $ | 29,905,736 | |
| Undistributed net investment income | | 171,415 | |
| Net unrealized appreciation (depreciation) | | 8,606,992 | |
| Accumulated net realized gain (loss) | | (763,799 | ) |
| Net assets, at value | $ | 37,920,344 | |
34 | The accompanying notes are an integral part of these financial statements. | Annual Report
Franklin Templeton International Trust
Financial Statements (continued)
Statement of Assets and Liabilities (continued)
October 31, 2013
| | | |
| | | | Franklin World |
| | | | Perspectives |
| | | | Fund |
| Class A: | | | |
| Net assets, at value | $ | | 17,341,197 |
| Shares outstanding | | | 1,365,178 |
| Net asset value per sharea | | $ | 12.70 |
| Maximum offering price per share (net asset value per share ÷ 94.25%) | | $ | 13.47 |
| Class C: | | | |
| Net assets, at value | $ | | 3,849,321 |
| Shares outstanding | | | 305,244 |
| Net asset value and maximum offering price per sharea | | $ | 12.61 |
| Class R: | | | |
| Net assets, at value | $ | | 3,162,848 |
| Shares outstanding | | | 250,000 |
| Net asset value and maximum offering price per share | | $ | 12.65 |
| Advisor Class: | | | |
| Net assets, at value | $ | | 13,566,978 |
| Shares outstanding | | | 1,066,400 |
| Net asset value and maximum offering price per share | | $ | 12.72 |
| |
| |
| aRedemption price is equal to net asset value less contingent deferred sales charges, if applicable. | | | |
Annual Report | The accompanying notes are an integral part of these financial statements. | 35
Franklin Templeton International Trust
Financial Statements (continued)
Statement of Operations
for the year ended October 31, 2013
| | | |
| | | Franklin World | |
| | | Perspectives | |
| | | Fund | |
| Investment income: | | | |
| Dividends (net of foreign taxes of $42,052) | $ | 688,816 | |
| Interest | | 40 | |
| Total investment income | | 688,856 | |
| Expenses: | | | |
| Management fees (Note 3a) | | 311,978 | |
| Administrative fees (Note 3b) | | 30,343 | |
| Distribution fees: (Note 3c) | | | |
| Class A | | 14,598 | |
| Class C | | 25,488 | |
| Class R | | 13,964 | |
| Transfer agent fees: (Note 3e) | | | |
| Class A | | 6,087 | |
| Class C | | 1,337 | |
| Class R | | 1,154 | |
| Advisor Class | | 4,904 | |
| Custodian fees (Note 4) | | 7,248 | |
| Reports to shareholders | | 22,052 | |
| Registration and filing fees | | 54,278 | |
| Professional fees | | 83,967 | |
| Other | | 36,971 | |
| Total expenses | | 614,369 | |
| Expense reductions | | (60 | ) |
| Expenses waived/paid by affiliates (Note 3f) | | (152,503 | ) |
| Net expenses | | 461,806 | |
| Net investment income | | 227,050 | |
| Realized and unrealized gains (losses): | | | |
| Net realized gain (loss) from: | | | |
| Investments | | 1,437,963 | |
| Foreign currency transactions | | (53,136 | ) |
| Net realized gain (loss) | | 1,384,827 | |
| Net change in unrealized appreciation (depreciation) on: | | | |
| Investments | | 6,233,961 | |
| Translation of other assets and liabilities denominated in foreign currencies | | 54,968 | |
| Net change in unrealized appreciation (depreciation) | | 6,288,929 | |
| Net realized and unrealized gain (loss) | | 7,673,756 | |
| Net increase (decrease) in net assets resulting from operations | $ | 7,900,806 | |
36 | The accompanying notes are an integral part of these financial statements. | Annual Report
Franklin Templeton International Trust
Financial Statements (continued)
| | | | | | |
| Statements of Changes in Net Assets | | | | | | |
| |
| |
| |
| | | Franklin World | |
| | | Perspectives Fund | |
| | | Year Ended October 31, | |
| | | 2013 | | | 2012 | |
| Increase (decrease) in net assets: | | | | | | |
| Operations: | | | | | | |
| Net investment income | $ | 227,050 | | $ | 170,991 | |
| Net realized gain (loss) from investments, mutual funds distributions, foreign currency transactions | | | | | | |
| and net increase from payments by affiliates | | 1,384,827 | | | (1,241,401 | ) |
| Net change in unrealized appreciation (depreciation) on investments and translation of other assets | | | | | | |
| and liabilities denominated in foreign currencies | | 6,288,929 | | | 2,684,744 | |
| Net increase (decrease) in net assets resulting from operations | | 7,900,806 | | | 1,614,334 | |
| Distributions to shareholders from: | | | | | | |
| Net investment income: | | | | | | |
| Class A | | (147,436 | ) | | (124,283 | ) |
| Class C | | (14,288 | ) | | (13,766 | ) |
| Class R | | (19,577 | ) | | (17,026 | ) |
| Advisor Class | | (134,853 | ) | | (111,678 | ) |
| Total distributions to shareholders | | (316,154 | ) | | (266,753 | ) |
| Capital share transactions: (Note 2) | | | | | | |
| Class A | | 1,166,985 | | | 358,336 | |
| Class C | | 277,524 | | | 1,277 | |
| Class R | | (251 | ) | | 120 | |
| Advisor Class | | 140,431 | | | 113,187 | |
| Total capital share transactions | | 1,584,689 | | | 472,920 | |
| Net increase (decrease) in net assets | | 9,169,341 | | | 1,820,501 | |
| Net assets: | | | | | | |
| Beginning of year | | 28,751,003 | | | 26,930,502 | |
| End of year | $ | 37,920,344 | | $ | 28,751,003 | |
| Undistributed net investment income included in net assets: | | | | | | |
| End of year | $ | 171,415 | | $ | 134,940 | |
Annual Report | The accompanying notes are an integral part of these financial statements. | 37
Franklin Templeton International Trust
Notes to Financial Statements
Franklin World Perspectives Fund
1. ORGANIZATION AND SIGNIFICANT ACCOUNTING POLICIES
Franklin Templeton International Trust (Trust) is registered under the Investment Company Act of 1940, as amended, (1940 Act) as an open-end investment company, consisting of four separate funds. The Franklin World Perspectives Fund (Fund) is included in this report. The financial statements of the remaining funds in the Company are presented separately. The Fund offers four classes of shares: Class A, Class C, Class R, and Advisor Class. Each class of shares differs by its initial sales load, contingent deferred sales charges, voting rights on matters affecting a single class, its exchange privilege and fees primarily due to differing arrangements for distribution and transfer agent fees.
The following summarizes the Fund’s significant accounting policies.
a. Financial Instrument Valuation
The Fund’s investments in financial instruments are carried at fair value daily. Fair value is the price that would be received to sell an asset or paid to transfer a liability in an orderly transaction between market participants on the measurement date. Under procedures approved by the Trust’s Board of Trustees (the Board), the Fund’s administrator, investment manager and other affiliates have formed the Valuation and Liquidity Oversight Committee (VLOC). The VLOC provides administration and oversight of the Fund’s valuation policies and procedures, which are approved annually by the Board. Among other things, these procedures allow the Fund to utilize independent pricing services, quotations from securities and financial instrument dealers, and other market sources to determine fair value.
Equity securities and exchange traded funds listed on an exchange or on the NASDAQ National Market System are valued at the last quoted sale price or the official closing price of the day, respectively. Foreign equity securities are valued as of the close of trading on the foreign stock exchange on which the security is primarily traded, or the NYSE, whichever is earlier. The value is then converted into its U.S. dollar equivalent at the foreign exchange rate in effect at the close of the NYSE on the day that the value of the security is determined. Over-the-counter (OTC) securities are valued within the range of the most recent quoted bid and ask prices. Securities that trade in multiple markets or on multiple exchanges are valued according to the broadest and most representative market. Certain equity securities are valued based upon fundamental characteristics or relationships to similar securities. Investments in open-end mutual funds are valued at the closing net asset value.
Debt securities generally trade in the OTC market rather than on a securities exchange. The Fund’s pricing services use multiple valuation techniques to determine fair value. In instances where sufficient market activity exists, the pricing services may utilize a market-based approach through which quotes from market makers are used to determine fair value. In instances where sufficient market activity may not exist or is limited, the pricing services also utilize proprietary
38 | Annual Report
Franklin Templeton International Trust
Notes to Financial Statements (continued)
Franklin World Perspectives Fund
| 1. | ORGANIZATION AND SIGNIFICANT ACCOUNTING POLICIES (continued) |
| a. | Financial Instrument Valuation (continued) |
valuation models which may consider market characteristics such as benchmark yield curves, credit spreads, estimated default rates, anticipated market interest rate volatility, coupon rates, anticipated timing of principal repayments, underlying collateral, and other unique security features in order to estimate the relevant cash flows, which are then discounted to calculate the fair value. Securities denominated in a foreign currency are converted into their U.S. dollar equivalent at the foreign exchange rate in effect at the close of the NYSE on the date that the values of the foreign debt securities are determined.
Certain derivative financial instruments (derivatives) trade in the OTC market. The Fund’s pricing services use various techniques including industry standard option pricing models and proprietary discounted cash flow models to determine the fair value of those instruments. The Fund’s net benefit or obligation under the derivative contract, as measured by the fair value of the contract, is included in net assets.
The Fund has procedures to determine the fair value of financial instruments for which market prices are not reliable or readily available. Under these procedures, the VLOC convenes on a regular basis to review such financial instruments and considers a number of factors, including significant unobservable valuation inputs, when arriving at fair value. The VLOC primarily employs a market-based approach which may use related or comparable assets or liabilities, recent transactions, market multiples, book values, and other relevant information for the investment to determine the fair value of the investment. An income-based valuation approach may also be used in which the anticipated future cash flows of the investment are discounted to calculate fair value. Discounts may also be applied due to the nature or duration of any restrictions on the disposition of the investments. Due to the inherent uncertainty of valuations of such investments, the fair values may differ significantly from the values that would have been used had an active market existed. The VLOC employs various methods for calibrating these valuation approaches including a regular review of key inputs and assumptions, transactional back-testing or disposition analysis, and reviews of any related market activity.
Trading in securities on foreign securities stock exchanges and OTC markets may be completed before the daily close of business on the NYSE. Occasionally, events occur between the time at which trading in a foreign security is completed and the close of the NYSE that might call into question the reliability of the value of a portfolio security held by the Fund. As a result, differences may arise between the value of the Fund’s portfolio securities as determined at the foreign market close and the latest indications of value at the close of the NYSE. In order to minimize the potential for these differences, the VLOC monitors price movements following the close of trading in foreign stock markets through a series of country specific market proxies (such as baskets of American Depositary Receipts, futures contracts and exchange traded funds).
Annual Report | 39
Franklin Templeton International Trust
Notes to Financial Statements (continued)
Franklin World Perspectives Fund
| 1. | ORGANIZATION AND SIGNIFICANT ACCOUNTING POLICIES (continued) |
| a. | Financial Instrument Valuation (continued) |
These price movements are measured against established trigger thresholds for each specific market proxy to assist in determining if an event has occurred that may call into question the reliability of the values of the foreign securities held by the Fund. If such an event occurs, the securities may be valued using fair value procedures, which may include the use of independent pricing services.
In addition, certain foreign markets may be open on days that the NYSE is closed, which could result in differences between the value of the Fund’s portfolio securities on the last business day and the last calendar day of the reporting period. Any significant security valuation changes due to an open foreign market are adjusted and reflected by the Fund for financial reporting purposes.
b. Foreign Currency Translation
Portfolio securities and other assets and liabilities denominated in foreign currencies are translated into U.S. dollars based on the exchange rate of such currencies against U.S. dollars on the date of valuation. The Fund may enter into foreign currency exchange contracts to facilitate transactions denominated in a foreign currency. Purchases and sales of securities, income and expense items denominated in foreign currencies are translated into U.S. dollars at the exchange rate in effect on the transaction date. Portfolio securities and assets and liabilities denominated in foreign currencies contain risks that those currencies will decline in value relative to the U.S. dollar. Occasionally, events may impact the availability or reliability of foreign exchange rates used to convert the U.S. dollar equivalent value. If such an event occurs, the foreign exchange rate will be valued at fair value using procedures established and approved by the Board.
The Fund does not separately report the effect of changes in foreign exchange rates from changes in market prices on securities held. Such changes are included in net realized and unrealized gain or loss from investments on the Statement of Operations.
Realized foreign exchange gains or losses arise from sales of foreign currencies, currency gains or losses realized between the trade and settlement dates on securities transactions and the difference between the recorded amounts of dividends, interest, and foreign withholding taxes and the U.S. dollar equivalent of the amounts actually received or paid. Net unrealized foreign exchange gains and losses arise from changes in foreign exchange rates on foreign denominated assets and liabilities other than investments in securities held at the end of the reporting period.
c. Derivative Financial Instruments
The Fund invested in derivatives in order to manage risk or gain exposure to various other investments or markets. Derivatives are financial contracts based on an underlying or notional amount, require no initial investment or an initial net investment that is smaller than would normally be required to have a similar response to changes in market factors, and require or permit
40 | Annual Report
Franklin Templeton International Trust
Notes to Financial Statements (continued)
Franklin World Perspectives Fund
| 1. | ORGANIZATION AND SIGNIFICANT ACCOUNTING POLICIES (continued) |
| c. | Derivative Financial Instruments (continued) |
net settlement. Derivatives contain various risks including the potential inability of the counter-party to fulfill their obligations under the terms of the contract, the potential for an illiquid secondary market, and/or the potential for market movements which expose the Fund to gains or losses in excess of the amounts shown on the Statement of Assets and Liabilities. Realized gain and loss and unrealized appreciation and depreciation on these contracts for the period are included in the Statement of Operations.
Derivative counterparty credit risk is managed through a formal evaluation of the creditworthiness of all potential counterparties. The Fund attempts to reduce its exposure to counterparty credit risk on OTC derivatives, whenever possible, by entering into International Swaps and Derivatives Association (ISDA) master agreements with certain counterparties. These agreements contain various provisions, including but not limited to collateral requirements, events of default, or early termination. Termination events applicable to the counterparty include certain deteriorations in the credit quality of the counterparty. Termination events applicable to the Fund include failure of the Fund to maintain certain net asset levels and/or limit the decline in net assets over various periods of time. In the event of default or early termination, the ISDA master agreement gives the non-defaulting party the right to net and close-out all transactions traded, whether or not arising under the ISDA agreement, to one net amount payable by one counterparty to the other. However, absent an event of default or early termination, OTC derivative assets and liabilities are presented gross and not offset in the Statement of Assets and Liabilities. Early termination by the counterparty may result in an immediate payment by the Fund of any net liability owed to that counterparty under the ISDA agreement. At October 31, 2013, the Fund had no OTC derivatives in a net liability position for such contracts.
Collateral requirements differ by type of derivative. Collateral terms are contract specific for OTC derivatives. For OTC derivatives traded under an ISDA master agreement, posting of collateral is required by either the fund or the applicable counterparty if the total net exposure of all OTC derivatives with the applicable counterparty exceeds the minimum transfer amount, which typically ranges from $100,000 to $250,000, and can vary depending on the counterparty and the type of the agreement. Generally, collateral is determined at the close of fund business each day and any additional collateral required due to changes in derivative values may be delivered by the fund or the counter-party within a few business days. Collateral pledged and/or received by the fund, if any, is held in segregated accounts with the fund’s custodian/counterparty broker and can be in the form of cash and/or securities. Unrestricted cash may be invested according to the Fund’s investment objectives.
The Fund entered into OTC forward exchange contracts primarily to manage and/or gain exposure to certain foreign currencies. A forward exchange contract is an agreement between the Fund and a counterparty to buy or sell a foreign currency at a specific exchange rate on a future date.
See Note 9 regarding other derivative information.
Annual Report | 41
Franklin Templeton International Trust
Notes to Financial Statements (continued)
Franklin World Perspectives Fund
| 1. | ORGANIZATION AND SIGNIFICANT ACCOUNTING POLICIES (continued) |
| d. | Participatory Notes |
The Fund invests in Participatory Notes (P-Notes). P-notes are promissory notes that are designed to offer a return linked to the performance of a particular underlying equity security or market. P-Notes are issued by banks or broker-dealers and allow the fund to gain exposure to common stocks in markets where direct investment is not allowed. Income received from P-Notes is recorded as dividend income in the Statement of Operations. P-Notes may contain various risks including the potential inability of the counterparty to fulfill their obligations under the terms of the contract. These securities may be more volatile and less liquid than other investments held by the Fund.
e. Income and Deferred Taxes
It is the Fund’s policy to qualify as a regulated investment company under the Internal Revenue Code. The Fund intends to distribute to shareholders substantially all of its taxable income and net realized gains to relieve it from federal income and if applicable, excise taxes. As a result, no provision for U.S. federal income taxes is required.
The Fund may be subject to foreign taxation related to income received, capital gains on the sale of securities and certain foreign currency transactions in the foreign jurisdictions in which it invests. Foreign taxes, if any, are recorded based on the tax regulations and rates that exist in the foreign markets in which the Fund invests. When a capital gain tax is determined to apply the Fund records an estimated deferred tax liability in an amount that would be payable if the securities were disposed of on the valuation date.
The Fund recognizes the tax benefits of uncertain tax positions only when the position is “more likely than not” to be sustained upon examination by the tax authorities based on the technical merits of the tax position. As of October 31, 2013, and for all open tax years, the Fund has determined that no liability for unrecognized tax benefits is required in the Fund’s financial statements related to uncertain tax positions taken on a tax return (or expected to be taken on future tax returns). Open tax years are those that remain subject to examination and are based on each tax jurisdiction statute of limitation.
f. Security Transactions, Investment Income, Expenses and Distributions
Security transactions are accounted for on trade date. Realized gains and losses on security transactions are determined on a specific identification basis. Interest income and estimated expenses are accrued daily. Amortization of premium and accretion of discount on debt securities are included in interest income. Dividend income is recorded on the ex-dividend date except that
42 | Annual Report
Franklin Templeton International Trust
Notes to Financial Statements (continued)
Franklin World Perspectives Fund
| 1. | ORGANIZATION AND SIGNIFICANT ACCOUNTING POLICIES (continued) |
| f. | Security Transactions, Investment Income, Expenses and Distributions (continued) |
certain dividends from foreign securities are recognized as soon as the Fund is notified of the ex-dividend date. Distributions to shareholders are recorded on the ex-dividend date and are determined according to income tax regulations (tax basis). Distributable earnings determined on a tax basis may differ from earnings recorded in accordance with accounting principles generally accepted in the United States of America. These differences may be permanent or temporary. Permanent differences are reclassified among capital accounts to reflect their tax character. These reclassifications have no impact on net assets or the results of operations. Temporary differences are not reclassified, as they may reverse in subsequent periods.
Common expenses incurred by the Trust are allocated among the Funds based on the ratio of net assets of each fund to the combined net assets of the Trust. Fund specific expenses are charged directly to the fund that incurred the expense.
Realized and unrealized gains and losses and net investment income, not including class specific expenses, are allocated daily to each class of shares based upon the relative proportion of net assets of each class. Differences in per share distributions, by class, are generally due to differences in class specific expenses.
g. Accounting Estimates
The preparation of financial statements in accordance with accounting principles generally accepted in the United States of America requires management to make estimates and assumptions that affect the reported amounts of assets and liabilities at the date of the financial statements and the amounts of income and expenses during the reporting period. Actual results could differ from those estimates.
h. Guarantees and Indemnifications
Under the Trust’s organizational documents, its officers and trustees are indemnified by the Trust against certain liabilities arising out of the performance of their duties to the Trust. Additionally, in the normal course of business, the Trust, on behalf of the Fund, enters into contracts with service providers that contain general indemnification clauses. The Trust’s maximum exposure under these arrangements is unknown as this would involve future claims that may be made against the Trust that have not yet occurred. Currently, the Trust expects the risk of loss to be remote.
Annual Report | 43
Franklin Templeton International Trust
Notes to Financial Statements (continued)
Franklin World Perspectives Fund
2. SHARES OF BENEFICIAL INTEREST
At October 31, 2013, there were an unlimited number of shares authorized (without par value).
Transactions in the Fund’s shares were as follows:
| | | | | | | | | | | | |
| | | | | | Year Ended October 31, | | | | | |
| | 2013 | | 2012 | |
| | Shares | | | | Amount | | Shares | | | | Amount | |
| Class A Shares: | | | | | | | | | | | | |
| Shares sold | 169,920 | | $ | 1,932,319 | | 135,002 | | $ | 1,316,765 | |
| Shares issued in reinvestment of distributions | 2,923 | | | | 30,023 | | 2,631 | | | | 23,283 | |
| Shares redeemed | (69,779 | ) | | | (795,357 | ) | (100,382 | ) | | | (981,712 | ) |
| Net increase (decrease) | 103,064 | | $ | 1,166,985 | | 37,251 | | | $ | 358,336 | |
| Class C Shares: | | | | | | | | | | | | |
| Shares sold | 28,688 | | | $ | 325,342 | | 5,921 | | | $ | 58,313 | |
| Shares issued in reinvestment of distributions | 147 | | | | 1,513 | | 177 | | | | 1,566 | |
| Shares redeemed | (4,578 | ) | | | (49,331 | ) | (6,002 | ) | | | (58,602 | ) |
| Net increase (decrease) | 24,257 | | | $ | 277,524 | | 96 | | | $ | 1,277 | |
| Class R Shares: | | | | | | | | | | | | |
| Shares sold | — | | | $ | — | | 13 | | | $ | 119 | |
| Shares issued in reinvestment of distributions | —a | | | | 2 | | —a | | | | 1 | |
| Shares redeemed | (22 | ) | | | (253 | ) | — | | | | — | |
| Net increase (decrease) | (22 | ) | | $ | (251 | ) | 13 | | | $ | 120 | |
| Advisor Class Shares: | | | | | | | | | | | | |
| Shares sold | 16,236 | | | $ | 186,575 | | 14,553 | | | $ | 142,333 | |
| Shares issued in reinvestment of distributions | 664 | | | | 6,821 | | 511 | | | | 4,524 | |
| Shares redeemed | (4,447 | ) | | | (52,965 | ) | (3,524 | ) | | | (33,670 | ) |
| Net increase (decrease) | 12,453 | | | $ | 140,431 | | 11,540 | | | $ | 113,187 | |
| |
| aRounds to less than 1. | | | | | | | | | | | | |
3. TRANSACTIONS WITH AFFILIATES
Franklin Resources, Inc. is the holding company for various subsidiaries that together are referred to as Franklin Templeton Investments. Certain officers and trustees of the Fund are also officers and/or directors of the following subsidiaries:
| |
| Subsidiary | Affiliation |
| Franklin Advisers, Inc. (Advisers) | Investment manager |
| Franklin Templeton Asset Management (India) Private Limited (FT India) | Investment manager |
| Franklin Templeton Investimentos (Brasil) Ltd. (FT Brasil) | Investment manager |
| Franklin Templeton Investment Management Limited (FTIML) | Investment manager |
| Franklin Templeton Investment Trust Management Co., Ltd. (FT Korea) | Investment manager |
| Franklin Templeton Investments Corp. (FTIC) | Investment manager |
| Franklin Templeton Investments Japan Limited (FT Japan) | Investment manager |
44 | Annual Report
Franklin Templeton International Trust
Notes to Financial Statements (continued)
| |
| Franklin World Perspectives Fund | |
| |
| |
| 3. TRANSACTIONS WITH AFFILIATES (continued) | |
| |
| Subsidiary | Affiliation |
| Franklin Templeton Investments (ME) Limited (FTIME) | Investment manager |
| Templeton Asset Management Ltd. (TAML) | Investment manager |
| Franklin Templeton Services, LLC (FT Services) | Administrative manager |
| Franklin Templeton Distributors, Inc. (Distributors) | Principal underwriter |
| Franklin Templeton Investor Services, LLC (Investor Services) | Transfer agent |
a. Management Fees
The Fund pays an investment management fee to Advisers based on the average daily net assets of the Fund as follows:
| | |
| Annualized Fee Rate | | Net Assets |
| 1.050 | % | Up to and including $1 billion |
| 1.000 | % | Over $1 billion, up to and including $4 billion |
| 0.950 | % | In excess of $4 billion |
Effective May 1, 2013, the Fund combined its investment management and administration agreements as approved by the Board. The fees paid under the combined agreement do not exceed the aggregate fees that were paid under the separate agreements.
Prior to May 1, 2013, the Fund paid fees to Advisers based on the average daily net assets of the Fund as follows:
| | |
| Annualized Fee Rate | | Net Assets |
| 0.850 | % | Up to and including $1 billion |
| 0.800 | % | Over $1 billion, up to and including $4 billion |
| 0.750 | % | In excess of $4 billion |
Under a subadvisory agreement, FTI Brasil, FTIML, FT Korea, FTIC, FTIME and TAML, affiliates of Advisers, provide subadvisory services to the Fund. The subadvisory fee is paid by Advisers based on the average daily net assets, and is not an additional expense of the Fund. Effective December 1, 2012, and October 22, 2013, FT Japan and FT India, respectively, were no longer investment managers of the Fund. Effective July 5, 2013, and October 30, 2013, TAML and FTIME, respectively, were new investment managers of the Fund.
b. Administrative Fees
Effective May 1, 2013, under an agreement with Advisers, FT Services provides administrative services to the Fund. The fee is paid by Advisers based on the Fund’s average daily net assets, and is not an additional expense of the Fund.
Prior to May 1, 2013, the Fund paid administrative fees to FT Services of 0.20% per year of the average daily net assets of the Fund.
Annual Report | 45
Franklin Templeton International Trust
Notes to Financial Statements (continued)
Franklin World Perspectives Fund
| 3. | TRANSACTIONS WITH AFFILIATES (continued) |
| c. | Distribution Fees |
The Board has adopted distribution plans for each share class with the exception of Advisor Class shares, pursuant to Rule 12b-1 under the 1940 Act. Distribution fees are not charged on shares held by affiliates. Under the Fund’s Class A reimbursement distribution plan, the Fund reimburses Distributors for costs incurred in connection with the servicing, sale and distribution of the Fund’s shares up to the maximum annual plan rate. Under the Class A reimbursement distribution plan, costs exceeding the maximum for the current plan year cannot be reimbursed in subsequent periods. In addition, under the Fund’s Class C and R compensation distribution plans, the Fund pays Distributors for costs incurred in connection with the servicing, sale and distribution of the Fund’s shares up to the maximum annual plan rate for each class. The plan year, for purposes of monitoring compliance with the maximum annual plan rates, is February 1 through January 31.
The maximum annual plan rates, based on the average daily net assets, for each class, are as follows:
| | |
| Class A | 0.30 | % |
| Class C | 1.00 | % |
| Class R | 0.50 | % |
d. Sales Charges/Underwriting Agreements
Front-end sales charges and contingent deferred sales charges (CDSC) do not represent expenses of the Fund. These charges are deducted from the proceeds of sales of Fund shares prior to investment or from redemption proceeds prior to remittance, as applicable. Distributors has advised the Fund of the following commission transactions related to the sales and redemptions of the Fund’s shares for the year:
| | |
| Sales charges retained net of commissions paid to unaffiliated | | |
| broker/dealers | $ | 5,626 |
| CDSC retained | $ | 14 |
e. Transfer Agent Fees
Each class of shares pays transfer agent fees to Investor Services for its performance of shareholder servicing obligations and reimburses Investor Services for out of pocket expenses incurred, including shareholding servicing fees paid to third parties. These fees are allocated daily based upon their relative proportion of such classes’ aggregate net assets.
For the year ended October 31, 2013, the Fund paid transfer agent fees of $13,482, of which $7,241 was retained by Investor Services.
46 | Annual Report
Franklin Templeton International Trust
Notes to Financial Statements (continued)
Franklin World Perspectives Fund
| 3. | TRANSACTIONS WITH AFFILIATES (continued) |
| f. | Waiver and Expense Reimbursements |
Advisers and FT Services have contractually agreed in advance to waive or limit their respective fees and to assume as their own expense certain expenses otherwise payable by the Fund so that the expenses (excluding distribution fees and acquired fund fees and expenses) for each class of the Fund do not exceed 1.25% based on the average net assets of each class (other than certain non-routine expenses or costs, including those relating to litigation, indemnification, reorganizations, and liquidations) until February 28, 2014.
g. Other Affiliated Transactions
At October 31, 2013, Franklin Resources, Inc. owned 82.75% of the Fund’s outstanding shares.
Investment activities of this shareholder could have a material impact on the Fund.
4. EXPENSE OFFSET ARRANGEMENT
The Fund has entered into an arrangement with its custodian whereby credits realized as a result of uninvested cash balances are used to reduce a portion of the Fund’s custodian expenses. During the year ended October 31, 2013, the custodian fees were reduced as noted in the Statement of Operations.
5. INCOME TAXES
For tax purposes, capital losses may be carried over to offset future capital gains. Capital loss carry-forwards with no expiration, if any, must be fully utilized before those losses with expiration dates.
At October 31, 2013, the Fund had capital loss carryforwards of $649,183 expiring in 2019.
During the year ended October 31, 2013, the Fund utilized $1,267,808 of capital loss carryforwards.
The tax character of distributions paid during the years ended October 31, 2013 and 2012, was as follows:
| | | | |
| | | 2013 | | 2012 |
| Distributions paid from ordinary income | $ | 316,154 | $ | 266,753 |
At October 31, 2013, the cost of investments, net unrealized appreciation (depreciation) and undistributed ordinary income for income tax purposes were as follows:
| | | |
| Cost of investments | $ | 29,158,820 | |
| |
| Unrealized appreciation | $ | 8,513,796 | |
| Unrealized depreciation | | (379,521 | ) |
| Net unrealized appreciation (depreciation) | $ | 8,134,275 | |
| |
| Distributable earnings – undistributed ordinary income | $ | 530,697 | |
Annual Report | 47
Franklin Templeton International Trust
Notes to Financial Statements (continued)
Franklin World Perspectives Fund
5. INCOME TAXES (continued)
Differences between income and/or capital gains as determined on a book basis and a tax basis are primarily due to differing treatments of passive foreign investment company shares and wash sales.
6. INVESTMENT TRANSACTIONS
Purchases and sales of investments (excluding short term securities) for the year ended October 31, 2013, aggregated $22,173,727 and $21,160,311, respectively.
7. INVESTMENTS IN FRANKLIN INDIA GROWTH FUND
The Fund may invest in the Franklin India Growth Fund, an open-end investment company managed by Advisers. Management fees paid by the Fund are reduced on assets invested in Franklin India Growth Fund, in an amount not to exceed the management fees paid by the Franklin India Growth Fund.
8. CONCENTRATION OF RISK
Investing in foreign securities may include certain risks and considerations not typically associated with investing in U.S. securities, such as fluctuating currency values and changing local and regional economic, political and social conditions, which may result in greater market volatility. In addition, certain foreign securities may not be as liquid as U.S. securities.
9. OTHER DERIVATIVE INFORMATION
At October 31, 2013, the Fund’s investments in derivative contracts are reflected on the Statement of Assets and Liabilities as follows:
| | | | | |
| | Asset Derivatives | Liability Derivatives |
| |
| Derivative Contracts | | | | | |
| Not Accounted for as | Statement of Assets and | | Fair Value | Statement of Assets and | Fair Value |
| Hedging Instruments | Liabilities Location | | Amount | Liabilities Location | Amount |
| Foreign exchange | | | | | |
| contracts | Unrealized appreciation on | $ | 12,598 | Unrealized depreciation on | $— |
| | forward exchange contracts / | | | forward exchange contracts / | |
| | Net assets consist of – net | | | Net assets consist of – net | |
| | unrealized appreciation | | | unrealized appreciation | |
| | (depreciation) | | | (depreciation) | |
48 | Annual Report
Franklin Templeton International Trust
Notes to Financial Statements (continued)
Franklin World Perspectives Fund
9. OTHER DERIVATIVE INFORMATION (continued)
For the year ended October 31, 2013, the effect of derivative contracts on the Fund’s Statement of Operations was as follows:
| | | | | | |
| | | | | | | Change in |
| | | | | | | Unrealized |
| Derivative Contracts | | | Realized | | | Appreciation |
| Not Accounted for as | Statement of | | Gain (Loss) | | | (Depreciation) |
| Hedging Instruments | Operations Locations | | for the Year | | | for the Year |
| Foreign exchange contracts | Net realized gain (loss) from foreign currency | $ | (43,995 | ) | $ | 55,195 |
| | transactions / Net change in unrealized | | | | | |
| appreciation (depreciation) on translation of |
| | other assets and liabilities denominated in | | | | | |
| | foreign currencies | | | | | |
For the year ended October 31, 2013, the average month end fair value of derivatives represented 0.05% of average month end net assets. The average month end number of open derivative contracts for the year was 1.
See Note 1(c) regarding derivative financial instruments.
10. CREDIT FACILITY
The Fund, together with other U.S. registered and foreign investment funds (collectively, Borrowers), managed by Franklin Templeton Investments, are borrowers in a joint syndicated senior unsecured credit facility totaling $1.5 billion (Global Credit Facility) which matures on January 17, 2014. This Global Credit Facility provides a source of funds to the Borrowers for temporary and emergency purposes, including the ability to meet future unanticipated or unusually large redemption requests.
Under the terms of the Global Credit Facility, the Fund shall, in addition to interest charged on any borrowings made by the Fund and other costs incurred by the Fund, pay its share of fees and expenses incurred in connection with the implementation and maintenance of the Global Credit Facility, based upon its relative share of the aggregate net assets of all of the Borrowers, including an annual commitment fee of 0.07% based upon the unused portion of the Global Credit Facility. These fees are reflected in other expenses on the Statement of Operations. During the year ended October 31, 2013, the Fund did not use the Global Credit Facility.
Annual Report | 49
Franklin Templeton International Trust
Notes to Financial Statements (continued)
Franklin World Perspectives Fund
11. FAIR VALUE MEASUREMENTS
The Fund follows a fair value hierarchy that distinguishes between market data obtained from independent sources (observable inputs) and the Fund’s own market assumptions (unobservable inputs). These inputs are used in determining the value of the Fund’s financial instruments and are summarized in the following fair value hierarchy:
- Level 1 – quoted prices in active markets for identical financial instruments
- Level 2 – other significant observable inputs (including quoted prices for similar financial instruments, interest rates, prepayment speed, credit risk, etc.)
- Level 3 – significant unobservable inputs (including the Fund’s own assumptions in determining the fair value of financial instruments)
The input levels are not necessarily an indication of the risk or liquidity associated with financial instruments at that level.
For movements between the levels within the fair value hierarchy, the Fund has adopted a policy of recognizing the transfers as of the date of the underlying event which caused the movement.
A summary of inputs used as of October 31, 2013, in valuing the Fund’s assets carried at fair value, is as follows:
| | | | | | | | |
| | | Level 1 | | Level 2 | | Level 3 | | Total |
| Assets: | | | | | | | | |
| Investments in Securities: | | | | | | | | |
| Equity Investmentsa: | | | | | | | | |
| Hong Kong | $ | 362,940 | $ | 92,374 | $ | — | $ | 455,314 |
| Taiwan | | 630,168 | | 947 | | — | | 631,115 |
| Other Equity Investmentsb | | 35,762,487 | | — | | — | | 35,762,487 |
| Participatory Notes | | — | | 249,179 | | — | | 249,179 |
| Short Term Investments | | — | | 195,000 | | — | | 195,000 |
| Total Investments in Securities | $ | 36,755,595 | $ | 537,500 | $ | — | $ | 37,293,095 |
| Forward Exchange Contracts | | — | | 12,598 | | — | | 12,598 |
| alncludes common and preferred stocks as well as other equity investments. | | | | | | | | |
| bFor detailed categories, see the accompanying Statement of Investments. | | | | | | | | |
A reconciliation of assets in which Level 3 inputs are used in determining fair value is presented when there are significant Level 3 investments at the end of the period.
50 | Annual Report
Franklin Templeton International Trust
Notes to Financial Statements (continued)
Franklin World Perspectives Fund
12. NEW ACCOUNTING PRONOUNCEMENTS
In December 2011, the Financial Accounting Standards Board (FASB) issued Accounting Standards Update (ASU) No. 2011-11, Balance Sheet (Topic 210): Disclosures about Offsetting Assets and Liabilities. The amendments in the ASU enhance disclosures about offsetting of financial assets and liabilities to enable investors to understand the effect of these arrangements on a fund’s financial position. In January 2013, FASB issued ASU No. 2013-01, Balance Sheet (Topic 210): Clarifying the Scope of Disclosures about Offsetting Assets and Liabilities. The amendments in ASU No. 2013-01 clarify the intended scope of disclosures required by ASU No. 2011-11. These ASUs are effective for interim and annual reporting periods beginning on or after January 1, 2013. The Fund believes the adoption of these ASUs will not have a material impact on its financial statements.
In June 2013, FASB issued ASU No. 2013-08, Investment Companies (Topic 946): Amendments to the Scope, Measurement, and Disclosure Requirements. The ASU modifies the criteria used in defining an investment company under U.S. Generally Accepted Accounting Principles and also sets forth certain measurement and disclosure requirements. Under the ASU, an entity that is registered under the 1940 Act automatically qualifies as an investment company. The ASU is effective for interim and annual reporting periods beginning after December 15, 2013. The Fund is currently reviewing the requirements and believes the adoption of this ASU will not have a material impact on its financial statements.
13. SUBSEQUENT EVENTS
The Fund has evaluated subsequent events through the issuance of the financial statements and determined that no events have occurred that require disclosure.
| | | |
| ABBREVIATIONS | | | |
| |
| Counterparty | Selected Portfolio |
| |
| BKF - DEUTSCHE BANK AG | ADR | - | American Depositary Receipt |
| | CDI | - | Clearing House Electronic Subregister System Depositary Interest |
| | ETF | - | Exchange Traded Fund |
| | FFCB | - | Federal Farm Credit Bank |
| | IDR | - | InternationalDepositary Receipt |
Annual Report | 51
Franklin Templeton International Trust
Report of Independent Registered Public Accounting Firm
Franklin World Perspectives Fund
To the Board of Trustees and Shareholders of Franklin Templeton International Trust
In our opinion, the accompanying statement of assets and liabilities, including the statement of investments, and the related statements of operations and of changes in net assets and the financial highlights present fairly, in all material respects, the financial position of The Franklin World Perspectives Fund (one of the funds constituting the Franklin Templeton International Trust, hereafter referred to as the “Fund”) at October 31, 2013, the results of its operations for the year then ended, the changes in its net assets for each of the two years in the period then ended and the financial highlights for the periods presented, in conformity with accounting principles generally accepted in the United States of America. These financial statements and financial highlights (hereafter referred to as “financial statements”) are the responsibility of the Fund’s management. Our responsibility is to express an opinion on these financial statements based on our audits. We conducted our audits of these financial statements in accordance with the standards of the Public Company Accounting Oversight Board (United States). Those standards require that we plan and perform the audit to obtain reasonable assurance about whether the financial statements are free of material misstatement. An audit includes examining, on a test basis, evidence supporting the amounts and disclosures in the financial statements, assessing the accounting principles used and significant estimates made by management, and evaluating the overall financial statement presentation. We believe that our audits, which included confirmation of securities at October 31, 2013 by correspondence with the custodian, transfer agent and brokers, provide a reasonable basis for our opinion.
PricewaterhouseCoopers LLP
San Francisco, California
December 17, 2013
52 | Annual Report
Franklin Templeton International Trust
Tax Information (unaudited)
Franklin World Perspectives Fund
Under Section 854(b)(1)(A) of the Internal Revenue Code (Code), the Fund hereby reports 38.97% of the ordinary income dividends as income qualifying for the dividends received deduction for the fiscal year ended October 31, 2013.
Under Section 854(b)(1)(B) of the Code, the Fund hereby reports the maximum amount allowable but no less than $466,383 as qualified dividends for purposes of the maximum rate under Section 1(h)(11) of the Code for the fiscal year ended October 31, 2013. Distributions, including qualified dividend income, paid during calendar year 2013 will be reported to shareholders on Form 1099-DIV by mid-February 2014. Shareholders are advised to check with their tax advisors for information on the treatment of these amounts on their individual income tax returns.
At October 31, 2012, more than 50% of the Fund’s total assets were invested in securities of foreign issuers. In most instances, foreign taxes were withheld from income paid to the Fund on these investments. As shown in the table below, the Fund hereby reports to shareholders the foreign source income and foreign taxes paid, pursuant to Section 853 of the Code. This written statement will allow shareholders of record on December 14, 2012, to treat their proportionate share of foreign taxes paid by the Fund as having been paid directly by them. The shareholder shall consider these amounts as foreign taxes paid in the tax year in which they receive the Fund distribution.
The following table provides a detailed analysis of foreign tax paid, foreign source income, and foreign qualified dividends as reported by the Fund, to Class A, Class C, Class R, and Advisor Class shareholders of record.
| | | | | | |
| | | Foreign Tax | | Foreign | | Foreign |
| | | Paid | | Source Income | | Qualified Dividends |
| Class | | Per Share | | Per Share | | Per Share |
| Class A | $ | 0.0130 | $ | 0.0934 | $ | 0.0453 |
| Class C | $ | 0.0130 | $ | 0.0548 | $ | 0.0267 |
| Class R | $ | 0.0130 | $ | 0.0711 | $ | 0.0344 |
| Advisor Class | $ | 0.0130 | $ | 0.1007 | $ | 0.0492 |
Foreign Tax Paid Per Share (Column 1) is the amount per share available to you, as a tax credit (assuming you held your shares in the Fund for a minimum of 16 days during the 31-day period beginning 15 days before the ex-dividend date of the Fund’s distribution to which the foreign taxes relate), or, as a tax deduction.
Foreign Source Income Per Share (Column 2) is the amount per share of income dividends attributable to foreign securities held by the Fund, plus any foreign taxes withheld on these dividends. The amounts reported include foreign source qualified dividends that have not been adjusted for the rate differential applicable to such dividend income.1
Annual Report | 53
Franklin Templeton International Trust
Tax Information (unaudited) (continued)
Franklin World Perspectives Fund
Foreign Qualified Dividends Per Share (Column 3) is the amount per share of foreign source qualified dividends, plus any foreign taxes withheld on these dividends. These amounts represent the portion of the Foreign Source Income reported to you in column 2 that were derived from qualified foreign securities held by the Fund.1
By mid-February 2013, shareholders received Form 1099-DIV which included their share of taxes paid and foreign source income distributed during the calendar year 2012. The Foreign Source Income reported on Form 1099-DIV has not been adjusted for the rate differential on foreign source qualified dividend income. Shareholders are advised to check with their tax advisors for information on the treatment of these amounts on their 2012 individual income tax returns.
1Qualified dividends are taxed at reduced long term capital gains tax rates. In determining the amount of foreign tax credit that may be applied against the U.S. tax liability of individuals receiving foreign source qualified dividends, adjustments may be required to the foreign tax credit limitation calculation to reflect the rate differential applicable to such dividend income. The rules however permit certain individuals to elect not to apply the rate differential adjustments for capital gains and/or dividends for any taxable year. Please consult your tax advisor and the instructions to Form 1116 for more information.
54 | Annual Report
Franklin Templeton International Trust
Board Members and Officers
The name, year of birth and address of the officers and board members, as well as their affiliations, positions held with the Trust, principal occupations during at least the past five years and number of portfolios overseen in the Franklin Templeton Investments fund complex are shown below. Generally, each board member serves until that person’s successor is elected and qualified.

Annual Report | 55
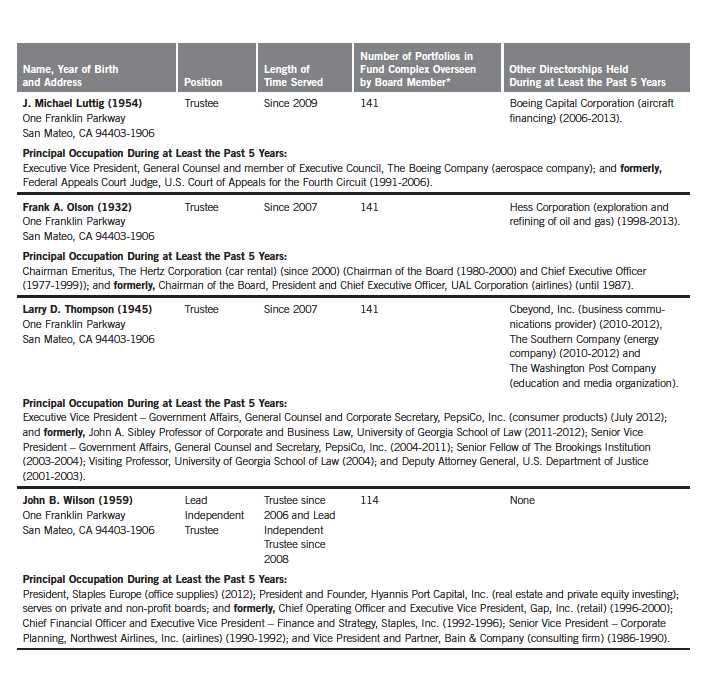
56 | Annual Report
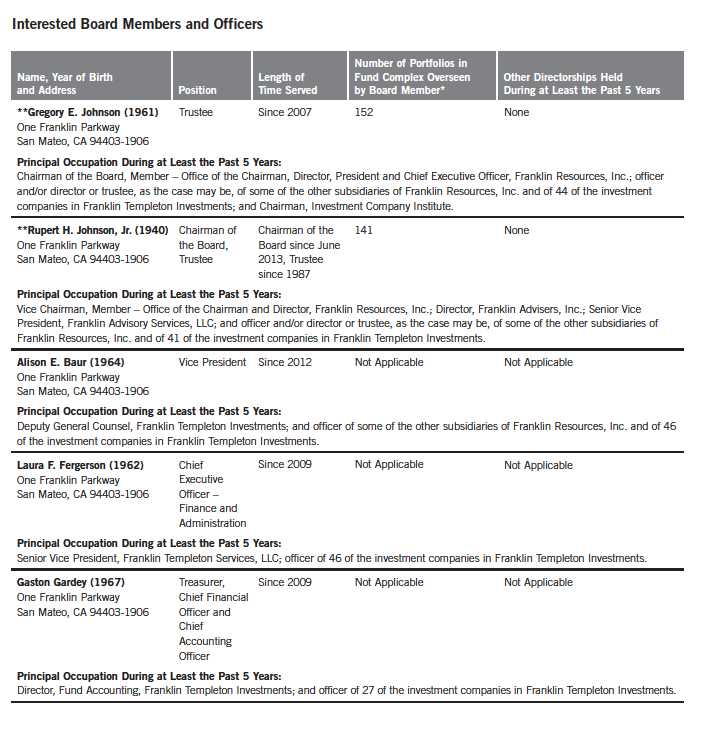
Annual Report | 57
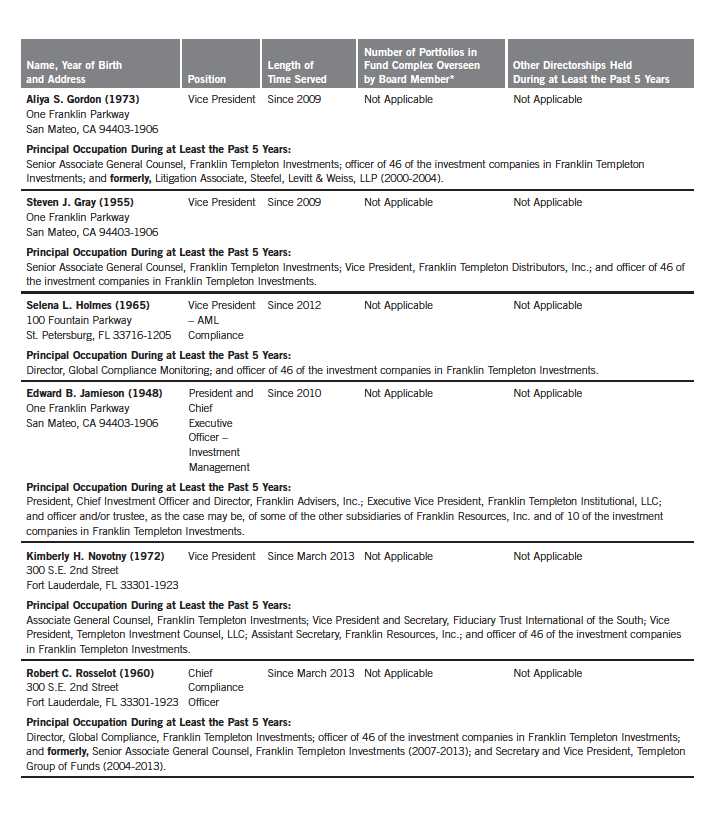
58 | Annual Report
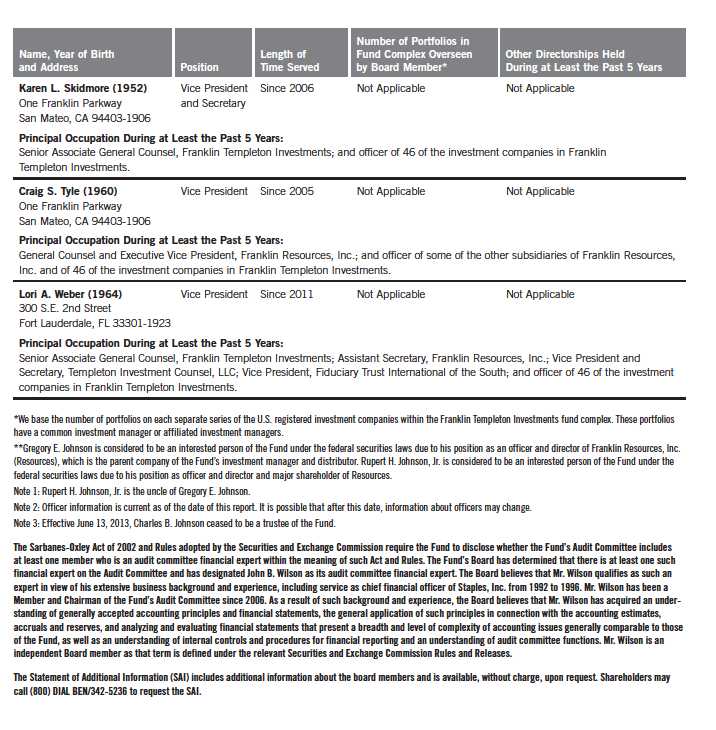
Annual Report | 59
Franklin Templeton International Trust
Shareholder Information
Franklin World Perspectives Fund
Proxy Voting Policies and Procedures
The Fund’s investment manager has established Proxy Voting Policies and Procedures (Policies) that the Fund uses to determine how to vote proxies relating to portfolio securities. Shareholders may view the Fund’s complete Policies online at franklintempleton.com. Alternatively, shareholders may request copies of the Policies free of charge by calling the Proxy Group collect at (954) 527-7678 or by sending a written request to: Franklin Templeton Companies, LLC, 300 S.E. 2nd Street, Fort Lauderdale, FL 33301, Attention: Proxy Group. Copies of the Fund’s proxy voting records are also made available online at franklintempleton.com and posted on the U.S. Securities and Exchange Commission’s website at sec.gov and reflect the most recent 12-month period ended June 30.
Quarterly Statement of Investments
The Fund files a complete statement of investments with the U.S. Securities and Exchange Commission for the first and third quarters for each fiscal year on Form N-Q. Shareholders may view the filed Form N-Q by visiting the Commission’s website at sec.gov. The filed form may also be viewed and copied at the Commission’s Public Reference Room in Washington, DC. Information regarding the operations of the Public Reference Room may be obtained by calling (800) SEC-0330.
Householding of Reports and Prospectuses
You will receive the Fund’s financial reports every six months as well as an annual updated summary prospectus (prospectus available upon request). To reduce Fund expenses, we try to identify related shareholders in a household and send only one copy of the financial reports and summary prospectus. This process, called “householding,” will continue indefinitely unless you instruct us otherwise. If you prefer not to have these documents householded, please call us at (800) 632-2301. At any time you may view current prospectuses/summary prospectuses and financial reports on our website. If you choose, you may receive these documents through electronic delivery.
60 | Annual Report


| 1
Annual Report
Templeton Foreign Smaller Companies Fund
Your Fund’s Goal and Main Investments: Templeton Foreign Smaller Companies Fund seeks to provide long-term capital growth. Under normal market conditions, the Fund invests at least 80% of its net assets in investments of smaller companies located outside the U.S., including emerging markets.
Performance data represent past performance, which does not guarantee future results. Investment return and principal value will fluctuate, and you may have a gain or loss when you sell your shares. Current performance may differ from figures shown. Please visit franklintempleton.com or call (800) 342-5236 for most recent month-end performance.

We are pleased to bring you Templeton Foreign Smaller Companies Fund’s annual report for the fiscal year ended October 31, 2013. Effective at the market close on December 10, 2013, the Fund will close to new investors. Existing shareholders may add to their accounts. We believe this closure will help us manage the inflow of assets and allow us to effectively manage our current level of assets.
Performance Overview
For the 12 months under review, Templeton Foreign Smaller Companies Fund –Class A delivered a +27.43% cumulative total return. In comparison, the MSCI All Country World Index (ACWI) ex USA Small Cap Index, which measures
The dollar value, number of shares or principal amount, and names of all portfolio holdings are listed in the Fund’s Statement of Investments (SOI). The SOI begins on page 19.
Annual Report | 3
| | |
| Top 10 Sectors/Industries | | |
| 10/31/13 | | |
| | % of Total | |
| | Net Assets | |
| Household Durables | 8.3 | % |
| Energy Equipment & Services | 6.1 | % |
| Metals & Mining | 5.5 | % |
| Machinery | 5.1 | % |
| Auto Components | 5.0 | % |
| Textiles, Apparel & Luxury Goods | 5.0 | % |
| Personal Products | 4.8 | % |
| Electronic Equipment, Instruments & | |
| Components | 4.6 | % |
| Life Sciences Tools & Services | 4.2 | % |
| Capital Markets | 3.6 | % |
performance of international small capitalization stocks in developed and emerging markets, excluding the U.S., generated a +24.12% total return.1 Please note index performance information is provided for reference and we do not attempt to track an index but rather undertake investments on the basis of fundamental research. You can find the Fund’s long-term performance data in the Performance Summary beginning on page 8.
Economic and Market Overview
The 12 months under review encompassed a period of reinvigorated policy support and economic recovery in the developed world, which offset a slowdown in emerging markets, periods of bond sell-offs and rising geopolitical tensions. Leadership transitions in some of the world’s largest economies, including the U.S., Germany, China and Japan, proceeded smoothly. The drama of electoral politics was replaced by that of fiscal politics as U.S. lawmakers struck a deal on New Year’s Day to partially avert automatic tax hikes and spending cuts. Late in the period, a partial U.S. federal government shutdown ended after Congress agreed to fund the government and raise the debt limit through early 2014. The U.S. Federal Reserve Board (Fed) noted that although the government’s fiscal policy may have restrained growth, the U.S. economy maintained its underlying strength.
The stock market rally in developed markets accelerated in 2013 amid redoubled central bank commitments, continued corporate earnings strength and increasing signs of economic progress, although the recovery remained uneven. U.S. growth and employment trends generally exceeded expectations, and several major U.S. equity indexes reached new nominal highs. The eurozone emerged from its longest recession on record, while Japan’s growth improved but failed to meet analysts’ expectations. Growth in China and emerging markets, however, tended to slow.
Differences in global economic trends corresponded with increasingly divergent policy approaches. The Fed vowed to keep interest rates low until unemployment met its 6.5% target but sparked considerable volatility and a Treasury sell-off by suggesting it might taper monthly bond purchases should economic conditions warrant. Amid uncertainty about future Fed actions, the International Monetary Fund adjusted downward its world growth forecasts for 2013 and 2014. The European Central Bank cut benchmark interest rates to a record low
1. Source: © 2013 Morningstar. All Rights Reserved. The information contained herein: (1) is proprietary to Morningstar and/or its content providers; (2) may not be copied or distributed; and (3) is not warranted to be accurate, complete or timely. Neither Morningstar nor its content providers are responsible for any damages or losses arising from any use of this information. The index is unmanaged and includes reinvested dividends. One cannot invest directly in an index, and an index is not representative of the Fund’s portfolio.
4 | Annual Report
and pledged to maintain systemic support following political turmoil in Greece, Spain, Portugal and Italy. Germany’s re-election of Chancellor Angela Merkel was largely perceived as a vote of support for ongoing eurozone reform measures. In Asia, the Bank of Japan set an explicit inflation target and pledged to double bond purchases in an unprecedented wave of policy reform. Emerging market central banks were less accommodative, with Brazil’s central bank hiking interest rates amid rising inflation and China’s central bank taking measures to curb real estate and credit speculation. Chinese liquidity tightening rattled credit markets, and a spike in interbank lending rates underscored concerns about the country’s shadow banking system.
Volatility engulfed the broader emerging market region as protests roiled Turkey and Brazil, civil war threatened Egypt and international military intervention looked possible in Syria. Regional asset prices tumbled as investors responded to rising bond rates by unwinding highly leveraged emerging market carry trades.2 In response, emerging market stocks recorded their biggest outflows on record and regional currencies sharply depreciated. However, emerging market stocks performed well late in the period, and oil staged a late rally based on supply concerns related to geopolitical turmoil. Gold, which had recorded its biggest price drop in four decades over the summer, recovered somewhat at period-end. Increasingly divergent economic and political circumstances during the period resulted in declining market correlations, which many bottom-up investors perceived as more favorable.
Investment Strategy
We employ a bottom-up, value-oriented, long-term approach to investing. We focus our analysis on the market price of a company’s securities relative to our evaluation of the company’s long-term earnings, asset value and cash flow potential. We also consider a company’s price/earnings ratio, profit margins and liquidation value. We are patient investors and may hold a security for several years as we wait for the market to recognize a company’s true worth.
Manager’s Discussion
Several holdings performed well during the fiscal year under review. HAJIME CONSTRUCTION is one of Japan’s largest builders of single detached homes. Unlike most of its peers, HAJIME remained profitable through a challenging period, aided by its position as a low-cost builder operating at the low end of
2. In a carry trade, an investor seeks to profit from an interest rate differential by borrowing low-yielding currencies and lending high-yielding currencies. The use of borrowed capital to facilitate the trade creates leverage for the borrower.
| | |
| Top 10 Equity Holdings | | |
| 10/31/13 | | |
| |
| Company | % of Total | |
| Sector/Industry, Country | Net Assets | |
| HAJIME CONSTRUCTION CO. LTD. | 3.2 | % |
| Household Durables, Japan | | |
| Ensign Energy Services Inc. | 2.7 | % |
| Energy Equipment & Services, Canada | |
| African Minerals Ltd. | 2.3 | % |
| Metals & Mining, U.K. | | |
| Kobayashi Pharmaceutical Co. Ltd. | 2.2 | % |
| Personal Products, Japan | | |
| HudBay Minerals Inc. | 2.2 | % |
| Metals & Mining, Canada | | |
| Minth Group Ltd. | 2.2 | % |
| Auto Components, China | | |
| Techtronic Industries Co. Ltd. | 2.2 | % |
| Household Durables, Hong Kong | | |
| Asics Corp. | 2.1 | % |
| Textiles, Apparel & Luxury Goods, Japan | |
| Laird PLC | 2.1 | % |
| Electronic Equipment, Instruments | | |
| & Components, U.K. | | |
| Steiner Leisure Ltd. | 2.1 | % |
| Diversified Consumer Services, Bahamas | |
Annual Report | 5
the market and its ability to quickly turn over inventory. On June 27, HAJIME and five other homebuilders announced their agreement to create a joint holding company, Iida Group Holdings, to combine their management resources and expertise in an effort to secure new revenue sources and enter overseas markets. Immediately after period-end, HAJIME became a subsidiary of Iida Group Holdings.
Kingsoft is a leading Chinese information technology firm. The company has transformed itself from what could be considered a minor online gaming concern into an Internet leader providing security software, web browser, productivity applications and cloud computing solutions. In 2012, earnings beat forecasts, and almost all of the company’s business segments reported better-than-expected results, leading to strong share-price appreciation. We closed the Fund’s position in the company during the period.
Azimut Holding (AZM) is one of Italy’s largest independent asset managers. Shares performed strongly amid an increase in assets under management and a gain in market share. AZM is not a leveraged vehicle and has no direct asset exposure to the financially troubled European countries. Additionally, AZM’s assets under management grew faster than those of the Italian mutual fund industry over the past five years. We closed the Fund’s position in the company during the period.
In contrast, certain Fund positions hindered performance during the 12-month period. HudBay Minerals, a Canada-based integrated zinc and copper producer, holds assets in North and South America. The company was negatively affected by weaker-than-expected metal prices that reduced earnings and weakened liquidity. In our longer term view, an increase in metal prices and acquisitions could lead to a rise in production, reserves, net asset value and earnings.
U.K.-based African Minerals is a minerals exploration and development firm. The company’s share price declined along with those of other mining companies as iron ore price expectations subsided amid a generally weak commodity market environment. However, the company has a strong Sierra Leone-based iron ore production growth profile that, in our view, could help offset any potential further weakness in the underlying commodity price.
Diagnosticos da America is Brazil’s largest medical diagnostic support services provider. Shares performed poorly amid a weak local currency and investor concerns about the Brazilian economy and the company’s internal operations. Specifically, the previous management’s focus on profit maximization led to underinvestment and customer-service quality issues, which resulted in market share losses.
6 | Annual Report
We believe the recent appointment of a new management team to turn around operations, a process that could take time to show benefits, could improve the company’s long-term prospects.
Thank you for your continued participation in Templeton Foreign Smaller Companies Fund. We look forward to serving your future investment needs.

CFA® is a trademark owned by CFA Institute.
The foregoing information reflects our analysis, opinions and portfolio holdings as of October 31, 2013, the end of the reporting period. The way we implement our main investment strategies and the resulting portfolio holdings may change depending on factors such as market and economic conditions. These opinions may not be relied upon as investment advice or an offer for a particular security. The information is not a complete analysis of every aspect of any market, country, industry, security or the Fund. Statements of fact are from sources considered reliable, but the investment manager makes no representation or warranty as to their completeness or accuracy. Although historical performance is no guarantee of future results, these insights may help you understand our investment management philosophy.
Annual Report | 7
Performance Summary as of 10/31/13
Your dividend income will vary depending on dividends or interest paid by securities in the Fund’s portfolio, adjusted for operating expenses of each class. Capital gain distributions are net profits realized from the sale of portfolio securities. The performance table and graphs do not reflect any taxes that a shareholder would pay on Fund dividends, capital gain distributions, if any, or any realized gains on the sale of Fund shares. Total return reflects reinvestment of the Fund’s dividends and capital gain distributions, if any, and any unrealized gains or losses.
| | | | | | | | |
| Price and Distribution Information | | | | | | |
| |
| Class A (Symbol: FINEX) | | | | Change | | 10/31/13 | | 10/31/12 |
| Net Asset Value (NAV) | | | +$ | 3.63 | $ | 18.02 | $ | 14.39 |
| Distributions (11/1/12–10/31/13) | | | | | | | | |
| Dividend Income | $ | 0.2673 | | | | | | |
| Class C (Symbol: FCFSX) | | | | Change | | 10/31/13 | | 10/31/12 |
| Net Asset Value (NAV) | | | +$ | 3.48 | $ | 17.31 | $ | 13.83 |
| Distributions (11/1/12–10/31/13) | | | | | | | | |
| Dividend Income | $ | 0.1617 | | | | | | |
| Class R6 (Symbol: n/a) | | | | Change | | 10/31/13 | | 5/1/13 |
| Net Asset Value (NAV) | | | +$ | 1.50 | $ | 18.03 | $ | 16.53 |
| Advisor Class (Symbol: FTFAX) | | | | Change | | 10/31/13 | | 10/31/12 |
| Net Asset Value (NAV) | | | +$ | 3.62 | $ | 18.00 | $ | 14.38 |
| Distributions (11/1/12–10/31/13) | | | | | | | | |
| Dividend Income | $ | 0.3065 | | | | | | |
8 | Annual Report
Performance Summary (continued)
Performance
Cumulative total return excludes sales charges. Aggregate and average annual total returns and value of $10,000 investment include maximum sales charges. Class A: 5.75% maximum initial sales charge; Class C: 1% contingent deferred sales charge in first year only; Class R6/Advisor Class: no sales charges.
| | | | | | | | | | | |
| Class A | | | | 1-Year | | | 5-Year | | | 10-Year | |
| Cumulative Total Return1 | | | + | 27.43 | % | + | 133.35 | % | + | 121.32 | % |
| Average Annual Total Return2 | | | + | 20.09 | % | + | 17.08 | % | + | 7.63 | % |
| Value of $10,000 Investment3 | | | $ | 12,009 | | $ | 22,002 | | $ | 20,857 | |
| Avg. Ann. Total Return (9/30/13)4 | | | + | 16.02 | % | + | 9.05 | % | + | 8.09 | % |
| Total Annual Operating Expenses5 | 1.65 | % | | | | | | | | | |
| Class C | | | | 1-Year | | | 5-Year | | | 10-Year | |
| Cumulative Total Return1 | | | + | 26.58 | % | + | 124.93 | % | + | 105.49 | % |
| Average Annual Total Return2 | | | + | 25.58 | % | + | 17.60 | % | + | 7.47 | % |
| Value of $10,000 Investment3 | | | $ | 12,558 | | $ | 22,493 | | $ | 20,549 | |
| Avg. Ann. Total Return (9/30/13)4 | | | + | 21.17 | % | + | 9.52 | % | + | 7.93 | % |
| Total Annual Operating Expenses5 | 2.40 | % | | | | | | | | | |
| Class R6 | | | | | | | | | | Inception (5/1/13) | |
| Cumulative Total Return1 | | | | | | | | | + | 9.07 | % |
| Aggregate Total Return6 | | | | | | | | | + | 9.07 | % |
| Value of $10,000 Investment3 | | | | | | | | | $ | 10,907 | |
| Aggregate Total Return (9/30/13)4, 6 | | | | | | | | | + | 6.72 | % |
| Total Annual Operating Expenses5 | 1.17 | % | | | | | | | | | |
| Advisor Class | | | | 1-Year | | | 5-Year | | | 10-Year | |
| Cumulative Total Return1 | | | + | 27.79 | % | + | 136.25 | % | + | 127.02 | % |
| Average Annual Total Return2 | | | + | 27.79 | % | + | 18.76 | % | + | 8.54 | % |
| Value of $10,000 Investment3 | | | $ | 12,779 | | $ | 23,625 | | $ | 22,702 | |
| Avg. Ann. Total Return (9/30/13)4 | | | + | 23.45 | % | + | 10.62 | % | + | 9.02 | % |
| Total Annual Operating Expenses5 | 1.40 | % | | | | | | | | | |
Performance data represent past performance, which does not guarantee future results. Investment return and principal value will fluctuate, and you may have a gain or loss when you sell your shares. Current performance may differ from figures shown. For most recent month-end performance, go to franklintempleton.com or call (800) 342-5236.
Annual Report | 9
Performance Summary (continued)
Total Return Index Comparison for a Hypothetical $10,000 Investment
Total return represents the change in value of an investment over the periods shown. It includes any current, applicable, maximum sales charge, Fund expenses, account fees and reinvested distributions. The unmanaged index includes reinvestment of any income or distributions. It differs from the Fund in composition and does not pay management fees or expenses. One cannot invest directly in an index.
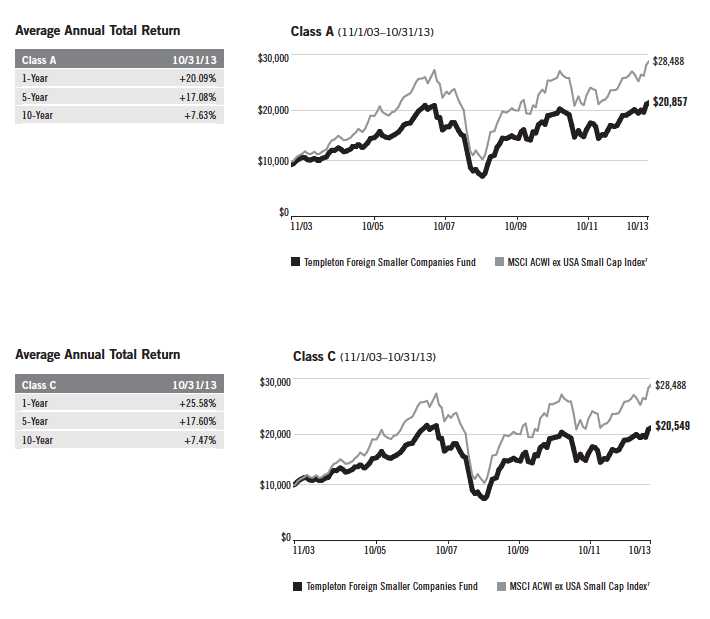
10 | Annual Report
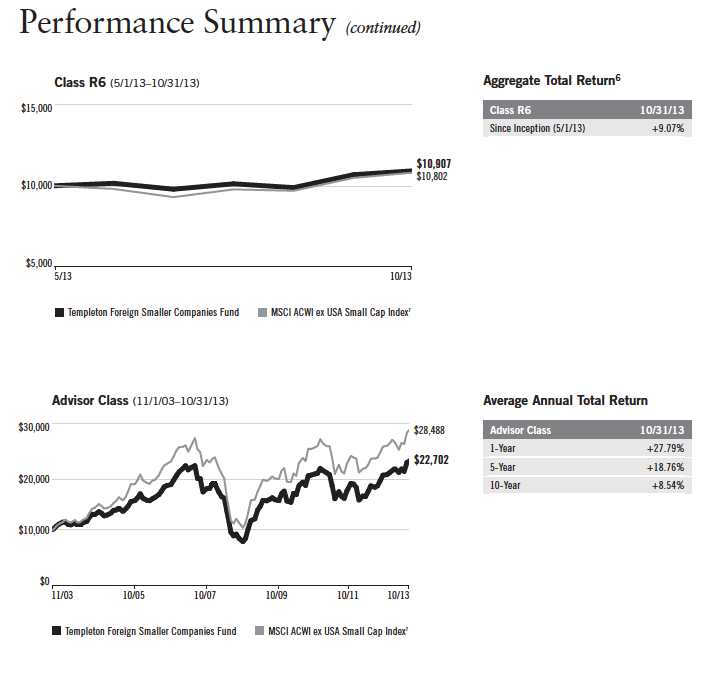
Annual Report | 11
Performance Summary (continued)
Endnotes
All investments involve risks, including possible loss of principal. Special risks are associated with foreign investing, including currency fluctuations, economic instability and political developments. Investments in emerging markets involve heightened risks related to the same factors, in addition to those associated with these markets’ smaller size and lesser liquidity. In addition, smaller company stocks have historically exhibited greater price volatility than large company stocks, particularly over the short term. The Fund is actively managed but there is no guarantee that the manager’s investment decisions will produce the desired results. The Fund’s prospectus also includes a description of the main investment risks.
| |
Class C: | Prior to 1/1/04, these shares were offered with an initial sales charge; thus actual total returns would have differed. These shares have higher annual fees and expenses than Class A shares. |
Class R6: Advisor Class: | Shares are available to certain eligible investors as described in the prospectus. Shares are available to certain eligible investors as described in the prospectus. |
1. Cumulative total return represents the change in value of an investment over the periods indicated.
2. Average annual total return represents the average annual change in value of an investment over the periods indicated.
3. These figures represent the value of a hypothetical $10,000 investment in the Fund over the periods indicated.
4. In accordance with SEC rules, we provide standardized average annual total return information through the latest calendar quarter.
5. Figures are as stated in the Fund’s current prospectus. In periods of market volatility, assets may decline significantly, causing total annual Fund operating expenses to become higher than the figures shown.
6. Aggregate total return represents the change in value of an investment for the period indicated. Since Class R6 shares have existed for less than one year, average annual total return is not available.
7. Source: © 2013 Morningstar. The MSCI ACWI ex USA Small Cap Index is a free float-adjusted, market capitalization-weighted index designed to measure the performance of small cap equity securities of global developed and emerging markets, excluding the U.S.
12 | Annual Report
Your Fund’s Expenses
As a Fund shareholder, you can incur two types of costs:
- Transaction costs, including sales charges (loads) on Fund purchases; and
- Ongoing Fund costs, including management fees, distribution and service (12b-1) fees, and other Fund expenses. All mutual funds have ongoing costs, sometimes referred to as operating expenses.
The following table shows ongoing costs of investing in the Fund and can help you understand these costs and compare them with those of other mutual funds. The table assumes a $1,000 investment held for the six months indicated.
Actual Fund Expenses
The first line (Actual) for each share class listed in the table provides actual account values and expenses. The “Ending Account Value” is derived from the Fund’s actual return, which includes the effect of Fund expenses.
You can estimate the expenses you paid during the period by following these steps. Of course, your account value and expenses will differ from those in this illustration:
| 1. | Divide your account value by $1,000. |
| | If an account had an $8,600 value, then $8,600 ÷ $1,000 = 8.6. |
| 2. | Multiply the result by the number under the heading “Expenses Paid During Period.” |
| | If Expenses Paid During Period were $7.50, then 8.6 x $7.50 = $64.50. |
In this illustration, the estimated expenses paid this period are $64.50.
Hypothetical Example for Comparison with Other Funds
Information in the second line (Hypothetical) for each class in the table can help you compare ongoing costs of investing in the Fund with those of other mutual funds. This information may not be used to estimate the actual ending account balance or expenses you paid during the period. The hypothetical “Ending Account Value” is based on the actual expense ratio for each class and an assumed 5% annual rate of return before expenses, which does not represent the Fund’s actual return. The figure under the heading “Expenses Paid During Period” shows the hypothetical expenses your account would have incurred under this scenario. You can compare this figure with the 5% hypothetical examples that appear in shareholder reports of other funds.
Annual Report | 13
Your Fund’s Expenses (continued)
Please note that expenses shown in the table are meant to highlight ongoing costs and do not reflect any transaction costs, such as sales charges. Therefore, the second line for each class is useful in comparing ongoing costs only, and will not help you compare total costs of owning different funds. In addition, if transaction costs were included, your total costs would have been higher. Please refer to the Fund prospectus for additional information on operating expenses.
| | | | | | |
| | | Beginning Account | | Ending Account | | Expenses Paid During |
| Class A | | Value 5/1/13 | | Value 10/31/13 | | Period* 5/1/13–10/31/13 |
| Actual | $ | 1,000 | $ | 1,092.20 | $ | 8.96 |
| Hypothetical (5% return before expenses) | $ | 1,000 | $ | 1,016.64 | $ | 8.64 |
| Class C | | | | | | |
| Actual | $ | 1,000 | $ | 1,088.00 | $ | 12.89 |
| Hypothetical (5% return before expenses) | $ | 1,000 | $ | 1,012.85 | $ | 12.43 |
| Class R6 | | | | | | |
| Actual | $ | 1,000 | $ | 1,090.70 | $ | 5.90 |
| Hypothetical (5% return before expenses) | $ | 1,000 | $ | 1,019.56 | $ | 5.70 |
| Advisor Class | | | | | | |
| Actual | $ | 1,000 | $ | 1,093.60 | $ | 7.65 |
| Hypothetical (5% return before expenses) | $ | 1,000 | $ | 1,017.90 | $ | 7.37 |
*Expenses are calculated using the most recent six-month expense ratio, annualized for each class (A: 1.70%; C: 2.45%; R6: 1.12%; and Advisor: 1.45%), multiplied by the average account value over the period, multiplied by 184/365 to reflect the one-half year period.
14 | Annual Report
Franklin Templeton International Trust
Financial Highlights
| | | | | | | | | | | | | | | |
| Templeton Foreign Smaller Companies Fund | | | | | | | | | | | | | | | |
| | | | | | Year Ended October 31, | | | | |
| Class A | | 2013 | | | 2012 | | | 2011 | | | 2010 | | | 2009 | |
| Per share operating performance | | | | | | | | | | | | | | | |
| (for a share outstanding throughout the year) | | | | | | | | | | | | | | | |
| Net asset value, beginning of year | $ | 14.39 | | $ | 13.92 | | $ | 15.47 | | $ | 12.82 | | $ | 8.58 | |
| Income from investment operationsa: | | | | | | | | | | | | | | | |
| Net investment incomeb | | 0.13 | | | 0.24 | | | 0.12 | | | 0.08 | | | 0.08 | |
| Net realized and unrealized gains (losses) | | 3.77 | | | 0.38 | | | (1.60 | ) | | 2.68 | | | 4.66 | |
| Total from investment operations | | 3.90 | | | 0.62 | | | (1.48 | ) | | 2.76 | | | 4.74 | |
| Less distributions from: | | | | | | | | | | | | | | | |
| Net investment income | | (0.27 | ) | | (0.15 | ) | | (0.07 | ) | | (0.11 | ) | | (0.45 | ) |
| Net realized gains | | — | | | — | | | — | | | — | | | (0.05 | ) |
| Total distributions | | (0.27 | ) | | (0.15 | ) | | (0.07 | ) | | (0.11 | ) | | (0.50 | ) |
| Net asset value, end of year | $ | 18.02 | | $ | 14.39 | | $ | 13.92 | | $ | 15.47 | | $ | 12.82 | |
| |
| Total returnc | | 27.43 | % | | 4.67 | % | | (9.60 | )% | | 21.71 | % | | 58.99 | % |
| |
| Ratios to average net assets | | | | | | | | | | | | | | | |
| Expenses | | 1.65 | %d | | 1.65 | % | | 1.55 | %d | | 1.59 | %d | | 1.71 | %d |
| Net investment income | | 0.83 | % | | 1.72 | % | | 0.80 | % | | 0.56 | % | | 0.83 | % |
| |
| Supplemental data | | | | | | | | | | | | | | | |
| Net assets, end of year (000’s) | $ | 131,844 | | $ | 103,168 | | $ | 121,119 | | $ | 163,993 | | $ | 144,167 | |
| Portfolio turnover rate | | 42.94 | % | | 57.56 | % | | 50.03 | % | | 19.65 | % | | 32.74 | % |
aThe amount shown for a share outstanding throughout the period may not correlate with the Statement of Operations for the period due to the timing of sales and repurchases of
the Fund shares in relation to income earned and/or fluctuating market value of the investments of the Fund.
bBased on average daily shares outstanding.
cTotal return does not reflect sales commissions or contingent deferred sales charges, if applicable.
dBenefit of expense reduction rounds to less than 0.01%.
Annual Report | The accompanying notes are an integral part of these financial statements. | 15
Franklin Templeton International Trust
Financial Highlights (continued)
| | | | | | | | | | | | | | | |
| Templeton Foreign Smaller Companies Fund | | | | | | | | | | | | | | | |
| | | | | | Year Ended October 31, | | | | |
| Class C | | 2013 | | | 2012 | | | 2011 | | | 2010 | | | 2009 | |
| Per share operating performance | | | | | | | | | | | | | | | |
| (for a share outstanding throughout the year) | | | | | | | | | | | | | | | |
| Net asset value, beginning of year | $ | 13.83 | | $ | 13.36 | | $ | 14.89 | | $ | 12.39 | | $ | 8.26 | |
| Income from investment operationsa: | | | | | | | | | | | | | | | |
| Net investment income (loss)b | | 0.01 | | | 0.13 | | | 0.01 | | | (0.02 | ) | | 0.01 | |
| Net realized and unrealized gains (losses) | | 3.63 | | | 0.38 | | | (1.54 | ) | | 2.60 | | | 4.51 | |
| Total from investment operations | | 3.64 | | | 0.51 | | | (1.53 | ) | | 2.58 | | | 4.52 | |
| Less distributions from: | | | | | | | | | | | | | | | |
| Net investment income | | (0.16 | ) | | (0.04 | ) | | — | | | (0.08 | ) | | (0.34 | ) |
| Net realized gains | | — | | | — | | | — | | | — | | | (0.05 | ) |
| Total distributions | | (0.16 | ) | | (0.04 | ) | | — | | | (0.08 | ) | | (0.39 | ) |
| Net asset value, end of year | $ | 17.31 | | $ | 13.83 | | $ | 13.36 | | $ | 14.89 | | $ | 12.39 | |
| |
| Total returnc | | 26.58 | % | | 3.85 | % | | (10.28 | )% | | 20.90 | % | | 57.73 | % |
| |
| Ratios to average net assets | | | | | | | | | | | | | | | |
| Expenses | | 2.40 | %d | | 2.40 | % | | 2.30 | %d | | 2.34 | %d | | 2.46 | %d |
| Net investment income (loss) | | 0.08 | % | | 0.97 | % | | 0.05 | % | | (0.19 | )% | | 0.08 | % |
| |
| Supplemental data | | | | | | | | | | | | | | | |
| Net assets, end of year (000’s) | $ | 16,027 | | $ | 12,814 | | $ | 14,457 | | $ | 17,202 | | $ | 14,349 | |
| Portfolio turnover rate | | 42.94 | % | | 57.56 | % | | 50.03 | % | | 19.65 | % | | 32.74 | % |
aThe amount shown for a share outstanding throughout the period may not correlate with the Statement of Operations for the period due to the timing of sales and repurchases of
the Fund shares in relation to income earned and/or fluctuating market value of the investments of the Fund.
bBased on average daily shares outstanding.
cTotal return does not reflect sales commissions or contingent deferred sales charges, if applicable.
dBenefit of expense reduction rounds to less than 0.01%.
16 | The accompanying notes are an integral part of these financial statements. | Annual Report
Franklin Templeton International Trust
Financial Highlights (continued)

aFor the period May 1, 2013 (effective date) to October 31, 2013.
bThe amount shown for a share outstanding throughout the period may not correlate with the Statement of Operations for the period due to the timing of sales and repurchases of
the Fund shares in relation to income earned and/or fluctuating market value of the investments of the Fund.
cBased on average daily shares outstanding.
dTotal return is not annualized for periods less than one year.
eRatios are annualized for periods less than one year.
fBenefit of expense reduction rounds to less than 0.01%.
Annual Report | The accompanying notes are an integral part of these financial statements. | 17
Franklin Templeton International Trust
Financial Highlights (continued)
| | | | | | | | | | | | | | | |
| Templeton Foreign Smaller Companies Fund | | | | | | | | | | | | | | | |
| | | | | | Year Ended October 31, | | | | |
| Advisor Class | | 2013 | | | 2012 | | | 2011 | | | 2010 | | | 2009 | |
| Per share operating performance | | | | | | | | | | | | | | | |
| (for a share outstanding throughout the year) | | | | | | | | | | | | | | | |
| Net asset value, beginning of year | $ | 14.38 | | $ | 13.93 | | $ | 15.48 | | $ | 12.81 | | $ | 8.62 | |
| Income from investment operationsa: | | | | | | | | | | | | | | | |
| Net investment incomeb | | 0.18 | | | 0.26 | | | 0.17 | | | 0.11 | | | 0.10 | |
| Net realized and unrealized gains (losses) | | 3.75 | | | 0.39 | | | (1.61 | ) | | 2.69 | | | 4.65 | |
| Total from investment operations | | 3.93 | | | 0.65 | | | (1.44 | ) | | 2.80 | | | 4.75 | |
| Less distributions from: | | | | | | | | | | | | | | | |
| Net investment income | | (0.31 | ) | | (0.20 | ) | | (0.11 | ) | | (0.13 | ) | | (0.51 | ) |
| Net realized gains | | — | | | — | | | — | | | — | | | (0.05 | ) |
| Total distributions | | (0.31 | ) | | (0.20 | ) | | (0.11 | ) | | (0.13 | ) | | (0.56 | ) |
| Net asset value, end of year | $ | 18.00 | | $ | 14.38 | | $ | 13.93 | | $ | 15.48 | | $ | 12.81 | |
| |
| Total return | | 27.79 | % | | 4.90 | % | | (9.38 | )% | | 22.06 | % | | 59.33 | % |
| |
| Ratios to average net assets | | | | | | | | | | | | | | | |
| Expenses | | 1.40 | %c | | 1.40 | % | | 1.30 | %c | | 1.34 | %c | | 1.46 | %c |
| Net investment income | | 1.08 | % | | 1.97 | % | | 1.05 | % | | 0.81 | % | | 1.08 | % |
| |
| Supplemental data | | | | | | | | | | | | | | | |
| Net assets, end of year (000’s) | $ | 40,832 | | $ | 31,817 | | $ | 36,902 | | $ | 33,172 | | $ | 14,438 | |
| Portfolio turnover rate | | 42.94 | % | | 57.56 | % | | 50.03 | % | | 19.65 | % | | 32.74 | % |
aThe amount shown for a share outstanding throughout the period may not correlate with the Statement of Operations for the period due to the timing of sales and repurchases of
the Fund shares in relation to income earned and/or fluctuating market value of the investments of the Fund.
bBased on average daily shares outstanding.
cBenefit of expense reduction rounds to less than 0.01%.
18 | The accompanying notes are an integral part of these financial statements. | Annual Report
Franklin Templeton International Trust
Statement of Investments, October 31, 2013
| | | | |
| Templeton Foreign Smaller Companies Fund | Industry | Shares | | Value |
| Common Stocks 90.3% | | | | |
| Bahamas 2.1% | | | | |
| aSteiner Leisure Ltd. | Diversified Consumer Services | 70,143 | $ | 3,929,411 |
| Belgium 0.3% | | | | |
| Barco NV | Electronic Equipment, Instruments & Components | 6,600 | | 500,195 |
| Brazil 2.4% | | | | |
| Companhia de Saneamento de Minas Gerais | Water Utilities | 107,100 | | 1,729,818 |
| Diagnosticos da America SA | Health Care Providers & Services | 545,600 | | 2,801,009 |
| | | | | 4,530,827 |
| Canada 8.9% | | | | |
| AGF Management Ltd. | Capital Markets | 148,800 | | 1,964,785 |
| Canaccord Genuity Group Inc. | Capital Markets | 192,425 | | 1,221,512 |
| Enerflex Ltd. | Energy Equipment & Services | 164,100 | | 2,324,166 |
| Ensign Energy Services Inc. | Energy Equipment & Services | 298,900 | | 5,107,540 |
| HudBay Minerals Inc. | Metals & Mining | 504,030 | | 4,108,218 |
| Trican Well Service Ltd. | Energy Equipment & Services | 146,700 | | 2,060,848 |
| | | | | 16,787,069 |
| Cayman Islands 0.9% | | | | |
| Stella International Holdings Ltd. | Textiles, Apparel & Luxury Goods | 733,000 | | 1,809,585 |
| China 9.6% | | | | |
| China Medical System Holdings Ltd. | Pharmaceuticals | 1,984,000 | | 1,786,200 |
| Digital China Holdings Ltd. | Electronic Equipment, Instruments & Components | 1,654,000 | | 2,176,049 |
| Haier Electronics Group Co. Ltd. | Household Durables | 1,294,000 | | 2,757,258 |
| MIE Holdings Corp. | Oil, Gas & Consumable Fuels | 9,224,000 | | 1,974,970 |
| Minth Group Ltd. | Auto Components | 1,952,000 | | 4,088,828 |
| b,cPrince Frog International Holdings Ltd. | Personal Products | 3,805,300 | | 2,287,219 |
| Springland International Holdings Ltd. | Multiline Retail | 2,133,800 | | 1,166,951 |
| Yingde Gases | Chemicals | 1,805,500 | | 1,849,060 |
| | | | | 18,086,535 |
| Finland 1.7% | | | | |
| Amer Sports OYJ | Leisure Equipment & Products | 159,140 | | 3,271,817 |
| Germany 7.0% | | | | |
| DMG MORI SEIKI AG | Machinery | 107,100 | | 3,529,016 |
| Gerresheimer AG | Life Sciences Tools & Services | 59,030 | | 3,913,401 |
| aGSW Immobilien AG | Real Estate Management & Development | 43,240 | | 2,011,083 |
| Leoni AG | Auto Components | 17,320 | | 1,176,220 |
| aMorphoSys AG | Life Sciences Tools & Services | 16,110 | | 1,249,371 |
| Rational AG | Machinery | 4,180 | | 1,282,828 |
| | | | | 13,161,919 |
| Hong Kong 6.0% | | | | |
| Samsonite International SA | Textiles, Apparel & Luxury Goods | 1,290,600 | | 3,520,749 |
| Techtronic Industries Co. Ltd. | Household Durables | 1,621,590 | | 4,082,760 |
| Value Partners Group Ltd. | Capital Markets | 2,979,700 | | 1,810,200 |
| VTech Holdings Ltd. | Communications Equipment | 129,600 | | 1,850,485 |
| | | | | 11,264,194 |
| Indonesia 1.1% | | | | |
| bSakari Resources Ltd. | Metals & Mining | 1,342,000 | | 2,025,748 |
Annual Report | 19
Franklin Templeton International Trust
Statement of Investments, October 31, 2013 (continued)
| | | | |
| Templeton Foreign Smaller Companies Fund | Industry | Shares | | Value |
| Common Stocks (continued) | | | | |
| Italy 4.3% | | | | |
| Amplifon SpA | Health Care Providers & Services | 493,204 | $ | 2,632,103 |
| Marr SpA | Food & Staples Retailing | 126,626 | | 1,991,202 |
| aSorin SpA | Health Care Equipment & Supplies | 1,299,393 | | 3,581,957 |
| | | | | 8,205,262 |
| Japan 10.2% | | | | |
| Asahi Co. Ltd. | Specialty Retail | 79,700 | | 1,350,422 |
| Asics Corp. | Textiles, Apparel & Luxury Goods | 229,200 | | 4,025,715 |
| b,cHAJIME CONSTRUCTION CO. LTD. | Household Durables | 86,900 | | 5,992,189 |
| Keihin Corp. | Auto Components | 147,200 | | 2,393,824 |
| Kobayashi Pharmaceutical Co. Ltd. | Personal Products | 74,379 | | 4,152,969 |
| Seria Co. Ltd. | Multiline Retail | 42,000 | | 1,401,068 |
| | | | | 19,316,187 |
| Netherlands 2.7% | | | | |
| Aalberts Industries NV | Machinery | 91,427 | | 2,736,339 |
| Arcadis NV | Construction & Engineering | 77,330 | | 2,428,362 |
| | | | | 5,164,701 |
| Philippines 2.1% | | | | |
| Energy Development Corp. | Independent Power Producers & Energy Traders | 11,811,100 | | 1,579,351 |
| Vista Land & Lifescapes Inc. | Real Estate Management & Development | 18,543,400 | | 2,359,875 |
| | | | | 3,939,226 |
| Singapore 3.6% | | | | |
| CSE Global Ltd. | IT Services | 2,733,000 | | 2,079,122 |
| Ezion Holdings Ltd. | Energy Equipment & Services | 1,169,000 | | 2,108,002 |
| First Resources Ltd. | Food Products | 1,715,000 | | 2,692,199 |
| | | | | 6,879,323 |
| South Korea 4.0% | | | | |
| BS Financial Group Inc. | Commercial Banks | 182,615 | | 2,918,485 |
| Daum Communication Corp. | Internet Software & Services | 33,095 | | 2,745,379 |
| Halla Visteon Climate Control Corp. | Auto Components | 49,030 | | 1,824,522 |
| | | | | 7,488,386 |
| Spain 1.1% | | | | |
| Construcciones y Auxiliar de Ferrocarriles SA | Machinery | 3,860 | | 2,006,780 |
| Sweden 1.4% | | | | |
| a,bD Carnegie & Co. AB | Capital Markets | 456,515 | | — |
| Oriflame Cosmetics SA, SDR | Personal Products | 85,320 | | 2,699,000 |
| | | | | 2,699,000 |
| Switzerland 1.5% | | | | |
| Lonza Group AG | Life Sciences Tools & Services | 14,990 | | 1,340,193 |
| Tecan Group AG | Life Sciences Tools & Services | 14,240 | | 1,491,346 |
| | | | | 2,831,539 |
| Taiwan 1.1% | | | | |
| Tripod Technology Corp. | Electronic Equipment, Instruments & Components | 1,015,400 | | 1,999,754 |
20 | Annual Report
Franklin Templeton International Trust
Statement of Investments, October 31, 2013 (continued)
| | | | |
| Templeton Foreign Smaller Companies Fund | Industry | Shares | | Value |
| Common Stocks (continued) | | | | |
| Turkey 1.1% | | | | |
| Aygaz AS | Gas Utilities | 450,975 | $ | 2,064,362 |
| United Kingdom 17.2% | | | | |
| aAfrican Minerals Ltd. | Metals & Mining | 1,424,385 | | 4,268,494 |
| APR Energy PLC | Diversified Financial Services | 142,920 | | 2,650,542 |
| Bellway PLC | Household Durables | 61,247 | | 1,477,655 |
| Bovis Homes Group PLC | Household Durables | 111,640 | | 1,407,591 |
| Dignity PLC | Diversified Consumer Services | 97,981 | | 2,184,001 |
| Greggs PLC | Food & Staples Retailing | 132,129 | | 975,187 |
| Homeserve PLC | Commercial Services & Supplies | 889,640 | | 3,348,293 |
| Laird PLC | Electronic Equipment, Instruments & Components | 986,251 | | 3,954,671 |
| Man Group PLC | Capital Markets | 1,253,573 | | 1,789,607 |
| Micro Focus International PLC | Software | 169,920 | | 2,230,960 |
| aOphir Energy PLC | Oil, Gas & Consumable Fuels | 315,714 | | 1,683,125 |
| a,dRoyal Mail PLC, 144A | Air Freight & Logistics | 189,400 | | 1,702,361 |
| SIG PLC | Trading Companies & Distributors | 707,670 | | 2,334,891 |
| aVectura Group PLC | Pharmaceuticals | 1,434,850 | | 2,533,894 |
| | | | | 32,541,272 |
| Total Common Stocks | | | | |
| (Cost $143,724,181) | | | | 170,503,092 |
| Preferred Stocks (Cost $1,809,209) 0.9% | | | | |
| Germany 0.9% | | | | |
| Draegerwerk AG & Co. KGAA, pfd. | Health Care Equipment & Supplies | 13,700 | | 1,609,239 |
| Total Investments before Short Term | | | | |
| Investments (Cost $145,533,390) | | | | 172,112,331 |
| Short Term Investments | | | | |
| (Cost $6,923,000) 3.7% | | | | |
| eInvestments from Cash Collateral Received for | | | | |
| Loaned Securities 3.7% | | | | |
| United States 3.7% | | | | |
| fBNY Mellon Overnight Government Fund, | | | | |
| 0.047% | | 6,923,000 | | 6,923,000 |
| Total Investments (Cost $152,456,390) | | | | |
| 94.9% | | | | 179,035,331 |
| Other Assets, less Liabilities 5.1% | | | | 9,673,577 |
| Net Assets 100.0% | | | $ | 188,708,908 |
See Abbreviations on page 37.
aNon-income producing.
bSecurity has been deemed illiquid because it may not be able to be sold within seven days. At October 31, 2013, the aggregate value of these securities was $10,305,156, representing 5.46% of net assets. cA portion or all of the security is on loan at October 31, 2013. See Note 1(c). dSecurity was purchased pursuant to Rule 144A under the Securities Act of 1933 and may be sold in transactions exempt from registration only to qualified institutional buyers or in a public offering registered under the Securities Act of 1933. This security has been deemed liquid under guidelines approved by the Trust’s Board of Trustees. At October 31, 2013, the value of this security was $1,702,361, representing 0.90% of net assets. eSee Note 1(c) regarding securities on loan. fThe rate shown is the annualized seven-day yield at period end.
Annual Report | The accompanying notes are an integral part of these financial statements. | 21
Franklin Templeton International Trust
Financial Statements
Statement of Assets and Liabilities
October 31, 2013
| | | |
| | | Templeton | |
| | | Foreign Smaller | |
| | | Companies Fund | |
| Assets: | | | |
| Investments in securities: | | | |
| Cost | $ | 152,456,390 | |
| Value (includes securities loaned $6,509,822) | $ | 179,035,331 | |
| Cash | | 16,634,236 | |
| Foreign currency, at value (cost $106,014) | | 105,910 | |
| Receivables: | | | |
| Investment securities sold | | 122,393 | |
| Capital shares sold | | 725,423 | |
| Dividends | | 422,261 | |
| Other assets | | 15 | |
| Total assets | | 197,045,569 | |
| Liabilities: | | | |
| Payables: | | | |
| Investment securities purchased | | 828,273 | |
| Capital shares redeemed | | 265,146 | |
| Management fees | | 150,375 | |
| Distribution fees | | 40,779 | |
| Transfer agent fees | | 87,797 | |
| Payable upon return of securities loaned | | 6,923,000 | |
| Accrued expenses and other liabilities | | 41,291 | |
| Total liabilities | | 8,336,661 | |
| Net assets, at value | $ | 188,708,908 | |
| Net assets consist of: | | | |
| Paid-in capital | $ | 179,292,781 | |
| Undistributed net investment income | | 1,500,918 | |
| Net unrealized appreciation (depreciation) | | 26,595,975 | |
| Accumulated net realized gain (loss) | | (18,680,766 | ) |
| Net assets, at value | $ | 188,708,908 | |
22 | The accompanying notes are an integral part of these financial statements. | Annual Report
Franklin Templeton International Trust
Financial Statements (continued)
Statement of Assets and Liabilities (continued)
October 31, 2013
| | |
| | | Templeton |
| | | Foreign Smaller |
| | | Companies Fund |
| Class A: | | |
| Net assets, at value | $ | 131,844,422 |
| Shares outstanding | | 7,318,545 |
| Net asset value per sharea | $ | 18.02 |
| Maximum offering price per share (net asset value per share ÷ 94.25%) | $ | 19.12 |
| Class C: | | |
| Net assets, at value | $ | 16,026,578 |
| Shares outstanding | | 925,893 |
| Net asset value and maximum offering price per sharea | $ | 17.31 |
| Class R6: | | |
| Net assets, at value | $ | 5,454 |
| Shares outstanding | | 302 |
| Net asset value and maximum offering price per shareb | $ | 18.03 |
| Advisor Class: | | |
| Net assets, at value | $ | 40,832,454 |
| Shares outstanding | | 2,268,145 |
| Net asset value and maximum offering price per share | $ | 18.00 |
| |
| |
| aRedemption price is equal to net asset value less contingent deferred sales charges, if applicable. | | |
| bNet asset value and maximum offering price may not recalculate due to rounding of net assets and/or shares outstanding. | | |
Annual Report | The accompanying notes are an integral part of these financial statements. | 23
Franklin Templeton International Trust
Financial Statements (continued)
Statement of Operations
for the year ended October 31, 2013
| | | |
| | | Templeton | |
| | | Foreign Smaller | |
| | | Companies Fund | |
| Investment income: | | | |
| Dividends (net of foreign taxes of $313,922) | $ | 3,939,108 | |
| Interest | | 971 | |
| Income from securities loaned | | 173,818 | |
| Total investment income | | 4,113,897 | |
| Expenses: | | | |
| Management fees (Note 3a) | | 1,591,128 | |
| Distribution fees: (Note 3c) | | | |
| Class A | | 289,896 | |
| Class B | | 466 | |
| Class C | | 142,049 | |
| Transfer agent fees: (Note 3e) | | | |
| Class A | | 328,065 | |
| Class B | | 114 | |
| Class C | | 40,163 | |
| Class R6 | | 37 | |
| Advisor Class | | 100,680 | |
| Custodian fees (Note 4) | | 26,800 | |
| Reports to shareholders | | 43,781 | |
| Registration and filing fees | | 108,902 | |
| Professional fees | | 50,284 | |
| Trustees’ fees and expenses | | 8,349 | |
| Other | | 23,441 | |
| Total expenses | | 2,754,155 | |
| Expense reductions (Note 4) | | (74 | ) |
| Expenses waived/paid by affiliates (Note 3f) | | (37 | ) |
| Net expenses | | 2,754,044 | |
| Net investment income | | 1,359,853 | |
| Realized and unrealized gains (losses): | | | |
| Net realized gain (loss) from: | | | |
| Investments | | 18,619,350 | |
| Foreign currency transactions | | (100,728 | ) |
| Net realized gain (loss) | | 18,518,622 | |
| Net change in unrealized appreciation (depreciation) on: | | | |
| Investments | | 19,662,239 | |
| Translation of other assets and liabilities denominated in foreign currencies | | 24,190 | |
| Net change in unrealized appreciation (depreciation) | | 19,686,429 | |
| Net realized and unrealized gain (loss) | | 38,205,051 | |
| Net increase (decrease) in net assets resulting from operations | $ | 39,564,904 | |
24 | The accompanying notes are an integral part of these financial statements. | Annual Report
Franklin Templeton International Trust
Financial Statements (continued)
| | | | | | |
| Statements of Changes in Net Assets | | | | | | |
| |
| |
| |
| | | Templeton Foreign | |
| | | Smaller Companies Fund | |
| | | Year Ended October 31, | |
| | | 2013 | | | 2012 | |
| Increase (decrease) in net assets: | | | | | | |
| Operations: | | | | | | |
| Net investment income | $ | 1,359,853 | | $ | 2,698,154 | |
| Net realized gain (loss) from investments and foreign currency transactions | | 18,518,622 | | | (13,401,283 | ) |
| Net change in unrealized appreciation (depreciation) on investments and translation of other | | | | | | |
| assets and liabilities denominated in foreign currencies | | 19,686,429 | | | 15,922,221 | |
| Net increase (decrease) in net assets resulting from operations | | 39,564,904 | | | 5,219,092 | |
| Distributions to shareholders from: | | | | | | |
| Net investment income: | | | | | | |
| Class A | | (1,894,784 | ) | | (1,300,195 | ) |
| Class C | | (146,239 | ) | | (39,953 | ) |
| Advisor Class | | (640,629 | ) | | (517,817 | ) |
| Total distributions to shareholders | | (2,681,652 | ) | | (1,857,965 | ) |
| Capital share transactions: (Note 2) | | | | | | |
| Class A | | 2,778,802 | | | (19,867,995 | ) |
| Class B | | (219,644 | ) | | (900,724 | ) |
| Class C | | 53,502 | | | (2,036,145 | ) |
| Class R6 | | 5,000 | | | — | |
| Advisor Class | | 1,208,773 | | | (6,136,862 | ) |
| Total capital share transactions | | 3,826,433 | | | (28,941,726 | ) |
| Net increase (decrease) in net assets | | 40,709,685 | | | (25,580,599 | ) |
| Net assets: | | | | | | |
| Beginning of year | | 147,999,223 | | | 173,579,822 | |
| End of year | $ | 188,708,908 | | $ | 147,999,223 | |
| Undistributed net investment income included in net assets: | | | | | | |
| End of year | $ | 1,500,918 | | $ | 2,491,931 | |
Annual Report | The accompanying notes are an integral part of these financial statements. | 25
Franklin Templeton International Trust
Notes to Financial Statements
Templeton Foreign Smaller Companies Fund
1. ORGANIZATION AND SIGNIFICANT ACCOUNTING POLICIES
Franklin Templeton International Trust (Trust) is registered under the Investment Company Act of 1940, as amended, (1940 Act) as an open-end investment company, consisting of four separate funds. The Templeton Foreign Smaller Companies Fund (Fund) is included in this report. The financial statements of the remaining funds in the Trust are presented separately. The Fund offers four classes of shares: Class A, Class C, Class R6, and Advisor Class. Effective May 1, 2013, the Fund began offering a new class of shares, Class R6. Effective March 22, 2013, all Class B shares were converted to Class A. Each class of shares differs by its initial sales load, contingent deferred sales charges, voting rights on matters affecting a single class, its exchange privilege and fees primarily due to differing arrangements for distribution and transfer agent fees. The Fund was closed to new investors effective at the close of market December 10, 2013.
The following summarizes the Fund’s significant accounting policies.
a. Financial Instrument Valuation
The Fund’s investments in financial instruments are carried at fair value daily. Fair value is the price that would be received to sell an asset or paid to transfer a liability in an orderly transaction between market participants on the measurement date. Under procedures approved by the Trust’s Board of Trustees (the Board), the Fund’s administrator, investment manager and other affiliates have formed the Valuation and Liquidity Oversight Committee (VLOC). The VLOC provides administration and oversight of the Fund’s valuation policies and procedures, which are approved annually by the Board. Among other things, these procedures allow the Fund to utilize independent pricing services, quotations from securities and financial instrument dealers, and other market sources to determine fair value.
Equity securities listed on an exchange or on the NASDAQ National Market System are valued at the last quoted sale price or the official closing price of the day, respectively. Foreign equity securities are valued as of the close of trading on the foreign stock exchange on which the security is primarily traded, or the NYSE, whichever is earlier. The value is then converted into its U.S. dollar equivalent at the foreign exchange rate in effect at the close of the NYSE on the day that the value of the security is determined. Over-the-counter (OTC) securities are valued within the range of the most recent quoted bid and ask prices. Securities that trade in multiple markets or on multiple exchanges are valued according to the broadest and most representative market. Certain equity securities are valued based upon fundamental characteristics or relationships to similar securities. Investments in non-registered money market funds are valued at the closing net asset value.
The Fund has procedures to determine the fair value of financial instruments for which market prices are not reliable or readily available. Under these procedures, the VLOC convenes on a regular basis to review such financial instruments and considers a number of factors, including significant unobservable valuation inputs, when arriving at fair value. The VLOC primarily employs a market-based approach which may use related or comparable assets or liabilities,
26 | Annual Report
Franklin Templeton International Trust
Notes to Financial Statements (continued)
Templeton Foreign Smaller Companies Fund
| 1. | ORGANIZATION AND SIGNIFICANT ACCOUNTING POLICIES (continued) |
| a. | Financial Instrument Valuation (continued) |
recent transactions, market multiples, book values, and other relevant information for the investment to determine the fair value of the investment. An income-based valuation approach may also be used in which the anticipated future cash flows of the investment are discounted to calculate fair value. Discounts may also be applied due to the nature or duration of any restrictions on the disposition of the investments. Due to the inherent uncertainty of valuations of such investments, the fair values may differ significantly from the values that would have been used had an active market existed. The VLOC employs various methods for calibrating these valuation approaches including a regular review of key inputs and assumptions, transactional back-testing or disposition analysis, and reviews of any related market activity.
Trading in securities on foreign securities stock exchanges and OTC markets may be completed before the daily close of business on the NYSE. Occasionally, events occur between the time at which trading in a foreign security is completed and the close of the NYSE that might call into question the reliability of the value of a portfolio security held by the Fund. As a result, differences may arise between the value of the Fund’s portfolio securities as determined at the foreign market close and the latest indications of value at the close of the NYSE. In order to minimize the potential for these differences, the VLOC monitors price movements following the close of trading in foreign stock markets through a series of country specific market proxies (such as baskets of American Depositary Receipts, futures contracts and exchange traded funds). These price movements are measured against established trigger thresholds for each specific market proxy to assist in determining if an event has occurred that may call into question the reliability of the values of the foreign securities held by the Fund. If such an event occurs, the securities may be valued using fair value procedures, which may include the use of independent pricing services.
In addition, certain foreign markets may be open on days that the NYSE is closed, which could result in differences between the value of the Fund’s portfolio securities on the last business day and the last calendar day of the reporting period. Any significant security valuation changes due to an open foreign market are adjusted and reflected by the Fund for financial reporting purposes.
b. Foreign Currency Translation
Portfolio securities and other assets and liabilities denominated in foreign currencies are translated into U.S. dollars based on the exchange rate of such currencies against U.S. dollars on the date of valuation. The Fund may enter into foreign currency exchange contracts to facilitate transactions denominated in a foreign currency. Purchases and sales of securities, income and expense items denominated in foreign currencies are translated into U.S. dollars at the exchange rate in effect on the transaction date. Portfolio securities and assets and liabilities denominated in foreign currencies contain risks that those currencies will decline in value relative to the U.S. dollar. Occasionally, events may impact the availability or reliability of foreign exchange rates
Annual Report | 27
Franklin Templeton International Trust
Notes to Financial Statements (continued)
Templeton Foreign Smaller Companies Fund
| 1. | ORGANIZATION AND SIGNIFICANT ACCOUNTING POLICIES (continued) |
| b. | Foreign Currency Translation (continued) |
used to convert the U.S. dollar equivalent value. If such an event occurs, the foreign exchange rate will be valued at fair value using procedures established and approved by the Board.
The Fund does not separately report the effect of changes in foreign exchange rates from changes in market prices on securities held. Such changes are included in net realized and unrealized gain or loss from investments on the Statement of Operations.
Realized foreign exchange gains or losses arise from sales of foreign currencies, currency gains or losses realized between the trade and settlement dates on securities transactions and the difference between the recorded amounts of dividends, interest, and foreign withholding taxes and the U.S. dollar equivalent of the amounts actually received or paid. Net unrealized foreign exchange gains and losses arise from changes in foreign exchange rates on foreign denominated assets and liabilities other than investments in securities held at the end of the reporting period.
c. Securities Lending
The Fund participates in an agency based securities lending program. The Fund receives cash collateral against the loaned securities in an amount equal to at least 102% of the market value of the loaned securities. Collateral is maintained over the life of the loan in an amount not less than 100% of the market value of loaned securities, as determined at the close of fund business each day; any additional collateral required due to changes in security values is delivered to the Fund on the next business day. The collateral is invested in a non-registered money fund as indicated on the Statement of Investments. The Fund receives income from the investment of cash collateral, in addition to lending fees and rebates paid by the borrower. The Fund bears the market risk with respect to the collateral investment, securities loaned, and the risk that the agent may default on its obligations to the Fund. The securities lending agent has agreed to indemnify the Fund in the event of default by a third party borrower.
d. Income and Deferred Taxes
It is the Fund’s policy to qualify as a regulated investment company under the Internal Revenue Code. The Fund intends to distribute to shareholders substantially all of its taxable income and net realized gains to relieve it from federal income and excise taxes. As a result, no provision for U.S. federal income taxes is required.
The Fund may be subject to foreign taxation related to income received, capital gains on the sale of securities and certain foreign currency transactions in the foreign jurisdictions in which it invests. Foreign taxes, if any, are recorded based on the tax regulations and rates that exist in the foreign markets in which the Fund invests. When a capital gain tax is determined to apply the Fund records an estimated deferred tax liability in an amount that would be payable if the securities were disposed of on the valuation date.
28 | Annual Report
Franklin Templeton International Trust
Notes to Financial Statements (continued)
Templeton Foreign Smaller Companies Fund
| 1. | ORGANIZATION AND SIGNIFICANT ACCOUNTING POLICIES (continued) |
| d. | Income and Deferred Taxes (continued) |
The Fund recognizes the tax benefits of uncertain tax positions only when the position is “more likely than not” to be sustained upon examination by the tax authorities based on the technical merits of the tax position. As of October 31, 2013, and for all open tax years, the Fund has determined that no liability for unrecognized tax benefits is required in the Fund’s financial statements related to uncertain tax positions taken on a tax return (or expected to be taken on future tax returns). Open tax years are those that remain subject to examination and are based on each tax jurisdiction statute of limitation.
e. Security Transactions, Investment Income, Expenses and Distributions
Security transactions are accounted for on trade date. Realized gains and losses on security transactions are determined on a specific identification basis. Interest income and estimated expenses are accrued daily. Amortization of premium and accretion of discount on debt securities are included in interest income. Dividend income is recorded on the ex-dividend date except that certain dividends from foreign securities are recognized as soon as the Fund is notified of the ex-dividend date. Distributions to shareholders are recorded on the ex-dividend date and are determined according to income tax regulations (tax basis). Distributable earnings determined on a tax basis may differ from earnings recorded in accordance with accounting principles generally accepted in the United States of America. These differences may be permanent or temporary. Permanent differences are reclassified among capital accounts to reflect their tax character. These reclassifications have no impact on net assets or the results of operations. Temporary differences are not reclassified, as they may reverse in subsequent periods.
Common expenses incurred by the Trust are allocated among the funds based on the ratio of net assets of each fund to the combined net assets of the Trust. Fund specific expenses are charged directly to the fund that incurred the expense.
Realized and unrealized gains and losses and net investment income, not including class specific expenses, are allocated daily to each class of shares based upon the relative proportion of net assets of each class. Differences in per share distributions, by class, are generally due to differences in class specific expenses.
f. Accounting Estimates
The preparation of financial statements in accordance with accounting principles generally accepted in the United States of America requires management to make estimates and assumptions that affect the reported amounts of assets and liabilities at the date of the financial statements and the amounts of income and expenses during the reporting period. Actual results could differ from those estimates.
Annual Report | 29
Franklin Templeton International Trust
Notes to Financial Statements (continued)
Templeton Foreign Smaller Companies Fund
| 1. | ORGANIZATION AND SIGNIFICANT ACCOUNTING POLICIES (continued) |
| g. | Guarantees and Indemnifications |
Under the Trust’s organizational documents, its officers and trustees are indemnified by the Trust against certain liabilities arising out of the performance of their duties to the Trust. Additionally, in the normal course of business, the Trust, on behalf of the Fund, enters into contracts with service providers that contain general indemnification clauses. The Trust’s maximum exposure under these arrangements is unknown as this would involve future claims that may be made against the Trust that have not yet occurred. Currently, the Trust expects the risk of loss to be remote.
2. SHARES OF BENEFICIAL INTEREST
At October 31, 2013, there were an unlimited number of shares authorized (without par value).
Transactions in the Fund’s shares were as follows:
| | | | | | | | | | | |
| | | | | Year Ended October 31, | | | | | |
| | | | | 2013 | | 2012 | |
| | Shares | | | Amount | | Shares | | | | Amount | |
| Class A Shares: | | | | | | | | | | | |
| Shares sold | 1,901,123 | | $ | 31,085,928 | | 2,623,068 | | $ | 36,625,881 | |
| Shares issued in reinvestment of | | | | | | | | | | | |
| distributions | 123,662 | | | 1,820,300 | | 101,675 | | | | 1,247,549 | |
| Shares redeemed | (1,878,157 | ) | | (30,127,426 | ) | (4,252,860 | ) | | | (57,741,425 | ) |
| Net increase (decrease) | 146,628 | | $ | 2,778,802 | | (1,528,117 | ) | $ | (19,867,995 | ) |
| Class B Shares:a | | | | | | | | | | | |
| Shares sold | — | | $ | — | | 371 | | | $ | 4,714 | |
| Shares redeemed | (14,472 | ) | | (219,644 | ) | (68,669 | ) | | | (905,438 | ) |
| Net increase (decrease) | (14,472 | ) | $ | (219,644 | ) | (68,298 | ) | | $ | (900,724 | ) |
| Class C Shares: | | | | | | | | | | | |
| Shares sold | 238,972 | | $ | 3,756,164 | | 182,846 | | | $ | 2,452,961 | |
| Shares issued in reinvestment of | | | | | | | | | | | |
| distributions | 9,802 | | | 139,476 | | 3,159 | | | | 37,501 | |
| Shares redeemed | (249,234 | ) | | (3,842,138 | ) | (341,814 | ) | | | (4,526,607 | ) |
| Net increase (decrease) | (460 | ) | $ | 53,502 | | (155,809 | ) | | $ | (2,036,145 | ) |
| Class R6 Shares:b | | | | | | | | | | | |
| Shares sold | 302 | | $ | 5,000 | | | | | | | |
| Net increase (decrease) | 302 | | $ | 5,000 | | | | | | | |
| Advisor Class Shares: | | | | | | | | | | | |
| Shares sold | 1,080,618 | | $ | 17,530,116 | | 1,414,817 | | $ | 19,491,652 | |
| Shares issued in reinvestment of | | | | | | | | | | | |
| distributions | 38,515 | | | 565,022 | | 37,605 | | | | 459,911 | |
| Shares redeemed | (1,063,915 | ) | | (16,886,365 | ) | (1,889,222 | ) | | | (26,088,425 | ) |
| Net increase (decrease) | 55,218 | | $ | 1,208,773 | | (436,800 | ) | | $ | (6,136,862 | ) |
aEffective March 22, 2013, all class B Shares were converted to Class A.
bFor the period May 1, 2013 (effective date) to October 31, 2013.
30 | Annual Report
Franklin Templeton International Trust
Notes to Financial Statements (continued)
Templeton Foreign Smaller Companies Fund
3. TRANSACTIONS WITH AFFILIATES
Franklin Resources, Inc. is the holding company for various subsidiaries that together are referred to as Franklin Templeton Investments. Certain officers and trustees of the Trust are also officers and/or directors of the following subsidiaries:
| |
| Subsidiary | Affiliation |
| Franklin Templeton Investments Corp. (FTIC) | Investment manager |
| Templeton Investment Counsel, LLC (TIC) | Investment manager |
| Franklin Templeton Services, LLC (FT Services) | Administrative manager |
| Franklin Templeton Distributors, Inc. (Distributors) | Principal underwriter |
| Franklin Templeton Investor Services, LLC (Investor Services) | Transfer agent |
a. Management Fees
The Fund pays an investment management fee to FTIC based on the average daily net assets of the Fund as follows:
| | |
| Annualized Fee Rate | | Net Assets |
| 1.000 | % | Up to and including $100 million |
| 0.900 | % | Over $100 million, up to and including $250 million |
| 0.800 | % | Over $250 million, up to and including $500 million |
| 0.750 | % | In excess of $500 million |
Under a subadvisory agreement, TIC, an affiliate of FTIC, provides subadvisory services to the Fund. The subadvisory fee is paid by FTIC based on the average daily net assets, and is not an additional expense of the Fund.
b. Administrative Fees
Under an agreement with FTIC, FT Services provides administrative services to the Fund. The fee is paid by FTIC based on the average daily net assets, and is not an additional expense of the Fund.
c. Distribution Fees
The Board has adopted distribution plans for each share class, with the exception of Class R6 and Advisor Class shares, pursuant to Rule 12b-1 under the 1940 Act. Distribution fees are not charged on shares held by affiliates. Under the Fund’s Class A reimbursement distribution plan, the Fund reimburses Distributors for costs incurred in connection with the servicing, sale and distribution of the Fund’s shares up to the maximum annual plan rate. Under the Class A reimbursement distribution plan, costs exceeding the maximum for the current plan year cannot be reimbursed in subsequent periods. In addition, under the Fund’s Class B and C compensation distribution plans, the Fund pays Distributors for costs incurred in connection with the servicing, sale and distribution of the Fund’s shares up to the maximum annual plan rate for each class. The plan year, for purposes of monitoring compliance with the maximum annual plan rates, is February 1 through January 31.
Annual Report | 31
Franklin Templeton International Trust
Notes to Financial Statements (continued)
Templeton Foreign Smaller Companies Fund
| 3. | TRANSACTIONS WITH AFFILIATES (continued) |
| c. | Distribution Fees (continued) |
The maximum annual plan rates, based on the average daily net assets, for each class, are as follows:
| | |
| Class A | 0.25 | % |
| Class B | 1.00 | % |
| Class C | 1.00 | % |
d. Sales Charges/Underwriting Agreements
Front-end sales charges and contingent deferred sales charges (CDSC) do not represent expenses of the Fund. These charges are deducted from the proceeds of sales of Fund shares prior to investment or from redemption proceeds prior to remittance, as applicable. Distributors has advised the Fund of the following commission transactions related to the sales and redemptions of the Fund’s shares for the year:
| | |
| Sales charges retained net of commissions paid to unaffiliated | | |
| broker/dealers | $ | 26,252 |
| CDSC retained | $ | 588 |
e. Transfer Agent Fees
Each class of shares, except for Class R6, pays transfer agent fees to Investor Services for its performance of shareholder servicing obligations and reimburses Investor Services for out of pocket expenses incurred, including shareholding servicing fees paid to third parties. These fees are allocated daily based upon their relative proportion of such classes’ aggregate net assets. Class R6 pays Investor Services transfer agent fees specific to that class.
For the year ended October 31, 2013, the Fund paid transfer agent fees of $469,059, of which $193,253 was retained by Investor Services.
f. Waiver and Expense Reimbursements
Investor Services has contractually agreed to waive or limit its fees so that the Class R6 transfer agent fees do not exceed 0.01% through February 28, 2014.
4. EXPENSE OFFSET ARRANGEMENT
The Fund has entered into an arrangement with its custodian whereby credits realized as a result of uninvested cash balances are used to reduce a portion of the Fund’s custodian expenses. During the year ended October 31, 2013, the custodian fees were reduced as noted in the Statement of Operations.
32 | Annual Report
Franklin Templeton International Trust
Notes to Financial Statements (continued)
Templeton Foreign Smaller Companies Fund
5. INCOME TAXES
For tax purposes, capital losses may be carried over to offset future capital gains. Capital loss carryforwards with no expiration, if any, must be fully utilized before those losses with expiration dates.
At October 31, 2013, the Fund had capital loss carryforwards of $18,442,662 expiring in 2017.
During the year ended October 31, 2013, the Fund utilized $18,150,747 of capital loss carryforwards.
The tax character of distributions paid during the years ended October 31, 2013 and 2012, was as follows:
| | | | |
| | | 2013 | | 2012 |
| Distributions paid from ordinary income | $ | 2,681,652 | $ | 1,857,965 |
At October 31, 2013, the cost of investments, net unrealized appreciation (depreciation) and undistributed ordinary income for income tax purposes were as follows:
| | | |
| Cost of investments | $ | 153,244,241 | |
| |
| Unrealized appreciation | $ | 38,719,424 | |
| Unrealized depreciation | | (12,928,334 | ) |
| Net unrealized appreciation (depreciation) | $ | 25,791,090 | |
| |
| Distributable earnings – undistributed ordinary income | $ | 2,051,093 | |
Differences between income and/or capital gains as determined on a book basis and a tax basis are primarily due to differing treatments of passive foreign investment company shares and wash sales.
6. INVESTMENT TRANSACTIONS
Purchases and sales of investments (excluding short term securities) for the year ended October 31, 2013, aggregated $65,571,134 and $68,487,096, respectively.
7. CONCENTRATION OF RISK
Investing in foreign securities may include certain risks and considerations not typically associated with investing in U.S. securities, such as fluctuating currency values and changing local and regional economic, political and social conditions, which may result in greater market volatility. In addition, certain foreign securities may not be as liquid as U.S. securities.
Annual Report | 33
Franklin Templeton International Trust
Notes to Financial Statements (continued)
Templeton Foreign Smaller Companies Fund
8. CREDIT FACILITY
The Fund, together with other U.S. registered and foreign investment funds (collectively, Borrowers), managed by Franklin Templeton Investments, are borrowers in a joint syndicated senior unsecured credit facility totaling $1.5 billion (Global Credit Facility) which matures on January 17, 2014. This Global Credit Facility provides a source of funds to the Borrowers for temporary and emergency purposes, including the ability to meet future unanticipated or unusually large redemption requests.
Under the terms of the Global Credit Facility, the Fund shall, in addition to interest charged on any borrowings made by the Fund and other costs incurred by the Fund, pay its share of fees and expenses incurred in connection with the implementation and maintenance of the Global Credit Facility, based upon its relative share of the aggregate net assets of all of the Borrowers, including an annual commitment fee of 0.07% based upon the unused portion of the Global Credit Facility. These fees are reflected in other expenses on the Statement of Operations. During the year ended October 31, 2013, the Fund did not use the Global Credit Facility.
9. FAIR VALUE MEASUREMENTS
The Fund follows a fair value hierarchy that distinguishes between market data obtained from independent sources (observable inputs) and the Fund’s own market assumptions (unobservable inputs). These inputs are used in determining the value of the Fund’s financial instruments and are summarized in the following fair value hierarchy:
- Level 1 – quoted prices in active markets for identical financial instruments
- Level 2 – other significant observable inputs (including quoted prices for similar financial instruments, interest rates, prepayment speed, credit risk, etc.)
- Level 3 – significant unobservable inputs (including the Fund’s own assumptions in determining the fair value of financial instruments)
The input levels are not necessarily an indication of the risk or liquidity associated with financial instruments at that level.
For movements between the levels within the fair value hierarchy, the Fund has adopted a policy of recognizing the transfers as of the date of the underlying event which caused the movement.
34 | Annual Report
Franklin Templeton International Trust
Notes to Financial Statements (continued)
Templeton Foreign Smaller Companies Fund
| 9. | FAIR VALUE MEASUREMENTS (continued) |
| A | summary of inputs used as of October 31, 2013, in valuing the Fund’s assets carried at fair |
value, is as follows:
| | | | | | | | |
| | | Level 1 | | Level 2 | | Level 3 | | Total |
| Assets: | | | | | | | | |
| Investments in Securities: | | | | | | | | |
| Equity Investments: | | | | | | | | |
| China | $ | 15,799,316 | $ | 2,287,219 | $ | — | $ | 18,086,535 |
| Indonesia | | — | | — | | 2,025,748 | | 2,025,748 |
| Japan | | 13,323,998 | | 5,992,189 | | — | | 19,316,187 |
| United Kingdom | | 30,838,911 | | 1,702,361 | | — | | 32,541,272 |
| All Other Equity Investmentsa | | 100,142,589 | | — | | —b | | 100,142,589 |
| Short Term Investments | | — | | 6,923,000 | | — | | 6,923,000 |
| Total Investments in Securities | $ | 160,104,814 | $ | 16,904,769 | $ | 2,025,748 | $ | 179,035,331 |
aFor detailed categories, see the accompanying Statement of Investments.
bIncludes securities determined to have no value at October 31, 2013.
A reconciliation of assets in which Level 3 inputs are used in determining fair value is presented when there are significant Level 3 investments at the end of the period. At October 31, 2013, the reconciliations of assets are as follows:
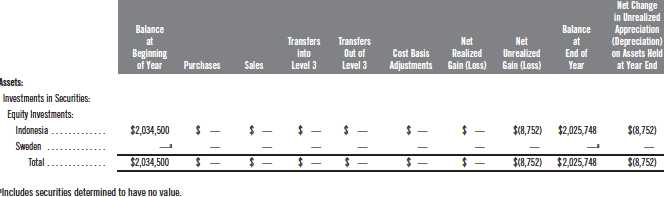
Annual Report | 35
Franklin Templeton International Trust
Notes to Financial Statements (continued)
Templeton Foreign Smaller Companies Fund
9. FAIR VALUE MEASUREMENTS (continued)
Significant unobservable valuation inputs developed by the VLOC for material Level 3 investments and impact to fair value as a result of changes in unobservable valuation inputs as of October 31, 2013, are as follows:

aRepresents the directional change in the fair value of the Level 3 investments that would result from a significant and reasonable increase in the corresponding input. A significant and reasonable decrease in the input would have the opposite effect. Significant impacts, if any, to fair value and/or net assets have been indicated. bRepresents a significant impact to fair value and net assets. cIncludes securities determined to have no value.
10. NEW ACCOUNTING PRONOUNCEMENTS
In December 2011, the Financial Accounting Standards Board (FASB) issued Accounting Standards Update (ASU) No. 2011-11, Balance Sheet (Topic 210): Disclosures about Offsetting Assets and Liabilities. The amendments in the ASU enhance disclosures about offsetting of financial assets and liabilities to enable investors to understand the effect of these arrangements on a fund’s financial position. In January 2013, FASB issued ASU No. 2013-01, Balance Sheet (Topic 210): Clarifying the Scope of Disclosures about Offsetting Assets and Liabilities. The amendments in ASU No. 2013-01 clarify the intended scope of disclosures required by ASU No. 2011-11. These ASUs are effective for interim and annual reporting periods beginning on or after January 1, 2013. The Fund believes the adoption of these ASUs will not have a material impact on its financial statements.
In June 2013, FASB issued ASU No. 2013-08, Investment Companies (Topic 946): Amendments to the Scope, Measurement, and Disclosure Requirements. The ASU modifies the criteria used in defining an investment company under U.S. Generally Accepted Accounting Principles and also sets forth certain measurement and disclosure requirements. Under the ASU, an entity that is registered under the 1940 Act automatically qualifies as an investment company. The ASU is effective for interim and annual reporting periods beginning after December 15, 2013. The Fund is currently reviewing the requirements and believes the adoption of this ASU will not have a material impact on its financial statements.
36 | Annual Report
Franklin Templeton International Trust
Notes to Financial Statements (continued)
Templeton Foreign Smaller Companies Fund
11. SUBSEQUENT EVENTS
The Fund has evaluated subsequent events through the issuance of the financial statements and determined that no events have occurred that require disclosure other than those already disclosed in the financial statements.
| |
| ABBREVIATIONS | |
| Currency | Selected Portfolio |
| SGD -SingaporeDollar | SDR - Swedish Depositary Receipt |
Annual Report | 37
Franklin Templeton International Trust
Report of Independent Registered Public Accounting Firm
Templeton Foreign Smaller Companies Fund
To the Board of Trustees and Shareholders of Franklin Templeton International Trust
In our opinion, the accompanying statement of assets and liabilities, including the statement of investments, and the related statements of operations and of changes in net assets and the financial highlights present fairly, in all material respects, the financial position of the Templeton Foreign Smaller Companies Fund (one of the funds constituting the Franklin Templeton International Trust, hereafter referred to as the “Fund”) at October 31, 2013, the results of its operations for the year then ended, the changes in its net assets for each of the two years in the period then ended and the financial highlights for each of the periods presented, in conformity with accounting principles generally accepted in the United States of America. These financial statements and financial highlights (hereafter referred to as “financial statements”) are the responsibility of the Fund’s management. Our responsibility is to express an opinion on these financial statements based on our audits. We conducted our audits of these financial statements in accordance with the standards of the Public Company Accounting Oversight Board (United States). Those standards require that we plan and perform the audit to obtain reasonable assurance about whether the financial statements are free of material misstatement. An audit includes examining, on a test basis, evidence supporting the amounts and disclosures in the financial statements, assessing the accounting principles used and significant estimates made by management, and evaluating the overall financial statement presentation. We believe that our audits, which included confirmation of securities at October 31, 2013 by correspondence with the custodian and brokers, provide a reasonable basis for our opinion.
PricewaterhouseCoopers LLP
San Francisco, California
December 17, 2013
38 | Annual Report
Franklin Templeton International Trust
Tax Information (unaudited)
Templeton Foreign Smaller Companies Fund
Under Section 854(b)(1)(B) of the Internal Revenue Code (Code), the Fund hereby reports the maximum amount allowable but no less than $1,947,836 as qualified dividends for purposes of the maximum rate under Section 1(h)(11) of the Code for the fiscal year ended October 31, 2013. Distributions, including qualified dividend income, paid during calendar year 2013 will be reported to shareholders on Form 1099-DIV by mid-February 2014. Shareholders are advised to check with their tax advisors for information on the treatment of these amounts on their individual income tax returns.
At October 31, 2012, more than 50% of the Fund’s total assets were invested in securities of foreign issuers. In most instances, foreign taxes were withheld from income paid to the Fund on these investments. As shown in the table below, the Fund hereby reports to shareholders the foreign source income and foreign taxes paid, pursuant to Section 853 of the Code. This written statement will allow shareholders of record on December 14, 2012, to treat their proportionate share of foreign taxes paid by the Fund as having been paid directly by them. The shareholder shall consider these amounts as foreign taxes paid in the tax year in which they receive the Fund distribution.
The following table provides a detailed analysis of foreign tax paid, foreign source income, and foreign qualified dividends as reported by the Fund, to Class A, Class B, Class C, and Advisor Class shareholders of record.
| | | | | | |
| | | Paid | | Source Income | | Qualified Dividends |
| Class | | Per Share | | Per Share | | Per Share |
| Class A | $ | 0.0371 | $ | 0.3136 | $ | 0.1716 |
| Class B | $ | 0.0371 | $ | 0.0000 | $ | 0.0000 |
| Class C | $ | 0.0371 | $ | 0.2111 | $ | 0.1156 |
| Advisor Class | $ | 0.0371 | $ | 0.3518 | $ | 0.1928 |
Foreign Tax Paid Per Share (Column 1) is the amount per share available to you, as a tax credit (assuming you held your shares in the Fund for a minimum of 16 days during the 31-day period beginning 15 days before the ex-dividend date of the Fund’s distribution to which the foreign taxes relate), or, as a tax deduction.
Foreign Source Income Per Share (Column 2) is the amount per share of income dividends attributable to foreign securities held by the Fund, plus any foreign taxes withheld on these dividends. The amounts reported include foreign source qualified dividends that have not been adjusted for the rate differential applicable to such dividend income.1
Foreign Qualified Dividends Per Share (Column 3) is the amount per share of foreign source qualified dividends, plus any foreign taxes withheld on these dividends. These amounts represent the portion of the Foreign Source Income reported to you in column 2 that were derived from qualified foreign securities held by the Fund.1
Annual Report | 39
Franklin Templeton International Trust
Tax Information (unaudited) (continued)
Templeton Foreign Smaller Companies Fund
By mid-February 2013, shareholders received Form 1099-DIV which included their share of taxes paid and foreign source income distributed during the calendar year 2012. The Foreign Source Income reported on Form 1099-DIV has not been adjusted for the rate differential on foreign source qualified dividend income. Shareholders are advised to check with their tax advisors for information on the treatment of these amounts on their 2012 individual income tax returns.
1Qualified dividends are taxed at reduced long term capital gains tax rates. In determining the amount of foreign tax credit that may be applied against the U.S. tax liability of individuals receiving foreign source qualified dividends, adjustments may be required to the foreign tax credit limitation calculation to reflect the rate differential applicable to such dividend income. The rules however permit certain individuals to elect not to apply the rate differential adjustments for capital gains and/or dividends for any taxable year. Please consult your tax advisor and the instructions to Form 1116 for more information.
40 | Annual Report
Franklin Templeton International Trust
Board Members and Officers
The name, year of birth and address of the officers and board members, as well as their affiliations, positions held with the Trust, principal occupations during at least the past five years and number of portfolios overseen in the Franklin Templeton Investments fund complex are shown below. Generally, each board member serves until that person’s successor is elected and qualified.

Annual Report | 41
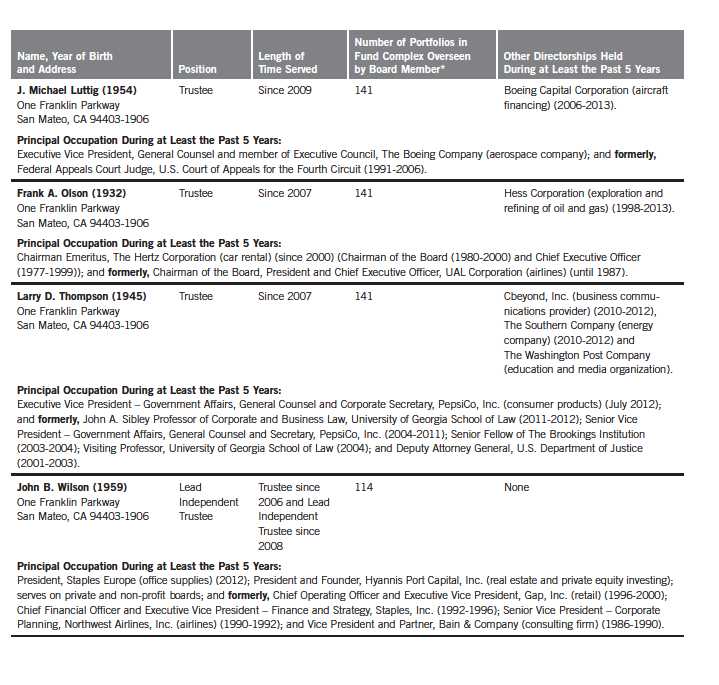
42 | Annual Report

Annual Report | 43
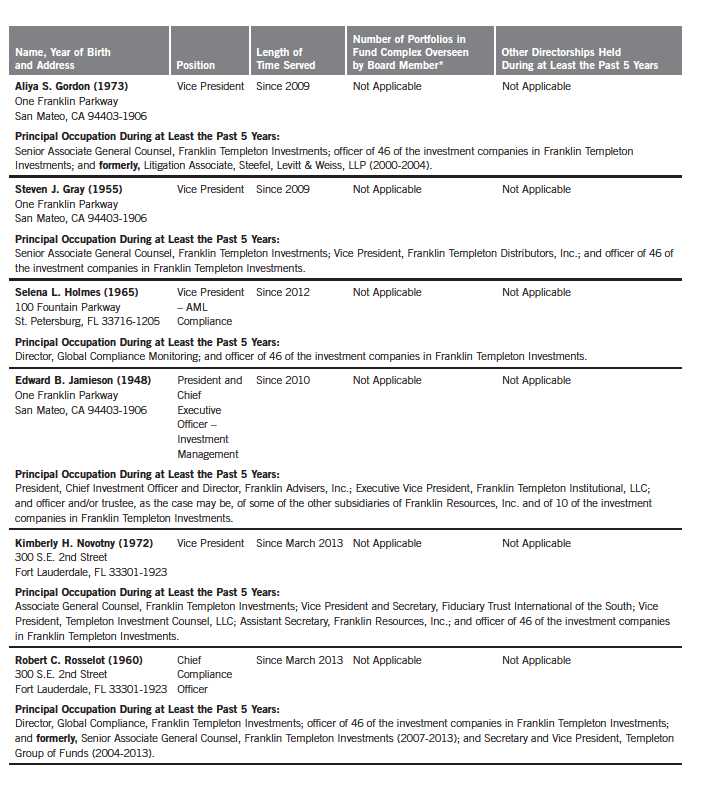
44 | Annual Report
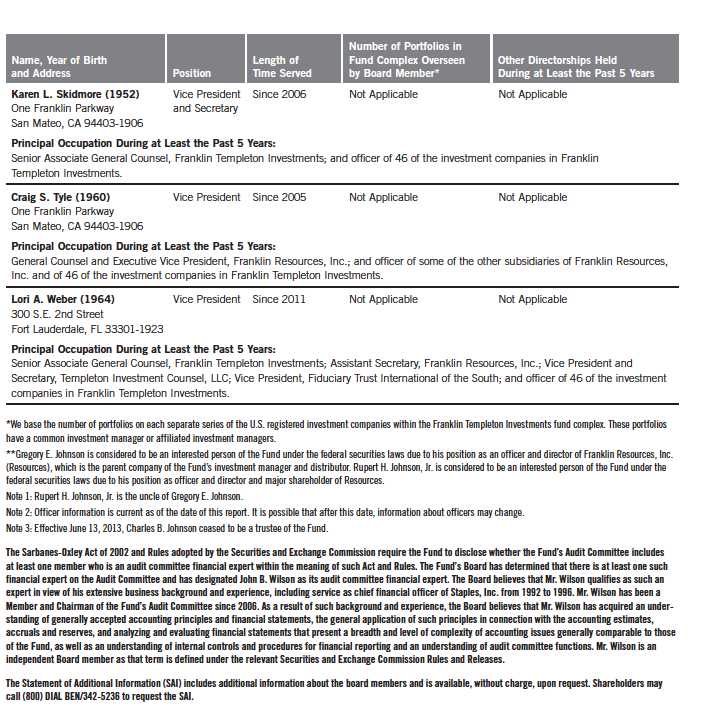
Annual Report | 45
Franklin Templeton International Trust
Shareholder Information
Templeton Foreign Smaller Companies Fund
Proxy Voting Policies and Procedures
The Fund’s investment manager has established Proxy Voting Policies and Procedures (Policies) that the Fund uses to determine how to vote proxies relating to portfolio securities. Shareholders may view the Fund’s complete Policies online at franklintempleton.com. Alternatively, shareholders may request copies of the Policies free of charge by calling the Proxy Group collect at (954) 527-7678 or by sending a written request to: Franklin Templeton Companies, LLC, 300 S.E. 2nd Street, Fort Lauderdale, FL 33301, Attention: Proxy Group. Copies of the Fund’s proxy voting records are also made available online at franklintempleton.com and posted on the U.S. Securities and Exchange Commission’s website at sec.gov and reflect the most recent 12-month period ended June 30.
Quarterly Statement of Investments
The Fund files a complete statement of investments with the U.S. Securities and Exchange Commission for the first and third quarters for each fiscal year on Form N-Q. Shareholders may view the filed Form N-Q by visiting the Commission’s website at sec.gov. The filed form may also be viewed and copied at the Commission’s Public Reference Room in Washington, DC. Information regarding the operations of the Public Reference Room may be obtained by calling (800) SEC-0330.
Householding of Reports and Prospectuses
You will receive the Fund’s financial reports every six months as well as an annual updated summary prospectus (prospectus available upon request). To reduce Fund expenses, we try to identify related shareholders in a household and send only one copy of the financial reports and summary prospectus. This process, called “householding,” will continue indefinitely unless you instruct us otherwise. If you prefer not to have these documents householded, please call us at (800) 632-2301. At any time you may view current prospectuses/summary prospectuses and financial reports on our website. If you choose, you may receive these documents through electronic delivery.
46 | Annual Report
This page intentionally left blank.
This page intentionally left blank.
Item 2. Code of Ethics.
(a) The Registrant has adopted a code of ethics that applies to its principal executive officers and principal financial and accounting officer.
(c) N/A
(d) N/A
(f) Pursuant to Item 12(a)(1), the Registrant is attaching as an exhibit a copy of its code of ethics that applies to its principal executive officers and principal financial and accounting officer.
Item 3. Audit Committee Financial Expert.
(a)(1) The Registrant has an audit committee financial expert serving on its audit committee.
(2) The audit committee financial expert is John B. Wilson and he is "independent" as defined under the relevant Securities and Exchange Commission Rules and Releases.
Item 4. Principal Accountant Fees and Services.
(a) Audit Fees
The aggregate fees paid to the principal accountant for professional services rendered by the principal accountant for the audit of the registrant’s annual financial statements or for services that are normally provided by the principal accountant in connection with statutory and regulatory filings or engagements were $128,810 for the fiscal year ended October 31, 2013 and $144,199 for the fiscal year ended October 31, 2012.
(b) Audit-Related Fees
There were no fees paid to the principal accountant for assurance and related services rendered by the principal accountant to the registrant that are reasonably related to the performance of the audit of the registrant's financial statements and are not reported under paragraph (a) of Item 4.
There were no fees paid to the principal accountant for assurance and related services rendered by the principal accountant to the registrant's investment adviser and any entity controlling, controlled by or under common control with the investment adviser that provides ongoing services to the registrant that are reasonably related to the performance of the audit of their financial statements.
(c) Tax Fees
The aggregate fees paid to the principal accountant for professional services rendered by the principal accountant to the registrant for tax compliance, tax advice and tax planning were $0 the fiscal year ended October 31, 2013 and $1,377 for the fiscal year ended October 31, 2012. The services for which these fees were paid included preparation of tax returns for foreign governments.
The aggregate fees paid to the principal accountant for professional services rendered by the principal accountant to the registrant’s investment adviser and any entity controlling, controlled by or under common control with the investment adviser that provides ongoing services to the registrant for tax compliance, tax advice and tax planning were $6,930 for the fiscal year ended October 31, 2013 and $29,600 for the fiscal year ended October 31, 2012. The services for which these fees were paid included technical tax consultation for capital gain tax reporting to foreign governments, application of local country tax laws to investments and licensing securities with local country offices.
(d) All Other Fees
The aggregate fees paid to the principal accountant for products and services rendered by the principal accountant to the registrant not reported in paragraphs (a)-(c) of Item 4 were $0 for the fiscal year ended October 31, 2013 and $97 for the fiscal year ended October 31, 2012. The services for which these fees were paid include review of materials provided to the fund Board in connection with the investment management contract renewal process.
The aggregate fees paid to the principal accountant for products and services rendered by the principal accountant to the registrant’s investment adviser and any entity controlling, controlled by or under common control with the investment adviser that provides ongoing services to the registrant not reported in paragraphs (a)-(c) of Item 4 were $39,194 for the fiscal year ended October 31, 2013 and $163,864 for the fiscal year ended October 31, 2012. The services for which these fees were paid include preparation and review of materials provided to the fund Board in connection with the investment management contract renewal process. And foreign assets under management certification review.
(e) (1) The registrant’s audit committee is directly responsible for approving the services to be provided by the auditors, including:
(i) pre-approval of all audit and audit related services;
(ii) pre-approval of all non-audit related services to be provided to the Fund by the auditors;
(iii) pre-approval of all non-audit related services to be provided to the registrant by the auditors to the registrant’s investment adviser or to any entity that controls, is controlled by or is under common control with the registrant’s investment adviser and that provides ongoing services to the registrant where the non-audit services relate directly to the operations or financial reporting of the registrant; and
(iv) establishment by the audit committee, if deemed necessary or appropriate, as an alternative to committee pre-approval of services to be provided by the auditors, as required by paragraphs (ii) and (iii) above, of policies and procedures to permit such services to be pre-approved by other means, such as through establishment of guidelines or by action of a designated member or members of the committee; provided the policies and procedures are detailed as to the particular service and the committee is informed of each service and such policies and procedures do not include delegation of audit committee responsibilities, as contemplated under the Securities Exchange Act of 1934, to management; subject, in the case of (ii) through (iv), to any waivers, exceptions or exemptions that may be available under applicable law or rules.
(e) (2) None of the services provided to the registrant described in paragraphs (b)-(d) of Item 4 were approved by the audit committee pursuant to paragraph (c)(7)(i)(C) of Rule 2-01 of regulation S-X.
(f) No disclosures are required by this Item 4(f).
(g) The aggregate non-audit fees paid to the principal accountant for services rendered by the principal accountant to the registrant and the registrant’s investment adviser and any entity controlling, controlled by or under common control with the investment adviser that provides ongoing services to the registrant were $46,124 for the fiscal year ended October 31, 2013 and $194,938 for the fiscal year ended October 31, 2012.
(h) The registrant’s audit committee of the board has considered whether the provision of non-audit services that were rendered to the registrant’s investment adviser (not including any sub-adviser whose role is primarily portfolio management and is subcontracted with or overseen by another investment adviser), and any entity controlling, controlled by, or under common control with the investment adviser that provides ongoing services to the registrant that were not pre-approved pursuant to paragraph (c)(7)(ii) of Rule 2-01 of Regulation S-X is compatible with maintaining the principal accountant’s independence.
Item 5. Audit Committee of Listed Registrants. N/A
Item 6. Schedule of Investments. N/A
Item 7. Disclosure of Proxy Voting Policies and Procedures for Closed-End Management Investment Companies. N/A
Item 8. Portfolio Managers of Closed-End Management Investment Companies. N/A
Item 9. Purchases of Equity Securities by Closed-End Management Investment Company and Affiliated Purchasers. N/A
Item 10. Submission of Matters to a Vote of Security Holders.
There have been no changes to the procedures by which shareholders may recommend nominees to the Registrant's Board of Trustees that would require disclosure herein.
Item 11. Controls and Procedures.
(a) Evaluation of Disclosure Controls and Procedures. The Registrant maintains disclosure controls and procedures that are designed to ensure that information required to be disclosed in the Registrant’s filings under the Securities Exchange Act of 1934 and the Investment Company Act of 1940 is recorded, processed, summarized and reported within the periods specified in the rules and forms of the Securities and Exchange Commission. Such information is accumulated and communicated to the Registrant’s management, including its principal executive officer and principal financial officer, as appropriate, to allow timely decisions regarding required disclosure. The Registrant’s management, including the principal executive officer and the principal financial officer, recognizes that any set of controls and procedures, no matter how well designed and operated, can provide only reasonable assurance of achieving the desired control objectives.
Within 90 days prior to the filing date of this Shareholder Report on Form N-CSR, the Registrant had carried out an evaluation, under the supervision and with the participation of the Registrant’s management, including the Registrant’s principal executive officer and the Registrant’s principal financial officer, of the effectiveness of the design and operation of the Registrant’s disclosure controls and procedures. Based on such evaluation, except as discussed in the following paragraph, the Registrant’s principal executive officer and principal financial officer concluded that the Registrant’s disclosure controls and procedures were effective.
Subsequent to the Registrant’s fiscal year ended October 31, 2013, but prior to the next evaluation of the Registrant’s disclosure controls and procedures, the Registrant’s management became aware that the Franklin India Growth Fund had used incorrect foreign exchange spot rates to value certain Asia Pacific foreign denominated assets and liabilities. The use of incorrect foreign exchange spot rates resulted from a miscommunication with the service provider of these rates, causing the Registrant’s management to update an internal pricing system with incorrect vendor foreign exchange spot rate currency identifiers. The controls in place were insufficient to ensure that accurate currency identifiers were used which resulted in a material weakness as of October 31, 2013. After October 31, 2013 and prior to the issuance of the Franklin India Growth Fund’s annual report as of and for the period then ended, the error was corrected and the Registrant’s internal controls over financial reporting were modified to ensure proper valuation of such Asia Pacific foreign denominated assets and liabilities.
(b) Changes in Internal Controls. There have been no changes in the Registrant’s internal controls or in other factors that could materially affect the internal controls over financial reporting subsequent to the date of their evaluation in connection with the preparation of this Shareholder Report on Form N-CSR.
Item 12. Exhibits.
(a) (1) Code of Ethics
(a) (2) Certifications pursuant to Section 302 of the Sarbanes-Oxley Act of 2002 of Laura F. Fergerson, Chief Executive Officer - Finance and Administration, and Gaston Gardey, Chief Financial Officer and Chief Accounting Officer
(b) Certifications pursuant to Section 906 of the Sarbanes-Oxley Act of 2002 of Laura F. Fergerson, Chief Executive Officer - Finance and Administration, and Gaston Gardey, Chief Financial Officer and Chief Accounting Officer
SIGNATURES
Pursuant to the requirements of the Securities Exchange Act of 1934 and the Investment Company Act of 1940, the registrant has duly caused this report to be signed on its behalf by the undersigned, thereunto duly authorized.
FRANKLIN TEMPLETON INTERNATIONAL TRUST
By /s/LAURA F. FERGERSON
Laura F. Fergerson
Chief Executive Officer - Finance and Administration
Date December 26, 2013
Pursuant to the requirements of the Securities Exchange Act of 1934 and the Investment Company Act of 1940, this report has been signed below by the following persons on behalf of the registrant and in the capacities and on the dates indicated.
By /s/LAURA F. FERGERSON
Laura F. Fergerson
Chief Executive Officer - Finance and Administration
Date December 26, 2013
By /s/GASTON GARDEY
Gaston Gardey
Chief Financial Officer and Chief Accounting Officer
Date December 26, 2013