UNITED STATES
SECURITIES AND EXCHANGE COMMISSION
Washington, DC 20549
FORM N-CSR
CERTIFIED SHAREHOLDER REPORT OF REGISTERED MANAGEMENT INVESTMENT COMPANIES
Investment Company Act file number_811-06336
Franklin Templeton International Trust
(Exact name of registrant as specified in charter)
One Franklin Parkway, San Mateo, CA 94403-1906
(Address of principal executive offices) (Zip code)
Craig S. Tyle, One Franklin Parkway, San Mateo, CA 94403-1906
(Name and address of agent for service)
Registrant's telephone number, including area code: 650 312-2000
Date of fiscal year end: 10/31
Date of reporting period: 10/31/14
Item 1. Reports to Stockholders.

| |
| Contents | |
| |
| Shareholder Letter | 1 |
| Annual Report | |
| Templeton Foreign Smaller | |
| Companies Fund | 3 |
| Performance Summary | 7 |
| Your Fund’s Expenses | 12 |
| Financial Highlights and | |
| Statement of Investments | 14 |
| Financial Statements | 21 |
| Notes to Financial Statements | 24 |
| Report of Independent Registered | |
| Public Accounting Firm | 33 |
| Tax Information | 34 |
| Board Members and Officers | 35 |
| Shareholder Information | 40 |
| 1
Annual Report
Templeton Foreign Smaller Companies Fund
This annual report for Templeton Foreign Smaller Companies Fund covers the fiscal year ended October 31, 2014. At the market close on December 10, 2013, the Fund closed to new investors. Existing shareholders may add to their accounts. We believe this closure will help us effectively manage our current level of assets.
Your Fund’s Goal and Main Investments
The Fund seeks to provide long-term capital growth. Under normal market conditions, the Fund invests at least 80% of its net assets in investments of smaller companies located outside the U.S., including emerging markets.
Performance Overview
For the 12 months under review, the Fund’s Class A shares had a -7.94% cumulative total return. In comparison, the MSCI All Country World Index (ACWI) Ex USA Small Cap Index, which measures performance of international small capitalization stocks in developed and emerging markets, excluding the U.S., had a -0.61% total return.1 Please note index performance information is provided for reference and we do not attempt to track an index but rather undertake investments on the basis of fundamental research. You can find the Fund’s long-term performance data in the Performance Summary beginning on page 7.
Performance data represent past performance, which does not guarantee future results. Investment return and principal value will fluctuate, and you may have a gain or loss when you sell your shares. Current performance may differ from figures shown. Please visit franklintempleton.com or call (800) 342-5236 for most recent month-end performance.
Economic and Market Overview
The global economy grew moderately during the 12 months under review as many developed markets continued to recover and many emerging markets continued to grow. Major developed market central banks reaffirmed their accommodative monetary policies in an effort to support the ongoing recovery. Several emerging market central banks cut interest rates to boost economic growth, while several others raised rates to control inflation and currency depreciation.
U.S. economic growth trends were generally encouraging during the period. Economic activity expanded in the third quarter of 2014, resulting largely from increased federal defense spending and a narrower trade deficit. In January 2014, the U.S. Federal Reserve Board (Fed) began reducing its bond purchases $10 billion a month, based on largely positive economic and employment data in late 2013. After further gradual reductions during the year, the Fed ended its asset purchase program in October based on its view that underlying economic strength could support ongoing progress in labor market conditions. The Fed reaffirmed it would maintain its
1. Source: Morningstar.
The index is unmanaged and includes reinvested dividends. One cannot invest directly in an index, and an index is not representative of the Fund’s portfolio.
The dollar value, number of shares or principal amount, and names of all portfolio holdings are listed in the Fund’s Statement of Investments (SOI).
The SOI begins on page 18.
franklintempleton.com Annual Report | 3
TEMPLETON FOREIGN SMALLER COMPANIES FUND
near-zero interest rate policy for a “considerable time” and stated its actions to normalize monetary policy remained dependent on economic performance. Additionally, the Fed noted that although inflation might remain low in the near term, the likelihood of inflation running persistently below its 2% longer term goal had diminished somewhat since early 2014.
Outside the U.S., the U.K. economy grew relatively well, supported by the services and manufacturing sectors. U.K. gross domestic product (GDP) continued to expand at pre-crisis levels in the third quarter of 2014. Although out of recession, the eurozone experienced deflationary risks and lackluster employment trends. Economic growth remained subdued and weaker than expected as concerns arose about the potential negative impacts to growth from the crisis in Ukraine and tension in the Middle East. In June 2014, the European Central Bank (ECB) reduced its main interest rate and for the first time set a negative deposit rate; the ECB reduced both rates again in September. In Japan, second- and third-quarter GDP contractions indicated the economy was in a recession. However, the third-quarter GDP contraction was less severe than the second quarter’s, as private consumption and exports improved. In October, the Bank of Japan expanded its stimulus measures to revive the country’s economic growth amid weak domestic demand following a sales tax hike and as a substantial decline in crude oil prices exerted further downward pressure on inflation.
| | |
| Top 10 Sectors/Industries | | |
| 10/31/14 | | |
| | % of Total | |
| | Net Assets | |
| Household Durables | 6.5 | % |
| Textiles, Apparel & Luxury Goods | 5.6 | % |
| Auto Components | 5.4 | % |
| Pharmaceuticals | 5.0 | % |
| Energy Equipment & Services | 4.9 | % |
| Machinery | 4.7 | % |
| Life Sciences Tools & Services | 4.6 | % |
| Personal Products | 4.5 | % |
| Banks | 3.9 | % |
| Metals & Mining | 3.7 | % |
In several emerging markets, including China, economic growth moderated in the third quarter. Emerging market small cap equities rose modestly for the 12-month period, amid headwinds such as soft domestic demand, weak exports, the possibility that U.S. interest rates would rise sooner than expected and geopolitical tensions in certain regions. Many emerging market currencies depreciated against the U.S. dollar, leading central banks in several countries, including Brazil, Turkey, South Africa and Russia to raise interest rates in an effort to curb inflation and support their currencies. Several other central banks, including those of Chile, Mexico and South Korea, lowered interest rates to promote economic growth.
Small cap stocks in global developed markets advanced overall during the period amid a generally accommodative monetary policy environment, continued strength in corporate earnings and signs of an economic recovery. Outside the U.S., however, developed market small cap stocks generally posted losses, driven largely by poor performance in the eurozone and the Pacific region excluding Japan. Oil and gold prices remained volatile and ended lower for the 12-month period. The U.S. dollar appreciated against most currencies.
Investment Strategy
We employ a bottom-up, value-oriented, long-term approach to investing. We focus our analysis on the market price of a company’s securities relative to our evaluation of the company’s long-term earnings, asset value and cash flow potential. We also consider a company’s price/earnings ratio, profit margins and liquidation value. We are patient investors and may hold a security for several years as we wait for the market to recognize a company’s true worth.
Manager’s Discussion
Several holdings performed well and contributed to the Fund’s absolute performance during the 12 months under review. Daum Communications is South Korea’s number-two search engine and Internet portal. During the period, Daum’s shares advanced strongly after the company accepted a merger proposal from Kakao, which dominates South Korea’s mobile game market. Additionally, Kakao has more than 36 million monthly active users in its domestic mobile business and offers a mobile application used by more than 90% of South Korea’s smartphone users. Following the merger completion in early October, Daum Communications changed its name to Daum Kakao.
4 | Annual Report franklintempleton.com
TEMPLETON FOREIGN SMALLER COMPANIES FUND
| | |
| Top 10 Equity Holdings | | |
| 10/31/14 | | |
| Company | % of Total | |
| Sector/Industry, Country | Net Assets | |
| Techtronic Industries Co. Ltd. | 2.9 | % |
| Household Durables, Hong Kong | | |
| Minth Group Ltd. | 2.8 | % |
| Auto Components, China | | |
| Asics Corp. | 2.7 | % |
| Textiles, Apparel & Luxury Goods, Japan | | |
| HomeServe PLC | 2.6 | % |
| Commercial Services & Supplies, U.K. | | |
| Ezion Holdings Ltd. | 2.6 | % |
| Energy Equipment & Services, Singapore | | |
| Kobayashi Pharmaceutical Co. Ltd. | 2.6 | % |
| Personal Products, Japan | | |
| HudBay Minerals Inc. | 2.5 | % |
| Metals & Mining, Canada | | |
| BS Financial Group Inc. | 2.2 | % |
| Banks, South Korea | | |
| Samsonite International SA | 2.2 | % |
| Textiles, Apparel & Luxury Goods, Hong Kong | | |
| LIC Housing Finance Ltd. | 2.2 | % |
| Thrifts & Mortgage Finance, India | | |
The share price rose for U.K.-based HomeServe, which provides home emergency insurance covering heating, plumbing, drainage and electrical problems. We believe the company’s business model offers a sustainable, competitive advantage, operating in a duopoly in the U.K. HomeServe’s partners are exclusive, and scale also benefits the business, as it allows the company to serve its customers at a low cost. Furthermore, HomeServe is expanding internationally through major operations in Spain, France and the U.S., where penetration rates are significantly lower than in the U.K.
Shares of Japan-based Asics advanced during the period as the sporting goods company reported strong financial results. Substantial growth in e-commerce sales, including direct online sales and sales through Amazon.com, Zappos.com and other websites, boosted Asics’s U.S. business, which was the greatest contributor to overall earnings for fiscal year 2013–2014. Even with this success, we saw further, substantial potential for Asics to expand its sales channels and take full advantage of its untapped brand value. The global popularity of fitness and running, as well as a growing recognition of Asics products’ high performance should, in our view, also remain a growth driver for the company. Asics recently announced a 30 billion yen investment in improved research and development, back-end systems and expansion of its distribution facilities in the U.S. and Japan.
In contrast, the Fund had some underperformers during the 12-month period. Headquartered in London, African Minerals is a minerals exploration and development company.2 Shares of African Minerals fell in line with iron ore price expectations during the period as commodity price weakness negatively affected metals stocks.
During the period, Swedish cosmetics retailer Oriflame Cosmetics’ share price fell to a nearly nine-year low after the company missed earnings estimates and issued weak guidance.2 Heavy exposure to Russia and Ukraine, which together account for more than one-third of Oriflame’s sales, also intensified downward pressure on the stock.
Italian medical technology firm Sorin declined after higher research and development expenses attributable to currency exchange rate movements overshadowed solid results from the company’s core operations. Even after factoring in the impact of unfavorable currency rate trends on near-term margins, we still believed that Sorin represented good value over our long-term investment horizon. Priced at what we considered a discount to the broader medical technology sector on a number of valuation metrics and featuring attractive opportunities from newly approved and existing products, Sorin’s long-term earnings prospects and potential takeover value seemed significantly underappreciated to us.
It is important to recognize the effect of currency movements on the Fund’s performance. In general, if the value of the U.S. dollar goes up compared with a foreign currency, an investment traded in that foreign currency will go down in value because it will be worth fewer U.S. dollars. This can have a negative effect on Fund performance. Conversely, when the U.S. dollar weakens in relation to a foreign currency, an investment traded in that foreign currency will increase in value, which can contribute to Fund performance. For the 12 months ended October 31, 2014, the U.S. dollar increased in value relative to most currencies. As a result, the Fund’s performance was negatively affected by the portfolio’s investment predominantly in securities with non-U.S. currency exposure.
2. Sold by period-end.
See www.franklintempletondatasources.com for additional data provider information.
franklintempleton.com Annual Report | 5
TEMPLETON FOREIGN SMALLER COMPANIES FUND
Thank you for your continued participation in Templeton Foreign Smaller Companies Fund. We look forward to serving your future investment needs.

The foregoing information reflects our analysis, opinions and portfolio holdings as of October 31, 2014, the end of the reporting period. The way we implement our main investment strategies and the resulting portfolio holdings may change depending on factors such as market and economic conditions. These opinions may not be relied upon as investment advice or an offer for a particular security. The information is not a complete analysis of every aspect of any market, country, industry, security or the Fund. Statements of fact are from sources considered reliable, but the investment manager makes no representation or warranty as to their completeness or accuracy. Although historical performance is no guarantee of future results, these insights may help you understand our investment management philosophy.
CFA® is a trademark owned by CFA Institute.
6 | Annual Report franklintempleton.com
TEMPLETON FOREIGN SMALLER COMPANIES FUND
Performance Summary as of October 31, 2014
Your dividend income will vary depending on dividends or interest paid by securities in the Fund’s portfolio, adjusted for operating expenses of each class. Capital gain distributions are net profits realized from the sale of portfolio securities. The performance table and graphs do not reflect any taxes that a shareholder would pay on Fund dividends, capital gain distributions, if any, or any realized gains on the sale of Fund shares. Total return reflects reinvestment of the Fund’s dividends and capital gain distributions, if any, and any unrealized gains or losses.
| | | | | | |
| Net Asset Value1 | | | | | | |
| Share Class (Symbol) | | 10/31/14 | | 10/31/13 | | Change |
| A (FINEX) | $ | 16.33 | $ | 18.02 | -$ | 1.69 |
| C (FCFSX) | $ | 15.67 | $ | 17.31 | -$ | 1.64 |
| R6 (N/A) | $ | 16.37 | $ | 18.03 | -$ | 1.66 |
| Advisor (FTFAX) | $ | 16.33 | $ | 18.00 | -$ | 1.67 |
| | |
| Distributions (11/1/13–10/31/14) | | |
| | | Dividend |
| Share Class | | Income |
| A | $ | 0.2555 |
| C | $ | 0.1423 |
| R6 | $ | 0.3313 |
| Advisor | $ | 0.2954 |
franklintempleton.com Annual Report | 7
TEMPLETON FOREIGN SMALLER COMPANIES FUND
PERFORMANCE SUMMARY
Performance as of 10/31/14
Cumulative total return excludes sales charges. Average annual total returns and value of $10,000 investment include maximum
sales charges. Class A: 5.75% maximum initial sales charge; Class C: 1% contingent deferred sales charge in first year only;
Class R6/Advisor Class: no sales charges.
| | | | | | | | | | | | | |
| | | Cumulative | | | Average Annual | | | Value of | | Average Annual | | Total Annual | |
| Share Class | | Total Return2 | | | Total Return3 | | $ | 10,000 Investment4 | | Total Return (9/30/14)5 | | Operating Expenses6 | |
| A | | | | | | | | | | | | 1.65 | % |
| 1-Year | | -7.94 | %1 | | -13.24 | % | $ | 8,676 | | -8.34 | % | | |
| 5-Year | + | 35.11 | % | + | 4.96 | % | $ | 12,737 | + | 5.59 | % | | |
| 10-Year | + | 76.55 | % | + | 5.23 | % | $ | 16,642 | + | 5.83 | % | | |
| C | | | | | | | | | | | | 2.40 | % |
| 1-Year | | -8.65 | %1 | | -9.56 | % | $ | 9,044 | | -4.39 | % | | |
| 5-Year | + | 30.27 | % | + | 5.43 | % | $ | 13,027 | + | 6.07 | % | | |
| 10-Year | + | 63.89 | % | + | 5.06 | % | $ | 16,389 | + | 5.67 | % | | |
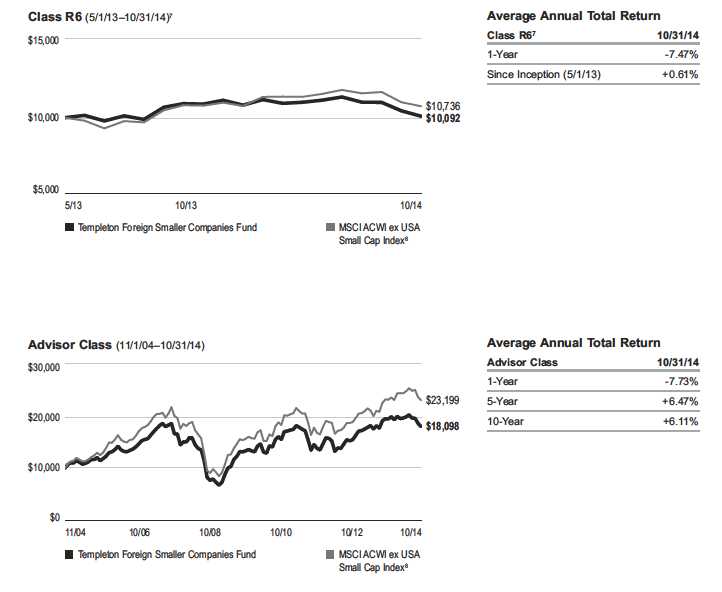
| R67 | | | | | | | | | | | | 1.13 | % |
| 1-Year | | -7.47 | %1 | | -7.47 | % | $ | 9,253 | | -2.14 | % | | |
| Since Inception (5/1/13) | + | 0.92 | % | + | 0.61 | % | $ | 10,092 | + | 3.11 | % | | |
| Advisor | | | | | | | | | | | | 1.40 | % |
| 1-Year | | -7.73 | %1 | | -7.73 | % | $ | 9,227 | | -2.51 | % | | |
| 5-Year | + | 36.81 | % | + | 6.47 | % | $ | 13,681 | + | 7.12 | % | | |
| 10-Year | + | 80.98 | % | + | 6.11 | % | $ | 18,098 | + | 6.73 | % | | |
Performance data represent past performance, which does not guarantee future results. Investment return and principal value will fluctuate, and you may have a gain or loss when you sell your shares. Current performance may differ from figures shown. For most recent month-end performance, go to franklintempleton.com or call (800) 342-5236.
8 | Annual Report franklintempleton.com
TEMPLETON FOREIGN SMALLER COMPANIES FUND
PERFORMANCE SUMMARY
Total Return Index Comparison for a Hypothetical $10,000 Investment
Total return represents the change in value of an investment over the periods shown. It includes any current, applicable, maximum sales charge, Fund expenses, account fees and reinvested distributions. The unmanaged index includes reinvestment of any income or distributions. It differs from the Fund in composition and does not pay management fees or expenses. One cannot invest directly in an index.

franklintempleton.com Annual Report | 9
TEMPLETON FOREIGN SMALLER COMPANIES FUND
PERFORMANCE SUMMARY
Total Return Index Comparison for a Hypothetical $10,000 Investment (continued)
10 | Annual Report franklintempleton.com
TEMPLETON FOREIGN SMALLER COMPANIES FUND
PERFORMANCE SUMMARY
All investments involve risks, including possible loss of principal. Special risks are associated with foreign investing, including currency fluctuations, economic instability and political developments. Investments in emerging markets involve heightened risks related to the same factors, in addition to those associated with these markets’ smaller size and lesser liquidity. Smaller, midsized and relatively new or unseasoned companies can be particularly sensitive to changing economic conditions, and their prospects for growth are less certain than those of larger, more established companies. Historically, these securities have exhibited greater price volatility than large company stocks, particularly over the short term. The Fund is actively managed but there is no guarantee that the manager’s investment decisions will produce the desired results. The Fund’s prospectus also includes a description of the main investment risks.
| |
| Class C: | These shares have higher annual fees and expenses than Class A shares. |
| Class R6: | Shares are available to certain eligible investors as described in the prospectus. |
| Advisor Class: | Shares are available to certain eligible investors as described in the prospectus. |
1. Price and total return information is based on net asset values calculated for shareholder transactions. Certain adjustments were made to the net assets of the Fund at
10/31/14 for financial reporting purposes, and as a result, the net asset values for shareholder transactions and the total returns based on those net asset values differ from
the adjusted net asset values and total returns reported in the Financial Highlights.
2. Cumulative total return represents the change in value of an investment over the periods indicated.
3. Average annual total return represents the average annual change in value of an investment over the periods indicated.
4. These figures represent the value of a hypothetical $10,000 investment in the Fund over the periods indicated.
5. In accordance with SEC rules, we provide standardized average annual total return information through the latest calendar quarter.
6. Figures are as stated in the Fund’s current prospectus. In periods of market volatility, assets may decline significantly, causing total annual Fund operating expenses
to become higher than the figures shown.
7. Class R6 shares have an expense reduction contractually guaranteed through at least 2/28/15. Investment results for this share class reflect the expense reduction,
to the extent applicable; without this reduction, the results would have been lower.
8. Source: Morningstar. The MSCI ACWI ex USA Small Cap Index is a free float-adjusted, market capitalization-weighted index designed to measure the performance
of small cap equity securities of global developed and emerging markets, excluding the U.S.
See www.franklintempletondatasources.com for additional data provider information.
franklintempleton.com Annual Report | 11
TEMPLETON FOREIGN SMALLER COMPANIES FUND
Your Fund’s Expenses
As a Fund shareholder, you can incur two types of costs:
- Transaction costs, including sales charges (loads) on Fund purchases; and
- Ongoing Fund costs, including management fees, distribu- tion and service (12b-1) fees, and other Fund expenses. All mutual funds have ongoing costs, sometimes referred to as operating expenses.
The following table shows ongoing costs of investing in the Fund and can help you understand these costs and compare them with those of other mutual funds. The table assumes a $1,000 investment held for the six months indicated.
Actual Fund Expenses
The first line (Actual) for each share class listed in the table provides actual account values and expenses. The “Ending Account Value” is derived from the Fund’s actual return, which includes the effect of Fund expenses.
You can estimate the expenses you paid during the period by following these steps. Of course, your account value and expenses will differ from those in this illustration:
| 1 | Divide your account value by $1,000. |
| | If an account had an $8,600 value, then $8,600 ÷ $1,000 = 8.6. |
| 2. | Multiply the result by the number under the heading “Expenses Paid During Period.” |
| | If Expenses Paid During Period were $7.50, then 8.6 x $7.50 = $64.50. |
In this illustration, the estimated expenses paid this period are $64.50.
Hypothetical Example for Comparison with Other Funds
Information in the second line (Hypothetical) for each class in the table can help you compare ongoing costs of investing in the Fund with those of other mutual funds. This information may not be used to estimate the actual ending account balance or expenses you paid during the period. The hypothetical “Ending Account Value” is based on the actual expense ratio for each class and an assumed 5% annual rate of return before expenses, which does not represent the Fund’s actual return. The figure under the heading “Expenses Paid During Period” shows the hypothetical expenses your account would have incurred under this scenario. You can compare this figure with the 5% hypothetical examples that appear in shareholder reports of other funds.
Please note that expenses shown in the table are meant to highlight ongoing costs and do not reflect any transaction costs, such as sales charges. Therefore, the second line for each class is useful in comparing ongoing costs only, and will not help you compare total costs of owning different funds. In addition, if transaction costs were included, your total costs would have been higher. Please refer to the Fund prospectus for additional information on operating expenses.
12 | Annual Report
franklintempleton.com
TEMPLETON FOREIGN SMALLER COMPANIES FUND
YOUR FUND’S EXPENSES
| | | | | | |
| | | Beginning Account | | Ending Account | | Expenses Paid During |
| Share Class | | Value 5/1/14 | | Value 10/31/14 | | Period* 5/1/14–10/31/14 |
| A | | | | | | |
| Actual | $ | 1,000 | $ | 915.90 | $ | 8.16 |
| Hypothetical (5% return before expenses) | $ | 1,000 | $ | 1,016.69 | $ | 8.59 |
| C | | | | | | |
| Actual | $ | 1,000 | $ | 912.70 | $ | 11.76 |
| Hypothetical (5% return before expenses) | $ | 1,000 | $ | 1,012.91 | $ | 12.38 |
| R6 | | | | | | |
| Actual | $ | 1,000 | $ | 918.10 | $ | 5.27 |
| Hypothetical (5% return before expenses) | $ | 1,000 | $ | 1,019.71 | $ | 5.55 |
| Advisor | | | | | | |
| Actual | $ | 1,000 | $ | 916.90 | $ | 6.96 |
| Hypothetical (5% return before expenses) | $ | 1,000 | $ | 1,017.95 | $ | 7.32 |
*Expenses are calculated using the most recent six-month expense ratio, annualized for each class (A: 1.69%; C: 2.44%; R6: 1.09% (net of
expense waivers); and Advisor: 1.44%), multiplied by the average account value over the period, multiplied by 184/365 to reflect the one-half
year period.
franklintempleton.com Annual Report | 13
| | | | | | | | | | | | | | | |
| FRANKLIN TEMPLETON INTERNATIONAL TRUST | | | | | | | | | | | | | | | |
| |
| |
| Financial Highlights | | | | | | | | | | | | | | | |
| Templeton Foreign Smaller Companies Fund | | | | | | | | | | | | | | | |
| | | | | | Year Ended October 31, | | | | |
| | | 2014 | | | 2013 | | | 2012 | | | 2011 | | | 2010 | |
| Class A | | | | | | | | | | | | | | | |
| Per share operating performance | | | | | | | | | | | | | | | |
| (for a share outstanding throughout the year) | | | | | | | | | | | | | | | |
| Net asset value, beginning of year | $ | 18.02 | | $ | 14.39 | | $ | 13.92 | | $ | 15.47 | | $ | 12.82 | |
| Income from investment operationsa: | | | | | | | | | | | | | | | |
| Net investment incomeb | | 0.05 | c | | 0.13 | | | 0.24 | | | 0.12 | | | 0.08 | |
| Net realized and unrealized gains (losses) | | (1.50 | ) | | 3.77 | | | 0.38 | | | (1.60 | ) | | 2.68 | |
| Total from investment operations | | (1.45 | ) | | 3.90 | | | 0.62 | | | (1.48 | ) | | 2.76 | |
| Less distributions from net investment income | | (0.26 | ) | | (0.27 | ) | | (0.15 | ) | | (0.07 | ) | | (0.11 | ) |
| Net asset value, end of year | $ | 16.31 | | $ | 18.02 | | $ | 14.39 | | $ | 13.92 | | $ | 15.47 | |
| |
| Total returnd | | (8.11 | )% | | 27.43 | % | | 4.67 | % | | (9.60 | )% | | 21.71 | % |
| |
| Ratios to average net assets | | | | | | | | | | | | | | | |
| Expenses | | 1.67 | % | | 1.65 | %e | | 1.65 | % | | 1.55 | %e | | 1.59 | %e |
| Net investment income | | 0.30 | %c | | 0.83 | % | | 1.72 | % | | 0.80 | % | | 0.56 | % |
| |
| Supplemental data | | | | | | | | | | | | | | | |
| Net assets, end of year (000’s) | $ | 94,088 | | $ | 131,844 | | $ | 103,168 | | $ | 121,119 | | $ | 163,993 | |
| Portfolio turnover rate | | 38.68 | % | | 42.94 | % | | 57.56 | % | | 50.03 | % | | 19.65 | % |
aThe amount shown for a share outstanding throughout the period may not correlate with the Statement of Operations for the period due to the timing of sales and
repurchases of the Fund shares in relation to income earned and/or fluctuating fair value of the investments of the Fund.
bBased on average daily shares outstanding.
cNet investment income per share includes approximately $0.05 per share received in the form of special dividends paid in connection with certain Fund’s holdings.
Excluding these non-recurring amounts, the ratio of net investment income (loss) to average net assets would have been (0.01)%.
dTotal return does not reflect sales commissions or contingent deferred sales charges, if applicable.
eBenefit of expense reduction rounds to less than 0.01%.
14 | Annual Report | The accompanying notes are an integral part of these financial statements. franklintempleton.com
| | | | | | | | | | | | | | | |
| | | FRANKLIN TEMPLETON INTERNATIONAL TRUST | |
| | | | | | | | | FINANCIAL HIGHLIGHTS | |
| |
| |
| |
| Templeton Foreign Smaller Companies Fund (continued) | | | | | | | | | | | | | | | |
| | | | | | Year Ended October 31, | | | | |
| | | 2014 | | | 2013 | | | 2012 | | | 2011 | | | 2010 | |
| Class C | | | | | | | | | | | | | | | |
| Per share operating performance | | | | | | | | | | | | | | | |
| (for a share outstanding throughout the year) | | | | | | | | | | | | | | | |
| Net asset value, beginning of year | $ | 17.31 | | $ | 13.83 | | $ | 13.36 | | $ | 14.89 | | $ | 12.39 | |
| Income from investment operationsa: | | | | | | | | | | | | | | | |
| Net investment income (loss)b | | (0.08 | )c | | 0.01 | | | 0.13 | | | 0.01 | | | (0.02 | ) |
| Net realized and unrealized gains (losses) | | (1.44 | ) | | 3.63 | | | 0.38 | | | (1.54 | ) | | 2.60 | |
| Total from investment operations | | (1.52 | ) | | 3.64 | | | 0.51 | | | (1.53 | ) | | 2.58 | |
| Less distributions from net investment income | | (0.14 | ) | | (0.16 | ) | | (0.04 | ) | | — | | | (0.08 | ) |
| Net asset value, end of year | $ | 15.65 | | $ | 17.31 | | $ | 13.83 | | $ | 13.36 | | $ | 14.89 | |
| |
| Total returnd | | (8.82 | )% | | 26.58 | % | | 3.85 | % | | (10.28 | )% | | 20.90 | % |
| |
| Ratios to average net assets | | | | | | | | | | | | | | | |
| Expenses | | 2.42 | % | | 2.40 | %e | | 2.40 | % | | 2.30 | %e | | 2.34 | %e |
| Net investment income (loss) | | (0.45 | )%c | | 0.08 | % | | 0.97 | % | | 0.05 | % | | (0.19 | )% |
| |
| Supplemental data | | | | | | | | | | | | | | | |
| Net assets, end of year (000’s) | $ | 13,040 | | $ | 16,027 | | $ | 12,814 | | $ | 14,457 | | $ | 17,202 | |
| Portfolio turnover rate | | 38.68 | % | | 42.94 | % | | 57.56 | % | | 50.03 | % | | 19.65 | % |
aThe amount shown for a share outstanding throughout the period may not correlate with the Statement of Operations for the period due to the timing of sales and
repurchases of the Fund shares in relation to income earned and/or fluctuating fair value of the investments of the Fund.
bBased on average daily shares outstanding.
cNet investment income per share includes approximately $0.05 per share received in the form of special dividends paid in connection with certain Fund’s holdings.
Excluding these non-recurring amounts, the ratio of net investment income (loss) to average net assets would have been (0.76)%.
dTotal return does not reflect sales commissions or contingent deferred sales charges, if applicable.
eBenefit of expense reduction rounds to less than 0.01%.
franklintempleton.com The accompanying notes are an integral part of these financial statements. | Annual Report | 15
| | | | | | |
| FRANKLIN TEMPLETON INTERNATIONAL TRUST | | | | | | |
| FINANCIAL HIGHLIGHTS | | | | | | |
| |
| |
| |
| Templeton Foreign Smaller Companies Fund (continued) | | | | | | |
| | | Year Ended | |
| | | October 31, | |
| | | 2014 | | | 2013 | a |
| Class R6 | | | | | | |
| Per share operating performance | | | | | | |
| (for a share outstanding throughout the year) | | | | | | |
| Net asset value, beginning of year | $ | 18.03 | | $ | 16.53 | |
| Income from investment operationsb: | | | | | | |
| Net investment incomec | | 0.15 | d | | 0.16 | |
| Net realized and unrealized gains (losses) | | (1.51 | ) | | 1.34 | |
| Total from investment operations | | (1.36 | ) | | 1.50 | |
| Less distributions from net investment income | | (0.33 | ) | | — | |
| Net asset value, end of year | $ | 16.34 | | $ | 18.03 | |
| |
| Total returne | | (7.64 | )% | | 9.07 | % |
| |
| Ratios to average net assetsf | | | | | | |
| Expenses before waiver and payments by affiliates | | 1.11 | % | | 2.55 | % |
| Expenses net of waiver and payments by affiliates | | 1.10 | % | | 1.12 | %g |
| Net investment income | | 0.87 | %d | | 1.36 | % |
| |
| Supplemental data | | | | | | |
| Net assets, end of year (000’s) | $ | 835 | | $ | 5 | |
| Portfolio turnover rate | | 38.68 | % | | 42.94 | % |
aFor the period May 1, 2013 (effective date) to October 31, 2013.
bThe amount shown for a share outstanding throughout the period may not correlate with the Statement of Operations for the period due to the timing of sales and
repurchases of the Fund shares in relation to income earned and/or fluctuating fair value of the investments of the Fund.
cBased on average daily shares outstanding.
dNet investment income per share includes approximately $0.05 per share received in the form of special dividends paid in connection with certain Fund’s holdings.
Excluding these non-recurring amounts, the ratio of net investment income to average net assets would have been 0.56%.
eTotal return is not annualized for periods less than one year.
fRatios are annualized for periods less than one year.
gBenefit of expense reduction rounds to less than 0.01%.
16 | Annual Report | The accompanying notes are an integral part of these financial statements. franklintempleton.com
| | | | | | | | | | | | | | | |
| | | FRANKLIN TEMPLETON INTERNATIONAL TRUST | |
| | | | | | | | | FINANCIAL HIGHLIGHTS | |
| |
| |
| |
| Templeton Foreign Smaller Companies Fund (continued) | | | | | | | | | | | | | | | |
| | | | | | Year Ended October 31, | | | | |
| | | 2014 | | | 2013 | | | 2012 | | | 2011 | | | 2010 | |
| Advisor Class | | | | | | | | | | | | | | | |
| Per share operating performance | | | | | | | | | | | | | | | |
| (for a share outstanding throughout the year) | | | | | | | | | | | | | | | |
| Net asset value, beginning of year | $ | 18.00 | | $ | 14.38 | | $ | 13.93 | | $ | 15.48 | | $ | 12.81 | |
| Income from investment operationsa: | | | | | | | | | | | | | | | |
| Net investment incomeb | | 0.10 | c | | 0.18 | | | 0.26 | | | 0.17 | | | 0.11 | |
| Net realized and unrealized gains (losses) | | (1.50 | ) | | 3.75 | | | 0.39 | | | (1.61 | ) | | 2.69 | |
| Total from investment operations | | (1.40 | ) | | 3.93 | | | 0.65 | | | (1.44 | ) | | 2.80 | |
| Less distributions from net investment income | | (0.30 | ) | | (0.31 | ) | | (0.20 | ) | | (0.11 | ) | | (0.13 | ) |
| Net asset value, end of year | $ | 16.30 | | $ | 18.00 | | $ | 14.38 | | $ | 13.93 | | $ | 15.48 | |
| |
| Total return | | (7.90 | )% | | 27.79 | % | | 4.90 | % | | (9.38 | )% | | 22.06 | % |
| |
| Ratios to average net assets | | | | | | | | | | | | | | | |
| Expenses | | 1.42 | % | | 1.40 | %d | | 1.40 | % | | 1.30 | %d | | 1.34 | %d |
| Net investment income | | 0.55 | %c | | 1.08 | % | | 1.97 | % | | 1.05 | % | | 0.81 | % |
| |
| Supplemental data | | | | | | | | | | | | | | | |
| Net assets, end of year (000’s) | $ | 40,153 | | $ | 40,832 | | $ | 31,817 | | $ | 36,902 | | $ | 33,172 | |
| Portfolio turnover rate | | 38.68 | % | | 42.94 | % | | 57.56 | % | | 50.03 | % | | 19.65 | % |
aThe amount shown for a share outstanding throughout the period may not correlate with the Statement of Operations for the period due to the timing of sales and
repurchases of the Fund shares in relation to income earned and/or fluctuating fair value of the investments of the Fund.
bBased on average daily shares outstanding.
cNet investment income per share includes approximately $0.05 per share received in the form of special dividends paid in connection with certain Fund’s holdings.
Excluding these non-recurring amounts, the ratio of net investment income to average net assets would have been 0.24%.
dBenefit of expense reduction rounds to less than 0.01%.
franklintempleton.com The accompanying notes are an integral part of these financial statements. | Annual Report | 17
FRANKLIN TEMPLETON INTERNATIONAL TRUST
| | | | |
| Statement of Investments, October 31, 2014 | | | | |
| |
| Templeton Foreign Smaller Companies Fund | | | | |
| | Industry | Shares | | Value |
| Closed End Funds (Cost $1,959,884) 1.4% | | | | |
| Thailand 1.4% | | | | |
| True Telecommunication Growth Infrastructure Fund | Diversified Financial Services | 6,179,200 | $ | 2,122,264 |
| Common Stocks 95.1% | | | | |
| Bahamas 1.5% | | | | |
| aSteiner Leisure Ltd. | Diversified Consumer Services | 53,203 | | 2,244,102 |
| Belgium 1.5% | | | | |
| aOntex Group NV | Personal Products | 47,610 | | 1,181,647 |
| a,bOntex Group NV, 144A | Personal Products | 40,280 | | 999,721 |
| | | | | 2,181,368 |
| Brazil 1.7% | | | | |
| Companhia de Saneamento de Minas Gerais | Water Utilities | 124,000 | | 1,412,025 |
| Grendene SA | Textiles, Apparel & Luxury Goods | 145,700 | | 1,028,284 |
| | | | | 2,440,309 |
| Canada 4.6% | | | | |
| AGF Management Ltd. | Capital Markets | 93,700 | | 851,516 |
| Enerflex Ltd. | Energy Equipment & Services | 67,100 | | 958,742 |
| Ensign Energy Services Inc. | Energy Equipment & Services | 120,800 | | 1,363,663 |
| HudBay Minerals Inc. | Metals & Mining | 484,230 | | 3,708,648 |
| | | | | 6,882,569 |
| China 7.9% | | | | |
| China Medical System Holdings Ltd. | Pharmaceuticals | 877,000 | | 1,617,101 |
| China ZhengTong Auto Services Holdings Ltd. | Specialty Retail | 2,049,000 | | 1,159,866 |
| Haier Electronics Group Co. Ltd. | Household Durables | 855,000 | | 2,293,141 |
| Hilong Holding Ltd. | Energy Equipment & Services | 344,000 | | 111,779 |
| aKingdee International Software Group Co. Ltd., fgn. | Software | 2,556,000 | | 837,136 |
| Minth Group Ltd. | Auto Components | 2,190,000 | | 4,207,574 |
| Yingde Gases Group Co. Ltd. | Chemicals | 1,805,500 | | 1,413,148 |
| | | | | 11,639,745 |
| Finland 2.1% | | | | |
| Amer Sports OYJ | Leisure Products | 159,140 | | 3,046,090 |
| Germany 8.4% | | | | |
| DMG MORI SEIKI AG | Machinery | 79,290 | | 2,024,078 |
| Gerresheimer AG | Life Sciences Tools & Services | 48,180 | | 2,678,155 |
| aGrand City Properties SA | Real Estate Management & Development | 92,770 | | 1,189,037 |
| Leoni AG | Auto Components | 32,830 | | 1,878,607 |
| aMorphoSys AG | Life Sciences Tools & Services | 27,240 | | 2,585,826 |
| Rational AG | Machinery | 6,880 | | 2,153,433 |
| | | | | 12,509,136 |
| Hong Kong 10.8% | | | | |
| Luk Fook Holdings (International) Ltd. | Specialty Retail | 1,069,000 | | 3,184,132 |
| MIE Holdings Corp. | Oil, Gas & Consumable Fuels | 1,665,100 | | 229,734 |
| NewOcean Energy Holdings Ltd. | Oil, Gas & Consumable Fuels | 5,882,000 | | 2,768,339 |
| Samsonite International SA | Textiles, Apparel & Luxury Goods | 978,000 | | 3,247,263 |
| Techtronic Industries Co. Ltd. | Household Durables | 1,392,590 | | 4,363,460 |
| Value Partners Group Ltd. | Capital Markets | 2,979,700 | | 2,243,814 |
| | | | | 16,036,742 |
18 | Annual Report franklintempleton.com
FRANKLIN TEMPLETON INTERNATIONAL TRUST
STATEMENT OF INVESTMENTS
| | | | |
| Templeton Foreign Smaller Companies Fund (continued) | | | |
| | Industry | Shares | | Value |
| Common Stocks (continued) | | | | |
| India 2.2% | | | | |
| LIC Housing Finance Ltd. | Thrifts & Mortgage Finance | 544,014 | $ | 3,204,017 |
| Indonesia 1.2% | | | | |
| a,cSakari Resources Ltd. | Metals & Mining | 1,342,000 | | 1,702,998 |
| Italy 4.1% | | | | |
| Amplifon SpA | Health Care Providers & Services | 277,731 | | 1,627,883 |
| Marr SpA | Food & Staples Retailing | 95,710 | | 1,524,850 |
| aSorin SpA | Health Care Equipment & Supplies | 1,299,393 | | 2,905,760 |
| | | | | 6,058,493 |
| Japan 11.3% | | | | |
| Aderans Co. Ltd. | Personal Products | 60,100 | | 716,045 |
| Asics Corp. | Textiles, Apparel & Luxury Goods | 170,800 | | 4,002,996 |
| Capcom Co. Ltd. | Software | 80,000 | | 1,244,035 |
| Iida Group Holdings Co. Ltd. | Household Durables | 272,866 | | 3,034,698 |
| Keihin Corp. | Auto Components | 111,500 | | 1,409,885 |
| Kobayashi Pharmaceutical Co. Ltd. | Personal Products | 61,279 | | 3,785,748 |
| Tsumura & Co. | Pharmaceuticals | 90,600 | | 2,028,965 |
| Unipres Corp. | Auto Components | 26,600 | | 529,784 |
| | | | | 16,752,156 |
| Netherlands 3.6% | | | | |
| Aalberts Industries NV | Machinery | 83,407 | | 2,221,179 |
| Arcadis NV | Construction & Engineering | 102,968 | | 3,165,451 |
| | | | | 5,386,630 |
| Norway 0.7% | | | | |
| Fred. Olsen Energy ASA | Energy Equipment & Services | 99,410 | | 1,060,658 |
| Philippines 3.2% | | | | |
| Energy Development Corp. | Independent Power & Renewable | | | |
| | Electricity Producers | 13,021,400 | | 2,229,841 |
| Vista Land & Lifescapes Inc. | Real Estate Management & Development | 18,543,400 | | 2,536,237 |
| | | | | 4,766,078 |
| Portugal 1.7% | | | | |
| CTT-Correios de Portugal SA | Air Freight & Logistics | 32,650 | | 302,449 |
| bCTT-Correios de Portugal SA, 144A | Air Freight & Logistics | 234,949 | | 2,176,418 |
| | | | | 2,478,867 |
| Russia 1.1% | | | | |
| a,dX5 Retail Group NV, GDR, Reg S | Food & Staples Retailing | 91,180 | | 1,664,035 |
| Singapore 2.6% | | | | |
| Ezion Holdings Ltd. | Energy Equipment & Services | 3,249,360 | | 3,819,206 |
| South Korea 3.2% | | | | |
| BS Financial Group Inc. | Banks | 213,589 | | 3,311,226 |
| Daum Kakao Corp. | Internet Software & Services | 10,689 | | 1,453,067 |
| | | | | 4,764,293 |
| Sweden 0.7% | | | | |
| a,cD Carnegie & Co. AB | Real Estate Management & Development | 228 | | — |
| aOrexo AB | Pharmaceuticals | 61,182 | | 1,077,323 |
| | | | | 1,077,323 |
franklintempleton.com Annual Report | 19
FRANKLIN TEMPLETON INTERNATIONAL TRUST
STATEMENT OF INVESTMENTS
| | | | | |
| Templeton Foreign Smaller Companies Fund (continued) | | | | | |
| | | Industry | Shares | | Value |
| Common Stocks (continued) | | | | | |
| Switzerland 2.3% | | | | | |
| aBasilea Pharmaceutica AG | | Biotechnology | 20,850 | $ | 1,894,371 |
| Tecan Group AG | | Life Sciences Tools & Services | 14,240 | | 1,501,051 |
| | | | | | 3,395,422 |
| Taiwan 1.5% | | | | | |
| Tripod Technology Corp. | | Electronic Equipment, Instruments | | | |
| | | & Components | 1,225,000 | | 2,284,007 |
| Thailand 1.3% | | | | | |
| Tisco Financial Group PCL, fgn. | | Banks | 1,374,500 | | 1,875,659 |
| Turkey 1.6% | | | | | |
| Aygaz AS | | Gas Utilities | 450,975 | | 1,901,127 |
| Turk Traktor ve Ziraat Makineleri AS | | Machinery | 16,857 | | 531,640 |
| | | | | | 2,432,767 |
| United Kingdom 14.3% | | | | | |
| APR Energy PLC | | Independent Power & Renewable | | | |
| | | Electricity Producers | 456,670 | | 2,650,264 |
| aChemring Group PLC | | Aerospace & Defense | 128,140 | | 499,699 |
| Debenhams PLC | | Multiline Retail | 801,380 | | 832,075 |
| Devro PLC | | Food Products | 210,840 | | 920,863 |
| Dignity PLC | | Diversified Consumer Services | 97,981 | | 2,461,052 |
| HomeServe PLC | | Commercial Services & Supplies | 697,120 | | 3,847,742 |
| Just Retirement Group PLC | | Insurance | 172,260 | | 366,535 |
| bJust Retirement Group PLC, 144A | | Insurance | 939,600 | | 1,999,281 |
| Laird PLC | | Electronic Equipment, Instruments | | | |
| | | & Components | 451,041 | | 2,273,033 |
| SIG PLC | | Trading Companies & Distributors | 414,750 | | 971,419 |
| aTSB Banking Group PLC | | Banks | 119,640 | | 517,179 |
| UBM PLC | | Media | 114,990 | | 1,046,771 |
| aVectura Group PLC | | Pharmaceuticals | 1,434,850 | | 2,720,221 |
| | | | | | 21,106,134 |
| Total Common Stocks | | | | | |
| (Cost $132,783,894) | | | | | 140,808,804 |
| Preferred Stocks (Cost $1,809,209) 0.9% | | | | | |
| Germany 0.9% | | | | | |
| Draegerwerk AG & Co. KGAA, pfd. | | Health Care Equipment & Supplies | 13,700 | | 1,333,480 |
| Total Investments (Cost $136,552,987) | | | | | |
| 97.4% | | | | | 144,264,548 |
| Other Assets, less Liabilities 2.6% | | | | | 3,852,266 |
| Net Assets 100.0% | | | | $ | 148,116,814 |
See Abbreviations on page 32.
aNon-income producing.
bSecurity was purchased pursuant to Rule 144A under the Securities Act of 1933 and may be sold in transactions exempt from registration only to qualified institutional buyers
or in a public offering registered under the Securities Act of 1933. These securities have been deemed liquid under guidelines approved by the Trust’s Board of Trustees. At
October 31, 2014, the aggregate value of these securities was $5,175,420, representing 3.49% of net assets.
cSecurity has been deemed illiquid because it may not be able to be sold within seven days. At October 31, 2014, the aggregate value of these securities was $1,702,998,
representing 1.15% of net assets.
dSecurity was purchased pursuant to Regulation S under the Securities Act of 1933, which exempts from registration securities offered and sold outside of the United States.
Such a security cannot be sold in the United States without either an effective registration statement filed pursuant to the Securities Act of 1933, or pursuant to an exemption
from registration. This security has been deemed liquid under guidelines approved by the Trust’s Board of Trustees.
20 | Annual Report | The accompanying notes are an integral part of these financial statements. franklintempleton.com
FRANKLIN TEMPLETON INTERNATIONAL TRUST
Financial Statements
Statement of Assets and Liabilities
October 31, 2014
| | | |
| Templeton Foreign Smaller Companies Fund | | | |
| |
| Assets: | | | |
| Investments in securities: | | | |
| Cost | $ | 136,552,987 | |
| Value | $ | 144,264,548 | |
| Cash | | 3,599,274 | |
| Receivables: | | | |
| Investment securities sold | | 828,259 | |
| Capital shares sold | | 48,679 | |
| Dividends | | 252,984 | |
| Other assets | | 38 | |
| Total assets | | 148,993,782 | |
| Liabilities: | | | |
| Payables: | | | |
| Investment securities purchased | | 222,480 | |
| Capital shares redeemed | | 171,369 | |
| Management fees | | 122,526 | |
| Distribution fees | | 30,878 | |
| Transfer agent fees | | 90,605 | |
| Deferred tax | | 210,847 | |
| Accrued expenses and other liabilities | | 28,263 | |
| Total liabilities | | 876,968 | |
| Net assets, at value | $ | 148,116,814 | |
| Net assets consist of: | | | |
| Paid-in capital | $ | 154,711,664 | |
| Undistributed net investment income | | 378,893 | |
| Net unrealized appreciation (depreciation) | | 7,489,166 | |
| Accumulated net realized gain (loss) | | (14,462,909 | ) |
| Net assets, at value | $ | 148,116,814 | |
| Class A: | | | |
| Net assets, at value | $ | 94,087,967 | |
| Shares outstanding | | 5,769,846 | |
| Net asset value per sharea | $ | 16.31 | |
| Maximum offering price per share (net asset value per share ÷ 94.25%) | $ | 17.31 | |
| Class C: | | | |
| Net assets, at value | $ | 13,040,304 | |
| Shares outstanding | | 833,423 | |
| Net asset value and maximum offering price per sharea | $ | 15.65 | |
| Class R6: | | | |
| Net assets, at value | $ | 835,157 | |
| Shares outstanding | | 51,102 | |
| Net asset value and maximum offering price per share | $ | 16.34 | |
| Advisor Class: | | | |
| Net assets, at value | $ | 40,153,386 | |
| Shares outstanding | | 2,463,392 | |
| Net asset value and maximum offering price per share | $ | 16.30 | |
aRedemption price is equal to net asset value less contingent deferred sales charges, if applicable.
franklintempleton.com The accompanying notes are an integral part of these financial statements. | Annual Report | 21
FRANKLIN TEMPLETON INTERNATIONAL TRUST
FINANCIAL STATEMENTS
Statement of Operations
for the year ended October 31, 2014
| | | |
| Templeton Foreign Smaller Companies Fund | | | |
| |
| Investment income: | | | |
| Dividends (net of foreign taxes of $314,206) | $ | 3,466,550 | |
| Interest | | 162 | |
| Income from securities loaned | | 54,020 | |
| Total investment income | | 3,520,732 | |
| Expenses: | | | |
| Management fees (Note 3a) | | 1,709,329 | |
| Distribution fees: (Note 3c) | | | |
| Class A | | 292,314 | |
| Class C | | 154,192 | |
| Transfer agent fees: (Note 3e) | | | |
| Class A | | 394,628 | |
| Class C | | 51,418 | |
| Class R6 | | 141 | |
| Advisor Class | | 145,820 | |
| Custodian fees (Note 4) | | 33,610 | |
| Reports to shareholders | | 46,831 | |
| Registration and filing fees | | 63,701 | |
| Professional fees | | 61,040 | |
| Trustees’ fees and expenses | | 9,434 | |
| Other | | 21,635 | |
| Total expenses | | 2,984,093 | |
| Expenses waived/paid by affiliates (Note 3f) | | (64 | ) |
| Net expenses | | 2,984,029 | |
| Net investment income | | 536,703 | |
| Realized and unrealized gains (losses): | | | |
| Net realized gain (loss) from: | | | |
| Investments (net of foreign taxes of $160,191) | | 5,276,343 | |
| Foreign currency transactions | | (10,856 | ) |
| Net realized gain (loss) | | 5,265,487 | |
| Net change in unrealized appreciation (depreciation) on: | | | |
| Investments | | (18,867,379 | ) |
| Translation of other assets and liabilities denominated in foreign currencies | | (28,583 | ) |
| Change in deferred taxes on unrealized appreciation | | (210,847 | ) |
| Net change in unrealized appreciation (depreciation) | | (19,106,809 | ) |
| Net realized and unrealized gain (loss) | | (13,841,322 | ) |
| Net increase (decrease) in net assets resulting from operations | $ | (13,304,619 | ) |
22 | Annual Report | The accompanying notes are an integral part of these financial statements.
franklintempleton.com
FRANKLIN TEMPLETON INTERNATIONAL TRUST
FINANCIAL STATEMENTS
Statements of Changes in Net Assets
| | | | | | |
| Templeton Foreign Smaller Companies Fund | | | | | | |
| |
| | | Year Ended October 31, | |
| | | 2014 | | | 2013 | |
| Increase (decrease) in net assets: | | | | | | |
| Operations: | | | | | | |
| Net investment income | $ | 536,703 | | $ | 1,359,853 | |
| Net realized gain (loss) from investments and foreign currency transactions | | 5,265,487 | | | 18,518,622 | |
| Net change in unrealized appreciation (depreciation) on investments, translation of other assets and | | | | | | |
| liabilities denominated in foreign currencies and deferred taxes | | (19,106,809 | ) | | 19,686,429 | |
| Net increase (decrease) in net assets resulting from operations | | (13,304,619 | ) | | 39,564,904 | |
| Distributions to shareholders from: | | | | | | |
| Net investment income: | | | | | | |
| Class A | | (1,901,066 | ) | | (1,894,784 | ) |
| Class C | | (135,379 | ) | | (146,239 | ) |
| Class R6 | | (100 | ) | | — | |
| Advisor Class | | (669,813 | ) | | (640,629 | ) |
| Total distributions to shareholders | | (2,706,358 | ) | | (2,681,652 | ) |
| Capital share transactions: (Note 2) | | | | | | |
| Class A | | (27,559,717 | ) | | 2,778,802 | |
| Class B | | — | | | (219,644 | ) |
| Class C | | (1,562,503 | ) | | 53,502 | |
| Class R6 | | 909,831 | | | 5,000 | |
| Advisor Class | | 3,631,272 | | | 1,208,773 | |
| Total capital share transactions | | (24,581,117 | ) | | 3,826,433 | |
| Net increase (decrease) in net assets | | (40,592,094 | ) | | 40,709,685 | |
| Net assets: | | | | | | |
| Beginning of year | | 188,708,908 | | | 147,999,223 | |
| End of year | $ | 148,116,814 | | $ | 188,708,908 | |
| Undistributed net investment income included in net assets: | | | | | | |
| End of year | $ | 378,893 | | $ | 1,500,918 | |
franklintempleton.com The accompanying notes are an integral part of these financial statements. | Annual Report | 23
FRANKLIN TEMPLETON INTERNATIONAL TRUST
Notes to Financial Statements
Templeton Foreign Smaller Companies Fund
1. Organization and Significant Accounting Policies
Franklin Templeton International Trust (Trust) is registered under the Investment Company Act of 1940, as amended, (1940 Act) as an open-end management investment company, consisting of four separate funds. The Templeton Foreign Smaller Companies Fund (Fund) is included in this report. The financial statements of the remaining funds in the Trust are presented separately. The Fund offers four classes of shares: Class A, Class C, Class R6, and Advisor Class. Each class of shares differs by its initial sales load, contingent deferred sales charges, voting rights on matters affecting a single class, its exchange privilege and fees primarily due to differing arrangements for distribution and transfer agent fees. The Fund was closed to new investors effective at the close of market December 10, 2013. Existing shareholders may add to their accounts through exchanges or additional purchases.
The following summarizes the Funds’ significant accounting policies.
a. Financial Instrument Valuation
The Fund’s investments in financial instruments are carried at fair value daily. Fair value is the price that would be received to sell an asset or paid to transfer a liability in an orderly transaction between market participants on the measurement date. The Fund calculates the net asset value (NAV) per share at the close of the New York Stock Exchange (NYSE), generally at 4 p.m. Eastern time (NYSE close) on each day the NYSE is open for trading. Under compliance policies and procedures approved by the Trust’s Board of Trustees (the Board), the Fund’s administrator has responsibility for oversight of valuation, including leading the cross-functional Valuation and Liquidity Oversight Committee (VLOC). The VLOC provides administration and oversight of the Fund’s valuation policies and procedures, which are approved annually by the Board. Among other things, these procedures allow the Fund to utilize independent pricing services, quotations from securities and financial instrument dealers, and other market sources to determine fair value.
Equity securities listed on an exchange or on the NASDAQ National Market System are valued at the last quoted sale price or the official closing price of the day, respectively. Foreign equity securities are valued as of the close of trading on the foreign stock exchange on which the security is primarily traded or as of the NYSE close, whichever is earlier. The value is then converted into its U.S. dollar equivalent at the foreign exchange rate in effect at the NYSE close on the day that the value of the security is determined. Over-the-counter (OTC) securities are valued within the range of the most recent quoted bid and ask prices. Securities that trade in multiple markets or on multiple exchanges are valued according to the broadest and most representative market. Certain equity securities are valued based upon fundamental characteristics or relationships to similar securities.
The Fund has procedures to determine the fair value of financial instruments for which market prices are not reliable or readily available. Under these procedures, the VLOC convenes on a regular basis to review such financial instruments and considers a number of factors, including significant unobservable valuation inputs, when arriving at fair value. The VLOC primarily employs a market-based approach which may use related or comparable assets or liabilities, recent transactions, market multiples, book values, and other relevant information for the investment to determine the fair value of the investment. An income-based valuation approach may also be used in which the anticipated future cash flows of the investment are discounted to calculate fair value. Discounts may also be applied due to the nature or duration of any restrictions on the disposition of the investments. Due to the inherent uncertainty of valuations of such investments, the fair values may differ significantly from the values that would have been used had an active market existed. The VLOC employs various methods for calibrating these valuation approaches including a regular review of key inputs and assumptions, transactional back-testing or disposition analysis, and reviews of any related market activity.
Trading in securities on foreign securities stock exchanges and OTC markets may be completed before the daily NYSE close. In addition, trading in certain foreign markets may not take place on every NYSE business day. Occasionally, events occur between the time at which trading in a foreign security is completed and the close of the NYSE that might call into question the reliability of the value of a portfolio security held by the Fund. As a result, differences may arise between the value of
24 | Annual Report franklintempleton.com
FRANKLIN TEMPLETON INTERNATIONAL TRUST
NOTES TO FINANCIAL STATEMENTS
Templeton Foreign Smaller Companies Fund (continued)
the Fund’s portfolio securities as determined at the foreign market close and the latest indications of value at the close of the NYSE. In order to minimize the potential for these differences, the VLOC monitors price movements following the close of trading in foreign stock markets through a series of country specific market proxies (such as baskets of American Depositary Receipts, futures contracts and exchange traded funds). These price movements are measured against established trigger thresholds for each specific market proxy to assist in determining if an event has occurred that may call into question the reliability of the values of the foreign securities held by the Fund. If such an event occurs, the securities may be valued using fair value procedures, which may include the use of independent pricing services. At October 31, 2014, a market event occurred resulting in a portion of the securities held by the Fund being valued using fair value procedures.
Also, when the last day of the reporting period is a non-business day, certain foreign markets may be open on those days that the NYSE is closed, which could result in differences between the value of the Fund’s portfolio securities on the last business day and the last calendar day of the reporting period. Any significant security valuation changes due to an open foreign market are adjusted and reflected by the Fund for financial reporting purposes.
b. Foreign Currency Translation
Portfolio securities and other assets and liabilities denominated in foreign currencies are translated into U.S. dollars based on the exchange rate of such currencies against U.S. dollars on the date of valuation. The Fund may enter into foreign currency exchange contracts to facilitate transactions denominated in a foreign currency. Purchases and sales of securities, income and expense items denominated in foreign currencies are translated into U.S. dollars at the exchange rate in effect on the transaction date. Portfolio securities and assets and liabilities denominated in foreign currencies contain risks that those currencies will decline in value relative to the U.S. dollar. Occasionally, events may impact the availability or reliability of foreign exchange rates used to convert the U.S. dollar equivalent value. If such an event occurs, the foreign exchange rate will be valued at fair value using procedures established and approved by the Board.
The Fund does not separately report the effect of changes in foreign exchange rates from changes in market prices on securities held. Such changes are included in net realized and unrealized gain or loss from investments on the Statement of Operations.
Realized foreign exchange gains or losses arise from sales of foreign currencies, currency gains or losses realized between the trade and settlement dates on securities transactions and the difference between the recorded amounts of dividends, interest, and foreign withholding taxes and the U.S. dollar equivalent of the amounts actually received or paid. Net unrealized foreign exchange gains and losses arise from changes in foreign exchange rates on foreign denominated assets and liabilities other than investments in securities held at the end of the reporting period.
c. Securities Lending
The Fund participates in an agency based securities lending program. The Fund receives cash collateral against the loaned securities in an amount equal to at least 102% of the fair value of the loaned securities. Collateral is maintained over the life of the loan in an amount not less than 100% of the fair value of loaned securities, as determined at the close of fund business each day; any additional collateral required due to changes in security values is delivered to the Fund on the next business day. The collateral is invested in a non-registered money fund. The Fund receives income from the investment of cash collateral, in addition to lending fees and rebates paid by the borrower. The Fund bears the market risk with respect to the collateral investment, securities loaned, and the risk that the agent may default on its obligations to the Fund. The securities lending agent has agreed to indemnify the Fund in the event of default by a third party borrower. At October 31, 2014, the Fund had no securities on loan.
d. Income and Deferred Taxes
It is the Fund’s policy to qualify as a regulated investment company under the Internal Revenue Code. The Fund intends to distribute to shareholders substantially all of its taxable income and net realized gains to relieve it from federal income and excise taxes. As a result, no provision for U.S. federal income taxes is required.
franklintempleton.com Annual Report | 25
FRANKLIN TEMPLETON INTERNATIONAL TRUST
NOTES TO FINANCIAL STATEMENTS
Templeton Foreign Smaller Companies Fund (continued)
1. Organization and Significant Accounting
Policies (continued)
d. Income and Deferred Taxes (continued)
The Fund may be subject to foreign taxation related to income received, capital gains on the sale of securities and certain foreign currency transactions in the foreign jurisdictions in which it invests. Foreign taxes, if any, are recorded based on the tax regulations and rates that exist in the foreign markets in which the Fund invests. When a capital gain tax is determined to apply the Fund records an estimated deferred tax liability in an amount that would be payable if the securities were disposed of on the valuation date.
The Fund recognizes the tax benefits of uncertain tax positions only when the position is “more likely than not” to be sustained upon examination by the tax authorities based on the technical merits of the tax position. As of October 31, 2014, and for all open tax years, the Fund has determined that no liability for unrecognized tax benefits is required in the Fund’s financial statements related to uncertain tax positions taken on a tax return (or expected to be taken on future tax returns). Open tax years are those that remain subject to examination and are based on each tax jurisdiction statute of limitation.
e. Security Transactions, Investment Income, Expenses and Distributions
Security transactions are accounted for on trade date. Realized gains and losses on security transactions are determined on a specific identification basis. Interest income and estimated expenses are accrued daily. Amortization of premium and accretion of discount on debt securities are included in interest income. Dividend income is recorded on the ex-dividend date except that certain dividends from foreign securities are recognized as soon as the Fund is notified of the ex-dividend date. Distributions to shareholders are recorded on the ex-dividend date and are determined according to income tax regulations (tax basis). Distributable earnings determined on a tax basis may differ from earnings recorded in accordance with accounting principles generally accepted in the United States of America. These differences may be permanent or temporary. Permanent differences are reclassified among capital accounts to reflect their tax character. These reclassifications have no impact on net assets or the results of operations. Temporary differences are not reclassified, as they may reverse in subsequent periods.
Common expenses incurred by the Trust are allocated among the funds based on the ratio of net assets of each fund to the combined net assets of the Trust. Fund specific expenses are charged directly to the fund that incurred the expense.
Realized and unrealized gains and losses and net investment income, not including class specific expenses, are allocated daily to each class of shares based upon the relative proportion of net assets of each class. Differences in per share distributions, by class, are generally due to differences in class specific expenses.
f. Accounting Estimates
The preparation of financial statements in accordance with accounting principles generally accepted in the United States of America requires management to make estimates and assumptions that affect the reported amounts of assets and liabilities at the date of the financial statements and the amounts of income and expenses during the reporting period. Actual results could differ from those estimates.
g. Guarantees and Indemnifications
Under the Trust’s organizational documents, its officers and trustees are indemnified by the Trust against certain liabilities arising out of the performance of their duties to the Trust. Additionally, in the normal course of business, the Trust, on behalf of the Fund, enters into contracts with service providers that contain general indemnification clauses. The Trust’s maximum exposure under these arrangements is unknown as this would involve future claims that may be made against the Trust that have not yet occurred. Currently, the Trust expects the risk of loss to be remote.
26 | Annual Report franklintempleton.com
FRANKLIN TEMPLETON INTERNATIONAL TRUST
NOTES TO FINANCIAL STATEMENTS
Templeton Foreign Smaller Companies Fund (continued)
2. Shares of Beneficial Interest
At October 31, 2014, there were an unlimited number of shares authorized (without par value). Transactions in the Fund’s shares were as follows:
| | | | | | | | | | |
| | | | | Year Ended October 31, | | | | |
| | | | | 2014 | | | | | 2013 | |
| | Shares | | | Amount | | Shares | | | Amount | |
| |
| Class A Shares: | | | | | | | | | | |
| Shares sold | 656,199 | | $ | 11,658,914 | | 1,901,123 | | $ | 31,085,928 | |
| Shares issued in reinvestment of distributions | 103,180 | | | 1,796,360 | | 123,662 | | | 1,820,300 | |
| Shares redeemed | (2,308,078 | ) | | (41,014,991 | ) | (1,878,157 | ) | | (30,127,426 | ) |
| Net increase (decrease) | (1,548,699 | ) | $ | (27,559,717 | ) | 146,628 | | $ | 2,778,802 | |
| |
| Class B Sharesa: | | | | | | | | | | |
| Shares redeemed | | | | | | (14,472 | ) | $ | (219,644 | ) |
| |
| Class C Shares: | | | | | | | | | | |
| Shares sold | 118,115 | | $ | 2,021,467 | | 238,972 | | $ | 3,756,164 | |
| Shares issued in reinvestment of distributions | 7,685 | | | 129,192 | | 9,802 | | | 139,476 | |
| Shares redeemed | (218,270 | ) | | (3,713,162 | ) | (249,234 | ) | | (3,842,138 | ) |
| Net increase (decrease) | (92,470 | ) | $ | (1,562,503 | ) | (460 | ) | $ | 53,502 | |
| |
| Class R6 Sharesb: | | | | | | | | | | |
| Shares sold | 60,634 | | $ | 1,084,834 | | 302 | | $ | 5,000 | |
| Shares redeemed | (9,834 | ) | | (175,003 | ) | — | | | — | |
| Net increase (decrease) | 50,800 | | $ | 909,831 | | 302 | | $ | 5,000 | |
| |
| Advisor Class Shares: | | | | | | | | | | |
| Shares sold | 1,274,813 | | $ | 22,772,036 | | 1,080,618 | | $ | 17,530,116 | |
| Shares issued in reinvestment of distributions | 32,798 | | | 569,372 | | 38,515 | | | 565,022 | |
| Shares redeemed | (1,112,364 | ) | | (19,710,136 | ) | (1,063,915 | ) | | (16,886,365 | ) |
| Net increase (decrease) | 195,247 | | $ | 3,631,272 | | 55,218 | | $ | 1,208,773 | |
aEffective March 22, 2013, all Class B shares were converted to Class A.
bFor the period May 1, 2013 (effective date) to October 31, 2013.
3. Transactions with Affiliates
Franklin Resources, Inc. is the holding company for various subsidiaries that together are referred to as Franklin Templeton Investments. Certain officers and trustees of the Trust are also officers and/or directors of the following subsidiaries:
| |
| Subsidiary | Affiliation |
| Franklin Templeton Investment Corp. (FTIC) | Investment manager |
| Templeton Investment Counsel, LLC (TIC) | Investment manager |
| Franklin Templeton Services, LLC (FT Services) | Administrative manager |
| Franklin Templeton Distributors, Inc. (Distributors) | Principal underwriter |
| Franklin Templeton Investor Services, LLC (Investor Services) | Transfer agent |
franklintempleton.com Annual Report | 27
FRANKLIN TEMPLETON INTERNATIONAL TRUST
NOTES TO FINANCIAL STATEMENTS
Templeton Foreign Smaller Companies Fund (continued)
| 3. | Transactions with Affiliates (continued) |
| a. | Management Fees |
The Fund pays an investment management fee to FTIC based on the average daily net assets of the Fund as follows:
| |
| Annualized Fee Rate | Net Assets |
| 1.000% | Up to and including $100 million |
| 0.900% | Over $100 million, up to and including $250 million |
| 0.800% | Over $250 million, up to and including $500 million |
| 0.750% | In excess of $500 million |
Under a subadvisory agreement, TIC, an affiliate of FTIC, provides subadvisory services to the Fund. The subadvisory fee is paid by FTIC based on the average daily net assets, and is not an additional expense of the Fund.
b. Administrative Fees
Under an agreement with FTIC, FT Services provides administrative services to the Fund. The fee is paid by FTIC based on the Fund’s average daily net assets, and is not an additional expense of the Fund.
c. Distribution Fees
The Board has adopted distribution plans for each share class, with the exception of Class R6 and Advisor Class shares, pursuant to Rule 12b-1 under the 1940 Act. Distribution fees are not charged on shares held by affiliates. Under the Fund’s Class A reimbursement distribution plan, the Fund reimburses Distributors for costs incurred in connection with the servicing, sale and distribution of the Fund’s shares up to the maximum annual plan rate. Under the Class A reimbursement distribution plan, costs exceeding the maximum for the current plan year cannot be reimbursed in subsequent periods. In addition, under the Fund’s Class C compensation distribution plan, the Fund pays Distributors for costs incurred in connection with the servicing, sale and distribution of the Fund’s shares up to the maximum annual plan rate. The plan year, for purposes of monitoring compliance with the maximum annual plan rates, is February 1 through January 31.
The maximum annual plan rates, based on the average daily net assets, for each class, are as follows:
| | |
| Class A | 0.25 | % |
| Class C | 1.00 | % |
| |
| d. Sales Charges/Underwriting Agreements | | |
Front-end sales charges and contingent deferred sales charges (CDSC) do not represent expenses of the Fund. These charges are deducted from the proceeds of sales of Fund shares prior to investment or from redemption proceeds prior to remittance, as applicable. Distributors has advised the Fund of the following commission transactions related to the sales and redemptions of the Fund’s shares for the year:
| | |
| Sales charges retained net of commissions paid to unaffiliated | | |
| broker/dealers | $ | 14,651 |
| CDSC retained | $ | 601 |
| |
| e. Transfer Agent Fees | | |
Each class of shares, except for Class R6, pays transfer agent fees to Investor Services for its performance of shareholder servicing obligations and reimburses Investor Services for out of pocket expenses incurred, including shareholding servicing fees paid to third parties. These fees are allocated daily based upon their relative proportion of such classes’ aggregate net assets. Class R6 pays Investor Services transfer agent fees specific to that class.
28 | Annual Report
franklintempleton.com
FRANKLIN TEMPLETON INTERNATIONAL TRUST
NOTES TO FINANCIAL STATEMENTS
Templeton Foreign Smaller Companies Fund (continued)
For the year ended October 31, 2014, the Fund paid transfer agent fees of $592,007, of which $215,401 was retained by Investor Services.
f. Waiver and Expense Reimbursements
Investor Services has contractually agreed in advance to waive or limit its fees so that the Class R6 transfer agent fees do not exceed 0.01% until February 28, 2015.
4. Expense Offset Arrangement
The Fund has entered into an arrangement with its custodian whereby credits realized as a result of uninvested cash balances are used to reduce a portion of the Fund’s custodian expenses. During the year ended October 31, 2014, there were no credits earned.
5. Income Taxes
For tax purposes, capital losses may be carried over to offset future capital gains. Capital loss carryforwards with no expiration, if any, must be fully utilized before those losses with expiration dates.
At October 31, 2014, the Fund had capital loss carryforwards of $13,038,009 expiring in 2017. During the year ended October 31, 2014, the Fund utilized $5,404,653 of capital loss carryforwards. The tax character of distributions paid during the years ended October 31, 2014 and 2013 was as follows:
| | | | |
| | | 2014 | | 2013 |
| Distributions paid from ordinary income | $ | 2,706,358 | $ | 2,681,652 |
At October 31, 2014, the cost of investments, net unrealized appreciation (depreciation), and undistributed ordinary income for income tax purposes were as follows:
| | | |
| Cost of investments | $ | 139,364,439 | |
| |
| Unrealized appreciation | $ | 26,352,209 | |
| Unrealized depreciation | | (21,452,100 | ) |
| Net unrealized appreciation (depreciation) | $ | 4,900,109 | |
| |
| Distributable earnings – undistributed ordinary income | $ | 1,925,631 | |
Differences between income and/or capital gains as determined on a book basis and a tax basis are primarily due to differing treatments of passive foreign investment company shares and wash sales.
6. Investment Transactions
Purchases and sales of investments (excluding short term securities) for the year ended October 31, 2014, aggregated $66,080,761 and $80,362,923 respectively.
7. Concentration of Risk
Investing in foreign securities may include certain risks and considerations not typically associated with investing in U.S. securities, such as fluctuating currency values and changing local and regional economic, political and social conditions, which may result in greater market volatility. In addition, certain foreign securities may not be as liquid as U.S. securities.
franklintempleton.com
Annual Report
| 29
FRANKLIN TEMPLETON INTERNATIONAL TRUST
NOTES TO FINANCIAL STATEMENTS
Templeton Foreign Smaller Companies Fund (continued)
8. Credit Facility
The Fund, together with other U.S. registered and foreign investment funds (collectively, Borrowers), managed by Franklin Templeton Investments, are borrowers in a joint syndicated senior unsecured credit facility totaling $1.5 billion (Global Credit Facility) which matures on February 13, 2015. This Global Credit Facility provides a source of funds to the Borrowers for temporary and emergency purposes, including the ability to meet future unanticipated or unusually large redemption requests.
Under the terms of the Global Credit Facility, the Fund shall, in addition to interest charged on any borrowings made by the Fund and other costs incurred by the Fund, pay its share of fees and expenses incurred in connection with the implementation and maintenance of the Global Credit Facility, based upon its relative share of the aggregate net assets of all of the Borrowers, including an annual commitment fee of 0.07% based upon the unused portion of the Global Credit Facility. These fees are reflected in other expenses on the Statement of Operations. During the year ended October 31, 2014, the Fund did not use the Global Credit Facility.
9. Fair Value Measurements
The Fund follows a fair value hierarchy that distinguishes between market data obtained from independent sources (observable inputs) and the Fund’s own market assumptions (unobservable inputs). These inputs are used in determining the value of the Fund’s financial instruments and are summarized in the following fair value hierarchy:
- Level 1 – quoted prices in active markets for identical financial instruments
- Level 2 – other significant observable inputs (including quoted prices for similar financial instruments, interest rates, prepayment speed, credit risk, etc.)
- Level 3 – significant unobservable inputs (including the Fund’s own assumptions in determining the fair value of financial instruments)
The input levels are not necessarily an indication of the risk or liquidity associated with financial instruments at that level.
For movements between the levels within the fair value hierarchy, the Fund has adopted a policy of recognizing the transfers as of the date of the underlying event which caused the movement. Additionally, at October 31, 2014, due to market events, the Fund employed fair value procedures to value a portion of its holdings. Such procedures resulted in a temporary transfer of financial instruments valued at $16,752,156 from Level 1 to Level 2 within the fair value hierarchy.
A summary of inputs used as of October 31, 2014, in valuing the Fund’s assets carried at fair value, is as follows:
| | | | | | | | |
| | | Level 1 | | Level 2 | | Level 3 | | Total |
| Assets: | | | | | | | | |
| Investments in Securities: | | | | | | | | |
| Closed End Funds | $ | 2,122,264 | $ | — | $ | — | $ | 2,122,264 |
| Equity Investments: | | | | | | | | |
| Indonesia | | — | | — | | 1,702,998 | | 1,702,998 |
| Japan | | — | | 16,752,156 | | — | | 16,752,156 |
| All Other Equity Investmentsa,b | | 123,687,130 | | — | | —c | | 123,687,130 |
| Total Investments in Securities | $ | 125,809,394 | $ | 16,752,156 | $ | 1,702,998 | $ | 144,264,548 |
aFor detailed categories, see the accompanying Statement of Investments.
bIncludes common and preferred stocks.
cIncludes securities determined to have no value at October 31, 2014.
30 | Annual Report franklintempleton.com
FRANKLIN TEMPLETON INTERNATIONAL TRUST
NOTES TO FINANCIAL STATEMENTS
Templeton Foreign Smaller Companies Fund (continued)
A reconciliation of assets in which Level 3 inputs are used in determining fair value is presented when there are significant Level 3 financial instruments at the end of the year. At October 31, 2014, the reconciliations of assets are as follows:
| | | | | | | | | | | | | | | | | | |
| | | | | | | | | | | | | | | | | | Net Change | |
| | | | | | | | | | | | | | | | | | in Unrealized | |
| | | | | | | | | | | | | Net | | | | | Appreciation | |
| | | Balance at | | | | | | | | | | Unrealized | | | | | (Depreciation) | |
| | | Beginning | | Purchases | | Transfers Into | | Cost Basis | | Net Realized | | Appreciation | | | Balance at | | on Assets Held | |
| | | of Year | | (Sales) | | (Out of) Level 3 | | Adjustments | | Gain (Loss) | | (Depreciation) | | | End of Year | | at Year End | |
| Assets: | | | | | | | | | | | | | | | | | | |
| Investments in Securities: | | | | | | | | | | | | | | | | | | |
| Equity Investments: | | | | | | | | | | | | | | | | | | |
| Indonesia | $ | 2,025,748 | $ | — | $ | — | $ | — | $ | — | $ | (322,750 | ) | $ | 1,702,998 | $ | (322,750 | ) |
| Sweden | | —a | | — | | — | | — | | — | | — | | | —a | | — | |
| Total | $ | 2,025,748 | $ | — | $ | — | $ | — | $ | — | $ | (322,750 | ) | $ | 1,702,998 | $ | (322,750 | ) |
aIncludes securities determined to have no value.
Significant unobservable valuation inputs developed by the VLOC for material Level 3 financial instruments and impact to fair value as a result of changes in unobservable valuation inputs as of October 31, 2014, are as follows:
| | | | | | | |
| | | | | | | | Impact to Fair |
| | | Fair Value at | | | | | Value if Input |
| Description | | End of Year | Valuation Technique | Unobservable Inputs | Amount | | Increasesa |
| Assets: | | | | | | | |
| Investments in Securities | | | | | | | |
| Equity Investments: | | | | | | | |
| Indonesia | $ | 1,702,998 | Market comparables | EV / EBITDA multiple | 5.8x - 17.4x | | Increaseb |
| | | | | Discount for lack of | | | |
| | | | | marketability | 0-10 | % | Decreaseb |
| All Other Investmentsc | | — | | | | | |
| Total | $ | 1,702,998 | | | | | |
aRepresents the directional change in the fair value of the Level 3 investments that would result from a significant and reasonable increase in the corresponding input.
A significant and reasonable decrease in the input would have the opposite effect. Significant impacts, if any, to fair value and/or net assets have been indicated.
bRepresents a significant impact to fair value and net assets.
cIncludes securities determined to have no value.
| |
| Abbreviations List |
| |
| EDITDA | Earnings before interest, taxes, depreciation and amortization |
| EV | Enterprise value |
10. New Accounting Pronouncements
In June 2013, the Financial Accounting Standards Board (FASB) issued Accounting Standards Update (ASU) No. 2013-08, Investment Companies (Topic 946): Amendments to the Scope, Measurement, and Disclosure Requirements. The ASU modifies the criteria used in defining an investment company under U.S. Generally Accepted Accounting Principles and also sets forth certain measurement and disclosure requirements. Under the ASU, an entity that is registered under the 1940 Act automatically qualifies as an investment company. The ASU is effective for interim and annual reporting periods beginning after December 15, 2013. Management has reviewed the requirements and believes the adoption of this ASU will not have a material impact on the financial statements.
franklintempleton.com Annual Report | 31
FRANKLIN TEMPLETON INTERNATIONAL TRUST
NOTES TO FINANCIAL STATEMENTS
Templeton Foreign Smaller Companies Fund (continued)
10. New Accounting Pronouncements (continued)
In June 2014, FASB issued ASU No.2014-11, Transfers and Servicing (Topic 860), Repurchase-to-Maturity Transactions, Repurchase Financings, and Disclosures. The ASU changes the accounting for certain repurchase agreements and expands disclosure requirements related to repurchase agreements, securities lending, repurchase-to-maturity and similar transactions. The ASU is effective for interim and annual reporting periods beginning after December 15, 2014. Management is currently evaluating the impact, if any, of applying this provision.
11. Subsequent Events
The Fund has evaluated subsequent events through the issuance of the financial statements and determined that no events have occurred that require disclosure.
|
| Abbreviations |
| Selected Portfolio |
| GDR Global Depositary Receipt |
32 | Annual Report
franklintempleton.com
FRANKLIN TEMPLETON INTERNATIONAL TRUST
TEMPLETON FOREIGN SMALLER COMPANIES FUND
Report of Independent Registered Public Accounting Firm
To the Board of Trustees and Shareholders of Franklin Templeton International Trust
In our opinion, the accompanying statement of assets and liabilities, including the statement of investments, and the related statements of operations and of changes in net assets and the financial highlights present fairly, in all material respects, the financial position of Templeton Foreign Smaller Companies Fund (one of the funds constituting Franklin Templeton International Trust, hereafter referred to as the “Fund”) at October 31, 2014, the results of its operations for the year then ended, the changes in its net assets for each of the two years in the period then ended and the financial highlights for each of the periods presented, in conformity with accounting principles generally accepted in the United States of America. These financial statements and financial highlights (hereafter referred to as “financial statements”) are the responsibility of the Fund’s management. Our responsibility is to express an opinion on these financial statements based on our audit. We conducted our audit of these financial statements in accordance with the standards of the Public Company Accounting Oversight Board (United States). Those standards require that we plan and perform the audit to obtain reasonable assurance about whether the financial statements are free of material misstatement. An audit includes examining, on a test basis, evidence supporting the amounts and disclosures in the financial statements, assessing the accounting principles used and significant estimates made by management, and evaluating the overall financial statement presentation. We believe that our audit, which included confirmation of securities at October 31, 2014 by correspondence with the custodian and brokers, provide a reasonable basis for our opinion.
PricewaterhouseCoopers LLP
San Francisco, California
December 19, 2014
franklintempleton.com
Annual Report
| 33
FRANKLIN TEMPLETON INTERNATIONAL TRUST
Tax Information (unaudited)
Templeton Foreign Smaller Companies Fund
Under Section 854(b)(1)(B) of the Internal Revenue Code (Code), the Fund hereby reports the maximum amount allowable but no less than $1,910,665 as qualified dividends for purposes of the maximum rate under Section 1(h)(11) of the Code for the fiscal year ended October 31, 2014. Distributions, including qualified dividend income, paid during calendar year 2014 will be reported to shareholders on Form 1099-DIV by mid-February 2015. Shareholders are advised to check with their tax advisors for information on the treatment of these amounts on their individual income tax returns.
At October 31, 2013, more than 50% of the Fund’s total assets were invested in securities of foreign issuers. In most instances, foreign taxes were withheld from income paid to the Fund on these investments. As shown in the table below, the Fund hereby reports to shareholders the foreign source income and foreign taxes paid, pursuant to Section 853 of the Code. This written statement will allow shareholders of record on December 13, 2013, to treat their proportionate share of foreign taxes paid by the Fund as having been paid directly by them. The shareholder shall consider these amounts as foreign taxes paid in the tax year in which they receive the Fund distribution.
The following table provides a detailed analysis of foreign tax paid, foreign source income, and foreign source qualified dividends as reported by the Fund, to Class A, Class C, Class R6, and Advisor Class shareholders of record.
| | | | | | |
| | | Foreign Tax Paid | | Foreign Source | | Foreign Qualified |
| Class | | Per Share | | Income Per Share | | Dividends Per Share |
| Class A | $ | 0.0294 | $ | 0.1897 | $ | 0.0869 |
| Class C | $ | 0.0294 | $ | 0.1013 | $ | 0.0464 |
| Class R6 | $ | 0.0294 | $ | 0.2573 | $ | 0.1178 |
| Advisor Class | $ | 0.0294 | $ | 0.2212 | $ | 0.1012 |
Foreign Tax Paid Per Share (Column 1) is the amount per share available to you, as a tax credit (assuming you held your shares in the Fund for a minimum of 16 days during the 31-day period beginning 15 days before the ex-dividend date of the Fund’s distribution to which the foreign taxes relate), or, as a tax deduction.
Foreign Source Income Per Share (Column 2) is the amount per share of income dividends attributable to foreign securities held by the Fund, plus any foreign taxes withheld on these dividends. The amounts reported include foreign source qualified dividends that have not been adjusted for the rate differential applicable to such dividend income.1
Foreign Source Qualified Dividends Per Share (Column 3) is the amount per share of foreign source qualified dividends, plus any foreign taxes withheld on these dividends. These amounts represent the portion of the Foreign Source Income reported to you in column 2 that were derived from qualified foreign securities held by the Fund.1
By mid-February 2014, shareholders received Form 1099-DIV which included their share of taxes paid and foreign source income distributed during the calendar year 2013. The Foreign Source Income reported on Form 1099-DIV has not been adjusted for the rate differential on foreign source qualified dividend income. Shareholders are advised to check with their tax advisors for information on the treatment of these amounts on their 2013 individual income tax returns.
1Qualified dividends are taxed at reduced long term capital gains tax rates. In determining the amount of foreign tax credit that may be applied against the U.S. tax liability
of individuals receiving foreign source qualified dividends, adjustments may be required to the foreign tax credit limitation calculation to reflect the rate differential applicable
to such dividend income. The rules however permit certain individuals to elect not to apply the rate differential adjustments for capital gains and/or dividends for any taxable
year. Please consult your tax advisor and the instructions to Form 1116 for more information.
34 | Annual Report franklintempleton.com
FRANKLIN TEMPLETON INTERNATIONAL TRUST
Board Members and Officers
The name, year of birth and address of the officers and board members, as well as their affiliations, positions held with the Trust, principal occupations during at least the past five years and number of portfolios overseen in the Franklin Templeton Investments fund complex are shown below. Generally, each board member serves until that person’s successor is elected and qualified.
| | | | |
| Independent Board Members | | | |
| |
| | | | Number of Portfolios in | |
| Name, Year of Birth | | Length of | Fund Complex Overseen | Other Directorships Held |
| and Address | Position | Time Served | by Board Member* | During at Least the Past 5 Years |
| |
| Harris J. Ashton (1932) | Trustee | Since 1991 | 137 | Bar-S Foods (meat packing company) |
| One Franklin Parkway | | | | (1981-2010). |
| San Mateo, CA 94403-1906 | | | | |
| Principal Occupation During at Least the Past 5 Years: | | |
| Director of various companies; and formerly, Director, RBC Holdings, Inc. (bank holding company) (until 2002); and President, Chief |
| Executive Officer and Chairman of the Board, General Host Corporation (nursery and craft centers) (until 1998). |
| |
| Mary C. Choksi (1950) | Trustee | Since | 111 | Avis Budget Group Inc. (car rental), |
| One Franklin Parkway | | October 2014 | | Omnicom Group Inc. (advertising and |
| San Mateo, CA 94403-1906 | | | | marketing communications services) |
| | | | | and H.J. Heinz Company (processed |
| | | | | foods and allied products) (1998-2006). |
| |
| Principal Occupation During at Least the Past 5 Years: | | |
| Founding Partner and Senior Managing Director, Strategic Investment Group (investment management group) (1987-present); director of |
| various companies; and formerly, Founding Partner and Managing Director, Emerging Markets Management LLC (investment management |
| firm) (1987-2011); Loan Officer/Senior Loan Officer/Senior Pension Investment Officer, World Bank Group (international financial institution) |
| (1977-1987). | | | | |
| |
| Sam Ginn (1937) | Trustee | Since 2007 | 111 | ICO Global Communications |
| One Franklin Parkway | | | | (Holdings) Limited (satellite company) |
| San Mateo, CA 94403-1906 | | | | (2006-2010), Chevron Corporation |
| | | | | (global energy company) (1989-2009), |
| | | | | Hewlett-Packard Company (technology |
| | | | | company) (1996-2002), Safeway, Inc. |
| | | | | (grocery retailer) (1991-1998) and |
| | | | | TransAmerica Corporation (insurance |
| | | | | company) (1989-1999). |
| |
| Principal Occupation During at Least the Past 5 Years: | | |
| Private investor; and formerly, Chairman, First Responder Network Authority (FirstNet) (interoperable wireless broadband network) |
| (2012-2014); Chairman of the Board, Vodafone AirTouch, PLC (wireless company) (1999-2000); Chairman of the Board and Chief Executive |
| Officer, AirTouch Communications (cellular communications) (1993-1998) and Pacific Telesis Group (telephone holding company) |
| (1988-1994). | | | | |
| |
| Edith E. Holiday (1952) | Trustee | Since 1998 | 137 | Hess Corporation (exploration and |
| One Franklin Parkway | | | | refining of oil and gas), H.J. Heinz |
| San Mateo, CA 94403-1906 | | | | Company (processed foods and |
| | | | | allied products) (1994-2013), RTI |
| | | | | International Metals, Inc. (manufacture |
| | | | | and distribution of titanium), Canadian |
| | | | | National Railway (railroad) and White |
| | | | | Mountains Insurance Group, Ltd. |
| | | | | (holding company). |
| |
| Principal Occupation During at Least the Past 5 Years: | | |
| Director or Trustee of various companies and trusts; and formerly, Assistant to the President of the United States and Secretary of the |
| Cabinet (1990-1993); General Counsel to the United States Treasury Department (1989-1990); and Counselor to the Secretary and |
| Assistant Secretary for Public Affairs and Public Liaison – United States Treasury Department (1988-1989). |
franklintempleton.com Annual Report | 35
FRANKLIN TEMPLETON INTERNATIONAL TRUST
| | | | |
| Independent Board Members (continued) | | |
| |
| | | | Number of Portfolios in | |
| Name, Year of Birth | | Length of | Fund Complex Overseen | Other Directorships Held |
| and Address | Position | Time Served | by Board Member* | During at Least the Past 5 Years |
| |
| J. Michael Luttig (1954) | Trustee | Since 2009 | 137 | Boeing Capital Corporation |
| One Franklin Parkway | | | | (aircraft financing) (2006-2013). |
| San Mateo, CA 94403-1906 | | | | |
| |
| Principal Occupation During at Least the Past 5 Years: | | |
| Executive Vice President, General Counsel and member of the Executive Council, The Boeing Company (aerospace company); and formerly, |
| Federal Appeals Court Judge, U.S. Court of Appeals for the Fourth Circuit (1991-2006). | |
| |
| Frank A. Olson (1932) | Trustee | Since 2007 | 137 | Hess Corporation (exploration and |
| One Franklin Parkway | | | | refining of oil and gas) (1998-2013). |
| San Mateo, CA 94403-1906 | | | | |
| |
| Principal Occupation During at Least the Past 5 Years: | | |
| Director of various companies; and formerly, Chairman of the Board, The Hertz Corporation (car rental) (1980-2000) and Chief Executive |
| Officer (1977-1999); and Chairman of the Board, President and Chief Executive Officer, UAL Corporation (airlines) (June-December 1987). |
| |
| Larry D. Thompson (1945) | Trustee | Since 2007 | 137 | Cbeyond, Inc. (business communi- |
| One Franklin Parkway | | | | cations provider) (2010-2012), The |
| San Mateo, CA 94403-1906 | | | | Southern Company (energy company) |
| | | | | (December 2014; previously |
| | | | | 2010-2012) and Graham Holdings |
| | | | | Company (education and media |
| | | | | organization) (2011-present). |
| Principal Occupation During at Least the Past 5 Years: | | |
| Executive Vice President – Government Affairs, General Counsel and Corporate Secretary, PepsiCo, Inc. (consumer products) (2012-present); |
| and formerly, John A. Sibley Professor of Corporate and Business Law, University of Georgia School of Law (2011-2012); Senior Vice |
| President – Government Affairs, General Counsel and Secretary, PepsiCo, Inc. (2004-2011); Senior Fellow of The Brookings Institution |
| (2003-2004); Visiting Professor, University of Georgia School of Law (2004); and Deputy Attorney General, U.S. Department of Justice |
| (2001-2003). | | | | |
| |
| John B. Wilson (1959) | Lead | Trustee since | 111 | None |
| One Franklin Parkway | Independent | 2006 and Lead | | |
| San Mateo, CA 94403-1906 | Trustee | Independent | | |
| | | Trustee since 2008 | | |
| |
| Principal Occupation During at Least the Past 5 Years: | | |
| President, Staples Europe (office supplies) (2012-present); President and Founder, Hyannis Port Capital, Inc. (real estate and private |
| equity investing); serves on private and non-profit boards; and formerly, Chief Operating Officer and Executive Vice President, Gap, Inc. |
| (retail) (1996-2000); Chief Financial Officer and Executive Vice President – Finance and Strategy, Staples, Inc. (1992-1996); Senior Vice |
| President – Corporate Planning, Northwest Airlines, Inc. (airlines) (1990-1992); and Vice President and Partner, Bain & Company |
| (consulting firm) (1986-1990). | | | | |
36 | Annual Report franklintempleton.com
FRANKLIN TEMPLETON INTERNATIONAL TRUST
| | | | |
| Interested Board Members and Officers | | |
| |
| | | | Number of Portfolios in | |
| Name, Year of Birth | | Length of | Fund Complex Overseen | Other Directorships Held |
| and Address | Position | Time Served | by Board Member* | During at Least the Past 5 Years |
| |
| **Gregory E. Johnson (1961) | Trustee | Since 2007 | 147 | None |
| One Franklin Parkway | | | | |
| San Mateo, CA 94403-1906 | | | | |
| |
| Principal Occupation During at Least the Past 5 Years: | | |
| Chairman of the Board, Member – Office of the Chairman, Director, President and Chief Executive Officer, Franklin Resources, Inc.; |
| officer and/or director or trustee, as the case may be, of some of the other subsidiaries of Franklin Resources, Inc. and of 44 of the |
| investment companies in Franklin Templeton Investments; and Vice Chairman, Investment Company Institute. |
| |
| **Rupert H. Johnson, Jr. (1940) Chairman of | Chairman of the | 137 | None |
| One Franklin Parkway | the Board, | Board and Trustee | | |
| San Mateo, CA 94403-1906 | Trustee and | since 2013 | | |
| | Vice President | | | |
| Principal Occupation During at Least the Past 5 Years: | | |
| Vice Chairman, Member – Office of the Chairman and Director, Franklin Resources, Inc.; Director, Franklin Advisers, Inc.; Senior Vice |
| President, Franklin Advisory Services, LLC; and officer and/or director or trustee, as the case may be, of some of the other subsidiaries of |
| Franklin Resources, Inc. and of 41 of the investment companies in Franklin Templeton Investments. | |
| |
| Alison E. Baur (1964) | Vice President | Since 2012 | Not Applicable | Not Applicable |
| One Franklin Parkway | | | | |
| San Mateo, CA 94403-1906 | | | | |
| |
| Principal Occupation During at Least the Past 5 Years: | | |
| Deputy General Counsel, Franklin Templeton Investments; and officer of some of the other subsidiaries of Franklin Resources, Inc. and of |
| 46 of the investment companies in Franklin Templeton Investments. | | |
| |
| Laura F. Fergerson (1962) | Chief | Since 2009 | Not Applicable | Not Applicable |
| One Franklin Parkway | Executive | | | |
| San Mateo, CA 94403-1906 | Officer – | | | |
| | Finance and | | | |
| | Administration | | | |
| |
| Principal Occupation During at Least the Past 5 Years: | | |
| Senior Vice President, Franklin Templeton Services, LLC; and officer of 46 of the investment companies in Franklin Templeton Investments. |
| |
| Gaston Gardey (1967) | Treasurer, | 2009 | Not Applicable | Not Applicable |
| One Franklin Parkway | Chief Financial | | | |
| San Mateo, CA 94403-1906 | Officer and | | | |
| | Chief | | | |
| | Accounting | | | |
| | Officer | | | |
| |
| Principal Occupation During at Least the Past 5 Years: | | |
| Director, Fund Accounting, Franklin Templeton Investments; and officer of 27 of the investment companies in Franklin Templeton Investments. |
| |
| Aliya S. Gordon (1973) | Vice President | Since 2009 | Not Applicable | Not Applicable |
| One Franklin Parkway | | | | |
| San Mateo, CA 94403-1906 | | | | |
| |
| Principal Occupation During at Least the Past 5 Years: | | |
| Senior Associate General Counsel, Franklin Templeton Investments; officer of 46 of the investment companies in Franklin Templeton |
| Investments; and formerly, Litigation Associate, Steefel, Levitt & Weiss, LLP (2000-2004). | |
franklintempleton.com Annual Report | 37
| | | | |
| FRANKLIN TEMPLETON INTERNATIONAL TRUST | | |
| |
| |
| |
| |
| Interested Board Members and Officers (continued) | |
| |
| | | | Number of Portfolios in | |
| Name, Year of Birth | | Length of | Fund Complex Overseen | Other Directorships Held |
| and Address | Position | Time Served | by Board Member* | During at Least the Past 5 Years |
| |
| Steven J. Gray (1955) | Vice President | Since 2009 | Not Applicable | Not Applicable |
| One Franklin Parkway | | | | |
| San Mateo, CA 94403-1906 | | | | |
| |
| Principal Occupation During at Least the Past 5 Years: | | |
| Senior Associate General Counsel, Franklin Templeton Investments; Vice President, Franklin Templeton Distributors, Inc. and Franklin |
| Alternative Strategies Advisers, LLC; and officer of 46 of the investment companies in Franklin Templeton Investments. |
| |
| Selena L. Holmes (1965) | Vice President | Since 2012 | Not Applicable | Not Applicable |
| 100 Fountain Parkway | – AML | | | |
| St. Petersburg, FL 33716-1205 | Compliance | | | |
| |
| Principal Occupation During at Least the Past 5 Years: | | |
| Director, Global Compliance Monitoring; Chief Compliance Officer, Franklin Alternative Strategies Advisers, LLC; Vice President, Franklin |
| Templeton Companies, LLC; and officer of 46 of the investment companies in Franklin Templeton Investments. |
| |
| Edward B. Jamieson (1948) | President and | Since 2010 | Not Applicable | Not Applicable |
| One Franklin Parkway | Chief Executive | | | |
| San Mateo, CA 94403-1906 | Officer – | | | |
| | Investment | | | |
| | Management | | | |
| Principal Occupation During at Least the Past 5 Years: | | |
| President, Chief Investment Officer and Director, Franklin Advisers, Inc.; Executive Vice President, Franklin Templeton Institutional, LLC; |
| and officer and/or trustee, as the case may be, of some of the other subsidiaries of Franklin Resources, Inc. and of 10 of the investment |
| companies in Franklin Templeton Investments. | | | |
| |
| Kimberly H. Novotny (1972) | Vice President | Since 2013 | Not Applicable | Not Applicable |
| 300 S.E. 2nd Street | | | | |
| Fort Lauderdale, FL 33301-1923 | | | | |
| |
| Principal Occupation During at Least the Past 5 Years: | | |
| Associate General Counsel, Franklin Templeton Investments; Vice President and Secretary, Fiduciary Trust International of the South; Vice |
| President, Templeton Investment Counsel, LLC; Assistant Secretary, Franklin Resources, Inc.; and officer of 46 of the investment companies |
| in Franklin Templeton Investments. | | | |
| |
| Robert C. Rosselot (1960) | Chief | Since 2013 | Not Applicable | Not Applicable |
| 300 S.E. 2nd Street | Compliance | | | |
| Fort Lauderdale, FL 33301-1923 | Officer | | | |
| Principal Occupation During at Least the Past 5 Years: | | |
| Director, Global Compliance, Franklin Templeton Investments; Vice President, Franklin Templeton Companies, LLC; officer of 46 of the |
| investment companies in Franklin Templeton Investments; and formerly, Senior Associate General Counsel, Franklin Templeton Investments |
| (2007-2013); and Secretary and Vice President, Templeton Group of Funds (2004-2013). | |
| |
| Karen L. Skidmore (1952) | Vice President | Since 2006 | Not Applicable | Not Applicable |
| One Franklin Parkway | and Secretary | | | |
| San Mateo, CA 94403-1906 | | | | |
| |
| Principal Occupation During at Least the Past 5 Years: | | |
| Senior Associate General Counsel, Franklin Templeton Investments; and officer of 46 of the investment companies in Franklin Templeton |
| Investments. | | | | |
38 | Annual Report franklintempleton.com
FRANKLIN TEMPLETON INTERNATIONAL TRUST
| | | | |
| Interested Board Members and Officers (continued) | |
| |
| | | | Number of Portfolios in | |
| Name, Year of Birth | | Length of | Fund Complex Overseen | Other Directorships Held |
| and Address | Position | Time Served | by Board Member* | During at Least the Past 5 Years |
| |
| Craig S. Tyle (1960) | Vice President | Since 2005 | Not Applicable | Not Applicable |
| One Franklin Parkway | | | | |
| San Mateo, CA 94403-1906 | | | | |
| |
| Principal Occupation During at Least the Past 5 Years: | | |
| General Counsel and Executive Vice President, Franklin Resources, Inc.; and officer of some of the other subsidiaries of Franklin Resources, |
| Inc. and of 46 of the investment companies in Franklin Templeton Investments. | |
| |
| Lori A. Weber (1964) | Vice President | Since 2011 | Not Applicable | Not Applicable |
| 300 S.E. 2nd Street | | | | |
| Fort Lauderdale, FL 33301-1923 | | | | |
| |
| Principal Occupation During at Least the Past 5 Years: | | |
| Senior Associate General Counsel, Franklin Templeton Investments; Assistant Secretary, Franklin Resources, Inc.; Vice President and |
| Secretary, Templeton Investment Counsel, LLC; Vice President, Fiduciary Trust International of the South; and officer of 46 of the investment |
| companies in Franklin Templeton Investments. | | | |
*We base the number of portfolios on each separate series of the U.S. registered investment companies within the Franklin Templeton Investments fund complex. These
portfolios have a common investment manager or affiliated investment managers.
**Gregory E. Johnson is considered to be an interested person of the Fund under the federal securities laws due to his position as an officer and director of Franklin
Resources, Inc. (Resources), which is the parent company of the Fund’s investment manager and distributor. Rupert H. Johnson, Jr. is considered to be an interested
person of the Fund under the federal securities laws due to his position as officer and director and major shareholder of Resources.
Note 1: Rupert H. Johnson, Jr. is the uncle of Gregory E. Johnson.
Note 2: Officer information is current as of the date of this report. It is possible that after this date, information about officers may change.
The Sarbanes-Oxley Act of 2002 and Rules adopted by the Securities and Exchange Commission require the Fund to disclose whether the Fund’s Audit Committee
includes at least one member who is an audit committee financial expert within the meaning of such Act and Rules. The Fund’s Board has determined that there
is at least one such financial expert on the Audit Committee and has designated John B. Wilson as its audit committee financial expert. The Board believes that
Mr. Wilson qualifies as such an expert in view of his extensive business background and experience, including service as chief financial officer of Staples, Inc.
from 1992 to 1996. Mr. Wilson has been a Member and Chairman of the Fund’s Audit Committee since 2006. As a result of such background and experience, the
Board believes that Mr. Wilson has acquired an understanding of generally accepted accounting principles and financial statements, the general application of
such principles in connection with the accounting estimates, accruals and reserves, and analyzing and evaluating financial statements that present a breadth and
level of complexity of accounting issues generally comparable to those of the Fund, as well as an understanding of internal controls and procedures for financial
reporting and an understanding of audit committee functions. Mr. Wilson is an independent Board member as that term is defined under the relevant Securities
and Exchange Commission Rules and Releases.
The Statement of Additional Information (SAI) includes additional information about the board members and is available, without charge, upon request.
Shareholders may call (800) DIAL BEN/342-5236 to request the SAI.
franklintempleton.com Annual Report | 39
FRANKLIN TEMPLETON INTERNATIONAL TRUST TEMPLETON FOREIGN SMALLER COMPANIES FUND
Shareholder Information
Proxy Voting Policies and Procedures
The Fund’s investment manager has established Proxy Voting Policies and Procedures (Policies) that the Fund uses to determine how to vote proxies relating to portfolio securities. Shareholders may view the Fund’s complete Policies online at franklintempleton.com. Alternatively, shareholders may request copies of the Policies free of charge by calling the Proxy Group collect at (954) 527-7678 or by sending a written request to: Franklin Templeton Companies, LLC, 300 S.E. 2nd Street, Fort Lauderdale, FL 33301, Attention: Proxy Group. Copies of the Fund’s proxy voting records are also made available online at franklintempleton.com and posted on the U.S. Securities and Exchange Commission’s website at sec.gov and reflect the most recent 12-month period ended June 30.
Quarterly Statement of Investments
The Fund files a complete statement of investments with the U.S. Securities and Exchange Commission for the first and third quarters for each fiscal year on Form N-Q. Shareholders may view the filed Form N-Q by visiting the Commission’s website at sec.gov. The filed form may also be viewed and copied at the Commission’s Public Reference Room in Washington, DC. Information regarding the operations of the Public Reference Room may be obtained by calling (800) SEC-0330.
Householding of Reports and Prospectuses
You will receive the Fund’s financial reports every six months as well as an annual updated summary prospectus (prospectus available upon request). To reduce Fund expenses, we try to identify related shareholders in a household and send only one copy of the financial reports and summary prospectus. This process, called “householding,” will continue indefinitely unless you instruct us otherwise. If you prefer not to have these documents householded, please call us at (800) 632-2301.
At any time you may view current prospectuses/summary prospectuses and financial reports on our website. If you choose, you may receive these documents through electronic delivery.
40 | Annual Report
franklintempleton.com

| |
| Contents | |
| |
| Shareholder Letter | 1 |
| Annual Report | |
| Franklin India Growth Fund | 3 |
| Performance Summary | 6 |
| Your Fund’s Expenses | 10 |
| Financial Highlights and | |
| Statement of Investments | 12 |
| Financial Statements | 17 |
| Notes to Financial Statements | 20 |
| Report of Independent Registered | |
| Public Accounting Firm | 27 |
| Tax Information | 28 |
| Board Members and Officers | 29 |
| FT (Mauritius) Offshore Investments | |
| Limited | 34 |
| Shareholder Information | 47 |
| 1
Annual Report
Franklin India Growth Fund
We are pleased to bring you Franklin India Growth Fund’s annual report for the fiscal year ended October 31, 2014.
Your Fund’s Goal and Main Investments
The Fund seeks long-term capital appreciation by investing under normal market conditions at least 80% of its net assets in securities of “Indian companies,” which are defined as those organized under the laws of, with a principal office in, or for which the principal trading market for their securities is in India, that derive 50% or more of total revenue or profit from goods or services produced or sales made in India, or that have 50% or more of their assets in India.1
Performance Overview
The Fund’s Class A shares delivered a +44.68% cumulative total return for the 12 months ended October 31, 2014. In comparison, the MSCI India Index posted a +29.39% total return.2 You can find more of the Fund’s performance data in the Performance Summary beginning on page 6.
Performance data represent past performance, which does not guarantee future results. Investment return and principal value will fluctuate, and you may have a gain or loss when you sell your shares. Current performance may differ from figures shown. Please visit franklintempleton.com or call (800) 342-5236 for most recent month-end performance.
Economic and Market Overview
India’s equity markets rose in anticipation of a stable government emerging from the country’s general election in May. As election results surpassed most expectations and resulted in a strong government focused on economic growth, equity markets continued an upward trend. Improvement in India’s economic conditions, based on indicators such as gross domestic product (GDP), inflation and current account deficit
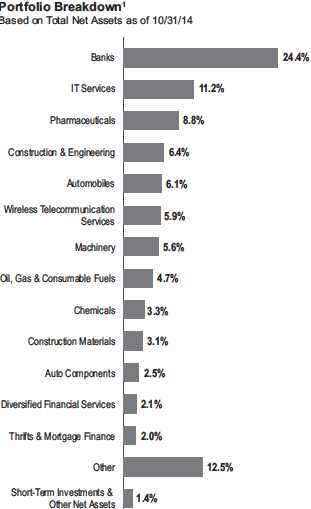
1. The Fund currently invests indirectly in Indian companies through FT (Mauritius) Offshore Investments Limited, a wholly owned, collective investment vehicle registered in
the Republic of Mauritius.
2. Source: Morningstar.
The index is unmanaged and includes reinvested dividends. One cannot invest directly in an index, and an index is not representative of the Fund’s portfolio.
The dollar value, number of shares or principal amount, and names of all portfolio holdings are listed in the Fund’s Statement of Investments (SOI).
The SOI begins on page 16.
franklintempleton.com Annual Report | 3
FRANKLIN INDIA GROWTH FUND
(CAD) also supported equity markets. Standard & Poor’s upgrade of the country’s credit outlook from negative to stable during the period, coupled with robust foreign capital inflows into India, seemed to reflect improving economic conditions. For example, foreign investors allocated $17 billion to India’s equities during the 12 months ended October 31, 2014.
What is a current account?
A current account is that part of the balance of payments where all of one country’s international transactions in goods and services are recorded.
India’s GDP in fiscal first quarter 2015 (ended June 30, 2014) grew 5.7% year-over-year, which was slightly above market expectations and higher than GDP growth of 4.6% year-over-year in the previous quarter.3 However, industrial activity was subdued, primarily as a result of weak manufacturing sector growth. India’s balance of payments remained in surplus in the first quarter of fiscal year 2015 for the third consecutive quarter resulting from robust capital flows. Even the CAD improved mainly because of restrictions on gold imports.
What is balance of payments?
Balance of payments is a record of all of a country’s exports and imports of goods and services, borrowing and lending with the rest of the world during a particular time period. It helps a country evaluate its competitive strengths and weaknesses and forecast the strength of its currency.
Also, retail and wholesale inflation moderated significantly from their earlier highs. Inflation fell in September 2014 to its lowest level since India’s government introduced a new consumer price index in January 2012 with revised weightings for various goods. The fall was helped by a drop in food inflation and also because of a higher base effect. Core inflation, excluding food and fuel, also declined and was at the lowest level since the inception of the new price index. Meanwhile, wholesale price inflation fell to a five-year low in September 2014, having benefited from a drop in food and fuel inflation.
In its September 2014 monetary policy review, the Reserve Bank of India (RBI) continued to sound cautious about its goal of 6% inflation by January 2016. The RBI stated that the balance of risks favored inflation increases, although somewhat lower than in the last policy statement. The central bank also added that “policy preparedness,” such as being ready to raise interest rates, was warranted to contain pressures if inflation risks materialized.
| | |
| Top 10 Equity Holdings1 | | |
| 10/31/14 | | |
| Company | % of Total | |
| Sector/Industry | Net Assets | |
| Infosys Ltd. | 5.6 | % |
| IT Services | | |
| Larsen & Toubro Ltd. | 5.2 | % |
| Construction & Engineering | | |
| Bharti Airtel Ltd. | 5.1 | % |
| Wireless Telecommunication Services | | |
| ICICI Bank Ltd. | 4.7 | % |
| Banks | | |
| Yes Bank Ltd. | 4.2 | % |
| Banks | | |
| Mahindra & Mahindra Ltd. | 3.4 | % |
| Automobiles | | |
| IndusInd Bank Ltd. | 3.3 | % |
| Banks | | |
| HDFC Bank Ltd. | 3.0 | % |
| Banks | | |
| State Bank of India | 3.0 | % |
| Banks | | |
| Tata Motors Ltd., ord. & A | 2.7 | % |
| Automobiles | | |
Investment Strategy
We are research-driven, fundamental investors pursuing a growth strategy. As bottom-up investors focusing primarily on individual securities, we seek to invest in companies whose current market price, in our opinion, does not reflect future growth prospects. We look for companies that have identifiable drivers of future earnings growth and that present, in our opinion, the best trade-off between potential earnings growth, business and financial risk, and valuation. Our philosophy includes favoring companies that have competitive advantages through leading-edge products, intellectual property, product positioning, unique market niches, brand identity, solid management teams, strong balance sheets, above-average or rising margins, and strong returns on capital invested in the business. In choosing equity investments, we also consider such factors as the company’s financial strength, management’s expertise, the company’s growth potential within the industry, and the industry’s growth potential.
3. Source: Central Statistics Office, India.
4 | Annual Report franklintempleton.com
FRANKLIN INDIA GROWTH FUND
Manager’s Discussion
We sought to identify companies that we thought were favorably positioned to gain from India’s growth over the medium to long term. In particular, we believed India’s demographics, increasing levels of wealth and higher infrastructure spending should be key structural drivers of economic growth, and we sought to position our portfolio with companies that we believed could derive maximum benefit from these opportunities.
During the period under review, the financials and industrials sectors were among the top contributors to absolute performance.4 Among individual holdings, Yes Bank, HDFC Bank and engineering and construction firm Larsen & Toubro were key contributors. Yes Bank, a young private sector bank started by experienced bankers, maintained a healthy asset quality profile and had strong future growth potential, in our view, as it was in an early stage of its growth phase. Private banking firm HDFC Bank was another notable contributor from the financials sector, as the bank continued to post strong earnings and maintained a healthy asset quality profile. Larsen & Toubro, in the industrials sector, fared well as cyclical stocks again gained investor interest. The company benefited from the ongoing economic recovery, a strong order book and healthy margins.
In contrast, the utilities and telecommunication services sectors hindered absolute performance.5 Some key individual detractors were electric utility National Thermal Power Corporation (NTPC), telecommunications firm Idea Cellular and cement company Grasim Industries. The Central Electricity Regulatory Commission’s new norms for tax and calculation of incentives for fiscal years 2015 through 2019 weighed on NTPC’s profitability and stock performance. Also impeding NTPC and the utilities sector was a recent Supreme Court judgment on a case involving improper grants of coal mining licenses. The court nullified nearly all mining licenses granted since 1993, and the mining firms received hefty fines for coal mined from the inception of the licenses. We sold our position in NTPC during the period. Idea Cellular underperformed along with the wider telecommunication services sector resulting from concerns about aggressive bidding at the 2G airwave auctions held in early February 2014. Competitive pressure from the entry of Reliance Jio Infocomm, which could add significant capacity to the sector, also worried investors. Grasim Industries underperformed resulting mainly from the timing of its sale from the portfolio.
Thank you for your continued participation in Franklin India Growth Fund. We look forward to serving your future investment needs.

The foregoing information reflects our analysis, opinions and portfolio holdings as of October 31, 2014, the end of the reporting period. The way we implement our main investment strategies and the resulting portfolio holdings may change depending on factors such as market and economic conditions. These opinions may not be relied upon as investment advice or an offer for a particular security. The information is not a complete analysis of every aspect of any market, country, industry, security or the Fund. Statements of fact are from sources considered reliable, but the investment manager makes no representation or warranty as to their completeness or accuracy. Although historical performance is no guarantee of future results, these insights may help you understand our investment management philosophy.
4. The financials sector comprises banks, consumer finance, diversified financial services, and thrifts and mortgage finance in the SOI. The industrials sector comprises
construction and engineering, electrical equipment, industrial conglomerates, machinery and transportation infrastructure in the SOI.
5. The utilities sector comprises gas utilities in the SOI. The telecommunications sector comprises wireless telecommunication services in the SOI.
See www.franklintempletondatasources.com for additional data provider information.
CFA® is a trademark owned by CFA Institute.
franklintempleton.com Annual Report | 5
FRANKLIN INDIA GROWTH FUND
Performance Summary as of October 31, 2014
Your dividend income will vary depending on dividends or interest paid by securities in the Fund’s portfolio, adjusted for operating expenses of each class. Capital gain distributions are net profits realized from the sale of portfolio securities. The performance table and graphs do not reflect any taxes that a shareholder would pay on Fund dividends, capital gain distributions, if any, or any realized gains on the sale of Fund shares. Total return reflects reinvestment of the Fund’s dividends and capital gain distributions, if any, and any unrealized gains or losses.
| | | | | | |
| Net Asset Value | | | | | | |
| Share Class (Symbol) | | 10/31/14 | | 10/31/13 | | Change |
| A (FINGX) | $ | 12.37 | $ | 8.55 | +$ | 3.82 |
| C (FINDX) | $ | 11.81 | $ | 8.22 | +$ | 3.59 |
| R6 (N/A) | $ | 12.63 | $ | 8.68 | +$ | 3.95 |
| Advisor (FIGZX) | $ | 12.60 | $ | 8.68 | +$ | 3.92 |
Performance1
Cumulative total return excludes sales charges. Average annual total returns and value of $10,000 investment include maximum sales charges. Class A: 5.75% maximum initial sales charge; Class C: 1% contingent deferred sales charge in first year only;
Class R6/Advisor Class: no sales charges.
| | | | | | | | | | | | | | | |
| | | | | | | | | Value of | | Average Annual | | | | | |
| | | Cumulative | | | Average Annual | | $ | 10,000 | | Total Return | | Total Annual Operating Expenses6 | |
| Share Class | | Total Return2 | | | Total Return3 | | | Investment4 | | (9/30/14 | )5 | (with waiver) | | (without waiver) | |
| A | | | | | | | | | | | | 1.68 | % | 2.26 | % |
| 1-Year | + | 44.68 | % | + | 36.38 | % | $ | 13,638 | + | 42.44 | % | | | | |
| 5-Year | + | 57.68 | % | + | 8.25 | % | $ | 14,866 | + | 6.70 | % | | | | |
| Since Inception (1/31/08) | + | 29.93 | % | + | 3.05 | % | $ | 12,246 | + | 2.20 | % | | | | |
| C | | | | | | | | | | | | 2.40 | % | 2.98 | % |
| 1-Year | + | 43.67 | % | + | 42.67 | % | $ | 14,267 | + | 49.00 | % | | | | |
| 5-Year | + | 52.13 | % | + | 8.75 | % | $ | 15,213 | + | 7.21 | % | | | | |
| Since Inception (1/31/08) | + | 23.83 | % | + | 3.22 | % | $ | 12,383 | + | 2.39 | % | | | | |
| R6 | | | | | | | | | | | | 1.20 | % | 1.78 | % |
| 1-Year | + | 45.51 | % | + | 45.51 | % | $ | 14,551 | + | 51.97 | % | | | | |
| Since Inception (5/1/13) | + | 35.08 | % | + | 22.17 | % | $ | 13,508 | + | 18.77 | % | | | | |
| Advisor | | | | | | | | | | | | 1.40 | % | 1.98 | % |
| 1-Year | + | 45.16 | % | + | 45.16 | % | $ | 14,516 | + | 51.66 | % | | | | |
| 5-Year | + | 59.87 | % | + | 9.84 | % | $ | 15,987 | + | 8.28 | % | | | | |
| Since Inception (1/31/08) | + | 32.40 | % | + | 4.25 | % | $ | 13,240 | + | 3.41 | % | | | | |
Performance data represent past performance, which does not guarantee future results. Investment return and principal value will fluctuate, and you may have a gain or loss when you sell your shares. Current performance may differ from figures shown. For most recent month-end performance, go to franklintempleton.com or call (800) 342-5236.
6 | Annual Report franklintempleton.com
FRANKLIN INDIA GROWTH FUND
PERFORMANCE SUMMARY
Total Return Index Comparison for a Hypothetical $10,000 Investment1
Total return represents the change in value of an investment over the periods shown. It includes any applicable maximum sales charge, Fund expenses, account fees and reinvested distributions. The unmanaged index includes reinvestment of any income or distributions. It differs from the Fund in composition and does not pay management fees or expenses. One cannot invest directly in an index.

franklintempleton.com Annual Report | 7
FRANKLIN INDIA GROWTH FUND
PERFORMANCE SUMMARY
Total Return Index Comparison for a Hypothetical $10,000 Investment1 (continued)

8 | Annual Report franklintempleton.com
FRANKLIN INDIA GROWTH FUND
PERFORMANCE SUMMARY
All investments involve risks, including possible loss of principal. Special risks are associated with foreign investing, including currency fluctuations, economic instability and political developments. Investments in developing markets involve heightened risks related to the same factors, in addition to risks associated with these companies’ smaller size, lesser liquidity and the potential lack of established legal, political, business and social frameworks to support securities markets in the countries in which they operate. The Fund may also experience greater volatility than a fund that is more broadly diversified geographically. The Fund is designed for the aggressive portion of a well-diversified portfolio. The Fund is actively managed but there is no guarantee that the manager’s investment decisions will produce the desired results. The Fund’s prospectus also includes a description of the main investment risks.
| |
| Class C: | These shares have higher annual fees and expenses than Class A shares. |
| Class R6: | Shares are available to certain eligible investors as described in the prospectus. |
| Advisor Class: | Shares are available to certain eligible investors as described in the prospectus. |
1. The Fund has an expense reduction contractually guaranteed through at least 2/28/15 and a fee waiver associated with its investments in a Franklin Templeton money
fund, contractually guaranteed through at least it current fiscal year-end. Fund investment results reflect the expense reduction, to the extent applicable; without these
reductions, the results would have been lower.
2. Cumulative total return represents the change in value of an investment over the periods indicated.
3. Average annual total return represents the average annual change in value of an investment over the periods indicated.
4. These figures represent the value of a hypothetical $10,000 investment in the Fund over the periods indicated.
5. In accordance with SEC rules, we provide standardized average annual total return information through the latest calendar quarter.
6. Figures are as stated in the Fund’s current prospectus. In periods of market volatility, assets may decline significantly, causing total annual Fund operating expenses to
become higher than the figures shown.
7. Source: Morningstar. The MSCI India Index is a free float-adjusted, market capitalization-weighted index designed to measure equity market performance in India.
See www.franklintempletondatasources.com for additional data provider information.
franklintempleton.com Annual Report | 9
FRANKLIN INDIA GROWTH FUND
Your Fund’s Expenses
As a Fund shareholder, you can incur two types of costs:
- Transaction costs, including sales charges (loads) on Fund purchases; and
- Ongoing Fund costs, including management fees, distribution and service (12b-1) fees, and other Fund expenses. All mutual funds have ongoing costs, sometimes referred to as operating expenses.
The following table shows ongoing costs of investing in the Fund and can help you understand these costs and compare them with those of other mutual funds. The table assumes a $1,000 investment held for the six months indicated.
Actual Fund Expenses
The first line (Actual) for each share class listed in the table provides actual account values and expenses. The “Ending Account Value” is derived from the Fund’s actual return, which includes the effect of Fund expenses.
You can estimate the expenses you paid during the period by following these steps. Of course, your account value and expenses will differ from those in this illustration:
| 1 | Divide your account value by $1,000. |
| | If an account had an $8,600 value, then $8,600 ÷ $1,000 = 8.6. |
| 2. | Multiply the result by the number under the heading “Expenses Paid During Period.” |
| | If Expenses Paid During Period were $7.50, then 8.6 x $7.50 = $64.50. |
In this illustration, the estimated expenses paid this period are $64.50.
Hypothetical Example for Comparison with Other Funds
Information in the second line (Hypothetical) for each class in the table can help you compare ongoing costs of investing in the Fund with those of other mutual funds. This information may not be used to estimate the actual ending account balance or expenses you paid during the period. The hypothetical “Ending Account Value” is based on the actual expense ratio for each class and an assumed 5% annual rate of return before expenses, which does not represent the Fund’s actual return. The figure under the heading “Expenses Paid During Period” shows the hypothetical expenses your account would have incurred under this scenario. You can compare this figure with the 5% hypothetical examples that appear in shareholder reports of other funds.
Please note that expenses shown in the table are meant to highlight ongoing costs and do not reflect any transaction costs, such as sales charges. Therefore, the second line for each class is useful in comparing ongoing costs only, and will not help you compare total costs of owning different funds. In addition, if transaction costs were included, your total costs would have been higher. Please refer to the Fund prospectus for additional information on operating expenses.
10 | Annual Report
franklintempleton.com
FRANKLIN INDIA GROWTH FUND
YOUR FUND’S EXPENSES
| | | | | | |
| | | Beginning Account | | Ending Account | | Expenses Paid During |
| Share Class | | Value 5/1/14 | | Value 10/31/14 | | Period* 5/1/14–10/31/14 |
| A | | | | | | |
| Actual | $ | 1,000 | $ | 1,446.80 | $ | 9.99 |
| Hypothetical (5% return before expenses) | $ | 1,000 | $ | 1,017.04 | $ | 8.24 |
| C | | | | | | |
| Actual | $ | 1,000 | $ | 1,436.70 | $ | 14.25 |
| Hypothetical (5% return before expenses) | $ | 1,000 | $ | 1,013.51 | $ | 11.77 |
| R6 | | | | | | |
| Actual | $ | 1,000 | $ | 1,455.10 | $ | 7.43 |
| Hypothetical (5% return before expenses) | $ | 1,000 | $ | 1,019.16 | $ | 6.11 |
| Advisor | | | | | | |
| Actual | $ | 1,000 | $ | 1,451.60 | $ | 8.16 |
| Hypothetical (5% return before expenses) | $ | 1,000 | $ | 1,018.55 | $ | 6.72 |
*Expenses are calculated using the most recent six-month expense ratio, net of expense waivers, annualized for each class (A: 1.62%;
C: 2.32%; R6: 1.20%; and Advisor: 1.32%), multiplied by the average account value over the period, multiplied by 184/365 to reflect the
one-half year period.
franklintempleton.com Annual Report | 11
| | | | | | | | | | | | | | | |
| FRANKLIN TEMPLETON INTERNATIONAL TRUST | | | | | | | | | | | | | | | |
| |
| |
| Financial Highlights | | | | | | | | | | | | | | | |
| Franklin India Growth Fund | | | | | | | | | | | | | | | |
| | | | | | Year Ended October 31, | | | | |
| | | 2014 | | | 2013 | | | 2012 | | | 2011 | | | 2010 | |
| Class A | | | | | | | | | | | | | | | |
| Per share operating performancea | | | | | | | | | | | | | | | |
| (for a share outstanding throughout the year) | | | | | | | | | | | | | | | |
| Net asset value, beginning of year | $ | 8.55 | | $ | 8.73 | | $ | 9.45 | | $ | 11.34 | | $ | 8.24 | |
| Income from investment operationsb: | | | | | | | | | | | | | | | |
| Net investment income (loss)c | | 0.02 | d | | (0.01 | ) | | (0.04 | ) | | (0.06 | ) | | (0.03 | ) |
| Net realized and unrealized gains (losses) | | 3.80 | | | (0.17 | ) | | (0.55 | ) | | (1.56 | ) | | 3.19 | |
| Total from investment operations | | 3.82 | | | (0.18 | ) | | (0.59 | ) | | (1.62 | ) | | 3.16 | |
| Less distributions from: | | | | | | | | | | | | | | | |
| Net investment income | | — | | | — | | | — | | | — | | | (0.04 | ) |
| Net realized gains | | — | | | — | | | (0.13 | ) | | (0.27 | ) | | (0.02 | ) |
| Total distributions | | — | | | — | | | (0.13 | ) | | (0.27 | ) | | (0.06 | ) |
| Net asset value, end of year | $ | 12.37 | | $ | 8.55 | | $ | 8.73 | | $ | 9.45 | | $ | 11.34 | |
| |
| Total returne | | 44.68 | % | | (2.06 | )% | | (6.02 | )% | | (14.53 | )% | | 38.54 | % |
| |
| Ratios to average net assetsa | | | | | | | | | | | | | | | |
| Expenses before waiver and payments by affiliates | | 2.25 | % | | 2.26 | % | | 2.21 | % | | 2.25 | % | | 2.27 | % |
| Expenses net of waiver and payments by affiliates | | 1.65 | % | | 1.68 | % | | 1.68 | % | | 1.70 | % | | 1.70 | % |
| Net investment income (loss) | | 0.22 | %d | | (0.07 | )% | | (0.43 | )% | | (0.62 | )% | | (0.31 | )% |
| |
| Supplemental data | | | | | | | | | | | | | | | |
| Net assets, end of year (000’s) | $ | 53,230 | | $ | 25,025 | | $ | 31,555 | | $ | 38,079 | | $ | 37,392 | |
| Portfolio turnover ratef | | 35.48 | % | | 16.95 | % | | 41.30 | % | | 39.07 | % | | 83.21 | % |
aThe per share amounts and ratios include income and expenses of the Portfolio.
bThe amount shown for a share outstanding throughout the period may not correlate with the Statement of Operations for the period due to the timing of sales and
repurchases of the Fund shares in relation to income earned and/or fluctuating fair value of the investments of the Fund.
cBased on average daily shares outstanding.
dNet investment income per share includes approximately $0.02 per share received in the form of special dividends. Excluding these amounts, the ratio of net investment
income to average net assets would have been 0.04%.
eTotal return does not reflect sales commissions or contingent deferred sales charges, if applicable.
fIncludes the Portfolio’s rate of turnover.
12 | Annual Report | The accompanying notes are an integral part of these financial statements. franklintempleton.com
FRANKLIN TEMPLETON INTERNATIONAL TRUST
FINANCIAL HIGHLIGHTS
| | | | | | | | | | | | | | | |
| Franklin India Growth Fund (continued) | | | | | | | | | | | | | | | |
| | | | | | Year Ended October 31, | | | | |
| | | 2014 | | | 2013 | | | 2012 | | | 2011 | | | 2010 | |
| Class C | | | | | | | | | | | | | | | |
| Per share operating performancea | | | | | | | | | | | | | | | |
| (for a share outstanding throughout the year) | | | | | | | | | | | | | | | |
| Net asset value, beginning of year | $ | 8.22 | | $ | 8.45 | | $ | 9.22 | | $ | 11.15 | | $ | 8.14 | |
| Income from investment operationsb: | | | | | | | | | | | | | | | |
| Net investment income (loss)c | | (0.05 | )d | | (0.07 | ) | | (0.09 | ) | | (0.13 | ) | | (0.09 | ) |
| Net realized and unrealized gains (losses) | | 3.64 | | | (0.16 | ) | | (0.55 | ) | | (1.53 | ) | | 3.14 | |
| Total from investment operations | | 3.59 | | | (0.23 | ) | | (0.64 | ) | | (1.66 | ) | | 3.05 | |
| Less distributions from: | | | | | | | | | | | | | | | |
| Net investment income | | — | | | — | | | — | | | — | | | (0.02 | ) |
| Net realized gains | | — | | | — | | | (0.13 | ) | | (0.27 | ) | | (0.02 | ) |
| Total distributions | | — | | | — | | | (0.13 | ) | | (0.27 | ) | | (0.04 | ) |
| Net asset value, end of year | $ | 11.81 | | $ | 8.22 | | $ | 8.45 | | $ | 9.22 | | $ | 11.15 | |
| |
| Total returne | | 43.67 | % | | (2.72 | )% | | (6.71 | )% | | (15.06 | )% | | 37.53 | % |
| |
| Ratios to average net assetsa | | | | | | | | | | | | | | | |
| Expenses before waiver and payments by affiliates | | 2.95 | % | | 2.98 | % | | 2.93 | % | | 2.95 | % | | 2.97 | % |
| Expenses net of waiver and payments by affiliates | | 2.35 | % | | 2.40 | % | | 2.40 | % | | 2.40 | % | | 2.40 | % |
| Net investment income (loss) | | (0.48 | )%d | | (0.79 | )% | | (1.15 | )% | | (1.32 | )% | | (1.01 | )% |
| |
| Supplemental data | | | | | | | | | | | | | | | |
| Net assets, end of year (000’s) | $ | 11,655 | | $ | 6,078 | | $ | 9,201 | | $ | 11,192 | | $ | 10,878 | |
| Portfolio turnover ratef | | 35.48 | % | | 16.95 | % | | 41.30 | % | | 39.07 | % | | 83.21 | % |
aThe per share amounts and ratios include income and expenses of the Portfolio.
bThe amount shown for a share outstanding throughout the period may not correlate with the Statement of Operations for the period due to the timing of sales and
repurchases of the Fund shares in relation to income earned and/or fluctuating fair value of the investments of the Fund.
cBased on average daily shares outstanding.
dNet investment income per share includes approximately $0.02 per share received in the form of special dividends. Excluding these amounts, the ratio of net investment
income (loss) to average net assets would have been (0.66)%.
eTotal return does not reflect sales commissions or contingent deferred sales charges, if applicable.
fIncludes the Portfolio’s rate of turnover.
franklintempleton.com The accompanying notes are an integral part of these financial statements. | Annual Report | 13
FRANKLIN TEMPLETON INTERNATIONAL TRUST
FINANCIAL HIGHLIGHTS
| | | | | | |
| Franklin India Growth Fund (continued) | | | | | | |
| | | Year Ended | |
| | | October 31, | |
| | | 2014 | | | 2013 | a |
| Class R6 | | | | | | |
| Per share operating performanceb | | | | | | |
| (for a share outstanding throughout the year) | | | | | | |
| Net asset value, beginning of year | $ | 8.68 | | $ | 9.35 | |
| Income from investment operationsc: | | | | | | |
| Net investment incomed | | 0.07 | e | | 0.02 | |
| Net realized and unrealized gains (losses) | | 3.88 | | | (0.69 | ) |
| Total from investment operations | | 3.95 | | | (0.67 | ) |
| Net asset value, end of year | $ | 12.63 | | $ | 8.68 | |
| |
| Total returnf | | 45.51 | % | | (7.17 | )% |
| |
| Ratios to average net assetsb,g | | | | | | |
| Expenses before waiver and payments by affiliates | | 1.80 | % | | 1.78 | % |
| Expenses net of waiver and payments by affiliates | | 1.20 | % | | 1.20 | % |
| Net investment income | | 0.67 | %e | | 0.41 | % |
| |
| Supplemental data | | | | | | |
| Net assets, end of year (000’s) | $ | 740 | | $ | 459 | |
| Portfolio turnover rateh | | 35.48 | % | | 16.95 | % |
aFor the period May 1, 2013 (effective date) to October 31, 2013.
bThe per share amounts and ratios include income and expenses of the Portfolio.
cThe amount shown for a share outstanding throughout the period may not correlate with the Statement of Operations for the period due to the timing of sales and
repurchases of the Fund shares in relation to income earned and/or fluctuating fair value of the investments of the Fund.
dBased on average daily shares outstanding.
eNet investment income per share includes approximately $0.02 per share received in the form of special dividends. Excluding these amounts, the ratio of net investment
income to average net assets would have been 0.49%.
fTotal return is not annualized for periods less than one year.
gRatios are annualized for periods less than one year.
hIncludes the Portfolio’s rate of turnover.
14 | Annual Report | The accompanying notes are an integral part of these financial statements. franklintempleton.com
FRANKLIN TEMPLETON INTERNATIONAL TRUST
FINANCIAL HIGHLIGHTS
| | | | | | | | | | | | | | | |
| Franklin India Growth Fund (continued) | | | | | | | | | | | | | | | |
| | | | | | Year Ended October 31, | | | | |
| | | 2014 | | | 2013 | | | 2012 | | | 2011 | | | 2010 | |
| Advisor Class | | | | | | | | | | | | | | | |
| Per share operating performancea | | | | | | | | | | | | | | | |
| (for a share outstanding throughout the year) | | | | | | | | | | | | | | | |
| Net asset value, beginning of year | $ | 8.68 | | $ | 8.83 | | $ | 9.54 | | $ | 11.41 | | $ | 8.28 | |
| Income from investment operationsb: | | | | | | | | | | | | | | | |
| Net investment income (loss)c | | 0.05 | d | | 0.02 | | | (0.01 | ) | | (0.03 | ) | | —e | |
| Net realized and unrealized gains (losses) | | 3.87 | | | (0.17 | ) | | (0.57 | ) | | (1.57 | ) | | 3.20 | |
| Total from investment operations | | 3.92 | | | (0.15 | ) | | (0.58 | ) | | (1.60 | ) | | 3.20 | |
| Less distributions from: | | | | | | | | | | | | | | | |
| Net investment income | | — | | | — | | | — | | | — | | | (0.05 | ) |
| Net realized gains | | — | | | — | | | (0.13 | ) | | (0.27 | ) | | (0.02 | ) |
| Total distributions | | — | | | — | | | (0.13 | ) | | (0.27 | ) | | (0.07 | ) |
| Net asset value, end of year | $ | 12.60 | | $ | 8.68 | | $ | 8.83 | | $ | 9.54 | | $ | 11.41 | |
| |
| Total return | | 45.16 | % | | (1.70 | )% | | (5.75 | )% | | (14.26 | )% | | 38.91 | % |
| |
| Ratios to average net assetsa | | | | | | | | | | | | | | | |
| Expenses before waiver and payments by affiliates | | 1.95 | % | | 1.98 | % | | 1.93 | % | | 1.95 | % | | 1.97 | % |
| Expenses net of waiver and payments by affiliates | | 1.35 | % | | 1.40 | % | | 1.40 | % | | 1.40 | % | | 1.40 | % |
| Net investment income (loss) | | 0.52 | %d | | 0.21 | % | | (0.15 | )% | | (0.32 | )% | | (0.01 | )% |
| |
| Supplemental data | | | | | | | | | | | | | | | |
| Net assets, end of year (000’s) | $ | 41,740 | | $ | 28,340 | | $ | 30,642 | | $ | 42,915 | | $ | 40,493 | |
| Portfolio turnover ratef | | 35.48 | % | | 16.95 | % | | 41.30 | % | | 39.07 | % | | 83.21 | % |
aThe per share amounts and ratios include income and expenses of the Portfolio.
bThe amount shown for a share outstanding throughout the period may not correlate with the Statement of Operations for the period due to the timing of sales and
repurchases of the Fund shares in relation to income earned and/or fluctuating fair value of the investments of the Fund.
cBased on average daily shares outstanding.
dNet investment income per share includes approximately $0.02 per share received in the form of special dividends. Excluding these amounts, the ratio of net investment
income to average net assets would have been 0.34%.
eAmount rounds to less than $0.01 per share.
fIncludes the Portfolio’s rate of turnover.
franklintempleton.com The accompanying notes are an integral part of these financial statements. | Annual Report | 15
| | | |
| FRANKLIN TEMPLETON INTERNATIONAL TRUST | | | |
| |
| |
| |
| Statement of Investments, October 31, 2014 | | | |
| Franklin India Growth Fund | | | |
| | Shares | | Value |
| Common Stocks (Cost $1,505,544) 1.8% | | | |
| IT Services 1.8% | | | |
| aCognizant Technology Solutions Corp., A (United States) | 40,000 | $ | 1,954,000 |
| Mutual Funds (Cost $71,127,220) 98.1% | | | |
| Diversified Financial Services 98.1% | | | |
| aFT (Mauritius) Offshore Investments Ltd. (India) | 7,800,201 | | 105,258,225 |
| Total Investments (Cost $72,632,764) 99.9% | | | 107,212,225 |
| Other Assets, less Liabilities 0.1% | | | 152,326 |
| Net Assets 100.0% | | $ | 107,364,551 |
aNon-income producing.
16 | Annual Report | The accompanying notes are an integral part of these financial statements. franklintempleton.com
FRANKLIN TEMPLETON INTERNATIONAL TRUST
Financial Statements
| | | |
| Statement of Assets and Liabilities | | | |
| October 31, 2014 | | | |
| |
| Franklin India Growth Fund | | | |
| |
| Assets: | | | |
| Investments in securities: | | | |
| Cost | $ | 1,505,544 | |
| Value | $ | 1,954,000 | |
| Investment in FT (Mauritius) Offshore Investments Limited (Note 1) | | 105,258,225 | |
| Total value of investments | $ | 107,212,225 | |
| Receivables: | | | |
| Investment securities sold | | 2,584,742 | |
| Capital shares sold | | 716,373 | |
| Affiliates | | 16,502 | |
| Other assets | | 12 | |
| Total assets | | 110,529,854 | |
| Liabilities: | | | |
| Payables: | | | |
| Investment securities purchased | | 294,994 | |
| Capital shares redeemed | | 265,203 | |
| Distribution fees | | 23,088 | |
| Transfer agent fees | | 16,896 | |
| Funds advanced by custodian | | 2,534,742 | |
| Accrued expenses and other liabilities | | 30,380 | |
| Total liabilities | | 3,165,303 | |
| Net assets, at value | $ | 107,364,551 | |
| Net assets consist of: | | | |
| Paid-in capital | $ | 85,307,697 | |
| Undistributed net investment income | | 159,830 | |
| Net unrealized appreciation (depreciation) | | 31,907,041 | |
| Accumulated net realized gain (loss) | | (10,010,017 | ) |
| Net assets, at value | $ | 107,364,551 | |
| Class A: | | | |
| Net assets, at value | $ | 53,230,010 | |
| Shares outstanding | | 4,302,360 | |
| Net asset value per sharea | $ | 12.37 | |
| Maximum offering price per share (net asset value per share ÷ 94.25%) | $ | 13.12 | |
| Class C: | | | |
| Net assets, at value | $ | 11,654,641 | |
| Shares outstanding | | 986,507 | |
| Net asset value and maximum offering price per sharea | $ | 11.81 | |
| Class R6: | | | |
| Net assets, at value | $ | 740,391 | |
| Shares outstanding | | 58,620 | |
| Net asset value and maximum offering price per share | $ | 12.63 | |
| Advisor Class: | | | |
| Net assets, at value | $ | 41,739,509 | |
| Shares outstanding | | 3,312,908 | |
| Net asset value and maximum offering price per share | $ | 12.60 | |
aRedemption price is equal to net asset value less contingent deferred sales charges, if applicable.
franklintempleton.com The accompanying notes are an integral part of these financial statements. | Annual Report | 17
FRANKLIN TEMPLETON INTERNATIONAL TRUST
FINANCIAL STATEMENTS
Statement of Operations
for the year ended October 31, 2014
| | | |
| Franklin India Growth Fund | | | |
| |
| Net investment income allocated from FT (Mauritius) Offshore Investments Limited: | | | |
| Dividends | $ | 1,387,356 | |
| Expenses | | (810,844 | ) |
| Net investment income allocated from FT (Mauritius) Offshore Investments Limited | | 576,512 | |
| Expenses: | | | |
| Management fees (Note 3a) | $ | 311,385 | |
| Distribution fees: (Note 3c) | | | |
| Class A | | 99,257 | |
| Class C | | 73,266 | |
| Transfer agent fees: (Note 3e) | | | |
| Class A | | 52,602 | |
| Class C | | 11,752 | |
| Class R6 | | 62 | |
| Advisor Class | | 54,218 | |
| Custodian fees (Note 4) | | 1,470 | |
| Reports to shareholders | | 30,133 | |
| Registration and filing fees | | 46,204 | |
| Professional fees | | 114,494 | |
| Trustees’ fees and expenses | | 2,626 | |
| Other | | 9,649 | |
| Total expenses | | 807,118 | |
| Expenses waived/paid by affiliates (Note 3f) | | (443,302 | ) |
| Net expenses | | 363,816 | |
| Net investment income | | 212,696 | |
| Realized and unrealized gains (losses) on investments allocated from FT (Mauritius) Offshore Investments Limited: | | | |
| Net realized gain (loss) from: | | | |
| Investments | | 885,973 | |
| Foreign currency transactions | | (75,312 | ) |
| Net realized gain (loss) | | 810,661 | |
| Net change in unrealized appreciation (depreciation) on: | | | |
| Investmentsa | | 26,552,489 | |
| Translation of assets and liabilities denominated in foreign currencies | | 25,408 | |
| Net change in unrealized appreciation (depreciation) | | 26,577,897 | |
| Net realized and unrealized gain (loss) | | 27,388,558 | |
| Net increase (decrease) in net assets resulting from operations | $ | 27,601,254 | |
aIncludes $215,400 of change in unrealized appreciation on other investments held by Franklin India Growth Fund.
18 | Annual Report | The accompanying notes are an integral part of these financial statements. franklintempleton.com
| | | | | |
| | | FRANKLIN TEMPLETON INTERNATIONAL TRUST | |
| | | FINANCIAL STATEMENTS | |
| |
| |
| Statements of Changes in Net Assets | | | | | |
| |
| |
| Franklin India Growth Fund | | | | | |
| |
| | | Year Ended October 31, | |
| | | 2014 | | 2013 | |
| Increase (decrease) in net assets: | | | | | |
| Operations: | | | | | |
| Net investment income (loss) | $ | 212,696 | $ | (13,408 | ) |
| Net realized gain (loss) from investments and foreign currency transactions | | 810,661 | | (1,840,007 | ) |
| Net change in unrealized appreciation (depreciation) on investments and translation of other assets and | | | |
| liabilities denominated in foreign currencies | | 26,577,897 | | (349,796 | ) |
| Net increase (decrease) in net assets resulting from operations | | 27,601,254 | | (2,203,211 | ) |
| Capital share transactions: (Note 2) | | | | | |
| Class A | | 16,016,138 | | (5,863,006 | ) |
| Class C | | 2,892,628 | | (2,839,742 | ) |
| Class R6 | | 69,697 | | 484,286 | |
| Advisor Class | | 883,366 | | (1,074,575 | ) |
| Total capital share transactions | | 19,861,829 | | (9,293,037 | ) |
| Net increase (decrease) in net assets | | 47,463,083 | | (11,496,248 | ) |
| Net assets: | | | | | |
| Beginning of year | | 59,901,468 | | 71,397,716 | |
| End of year | $ | 107,364,551 | $ | 59,901,468 | |
| Undistributed net investment income (loss) included in net assets: | | | | | |
| End of year | $ | 159,830 | $ | (196,552 | ) |
franklintempleton.com The accompanying notes are an integral part of these financial statements. | Annual Report | 19
FRANKLIN TEMPLETON INTERNATIONAL TRUST
Notes to Financial Statements
Franklin India Growth Fund
1. Organization and Significant Accounting Policies
Franklin Templeton International Trust (Trust) is registered under the Investment Company Act of 1940, as amended, (1940 Act) as an open-end management investment company, consisting of four separate funds. Franklin India Growth Fund (Fund) is included in this report. The financial statements of the remaining funds in the Trust are presented separately. The Fund offers four classes of shares: Class A, Class C, Class R6, and Advisor Class. Each class of shares differs by its initial sales load, contingent deferred sales charges, voting rights on matters affecting a single class, its exchange privilege and fees primarily due to differing arrangements for distribution and transfer agent fees.
The Fund operates using a “master fund/feeder fund” structure and primarily invests indirectly in the securities of Indian companies through FT (Mauritius) Offshore Investments Limited (Portfolio), an entity registered with and regulated by the Mauritius Financial Services Commission, which shares the same investment objective as the Fund. The accounting policies of the Portfolio, including the Portfolio’s security valuation policies, will directly affect the recorded value of the Fund’s investment in the Portfolio. The financial statements of the Portfolio, including the Statement of Investments, are included elsewhere in this report and should be read in conjunction with the Fund’s financial statements. At October 31, 2014, the Fund owned 100% of the outstanding shares of the Portfolio.
The following summarizes the Fund’s significant accounting policies.
a. Financial Instrument Valuation
The Fund’s investments in financial instruments are carried at fair value daily. Fair value is the price that would be received to sell an asset or paid to transfer a liability in an orderly transaction between market participants on the measurement date. The Fund calculates the net asset value (NAV) per share at the close of the New York Stock Exchange (NYSE), generally at 4 p.m. Eastern time (NYSE close) on each day the NYSE is open for trading. Under compliance policies and procedures approved by the Fund’s Board of Trustees (the Board), the Fund’s administrator has responsibility for oversight of valuation, including leading the cross-functional Valuation and
Liquidity Oversight Committee (VLOC). The VLOC provides administration and oversight of the Fund’s valuation policies and procedures, which are approved annually by the Board. Among other things, these procedures allow the Fund to utilize independent pricing services, quotations from securities and financial instrument dealers, and other market sources to determine fair value.
Equity securities listed on an exchange or on the NASDAQ National Market System are valued at the last quoted sale price or the official closing price of the day, respectively. Over-the-counter (OTC) securities are valued within the range of the most recent quoted bid and ask prices. Securities that trade in multiple markets or on multiple exchanges are valued according to the broadest and most representative market. Certain equity securities are valued based upon fundamental characteristics or relationships to similar securities.
The Fund has procedures to determine the fair value of financial instruments for which market prices are not reliable or readily available. Under these procedures, the VLOC convenes on a regular basis to review such financial instruments and considers a number of factors, including significant unobservable valuation inputs, when arriving at fair value. The VLOC primarily employs a market-based approach which may use related or comparable assets or liabilities, recent transactions, market multiples, book values, and other relevant information for the investment to determine the fair value of the investment. An income-based valuation approach may also be used in which the anticipated future cash flows of the investment are discounted to calculate fair value. Discounts may also be applied due to the nature or duration of any restrictions on the disposition of the investments. Due to the inherent uncertainty of valuations of such investments, the fair values may differ significantly from the values that would have been used had an active market existed. The VLOC employs various methods for calibrating these valuation approaches including a regular review of key inputs and assumptions, transactional back-testing or disposition analysis, and reviews of any related market activity.
The Fund’s investment in the Portfolio shares is valued at the Portfolio’s net asset value per share. Valuation of securities by the Portfolio is discussed in Note 1(a) of the Portfolio’s Notes to Financial Statements, which are included elsewhere in this report.
20 | Annual Report
franklintempleton.com
FRANKLIN TEMPLETON INTERNATIONAL TRUST
NOTES TO FINANCIAL STATEMENTS
Franklin India Growth Fund (continued)
b. Income Taxes
It is the Fund’s policy to qualify as a regulated investment company under the Internal Revenue Code. The Fund intends to distribute to shareholders substantially all of its taxable income and net realized gains to relieve it from federal income and excise taxes. As a result, no provision for U.S. federal income taxes is required.
The Fund recognizes the tax benefits of uncertain tax positions only when the position is “more likely than not” to be sustained upon examination by the tax authorities based on the technical merits of the tax position. As of October 31, 2014, and for all open tax years, the Fund has determined that no liability for unrecognized tax benefits is required in the Fund’s financial statements related to uncertain tax positions taken on a tax return (or expected to be taken on future tax returns). Open tax years are those that remain subject to examination and are based on each tax jurisdiction statute of limitation.
The Fund’s investment in the Portfolio may be subject to income and withholding taxes in Mauritius and/or India which are discussed in Note 1(c) of the Portfolio’s Notes to Financial Statements.
c. Security Transactions, Investment Income, Expenses and Distributions
Security transactions, including investments in the Portfolio, are accounted for on trade date. Realized gains and losses on security transactions are determined on a specific identification basis. Estimated expenses are accrued daily. Dividend income is recorded on the ex-dividend date. Distributions to shareholders are recorded on the ex-dividend date and are determined according to income tax regulations (tax basis). Distributable earnings determined on a tax basis may differ from earnings recorded in accordance with accounting principles generally accepted in the United States of America. These differences may be permanent or temporary. Permanent differences are reclassified among capital accounts to reflect their tax character. These reclassifications have no impact on net assets or the results of operations. Temporary differences are not reclassified, as they may reverse in subsequent periods.
Common expenses incurred by the Trust are allocated among the funds based on the ratio of net assets of each fund to the combined net assets of the Trust. Fund specific expenses are charged directly to the fund that incurred the expense.
Realized and unrealized gains and losses and net investment income, not including class specific expenses, are allocated daily to each class of shares based upon the relative proportion of net assets of each class. Differences in per share distributions, by class, are generally due to differences in class specific expenses.
The Fund records its proportionate share of the Portfolio’s income, expenses and realized and unrealized gains and losses daily. In addition, the Fund accrues its own expenses.
d. Accounting Estimates
The preparation of financial statements in accordance with accounting principles generally accepted in the United States of America requires management to make estimates and assumptions that affect the reported amounts of assets and liabilities at the date of the financial statements and the amounts of income and expenses during the reporting period. Actual results could differ from those estimates.
e. Guarantees and Indemnifications
Under the Trust’s organizational documents, its officers and directors are indemnified by the Trust against certain liabilities arising out of the performance of their duties to the Trust. Additionally, in the normal course of business, the Trust, on behalf of the Fund, enters into contracts with service providers that contain general indemnification clauses. The Trust’s maximum exposure under these arrangements is unknown as this would involve future claims that may be made against the Trust that have not yet occurred. Currently, the Trust expects the risk of loss to be remote.
franklintempleton.com
Annual Report
| 21
FRANKLIN TEMPLETON INTERNATIONAL TRUST
NOTES TO FINANCIAL STATEMENTS
Franklin India Growth Fund (continued)
2. Shares of Beneficial Interest
At October 31, 2014, there were an unlimited number of shares authorized (without par value). Transactions in the Fund’s shares were as follows:
| | | | | | | | | | | |
| | | | | | Year Ended October 31, | | | | |
| | 2014 | | | | | | 2013 | |
| | Shares | | | | Amount | | Shares | | | Amount | |
| Class A Shares: | | | | | | | | | | | |
| Shares sold | 3,184,828 | | $ | 34,355,838 | | 950,756 | | $ | 8,160,865 | |
| Shares redeemed | (1,809,371 | ) | | (18,339,700 | ) | (1,638,554 | ) | | (14,023,871 | ) |
| Net increase (decrease) | 1,375,457 | | $ | 16,016,138 | | (687,798 | ) | $ | (5,863,006 | ) |
| Class C Shares: | | | | | | | | | | | |
| Shares sold | 722,501 | | | $ | 7,157,582 | | 270,061 | | $ | 2,210,327 | |
| Shares redeemed | (475,292 | ) | | | (4,264,954 | ) | (619,059 | ) | | (5,050,069 | ) |
| Net increase (decrease) | 247,209 | | | $ | 2,892,628 | | (348,998 | ) | $ | (2,839,742 | ) |
| Class R6 Sharesa: | | | | | | | | | | | |
| Shares soldb | 16,874 | | | $ | 196,249 | | 53,411 | | $ | 488,400 | |
| Shares redeemed | (11,130 | ) | | | (126,552 | ) | (535 | ) | | (4,114 | ) |
| Net increase (decrease) | 5,744 | | | $ | 69,697 | | 52,876 | | $ | 484,286 | |
| Advisor Class Shares: | | | | | | | | | | | |
| Shares sold | 1,484,046 | | $ | 16,405,842 | | 830,148 | | $ | 7,447,876 | |
| Shares redeemedb | (1,437,411 | ) | | (15,522,476 | ) | (1,032,537 | ) | | (8,522,451 | ) |
| Net increase (decrease) | 46,635 | | | $ | 883,366 | | (202,389 | ) | $ | (1,074,575 | ) |
aFor the period May 1, 2013 (effective date) to October 31, 2013.
bEffective May 1, 2013, a portion of Advisor Class shares were exchanged into Class R6.
3. Transactions with Affiliates
Franklin Resources, Inc. is the holding company for various subsidiaries that together are referred to as Franklin Templeton Investments. Certain officers and trustees of the Trust are also officers, and/or directors of the Portfolio and of the following subsidiaries:
| |
| Subsidiary | Affiliation |
| Franklin Advisers, Inc. (Advisers) | Investment manager |
| Franklin Templeton Asset Management (India) Private Limited (FT India) | Investment manager |
| Templeton Asset Management Ltd. (TAML) | Investment manager |
| Franklin Templeton Services, LLC (FT Services) | Administrative manager |
| Franklin Templeton Distributors, Inc. (Distributors) | Principal underwriter |
| Franklin Templeton Investor Services, LLC (Investor Services) | Transfer agent |
22 | Annual Report franklintempleton.com
FRANKLIN TEMPLETON INTERNATIONAL TRUST
NOTES TO FINANCIAL STATEMENTS
Franklin India Growth Fund (continued)
a. Management Fees
The Fund pays an investment management fee to Advisers. The total management fee is paid based on the average daily net assets of the Fund as follows:
| |
| Annualized Fee Rate | Net Assets |
| 1.300% | Up to and including $1 billion |
| 1.250% | Over $1 billion, up to and including $5 billion |
| 1.200% | Over $5 billion, up to and including $10 billion |
| 1.150% | Over $10 billion, up to and including $15 billion |
| 1.100% | Over $15 billion, up to and including $20 billion |
| 1.050% | In excess of $20 billion |
The Portfolio will pay Advisers a fee equal to 80% of the difference between the total management fee and the fee paid by Advisers to FT Services for its administrative services to the Fund.
Effective March 1, 2014, under a subadvisory agreement, TAML, an affiliate of Advisers, provides subadvisory services to the Fund. The subadvisory fee is paid by Advisers based on the Fund’s average daily net assets, and is not an additional expense of the Fund. Prior to March 1, 2014, FT India, an affiliate of Advisers, provided subadvisory services to the Fund.
b. Administrative Fees
Under an agreement with Advisers, FT Services provides administrative services to the Fund. The fee is paid by Advisers based on the Fund’s average daily net assets, and is not an additional expense of the Fund.
c. Distribution Fees
The Board has adopted distribution plans for each share class, with the exception of Class R6 and Advisor Class shares, pursuant to Rule 12b-1 under the 1940 Act. Distribution fees are not charged on shares held by affiliates. Under the Fund’s Class A reimbursement distribution plan, the Fund reimburses Distributors for costs incurred in connection with the servicing, sale and distribution of the Fund’s shares up to the maximum annual plan rate. Under the Class A reimbursement distribution plan, costs exceeding the maximum for the current plan year cannot be reimbursed in subsequent periods. In addition, under the Fund’s Class C compensation distribution plan, the Fund pays Distributors for costs incurred in connection with the servicing, sale and distribution of the Fund’s shares up to the maximum annual plan rate. The plan year, for purposes of monitoring compliance with the maximum annual plan rate, is February 1 through January 31.
The maximum annual plan rates, based on the average daily net assets, for each class, are as follows:
The Board has set the current rate at 0.30% per year for Class A shares until further notice and approval by the Board.
franklintempleton.com
Annual Report
| 23
FRANKLIN TEMPLETON INTERNATIONAL TRUST
NOTES TO FINANCIAL STATEMENTS
Franklin India Growth Fund (continued)
3. Transactions with Affiliates (continued)
d. Sales Charges/Underwriting Agreements
Front-end sales charges and contingent deferred sales charges (CDSC) do not represent expenses of the Fund. These charges are deducted from the proceeds of sales of Fund shares prior to investment or from redemption proceeds prior to remittance, as applicable. Distributors has advised the Fund of the following commission transactions related to the sales and redemptions of the Fund’s shares for the year:
| | |
| Sales charges retained net of commissions paid to unaffiliated | | |
| broker/dealers | $ | 48,162 |
| CDSC retained | $ | 6,439 |
e. Transfer Agent Fees
Each class of shares, except for Class R6, pays transfer agent fees to Investor Services for its performance of shareholder servicing obligations and reimburses Investor Services for out of pocket expenses incurred, including shareholding servicing fees paid to third parties. These fees are allocated daily based upon their relative proportion of such classes’ aggregate net assets. Class R6 pays Investor Services transfer agent fees specific to that class.
For the year ended October 31, 2014, the Fund paid transfer agent fees of $118,634, of which $66,103 was retained by Investor Services.
f. Waiver and Expense Reimbursements
Advisers and Investor Services have contractually agreed in advance to waive or limit their fees and to assume as their own expense certain expenses otherwise payable by the Fund so that the expenses, including the Fund’s share of the Portfolio’s allocated expenses, (excluding distribution fees), for Class A, Class C, and Advisor Class of the Fund do not exceed 1.40%, and Class R6 does not exceed 1.20% based on the average net assets of each class (other than certain non-routine expenses or costs, including those relating to litigation, indemnification, reorganizations, and liquidations) until February 28, 2015.
4. Expense Offset Arrangement
The Fund has entered into an arrangement with its custodian whereby credits realized as a result of uninvested cash balances are used to reduce a portion of the Fund’s custodian expenses. During the year ended October 31, 2014, there were no credits earned.
5. Income Taxes
For tax purposes, capital losses may be carried over to offset future capital gains, if any. At October 31, 2014, the capital loss carryforwards were as follows:
| | |
| Capital loss carryforwards: | | |
| Short term | $ | 1,558,410 |
| Long term | | 7,303,405 |
| Total capital loss carryforwards | $ | 8,861,815 |
During the year ended October 31, 2014, the Fund utilized $181,087 of capital loss carryforwards.
24 | Annual Report
franklintempleton.com
FRANKLIN TEMPLETON INTERNATIONAL TRUST
NOTES TO FINANCIAL STATEMENTS
Franklin India Growth Fund (continued)
At October 31, 2014, the cost of investments, net unrealized appreciation (depreciation), including the holdings of the Portfolio, and undistributed ordinary income, for income tax purposes were as follows:
| | | |
| Cost of investments | $ | 75,677,654 | |
| |
| Unrealized appreciation | $ | 31,369,752 | |
| Unrealized depreciation | | (1,208,165 | ) |
| Net unrealized appreciation (depreciation) | $ | 30,161,587 | |
| |
| Undistributed ordinary income | $ | 785,494 | |
The Portfolio is a disregarded entity for United States federal income tax purposes.
Differences between income and/or capital gains as determined on a book basis and a tax basis are primarily due to differing treatments of passive foreign investment company shares, amortization of organizational costs and wash sales.
The India tax law also includes provisions that impose tax on certain transfers of shares of non-Indian companies that substantially derive their value from Indian assets. Uncertainty exists with respect to the application of this law on investment structures such as the Fund and the Portfolio. However, based on judgment and analysis of the facts and circumstances, management currently believes that the provisions are not likely to have a material impact on the Fund and the Portfolio.
6. Investment Transactions
Purchases and sales of investments including transactions from the Portfolio (excluding short term securities) for the year ended October 31, 2014, aggregated $46,324,322 and $25,563,345, respectively.
7. Concentration of Risk
Investing in Indian equity securities through the Portfolio may include certain risks and considerations not typically associated with investing in U.S. securities, such as fluctuating currency values, less liquidity, expropriation, confiscatory taxation, nationalization, exchange control regulations (including currency blockage), differing legal standards and changing local and regional economic, political and social conditions, which may result in greater market volatility.
8. Credit Facility
The Fund, together with other U.S. registered and foreign investment funds (collectively, Borrowers), managed by Franklin Templeton Investments, are borrowers in a joint syndicated senior unsecured credit facility totaling $1.5 billion (Global Credit Facility) which matures on February 13, 2015. This Global Credit Facility provides a source of funds to the Borrowers for temporary and emergency purposes, including the ability to meet future unanticipated or unusually large redemption requests.
Under the terms of the Global Credit Facility, the Fund shall, in addition to interest charged on any borrowings made by the Fund and other costs incurred by the Fund, pay its share of fees and expenses incurred in connection with the implementation and maintenance of the Global Credit Facility, based upon its relative share of the aggregate net assets of all of the Borrowers, including an annual commitment fee of 0.07% based upon the unused portion of the Global Credit Facility. These fees are reflected in other expenses on the Statement of Operations. During the year ended October 31, 2014, the Fund did not use the Global Credit Facility.
franklintempleton.com
Annual Report
| 25
FRANKLIN TEMPLETON INTERNATIONAL TRUST
NOTES TO FINANCIAL STATEMENTS
Franklin India Growth Fund (continued)
9. Fair Value Measurements
The Fund follows a fair value hierarchy that distinguishes between market data obtained from independent sources (observable inputs) and the Fund’s own market assumptions (unobservable inputs). These inputs are used in determining the value of the Fund’s financial instruments and are summarized in the following fair value hierarchy:
- Level 1 – quoted prices in active markets for identical financial instruments
- Level 2 – other significant observable inputs (including quoted prices for similar financial instruments, interest rates, prepayment speed, credit risk, etc.)
- Level 3 – significant unobservable inputs (including the Fund’s own assumptions in determining the fair value of financial instruments)
The input levels are not necessarily an indication of the risk or liquidity associated with financial instruments at that level.
For movements between the levels within the fair value hierarchy, the Fund has adopted a policy of recognizing the transfers as of the date of the underlying event which caused the movement.
At October 31, 2014, all of the Fund’s investments in financial instruments carried at fair value were valued using Level 1 inputs.
For detailed categories, see the accompanying Statement of Investments.
10. New Accounting Pronouncements
In June 2013, the Financial Accounting Standards Board issued Accounting Standards Update (ASU) No. 2013-08, Investment Companies (Topic 946): Amendments to the Scope, Measurement, and Disclosure Requirements. The ASU modifies the criteria used in defining an investment company under U.S. Generally Accepted Accounting Principles and also sets forth certain measurement and disclosure requirements. Under the ASU, an entity that is registered under the 1940 Act automatically qualifies as an investment company. The ASU is effective for interim and annual reporting periods beginning after December 15, 2013. Management has reviewed the requirements and believes the adoption of this ASU will not have a material impact on the financial statements.
11. Subsequent Events
The Fund has evaluated subsequent events through the issuance of the financial statements and determined that no events have occurred that require disclosure.
26 | Annual Report
franklintempleton.com
FRANKLIN TEMPLETON INTERNATIONAL TRUST
Report of Independent Registered Public Accounting Firm
To the Board of Directors and Shareholders of Franklin India Growth Fund
In our opinion, the accompanying statement of assets and liabilities, including the statement of investments, and the related statements of operations and of changes in net assets and the financial highlights present fairly, in all material respects, the financial position of Franklin India Growth Fund (the “Fund”) at October 31, 2014, the results of its operations for the year then ended, the changes in its net assets for each of the two years in the period then ended and the financial highlights for each of the five years in the period then ended, in conformity with accounting principles generally accepted in the United States of America. These financial statements and financial highlights (hereafter referred to as “financial statements”) are the responsibility of the Fund’s management. Our responsibility is to express an opinion on these financial statements based on our audits. We conducted our audits of these financial statements in accordance with the standards of the Public Company Accounting Oversight Board (United States). Those standards require that we plan and perform the audit to obtain reasonable assurance about whether the financial statements are free of material misstatement. An audit includes examining, on a test basis, evidence supporting the amounts and disclosures in the financial statements, assessing the accounting principles used and significant estimates made by management, and evaluating the overall financial statement presentation. We believe that our audits, which included confirmation of securities at October 31, 2014 by correspondence with the custodian, transfer agent and brokers, provides a reasonable basis for our opinion.
PricewaterhouseCoopers LLP
San Francisco, California
December 19, 2014
franklintempleton.com
Annual Report
| 27
FRANKLIN TEMPLETON INTERNATIONAL TRUST
Tax Information (unaudited)
Franklin India Growth Fund
Under Section 854(b)(1)(B) of the Internal Revenue Code (Code), the Fund hereby reports the maximum amount allowable but no less than $1,093,918 as qualified dividends for purposes of the maximum rate under Section 1(h)(11) of the Code for the fiscal year ended October 31, 2014. Distributions, including qualified dividend income, paid during calendar year 2014 will be reported to shareholders on Form 1099-DIV by mid-February 2015. Shareholders are advised to check with their tax advisors for information on the treatment of these amounts on their individual income tax returns.
28 | Annual Report
franklintempleton.com
FRANKLIN TEMPLETON INTERNATIONAL TRUST
Board Members and Officers
The name, year of birth and address of the officers and board members, as well as their affiliations, positions held with the Trust, principal occupations during at least the past five years and number of portfolios overseen in the Franklin Templeton Investments fund complex are shown below. Generally, each board member serves until that person’s successor is elected and qualified.
| | | | |
| Independent Board Members | | | |
| |
| | | | Number of Portfolios in | |
| Name, Year of Birth | | Length of | Fund Complex Overseen | Other Directorships Held |
| and Address | Position | Time Served | by Board Member* | During at Least the Past 5 Years |
| |
| Harris J. Ashton (1932) | Trustee | Since 1991 | 137 | Bar-S Foods (meat packing company) |
| One Franklin Parkway | | | | (1981-2010). |
| San Mateo, CA 94403-1906 | | | | |
| Principal Occupation During at Least the Past 5 Years: | | |
| Director of various companies; and formerly, Director, RBC Holdings, Inc. (bank holding company) (until 2002); and President, Chief |
| Executive Officer and Chairman of the Board, General Host Corporation (nursery and craft centers) (until 1998). |
| |
| Mary C. Choksi (1950) | Trustee | Since | 111 | Avis Budget Group Inc. (car rental), |
| One Franklin Parkway | | October 2014 | | Omnicom Group Inc. (advertising and |
| San Mateo, CA 94403-1906 | | | | marketing communications services) |
| | | | | and H.J. Heinz Company (processed |
| | | | | foods and allied products) (1998-2006). |
| |
| Principal Occupation During at Least the Past 5 Years: | | |
| Founding Partner and Senior Managing Director, Strategic Investment Group (investment management group) (1987-present); director of |
| various companies; and formerly, Founding Partner and Managing Director, Emerging Markets Management LLC (investment management |
| firm) (1987-2011); Loan Officer/Senior Loan Officer/Senior Pension Investment Officer, World Bank Group (international financial institution) |
| (1977-1987). | | | | |
| |
| Sam Ginn (1937) | Trustee | Since 2007 | 111 | ICO Global Communications |
| One Franklin Parkway | | | | (Holdings) Limited (satellite company) |
| San Mateo, CA 94403-1906 | | | | (2006-2010), Chevron Corporation |
| | | | | (global energy company) (1989-2009), |
| | | | | Hewlett-Packard Company (technology |
| | | | | company) (1996-2002), Safeway, Inc. |
| | | | | (grocery retailer) (1991-1998) and |
| | | | | TransAmerica Corporation (insurance |
| | | | | company) (1989-1999). |
| |
| Principal Occupation During at Least the Past 5 Years: | | |
| Private investor; and formerly, Chairman, First Responder Network Authority (FirstNet) (interoperable wireless broadband network) |
| (2012-2014); Chairman of the Board, Vodafone AirTouch, PLC (wireless company) (1999-2000); Chairman of the Board and Chief Executive |
| Officer, AirTouch Communications (cellular communications) (1993-1998) and Pacific Telesis Group (telephone holding company) |
| (1988-1994). | | | | |
| |
| Edith E. Holiday (1952) | Trustee | Since 1998 | 137 | Hess Corporation (exploration and |
| One Franklin Parkway | | | | refining of oil and gas), H.J. Heinz |
| San Mateo, CA 94403-1906 | | | | Company (processed foods and |
| | | | | allied products) (1994-2013), RTI |
| | | | | International Metals, Inc. (manufacture |
| | | | | and distribution of titanium), Canadian |
| | | | | National Railway (railroad) and White |
| | | | | Mountains Insurance Group, Ltd. |
| | | | | (holding company). |
| |
| Principal Occupation During at Least the Past 5 Years: | | |
| Director or Trustee of various companies and trusts; and formerly, Assistant to the President of the United States and Secretary of the |
| Cabinet (1990-1993); General Counsel to the United States Treasury Department (1989-1990); and Counselor to the Secretary and |
| Assistant Secretary for Public Affairs and Public Liaison – United States Treasury Department (1988-1989). |
| |
| |
| |
| |
| franklintempleton.com | | | | Annual Report | 29 |
FRANKLIN TEMPLETON INTERNATIONAL TRUST
| | | | |
| Independent Board Members (continued) | | |
| |
| | | | Number of Portfolios in | |
| Name, Year of Birth | | Length of | Fund Complex Overseen | Other Directorships Held |
| and Address | Position | Time Served | by Board Member* | During at Least the Past 5 Years |
| |
| J. Michael Luttig (1954) | Trustee | Since 2009 | 137 | Boeing Capital Corporation |
| One Franklin Parkway | | | | (aircraft financing) (2006-2013). |
| San Mateo, CA 94403-1906 | | | | |
| |
| Principal Occupation During at Least the Past 5 Years: | | |
| Executive Vice President, General Counsel and member of the Executive Council, The Boeing Company (aerospace company); and formerly, |
| Federal Appeals Court Judge, U.S. Court of Appeals for the Fourth Circuit (1991-2006). | |
| |
| Frank A. Olson (1932) | Trustee | Since 2007 | 137 | Hess Corporation (exploration and |
| One Franklin Parkway | | | | refining of oil and gas) (1998-2013). |
| San Mateo, CA 94403-1906 | | | | |
| |
| Principal Occupation During at Least the Past 5 Years: | | |
| Director of various companies; and formerly, Chairman of the Board, The Hertz Corporation (car rental) (1980-2000) and Chief Executive |
| Officer (1977-1999); and Chairman of the Board, President and Chief Executive Officer, UAL Corporation (airlines) (June-December 1987). |
| |
| Larry D. Thompson (1945) | Trustee | Since 2007 | 137 | Cbeyond, Inc. (business communi- |
| One Franklin Parkway | | | | cations provider) (2010-2012), The |
| San Mateo, CA 94403-1906 | | | | Southern Company (energy company) |
| | | | | (December 2014; previously |
| | | | | 2010-2012) and Graham Holdings |
| | | | | Company (education and media |
| | | | | organization) (2011-present). |
| Principal Occupation During at Least the Past 5 Years: | | |
| Executive Vice President – Government Affairs, General Counsel and Corporate Secretary, PepsiCo, Inc. (consumer products) (2012-present); |
| and formerly, John A. Sibley Professor of Corporate and Business Law, University of Georgia School of Law (2011-2012); Senior Vice |
| President – Government Affairs, General Counsel and Secretary, PepsiCo, Inc. (2004-2011); Senior Fellow of The Brookings Institution |
| (2003-2004); Visiting Professor, University of Georgia School of Law (2004); and Deputy Attorney General, U.S. Department of Justice |
| (2001-2003). | | | | |
| |
| John B. Wilson (1959) | Lead | Trustee since | 111 | None |
| One Franklin Parkway | Independent | 2006 and Lead | | |
| San Mateo, CA 94403-1906 | Trustee | Independent | | |
| | | Trustee since 2008 | | |
| |
| Principal Occupation During at Least the Past 5 Years: | | |
| President, Staples Europe (office supplies) (2012-present); President and Founder, Hyannis Port Capital, Inc. (real estate and private |
| equity investing); serves on private and non-profit boards; and formerly, Chief Operating Officer and Executive Vice President, Gap, Inc. |
| (retail) (1996-2000); Chief Financial Officer and Executive Vice President – Finance and Strategy, Staples, Inc. (1992-1996); Senior Vice |
| President – Corporate Planning, Northwest Airlines, Inc. (airlines) (1990-1992); and Vice President and Partner, Bain & Company |
| (consulting firm) (1986-1990). | | | | |
30 | Annual Report franklintempleton.com
FRANKLIN TEMPLETON INTERNATIONAL TRUST
| | | | |
| Interested Board Members and Officers (continued) | |
| |
| | | | Number of Portfolios in | |
| Name, Year of Birth | | Length of | Fund Complex Overseen | Other Directorships Held |
| and Address | Position | Time Served | by Board Member* | During at Least the Past 5 Years |
| |
| **Gregory E. Johnson (1961) | Trustee | Since 2007 | 147 | None |
| One Franklin Parkway | | | | |
| San Mateo, CA 94403-1906 | | | | |
| |
| Principal Occupation During at Least the Past 5 Years: | | |
| Chairman of the Board, Member – Office of the Chairman, Director, President and Chief Executive Officer, Franklin Resources, Inc.; |
| officer and/or director or trustee, as the case may be, of some of the other subsidiaries of Franklin Resources, Inc. and of 44 of the |
| investment companies in Franklin Templeton Investments; and Vice Chairman, Investment Company Institute. |
| |
| **Rupert H. Johnson, Jr. (1940) Chairman of | Chairman of the | 137 | None |
| One Franklin Parkway | the Board, | Board and Trustee | | |
| San Mateo, CA 94403-1906 | Trustee and | since 2013 | | |
| | Vice President | | | |
| Principal Occupation During at Least the Past 5 Years: | | |
| Vice Chairman, Member – Office of the Chairman and Director, Franklin Resources, Inc.; Director, Franklin Advisers, Inc.; Senior Vice |
| President, Franklin Advisory Services, LLC; and officer and/or director or trustee, as the case may be, of some of the other subsidiaries of |
| Franklin Resources, Inc. and of 41 of the investment companies in Franklin Templeton Investments. | |
| |
| Alison E. Baur (1964) | Vice President | Since 2012 | Not Applicable | Not Applicable |
| One Franklin Parkway | | | | |
| San Mateo, CA 94403-1906 | | | | |
| |
| Principal Occupation During at Least the Past 5 Years: | | |
| Deputy General Counsel, Franklin Templeton Investments; and officer of some of the other subsidiaries of Franklin Resources, Inc. and of |
| 46 of the investment companies in Franklin Templeton Investments. | | |
| |
| Laura F. Fergerson (1962) | Chief | Since 2009 | Not Applicable | Not Applicable |
| One Franklin Parkway | Executive | | | |
| San Mateo, CA 94403-1906 | Officer – | | | |
| | Finance and | | | |
| | Administration | | | |
| |
| Principal Occupation During at Least the Past 5 Years: | | |
| Senior Vice President, Franklin Templeton Services, LLC; and officer of 46 of the investment companies in Franklin Templeton Investments. |
| |
| Gaston Gardey (1967) | Treasurer, | 2009 | Not Applicable | Not Applicable |
| One Franklin Parkway | Chief Financial | | | |
| San Mateo, CA 94403-1906 | Officer and | | | |
| | Chief | | | |
| | Accounting | | | |
| | Officer | | | |
| |
| Principal Occupation During at Least the Past 5 Years: | | |
| Director, Fund Accounting, Franklin Templeton Investments; and officer of 27 of the investment companies in Franklin Templeton Investments. |
| |
| Aliya S. Gordon (1973) | Vice President | Since 2009 | Not Applicable | Not Applicable |
| One Franklin Parkway | | | | |
| San Mateo, CA 94403-1906 | | | | |
| |
| Principal Occupation During at Least the Past 5 Years: | | |
| Senior Associate General Counsel, Franklin Templeton Investments; officer of 46 of the investment companies in Franklin Templeton |
| Investments; and formerly, Litigation Associate, Steefel, Levitt & Weiss, LLP (2000-2004). | |
| |
| |
| |
| |
| franklintempleton.com | | | | Annual Report | 31 |
FRANKLIN TEMPLETON INTERNATIONAL TRUST
| | | | |
| Interested Board Members and Officers (continued) | |
| |
| | | | Number of Portfolios in | |
| Name, Year of Birth | | Length of | Fund Complex Overseen | Other Directorships Held |
| and Address | Position | Time Served | by Board Member* | During at Least the Past 5 Years |
| |
| Steven J. Gray (1955) | Vice President | Since 2009 | Not Applicable | Not Applicable |
| One Franklin Parkway | | | | |
| San Mateo, CA 94403-1906 | | | | |
| |
| Principal Occupation During at Least the Past 5 Years: | | |
| Senior Associate General Counsel, Franklin Templeton Investments; Vice President, Franklin Templeton Distributors, Inc. and Franklin |
| Alternative Strategies Advisers, LLC; and officer of 46 of the investment companies in Franklin Templeton Investments. |
| |
| Selena L. Holmes (1965) | Vice President | Since 2012 | Not Applicable | Not Applicable |
| 100 Fountain Parkway | – AML | | | |
| St. Petersburg, FL 33716-1205 | Compliance | | | |
| |
| Principal Occupation During at Least the Past 5 Years: | | |
| Director, Global Compliance Monitoring; Chief Compliance Officer, Franklin Alternative Strategies Advisers, LLC; Vice President, Franklin |
| Templeton Companies, LLC; and officer of 46 of the investment companies in Franklin Templeton Investments. |
| |
| Edward B. Jamieson (1948) | President and | Since 2010 | Not Applicable | Not Applicable |
| One Franklin Parkway | Chief Executive | | | |
| San Mateo, CA 94403-1906 | Officer – | | | |
| | Investment | | | |
| | Management | | | |
| Principal Occupation During at Least the Past 5 Years: | | |
| President, Chief Investment Officer and Director, Franklin Advisers, Inc.; Executive Vice President, Franklin Templeton Institutional, LLC; |
| and officer and/or trustee, as the case may be, of some of the other subsidiaries of Franklin Resources, Inc. and of 10 of the investment |
| companies in Franklin Templeton Investments. | | | |
| |
| Kimberly H. Novotny (1972) | Vice President | Since 2013 | Not Applicable | Not Applicable |
| 300 S.E. 2nd Street | | | | |
| Fort Lauderdale, FL 33301-1923 | | | | |
| |
| Principal Occupation During at Least the Past 5 Years: | | |
| Associate General Counsel, Franklin Templeton Investments; Vice President and Secretary, Fiduciary Trust International of the South; Vice |
| President, Templeton Investment Counsel, LLC; Assistant Secretary, Franklin Resources, Inc.; and officer of 46 of the investment companies |
| in Franklin Templeton Investments. | | | |
| |
| Robert C. Rosselot (1960) | Chief | Since 2013 | Not Applicable | Not Applicable |
| 300 S.E. 2nd Street | Compliance | | | |
| Fort Lauderdale, FL 33301-1923 | Officer | | | |
| Principal Occupation During at Least the Past 5 Years: | | |
| Director, Global Compliance, Franklin Templeton Investments; Vice President, Franklin Templeton Companies, LLC; officer of 46 of the |
| investment companies in Franklin Templeton Investments; and formerly, Senior Associate General Counsel, Franklin Templeton Investments |
| (2007-2013); and Secretary and Vice President, Templeton Group of Funds (2004-2013). | |
| |
| Karen L. Skidmore (1952) | Vice President | Since 2006 | Not Applicable | Not Applicable |
| One Franklin Parkway | and Secretary | | | |
| San Mateo, CA 94403-1906 | | | | |
| |
| Principal Occupation During at Least the Past 5 Years: | | |
| Senior Associate General Counsel, Franklin Templeton Investments; and officer of 46 of the investment companies in Franklin Templeton |
| Investments. | | | | |
| |
| |
| |
| |
| 32 | Annual Report | | | | franklintempleton.com |
FRANKLIN TEMPLETON INTERNATIONAL TRUST
| | | | |
| Interested Board Members and Officers (continued) | |
| |
| | | | Number of Portfolios in | |
| Name, Year of Birth | | Length of | Fund Complex Overseen | Other Directorships Held |
| and Address | Position | Time Served | by Board Member* | During at Least the Past 5 Years |
| |
| Craig S. Tyle (1960) | Vice President | Since 2005 | Not Applicable | Not Applicable |
| One Franklin Parkway | | | | |
| San Mateo, CA 94403-1906 | | | | |
| |
| Principal Occupation During at Least the Past 5 Years: | | |
| General Counsel and Executive Vice President, Franklin Resources, Inc.; and officer of some of the other subsidiaries of Franklin Resources, |
| Inc. and of 46 of the investment companies in Franklin Templeton Investments. | |
| |
| Lori A. Weber (1964) | Vice President | Since 2011 | Not Applicable | Not Applicable |
| 300 S.E. 2nd Street | | | | |
| Fort Lauderdale, FL 33301-1923 | | | | |
| |
| Principal Occupation During at Least the Past 5 Years: | | |
| Senior Associate General Counsel, Franklin Templeton Investments; Assistant Secretary, Franklin Resources, Inc.; Vice President and |
| Secretary, Templeton Investment Counsel, LLC; Vice President, Fiduciary Trust International of the South; and officer of 46 of the investment |
| companies in Franklin Templeton Investments. | | | |
*We base the number of portfolios on each separate series of the U.S. registered investment companies within the Franklin Templeton Investments fund complex. These
portfolios have a common investment manager or affiliated investment managers.
**Gregory E. Johnson is considered to be an interested person of the Fund under the federal securities laws due to his position as an officer and director of Franklin
Resources, Inc. (Resources), which is the parent company of the Fund’s investment manager and distributor. Rupert H. Johnson, Jr. is considered to be an interested
person of the Fund under the federal securities laws due to his position as officer and director and major shareholder of Resources.
Note 1: Rupert H. Johnson, Jr. is the uncle of Gregory E. Johnson.
Note 2: Officer information is current as of the date of this report. It is possible that after this date, information about officers may change.
The Sarbanes-Oxley Act of 2002 and Rules adopted by the Securities and Exchange Commission require the Fund to disclose whether the Fund’s Audit
Committee includes at least one member who is an audit committee financial expert within the meaning of such Act and Rules. The Fund’s Board has deter-
mined that there is at least one such financial expert on the Audit Committee and has designated John B. Wilson as its audit committee financial expert. The
Board believes that Mr. Wilson qualifies as such an expert in view of his extensive business background and experience, including service as chief financial
officer of Staples, Inc. from 1992 to 1996. Mr. Wilson has been a Member and Chairman of the Fund’s Audit Committee since 2006. As a result of such background
and experience, the Board believes that Mr. Wilson has acquired an understanding of generally accepted accounting principles and financial statements, the gen-
eral application of such principles in connection with the accounting estimates, accruals and reserves, and analyzing and evaluating financial statements that
present a breadth and level of complexity of accounting issues generally comparable to those of the Fund, as well as an understanding of internal controls
and procedures for financial reporting and an understanding of audit committee functions. Mr. Wilson is an independent Board member as that term is defined
under the relevant Securities and Exchange Commission Rules and Releases.
The Statement of Additional Information (SAI) includes additional information about the board members and is available, without charge, upon request.
Shareholders may call (800) DIAL BEN/342-5236 to request the SAI.
franklintempleton.com Annual Report | 33
| | | | | | | | | | | | | | | |
| FT (MAURITIUS) OFFSHORE INVESTMENTS LIMITED | | | | | | | | | | | | | | | |
| |
| |
| Financial Highlights | | | | | | | | | | | | | | | |
| (Expressed in U.S. Dollars) | | | | | | | | | | | | | | | |
| | | | | | Year Ended October 31, | | | | |
| | | 2014 | | | 2013 | | | 2012 | | | 2011 | | | 2010 | |
| Per share operating performance | | | | | | | | | | | | | | | |
| (for a share outstanding throughout the year) | | | | | | | | | | | | | | | |
| Net asset value, beginning of year | $ | 9.19 | | $ | 9.37 | | $ | 9.88 | | $ | 11.52 | | $ | 8.26 | |
| Income from investment operationsa: | | | | | | | | | | | | | | | |
| Net investment income (loss)b | | 0.09 | c | | 0.06 | | | 0.02 | | | (0.01 | ) | | 0.02 | |
| Net realized and unrealized gains (losses) | | 4.21 | | | (0.24 | ) | | (0.53 | ) | | (1.63 | ) | | 3.24 | |
| Total from investment operations | | 4.30 | | | (0.18 | ) | | (0.51 | ) | | (1.64 | ) | | 3.26 | |
| Net asset value, end of year | $ | 13.49 | | $ | 9.19 | | $ | 9.37 | | $ | 9.88 | | $ | 11.52 | |
| |
| Total return | | 46.79 | % | | (1.92 | )% | | (5.16 | )% | | (14.24 | )% | | 39.47 | % |
| |
| Ratios to average net assets | | | | | | | | | | | | | | | |
| Expenses | | 1.12 | % | | 1.07 | % | | 1.08 | % | | 1.17 | % | | 1.22 | % |
| Net investment income (loss) | | 0.80 | %c | | 0.54 | % | | 0.19 | % | | (0.08 | )% | | 0.18 | % |
| |
| Supplemental data | | | | | | | | | | | | | | | |
| Net assets, end of year (000’s) | $ | 105,258 | | $ | 58,206 | | $ | 70,010 | | $ | 90,257 | | $ | 88,225 | |
| Portfolio turnover rate | | 35.48 | % | | 16.95 | % | | 41.30 | % | | 39.07 | % | | 83.21 | % |
aThe amount shown for a share outstanding throughout the period may not correlate with the Statement of Operations for the period due to the timing of sales and
repurchases of the Fund shares in relation to income earned and/or fluctuating fair value of the investments of the Fund.
bBased on average daily shares outstanding.
cNet investment income per share includes approximately $0.02 per share received in the form of special dividends. Excluding these amounts, the ratio of net investment
income to average net assets would have been 0.62%.
34 | Annual Report | The accompanying notes are an integral part of these financial statements. franklintempleton.com
FT (MAURITIUS) OFFSHORE INVESTMENTS LIMITED
Statement of Investments, October 31, 2014
(Expressed in U.S. Dollars)
| | | |
| | Shares | | Value |
| Common Stocks 98.6% | | | |
| India 98.6% | | | |
| Auto Components 2.5% | | | |
| Balkrishna Industries Ltd. | 119,147 | $ | 1,495,814 |
| Bosch Ltd. | 4,864 | | 1,180,081 |
| | | | 2,675,895 |
| Automobiles 6.2% | | | |
| Mahindra & Mahindra Ltd. | 170,790 | | 3,625,237 |
| Tata Motors Ltd. | 119,000 | | 1,038,064 |
| Tata Motors Ltd., A | 350,000 | | 1,907,174 |
| | | | 6,570,475 |
| Banks 24.9% | | | |
| Axis Bank Ltd. | 247,000 | | 1,764,860 |
| Bank of Baroda | 27,200 | | 412,175 |
| Corporation Bank Ltd. | 27,135 | | 149,164 |
| HDFC Bank Ltd. | 219,400 | | 3,259,290 |
| ICICI Bank Ltd. | 189,000 | | 5,003,014 |
| IndusInd Bank Ltd. | 298,863 | | 3,498,700 |
| Karur Vysya Bank Ltd. | 59,000 | | 525,864 |
| Kotak Mahindra Bank Ltd. | 146,000 | | 2,660,836 |
| Punjab National Bank Ltd. | 79,000 | | 1,197,383 |
| State Bank of India | 72,852 | | 3,205,286 |
| Yes Bank Ltd. | 405,000 | | 4,512,348 |
| | | | 26,188,920 |
| Chemicals 3.4% | | | |
| Asian Paints Ltd. | 209,000 | | 2,233,293 |
| Coromandel International Ltd. | 2,000 | | 10,761 |
| Pidilite Industries Ltd. | 157,000 | | 1,058,513 |
| Rallis India Ltd. | 62,000 | | 231,724 |
| | | | 3,534,291 |
| Construction & Engineering 6.5% | | | |
| Larsen & Toubro Ltd. | 207,000 | | 5,578,600 |
| Voltas Ltd. | 313,500 | | 1,283,510 |
| | | | 6,862,110 |
| Construction Materials 3.2% | | | |
| Ramco Cements Ltd. | 114,000 | | 638,274 |
| Shree Cements Ltd. | 9,392 | | 1,392,580 |
| Ultra Tech Cement Ltd. | 32,500 | | 1,350,360 |
| | | | 3,381,214 |
| Consumer Finance 0.9% | | | |
| Mahindra & Mahindra Financial Services Ltd. | 210,000 | | 1,001,865 |
| Diversified Financial Services 2.1% | | | |
| Credit Analysis and Research Ltd. | 71,000 | | 1,554,010 |
| Crisil Ltd. | 22,500 | | 666,902 |
| | | | 2,220,912 |
| Electrical Equipment 0.6% | | | |
| Amara Raja Batteries Ltd. | 62,497 | | 664,307 |
franklintempleton.com
Annual Report
| 35
FT (MAURITIUS) OFFSHORE INVESTMENTS LIMITED
STATEMENT OF INVESTMENTS
(Expressed in U.S. Dollars)
| | | |
| | Shares | | Value |
| Common Stocks (continued) | | | |
| Food Products 1.6% | | | |
| Kaveri Seed Co. Ltd. | 33,000 | $ | 494,369 |
| Nestle India Ltd. | 12,000 | | 1,218,946 |
| | | | 1,713,315 |
| Gas Utilities 1.3% | | | |
| GAIL India Ltd. | 159,800 | | 1,377,057 |
| Hotels, Restaurants & Leisure 0.5% | | | |
| aIndian Hotels Co. Ltd. | 319,853 | | 542,247 |
| Industrial Conglomerates 1.0% | | | |
| Aditya Birla Nuvo Ltd. | 37,000 | | 1,013,440 |
| IT Services 9.6% | | | |
| HCL Technologies Ltd. | 84,500 | | 2,209,000 |
| Infosys Ltd. | 91,800 | | 6,056,886 |
| Tata Consultancy Services Ltd. | 32,542 | | 1,380,299 |
| Tech Mahindra Ltd. | 600 | | 24,544 |
| Wipro Ltd. | 44,793 | | 411,019 |
| | | | 10,081,748 |
| Machinery 5.7% | | | |
| AIA Engineering Ltd. | 24,000 | | 367,436 |
| Cummins India Ltd. | 240,000 | | 2,852,211 |
| Eicher Motors Ltd. | 10,300 | | 2,141,940 |
| SKF India Ltd. | 30,000 | | 606,351 |
| | | | 5,967,938 |
| Media 1.1% | | | |
| Jagran Prakashan Ltd. | 560,933 | | 1,178,411 |
| Metals & Mining 1.5% | | | |
| Hindalco Industries Ltd. | 600,000 | | 1,594,658 |
| Oil, Gas & Consumable Fuels 4.8% | | | |
| Bharat Petroleum Corp. Ltd. | 176,048 | | 2,076,280 |
| Coal India Ltd. | 100,000 | | 601,498 |
| Gujarat Mineral Development Corp. Ltd. | 410,000 | | 1,013,900 |
| Hindustan Petroleum Corp. Ltd. | 58,000 | | 500,280 |
| Petronet LNG Ltd. | 254,000 | | 823,778 |
| | | | 5,015,736 |
| Personal Products 1.5% | | | |
| Marico Ltd. | 310,000 | | 1,573,097 |
| Pharmaceuticals 8.9% | | | |
| Cadila Healthcare Ltd. | 49,000 | | 1,118,609 |
| Dr. Reddy’s Laboratories Ltd. | 57,000 | | 2,934,890 |
| Pfizer Ltd. | 31,305 | | 834,766 |
| Sun Pharmaceutical Industries Ltd. | 160,000 | | 2,203,208 |
| Torrent Pharmaceuticals Ltd. | 161,000 | | 2,318,054 |
| | | | 9,409,527 |
| Textiles, Apparel & Luxury Goods 1.6% | | | |
| Titan Co. Ltd. | 258,778 | | 1,657,056 |
36 | Annual Report
franklintempleton.com
FT (MAURITIUS) OFFSHORE INVESTMENTS LIMITED
STATEMENT OF INVESTMENTS
(Expressed in U.S. Dollars)
| | | | |
| | Shares | | | Value |
| Common Stocks (continued) | | | | |
| Thrifts & Mortgage Finance 2.1% | | | | |
| Housing Development Finance Corp. Ltd. | 120,000 | | $ | 2,161,290 |
| Transportation Infrastructure 1.0% | | | | |
| aGujarat Pipavav Port Ltd. | 380,000 | | | 1,025,112 |
| Wireless Telecommunication Services 6.1% | | | | |
| Bharti Airtel Ltd. | 840,000 | | | 5,448,612 |
| Idea Cellular Ltd. | 354,000 | | | 939,119 |
| | | | | 6,387,731 |
| Total Common Stocks (Cost $72,376,286) | | | | 103,798,352 |
| |
| | Principal | | | |
| | Amount* | | | |
| Convertible Bonds (Cost $50,870) 0.1% | | | | |
| India 0.1% | | | | |
| Hotels, Restaurants & Leisure 0.1% | | | | |
| Indian Hotels Co. Ltd., cvt., zero cpn., 3/01/16 | 56,216 | INR | | 86,889 |
| Total Investments (Cost $72,427,156) 98.7% | | | | 103,885,241 |
| Other Assets, less Liabilities 1.3% | | | | 1,372,984 |
| Net Assets 100.0% | | | $ | 105,258,225 |
See Abbreviations on page 45.
*The principal amount is stated in U.S. dollars unless otherwise indicated.
aNon-income producing.
franklintempleton.com The accompanying notes are an integral part of these financial statements. | Annual Report | 37
FT (MAURITIUS) OFFSHORE INVESTMENTS LIMITED
Financial Statements
(Expressed in U.S. Dollars)
Statement of Assets and Liabilities
October 31, 2014
| | |
| Assets: | | |
| Investments in securities: | | |
| Cost | $ | 72,427,156 |
| Value | $ | 103,885,241 |
| Cash | | 208,403 |
| Foreign currency, at value (cost $3,453,923) | | 3,454,750 |
| Receivables: | | |
| Investment securities sold | | 108,076 |
| Capital shares sold | | 294,994 |
| Dividends | | 13,382 |
| Total assets | | 107,964,846 |
| Liabilities: | | |
| Payables: | | |
| Investment securities purchased | | 24,679 |
| Capital shares redeemed | | 2,584,742 |
| Management fees | | 77,358 |
| Administrative fees | | 3,050 |
| Accrued expenses and other liabilities | | 16,792 |
| Total liabilities | | 2,706,621 |
| Net assets, at value | $ | 105,258,225 |
| Shares outstanding | | 7,800,201 |
| Net asset value per share | $ | 13.49 |
38 | Annual Report | The accompanying notes are an integral part of these financial statements.
franklintempleton.com
FT (MAURITIUS) OFFSHORE INVESTMENTS LIMITED
FINANCIAL STATEMENTS
(Expressed in U.S. Dollars)
| | | |
| Statement of Operations | | | |
| for the year ended October 31, 2014 | | | |
| |
| Investment income: | | | |
| Dividends | $ | 1,387,356 | |
| Expenses: | | | |
| Management fees (Note 3a) | | 652,425 | |
| Administrative fees (Note 3b) | | 36,121 | |
| Custodian fees | | 70,243 | |
| Reports to shareholders | | 1,500 | |
| Professional fees | | 32,279 | |
| Directors’ fees and expenses | | 10,000 | |
| Other | | 8,276 | |
| Total expenses | | 810,844 | |
| Net investment income | | 576,512 | |
| Realized and unrealized gains (losses): | | | |
| Net realized gain (loss) from: | | | |
| Investments | | 885,973 | |
| Foreign currency transactions | | (75,312 | ) |
| Net realized gain (loss) | | 810,661 | |
| Net change in unrealized appreciation (depreciation) on: | | | |
| Investments | | 26,337,089 | |
| Translation of other assets and liabilities denominated in foreign currencies | | 25,408 | |
| Net change in unrealized appreciation (depreciation) | | 26,362,497 | |
| Net realized and unrealized gain (loss) | | 27,173,158 | |
| Net increase (decrease) in net assets resulting from operations | $ | 27,749,670 | |
franklintempleton.com The accompanying notes are an integral part of these financial statements. | Annual Report | 39
FT (MAURITIUS) OFFSHORE INVESTMENTS LIMITED FINANCIAL STATEMENTS
(Expressed in U.S. Dollars)
| | | | | |
| Statements of Changes in Net Assets | | | | | |
| |
| |
| | | Year Ended October 31, | |
| | | 2014 | | 2013 | |
| Increase (decrease) in net assets: | | | | | |
| Operations: | | | | | |
| Net investment income | $ | 576,512 | $ | 370,315 | |
| Net realized gain (loss) from investments and foreign currency transactions | | 810,661 | | (1,840,007 | ) |
| Net change in unrealized appreciation (depreciation) on investments and translation of other assets and | | | | | |
| liabilities denominated in foreign currencies | | 26,362,497 | | (755,396 | ) |
| Net increase (decrease) in net assets resulting from operations | | 27,749,670 | | (2,225,088 | ) |
| Capital share transactions (Note 2) | | 19,302,836 | | (9,578,959 | ) |
| Net increase (decrease) in net assets | | 47,052,506 | | (11,804,047 | ) |
| Net assets: | | | | | |
| Beginning of year | | 58,205,719 | | 70,009,766 | |
| End of year | $ | 105,258,225 | $ | 58,205,719 | |
40 | Annual Report | The accompanying notes are an integral part of these financial statements. franklintempleton.com
FT (MAURITIUS) OFFSHORE INVESTMENTS LIMITED
Notes to Financial Statements
(Expressed in U.S. Dollars)
1. Organization and Significant Accounting Policies
FT (Mauritius) Offshore Investments Limited (Portfolio) is registered with and regulated by the Mauritius Financial Services Commission and has elected to be treated as a disregarded entity for United States federal income tax purposes.
At October 31, 2014, Franklin India Growth Fund (Fund) owned 100% of the Portfolio.
The following summarizes the Portfolio’s significant accounting policies.
a. Financial Instrument Valuation
The Portfolio’s investments in financial instruments are carried at fair value daily. Fair value is the price that would be received to sell an asset or paid to transfer a liability in an orderly transaction between market participants on the measurement date. The Portfolio calculates the net asset value (NAV) per share at the close of the New York Stock Exchange (NYSE), generally at 4 p.m. Eastern time (NYSE close) on each day the NYSE is open for trading. Under compliance policies and procedures approved by the Fund’s Board of Trustees (the Board), the Fund’s administrator has responsibility for oversight of valuation, including leading the cross-functional Valuation and Liquidity Oversight Committee (VLOC). The VLOC provides administration and oversight of the Portfolio’s valuation policies and procedures, which are approved annually by the Board. Among other things, these procedures allow the Portfolio to utilize independent pricing services, quotations from securities and financial instrument dealers, and other market sources to determine fair value.
Equity securities listed on an exchange or on the NASDAQ National Market System are valued at the last quoted sale price or the official closing price of the day, respectively. Foreign equity securities are valued as of the close of trading on the foreign stock exchange on which the security is primarily traded or as of the NYSE close, whichever is earlier. The value is then converted into its U.S. dollar equivalent at the foreign exchange rate in effect at the NYSE close on the day that the value of the security is determined. Over-the-counter (OTC) securities are valued within the range of the most recent quoted bid and ask prices. Securities that trade in multiple markets or on multiple exchanges are valued according to the broadest and most representative market. Certain equity securities are valued based upon fundamental characteristics or relationships to similar securities.
Debt securities generally trade in the OTC market rather than on a securities exchange. The Portfolio’s pricing services use multiple valuation techniques to determine fair value. In instances where sufficient market activity exists, the pricing services may utilize a market-based approach through which quotes from market makers are used to determine fair value. In instances where sufficient market activity may not exist or is limited, the pricing services also utilize proprietary valuation models which may consider market characteristics such as benchmark yield curves, credit spreads, estimated default rates, anticipated market interest rate volatility, coupon rates, anticipated timing of principal repayments, underlying collateral, and other unique security features in order to estimate the relevant cash flows, which are then discounted to calculate the fair value. Securities denominated in a foreign currency are converted into their U.S. dollar equivalent at the foreign exchange rate in effect at the NYSE close on the date that the values of the foreign debt securities are determined.
The Portfolio follows the Fund’s procedures to determine the fair value of financial instruments for which market prices are not reliable or readily available. Under these procedures, the VLOC convenes on a regular basis to review such financial instruments and considers a number of factors, including significant unobservable valuation inputs, when arriving at fair value. The VLOC primarily employs a market-based approach which may use related or comparable assets or liabilities, recent transactions, market multiples, book values, and other relevant information for the investment to determine the fair value of the investment. An income-based valuation approach may also be used in which the anticipated future cash flows of the investment are discounted to calculate fair value. Discounts may also be applied due to the nature or duration of any restrictions on the disposition of the investments. Due to the inherent uncertainty of valuations of such investments, the fair values may differ significantly from the values that would have been used had an active market existed. The VLOC employs various methods for calibrating these valuation approaches including a regular review of key inputs and assumptions, transactional back-testing or disposition analysis, and reviews of any related market activity.
Trading in securities on foreign securities stock exchanges and OTC markets may be completed before the daily NYSE close. In addition, trading in certain foreign markets may not take place on every NYSE business day. Occasionally, events occur between the time at which trading in a foreign security is completed and the close of the NYSE that might call into question
franklintempleton.com Annual Report | 41
FT (MAURITIUS) OFFSHORE INVESTMENTS LIMITED NOTES TO FINANCIAL STATEMENTS
(Expressed in U.S. Dollars)
1. Organization and Significant Accounting
Policies (continued)
a. Financial Instrument Valuation (continued)
the reliability of the value of a portfolio security held by the Portfolio. As a result, differences may arise between the value of the Portfolio’s portfolio securities as determined at the foreign market close and the latest indications of value at the close of the NYSE. In order to minimize the potential for these differences, the VLOC monitors price movements following the close of trading in foreign stock markets through a series of country specific market proxies (such as baskets of American Depositary Receipts, futures contracts and exchange traded funds). These price movements are measured against established trigger thresholds for each specific market proxy to assist in determining if an event has occurred that may call into question the reliability of the values of the foreign securities held by the Portfolio. If such an event occurs, the securities may be valued using fair value procedures, which may include the use of independent pricing services.
Also, when the last day of the reporting period is a non-business day, certain foreign markets may be open on days that the NYSE is closed, which could result in differences between the value of the Portfolio’s portfolio securities on the last business day and the last calendar day of the reporting period. Any significant security valuation changes due to an open foreign market are adjusted and reflected by the Portfolio for financial reporting purposes.
b. Foreign Currency Translation
Portfolio securities and other assets and liabilities denominated in foreign currencies are translated into U.S. dollars based on the exchange rate of such currencies against U.S. dollars on the date of valuation. The Portfolio may enter into foreign currency exchange contracts to facilitate transactions denominated in a foreign currency. Purchases and sales of securities, income and expense items denominated in foreign currencies are translated into U.S. dollars at the exchange rate in effect on the transaction date. Portfolio securities and assets and liabilities denominated in foreign currencies contain risks that those currencies will decline in value relative to the U.S. dollar. Occasionally, events may impact the availability or reliability of foreign exchange rates used to convert the U.S. dollar equivalent value. If such an event occurs, the foreign exchange rate will be valued at fair value using procedures established and approved by the Board.
The Portfolio does not separately report the effect of changes in foreign exchange rates from changes in market prices on securities held. Such changes are included in net realized and unrealized gain or loss from investments on the Statement of Operations.
Realized foreign exchange gains or losses arise from sales of foreign currencies, currency gains or losses realized between the trade and settlement dates on securities transactions and the difference between the recorded amounts of dividends, interest, and foreign withholding taxes and the U.S. dollar equivalent of the amounts actually received or paid. Net unrealized foreign exchange gains and losses arise from changes in foreign exchange rates on foreign denominated assets and liabilities other than investments in securities held at the end of the reporting period.
c. Income Taxes
The Portfolio conducts its investment activities in India as a tax resident of Mauritius and expects to obtain benefits under the double taxation treaty between Mauritius and India (Treaty). To obtain benefits under the Treaty, the Portfolio must meet certain tests and conditions, including the establishment of Mauritius tax residence and related requirements. The Portfolio has obtained a certificate from the Mauritius tax authorities and believes that such certification is evidence that it is a resident of Mauritius under the Treaty. A company which is a tax resident in Mauritius under the Treaty and has no branch or permanent establishment in India, will not be subject to capital gains tax in India on the sale of Indian securities but is subject to Indian withholding tax on interest earned on Indian securities up to maximum rate of 21.63% (which includes surcharges). There is no withholding tax in India in respect of dividends paid by Indian companies and such dividends are exempt in the hands of the shareholders.
The Portfolio holds a Category 1 Global Business License for the purpose of the Financial Services Act 2007 and under current laws and regulations, is subject to tax in Mauritius at the rate of 15% on its net income. However, the Portfolio is entitled to a deemed tax credit equivalent to the higher of actual foreign tax suffered or a presumed foreign tax equivalent of 80% of the Mauritian tax on its foreign source income. Thus, the effective tax rate in Mauritius should not exceed 3% (i.e. 15% less 80% of 15%). Indian companies making distributions are, however, liable to a dividend distribution tax equivalent to 16.995% of the dividends distributed. A company holding at
42 | Annual Report franklintempleton.com
FT (MAURITIUS) OFFSHORE INVESTMENTS LIMITED
NOTES TO FINANCIAL STATEMENTS
(Expressed in U.S. Dollars)
least 5% of the share capital of an Indian company and receiving dividends from that Indian company may claim a credit for tax paid by the Indian company on its profits out of which the dividends were distributed including the dividend distribution tax. No Mauritian capital gains tax is payable on profits arising from sale of securities, and any dividends and redemption proceeds paid by the Portfolio to its shareholders will be exempt from withholding or other tax.
The Portfolio continues to: (i) comply with the requirements of the Treaty; (ii) be a tax resident of Mauritius; and (iii) maintain that its central management and control resides in Mauritius, and therefore management believes that the Portfolio will be able to obtain the benefits of the Treaty. Accordingly, no provision for Indian income taxes has been made in the accompanying financial statements of the Portfolio for taxes related to capital gains or dividends.
The Indian Finance Minister announced the introduction of a General Anti Avoidance Rule (“GAAR”) in the Indian tax law in the 2012/2013 budget. Subsequently, following representations made by stakeholders, the implementation of the GAAR provisions has been deferred until assessment year April 1, 2016.
The Portfolio’s accounting policy in accordance with accounting principles generally accepted in the United States of America is to account for changes in tax laws when the laws are enacted.
The India tax law also includes provisions that impose tax on certain transfers of shares of non-Indian companies that substantially derive their value from Indian assets. Uncertainty exists with respect to the application of this law on investment structures such as the Portfolio and the Fund. However, based
on judgment and analysis of the facts and circumstances, management currently believes that the provisions are not likely to have a material impact on the Portfolio and the Fund.
d. Security Transactions, Investment Income and Expenses
Security transactions are accounted for on trade date. Realized gains and losses on security transactions are determined on a specific identification basis. Estimated expenses are accrued daily. Dividend income is recorded on the ex-dividend date except that certain dividends from foreign securities are recognized as soon as the Portfolio is notified of the ex-dividend date.
e. Accounting Estimates
The preparation of financial statements in accordance with principles generally accepted in the United States of America requires management to make estimates and assumptions that affect the reported amounts of assets and liabilities at the date of the financial statements and the amounts of income and expenses during the reporting period. Actual results could differ from those estimates.
f. Guarantees and Indemnifications
Under the Portfolio’s organizational documents, the Portfolio’s officers and directors are indemnified by the Portfolio against certain liabilities arising out of the performance of their duties to the Portfolio. Additionally, in the normal course of business, the Portfolio enters into contracts with service providers that contain general indemnification clauses. The Portfolio’s maximum exposure under these arrangements is unknown as this would involve future claims that may be made against the Portfolio that have not yet occurred. Currently, the Portfolio expects the risk of loss to be remote.
2. Shares of Beneficial Interest
At October 31, 2014, there were an unlimited number of shares authorized (without par value). Transactions in the Portfolio’s shares were as follows:
| | | | | | | | | | |
| | | | | Year Ended October 31, | | | | |
| | | | | 2014 | | | | | 2013 | |
| | Shares | | | Amount | | Shares | | | Amount | |
| Shares sold | 3,095,391 | | $ | 36,704,878 | | 784,648 | | $ | 7,545,873 | |
| Shares redeemed | (1,631,551 | ) | | (17,402,042 | ) | (1,919,385 | ) | | (17,124,832 | ) |
| Net increase (decrease) | 1,463,840 | | $ | 19,302,836 | | (1,134,737 | ) | $ | (9,578,959 | ) |
franklintempleton.com Annual Report | 43
FT (MAURITIUS) OFFSHORE INVESTMENTS LIMITED
NOTES TO FINANCIAL STATEMENTS
(Expressed in U.S. Dollars)
3. Transactions with Affiliates
Franklin Resources, Inc. is the holding company of Franklin Advisers, Inc. (Advisers) which is the investment manager of the Portfolio.
a. Management Fees
The Portfolio pays an investment management fee to Advisers equal to 80% of the total management fee with the remainder to be paid by the Fund based on the average daily net assets of the Fund as follows:
| |
| Annualized Fee Rate | Net Assets |
| 1.100% | Up to and including $1 billion |
| 1.050% | Over $1 billion, up to and including $5 billion |
| 1.000% | Over $5 billion, up to and including $10 billion |
| 0.950% | Over $10 billion, up to and including $15 billion |
| 0.900% | Over $15 billion, up to and including $20 billion |
| 0.850% | In excess of $20 billion |
b. Administrative Fees
The Portfolio pays an administrative fee to International Financial Services Limited (IFS), a Mauritius company, an annual fee of $30,000 plus reimbursement of certain expenses. Certain directors of the Portfolio are also directors of IFS.
4. Investment Transactions
Purchases and sales of investments (excluding short term securities) for the year ended October 31, 2014, aggregated $46,324,322 and $25,563,345, respectively.
5. Concentration of Risk
Investing in Indian equity securities may include certain risks and considerations not typically associated with investing in U.S. securities, such as fluctuating currency values, less liquidity, expropriation, confiscatory taxation, nationalization, exchange control regulations (including currency blockage), differing legal standards and changing local and regional economic, political and social conditions, which may result in greater market volatility.
6. Fair Value Measurements
The Portfolio follows a fair value hierarchy that distinguishes between market data obtained from independent sources (observable inputs) and the Portfolio’s own market assumptions (unobservable inputs). These inputs are used in determining the value of the Portfolio’s financial instruments and are summarized in the following fair value hierarchy:
- Level 1 – quoted prices in active markets for identical financial instruments
- Level 2 – other significant observable inputs (including quoted prices for similar financial instruments, interest rates, prepayment speed, credit risk, etc.)
- Level 3 – significant unobservable inputs (including the Portfolio’s own assumptions in determining the fair value of financial instruments)
The input levels are not necessarily an indication of the risk or liquidity associated with financial instruments at that level.
44 | Annual Report franklintempleton.com
FT (MAURITIUS) OFFSHORE INVESTMENTS LIMITED
NOTES TO FINANCIAL STATEMENTS
(Expressed in U.S. Dollars)
For movements between the levels within the fair value hierarchy, the Portfolio has adopted a policy of recognizing the transfers as of the date of the underlying event which caused the movement.
A summary of inputs used as of October 31, 2014, in valuing the Portfolio’s assets carried at fair value, is as follows:
| | | | | | | | |
| | | Level 1 | | Level 2 | | Level 3 | | Total |
| Assets: | | | | | | | | |
| Investments in Securities: | | | | | | | | |
| Equity Investmentsa | $ | 103,798,352 | $ | — | $ | — | $ | 103,798,352 |
| Convertible Bonds | | — | | 86,889 | | — | | 86,889 |
| Total Investments in Securities | $ | 103,798,352 | $ | 86,889 | $ | — | $ | 103,885,241 |
| aFor detailed categories, see the accompanying Statement of Investments. | | | | | | | | |
7. New Accounting Pronouncements
In June 2013, the Financial Accounting Standards Board issued Accounting Standards Update (ASU) No. 2013-08, Investment Companies (Topic 946): Amendments to the Scope, Measurement, and Disclosure Requirements. The ASU modifies the criteria used in defining an investment company under U.S. Generally Accepted Accounting Principles and also sets forth certain measurement and disclosure requirements. The ASU is effective for interim and annual reporting periods beginning after December 15, 2013. Management has reviewed the requirements and believes the adoption of this ASU will not have a material impact on the financial statements.
8. Subsequent Events
The Portfolio has evaluated subsequent events through the issuance of the financial statements and determined that no events have occurred that require disclosure.
|
| Abbreviations |
| Currency |
| INR Indian Rupee |
franklintempleton.com Annual Report | 45
FT (MAURITIUS) OFFSHORE INVESTMENTS LIMITED
Report of Independent Registered Public Accounting Firm
To the Board of Directors and Shareholders of FT (Mauritius) Offshore Investments Limited
In our opinion, the accompanying statement of assets and liabilities, including the statement of investments, and the related statements of operations and of changes in net assets and the financial highlights present fairly, in all material respects, the financial position of FT (Mauritius) Offshore Investments Limited (the “Portfolio”) at October 31, 2014, the results of its operations for the year then ended, the changes in its net assets for each of the two years in the period then ended and the financial highlights for each of the five years in the period then ended, in conformity with accounting principles generally accepted in the United States of America. These financial statements and financial highlights (hereafter referred to as “financial statements”) are the responsibility of the Portfolio’s management. Our responsibility is to express an opinion on these financial statements based on our audits. We conducted our audits of these financial statements in accordance with the standards of the Public Company Accounting Oversight Board (United States). Those standards require that we plan and perform the audit to obtain reasonable assurance about whether the financial statements are free of material misstatement. An audit includes examining, on a test basis, evidence supporting the amounts and disclosures in the financial statements, assessing the accounting principles used and significant estimates made by management, and evaluating the overall financial statement presentation. We believe that our audits, which included confirmation of securities at October 31, 2014 by correspondence with the custodian and brokers, provide a reasonable basis for our opinion.
PricewaterhouseCoopers LLP
San Francisco, California
December 19, 2014
46 | Annual Report
franklintempleton.com
FRANKLIN TEMPLETON INTERNATIONAL TRUST
FRANKLIN INDIA GROWTH FUND
Shareholder Information
Proxy Voting Policies and Procedures
The Fund’s investment manager has established Proxy Voting Policies and Procedures (Policies) that the Fund uses to determine how to vote proxies relating to portfolio securities. Shareholders may view the Fund’s complete Policies online at franklintempleton.com. Alternatively, shareholders may request copies of the Policies free of charge by calling the Proxy Group collect at (954) 527-7678 or by sending a written request to: Franklin Templeton Companies, LLC, 300 S.E. 2nd Street, Fort Lauderdale, FL 33301, Attention: Proxy Group. Copies of the Fund’s proxy voting records are also made available online at franklintempleton.com and posted on the U.S. Securities and Exchange Commission’s website at sec.gov and reflect the most recent 12-month period ended June 30.
Quarterly Statement of Investments
The Fund files a complete statement of investments with the U.S. Securities and Exchange Commission for the first and third quarters for each fiscal year on Form N-Q. Shareholders may view the filed Form N-Q by visiting the Commission’s website at sec.gov. The filed form may also be viewed and copied at the Commission’s Public Reference Room in Washington, DC. Information regarding the operations of the Public Reference Room may be obtained by calling (800) SEC-0330.
Householding of Reports and Prospectuses
You will receive the Fund’s financial reports every six months as well as an annual updated summary prospectus (prospectus available upon request). To reduce Fund expenses, we try to identify related shareholders in a household and send only one copy of the financial reports and summary prospectus. This process, called “householding,” will continue indefinitely unless you instruct us otherwise. If you prefer not to have these documents householded, please call us at (800) 632-2301. At any time you may view current prospectuses/summary prospectuses and financial reports on our website. If you choose, you may receive these documents through electronic delivery.
franklintempleton.com Annual Report | 47
This page intentionally left blank.
| |
| Contents | |
| |
| Shareholder Letter | 1 |
| Annual Report | |
| Franklin World Perspectives Fund | 3 |
| Performance Summary | 8 |
| Your Fund’s Expenses | 13 |
| Financial Highlights and | |
| Statement of Investments | 15 |
| Financial Statements | 28 |
| Notes to Financial Statements | 32 |
| Report of Independent Registered | |
| Public Accounting Firm | 42 |
| Tax Information | 43 |
| Board Members and Officers | 44 |
| Shareholder Information | 49 |
| 1
Annual Report
Franklin World Perspectives Fund
This annual report for Franklin World Perspectives Fund covers the fiscal year ended October 31, 2014.
Your Fund’s Goal and Main Investments
The Fund seeks long-term capital appreciation. Under normal market conditions, the Fund invests primarily in equity securities in developed, emerging and frontier markets across the entire market capitalization spectrum.
Performance Overview
The Fund’s Class A shares delivered a +4.92% cumulative total return for the 12 months under review. In comparison, the Fund’s benchmark, the MSCI All Country World Index Plus Frontier Markets Index (ACWI+FM), which measures stock performance in developed, emerging and frontier markets, produced a total return of +8.38%.1 You can find more of the Fund’s performance data in the Performance Summary beginning on page 8.
Performance data represent past performance, which does not guarantee future results. Investment return and principal value will fluctuate, and you may have a gain or loss when you sell your shares. Current performance may differ from figures shown. Please visit franklintempleton.com or call (800) 342-5236 for most recent month-end performance.
Economic and Market Overview
The global economy grew moderately during the 12 months under review as many developed markets continued to recover and many emerging markets continued to grow. Major developed market central banks reaffirmed their accommodative monetary policies in an effort to support the ongoing recovery. Several emerging market central banks cut interest rates to boost economic growth, while several others raised rates to control inflation and currency depreciation.
U.S. economic growth trends were generally encouraging during the period. Economic activity expanded in the third quarter of 2014, resulting largely from increased federal defense spending and a narrower trade deficit. In January 2014, the
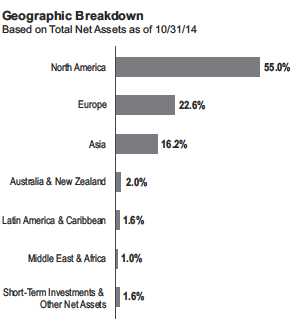
U.S. Federal Reserve Board (Fed) began reducing its bond purchases $10 billion a month, based on largely positive economic and employment data in late 2013. After further gradual reductions during the year, the Fed ended its asset purchase program in October based on its view that underlying economic strength could support ongoing progress in labor market conditions. The Fed reaffirmed it would maintain its near-zero interest rate policy for a “considerable time” and stated its actions to normalize monetary policy remained dependent on economic performance. Additionally, the Fed noted that although inflation might remain low in the near term, the likelihood of inflation running persistently below its 2% longer term goal had diminished somewhat since early 2014.
Outside the U.S., the U.K. economy grew relatively well, supported by the services and manufacturing sectors. U.K. gross domestic product (GDP) continued to expand at pre-crisis levels in the third quarter of 2014. Although out of recession, the eurozone experienced deflationary risks and lackluster employment trends. Economic growth remained subdued and weaker than expected as concerns arose about the potential negative
1. Source: Morningstar.
The index is unmanaged and includes reinvested dividends. One cannot invest directly in an index, and an index is not representative of the Fund’s portfolio.
The dollar value, number of shares or principal amount, and names of all portfolio holdings are listed in the Fund’s Statement of Investments (SOI).
The SOI begins on page 19.
franklintempleton.com Annual Report | 3
FRANKLIN WORLD PERSPECTIVES FUND
impacts to growth from the crisis in Ukraine and tension in the Middle East. In June 2014, the European Central Bank (ECB) reduced its main interest rate and for the first time set a negative deposit rate; the ECB reduced both rates again in September. In Japan, second- and third-quarter GDP contractions indicated the economy was in a recession. However, the third-quarter GDP contraction was less severe than the second quarter’s, as private consumption and exports improved. In October, the Bank of Japan expanded its stimulus measures to revive the country’s economic growth amid weak domestic demand following a sales tax hike and as a substantial decline in crude oil prices exerted further downward pressure on inflation.
In several emerging markets, including China, economic growth moderated in the third quarter. Emerging market equities rose slightly for the 12-month period, as measured by the MSCI Emerging Markets (EM) Index, amid headwinds such as generally soft domestic demand, weak exports, the possibility that U.S. interest rates would rise sooner than expected and geopolitical tensions in certain regions. Many emerging market currencies depreciated against the U.S. dollar, leading central banks in several countries, including Brazil, Turkey, South Africa and Russia, to raise interest rates in an effort to curb inflation and support their currencies. Several other central banks, including those of Chile, Mexico and South Korea, lowered interest rates to promote economic growth.
As measured by the MSCI World Index, stocks in developed markets advanced overall during the period amid a generally accommodative monetary policy environment, continued strength in corporate earnings and signs of an economic recovery. Oil and gold prices remained volatile and ended lower for the 12-month period. The U.S. dollar appreciated against most currencies.
Investment Strategy
While we have overall responsibility for the Fund’s investments, we manage the Fund using a multi-manager approach. We consult with Franklin Templeton’s local asset management teams (subadvisors) based in countries around the world to help determine regional and country allocations, and each subadvisor is responsible for selecting investments for that portion of the Fund’s portfolio allocated to it. We work closely with the subadvisors to develop local portfolios of securities seeking to outperform the relevant market of each region and combine those portfolios into a single global growth equity fund. The Fund’s actual exposure to various regions and markets will vary from time to time according to our and the subadvisors’ opinions as to the prevailing conditions and prospects for these markets.
Using a growth-oriented investment style, we seek to invest in growth-oriented equity securities of companies in developed, emerging and frontier regions and countries around the world. When choosing equity investments for the Fund, we and the subadvisors, with the benefit of local knowledge and market insight, apply a research-driven, bottom-up, fundamental long-term approach. We focus on the market price of a company’s securities relative to our and the subadvisors’ evaluations of the company’s long-term earnings, asset value and cash flow potential. We seek to invest in financially strong companies with favorable growth potential and sustainable competitive advantages.
| | |
| Top 10 Countries | | |
| 10/31/14 | | |
| | % of Total | |
| | Net Assets | |
| U.S. | 50.8 | % |
| U.K. | 8.0 | % |
| Japan | 5.8 | % |
| Canada | 4.2 | % |
| France | 3.4 | % |
| China | 2.2 | % |
| Italy | 2.1 | % |
| Belgium | 2.0 | % |
| India | 2.0 | % |
| Australia | 2.0 | % |
Manager’s Discussion
Global economic growth remained quite tepid during the reporting period, but corporations generally were able to expand their earnings despite a lack of real revenue improvement. Financial markets remained driven by central bank policies in the U.S., Europe and Japan, although geopolitical tensions and large-scale elections in many parts of the world created many developments for the market to digest. As measured by MSCI indexes, developed markets outperformed emerging markets mostly because of strong U.S. returns, while Europe and Japan lagged and posted negative returns in U.S. dollar terms. Although emerging markets as a whole trailed developed markets, some countries such as India outperformed. Frontier markets delivered the highest performance due to high returns from the Middle East despite regional geopolitical tensions. Within this environment, the Fund’s emerging market holdings produced better returns than its benchmark index, but its U.S. holdings underperformed as they failed to keep pace with the steep rise in U.S. equities.
4 | Annual Report
franklintempleton.com
FRANKLIN WORLD PERSPECTIVES FUND
| | |
| Top 10 Industries | | |
| 10/31/14 | | |
| | % of Total | |
| | Net Assets | |
| Media | 5.9 | % |
| Pharmaceuticals | 5.3 | % |
| Banks | 5.0 | % |
| Internet Software & Services | 4.5 | % |
| Foreign Equity | 3.9 | % |
| IT Services | 3.9 | % |
| Biotechnology | 3.1 | % |
| Technology Hardware, Storage & Peripherals | 3.0 | % |
| Capital Markets | 3.0 | % |
| Chemicals | 3.0 | % |
North America
During the year under review, the Fund’s overall holdings in North America detracted from performance relative to the MSCI ACWI+FM, particularly due to stock selection in the U.S., while stock selection in Canada contributed. Within the U.S., most of our relative underperformance came from consumer discretionary and information technology stocks, while health care — particularly biotechnology — positioning was strongly positive from a relative perspective.2 Among the largest detractors from relative performance in the U.S. were Whole Foods Market, Chart Industries3 and Precision Castparts. Conversely, Illumina, United Rentals, Facebook and Gilead Sciences delivered strong relative performance.
Within Canada, the materials, energy and industrials sectors benefited relative performance.4 In particular, Canadian Pacific Railway, Nuvista Energy and Brookfield Asset Management helped relative results. Canada has been in about a five-and-a-half-year-long bull market, and growth has remained relatively solid. Market volatility also reached a decade-long low in the third quarter of 2014.
We increased our allocation toward the U.S. during the reporting period. At the beginning of the year, we were underweighted toward the U.S. compared to the benchmark, but we
ended the period close to a neutral weighting while slightly underweighted. Our allocation to Canada remained relatively stable during the period, and we were slightly overweighted at period-end.
Europe
Overall, Europe was a major detractor from the Fund’s relative performance mostly due to stock selection. At the country level, allocation results were quite mixed. An underweighting in Germany as well as overweightings in Ireland and Norway were positive, but underweightings in Switzerland and Denmark hurt, leading to a slightly positive overall contribution to relative performance for the region. From a sector perspective, key detractors from relative performance in Europe were the Netherlands’ energy sector, Finland’s industrials sector and Germany’s consumer discretionary sector. Notable relative detractors were positions in Dutch company Fugro (sold by period-end), Finnish firm Outotec and U.K. business De La Rue.
Throughout the period, Europe did not deliver the economic growth that we hoped for. The region also posted slightly negative returns for the year in U.S. dollar terms, although individual country results were more mixed, according to the MSCI Europe Index. We saw improvements in certain areas, such as structural reforms in Spain, but overall Europe’s periphery had a tough year. During much of the year, the euro depreciated and detracted from investor returns in U.S. dollar terms, but a weaker currency may benefit the region in the longer term, in our opinion.
Overall, we decreased our allocation to Europe during the period, and we ended the period slightly underweighted. Most of this reduction was due to our trimming positions in the U.K., Germany and Switzerland. Conversely, we increased our weightings in Italy and Belgium.
Asia Pacific ex-Japan
The Fund’s positioning in Asia Pacific ex-Japan was positive in relative terms, with contributions from our slight overweighting and stock selection. India and Thailand were strong contributors
2. The consumer discretionary sector comprises auto components; automobiles; distributors; diversified consumer services; hotels, restaurants and leisure; household
durables; Internet and catalog retail; media; multiline retail; specialty retail; and textiles, apparel and luxury goods in the SOI. The information technology sector comprises
communications equipment; electronic equipment, instruments and components; Internet software and services; IT services; semiconductors and semiconductor equipment;
software; and technology hardware, storage and peripherals in the SOI. The health care sector comprises biotechnology; health care equipment and supplies; health care
providers and services; health care technology; life sciences, tools and services; and pharmaceuticals in the SOI.
3. Bought and sold during the period.
4. The materials sector comprises chemicals, construction materials, containers and packaging, metals and mining, and paper and forest products in the SOI. The energy
sector comprises energy equipment and services; and oil, gas and consumable fuels in the SOI. The industrials sector comprises aerospace and defense, air freight and
logistics, commercial services and supplies, construction and engineering, electrical equipment, industrial conglomerates, machinery, marine, professional services, road
and rail, trading companies and distributors, and transportation infrastructure in the SOI.
franklintempleton.com Annual Report | 5
FRANKLIN WORLD PERSPECTIVES FUND
to relative performance in the region during the period. Within India, stock selection helped relative performance particularly due to the financials and industrial sectors.5 One of the most significant contributors in Thailand was an off-benchmark position in Siam Commercial Bank.
Much of the attention on the Asia Pacific ex-Japan region during the period was focused on China and especially on its growth policies, which has been the case for a few years. Although China appeared to be continuing to rebalance its economy, many investors worried about a “hard landing” and credit and shadow banking problems. In India, a historic election result caused the market to perform well amid optimism about the newly elected pro-business government. Expectations arose that the new administration would be able to accelerate growth, tame inflation and improve structural issues in the economy, reducing infrastructure project bottlenecks, red tape and inefficiencies. We increased our weighting toward the region during the period and ended the period with an overweighting.
| | |
| Top 10 Equity Holdings | | |
| 10/31/14 | | |
| Company | % of Total | |
| Sector/Industry, Country | Net Assets | |
| Franklin India Growth Fund, Class R6 | 2.0 | % |
| Foreign Equity, India | | |
| Google Inc., A | 1.9 | % |
| Internet Software & Services, U.S. | | |
| Apple Inc. | 1.7 | % |
| Technology Hardware, Storage & Peripherals, U.S. | | |
| MasterCard Inc., A | 1.4 | % |
| IT Services, U.S. | | |
| Actavis PLC | 1.3 | % |
| Pharmaceuticals, U.S. | | |
| Reed Elsevier NV | 1.2 | % |
| Media, U.K. | | |
| Ecolab Inc. | 1.2 | % |
| Chemicals, U.S. | | |
| Sanofi | 1.2 | % |
| Pharmaceuticals, France | | |
| Celgene Corp. | 1.2 | % |
| Biotechnology, U.S. | | |
| Visa Inc., A | 1.2 | % |
| IT Services, U.S. | | |
Japan
Relative to the Fund’s benchmark, the positive effect of our underweighted allocation to Japan was not enough to offset the negative effect of stock selection. Some of the largest detractors were a few companies in the industrials sector, including TOTO and Keikyu.3 Our allocation to Japan remained basically stable during the period and we remained underweighted.
Latin America
Our overweighted allocation to the region detracted slightly from relative performance and overcame the positive effect of stock selection. Positions within the materials and energy sectors contributed to relative performance, but positions within industrials and utilities weighed on results.6
Brazil’s central bank raised interest rates in response to rising inflation and a weakening real. Toward period-end, the presidential election that resulted in a win for incumbent Dilma Rousseff dampened demand, and manufacturing and services sector output declined. We decreased our allocation to Latin America during the period. Although we still believed many attractive bottom-up opportunities existed within the region, we reduced our overall weighting as we believed the region’s growth outlook was weaker than in other regions.
Middle East and North Africa (MENA)
Our allocation to the MENA region delivered positive relative performance during the period with our overweighted allocation and stock selection contributing to relative results. Our positions in Kuwait and Saudi Arabia were particularly beneficial, especially Agility Public Warehousing, Kuwait Projects Co. Holding and Al Tayyar Travel Group.7
During the period, Saudi Arabia’s economic growth eased mainly because of a slowdown in the oil sector. The non-oil sector maintained its momentum, however, and supported growth. Government-led infrastructure spending, rising consumer spending and higher investment growth have also contributed to economic strength. Despite our view that the MENA region’s economic growth potential was still strong and that equity markets there may continue to perform strongly relative to the rest of the world, we decreased our allocation following the region’s robust market performance over the past two years.
5. The financials sector comprises banks, capital markets, consumer finance, diversified financial services, insurance, real estate investment trusts, and real estate
management and development in the SOI.
6. The utilities sector comprises electric utilities, independent power and renewable electricity producers, and water utilities in the SOI.
7. Investment in Al Tayyar Travel Group was made through participatory notes, which are promissory notes designed to offer a return linked to the performance of a
particular underlying equity security or market.
See www.franklintempletondatasources.com for additional data provider information.
6 | Annual Report franklintempleton.com
FRANKLIN WORLD PERSPECTIVES FUND
It is important to recognize the effect of currency movements on the Fund’s performance. In general, if the value of the U.S. dollar goes up compared with a foreign currency, an investment traded in that foreign currency will go down in value because it will be worth fewer U.S. dollars. This can have a negative effect on Fund performance. Conversely, when the U.S. dollar weakens in relation to a foreign currency, an investment traded in that foreign currency will increase in value, which can contribute to Fund performance. For the 12 months ended October 31, 2014, the U.S. dollar rose in value relative to most currencies. As a result, the Fund’s performance was negatively affected by the portfolio’s significant investment in securities with non-U.S. currency exposure.
We thank you for your participation in Franklin World Perspectives Fund and look forward to serving your future investment needs.

The foregoing information reflects our analysis, opinions and portfolio holdings as of October 31, 2014, the end of the reporting period. The way we implement our main investment strategies and the resulting portfolio holdings may change depending on factors such as market and economic conditions. These opinions may not be relied upon as investment advice or an offer for a particular security. The information is not a complete analysis of every aspect of any market, country, industry, security or the Fund. Statements of fact are from sources considered reliable, but the investment manager makes no representation or warranty as to their completeness or accuracy. Although historical performance is no guarantee of future results, these insights may help you understand our investment management philosophy.
CFA® is a trademark owned by CFA Institute.
franklintempleton.com Annual Report | 7
FRANKLIN WORLD PERSPECTIVES FUND
Performance Summary as of October 31, 2014
Your dividend income will vary depending on dividends or interest paid by securities in the Fund’s portfolio, adjusted for operating expenses of each class. Capital gain distributions are net profits realized from the sale of portfolio securities. The performance table and graphs do not reflect any taxes that a shareholder would pay on Fund dividends, capital gain distributions, if any, or any realized gains on the sale of Fund shares. Total return reflects reinvestment of the Fund’s dividends and capital gain distributions, if any, and any unrealized gains or losses.
| | | | | | |
| Net Asset Value | | | | | | |
| Share Class (Symbol) | | 10/31/14 | | 10/31/13 | | Change |
| A (FWPAX) | $ | 13.14 | $ | 12.70 | +$ | 0.44 |
| C (N/A) | $ | 13.02 | $ | 12.61 | +$ | 0.41 |
| R (N/A) | $ | 13.08 | $ | 12.65 | +$ | 0.43 |
| Advisor (FWPZX) | $ | 13.17 | $ | 12.72 | +$ | 0.45 |
| |
| |
| Distributions (11/1/13–10/31/14) | | | | | | |
| Dividend |
| Share Class | | Income | | | | |
| A | $ | 0.1769 | | | | |
| C | $ | 0.1169 | | | | |
| R | $ | 0.1382 | | | | |
| Advisor | $ | 0.1857 | | | | |
8 | Annual Report
franklintempleton.com
FRANKLIN WORLD PERSPECTIVES FUND
PERFORMANCE SUMMARY
Performance as of 10/31/141
Cumulative total return excludes sales charges. Average annual total returns and value of $10,000 investment include maximum sales charges. Class A: 5.75% maximum initial sales charge; Class C: 1% contingent deferred sales charge in first year only;
Class R/Advisor Class: no sales charges.
| | | | | | | | | | | | | | | |
| | | Cumulative | | | Average Annual | | | Value of | | Average Annual | | Total Annual Operating Expenses6 | |
| Share Class | | Total Return2 | | | Total Return3 | | $ | 10,000 Investment4 | | Total Return (9/30/14)5 | | (with waiver) | | (without waiver) | |
| A | | | | | | | | | | | | 1.58 | % | 2.05 | % |
| 1-Year | + | 4.92 | % | | -1.08 | % | $ | 9,892 | + | 1.64 | % | | | | |
| 3-Year | + | 41.39 | % | + | 10.04 | % | $ | 13,324 | + | 13.62 | % | | | | |
| Since Inception | | | | | | | | | | | | | | | |
| (12/16/10) | + | 36.39 | % | + | 6.70 | % | $ | 12,855 | + | 6.66 | % | | | | |
| C | | | | | | | | | | | | 2.28 | % | 2.75 | % |
| 1-Year | + | 4.22 | % | + | 3.22 | % | $ | 10,322 | + | 6.06 | % | | | | |
| 3-Year | + | 38.62 | % | + | 11.50 | % | $ | 13,862 | + | 15.10 | % | | | | |
| Since Inception | | | | | | | | | | | | | | | |
| (12/16/10) | + | 32.88 | % | + | 7.61 | % | $ | 13,288 | + | 7.59 | % | | | | |
| R | | | | | | | | | | | | 1.78 | % | 2.25 | % |
| 1-Year | + | 4.54 | % | + | 4.54 | % | $ | 10,454 | + | 7.38 | % | | | | |
| 3-Year | + | 39.87 | % | + | 11.83 | % | $ | 13,987 | + | 15.43 | % | | | | |
| Since Inception | | | | | | | | | | | | | | | |
| (12/16/10) | + | 34.36 | % | + | 7.92 | % | $ | 13,436 | + | 7.91 | % | | | | |
| Advisor | | | | | | | | | | | | 1.28 | % | 1.75 | % |
| 1-Year | + | 5.07 | % | + | 5.07 | % | $ | 10,507 | + | 7.92 | % | | | | |
| 3-Year | + | 42.06 | % | + | 12.41 | % | $ | 14,206 | + | 16.03 | % | | | | |
| Since Inception | | | | | | | | | | | | | | | |
| (12/16/10) | + | 37.03 | % | + | 8.47 | % | $ | 13,703 | + | 8.45 | % | | | | |
Performance data represent past performance, which does not guarantee future results. Investment return and principal value will fluctuate, and you may have a gain or loss when you sell your shares. Current performance may differ from figures shown. For most recent month-end performance, go to franklintempleton.com or call (800) 342-5236.
franklintempleton.com Annual Report | 9
FRANKLIN WORLD PERSPECTIVES FUND
PERFORMANCE SUMMARY
Total Return Index Comparison for a Hypothetical $10,000 Investment1
Total return represents the change in value of an investment over the periods shown. It includes any applicable maximum sales charge, Fund expenses, account fees and reinvested distributions. The unmanaged index includes reinvestment of any income or distributions. It differs from the Fund in composition and does not pay management fees or expenses. One cannot invest directly in an index.
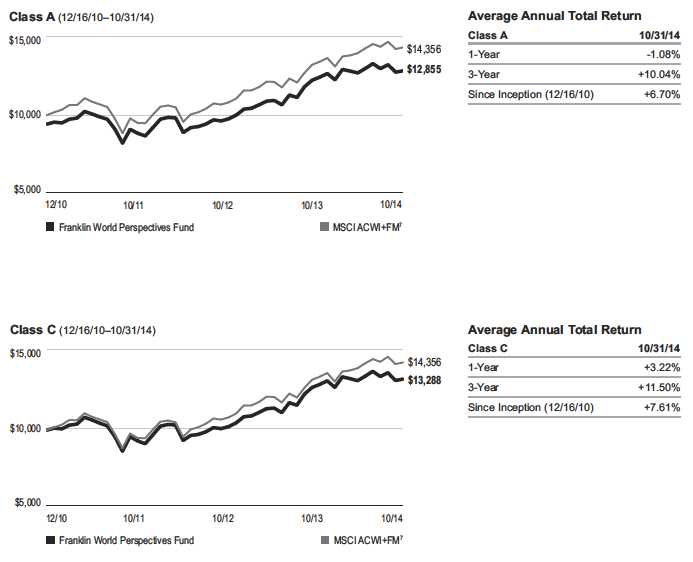
10 | Annual Report franklintempleton.com
FRANKLIN WORLD PERSPECTIVES FUND
PERFORMANCE SUMMARY
Total Return Index Comparison for a Hypothetical $10,000 Investment1 (continued)
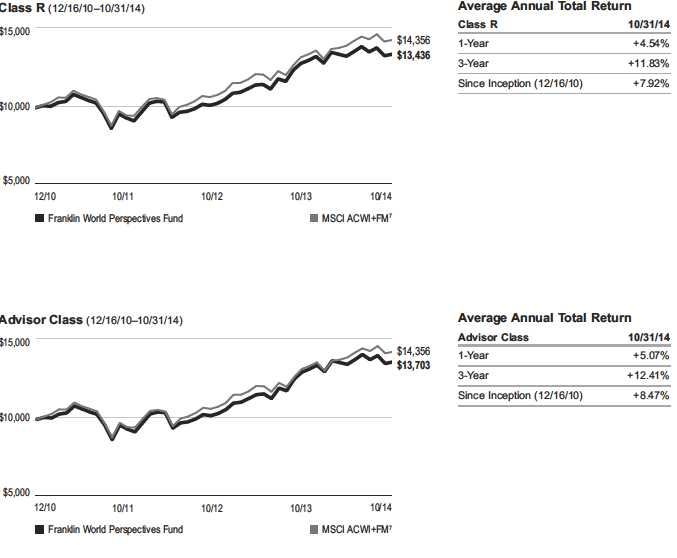
franklintempleton.com Annual Report | 11
FRANKLIN WORLD PERSPECTIVES FUND
PERFORMANCE SUMMARY
All investments involve risks, including possible loss of principal. Special risks are associated with foreign investing, including currency fluctuations, economic instability and political developments. Investments in emerging market countries involve heightened risks related to the same factors, in addition to those associated with these markets’ smaller size, lesser liquidity and lack of established legal, political, business and social frameworks to support securities markets. Smaller company stocks have historically had more price volatility than large-company stocks, particularly over the short term. The Fund is designed for the aggressive portion of a well-diversified portfolio. The Fund is actively managed but there is no guarantee that the manager’s investment decisions will produce the desired results. The Fund’s prospectus also includes a description of the main investment risks.
| |
| Class C: | These shares have higher annual fees and expenses than Class A shares. |
| Class R: | Shares are available to certain eligible investors as described in the prospectus. These shares have higher annual fees and expenses than Class A shares. |
| Advisor Class: | Shares are available to certain eligible investors as described in the prospectus. |
1. The Fund has an expense reduction contractually guaranteed through at least 2/28/15 and fee waivers associated with its investments in a Franklin Templeton money
fund and in Franklin India Growth Fund, contractually guaranteed through at least its current fiscal year-end. Fund investment results reflect the expense reduction and
fee waivers, to the extent applicable; without these reductions, the results would have been lower.
2. Cumulative total return represents the change in value of an investment over the periods indicated.
3. Average annual total return represents the average annual change in value of an investment over the periods indicated.
4. These figures represent the value of a hypothetical $10,000 investment in the Fund over the periods indicated.
5. In accordance with SEC rules, we provide standardized average annual total return information through the latest calendar quarter.
6. Figures are as stated in the Fund’s current prospectus. In periods of market volatility, assets may decline significantly, causing total annual Fund operating expenses
to become higher than the figures shown.
7. Source: Morningstar. The MSCI ACWI+FM is a free float-adjusted, market capitalization-weighted index designed to measure equity market performance of global
developed, emerging and frontier markets.
See www.franklintempletondatasources.com for additional data provider information.
12 | Annual Report franklintempleton.com
FRANKLIN WORLD PERSPECTIVES FUND
Your Fund’s Expenses
As a Fund shareholder, you can incur two types of costs:
- Transaction costs, including sales charges (loads) on Fund purchases; and
- Ongoing Fund costs, including management fees, distribution and service (12b-1) fees, and other Fund expenses. All mutual funds have ongoing costs, sometimes referred to as operating expenses.
The following table shows ongoing costs of investing in the Fund and can help you understand these costs and compare them with those of other mutual funds. The table assumes a $1,000 investment held for the six months indicated.
Actual Fund Expenses
The first line (Actual) for each share class listed in the table provides actual account values and expenses. The “Ending Account Value” is derived from the Fund’s actual return, which includes the effect of Fund expenses.
You can estimate the expenses you paid during the period by following these steps. Of course, your account value and expenses will differ from those in this illustration:
| 1. | Divide your account value by $1,000. |
| | If an account had an $8,600 value, then $8,600 ÷ $1,000 = 8.6. |
| 2. | Multiply the result by the number under the heading “Expenses Paid During Period.” |
| | If Expenses Paid During Period were $7.50, then 8.6 x $7.50 = $64.50. |
In this illustration, the estimated expenses paid this period are $64.50.
Hypothetical Example for Comparison with Other Funds
Information in the second line (Hypothetical) for each class in the table can help you compare ongoing costs of investing in the Fund with those of other mutual funds. This information may not be used to estimate the actual ending account balance or expenses you paid during the period. The hypothetical “Ending Account Value” is based on the actual expense ratio for each class and an assumed 5% annual rate of return before expenses, which does not represent the Fund’s actual return. The figure under the heading “Expenses Paid During Period” shows the hypothetical expenses your account would have incurred under this scenario. You can compare this figure with the 5% hypothetical examples that appear in shareholder reports of other funds.
Please note that expenses shown in the table are meant to highlight ongoing costs and do not reflect any transaction costs, such as sales charges. Therefore, the second line for each class is useful in comparing ongoing costs only, and will not help you compare total costs of owning different funds. In addition, if transaction costs were included, your total costs would have been higher. Please refer to the Fund prospectus for additional information on operating expenses.
franklintempleton.com Annual Report | 13
| | | | | | |
| FRANKLIN WORLD PERSPECTIVES FUND | | | | |
| YOUR FUND’S EXPENSES | | | | | | |
| |
| |
| |
| | | Beginning Account | | Ending Account | | Expenses Paid During |
| Share Class | | Value 5/1/14 | | Value 10/31/14 | | Period* 5/1/14–10/31/14 |
| A | | | | | | |
| Actual | $ | 1,000 | $ | 1,010.80 | $ | 7.25 |
| Hypothetical (5% return before expenses) | $ | 1,000 | $ | 1,018.00 | $ | 7.27 |
| C | | | | | | |
| Actual | $ | 1,000 | $ | 1,007.70 | $ | 10.37 |
| Hypothetical (5% return before expenses) | $ | 1,000 | $ | 1,014.87 | $ | 10.41 |
| R | | | | | | |
| Actual | $ | 1,000 | $ | 1,009.30 | $ | 8.86 |
| Hypothetical (5% return before expenses) | $ | 1,000 | $ | 1,016.38 | $ | 8.89 |
| Advisor | | | | | | |
| Actual | $ | 1,000 | $ | 1,011.50 | $ | 6.34 |
| Hypothetical (5% return before expenses) | $ | 1,000 | $ | 1,018.90 | $ | 6.36 |
*Expenses are calculated using the most recent six-month expense ratio, net of expense waivers, annualized for each class (A: 1.43%; C: 2.05%;
R: 1.75%; and Advisor: 1.25%), multiplied by the average account value over the period, multiplied by 184/365 to reflect the one-half year period.
14 | Annual Report
franklintempleton.com
| | | | | | | | | | | | |
| | | FRANKLIN TEMPLETON INTERNATIONAL TRUST | |
| |
| |
| Financial Highlights | | | | | | | | | | | | |
| Franklin World Perspectives Fund | | | | | | | | | | | | |
| | | | | | Year Ended October 31, | | | | |
| | | 2014 | | | 2013 | | | 2012 | | | 2011 | a |
| Class A | | | | | | | | | | | | |
| Per share operating performance | | | | | | | | | | | | |
| (for a share outstanding throughout the year) | | | | | | | | | | | | |
| Net asset value, beginning of year | $ | 12.70 | | $ | 10.10 | | $ | 9.63 | | $ | 10.00 | |
| Income from investment operationsb: | | | | | | | | | | | | |
| Net investment incomec | | 0.04 | | | 0.09 | | | 0.07 | | | 0.05 | |
| Net realized and unrealized gains (losses) | | 0.58 | | | 2.63 | | | 0.50 | | | (0.41 | ) |
| Total from investment operations | | 0.62 | | | 2.72 | | | 0.57 | | | (0.36 | ) |
| Less distributions from net investment income | | (0.18 | ) | | (0.12 | ) | | (0.10 | ) | | (0.01 | ) |
| Net asset value, end of year | $ | 13.14 | | $ | 12.70 | | $ | 10.10 | | $ | 9.63 | |
| |
| Total returnd | | 4.92 | % | | 27.17 | % | | 5.97 | % | | (3.64 | )% |
| |
| Ratios to average net assetse | | | | | | | | | | | | |
| Expenses before waiver and payments by affiliates | | 1.92 | % | | 1.82 | % | | 1.98 | % | | 2.29 | % |
| Expenses net of waiver and payments by affiliates | | 1.39 | %f | | 1.35 | %f | | 1.37 | % | | 1.33 | %f |
| Net investment income | | 0.28 | % | | 0.76 | % | | 0.67 | % | | 0.54 | % |
| |
| Supplemental data | | | | | | | | | | | | |
| Net assets, end of year (000’s) | $ | 16,438 | | $ | 17,341 | | $ | 12,752 | | $ | 11,796 | |
| Portfolio turnover rate | | 79.24 | % | | 66.56 | % | | 62.96 | % | | 71.86 | % |
aFor the period December 16, 2010 (commencement of operations) to October 31, 2011.
bThe amount shown for a share outstanding throughout the period may not correlate with the Statement of Operations for the period due to the timing of sales and
repurchases of the Fund shares in relation to income earned and/or fluctuating fair value of the investments of the Fund.
cBased on average daily shares outstanding.
dTotal return does not reflect sales commissions or contingent deferred sales charges, if applicable, and is not annualized for periods less than one year.
eRatios are annualized for periods less than one year.
fBenefit of expense reduction rounds to less than 0.01%.
franklintempleton.com The accompanying notes are an integral part of these financial statements. | Annual Report | 15
| | | | | | | | | | | | |
| FRANKLIN TEMPLETON INTERNATIONAL TRUST | | | | | | | | | | | | |
| FINANCIAL HIGHLIGHTS | | | | | | | | | | | | |
| |
| |
| |
| Franklin World Perspectives Fund (continued) | | | | | | | | | | | | |
| | | | | | Year Ended October 31, | | | | |
| | | 2014 | | | 2013 | | | 2012 | | | 2011 | a |
| Class C | | | | | | | | | | | | |
| Per share operating performance | | | | | | | | | | | | |
| (for a share outstanding throughout the year) | | | | | | | | | | | | |
| Net asset value, beginning of year | $ | 12.61 | | $ | 10.04 | | $ | 9.57 | | $ | 10.00 | |
| Income from investment operationsb: | | | | | | | | | | | | |
| Net investment income (loss)c | | (0.05 | ) | | 0.01 | | | —d | | | (0.01 | ) |
| Net realized and unrealized gains (losses) | | 0.58 | | | 2.61 | | | 0.52 | | | (0.41 | ) |
| Total from investment operations | | 0.53 | | | 2.62 | | | 0.52 | | | (0.42 | ) |
| Less distributions from net investment income | | (0.12 | ) | | (0.05 | ) | | (0.05 | ) | | (0.01 | ) |
| Net asset value, end of year | $ | 13.02 | | $ | 12.61 | | $ | 10.04 | | $ | 9.57 | |
| |
| Total returne | | 4.22 | % | | 26.22 | % | | 5.38 | % | | (4.14 | )% |
| |
| Ratios to average net assetsf | | | | | | | | | | | | |
| Expenses before waiver and payments by affiliates | | 2.59 | % | | 2.51 | % | | 2.62 | % | | 3.00 | % |
| Expenses net of waiver and payments by affiliates | | 2.06 | %g | | 2.04 | %g | | 2.01 | % | | 2.04 | %g |
| Net investment income (loss) | | (0.39 | )% | | 0.07 | % | | 0.03 | % | | (0.17 | )% |
| |
| Supplemental data | | | | | | | | | | | | |
| Net assets, end of year (000’s) | $ | 4,185 | | $ | 3,849 | | $ | 2,820 | | $ | 2,689 | |
| Portfolio turnover rate | | 79.24 | % | | 66.56 | % | | 62.96 | % | | 71.86 | % |
aFor the period December 16, 2010 (commencement of operations) to October 31, 2011.
bThe amount shown for a share outstanding throughout the period may not correlate with the Statement of Operations for the period due to the timing of sales and
repurchases of the Fund shares in relation to income earned and/or fluctuating fair value of the investments of the Fund.
cBased on average daily shares outstanding.
dAmount rounds to less than $0.01 per share.
eTotal return does not reflect sales commissions or contingent deferred sales charges, if applicable, and is not annualized for periods less than one year.
fRatios are annualized for periods less than one year.
gBenefit of expense reduction rounds to less than 0.01%.
16 | Annual Report | The accompanying notes are an integral part of these financial statements. franklintempleton.com
| | | | | | | | | | | | |
| | | FRANKLIN TEMPLETON INTERNATIONAL TRUST | |
| | | | | | FINANCIAL HIGHLIGHTS | |
| |
| |
| |
| Franklin World Perspectives Fund (continued) | | | | | | | | | | | | |
| | | | | | Year Ended October 31, | | | | |
| | | 2014 | | | 2013 | | | 2012 | | | 2011 | a |
| Class R | | | | | | | | | | | | |
| Per share operating performance | | | | | | | | | | | | |
| (for a share outstanding throughout the year) | | | | | | | | | | | | |
| Net asset value, beginning of year | $ | 12.65 | | $ | 10.07 | | $ | 9.60 | | $ | 10.00 | |
| Income from investment operationsb: | | | | | | | | | | | | |
| Net investment income (loss)c | | (0.01 | ) | | 0.04 | | | 0.03 | | | 0.01 | |
| Net realized and unrealized gains (losses) | | 0.58 | | | 2.62 | | | 0.51 | | | (0.40 | ) |
| Total from investment operations | | 0.57 | | | 2.66 | | | 0.54 | | | (0.39 | ) |
| Less distributions from net investment income | | (0.14 | ) | | (0.08 | ) | | (0.07 | ) | | (0.01 | ) |
| Net asset value, end of year | $ | 13.08 | | $ | 12.65 | | $ | 10.07 | | $ | 9.60 | |
| |
| Total returnd | | 4.54 | % | | 26.58 | % | | 5.70 | % | | (3.94 | )% |
| |
| Ratios to average net assetse | | | | | | | | | | | | |
| Expenses before waiver and payments by affiliates | | 2.28 | % | | 2.22 | % | | 2.36 | % | | 2.71 | % |
| Expenses net of waiver and payments by affiliates | | 1.75 | %f | | 1.75 | %f | | 1.75 | % | | 1.75 | %f |
| Net investment income (loss) | | (0.08 | )% | | 0.36 | % | | 0.29 | % | | 0.12 | % |
| |
| Supplemental data | | | | | | | | | | | | |
| Net assets, end of year (000’s) | $ | 3,269 | | $ | 3,163 | | $ | 2,517 | | $ | 2,399 | |
| Portfolio turnover rate | | 79.24 | % | | 66.56 | % | | 62.96 | % | | 71.86 | % |
aFor the period December 16, 2010 (commencement of operations) to October 31, 2011.
bThe amount shown for a share outstanding throughout the period may not correlate with the Statement of Operations for the period due to the timing of sales and
repurchases of the Fund shares in relation to income earned and/or fluctuating fair value of the investments of the Fund.
cBased on average daily shares outstanding.
dTotal return is not annualized for periods less than one year.
eRatios are annualized for periods less than one year.
fBenefit of expense reduction rounds to less than 0.01%.
franklintempleton.com The accompanying notes are an integral part of these financial statements. | Annual Report | 17
FRANKLIN TEMPLETON INTERNATIONAL TRUST
FINANCIAL HIGHLIGHTS
| | | | | | | | | | | | |
| Franklin World Perspectives Fund (continued) | | | | | | | | | | | | |
| | | | | | Year Ended October 31, | | | | |
| | | 2014 | | | 2013 | | | 2012 | | | 2011 | a |
| Advisor Class | | | | | | | | | | | | |
| Per share operating performance | | | | | | | | | | | | |
| (for a share outstanding throughout the year) | | | | | | | | | | | | |
| Net asset value, beginning of year | $ | 12.72 | | $ | 10.12 | | $ | 9.64 | | $ | 10.00 | |
| Income from investment operationsb: | | | | | | | | | | | | |
| Net investment incomec | | 0.06 | | | 0.10 | | | 0.08 | | | 0.05 | |
| Net realized and unrealized gains (losses) | | 0.58 | | | 2.63 | | | 0.51 | | | (0.40 | ) |
| Total from investment operations | | 0.64 | | | 2.73 | | | 0.59 | | | (0.35 | ) |
| Less distributions from net investment income | | (0.19 | ) | | (0.13 | ) | | (0.11 | ) | | (0.01 | ) |
| Net asset value, end of year | $ | 13.17 | | $ | 12.72 | | $ | 10.12 | | $ | 9.64 | |
| |
| Total returnd | | 5.07 | % | | 27.26 | % | | 6.25 | % | | (3.54 | )% |
| |
| Ratios to average net assetse | | | | | | | | | | | | |
| Expenses before waiver and payments by affiliates | | 1.78 | % | | 1.72 | % | | 1.86 | % | | 2.21 | % |
| Expenses net of waiver and payments by affiliates | | 1.25 | %f | | 1.25 | %f | | 1.25 | % | | 1.25 | %f |
| Net investment income | | 0.42 | % | | 0.86 | % | | 0.79 | % | | 0.62 | % |
| |
| Supplemental data | | | | | | | | | | | | |
| Net assets, end of year (000’s) | $ | 12,818 | | $ | 13,567 | | $ | 10,662 | | $ | 10,047 | |
| Portfolio turnover rate | | 79.24 | % | | 66.56 | % | | 62.96 | % | | 71.86 | % |
aFor the period December 16, 2010 (commencement of operations) to October 31, 2011.
bThe amount shown for a share outstanding throughout the period may not correlate with the Statement of Operations for the period due to the timing of sales and
repurchases of the Fund shares in relation to income earned and/or fluctuating fair value of the investments of the Fund.
cBased on average daily shares outstanding.
dTotal return is not annualized for periods less than one year.
eRatios are annualized for periods less than one year.
fBenefit of expense reduction rounds to less than 0.01%.
18 | Annual Report | The accompanying notes are an integral part of these financial statements. franklintempleton.com
FRANKLIN TEMPLETON INTERNATIONAL TRUST
Statement of Investments, October 31, 2014
Franklin World Perspectives Fund
| | | | | |
| | Industry | Shares/Units | | | Value |
| Common Stocks and | | | | | |
| Other Equity Interests 97.6% | | | | | |
| Australia 2.0% | | | | | |
| Amcor Ltd. | Containers & Packaging | 9,934 | $ | | 102,461 |
| Australia & New Zealand Banking Group Ltd. | Banks | 666 | | | 19,635 |
| BHP Billiton Ltd. | Metals & Mining | 2,984 | | | 89,181 |
| Brambles Ltd. | Commercial Services & Supplies | 9,590 | | | 80,430 |
| Coca-Cola Amatil Ltd. | Beverages | 4,538 | | | 36,542 |
| Commonwealth Bank of Australia | Banks | 857 | | | 60,698 |
| Computershare Ltd. | IT Services | 8,621 | | | 93,091 |
| CSL Ltd. | Biotechnology | 1,358 | | | 95,836 |
| FlexiGroup Ltd. | Consumer Finance | 8,140 | | | 25,646 |
| Fortescue Metals Group Ltd. | Metals & Mining | 11,857 | | | 36,522 |
| Origin Energy Ltd. | Oil, Gas & Consumable Fuels | 1,205 | | | 15,133 |
| Woolworths Ltd. | Food & Staples Retailing | 1,724 | | | 54,619 |
| WorleyParsons Ltd. | Energy Equipment & Services | 1,075 | | | 12,828 |
| | | | | | 722,622 |
| Belgium 2.0% | | | | | |
| Anheuser-Busch InBev NV | Beverages | 3,701 | | | 408,760 |
| bpost SA | Air Freight & Logistics | 13,657 | | | 338,187 |
| | | | | | 746,947 |
| Brazil 0.5% | | | | | |
| Ambev SA | Beverages | 5,400 | | | 35,736 |
| Arteris SA | Transportation Infrastructure | 2,100 | | | 13,008 |
| BRF SA | Food Products | 1,400 | | | 36,432 |
| CETIP SA Mercados Organizados | Capital Markets | 1,800 | | | 22,807 |
| Cosan SA Industria e Comercio | Oil, Gas & Consumable Fuels | 700 | | | 9,770 |
| Estacio Participacoes SA | Diversified Consumer Services | 2,400 | | | 27,794 |
| Sul America SA | Insurance | 6,300 | | | 33,455 |
| aUsinas Siderurgicas de Minas Gerais SA | Metals & Mining | 4,400 | | | 11,718 |
| | | | | | 190,720 |
| Canada 4.2% | | | | | |
| Agrium Inc. | Chemicals | 300 | | | 29,358 |
| Alimentation Couche-Tard Inc., B | Food & Staples Retailing | 850 | | | 28,854 |
| ARC Resources Ltd. | Oil, Gas & Consumable Fuels | 300 | | | 7,077 |
| Bank of Montreal | Banks | 875 | | | 63,466 |
| Bank of Nova Scotia | Banks | 1,025 | | | 62,785 |
| Bonavista Energy Corp. | Oil, Gas & Consumable Fuels | 1,600 | | | 15,037 |
| Brookfield Asset Management Inc., A | Real Estate Management & Development | 1,750 | | | 85,683 |
| Calfrac Well Services Ltd. | Energy Equipment & Services | 975 | | | 11,681 |
| Canadian Imperial Bank of Commerce | Banks | 925 | | | 84,463 |
| Canadian National Railway Co. | Road & Rail | 1,525 | | | 107,540 |
| Canadian Natural Resources Ltd. | Oil, Gas & Consumable Fuels | 1,225 | | | 42,758 |
| Canadian Pacific Railway Ltd. | Road & Rail | 250 | | | 52,012 |
| Cenovus Energy Inc. | Oil, Gas & Consumable Fuels | 1,275 | | | 31,558 |
| Enbridge Inc. | Oil, Gas & Consumable Fuels | 1,525 | | | 72,176 |
| Franco-Nevada Corp. | Metals & Mining | 550 | | | 25,753 |
| Gildan Activewear Inc. | Textiles, Apparel & Luxury Goods | 250 | | | 14,896 |
| IGM Financial Inc. | Capital Markets | 600 | | | 24,004 |
| Keyera Corp. | Oil, Gas & Consumable Fuels | 200 | | | 15,914 |
| |
| |
| |
| franklintempleton.com | | Annual Report | | | 19 |
FRANKLIN TEMPLETON INTERNATIONAL TRUST
STATEMENT OF INVESTMENTS
| | | | |
| Franklin World Perspectives Fund (continued) | | | | |
| | Industry | Shares/Units | | Value |
| Common Stocks and | | | | |
| Other Equity Interests (continued) | | | | |
| Canada (continued) | | | | |
| MacDonald Dettwiler and Associates Ltd. | Aerospace & Defense | 640 | $ | 48,812 |
| Major Drilling Group International Inc. | Metals & Mining | 2,200 | | 12,847 |
| Manulife Financial Corp. | Insurance | 1,275 | | 24,203 |
| Metro Inc., A | Food & Staples Retailing | 725 | | 50,959 |
| Mullen Group Ltd. | Energy Equipment & Services | 675 | | 13,119 |
| aNuvista Energy Ltd. | Oil, Gas & Consumable Fuels | 4,550 | | 41,874 |
| Onex Corp. | Diversified Financial Services | 600 | | 33,861 |
| Potash Corp. of Saskatchewan Inc. | Chemicals | 925 | | 31,580 |
| Power Corp. of Canada | Insurance | 1,550 | | 40,910 |
| Power Financial Corp. | Insurance | 1,325 | | 38,816 |
| Rogers Communications Inc., B | Wireless Telecommunication Services | 1,025 | | 38,551 |
| Royal Bank of Canada | Banks | 1,000 | | 71,006 |
| Saputo Inc. | Food Products | 725 | | 20,577 |
| Savanna Energy Services Corp. | Energy Equipment & Services | 3,725 | | 20,100 |
| SNC-Lavalin Group Inc., A | Construction & Engineering | 725 | | 31,244 |
| Sun Life Financial Inc. | Insurance | 400 | | 14,232 |
| The Toronto-Dominion Bank | Banks | 1,500 | | 73,842 |
| Thomson Reuters Corp. | Media | 1,800 | | 66,981 |
| aTourmaline Oil Corp. | Oil, Gas & Consumable Fuels | 725 | | 26,013 |
| TransCanada Corp. | Oil, Gas & Consumable Fuels | 1,250 | | 61,624 |
| | | | | 1,536,166 |
| Chile 0.2% | | | | |
| iShares MSCI Chile Capped ETF | Foreign Equity | 1,394 | | 59,440 |
| China 2.2% | | | | |
| aAlibaba Group Holding Ltd., ADR | Internet Software & Services | 1,711 | | 168,705 |
| aBaidu Inc., ADR | Internet Software & Services | 514 | | 122,728 |
| China Huishan Dairy Holdings Co. Ltd. | Food Products | 118,000 | | 26,323 |
| China Merchants Bank Co. Ltd., H | Banks | 49,502 | | 91,787 |
| China Overseas Land & Investment Ltd. | Real Estate Management & Development | 40,000 | | 116,050 |
| China Resources Land Ltd. | Real Estate Management & Development | 4,000 | | 9,501 |
| China Shenhua Energy Co. Ltd., H | Oil, Gas & Consumable Fuels | 25,000 | | 70,274 |
| aCtrip.com International Ltd., ADR | Internet & Catalog Retail | 288 | | 16,790 |
| Dongfeng Motor Group Co. Ltd., H | Automobiles | 20,000 | | 30,895 |
| Minth Group Ltd. | Auto Components | 4,000 | | 7,685 |
| PetroChina Co. Ltd., H | Oil, Gas & Consumable Fuels | 40,000 | | 50,133 |
| Shenzhou International Group Holdings Ltd. | Textiles, Apparel & Luxury Goods | 5,000 | | 17,182 |
| Tencent Holdings Ltd. | Internet Software & Services | 5,200 | | 82,875 |
| | | | | 810,928 |
| Egypt 0.1% | | | | |
| Commercial International Bank Egypt SAE | Banks | 1,630 | | 11,148 |
| aEgyptian Financial Group-Hermes Holding | Capital Markets | 4,262 | | 10,091 |
| | | | | 21,239 |
| Euro Community 0.7% | | | | |
| iShares MSCI Emerging Markets Eastern | | | | |
| Europe ETF | Foreign Equity | 11,865 | | 253,674 |
| Finland 0.9% | | | | |
| Outotec OYJ | Construction & Engineering | 50,683 | | 335,127 |
20 | Annual Report
franklintempleton.com
FRANKLIN TEMPLETON INTERNATIONAL TRUST
STATEMENT OF INVESTMENTS
| | | | | |
| Franklin World Perspectives Fund (continued) | | | | | |
| | Industry | Shares/Units | | | Value |
| Common Stocks and | | | | | |
| Other Equity Interests (continued) | | | | | |
| France 3.4% | | | | | |
| Euler Hermes Group | Insurance | 3,197 | $ | | 313,221 |
| Legrand SA | Electrical Equipment | 7,185 | | | 386,735 |
| Neopost SA | Technology Hardware, Storage & Peripherals | 1,778 | | | 123,494 |
| Sanofi | Pharmaceuticals | 4,654 | | | 429,717 |
| | | | 1,253,167 |
| Germany 1.3% | | | | | |
| GFK AG | Media | 5,516 | | | 228,172 |
| Takkt AG | Internet & Catalog Retail | 17,142 | | | 267,197 |
| | | | | | 495,369 |
| Hong Kong 0.9% | | | | | |
| AIA Group Ltd. | Insurance | 29,800 | | | 166,190 |
| Dairy Farm International Holdings Ltd. | Food & Staples Retailing | 2,700 | | | 25,920 |
| Hong Kong Exchanges & Clearing Ltd. | Diversified Financial Services | 2,342 | | | 52,002 |
| Samsonite International SA | Textiles, Apparel & Luxury Goods | 10,200 | | | 33,867 |
| Sands China Ltd. | Hotels, Restaurants & Leisure | 1,200 | | | 7,481 |
| Techtronic Industries Co. Ltd. | Household Durables | 15,500 | | | 48,567 |
| | | | | | 334,027 |
| India 2.0% | | | | | |
| a,bFranklin India Growth Fund, Class R6 | Foreign Equity | 58,608 | | | 740,223 |
| Indonesia 0.5% | | | | | |
| Bank Central Asia Tbk PT | Banks | 58,500 | | | 63,171 |
| Jasa Marga Persero Tbk PT | Transportation Infrastructure | 20,800 | | | 10,929 |
| Kalbe Farma Tbk PT | Pharmaceuticals | 271,000 | | | 38,234 |
| Mayora Indah Tbk PT | Food Products | 7,600 | | | 17,782 |
| Mitra Adiperkasa Tbk PT | Multiline Retail | 17,900 | | | 7,850 |
| Surya Citra Media Tbk PT | Media | 113,985 | | | 31,880 |
| | | | | | 169,846 |
| Ireland 0.8% | | | | | |
| C&C Group PLC | Beverages | 63,590 | | | 283,290 |
| Italy 2.1% | | | | | |
| Banca Generali | Capital Markets | 14,875 | | | 394,359 |
| Prysmian SpA | Electrical Equipment | 21,887 | | | 378,608 |
| | | | | | 772,967 |
| Japan 5.8% | | | | | |
| Coca-Cola West Company Ltd. | Beverages | 3,773 | | | 53,906 |
| Daito Trust Construction Co. Ltd. | Real Estate Management & Development | 368 | | | 45,892 |
| Fuji Electric Co. Ltd. | Electrical Equipment | 13,461 | | | 59,191 |
| Hitachi Ltd. | Electronic Equipment, Instruments & Components | 9,541 | | | 75,032 |
| Hokuriku Electric Power Co. | Electric Utilities | 3,764 | | | 50,858 |
| Hoya Corp. | Electronic Equipment, Instruments & Components | 2,479 | | | 87,798 |
| INPEX Corp. | Oil, Gas & Consumable Fuels | 1,626 | | | 20,815 |
| ITOCHU Corp. | Trading Companies & Distributors | 10,499 | | | 127,025 |
| KDDI Corp. | Wireless Telecommunication Services | 778 | | | 51,134 |
| Keio Corp. | Road & Rail | 19,423 | | | 147,657 |
| Keyence Corp. | Electronic Equipment, Instruments & Components | 188 | | | 91,179 |
| Komatsu Ltd. | Machinery | 3,595 | | | 84,947 |
| Mazda Motor Corp. | Automobiles | 3,637 | | | 86,003 |
| |
| franklintempleton.com | | Annual Report | | | 21 |
FRANKLIN TEMPLETON INTERNATIONAL TRUST
STATEMENT OF INVESTMENTS
| | | | |
| Franklin World Perspectives Fund (continued) | | | | |
| | Industry | Shares/Units | | Value |
| Common Stocks and | | | | |
| Other Equity Interests (continued) | | | | |
| Japan (continued) | | | | |
| Mitsubishi Estate Co. Ltd. | Real Estate Management & Development | 4,571 | $ | 116,544 |
| Mitsubishi UFJ Financial Group Inc. | Banks | 17,826 | | 103,999 |
| Nippon Steel Sumitomo Metal Corp. | Metals & Mining | 19,462 | | 51,401 |
| Panasonic Corp. | Household Durables | 5,733 | | 69,033 |
| Seven & I Holdings Co. Ltd. | Food & Staples Retailing | 2,212 | | 86,465 |
| Shin-Etsu Chemical Co. Ltd. | Chemicals | 1,158 | | 74,393 |
| SoftBank Corp. | Wireless Telecommunication Services | 989 | | 72,060 |
| Sumitomo Mitsui Financial Group Inc. | Banks | 2,190 | | 89,390 |
| T&D Holdings Inc. | Insurance | 5,234 | | 67,479 |
| Takeda Pharmaceutical Co. Ltd. | Pharmaceuticals | 3,058 | | 132,671 |
| Toyota Industries Corp. | Auto Components | 2,278 | | 108,562 |
| Toyota Motor Corp. | Automobiles | 2,876 | | 173,216 |
| | | | | 2,126,650 |
| Kuwait 0.1% | | | | |
| Agility Public Warehousing Co. KSC | Air Freight & Logistics | 3,938 | | 11,942 |
| Kuwait Projects Co. Holding KSC | Diversified Financial Services | 4,419 | | 10,659 |
| | | | | 22,601 |
| Luxembourg 0.1% | | | | |
| L’Occitane International SA | Specialty Retail | 13,500 | | 31,856 |
| Malaysia 0.2% | | | | |
| a,c7-Eleven Malaysia Holdings Bhd., 144A | Food & Staples Retailing | 32,100 | | 16,291 |
| Nestle (Malaysia) Bhd. | Food Products | 1,600 | | 33,308 |
| Public Bank Bhd. | Banks | 7,500 | | 42,258 |
| | | | | 91,857 |
| Mexico 0.6% | | | | |
| iShares MSCI Mexico Capped ETF | Foreign Equity | 3,018 | | 206,582 |
| Netherlands 0.7% | | | | |
| Koninklijke Boskalis Westminster NV | Construction & Engineering | 4,632 | | 246,851 |
| Norway 0.9% | | | | |
| TGS Nopec Geophysical Co. ASA | Energy Equipment & Services | 14,734 | | 344,125 |
| Oman 0.0%† | | | | |
| Bank Muscat SAOG | Banks | 5,125 | | 9,318 |
| Qatar 0.1% | | | | |
| Doha Bank QSC | Banks | 714 | | 11,372 |
| Gulf International Services QSC | Energy Equipment & Services | 284 | | 9,281 |
| Qatar National Bank | Banks | 227 | | 13,358 |
| | | | | 34,011 |
| Singapore 0.6% | | | | |
| DBS Group Holdings Ltd. | Banks | 3,047 | | 43,830 |
| Ezion Holdings Ltd. | Energy Equipment & Services | 28,800 | | 33,851 |
| Global Logistic Properties Ltd. | Real Estate Management & Development | 21,000 | | 44,952 |
| OSIM International Ltd. | Specialty Retail | 14,000 | | 20,269 |
| Singapore Exchange Ltd. | Diversified Financial Services | 6,000 | | 32,693 |
| Singapore Technologies Engineering Ltd. | Aerospace & Defense | 6,000 | | 17,514 |
| Singapore Telecommunications Ltd. | Diversified Telecommunication Services | 10,000 | | 29,423 |
| | | | | 222,532 |
| |
| |
| 22 | Annual Report | | franklintempleton.com |
FRANKLIN TEMPLETON INTERNATIONAL TRUST
STATEMENT OF INVESTMENTS
| | | | | |
| Franklin World Perspectives Fund (continued) | | | | | |
| | Industry | Shares/Units | | | Value |
| Common Stocks and | | | | | |
| Other Equity Interests (continued) | | | | | |
| South Africa 0.5% | | | | | |
| iShares MSCI South Africa ETF | Foreign Equity | 2,614 | $ | | 178,771 |
| South Korea 1.8% | | | | | |
| Chinyang Holdings Corp. | Capital Markets | 3,631 | | | 16,262 |
| aGS Engineering & Construction Corp. | Construction & Engineering | 685 | | | 17,922 |
| Hana Financial Group Inc. | Banks | 757 | | | 26,114 |
| Hyundai Glovis Co. Ltd. | Air Freight & Logistics | 83 | | | 20,557 |
| Hyundai Mobis | Auto Components | 112 | | | 26,071 |
| Hyundai Motor Co. | Automobiles | 469 | | | 74,236 |
| Hyundai Wia Corp. | Auto Components | 235 | | | 40,370 |
| Kia Motors Corp. | Automobiles | 1,207 | | | 58,552 |
| POSCO | Metals & Mining | 127 | | | 36,184 |
| Samsung C&T Corp. | Trading Companies & Distributors | 550 | | | 37,025 |
| Samsung Electronics Co. Ltd. | Technology Hardware, Storage & Peripherals | 124 | | | 143,628 |
| c,dSamsung SDS Co. Ltd., 144A | IT Services | 639 | | | 113,045 |
| Shinsegae International Co. Ltd. | Specialty Retail | 180 | | | 20,950 |
| SK C&C Co., Ltd. | IT Services | 86 | | | 19,418 |
| | | | | | 650,334 |
| Spain 1.1% | | | | | |
| aMediaset Espana Comunicacion SA | Media | 32,915 | | | 412,218 |
| Sri Lanka 0.1% | | | | | |
| Nestle Lanka PLC | Food Products | 2,132 | | | 34,399 |
| Switzerland 0.5% | | | | | |
| Roche Holding AG | Pharmaceuticals | 623 | | | 183,736 |
| Taiwan 1.0% | | | | | |
| Cathay Financial Holding Co. Ltd. | Insurance | 37,650 | | | 61,794 |
| Chroma Ate Inc. | Electronic Equipment, Instruments & Components | 13,000 | | | 32,304 |
| aE Ink Holdings Inc. | Electronic Equipment, Instruments & Components | 15,000 | | | 7,287 |
| Epistar Corp. | Semiconductors & Semiconductor Equipment | 5,000 | | | 9,011 |
| aEvergreen Marine Corp. Ltd. | Marine | 71,000 | | | 41,834 |
| GeoVision Inc. | Electronic Equipment, Instruments & Components | 7,000 | | | 25,391 |
| Poya Co. Ltd. | Multiline Retail | 6,000 | | | 40,375 |
| President Chain Store Corp. | Food & Staples Retailing | 4,000 | | | 29,937 |
| Taiwan Semiconductor Manufacturing Co. Ltd. | Semiconductors & Semiconductor Equipment | 31,570 | | | 135,238 |
| | | | | | 383,171 |
| Thailand 0.8% | | | | | |
| AP Thailand PCL, fgn. | Real Estate Management & Development | 119,900 | | | 24,451 |
| Bangkok Bank PCL, fgn. | Banks | 2,800 | | | 17,344 |
| BEC World PCL, fgn. | Media | 18,100 | | | 26,781 |
| Bumrungrad Hospital PCL, fgn. | Health Care Providers & Services | 5,000 | | | 20,393 |
| CP ALL PCL, fgn. | Food & Staples Retailing | 19,500 | | | 27,208 |
| Kasikornbank PCL, fgn. | Banks | 6,300 | | | 45,593 |
| Major Cineplex Group PCL, fgn. | Media | 24,100 | | | 17,589 |
| MK Restaurant Group PCL, fgn. | Hotels, Restaurants & Leisure | 4,800 | | | 8,684 |
| PTT PCL, fgn. | Oil, Gas & Consumable Fuels | 3,400 | | | 38,369 |
| The Siam Cement PCL, fgn. | Construction Materials | 2,300 | | | 31,880 |
| Siam Commercial Bank PCL, fgn. | Banks | 9,890 | | | 53,832 |
| | | | | | 312,124 |
| |
| |
| franklintempleton.com | | Annual Report | | | 23 |
FRANKLIN TEMPLETON INTERNATIONAL TRUST
STATEMENT OF INVESTMENTS
| | | | |
| Franklin World Perspectives Fund (continued) | | | | |
| | Industry | Shares/Units | | Value |
| Common Stocks and | | | | |
| Other Equity Interests (continued) | | | | |
| United Arab Emirates 0.1% | | | | |
| Emaar Properties PJSC | Real Estate Management & Development | 4,565 | $ | 12,429 |
| Emirates REIT CEIC Ltd. | Real Estate Investment Trusts (REITs) | 5,775 | | 8,085 |
| First Gulf Bank PJSC | Banks | 2,185 | | 10,797 |
| | | | | 31,311 |
| United Kingdom 8.0% | | | | |
| Ashmore Group PLC | Capital Markets | 82,268 | | 419,330 |
| Berkeley Group Holdings PLC | Household Durables | 11,189 | | 408,136 |
| De La Rue PLC | Commercial Services & Supplies | 28,614 | | 239,190 |
| Drax Group PLC | Independent Power & | | | |
| | Renewable Electricity Producers | 40,221 | | 382,546 |
| IMI PLC | Machinery | 900 | | 17,595 |
| Imperial Tobacco Group PLC | Tobacco | 5,820 | | 252,425 |
| International Personal Finance PLC | Consumer Finance | 54,083 | | 420,337 |
| ITE Group PLC | Media | 60,572 | | 164,983 |
| Reckitt Benckiser Group PLC | Household Products | 2,176 | | 182,767 |
| Reed Elsevier NV | Media | 19,348 | | 445,401 |
| Rio Tinto Ltd. | Metals & Mining | 358 | | 19,033 |
| | | | | 2,951,743 |
| United States 50.8% | | | | |
| aActavis PLC | Pharmaceuticals | 2,000 | | 485,480 |
| Advance Auto Parts Inc. | Specialty Retail | 650 | | 95,524 |
| aAmazon.com Inc. | Internet & Catalog Retail | 880 | | 268,805 |
| American Tower Corp. | Real Estate Investment Trusts (REITs) | 3,100 | | 302,250 |
| AMETEK Inc. | Electrical Equipment | 2,500 | | 130,375 |
| Anadarko Petroleum Corp. | Oil, Gas & Consumable Fuels | 2,500 | | 229,450 |
| aANSYS Inc. | Software | 1,150 | | 90,344 |
| Apple Inc. | Technology Hardware, Storage & Peripherals | 5,900 | | 637,200 |
| Applied Materials Inc. | Semiconductors & Semiconductor Equipment | 7,500 | | 165,675 |
| aBiogen Idec Inc. | Biotechnology | 1,050 | | 337,134 |
| The Boeing Co. | Aerospace & Defense | 1,600 | | 199,856 |
| BorgWarner Inc. | Auto Components | 3,500 | | 199,570 |
| Bristol-Myers Squibb Co. | Pharmaceuticals | 5,000 | | 290,950 |
| aCavium Inc. | Semiconductors & Semiconductor Equipment | 3,000 | | 153,930 |
| aCelgene Corp. | Biotechnology | 4,000 | | 428,360 |
| aCerner Corp. | Health Care Technology | 2,500 | | 158,350 |
| aCharter Communications Inc., A | Media | 1,200 | | 190,068 |
| aChuy’s Holdings Inc. | Hotels, Restaurants & Leisure | 4,250 | | 127,118 |
| aCognizant Technology Solutions Corp., A | IT Services | 5,350 | | 261,347 |
| aConcho Resources Inc. | Oil, Gas & Consumable Fuels | 1,300 | | 141,739 |
| aCoStar Group Inc. | Internet Software & Services | 950 | | 153,036 |
| Cytec Industries Inc. | Chemicals | 7,700 | | 359,051 |
| Discover Financial Services | Consumer Finance | 4,700 | | 299,766 |
| Ecolab Inc. | Chemicals | 3,890 | | 432,685 |
| aFacebook Inc., A | Internet Software & Services | 4,900 | | 367,451 |
| aGilead Sciences Inc. | Biotechnology | 2,400 | | 268,800 |
| Google Inc., A | Internet Software & Services | 1,240 | | 704,159 |
| aHD Supply Holdings Inc. | Trading Companies & Distributors | 5,500 | | 158,620 |
| Honeywell International Inc. | Aerospace & Defense | 2,570 | | 247,028 |
24 | Annual Report
franklintempleton.com
FRANKLIN TEMPLETON INTERNATIONAL TRUST
STATEMENT OF INVESTMENTS
| | | | | |
| Franklin World Perspectives Fund (continued) | | | | | |
| | Industry | Shares/Units | | | Value |
| Common Stocks and | | | | | |
| Other Equity Interests (continued) | | | | | |
| United States (continued) | | | | | |
| aHub Group Inc., A | Air Freight & Logistics | 4,600 | $ | | 166,934 |
| aIHS Inc., A | Professional Services | 1,830 | | | 239,785 |
| aIllumina Inc. | Life Sciences Tools & Services | 1,700 | | | 327,386 |
| aInsulet Corp. | Health Care Equipment & Supplies | 3,430 | | | 148,073 |
| Intercontinental Exchange Inc. | Diversified Financial Services | 750 | | | 156,218 |
| aJazz Pharmaceuticals PLC | Pharmaceuticals | 900 | | | 151,956 |
| Kansas City Southern | Road & Rail | 1,000 | | | 122,790 |
| aLiberty TripAdvisor Holdings Inc., A | Internet & Catalog Retail | 2,200 | | | 69,476 |
| aLinkedIn Corp., A | Internet Software & Services | 350 | | | 80,136 |
| aLKQ Corp. | Distributors | 6,000 | | | 171,420 |
| MasterCard Inc., A | IT Services | 6,300 | | | 527,625 |
| McKesson Corp. | Health Care Providers & Services | 1,450 | | | 294,944 |
| Mead Johnson Nutrition Co., A | Food Products | 1,200 | | | 119,172 |
| aMichael Kors Holdings Ltd. | Textiles, Apparel & Luxury Goods | 1,420 | | | 111,598 |
| Microchip Technology Inc. | Semiconductors & Semiconductor Equipment | 6,000 | | | 258,660 |
| aMobileye NV | Software | 800 | | | 41,608 |
| aMonster Beverage Corp. | Beverages | 1,960 | | | 197,725 |
| aNetSuite Inc. | Software | 1,000 | | | 108,660 |
| Nielsen NV | Professional Services | 1,970 | | | 83,705 |
| NIKE Inc., B | Textiles, Apparel & Luxury Goods | 2,030 | | | 188,729 |
| Oceaneering International Inc. | Energy Equipment & Services | 3,050 | | | 214,324 |
| Oracle Corp. | Software | 3,400 | | | 132,770 |
| Pall Corp. | Machinery | 2,400 | | | 219,408 |
| Perrigo Co. PLC | Pharmaceuticals | 1,470 | | | 237,332 |
| Praxair Inc. | Chemicals | 1,300 | | | 163,787 |
| Precision Castparts Corp. | Aerospace & Defense | 1,150 | | | 253,805 |
| aThe Priceline Group Inc. | Internet & Catalog Retail | 330 | | | 398,049 |
| QUALCOMM Inc. | Communications Equipment | 2,600 | | | 204,126 |
| aQuintiles Transnational Holdings Inc. | Life Sciences Tools & Services | 2,400 | | | 140,496 |
| Resmed Inc., CDI | Health Care Equipment & Supplies | 17,100 | | | 89,089 |
| Rockwell Automation Inc. | Electrical Equipment | 430 | | | 48,311 |
| Roper Industries Inc. | Industrial Conglomerates | 1,650 | | | 261,195 |
| aSalesforce.com Inc. | Software | 3,900 | | | 249,561 |
| SanDisk Corp. | Technology Hardware, Storage & Peripherals | 1,500 | | | 141,210 |
| Schlumberger Ltd. | Energy Equipment & Services | 2,300 | | | 226,918 |
| aSignature Bank | Banks | 2,350 | | | 284,655 |
| aSirius XM Holdings Inc. | Media | 46,000 | | | 157,780 |
| Starbucks Corp. | Hotels, Restaurants & Leisure | 1,790 | | | 135,252 |
| aStericycle Inc. | Commercial Services & Supplies | 1,650 | | | 207,900 |
| aSVB Financial Group | Banks | 1,900 | | | 212,781 |
| T. Rowe Price Group Inc. | Capital Markets | 2,600 | | | 213,434 |
| aTesla Motors Inc. | Automobiles | 500 | | | 120,850 |
| Time Warner Inc. | Media | 2,000 | | | 158,940 |
| Tractor Supply Co. | Specialty Retail | 1,650 | | | 120,813 |
| aTRI Pointe Homes Inc. | Household Durables | 8,000 | | | 109,520 |
| aTrimble Navigation Ltd. | Electronic Equipment, Instruments & Components | 4,000 | | | 107,440 |
| aUnder Armour Inc., A | Textiles, Apparel & Luxury Goods | 2,550 | | | 167,229 |
| Union Pacific Corp. | Road & Rail | 2,500 | | | 291,125 |
| aUnited Rentals Inc. | Trading Companies & Distributors | 2,130 | | | 234,428 |
| Vanguard Consumer Discretionary ETF | Diversified Consumer Services | 1,950 | | | 216,957 |
| Vanguard Financials ETF | Diversified Financial Services | 6,423 | | | 309,653 |
| |
| |
| franklintempleton.com | | Annual Report | | | 25 |
FRANKLIN TEMPLETON INTERNATIONAL TRUST
STATEMENT OF INVESTMENTS
| | | | |
| Franklin World Perspectives Fund (continued) | | | | |
| | Industry | Shares/Units | | Value |
| Common Stocks and | | | | |
| Other Equity Interests (continued) | | | | |
| United States (continued) | | | | |
| Vanguard Telecommunication Services ETF | Diversified Telecommunication Services | 502 | $ | 44,738 |
| Vanguard Utilities ETF | Electric Utilities | 524 | | 51,855 |
| Visa Inc., A | IT Services | 1,750 | | 422,502 |
| The Walt Disney Co. | Media | 2,850 | | 260,433 |
| Wells Fargo & Co. | Banks | 3,770 | | 200,149 |
| Whole Foods Market Inc. | Food & Staples Retailing | 1,200 | | 47,196 |
| Wynn Resorts Ltd. | Hotels, Restaurants & Leisure | 780 | | 148,208 |
| | | | | 18,654,940 |
| Total Common Stocks and Other Equity | | | | |
| Interests (Cost $29,047,633) | | | | 35,854,882 |
| eParticipatory Notes 0.2% | | | | |
| Saudi Arabia 0.2% | | | | |
| HSBC Bank PLC, | | | | |
| Abdullah A.M. Al-khodari Sons Co., 2/12/16 | Construction & Engineering | 662 | | 13,146 |
| Banque Saudi Fransi, 2/23/15 | Banks | 977 | | 9,583 |
| aDar Al Arkan Real Estate Development Co., | | | | |
| 8/10/15 | Real Estate Management & Development | 2,680 | | 9,251 |
| c Etihad Etisalat Co., 144A, 12/05/14 | Wireless Telecommunication Services | 421 | | 8,935 |
| National Industrialization Co., 10/31/16 | Industrial Conglomerates | 972 | | 7,928 |
| c Samba Financial Group, 144A, 6/29/17 | Industrial Conglomerates | 796 | | 9,717 |
| c Saudi Basic Industries Corp., 144A, 10/31/16 | Chemicals | 283 | | 8,354 |
| Merrill Lynch International & Co. CV, Al Tayyar Travel | | | | |
| Group, 6/10/15 | Hotels, Restaurants & Leisure | 250 | | 9,112 |
| Total Participatory Notes | | | | |
| (Cost $60,770) | | | | 76,026 |
| Preferred Stocks 0.6% | | | | |
| Brazil 0.4% | | | | |
| Banco Bradesco SA, pfd. | Banks | 800 | | 12,047 |
| Cia de Saneamento do Parana, pfd. | Water Utilities | 10,700 | | 25,388 |
| Companhia Brasileira de Distribuicao, pfd., A | Food & Staples Retailing | 500 | | 20,963 |
| Itausa - Investimentos Itau SA, pfd. | Banks | 11,175 | | 44,597 |
| Petroleo Brasileiro SA, pfd. | Oil, Gas & Consumable Fuels | 2,200 | | 13,565 |
| Suzano Papel e Celulose SA, pfd., A | Paper & Forest Products | 5,600 | | 23,636 |
| | | | | 140,196 |
| South Korea 0.2% | | | | |
| Samsung Electronics Co. Ltd., pfd. | Technology Hardware, Storage & Peripherals | 77 | | 70,619 |
| Total Preferred Stocks | | | | |
| (Cost $216,312) | | | | 210,815 |
| Total Investments before Short Term | | | | |
| Investments (Cost $29,324,715) | | | | 36,141,723 |
26 | Annual Report
franklintempleton.com
FRANKLIN TEMPLETON INTERNATIONAL TRUST
STATEMENT OF INVESTMENTS
Franklin World Perspectives Fund (continued)
| | | | |
| | | Principal | | |
| | | Amount | | Value |
| Short Term Investments | | | | |
| (Cost $295,000) 0.9% | | | | |
| U.S. Government and Agency Securities 0.9% | | | | |
| United States 0.9% | | | | |
| fFHLB, 11/03/14 | $ | 295,000 | $ | 295,000 |
| Total Investments | | | | |
| (Cost $29,619,715) 99.3% | | | | 36,436,723 |
| Other Assets, less Liabilities 0.7% | | | | 274,187 |
| Net Assets 100.0% | | | $ | 36,710,910 |
|
| †Rounds to less than 0.1% of net assets. |
| aNon-income producing. |
| bSee Note 3(f) regarding investments in Franklin India Growth Fund. |
| cSecurity was purchased pursuant to Rule 144A under the Securities Act of 1933 and may be sold in transactions exempt from registration only to qualified institutional buyers |
| or in a public offering registered under the Securities Act of 1933. These securities have been deemed liquid under guidelines approved by the Trust’s Board of Trustees. At |
| October 31, 2014, the aggregate value of these securities was $156,342, representing 0.43% of net assets. |
| dSecurity purchased on a delayed delivery basis. See Note 1(c). |
| eSee Note 1(e) regarding Participatory Notes. |
| fThe security is traded on a discount basis with no stated coupon rate. |
At October 31, 2014, the Fund had the following forward exchange contracts outstanding. See Note 1(d).
| | | | | | | | | |
| Forward Exchange Contracts | | | | | | | | | |
| | | | | | Contract | Settlement | | Unrealized | Unrealized |
| Currency | Counterpartya | Type | Quantity | | Amount | Date | | Appreciation | Depreciation |
| Japanese Yen | BKF | Sell | 146,838,405 | $ | 1,439,098 | 12/24/14 | $ | 129,830 | — |
| Net unrealized appreciation (depreciation) | | | | | | $ | 129,830 | |
aMay be comprised of multiple contracts with the same counterparty, currency and settlement date.
See Abbreviations on page 41.
franklintempleton.com The accompanying notes are an integral part of these financial statements. | Annual Report | 27
FRANKLIN TEMPLETON INTERNATIONAL TRUST
Financial Statements
Statement of Assets and Liabilities
October 31, 2014
| | | |
| Franklin World Perspectives Fund | | | |
| |
| Assets: | | | |
| Investments in securities: | | | |
| Cost - Unaffiliated issuers | $ | 29,073,719 | |
| Cost - Non-controlled affiliated issuers (Note 3f) | | 545,996 | |
| Total cost of investments | $ | 29,619,715 | |
| Value - Unaffiliated issuers | $ | 35,696,500 | |
| Value - Non-controlled affiliated issuers (Note 3f) | | 740,223 | |
| Total value of investments | | 36,436,723 | |
| Cash | | 118,180 | |
| Foreign currency, at value (cost $94,497) | | 94,497 | |
| Receivables: | | | |
| Investment securities sold | | 101,891 | |
| Capital shares sold | | 24,581 | |
| Dividends | | 34,630 | |
| Unrealized appreciation on forward exchange contracts | | 129,830 | |
| Other assets | | 7 | |
| Total assets | | 36,940,339 | |
| Liabilities: | | | |
| Payables: | | | |
| Investment securities purchased | | 188,845 | |
| Capital shares redeemed | | 1,630 | |
| Management fees | | 2,179 | |
| Distribution fees | | 10,250 | |
| Transfer agent fees | | 2,566 | |
| Reports to shareholders | | 11,258 | |
| Accrued expenses and other liabilities | | 12,701 | |
| Total liabilities | | 229,429 | |
| Net assets, at value | $ | 36,710,910 | |
| Net assets consist of: | | | |
| Paid-in capital | $ | 27,430,490 | |
| Distributions in excess of net investment income | | (106,315 | ) |
| Net unrealized appreciation (depreciation) | | 6,946,838 | |
| Accumulated net realized gain (loss) | | 2,439,897 | |
| Net assets, at value | $ | 36,710,910 | |
28 | Annual Report | The accompanying notes are an integral part of these financial statements.
franklintempleton.com
FRANKLIN TEMPLETON INTERNATIONAL TRUST
FINANCIAL STATEMENTS
| | |
| Statement of Assets and Liabilities (continued) | | |
| October 31, 2014 | | |
| |
| Class A: | | |
| Net assets, at value | $ | 16,438,302 |
| Shares outstanding | | 1,251,341 |
| Net asset value per sharea | $ | 13.14 |
| Maximum offering price per share (net asset value per share ÷ 94.25%) | $ | 13.94 |
| Class C: | | |
| Net assets, at value | $ | 4,184,848 |
| Shares outstanding | | 321,499 |
| Net asset value and maximum offering price per sharea | $ | 13.02 |
| Class R: | | |
| Net assets, at value | $ | 3,269,295 |
| Shares outstanding | | 250,000 |
| Net asset value and maximum offering price per share | $ | 13.08 |
| Advisor Class: | | |
| Net assets, at value | $ | 12,818,465 |
| Shares outstanding | | 973,529 |
| Net asset value and maximum offering price per share | $ | 13.17 |
aRedemption price is equal to net asset value less contingent deferred sales charges, if applicable.
franklintempleton.com The accompanying notes are an integral part of these financial statements. | Annual Report | 29
FRANKLIN TEMPLETON INTERNATIONAL TRUST
FINANCIAL STATEMENTS
Statement of Operations
for the year ended October 31, 2014
| | | |
| Franklin World Perspectives Fund | | | |
| |
| Investment income: | | | |
| Dividends (net of foreign taxes of $45,285) | $ | 630,492 | |
| Interest | | 27 | |
| Total investment income | | 630,519 | |
| Expenses: | | | |
| Management fees (Note 3a) | | 396,044 | |
| Distribution fees: (Note 3c) | | | |
| Class A | | 23,627 | |
| Class C | | 33,577 | |
| Class R | | 16,282 | |
| Transfer agent fees: (Note 3e) | | | |
| Class A | | 8,655 | |
| Class C | | 2,128 | |
| Class R | | 1,668 | |
| Advisor Class | | 6,894 | |
| Custodian fees (Note 4) | | 8,621 | |
| Reports to shareholders | | 27,782 | |
| Registration and filing fees | | 61,290 | |
| Professional fees | | 113,924 | |
| Other | | 44,501 | |
| Total expenses | | 744,993 | |
| Expense reductions (Note 4) | | (74 | ) |
| Expenses waived/paid by affiliates (Notes 3f and 3g) | | (200,349 | ) |
| Net expenses | | 544,570 | |
| Net investment income | | 85,949 | |
| Realized and unrealized gains (losses): | | | |
| Net realized gain (loss) from: | | | |
| Investments: | | | |
| Unaffiliated issuers | | 3,286,865 | |
| Non-controlled affiliated issuers (Note 3f) | | 24,864 | |
| Foreign currency transactions | | 55,546 | |
| Net realized gain (loss) | | 3,367,275 | |
| Net change in unrealized appreciation (depreciation) on: | | | |
| Investments | | (1,778,398 | ) |
| Translation of other assets and liabilities denominated in foreign currencies | | 118,244 | |
| Net change in unrealized appreciation (depreciation) | | (1,660,154 | ) |
| Net realized and unrealized gain (loss) | | 1,707,121 | |
| Net increase (decrease) in net assets resulting from operations | $ | 1,793,070 | |
30 | Annual Report | The accompanying notes are an integral part of these financial statements. franklintempleton.com
FRANKLIN TEMPLETON INTERNATIONAL TRUST
FINANCIAL STATEMENTS
| | | | | | |
| Statements of Changes in Net Assets | | | | | | |
| |
| |
| Franklin World Perspectives Fund | | | | | | |
| |
| | | Year Ended October 31, | |
| | | 2014 | | | 2013 | |
| Increase (decrease) in net assets: | | | | | | |
| Operations: | | | | | | |
| Net investment income | $ | 85,949 | | $ | 227,050 | |
| Net realized gain (loss) from investments and foreign currency transactions | | 3,367,275 | | | 1,384,827 | |
| Net change in unrealized appreciation (depreciation) on investments and translation of other assets and | | | | | | |
| liabilities denominated in foreign currencies | | (1,660,154 | ) | | 6,288,929 | |
| Net increase (decrease) in net assets resulting from operations | | 1,793,070 | | | 7,900,806 | |
| Distributions to shareholders from: | | | | | | |
| Net investment income: | | | | | | |
| Class A | | (252,661 | ) | | (147,436 | ) |
| Class C | | (36,819 | ) | | (14,288 | ) |
| Class R | | (34,550 | ) | | (19,577 | ) |
| Advisor Class | | (203,228 | ) | | (134,853 | ) |
| Total distributions to shareholders | | (527,258 | ) | | (316,154 | ) |
| Capital share transactions: (Note 2) | | | | | | |
| Class A | | (1,485,847 | ) | | 1,166,985 | |
| Class C | | 205,295 | | | 277,524 | |
| Class R | | — | | | (251 | ) |
| Advisor Class | | (1,194,694 | ) | | 140,431 | |
| Total capital share transactions | | (2,475,246 | ) | | 1,584,689 | |
| Net increase (decrease) in net assets | | (1,209,434 | ) | | 9,169,341 | |
| Net assets: | | | | | | |
| Beginning of year | | 37,920,344 | | | 28,751,003 | |
| End of year | $ | 36,710,910 | | $ | 37,920,344 | |
| Undistributed net investment income (distributions in excess of net investment income) included in | | | | | | |
| net assets: | | | | | | |
| End of year | $ | (106,315 | ) | $ | 171,415 | |
franklintempleton.com The accompanying notes are an integral part of these financial statements. | Annual Report | 31
FRANKLIN TEMPLETON INTERNATIONAL TRUST
Notes to Financial Statements
Franklin World Perspectives Fund
1. Organization and Significant Accounting Policies
Franklin Templeton International Trust (Trust) is registered under the Investment Company Act of 1940, as amended, (1940 Act) as an open-end management investment company, consisting of four separate funds. Franklin World Perspectives Fund (Fund) is included in this report. The financial statements of the remaining funds in the Trust are presented separately. The Fund offers four classes of shares: Class A, Class C, Class R, and Advisor Class. Each class of shares differs by its initial sales load, contingent deferred sales charges, voting rights on matters affecting a single class, its exchange privilege and fees primarily due to differing arrangements for distribution and transfer agent fees.
The following summarizes the Fund’s significant accounting policies.
a. Financial Instrument Valuation
The Fund’s investments in financial instruments are carried at fair value daily. Fair value is the price that would be received to sell an asset or paid to transfer a liability in an orderly transaction between market participants on the measurement date. The Fund calculates the net asset value (NAV) per share at the close of the New York Stock Exchange (NYSE), generally at 4 p.m. Eastern time (NYSE close) on each day the NYSE is open for trading. Under compliance policies and procedures approved by the Trust’s Board of Trustees (the Board), the Fund’s administrator has responsibility for oversight of valuation, including leading the cross-functional Valuation and Liquidity Oversight Committee (VLOC). The VLOC provides administration and oversight of the Fund’s valuation policies and procedures, which are approved annually by the Board. Among other things, these procedures allow the Fund to utilize independent pricing services, quotations from securities and financial instrument dealers, and other market sources to determine fair value.
Equity securities and exchange traded funds listed on an exchange or on the NASDAQ National Market System are valued at the last quoted sale price or the official closing price of the day, respectively. Foreign equity securities are valued as of the close of trading on the foreign stock exchange on which the security is primarily traded or as of the NYSE close, whichever is earlier. The value is then converted into its U.S. dollar equivalent at the foreign exchange rate in effect at the NYSE close on the day that the value of the security is determined. Over-the-counter (OTC) securities are valued within the range of the most recent quoted bid and ask prices. Securities that trade in multiple markets or on multiple exchanges are valued according to the broadest and most representative market. Certain equity securities are valued based upon fundamental characteristics or relationships to similar securities. Investments in open-end mutual funds are valued at the closing net asset value.
Debt securities generally trade in the OTC market rather than on a securities exchange. The Fund’s pricing services use multiple valuation techniques to determine fair value. In instances where sufficient market activity exists, the pricing services may utilize a market-based approach through which quotes from market makers are used to determine fair value. In instances where sufficient market activity may not exist or is limited, the pricing services also utilize proprietary valuation models which may consider market characteristics such as benchmark yield curves, credit spreads, estimated default rates, anticipated market interest rate volatility, coupon rates, anticipated timing of principal repayments, underlying collateral, and other unique security features in order to estimate the relevant cash flows, which are then discounted to calculate the fair value. Securities denominated in a foreign currency are converted into their U.S. dollar equivalent at the foreign exchange rate in effect at the NYSE close on the date that the values of the foreign debt securities are determined.
Certain derivative financial instruments (derivatives) trade in the OTC market. The Fund’s pricing services use various techniques including industry standard option pricing models and proprietary discounted cash flow models to determine the fair value of those instruments. The Fund’s net benefit or obligation under the derivative contract, as measured by the fair value of the contract, is included in net assets.
The Fund has procedures to determine the fair value of financial instruments for which market prices are not reliable or readily available. Under these procedures, the VLOC convenes on a regular basis to review such financial instruments and considers a number of factors, including significant unobservable valuation inputs, when arriving at fair value. The VLOC primarily employs a market-based approach which may use related or comparable assets or liabilities, recent transactions, market multiples, book values, and other relevant information for the investment to determine the fair value of the investment.
32 | Annual Report franklintempleton.com
FRANKLIN TEMPLETON INTERNATIONAL TRUST
NOTES TO FINANCIAL STATEMENTS
Franklin World Perspectives Fund (continued)
An income-based valuation approach may also be used in which the anticipated future cash flows of the investment are discounted to calculate fair value. Discounts may also be applied due to the nature or duration of any restrictions on the disposition of the investments. Due to the inherent uncertainty of valuations of such investments, the fair values may differ significantly from the values that would have been used had an active market existed. The VLOC employs various methods for calibrating these valuation approaches including a regular review of key inputs and assumptions, transactional back-testing or disposition analysis, and reviews of any related market activity.
Trading in securities on foreign securities stock exchanges and OTC markets may be completed before the daily NYSE close. In addition, trading in certain foreign markets may not take place on every NYSE business day. Occasionally, events occur between the time at which trading in a foreign security is completed and the close of the NYSE that might call into question the reliability of the value of a portfolio security held by the Fund. As a result, differences may arise between the value of the Fund’s portfolio securities as determined at the foreign market close and the latest indications of value at the close of the NYSE. In order to minimize the potential for these differences, the VLOC monitors price movements following the close of trading in foreign stock markets through a series of country specific market proxies (such as baskets of American Depositary Receipts, futures contracts and exchange traded funds). These price movements are measured against established trigger thresholds for each specific market proxy to assist in determining if an event has occurred that may call into question the reliability of the values of the foreign securities held by the Fund. If such an event occurs, the securities may be valued using fair value procedures, which may include the use of independent pricing services. At October 31, 2014, a market event occurred resulting in a portion of the securities held by the Fund being valued using fair value procedures.
Also, when the last day of the reporting period is a non-business day, certain foreign markets may be open on those days that the NYSE is closed, which could result in differences between the value of the Fund’s portfolio securities on the last business day and the last calendar day of the reporting period. Any significant security valuation changes due to an open foreign market are adjusted and reflected by the Fund for financial reporting purposes.
b. Foreign Currency Translation
Portfolio securities and other assets and liabilities denominated in foreign currencies are translated into U.S. dollars based on the exchange rate of such currencies against U.S. dollars on the date of valuation. The Fund may enter into foreign currency exchange contracts to facilitate transactions denominated in a foreign currency. Purchases and sales of securities, income and expense items denominated in foreign currencies are translated into U.S. dollars at the exchange rate in effect on the transaction date. Portfolio securities and assets and liabilities denominated in foreign currencies contain risks that those currencies will decline in value relative to the U.S. dollar. Occasionally, events may impact the availability or reliability of foreign exchange rates used to convert the U.S. dollar equivalent value. If such an event occurs, the foreign exchange rate will be valued at fair value using procedures established and approved by the Board.
The Fund does not separately report the effect of changes in foreign exchange rates from changes in market prices on securities held. Such changes are included in net realized and unrealized gain or loss from investments on the Statement of Operations.
Realized foreign exchange gains or losses arise from sales of foreign currencies, currency gains or losses realized between the trade and settlement dates on securities transactions and the difference between the recorded amounts of dividends, interest, and foreign withholding taxes and the U.S. dollar equivalent of the amounts actually received or paid. Net unrealized foreign exchange gains and losses arise from changes in foreign exchange rates on foreign denominated assets and liabilities other than investments in securities held at the end of the reporting period.
c. Securities Purchased on a Delayed Delivery Basis
The Fund purchases securities on a delayed delivery basis, with payment and delivery scheduled for a future date. These transactions are subject to market fluctuations and are subject to the risk that the value at delivery may be more or less than the trade date purchase price. Although the Fund will generally purchase these securities with the intention of holding the securities, it may sell the securities before the settlement date. Sufficient assets have been segregated for these securities.
franklintempleton.com Annual Report | 33
FRANKLIN TEMPLETON INTERNATIONAL TRUST
NOTES TO FINANCIAL STATEMENTS
Franklin World Perspectives Fund (continued)
1. Organization and Significant Accounting
Policies (continued)
d. Derivative Financial Instruments
The Fund invested in derivatives in order to manage risk or gain exposure to various other investments or markets. Derivatives are financial contracts based on an underlying or notional amount, require no initial investment or an initial net investment that is smaller than would normally be required to have a similar response to changes in market factors, and require or permit net settlement. Derivatives contain various risks including the potential inability of the counterparty to fulfill their obligations under the terms of the contract, the potential for an illiquid secondary market, and/or the potential for market movements which expose the Fund to gains or losses in excess of the amounts shown on the Statement of Assets and Liabilities. Realized gain and loss and unrealized appreciation and depreciation on these contracts for the period are included in the Statement of Operations.
Derivative counterparty credit risk is managed through a formal evaluation of the creditworthiness of all potential counterparties. The Fund attempts to reduce its exposure to counterparty credit risk on OTC derivatives, whenever possible, by entering into International Swaps and Derivatives Association (ISDA) master agreements with certain counterparties. These agreements contain various provisions, including but not limited to collateral requirements, events of default, or early termination. Termination events applicable to the counterparty include certain deteriorations in the credit quality of the counterparty. Termination events applicable to the Fund include failure of the Fund to maintain certain net asset levels and/or limit the decline in net assets over various periods of time. In the event of default or early termination, the ISDA master agreement gives the non-defaulting party the right to net and close-out all transactions traded, whether or not arising under the ISDA agreement, to one net amount payable by one counterparty to the other. However, absent an event of default or early termination, OTC derivative assets and liabilities are presented gross and not offset in the Statement of Assets and Liabilities. Early termination by the counterparty may result in an immediate payment by the Fund of any net liability owed to that counterparty under the ISDA agreement. At October 31, 2014, the Fund had no OTC derivatives in a net liability position for such contracts.
Collateral requirements differ by type of derivative. Collateral terms are contract specific for OTC derivatives. For OTC derivatives traded under an ISDA master agreement, posting of collateral is required by either the fund or the applicable coun-terparty if the total net exposure of all OTC derivatives with the applicable counterparty exceeds the minimum transfer amount, which typically ranges from $100,000 to $250,000, and can vary depending on the counterparty and the type of the agreement. Generally, collateral is determined at the close of fund business each day and any additional collateral required due to changes in derivative values may be delivered by the fund or the coun-terparty within a few business days. Collateral pledged and/or received by the fund, if any, is held in segregated accounts with the fund’s custodian/counterparty broker and can be in the form of cash and/or securities. Unrestricted cash may be invested according to the Fund’s investment objectives.
The Fund entered into OTC forward exchange contracts primarily to manage and/or gain exposure to certain foreign currencies. A forward exchange contract is an agreement between the Fund and a counterparty to buy or sell a foreign currency at a specific exchange rate on a future date.
See Note 8 regarding other derivative information.
e. Participatory Notes
The Fund invests in Participatory Notes (P-Notes). P-notes are promissory notes that are designed to offer a return linked to the performance of a particular underlying equity security or market. P-Notes are issued by banks or broker-dealers and allow the fund to gain exposure to common stocks in markets where direct investment is not allowed. Income received from P-Notes is recorded as dividend income in the Statement of Operations. P-Notes may contain various risks including the potential inability of the counterparty to fulfill their obligations under the terms of the contract. These securities may be more volatile and less liquid than other investments held by the Fund.
f. Income and Deferred Taxes
It is the Fund’s policy to qualify as a regulated investment company under the Internal Revenue Code. The Fund intends to distribute to shareholders substantially all of its taxable income and net realized gains to relieve it from federal income and if applicable, excise taxes. As a result, no provision for U.S. federal income taxes is required.
34 | Annual Report franklintempleton.com
FRANKLIN TEMPLETON INTERNATIONAL TRUST
NOTES TO FINANCIAL STATEMENTS
Franklin World Perspectives Fund (continued)
The Fund may be subject to foreign taxation related to income received, capital gains on the sale of securities and certain foreign currency transactions in the foreign jurisdictions in which it invests. Foreign taxes, if any, are recorded based on the tax regulations and rates that exist in the foreign markets in which the Fund invests. When a capital gain tax is determined to apply the Fund records an estimated deferred tax liability in an amount that would be payable if the securities were disposed of on the valuation date.
The Fund recognizes the tax benefits of uncertain tax positions only when the position is “more likely than not” to be sustained upon examination by the tax authorities based on the technical merits of the tax position. As of October 31, 2014, and for all open tax years, the Fund has determined that no liability for unrecognized tax benefits is required in the Fund’s financial statements related to uncertain tax positions taken on a tax return (or expected to be taken on future tax returns). Open tax years are those that remain subject to examination and are based on each tax jurisdiction statute of limitation.
g. Security Transactions, Investment Income, Expenses and Distributions
Security transactions are accounted for on trade date. Realized gains and losses on security transactions are determined on a specific identification basis. Interest income and estimated expenses are accrued daily. Amortization of premium and accretion of discount on debt securities are included in interest income. Dividend income is recorded on the ex-dividend date except that certain dividends from foreign securities are recognized as soon as the Fund is notified of the ex-dividend date. Distributions to shareholders are recorded on the ex-dividend date and are determined according to income tax regulations (tax basis). Distributable earnings determined on a tax basis may differ from earnings recorded in accordance with accounting principles generally accepted in the United States of America. These differences may be permanent or temporary. Permanent differences are reclassified among capital accounts to reflect their tax character. These reclassifications have no impact on net assets or the results of operations. Temporary differences are not reclassified, as they may reverse in subsequent periods.
Common expenses incurred by the Trust are allocated among the funds based on the ratio of net assets of each fund to the combined net assets of the Trust. Fund specific expenses are charged directly to the fund that incurred the expense.
Realized and unrealized gains and losses and net investment income, not including class specific expenses, are allocated daily to each class of shares based upon the relative proportion of net assets of each class. Differences in per share distributions, by class, are generally due to differences in class specific expenses.
h. Accounting Estimates
The preparation of financial statements in accordance with accounting principles generally accepted in the United States of America requires management to make estimates and assumptions that affect the reported amounts of assets and liabilities at the date of the financial statements and the amounts of income and expenses during the reporting period. Actual results could differ from those estimates.
i. Guarantees and Indemnifications
Under the Trust’s organizational documents, its officers and trustees are indemnified by the Trust against certain liabilities arising out of the performance of their duties to the Trust. Additionally, in the normal course of business, the Trust, on behalf of the Fund, enters into contracts with service providers that contain general indemnification clauses. The Trust’s maximum exposure under these arrangements is unknown as this would involve future claims that may be made against the Trust that have not yet occurred. Currently, the Trust expects the risk of loss to be remote.
franklintempleton.com Annual Report | 35
FRANKLIN TEMPLETON INTERNATIONAL TRUST
NOTES TO FINANCIAL STATEMENTS
Franklin World Perspectives Fund (continued)
2. Shares of Beneficial Interest
At October 31, 2014, there were an unlimited number of shares authorized (without par value). Transactions in the Fund’s shares were as follows:
| | | | | | | | | | | | |
| | | | | | | Year Ended October 31, | | | | |
| | 2014 | a | | | | | | 2013 | |
| | Shares | | | Amount | | Shares | | | Amount | |
| |
| Class A Shares: | | | | | | | | | | | | |
| Shares sold | 224,626 | | $ | 2,908,136 | | 169,920 | | $ | 1,932,319 | |
| Shares issued in reinvestment of distributions | 6,358 | | | | | 79,857 | | 2,923 | | | 30,023 | |
| Shares redeemed | (344,821 | ) | | (4,473,840 | ) | (69,779 | ) | | (795,357 | ) |
| Net increase (decrease) | (113,837 | ) | $ | (1,485,847 | ) | 103,064 | | $ | 1,166,985 | |
| |
| Class C Shares: | | | | | | | | | | | | |
| Shares sold | 37,978 | | | $ | | 487,682 | | 28,688 | | $ | 325,342 | |
| Shares issued in reinvestment of distributions | 607 | | | | | 7,594 | | 147 | | | 1,513 | |
| Shares redeemed | (22,330 | ) | | | | (289,981 | ) | (4,578 | ) | | (49,331 | ) |
| Net increase (decrease) | 16,255 | | | $ | | 205,295 | | 24,257 | | $ | 277,524 | |
| |
| Class R Shares: | | | | | | | | | | | | |
| Shares issued in reinvestment of distributions | | | | | | | | —b | | $ | 2 | |
| Shares redeemed | | | | | | | | (22 | ) | | (253 | ) |
| Net increase (decrease) | | | | | | | | (22 | ) | $ | (251 | ) |
| |
| Advisor Class Shares: | | | | | | | | | | | | |
| Shares sold | 63,296 | | | $ | | 827,884 | | 16,236 | | $ | 186,575 | |
| Shares issued in reinvestment of distributions | 499 | | | | | 6,274 | | 664 | | | 6,821 | |
| Shares redeemed | (156,666 | ) | | (2,028,852 | ) | (4,447 | ) | | (52,965 | ) |
| Net increase (decrease) | (92,871 | ) | $ | (1,194,694 | ) | 12,453 | | $ | 140,431 | |
| aDuring the year Class R did not report any share transactions. | | | | | | | | | | | | |
| bRounds to less than 1. | | | | | | | | | | | | |
3. Transactions with Affiliates
Franklin Resources, Inc. is the holding company for various subsidiaries that together are referred to as Franklin Templeton Investments. Certain officers and trustees of the Fund are also officers and/or directors of the following subsidiaries:
| |
| Subsidiary | Affiliation |
| Franklin Advisers, Inc. (Advisers) | Investment manager |
| Franklin Templeton Investimentos (Brasil) Ltda. (FT Brasil) | Investment manager |
| Franklin Templeton Investment Management Limited (FTIML) | Investment manager |
| Franklin Templeton Investment Trust Management Co., Ltd. (FT Korea) | Investment manager |
| Franklin Templeton Investments Corp. (FTIC) | Investment manager |
| Franklin Templeton Investments (ME) Limited (FTIME) | Investment manager |
| Templeton Asset Management Ltd. (TAML) | Investment manager |
| Franklin Templeton Services, LLC (FT Services) | Administrative manager |
| Franklin Templeton Distributors, Inc. (Distributors) | Principal underwriter |
| Franklin Templeton Investor Services, LLC (Investor Services) | Transfer agent |
36 | Annual Report franklintempleton.com
FRANKLIN TEMPLETON INTERNATIONAL TRUST
NOTES TO FINANCIAL STATEMENTS
Franklin World Perspectives Fund (continued)
a. Management Fees
The Fund pays an investment management fee to Advisers based on the average daily net assets of the Fund as follows:
| |
| Annualized Fee Rate | Net Assets |
| 1.050% | Up to and including $1 billion |
| 1.000% | Over $1 billion, up to and including $4 billion |
| 0.950% | In excess of $4 billion |
Under a subadvisory agreement, FTI Brasil, FTIML, FT Korea, FTIC, FTIME and TAML, affiliates of Advisers, provide sub-advisory services to the Fund. The subadvisory fee is paid by Advisers based on the Fund’s average daily net assets, and is not an additional expense of the Fund.
b. Administrative Fees
Under an agreement with Advisers, FT Services provides administrative services to the Fund. The fee is paid by Advisers based on the Fund’s average daily net assets, and is not an additional expense of the Fund.
c. Distribution Fees
The Board has adopted distribution plans for each share class, with the exception of Advisor Class shares, pursuant to Rule 12b-1 under the 1940 Act. Distribution fees are not charged on shares held by affiliates. Under the Fund’s Class A reimbursement distribution plan, the Fund reimburses Distributors for costs incurred in connection with the servicing, sale and distribution of the Fund’s shares up to the maximum annual plan rate. Under the Class A reimbursement distribution plan, costs exceeding the maximum for the current plan year cannot be reimbursed in subsequent periods. In addition, under the Fund’s Class C and R compensation distribution plans, the Fund pays Distributors for costs incurred in connection with the servicing, sale and distribution of the Fund’s shares up to the maximum annual plan rate for each class. The plan year, for purposes of monitoring compliance with the maximum annual plan rates, is February 1 through January 31.
The maximum annual plan rates, based on the average daily net assets, for each class, are as follows:
| | |
| Class A | 0.30 | % |
| Class C | 1.00 | % |
| Class R | 0.50 | % |
d. Sales Charges/Underwriting Agreements
Front-end sales charges and contingent deferred sales charges (CDSC) do not represent expenses of the Fund. These charges are deducted from the proceeds of sales of Fund shares prior to investment or from redemption proceeds prior to remittance, as applicable. Distributors has advised the Fund of the following commission transactions related to the sales and redemptions of the Fund’s shares for the year:
| | |
| Sales charges retained net of commissions paid to unaffiliated broker/dealers | $ | 8,768 |
| CDSC retained | $ | 1,707 |
e. Transfer Agent Fees
Each class of shares pays transfer agent fees to Investor Services for its performance of shareholder servicing obligations and reimburses Investor Services for out of pocket expenses incurred, including shareholding servicing fees paid to third parties. These fees are allocated daily based upon their relative proportion of such classes’ aggregate net assets.
For the year ended October 31, 2014, the Fund paid transfer agent fees of $19,345, of which $10,054 was retained by Investor Services.
franklintempleton.com
Annual Report
| 37
FRANKLIN TEMPLETON INTERNATIONAL TRUST
NOTES TO FINANCIAL STATEMENTS
Franklin World Perspectives Fund (continued)
3. Transactions with Affiliates (continued)
f. Investments in Franklin India Growth Fund
The Fund invests in Franklin India Growth Fund (India Fund), an affiliated open-end management investment company. Management fees paid by the Fund are waived on assets invested in the India Fund, as noted on the Statement of Operations, in an amount not to exceed the management and administrative fees paid directly or indirectly by the India Fund. Prior to November 1, 2013, the waiver was accounted for as a reduction to management fees.
| | | | | | | | | | | | |
| | | | | | | | | | | | % of | |
| | Number | | | | Number | | | | | | Affiliated | |
| | of Shares | | | | of Shares | | | | | | Fund Shares | |
| | Held at | | | | Held | | Value | | | | Outstanding | |
| | Beginning | Gross | Gross | | at End | | at End | Investment | | Realized | Held at | |
| Fund Name | of Year | Additions | Reductions | | of Year | | of Year | Income | | Gain (Loss) | End of Year | |
| Non-Controlled Affiliates | | | | | | | | | | | | |
| Franklin India Growth Fund, | | | | | | | | | | | | |
| Class R6 | | | | | | | | | | | | |
| (Value is 2.0% of Net Assets) | 52,876 | 16,862 | (11,130 | ) | 58,608 | $ | 740,223 | $ — | $ | 24,864 | 0.68 | % |
g. Waiver and Expense Reimbursements
Advisers has contractually agreed in advance to waive or limit its fees and to assume as its own expense certain expenses otherwise payable by the Fund so that the expenses (excluding distribution fees and acquired fund fees and expenses) for each class of the Fund do not exceed 1.25% based on the average net assets of each class (other than certain non-routine expenses or costs, including those relating to litigation, indemnification, reorganizations, and liquidations) until February 28, 2015.
h. Other Affiliated Transactions
At October 31, 2014, Franklin Resources, Inc. owned 74.58% of the Fund’s outstanding shares. Investment activities of this shareholder could have a material impact on the Fund.
4. Expense Offset Arrangement
The Fund has entered into an arrangement with its custodian whereby credits realized as a result of uninvested cash balances are used to reduce a portion of the Fund’s custodian expenses. During the year ended October 31, 2014, the custodian fees were reduced as noted in the Statement of Operations.
5. Income Taxes
For tax purposes, capital losses may be carried over to offset future capital gains. Capital loss carryforwards with no expiration, if any, must be fully utilized before those losses with expiration dates.
During the year ended October 31, 2014, the Fund utilized $633,915 of capital loss carryforwards.
The tax character of distributions paid during the years ended October 31, 2014 and 2013, was as follows:
| | | | |
| | | 2014 | | 2013 |
| Distributions paid from ordinary income | $ | 527,258 | $ | 316,154 |
38 | Annual Report franklintempleton.com
FRANKLIN TEMPLETON INTERNATIONAL TRUST
NOTES TO FINANCIAL STATEMENTS
Franklin World Perspectives Fund (continued)
At October 31, 2014, the cost of investments, net unrealized appreciation (depreciation), undistributed ordinary income and undistributed long term capital gains for income tax purposes were as follows:
| | | |
| Cost of investments | $ | 29,999,938 | |
| |
| Unrealized appreciation | $ | 7,727,408 | |
| Unrealized depreciation | | (1,290,623 | ) |
| Net unrealized appreciation (depreciation) | $ | 6,436,785 | |
| |
| Undistributed ordinary income | $ | 247,197 | |
| Undistributed long term capital gains | | 2,596,434 | |
| Distributable earnings | $ | 2,843,631 | |
Differences between income and/or capital gains as determined on a book basis and a tax basis are primarily due to differing treatments of foreign currency transactions, passive foreign investment company shares and wash sales.
6. Investment Transactions
Purchases and sales of investments (excluding short term securities) for the year ended October 31, 2014, aggregated $29,377,790 and $31,905,928, respectively.
7. Concentration of Risk
Investing in foreign securities may include certain risks and considerations not typically associated with investing in U.S. securities, such as fluctuating currency values and changing local and regional economic, political and social conditions, which may result in greater market volatility. In addition, certain foreign securities may not be as liquid as U.S. securities.
8. Other Derivative Information
At October 31, 2014, the Fund’s investments in derivative contracts are reflected on the Statement of Assets and Liabilities as follows:
| | | | | |
| | Asset Derivatives | | | Liability Derivatives |
| Derivative Contracts | | | | | |
| Not Accounted for as | Statement of Assets and | | Fair Value | Statement of Assets and | Fair Value |
| Hedging Instruments | Liabilities Location | | Amount | Liabilities Location | Amount |
| Foreign exchange contracts | Unrealized appreciation on | $ | 129,830 | Unrealized depreciation on | $ — |
| | forward exchange contracts | | | forward exchange contracts | |
For the year ended October 31, 2014, the effect of derivative contracts on the Fund’s Statement of Operations was as follows:
| | | | | |
| | | | | | Change in |
| | | | | | Unrealized |
| Derivative Contracts | | | Realized | | Appreciation |
| Not Accounted for as | | | Gain (Loss) | | (Depreciation) |
| Hedging Instruments | Statement of Operations Locations | | for the Year | | for the Year |
| Foreign exchange contracts | Net realized gain (loss) from foreign currency | $ | 63,557 | $ | 117,232 |
| | transactions / Net change in unrealized appreciation | | | | |
| | (depreciation) on translation of other assets and | | | | |
| | liabilities denominated in foreign currencies | | | | |
franklintempleton.com
Annual Report
| 39
FRANKLIN TEMPLETON INTERNATIONAL TRUST
NOTES TO FINANCIAL STATEMENTS
Franklin World Perspectives Fund (continued)
8. Other Derivative Information (continued)
For the year ended October 31, 2014, the average month end fair value of derivatives represented 0.11% of average month end net assets. The average month end number of open derivative contracts for the year was 1.
See Note 1(d) regarding derivative financial instruments.
9. Credit Facility
The Fund, together with other U.S. registered and foreign investment funds (collectively, Borrowers), managed by Franklin Templeton Investments, are borrowers in a joint syndicated senior unsecured credit facility totaling $1.5 billion (Global Credit Facility) which matures on February 13, 2015. This Global Credit Facility provides a source of funds to the Borrowers for temporary and emergency purposes, including the ability to meet future unanticipated or unusually large redemption requests.
Under the terms of the Global Credit Facility, the Fund shall, in addition to interest charged on any borrowings made by the Fund and other costs incurred by the Fund, pay its share of fees and expenses incurred in connection with the implementation and maintenance of the Global Credit Facility, based upon its relative share of the aggregate net assets of all of the Borrowers, including an annual commitment fee of 0.07% based upon the unused portion of the Global Credit Facility. These fees are reflected in other expenses on the Statement of Operations. During the year ended October 31, 2014, the Fund did not use the Global Credit Facility.
10. Fair Value Measurements
The Fund follows a fair value hierarchy that distinguishes between market data obtained from independent sources (observable inputs) and the Fund’s own market assumptions (unobservable inputs). These inputs are used in determining the value of the Fund’s financial instruments and are summarized in the following fair value hierarchy:
- Level 1 – quoted prices in active markets for identical financial instruments
- Level 2 – other significant observable inputs (including quoted prices for similar financial instruments, interest rates, prepayment speed, credit risk, etc.)
- Level 3 – significant unobservable inputs (including the Fund’s own assumptions in determining the fair value of financial instruments)
The input levels are not necessarily an indication of the risk or liquidity associated with financial instruments at that level.
For movements between the levels within the fair value hierarchy, the Fund has adopted a policy of recognizing the transfers as of the date of the underlying event which caused the movement. Additionally, at October 31, 2014, due to market events, the Fund employed fair value procedures to value a portion of its holdings. Such procedures resulted in a temporary transfer of financial instruments valued at $2,126,650 from Level 1 to Level 2 within the fair value hierarchy.
40 | Annual Report
franklintempleton.com
FRANKLIN TEMPLETON INTERNATIONAL TRUST
NOTES TO FINANCIAL STATEMENTS
Franklin World Perspectives Fund (continued)
A summary of inputs used as of October 31, 2014, in valuing the Fund’s assets carried at fair value, is as follows:
| | | | | | | | |
| | | Level 1 | | Level 2 | | Level 3 | | Total |
| Assets: | | | | | | | | |
| Investments in Securities: | | | | | | | | |
| Equity Investments:a | | | | | | | | |
| Japan | $ | — | $ | 2,126,650 | $ | — | $ | 2,126,650 |
| South Korea | | — | | 113,045 | | — | | 113,045 |
| All Other Equity Investmentsb | | 33,826,002 | | — | | — | | 33,826,002 |
| Participatory Notes | | — | | 76,026 | | — | | 76,026 |
| Short Term Investments | | — | | 295,000 | | — | | 295,000 |
| Total Investments in Securities | $ | 33,826,002 | $ | 2,610,721 | $ | — | $ | 36,436,723 |
| Other Financial Instruments | | | | | | | | |
| Forward Exchange Contracts | $ | — | $ | 129,830 | $ | — | $ | 129,830 |
alncludes common and preferred stocks as well as other equity investments.
bFor detailed categories, see the accompanying Statement of Investments.
11. New Accounting Pronouncements
In June 2013, the Financial Accounting Standards Board (FASB) issued Accounting Standards Update (ASU) No. 2013-08, Investment Companies (Topic 946): Amendments to the Scope, Measurement, and Disclosure Requirements. The ASU modifies the criteria used in defining an investment company under U.S. Generally Accepted Accounting Principles and also sets forth certain measurement and disclosure requirements. Under the ASU, an entity that is registered under the 1940 Act automatically qualifies as an investment company. The ASU is effective for interim and annual reporting periods beginning after December 15, 2013. Management has reviewed the requirements and believes the adoption of this ASU will not have a material impact on the financial statements.
In June 2014, FASB issued ASU No. 2014-11, Transfers and Servicing (Topic 860), Repurchase-to-Maturity Transactions, Repurchase Financings, and Disclosures. The ASU changes the accounting for certain repurchase agreements and expands disclosure requirements related to repurchase agreements, securities lending, repurchase-to-maturity and similar transactions. The ASU is effective for interim and annual reporting periods beginning after December 15, 2014. Management is currently evaluating the impact, if any, of applying this provision.
12. Subsequent Events
The Fund has evaluated subsequent events through the issuance of the financial statements and determined that no events have occurred that require disclosure.
| | |
| Abbreviations | | |
| Counterparty | Selected Portfolio |
| BKF Deutsche Bank AG | ADR | American Depositary Receipt |
| | CDI | Clearing House Electronic Subregister System Depositary Interest |
| | ETF | Exchange Traded Fund |
| | FHLB | Federal Home Loan Bank |
franklintempleton.com Annual Report | 41
FRANKLIN TEMPLETON INTERNATIONAL TRUST FRANKLIN WORLD PERSPECTIVES FUND
Report of Independent Registered Public Accounting Firm
To the Board of Trustees and Shareholders of Franklin Templeton International Trust
In our opinion, the accompanying statement of assets and liabilities, including the statement of investments, and the related statements of operations and of changes in net assets and the financial highlights present fairly, in all material respects, the financial position of Franklin World Perspectives Fund (one of the funds constituting the Franklin Templeton International Trust, hereafter referred to as the “Fund”) at October 31, 2014, the results of its operations for the year then ended, the changes in its net assets for each of the two years in the period then ended and the financial highlights for the periods presented, in conformity with accounting principles generally accepted in the United States of America. These financial statements and financial highlights (hereafter referred to as “financial statements”) are the responsibility of the Fund’s management. Our responsibility is to express an opinion on these financial statements based on our audits. We conducted our audits of these financial statements in accordance with the standards of the Public Company Accounting Oversight Board (United States). Those standards require that we plan and perform the audit to obtain reasonable assurance about whether the financial statements are free of material misstatement. An audit includes examining, on a test basis, evidence supporting the amounts and disclosures in the financial statements, assessing the accounting principles used and significant estimates made by management, and evaluating the overall financial statement presentation. We believe that our audits, which included confirmation of securities at October 31, 2014 by correspondence with the custodian, transfer agent and brokers, provide a reasonable basis for our opinion.
PricewaterhouseCoopers LLP
San Francisco, California
December 19, 2014
42 | Annual Report
franklintempleton.com
FRANKLIN TEMPLETON INTERNATIONAL TRUST
Tax Information (unaudited)
Franklin World Perspectives Fund
Under Section 854(b)(1)(A) of the Internal Revenue Code (Code), the Fund hereby reports 24.25% of the ordinary income dividends as income qualifying for the dividends received deduction for the fiscal year ended October 31, 2014.
Under Section 854(b)(1)(B) of the Code, the Fund hereby reports the maximum amount allowable but no less than $443,992 as qualified dividends for purposes of the maximum rate under Section 1(h)(11) of the Code for the fiscal year ended October 31, 2014. Distributions, including qualified dividend income, paid during calendar year 2014 will be reported to shareholders on Form 1099-DIV by mid-February 2015. Shareholders are advised to check with their tax advisors for information on the treatment of these amounts on their individual income tax returns.
At October 31, 2013, more than 50% of the Fund’s total assets were invested in securities of foreign issuers. In most instances, foreign taxes were withheld from income paid to the Fund on these investments. As shown in the table below, the Fund hereby reports to shareholders the foreign source income and foreign taxes paid, pursuant to Section 853 of the Code. This written statement will allow shareholders of record on December 13, 2013, to treat their proportionate share of foreign taxes paid by the Fund as having been paid directly by them. The shareholder shall consider these amounts as foreign taxes paid in the tax year in which they receive the Fund distribution.
The following table provides a detailed analysis of foreign tax paid, foreign source income, and foreign source qualified dividends as reported by the Fund, to Class A, Class C, Class R, and Advisor Class shareholders of record.
| | | | | | |
| | | Foreign Tax Paid | | Foreign Source | | Foreign Source Qualified |
| Class | | Per Share | | Income Per Share | | Dividends Per Share |
| Class A | $ | 0.0136 | $ | 0.1078 | $ | 0.0652 |
| Class C | $ | 0.0136 | $ | 0.0699 | $ | 0.0422 |
| Class R | $ | 0.0136 | $ | 0.0830 | $ | 0.0499 |
| Advisor Class | $ | 0.0136 | $ | 0.1154 | $ | 0.0697 |
Foreign Tax Paid Per Share (Column 1) is the amount per share available to you, as a tax credit (assuming you held your shares in the Fund for a minimum of 16 days during the 31-day period beginning 15 days before the ex-dividend date of the Fund’s distribution to which the foreign taxes relate), or, as a tax deduction.
Foreign Source Income Per Share (Column 2) is the amount per share of income dividends attributable to foreign securities held by the Fund, plus any foreign taxes withheld on these dividends. The amounts reported include foreign source qualified dividends that have not been adjusted for the rate differential applicable to such dividend income.1
Foreign Source Qualified Dividends Per Share (Column 3) is the amount per share of foreign source qualified dividends, plus any foreign taxes withheld on these dividends. These amounts represent the portion of the Foreign Source Income reported to you in column 2 that were derived from qualified foreign securities held by the Fund.1
By mid-February 2014, shareholders received Form 1099-DIV which included their share of taxes paid and foreign source income distributed during the calendar year 2013. The Foreign Source Income reported on Form 1099-DIV has not been adjusted for the rate differential on foreign source qualified dividend income. Shareholders are advised to check with their tax advisors for information on the treatment of these amounts on their 2013 individual income tax returns.
1Qualified dividends are taxed at reduced long term capital gains tax rates. In determining the amount of foreign tax credit that may be applied against the U.S. tax liability
of individuals receiving foreign source qualified dividends, adjustments may be required to the foreign tax credit limitation calculation to reflect the rate differential applicable
to such dividend income. The rules however permit certain individuals to elect not to apply the rate differential adjustments for capital gains and/or dividends for any taxable
year. Please consult your tax advisor and the instructions to Form 1116 for more information.
franklintempleton.com Annual Report | 43
FRANKLIN TEMPLETON INTERNATIONAL TRUST
Board Members and Officers
The name, year of birth and address of the officers and board members, as well as their affiliations, positions held with the Trust, principal occupations during at least the past five years and number of portfolios overseen in the Franklin Templeton Investments fund complex are shown below. Generally, each board member serves until that person’s successor is elected and qualified.
| | | | |
| Independent Board Members | | | |
| |
| | | | Number of Portfolios in | |
| Name, Year of Birth | | Length of | Fund Complex Overseen | Other Directorships Held |
| and Address | Position | Time Served | by Board Member* | During at Least the Past 5 Years |
| |
| Harris J. Ashton (1932) | Trustee | Since 1991 | 137 | Bar-S Foods (meat packing company) |
| One Franklin Parkway | | | | (1981-2010). |
| San Mateo, CA 94403-1906 | | | | |
| Principal Occupation During at Least the Past 5 Years: | | |
| Director of various companies; and formerly, Director, RBC Holdings, Inc. (bank holding company) (until 2002); and President, Chief |
| Executive Officer and Chairman of the Board, General Host Corporation (nursery and craft centers) (until 1998). |
| |
| Mary C. Choksi (1950) | Trustee | Since | 111 | Avis Budget Group Inc. (car rental), |
| One Franklin Parkway | | October 2014 | | Omnicom Group Inc. (advertising and |
| San Mateo, CA 94403-1906 | | | | marketing communications services) |
| | | | | and H.J. Heinz Company (processed |
| | | | | foods and allied products) (1998-2006). |
| |
| Principal Occupation During at Least the Past 5 Years: | | |
| Founding Partner and Senior Managing Director, Strategic Investment Group (investment management group) (1987-present); director of |
| various companies; and formerly, Founding Partner and Managing Director, Emerging Markets Management LLC (investment management |
| firm) (1987-2011); Loan Officer/Senior Loan Officer/Senior Pension Investment Officer, World Bank Group (international financial institution) |
| (1977-1987). | | | | |
| |
| Sam Ginn (1937) | Trustee | Since 2007 | 111 | ICO Global Communications |
| One Franklin Parkway | | | | (Holdings) Limited (satellite company) |
| San Mateo, CA 94403-1906 | | | | (2006-2010), Chevron Corporation |
| | | | | (global energy company) (1989-2009), |
| | | | | Hewlett-Packard Company (technology |
| | | | | company) (1996-2002), Safeway, Inc. |
| | | | | (grocery retailer) (1991-1998) and |
| | | | | TransAmerica Corporation (insurance |
| | | | | company) (1989-1999). |
| |
| Principal Occupation During at Least the Past 5 Years: | | |
| Private investor; and formerly, Chairman, First Responder Network Authority (FirstNet) (interoperable wireless broadband network) |
| (2012-2014); Chairman of the Board, Vodafone AirTouch, PLC (wireless company) (1999-2000); Chairman of the Board and Chief Executive |
| Officer, AirTouch Communications (cellular communications) (1993-1998) and Pacific Telesis Group (telephone holding company) |
| (1988-1994). | | | | |
| |
| Edith E. Holiday (1952) | Trustee | Since 1998 | 137 | Hess Corporation (exploration and |
| One Franklin Parkway | | | | refining of oil and gas), H.J. Heinz |
| San Mateo, CA 94403-1906 | | | | Company (processed foods and |
| | | | | allied products) (1994-2013), RTI |
| | | | | International Metals, Inc. (manufacture |
| | | | | and distribution of titanium), Canadian |
| | | | | National Railway (railroad) and White |
| | | | | Mountains Insurance Group, Ltd. |
| | | | | (holding company). |
| |
| Principal Occupation During at Least the Past 5 Years: | | |
| Director or Trustee of various companies and trusts; and formerly, Assistant to the President of the United States and Secretary of the |
| Cabinet (1990-1993); General Counsel to the United States Treasury Department (1989-1990); and Counselor to the Secretary and |
| Assistant Secretary for Public Affairs and Public Liaison – United States Treasury Department (1988-1989). |
| |
| |
| |
| |
| 44 | Annual Report | | | | franklintempleton.com |
FRANKLIN TEMPLETON INTERNATIONAL TRUST
| | | | |
| Independent Board Members (continued) | | |
| |
| | | | Number of Portfolios in | |
| Name, Year of Birth | | Length of | Fund Complex Overseen | Other Directorships Held |
| and Address | Position | Time Served | by Board Member* | During at Least the Past 5 Years |
| |
| J. Michael Luttig (1954) | Trustee | Since 2009 | 137 | Boeing Capital Corporation |
| One Franklin Parkway | | | | (aircraft financing) (2006-2013). |
| San Mateo, CA 94403-1906 | | | | |
| |
| Principal Occupation During at Least the Past 5 Years: | | |
| Executive Vice President, General Counsel and member of the Executive Council, The Boeing Company (aerospace company); and formerly, |
| Federal Appeals Court Judge, U.S. Court of Appeals for the Fourth Circuit (1991-2006). | |
| |
| Frank A. Olson (1932) | Trustee | Since 2007 | 137 | Hess Corporation (exploration and |
| One Franklin Parkway | | | | refining of oil and gas) (1998-2013). |
| San Mateo, CA 94403-1906 | | | | |
| |
| Principal Occupation During at Least the Past 5 Years: | | |
| Director of various companies; and formerly, Chairman of the Board, The Hertz Corporation (car rental) (1980-2000) and Chief Executive |
| Officer (1977-1999); and Chairman of the Board, President and Chief Executive Officer, UAL Corporation (airlines) (June-December 1987). |
| |
| Larry D. Thompson (1945) | Trustee | Since 2007 | 137 | Cbeyond, Inc. (business communi- |
| One Franklin Parkway | | | | cations provider) (2010-2012), The |
| San Mateo, CA 94403-1906 | | | | Southern Company (energy company) |
| | | | | (December 2014; previously |
| | | | | 2010-2012) and Graham Holdings |
| | | | | Company (education and media |
| | | | | organization) (2011-present). |
| Principal Occupation During at Least the Past 5 Years: | | |
| Executive Vice President – Government Affairs, General Counsel and Corporate Secretary, PepsiCo, Inc. (consumer products) (2012-present); |
| and formerly, John A. Sibley Professor of Corporate and Business Law, University of Georgia School of Law (2011-2012); Senior Vice |
| President – Government Affairs, General Counsel and Secretary, PepsiCo, Inc. (2004-2011); Senior Fellow of The Brookings Institution |
| (2003-2004); Visiting Professor, University of Georgia School of Law (2004); and Deputy Attorney General, U.S. Department of Justice |
| (2001-2003). | | | | |
| |
| John B. Wilson (1959) | Lead | Trustee since | 111 | None |
| One Franklin Parkway | Independent | 2006 and Lead | | |
| San Mateo, CA 94403-1906 | Trustee | Independent | | |
| | | Trustee since 2008 | | |
| |
| Principal Occupation During at Least the Past 5 Years: | | |
| President, Staples Europe (office supplies) (2012-present); President and Founder, Hyannis Port Capital, Inc. (real estate and private |
| equity investing); serves on private and non-profit boards; and formerly, Chief Operating Officer and Executive Vice President, Gap, Inc. |
| (retail) (1996-2000); Chief Financial Officer and Executive Vice President – Finance and Strategy, Staples, Inc. (1992-1996); Senior Vice |
| President – Corporate Planning, Northwest Airlines, Inc. (airlines) (1990-1992); and Vice President and Partner, Bain & Company |
| (consulting firm) (1986-1990). | | | | |
franklintempleton.com Annual Report | 45
| | | | |
| FRANKLIN TEMPLETON INTERNATIONAL TRUST | | |
| |
| |
| |
| |
| Interested Board Members and Officers | | |
| |
| | | | Number of Portfolios in | |
| Name, Year of Birth | | Length of | Fund Complex Overseen | Other Directorships Held |
| and Address | Position | Time Served | by Board Member* | During at Least the Past 5 Years |
| |
| **Gregory E. Johnson (1961) | Trustee | Since 2007 | 147 | None |
| One Franklin Parkway | | | | |
| San Mateo, CA 94403-1906 | | | | |
| |
| Principal Occupation During at Least the Past 5 Years: | | |
| Chairman of the Board, Member – Office of the Chairman, Director, President and Chief Executive Officer, Franklin Resources, Inc.; |
| officer and/or director or trustee, as the case may be, of some of the other subsidiaries of Franklin Resources, Inc. and of 44 of the |
| investment companies in Franklin Templeton Investments; and Vice Chairman, Investment Company Institute. |
| |
| **Rupert H. Johnson, Jr. (1940) Chairman of | Chairman of the | 137 | None |
| One Franklin Parkway | the Board, | Board and Trustee | | |
| San Mateo, CA 94403-1906 | Trustee and | since 2013 | | |
| | Vice President | | | |
| Principal Occupation During at Least the Past 5 Years: | | |
| Vice Chairman, Member – Office of the Chairman and Director, Franklin Resources, Inc.; Director, Franklin Advisers, Inc.; Senior Vice |
| President, Franklin Advisory Services, LLC; and officer and/or director or trustee, as the case may be, of some of the other subsidiaries of |
| Franklin Resources, Inc. and of 41 of the investment companies in Franklin Templeton Investments. | |
| |
| Alison E. Baur (1964) | Vice President | Since 2012 | Not Applicable | Not Applicable |
| One Franklin Parkway | | | | |
| San Mateo, CA 94403-1906 | | | | |
| |
| Principal Occupation During at Least the Past 5 Years: | | |
| Deputy General Counsel, Franklin Templeton Investments; and officer of some of the other subsidiaries of Franklin Resources, Inc. and of |
| 46 of the investment companies in Franklin Templeton Investments. | | |
| |
| Laura F. Fergerson (1962) | Chief | Since 2009 | Not Applicable | Not Applicable |
| One Franklin Parkway | Executive | | | |
| San Mateo, CA 94403-1906 | Officer – | | | |
| | Finance and | | | |
| | Administration | | | |
| |
| Principal Occupation During at Least the Past 5 Years: | | |
| Senior Vice President, Franklin Templeton Services, LLC; and officer of 46 of the investment companies in Franklin Templeton Investments. |
| |
| Gaston Gardey (1967) | Treasurer, | 2009 | Not Applicable | Not Applicable |
| One Franklin Parkway | Chief Financial | | | |
| San Mateo, CA 94403-1906 | Officer and | | | |
| | Chief | | | |
| | Accounting | | | |
| | Officer | | | |
| |
| Principal Occupation During at Least the Past 5 Years: | | |
| Director, Fund Accounting, Franklin Templeton Investments; and officer of 27 of the investment companies in Franklin Templeton Investments. |
| |
| Aliya S. Gordon (1973) | Vice President | Since 2009 | Not Applicable | Not Applicable |
| One Franklin Parkway | | | | |
| San Mateo, CA 94403-1906 | | | | |
| |
| Principal Occupation During at Least the Past 5 Years: | | |
| Senior Associate General Counsel, Franklin Templeton Investments; officer of 46 of the investment companies in Franklin Templeton |
| Investments; and formerly, Litigation Associate, Steefel, Levitt & Weiss, LLP (2000-2004). | |
| |
| |
| |
| |
| 46 | Annual Report | | | | franklintempleton.com |
FRANKLIN TEMPLETON INTERNATIONAL TRUST
| | | | |
| Interested Board Members and Officers (continued) | |
| |
| | | | Number of Portfolios in | |
| Name, Year of Birth | | Length of | Fund Complex Overseen | Other Directorships Held |
| and Address | Position | Time Served | by Board Member* | During at Least the Past 5 Years |
| |
| Steven J. Gray (1955) | Vice President | Since 2009 | Not Applicable | Not Applicable |
| One Franklin Parkway | | | | |
| San Mateo, CA 94403-1906 | | | | |
| |
| Principal Occupation During at Least the Past 5 Years: | | |
| Senior Associate General Counsel, Franklin Templeton Investments; Vice President, Franklin Templeton Distributors, Inc. and Franklin |
| Alternative Strategies Advisers, LLC; and officer of 46 of the investment companies in Franklin Templeton Investments. |
| |
| Selena L. Holmes (1965) | Vice President | Since 2012 | Not Applicable | Not Applicable |
| 100 Fountain Parkway | – AML | | | |
| St. Petersburg, FL 33716-1205 | Compliance | | | |
| |
| Principal Occupation During at Least the Past 5 Years: | | |
| Director, Global Compliance Monitoring; Chief Compliance Officer, Franklin Alternative Strategies Advisers, LLC; Vice President, Franklin |
| Templeton Companies, LLC; and officer of 46 of the investment companies in Franklin Templeton Investments. |
| |
| Edward B. Jamieson (1948) | President and | Since 2010 | Not Applicable | Not Applicable |
| One Franklin Parkway | Chief Executive | | | |
| San Mateo, CA 94403-1906 | Officer – | | | |
| | Investment | | | |
| | Management | | | |
| Principal Occupation During at Least the Past 5 Years: | | |
| President, Chief Investment Officer and Director, Franklin Advisers, Inc.; Executive Vice President, Franklin Templeton Institutional, LLC; |
| and officer and/or trustee, as the case may be, of some of the other subsidiaries of Franklin Resources, Inc. and of 10 of the investment |
| companies in Franklin Templeton Investments. | | | |
| |
| Kimberly H. Novotny (1972) | Vice President | Since 2013 | Not Applicable | Not Applicable |
| 300 S.E. 2nd Street | | | | |
| Fort Lauderdale, FL 33301-1923 | | | | |
| |
| Principal Occupation During at Least the Past 5 Years: | | |
| Associate General Counsel, Franklin Templeton Investments; Vice President and Secretary, Fiduciary Trust International of the South; Vice |
| President, Templeton Investment Counsel, LLC; Assistant Secretary, Franklin Resources, Inc.; and officer of 46 of the investment companies |
| in Franklin Templeton Investments. | | | |
| |
| Robert C. Rosselot (1960) | Chief | Since 2013 | Not Applicable | Not Applicable |
| 300 S.E. 2nd Street | Compliance | | | |
| Fort Lauderdale, FL 33301-1923 | Officer | | | |
| Principal Occupation During at Least the Past 5 Years: | | |
| Director, Global Compliance, Franklin Templeton Investments; Vice President, Franklin Templeton Companies, LLC; officer of 46 of the |
| investment companies in Franklin Templeton Investments; and formerly, Senior Associate General Counsel, Franklin Templeton Investments |
| (2007-2013); and Secretary and Vice President, Templeton Group of Funds (2004-2013). | |
| |
| Karen L. Skidmore (1952) | Vice President | Since 2006 | Not Applicable | Not Applicable |
| One Franklin Parkway | and Secretary | | | |
| San Mateo, CA 94403-1906 | | | | |
| |
| Principal Occupation During at Least the Past 5 Years: | | |
| Senior Associate General Counsel, Franklin Templeton Investments; and officer of 46 of the investment companies in Franklin Templeton |
| Investments. | | | | |
| |
| |
| |
| |
| franklintempleton.com | | | | Annual Report | 47 |
FRANKLIN TEMPLETON INTERNATIONAL TRUST
| | | | |
| Interested Board Members and Officers (continued) | |
| |
| | | | Number of Portfolios in | |
| Name, Year of Birth | | Length of | Fund Complex Overseen | Other Directorships Held |
| and Address | Position | Time Served | by Board Member* | During at Least the Past 5 Years |
| |
| Craig S. Tyle (1960) | Vice President | Since 2005 | Not Applicable | Not Applicable |
| One Franklin Parkway | | | | |
| San Mateo, CA 94403-1906 | | | | |
| |
| Principal Occupation During at Least the Past 5 Years: | | |
| General Counsel and Executive Vice President, Franklin Resources, Inc.; and officer of some of the other subsidiaries of Franklin Resources, |
| Inc. and of 46 of the investment companies in Franklin Templeton Investments. | |
| |
| Lori A. Weber (1964) | Vice President | Since 2011 | Not Applicable | Not Applicable |
| 300 S.E. 2nd Street | | | | |
| Fort Lauderdale, FL 33301-1923 | | | | |
| |
| Principal Occupation During at Least the Past 5 Years: | | |
| Senior Associate General Counsel, Franklin Templeton Investments; Assistant Secretary, Franklin Resources, Inc.; Vice President and |
| Secretary, Templeton Investment Counsel, LLC; Vice President, Fiduciary Trust International of the South; and officer of 46 of the investment |
| companies in Franklin Templeton Investments. | | | |
*We base the number of portfolios on each separate series of the U.S. registered investment companies within the Franklin Templeton Investments fund complex. These
portfolios have a common investment manager or affiliated investment managers.
**Gregory E. Johnson is considered to be an interested person of the Fund under the federal securities laws due to his position as an officer and director of Franklin
Resources, Inc. (Resources), which is the parent company of the Fund’s investment manager and distributor. Rupert H. Johnson, Jr. is considered to be an interested
person of the Fund under the federal securities laws due to his position as officer and director and major shareholder of Resources.
Note 1: Rupert H. Johnson, Jr. is the uncle of Gregory E. Johnson.
Note 2: Officer information is current as of the date of this report. It is possible that after this date, information about officers may change.
The Sarbanes-Oxley Act of 2002 and Rules adopted by the Securities and Exchange Commission require the Fund to disclose whether the Fund’s Audit
Committee includes at least one member who is an audit committee financial expert within the meaning of such Act and Rules. The Fund’s Board has deter-
mined that there is at least one such financial expert on the Audit Committee and has designated John B. Wilson as its audit committee financial expert. The
Board believes that Mr. Wilson qualifies as such an expert in view of his extensive business background and experience, including service as chief financial
officer of Staples, Inc. from 1992 to 1996. Mr. Wilson has been a Member and Chairman of the Fund’s Audit Committee since 2006. As a result of such back-
ground and experience, the Board believes that Mr. Wilson has acquired an understanding of generally accepted accounting principles and financial statements,
the general application of such principles in connection with the accounting estimates, accruals and reserves, and analyzing and evaluating financial state-
ments that present a breadth and level of complexity of accounting issues generally comparable to those of the Fund, as well as an understanding of internal
controls and procedures for financial reporting and an understanding of audit committee functions. Mr. Wilson is an independent Board member as that term
is defined under the relevant Securities and Exchange Commission Rules and Releases.
The Statement of Additional Information (SAI) includes additional information about the board members and is available, without charge, upon request.
Shareholders may call (800) DIAL BEN/342-5236 to request the SAI.
48 | Annual Report franklintempleton.com
FRANKLIN TEMPLETON INTERNATIONAL TRUST
FRANKLIN WORLD PERSPECTIVES FUND
Shareholder Information
Proxy Voting Policies and Procedures
The Fund’s investment manager has established Proxy Voting Policies and Procedures (Policies) that the Fund uses to determine how to vote proxies relating to portfolio securities. Shareholders may view the Fund’s complete Policies online at franklintempleton.com. Alternatively, shareholders may request copies of the Policies free of charge by calling the Proxy Group collect at (954) 527-7678 or by sending a written request to: Franklin Templeton Companies, LLC, 300 S.E. 2nd Street, Fort Lauderdale, FL 33301, Attention: Proxy Group. Copies of the Fund’s proxy voting records are also made available online at franklintempleton.com and posted on the U.S. Securities and Exchange Commission’s website at sec.gov and reflect the most recent 12-month period ended June 30.
Quarterly Statement of Investments
The Fund files a complete statement of investments with the U.S. Securities and Exchange Commission for the first and third quarters for each fiscal year on Form N-Q. Shareholders may view the filed Form N-Q by visiting the Commission’s website at sec.gov. The filed form may also be viewed and copied at the Commission’s Public Reference Room in Washington, DC. Information regarding the operations of the Public Reference Room may be obtained by calling (800) SEC-0330.
Householding of Reports and Prospectuses
You will receive the Fund’s financial reports every six months as well as an annual updated summary prospectus (prospectus available upon request). To reduce Fund expenses, we try to identify related shareholders in a household and send only one copy of the financial reports and summary prospectus. This process, called “householding,” will continue indefinitely unless you instruct us otherwise. If you prefer not to have these documents householded, please call us at (800) 632-2301. At any time you may view current prospectuses/summary prospectuses and financial reports on our website. If you choose, you may receive these documents through electronic delivery.
franklintempleton.com Annual Report | 49
This page intentionally left blank.
This page intentionally left blank.
This page intentionally left blank.
Item 2. Code of Ethics.
(a) The Registrant has adopted a code of ethics that applies to its principal executive officers and principal financial and accounting officer.
(c) N/A
(d) N/A
(f) Pursuant to Item 12(a)(1), the Registrant is attaching as an exhibit a copy of its code of ethics that applies to its principal executive officers and principal financial and accounting officer.
Item 3. Audit Committee Financial Expert.
(a)(1) The Registrant has an audit committee financial expert serving on its audit committee.
(2) The audit committee financial expert is John B. Wilson and he is "independent" as defined under the relevant Securities and Exchange Commission Rules and Releases.
Item 4. Principal Accountant Fees and Services.
(a) Audit Fees
The aggregate fees paid to the principal accountant for professional services rendered by the principal accountant for the audit of the registrant’s annual financial statements or for services that are normally provided by the principal accountant in connection with statutory and regulatory filings or engagements were $142,824 for the fiscal year ended October 31, 2014 and $144,332 for the fiscal year ended October 31, 2013.
(b) Audit-Related Fees
There were no fees paid to the principal accountant for assurance and related services rendered by the principal accountant to the registrant that are reasonably related to the performance of the audit of the registrant's financial statements and are not reported under paragraph (a) of Item 4.
There were no fees paid to the principal accountant for assurance and related services rendered by the principal accountant to the registrant's investment adviser and any entity controlling, controlled by or under common control with the investment adviser that provides ongoing services to the registrant that are reasonably related to the performance of the audit of their financial statements.
(c) Tax Fees
There were no fees paid to the principal accountant for professional services rendered by the principal accountant to the registrant for tax compliance, tax advice and tax planning.
The aggregate fees paid to the principal accountant for professional services rendered by the principal accountant to the registrant’s investment adviser and any entity controlling, controlled by or under common control with the investment adviser that provides ongoing services to the registrant for tax compliance, tax advice and tax planning were $0 for the fiscal year ended October 31, 2014 and $6,930 for the fiscal year ended October 31, 2013. The services for which these fees were paid included technical tax consultation for capital gain tax reporting to foreign governments, application of local country tax laws to investments and licensing securities with local country offices.
(d) All Other Fees
The aggregate fees paid to the principal accountant for products and services rendered by the principal accountant to the registrant not reported in paragraphs (a)-(c) of Item 4 were $85 for the fiscal year ended October 31, 2014 and $0 for the fiscal year ended October 31, 2013. The services for which these fees were paid include review of materials provided to the fund Board in connection with the investment management contract renewal process.
The aggregate fees paid to the principal accountant for products and services rendered by the principal accountant to the registrant’s investment adviser and any entity controlling, controlled by or under common control with the investment adviser that provides ongoing services to the registrant not reported in paragraphs (a)-(c) of Item 4 were $163,170 for the fiscal year ended October 31, 2014 and $46,144 for the fiscal year ended October 31, 2013. The services for which these fees were paid include preparation and review of materials provided to the fund Board in connection with the investment management contract renewal process, certifying asset under management, and XBRL tagging on financial statements.
(e) (1) The registrant’s audit committee is directly responsible for approving the services to be provided by the auditors, including:
(i) pre-approval of all audit and audit related services;
(ii) pre-approval of all non-audit related services to be provided to the Fund by the auditors;
(iii) pre-approval of all non-audit related services to be provided to the registrant by the auditors to the registrant’s investment adviser or to any entity that controls, is controlled by or is under common control with the registrant’s investment adviser and that provides ongoing services to the registrant where the non-audit services relate directly to the operations or financial reporting of the registrant; and
(iv) establishment by the audit committee, if deemed necessary or appropriate, as an alternative to committee pre-approval of services to be provided by the auditors, as required by paragraphs (ii) and (iii) above, of policies and procedures to permit such services to be pre-approved by other means, such as through establishment of guidelines or by action of a designated member or members of the committee; provided the policies and procedures are detailed as to the particular service and the committee is informed of each service and such policies and procedures do not include delegation of audit committee responsibilities, as contemplated under the Securities Exchange Act of 1934, to management; subject, in the case of (ii) through (iv), to any waivers, exceptions or exemptions that may be available under applicable law or rules.
(e) (2) None of the services provided to the registrant described in paragraphs (b)-(d) of Item 4 were approved by the audit committee pursuant to paragraph (c)(7)(i)(C) of Rule 2-01 of regulation S-X.
(f) No disclosures are required by this Item 4(f).
(g) The aggregate non-audit fees paid to the principal accountant for services rendered by the principal accountant to the registrant and the registrant’s investment adviser and any entity controlling, controlled by or under common control with the investment adviser that provides ongoing services to the registrant were $163,255 for the fiscal year ended October 31, 2014 and $53,074 for the fiscal year ended October 31, 2013.
(h) The registrant’s audit committee of the board has considered whether the provision of non-audit services that were rendered to the registrant’s investment adviser (not including any sub-adviser whose role is primarily portfolio management and is subcontracted with or overseen by another investment adviser), and any entity controlling, controlled by, or under common control with the investment adviser that provides ongoing services to the registrant that were not pre-approved pursuant to paragraph (c)(7)(ii) of Rule 2-01 of Regulation S-X is compatible with maintaining the principal accountant’s independence.
Item 5. Audit Committee of Listed Registrants. N/A
Item 6. Schedule of Investments. N/A
Item 7. Disclosure of Proxy Voting Policies and Procedures for Closed-End Management Investment Companies. N/A
Item 8. Portfolio Managers of Closed-End Management Investment Companies. N/A
Item 9. Purchases of Equity Securities by Closed-End Management Investment Company and Affiliated Purchasers. N/A
Item 10. Submission of Matters to a Vote of Security Holders.
There have been no changes to the procedures by which shareholders may recommend nominees to the Registrant's Board of Trustees that would require disclosure herein.
Item 11. Controls and Procedures.
(a) Evaluation of Disclosure Controls and Procedures. The Registrant maintains disclosure controls and procedures that are designed to ensure that information required to be disclosed in the Registrant’s filings under the Securities Exchange Act of 1934 and the Investment Company Act of 1940 is recorded, processed, summarized and reported within the periods specified in the rules and forms of the Securities and Exchange Commission. Such information is accumulated and communicated to the Registrant’s management, including its principal executive officer and principal financial officer, as appropriate, to allow timely decisions regarding required disclosure. The Registrant’s management, including the principal executive officer and the principal financial officer, recognizes that any set of controls and procedures, no matter how well designed and operated, can provide only reasonable assurance of achieving the desired control objectives.
Within 90 days prior to the filing date of this Shareholder Report on Form N-CSR, the Registrant had carried out an evaluation, under the supervision and with the participation of the Registrant’s management, including the Registrant’s principal executive officer and the Registrant’s principal financial officer, of the effectiveness of the design and operation of the Registrant’s disclosure controls and procedures. Based on such evaluation, the Registrant’s principal executive officer and principal financial officer concluded that the Registrant’s disclosure controls and procedures are effective.
(b) Changes in Internal Controls. There have been no changes in the Registrant’s internal controls or in other factors that could materially affect the internal controls over financial reporting subsequent to the date of their evaluation in connection with the preparation of this Shareholder Report on Form N-CSR.
Item 12. Exhibits.
(a) (1) Code of Ethics
(a) (2) Certifications pursuant to Section 302 of the Sarbanes-Oxley Act of 2002 of Laura F. Fergerson, Chief Executive Officer - Finance and Administration, and Gaston Gardey, Chief Financial Officer and Chief Accounting Officer
(b) Certifications pursuant to Section 906 of the Sarbanes-Oxley Act of 2002 of Laura F. Fergerson, Chief Executive Officer - Finance and Administration, and Gaston Gardey, Chief Financial Officer and Chief Accounting Officer
SIGNATURES
Pursuant to the requirements of the Securities Exchange Act of 1934 and the Investment Company Act of 1940, the registrant has duly caused this report to be signed on its behalf by the undersigned, thereunto duly authorized.
FRANKLIN TEMPLETON INTERNATIONAL TRUST
By /s/Laura F. Fergerson
Laura F. Fergerson
Chief Executive Officer - Finance and Administration
Date December 26, 2014
Pursuant to the requirements of the Securities Exchange Act of 1934 and the Investment Company Act of 1940, this report has been signed below by the following persons on behalf of the registrant and in the capacities and on the dates indicated.
By /s/Laura F. Fergerson
Laura F. Fergerson
Chief Executive Officer - Finance and Administration
Date December 26, 2014
By /s/Gaston Gardey
Gaston Gardey
Chief Financial Officer and Chief Accounting Officer
Date December 26, 2014