UNITED STATES
SECURITIES AND EXCHANGE COMMISSION
Washington, DC 20549
FORM N-CSR
CERTIFIED SHAREHOLDER REPORT OF REGISTERED MANAGEMENT INVESTMENT COMPANIES
Investment Company Act file number_811-06336
Franklin Templeton International Trust
(Exact name of registrant as specified in charter)
One Franklin Parkway, San Mateo, CA 94403-1906
(Address of principal executive offices) (Zip code)
Craig S. Tyle, One Franklin Parkway, San Mateo, CA 94403-1906
(Name and address of agent for service)
Registrant's telephone number, including area code: 650 312-2000
Date of fiscal year end: 5/31
Date of reporting period: 5/31/15
Item 1. Reports to Stockholders.

Franklin Templeton Investments
Gain From Our Perspective®
At Franklin Templeton Investments, we’re dedicated to one goal: delivering exceptional asset management for our clients. By bringing together multiple, world-class investment teams in a single firm, we’re able to offer specialized expertise across styles and asset classes, all supported by the strength and resources of one of the world’s largest asset managers. This has helped us to become a trusted partner to individual and institutional investors across the globe.
Focus on Investment Excellence
At the core of our firm, you’ll find multiple independent investment teams—each with a focused area of expertise—from traditional to alternative strategies and multi-asset solutions. And because our portfolio groups operate autonomously, their strategies can be combined to deliver true style and asset class diversification.
All of our investment teams share a common commitment to excellence grounded in rigorous, fundamental research and robust, disciplined risk management. Decade after decade, our consistent, research-driven processes have helped Franklin Templeton earn an impressive record of strong, long-term results.
Global Perspective Shaped by Local Expertise
In today’s complex and interconnected world, smart investing demands a global perspective. Franklin Templeton pioneered international investing over 60 years ago, and our expertise in emerging markets spans more than a quarter of a century. Today, our investment professionals are on the ground across the globe, spotting investment ideas and potential risks firsthand. These locally based teams bring in-depth understanding of local companies, economies and cultural nuances, and share their best thinking across our global research network.
Strength and Experience
Franklin Templeton is a global leader in asset management serving clients in over 150 countries.1 We run our business with the same prudence we apply to asset management, staying focused on delivering relevant investment solutions, strong long-term results and reliable, personal service. This approach, focused on putting clients first, has helped us to become one of the most trusted names in financial services.
1. As of 12/31/14. Clients are represented by the total number of shareholder accounts.
Not FDIC Insured | May Lose Value | No Bank Guarantee
| |
| Contents | |
| |
| Annual Report | |
| Franklin Global Allocation Fund | 3 |
| Performance Summary | 7 |
| Your Fund’s Expenses | 12 |
| Consolidated Financial Highlights | |
| and Consolidated Statement | |
| of Investments | 14 |
| Consolidated Financial Statements | 31 |
| Notes to | |
| Consolidated Financial Statements | 35 |
| Report of Independent Registered | |
| Public Accounting Firm | 48 |
| Tax Information | 49 |
| Board Members and Officers | 51 |
| Shareholder Information | 56 |
franklintempleton.com
1
Annual Report
Franklin Global Allocation Fund
(formerly, Franklin Templeton Global Allocation Fund)
We are pleased to bring you Franklin Global Allocation Fund’s annual report for the fiscal year ended May 31, 2015. Effective at the close of market on April 20, 2015, the Fund was closed to all new investors with limited exceptions, and the Fund closed to all investments on or about June 23, 2015. The Fund was scheduled to liquidate on June 30, 2015, but on June 26, 2015, the Board of Trustees approved a proposal to delay the termination and liquidation of the Fund due to delays in liquidating certain portfolio securities. The termination and liquidation of the Fund is now anticipated to occur following the sale of the portfolio securities, but may occur earlier at the discretion of the Trust’s officers if circumstances change. As a reminder, shareholders of the Fund may redeem their shares at any time before the liquidation without incurring any contingent deferred sales charges or other fees.
Your Fund’s Goal and Main Investments
The Fund seeks total return. Under normal market conditions, the Fund strategically invests in a diversified core portfolio of equity and fixed income investments, and tactically adjusts the Fund’s exposure to certain asset classes, regions, currencies and sectors independent of the investment processes of the core portfolio’s investment strategies.
Performance Overview
The Fund’s Class A shares delivered a +3.83% cumulative total return for the 12 months under review. In comparison, the Fund’s benchmark generated a +1.48% total return.1 The benchmark is a combination of MSCI All Country World Index (ACWI),2 which measures stock performance in developed and emerging markets; Citigroup World Government Bond Index (WGBI),2 which measures performance of investment-grade
world government bonds; Bloomberg Commodity Index,2,3 which measures performance of exchange-traded futures contracts on physical commodities; and Payden & Rygel (P&R) 90 Day U.S. Treasury Bill (T-Bill) Index,4 a proxy for short-term investments and other net assets. You can find more of the Fund’s performance data in the Performance Summary beginning on page 7.
Performance data represent past performance, which does not guarantee future results. Investment return and principal value will fluctuate, and you may have a gain or loss when you sell your shares. Current performance may differ from figures shown. Please visit franklintempleton.com or call (800) 342-5236 for most recent month-end performance.
1. The Fund’s blended benchmark is currently weighted 50% for the MSCI ACWI, 35% for the Citigroup WGBI, 5% for the Bloomberg Commodity Index and 10% for the
P&R 90 Day U.S. T-Bill Index, rebalanced monthly. For the period from 5/31/14 through 5/31/15, the MSCI ACWI had a +5.62% total return, the Citigroup WGBI had a
-8.04% total return, the Bloomberg Commodity Index had a -24.55% total return, and the P&R 90 Day U.S. T-Bill Index had a +0.03% total return.
2. Source: Morningstar.
3. Prior to 7/1/14, the index was known as Dow Jones-UBS Commodity Index.
4. Source: Payden & Rygel.
The indexes are unmanaged and include reinvestment of any income or distributions. One cannot invest directly in an index, and an index is not representative of the
Fund’s portfolio.
The dollar value, number of shares or principal amount, and names of all portfolio holdings are listed in the Fund’s Consolidated Statement of Investments (SOI).
The Consolidated SOI begins on page 18.
franklintempleton.com
Annual Report
| 3
FRANKLIN GLOBAL ALLOCATION FUND
Economic and Market Overview
The global economy expanded moderately during the 12 months under review despite slowing growth in some countries. As measured by the MSCI World Index, stocks in global developed markets advanced overall during the 12-month period amid a generally accommodative monetary policy environment and signs of economic improvement in Europe and Japan. Prices of oil and other commodities declined sharply during the 12-month period owing largely to strong global supply.
U.S. economic growth moderated, especially in the second half of the period. In 2015’s first quarter, low energy prices, U.S. dollar strength and a labor dispute at West Coast ports led exports to decline. Lower business investment and state and local government spending also weighed on the economy, while increases in consumer spending and private inventory investment offered some support. The U.S. Federal Reserve Board (Fed) ended its bond buying program in October 2014 and kept its target interest rate at 0%–0.25% while considering when it might be appropriate to raise it. In its April meeting, the Fed attributed the economy’s first-quarter slowdown to transitory factors. The Fed reiterated that it would raise interest rates when it saw further improvement in the labor market and was reasonably confident that inflation would move back to its 2% objective over the medium term.
Outside the U.S., the U.K. economy grew relatively well through 2014, aided by the services and manufacturing sectors but moderated in 2015’s first quarter as the construction, mining and agriculture sectors contracted. Near period-end, the Conservative Party’s unexpected victory in the U.K. general elections supported investor sentiment. In the eurozone, economic growth improved during the 12-month period. Spain expanded at a solid pace, and France and Italy returned to growth in 2015’s first quarter. However, Germany, the region’s largest economy, slowed during the first quarter amid sluggish exports. In June and September 2014, the European Central Bank (ECB) reduced interest rates. The ECB also expanded asset purchases to boost inflation and the economy. Despite deflationary pressures and the crisis in Ukraine, the region benefited from lower oil prices, a weaker euro that helped exports, the ECB’s accommodative policy and an improved 2015 eurozone growth forecast.
The Bank of Japan (BOJ) broadened its stimulus measures amid weak domestic demand and lower inflation. In December, Japan’s ruling coalition was reelected and announced a new stimulus package to revive economic growth. The country exited recession in the fourth quarter, supported largely by exports. The Japanese economy continued to grow in 2015’s first quarter, driven by an increase in private demand as business investment and private consumption rose. Near period-end, the BOJ lowered its economic growth and inflation forecasts and maintained its monetary policy.
In emerging markets, economic growth generally moderated. Brazil continued to face headwinds such as high inflation, lower commodity prices and a severe drought. To reduce a widening fiscal deficit and regain investors’ confidence after a first-quarter decline in growth, Brazil’s government approved austerity measures that curbed social security and labor benefits. Central bank actions varied across emerging markets, as some banks raised interest rates in response to rising inflation and weakening currencies, while others lowered interest rates to promote economic growth. In the recent global environment, emerging market stocks, as measured by the MSCI Emerging Markets Index, were fairly flat for the 12-month period.
Investment Strategy
We manage the Fund using a multi-manager approach. While we are responsible for the Fund’s overall investments, we consult with various other investment managers within Franklin Templeton Investments (subadvisors) who independently manage separate portions of the Fund’s core equity and fixed income portfolio in accordance with the following strategies: all-cap U.S. growth equity, non-U.S. growth equity, deep value equity, non-U.S. value equity, emerging markets equity, global fixed income and global low duration fixed income. The allocations to each strategy may change from time to time and are subject to periodic rebalancing as market values of the portfolio’s securities change or at our discretion.
Under normal market conditions, the Fund’s baseline allocation between broad asset classes is 50% global equity (U.S./international/emerging), 35% global fixed income (U.S./international/emerging), 5% commodity-linked instruments, and 10% cash and derivative instruments. We manage the Fund’s allocation to commodities, as well as the Fund’s tactical allocation portion, and rebalance the Fund’s portfolio to maintain the baseline strategic allocation to various asset classes and investment strategies. We may change the baseline strategic allocation from time to time.
For purposes of its investment goal, the Fund regularly enters into various transactions involving derivative instruments. For the Fund’s tactical asset allocation, we primarily use stock index futures, government bond futures, equity total return swaps and currency forwards and futures contracts. We make tactical investment decisions based on quantitative research
4 | Annual Report
franklintempleton.com
FRANKLIN GLOBAL ALLOCATION FUNDand a systematic investment strategy driven by bottom-up fundamentals analysis, top-down macroeconomic analysis and short-term sentiment indicators. The tactical allocation portion of the Fund is intended to adjust the Fund’s equity, fixed income, commodity, country/regional, and currency exposures. Although we do not attempt to time the entire market’s direction, we keep the flexibility to shift the Fund’s net exposure (the value of securities held long less the value of securities held short) depending on which market opportunities look more attractive.5 The Fund may, from time to time, have a net short position in certain asset classes, regions, currencies and sectors.
What is a futures contract?
A futures contract, or a future, is an agreement between the
Fund and a counterparty made through a U.S. or foreign
futures exchange to buy or sell an underlying instrument or
asset at a specific price on a future date.
What is a currency forward contract?
A currency forward contract, or a currency forward, is an
agreement between the Fund and a counterparty to buy or sell
a foreign currency at a specific exchange rate on a future date.
What is a swap agreement?
A swap agreement, such as an equity total return swap, is a
contract between the Fund and a counterparty to exchange on
a future date the returns, or differentials in rates of return, that
would have been earned or realized if a notional amount were
invested in specific instruments.
Manager’s Discussion
For the 12-month period ended May 31, 2015, the Fund’s multi-asset portfolio’s Class A shares outperformed its blended benchmark, driven primarily by selection across the fixed income and currency markets. The Fund’s overweighted equity allocation also contributed to relative performance.
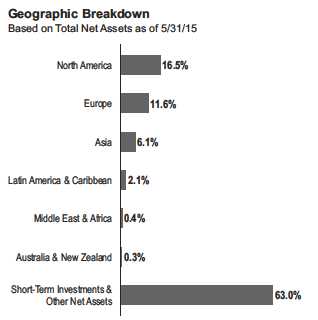
Baseline Strategic Allocation
At period-end, the Fund’s largest asset class exposure was to short-term investments, resulting from the investment manager’s decision to liquidate the Fund. Global equities represented the second-largest holding, followed by fixed income. Regionally, the largest equity weightings were in North America and Europe, with the U.S., the U.K. and China making up the
| | |
| Portfolio Breakdown | | |
| 5/31/15 | | |
| | % of Total | |
| | Net Assets | |
| |
| Stocks | 24.4 | % |
| Energy | 3.0 | % |
| Pharmaceuticals, Biotechnology & Life Sciences | 2.8 | % |
| Software & Services | 2.1 | % |
| Banks | 2.0 | % |
| Other | 14.5 | % |
| |
| Bonds | 12.0 | % |
| Foreign Government & Agency Securities | 5.7 | % |
| Corporate Bonds | 3.3 | % |
| U.S. Government & Agency Securities | 3.0 | % |
| |
| Commodities | 2.4 | % |
| Exchange Traded Notes | 2.4 | % |
| |
| Short-Term Investments & Other Net Assets | 61.2 | % |
largest country exposures. Relative to the blended benchmark’s equity portion, the largest country overweightings were in China, Denmark and Russia, while the U.S. and Japan represented our largest underweightings. Within the fixed income allocation, the largest regional allocations at period-end were to North America and Latin America, and our largest country exposures were to the U.S., Mexico and Malaysia. Relative to the blended benchmark’s fixed income portion, the largest country overweightings were in Mexico and Malaysia. The largest fixed income underweightings were in the U.S., Japan and France.
Tactical Asset Allocation
At period end, the portfolio’s tactical asset allocation was limited to allocations to several currency markets. These positions included long positions in the U.S. dollar and Norwegian krone and short positions in the Canadian dollar, euro and Japanese yen, achieved through currency forwards.
Equity
For the overall portfolio, the equity portion positively contributed to performance, outperforming the blended benchmark. Positioning within Asia was a major contributor, driven by overweighted allocations to China and Hong Kong. Security selection in Japanese equities also added value, although an underweighting in that market limited gains. Security selection across Europe aided performance, led by currency-hedged positions in Germany and Spain. Despite the overall positive
5. A long position involves the purchase of a security, commodity or currency, or the use of derivatives, with the expectation that the asset or underlying asset will
subsequently rise in value. A short position may involve the sale of a borrowed security, commodity or currency, or the use of derivatives, with the expectation that the
asset or underlying asset will subsequently fall in value.
See www.franklintempletondatasources.com for additional data provider information.
franklintempleton.com
Annual Report
| 5
FRANKLIN GLOBAL ALLOCATION FUND
contribution to return, some areas of our equity holdings hurt relative performance. An underweighted allocation to the U.S. weighed on performance, as it was among the strongest markets over the period. Short positions in developing markets equities also hindered performance.
Fixed Income
For the overall portfolio, our fixed income holdings detracted on an absolute basis but outperformed relative to the blended benchmark. In general, a significant underweighting to developed markets added value, as those markets broadly underperformed. A focus on shorter duration assets also benefited performance as these issues saw smaller losses relative to the broad index. A hedge against rising global interest rates, achieved primarily through a short position in U.K. gilt debt securities, detracted from relative performance as yields on those issues moved lower over the period. Exposure to several emerging debt markets, including Poland, Mexico and Hungary, also detracted.
Currencies
Overall, currency positions were positive contributors to performance in absolute terms and relative to the blended benchmark. A significant underweighting in the euro was a major contributor, as the euro depreciated against the U.S. dollar during the period. A short position in the Japanese yen, achieved through currency forward contracts, was another driver of positive performance. However, overweightings in several emerging market currencies, including positions in the South Korean won and Polish zloty, detracted from performance.
Thank you for your participation in Franklin Global Allocation Fund.

The foregoing information reflects our analysis, opinions and portfolio holdings as of May 31, 2015, the end of the reporting period. The way we implement our main investment strategies and the resulting portfolio holdings may change depending on factors such as market and economic conditions. These opinions may not be relied upon as investment advice or an offer for a particular security. The information is not a complete analysis of every aspect of any market, country, industry, security or the Fund. Statements of fact are from sources considered reliable, but the investment manager makes no representation or warranty as to their completeness or accuracy. Although historical performance is no guarantee of future results, these insights may help you understand our investment management philosophy.
Effective in April 2015, Vaneet Chadha assumed lead portfolio manager responsibilities for the Fund. He is also a research analyst for Franklin Alternative Strategies, LLC, a member of the Franklin Templeton Solutions Global Investment Committee and the portfolio manager for our global tactical allocation investment strategies. Before joining Franklin Templeton in 2012, Mr. Chadha worked at Citadel LLC for over three years, most recently as a quantitative developer supporting long short, relative value credit strategies. Previously at Citadel, he completed a financial technology associate rotation program working for various businesses such as options market making and global equities.
CFA® is a trademark owned by CFA Institute.
6 | Annual Report
franklintempleton.com
FRANKLIN GLOBAL ALLOCATION FUND
Performance Summary as of May 31, 2015
Your dividend income will vary depending on dividends or interest paid by securities in the Fund’s portfolio, adjusted for operating expenses of each class. Capital gain distributions are net profits realized from the sale of portfolio securities. The performance table and graphs do not reflect any taxes that a shareholder would pay on Fund dividends, capital gain distributions, if any, or any realized gains on the sale of Fund shares. Total return reflects reinvestment of the Fund’s dividends and capital gain distributions, if any, and any unrealized gains or losses.
| | | | | | | | |
| Net Asset Value | | | | | | | | |
| Share Class (Symbol) | | 5/31/15 | | 5/31/14 | | Change | | |
| A (FGAAX) | $ | 10.97 | $ | 11.38 | -$ | 0.41 | | |
| C (N/A) | $ | 10.92 | $ | 11.27 | -$ | 0.35 | | |
| R (N/A) | $ | 10.95 | $ | 11.35 | -$ | 0.40 | | |
| Advisor (FGAZX) | $ | 10.98 | $ | 11.41 | -$ | 0.43 | | |
| |
| |
| Distributions (6/1/14–5/31/15) | | | | | | | | |
| | | Dividend | | Short-Term | | Long-Term | | |
| Share Class | | Income | | Capital Gain | | Capital Gain | | Total |
| A | $ | 0.3197 | $ | 0.0335 | $ | 0.4147 | $ | 0.7679 |
| C | $ | 0.1861 | $ | 0.0335 | $ | 0.4147 | $ | 0.6343 |
| R | $ | 0.2780 | $ | 0.0335 | $ | 0.4147 | $ | 0.7262 |
| Advisor | $ | 0.3643 | $ | 0.0335 | $ | 0.4147 | $ | 0.8125 |
franklintempleton.com
Annual Report
| 7
FRANKLIN GLOBAL ALLOCATION FUND
PERFORMANCE SUMMARY
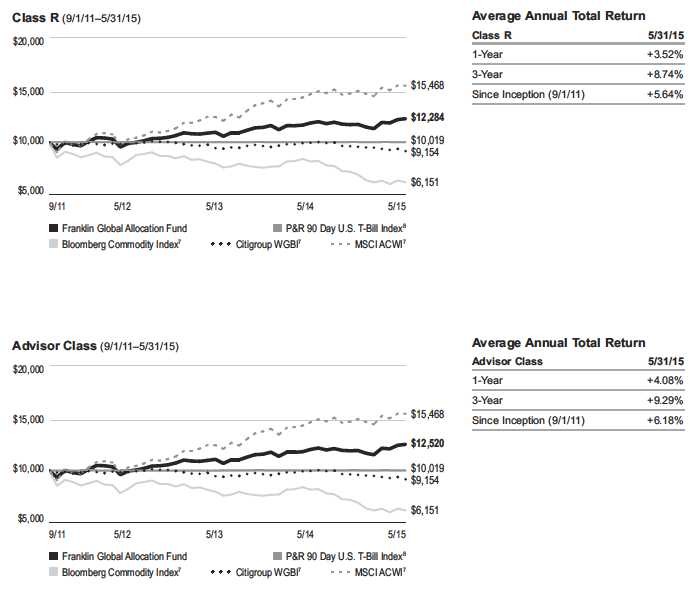
Performance as of 5/31/151
Cumulative total return excludes sales charges. Average annual total returns and value of $10,000 investment include maximum sales charges. Class A: 5.75% maximum initial sales charge; Class C: 1% contingent deferred sales charge in first year only;
Class R/Advisor Class: no sales charges.
| | | | | | | | | | | | |
| | | | | | | Value of | Average Annual | | | | | |
| | Cumulative | | Average Annual | | $ | 10,000 | Total Return | | Total Annual Operating Expenses6 | |
| Share Class | Total Return2 | | Total Return3 | | | Investment4 | (6/30/15 | )5 | (with waiver) | | (without waiver) | |
| A | | | | | | | | | 1.31 | % | 2.04 | % |
| 1-Year | +3.83 | % | -2.11 | % | $ | 9,789 | -3.80 | % | | | | |
| 3-Year | +29.63 | % | +6.91 | % | $ | 12,219 | +5.43 | % | | | | |
| Since Inception (9/1/11) | +24.33 | % | +4.32 | % | $ | 11,718 | +4.06 | % | | | | |
| C | | | | | | | | | 2.01 | % | 2.74 | % |
| 1-Year | +3.07 | % | +2.10 | % | $ | 10,210 | +0.41 | % | | | | |
| 3-Year | +26.89 | % | +8.26 | % | $ | 12,689 | +6.73 | % | | | | |
| Since Inception (9/1/11) | +20.83 | % | +5.18 | % | $ | 12,083 | +4.88 | % | | | | |
| R | | | | | | | | | 1.51 | % | 2.24 | % |
| 1-Year | +3.52 | % | +3.52 | % | $ | 10,352 | +1.92 | % | | | | |
| 3-Year | +28.57 | % | +8.74 | % | $ | 12,857 | +7.25 | % | | | | |
| Since Inception (9/1/11) | +22.84 | % | +5.64 | % | $ | 12,284 | +5.38 | % | | | | |
| Advisor | | | | | | | | | 1.01 | % | 1.74 | % |
| 1-Year | +4.08 | % | +4.08 | % | $ | 10,408 | +2.16 | % | | | | |
| 3-Year | +30.54 | % | +9.29 | % | $ | 13,054 | +7.69 | % | | | | |
| Since Inception (9/1/11) | +25.20 | % | +6.18 | % | $ | 12,520 | +5.84 | % | | | | |
Performance data represent past performance, which does not guarantee future results. Investment return and principal value will fluctuate, and you may have a gain or loss when you sell your shares. Current performance may differ from figures shown. For most recent month-end performance, go to franklintempleton.com or call (800) 342-5236.
8 | Annual Report
franklintempleton.com
FRANKLIN GLOBAL ALLOCATION FUND
PERFORMANCE SUMMARY
Total Return Index Comparison for a Hypothetical $10,000 Investment1
Total return represents the change in value of an investment over the periods shown. It includes any applicable maximum sales charge, Fund expenses, account fees and reinvested distributions. The unmanaged indexes include reinvestment of any income or distributions. They differ from the Fund in composition and do not pay management fees or expenses. One cannot invest directly in an index.

franklintempleton.com
Annual Report
| 9
FRANKLIN GLOBAL ALLOCATION FUND
PERFORMANCE SUMMARY
Total Return Index Comparison for a Hypothetical $10,000 Investment1 (continued)
10 | Annual Report
franklintempleton.com
FRANKLIN GLOBAL ALLOCATION FUND
PERFORMANCE SUMMARY
All investments involve risks, including possible loss of principal. Generally, investors should be comfortable with fluctuation in the value of their investments, especially over the short term. Stock prices fluctuate, sometimes rapidly or unpredictably, due to factors affecting individual companies, particular industries or sectors, or general market conditions. Bond prices generally move in the opposite direction of interest rates. Thus, as prices of bonds in the Fund adjust to a rise in interest rates, the Fund’s share price may decline. Changes in the financial strength of a bond issuer or in a bond’s credit rating may affect its value. Foreign investing carries additional risks such as currency and market volatility and political or social instability, risks that are heightened in less developed or emerging market countries. Derivative instruments, including currency management strategies, involve costs and can create economic leverage in the Fund’s portfolio, which may result in significant volatility and cause the Fund to participate in losses (as well as gains) in an amount that significantly exceeds the Fund’s initial investment. The Fund may not achieve the intended benefits and may realize losses when a counterparty fails to perform as promised. Because the Fund allocates assets to a variety of investment strategies involving certain risks, it may be subject to those same risks. These risks are described more fully in the Fund’s prospectus. The Fund is actively managed, but there is no guarantee that the manager’s investment decisions will produce the desired results.
| |
| Class C: | These shares have higher annual fees and expenses than Class A shares. |
| Class R: | Shares are available to certain eligible investors as described in the prospectus. These shares have higher annual fees and expenses than Class A shares. |
| Advisor Class: | Shares are available to certain eligible investors as described in the prospectus. |
1. The Fund has an expense reduction contractually guaranteed through at least 9/30/15, a fee waiver related to the management fee paid by a subsidiary and a fee waiver
associated with any investments in a Franklin Templeton money fund, contractually guaranteed through at least its current fiscal year-end. Fund investment results reflect
the expense reduction and fee waivers, to the extent applicable; without these reductions, the results would have been lower.
2. Cumulative total return represents the change in value of an investment over the periods indicated.
3. Average annual total return represents the average annual change in value of an investment over the periods indicated.
4. These figures represent the value of a hypothetical $10,000 investment in the Fund over the periods indicated.
5. In accordance with SEC rules, we provide standardized average annual total return information through the latest calendar quarter.
6. Figures are as stated in the Fund’s current prospectus. In periods of market volatility, assets may decline significantly, causing total annual Fund operating expenses to
become higher than the figures shown.
7. Source: Morningstar. The MSCI ACWI is a free float-adjusted, market capitalization-weighted index designed to measure equity market performance in global developed
and emerging markets. The Citigroup WGBI is a market capitalization-weighted index consisting of investment-grade world government bond markets. The P&R 90 Day
U.S. T-Bill Index is a total return index based on a constant maturity instrument. P&R includes both accrued interest and change in market price in its monthly total return
calculation. The Bloomberg Commodity Index comprises exchange-traded futures on physical commodities, which are weighted to account for economic significance and
market liquidity.
See www.franklintempletondatasources.com for additional data provider information.
franklintempleton.com
Annual Report
| 11
FRANKLIN GLOBAL ALLOCATION FUND
Your Fund’s Expenses
As a Fund shareholder, you can incur two types of costs:
- Transaction costs, including sales charges (loads) on Fund purchases; and
- Ongoing Fund costs, including management fees, distribu- tion and service (12b-1) fees, and other Fund expenses. All mutual funds have ongoing costs, sometimes referred to as operating expenses.
The following table shows ongoing costs of investing in the Fund and can help you understand these costs and compare them with those of other mutual funds. The table assumes a $1,000 investment held for the six months indicated.
Actual Fund Expenses
The first line (Actual) for each share class listed in the table provides actual account values and expenses. The “Ending Account Value” is derived from the Fund’s actual return, which includes the effect of Fund expenses.
You can estimate the expenses you paid during the period by following these steps. Of course, your account value and expenses will differ from those in this illustration:
| 1. | Divide your account value by $1,000. |
| | If an account had an $8,600 value, then $8,600 ÷ $1,000 = 8.6. |
| 2. | Multiply the result by the number under the heading “Expenses Paid During Period.” |
| | If Expenses Paid During Period were $7.50, then 8.6 x $7.50 = $64.50. |
In this illustration, the estimated expenses paid this period are $64.50.
Hypothetical Example for Comparison with Other Funds
Information in the second line (Hypothetical) for each class in the table can help you compare ongoing costs of investing in the Fund with those of other mutual funds. This information may not be used to estimate the actual ending account balance or expenses you paid during the period. The hypothetical “Ending Account Value” is based on the actual expense ratio for each class and an assumed 5% annual rate of return before expenses, which does not represent the Fund’s actual return. The figure under the heading “Expenses Paid During Period” shows the hypothetical expenses your account would have incurred under this scenario. You can compare this figure with the 5% hypothetical examples that appear in shareholder reports of other funds.
Please note that expenses shown in the table are meant to highlight ongoing costs and do not reflect any transaction costs, such as sales charges. Therefore, the second line for each class is useful in comparing ongoing costs only, and will not help you compare total costs of owning different funds. In addition, if transaction costs were included, your total costs would have been higher. Please refer to the Fund prospectus for additional information on operating expenses.
12 | Annual Report
franklintempleton.com
FRANKLIN GLOBAL ALLOCATION FUND
YOUR FUND’S EXPENSES
| | | | | | |
| | | Beginning Account | | Ending Account | | Expenses Paid During |
| Share Class | | Value 12/1/14 | | Value 5/31/15 | | Period* 12/1/14–5/31/15 |
| A | | | | | | |
| Actual | $ | 1,000 | $ | 1,048.40 | $ | 5.92 |
| Hypothetical (5% return before expenses) | $ | 1,000 | $ | 1,019.15 | $ | 5.84 |
| C | | | | | | |
| Actual | $ | 1,000 | $ | 1,043.70 | $ | 10.14 |
| Hypothetical (5% return before expenses) | $ | 1,000 | $ | 1,015.01 | $ | 10.00 |
| R | | | | | | |
| Actual | $ | 1,000 | $ | 1,047.20 | $ | 7.66 |
| Hypothetical (5% return before expenses) | $ | 1,000 | $ | 1,017.45 | $ | 7.54 |
| Advisor | | | | | | |
| Actual | $ | 1,000 | $ | 1,050.00 | $ | 5.11 |
| Hypothetical (5% return before expenses) | $ | 1,000 | $ | 1,019.95 | $ | 5.04 |
*Expenses are calculated using the most recent six-month expense ratio, net of expense waivers, annualized for each class (A: 1.16%;
C: 1.99%; R: 1.50%; and Advisor: 1.00%), multiplied by the average account value over the period, multiplied by 182/365 to reflect the
one-half year period.
franklintempleton.com
Annual Report
| 13
| | | | | | | | | | | | |
| FRANKLIN TEMPLETON INTERNATIONAL TRUST | | | | | | | | | | | | |
| |
| |
| Consolidated Financial Highlights | | | | | | | | | | | | |
| Franklin Global Allocation Fund | | | | | | | | | | | | |
| | | | | | Year Ended May 31, | | | | |
| | | 2015 | | | 2014 | | | 2013 | | | 2012 | a |
| Class A | | | | | | | | | | | | |
| Per share operating performance | | | | | | | | | | | | |
| (for a share outstanding throughout the year) | | | | | | | | | | | | |
| Net asset value, beginning of year | $ | 11.38 | | $ | 10.78 | | $ | 9.53 | | $ | 10.00 | |
| Income from investment operationsb: | | | | | | | | | | | | |
| Net investment incomec | | 0.07 | | | 0.10 | d | | 0.08 | | | 0.06 | |
| Net realized and unrealized gains (losses) | | 0.29 | | | 0.79 | | | 1.36 | | | (0.47 | ) |
| Total from investment operations | | 0.36 | | | 0.89 | | | 1.44 | | | (0.41 | ) |
| Less distributions from: | | | | | | | | | | | | |
| Net investment income and net foreign currency gains | | (0.32 | ) | | (0.29 | ) | | (0.19 | ) | | (0.06 | ) |
| Net realized gains | | (0.45 | ) | | — | | | — | | | — | |
| Total distributions | | (0.77 | ) | | (0.29 | ) | | (0.19 | ) | | (0.06 | ) |
| Net asset value, end of year | $ | 10.97 | | $ | 11.38 | | $ | 10.78 | | $ | 9.53 | |
| |
| Total returne | | 3.83 | % | | 8.35 | % | | 15.22 | % | | (4.09 | )% |
| |
| Ratios to average net assetsf | | | | | | | | | | | | |
| Expenses before waiver and payments by affiliates | | 2.12 | % | | 1.89 | % | | 2.10 | % | | 2.85 | % |
| Expenses net of waiver and payments by affiliates | | 1.25 | %g | | 1.20 | %g | | 1.16 | % | | 1.08 | % |
| Net investment income | | 0.66 | % | | 0.92 | %d | | 0.76 | % | | 0.79 | % |
| |
| Supplemental data | | | | | | | | | | | | |
| Net assets, end of year (000’s) | $ | 17,010 | | $ | 23,509 | | $ | 23,472 | | $ | 18,055 | |
| Portfolio turnover rate | | 49.80 | % | | 39.58 | % | | 47.73 | % | | 15.34 | % |
aFor the period September 1, 2011 (commencement of operations) to May 31, 2012.
bThe amount shown for a share outstanding throughout the period may not correlate with the Consolidated Statement of Operations for the period due to the timing of sales
and repurchases of the Fund’s shares in relation to income earned and/or fluctuating fair value of the investments of the Fund.
cBased on average daily shares outstanding.
dNet investment income per share includes approximately $0.03 per share received in the form of a special dividend paid in connection with certain Fund holdings.
Excluding this amount, the ratio of net investment income to average net assets would have been 0.68%.
eTotal return does not reflect sales commissions or contingent deferred sales charges, if applicable, and is not annualized for periods less than one year.
fRatios are annualized for periods less than one year.
gBenefit of expense reduction rounds to less than 0.01%.
14 | Annual Report | The accompanying notes are an integral part of these consolidated financial statements. franklintempleton.com
| | | | | | | | | | | | |
| | | FRANKLIN TEMPLETON INTERNATIONAL TRUST | |
| | | | | | FINANCIAL HIGHLIGHTS | |
| |
| |
| |
| Franklin Global Allocation Fund (continued) | | | | | | | | | | | | |
| | | | | | Year Ended May 31, | | | | |
| | | 2015 | | | 2014 | | | 2013 | | | 2012 | a |
| Class C | | | | | | | | | | | | |
| Per share operating performance | | | | | | | | | | | | |
| (for a share outstanding throughout the year) | | | | | | | | | | | | |
| Net asset value, beginning of year | $ | 11.27 | | $ | 10.72 | | $ | 9.49 | | $ | 10.00 | |
| Income from investment operationsb: | | | | | | | | | | | | |
| Net investment income (loss)c | | (0.01 | ) | | 0.02 | d | | —e | | | —e | |
| Net realized and unrealized gains (losses) | | 0.30 | | | 0.78 | | | 1.36 | | | (0.48 | ) |
| Total from investment operations | | 0.29 | | | 0.80 | | | 1.36 | | | (0.48 | ) |
| Less distributions from: | | | | | | | | | | | | |
| Net investment income and net foreign currency gains | | (0.19 | ) | | (0.25 | ) | | (0.13 | ) | | (0.03 | ) |
| Net realized gains | | (0.45 | ) | | — | | | — | | | — | |
| Total distributions | | (0.64 | ) | | (0.25 | ) | | (0.13 | ) | | (0.03 | ) |
| Net asset value, end of year | $ | 10.92 | | $ | 11.27 | | $ | 10.72 | | $ | 9.49 | |
| |
| Total returnf | | 3.07 | % | | 7.62 | % | | 14.40 | % | | (4.77 | )% |
| |
| Ratios to average net assetsg | | | | | | | | | | | | |
| Expenses before waiver and payments by affiliates | | 2.84 | % | | 2.62 | % | | 2.86 | % | | 3.69 | % |
| Expenses net of waiver and payments by affiliates | | 1.97 | %h | | 1.93 | %h | | 1.92 | % | | 1.92 | % |
| Net investment income (loss) | | (0.06 | )% | | 0.19 | %d | | —%i | | | (0.05 | )% |
| |
| Supplemental data | | | | | | | | | | | | |
| Net assets, end of year (000’s) | $ | 3,866 | | $ | 5,557 | | $ | 6,315 | | $ | 3,639 | |
| Portfolio turnover rate | | 49.80 | % | | 39.58 | % | | 47.73 | % | | 15.34 | % |
aFor the period September 1, 2011 (commencement of operations) to May 31, 2012.
bThe amount shown for a share outstanding throughout the period may not correlate with the Consolidated Statement of Operations for the period due to the timing of sales
and repurchases of the Fund’s shares in relation to income earned and/or fluctuating fair value of the investments of the Fund.
cBased on average daily shares outstanding.
dNet investment income per share includes approximately $0.03 per share received in the form of a special dividend paid in connection with certain Fund holdings.
Excluding this amount, the ratio of net investment income to average net assets would have been (0.05)%.
eAmount rounds to less than $0.01 per share.
fTotal return does not reflect sales commissions or contingent deferred sales charges, if applicable, and is not annualized for periods less than one year.
gRatios are annualized for periods less than one year.
hBenefit of expense reduction rounds to less than 0.01%.
iRounds to less than 0.01%.
franklintempleton.com The accompanying notes are an integral part of these consolidated financial statements. | Annual Report | 15
| | | | | | | | | | | | |
| FRANKLIN TEMPLETON INTERNATIONAL TRUST | | | | | | | | | | | | |
| FINANCIAL HIGHLIGHTS | | | | | | | | | | | | |
| |
| |
| |
| Franklin Global Allocation Fund (continued) | | | | | | | | | | | | |
| | | | | | Year Ended May 31, | | | | |
| | | 2015 | | | 2014 | | | 2013 | | | 2012 | a |
| Class R | | | | | | | | | | | | |
| Per share operating performance | | | | | | | | | | | | |
| (for a share outstanding throughout the year) | | | | | | | | | | | | |
| Net asset value, beginning of year | $ | 11.35 | | $ | 10.76 | | $ | 9.51 | | $ | 10.00 | |
| Income from investment operationsb: | | | | | | | | | | | | |
| Net investment incomec | | 0.05 | | | 0.07 | d | | 0.04 | | | 0.02 | |
| Net realized and unrealized gains (losses) | | 0.28 | | | 0.79 | | | 1.37 | | | (0.47 | ) |
| Total from investment operations | | 0.33 | | | 0.86 | | | 1.41 | | | (0.45 | ) |
| Less distributions from: | | | | | | | | | | | | |
| Net investment income and net foreign currency gains | | (0.28 | ) | | (0.27 | ) | | (0.16 | ) | | (0.04 | ) |
| Net realized gains | | (0.45 | ) | | — | | | — | | | — | |
| Total distributions | | (0.73 | ) | | (0.27 | ) | | (0.16 | ) | | (0.04 | ) |
| Net asset value, end of year | $ | 10.95 | | $ | 11.35 | | $ | 10.76 | | $ | 9.51 | |
| |
| Total returne | | 3.52 | % | | 8.16 | % | | 14.84 | % | | (4.45 | )% |
| |
| Ratios to average net assetsf | | | | | | | | | | | | |
| Expenses before waiver and payments by affiliates | | 2.37 | % | | 2.19 | % | | 2.44 | % | | 3.27 | % |
| Expenses net of waiver and payments by affiliates | | 1.50 | %g | | 1.50 | %g | | 1.50 | % | | 1.50 | % |
| Net investment income | | 0.41 | % | | 0.62 | %d | | 0.42 | % | | 0.37 | % |
| |
| Supplemental data | | | | | | | | | | | | |
| Net assets, end of year (000’s) | $ | 2,192 | | $ | 2,297 | | $ | 2,155 | | $ | 1,903 | |
| Portfolio turnover rate | | 49.80 | % | | 39.58 | % | | 47.73 | % | | 15.34 | % |
aFor the period September 1, 2011 (commencement of operations) to May 31, 2012.
bThe amount shown for a share outstanding throughout the period may not correlate with the Consolidated Statement of Operations for the period due to the timing of sales
and repurchases of the Fund’s shares in relation to income earned and/or fluctuating fair value of the investments of the Fund.
cBased on average daily shares outstanding.
dNet investment income per share includes approximately $0.03 per share received in the form of a special dividend paid in connection with certain Fund holdings.
Excluding this amount, the ratio of net investment income to average net assets would have been 0.38%.
eTotal return is not annualized for periods less than one year.
fRatios are annualized for periods less than one year.
gBenefit of expense reduction rounds to less than 0.01%.
16 | Annual Report | The accompanying notes are an integral part of these consolidated financial statements. franklintempleton.com
| | | | | | | | | | | | |
| | | FRANKLIN TEMPLETON INTERNATIONAL TRUST | |
| | | | | | FINANCIAL HIGHLIGHTS | |
| |
| |
| |
| Franklin Global Allocation Fund (continued) | | | | | | | | | | | | |
| | | | | | Year Ended May 31, | | | | |
| | | 2015 | | | 2014 | | | 2013 | | | 2012 | a |
| Advisor Class | | | | | | | | | | | | |
| Per share operating performance | | | | | | | | | | | | |
| (for a share outstanding throughout the year) | | | | | | | | | | | | |
| Net asset value, beginning of year | $ | 11.41 | | $ | 10.79 | | $ | 9.53 | | $ | 10.00 | |
| Income from investment operationsb: | | | | | | | | | | | | |
| Net investment incomec | | 0.10 | | | 0.12 | d | | 0.09 | | | 0.06 | |
| Net realized and unrealized gains (losses) | | 0.28 | | | 0.80 | | | 1.38 | | | (0.47 | ) |
| Total from investment operations | | 0.38 | | | 0.92 | | | 1.47 | | | (0.41 | ) |
| Less distributions from: | | | | | | | | | | | | |
| Net investment income and net foreign currency gains | | (0.36 | ) | | (0.30 | ) | | (0.21 | ) | | (0.06 | ) |
| Net realized gains | | (0.45 | ) | | — | | | — | | | — | |
| Total distributions | | (0.81 | ) | | (0.30 | ) | | (0.21 | ) | | (0.06 | ) |
| Net asset value, end of year | $ | 10.98 | | $ | 11.41 | | $ | 10.79 | | $ | 9.53 | |
| |
| Total returne | | 4.08 | % | | 8.62 | % | | 15.47 | % | | (4.09 | )% |
| |
| Ratios to average net assetsf | | | | | | | | | | | | |
| Expenses before waiver and payments by affiliates | | 1.87 | % | | 1.69 | % | | 1.94 | % | | 2.77 | % |
| Expenses net of waiver and payments by affiliates | | 1.00 | %g | | 1.00 | %g | | 1.00 | % | | 1.00 | % |
| Net investment income | | 0.91 | % | | 1.12 | %d | | 0.92 | % | | 0.87 | % |
| |
| Supplemental data | | | | | | | | | | | | |
| Net assets, end of year (000’s) | $ | 10,971 | | $ | 12,441 | | $ | 14,511 | | $ | 12,654 | |
| Portfolio turnover rate | | 49.80 | % | | 39.58 | % | | 47.73 | % | | 15.34 | % |
aFor the period September 1, 2011 (commencement of operations) to May 31, 2012.
bThe amount shown for a share outstanding throughout the period may not correlate with the Consolidated Statement of Operations for the period due to the timing of sales
and repurchases of the Fund’s shares in relation to income earned and/or fluctuating fair value of the investments of the Fund.
cBased on average daily shares outstanding.
dNet investment income per share includes approximately $0.03 per share received in the form of a special dividend paid in connection with certain Fund holdings.
Excluding this amount, the ratio of net investment income to average net assets would have been 0.88%.
eTotal return is not annualized for periods less than one year.
fRatios are annualized for periods less than one year.
gBenefit of expense reduction rounds to less than 0.01%.
franklintempleton.com The accompanying notes are an integral part of these consolidated financial statements. | Annual Report | 17
| | | | |
| FRANKLIN TEMPLETON INTERNATIONAL TRUST | | | | |
| |
| |
| |
| |
| Consolidated Statement of Investments, May 31, 2015 | | | | |
| |
| Franklin Global Allocation Fund | | | | |
| | Country | Shares | | Value |
| Common Stocks 24.4% | | | | |
| Automobiles & Components 1.1% | | | | |
| Brilliance China Automotive Holdings Ltd. | China | 96,000 | $ | 150,063 |
| Cie Generale des Etablissements Michelin, B | France | 230 | | 24,654 |
| General Motors Co. | United States | 849 | | 30,538 |
| Guangzhou Automobile Group Co. Ltd., H | China | 60,000 | | 61,443 |
| Hyundai Mobis Co. Ltd. | South Korea | 87 | | 17,453 |
| Hyundai Motor Co. | South Korea | 68 | | 9,644 |
| Nissan Motor Co. Ltd. | Japan | 3,300 | | 34,581 |
| aTesla Motors Inc. | United States | 40 | | 10,032 |
| Toyota Motor Corp. | Japan | 400 | | 27,731 |
| | | | | 366,139 |
| Banks 2.0% | | | | |
| Bangkok Bank PCL, fgn. | Thailand | 2,300 | | 12,414 |
| Bank of Nova Scotia | Canada | 1,000 | | 52,560 |
| Barclays PLC | United Kingdom | 9,340 | | 38,544 |
| BNP Paribas SA | France | 750 | | 45,260 |
| CIT Group Inc. | United States | 385 | | 17,810 |
| Citigroup Inc. | United States | 454 | | 24,552 |
| Citizens Financial Group Inc. | United States | 731 | | 19,620 |
| Columbia Banking System Inc. | United States | 232 | | 7,009 |
| Hana Financial Group Inc. | South Korea | 1,436 | | 38,281 |
| HSBC Holdings PLC | United Kingdom | 2,450 | | 23,318 |
| ING Groep NV, IDR | Netherlands | 2,330 | | 38,332 |
| JPMorgan Chase & Co. | United States | 487 | | 32,035 |
| KB Financial Group Inc. | South Korea | 1,098 | | 39,668 |
| KBC GROEP NV | Belgium | 700 | | 46,949 |
| PNC Financial Services Group Inc. | United States | 469 | | 44,879 |
| aSignature Bank | United States | 200 | | 27,930 |
| Societe Generale SA | France | 316 | | 14,763 |
| Standard Chartered PLC | United Kingdom | 980 | | 15,668 |
| SunTrust Banks Inc. | United States | 399 | | 17,029 |
| aSVB Financial Group | United States | 150 | | 20,236 |
| UniCredit SpA | Italy | 4,637 | | 32,450 |
| United Overseas Bank Ltd. | Singapore | 3,300 | | 56,642 |
| Wells Fargo & Co. | United States | 283 | | 15,837 |
| | | | | 681,786 |
| Capital Goods 1.8% | | | | |
| B/E Aerospace Inc. | United States | 188 | | 10,780 |
| BAE Systems PLC | United Kingdom | 2,840 | | 22,355 |
| Carillion PLC | United Kingdom | 2,950 | | 14,943 |
| Caterpillar Inc. | United States | 255 | | 21,757 |
| CNH Industrial NV | United Kingdom | 970 | | 8,637 |
| CNH Industrial NV (Qualifying Common Shares) | United Kingdom | 1,929 | | 17,176 |
| Compagnie de Saint-Gobain | France | 380 | | 17,713 |
| Daewoo International Corp. | South Korea | 368 | | 8,803 |
| GEA Group AG | Germany | 1,100 | | 53,420 |
| aHD Supply Holdings Inc. | United States | 1,070 | | 34,721 |
| Honeywell International Inc. | United States | 200 | | 20,840 |
| Huntington Ingalls Industries Inc. | United States | 144 | | 17,855 |
| Hyundai Development Co. | South Korea | 1,570 | | 85,257 |
| ITOCHU Corp. | Japan | 1,700 | | 23,013 |
| Kloeckner & Co. SE | Germany | 780 | | 6,803 |
18 | Annual Report franklintempleton.com
FRANKLIN TEMPLETON INTERNATIONAL TRUST
CONSOLIDATED STATEMENT OF INVESTMENTS
| | | | |
| Franklin Global Allocation Fund (continued) | | | | |
| | Country | Shares | | Value |
| Common Stocks (continued) | | | | |
| Capital Goods (continued) | | | | |
| aKLX Inc. | United States | 94 | $ | 4,121 |
| MTU Aero Engines AG | Germany | 500 | | 47,712 |
| Noble Group Ltd. | Hong Kong | 85,000 | | 50,124 |
| Roper Technologies Inc. | United States | 150 | | 26,244 |
| Siemens AG | Germany | 170 | | 17,888 |
| Sinopec Engineering Group Co. Ltd. | China | 18,000 | | 17,644 |
| Weir Group PLC | United Kingdom | 2,300 | | 71,152 |
| | | | | 598,958 |
| Commercial & Professional Services 0.6% | | | | |
| Experian PLC | United Kingdom | 3,600 | | 68,560 |
| aIHS Inc., A | United States | 280 | | 34,552 |
| Recruit Holdings Co. Ltd. | Japan | 1,700 | | 53,286 |
| aStericycle Inc. | United States | 260 | | 35,698 |
| | | | | 192,096 |
| Consumer Durables & Apparel 0.7% | | | | |
| Burberry Group PLC | United Kingdom | 1,800 | | 46,633 |
| Ekornes ASA | Norway | 1,750 | | 23,652 |
| Grendene SA | Brazil | 1,800 | | 9,810 |
| Luxottica Group SpA | Italy | 1,000 | | 67,344 |
| NIKE Inc., B | United States | 460 | | 46,768 |
| aTRI Pointe Homes Inc. | United States | 1,210 | | 17,448 |
| aUnder Armour Inc., A | United States | 280 | | 21,955 |
| | | | | 233,610 |
| Consumer Services 0.4% | | | | |
| Starbucks Corp. | United States | 220 | | 11,431 |
| aTAL Education Group, ADR | China | 1,700 | | 61,574 |
| Whitbread PLC | United Kingdom | 600 | | 46,954 |
| | | | | 119,959 |
| Diversified Financials 0.9% | | | | |
| Aberdeen Asset Management PLC | United Kingdom | 10,670 | | 72,834 |
| aAffiliated Managers Group Inc. | United States | 200 | | 44,732 |
| aAlly Financial Inc. | United States | 433 | | 9,816 |
| Azimut Holding SpA | Italy | 1,400 | | 39,743 |
| BM&F BOVESPA SA | Brazil | 3,200 | | 11,275 |
| Credit Suisse Group AG | Switzerland | 978 | | 25,921 |
| Deutsche Boerse AG | Germany | 900 | | 72,109 |
| GAM Holding Ltd. | Switzerland | 390 | | 8,693 |
| Intercontinental Exchange Inc. | United States | 100 | | 23,678 |
| Korea Investment Holdings Co. Ltd. | South Korea | 232 | | 13,827 |
| | | | | 322,628 |
| Energy 3.0% | | | | |
| Amec Foster Wheeler PLC | United Kingdom | 4,300 | | 62,437 |
| Anadarko Petroleum Corp. | United States | 120 | | 10,033 |
| Apache Corp. | United States | 360 | | 21,542 |
| Baker Hughes Inc. | United States | 389 | | 25,075 |
| BG Group PLC | United Kingdom | 808 | | 14,042 |
| BP PLC | United Kingdom | 5,164 | | 35,577 |
franklintempleton.com
Annual Report
| 19
FRANKLIN TEMPLETON INTERNATIONAL TRUST
CONSOLIDATED STATEMENT OF INVESTMENTS
| | | | |
| Franklin Global Allocation Fund (continued) | | | | |
| | Country | Shares | | Value |
| Common Stocks (continued) | | | | |
| Energy (continued) | | | | |
| Cenovus Energy Inc. | Canada | 1,000 | $ | 16,491 |
| China Petroleum and Chemical Corp., H | China | 58,000 | | 51,091 |
| CNOOC Ltd. | China | 55,000 | | 85,974 |
| CONSOL Energy Inc. | United States | 318 | | 8,853 |
| Dragon Oil PLC | Turkmenistan | 920 | | 9,604 |
| Eni SpA | Italy | 1,144 | | 20,599 |
| Ensign Energy Services Inc. | Canada | 2,300 | | 21,756 |
| aFMC Technologies Inc. | United States | 230 | | 9,612 |
| Gazprom OAO, ADR | Russia | 12,300 | | 66,014 |
| bInner Mongolia Yitai Coal Co. Ltd., B | China | 61,200 | | 105,754 |
| Kunlun Energy Co. Ltd. | China | 8,000 | | 8,677 |
| bLUKOIL Holdings, ADR (London Stock Exchange) | Russia | 1,950 | | 93,522 |
| Marathon Oil Corp. | United States | 797 | | 21,670 |
| Murphy Oil Corp. | United States | 214 | | 9,300 |
| Noble Corp. PLC | United States | 930 | | 15,578 |
| PetroChina Co. Ltd., H | China | 78,000 | | 92,350 |
| Petrofac Ltd. | United Kingdom | 2,020 | | 27,942 |
| Precision Drilling Corp. | Canada | 1,800 | | 11,920 |
| Royal Dutch Shell PLC, A | United Kingdom | 1,003 | | 29,939 |
| Royal Dutch Shell PLC, B | United Kingdom | 670 | | 20,210 |
| aSaipem SpA | Italy | 683 | | 8,674 |
| aSBM Offshore NV | Netherlands | 2,121 | | 28,264 |
| Subsea 7 SA | United Kingdom | 990 | | 10,386 |
| Suncor Energy Inc. | Canada | 800 | | 23,371 |
| Technip SA | France | 390 | | 25,746 |
| Total SA, B | France | 340 | | 17,173 |
| Trican Well Service Ltd. | Canada | 2,300 | | 7,153 |
| aWhiting Petroleum Corp. | United States | 301 | | 9,930 |
| WorleyParsons Ltd. | Australia | 680 | | 5,660 |
| | | | | 1,031,919 |
| Food & Staples Retailing 0.4% | | | | |
| CVS Health Corp. | United States | 199 | | 20,374 |
| The Kroger Co. | United States | 286 | | 20,821 |
| Metro AG | Germany | 362 | | 12,565 |
| Tesco PLC | United Kingdom | 8,880 | | 28,855 |
| Walgreens Boots Alliance Inc. | United States | 310 | | 26,610 |
| Whole Foods Market Inc. | United States | 320 | | 13,197 |
| | | | | 122,422 |
| Food, Beverage & Tobacco 0.6% | | | | |
| Altria Group Inc. | United States | 439 | | 22,477 |
| British American Tobacco PLC | United Kingdom | 663 | | 36,537 |
| Constellation Brands Inc., A | United States | 280 | | 33,009 |
| Imperial Tobacco Group PLC | United Kingdom | 521 | | 26,836 |
| Lorillard Inc. | United States | 499 | | 36,167 |
| aMonster Beverage Corp. | United States | 160 | | 20,365 |
| PepsiCo Inc. | United States | 260 | | 25,072 |
| Philip Morris International Inc. | United States | 123 | | 10,218 |
| | | | | 210,681 |
20 | Annual Report
franklintempleton.com
FRANKLIN TEMPLETON INTERNATIONAL TRUST
CONSOLIDATED STATEMENT OF INVESTMENTS
| | | | |
| Franklin Global Allocation Fund (continued) | | | | |
| | Country | Shares | | Value |
| Common Stocks (continued) | | | | |
| Health Care Equipment & Services 1.4% | | | | |
| aCerner Corp. | United States | 510 | $ | 34,318 |
| Cigna Corp. | United States | 11 | | 1,549 |
| Cochlear Ltd. | Australia | 700 | | 47,375 |
| aDexCom Inc. | United States | 260 | | 18,647 |
| aEdwards Lifesciences Corp. | United States | 150 | | 19,608 |
| Elekta AB, B | Sweden | 4,600 | | 32,391 |
| aEnvision Healthcare Holdings Inc. | United States | 970 | | 35,841 |
| Getinge AB, B | Sweden | 647 | | 15,637 |
| GN Store Nord AS | Denmark | 3,000 | | 64,851 |
| McKesson Corp. | United States | 240 | | 56,935 |
| Medtronic PLC | United States | 1,036 | | 79,068 |
| Shanghai Pharmaceuticals Holding Co. Ltd., H | China | 6,200 | | 20,710 |
| Sinopharm Group Co. | China | 2,800 | | 13,344 |
| Stryker Corp. | United States | 275 | | 26,436 |
| | | | | 466,710 |
| Household & Personal Products 0.2% | | | | |
| Energizer Holdings Inc. | United States | 85 | | 12,044 |
| Reckitt Benckiser Group PLC | United Kingdom | 600 | | 54,153 |
| | | | | 66,197 |
| Insurance 0.8% | | | | |
| ACE Ltd. | United States | 265 | | 28,217 |
| Aegon NV | Netherlands | 3,693 | | 28,120 |
| aAlleghany Corp. | United States | 46 | | 21,866 |
| The Allstate Corp. | United States | 332 | | 22,350 |
| American International Group Inc. | United States | 695 | | 40,734 |
| Aviva PLC | United Kingdom | 2,490 | | 19,924 |
| AXA SA | France | 550 | | 13,846 |
| China Life Insurance Co. Ltd., H | China | 3,000 | | 14,432 |
| MetLife Inc. | United States | 484 | | 25,294 |
| Muenchener Rueckversicherungs-Gesellschaft AG | Germany | 80 | | 14,765 |
| Swiss Re AG | Switzerland | 130 | | 11,674 |
| XL Group PLC | Ireland | 650 | | 24,492 |
| | | | | 265,714 |
| Materials 1.1% | | | | |
| Akzo Nobel NV | Netherlands | 190 | | 14,476 |
| CRH PLC | Ireland | 350 | | 9,813 |
| Cytec Industries Inc. | United States | 280 | | 16,937 |
| Ecolab Inc. | United States | 330 | | 37,834 |
| Freeport-McMoRan Inc., B | United States | 820 | | 16,113 |
| HudBay Minerals Inc. | Canada | 2,300 | | 20,554 |
| International Paper Co. | United States | 479 | | 24,827 |
| MeadWestvaco Corp. | United States | 464 | | 23,450 |
| aPetra Diamonds Ltd. | South Africa | 6,780 | | 18,031 |
| POSCO | South Korea | 77 | | 16,864 |
| Symrise AG | Germany | 600 | | 38,205 |
| Syngenta AG | Switzerland | 160 | | 72,437 |
| ThyssenKrupp AG | Germany | 477 | | 12,640 |
| Umicore SA | Belgium | 1,400 | | 68,789 |
| | | | | 390,970 |
franklintempleton.com Annual Report | 21
FRANKLIN TEMPLETON INTERNATIONAL TRUST
CONSOLIDATED STATEMENT OF INVESTMENTS
| | | | |
| Franklin Global Allocation Fund (continued) | | | | |
| | Country | Shares | | Value |
| Common Stocks (continued) | | | | |
| Media 0.8% | | | | |
| CBS Corp., B | United States | 447 | $ | 27,589 |
| aCharter Communications Inc., A | United States | 130 | | 23,272 |
| ITV PLC | United Kingdom | 11,000 | | 45,782 |
| Reed Elsevier PLC | United Kingdom | 1,735 | | 28,773 |
| Time Warner Cable Inc. | United States | 239 | | 43,233 |
| Time Warner Inc. | United States | 194 | | 16,389 |
| Twenty-First Century Fox Inc., B | United States | 1,170 | | 39,125 |
| The Walt Disney Co. | United States | 460 | | 50,770 |
| | | | | 274,933 |
| Pharmaceuticals, Biotechnology & Life Sciences 2.8% | | | | |
| aActavis PLC | United States | 320 | | 98,179 |
| aAlkermes PLC | United States | 1,000 | | 61,100 |
| Bayer AG | Germany | 170 | | 24,120 |
| aBiogen Inc. | United States | 170 | | 67,488 |
| aBioMarin Pharmaceutical Inc. | United States | 70 | | 8,790 |
| Bristol-Myers Squibb Co. | United States | 390 | | 25,194 |
| aCelgene Corp. | United States | 600 | | 68,664 |
| CSL Ltd. | Australia | 600 | | 42,877 |
| Eli Lilly & Co. | United States | 569 | | 44,894 |
| Gerresheimer AG | Germany | 210 | | 11,983 |
| GlaxoSmithKline PLC | United Kingdom | 790 | | 17,551 |
| aHospira Inc. | United States | 354 | | 31,301 |
| aIllumina Inc. | United States | 170 | | 35,034 |
| aJazz Pharmaceuticals PLC | United States | 50 | | 8,968 |
| Lonza Group AG | Switzerland | 110 | | 15,449 |
| Merck & Co. Inc. | United States | 1,019 | | 62,047 |
| aMorphoSys AG | Germany | 170 | | 12,483 |
| aPrestige Brands Holdings Inc. | United States | 420 | | 18,446 |
| aQIAGEN NV | Netherlands | 790 | | 19,337 |
| aRegeneron Pharmaceuticals Inc. | United States | 30 | | 15,377 |
| Roche Holding AG | Switzerland | 370 | | 108,734 |
| Sanofi | France | 210 | | 20,567 |
| Teva Pharmaceutical Industries Ltd., ADR | Israel | 1,127 | | 67,733 |
| UCB SA | Belgium | 140 | | 10,013 |
| aValeant Pharmaceuticals International Inc. | United States | 230 | | 54,917 |
| | | | | 951,246 |
| Retailing 0.8% | | | | |
| Advance Auto Parts Inc. | United States | 150 | | 22,983 |
| aAmazon.com Inc. | United States | 90 | | 38,631 |
| Dollarama Inc. | Canada | 900 | | 49,821 |
| Kingfisher PLC | United Kingdom | 4,770 | | 26,975 |
| Marks & Spencer Group PLC | United Kingdom | 2,300 | | 20,495 |
| aThe Priceline Group Inc. | United States | 30 | | 35,161 |
| Springland International Holdings Ltd. | China | 21,600 | | 7,856 |
| Start Today Co. Ltd. | Japan | 1,800 | | 48,588 |
| Tractor Supply Co. | United States | 200 | | 17,428 |
| | | | | 267,938 |
22 | Annual Report
franklintempleton.com
FRANKLIN TEMPLETON INTERNATIONAL TRUST
CONSOLIDATED STATEMENT OF INVESTMENTS
| | | | |
| Franklin Global Allocation Fund (continued) | | | | |
| | Country | Shares | | Value |
| Common Stocks (continued) | | | | |
| Semiconductors & Semiconductor Equipment 0.7% | | | | |
| ARM Holdings PLC | United Kingdom | 3,400 | $ | 60,022 |
| aCavium Inc. | United States | 460 | | 32,370 |
| aGCL-Poly Energy Holdings Ltd. | China | 103,000 | | 27,498 |
| aNXP Semiconductors NV | Netherlands | 460 | | 51,635 |
| Skyworks Solutions Inc. | United States | 260 | | 28,434 |
| aTrina Solar Ltd., ADR | China | 2,310 | | 28,575 |
| | | | | 228,534 |
| Software & Services 2.1% | | | | |
| CA Inc. | United States | 679 | | 20,675 |
| Capcom Co. Ltd. | Japan | 1,100 | | 21,334 |
| aCheck Point Software Technologies Ltd. | Israel | 600 | | 50,832 |
| aCoStar Group Inc. | United States | 100 | | 20,891 |
| Dassault Systemes SA | France | 800 | | 62,550 |
| aElectronic Arts Inc. | United States | 520 | | 32,633 |
| aFacebook Inc., A | United States | 480 | | 38,011 |
| aFleetCor Technologies Inc. | United States | 190 | | 28,907 |
| aLinkedIn Corp., A | United States | 190 | | 37,037 |
| MasterCard Inc., A | United States | 720 | | 66,427 |
| MercadoLibre Inc. | Argentina | 300 | | 43,539 |
| Microsoft Corp. | United States | 1,303 | | 61,059 |
| aMobileye NV | United States | 190 | | 8,945 |
| The Sage Group PLC | United Kingdom | 6,000 | | 52,135 |
| aSalesforce.com Inc. | United States | 520 | | 37,830 |
| aServiceNow Inc. | United States | 260 | | 19,919 |
| Symantec Corp. | United States | 1,384 | | 34,081 |
| Visa Inc., A | United States | 790 | | 54,257 |
| Xerox Corp. | United States | 2,157 | | 24,633 |
| | | | | 715,695 |
| Technology Hardware & Equipment 1.4% | | | | |
| Apple Inc. | United States | 1,450 | | 188,906 |
| CANON Inc. | Japan | 300 | | 10,375 |
| Cisco Systems Inc. | United States | 1,117 | | 32,739 |
| Digital China Holdings Ltd. | China | 8,000 | | 14,445 |
| Hewlett-Packard Co. | United States | 615 | | 20,541 |
| Kingboard Chemical Holdings Ltd. | Hong Kong | 9,200 | | 17,988 |
| Nokia Corp., ADR | Finland | 2,251 | | 16,410 |
| Nokia OYJ, A | Finland | 2,217 | | 16,185 |
| aPalo Alto Networks Inc. | United States | 280 | | 47,457 |
| Samsung Electronics Co. Ltd. | South Korea | 58 | | 68,042 |
| YASKAWA Electric Corp. | Japan | 3,000 | | 42,303 |
| aZebra Technologies Corp., A | United States | 130 | | 14,253 |
| | | | | 489,644 |
| Telecommunication Services 0.4% | | | | |
| China Mobile Ltd. | China | 1,000 | | 13,207 |
| China Telecom Corp. Ltd., H | China | 42,000 | | 28,547 |
| Koninklijke KPN NV | Netherlands | 4,210 | | 15,281 |
franklintempleton.com
Annual Report
| 23
FRANKLIN TEMPLETON INTERNATIONAL TRUST
CONSOLIDATED STATEMENT OF INVESTMENTS
| | | | | |
| Franklin Global Allocation Fund (continued) | | | | | |
| | Country | Shares | | | Value |
| Common Stocks (continued) | | | | | |
| Telecommunication Services (continued) | | | | | |
| SoftBank Corp. | Japan | 200 | | $ | 12,001 |
| Telefonica SA | Spain | 1,440 | | | 20,376 |
| Telenor ASA | Norway | 860 | | | 19,505 |
| Vodafone Group PLC | United Kingdom | 9,287 | | | 36,246 |
| | | | | | 145,163 |
| Transportation 0.4% | | | | | |
| A.P. Moeller-Maersk AS, B | Denmark | 29 | | | 55,942 |
| Deutsche Lufthansa AG | Germany | 670 | | | 9,422 |
| DSV AS | Denmark | 1,900 | | | 66,084 |
| aSpirit Airlines Inc. | United States | 330 | | | 20,978 |
| | | | | | 152,426 |
| Utilities 0.0%† | | | | | |
| NRG Energy Inc. | United States | 595 | | | 14,994 |
| Total Common Stocks (Cost $6,041,365) | | | | | 8,310,362 |
| Preferred Stocks (Cost $14,338) 0.0%† | | | | | |
| Automobiles & Components 0.0%† | | | | | |
| Volkswagen AG, pfd. | Germany | 59 | | | 14,325 |
| |
| | | Principal | | | |
| | | Amount* | | | |
| |
| Corporate Bonds 3.2% | | | | | |
| Automobiles & Components 0.6% | | | | | |
| cBMW Finance NV, senior note, FRN, 0.258%, 9/05/16 | Germany | 130,000 | EUR | | 143,005 |
| BMW US Capital LLC, senior note, 1.25%, 7/20/16 | Germany | 65,000 | EUR | | 72,300 |
| | | | | | 215,305 |
| Banks 1.1% | | | | | |
| dAbbey National Treasury Services PLC, senior note, Reg S, 2.00%, 1/14/19 | United Kingdom | 100,000 | EUR | | 115,116 |
| dToyota Motor Credit Corp., senior note, Reg S, 1.25%, 8/01/17 | Japan | 125,000 | EUR | | 140,529 |
| c,dVolkswagen Bank GmbH, senior note, Reg S, FRN, 0.391%, 5/09/16 | Germany | 100,000 | EUR | | 110,151 |
| | | | | | 365,796 |
| Diversified Financials 0.5% | | | | | |
| dGE Capital European Funding, senior note, Reg S, 2.875%, 6/18/19 | United States | 125,000 | EUR | | 150,225 |
| Food, Beverage & Tobacco 0.4% | | | | | |
| dAnheuser-Busch InBev NV, senior note, Reg S, 1.25%, 3/24/17 | Belgium | 130,000 | EUR | | 145,482 |
| Technology Hardware & Equipment 0.2% | | | | | |
| eAvaya Inc., | | | | | |
| senior note, 144A, 10.50%, 3/01/21 | United States | 42,000 | | | 36,120 |
| senior secured note, 144A, 7.00%, 4/01/19 | United States | 17,000 | | | 17,085 |
| | | | | | 53,205 |
| Utilities 0.4% | | | | | |
| dSnam SpA, senior note, Reg S, 2.375%, 6/30/17 | Italy | 125,000 | EUR | | 142,874 |
| Total Corporate Bonds (Cost $1,282,184) | | | | | 1,072,887 |
24 | Annual Report
franklintempleton.com
FRANKLIN TEMPLETON INTERNATIONAL TRUST
CONSOLIDATED STATEMENT OF INVESTMENTS
| | | | | |
| Franklin Global Allocation Fund (continued) | | | | | |
| | Country | Shares | | | Value |
| c,fSenior Floating Rate Interests 0.1% | | | | | |
| Technology Hardware & Equipment 0.1% | | | | | |
| Avaya Inc., | | | | | |
| Term B-3 Loan, 4.685%, 10/26/17 | United States | 13,569 | | $ | 13,539 |
| Term B-6 Loan, 6.50%, 3/31/18 | United States | 3,229 | | | 3,233 |
| Total Senior Floating Rate Interests (Cost $15,757) | | | | | 16,772 |
| |
| | | Units | | | |
| |
| gExchange Traded Notes (Cost $954,712) 2.4% | | | | | |
| Energy 2.4% | | | | | |
| a,h,iiPath Bloomberg Commodity Index Total Return ETN, 6/12/36 | United States | 28,900 | | | 825,673 |
| |
| | | Principal | | | |
| | | Amount* | | | |
| |
| Foreign Government and Agency Securities 3.9% | | | | | |
| eCaisse D’Amortissement De La Dette Sociale, senior note, 144A, 1.375%, | | | | | |
| 1/29/18 | France | 152,000 | | | 153,310 |
| Deutsche Bahn Finance BV, senior note, 4.00%, 1/16/17 | Germany | 100,000 | EUR | | 116,808 |
| Government of Malaysia, | | | | | |
| 3.835%, 8/12/15 | Malaysia | 640,000 | MYR | | 174,870 |
| 4.72%, 9/30/15 | Malaysia | 527,000 | MYR | | 144,549 |
| 3.197%, 10/15/15 | Malaysia | 330,000 | MYR | | 90,077 |
| senior note, 3.172%, 7/15/16 | Malaysia | 10,000 | MYR | | 2,729 |
| Government of Mexico, | | | | | |
| 6.00%, 6/18/15 | Mexico | 31,920j MXN | | 207,639 |
| 8.00%, 12/17/15 | Mexico | 13,170j MXN | | 87,769 |
| 6.25%, 6/16/16 | Mexico | 21,490j MXN | | 143,552 |
| 7.25%, 12/15/16 | Mexico | 22,700j MXN | | 154,953 |
| Letra Tesouro Nacional, Strip, | | | | | |
| 10/01/15 | Brazil | 40k BRL | | 12,009 |
| 1/01/16 | Brazil | 110k BRL | | 31,964 |
| 7/01/16 | Brazil | 10k BRL | | 2,729 |
| 10/01/16 | Brazil | 40k BRL | | 10,582 |
| Total Foreign Government and Agency Securities | | | | | |
| (Cost $1,446,889) | | | | | 1,333,540 |
| U.S. Government and Agency Securities 3.0% | | | | | |
| FHLB, 0.375%, 6/24/16 | United States | 190,000 | | | 190,014 |
| U.S. Treasury Note, | | | | | |
| 0.50%, 9/30/16 | United States | 180,000 | | | 180,197 |
| 0.625%, 9/30/17 | United States | 180,000 | | | 179,564 |
| 1.375%, 9/30/18 | United States | 180,000 | | | 181,772 |
| 1.375%, 3/31/20 | United States | 300,000 | | | 298,852 |
| Total U.S. Government and Agency Securities | | | | | |
| (Cost $1,031,556) | | | | | 1,030,399 |
| Total Investments before Short Term Investments | | | | | |
| (Cost $10,786,801) | | | | | 12,603,958 |
franklintempleton.com
Annual Report
| 25
FRANKLIN TEMPLETON INTERNATIONAL TRUST
CONSOLIDATED STATEMENT OF INVESTMENTS
| | | | | | |
| Franklin Global Allocation Fund (continued) | | | | | | |
| | | Principal | | | | |
| | Country | Amount* | | | Value | |
| Short Term Investments 64.0% | | | | | | |
| Foreign Government and Agency Securities 1.8% | | | | | | |
| lBank of Negara Monetary Notes, 6/03/15 - 11/24/15 | Malaysia | 880,000 | MYR | $ | 238,481 | |
| lMalaysia Treasury Bills, 6/05/15 - 3/18/16 | Malaysia | 140,000 | MYR | | 37,847 | |
| lMexico Treasury Bills, 6/11/15 - 4/14/16 | Mexico | 491,390m MXN | | 312,950 | |
| Total Foreign Government and Agency Securities | | | | | | |
| (Cost $627,393) | | | | | 589,278 | |
| Total Investments before Money Market Funds | | | | | | |
| (Cost $11,414,194) | | | | | 13,193,236 | |
| |
| | | Shares | | | | |
| Money Market Funds (Cost $21,176,248) 62.2% | | | | | | |
| a,nInstitutional Fiduciary Trust Money Market Portfolio | United States | 21,176,248 | | | 21,176,248 | |
| Total Investments (Cost $32,590,442) 101.0% | | | | | 34,369,484 | |
| Other Assets, less Liabilities (1.0)% | | | | | (331,241 | ) |
| Net Assets 100.0% | | | | $ | 34,038,243 | |
†Rounds to less than 0.1% of net assets.
*The principal amount is stated in U.S. dollars unless otherwise indicated.
aNon-income producing.
bAt May 31, 2015, pursuant to the Fund’s policies and the requirements of applicable securities law, the Fund may be restricted from trading this security for a limited or
extended period of time.
cThe coupon rate shown represents the rate at period end.
dSecurity was purchased pursuant to Regulation S under the Securities Act of 1933, which exempts from registration securities offered and sold outside of the United States.
Such a security cannot be sold in the United States without either an effective registration statement filed pursuant to the Securities Act of 1933, or pursuant to an exemption
from registration. These securities have been deemed liquid under guidelines approved by the Trust’s Board of Trustees. At May 31, 2015, the aggregate value of these
securities was $804,377, representing 2.36% of net assets.
eSecurity was purchased pursuant to Rule 144A under the Securities Act of 1933 and may be sold in transactions exempt from registration only to qualified institutional buy-
ers or in a public offering registered under the Securities Act of 1933. These securities have been deemed liquid under guidelines approved by the Trust’s Board of Trustees.
At May 31, 2015, the aggregate value of these securities was $206,515, representing 0.61% of net assets.
fSee Note 1(g) regarding senior floating rate interests.
gSee Note 1(e) regarding exchange traded notes.
hThe security is owned by GAF Holdings Corp., a wholly-owned subsidiary of the Fund. See Note 1(f).
iSecurity does not guarantee any return of principal at maturity, upon redemption or otherwise. Cash payment at maturity or upon early redemption is based on the
performance of the indicated index less an investor fee.
jPrincipal amount is stated in 100 Mexican Peso Units.
kPrincipal amount is stated in 1,000 Brazilian Real Units.
lThe security is traded on a discount basis with no stated coupon rate.
mPrincipal amount is stated in 10 Mexican Peso Units.
nSee Note 3(f) regarding investments in Institutional Fiduciary Trust Money Market Portfolio.
26 | Annual Report
franklintempleton.com
FRANKLIN TEMPLETON INTERNATIONAL TRUST
CONSOLIDATED STATEMENT OF INVESTMENTS
Franklin Global Allocation Fund (continued)
At May 31, 2015, the Fund had the following forward exchange contracts outstanding. See Note 1(c)
| | | | | | | | | | | |
| Forward Exchange Contracts | | | | | | | | | | |
| | | | | Contract | | Settlement | | Unrealized | | Unrealized | |
| Currency | Counterpartya | Type | Quantity | Amount* | | Date | | Appreciation | | Depreciation | |
| OTC Forward Exchange | | | | | | | | | | | |
| Contracts | | | | | | | | | | | |
| Indian Rupee | JPHQ | Buy | 3,794,000 | 59,603 | | 6/02/15 | $ | — | $ | (126 | ) |
| Indian Rupee | JPHQ | Sell | 3,794,000 | 59,598 | | 6/02/15 | | 121 | | — | |
| Euro | BZWS | Buy | 13,300 | 15,114 | | 6/05/15 | | — | | (502 | ) |
| Euro | BZWS | Sell | 13,300 | 18,114 | | 6/05/15 | | 3,501 | | — | |
| Euro | HSBC | Buy | 44,523 | 52,510 | | 6/08/15 | | — | | (3,591 | ) |
| Euro | HSBC | Sell | 44,523 | 57,984 | | 6/08/15 | | 9,065 | | — | |
| Indian Rupee | JPHQ | Buy | 3,794,000 | 59,652 | | 6/08/15 | | — | | (239 | ) |
| Indian Rupee | JPHQ | Sell | 3,794,000 | 59,532 | | 6/08/15 | | 119 | | — | |
| Japanese Yen | CITI | Buy | 3,100,000 | 26,018 | | 6/09/15 | | — | | (1,035 | ) |
| Japanese Yen | CITI | Sell | 3,100,000 | 30,353 | | 6/09/15 | | 5,370 | | — | |
| Japanese Yen | HSBC | Buy | 4,600,000 | 38,612 | | 6/09/15 | | — | | (1,540 | ) |
| Japanese Yen | HSBC | Sell | 4,600,000 | 45,035 | | 6/09/15 | | 7,964 | | — | |
| Japanese Yen | BZWS | Buy | 4,130,000 | 34,661 | | 6/10/15 | | — | | (1,377 | ) |
| Japanese Yen | BZWS | Sell | 4,130,000 | 40,448 | | 6/10/15 | | 7,164 | | — | |
| Japanese Yen | CITI | Buy | 6,080,000 | 51,029 | | 6/10/15 | | — | | (2,030 | ) |
| Japanese Yen | CITI | Sell | 6,080,000 | 59,455 | | 6/10/15 | | 10,456 | | — | |
| Japanese Yen | HSBC | Buy | 4,400,000 | 36,933 | | 6/10/15 | | — | | (1,473 | ) |
| Japanese Yen | HSBC | Sell | 4,400,000 | 43,108 | | 6/10/15 | | 7,648 | | — | |
| Japanese Yen | DBAB | Buy | 1,500,000 | 12,590 | | 6/11/15 | | — | | (501 | ) |
| Japanese Yen | DBAB | Sell | 1,500,000 | 14,686 | | 6/11/15 | | 2,597 | | — | |
| Japanese Yen | JPHQ | Buy | 4,080,000 | 34,245 | | 6/11/15 | | — | | (1,363 | ) |
| Japanese Yen | JPHQ | Sell | 4,080,000 | 39,937 | | 6/11/15 | | 7,055 | | — | |
| Indian Rupee | JPHQ | Buy | 3,794,000 | 60,360 | | 6/15/15 | | — | | (1,020 | ) |
| Indian Rupee | JPHQ | Sell | 3,794,000 | 59,448 | | 6/15/15 | | 108 | | — | |
| Australian Dollar | DBAB | Buy | 1,250,000 | 955,500 | | 6/17/15 | | — | | (1,090 | ) |
| Australian Dollar | DBAB | Sell | 1,250,000 | 957,938 | | 6/17/15 | | 3,527 | | — | |
| British Pound | DBAB | Buy | 1,240,000 | 1,833,292 | | 6/17/15 | | 61,726 | | — | |
| British Pound | DBAB | Sell | 1,240,000 | 1,835,662 | | 6/17/15 | | — | | (59,356 | ) |
| Canadian Dollar | DBAB | Sell | 2,300,000 | 1,829,846 | | 6/17/15 | | — | | (18,006 | ) |
| Euro | DBAB | Sell | 1,600,000 | 1,697,120 | | 6/17/15 | | — | | (61,070 | ) |
| Japanese Yen | DBAB | Sell | 153,200,000 | 1,264,235 | | 6/17/15 | | 29,464 | | — | |
| Japanese Yen | JPHQ | Buy | 1,700,000 | 14,269 | | 6/17/15 | | — | | (568 | ) |
| Japanese Yen | JPHQ | Sell | 1,700,000 | 16,712 | | 6/17/15 | | 3,011 | | — | |
| Norwegian Krone | DBAB | Buy | 9,500,000 | 1,176,357 | | 6/17/15 | | 45,811 | | — | |
| Swiss Franc | DBAB | Buy | 2,240,000 | 2,299,323 | | 6/17/15 | | 85,642 | | — | |
| Swiss Franc | DBAB | Sell | 2,240,000 | 2,235,975 | | 6/17/15 | | — | | (148,989 | ) |
| Euro | BZWS | Buy | 1,929 | 2,193 | | 6/22/15 | | — | | (73 | ) |
| Euro | BZWS | Sell | 1,929 | 2,624 | | 6/22/15 | | 504 | | — | |
| Euro | RBS | Buy | 1,009,000 | 1,133,773 | | 6/25/15 | | — | | (24,900 | ) |
| Euro | RBS | Sell | 1,009,000 | 1,086,441 | | 6/25/15 | | — | | (22,432 | ) |
| Malaysian Ringgit | HSBC | Buy | 162,863 | 41,377 | EUR | 7/14/15 | | — | | (1,214 | ) |
| Malaysian Ringgit | HSBC | Sell | 162,863 | 39,723 | EUR | 7/14/15 | | — | | (604 | ) |
| Malaysian Ringgit | JPHQ | Buy | 30,630 | 7,134 | EUR | 7/14/15 | | 484 | | — | |
| Malaysian Ringgit | JPHQ | Sell | 30,630 | 7,469 | EUR | 7/14/15 | | — | | (115 | ) |
| Euro | BOFA | Sell | 7,560 | 8,585 | | 7/20/15 | | 323 | | (50 | ) |
| Euro | BZWS | Sell | 165 | 187 | | 7/20/15 | | 6 | | — | |
| | | |
| franklintempleton.com | Annual Report | | | 27 |
FRANKLIN TEMPLETON INTERNATIONAL TRUST
CONSOLIDATED STATEMENT OF INVESTMENTS
| | | | | | | | | | |
| Franklin Global Allocation Fund (continued) | | | | | | | | |
| |
| |
| Forward Exchange Contracts (continued) | | | | | | | | | |
| | | | | Contract | Settlement | | Unrealized | | Unrealized | |
| Currency | Counterpartya | Type | Quantity | Amount* | Date | | Appreciation | | Depreciation | |
| OTC Forward Exchange | | | | | | | | | | |
| Contracts (continued) | | | | | | | | | | |
| Euro | DBAB | Sell | 31,556 | 36,281 | 7/20/15 | $ | 1,713 | $ | (125 | ) |
| Euro | FBCO | Sell | 9,090 | 10,281 | 7/20/15 | | 377 | | (90 | ) |
| Euro | HSBC | Sell | 10,368 | 11,864 | 7/20/15 | | 532 | | (67 | ) |
| Euro | SSBT | Sell | 32,666 | 37,734 | 7/20/15 | | 1,897 | | (76 | ) |
| Japanese Yen | DBAB | Buy | 3,820,000 | 32,081 | 7/21/15 | | — | | (1,279 | ) |
| Japanese Yen | DBAB | Sell | 3,820,000 | 32,850 | 7/21/15 | | 2,048 | | — | |
| Euro | DBAB | Buy | 12,000 | 13,643 | 7/27/15 | | — | | (449 | ) |
| Euro | DBAB | Sell | 12,000 | 16,183 | 7/27/15 | | 2,989 | | — | |
| Euro | GSFX | Buy | 12,000 | 13,655 | 7/27/15 | | — | | (461 | ) |
| Euro | GSFX | Sell | 12,000 | 16,190 | 7/27/15 | | 2,996 | | — | |
| Euro | JPHQ | Buy | 16,000 | 18,192 | 7/31/15 | | — | �� | (598 | ) |
| Euro | JPHQ | Sell | 16,000 | 21,511 | 7/31/15 | | 3,918 | | — | |
| Euro | HSBC | Buy | 16,000 | 18,199 | 8/04/15 | | — | | (605 | ) |
| Euro | HSBC | Sell | 16,000 | 21,472 | 8/04/15 | | 3,878 | | — | |
| Euro | UBSW | Sell | 17,000 | 22,814 | 8/04/15 | | 4,120 | | — | |
| Euro | BZWS | Buy | 8,000 | 9,097 | 8/05/15 | | — | | (300 | ) |
| Euro | BZWS | Sell | 8,000 | 10,754 | 8/05/15 | | 1,957 | | — | |
| South Korean Won | BOFA | Buy | 16,786,101 | 15,355 | 8/12/15 | | — | | (322 | ) |
| South Korean Won | BOFA | Sell | 18,886,175 | 16,995 | 8/12/15 | | 93 | | (12 | ) |
| South Korean Won | FBCO | Buy | 1,877,046 | 1,712 | 8/12/15 | | — | | (31 | ) |
| South Korean Won | FBCO | Sell | 20,306,704 | 18,272 | 8/12/15 | | 86 | | — | |
| South Korean Won | HSBC | Buy | 31,358,827 | 28,706 | 8/12/15 | | — | | (622 | ) |
| South Korean Won | HSBC | Sell | 26,513,095 | 23,817 | 8/12/15 | | 94 | | (22 | ) |
| Japanese Yen | CITI | Buy | 2,840,000 | 23,858 | 8/17/15 | | — | | (950 | ) |
| Japanese Yen | CITI | Sell | 2,840,000 | 23,830 | 8/17/15 | | 923 | | — | |
| British Pound | BOFA | Buy | 5,085 | 7,658 | 8/19/15 | | 120 | | (11 | ) |
| British Pound | BOFA | Sell | 84,952 | 129,787 | 8/19/15 | | 226 | | (205 | ) |
| British Pound | DBAB | Buy | 9,936 | 15,058 | 8/19/15 | | 119 | | — | |
| British Pound | DBAB | Sell | 2,550 | 3,779 | 8/19/15 | | — | | (116 | ) |
| British Pound | FBCO | Buy | 5,937 | 8,891 | 8/19/15 | | 186 | | (8 | ) |
| British Pound | FBCO | Sell | 57,121 | 87,401 | 8/19/15 | | 148 | | — | |
| British Pound | HSBC | Sell | 56,873 | 87,016 | 8/19/15 | | 141 | | — | |
| British Pound | SSBT | Buy | 94,075 | 148,057 | 8/19/15 | | 11 | | (4,366 | ) |
| British Pound | SSBT | Sell | 2,786 | 4,148 | 8/19/15 | | 14 | | (122 | ) |
| Philippine Peso | JPHQ | Buy | 10,959,000 | 249,266 | 8/28/15 | | — | | (4,281 | ) |
| Philippine Peso | JPHQ | Sell | 10,959,000 | 245,332 | 8/28/15 | | 347 | | — | |
| Japanese Yen | CITI | Buy | 34,544,250 | 290,243 | 8/31/15 | | — | | (11,553 | ) |
| Japanese Yen | CITI | Sell | 34,544,250 | 333,864 | 8/31/15 | | 55,175 | | — | |
| Japanese Yen | JPHQ | Buy | 33,831,600 | 284,275 | 8/31/15 | | — | | (11,335 | ) |
| Japanese Yen | JPHQ | Sell | 33,831,600 | 327,073 | 8/31/15 | | 54,133 | | — | |
| Euro | DBAB | Buy | 620,000 | 705,250 | 9/02/15 | | — | | (23,160 | ) |
| Euro | DBAB | Sell | 620,000 | 819,318 | 9/02/15 | | 137,228 | | — | |
| Chilean Peso | DBAB | Buy | 114,700,000 | 189,399 | 9/08/15 | | — | | (5,672 | ) |
| Chilean Peso | DBAB | Sell | 114,700,000 | 189,618 | 9/08/15 | | 5,891 | | — | |
| Euro | JPHQ | Buy | 45,000 | 51,192 | 9/08/15 | | — | | (1,680 | ) |
| Euro | JPHQ | Sell | 45,000 | 58,550 | 9/08/15 | | 9,038 | | — | |
| Malaysian Ringgit | DBAB | Buy | 38,299 | 11,673 | 9/18/15 | | — | | (1,317 | ) |
| Malaysian Ringgit | DBAB | Sell | 38,299 | 10,546 | 9/18/15 | | 189 | | — | |
28 | Annual Report franklintempleton.com
FRANKLIN TEMPLETON INTERNATIONAL TRUST
CONSOLIDATED STATEMENT OF INVESTMENTS
| | | | | | | | | | | |
| Franklin Global Allocation Fund (continued) | | | | | | | | | |
| |
| |
| Forward Exchange Contracts (continued) | | | | | | | | | | |
| | | | | Contract | | Settlement | | Unrealized | | Unrealized | |
| Currency | Counterpartya | Type | Quantity | Amount* | | Date | | Appreciation | | Depreciation | |
| OTC Forward Exchange | | | | | | | | | | | |
| Contracts (continued) | | | | | | | | | | | |
| Hungarian Forint | JPHQ | Buy | 4,038,000 | 12,834 | EUR | 9/23/15 | $ | 190 | $ | — | |
| Hungarian Forint | JPHQ | Sell | 4,038,000 | 13,121 | EUR | 9/23/15 | | 125 | | — | |
| Hungarian Forint | JPHQ | Buy | 3,232,000 | 10,261 | EUR | 9/25/15 | | 164 | | — | |
| Hungarian Forint | JPHQ | Sell | 3,232,000 | 10,501 | EUR | 9/25/15 | | 100 | | — | |
| Euro | CITI | Buy | 9,009 | 10,263 | | 9/28/15 | | — | | (347 | ) |
| Euro | CITI | Sell | 9,009 | 11,619 | | 9/28/15 | | 1,703 | | — | |
| Euro | DBAB | Buy | 32,000 | 36,413 | | 9/28/15 | | — | | (1,192 | ) |
| Euro | DBAB | Sell | 32,000 | 41,211 | | 9/28/15 | | 5,990 | | — | |
| Japanese Yen | JPHQ | Sell | 14,600,000 | 134,780 | | 10/07/15 | | 16,914 | | — | |
| Euro | DBAB | Buy | 2,665 | 3,033 | | 10/08/15 | | — | | (99 | ) |
| Euro | DBAB | Sell | 2,665 | 2,902 | | 10/08/15 | | — | | (32 | ) |
| Japanese Yen | HSBC | Sell | 7,200,000 | 66,823 | | 10/09/15 | | 8,696 | | — | |
| Japanese Yen | BZWS | Sell | 3,700,000 | 34,363 | | 10/13/15 | | 4,489 | | — | |
| Japanese Yen | DBAB | Sell | 3,600,000 | 33,454 | | 10/13/15 | | 4,388 | | — | |
| Euro | BZWS | Buy | 92,000 | 104,765 | | 10/14/15 | | — | | (3,477 | ) |
| Euro | BZWS | Sell | 92,000 | 117,516 | | 10/14/15 | | 16,229 | | — | |
| Euro | JPHQ | Buy | 173,000 | 196,919 | | 10/14/15 | | — | | (6,454 | ) |
| Euro | JPHQ | Sell | 173,000 | 221,047 | | 10/14/15 | | 30,583 | | — | |
| Mexican Peso | DBAB | Buy | 1,296,000 | 94,765 | | 10/14/15 | | — | | (11,419 | ) |
| Mexican Peso | DBAB | Sell | 1,296,000 | 84,674 | | 10/14/15 | | 1,329 | | — | |
| Malaysian Ringgit | DBAB | Buy | 38,299 | 9,681 | EUR | 10/15/15 | | — | | (323 | ) |
| Malaysian Ringgit | DBAB | Sell | 38,299 | 9,264 | EUR | 10/15/15 | | — | | (135 | ) |
| Euro | BZWS | Buy | 64,000 | 72,914 | | 10/16/15 | | — | | (2,451 | ) |
| Euro | BZWS | Sell | 64,000 | 81,632 | | 10/16/15 | | 11,169 | | — | |
| Japanese Yen | JPHQ | Sell | 3,465,000 | 32,782 | | 10/19/15 | | 4,804 | | — | |
| Japanese Yen | JPHQ | Sell | 6,550,000 | 61,953 | | 10/20/15 | | 9,063 | | — | |
| Euro | BZWS | Buy | 174,000 | 198,274 | | 10/22/15 | | — | | (6,682 | ) |
| Euro | BZWS | Sell | 174,000 | 222,931 | | 10/22/15 | | 31,339 | | — | |
| Japanese Yen | BZWS | Sell | 840,000 | 7,894 | | 10/22/15 | | 1,111 | | — | |
| Euro | GSFX | Buy | 4,537 | 5,171 | | 11/09/15 | | — | | (174 | ) |
| Euro | GSFX | Sell | 4,537 | 5,108 | | 11/09/15 | | 111 | | — | |
| Euro | JPHQ | Sell | 17,084 | 21,407 | | 11/12/15 | | 2,589 | | — | |
| Japanese Yen | JPHQ | Sell | 1,300,000 | 11,422 | | 11/12/15 | | 921 | | — | |
| Euro | BZWS | Sell | 52,000 | 64,906 | | 11/13/15 | | 7,626 | | — | |
| Euro | CITI | Sell | 9,840 | 11,019 | | 11/13/15 | | 180 | | — | |
| Euro | DBAB | Sell | 346,573 | 433,930 | | 11/16/15 | | 52,149 | | — | |
| Japanese Yen | DBAB | Sell | 1,634,000 | 14,246 | | 11/16/15 | | 1,046 | | — | |
| Brazilian Real | HSBC | Buy | 110,000 | 38,540 | | 11/20/15 | | — | | (6,020 | ) |
| Brazilian Real | HSBC | Sell | 110,000 | 34,402 | | 11/20/15 | | 1,882 | | — | |
| Euro | DBAB | Sell | 17,273 | 20,718 | | 1/07/16 | | 1,668 | | — | |
| Euro | JPHQ | Sell | 40,000 | 47,308 | | 1/15/16 | | 3,187 | | — | |
| Euro | BZWS | Sell | 40,000 | 47,339 | | 1/19/16 | | 3,214 | | — | |
| Euro | JPHQ | Sell | 39,000 | 46,084 | | 1/19/16 | | 3,063 | | — | |
| Japanese Yen | JPHQ | Sell | 3,465,000 | 29,822 | | 1/20/16 | | 1,781 | | — | |
| Euro | JPHQ | Sell | 40,000 | 46,825 | | 1/25/16 | | 2,694 | | — | |
| Euro | DBAB | Sell | 19,000 | 21,678 | | 1/29/16 | | 714 | | — | |
| Japanese Yen | JPHQ | Sell | 3,300,000 | 28,289 | | 2/08/16 | | 1,569 | | — | |
| Japanese Yen | SCNY | Sell | 3,280,000 | 28,112 | | 2/08/16 | | 1,554 | | — | |
franklintempleton.com
Annual Report | 29
FRANKLIN TEMPLETON INTERNATIONAL TRUST
CONSOLIDATED STATEMENT OF INVESTMENTS
| | | | | | | | | | |
| Franklin Global Allocation Fund (continued) | | | | | | | | |
| |
| |
| Forward Exchange Contracts (continued) | | | | | | | | | |
| | | | | Contract | Settlement | | Unrealized | | Unrealized | |
| Currency | Counterpartya | Type | Quantity | Amount* | Date | | Appreciation | | Depreciation | |
| OTC Forward Exchange | | | | | | | | | | |
| Contracts (continued) | | | | | | | | | | |
| Euro | DBAB | Sell | 113,000 | 130,052 | 2/09/16 | $ | 5,340 | $ | — | |
| Japanese Yen | BZWS | Sell | 3,280,000 | 28,112 | 2/09/16 | | 1,553 | | — | |
| Japanese Yen | JPHQ | Sell | 3,290,000 | 28,188 | 2/09/16 | | 1,549 | | — | |
| Japanese Yen | HSBC | Sell | 4,290,000 | 36,418 | 2/12/16 | | 1,678 | | — | |
| Japanese Yen | JPHQ | Sell | 4,287,000 | 36,393 | 2/12/16 | | 1,678 | | — | |
| Japanese Yen | CITI | Sell | 5,680,000 | 47,776 | 2/16/16 | | 1,775 | | — | |
| Japanese Yen | JPHQ | Sell | 2,850,000 | 24,051 | 2/16/16 | | 970 | | — | |
| Japanese Yen | GSFX | Sell | 2,850,000 | 24,167 | 2/17/16 | | 1,085 | | — | |
| Japanese Yen | JPHQ | Sell | 2,850,000 | 24,124 | 2/17/16 | | 1,042 | | — | |
| Euro | DBAB | Sell | 140,000 | 160,374 | 2/23/16 | | 5,815 | | — | |
| Japanese Yen | BZWS | Sell | 1,420,000 | 12,032 | 2/25/16 | | 529 | | — | |
| Euro | BZWS | Sell | 70,528 | 80,482 | 2/26/16 | | 2,613 | | — | |
| Japanese Yen | BZWS | Sell | 2,840,000 | 23,927 | 2/26/16 | | 920 | | — | |
| Euro | DBAB | Sell | 83,517 | 95,541 | 2/29/16 | | 3,322 | | — | |
| Japanese Yen | DBAB | Sell | 915,000 | 7,745 | 2/29/16 | | 332 | | — | |
| Euro | BZWS | Sell | 20,444 | 22,775 | 3/09/16 | | 196 | | — | |
| Euro | DBAB | Sell | 40,000 | 44,466 | 3/09/16 | | 287 | | — | |
| Japanese Yen | BZWS | Sell | 3,863,800 | 32,396 | 3/09/16 | | 1,083 | | — | |
| Euro | CITI | Sell | 25,814 | 28,326 | 3/10/16 | | — | | (186 | ) |
| Mexican Peso | HSBC | Buy | 753,430 | 47,368 | 3/11/16 | | 538 | | — | |
| Mexican Peso | HSBC | Sell | 753,430 | 48,608 | 3/11/16 | | 702 | | — | |
| Euro | BZWS | Sell | 4,551 | 4,870 | 3/16/16 | | — | | (157 | ) |
| Euro | CITI | Sell | 2,661 | 2,851 | 3/16/16 | | — | | (88 | ) |
| Japanese Yen | CITI | Sell | 3,100,000 | 25,774 | 3/22/16 | | 641 | | — | |
| Euro | BZWS | Sell | 4,538 | 4,876 | 3/23/16 | | — | | (138 | ) |
| Japanese Yen | DBAB | Sell | 1,542,000 | 12,843 | 3/24/16 | | 340 | | — | |
| Japanese Yen | BZWS | Sell | 1,580,000 | 13,338 | 3/28/16 | | 526 | | — | |
| Euro | BOFA | Sell | 64,700 | 71,456 | 3/29/16 | | 65 | | (109 | ) |
| Euro | BOFA | Sell | 18,200 | 20,180 | 3/30/16 | | 66 | | — | |
| Euro | BZWS | Sell | 4,483 | 4,895 | 4/01/16 | | — | | (59 | ) |
| Euro | CITI | Sell | 8,200 | 9,100 | 4/08/16 | | 36 | | — | |
| Euro | DBAB | Sell | 5,365 | 5,809 | 4/13/16 | | — | | (122 | ) |
| Euro | HSBC | Sell | 5,386 | 5,739 | 4/18/16 | | — | | (217 | ) |
| Japanese Yen | BZWS | Sell | 1,270,000 | 10,725 | 4/18/16 | | 420 | | — | |
| Euro | JPHQ | Sell | 865 | 942 | 4/21/16 | | — | | (14 | ) |
| Japanese Yen | JPHQ | Sell | 1,640,000 | 13,908 | 4/21/16 | | 600 | | — | |
| Euro | BZWS | Sell | 4,457 | 4,826 | 4/22/16 | | — | | (103 | ) |
| Euro | BZWS | Sell | 3,615 | 3,951 | 4/29/16 | | — | | (47 | ) |
| Euro | SCNY | Sell | 16,000 | 17,621 | 4/29/16 | | — | | (77 | ) |
| Euro | BZWS | Sell | 9,004 | 10,126 | 5/05/16 | | 165 | | — | |
| Total Forward Exchange Contracts unrealized appreciation (depreciation) | | | | 852,453 | | (463,221 | ) |
| Net unrealized appreciation (depreciation) | | | | | $ | 389,232 | | | |
aMay be comprised of multiple contracts with the same counterparty, currency and settlement date.
*In U.S. dollars unless otherwise indicated.
See Abbreviations on page 47.
30 | Annual Report | The accompanying notes are an integral part of these consolidated financial statements. franklintempleton.com
FRANKLIN TEMPLETON INTERNATIONAL TRUST
Consolidated Financial Statements
Consolidated Statement of Assets and Liabilities
May 31, 2015
| | |
| Franklin Global Allocation Fund | | |
| |
| Assets: | | |
| Investments in securities: | | |
| Cost - Unaffiliated issuers | $ | 11,414,194 |
| Cost - Sweep Money Fund (Note 3f) | | 21,176,248 |
| Total cost of investments | $ | 32,590,442 |
| Value - Unaffiliated issuers | $ | 13,193,236 |
| Value - Sweep Money Fund (Note 3f) | | 21,176,248 |
| Total value of investments | | 34,369,484 |
| Cash | | 55,125 |
| Restricted Cash (Note 1d) | | 140,000 |
| Foreign currency, at value (cost $44,018) | | 43,977 |
| Receivables: | | |
| Investment securities sold | | 23,595 |
| Capital shares sold | | 85,164 |
| Dividends and interest | | 83,886 |
| Unrealized appreciation on OTC forward exchange contracts | | 852,453 |
| Other assets | | 17 |
| Total assets | | 35,653,701 |
| Liabilities: | | |
| Payables: | | |
| Capital shares redeemed | | 928,675 |
| Management fees | | 1,093 |
| Distribution fees | | 8,283 |
| Transfer agent fees | | 4,702 |
| Due to brokers | | 140,000 |
| Unrealized depreciation on OTC forward exchange contracts | | 463,221 |
| Deferred tax | | 2,072 |
| Accrued expenses and other liabilities | | 67,412 |
| Total liabilities | | 1,615,458 |
| Net assets, at value | $ | 34,038,243 |
| Net assets consist of: | | |
| Paid-in capital | $ | 28,792,373 |
| Undistributed net investment income | | 241,815 |
| Net unrealized appreciation (depreciation) | | 2,163,585 |
| Accumulated net realized gain (loss) | | 2,840,470 |
| Net assets, at value | $ | 34,038,243 |
franklintempleton.com The accompanying notes are an integral part of these consolidated financial statements. | Annual Report | 31
FRANKLIN TEMPLETON INTERNATIONAL TRUST
CONSOLIDATED FINANCIAL STATEMENTS
| | |
| Consolidated Statement of Assets and Liabilities (continued) | | |
| May 31, 2015 | | |
| |
| Class A: | | |
| Net assets, at value | $ | 17,009,868 |
| Shares outstanding | | 1,550,550 |
| Net asset value per sharea | $ | 10.97 |
| Maximum offering price per share (net asset value per share ÷ 94.25%) | $ | 11.64 |
| Class C: | | |
| Net assets, at value | $ | 3,865,713 |
| Shares outstanding | | 354,052 |
| Net asset value and maximum offering price per sharea | $ | 10.92 |
| Class R: | | |
| Net assets, at value | $ | 2,191,624 |
| Shares outstanding | | 200,209 |
| Net asset value and maximum offering price per share | $ | 10.95 |
| Advisor Class: | | |
| Net assets, at value | $ | 10,971,038 |
| Shares outstanding | | 999,635 |
| Net asset value and maximum offering price per share | $ | 10.98 |
aRedemption price is equal to net asset value less contingent deferred sales charges, if applicable.
32 | Annual Report | The accompanying notes are an integral part of these consolidated financial statements. franklintempleton.com
FRANKLIN TEMPLETON INTERNATIONAL TRUST
CONSOLIDATED FINANCIAL STATEMENTS
Consolidated Statement of Operations
for the year ended May 31, 2015
| | | |
| Franklin Global Allocation Fund | | | |
| |
| Investment income: | | | |
| Dividends (net of foreign taxes of $30,037) | $ | 434,923 | |
| Interest (net of foreign taxes of $4,465) | | 324,569 | |
| Total investment income | | 759,492 | |
| Expenses: | | | |
| Management fees (Note 3a) | | 377,479 | |
| Distribution fees: (Note 3c) | | | |
| Class A | | 52,222 | |
| Class C | | 52,833 | |
| Class R | | 11,060 | |
| Transfer agent fees: (Note 3e) | | | |
| Class A | | 21,139 | |
| Class C | | 5,488 | |
| Class R | | 2,239 | |
| Advisor Class | | 11,316 | |
| Custodian fees (Note 4) | | 11,055 | |
| Reports to shareholders | | 30,403 | |
| Registration and filing fees | | 63,651 | |
| Professional fees | | 154,819 | |
| Other | | 63,688 | |
| Total expenses | | 857,392 | |
| Expense reductions (Note 4) | | (21 | ) |
| Expenses waived/paid by affiliates (Note 3f and 3g) | | (344,197 | ) |
| Net expenses | | 513,174 | |
| Net investment income | | 246,318 | |
| Realized and unrealized gains (losses): | | | |
| Net realized gain (loss) from: | | | |
| Investments | | 2,466,106 | |
| Foreign currency transactions | | 1,537,303 | |
| Futures contracts | | 865,063 | |
| Swap contracts | | (17,136 | ) |
| Net realized gain (loss) | | 4,851,336 | |
| Net change in unrealized appreciation (depreciation) on: | | | |
| Investments | | (4,102,128 | ) |
| Futures contracts | | (73,422 | ) |
| Swap contracts | | (47,316 | ) |
| Translation of other assets and liabilities denominated in foreign currencies | | 440,350 | |
| Change in deferred taxes on unrealized appreciation | | (99 | ) |
| Net change in unrealized appreciation (depreciation) | | (3,782,615 | ) |
| Net realized and unrealized gain (loss) | | 1,068,721 | |
| Net increase (decrease) in net assets resulting from operations | $ | 1,315,039 | |
franklintempleton.com The accompanying notes are an integral part of these consolidated financial statements. | Annual Report | 33
| | | | | | |
| FRANKLIN TEMPLETON INTERNATIONAL TRUST | | | | | | |
| CONSOLIDATED FINANCIAL STATEMENTS | | | | | | |
| |
| |
| Consolidated Statements of Changes in Net Assets | | | | | | |
| |
| |
| Franklin Global Allocation Fund | | | | | | |
| |
| | | Year Ended May 31, | |
| | | 2015 | | | 2014 | |
| Increase (decrease) in net assets: | | | | | | |
| Operations: | | | | | | |
| Net investment income | $ | 246,318 | | $ | 385,492 | |
| Net realized gain (loss) | | 4,851,336 | | | 611,780 | |
| Net change in unrealized appreciation (depreciation) | | (3,782,615 | ) | | 2,455,361 | |
| Net increase (decrease) in net assets resulting from operations | | 1,315,039 | | | 3,452,633 | |
| Distributions to shareholders from: | | | | | | |
| Net investment income and net foreign currency gains: | | | | | | |
| Class A | | (576,960 | ) | | (592,943 | ) |
| Class C | | (92,968 | ) | | (138,311 | ) |
| Class R | | (56,316 | ) | | (55,502 | ) |
| Advisor Class | | (374,006 | ) | | (346,721 | ) |
| Net realized gains: | | | | | | |
| Class A | | (808,863 | ) | | — | |
| Class C | | (223,902 | ) | | — | |
| Class R | | (90,795 | ) | | — | |
| Advisor Class | | (460,142 | ) | | — | |
| Total distributions to shareholders | | (2,683,952 | ) | | (1,133,477 | ) |
| Capital share transactions: (Note 2) | | | | | | |
| Class A | | (5,806,665 | ) | | (1,107,999 | ) |
| Class C | | (1,529,032 | ) | | (1,048,184 | ) |
| Class R | | (24,254 | ) | | 24,507 | |
| Advisor Class | | (1,035,148 | ) | | (2,837,941 | ) |
| Total capital share transactions | | (8,395,099 | ) | | (4,969,617 | ) |
| Net increase (decrease) in net assets | | (9,764,012 | ) | | (2,650,461 | ) |
| Net assets: | | | | | | |
| Beginning of year | | 43,802,255 | | | 46,452,716 | |
| End of year | $ | 34,038,243 | | $ | 43,802,255 | |
| Undistributed net investment income (distributions in excess of net investment income) included in | | | | | | |
| net assets: | | | | | | |
| End of year | $ | 241,815 | | $ | (132,180 | ) |
34 | Annual Report | The accompanying notes are an integral part of these consolidated financial statements. franklintempleton.com
FRANKLIN TEMPLETON INTERNATIONAL TRUST
Notes to Consolidated Financial Statements
Franklin Global Allocation Fund
1. Organization and Significant Accounting Policies
Franklin Templeton International Trust (Trust) is registered under the Investment Company Act of 1940 (1940 Act) as an open-end management investment company, consisting of four separate funds and applies the specialized accounting and reporting guidance in U.S. Generally Accepted Accounting Principles (U.S. GAAP). Franklin Global Allocation Fund (Fund) is included in this report. The financial statements of the remaining funds in the Trust are presented separately. The Fund offers four classes of shares: Class A, Class C, Class R, and Advisor Class. Each class of shares differs by its initial sales load, contingent deferred sales charges, voting rights on matters affecting a single class, its exchange privilege and fees primarily due to differing arrangements for distribution and transfer agent fees. The Fund was closed to new investors effective April 20, 2015.
Effective June 30, 2014, Franklin Templeton Global Allocation Fund was renamed Franklin Global Allocation Fund.
The following summarizes the Fund’s significant accounting policies.
a. Financial Instrument Valuation
The Fund’s investments in financial instruments are carried at fair value daily. Fair value is the price that would be received to sell an asset or paid to transfer a liability in an orderly transaction between market participants on the measurement date. The Fund calculates the net asset value per share at the close of the New York Stock Exchange (NYSE), generally at 4 p.m. Eastern time (NYSE close) on each day the NYSE is open for trading. Under compliance policies and procedures approved by the Trust’s Board of Trustees (the Board), the Fund’s administrator has responsibility for oversight of valuation, including leading the cross-functional Valuation and Liquidity Oversight Committee (VLOC). The VLOC provides administration and oversight of the Fund’s valuation policies and procedures, which are approved annually by the Board. Among other things, these procedures allow the Fund to utilize independent pricing services, quotations from securities and financial instrument dealers, and other market sources to determine fair value.
Equity securities, exchange traded notes and derivative financial instruments (derivatives) listed on an exchange or on the NASDAQ National Market System are valued at the last quoted sale price or the official closing price of the day, respectively.
Foreign equity securities are valued as of the close of trading on the foreign stock exchange on which the security is primarily traded or as of the NYSE close, whichever is earlier. The value is then converted into its U.S. dollar equivalent at the foreign exchange rate in effect at the NYSE close on the day that the value of the security is determined. Over-the-counter (OTC) securities are valued within the range of the most recent quoted bid and ask prices. Securities that trade in multiple markets or on multiple exchanges are valued according to the broadest and most representative market. Certain equity securities are valued based upon fundamental characteristics or relationships to similar securities. Investments in open-end mutual funds are valued at the closing NAV.
Debt securities generally trade in the OTC market rather than on a securities exchange. The Fund’s pricing services use multiple valuation techniques to determine fair value. In instances where sufficient market activity exists, the pricing services may utilize a market-based approach through which quotes from market makers are used to determine fair value. In instances where sufficient market activity may not exist or is limited, the pricing services also utilize proprietary valuation models which may consider market characteristics such as benchmark yield curves, credit spreads, estimated default rates, anticipated market interest rate volatility, coupon rates, anticipated timing of principal repayments, underlying collateral, and other unique security features in order to estimate the relevant cash flows, which are then discounted to calculate the fair value. Securities denominated in a foreign currency are converted into their U.S. dollar equivalent at the foreign exchange rate in effect at the NYSE close on the date that the values of the foreign debt securities are determined.
Certain derivatives trade in the OTC market. The Fund’s pricing services use various techniques including industry standard option pricing models and proprietary discounted cash flow models to determine the fair value of those instruments. The Fund’s net benefit or obligation under the derivative contract, as measured by the fair value of the contract, is included in net assets.
The Fund has procedures to determine the fair value of financial instruments for which market prices are not reliable or readily available. Under these procedures, the VLOC convenes on a regular basis to review such financial instruments and considers a number of factors, including significant unobservable valuation inputs, when arriving at fair value. The VLOC primarily employs a market-based approach which may use related
franklintempleton.com
Annual Report
| 35
FRANKLIN TEMPLETON INTERNATIONAL TRUST
NOTES TO CONSOLIDATED FINANCIAL STATEMENTS
Franklin Global Allocation Fund (continued)
1. Organization and Significant Accounting
Policies (continued)
a. Financial Instrument Valuation (continued)
or comparable assets or liabilities, recent transactions, market multiples, book values, and other relevant information for the investment to determine the fair value of the investment. An income-based valuation approach may also be used in which the anticipated future cash flows of the investment are discounted to calculate fair value. Discounts may also be applied due to the nature or duration of any restrictions on the disposition of the investments. Due to the inherent uncertainty of valuations of such investments, the fair values may differ significantly from the values that would have been used had an active market existed. The VLOC employs various methods for calibrating these valuation approaches including a regular review of key inputs and assumptions, transactional back-testing or disposition analysis, and reviews of any related market activity.
Trading in securities on foreign securities stock exchanges and OTC markets may be completed before the daily NYSE close. In addition, trading in certain foreign markets may not take place on every NYSE business day. Occasionally, events occur between the time at which trading in a foreign security is completed and the close of the NYSE that might call into question the reliability of the value of a portfolio security held by the Fund. As a result, differences may arise between the value of the Fund’s portfolio securities as determined at the foreign market close and the latest indications of value at the close of the NYSE. In order to minimize the potential for these differences, the VLOC monitors price movements following the close of trading in foreign stock markets through a series of country specific market proxies (such as baskets of American Depositary Receipts, futures contracts and exchange traded funds). These price movements are measured against established trigger thresholds for each specific market proxy to assist in determining if an event has occurred that may call into question the reliability of the values of the foreign securities held by the Fund. If such an event occurs, the securities may be valued using fair value procedures, which may include the use of independent pricing services.
When the last day of the reporting period is a non-business day, certain foreign markets may be open on those days that the NYSE is closed, which could result in differences between the value of the Fund’s portfolio securities on the last business day and the last calendar day of the reporting period. Any significant security valuation changes due to an open foreign market are adjusted and reflected by the Fund for financial reporting purposes.
b. Foreign Currency Translation
Portfolio securities and other assets and liabilities denominated in foreign currencies are translated into U.S. dollars based on the exchange rate of such currencies against U.S. dollars on the date of valuation. The Fund may enter into foreign currency exchange contracts to facilitate transactions denominated in a foreign currency. Purchases and sales of securities, income and expense items denominated in foreign currencies are translated into U.S. dollars at the exchange rate in effect on the transaction date. Portfolio securities and assets and liabilities denominated in foreign currencies contain risks that those currencies will decline in value relative to the U.S. dollar. Occasionally, events may impact the availability or reliability of foreign exchange rates used to convert the U.S. dollar equivalent value. If such an event occurs, the foreign exchange rate will be valued at fair value using procedures established and approved by the Board.
The Fund does not separately report the effect of changes in foreign exchange rates from changes in market prices on securities held. Such changes are included in net realized and unrealized gain or loss from investments in the Consolidated Statement of Operations.
Realized foreign exchange gains or losses arise from sales of foreign currencies, currency gains or losses realized between the trade and settlement dates on securities transactions and the difference between the recorded amounts of dividends, interest, and foreign withholding taxes and the U.S. dollar equivalent of the amounts actually received or paid. Net unrealized foreign exchange gains and losses arise from changes in foreign exchange rates on foreign denominated assets and liabilities other than investments in securities held at the end of the reporting period.
c. Derivative Financial Instruments
The Fund invested in derivatives in order to manage risk or gain exposure to various other investments or markets. Derivatives are financial contracts based on an underlying or notional amount, require no initial investment or an initial net investment that is smaller than would normally be required to have a similar response to changes in market factors, and require or permit net settlement. Derivatives contain various
36 | Annual Report
franklintempleton.com
FRANKLIN TEMPLETON INTERNATIONAL TRUST
NOTES TO CONSOLIDATED FINANCIAL STATEMENTS
Franklin Global Allocation Fund (continued)
risks including the potential inability of the counterparty to fulfill their obligations under the terms of the contract, the potential for an illiquid secondary market, and/or the potential for market movements which expose the Fund to gains or losses in excess of the amounts shown in the Consolidated Statement of Assets and Liabilities. Realized gain and loss and unrealized appreciation and depreciation on these contracts for the period are included in the Consolidated Statement of Operations.
Derivative counterparty credit risk is managed through a formal evaluation of the creditworthiness of all potential counterpar-ties. The Fund attempts to reduce its exposure to counterparty credit risk on OTC derivatives, whenever possible, by entering into International Swaps and Derivatives Association (ISDA) master agreements with certain counterparties. These agreements contain various provisions, including but not limited to collateral requirements, events of default, or early termination. Termination events applicable to the counterparty include certain deteriorations in the credit quality of the counterparty. Termination events applicable to the Fund include failure of the Fund to maintain certain net asset levels and/or limit the decline in net assets over various periods of time. In the event of default or early termination, the ISDA master agreement gives the non-defaulting party the right to net and close-out all transactions traded, whether or not arising under the ISDA agreement, to one net amount payable by one counterparty to the other. However, absent an event of default or early termination, OTC derivative assets and liabilities are presented gross and not offset in the Consolidated Statement of Assets and Liabilities. Early termination by the counterparty may result in an immediate payment by the Fund of any net liability owed to that counterparty under the ISDA agreement.
Collateral requirements differ by type of derivative. Collateral terms are contract specific for OTC derivatives. For OTC derivatives traded under an ISDA master agreement, posting of collateral is required by either the fund or the applicable counterparty if the total net exposure of all OTC derivatives with the applicable counterparty exceeds the minimum transfer amount, which typically ranges from $100,000 to $250,000, and can vary depending on the counterparty and the type of the agreement. Generally, collateral is determined at the close of fund business each day and any additional collateral required due to changes in derivative values may be delivered by the fund or the counterparty within a few business days. Collateral pledged and/or received by the fund, if any, is held in segregated accounts with the fund’s custodian/counterparty broker and can be in the form of cash and/or securities. Unrestricted cash may be invested according to the Fund’s investment objectives.
The Fund entered into exchange traded financial futures contracts primarily to manage and/or gain exposure to interest rate or equity price risk, and certain foreign currencies. A futures contract is an agreement between the Fund and a counterparty to buy or sell an asset for a specified price on a future date. Required initial margins are pledged by the Fund, and the daily change in fair value is accounted for as a variation margin payable or receivable in the Consolidated Statement of Assets and Liabilities.
The Fund entered into OTC forward exchange contracts primarily to manage and/or gain exposure to certain foreign currencies. A forward exchange contract is an agreement between the Fund and a counterparty to buy or sell a foreign currency at a specific exchange rate on a future date.
The Fund entered into interest rate swap contracts primarily to manage interest rate risk. An interest rate swap is an agreement between the Fund and a counterparty to exchange cash flows based on the difference between two interest rates, applied to a notional amount. These agreements may be privately negotiated in the over-the-counter market (“OTC interest rate swaps”) or may be executed on a registered exchange (“centrally cleared interest rate swaps”). For centrally cleared interest rate swaps, required initial margins are pledged by the Fund, and the daily change in fair value is accounted for as a variation margin payable or receivable in the Consolidated Statement of Assets and Liabilities. Over the term of the contract, contractually required payments to be paid and to be received are accrued daily and recorded as unrealized depreciation and appreciation until the payments are made, at which time they are realized.
The Fund entered into OTC total return swap contracts primarily to manage and/or gain exposure to equity price risk of an underlying instrument. A total return swap is an agreement between the Fund and a counterparty to exchange a return linked to an underlying instrument for a floating or fixed rate payment, both based upon a notional amount. Over the term of the contract, contractually required payments to be paid or received are accrued daily and recorded as unrealized appreciation or depreciation until the payments are made, at which time they are recognized as realized gain or loss.
See Note 8 regarding other derivative information.
franklintempleton.com
Annual Report
| 37
FRANKLIN TEMPLETON INTERNATIONAL TRUST
NOTES TO CONSOLIDATED FINANCIAL STATEMENTS
Franklin Global Allocation Fund (continued)
1. Organization and Significant Accounting
Policies (continued)
d. Restricted Cash
At May 31, 2015, the Fund held restricted cash in connection with investments in certain derivative securities. Restricted cash is held in a segregated account with the Fund’s custodian and is reflected in the Consolidated Statement of Assets and Liabilities.
e. Exchange Traded Notes
The Fund purchases exchange traded notes. Exchange traded notes are senior, unsecured, unsubordinated debt securities issued by an underwriting bank. Exchange traded notes are designed to provide investors access to the returns of various market benchmarks and intended to replicate the economic effects that would apply had the Fund directly purchased the underlying referenced asset or basket of assets. The risks of exchange traded notes include the credit risk of the issuer, counterparty risk, and the potential inability of the Fund to dispose of the exchange traded note in the normal course of business.
f. Investments in GAF Holdings Corporation (GAF Subsidiary)
The Fund invests in certain financial instruments through its investment in the GAF Subsidiary. The GAF Subsidiary is a Cayman Islands exempted company with limited liability, is a wholly-owned subsidiary of the Fund, and is able to invest in certain financial instruments consistent with the investment objective of the Fund. At May 31, 2015, the GAF Subsidiary’s investment as well as any other assets and liabilities of the GAF Subsidiary are reflected in the Fund’s Consolidated Statement of Investments and Consolidated Statement of Assets and Liabilities. The financial statements have been consolidated and include the accounts of the Fund and the GAF Subsidiary. All intercompany transactions and balances have been eliminated. At May 31, 2015, the net assets of the GAF Subsidiary were $870,605, representing 2.56% of the Fund’s consolidated net assets. The Fund’s investment in the GAF Subsidiary is limited to 25% of consolidated assets.
g. Senior Floating Rate Interests
The Fund invests in senior secured corporate loans that pay interest at rates which are periodically reset by reference to a base lending rate plus a spread. These base lending rates are generally the prime rate offered by a designated U.S. bank or the London InterBank Offered Rate (LIBOR). Senior secured corporate loans often require prepayment of principal from excess cash flows or at the discretion of the borrower. As a result, actual maturity may be substantially less than the stated maturity. Senior secured corporate loans in which the Fund invests are generally readily marketable, but may be subject to certain restrictions on resale.
h. Income and Deferred Taxes
It is the Fund’s policy to qualify as a regulated investment company under the Internal Revenue Code. The Fund intends to distribute to shareholders substantially all of its taxable income and net realized gains to relieve it from federal income and excise taxes. As a result, no provision for U.S. federal income taxes is required.
The Fund may be subject to foreign taxation related to income received, capital gains on the sale of securities and certain foreign currency transactions in the foreign jurisdictions in which it invests. Foreign taxes, if any, are recorded based on the tax regulations and rates that exist in the foreign markets in which the Fund invests. When a capital gain tax is determined to apply, the Fund records an estimated deferred tax liability in an amount that would be payable if the securities were disposed of on the valuation date.
The Fund recognizes the tax benefits of uncertain tax positions only when the position is “more likely than not” to be sustained upon examination by the tax authorities based on the technical merits of the tax position. As of May 31, 2015, and for all open tax years, the Fund has determined that no liability for unrecognized tax benefits is required in the Fund’s consolidated financial statements related to uncertain tax positions taken on a tax return (or expected to be taken on future tax returns). Open tax years are those that remain subject to examination and are based on each tax jurisdiction’s statute of limitation.
i. Security Transactions, Investment Income, Expenses and Distributions
Security transactions are accounted for on trade date. Realized gains and losses on security transactions are determined on a specific identification basis. Interest income and estimated expenses are accrued daily. Amortization of premium and accretion of discount on debt securities are included in interest income. Dividend income is recorded on the ex-dividend date except for certain dividends from foreign securities where the
38 | Annual Report
franklintempleton.com
FRANKLIN TEMPLETON INTERNATIONAL TRUST
NOTES TO CONSOLIDATED FINANCIAL STATEMENTS
Franklin Global Allocation Fund (continued)
dividend rate is not available. In such cases, the dividend is recorded as soon as the information is received by the Fund. Distributions to shareholders are recorded on the ex-dividend date and are determined according to income tax regulations (tax basis). Distributable earnings determined on a tax basis may differ from earnings recorded in accordance with U.S. GAAP. These differences may be permanent or temporary. Permanent differences are reclassified among capital accounts to reflect their tax character. These reclassifications have no impact on net assets or the results of operations. Temporary differences are not reclassified, as they may reverse in subsequent periods.
Common expenses incurred by the Trust are allocated among the funds based on the ratio of net assets of each fund to the combined net assets of the Trust. Fund specific expenses are charged directly to the fund that incurred the expense.
Realized and unrealized gains and losses and net investment income, not including class specific expenses, are allocated daily to each class of shares based upon the relative proportion of net assets of each class. Differences in per share distributions, by class, are generally due to differences in class specific expenses.
Inflation-indexed bonds are adjusted for inflation through periodic increases or decreases in the security’s interest accruals, face amount, or principal redemption value, by amounts corresponding to the rate of inflation as measured by an index. Any increase or decrease in the face amount or principal redemption value will be included as interest income in the Consolidated Statement of Operations.
j. Accounting Estimates
The preparation of financial statements in accordance with U.S. GAAP requires management to make estimates and assumptions that affect the reported amounts of assets and liabilities at the date of the financial statements and the amounts of income and expenses during the reporting period. Actual results could differ from those estimates.
k. Guarantees and Indemnifications
Under the Trust’s organizational documents, its officers and trustees are indemnified by the Trust against certain liabilities arising out of the performance of their duties to the Trust. Additionally, in the normal course of business, the Trust, on behalf of the Fund, enters into contracts with service providers that contain general indemnification clauses. The Trust’s maximum exposure under these arrangements is unknown as this would involve future claims that may be made against the Trust that have not yet occurred. Currently, the Trust expects the risk of loss to be remote.
2. Shares of Beneficial Interest
At May 31, 2015, there were an unlimited number of shares authorized (without par value). Transactions in the Fund’s shares were as follows:
| | | | | | | | | | |
| | | | | Year Ended May 31, | | | | |
| | | | | 2015 | | | | | 2014 | |
| | Shares | | | Amount | | Shares | | | Amount | |
| |
| Class A Shares: | | | | | | | | | | |
| Shares sold | 305,811 | | $ | 3,357,984 | | 649,165 | | $ | 7,140,140 | |
| Shares issued in reinvestment of distributions | 94,598 | | | 942,193 | | 30,002 | | | 325,524 | |
| Shares redeemed | (914,978 | ) | | (10,106,842 | ) | (791,858 | ) | | (8,573,663 | ) |
| Net increase (decrease) | (514,569 | ) | $ | (5,806,665 | ) | (112,691 | ) | $ | (1,107,999 | ) |
| |
| Class C Shares: | | | | | | | | | | |
| Shares sold | 121,768 | | $ | 1,336,304 | | 182,498 | | $ | 1,981,247 | |
| Shares issued in reinvestment of distributions | 31,741 | | | 315,826 | | 10,240 | | | 110,391 | |
| Shares redeemed | (292,353 | ) | | (3,181,162 | ) | (288,840 | ) | | (3,139,822 | ) |
| Net increase (decrease) | (138,844 | ) | $ | (1,529,032 | ) | (96,102 | ) | $ | (1,048,184 | ) |
franklintempleton.com Annual Report | 39
FRANKLIN TEMPLETON INTERNATIONAL TRUST
NOTES TO CONSOLIDATED FINANCIAL STATEMENTS
| | | | | | | | | | | |
| Franklin Global Allocation Fund (continued) | | | | | | | | | | | |
| |
| 2. Shares of Beneficial Interest (continued) | | | | | | | | | | | |
| | | | | | Year Ended May 31, | | | | |
| | | | | 2015 | | | | | | 2014 | |
| | Shares | | | | Amount | | Shares | | | Amount | |
| Class R Shares: | | | | | | | | | | | |
| Shares sold | 296 | | | $ | 3,220 | | 2,345 | | $ | 26,119 | |
| Shares issued in reinvestment of distributions | 188 | | | | 1,871 | | 57 | | | 622 | |
| Shares redeemed | (2,700 | ) | | | (29,345 | ) | (200 | ) | | (2,234 | ) |
| Net increase (decrease) | (2,216 | ) | | $ | (24,254 | ) | 2,202 | | $ | 24,507 | |
| Advisor Class Shares: | | | | | | | | | | | |
| Shares sold | 42,180 | | | $ | 475,051 | | 26,842 | | $ | 291,477 | |
| Shares issued in reinvestment of distributions | 4,470 | | | | 44,520 | | 1,459 | | | 15,860 | |
| Shares redeemed | (137,468 | ) | | | (1,554,719 | ) | (283,012 | ) | | (3,145,278 | ) |
| Net increase (decrease) | (90,818 | ) | $ | (1,035,148 | ) | (254,711 | ) | $ | (2,837,941 | ) |
3. Transactions with Affiliates
Franklin Resources, Inc. is the holding company for various subsidiaries that together are referred to as Franklin Templeton Investments. Certain officers and trustees of the Trust are also officers and/or directors of the following subsidiaries:
| |
| Subsidiary | Affiliation |
| Franklin Alternative Strategies Advisers, LLC (FASA) | Investment manager |
| Franklin Advisers, Inc. (Advisers) | Investment manager |
| Franklin Mutual Advisers, LLC (Franklin Mutual) | Investment manager |
| Franklin Templeton Institutional, LLC (FT Institutional) | Investment manager |
| Franklin Templeton Investment Management Limited (FTIML) | Investment manager |
| Templeton Asset Management Ltd. (TAML) | Investment manager |
| Templeton Global Advisors Limited (TGAL) | Investment manager |
| Franklin Templeton Services, LLC (FT Services) | Administrative manager |
| Franklin Templeton Distributors, Inc. (Distributors) | Principal underwriter |
| Franklin Templeton Investor Services, LLC (Investor Services) | Transfer agent |
a. Management Fees
The Fund and the GAF Subsidiary pay an investment management fee to FASA based on the average daily net assets of the Fund and the GAF Subsidiary as follows:
| | |
| Annualized Fee Rate | | Net Assets |
| 0.950 | % | Up to and including $1 billion |
| 0.930 | % | Over $1 billion, up to and including $5 billion |
| 0.910 | % | Over $5 billion, up to and including $10 billion |
| 0.890 | % | Over $10 billion, up to and including $15 billion |
| 0.870 | % | Over $15 billion, up to and including $20 billion |
| 0.850 | % | In excess of $20 billion |
40 | Annual Report
franklintempleton.com
FRANKLIN TEMPLETON INTERNATIONAL TRUST
NOTES TO CONSOLIDATED FINANCIAL STATEMENTS
Franklin Global Allocation Fund (continued)
Management fees paid by the Fund are reduced on assets invested in the GAF Subsidiary, in an amount not to exceed the management fees paid by the GAF Subsidiary.
Under a subadvisory agreement, Advisers, Franklin Mutual, FT Institutional, FTIML, TAML, and TGAL, affiliates of FASA, provide subadvisory services to the Fund. The subadvisory fee is paid by FASA based on the Fund’s average daily net assets, and is not an additional expense of the Fund or the GAF Subsidiary.
b. Administrative Fees
Under an agreement with FASA, FT Services provides administrative services to the Fund and the GAF Subsidiary. The fee is paid by FASA based on the Fund’s and the GAF Subsidiary’s average daily net assets, and is not an additional expense of the Fund or the GAF Subsidiary.
c. Distribution Fees
The Board has adopted distribution plans for each share class, with the exception of Advisor Class shares, pursuant to Rule 12b-1 under the 1940 Act. Distribution fees are not charged on shares held by affiliates. Under the Fund’s Class A reimbursement distribution plan, the Fund reimburses Distributors for costs incurred in connection with the servicing, sale and distribution of the Fund’s shares up to the maximum annual plan rate. Under the Class A reimbursement distribution plan, costs exceeding the maximum for the current plan year cannot be reimbursed in subsequent periods. In addition, under the Fund’s Class C and R compensation distribution plans, the Fund pays Distributors for costs incurred in connection with the servicing, sale and distribution of the Fund’s shares up to the maximum annual plan rate for each class. The plan year, for purposes of monitoring compliance with the maximum annual plan rates, is February 1 through January 31.
The maximum annual plan rates, based on the average daily net assets, for each class, are as follows:
| | |
| Class A | 0.30 | % |
| Class C | 1.00 | % |
| Class R | 0.50 | % |
On July 15, 2015, the Board approved to set the current rate at 0.25% per year for Class A shares, effective August 1, 2015, until further notice and approval by the Board.
d. Sales Charges/Underwriting Agreements
Front-end sales charges and contingent deferred sales charges (CDSC) do not represent expenses of the Fund. These charges are deducted from the proceeds of sales of Fund shares prior to investment or from redemption proceeds prior to remittance, as applicable. Distributors has advised the Fund of the following commission transactions related to the sales and redemptions of the Fund’s shares for the year:
| | |
| Sales charges retained net of commissions paid to unaffiliated broker/dealers | $ | 11,536 |
| CDSC retained | $ | 845 |
e. Transfer Agent Fees
Each class of shares pays transfer agent fees to Investor Services for its performance of shareholder servicing obligations and reimburses Investor Services for out of pocket expenses incurred, including shareholding servicing fees paid to third parties. These fees are allocated daily based upon their relative proportion of such classes’ aggregate net assets.
For the year ended May 31, 2015, the Fund paid transfer agent fees of $40,182, of which $23,668 was retained by Investor Services.
franklintempleton.com
Annual Report
| 41
FRANKLIN TEMPLETON INTERNATIONAL TRUST
NOTES TO CONSOLIDATED FINANCIAL STATEMENTS
Franklin Global Allocation Fund (continued)
3. Transactions with Affiliates (continued)
f. Investments in Institutional Fiduciary Trust Money Market Portfolio
The Fund invests in Institutional Fiduciary Trust Money Market Portfolio (Sweep Money Fund), an affiliated open-end management investment company. Management fees paid by the Fund are waived on assets invested in the Sweep Money Fund, as noted in the Consolidated Statement of Operations, in an amount not to exceed the management and administrative fees paid directly or indirectly by the Sweep Money Fund. Prior to June 1, 2013, the waiver was accounted for as a reduction to management fees.
g. Waiver and Expense Reimbursements
FASA has contractually agreed in advance to waive or limit its fees and to assume as its own expense certain expenses otherwise payable by the Fund so that the expenses (excluding distribution fees, and acquired fund fees and expenses) for each class of the Fund do not exceed 1.00% based on the average net assets of each class (other than certain non-routine expenses or costs, including those relating to litigation, indemnification, reorganizations, and liquidations) until September 30, 2015.
h. Other Affiliated Transactions
At May 31, 2015, Advisers owned 55.21% of the Fund’s outstanding shares. Investment activities of this investment company could have a material impact on the Fund.
4. Expense Offset Arrangement
The Fund and the GAF Subsidiary have entered into an arrangement with their custodian whereby credits realized as a result of uninvested cash balances are used to reduce a portion of the funds’ custodian expenses. During the year ended May 31, 2015, the custodian fees were reduced as noted in the Consolidated Statement of Operations.
5. Income Taxes
The tax character of distributions paid during the years ended May 31, 2015 and 2014, was as follows:
| | | | |
| | | 2015 | | 2014 |
| Distributions paid from: | | | | |
| Ordinary income | $ | 1,218,622 | $ | 1,133,477 |
| Long term capital gain | | 1,465,330 | | — |
| | $ | 2,683,952 | $ | 1,133,477 |
At May 31, 2015, the cost of investments and net unrealized appreciation (depreciation), undistributed ordinary income and undistributed long term capital gains for income tax purposes were as follows:
| | | |
| Cost of investments | $ | 32,735,482 | |
| |
| Unrealized appreciation | $ | 2,497,743 | |
| Unrealized depreciation | | (863,741 | ) |
| Net unrealized appreciation (depreciation) | $ | 1,634,002 | |
| |
| Undistributed ordinary income | $ | 1,337,568 | |
| Undistributed long term capital gains | | 2,299,594 | |
| Distributable earnings | $ | 3,637,162 | |
Differences between income and/or capital gains as determined on a book basis and a tax basis are primarily due to differing treatments of foreign currency transactions, inflation related adjustments on foreign securities, wash sales and financial futures transactions.
42 | Annual Report
franklintempleton.com
FRANKLIN TEMPLETON INTERNATIONAL TRUST
NOTES TO CONSOLIDATED FINANCIAL STATEMENTS
Franklin Global Allocation Fund (continued)
6. Investment Transactions
Purchases and sales of investments (excluding short term securities) for the year ended May 31, 2015, aggregated $16,138,213 and $39,318,435, respectively.
7. Concentration of Risk
Investing in foreign securities may include certain risks and considerations not typically associated with investing in U.S. securities, such as fluctuating currency values and changing local and regional economic, political and social conditions, which may result in greater market volatility. In addition, certain foreign securities may not be as liquid as U.S. securities.
8. Other Derivative Information
At May 31, 2015, the Fund’s investments in derivative contracts are reflected in the Consolidated Statement of Assets and Liabilities as follows:
| | | | | | |
| | Asset Derivatives | | | Liability Derivatives |
| Derivative Contracts | | | | | | |
| Not Accounted for as | Consolidated Statement of | | | Consolidated Statement of | | |
| Hedging Instruments | Assets and Liabilities Location | | Fair Value | Assets and Liabilities Location | | Fair Value |
| Foreign exchange contracts | Unrealized appreciation on OTC | | | Unrealized depreciation on OTC | | |
| | forward exchange contracts | $ | 852,453 | forward exchange contracts | $ | 463,221 |
For the year ended May 31, 2015, the effect of derivative contracts in the Fund’s Consolidated Statement of Operations was as follows:
| | | | | | | | |
| | | | | | | | Net Change | |
| | | | Net | | | | in Unrealized | |
| Derivative Contracts | | | Realized | | | | Appreciation | |
| Not Accounted for as | Consolidated Statement | | Gain (Loss) | | Consolidated Statement | | (Depreciation) | |
| Hedging Instruments | of Operations Locations | | for the Year | | of Operations Locations | | for the Year | |
| | Net realized gain (loss) from: | | | | Net change in unrealized | | | |
| | | | | | appreciation (depreciation) on: | | | |
| Interest rate contracts | Futures contracts | $ | (178,363 | ) | Futures contracts | $ | 557 | |
| | Swap contracts | | (39,647 | ) | Swap contracts | | 22,814 | |
| Foreign exchange contracts | Foreign currency transactions | | 1,546,374 | a | Translation of other assets | | | |
| | | | | | and liabilities denominated | | | |
| | | | | | in foreign currencies | | 443,871 | a |
| Equity contracts | Futures contracts | | 1,043,426 | | Futures contracts | | (73,979 | ) |
| | Swap contracts | | 22,511 | | Swap contracts | | (70,130 | ) |
| Totals | | $ | 2,394,301 | | | $ | 323,133 | |
aForward exchange contracts are included in net realized gain (loss) from foreign currency transactions and net change in unrealized appreciation (depreciation) on
translation of other assets and liabilities denominated in foreign currencies in the Consolidated Statement of Operations.
For the year ended May 31, 2015 the average month end fair value of derivatives represented 3.19% of average month end net
assets. The average month end number of open derivative contracts for the year was 330.
See Note 1(c) regarding derivative financial instruments.
franklintempleton.com
Annual Report
| 43
| | | | |
| FRANKLIN TEMPLETON INTERNATIONAL TRUST | | | | |
| NOTES TO CONSOLIDATED FINANCIAL STATEMENTS | | |
| |
| |
| Franklin Global Allocation Fund (continued) | | | | |
| 8. Other Derivative Information (continued) | | | | |
| At May 31, 2015, the Fund’s OTC derivative assets and liabilities, are as follows: | | |
| | | Gross and Net Amounts of Assets and Liabilities |
| | | Presented in the Consolidated Statement of Assets and Liabilities |
| | | Assetsa | | Liabilitiesa |
| Derivatives | | | | |
| Forward exchange contracts | $ | 852,453 | $ | 463,221 |
aAbsent an event of default or early termination, OTC derivative assets and liabilities are presented gross and not offset in the Consolidated Statement of Assets and Liabilities.
At May 31, 2015, the Fund’s OTC derivative assets which may be offset against the Fund’s OTC derivative liabilities and collateral received from the counterparty, is as follows:
| | | | | | | | | | | | | |
| | | | | Amounts Not Offset in the Consolidated | | | |
| | | | | Statement of Assets and Liabilities | | | |
| | | Gross and | | | | | | | | | | | |
| | | Net Amounts of | | Financial | | | Financial | | | | | | |
| | | Assets Presented in the | | Instruments | | | Instruments | | | Cash | | | Net Amount |
| | | Consolidated Statement of | | Available for | | | Collateral | | Collateral | | | (Not less |
| | | Assets and Liabilities | | Offset | | | Received | | Receiveda | | | than zero) |
| Counterparty | | | | | | | | | | | | | |
| BOFA | $ | 893 | $ | (709 | ) | $ | — | | $ | — | | $ | 184 |
| BZWS | | 96,314 | | (15,366 | ) | | — | | | — | | | 80,948 |
| CITI | | 76,259 | | (16,189 | ) | | — | | | — | | | 60,070 |
| DBAB | | 461,664 | | (334,452 | ) | | — | | (127,212 | ) | | — |
| FBCO | | 797 | | (129 | ) | | — | | | — | | | 668 |
| GSFX | | 4,192 | | (635 | ) | | — | | | — | | | 3,557 |
| HSBC | | 42,818 | | (15,975 | ) | | — | | | — | | | 26,843 |
| JPHQ | | 161,920 | | (27,793 | ) | | — | | | — | | | 134,127 |
| SCNY | | 1,554 | | (77 | ) | | — | | | — | | | 1,477 |
| SSBT | | 1,922 | | (1,922 | ) | | — | | | — | | | — |
| UBSW | | 4,120 | | — | | | — | | | — | | | 4,120 |
| Total | $ | 852,453 | $ | (413,247 | ) | $ | — | $ | (127,212 | ) | $ | 311,994 |
aIn some instances, the collateral amounts disclosed in the table above were adjusted due to the requirement to limit the collateral amounts to avoid the effect of
overcollateralization. Actual collateral received and/or pledged may be more than the amounts disclosed herein.
44 | Annual Report
franklintempleton.com
FRANKLIN TEMPLETON INTERNATIONAL TRUST
NOTES TO CONSOLIDATED FINANCIAL STATEMENTS
Franklin Global Allocation Fund (continued)
At May 31, 2015, the Fund’s OTC derivative liabilities which may be offset against the Fund’s OTC derivative assets and collateral pledged to the counterparty, is as follows:
| | | | | | | | | | | |
| | | | | Amounts Not Offset in the Consolidated | | |
| | | | | Statement of Assets and Liabilities | | |
| | | Gross and | | | | | | | | | |
| | | Net Amounts of | | Financial | | | Financial | | | | |
| | | Liabilities Presented in the | | Instruments | | | Instruments | | Cash | | Net Amount |
| | | Consolidated Statement of | | Available for | | | Collateral | | Collateral | | (Not less |
| | | Assets and Liabilities | | Offset | | | Pledged | | Pledged | | than zero) |
| Counterparty | | | | | | | | | | | |
| BOFA | $ | 709 | $ | (709 | ) | $ | — | $ | — | $ | — |
| BZWS | | 15,366 | | (15,366 | ) | | — | | — | | — |
| CITI | | 16,189 | | (16,189 | ) | | — | | — | | — |
| DBAB | | 334,452 | | (334,452 | ) | | — | | — | | — |
| FBCO | | 129 | | (129 | ) | | — | | — | | — |
| GSFX | | 635 | | (635 | ) | | — | | — | | — |
| HSBC | | 15,975 | | (15,975 | ) | | — | | — | | — |
| JPHQ | | 27,793 | | (27,793 | ) | | — | | — | | — |
| RBS | | 47,332 | | — | | | — | | — | | 47,332 |
| SCNY | | 77 | | (77 | ) | | — | | — | | — |
| SSBT | | 4,564 | | (1,922 | ) | | — | | — | | 2,642 |
| Total | $ | 463,221 | $ | (413,247 | ) | $ | — | $ | — | $ | 49,974 |
| |
| See Abbreviations on page 47. | | | | | | | | | | | |
9. Upcoming Liquidation
On April 14, 2015, the Board approved a proposal to liquidate the Fund. The Fund was scheduled to liquidate on June 30, 2015.
On June 26, 2015, the Board approved a proposal to delay the termination and liquidation of the Fund due to delays in liquidating certain portfolio securities. The termination and liquidation of the Fund is now anticipated to occur following the sale of the portfolio securities, but may occur earlier at the discretion of the Trust’s officers if circumstances change. Additionally, Management informed the Board of its intent to waive all fees and expenses effective July 1, 2015 until liquidation of the Fund.
10. Credit Facility
The Fund, together with other U.S. registered and foreign investment funds (collectively, Borrowers), managed by Franklin Templeton Investments, are borrowers in a joint syndicated senior unsecured credit facility totaling $2 billion (Global Credit Facility) which matures on February 12, 2016. This Global Credit Facility provides a source of funds to the Borrowers for temporary and emergency purposes, including the ability to meet future unanticipated or unusually large redemption requests.
Under the terms of the Global Credit Facility, the Fund shall, in addition to interest charged on any borrowings made by the Fund and other costs incurred by the Fund, pay its share of fees and expenses incurred in connection with the implementation and maintenance of the Global Credit Facility, based upon its relative share of the aggregate net assets of all of the Borrowers, including an annual commitment fee of 0.07% based upon the unused portion of the Global Credit Facility. These fees are reflected in other expenses in the Consolidated Statement of Operations. During the year ended May 31, 2015, the Fund did not use the Global Credit Facility.
franklintempleton.com
Annual Report
| 45
FRANKLIN TEMPLETON INTERNATIONAL TRUST
NOTES TO CONSOLIDATED FINANCIAL STATEMENTS
Franklin Global Allocation Fund (continued)
11. Fair Value Measurements
The Fund follows a fair value hierarchy that distinguishes between market data obtained from independent sources (observable inputs) and the Fund’s own market assumptions (unobservable inputs). These inputs are used in determining the value of the Fund’s financial instruments and are summarized in the following fair value hierarchy:
- Level 1 – quoted prices in active markets for identical financial instruments
- Level 2 – other significant observable inputs (including quoted prices for similar financial instruments, interest rates, prepayment speed, credit risk, etc.)
- Level 3 – significant unobservable inputs (including the Fund’s own assumptions in determining the fair value of financial instruments)
The input levels are not necessarily an indication of the risk or liquidity associated with financial instruments at that level.
For movements between the levels within the fair value hierarchy, the Fund has adopted a policy of recognizing the transfers as of the date of the underlying event which caused the movement.
A summary of inputs used as of May 31, 2015, in valuing the Fund’s assets and liabilities carried at fair value, is as follows:
| | | | | | | | |
| | | Level 1 | | Level 2 | | Level 3 | | Total |
| Assets: | | | | | | | | |
| Investments in Securities: | | | | | | | | |
| Equity Investments:a | | | | | | | | |
| Capital Goods | $ | 581,782 | $ | 17,176 | $ | — | $ | 598,958 |
| Energy | | 965,905 | | 66,014 | | — | | 1,031,919 |
| Other Equity Investmentsb | | 6,693,810 | | — | | — | | 6,693,810 |
| Corporate Bonds | | — | | 1,072,887 | | — | | 1,072,887 |
| Senior Floating Rate Interests | | — | | 16,772 | | — | | 16,772 |
| Exchange Traded Notes | | 825,673 | | — | | — | | 825,673 |
| Foreign Government and Agency Securities | | — | | 1,333,540 | | — | | 1,333,540 |
| U.S. Government and Agency Securities | | — | | 1,030,399 | | — | | 1,030,399 |
| Short Term Investments | | 21,176,248 | | 589,278 | | — | | 21,765,526 |
| Total Investments in Securities | $ | 30,243,418 | $ | 4,126,066 | $ | — | $ | 34,369,484 |
| Other Financial Instruments | | | | | | | | |
| Forward Exchange Contracts | $ | — | $ | 852,453 | $ | — | $ | 852,453 |
| Liabilities: | | | | | | | | |
| Other Financial Instruments | | | | | | | | |
| Forward Exchange Contracts | $ | — | $ | 463,221 | $ | — | $ | 463,221 |
aIncludes common and preferred stocks as well as other equity investments.
bFor detailed categories, see the accompanying Consolidated Statement of Investments.
46 | Annual Report
franklintempleton.com
FRANKLIN TEMPLETON INTERNATIONAL TRUST
NOTES TO CONSOLIDATED FINANCIAL STATEMENTS
Franklin Global Allocation Fund (continued)
12. New Accounting Pronouncements
In June 2014, the Financial Accounting Standards Board issued Accounting Standards Update (ASU) No. 2014-11, Transfers and Servicing (Topic 860), Repurchase-to-Maturity Transactions, Repurchase Financings, and Disclosures. The ASU changes the accounting for certain repurchase agreements and expands disclosure requirements related to repurchase agreements, securities lending, repurchase-to-maturity and similar transactions. The ASU is effective for interim and annual reporting periods beginning after December 15, 2014. Management has reviewed the requirements and believes the adoption of this ASU will not have a material impact on the financial statements.
13. Subsequent Events
The Fund has evaluated subsequent events through the issuance of the consolidated financial statements and determined that no events have occurred that require disclosure, other than those already disclosed in the financial statements.
| | | | | |
| Abbreviations | | | | |
| Counterparty | Currency | Selected Portfolio |
| BOFA | Bank of America Corp | BRL | Brazilian Real | ADR | American Depositary Receipt |
| BZWS | Barclays Bank PLC | EUR | Euro | ETN | Exchange Traded Note |
| CITI | Citigroup, Inc. | MXN | Mexican Peso | FHLB | Federal Home Loan Bank |
| DBAB | Deutsche Bank AG | MYR | Malaysian Ringgit | FRN | Floating Rate Note |
| FBCO | Credit Suisse Group AG | | | IDR | International Depositary Receipt |
| GSFX | Goldman Sachs Bank | | | | |
| HSBC | HSBC Bank USA, N.A. | | | | |
| JPHQ | JP Morgan Chase & Co. | | | | |
| RBS | The Royal Bank of Scotland Group PLC | | | | |
| SCNY | Standard Chartered Bank | | | | |
| SSBT | State Street Bank Corp. | | | | |
| UBSW | UBS AG | | | | |
franklintempleton.com
Annual Report
| 47
FRANKLIN TEMPLETON INTERNATIONAL TRUST
Report of Independent Registered Public Accounting Firm
To the Board of Trustees and Shareholders of Franklin Global Allocation Fund
In our opinion, the accompanying consolidated statement of assets and liabilities, including the consolidated statement of investments, and the related consolidated statements of operations and of changes in net assets and the consolidated financial highlights present fairly, in all material respects, the financial position of Franklin Global Allocation Fund and its subsidiary (collectively, the “Fund”) at May 31, 2015, the results of their consolidated operations for the year then ended, the changes in their consolidated net assets for each of the two years in the period then ended and the consolidated financial highlights for the periods presented, in conformity with accounting principles generally accepted in the United States of America. These consolidated financial statements and consolidated financial highlights (hereafter referred to as “financial statements”) are the responsibility of the Fund’s management. Our responsibility is to express an opinion on these financial statements based on our audits. We conducted our audits of these financial statements in accordance with the standards of the Public Company Accounting Oversight Board (United States). Those standards require that we plan and perform the audit to obtain reasonable assurance about whether the financial statements are free of material misstatement. An audit includes examining, on a test basis, evidence supporting the amounts and disclosures in the financial statements, assessing the accounting principles used and significant estimates made by management, and evaluating the overall financial statement presentation. We believe that our audits, which included confirmation of securities at May 31, 2015 by correspondence with the custodian, transfer agent and brokers, provide a reasonable basis for our opinion.
As discussed in Note 9, the Investment Manager is in the process of completing the liquidation of the Fund, after which the Fund will cease all operations. Our opinion is not modified with respect to this matter.
PricewaterhouseCoopers LLP
San Francisco, California
July 16, 2015
48 | Annual Report
franklintempleton.com
FRANKLIN TEMPLETON INTERNATIONAL TRUST
Tax Information (unaudited)
Franklin Global Allocation Fund
Under Section 852(b)(3)(C) of the Internal Revenue Code (Code), the Fund hereby reports the maximum amount allowable but no less than $1,465,331 as a long term capital gain dividend for the fiscal year ended May 31, 2015.
Under Section 871(k)(2)(C) of the Code, the Fund hereby reports the maximum amount allowable but no less than $118,371 as a short term capital gain dividend for purposes of the tax imposed under Section 871(a)(1)(A) of the Code for the fiscal year ended May 31, 2015.
Under Section 854(b)(1)(A) of the Code, the Fund hereby reports 7.75% of the ordinary income dividends as income qualifying for the dividends received deduction for the fiscal year ended May 31, 2015.
Under Section 854(b)(1)(B) of the Code, the Fund hereby reports the maximum amount allowable but no less than $367,416 as qualified dividends for purposes of the maximum rate under Section 1(h)(11) of the Code for the fiscal year ended May 31, 2015. Distributions, including qualified dividend income, paid during calendar year 2015 will be reported to shareholders on Form 1099-DIV by mid-February 2016. Shareholders are advised to check with their tax advisors for information on the treatment of these amounts on their individual income tax returns.
At May 31, 2014, more than 50% of the Fund’s total assets were invested in securities of foreign issuers. In most instances, foreign taxes were withheld from income paid to the Fund on these investments. As shown in the table below, the Fund hereby reports to shareholders the foreign source income and foreign taxes paid, pursuant to Section 853 of the Code. This written statement will allow shareholders of record on December 12, 2014, to treat their proportionate share of foreign taxes paid by the Fund as having been paid directly by them. The shareholder shall consider these amounts as foreign taxes paid in the tax year in which they receive the Fund distribution.
The following table provides a detailed analysis of foreign tax paid, foreign source income, and foreign source qualified dividends as reported by the Fund, to Class A, Class C, Class R, and Advisor shareholders of record.
| | | | | | |
| | | Foreign Tax Paid | | Foreign Source | | Foreign Source Qualified |
| Class | | Per Share | | Income Per Share | | Dividends Per Share |
| Class A | $ | 0.0125 | $ | 0.1199 | $ | 0.0553 |
| Class C | $ | 0.0125 | $ | 0.0497 | $ | 0.0230 |
| Class R | $ | 0.0125 | $ | 0.0977 | $ | 0.0451 |
| Advisor Class | $ | 0.0125 | $ | 0.1383 | $ | 0.0637 |
Foreign Tax Paid Per Share (Column 1) is the amount per share available to you, as a tax credit (assuming you held your shares in the Fund for a minimum of 16 days during the 31-day period beginning 15 days before the ex-dividend date of the Fund’s distribution to which the foreign taxes relate), or, as a tax deduction.
Foreign Source Income Per Share (Column 2) is the amount per share of income dividends attributable to foreign securities held by the Fund, plus any foreign taxes withheld on these dividends. The amounts reported include foreign source qualified dividends that have not been adjusted for the rate differential applicable to such dividend income.1
Foreign Source Qualified Dividends Per Share (Column 3) is the amount per share of foreign source qualified dividends, plus any foreign taxes withheld on these dividends. These amounts represent the portion of the Foreign Source Income reported to you in column 2 that were derived from qualified foreign securities held by the Fund.1
franklintempleton.com
Annual Report
| 49
FRANKLIN TEMPLETON INTERNATIONAL TRUST
FRANKLIN GLOBAL ALLOCATION FUND
TAX INFORMATION (UNAUDITED)
By mid-February 2015, shareholders received Form 1099-DIV which included their share of taxes paid and foreign source income distributed during the calendar year 2014. The Foreign Source Income reported on Form 1099-DIV has not been adjusted for the rate differential on foreign source qualified dividend income. Shareholders are advised to check with their tax advisors for information on the treatment of these amounts on their 2014 individual income tax returns.
1Qualified dividends are taxed at reduced long term capital gains tax rates. In determining the amount of foreign tax credit that may be applied against the U.S. tax liability
of individuals receiving foreign source qualified dividends, adjustments may be required to the foreign tax credit limitation calculation to reflect the rate differential applicable
to such dividend income. The rules however permit certain individuals to elect not to apply the rate differential adjustments for capital gains and/or dividends for any taxable
year. Please consult your tax advisor and the instructions to Form 1116 for more information.
50 | Annual Report
franklintempleton.com
FRANKLIN TEMPLETON INTERNATIONAL TRUST
Board Members and Officers
The name, year of birth and address of the officers and board members, as well as their affiliations, positions held with the Trust, principal occupations during at least the past five years and number of portfolios overseen in the Franklin Templeton Investments fund complex are shown below. Generally, each board member serves until that person’s successor is elected and qualified.
| | | | |
| Independent Board Members | | | |
| |
| | | | Number of Portfolios in | |
| Name, Year of Birth | | Length of | Fund Complex Overseen | Other Directorships Held |
| and Address | Position | Time Served | by Board Member* | During at Least the Past 5 Years |
| |
| Harris J. Ashton (1932) | Trustee | Since 1991 | 145 | Bar-S Foods (meat packing company) |
| One Franklin Parkway | | | | (1981-2010). |
| San Mateo, CA 94403-1906 | | | | |
| Principal Occupation During at Least the Past 5 Years: | | |
| Director of various companies; and formerly, Director, RBC Holdings, Inc. (bank holding company) (until 2002); and President, Chief |
| Executive Officer and Chairman of the Board, General Host Corporation (nursery and craft centers) (until 1998). |
| |
| Mary C. Choksi (1950) | Trustee | Since | 119 | Avis Budget Group Inc. (car rental) |
| One Franklin Parkway | | October 2014 | | (2007-present), Omnicom Group Inc. |
| San Mateo, CA 94403-1906 | | | | (advertising and marketing communi- |
| | | | | cations services) (2011-present) and |
| | | | | H.J. Heinz Company (processed foods |
| | | | | and allied products) (1998-2006). |
| Principal Occupation During at Least the Past 5 Years: | | |
| Founding Partner and Senior Managing Director, Strategic Investment Group (investment management group) (1987-present); director of |
| various companies; and formerly, Founding Partner and Managing Director, Emerging Markets Management LLC (investment management |
| firm) (1987-2011); and Loan Officer/Senior Loan Officer/Senior Pension Investment Officer, World Bank Group (international financial |
| institution) (1977-1987). | | | | |
| |
| Edith E. Holiday (1952) | Trustee | Since 1998 | 145 | Hess Corporation (exploration and |
| One Franklin Parkway | | | | refining of oil and gas) (1993-present), |
| San Mateo, CA 94403-1906 | | | | RTI International Metals, Inc. (manu- |
| | | | | facture and distribution of titanium) |
| | | | | (1999-present), Canadian National |
| | | | | Railway (railroad) (2001-present), |
| | | | | White Mountains Insurance Group, |
| | | | | Ltd. (holding company) (2004-present) |
| | | | | and H.J. Heinz Company (processed |
| | | | | foods and allied products) (1994-2013). |
| |
| Principal Occupation During at Least the Past 5 Years: | | |
| Director or Trustee of various companies and trusts; and formerly, Assistant to the President of the United States and Secretary of the |
| Cabinet (1990-1993); General Counsel to the United States Treasury Department (1989-1990); and Counselor to the Secretary and Assistant |
| Secretary for Public Affairs and Public Liaison – United States Treasury Department (1988-1989). | |
| |
| J. Michael Luttig (1954) | Trustee | Since 2009 | 145 | Boeing Capital Corporation |
| One Franklin Parkway | | | | (aircraft financing) (2006-2013). |
| San Mateo, CA 94403-1906 | | | | |
| Principal Occupation During at Least the Past 5 Years: | | |
| Executive Vice President, General Counsel and member of the Executive Council, The Boeing Company (aerospace company); and formerly, |
| Federal Appeals Court Judge, U.S. Court of Appeals for the Fourth Circuit (1991-2006). | |
franklintempleton.com
Annual Report
| 51
FRANKLIN TEMPLETON INTERNATIONAL TRUST
| | | | |
| Independent Board Members (continued) | | |
| |
| | | | Number of Portfolios in | |
| Name, Year of Birth | | Length of | Fund Complex Overseen | Other Directorships Held |
| and Address | Position | Time Served | by Board Member* | During at Least the Past 5 Years |
| |
| Frank A. Olson (1932) | Trustee | Since 2007 | 145 | Hess Corporation (exploration and |
| One Franklin Parkway | | | | refining of oil and gas) (1998-2013). |
| San Mateo, CA 94403-1906 | | | | |
| Principal Occupation During at Least the Past 5 Years: | | |
| Director of various companies; and formerly, Chairman of the Board, The Hertz Corporation (car rental) (1980-2000) and Chief Executive |
| Officer (1977-1999); and Chairman of the Board, President and Chief Executive Officer, UAL Corporation (airlines) (June-December 1987). |
| |
| Larry D. Thompson (1945) | Trustee | Since 2007 | 145 | Cbeyond, Inc. (business commu- |
| One Franklin Parkway | | | | nications provider) (2010-2012), |
| San Mateo, CA 94403-1906 | | | | The Southern Company (energy |
| | | | | company) (December 2014; |
| | | | | previously 2010-2012) and Graham |
| | | | | Holdings Company (education and |
| | | | | media organization) (2011-present). |
| Principal Occupation During at Least the Past 5 Years: | | |
| Director of various companies; John A. Sibley Professor of Corporate and Business Law, University of Georgia School of Law (January 2015; |
| previously 2011-2012); and formerly, Executive Vice President – Government Affairs, General Counsel and Corporate Secretary, PepsiCo, |
| Inc. (consumer products) (2012-2014); Senior Vice President – Government Affairs, General Counsel and Secretary, PepsiCo, Inc. (2004-2011); |
| Senior Fellow of The Brookings Institution (2003-2004); Visiting Professor, University of Georgia School of Law (2004); and Deputy Attorney |
| General, U.S. Department of Justice (2001-2003). | | | |
| |
| John B. Wilson (1959) | Lead | Trustee since | 119 | None |
| One Franklin Parkway | Independent | 2006 and Lead | | |
| San Mateo, CA 94403-1906 | Trustee | Independent | | |
| | | Trustee since 2008 | | |
| Principal Occupation During at Least the Past 5 Years: | | |
| President, Staples Europe (office supplies) (2012-present); President and Founder, Hyannis Port Capital, Inc. (real estate and private |
| equity investing); serves on private and non-profit boards; and formerly, Chief Operating Officer and Executive Vice President, Gap, Inc. |
| (retail) (1996-2000); Chief Financial Officer and Executive Vice President – Finance and Strategy, Staples, Inc. (1992-1996); Senior Vice |
| President – Corporate Planning, Northwest Airlines, Inc. (airlines) (1990-1992); and Vice President and Partner, Bain & Company |
| (consulting firm) (1986-1990). | | | | |
| |
| |
| |
| Interested Board Members and Officers | | |
| |
| | | | Number of Portfolios in | |
| Name, Year of Birth | | Length of | Fund Complex Overseen | Other Directorships Held |
| and Address | Position | Time Served | by Board Member* | During at Least the Past 5 Years |
| |
| **Gregory E. Johnson (1961) | Trustee | Since 2007 | 162 | None |
| One Franklin Parkway | | | | |
| San Mateo, CA 94403-1906 | | | | |
| Principal Occupation During at Least the Past 5 Years: | | |
| Chairman of the Board, Member – Office of the Chairman, Director, President and Chief Executive Officer, Franklin Resources, Inc.; officer |
| and/or director or trustee, as the case may be, of some of the other subsidiaries of Franklin Resources, Inc. and of 46 of the investment |
| companies in Franklin Templeton Investments; and vice Chairman, Investment Company Institute. | |
52 | Annual Report
franklintempleton.com
FRANKLIN TEMPLETON INTERNATIONAL TRUST
| | | | |
| Interested Board Members and Officers (continued) | |
| |
| | | | Number of Portfolios in | |
| Name, Year of Birth | | Length of | Fund Complex Overseen | Other Directorships Held |
| and Address | Position | Time Served | by Board Member* | During at Least the Past 5 Years |
| |
| **Rupert H. Johnson, Jr. (1940) Chairman of | Chairman of the | 145 | None |
| One Franklin Parkway | the Board and | Board and Trustee | | |
| San Mateo, CA 94403-1906 | Trustee | since 2013 | | |
| Principal Occupation During at Least the Past 5 Years: | | |
| Vice Chairman, Member – Office of the Chairman and Director, Franklin Resources, Inc.; Director, Franklin Advisers, Inc.; Senior Vice |
| President, Franklin Advisory Services, LLC; and officer and/or director or trustee, as the case may be, of some of the other subsidiaries of |
| Franklin Resources, Inc. and of 43 of the investment companies in Franklin Templeton Investments. | |
| |
| Alison E. Baur (1964) | Vice President | Since 2012 | Not Applicable | Not Applicable |
| One Franklin Parkway | | | | |
| San Mateo, CA 94403-1906 | | | | |
| Principal Occupation During at Least the Past 5 Years: | | |
| Deputy General Counsel, Franklin Templeton Investments; and officer of some of the other subsidiaries of Franklin Resources, Inc. and of 46 |
| of the investment companies in Franklin Templeton Investments. | | |
| |
| Laura F. Fergerson (1962) | Chief | Since 2009 | Not Applicable | Not Applicable |
| One Franklin Parkway | Executive | | | |
| San Mateo, CA 94403-1906 | Officer – | | | |
| | Finance and | | | |
| | Administration | | | |
| |
| Principal Occupation During at Least the Past 5 Years: | | |
| Senior Vice President, Franklin Templeton Services, LLC; Vice President, Franklin Advisers, Inc. and Franklin Templeton Institutional, LLC; |
| and officer of 46 of the investment companies in Franklin Templeton Investments. | |
| |
| Gaston Gardey (1967) | Treasurer, | Since 2009 | Not Applicable | Not Applicable |
| One Franklin Parkway | Chief Financial | | | |
| San Mateo, CA 94403-1906 | Officer and | | | |
| | Chief | | | |
| | Accounting | | | |
| | Officer | | | |
| |
| Principal Occupation During at Least the Past 5 Years: | | |
| Treasurer, U.S. Fund Administration & Reporting, Franklin Templeton Investments; and officer of 27 of the investment companies in Franklin |
| Templeton Investments. | | | | |
| |
| Aliya S. Gordon (1973) | Vice President | Since 2009 | Not Applicable | Not Applicable |
| One Franklin Parkway | | | | |
| San Mateo, CA 94403-1906 | | | | |
| |
| Principal Occupation During at Least the Past 5 Years: | | |
| Senior Associate General Counsel, Franklin Templeton Investments; officer of 46 of the investment companies in Franklin Templeton |
| Investments; and formerly, Litigation Associate, Steefel, Levitt & Weiss, LLP (2000-2004). | |
| |
| Steven J. Gray (1955) | Vice President | Since 2009 | Not Applicable | Not Applicable |
| One Franklin Parkway | | | | |
| San Mateo, CA 94403-1906 | | | | |
| |
| Principal Occupation During at Least the Past 5 Years: | | |
| Senior Associate General Counsel, Franklin Templeton Investments; Vice President, Franklin Templeton Distributors, Inc. and Franklin |
| Alternative Strategies Advisers, LLC; and officer of 46 of the investment companies in Franklin Templeton Investments. |
franklintempleton.com
Annual Report
| 53
| | | | |
| FRANKLIN TEMPLETON INTERNATIONAL TRUST | | |
| |
| |
| |
| |
| Interested Board Members and Officers (continued) | |
| |
| | | | Number of Portfolios in | |
| Name, Year of Birth | | Length of | Fund Complex Overseen | Other Directorships Held |
| and Address | Position | Time Served | by Board Member* | During at Least the Past 5 Years |
| |
| Selena L. Holmes (1965) | Vice President | Since 2012 | Not Applicable | Not Applicable |
| 100 Fountain Parkway | – AML | | | |
| St. Petersburg, FL 33716-1205 | Compliance | | | |
| Principal Occupation During at Least the Past 5 Years: | | |
| Director, Global Compliance Monitoring; Chief Compliance Officer, Franklin Alternative Strategies Advisers, LLC; Vice President, Franklin |
| Templeton Companies, LLC; and officer of 46 of the investment companies in Franklin Templeton Investments. |
| |
| Edward B. Jamieson (1948) | President and | Since 2010 | Not Applicable | Not Applicable |
| One Franklin Parkway | Chief Executive | | | |
| San Mateo, CA 94403-1906 | Officer – | | | |
| | Investment | | | |
| | Management | | | |
| |
| Principal Occupation During at Least the Past 5 Years: | | |
| President, Chief Investment Officer and Director, Franklin Advisers, Inc.; Executive Vice President, Franklin Templeton Institutional, LLC; |
| and officer and/or trustee, as the case may be, of some of the other subsidiaries of Franklin Resources, Inc. and of 10 of the investment |
| companies in Franklin Templeton Investments. | | | |
| |
| Kimberly H. Novotny (1972) | Vice President | Since 2013 | Not Applicable | Not Applicable |
| 300 S.E. 2nd Street | | | | |
| Fort Lauderdale, FL 33301-1923 | | | | |
| |
| Principal Occupation During at Least the Past 5 Years: | | |
| Associate General Counsel, Franklin Templeton Investments; Vice President and Secretary, Fiduciary Trust International of the South; Vice |
| President, Templeton Investment Counsel, LLC; Assistant Secretary, Franklin Resources, Inc.; and officer of 46 of the investment companies |
| in Franklin Templeton Investments. | | | |
| |
| Robert C. Rosselot (1960) | Chief | Since 2013 | Not Applicable | Not Applicable |
| 300 S.E. 2nd Street | Compliance | | | |
| Fort Lauderdale, FL 33301-1923 | Officer | | | |
| |
| Principal Occupation During at Least the Past 5 Years: | | |
| Director, Global Compliance, Franklin Templeton Investments; Vice President, Franklin Templeton Companies, LLC; officer of 46 of the |
| investment companies in Franklin Templeton Investments; and formerly, Senior Associate General Counsel, Franklin Templeton Investments |
| (2007-2013); and Secretary and Vice President, Templeton Group of Funds (2004-2013). | |
| |
| Karen L. Skidmore (1952) | Vice President | Since 2006 | Not Applicable | Not Applicable |
| One Franklin Parkway | and Secretary | | | |
| San Mateo, CA 94403-1906 | | | | |
| |
| Principal Occupation During at Least the Past 5 Years: | | |
| Senior Associate General Counsel, Franklin Templeton Investments; and officer of 46 of the investment companies in Franklin Templeton |
| Investments. | | | | |
| |
| Craig S. Tyle (1960) | Vice President | Since 2005 | Not Applicable | Not Applicable |
| One Franklin Parkway | | | | |
| San Mateo, CA 94403-1906 | | | | |
| |
| Principal Occupation During at Least the Past 5 Years: | | |
| General Counsel and Executive Vice President, Franklin Resources, Inc.; and officer of some of the other subsidiaries of Franklin Resources, |
| Inc. and of 46 of the investment companies in Franklin Templeton Investments. | |
54 | Annual Report
franklintempleton.com
FRANKLIN TEMPLETON INTERNATIONAL TRUST
| | | | |
| Interested Board Members and Officers (continued) | |
| |
| | | | Number of Portfolios in | |
| Name, Year of Birth | | Length of | Fund Complex Overseen | Other Directorships Held |
| and Address | Position | Time Served | by Board Member* | During at Least the Past 5 Years |
| |
| Lori A. Weber (1964) | Vice President | Since 2011 | Not Applicable | Not Applicable |
| 300 S.E. 2nd Street | | | | |
| Fort Lauderdale, FL 33301-1923 | | | | |
| Principal Occupation During at Least the Past 5 Years: | | |
| Senior Associate General Counsel, Franklin Templeton Investments; Assistant Secretary, Franklin Resources, Inc.; Vice President and |
| Secretary, Templeton Investment Counsel, LLC; Vice President, Fiduciary Trust International of the South; and officer of 46 of the investment |
| companies in Franklin Templeton Investments. | | | |
*We base the number of portfolios on each separate series of the U.S. registered investment companies within the Franklin Templeton Investments fund complex.
These portfolios have a common investment manager or affiliated investment managers.
**Gregory E. Johnson is considered to be an interested person of the Fund under the federal securities laws due to his position as an officer and director of Franklin
Resources, Inc. (Resources), which is the parent company of the Fund’s investment manager and distributor. Rupert H. Johnson, Jr. is considered to be an interested
person of the Fund under the federal securities laws due to his position as officer and director and major shareholder of Resources.
Note 1: Rupert H. Johnson, Jr. is the uncle of Gregory E. Johnson.
Note 2: Officer information is current as of the date of this report. It is possible that after this date, information about officers may change.
Note 3: Effective April 30, 2015, Sam Ginn ceased to be a trustee of the Fund
The Sarbanes-Oxley Act of 2002 and Rules adopted by the Securities and Exchange Commission require the Fund to disclose whether the Fund’s Audit Committee
includes at least one member who is an audit committee financial expert within the meaning of such Act and Rules. The Fund’s Board has determined that there
is at least one such financial expert on the Audit Committee and has designated John B. Wilson as its audit committee financial expert. The Board believes that
Mr. Wilson qualifies as such an expert in view of his extensive business background and experience, including service as chief financial officer of Staples, Inc.
from 1992 to 1996. Mr. Wilson has been a Member and Chairman of the Fund’s Audit Committee since 2006. As a result of such background and experience, the
Board believes that Mr. Wilson has acquired an understanding of generally accepted accounting principles and financial statements, the general application of
such principles in connection with the accounting estimates, accruals and reserves, and analyzing and evaluating financial statements that present a breadth
and level of complexity of accounting issues generally comparable to those of the Fund, as well as an understanding of internal controls and procedures for
financial reporting and an understanding of audit committee functions. Mr. Wilson is an independent Board member as that term is defined under the relevant
Securities and Exchange Commission Rules and Releases.
The Statement of Additional Information (SAI) includes additional information about the board members and is available, without charge, upon request.
Shareholders may call (800) DIAL BEN/342-5236 to request the SAI.
franklintempleton.com
Annual Report
| 55
FRANKLIN TEMPLETON INTERNATIONAL TRUST FRANKLIN GLOBAL ALLOCATION FUND
Shareholder Information
Board Review of Investment Management Agreement
At a meeting held April 14, 2015, the Board of Trustees (Board), including a majority of non-interested or independent Trustees, approved renewal of the investment management agreement for each of the Funds within the Trust, including Franklin Global Allocation Fund (Fund(s)). In reaching this decision, the Board took into account information furnished throughout the year at regular Board meetings, as well as information prepared specifically in connection with the annual renewal review process. Information furnished and discussed throughout the year included investment performance reports and related financial information for each Fund, along with periodic reports on expenses, shareholder services, legal and compliance matters, pricing, brokerage commissions and execution and other services provided by the Investment Manager (Manager) and its affiliates, as well as marketing support payments made to financial intermediaries. Information furnished specifically in connection with the renewal process included a report for each Fund prepared by Lipper, Inc. (Lipper), an independent organization, as well as additional material, including a Fund profitability analysis prepared by management. The Lipper reports compared each Fund’s investment performance and expenses with those of other mutual funds deemed comparable to the Fund as selected by Lipper. The Fund profitability analysis report discussed the profitability to Franklin Templeton Investments (FTI) from its overall U.S. fund operations, as well as on an individual fund-by-fund basis. Additional material accompanying such profitability analysis included information on a fund-by-fund basis listing portfolio managers and other accounts they manage, as well as information on management fees charged by the Manager and its affiliates to U.S. mutual funds and other accounts, including management’s explanation of differences where relevant. Such material also included a memorandum prepared by management describing project initiatives and capital investments relating to the services provided to the Funds by the FTI organization, as well as a memorandum relating to economies of scale and an analysis concerning transfer agent fees charged by an affiliate of the Manager. The Board also noted that at the February meetings each year, it receives an annual report on all marketing support payments made by FTI to financial intermediaries.
In considering such materials, the independent Trustees received assistance and advice from and met separately with independent counsel. While the investment management agreements for all Funds were considered at the same Board meeting, the Board dealt with each Fund separately. In approving continuance of the investment management agreement for each Fund, the Board, including a majority of independent Trustees, determined that the existing management fee structure was fair and reasonable and that continuance of the investment management agreement was in the best interests of each Fund and its shareholders. While attention was given to all information furnished, the following discusses some primary factors relevant to the Board’s decision.
NATURE, EXTENT AND QUALITY OF SERVICE. The Board was satisfied with the nature and quality of the overall services provided by the Manager and its affiliates to the Fund and its shareholders, except as noted later with respect to investment performance. The Board’s opinion was based, in part, upon periodic reports furnished it showing that the investment policies and restrictions for the Fund were consistently complied with as well as other reports periodically furnished the Board covering matters such as the compliance of portfolio managers and other management personnel with the code of ethics adopted throughout the Franklin Templeton fund complex, the adherence to fair value pricing procedures established by the Board, and the accuracy of net asset value calculations. The Board also noted the extent of benefits provided Fund shareholders from being part of the Franklin Templeton family of funds, including the right to exchange investments between the same class of shares of different funds without a sales charge, the ability to reinvest Fund dividends into other funds and the right to combine holdings in other funds to obtain a reduced sales charge. Favorable consideration was given to management’s continual efforts and expenditures in establishing effective business continuity plans and developing strategies to address cybersecurity threats. Among other factors taken into account by the Board were the Manager’s best execution trading policies, including a favorable report by an independent portfolio trading analytical firm that also covered FOREX transactions. Consideration was also given to the experience of the Fund’s portfolio management team, the number of accounts managed and general method of compensation. In this latter respect, the Board noted that a primary factor in management’s determination of a portfolio manager’s bonus compensation was the relative investment performance of the funds he or she managed and that a portion of such bonus was required to be invested in a predesignated list of funds within such person’s fund management area so as to be aligned with the interests of shareholders. The Board also took into account the quality of transfer agent and shareholder services provided Fund shareholders by an affiliate of the Manager, noting the changes taking place in the nature of transfer agency services throughout the industry and regulatory initiatives in this area, and the
56 | Annual Report
franklintempleton.com
FRANKLIN TEMPLETON INTERNATIONAL TRUST
FRANKLIN GLOBAL ALLOCATION FUND
SHAREHOLDER INFORMATION
continual enhancements to the Franklin Templeton website. Particular attention was given to management’s conservative approach and diligent risk management procedures, including continual monitoring of counterparty credit risk and attention given to derivatives and other complex instruments, including expanded collateralization requirements. The Board also took into account, among other things, management’s efforts in establishing a global credit facility for the benefit of the Fund and other accounts managed by FTI to provide a source of cash for temporary and emergency purposes or to meet unusual redemption requests as well as the strong financial position of the Manager’s parent company and its commitment to the mutual fund business as evidenced by its continued subsidization of money market funds. With respect to the Fund, the Board also took into account that the investment management arrangements for such Fund involved the use of a wholly owned Cayman Island subsidiary for certain holdings and that the Manager waives a portion of investment management fees from the Fund to the extent it receives investment management fees from such subsidiary corporation.
INVESTMENT PERFORMANCE. The Board placed significant emphasis on the investment performance of the Fund in view of its importance to shareholders. While consideration was given to performance reports and discussions with portfolio managers at Board meetings throughout the year, particular attention in assessing performance was given to the Lipper reports furnished for the agreement renewal. The Lipper reports prepared for the Fund showed the investment performance of its Class A shares in comparison to a performance universe selected by Lipper. Comparative performance for the Fund was shown for the one-year period ended January 31, 2015, and previous periods ended that date of up to 10 years unless otherwise noted.
The performance universe for the Fund consisted of the Fund and all retail and institutional flexible portfolio funds as selected by Lipper. The Fund has been in operation for only three full years and the Lipper report showed its total return for the 12-month period ended January 31, 2015, to be in the lowest performing quintile of such performance universe, and to also be in the lowest performing quintile of such universe for the annualized three-year period. The Board found the Fund’s overall comparative performance as set forth in the Lipper report to be unacceptable but acknowledged the Fund’s relatively short period of effectiveness. The Board discussed with management the structural limitations in the Fund’s design and the Fund’s conservative investment objective, which have contributed to underperformance. They further discussed management’s proposal to liquidate the Fund. In light of this proposal, and changes to portfolio management anticipated prior to the liquidation, the Board determined that management was taking the appropriate steps to address the performance of the Fund.
COMPARATIVE EXPENSES. Consideration was given to a comparative analysis of the management fee and total expense ratio of the Fund compared with those of a group of other funds selected by Lipper as constituting its appropriate Lipper expense group. Lipper expense data is based upon information taken from each fund’s most recent annual report, which reflects historical asset levels that may be quite different from those currently existing, particularly in a period of market volatility. While recognizing such inherent limitation and the fact that expense ratios generally increase as assets decline and decrease as assets grow, the Board believed the independent analysis conducted by Lipper to be an appropriate measure of comparative expenses. In reviewing comparative costs, Lipper provides information on the Fund’s contractual investment management fee in comparison with the investment management fee that would have been charged by other funds within its Lipper expense group assuming they were similar in size to the Fund, as well as the actual total expense ratio of the Fund in comparison with those of its Lipper expense group. The Lipper contractual investment management fee analysis includes administrative charges as being part of the investment management fee, and actual total expenses, for comparative consistency, are shown by Lipper for Fund Class A shares. The Lipper report for the Fund showed its contractual management fee rate to be at the median of its Lipper expense group and its actual total expense ratio to be below the median. The Board was satisfied with the expenses of the Fund and noted that the Fund benefited from a waiver of fees.
MANAGEMENT PROFITABILITY. The Board also considered the level of profits realized by the Manager and its affiliates in connection with the operation of the Fund. In this respect, the Board reviewed the Fund profitability analysis that addresses the overall profitability of Franklin Templeton’s U.S. fund business, as well as its profits in providing management and other services to each of the individual funds during the 12-month period ended September 30, 2014, being the most recent fiscal year-end for Franklin Resources, Inc., the Manager’s parent. In reviewing the analysis, the Board recognized that allocation methodologies are inherently subjective and various allocation methodologies may be reasonable while producing different results. In this respect, the Board noted that while management continually makes refinements to its
franklintempleton.com
Annual Report
| 57
FRANKLIN TEMPLETON INTERNATIONAL TRUST FRANKLIN GLOBAL ALLOCATION FUND SHAREHOLDER INFORMATION
Board Review of Investment Management
Agreement (continued) methodologies in response to organizational and product related changes, the overall approach as defined by the primary drivers and activity measurements has remained consistent with that used in the Fund’s profitability report presentations from prior years. Additionally, the Fund’s independent registered public accounting firm had been engaged by the Manager to periodically review the reasonableness of the allocation methodologies to be used solely by the Fund’s Board in reference to the profitability analysis. In reviewing and discussing such analysis, management discussed with the Board its belief that costs incurred in establishing the infrastructure necessary for the type of mutual fund operations conducted by the Manager and its affiliates may not be fully reflected in the expenses allocated to the Fund in determining its profitability, as well as the fact that the level of profits, to a certain extent, reflected operational cost savings and efficiencies initiated by management. The Board also took into account management’s expenditures in improving shareholder services provided the Fund, as well as the need to implement systems and meet additional regulatory and compliance requirements resulting from statutes such as the Sarbanes-Oxley and Dodd-Frank Acts and recent SEC and other regulatory requirements. In addition, the Board considered a third-party study comparing the profitability of the Manager’s parent on an overall basis to other publicly held managers broken down to show profitability from management operations exclusive of distribution expenses, as well as profitability including distribution expenses. The Board also considered the extent to which the Manager and its affiliates might derive ancillary benefits from fund operations, including revenues generated from transfer agent services, potential benefits resulting from personnel and systems enhancements necessitated by fund growth, as well as increased leverage with the service providers and counterparties. Based upon its consideration of all these factors, the Board determined that the level of profits realized by the Manager and its affiliates from providing services to the Fund was not excessive in view of the nature, quality and extent of services provided.
ECONOMIES OF SCALE. The Board also considered whether economies of scale are realized by the Manager as the Fund grows larger and the extent to which this is reflected in the level of management fees charged. While recognizing that any precise determination is inherently subjective, the Board noted that based upon the Fund profitability analysis, it appears that as some funds get larger, at some point economies of scale do result in the Manager realizing a larger profit margin on management services provided such a fund. The Board also noted that economies of scale are shared with the Fund and its shareholders through management fee breakpoints so that as a fund grows in size, its effective management fee rate declines. The asset level of the Fund was approximately $37 million on December 31, 2014, and the Board believed the size of the Fund afforded no meaningful economies of scale.
Proxy Voting Policies and Procedures
The Fund’s investment manager has established Proxy Voting Policies and Procedures (Policies) that the Fund uses to determine how to vote proxies relating to portfolio securities. Shareholders may view the Fund’s complete Policies online at franklintempleton.com. Alternatively, shareholders may request copies of the Policies free of charge by calling the Proxy Group collect at (954) 527-7678 or by sending a written request to: Franklin Templeton Companies, LLC, 300 S.E. 2nd Street, Fort Lauderdale, FL 33301, Attention: Proxy Group. Copies of the Fund’s proxy voting records are also made available online at franklintempleton.com and posted on the U.S. Securities and Exchange Commission’s website at sec.gov and reflect the most recent 12-month period ended June 30.
Quarterly Statement of Investments
The Fund files a complete statement of investments with the U.S. Securities and Exchange Commission for the first and third quarters for each fiscal year on Form N-Q. Shareholders may view the filed Form N-Q by visiting the Commission’s website at sec.gov. The filed form may also be viewed and copied at the Commission’s Public Reference Room in Washington, DC. Information regarding the operations of the Public Reference Room may be obtained by calling (800) SEC-0330.
Householding of Reports and Prospectuses
You will receive the Fund’s financial reports every six months as well as an annual updated summary prospectus (prospectus available upon request). To reduce Fund expenses, we try to identify related shareholders in a household and send only one copy of the financial reports and summary prospectus. This process, called “householding,” will continue indefinitely unless you instruct us otherwise. If you prefer not to have these documents householded, please call us at (800) 632-2301. At any time you may view current prospectuses/summary prospectuses and financial reports on our website. If you choose, you may receive these documents through electronic delivery.
58 | Annual Report
franklintempleton.com
This page intentionally left blank.
This page intentionally left blank.
Item 2. Code of Ethics.
(a) The Registrant has adopted a code of ethics that applies to its principal executive officers and principal financial and accounting officer.
(c) N/A
(d) N/A
(f) Pursuant to Item 12(a)(1), the Registrant is attaching as an exhibit a copy of its code of ethics that applies to its principal executive officers and principal financial and accounting officer.
Item 3. Audit Committee Financial Expert.
(a)(1) The Registrant has an audit committee financial expert serving on its audit committee.
(2) The audit committee financial expert is John B. Wilson and he is "independent" as defined under the relevant Securities and Exchange Commission Rules and Releases.
Item 4. Principal Accountant Fees and Services.
(a) Audit Fees
The aggregate fees paid to the principal accountant for professional services rendered by the principal accountant for the audit of the registrant’s annual financial statements or for services that are normally provided by the principal accountant in connection with statutory and regulatory filings or engagements were $58,220 for the fiscal year ended May 31, 2015 and $52,539 for the fiscal year ended May 31, 2014.
(b) Audit-Related Fees
There were no fees paid to the principal accountant for assurance and related services rendered by the principal accountant to the registrant that are reasonably related to the performance of the audit of the registrant's financial statements and are not reported under paragraph (a) of Item 4.
There were no fees paid to the principal accountant for assurance and related services rendered by the principal accountant to the registrant's investment adviser and any entity controlling, controlled by or under common control with the investment adviser that provides ongoing services to the registrant that are reasonably related to the performance of the audit of their financial statements.
(c) Tax Fees
There were no fees paid to the principal accountant for professional services rendered by the principal accountant to the registrant for tax compliance, tax advice and tax planning.
The aggregate fees paid to the principal accountant for professional services rendered by the principal accountant to the registrant’s investment adviser and any entity controlling, controlled by or under common control with the investment adviser that provides ongoing services to the registrant for tax compliance, tax advice and tax planning were $0 for the fiscal year ended May 31, 2015 and $6,930 for the fiscal year ended May 31, 2014. The services for which these fees were paid included technical tax consultation for capital gain tax and withholding tax reporting for foreign governments and requirements on local country’s self-certification forms.
(d) All Other Fees
The aggregate fees paid to the principal accountant for products and services rendered by the principal accountant to the registrant not reported in paragraphs (a)-(c) of Item 4 were $0 for the fiscal year ended May 31, 2015 and $13 for the fiscal year ended May 31, 2014. The services for which these fees were paid included review of materials provided to the fund Board in connection with the investment management contract renewal process.
The aggregate fees paid to the principal accountant for products and services rendered by the principal accountant to the registrant’s investment adviser and any entity controlling, controlled by or under common control with the investment adviser that provides ongoing services to the registrant other than services reported in paragraphs (a)-(c) of Item 4 were $31,543 for the fiscal year ended May 31, 2015 and $192,673 for the fiscal year ended May 31, 2014. The services for which these fees were paid included preparation and review of materials provided to the fund Board in connection with the investment management contract renewal process. Other services include compliance examination for Investment Advisor Act rule 206-4(2), assets under management certification review, and XBRL tagging on financial statements.
(e) (1) The registrant’s audit committee is directly responsible for approving the services to be provided by the auditors, including:
(i) pre-approval of all audit and audit related services;
(ii) pre-approval of all non-audit related services to be provided to the Fund by the auditors;
(iii) pre-approval of all non-audit related services to be provided to the registrant by the auditors to the registrant’s investment adviser or to any entity that controls, is controlled by or is under common control with the registrant’s investment adviser and that provides ongoing services to the registrant where the non-audit services relate directly to the operations or financial reporting of the registrant; and
(iv) establishment by the audit committee, if deemed necessary or appropriate, as an alternative to committee pre-approval of services to be provided by the auditors, as required by paragraphs (ii) and (iii) above, of policies and procedures to permit such services to be pre-approved by other means, such as through establishment of guidelines or by action of a designated member or members of the committee; provided the policies and procedures are detailed as to the particular service and the committee is informed of each service and such policies and procedures do not include delegation of audit committee responsibilities, as contemplated under the Securities Exchange Act of 1934, to management; subject, in the case of (ii) through (iv), to any waivers, exceptions or exemptions that may be available under applicable law or rules.
(e) (2) None of the services provided to the registrant described in paragraphs (b)-(d) of Item 4 were approved by the audit committee pursuant to paragraph (c)(7)(i)(C) of Rule 2-01 of regulation S-X.
(f) No disclosures are required by this Item 4(f).
(g) The aggregate non-audit fees paid to the principal accountant for services rendered by the principal accountant to the registrant and the registrant’s investment adviser and any entity controlling, controlled by or under common control with the investment adviser that provides ongoing services to the registrant were $31,543 for the fiscal year ended May 31, 2015 and $199,616 for the fiscal year ended May 31, 2014.
(h) The registrant’s audit committee of the board has considered whether the provision of non-audit services that were rendered to the registrant’s investment adviser (not including any sub-adviser whose role is primarily portfolio management and is subcontracted with or overseen by another investment adviser), and any entity controlling, controlled by, or under common control with the investment adviser that provides ongoing services to the registrant that were not pre-approved pursuant to paragraph (c)(7)(ii) of Rule 2-01 of Regulation S-X is compatible with maintaining the principal accountant’s independence.
Item 5. Audit Committee of Listed Registrants. N/A
Item 6. Schedule of Investments. N/A
Item 7. Disclosure of Proxy Voting Policies and Procedures for Closed-End Management Investment Companies. N/A
Item 8. Portfolio Managers of Closed-End Management Investment Companies. N/A
Item 9. Purchases of Equity Securities by Closed-End Management Investment Company and Affiliated Purchasers. N/A
Item 10. Submission of Matters to a Vote of Security Holders.
There have been no changes to the procedures by which shareholders may recommend nominees to the Registrant's Board of Trustees that would require disclosure herein.
Item 11. Controls and Procedures.
(a) Evaluation of Disclosure Controls and Procedures. The Registrant maintains disclosure controls and procedures that are designed to ensure that information required to be disclosed in the Registrant’s filings under the Securities Exchange Act of 1934 and the Investment Company Act of 1940 is recorded, processed, summarized and reported within the periods specified in the rules and forms of the Securities and Exchange Commission. Such information is accumulated and communicated to the Registrant’s management, including its principal executive officer and principal financial officer, as appropriate, to allow timely decisions regarding required disclosure. The Registrant’s management, including the principal executive officer and the principal financial officer, recognizes that any set of controls and procedures, no matter how well designed and operated, can provide only reasonable assurance of achieving the desired control objectives.
Within 90 days prior to the filing date of this Shareholder Report on Form N-CSR, the Registrant had carried out an evaluation, under the supervision and with the participation of the Registrant’s management, including the Registrant’s principal executive officer and the Registrant’s principal financial officer, of the effectiveness of the design and operation of the Registrant’s disclosure controls and procedures. Based on such evaluation, the Registrant’s principal executive officer and principal financial officer concluded that the Registrant’s disclosure controls and procedures are effective.
(b) Changes in Internal Controls. There have been no changes in the Registrant’s internal controls or in other factors that could materially affect the internal controls over financial reporting subsequent to the date of their evaluation in connection with the preparation of this Shareholder Report on Form N-CSR.
Item 12. Exhibits.
(a) (1) Code of Ethics
(a) (2) Certifications pursuant to Section 302 of the Sarbanes-Oxley Act of 2002 of Laura F. Fergerson, Chief Executive Officer - Finance and Administration, and Gaston Gardey, Chief Financial Officer and Chief Accounting Officer
(b) Certifications pursuant to Section 906 of the Sarbanes-Oxley Act of 2002 of Laura F. Fergerson, Chief Executive Officer - Finance and Administration, and Gaston Gardey, Chief Financial Officer and Chief Accounting Officer
SIGNATURES
Pursuant to the requirements of the Securities Exchange Act of 1934 and the Investment Company Act of 1940, the registrant has duly caused this report to be signed on its behalf by the undersigned, thereunto duly authorized.
FRANKLIN TEMPLETON INTERNATIONAL TRUST
By /s/Laura F. Fergerson
Laura F. Fergerson
Chief Executive Officer –
Finance and Administration
Date July 27, 2015
Pursuant to the requirements of the Securities Exchange Act of 1934 and the Investment Company Act of 1940, this report has been signed below by the following persons on behalf of the registrant and in the capacities and on the dates indicated.
By /s/Laura F. Fergerson
Laura F. Fergerson
Chief Executive Officer –
Finance and Administration
Date July 27, 2015
By /s/Gaston Gardey
Gaston Gardey
Chief Financial Officer and
Chief Accounting Officer
Date July 27, 2015