UNITED STATES
SECURITIES AND EXCHANGE COMMISSION
Washington, DC 20549
FORM N-CSR
CERTIFIED SHAREHOLDER REPORT OF REGISTERED
MANAGEMENT INVESTMENT COMPANIES
Investment Company Act file number 811-06336
Franklin Templeton International Trust
(Exact name of registrant as specified in charter)
One Franklin Parkway, San Mateo, CA 94403-1906
(Address of principal executive offices) (Zip code)
Craig S. Tyle, One Franklin Parkway, San Mateo, CA 94403-1906
(Name and address of agent for service)
Registrant’s telephone number, including area code: 650 312-2000
Date of fiscal year end: 10/31
Date of reporting period: 10/31/17
Item 1. Reports to Stockholders.
| | | | |
 | | | | Annual Report and Shareholder Letter October 31, 2017 |
| | | |


Sign up for electronic delivery at franklintempleton.com/edelivery
Franklin Templeton Investments
Gain From Our Perspective®
At Franklin Templeton Investments, we’re dedicated to one goal: delivering exceptional asset management for our clients. By bringing together multiple, world-class investment teams in a single firm, we’re able to offer specialized expertise across styles and asset classes, all supported by the strength and resources of one of the world’s largest asset managers. This has helped us to become a trusted partner to individual and institutional investors across the globe.
Dear Shareholder:
India’s economy expanded during the 12 months ended October 31, 2017. Growth was driven by increased industrial production, though it was tempered by disruption caused by the government’s demonetization program, which recalled existing large-denominated currency notes in exchange for new currency notes, and uncertainty about the implementation of the goods and services tax (GST). Indian stocks, as measured by the MSCI India Index, rose significantly during the period amid moderate inflation, investor optimism about the GST and the government’s announcement of a budget that was generally considered to be pro-growth.
We remain committed to our long-term, disciplined investment approach as we conduct rigorous, fundamental analysis of securities with a regular emphasis on investment risk management.
We believe active, professional investment management serves investors well. We also recognize the important role of financial advisors in today’s markets and encourage investors to continue to seek their advice. Amid changing markets and economic conditions, we are confident investors with a well-diversified portfolio and a patient, long-term outlook will be well positioned for the years ahead.
In addition, Franklin India Growth Fund’s annual report includes more detail about prevailing conditions and a discussion about investment decisions during the period. Please remember all securities markets fluctuate, as do mutual fund share prices.
Sincerely,

Edward B. Jamieson
President and Chief Executive Officer –
Investment Management
Franklin Templeton International Trust
This letter reflects our analysis and opinions as of October 31, 2017, unless otherwise indicated. The information is not a complete analysis of every aspect of any market, country, industry, security or fund. Statements of fact are from sources considered reliable.
| | | | | | | | |
Not FDIC Insured | | | | | May Lose Value | | | | | No Bank Guarantee |
| | | | |
| | | |
franklintempleton.com | | Not part of the annual report | | 1 |
| | | | |
Contents | | | | |
| |
Annual Report | | | | |
| |
Franklin India Growth Fund | | | 3 | |
| |
Performance Summary | | | 7 | |
| |
Your Fund’s Expenses | | | 10 | |
| |
Financial Highlights and Statement of Investments | | | 11 | |
| |
Financial Statements | | | 16 | |
| |
Notes to Financial Statements | | | 19 | |
| |
Report of Independent Registered Public Accounting Firm | | | 26 | |
| |
Tax Information | | | 27 | |
| |
Board Members and Officers | | | 28 | |
| |
FT (Mauritius) Offshore Investments Limited | | | 32 | |
| |
Report of Independent Registered Public Accounting Firm | | | 44 | |
| |
Shareholder Information | | | 45 | |
Visit franklintempleton.com for fund updates, to access your account, or to find helpful financial planning tools.
| | | | |
| | | |
2 | | Annual Report | | franklintempleton.com |
Annual Report
Franklin India Growth Fund
This annual report for Franklin India Growth Fund covers the fiscal year ended October 31, 2017.
Your Fund’s Goal and Main Investments
The Fund seeks long-term capital appreciation by investing under normal market conditions at least 80% of its net assets in securities of “Indian companies,” which are defined as those organized under the laws of, with a principal office in, or for which the principal trading market for their securities is in India, that derive 50% or more of total revenue or profit from goods or services produced or sales made in India, or that have 50% or more of their assets in India. The Fund currently intends to invest in the securities of Indian companies by investing in shares of a wholly-owned, collective investment vehicle (the “Portfolio”), registered with and regulated by the Mauritius Financial Services Commission. Investing through the Portfolio is intended to provide the Fund with a tax-efficient method of investing indirectly in Indian companies. Unless the context otherwise requires, descriptions in this annual report of securities and transactions, and their associated risks, generally refer to investments made indirectly by the Fund through the Portfolio. See page 9 for additional details in investing through the Portfolio.
Performance Overview
For the 12 months under review, the Fund’s Class A shares delivered a +14.79% cumulative total return. In comparison, the MSCI India Index posted a +23.20% total return.1 You can find more of the Fund’s performance data in the Performance Summary beginning on page 7.
Performance data represent past performance, which does not guarantee future results. Investment return and principal value will fluctuate, and you may have a gain or loss when you sell your shares. Current performance may differ from figures shown. For most recent month-end performance, go to franklintempleton.com or call (800) 342-5236.
Portfolio Composition*
Based on Total Net Assets as of 10/31/17
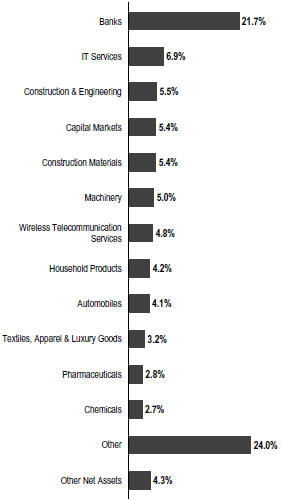
*The information shown reflects the Fund’s holdings and the Fund’s indirect holdings through the Portfolio.
1. Source: Morningstar.
The index is unmanaged and includes reinvestment of any income or distributions. It does not reflect any fees, expenses or sales charges. One cannot invest directly in an index, and an index is not representative of the Fund’s portfolio.
The dollar value, number of shares or principal amount, and names of all portfolio holdings are listed in the Fund’s Statement of Investments (SOI). The SOI begins on page 15.
| | | | |
| | | |
franklintempleton.com | | Annual Report | | 3 |
FRANKLIN INDIA GROWTH FUND
Economic and Market Overview
The Indian economy, as measured by gross domestic product (GDP), grew 7.1% for fiscal-year 2017 (ended March 31), slower than the fiscal-year 2016 growth rate of 8.0%.2 This slowdown was largely due to the disruption caused by the government’s demonetization program, which recalled existing large-denominated currency notes in exchange for new currency notes. India moved to a “one nation, one tax” structure on July 1, 2017, and the uncertainty surrounding the implementation of the goods and services tax (GST) negatively impacted overall economic growth. The GDP grew 5.7% in the fiscal first-quarter 2018 (ended June 30, 2017), compared to the prior-year period, the slowest pace in three years.2 Manufacturers cut production and dealers offered discounts on items such as cars. As a result, manufacturing growth slowed significantly the fiscal second-quarter compared to the preceding quarter, while mining activity contracted. In October, the Reserve Bank of India also lowered its GDP growth forecast for fiscal-year 2018, due to issues with GST implementation and lower winter crop output estimates. Annual retail inflation held steady in the latter part of the reporting period, while industrial production saw robust annualized growth, which was driven by restocking of manufactured items as the initial impact of GST implementation began to fade and the trade deficit widened.
India’s equity markets experienced heightened volatility in the first three months of the reporting period due to investor concerns about weak global trade growth, policy normalization by the US Federal Reserve and the potential for protectionist trade policy by the new US presidential administration. Further hurting equity markets was the Indian government’s demonetization program, which led to a liquidity crunch in ensuing weeks.
However, equity markets generally trended higher from the start of 2017 through period-end, amid encouraging corporate results and the government’s announcement of a union budget that market participants considered pro-growth. Better domestic liquidity, moderate inflation, GST implementation and positive global growth sentiments pushed the Indian domestic equity markets to all-time highs. In a major reform, the Indian government announced a recapitalization of public sector banks in October, which it plans to finance by issuing bonds and either through budget allocation or the banks’ own fund-raising
2. Source: Central Statistics Office, India.
efforts. This capital infusion seeks to clean up banks’ books and allow banks to lend more. The initiative’s total amount is
| | | | |
| Top 10 Holdings* | | | |
| 10/31/17 | | | |
| |
Company Sector/Industry | | % of Total
Net Assets | |
HDFC Bank Ltd. Banks | | | 5.0% | |
Hindustan Unilever Ltd. Household Products | | | 4.2% | |
Tata Motors Ltd. Automobiles | | | 4.1% | |
YesBankLtd. Banks | | | 3.9% | |
Kotak Mahindra Bank Ltd. Banks | | | 3.8% | |
StateBankof India Banks | | | 3.7% | |
UltraTech Cement Ltd. Construction Materials | | | 3.5% | |
Infosys Ltd. IT Services | | | 3.4% | |
Axis Bank Ltd. Banks | | | 3.3% | |
Larsen & Toubro Ltd. Construction & Engineering | | | 3.3% | |
| *The information shown reflects the Fund’s indirect holdings through the Portfolio. | | | | |
equal to roughly 1.3% of the country’s GDP, which could potentially spur economic activity. Investors were encouraged by positive economic indicators and the government’s announcements of public sector banks’ recapitalization and a road development project, which could improve job creation. The MSCI India Index generated a +23.20% total return during the period under consideration.
Investment Strategy
We are research-driven, fundamental investors pursuing a growth strategy. As bottom-up investors focusing primarily on individual securities, we seek to invest in companies whose current market price, in our opinion, does not reflect future growth prospects. We look for companies that have identifiable drivers of future earnings growth and that present, in our opinion, the best trade-off between potential earnings growth, business and financial risk, and valuation. Our philosophy includes favoring companies that have competitive advantages through leading-edge products, intellectual property, product
| | | | |
4 | | Annual Report | | franklintempleton.com |
FRANKLIN INDIA GROWTH FUND
positioning, unique market niches, brand identity, solid management teams, strong balance sheets, above-average or rising margins, and strong returns on capital invested in the business. In choosing equity investments, we also consider such factors as the company’s financial strength, management’s expertise, the company’s growth potential within the industry, and the industry’s growth potential.
Manager’s Discussion
The information technology (IT) sector was a major contributor to relative performance due to stock selection and an underweighted allocation.3 Within information technology, our underweighted position in Infosys was a key contributor. The IT sector performed poorly during the past three quarters, saddled by headwinds from a stringent visa policy, restrictive hiring measures imposed by the US and weak external demand. Ongoing corporate turmoil within Infosys leading to the resignation of its chief executive officer and a few other top executives as well as rising attrition and steady guidance for fiscal year 2018 further dragged on the stock’s price.
Other significant contributors to relative performance were off-benchmark positions within the financials sector.4 Motilal Oswal Financial Services (MOFSL) has a diversified revenue base with contributions from brokerage, asset and wealth, housing finance, and fund-based businesses. Positive market sentiment fueling the Indian equity market rally as well as strong operating results posted by MOFSL boosted the stock price. IndusInd Bank entered into an exclusivity arrangement with Bharat Financial Inclusion (BHAFIN)5 to consider a merger and acquisition. A possible merger can lead to significant rise in retail share for the bank and can bring along a strong sales force network and supporting technology infrastructure. Other positive synergies from the proposed merger with BHAFIN include a diversified loan book, stable margin outlook, consistent asset quality, improving current and savings account ratio, and a healthy growth potential.
Although stock selection in the energy sector contributed to relative performance, our underweighting in the sector led to overall sector underperformance.6 For instance, our underweighting in Reliance Industries hurt relative results.7 Strong pickup in gross refining margins in the refining segment and record margin in the petrochemical business boosted net
profits growth for the company during the year. Its retail segment also reported strong revenue growth and margin improvement, leading to a surge in the stock price during the period under review. Having made heavy investments in a telecommunications venture, which in our view is a capital misallocation, Reliance could potentially eye acquisition of a greater market share over profitability in the near term. This action along with capacity expansion could possibly drag on the company’s return ratios.
Other key detractors included Amara Raja Batteries7 and Tata Motors. Amara Raja Batteries experienced robust revenue growth due to strong volume growth. However, profit margins were impacted by the demonetization-led slowdown in the two-wheeler segment. Tata Motors reported weak performance due to auto industry regulatory actions materially influencing auto volumes over the past few quarters. Additionally, lower wholesale volumes, higher competitive incentive levels in the market to boost sales, and a significant contraction in the medium and heavy truck segment in its Indian business hampered the stock. We continue to believe that strength in the underlying business continues to be satisfactory.
It is important to recognize the effect of currency movements on the Fund’s performance. In general, if the value of the US dollar goes up compared with a foreign currency, an investment traded in that foreign currency will go down in value because it will be worth fewer US dollars. This can have a negative effect on Fund performance. Conversely, when the US dollar weakens in relation to a foreign currency, an investment traded in that foreign currency will increase in value, which can contribute to Fund performance. For the 12 months ended October 31, 2017, the US dollar declined in value relative to the Indian rupee. As a result, the Fund’s performance was positively affected by the portfolio’s investment predominantly in securities denominated in the Indian rupee. However, one cannot expect the same result in future periods.
.
3. The IT sector comprises IT services in the SOI.
4. The financials sector comprises banks, capital markets, consumer finance, insurance, and thrifts and mortgage finance in the SOI.
5. Not a Fund holding.
6. The energy sector comprises oil, gas and consumable fuels in the SOI.
7. Not held at period-end.
See www.franklintempletondatasources.com for additional data provider information
| | | | | | |
franklintempleton.com | | Annual Report | | | 5 | |
FRANKLIN INDIA GROWTH FUND
Thank you for your continued participation in Franklin India Growth Fund. We look forward to serving your future investment needs.
| | |
 | | 
Sukumar Rajah |
| |
 | | 
Stephen H. Dover, CFA |
| |
 | | 
Purav A. Jhaveri, CFA, FRM |
| |
| | Portfolio Management Team |
The foregoing information reflects our analysis, opinions and portfolio holdings as of October 31, 2017, the end of the reporting period. The way we implement our main investment strategies and the resulting portfolio holdings may change depending on factors such as market and economic conditions. These opinions may not be relied upon as investment advice or an offer for a particular security. The information is not a complete analysis of every aspect of any market, country, industry, security or the Fund. Statements of fact are from sources considered reliable, but the investment manager makes no representation or warranty as to their completeness or accuracy. Although historical performance is no guarantee of future results, these insights may help you understand our investment management philosophy.
CFA® is a trademark owned by CFA Institute.
| | | | |
| 6 | | Annual Report | | franklintempleton.com |
FRANKLIN INDIA GROWTH FUND
Performance Summary as of October 31, 2017
The performance table and graphs do not reflect any taxes that a shareholder would pay on Fund dividends, capital gain distributions, if any, or any realized gains on the sale of Fund shares. Total return reflects reinvestment of the Fund’s dividends and capital gain distributions, if any, and any unrealized gains or losses. Your dividend income will vary depending on dividends or interest paid by securities in the Fund’s portfolio, adjusted for operating expenses of each class. Capital gain distributions are net profits realized from the sale of portfolio securities.
Performance as of 10/31/171
Cumulative total return excludes sales charges. Average annual total return includes maximum sales charges. Sales charges will vary depending on the size of the investment and the class of share purchased. The maximum is 5.75% and the minimum is 0%. Class A: 5.75% maximum initial sales charge; Advisor Class: no sales charges. For other share classes, visit franklintempleton.com.
| | | | |
| Share Class | | Cumulative Total Return2 | | Average Annual
Total Return3 |
A | | | | |
1-Year | | +14.79% | | +8.23% |
5-Year | | +78.93% | | +11.02% |
Since Inception (1/31/08) | | +64.07% | | +4.57% |
| | |
Advisor | | | | |
1-Year | | +14.97% | | +14.97% |
5-Year | | +81.26% | | +12.63% |
Since Inception (1/31/08) | | +68.51% | | +5.50% |
Performance data represent past performance, which does not guarantee future results. Investment return and principal value will fluctuate, and you may have a gain or loss when you sell your shares. Current performance may differ from figures shown. For most recent month-end performance, go to franklintempleton.com or call (800) 342-5236.
| | | | | | |
franklintempleton.com | | Annual Report | | | 7 | |
FRANKLIN INDIA GROWTH FUND
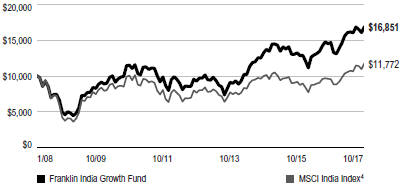
PERFORMANCE SUMMARY
Total Return Index Comparison for a Hypothetical $10,000 Investment1
Total return represents the change in value of an investment over the periods shown. It includes any applicable maximum sales charge, Fund expenses, account fees and reinvested distributions. The unmanaged index includes reinvestment of any income or distributions. It differs from the Fund in composition and does not pay management fees or expenses. One cannot invest directly in an index.
Class A (1/31/08–10/31/17)
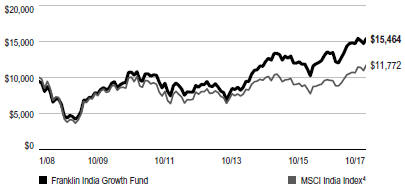
Advisor Class (1/31/08–10/31/17)
| | | | |
8 | | Annual Report | | franklintempleton.com |
FRANKLIN INDIA GROWTH FUND
PERFORMANCE SUMMARY
Total Annual Operating Expenses5
| | | | | | | | |
| Share Class | | With Waiver | | | Without Waiver | |
A | | | 1.65 | % | | | 2.14% | |
Advisor | | | 1.40 | % | | | 1.89% | |
Each class of shares is available to certain eligible investors and has different annual fees and expenses, as described in the prospectus.
All investments involve risks, including possible loss of principal. Special risks are associated with foreign investing, including currency fluctuations, economic instability and political developments. Investments in developing markets involve heightened risks related to the same factors, in addition to risks associated with these companies’ smaller size, lesser liquidity and the potential lack of established legal, political, business and social frameworks to support securities markets in the countries in which they operate. The Fund relies on the income tax treaty between India and the Republic of Mauritius for relief from certain Indian taxes. Treaty renegotiation, legislative changes or changes in the requirements to establish a residency in Mauritius may result in higher taxes and lower returns for the Fund. The Portfolio has received a Tax Residency Certificate from the Mauritius Revenue Authority, which is expected to be renewed on an annual basis. Additionally, the governments of India and Mauritius recently signed a protocol amending the Treaty (Protocol). The Protocol gives India the right to tax short-term capital gains which arise from the alienation of shares of an Indian resident company acquired by a Mauritian resident. No assurance can be given that the terms of the Treaty will not be further renegotiated or subject to a different interpretation in the future or that the Portfolio will continue to be entitled to take advantage of the Treaty. The government of India will impose certain General Anti-Avoidance Rules (GAAR) under the Indian Income Tax Act that could potentially impact the application of the Treaty to the Portfolio. GAAR became effective from the financial year beginning April 1, 2017. Because the Fund invests its assets primarily in companies in a specific country or region, the Fund may also experience greater volatility than a fund that is more broadly diversified geographically. The Fund is designed for the aggressive portion of a well-diversified portfolio. The Fund is actively managed but there is no guarantee that the manager’s investment decisions will produce the desired results. The Fund’s prospectus also includes a description of the main investment risks.
1. The Fund has an expense reduction contractually guaranteed through 2/28/18. Fund investment results reflect the expense reduction; without this reduction, the results would have been lower.
2. Cumulative total return represents the change in value of an investment over the periods indicated.
3. Average annual total return represents the average annual change in value of an investment over the periods indicated. Return for less than one year, if any, has not been annualized.
4. Source: Morningstar. The MSCI India Index is a free float-adjusted, market capitalization-weighted index designed to measure equity market performance in India.
5. Figures are as stated in the Fund’s current prospectus and may differ from the expense ratios disclosed in the Your Fund’s Expenses and Financial Highlights sections in this report. In periods of market volatility, assets may decline significantly, causing total annual Fund operating expenses to become higher than the figures shown.
See www.franklintempletondatasources.com for additional data provider information.
| | | | | | |
franklintempleton.com | | Annual Report | | | 9 | |
FRANKLIN INDIA GROWTH FUND
Your Fund’s Expenses
As a Fund shareholder, you can incur two types of costs: (1) transaction costs, including sales charges (loads) on Fund purchases and redemptions; and (2) ongoing Fund costs, including management fees, distribution and service (12b-1) fees, and other Fund expenses. All mutual funds have ongoing costs, sometimes referred to as operating expenses. The table below shows ongoing costs of investing in the Fund and can help you understand these costs and compare them with those of other mutual funds. The table assumes a $1,000 investment held for the six months indicated.
Actual Fund Expenses
The table below provides information about actual account values and actual expenses in the columns under the heading “Actual.” In these columns the Fund’s actual return, which includes the effect of Fund expenses, is used to calculate the “Ending Account Value” for each class of shares. You can estimate the expenses you paid during the period by following these steps (of course, your account value and expenses will differ from those in this illustration): Divide your account value by $1,000 (if your account had an $8,600 value, then $8,600 ÷ $1,000 = 8.6). Then multiply the result by the number in the row for your class of shares under the headings “Actual” and “Expenses Paid During Period” (if Actual Expenses Paid During Period were $7.50, then 8.6 x $7.50 = $64.50). In this illustration, the actual expenses paid this period are $64.50.
Hypothetical Example for Comparison with Other Funds
Under the heading “Hypothetical” in the table, information is provided about hypothetical account values and hypothetical expenses based on the Fund’s actual expense ratio and an assumed rate of return of 5% per year before expenses, which is not the Fund’s actual return. This information may not be used to estimate the actual ending account balance or expenses you paid for the period, but it can help you compare ongoing costs of investing in the Fund with those of other funds. To do so, compare this 5% hypothetical example for the class of shares you hold with the 5% hypothetical examples that appear in the shareholder reports of other funds.
Please note that expenses shown in the table are meant to highlight ongoing costs and do not reflect any transactional costs. Therefore, information under the heading “Hypothetical” is useful in comparing ongoing costs only, and will not help you compare total costs of owning different funds. In addition, if transactional costs were included, your total costs would have been higher.
| | | | | | | | | | | | | | | | | | |
| | | | | | | Actual (actual return after expenses) | | | | Hypothetical (5% annual return before expenses) | | | | |
Share Class | | Beginning
Account
Value 5/1/17 | | | | Ending
Account
Value 10/31/17 | | Expenses Paid During
Period 5/1/17–10/31/171,2 | | | | Ending
Account
Value 10/31/17 | | Expenses Paid During
Period 5/1/17–10/31/171,2 | | | | Net
Annualized
Expense
Ratio2 |
| A | | $1,000 | | | | $1,048.60 | | $ 8.52 | | | | $1,016.89 | | $ 8.39 | | | | 1.65% |
| C | | $1,000 | | | | $1,045.30 | | $12.37 | | | | $1,013.11 | | $12.18 | | | | 2.40% |
| R6 | | $1,000 | | | | $1,052.60 | | $ 6.21 | | | | $1,019.16 | | $ 6.11 | | | | 1.20% |
| Advisor | | $1,000 | | | | $1,050.20 | | $ 7.23 | | | | $1,018.15 | | $ 7.12 | | | | 1.40% |
1. Expenses are equal to the annualized expense ratio for the six-month period as indicated above—in the far right column—multiplied by the simple average account value over the period indicated, and then multiplied by 184/365 to reflect the one-half year period.
2. Reflects expenses after fee waivers and expense reimbursements. Does not include acquired fund fees and expenses.
| | | | |
10 | | Annual Report | | franklintempleton.com |
FRANKLIN TEMPLETON INTERNATIONAL TRUST
Financial Highlights
Franklin India Growth Fund
| | | | | | | | | | | | | | | | | | | | |
| | | Year Ended October 31, | |
| | | 2017 | | | 2016 | | | 2015 | | | 2014 | | | 2013 | |
| | | | | |
Class A | | | | | | | | | | | | | | | | | | | | |
| | | | | |
Per share operating performancea (for a share outstanding throughout the year) | | | | | | | | | | | | | | | | | | | | |
| | | | | |
Net asset value, beginning of year | | | $ 13.52 | | | | $12.23 | | | | $12.37 | | | | $8.55 | | | | $8.73 | |
| | | | |
| | | | | |
Income from investment operationsb: | | | | | | | | | | | | | | | | | | | | |
| | | | | |
Net investment income (loss)c | | | (0.11 | ) | | | 0.02 | d | | | (0.10 | ) | | | 0.02 | e | | | (0.01) | |
| | | | | |
Net realized and unrealized gains (losses) | | | 2.11 | | | | 1.27 | | | | 0.04 | | | | 3.80 | | | | (0.17) | |
| | | | |
| | | | | |
Total from investment operations | | | 2.00 | | | | 1.29 | | | | (0.06 | ) | | | 3.82 | | | | (0.18) | |
| | | | |
| | | | | |
Less distributions from net investment income | | | — | | | | — | | | | (0.08 | ) | | | — | | | | — | |
| | | | |
| | | | | |
Net asset value, end of year. | | | $ 15.52 | | | | $13.52 | | | | $12.23 | | | | $12.37 | | | | $8.55 | |
| | | | |
| | | | | |
Total returnf | | | 14.79% | | | | 10.55% | | | | (0.49)% | | | | 44.68% | | | | (2.06)% | |
| | | | | |
| Ratios to average net assetsa | | | | | | | | | | | | | | | | | | | | |
| | | | | |
Expenses before waiver and payments by affiliates | | | 2.15% | | | | 2.14% | | | | 2.08% | | | | 2.25% | | | | 2.26% | |
| | | | | |
Expenses net of waiver and payments by affiliates | | | 1.65%g | | | | 1.65% | | | | 1.69% | | | | 1.65% | | | | 1.68% | |
| | | | | |
Net investment income (loss) | | | (0.78)% | | | | 0.15%d | | | | (0.77)% | | | | 0.22%e | | | | (0.07)% | |
| | | | | |
| Supplemental data | | | | | | | | | | | | | | | | | | | | |
| | | | | |
Net assets, end of year (000’s) | | | $78,079 | | | | $61,347 | | | | $66,035 | | | | $53,230 | | | | $25,025 | |
| | | | | |
Portfolio turnover rateh | | | 39.65% | | | | 21.54% | | | | 46.88% | | | | 35.48% | | | | 16.95% | |
aThe per share amounts and ratios include income and expenses of the Portfolio.
bThe amount shown for a share outstanding throughout the period may not correlate with the Statement of Operations for the period due to the timing of sales and repurchases of the Fund’s shares in relation to income earned and/or fluctuating fair value of the investments of the Fund.
cBased on average daily shares outstanding.
dNet investment income (loss) per share includes approximately $0.09 per share related to a corporate action in connection with certain Fund holdings. Excluding this amount, the ratio of net investment income to average net assets would have been (0.61)%.
eNet investment income per share includes approximately $0.02 per share related to income received in the form of special dividends in connection with certain Fund holdings. Excluding this amount, the ratio of net investment income to average net assets would have been 0.04%.
fTotal return does not reflect sales commissions or contingent deferred sales charges, if applicable.
gBenefit of expense reduction rounds to less than 0.01%.
hIncludes the Portfolio’s rate of turnover.
| | | | | | |
franklintempleton.com | | The accompanying notes are an integral part of these financial statements. | Annual Report | | | 11 | |
FRANKLIN TEMPLETON INTERNATIONAL TRUST
FINANCIAL HIGHLIGHTS
Franklin India Growth Fund (continued)
| | | | | | | | | | | | | | | | | | | | |
| | | Year Ended October 31, | |
| | | 2017 | | | 2016 | | | 2015 | | | 2014 | | | 2013 | |
| | | | | |
Class C | | | | | | | | | | | | | | | | | | | | |
| | | | | |
| Per share operating performancea | | | | | | | | | | | | | | | | | | | | |
(for a share outstanding throughout the year) | | | | | | | | | | | | | | | | | | | | |
| | | | | |
Net asset value, beginning of year | | | $ 12.77 | | | | $ 11.64 | | | | $ 11.81 | | | | $ 8.22 | | | | $ 8.45 | |
| | | | |
| | | | | |
Income from investment operationsb: | | | | | | | | | | | | | | | | | | | | |
| | | | | |
Net investment income (loss)c | | | (0.20 | ) | | | (0.07 | )d | | | (0.18 | ) | | | (0.05 | )e | | | (0.07 | ) |
| | | | | |
Net realized and unrealized gains (losses) | | | 1.97 | | | | 1.20 | | | | 0.05 | | | | 3.64 | | | | (0.16 | ) |
| | | | |
| | | | | |
Total from investment operations | | | 1.77 | | | | 1.13 | | | | (0.13 | ) | | | 3.59 | | | | (0.23 | ) |
| | | | |
| | | | | |
Less distributions from net investment income | | | — | | | | — | | | | (0.04 | ) | | | — | | | | — | |
| | | | |
| | | | | |
Net asset value, end of year. | | | $ 14.54 | | | | $ 12.77 | | | | $ 11.64 | | | | $ 11.81 | | | | $ 8.22 | |
| | | | |
| | | | | |
Total returnf | | | 13.86% | | | | 9.71% | | | | (1.14)% | | | | 43.67% | | | | (2.72)% | |
| | | | | |
| Ratios to average net assetsa | | | | | | | | | | | | | | | | | | | | |
| | | | | |
Expenses before waiver and payments by affiliates | | | 2.90% | | | | 2.89% | | | | 2.79% | | | | 2.95% | | | | 2.98% | |
| | | | | |
Expenses net of waiver and payments by affiliates | | | 2.40% | g | | | 2.40% | | | | 2.40% | | | | 2.35% | | | | 2.40% | |
| | | | | |
Net investment income (loss) | | | (1.53)% | | | | (0.60)% | d | | | (1.48)% | | | | (0.48)% | e | | | (0.79)% | |
| | | | | |
| Supplemental data | | | | | | | | | | | | | | | | | | | | |
| | | | | |
Net assets, end of year (000’s) | | | $24,039 | | | | $17,291 | | | | $17,754 | | | | $11,655 | | | | $6,078 | |
| | | | | |
Portfolio turnover rateh | | | 39.65% | | | | 21.54% | | | | 46.88% | | | | 35.48% | | | | 16.95% | |
aThe per share amounts and ratios include income and expenses of the Portfolio.
bThe amount shown for a share outstanding throughout the period may not correlate with the Statement of Operations for the period due to the timing of sales and repurchases of the Fund’s shares in relation to income earned and/or fluctuating fair value of the investments of the Fund.
cBased on average daily shares outstanding.
dNet investment income (loss) per share includes approximately $0.09 per share related to a corporate action in connection with certain Fund holdings. Excluding this amount, the ratio of net investment income to average net assets would have been (1.36)%.
eNet investment income (loss) per share includes approximately $0.02 per share related to income received in the form of special dividends in connection with certain Fund holdings. Excluding this amount, the ratio of net investment income to average net assets would have been (0.66)%.
fTotal return does not reflect sales commissions or contingent deferred sales charges, if applicable.
gBenefit of expense reduction rounds to less than 0.01%.
hIncludes the Portfolio’s rate of turnover.
| | | | |
12 | | Annual Report | The accompanying notes are an integral part of these financial statements. | | franklintempleton.com |
FRANKLIN TEMPLETON INTERNATIONAL TRUST
FINANCIAL HIGHLIGHTS
Franklin India Growth Fund (continued)
| | | | | | | | | | | | | | | | | | | | |
| | | Year Ended October 31, | |
| | | 2017 | | | 2016 | | | 2015 | | | 2014 | | | 2013a | |
| | | | | |
Class R6 | | | | | | | | | | | | | | | | | | | | |
| | | | | |
| Per share operating performanceb | | | | | | | | | | | | | | | | | | | | |
(for a share outstanding throughout the year) | | | | | | | | | | | | | | | | | | | | |
| | | | | |
Net asset value, beginning of year | | | $13.89 | | | | $12.51 | | | | $12.63 | | | | $8.68 | | | | $9.35 | |
| | | | |
| | | | | |
Income from investment operationsc: | | | | | | | | | | | | | | | | | | | | |
| | | | | |
Net investment income (loss)d | | | (0.05 | ) | | | 0.07 | e | | | (0.04 | ) | | | 0.07 | f | | | 0.02 | |
| | | | | |
Net realized and unrealized gains (losses) | | | 2.08 | | | | 1.31 | | | | 0.03 | | | | 3.88 | | | | (0.69 | ) |
| | | | |
| | | | | |
Total from investment operations | | | 2.03 | | | | 1.38 | | | | (0.01 | ) | | | 3.95 | | | | (0.67 | ) |
| | | | |
| | | | | |
Less distributions from net investment income | | | — | | | | — | | | | (0.11 | ) | | | — | | | | — | |
| | | | |
| | | | | |
Net asset value, end of year. | | | $15.92 | | | | $13.89 | | | | $12.51 | | | | $12.63 | | | | $8.68 | |
| | | | |
| | | | | |
Total returng | | | 14.61% | | | | 11.03% | | | | (0.07)% | | | | 45.51% | | | | (7.17)% | |
| | | | | |
| Ratios to average net assetsb,h | | | | | | | | | | | | | | | | | | | | |
| | | | | |
Expenses before waiver and payments by affiliates | | | 1.66% | | | | 1.67% | | | | 1.63% | | | | 1.80% | | | | 1.78% | |
| | | | | |
Expenses net of waiver and payments by affiliates | | | 1.21%i | | | | 1.24% | | | | 1.24% | | | | 1.20% | | | | 1.20% | |
| | | | | |
Net investment income (loss) | | | (0.34)% | | | | 0.56% | e | | | (0.32)% | | | | 0.67% | f | | | 0.41% | |
| | | | | |
| Supplemental data | | | | | | | | | | | | | | | | | | | | |
| | | | | |
Net assets, end of year (000’s) | | | $85 | | | | $12,592 | | | | $12,102 | | | | $740 | | | | $459 | |
| | | | | |
Portfolio turnover ratej | | | 39.65% | | | | 21.54% | | | | 46.88% | | | | 35.48% | | | | 16.95% | |
aFor the period May 1, 2013 (effective date) to October 31, 2013.
bThe per share amounts and ratios include income and expenses of the Portfolio.
cThe amount shown for a share outstanding throughout the period may not correlate with the Statement of Operations for the period due to the timing of sales and repurchases of the Fund’s shares in relation to income earned and/or fluctuating fair value of the investments of the Fund.
dBased on average daily shares outstanding.
eNet investment income (loss) per share includes approximately $0.09 per share related to a corporate action in connection with certain Fund holdings. Excluding this amount, the ratio of net investment income to average net assets would have been (0.20)%.
fNet investment income per share includes approximately $0.02 per share related to income received in the form of special dividends in connection with certain Fund holdings. Excluding this amount, the ratio of net investment income to average net assets would have been 0.49%.
gTotal return is not annualized for periods less than one year.
hRatios are annualized for periods less than one year.
iBenefit of expense reduction rounds to less than 0.01%.
jIncludes the Portfolio’s rate of turnover.
| | | | | | |
franklintempleton.com | | The accompanying notes are an integral part of these financial statements. | Annual Report | | | 13 | |
FRANKLIN TEMPLETON INTERNATIONAL TRUST
FINANCIAL HIGHLIGHTS
Franklin India Growth Fund (continued)
| | | | | | | | | | | | | | | | | | | | |
| | | Year Ended October 31, | |
| | | 2017 | | | 2016 | | | 2015 | | | 2014 | | | 2013 | |
| | | | | |
Advisor Class | | | | | | | | | | | | | | | | | | | | |
| | | | | |
| Per share operating performancea | | | | | | | | | | | | | | | | | | | | |
(for a share outstanding throughout the year) | | | | | | | | | | | | | | | | | | | | |
| | | | | |
Net asset value, beginning of year | | | $13.83 | | | | $12.48 | | | | $12.60 | | | | $8.68 | | | | $8.83 | |
| | | | |
| | | | | |
Income from investment operationsb: | | | | | | | | | | | | | | | | | | | | |
| | | | | |
Net investment income (loss)c | | | (0.08 | ) | | | 0.05 | d | | | (0.06 | ) | | | 0.05 | e | | | 0.02 | |
| | | | | |
Net realized and unrealized gains (losses) | | | 2.15 | | | | 1.30 | | | | 0.04 | | | | 3.87 | | | | (0.17 | ) |
| | | | |
| | | | | |
Total from investment operations | | | 2.07 | | | | 1.35 | | | | (0.02 | ) | | | 3.92 | | | | (0.15 | ) |
| | | | |
| | | | | |
Less distributions from net investment income | | | — | | | | — | | | | (0.10 | ) | | | — | | | | — | |
| | | | |
| | | | | |
Net asset value, end of year. | | | $15.90 | | | | $13.83 | | | | $12.48 | | | | $12.60 | | | | $8.68 | |
| | | | |
| | | | | |
Total return | | | 14.97% | | | | 10.82% | | | | (0.11)% | | | | 45.16% | | | | (1.70)% | |
| | | | | |
| Ratios to average net assetsa | | | | | | | | | | | | | | | | | | | | |
| | | | | |
Expenses before waiver and payments by affiliates | | | 1.90% | | | | 1.89% | | | | 1.79% | | | | 1.95% | | | | 1.98% | |
| | | | | |
Expenses net of waiver and payments by affiliates | | | 1.40%f | | | | 1.40% | | | | 1.40% | | | | 1.35% | | | | 1.40% | |
| | | | | |
Net investment income (loss) | | | (0.53)% | | | | 0.40% | d | | | (0.48)% | | | | 0.52% | e | | | 0.21% | |
| | | | | |
| Supplemental data | | | | | | | | | | | | | | | | | | | | |
| | | | | |
Net assets, end of year (000’s) | | | $51,499 | | | | $24,723 | | | | $34,113 | | | | $41,740 | | | | $28,340 | |
| | | | | |
Portfolio turnover rateg | | | 39.65% | | | | 21.54% | | | | 46.88% | | | | 35.48% | | | | 16.95% | |
aThe per share amounts and ratios include income and expenses of the Portfolio.
bThe amount shown for a share outstanding throughout the period may not correlate with the Statement of Operations for the period due to the timing of sales and repurchases of the Fund’s shares in relation to income earned and/or fluctuating fair value of the investments of the Fund.
cBased on average daily shares outstanding.
dNet investment income (loss) per share includes approximately $0.09 per share related to a corporate action in connection with certain Fund holdings. Excluding this amount, the ratio of net investment income to average net assets would have been (0.36)%.
eNet investment income per share includes approximately $0.02 per share related to income received in the form of special dividends in connection with certain Fund holdings. Excluding this amount, the ratio of net investment income to average net assets would have been 0.34%.
f Benefit of expense reduction rounds to less than 0.01%.
gIncludes the Portfolio’s rate of turnover.
| | | | |
14 | | Annual Report | The accompanying notes are an integral part of these financial statements. | | franklintempleton.com |
FRANKLIN TEMPLETON INTERNATIONAL TRUST
Statement of Investments, October 31, 2017
Franklin India Growth Fund
| | | | | | | | |
| | | Shares | | | Value | |
Common Stocks 2.6% | | | | | | | | |
| Internet & Direct Marketing Retail 1.1% | | | | | | | | |
aMakeMyTrip Ltd. (India) | | | 64,200 | | | $ | 1,752,660 | |
| | | | | | | | |
IT Services 1.5% | | | | | | | | |
Cognizant Technology Solutions Corp., A (United States) | | | 30,300 | | | | 2,292,801 | |
| | | | | | | | |
Total Common Stocks (Cost $3,283,957) | | | | | | | 4,045,461 | |
| | | | | | | | |
| | |
Management Investment Companies (Cost $85,200,226) 96.9% | | | | | | | | |
Diversified Financial Services 96.9% | | | | | | | | |
a,bFT (Mauritius) Offshore Investments Ltd. (India) | | | 8,579,992 | | | | 148,913,590 | |
| | | | | | | | |
Total Investments (Cost $88,484,183) 99.5% | | | | | | | 152,959,051 | |
Other Assets, less Liabilities 0.5% | | | | | | | 742,914 | |
| | | | | | | | |
Net Assets 100.0% | | | | | | $ | 153,701,965 | |
| | | | | | | | |
aNon-income producing.
bThe dollar value, number of shares or principal amount, and names of all Portfolio holdings are listed in the Portfolio’s SOI, beginning on page 33.
| | | | | | |
franklintempleton.com | | The accompanying notes are an integral part of these financial statements. | Annual Report | | | 15 | |
FRANKLIN TEMPLETON INTERNATIONAL TRUST
Financial Statements
Statement of Assets and Liabilities
October 31, 2017
Franklin India Growth Fund
| | | | |
Assets: | | | | |
Investments in securities: | | | | |
Cost - Unaffiliated issuers | | | $ 3,283,957 | |
| | | | |
Value - Unaffiliated issuers | | | $ 4,045,461 | |
Investment in FT (Mauritius) Offshore Investments Limited (Note 1) | | | 148,913,590 | |
Cash | | | 659,087 | |
Receivables: | | | | |
Investment securities sold | | | 103,987 | |
Capital shares sold | | | 378,386 | |
Affiliates | | | 38,005 | |
Other assets | | | 30 | |
| | | | |
Total assets | | | 154,138,546 | |
| | | | |
Liabilities: | | | | |
Payables: | | | | |
Investment securities purchased | | | 85,403 | |
Capital shares redeemed | | | 239,288 | |
Distribution fees | | | 36,078 | |
Transfer agent fees | | | 56,374 | |
Accrued expenses and other liabilities | | | 19,438 | |
| | | | |
Total liabilities | | | 436,581 | |
| | | | |
Net assets, at value | | | $153,701,965 | |
| | | | |
Net assets consist of: | | | | |
Paid-in capital | | | $107,849,688 | |
Undistributed net investment income (loss) | | | (546,156 | ) |
Net unrealized appreciation (depreciation) | | | 42,398,197 | |
Accumulated net realized gain (loss) | | | 4,000,236 | |
| | | | |
Net assets, at value | | | $153,701,965 | |
| | | | |
| Class A: | | | | |
Net assets, at value | | | $ 78,078,540 | |
| | | | |
Shares outstanding | | | 5,031,011 | |
| | | | |
Net asset value per sharea | | | $15.52 | |
| | | | |
Maximum offering price per share (net asset value per share ÷ 94.25%) | | | $16.47 | |
| | | | |
| Class C: | | | | |
Net assets, at value | | | $ 24,038,880 | |
| | | | |
Shares outstanding | | | 1,653,433 | |
| | | | |
Net asset value and maximum offering price per sharea | | | $14.54 | |
| | | | |
| Class R6: | | | | |
Net assets, at value | | | $ 85,324 | |
| | | | |
Shares outstanding | | | 5,358 | |
| | | | |
Net asset value and maximum offering price per share | | | $15.92 | |
| | | | |
| Advisor Class: | | | | |
Net assets, at value | | | $ 51,499,221 | |
| | | | |
Shares outstanding | | | 3,238,621 | |
| | | | |
Net asset value and maximum offering price per share | | | $15.90 | |
| | | | |
aRedemption price is equal to net asset value less contingent deferred sales charges, if applicable.
| | | | |
16 | | Annual Report | The accompanying notes are an integral part of these financial statements. | | franklintempleton.com |
FRANKLIN TEMPLETON INTERNATIONAL TRUST
FINANCIAL STATEMENTS
Statement of Operations
for the year ended October 31, 2017
Franklin India Growth Fund
| | | | |
Net investment income allocated from FT (Mauritius) Offshore Investments Limited: | | | | |
Dividends:a | | | | |
Unaffiliated issuers. | | $ | 1,191,146 | |
Expenses | | | (1,516,702 | ) |
| | | | |
Net investment income allocated from FT (Mauritius) Offshore Investments Limited | | | (325,556 | ) |
| | | | |
Expenses: | | | | |
Management fees (Note 3a) | | | 518,875 | |
Distribution fees: (Note 3c) | | | | |
Class A | | | 171,093 | |
Class C | | | 195,276 | |
Transfer agent fees: (Note 3e) | | | | |
Class A | | | 162,245 | |
Class C | | | 46,289 | |
Class R6 | | | 530 | |
Advisor Class | | | 90,076 | |
Custodian fees (Note 4) | | | 131 | |
Reports to shareholders | | | 36,541 | |
Registration and filing fees | | | 89,570 | |
Professional fees. | | | 99,411 | |
Directors’/Trustees’ fees and expenses | | | 4,307 | |
Other | | | 9,122 | |
| | | | |
Total expenses | | | 1,423,466 | |
Expense reductions (Note 4) | | | (8 | ) |
Expenses waived/paid by affiliates (Note 3f) | | | (681,600 | ) |
| | | | |
Net expenses | | | 741,858 | |
| | | | |
Net investment income (loss) | | | (1,067,414 | ) |
| | | | |
Realized and unrealized gains (losses) on investments allocated from FT (Mauritius) Offshore Investments Limited: | | | | |
Net realized gain (loss) from: | | | | |
Investments:#,b | | | | |
Unaffiliated issuers. | | | 6,908,736 | |
Foreign currency transactions | | | 70,031 | |
| | | | |
Net realized gain (loss) | | | 6,978,767 | |
| | | | |
Net change in unrealized appreciation (depreciation) on: | | | | |
Investments:c | | | | |
Unaffiliated issuers. | | | 13,137,722 | |
Translation of other assets and liabilities denominated in foreign currencies | | | 15,800 | |
Change in deferred taxes on unrealized appreciation | | | (854,361 | ) |
| | | | |
Net change in unrealized appreciation (depreciation) | | | 12,299,161 | |
| | | | |
Net realized and unrealized gain (loss) | | | 19,277,928 | |
| | | | |
Net increase (decrease) in net assets resulting from operations | | $ | 18,210,514 | |
| | | | |
| |
#Net of foreign taxes | | $ | 912 | |
aIncludes $12,000 of dividend income from investments held directly by Franklin India Growth Fund.
bIncludes $357,364 of net realized gains from investments held directly by Franklin India Growth Fund.
cIncludes $213,048 of change in unrealized appreciation on investments held directly by Franklin India Growth Fund.
| | | | | | |
franklintempleton.com | | The accompanying notes are an integral part of these financial statements. | Annual Report | | | 17 | |
FRANKLIN TEMPLETON INTERNATIONAL TRUST
FINANCIAL STATEMENTS
Statements of Changes in Net Assets
Franklin India Growth Fund
| | | | | | | | |
| | | Year Ended October 31, | |
| | |
| | | 2017 | | | 2016 | |
Increase (decrease) in net assets: | | | | | | | | |
Operations: | | | | | | | | |
Net investment income (loss) | | $ | (1,067,414 | ) | | $ | 150,643 | |
Net realized gain (loss) | | | 6,978,767 | �� | | | 3,705,134 | |
Net change in unrealized appreciation (depreciation) | | | 12,299,161 | | | | 5,522,508 | |
| | | | |
Net increase (decrease) in net assets resulting from operations. | | | 18,210,514 | | | | 9,378,285 | |
| | | | |
Capital share transactions: (Note 2) | | | | | | | | |
Class A | | | 7,905,087 | | | | (9,981,239 | ) |
Class C | | | 4,230,982 | | | | (1,858,519 | ) |
Class R6 | | | (14,094,936 | ) | | | (755,428 | ) |
Advisor Class | | | 21,497,620 | | | | (10,835,035 | ) |
| | | | |
Total capital share transactions | | | 19,538,753 | | | | (23,430,221 | ) |
| | | | |
Net increase (decrease) in net assets. | | | 37,749,267 | | | | (14,051,936 | ) |
Net assets: | | | | | | | | |
Beginning of year | | | 115,952,698 | | | | 130,004,634 | |
| | | | |
End of year | | $ | 153,701,965 | | | $ | 115,952,698 | |
| | | | |
Undistributed net investment income (loss) included in net assets: | | | | | | | | |
End of year | | $ | (546,156 | ) | | $ | (443,226 | ) |
| | | | |
| | | | |
18 | | Annual Report | The accompanying notes are an integral part of these financial statements. | | franklintempleton.com |
FRANKLIN TEMPLETON INTERNATIONAL TRUST
Notes to Financial Statements
Franklin India Growth Fund
1. Organization and Significant Accounting Policies
Franklin Templeton International Trust (Trust) is registered under the Investment Company Act of 1940 (1940 Act) as an open-end management investment company, consisting of one fund, Franklin India Growth Fund (Fund), and applies the specialized accounting and reporting guidance in U.S. Generally Accepted Accounting Principles (U.S. GAAP). The Fund offers four classes of shares: Class A, Class C, Class R6, and Advisor Class. Each class of shares may differ by its initial sales load, contingent deferred sales charges, voting rights on matters affecting a single class, its exchange privilege and fees due to differing arrangements for distribution and transfer agent fees.
The Fund operates using a “master fund/feeder fund” structure and primarily invests indirectly in the securities of Indian companies through FT (Mauritius) Offshore Investments Limited (Portfolio), an entity registered with and regulated by the Mauritius Financial Services Commission, which shares the same investment objective as the Fund. The accounting policies of the Portfolio, including the Portfolio’s security valuation policies, will directly affect the recorded value of the Fund’s investment in the Portfolio. The financial statements of the Portfolio, including the Statement of Investments, are included elsewhere in this report, and should be read in conjunction with the Fund’s financial statements. At October 31, 2017, the Fund owned 100% of the outstanding shares of the Portfolio.
The following summarizes the Fund’s significant accounting policies.
a. Financial Instrument Valuation
The Fund’s investments in financial instruments are carried at fair value daily. Fair value is the price that would be received to sell an asset or paid to transfer a liability in an orderly transaction between market participants on the measurement date. The Fund calculates the net asset value (NAV) per share as of 4 p.m. Eastern time each day the New York Stock Exchange (NYSE) is open for trading. Under compliance policies and procedures approved by the Fund’s Board of Trustees (the Board), the Fund’s administrator has responsibility for oversight of valuation, including leading the cross-functional Valuation Committee (VC). The VC provides administration and oversight of the Fund’s valuation policies and procedures, which are approved annually by the Board. Among other things, these procedures allow the Fund to utilize
independent pricing services, quotations from securities and financial instrument dealers, and other market sources to determine fair value.
Equity securities listed on an exchange or on the NASDAQ National Market System are valued at the last quoted sale price or the official closing price of the day, respectively. Over-the-counter securities are valued within the range of the most recent quoted bid and ask prices. Securities that trade in multiple markets or on multiple exchanges are valued according to the broadest and most representative market. Certain equity securities are valued based upon fundamental characteristics or relationships to similar securities.
The Fund’s investment in the Portfolio shares is valued at the Portfolio’s NAV per share. Valuation of securities by the Portfolio is discussed in Note 1(a) of the Portfolio’s Notes to Financial Statements.
The Fund has procedures to determine the fair value of financial instruments for which market prices are not reliable or readily available. Under these procedures, the VC convenes on a regular basis to review such financial instruments and considers a number of factors, including significant unobservable valuation inputs, when arriving at fair value. The VC primarily employs a market-based approach which may use related or comparable assets or liabilities, recent transactions, market multiples, book values, and other relevant information for the investment to determine the fair value of the investment. An income-based valuation approach may also be used in which the anticipated future cash flows of the investment are discounted to calculate fair value. Discounts may also be applied due to the nature or duration of any restrictions on the disposition of the investments. Due to the inherent uncertainty of valuations of such investments, the fair values may differ significantly from the values that would have been used had an active market existed. The VC employs various methods for calibrating these valuation approaches including a regular review of key inputs and assumptions, transactional back-testing or disposition analysis, and reviews of any related market activity.
b. Income Taxes
It is the Fund’s policy to qualify as a regulated investment company under the Internal Revenue Code. The Fund intends to distribute to shareholders substantially all of its taxable income
| | | | | | |
franklintempleton.com | | Annual Report | | | 19 | |
FRANKLIN TEMPLETON INTERNATIONAL TRUST
NOTES TO FINANCIAL STATEMENTS
Franklin India Growth Fund (continued)
1. Organization and Significant Accounting Policies (continued)
b. Income Taxes (continued)
and net realized gains to relieve it from federal income and excise taxes. As a result, no provision for U.S. federal income taxes is required.
The Fund may recognize an income tax liability related to its uncertain tax positions under U.S. GAAP when the uncertain tax position has a less than 50% probability that it will be sustained upon examination by the tax authorities based on its technical merits. As of October 31, 2017, the Fund has determined that no tax liability is required in its financial statements related to uncertain tax positions for any open tax years (or expected to be taken in future tax years). Open tax years are those that remain subject to examination and are based on the statute of limitations in each jurisdiction in which the Fund invests.
The Fund’s investment through the Portfolio may be subject to income and withholding taxes in Mauritius and/or India which are discussed in Note 1(c) of the Portfolio’s Notes to Financial Statements.
c. Security Transactions, Investment Income, Expenses and Distributions
Security transactions, including investments of the Portfolio, are accounted for on trade date. Realized gains and losses on security transactions are determined on a specific identification basis. Estimated expenses are accrued daily. Dividend income is recorded on the ex-dividend date. Distributions to shareholders are recorded on the ex-dividend date. Distributable earnings are determined according to income tax regulations (tax basis) and may differ from earnings recorded in accordance with U.S. GAAP. These differences may be permanent or temporary.
Permanent differences are reclassified among capital accounts to reflect their tax character. These reclassifications have no impact on net assets or the results of operations. Temporary differences are not reclassified, as they may reverse in subsequent periods.
Realized and unrealized gains and losses and net investment income, excluding class specific expenses, are allocated daily to each class of shares based upon the relative proportion of net assets of each class. Differences in per share distributions by class are generally due to differences in class specific expenses.
The Fund records its proportionate share of the Portfolio’s income, expenses and realized and unrealized gains and losses daily. In addition, the Fund accrues its own expenses.
d. Accounting Estimates
The preparation of financial statements in accordance with U.S. GAAP requires management to make estimates and assumptions that affect the reported amounts of assets and liabilities at the date of the financial statements and the amounts of income and expenses during the reporting period. Actual results could differ from those estimates.
e. Guarantees and Indemnifications
Under the Trust’s organizational documents, its officers and trustees are indemnified by the Trust against certain liabilities arising out of the performance of their duties to the Trust. Additionally, in the normal course of business, the Trust, on behalf of the Fund, enters into contracts with service providers that contain general indemnification clauses. The Trust’s maximum exposure under these arrangements is unknown as this would involve future claims that may be made against the Trust that have not yet occurred. Currently, the Trust expects the risk of loss to be remote.
| | | | |
20 | | Annual Report | | franklintempleton.com |
FRANKLIN TEMPLETON INTERNATIONAL TRUST
NOTES TO FINANCIAL STATEMENTS
Franklin India Growth Fund (continued)
2. Shares of Beneficial Interest
At October 31, 2017, there were an unlimited number of shares authorized (without par value). Transactions in the Fund’s shares were as follows:
| | | | | | | | | | | | | | | | |
| | | Year Ended October 31, | |
| | | 2017 | | | 2016 | |
| | | Shares | | | Amount | | | Shares | | | Amount | |
| | | | |
| Class A Shares: | | | | | | | | | | | | | | | | |
Shares sold | | | 2,617,488 | | | $ | 37,511,958 | | | | 918,366 | | | $ | 11,299,421 | |
Shares redeemed | | | (2,123,150 | ) | | | (29,606,871 | ) | | | (1,779,920 | ) | | | (21,280,660 | ) |
| | | | |
Net increase (decrease) | | | 494,338 | | | $ | 7,905,087 | | | | (861,554 | ) | | $ | (9,981,239 | ) |
| | | | |
Class C Shares: | | | | | | | | | | | | | | | | |
Shares sold | | | 702,359 | | | $ | 9,576,901 | | | | 280,910 | | | $ | 3,217,739 | |
Shares redeemed | | | (402,964 | ) | | | (5,345,919 | ) | | | (452,332 | ) | | | (5,076,258 | ) |
| | | | |
Net increase (decrease) | | | 299,395 | | | $ | 4,230,982 | | | | (171,422 | ) | | $ | (1,858,519 | ) |
| | | | |
Class R6 Shares: | | | | | | | | | | | | | | | | |
Shares sold | | | 75,501 | | | $ | 1,024,818 | | | | 260,122 | | | $ | 3,194,111 | |
Shares redeemed | | | (976,994 | ) | | | (15,119,754 | ) | | | (320,599 | ) | | | (3,949,539 | ) |
| | | | |
Net increase (decrease) | | | (901,493 | ) | | $ | (14,094,936 | ) | | | (60,477 | ) | | $ | (755,428 | ) |
| | | | |
Advisor Class Shares: | | | | | | | | | | | | | | | | |
Shares sold | | | 2,343,042 | | | $ | 34,599,870 | | | | 628,666 | | | $ | 8,090,137 | |
Shares redeemed | | | (892,346 | ) | | | (13,102,250 | ) | | | (1,574,976 | ) | | | (18,925,172 | ) |
| | | | |
Net increase (decrease) | | | 1,450,696 | | | $ | 21,497,620 | | | | (946,310 | ) | | $ | (10,835,035 | ) |
3. Transactions with Affiliates
Franklin Resources, Inc. is the holding company for various subsidiaries that together are referred to as Franklin Templeton Investments. Certain officers and trustees of the Trust are also officers and/or directors of the Portfolio and of the following subsidiaries:
| | |
| Subsidiary | | Affiliation |
Franklin Advisers, Inc. (Advisers) | | Investment manager |
Templeton Asset Management Ltd. (TAML) | | Investment manager |
Franklin Templeton Services, LLC (FT Services) | | Administrative manager |
Franklin Templeton Distributors, Inc. (Distributors) | | Principal underwriter |
Franklin Templeton Investor Services, LLC (Investor Services) | | Transfer agent |
| | | | | | |
franklintempleton.com | | Annual Report | | | 21 | |
FRANKLIN TEMPLETON INTERNATIONAL TRUST
NOTES TO FINANCIAL STATEMENTS
Franklin India Growth Fund (continued)
3. Transactions with Affiliates (continued)
a. Management Fees
The Fund pays an investment management fee to Advisers (directly and/or indirectly through the Portfolio). The total management fee is paid based on the average daily net assets of the Fund as follows:
| | |
| Annualized Fee Rate | | Net Assets |
1.300% | | Up to and including $1 billion |
1.250% | | Over $1 billion, up to and including $5 billion |
1.200% | | Over $5 billion, up to and including $10 billion |
1.150% | | Over $10 billion, up to and including $15 billion |
1.100% | | Over $15 billion, up to and including $20 billion |
1.050% | | In excess of $20 billion |
For the year ended October 31, 2017, the effective investment management fee rate was 1.300% of the Fund’s average daily net assets.
Under a subadvisory agreement, TAML, an affiliate of Advisers, provides subadvisory services to the Fund. The subadvisory fee is paid by Advisers based on the Fund’s average daily net assets, and is not an additional expense of the Fund.
b. Administrative Fees
Under an agreement with Advisers, FT Services provides administrative services to the Fund. The fee is paid by Advisers based on the Fund’s average daily net assets, and is not an additional expense of the Fund.
c. Distribution Fees
The Board has adopted distribution plans for each share class, with the exception of Class R6 and Advisor Class shares, pursuant to Rule 12b-1 under the 1940 Act. Under the Fund’s Class A reimbursement distribution plan, the Fund reimburses Distributors for costs incurred in connection with the servicing, sale and distribution of the Fund’s shares up to the maximum annual plan rate. Under the Class A reimbursement distribution plan, costs exceeding the maximum for the current plan year cannot be reimbursed in subsequent periods. In addition, under the Fund’s Class C compensation distribution plan, the Fund pays Distributors for costs incurred in connection with the servicing, sale and distribution of the Fund’s shares up to the maximum annual plan rate. The plan year, for purposes of monitoring compliance with the maximum annual plan rates, is February 1 through January 31 .
The maximum annual plan rates, based on the average daily net assets, for each class, are as follows:
| | | | |
Class A | | | 0.35 | % |
Class C | | | 1.00 | % |
The Board has set the current rate at 0.25% per year for Class A shares until further notice and approval by the Board.
d. Sales Charges/Underwriting Agreements
Front-end sales charges and contingent deferred sales charges (CDSC) do not represent expenses of the Fund. These charges are deducted from the proceeds of sales of Fund shares prior to investment or from redemption proceeds prior to remittance, as applicable. Distributors has advised the Fund of the following commission transactions related to the sales and redemptions of the Fund’s shares for the year:
| | | | |
Sales charges retained net of commissions paid to unaffiliated brokers/dealers. | | $ | 77,403 | |
CDSC retained | | $ | 1,393 | |
| | | | |
22 | | Annual Report | | franklintempleton.com |
FRANKLIN TEMPLETON INTERNATIONAL TRUST
NOTES TO FINANCIAL STATEMENTS
Franklin India Growth Fund (continued)
e. Transfer Agent Fees
Each class of shares, except for Class R6, pays transfer agent fees to Investor Services for its performance of shareholder servicing obligations and reimburses Investor Services for out of pocket expenses incurred, including shareholder servicing fees paid to third parties. These fees are allocated daily based upon their relative proportion of such classes’ aggregate net assets. Class R6 pays Investor Services transfer agent fees specific to that class.
For the year ended October 31, 2017, the Fund paid transfer agent fees of $299,140, of which $114,042 was retained by Investor Services.
f. Waiver and Expense Reimbursements
Advisers and Investor Services have contractually agreed in advance to waive or limit their respective fees and to assume as their own expense certain expenses otherwise payable by the Fund so that the expenses (excluding distribution fees) for Class A, Class C and Advisor Class of the Fund do not exceed 1.40%, and Class R6 does not exceed 1.19% based on the average net assets of each class (other than certain non-routine expenses or costs, including those relating to litigation, indemnification, reorganizations, and liquidations) until February 28, 2018. Total expenses waived or paid are not subject to recapture subsequent to the Fund’s fiscal year end. Prior to March 1, 2017, expenses for Class R6 were limited to 1.24%.
4. Expense Offset Arrangement
The Fund has entered into an arrangement with their custodian whereby credits realized as a result of uninvested cash balances are used to reduce a portion of the Funds’ custodian expenses. During the year ended October 31, 2017, the custodian fees were reduced as noted in the Statements of Operations.
5. Income Taxes
For tax purposes, capital losses may be carried over to offset future capital gains, if any.
During the year ended October 31, 2017, the Fund utilized $355,834 of short-term capital loss carryforwards.
For tax purposes, the Fund may elect to defer any portion of a late-year ordinary loss to the first day of the following fiscal year. At October 31, 2017, the Fund deferred late-year ordinary losses of $6,079.
At October 31, 2017, the cost of investments, net unrealized appreciation (depreciation) and undistributed long term capital gains, for income tax purposes were as follows:
| | | | |
Cost of investments | | $ | 104,855,924 | |
| | | | |
Unrealized appreciation | | $ | 45,033,109 | |
Unrealized depreciation | | | (2,852,045 | ) |
| | | | |
Net unrealized appreciation (depreciation) | | $ | 42,181,064 | |
| | | | |
Distributable earnings - undistributed long term capital gains | | $ | 4,536,164 | |
| | | | |
The Portfolio is a disregarded entity for United States federal income tax purposes.
Differences between income and/or capital gains as determined on a book basis and a tax basis are primarily due to differing treatments of passive foreign investment company shares and wash sales.
| | | | | | |
franklintempleton.com | | Annual Report | | | 23 | |
FRANKLIN TEMPLETON INTERNATIONAL TRUST
NOTES TO FINANCIAL STATEMENTS
Franklin India Growth Fund (continued)
5. Income Taxes (continued)
The Fund utilized a tax accounting practice to treat a portion of the proceeds from capital shares redeemed as a distribution from realized capital gains.
6. Investment Transactions
Purchases and sales of investments including transactions from the Portfolio (excluding short term securities) for the year ended October 31, 2017, aggregated $66,197,992 and $51,800,335, respectively.
7. Concentration of Risk
Investing in Indian equity securities through the Portfolio may include certain risks and considerations not typically associated with investing in U.S. securities, such as fluctuating currency values, less liquidity, expropriation, confiscatory taxation, nationalization, exchange control regulations (including currency blockage), differing legal standards and changing local and regional economic, political and social conditions, which may result in greater market volatility.
8. Credit Facility
The Fund, together with other U.S. registered and foreign investment funds (collectively, Borrowers), managed by Franklin Templeton Investments, are borrowers in a joint syndicated senior unsecured credit facility totaling $2 billion (Global Credit Facility) which matures on February 9, 2018. This Global Credit Facility provides a source of funds to the Borrowers for temporary and emergency purposes, including the ability to meet future unanticipated or unusually large redemption requests.
Under the terms of the Global Credit Facility, the Fund shall, in addition to interest charged on any borrowings made by the Fund and other costs incurred by the Fund, pay its share of fees and expenses incurred in connection with the implementation and maintenance of the Global Credit Facility, based upon its relative share of the aggregate net assets of all of the Borrowers, including an annual commitment fee of 0.15% based upon the unused portion of the Global Credit Facility. These fees are reflected in other expenses in the Statements of Operations. During the year ended October 31, 2017, the Fund did not use the Global Credit Facility.
9. Fair Value Measurements
The Fund follows a fair value hierarchy that distinguishes between market data obtained from independent sources (observable inputs) and the Fund’s own market assumptions (unobservable inputs). These inputs are used in determining the value of the Fund’s financial instruments and are summarized in the following fair value hierarchy:
| | • | | Level 1 – quoted prices in active markets for identical financial instruments |
| | • | | Level 2 – other significant observable inputs (including quoted prices for similar financial instruments, interest rates, prepayment speed, credit risk, etc.) |
| | • | | Level 3 – significant unobservable inputs (including the Fund’s own assumptions in determining the fair value of financial instruments) |
The input levels are not necessarily an indication of the risk or liquidity associated with financial instruments at that level.
For movements between the levels within the fair value hierarchy, the Fund has adopted a policy of recognizing the transfers as of the date of the underlying event which caused the movement.
| | | | |
24 | | Annual Report | | franklintempleton.com |
FRANKLIN TEMPLETON INTERNATIONAL TRUST
NOTES TO FINANCIAL STATEMENTS
Franklin India Growth Fund (continued)
At October 31, 2017, all of the Fund’s investments in financial instruments carried at fair value were valued using Level 1 inputs. For detailed categories, see the accompanying Statement of Investments.
10. Subsequent Events
The Fund has evaluated subsequent events through the issuance of the financial statements and determined that no events have occurred that require disclosure.
| | | | | | |
franklintempleton.com | | Annual Report | | | 25 | |
FRANKLIN TEMPLETON INTERNATIONAL TRUST
Report of Independent Registered Public Accounting Firm
To the Board of Trustees of Franklin Templeton International Trust and Shareholders of the Franklin India Growth Fund
In our opinion, the accompanying statement of assets and liabilities, including the statement of investments, and the related statements of operations and of changes in net assets and the financial highlights present fairly, in all material respects, the financial position of the Franklin India Growth Fund (the “Fund”) as of October 31, 2017, the results of its operations for the year then ended, the changes in its net assets for each of the two years in the period then ended and the financial highlights for each of the periods indicated, in conformity with accounting principles generally accepted in the United States of America. These financial statements and financial highlights (hereafter referred to as “financial statements”) are the responsibility of the Fund’s management. Our responsibility is to express an opinion on these financial statements based on our audits. We conducted our audits of these financial statements in accordance with the standards of the Public Company Accounting Oversight Board (United States). Those standards require that we plan and perform the audit to obtain reasonable assurance about whether the financial statements are free of material misstatement. An audit includes examining, on a test basis, evidence supporting the amounts and disclosures in the financial statements, assessing the accounting principles used and significant estimates made by management, and evaluating the overall financial statement presentation. We believe that our audits, which included confirmation of securities as of October 31, 2017 by correspondence with the custodian, transfer agent and brokers, provide a reasonable basis for our opinion.
PricewaterhouseCoopers LLP
San Francisco, California
December 18, 2017
| | | | |
26 | | Annual Report | | franklintempleton.com |
FRANKLIN TEMPLETON INTERNATIONAL TRUST
Tax Information (unaudited)
Franklin India Growth Fund
Under Section 852(b)(3)(C) of the Internal Revenue Code (Code), the Fund hereby reports the maximum amount allowable but no less than $1,001,726 as a long term capital gain dividend for the fiscal year ended October 31, 2017.
Under Section 854(b)(1)(B) of the Code, the Fund hereby reports the maximum amount allowable but no less than $876,228 as qualified dividends for purposes of the maximum rate under Section 1(h)(11) of the Code for the fiscal year ended October 31, 2017. Distributions, including qualified dividend income, paid during calendar year 2017 will be reported to shareholders on Form 1099-DIV by mid-February 2018. Shareholders are advised to check with their tax advisors for information on the treatment of these amounts on their individual income tax returns.
| | | | | | |
franklintempleton.com | | Annual Report | | | 27 | |
FRANKLIN TEMPLETON INTERNATIONAL TRUST
Board Members and Officers
The name, year of birth and address of the officers and board members, as well as their affiliations, positions held with the Trust, principal occupations during at least the past five years and number of US registered portfolios overseen in the Franklin Templeton Investments fund complex, are shown below. Generally, each board member serves until that person’s successor is elected and qualified.
Independent Board Members
| | | | | | | | |
Name,Year of Birth and Address | | Position | | Length of Time Served | | Number of Portfolios in Fund Complex Overseen by Board Member* | | Other Directorships Held During at Least the Past 5 Years |
| | | | |
Harris J. Ashton (1932) One Franklin Parkway San Mateo, CA 94403-1906 | | Trustee | | Since 1991 | | 139 | | Bar-S Foods (meat packing company) (1981-2010). |
|
Principal Occupation During at Least the Past 5 Years: Director of various companies; and formerly, Director, RBC Holdings, Inc. (bank holding company) (until 2002); and President, Chief Executive Officer and Chairman of the Board, General Host Corporation (nursery and craft centers) (until 1998). |
| | | | |
Mary C. Choksi (1950) One Franklin Parkway San Mateo, CA 94403-1906 | | Trustee | | Since 2014 | | 133 | | Avis Budget Group Inc. (car rental) (2007-present), Omnicom Group Inc. (advertising and marketing communications services) (2011-present) and White Mountains Insurance Group, Ltd. (holding company) (August 2017-present). |
|
Principal Occupation During at Least the Past 5 Years: Director of various companies; and formerly, Founder and Senior Advisor, Strategic Investment Group (investment management group) (2015-2017); Founding Partner and Senior Managing Director, Strategic Investment Group (1987 -2015); Founding Partner and Managing Director,Emerging Markets Management LLC (investment management firm) (1987-2011); and Loan Officer/Senior Loan Officer/Senior Pension Investment Officer, World Bank Group (international financial institution) (1977-1987). |
| | | | |
Edith E. Holiday (1952) One Franklin Parkway San Mateo, CA 94403-1906 | | Trustee | | Since 1998 | | 139 | | Hess Corporation (exploration of oil and gas) (1993-present), Canadian National Railway (railroad) (2001-present), White Mountains Insurance Group, Ltd. (holding company) (2004-present), Santander Consumer USA Holdings, Inc. (consumer finance) (2016-present), RTI International Metals, Inc. (manufacture and distribution of titanium) (1999-2015) and H.J. Heinz Company (processed foods and allied products) (1994-2013). |
|
Principal Occupation During at Least the Past 5 Years: Director or Trustee of various companies and trusts; and formerly, Assistant to the President of the United States and Secretary of the Cabinet (1990-1993); General Counsel to the United States Treasury Department (1989-1990); and Counselor to the Secretary and Assistant Secretary for Public Affairs and Public Liaison – United States Treasury Department (1988-1989). |
| | | | |
J. Michael Luttig (1954) One Franklin Parkway San Mateo, CA 94403-1906 | | Trustee | | Since 2009 | | 139 | | Boeing Capital Corporation (aircraft financing) (2006-2013). |
|
Principal Occupation During at Least the Past 5 Years: Executive Vice President, General Counsel and member of the Executive Council, The Boeing Company (aerospace company) (2006-present); and formerly, Federal Appeals Court Judge, U.S. Court of Appeals for the Fourth Circuit (1991-2006). |
| | | | |
28 | | Annual Report | | franklintempleton.com |
FRANKLIN TEMPLETON INTERNATIONAL TRUST
Independent Board Members (continued)
| | | | | | | | |
Name,Year of Birth and Address | | Position | | Length of
Time Served | | Number of Portfolios in
Fund Complex Overseen by Board Member* | | Other Directorships Held During at Least the Past 5 Years |
| | | | |
Larry D. Thompson (1945) One Franklin Parkway San Mateo, CA 94403-1906 | | Trustee | | Since 2007 | | 139 | | The Southern Company (energy company) (2014-present; previously 2010-2012), Graham Holdings Company (education and media organization) (2011-present) and Cbeyond, Inc. (business communications provider) (2010-2012). |
|
Principal Occupation During at Least the Past 5 Years: Director of various companies; Counsel, Finch McCranie, LLP (law firm) (2015-present); Independent Compliance Monitor and Auditor, Volkswagen AG (manufacturer of automobiles and commercial vehicles) (April 2017 – present); John A. Sibley Professor of Corporate and Business Law, University of Georgia School of Law (2015-present; previously 2011-2012); and formerly, Executive Vice President - Government Affairs, General Counsel and Corporate Secretary, PepsiCo, Inc. (consumer products) (2012-2014); Senior Vice President - Government Affairs, General Counsel and Secretary, PepsiCo, Inc. (2004-2011); Senior Fellow of The Brookings Institution (2003-2004); Visiting Professor, University of Georgia School of Law (2004); and Deputy Attorney General, U.S. Department of Justice (2001-2003). |
| | | | |
John B. Wilson (1959) One Franklin Parkway San Mateo, CA 94403-1906 | | Lead Independent Trustee | | Trustee since 2006 and Lead Independent Trustee since 2008 | | 113 | | None |
|
Principal Occupation During at Least the Past 5 Years: President and Founder, Hyannis Port Capital, Inc. (real estate and private equity investing) (2002-present); serves on private and non-profit boards; and formerly, President, Staples International and Head of Global Transformation (office supplies) (2012-2016); Chief Operating Officer and Executive Vice President, Gap, Inc. (retail) (1996-2000); Chief Financial Officer and Executive Vice President - Finance and Strategy, Staples, Inc. (1992-1996); Senior Vice President - Corporate Planning, Northwest Airlines, Inc. (airlines) (1990-1992); and Vice President and Partner, Bain & Company (consulting firm) (1986-1990). |
| |
| Interested Board Members and Officers | | |
| | | | |
Name,Year of Birth and Address | | Position | | Length of
Time Served | | Number of Portfolios in
Fund Complex Overseen
by Board Member* | | Other Directorships Held During at Least the Past 5 Years |
| | | | |
**Gregory E. Johnson (1961) One Franklin Parkway San Mateo, CA 94403-1906 | | Trustee | | Since 2007 | | 155 | | None |
|
Principal Occupation During at Least the Past 5 Years: Chairman of the Board, Member - Office of the Chairman, Director and Chief Executive Officer, Franklin Resources, Inc.; officer and/or director or trustee, as the case may be, of some of the other subsidiaries of Franklin Resources, Inc. and of 43 of the investment companies in Franklin Templeton Investments; Vice Chairman, Investment Company Institute; and formerly, President, Franklin Resources, Inc. (1994-2015). |
| | | | |
**Rupert H. Johnson, Jr. (1940) One Franklin Parkway San Mateo, CA 94403-1906 | | Chairman of the Board and Trustee | | Since 2013 | | 139 | | None |
|
Principal Occupation During at Least the Past 5 Years: Vice Chairman, Member – Office of the Chairman and Director, Franklin Resources, Inc.; Director, Franklin Advisers, Inc.; Senior Vice President, Franklin Advisory Services, LLC; and officer and/or director or trustee, as the case may be, of some of the other subsidiaries of Franklin Resources, Inc. and of 43 of the investment companies in Franklin Templeton Investments. |
| | | | |
Alison E. Baur (1964) One Franklin Parkway San Mateo, CA 94403-1906 | | Vice President | | Since 2012 | | Not Applicable | | Not Applicable |
|
Principal Occupation During at Least the Past 5 Years: Deputy General Counsel, Franklin Templeton Investments; and officer of some of the other subsidiaries of Franklin Resources, Inc. and of 45 of the investment companies in Franklin Templeton Investments. |
| | | | | | |
franklintempleton.com | | Annual Report | | | 29 | |
FRANKLIN TEMPLETON INTERNATIONAL TRUST
Interested Board Members and Officers (continued)
| | | | | | | | |
Name,Year of Birth and Address | | Position | | Length of
Time Served | | Number of Portfolios in
Fund Complex Overseen by Board Member* | | Other Directorships Held During at Least the Past 5 Years |
| | | | |
Gaston Gardey (1967) One Franklin Parkway San Mateo, CA 94403-1906 | | Chief
Financial
Officer, Chief
Accounting
Officer and
Treasurer | | Since 2009 | | Not Applicable | | Not Applicable |
|
Principal Occupation During at Least the Past 5 Years: Treasurer, U.S. Fund Administration & Reporting, Franklin Templeton Investments; and officer of 27 of the investment companies in Franklin Templeton Investments. |
| | | | |
Aliya S. Gordon (1973) One Franklin Parkway San Mateo, CA 94403-1906 | | Vice President | | Since 2009 | | Not Applicable | | Not Applicable |
|
Principal Occupation During at Least the Past 5 Years: Senior Associate General Counsel, Franklin Templeton Investments; and officer of 45 of the investment companies in Franklin Templeton Investments. |
| | | | |
Steven J. Gray (1955) One Franklin Parkway San Mateo, CA 94403-1906 | | Vice President | | Since 2009 | | Not Applicable | | Not Applicable |
Principal Occupation During at Least the Past 5 Years: Senior Associate General Counsel, Franklin Templeton Investments; Vice President, Franklin Templeton Distributors, Inc. and FT AlphaParity, LLC; and officer of 45 of the investment companies in Franklin Templeton Investments. |
| | | | |
Matthew T. Hinkle (1971) One Franklin Parkway San Mateo, CA 94403-1906 | | Chief
Executive
Officer –
Finance and
Administration | | Since June
2017 | | Not Applicable | | Not Applicable |
Principal Occupation During at Least the Past 5 Years: Senior Vice President, Franklin Templeton Services, LLC; officer of 45 of the investment companies in Franklin Templeton Investments; and formerly, Vice President, Global Tax (2012-April 2017) and Treasurer/Assistant Treasurer, Franklin Templeton Investments (2009-2017). |
| | | | |
Edward B. Jamieson (1948) One Franklin Parkway San Mateo, CA 94403-1906 | | President and
Chief
Executive
Officer –
Investment
Management | | Since 2010 | | Not Applicable | | Not Applicable |
Principal Occupation During at Least the Past 5 Years: President and Director, Franklin Advisers, Inc.; Executive Vice President, Franklin Templeton Institutional, LLC; and officer and/or trustee, as the case may be, of some of the other subsidiaries of Franklin Resources, Inc. and of 10 of the investment companies in Franklin Templeton Investments. |
| | | | |
Robert Lim (1948) One Franklin Parkway San Mateo, CA 94403-1906 | | Vice President
–AML
Compliance | | Since 2016 | | Not Applicable | | Not Applicable |
Principal Occupation During at Least the Past 5 Years: Vice President, Franklin Templeton Companies, LLC; Chief Compliance Officer, Franklin Templeton Distributors, Inc. and Franklin Templeton Investor Services, LLC; and officer of 45 of the investment companies in Franklin Templeton Investments. |
| | | | |
Kimberly H. Novotny (1972) 300 S.E. 2nd Street Fort Lauderdale, FL 33301-1923 | | Vice President | | Since 2013 | | Not Applicable | | Not Applicable |
Principal Occupation During at Least the Past 5 Years: Associate General Counsel, Franklin Templeton Investments; Vice President and Corporate Secretary, Fiduciary Trust International of the South; Vice President, Templeton Investment Counsel, LLC; Assistant Secretary, Franklin Resources, Inc.; and officer of 45 of the investment companies in Franklin Templeton Investments. |
| | | | |
30 | | Annual Report | | franklintempleton.com |
FRANKLIN TEMPLETON INTERNATIONAL TRUST
Interested Board Members and Officers (continued)
| | | | | | | | |
Name,Year of Birth and Address | | Position | | Length of
Time Served | | Number of Portfolios in
Fund Complex Overseen by Board Member* | | Other Directorships Held During at Least the Past 5 Years |
| | | | |
Robert C. Rosselot (1960) 300 S.E. 2nd Street Fort Lauderdale, FL 33301-1923 | | Chief
Compliance
Officer | | Since 2013 | | Not Applicable | | Not Applicable |
|
Principal Occupation During at Least the Past 5 Years: Director, Global Compliance, Franklin Templeton Investments; Vice President, Franklin Templeton Companies, LLC; officer of 45 of the investment companies in Franklin Templeton Investments; and formerly, Senior Associate General Counsel, Franklin Templeton Investments (2007-2013); and Secretary and Vice President, Templeton Group of Funds (2004-2013). |
| | | | |
Karen L. Skidmore (1952) One Franklin Parkway San Mateo, CA 94403-1906 | | Vice President
and Secretary | | Since 2006 | | Not Applicable | | Not Applicable |
|
Principal Occupation During at Least the Past 5 Years: Senior Associate General Counsel, Franklin Templeton Investments; and officer of 45 of the investment companies in Franklin Templeton Investments. |
| | | | |
Navid J. Tofigh (1972) One Franklin Parkway San Mateo, CA 94403-1906 | | Vice President | | Since 2015 | | Not Applicable | | Not Applicable |
|
Principal Occupation During at Least the Past 5 Years: Associate General Counsel, Franklin Templeton Investments; and officer of 45 of the investment companies in Franklin Templeton Investments. |
| | | | |
Craig S. Tyle (1960) One Franklin Parkway San Mateo, CA 94403-1906 | | Vice President | | Since 2005 | | Not Applicable | | Not Applicable |
|
Principal Occupation During at Least the Past 5 Years: General Counsel and Executive Vice President, Franklin Resources, Inc.; and officer of some of the other subsidiaries of Franklin Resources, Inc. and of 45 of the investment companies in Franklin Templeton Investments. |
| | | | |
Lori A. Weber (1964) 300 S.E. 2nd Street Fort Lauderdale, FL 33301-1923 | | Vice President | | Since 2011 | | Not Applicable | | Not Applicable |
|
Principal Occupation During at Least the Past 5 Years: Senior Associate General Counsel, Franklin Templeton Investments; Assistant Secretary, Franklin Resources, Inc.; Vice President and Secretary, Templeton Investment Counsel, LLC; and officer of 45 of the investment companies in Franklin Templeton Investments. |
*We base the number of portfolios on each separate series of the US registered investment companies within the Franklin Templeton Investments fund complex. These portfolios have a common investment manager or affiliated investment managers.
**Gregory E. Johnson is considered to be an interested person of the Fund under the federal securities laws due to his position as an officer and director of Franklin
Resources, Inc. (Resources), which is the parent company of the Fund’s investment manager and distributor. Rupert H. Johnson, Jr. is considered to be an interested person of the Fund under the federal securities laws due to his position as officer and director and major shareholder of Resources.
Note 1: Rupert H. Johnson, Jr. is the uncle of Gregory E. Johnson.
Note 2: Officer information is current as of the date of this report. It is possible that after this date, information about officers may change.
The Sarbanes-Oxley Act of 2002 and Rules adopted by the Securities and Exchange Commission require the Fund to disclose whether the Fund’s Audit Committee includes at least one member who is an audit committee financial expert within the meaning of such Act and Rules. The Fund’s Board has determined that there is at least one such financial expert on the Audit Committee and has designated John B. Wilson as its audit committee financial expert. The Board believes that Mr. Wilson qualifies as such an expert in view of his extensive business background and experience, including service as chief financial officer of Staples, Inc. from 1992 to 1996. Mr. Wilson has been a Member and Chairman of the Fund’s Audit Committee since 2006. As a result of such background and experience, the Board believes that Mr. Wilson has acquired an understanding of generally accepted accounting principles and financial statements, the general application of such principles in connection with the accounting estimates, accruals and reserves, and analyzing and evaluating financial statements that present a breadth and level of complexity of accounting issues generally comparable to those of the Fund, as well as an understanding of internal controls and procedures for financial reporting and an understanding of audit committee functions. Mr. Wilson is an independent Board member as that term is defined under the relevant Securities and Exchange Commission Rules and Releases.
The Statement of Additional Information (SAI) includes additional information about the board members and is available, without charge, upon request. Shareholders may call (800) DIAL BEN/342-5236 to request the SAI.
| | | | | | |
franklintempleton.com | | Annual Report | | | 31 | |
FT (MAURITIUS) OFFSHORE INVESTMENTS LIMITED
Financial Highlights
(Expressed in U.S. Dollars)
| | | | | | | | | | | | | | | | | | | | |
| | | Year Ended October 31, | |
| | | 2017 | | | 2016 | | | 2015 | | | 2014 | | | 2013 | |
| | | | | |
| Per share operating performance | | | | | | | | | | | | | | | | | | | | |
(for a share outstanding throughout the year) | | | | | | | | | | | | | | | | | | | | |
| | | | | |
Net asset value, beginning of year | | | $15.06 | | | | $13.43 | | | | $13.49 | | | | $9.19 | | | | $9.37 | |
| | | | |
| | | | | |
| Income from investment operationsa: | | | | | | | | | | | | | | | | | | | | |
| | | | | |
Net investment income (loss)b | | | (0.04 | ) | | | 0.10 | c | | | (0.02 | ) | | | 0.09 | d | | | 0.06 | |
| | | | | |
Net realized and unrealized gains (losses) | | | 2.34 | | | | 1.53 | | | | (0.04 | ) | | | 4.21 | | | | (0.24 | ) |
| | | | |
| | | | | |
Total from investment operations | | | 2.30 | | | | 1.63 | | | | (0.06 | ) | | | 4.30 | | | | (0.18 | ) |
| | | | |
| | | | | |
Net asset value, end of year. | | | $17.36 | | | | $15.06 | | | | $13.43 | | | | $13.49 | | | | $9.19 | |
| | | | |
| | | | | |
Total return | | | 15.27% | | | | 12.14% | | | | (0.44)% | | | | 46.79% | | | | (1.92)% | |
| | | | | |
| Ratios to average net assets | | | | | | | | | | | | | | | | | | | | |
| | | | | |
Expenses | | | 1.14% | | | | 1.14% | | | | 1.10% | | | | 1.12% | | | | 1.07% | |
| | | | | |
Net investment income (loss) | | | (0.25)% | | | | 0.71% | c | | | (0.16)% | | | | 0.80% | d | | | 0.54% | |
| | | | | |
| Supplemental data | | | | | | | | | | | | | | | | | | | | |
| | | | | |
Net assets, end of year (000’s) | | | $148,914 | | | | $113,405 | | | | $126,895 | | | | $105,258 | | | | $58,206 | |
| | | | | |
Portfolio turnover rate | | | 40.10% | | | | 21.54% | | | | 46.88% | | | | 35.48% | | | | 16.95% | |
aThe amount shown for a share outstanding throughout the period may not correlate with the Statement of Operations for the period due to the timing of sales and repurchases of the Fund’s shares in relation to income earned and/or fluctuating fair value of the investments of the Portfolio.
bBased on average daily shares outstanding.
cNet investment income per shares includes approximately $0.10 per share related to a corporate action in connection with certain Portfolio holdings. Excluding this amount, the ratio of net investment income to average net assets would have been (0.07)%.
dNet investment income per share includes approximately $0.02 per share related to income received in the form of special dividends in connection with certain Portfolio holdings. Excluding this amount, the ratio of net investment income to average net assets would have been 0.62%.
| | | | |
32 | | Annual Report | The accompanying notes are an integral part of these financial statements. | | franklintempleton.com |
FT (MAURITIUS) OFFSHORE INVESTMENTS LIMITED
Statement of Investments, October 31, 2017
(Expressed in U.S. Dollars)
| | | | | | | | |
| | | Shares | | | Value | |
Common Stocks 96.0% | | | | | | | | |
| India 96.0% | | | | | | | | |
| Auto Components 1.4% | | | | | | | | |
Apollo Tyres Ltd | | | 143,541 | | | $ | 545,345 | |
Bharat Forge Ltd | | | 145,412 | | | | 1,567,979 | |
| | | | | | | | |
| | | | | | | 2,113,324 | |
| | | | | | | | |
| Automobiles 4.2% | | | | | | | | |
aTata Motors Ltd | | | 612,454 | | | | 4,052,128 | |
aTata Motors Ltd., A. | | | 609,129 | | | | 2,265,772 | |
| | | | | | | | |
| | | | | | | 6,317,900 | |
| | | | | | | | |
| Banks 22.4% | | | | | | | | |
Axis Bank Ltd | | | 635,041 | | | | 5,130,837 | |
HDFC Bank Ltd | | | 275,400 | | | | 7,705,883 | |
IndusInd Bank Ltd | | | 123,733 | | | | 3,109,377 | |
Kotak Mahindra Bank Ltd | | | 367,563 | | | | 5,818,849 | |
State Bank of India | | | 1,199,343 | | | | 5,664,233 | |
Yes Bank Ltd | | | 1,221,754 | | | | 5,929,517 | |
| | | | | | | | |
| | | | | | | 33,358,696 | |
| | | | | | | | |
| Beverages 0.4% | | | | | | | | |
aUnited Spirits Ltd | | | 11,691 | | | | 550,940 | |
| | | | | | | | |
| Building Products 2.1% | | | | | | | | |
Kajaria Ceramics Ltd | | | 292,078 | | | | 3,068,285 | |
| | | | | | | | |
| Capital Markets 5.6% | | | | | | | | |
Care Ratings Ltd | | | 110,617 | | | | 2,568,962 | |
Crisil Ltd | | | 50,000 | | | | 1,389,537 | |
ICRA Ltd | | | 29,007 | | | | 1,764,007 | |
Motilal Oswal Financial Services Ltd | | | 124,708 | | | | 2,646,602 | |
| | | | | | | | |
| | | | | | | 8,369,108 | |
| | | | | | | | |
| Chemicals 2.8% | | | | | | | | |
Asian Paints Ltd | | | 226,301 | | | | 4,127,066 | |
| | | | | | | | |
| Construction & Engineering 5.7% | | | | | | | | |
Larsen & Toubro Ltd | | | 270,609 | | | | 5,108,346 | |
Voltas Ltd | | | 390,653 | | | | 3,424,473 | |
| | | | | | | | |
| | | | | | | 8,532,819 | |
| | | | | | | | |
| Construction Materials 5.6% | | | | | | | | |
Shree Cement Ltd | | | 9,905 | | | | 2,895,840 | |
UltraTech Cement Ltd | | | 79,427 | | | | 5,398,644 | |
| | | | | | | | |
| | | | | | | 8,294,484 | |
| | | | | | | | |
| Consumer Finance 2.3% | | | | | | | | |
Mahindra & Mahindra Financial Services Ltd | | | 191,808 | | | | 1,278,671 | |
Repco Home Finance Ltd | | | 220,866 | | | | 2,111,615 | |
| | | | | | | | |
| | | | | | | 3,390,286 | |
| | | | | | | | |
| Electrical Equipment 1.1% | | | | | | | | |
Havell’s India Ltd | | | 209,885 | | | | 1,571,301 | |
| | | | | | | | |
| Food Products 1.0% | | | | | | | | |
Nestle India Ltd | | | 13,673 | | | | 1,528,631 | |
| | | | | | | | |
| Health Care Providers & Services 0.5% | | | | | | | | |
a,bNarayana Hrudayalaya Ltd., Reg S | | | 160,287 | | | | 759,971 | |
| | | | | | | | |
| | | | | | |
franklintempleton.com | | | Annual Report | | | 33 | |
FT (MAURITIUS) OFFSHORE INVESTMENTS LIMITED
STATEMENT OF INVESTMENTS
(Expressed in U.S. Dollars)
| | | | | | | | |
| | | Shares | | | Value | |
Common Stocks (continued) | | | | | | | | |
| India (continued) | | | | | | | | |
| Hotels, Restaurants & Leisure 1.8% | | | | | | | | |
Indian Hotels Co. Ltd | | | 1,552,341 | | | $ | 2,715,098 | |
| | | | | | | | |
| Household Durables 1.1% | | | | | | | | |
Crompton Greaves Consumer Electricals Ltd | | | 467,705 | | | | 1,597,420 | |
| | | | | | | | |
| Household Products 4.3% | | | | | | | | |
Hindustan Unilever Ltd | | | 336,127 | | | | 6,423,789 | |
| | | | | | | | |
| Insurance 0.5% | | | | | | | | |
bICICI Lombard General Insurance Co. Ltd., Reg S | | | 72,205 | | | | 754,946 | |
| | | | | | | | |
| IT Services 5.6% | | | | | | | | |
HCL Technologies Ltd | | | 236,906 | | | | 3,131,184 | |
Infosys Ltd | | | 364,082 | | | | 5,183,459 | |
| | | | | | | | |
| | | | | | | 8,314,643 | |
| | | | | | | | |
| Machinery 5.1% | | | | | | | | |
Cummins India Ltd | | | 336,941 | | | | 4,710,149 | |
Eicher Motors Ltd | | | 4,147 | | | | 2,064,431 | |
SKF India Ltd | | | 35,000 | | | | 888,622 | |
| | | | | | | | |
| | | | | | | 7,663,202 | |
| | | | | | | | |
| Media 0.4% | | | | | | | | |
Jagran Prakashan Ltd | | | 229,686 | | | | 630,173 | |
| | | | | | | | |
| Metals & Mining 2.5% | | | | | | | | |
Hindalco Industries Ltd | | | 707,439 | | | | 2,921,532 | |
Tata Steel Ltd | | | 70,529 | | | | 766,615 | |
| | | | | | | | |
| | | | | | | 3,688,147 | |
| | | | | | | | |
| Multiline Retail 1.7% | | | | | | | | |
Trent Ltd | | | 564,824 | | | | 2,578,999 | |
| | | | | | | | |
| Oil, Gas & Consumable Fuels 1.1% | | | | | | | | |
Petronet LNG Ltd | | | 406,020 | | | | 1,629,410 | |
| | | | | | | | |
| Personal Products 0.9% | | | | | | | | |
Godrej Consumer Products Ltd | | | 93,751 | | | | 1,352,186 | |
| | | | | | | | |
| Pharmaceuticals 2.9% | | | | | | | | |
Dr Reddy’s Laboratories Ltd | | | 114,288 | | | | 4,285,844 | |
| | | | | | | | |
| Real Estate Management & Development 2.1% | | | | | | | | |
aGodrej Properties Ltd | | | 68,980 | | | | 723,677 | |
Oberoi Realty Ltd | | | 336,278 | | | | 2,465,606 | |
| | | | | | | | |
| | | | | | | 3,189,283 | |
| | | | | | | | |
| Textiles, Apparel & Luxury Goods 3.3% | | | | | | | | |
aAditya Birla Fashion and Retail Ltd | | | 899,365 | | | | 2,179,311 | |
Titan Co. Ltd | | | 282,362 | | | | 2,770,200 | |
| | | | | | | | |
| | | | | | | 4,949,511 | |
| | | | | | | | |
| Thrifts & Mortgage Finance 2.0% | | | | | | | | |
Housing Development Finance Corp. Ltd | | | 111,832 | | | | 2,948,911 | |
| | | | | | | | |
| Transportation Infrastructure 0.6% | | | | | | | | |
Gujarat Pipavav Port Ltd | | | 400,851 | | | | 877,539 | |
| | | | | | | | |
| | | | |
34 | | Annual Report | | franklintempleton.com |
FT (MAURITIUS) OFFSHORE INVESTMENTS LIMITED
STATEMENT OF INVESTMENTS
(Expressed in U.S. Dollars)
| | | | | | | | |
| | | Shares | | | Value | |
Common Stocks (continued) | | | | | | | | |
| India (continued) | | | | | | | | |
| Wireless Telecommunication Services 5.0% | | | | | | | | |
Bharti Airtel Ltd | | | 479,297 | | | $ | 3,680,409 | |
aIdea Cellular Ltd | | | 2,600,604 | | | | 3,729,206 | |
| | | | | | | | |
| | | | | | | 7,409,615 | |
| | | | | | | | |
Total Common Stocks (Cost $100,515,267) | | | | | | | 142,991,527 | |
Other Assets, less Liabilities 4.0% | | | | | | | 5,922,063 | |
| | | | | | | | |
Net Assets 100.0% | | | | | | $ | 148,913,590 | |
| | | | | | | | |
aNon-income producing.
bSecurity was purchased pursuant to Regulation S under the Securities Act of 1933, which exempts from registration securities offered and sold outside of the United States. Such a security cannot be sold in the United States without either an effective registration statement filed pursuant to the Securities Act of 1933, or pursuant to an exemption from registration. These securities have been deemed liquid under guidelines approved by the Portfolio’s Board of Directors. At October 31, 2017, the aggregate value of these securities was $1,514,917, representing 1.0% of net assets.
| | | | | | |
franklintempleton.com | | The accompanying notes are an integral part of these financial statements. | Annual Report | | | 35 | |
FT (MAURITIUS) OFFSHORE INVESTMENTS LIMITED
Financial Statements
(Expressed in U.S. Dollars)
Statement of Assets and Liabilities
October 31, 2017
| | | | |
Assets: | | | | |
Investments in securities: | | | | |
Cost - Unaffiliated issuers | | | $100,515,267 | |
| | | | |
Value - Unaffiliated issuers | | | $142,991,527 | |
Cash | | | 12,687 | |
Foreign currency, at value (cost $7,473,049) | | | 7,486,216 | |
Receivables: | | | | |
Dividends | | | 87,829 | |
| | | | |
Total assets | | | 150,578,259 | |
| | | | |
Liabilities: | | | | |
Payables: | | | | |
Investment securities purchased | | | 523,835 | |
Capital shares redeemed | | | 103,987 | |
Management fees | | | 117,241 | |
Administrative fees | | | 3,478 | |
Deferred tax | | | 854,361 | |
Accrued expenses and other liabilities | | | 61,767 | |
| | | | |
Total liabilities | | | 1,664,669 | |
| | | | |
Net assets, at value | | | $148,913,590 | |
| | | | |
Shares outstanding | | | 8,579,992 | |
| | | | |
Net asset value per share. | | | $17.36 | |
| | | | |
| | | | |
36 | | Annual Report | The accompanying notes are an integral part of these financial statements. | | franklintempleton.com |
FT (MAURITIUS) OFFSHORE INVESTMENTS LIMITED
FINANCIAL STATEMENTS
(Expressed in U.S. Dollars)
Statement of Operations
for the year ended October 31, 2017
| | | | |
Investment income: | | | | |
Dividends: | | | | |
Unaffiliated issuers | | | $1,179,146 | |
| | | | |
Expenses: | | | | |
Management fees (Note 3a) | | | 1,256,221 | |
Administrative fees (Note 3b) | | | 38,890 | |
Custodian fees | | | 101,011 | |
Reports to shareholders | | | 1,500 | |
Registration and filing fees | | | 4,000 | |
Professional fees. | | | 27,583 | |
Directors’ fees and expenses | | | 10,000 | |
Other | | | 77,497 | |
| | | | |
Total expenses | | | 1,516,702 | |
| | | | |
Net investment income (loss) | | | (337,556 | ) |
| | | | |
Realized and unrealized gains (losses): | | | | |
Net realized gain (loss) from: | | | | |
Investments:# | | | | |
Unaffiliated issuers. | | | 6,551,372 | |
Foreign currency transactions | | | 70,031 | |
| | | | |
Net realized gain (loss) | | | 6,621,403 | |
| | | | |
Net change in unrealized appreciation (depreciation) on: | | | | |
Investments: | | | | |
Unaffiliated issuers. | | | 12,924,674 | |
Translation of other assets and liabilities denominated in foreign currencies | | | 15,800 | |
Change in deferred taxes on unrealized appreciation | | | (854,361 | ) |
| | | | |
Net change in unrealized appreciation (depreciation) | | | 12,086,113 | |
| | | | |
Net realized and unrealized gain (loss) | | | 18,707,516 | |
| | | | |
Net increase (decrease) in net assets resulting from operations | | | $18,369,960 | |
| | | | |
| | | | |
#Net of foreign taxes | | $ | 912 | |
| | | | | | |
franklintempleton.com | | The accompanying notes are an integral part of these financial statements. | Annual Report | | | 37 | |
FT (MAURITIUS) OFFSHORE INVESTMENTS LIMITED
FINANCIAL STATEMENTS
(Expressed in U.S. Dollars)
Statements of Changes in Net Assets
| | | | | | | | |
| | | Year Ended October 31, | |
| | |
| | | 2017 | | | 2016 | |
| | |
Increase (decrease) in net assets: | | | | | | | | |
Operations: | | | | | | | | |
Net investment income (loss) | | | $ (337,556 | ) | | | $ 761,350 | |
Net realized gain (loss) | | | 6,621,403 | | | | 3,705,134 | |
Net change in unrealized appreciation (depreciation) | | | 12,086,113 | | | | 6,192,908 | |
| | | | |
Net increase (decrease) in net assets resulting from operations. | | | 18,369,960 | | | | 10,659,392 | |
| | | | |
Capital share transactions (Note 2) | | | 17,138,470 | | | | (24,149,189 | ) |
| | | | |
Net increase (decrease) in net assets. | | | 35,508,430 | | | | (13,489,797 | ) |
Net assets: | | | | | | | | |
Beginning of year | | | 113,405,160 | | | | 126,894,957 | |
| | | | |
End of year | | | $148,913,590 | | | | $113,405,160 | |
| | | | |
| | | | |
38 | | Annual Report | The accompanying notes are an integral part of these financial statements. | | franklintempleton.com |
FT (MAURITIUS) OFFSHORE INVESTMENTS LIMITED
Notes to Financial Statements
(Expressed in U.S. Dollars)
1. Organization and Significant Accounting Policies
FT (Mauritius) Offshore Investments Limited (Portfolio) is registered with and regulated by the Mauritius Financial Services Commission and has elected to be treated as a disregarded entity for United States federal income tax purposes.
At October 31, 2017, Franklin India Growth Fund (Fund) owned 100% of the Portfolio.
The following summarizes the Portfolio’s significant accounting policies.
a. Financial Instrument Valuation
The Portfolio’s investments in financial instruments are carried at fair value daily. Fair value is the price that would be received to sell an asset or paid to transfer a liability in an orderly transaction between market participants on the measurement date. The Portfolio calculates the net asset value (NAV) per share as of 4 p.m. Eastern time each day the New York Stock Exchange (NYSE) is open for trading. Under compliance policies and procedures approved by the Fund’s Board of Trustees (the Board), the Fund’s administrator has responsibility for oversight of valuation, including leading the cross-functional Valuation Committee (VC). The VC provides administration and oversight of the Portfolio’s valuation policies and procedures, which are approved annually by the Board. Among other things, these procedures allow the Portfolio to utilize independent pricing services, quotations from securities and financial instrument dealers, and other market sources to determine fair value.
Equity securities listed on an exchange or on the NASDAQ National Market System are valued at the last quoted sale price or the official closing price of the day, respectively. Foreign equity securities are valued as of the close of trading on the foreign stock exchange on which the security is primarily traded, or as of 4 p.m. Eastern time. The value is then converted into its U.S. dollar equivalent at the foreign exchange rate in effect at 4 p.m. Eastern time on the day that the value of the security is determined. Over-the-counter (OTC) securities are valued within the range of the most recent quoted bid and ask prices. Securities that trade in multiple markets or on multiple
exchanges are valued according to the broadest and most representative market. Certain equity securities are valued based upon fundamental characteristics or relationships to similar securities.
The Portfolio follows the Fund’s procedures to determine the fair value of financial instruments for which market prices are not reliable or readily available. Under these procedures, the VC convenes on a regular basis to review such financial instruments and considers a number of factors, including significant unobservable valuation inputs, when arriving at fair value. The VC primarily employs a market-based approach which may use related or comparable assets or liabilities, recent transactions, market multiples, book values, and other relevant information for the investment to determine the fair value of the investment. An income-based valuation approach may also be used in which the anticipated future cash flows of the investment are discounted to calculate fair value. Discounts may also be applied due to the nature or duration of any restrictions on the disposition of the investments. Due to the inherent uncertainty of valuations of such investments, the fair values may differ significantly from the values that would have been used had an active market existed. The VC employs various methods for calibrating these valuation approaches including a regular review of key inputs and assumptions, transactional back-testing or disposition analysis, and reviews of any related market activity.
Trading in securities on foreign securities stock exchanges and OTC markets may be completed before 4 p.m. Eastern time. In addition, trading in certain foreign markets may not take place on every Portfolio’s business day. Occasionally, events occur between the time at which trading in a foreign security is completed and 4 p.m. Eastern time that might call into question the reliability of the value of a portfolio security held by the Portfolio. As a result, differences may arise between the value of the Portfolio’s securities as determined at the foreign market close and the latest indications of value at 4 p.m. Eastern time. In order to minimize the potential for these differences, the VC monitors price movements following the close of trading in foreign stock markets through a series of country specific market proxies (such as baskets of American Depositary Receipts, futures contracts and exchange traded funds). These price movements are measured against established trigger thresholds for each specific market proxy to assist in determining if an event has occurred that may call into question the reliability of the values of the foreign securities held by the
| | | | | | |
franklintempleton.com | | Annual Report | | | 39 | |
FT (MAURITIUS) OFFSHORE INVESTMENTS LIMITED
NOTES TO FINANCIAL STATEMENTS
(Expressed in U.S. Dollars)
1. Organization and Significant Accounting Policies (continued)
a. Financial Instrument Valuation (continued)
Portfolio. If such an event occurs, the securities may be valued using fair value procedures, which may include the use of independent pricing services.
When the last day of the reporting period is a non-business day, certain foreign markets may be open on those days that the Portfolio’s NAV is not calculated, which could result in differences between the value of the Portfolio’s securities on the last business day and the last calendar day of the reporting period. Any significant security valuation changes due to an open foreign market are adjusted and reflected by the Portfolio for financial reporting purposes.
b. Foreign Currency Translation
Portfolio securities and other assets and liabilities denominated in foreign currencies are translated into U.S. dollars based on the exchange rate of such currencies against U.S. dollars on the date of valuation. The Portfolio may enter into foreign currency exchange contracts to facilitate transactions denominated in a foreign currency. Purchases and sales of securities, income and expense items denominated in foreign currencies are translated into U.S. dollars at the exchange rate in effect on the transaction date. Portfolio securities and assets and liabilities denominated in foreign currencies contain risks that those currencies will decline in value relative to the U.S. dollar. Occasionally, events may impact the availability or reliability of foreign exchange rates used to convert the U.S. dollar equivalent value. If such an event occurs, the foreign exchange rate will be valued at fair value using procedures established and approved by the Board.
The Portfolio does not separately report the effect of changes in foreign exchange rates from changes in market prices on securities held. Such changes are included in net realized and unrealized gain or loss from investments in the Statement of Operations.
Realized foreign exchange gains or losses arise from sales of foreign currencies, currency gains or losses realized between the trade and settlement dates on securities transactions and the difference between the recorded amounts of dividends, interest, and foreign withholding taxes and the U.S. dollar equivalent of the amounts actually received or paid. Net unrealized foreign exchange gains and losses arise from changes in foreign
exchange rates on foreign denominated assets and liabilities other than investments in securities held at the end of the reporting period.
c. Income Taxes
The Portfolio conducts its investment activities in India as a tax resident of Mauritius. On April 1, 2017, the Indian General Anti Avoidance Rule (GAAR) became effective, as well as the amendment (Protocol) to the double taxation treaty (Treaty) between the Governments of India and Mauritius. The Protocol allows for capital gains arising on disposal of Indian shares acquired by a Mauritius company on or after April 1, 2017, to be taxed in accordance with tax regulations and rates that exist in the Indian market. When a capital gain tax is determined to apply, the Portfolio records an estimated deferred tax liability in the amount that would be payable if the securities were disposed of on the valuation date. Gains realized from shares acquired prior to April 1, 2017, are exempt from Indian tax under the Protocol.
Prior to April 1, 2017, the Portfolio received benefits under the Treaty. In order to obtain benefits under the Treaty, the Portfolio met certain tests and conditions, including the establishment of Mauritius tax residence and related requirements. Any company which was a tax resident of Mauritius was not subject to capital gains tax in India on the sale of Indian securities to the extent that such a Mauritius company did not have a permanent establishment in India. The Portfolio had obtained a certificate of tax residence from the Mauritius tax authorities, complied with the requirements of the Treaty, maintained its central management and control in Mauritius and therefore was able to obtain benefits as a Mauritius resident under the Treaty. There is no withholding tax on dividends distributed by Indian companies as per the Indian Tax Laws. Accordingly, no provision for Indian capital gains taxes or dividend withholding taxes were made.
The Portfolio holds a Category 1 Global Business Licence in Mauritius for the purpose of the Financial Services Act 2007 and under current laws and regulations, is subject to tax at the rate of 15% on its net income. However, the Portfolio is entitled to a deemed tax credit equivalent to the higher of actual foreign tax suffered or a presumed foreign tax equivalent of 80% of the Mauritian tax on its foreign source income. Thus, the effective tax rate in Mauritius should not exceed 3% (i.e. 15% less 80% of 15%). Indian companies making distributions are, however, liable to a dividend distribution tax equivalent to 20.358% of
| | | | |
40 | | Annual Report | | franklintempleton.com |
FT (MAURITIUS) OFFSHORE INVESTMENTS LIMITED
NOTES TO FINANCIAL STATEMENTS
(Expressed in U.S. Dollars)
the dividends distributed. A company holding at least 5% of the share capital of an Indian company and receiving dividends from that Indian company may claim a credit for tax paid by the Indian company on its profits out of which the dividends were distributed including the dividend distribution tax. No Mauritian capital gains tax is payable on profits arising from sale of securities, and any dividends and redemption proceeds paid by the Portfolio to its shareholders will be exempt from withholding or other tax in Mauritius. The Portfolio’s accounting policy in accordance with accounting principles generally accepted in the United States of America (U.S. GAAP) is to account for changes in tax laws when the laws are enacted.
d. Security Transactions, Investment Income and Expenses
Security transactions are accounted for on trade date. Realized gains and losses on security transactions are determined on a specific identification basis. Estimated expenses are accrued daily. Dividend income is recorded on the ex-dividend date except for certain dividends from securities where the dividend rate is not available. In such cases, the dividend is recorded as soon as the information is received by the Portfolio.
e. Accounting Estimates
The preparation of financial statements in accordance with U.S. GAAP requires management to make estimates and assumptions that affect the reported amounts of assets and liabilities at the date of the financial statements and the amounts of income and expenses during the reporting period. Actual results could differ from those estimates.
f. Guarantees and Indemnifications
Under tthe Portfolio’s organizational documents, the Portfolio’s officers and directors are indemnified by the Portfolio against certain liabilities arising out of the performance of their duties to the Portfolio. Additionally, in the normal course of business, the Portfolio enters into contracts with service providers that contain general indemnification clauses. The Portfolio’s maximum exposure under these arrangements is unknown as this would involve future claims that may be made against the Portfolio that have not yet occurred. Currently, the Portfolio expects the risk of loss to be remote.
2. Shares of Beneficial Interest
At October 31, 2017, there were an unlimited number of shares authorized (without par value). Transactions in the Portfolio’s shares were as follows:
| | | | | | | | | | | | | | | | |
| | | Year Ended October 31, | |
| | | 2017 | | | 2016 | |
| | | | Shares | | | | Amount | | | | Shares | | | | Amount | |
Shares sold | | | 3,126,026 | | | $ | 50,549,898 | | | | 518,972 | | | $ | 7,233,039 | |
Shares redeemed | | | (2,077,202 | ) | | | (33,411,428 | ) | | | (2,436,807 | ) | | | (31,382,228 | ) |
| | | | |
Net increase (decrease) | | | 1,048,824 | | | $ | 17,138,470 | | | | (1,917,835 | ) | | $ | (24,149,189 | ) |
| | | | |
3. Transactions with Affiliates
Franklin Resources, Inc. is the holding company of Franklin Advisers, Inc. (Advisers) which is the investment manager of the Portfolio.
| | | | | | |
franklintempleton.com | | Annual Report | | | 41 | |
FT (MAURITIUS) OFFSHORE INVESTMENTS LIMITED
NOTES TO FINANCIAL STATEMENTS
(Expressed in U.S. Dollars)
3. Transactions with Affiliates (continued)
a. Management Fees
The Portfolio pays an investment management fee to Advisers (directly and/or indirectly through the Fund). The total management fee is paid based on the average daily net assets of the Fund as follows:
| | |
| Annualized Fee Rate | | Net Assets |
1.300% | | Up to and including $1 billion |
1.250% | | Over $1 billion, up to and including $5 billion |
1.200% | | Over $5 billion, up to and including $10 billion |
1.150% | | Over $10 billion, up to and including $15 billion |
1.100% | | Over $15 billion, up to and including $20 billion |
1.050% | | In excess of $20 billion |
For the year ended October 31, 2017, the effective investment management fee rate was 1.300% of the Fund’s average daily net assets.
b. Administrative Fees
The Portfolio pays an administrative fee to International Financial Services Limited (IFS), a Mauritius company, an annual fee of $30,000 plus reimbursement of certain expenses. Certain directors of the Portfolio are also officers and/or directors of IFS.
4. Investment Transactions
Purchases and sales of investments (excluding short term securities) for the year ended October 31, 2017, aggregated $64,054,484 and $51,077,877, respectively.
5. Concentration of Risk
Investing in Indian equity securities may include certain risks and considerations not typically associated with investing in U.S. securities, such as fluctuating currency values, less liquidity, expropriation, confiscatory taxation, nationalization, exchange control regulations (including currency blockage), differing legal standards and changing local and regional economic, political and social conditions, which may result in greater market volatility.
6. Fair Value Measurements
The Portfolio follows a fair value hierarchy that distinguishes between market data obtained from independent sources (observable inputs) and the Portfolio’s own market assumptions (unobservable inputs). These inputs are used in determining the value of the Portfolio’s financial instruments and are summarized in the following fair value hierarchy:
| | • | | Level 1 – quoted prices in active markets for identical financial instruments |
| | • | | Level 2 – other significant observable inputs (including quoted prices for similar financial instruments, interest rates, prepayment speed, credit risk, etc.) |
| | • | | Level 3 – significant unobservable inputs (including the Portfolio’s own assumptions in determining the fair value of financial instruments) |
The input levels are not necessarily an indication of the risk or liquidity associated with financial instruments at that level.
| | | | |
42 | | Annual Report | | franklintempleton.com |
FT (MAURITIUS) OFFSHORE INVESTMENTS LIMITED
NOTES TO FINANCIAL STATEMENTS
(Expressed in U.S. Dollars)
For movements between the levels within the fair value hierarchy, the Portfolio has adopted a policy of recognizing the transfers as of the date of the underlying event which caused the movement.
At October 31, 2017, all of the Portfolio’s investments in financial instruments carried at fair value were valued using Level 1 inputs. For detailed categories, see the accompanying Statement of Investments.
7. Subsequent Events
The Portfolio has evaluated subsequent events through the issuance of the financial statements and determined that no events have occurred that require disclosure.
| | | | | | |
franklintempleton.com | | Annual Report | | | 43 | |
FT (MAURITIUS) OFFSHORE INVESTMENTS LIMITED
Report of Independent Registered Public Accounting Firm
To the Board of Directors and Shareholders of the FT (Mauritius) Offshore Investments Limited:
In our opinion, the accompanying statement of assets and liabilities, including the statement of investments, and the related statements of operations and of changes in net assets and the financial highlights present fairly, in all material respects, the financial position of the FT (Mauritius) Offshore Investments Limited (the “Portfolio”) as of October 31, 2017, the results of its operations for the year then ended, the changes in its net assets for each of the two years in the period then ended and the financial highlights for each of the five years in the period then ended, in conformity with accounting principles generally accepted in the United States of America. These financial statements and financial highlights (hereafter referred to as “financial statements”) are the responsibility of the Portfolio’s management. Our responsibility is to express an opinion on these financial statements based on our audits. We conducted our audits of these financial statements in accordance with the standards of the Public Company Accounting Oversight Board (United States). Those standards require that we plan and perform the audit to obtain reasonable assurance about whether the financial statements are free of material misstatement. An audit includes examining, on a test basis, evidence supporting the amounts and disclosures in the financial statements, assessing the accounting principles used and significant estimates made by management, and evaluating the overall financial statement presentation. We believe that our audits, which included confirmation of securities as of October 31, 2017 by correspondence with the custodian and brokers, provide a reasonable basis for our opinion.
PricewaterhouseCoopers LLP
San Francisco, California
December 18, 2017
| | | | |
44 | | Annual Report | | franklintempleton.com |
FRANKLIN TEMPLETON INTERNATIONAL TRUST
FRANKLIN INDIA GROWTH FUND
Shareholder Information
Proxy Voting Policies and Procedures
The Fund’s investment manager has established Proxy Voting Policies and Procedures (Policies) that the Fund uses to determine how to vote proxies relating to portfolio securities. Shareholders may view the Fund’s complete Policies online at franklintempleton.com. Alternatively, shareholders may request copies of the Policies free of charge by calling the Proxy Group collect at (954) 527-7678 or by sending a written request to: Franklin Templeton Companies, LLC, 300 S.E. 2nd Street, Fort Lauderdale, FL 33301, Attention: Proxy Group. Copies of the Fund’s proxy voting records are also made available online at franklintempleton.com and posted on the US Securities and Exchange Commission’s website at sec.gov and reflect the most recent 12-month period ended June 30.
Quarterly Statement of Investments
The Trust, on behalf of the Fund, files a complete statement of investments with the US Securities and Exchange Commission for the first and third quarters for each fiscal year on Form N-Q. Shareholders may view the filed Form N-Q by visiting the Commission’s website at sec.gov. The filed form may also be viewed and copied at the Commission’s Public Reference Room in Washington, DC. Information regarding the operations of the Public Reference Room may be obtained by calling (800) SEC-0330.
Householding of Reports and Prospectuses
You will receive the Fund’s financial reports every six months as well as an annual updated summary prospectus (prospectus available upon request). To reduce Fund expenses, we try to identify related shareholders in a household and send only one copy of the financial reports and summary prospectus. This process, called “householding,” will continue indefinitely unless you instruct us otherwise. If you prefer not to have these documents householded, please call us at (800) 632-2301. At any time you may view current prospectuses/summary prospectuses and financial reports on our website. If you choose, you may receive these documents through electronic delivery.
| | | | | | |
franklintempleton.com | | Annual Report | | | 45 | |
This page intentionally left blank.
This page intentionally left blank.
This page intentionally left blank.
| | |

| | Annual Report and Shareholder Letter |
| | Franklin India Growth Fund |
| | |
| | |
| | Investment Manager |
| | Franklin Advisers, Inc. |
| | |
| | Subadvisor |
| | Templeton Asset Management Ltd. |
| | |
| | Distributor |
| | Franklin Templeton Distributors, Inc. |
| | (800) DIAL BEN® / 342-5236 |
| | franklintempleton.com |
| | |
| | Shareholder Services |
| | (800) 632-2301 |
Authorized for distribution only when accompanied or preceded by a summary prospectus and/or prospectus. Investors should carefully consider a fund’s investment goals, risks, charges and expenses before investing. A prospectus contains this and other information; please read it carefully before investing.
To help ensure we provide you with quality service, all calls to and from our service areas are monitored and/or recorded.
| | |
| © 2017 Franklin Templeton Investments. All rights reserved. | | 141 A2017 12/17 |
(a) The Registrant has adopted a code of ethics that applies to its principal executive officers and principal financial and accounting officer.
(c) N/A
(d) N/A
(f) Pursuant to Item 12(a)(1), the Registrant is attaching as an exhibit a copy of its code of ethics that applies to its principal executive officers and principal financial and accounting officer.
| Item 3. | Audit Committee Financial Expert. |
(a)(1) The Registrant has an audit committee financial expert serving on its audit committee.
(2) The audit committee financial expert is John B. Wilson and he is “independent” as defined under the relevant Securities and Exchange Commission Rules and Releases.
| Item 4. | Principal Accountant Fees and Services. |
(a) Audit Fees
The aggregate fees paid to the principal accountant for professional services rendered by the principal accountant for the audit of the registrant’s annual financial statements or for services that are normally provided by the principal accountant in connection with statutory and regulatory filings or engagements were $44,669 for the fiscal year ended October 31, 2017 and $59,019 for the fiscal year ended October 31, 2016.
(b) Audit-Related Fees
There were no fees paid to the principal accountant for assurance and related services rendered by the principal accountant to the registrant that are reasonably related to the performance of the audit of the registrant’s financial statements and are not reported under paragraph (a) of Item 4.
There were no fees paid to the principal accountant for assurance and related services rendered by the principal accountant to the registrant’s investment adviser and any entity controlling, controlled by or under common control with the investment adviser that provides ongoing services to the registrant that are reasonably related to the performance of the audit of their financial statements.
(c) Tax Fees
There were no fees paid to the principal accountant for professional services rendered by the principal accountant to the registrant for tax compliance, tax advice and tax planning.
There were no fees paid to the principal accountant for professional services rendered by the principal accountant to the registrant’s investment adviser and any entity controlling, controlled by or under
common control with the investment adviser that provides ongoing services to the registrant for tax compliance, tax advice and tax planning.
(d) All Other Fees
There were no fees paid to the principal accountant for products and services rendered by the principal accountant to the registrant not reported in paragraphs (a)-(c) of Item 4.
The aggregate fees paid to the principal accountant for products and services rendered by the principal accountant to the registrant’s investment adviser and any entity controlling, controlled by or under common control with the investment adviser that provides ongoing services to the registrant not reported in paragraphs (a)-(c) of Item 4 were $14,000 for the fiscal year ended October 31, 2017 and $436,180 for the fiscal year ended October 31, 2016. The services for which these fees were paid included review of materials provided to the fund Board in connection with the investment management contract renewal process and derivatives assessments, review of system processes related to fixed income securities, and benchmarking services in connection with 2015 ICI TA Survey.
(e) (1) The registrant’s audit committee is directly responsible for approving the services to be provided by the auditors, including:
(i) pre-approval of all audit and audit related services;
(ii) pre-approval of all non-audit related services to be provided to the Fund by the auditors;
(iii) pre-approval of all non-audit related services to be provided to the registrant by the auditors to the registrant’s investment adviser or to any entity that controls, is controlled by or is under common control with the registrant’s investment adviser and that provides ongoing services to the registrant where the non-audit services relate directly to the operations or financial reporting of the registrant; and
(iv) establishment by the audit committee, if deemed necessary or appropriate, as an alternative to committee pre-approval of services to be provided by the auditors, as required by paragraphs (ii) and (iii) above, of policies and procedures to permit such services to be pre-approved by other means, such as through establishment of guidelines or by action of a designated member or members of the committee; provided the policies and procedures are detailed as to the particular service and the committee is informed of each service and such policies and procedures do not include delegation of audit committee responsibilities, as contemplated under the Securities Exchange Act of 1934, to management; subject, in the case of (ii) through (iv), to any waivers, exceptions or exemptions that may be available under applicable law or rules.
(e) (2) None of the services provided to the registrant described in paragraphs (b)-(d) of Item 4 were approved by the audit committee pursuant to paragraph (c)(7)(i)(C) of Rule 2-01 of regulation S-X.
(f) No disclosures are required by this Item 4(f).
(g) The aggregate non-audit fees paid to the principal accountant for services rendered by the principal accountant to the registrant and the registrant’s investment adviser and any entity controlling, controlled by or under common control with the investment adviser that provides ongoing services to the registrant were $14,000 for the fiscal year ended October 31, 2017 and $436,180 for the fiscal year ended October 31, 2016.
(h) The registrant’s audit committee of the board has considered whether the provision of non-audit services that were rendered to the registrant’s investment adviser (not including any sub-adviser whose role is primarily portfolio management and is subcontracted with or overseen by another investment adviser), and any entity controlling, controlled by, or under common control with the investment adviser that provides ongoing services to the registrant that were not pre-approved pursuant to paragraph (c)(7)(ii) of Rule 2-01 of Regulation S-X is compatible with maintaining the principal accountant’s independence.
| Item 5. | Audit Committee of Listed Registrants. N/A |
| Item 6. | Schedule of Investments. N/A |
| Item 7. | Disclosure of Proxy Voting Policies and Procedures for Closed-End Management Investment Companies. N/A |
| Item 8. | Portfolio Managers of Closed-End Management Investment Companies. N/A |
| Item 9. | Purchases of Equity Securities by Closed-End Management Investment Company and Affiliated Purchasers. N/A |
| Item 10. | Submission of Matters to a Vote of Security Holders. |
There have been no changes to the procedures by which shareholders may recommend nominees to the Registrant’s Board of Trustees that would require disclosure herein.
| Item 11. | Controls and Procedures. |
(a) Evaluation of Disclosure Controls and Procedures. The Registrant maintains disclosure controls and procedures that are designed to ensure that information required to be disclosed in the Registrant’s filings under the Securities Exchange Act of 1934 and the Investment Company Act of 1940 is recorded, processed, summarized and reported within the periods specified in the rules and forms of the Securities and Exchange Commission. Such information is accumulated and communicated to the Registrant’s management, including its principal executive officer and principal financial officer, as appropriate, to allow timely decisions regarding required disclosure. The Registrant’s
management, including the principal executive officer and the principal financial officer, recognizes that any set of controls and procedures, no matter how well designed and operated, can provide only reasonable assurance of achieving the desired control objectives.
Within 90 days prior to the filing date of this Shareholder Report on Form N-CSR, the Registrant had carried out an evaluation, under the supervision and with the participation of the Registrant’s management, including the Registrant’s principal executive officer and the Registrant’s principal financial officer, of the effectiveness of the design and operation of the Registrant’s disclosure controls and procedures. Based on such evaluation, the Registrant’s principal executive officer and principal financial officer concluded that the Registrant’s disclosure controls and procedures are effective.
(b) Changes in Internal Controls. There have been no changes in the Registrant’s internal controls or in other factors that could materially affect the internal controls over financial reporting subsequent to the date of their evaluation in connection with the preparation of this Shareholder Report on Form N-CSR.
(a) (1) Code of Ethics
(a) (2) Certifications pursuant to Section 302 of the Sarbanes-Oxley Act of 2002 of Matthew T. Hinkle, Chief Executive Officer—Finance and Administration, and Gaston Gardey, Chief Financial Officer and Chief Accounting Officer
(b) Certifications pursuant to Section 906 of the Sarbanes-Oxley Act of 2002 of Matthew T. Hinkle, Chief Executive Officer—Finance and Administration, and Gaston Gardey, Chief Financial Officer and Chief Accounting Officer
SIGNATURES
Pursuant to the requirements of the Securities Exchange Act of 1934 and the Investment Company Act of 1940, the registrant has duly caused this report to be signed on its behalf by the undersigned, thereunto duly authorized.
FRANKLIN TEMPLETON INTERNATIONAL TRUST
| | |
| |
| By | | /s/ Matthew T. Hinkle |
| | Matthew T. Hinkle |
| | Chief Executive Officer - Finance and Administration |
| Date | | December 27, 2017 |
Pursuant to the requirements of the Securities Exchange Act of 1934 and the Investment Company Act of 1940, this report has been signed below by the following persons on behalf of the registrant and in the capacities and on the dates indicated.
| | |
| By | | /s/ Matthew T. Hinkle |
| | Matthew T. Hinkle |
| | Chief Executive Officer - Finance and Administration |
| Date | | December 27, 2017 |
| |
| By | | /s/ Gaston Gardey |
| | Gaston Gardey |
| | Chief Financial Officer and Chief Accounting Officer |
| Date | | December 27, 2017 |