UNITEDSTATES
SECURITIESANDEXCHANGECOMMISSION
Washington,D.C.20549
FORM N-CSR
CERTIFIED SHAREHOLDER REPORT OF REGISTERED MANAGEMENT
INVESTMENT COMPANIES
Investment Company Act file number 811-06349
Name of Fund: BlackRock Latin America Fund, Inc.
Fund Address: 100 Bellevue Parkway, Wilmington, DE 19809
Name and address of agent for service: John M. Perlowski, Chief Executive Officer, BlackRock
Latin America Fund, Inc., 40 East 52nd Street, New York, NY 10022
Registrant’s telephone number, including area code: (800) 441-7762
Date of fiscal year end: 10/31/2010
Date of reporting period: 10/31/2010
Item 1 – Report to Stockholders

Annual Report
BlackRock Global Emerging Markets Fund, Inc.
BlackRock Latin America Fund, Inc.
BlackRock International Fund of BlackRock Series, Inc.
October 31, 2010
Not FDIC Insured • No Bank Guarantee • May Lose Value
| |
| Table of Contents | |
| | Page |
| Dear Shareholder | 3 |
| Annual Report: | |
| Fund Summaries | 4 |
| About Fund Performance | 10 |
| Disclosure of Expenses | 10 |
| Derivative Financial Instruments | 10 |
| Financial Statements: | |
| Schedules of Investments | 11 |
| Statements of Assets and Liabilities | 16 |
| Statements of Operations | 17 |
| Statements of Changes in Net Assets | 18 |
| Financial Highlights | 19 |
| Notes to Financial Statements | 25 |
| Report of Independent Registered Public Accounting Firm | 33 |
| Important Tax Information | 34 |
| Master Portfolio Information | 35 |
| Master Portfolio Financial Statements: | |
| Schedule of Investments | 36 |
| Statement of Assets and Liabilities | 38 |
| Statement of Operations | 39 |
| Statements of Changes in Net Assets | 40 |
| Master Portfolio Financial Highlights | 40 |
| Master Portfolio Notes to Financial Statements | 41 |
| Master Report of Independent Registered Public Accounting Firm | 44 |
| Disclosure of Investment Advisory Agreements and Sub-Advisory Agreements | 45 |
| Officers and Directors | 49 |
| Additional Information | 52 |
| Mutual Fund Family | 54 |
2 ANNUAL REPORT
OCTOBER 31, 2010
Dear Shareholder
The global economic recovery that began in 2009 has continued on its choppy course this year, delivering mixed but slowly improving economic data and
gradual if uneven improvement of investor sentiment. The risks of a double-dip recession continue to recede, but the economy remains mired in a slow-
growth environment. In the United States, the National Bureau of Economic Research declared that the “Great Recession” ended in June 2009. Spanning
December 2007 to June 2009, this marked the longest reported recession since the Great Depression. Structural problems of ongoing deleveraging and
weak spending among businesses and households weigh heavily on the pace of economic growth. The unemployment rate remains stubbornly high in the
face of sluggish job gains in the private sector. The US dollar, along with other developed market currencies, has experienced devaluation resulting from
aggressively easy monetary and fiscal policies. Given these long-standing conditions, the Federal Reserve Board has announced that additional policy
action will be taken to combat deflation and unemployment and promote economic growth.
The high levels of volatility experienced in global equity markets throughout 2009 continued into 2010 as mixed economic data and lingering credit issues
caused stocks to trade in both directions, but by the end of the first quarter, most markets had managed to post gains. The second quarter, in contrast,
brought higher levels of volatility and a “flight to quality” as investor sentiment was dominated by fears of a double-dip recession. Global equity markets
saw negative quarterly returns — and for many markets, the first significant downturn since the bull market began in March 2009. In the third quarter, eco-
nomic data turned less negative and strong corporate earnings reports became increasingly consistent. These factors, along with attractive valuations and
expectations for additional quantitative easing, drove equity markets higher, with most markets recapturing their second quarter losses. Stocks continued
their rally into the beginning of the fourth quarter, closing out the 12-month period in positive territory. International equities posted gains on both a six-
and 12-month basis. In the United States, both large and small cap equities posted robust gains for the 12-month period, while on a six-month basis,
large cap stocks remained relatively flat and small caps turned slightly negative.
In fixed income markets, yields fluctuated but declined significantly over the past 12 months amid heightened uncertainty. Weak economic data, lingering
credit problems and, near the end of the period, the expectation of additional quantitative easing drove interest rates lower and bond prices higher.
Treasuries rallied over the period, modestly outperforming the credit spread sectors of the market. Corporate credit spreads benefited from the low interest
rate environment and high yield fixed income became increasingly attractive due to declining default rates and better-than-expected results on European
bank stress tests. Tax-exempt municipal bonds performed well over the 12-month period, driven primarily by technical factors including favorable supply-
and-demand dynamics.
Cash investments, as represented by the 3-month Treasury bill, returned only a fraction over 0% for the 12-month period as short-term interest rates
remained low. Yields on money market securities remain near all-time lows.
| | |
| Against this backdrop, the major market averages posted the following returns: | | |
| Total Returns as of October 31, 2010 | 6-month | 12-month |
| US large cap equities (S&P 500 Index) | 0.74% | 16.52% |
| US small cap equities (Russell 2000 Index) | (1.24) | 26.58 |
| International equities (MSCI Europe, Australasia, Far East Index) | 5.74 | 8.36 |
| 3-month Treasury bill (BofA Merrill Lynch 3-Month Treasury Bill Index) | 0.08 | 0.12 |
| US Treasury securities (BofA Merrill Lynch 10-Year US Treasury Index) | 10.63 | 10.03 |
| US investment grade bonds (Barclays Capital US Aggregate Bond Index) | 5.33 | 8.01 |
| Tax-exempt municipal bonds (Barclays Capital Municipal Bond Index) | 3.95 | 7.78 |
| US high yield bonds (Barclays Capital US Corporate High Yield 2% Issuer Capped Index) | 6.73 | 19.10 |
Past performance is no guarantee of future results. Index performance shown for illustrative purposes only. You cannot invest directly in an index.
As global economic conditions continue to improve, investors across the world continue to face uncertainty about the future of economic growth. Through
periods of uncertainty, as ever, BlackRock’s full resources are dedicated to the management of our clients’ assets. For additional market perspective and
investment insight, visit www.blackrock.com/shareholdermagazine, where you’ll find the most recent issue of our award-winning Shareholder® magazine, as
well as its quarterly companion newsletter, Shareholder Perspectives. As always, we thank you for entrusting BlackRock with your investments, and we look
forward to your continued partnership in the months and years ahead.

THIS PAGE NOT PART OF YOUR FUND REPORT
3
Fund Summary as of October 31, 2010
BlackRock Global Emerging Markets Fund, Inc.
Portfolio Management Commentary
How did the Fund perform?
• The Fund generated positive results for the 12-month period ended
October 31, 2010, but underperformed its benchmark, the MSCI Emerging
Markets Index.
What factors influenced performance?
• The Fund’s underperformance relative to its benchmark was not attri-
butable to any particular factor. Notable individual securities that did not
perform as expected include Russian oil & gas producer OAO Gazprom,
which lagged the general market rally due to unresolved concerns around
the company’s plans to discontinue engaging in long-term contracts to
deliver gas supplies and begin trading in the spot market. Macau-based
casino operator Melco Crown Entertainment Ltd. fell on concerns that a
proposed government review of the country’s gaming industry would have a
negative impact on the company’s revenues; however, we expect Melco to
benefit from the region’s economic recovery and, as such, have retained
the position. Indian mobile telecommunications operator Reliance
Communications Ltd. also lost ground after the company cut its call
charges aggressively in connection with an ongoing tariff war with competi-
tors. Other Indian stocks that underperformed include construction compa-
nies Punj Lloyd Ltd. and Unitech Ltd., both of which reported disappointing
earnings in the fourth quarter of 2009.
• Indian stocks that contributed positively to performance include tobacco
company ITC Ltd. and, in financials, Axis Bank, which benefited from strong
loan growth, increasing profits and lower-than-expected default activity.
Brazilian consumer stock Lojas Renner SA also made a notable positive
impact on performance.
Describe recent portfolio activity.
• During the 12-month period, we increased the Fund’s exposure to Latin
America. In particular, we significantly increased exposure to Mexico with
the purchase of mobile telecommunications operator America Movil, SA de
CV, following its merger with Telmex. We believe the merger was fundamen-
tally misunderstood by the market and that the post-merger company will
have significant strengths versus its competitors as an integrated player. In
Brazil, we added to holdings in Itau Unibanco Holdings SA, which continues
to benefit from strong loan growth. Among Brazilian oil companies, we
established a new position in OGX Petroleo e Gas Participacoes SA, which
offers significant potential from its drilling program in the Campos and
Santos basins, and we reduced our position in Petrobras.
• Outside of Latin America, we exited our position in Russian oil company
Rosneft and added to Chinese oil & gas company CNOOC Ltd. Also in
China, we made new investments in companies benefiting from growth in
consumer demand, including the dominant mobile telecommunications
operator, China Mobile Ltd. We also added to holdings of Taiwanese
electronics manufacturer HON HAI Precision Industry Co., Ltd.
Describe Fund positioning at period end.
• At period end, the Fund was overweight relative to its benchmark in
consumer-related sectors and underweight in materials. From a geographic
perspective, the Fund was overweight in India, Brazil and Turkey and under-
weight in China, Korea and Taiwan. We remain cautious about China as we
are concerned about economic deceleration resulting from the govern-
ment’s policy on the property market.
The views expressed reflect the opinions of BlackRock as of the date of this report and are subject to change based on changes in market, economic or other conditions.
These views are not intended to be a forecast of future events and are no guarantee of future results.
| |
| Portfolio Information | |
| | Percent of |
| | Long-Term |
| Ten Largest Holdings | Investments |
| Itau Unibanco Holdings SA — ADR | 5% |
| America Movil, SA de CV — ADR | 4 |
| China Mobile Ltd | 4 |
| Vale SA — ADR | 3 |
| HON HAI Precision Industry Co., Ltd. | 3 |
| MTN Group Ltd. | 2 |
| CNOOC Ltd. | 2 |
| Cia de Bebidas das Americas, Preference Shares — ADR | 2 |
| Morgan Stanley Asia Products Ltd. (ITC Ltd.), due 7/03/14 | 2 |
| Samsung Electronics Co. Ltd | 2 |
| |
| | Percent of |
| | Long-Term |
| Geographic Allocation | Investments |
| Brazil | 19% |
| China | 13 |
| South Korea | 10 |
| Taiwan | 7 |
| South Africa | 7 |
| India | 7 |
| Russia | 6 |
| Mexico | 5 |
| Turkey | 5 |
| United States | 5 |
| Peru | 3 |
| Qatar | 2 |
| Indonesia | 2 |
| Thailand | 2 |
| Panama | 1 |
| Cayman Islands | 1 |
| Saudi Arabia | 1 |
| Poland | 1 |
| Israel | 1 |
| Luxembourg | 1 |
| Chile | 1 |
4 ANNUAL REPORT
OCTOBER 31, 2010
BlackRock Global Emerging Markets Fund, Inc.
Total Return Based on a $10,000 Investment

1 Assuming maximum sales charges, transaction costs and other operating expenses, including advisory fees. Institutional Shares do not have
a sales charge.
2 The Fund invests in securities, principally equities, of issuers in countries having smaller capital markets.
3 This unmanaged index measures the total returns of emerging foreign stock markets in Europe, Asia and the Far East.
| | | | | | | |
| Performance Summary for the Period Ended October 31, 2010 | | | | | | |
| | | | | Average Annual Total Returns4 | | |
| | | 1 Year | | 5 Years | | 10 Years |
| | 6-Month | w/o sales | w/sales | w/o sales | w/sales | w/o sales | w/sales |
| | Total Returns | charge | charge | charge | charge | charge | charge |
| Institutional | 10.63% | 21.28% | N/A | 14.14% | N/A | 13.28% | N/A |
| Investor A | 10.49 | 20.93 | 14.58% | 13.80 | 12.58% | 12.98 | 12.37% |
| Investor B | 10.01 | 19.92 | 15.42 | 12.87 | 12.63 | 12.26 | 12.26 |
| Investor C | 10.03 | 19.90 | 18.90 | 12.89 | 12.89 | 12.07 | 12.07 |
| MSCI Emerging Markets Index | 10.16 | 23.89 | N/A | 15.28 | N/A | 14.96 | N/A |
4 Assuming maximum sales charges, if any. Average annual total returns with and without sales charges reflect reductions for distribution and service fees. See “About Fund
Performance” on page 10 for a detailed description of share classes, including any related sales charges and fees.
N/A — Not applicable as share class and index do not have a sales charge.
| | | | | | | |
| Expense Example | | | | | | | |
| | | Actual | | | Hypothetical6 | | |
| | Beginning | Ending | | Beginning | Ending | | |
| | Account Value | Account Value | Expenses Paid | Account Value | Account Value | Expenses Paid | Annualized |
| | May 1, 2010 | October 31, 2010 | During the Period5 | May 1, 2010 | October 31, 2010 | During the Period5 | Expense Ratio |
| Institutional | $1,000.00 | $1,106.30 | $ 7.01 | $1,000.00 | $1,018.55 | $ 6.72 | 1.32% |
| Investor A | $1,000.00 | $1,104.90 | $ 8.75 | $1,000.00 | $1,016.88 | $ 8.39 | 1.65% |
| Investor B | $1,000.00 | $1,100.10 | $13.07 | $1,000.00 | $1,012.75 | $12.53 | 2.47% |
| Investor C | $1,000.00 | $1,100.30 | $13.34 | $1,000.00 | $1,012.50 | $12.78 | 2.52% |
5 For each share class of the Fund, expenses are equal to the annualized expense ratio for the class, multiplied by the average account value over the period, multiplied by 184/365
(to reflect the one-half year period shown).
6 Hypothetical 5% annual return before expenses is calculated by pro rating the number of days in the most recent fiscal half year divided by 365.
Past performance is not indicative of future results.
ANNUAL REPORT OCTOBER 31, 2010 5
Fund Summary as of October 31, 2010
BlackRock Latin America Fund, Inc.
Portfolio Management Commentary
How did the Fund perform?
• The Fund outperformed its benchmark, the MSCI Emerging Markets Latin
America Index, for the 12-month period ended October 31, 2010.
What factors influenced performance?
• Stock selection within Brazil was the primary contributor to performance
for the period. In particular, an underweight position in oil giant Petroleo
Brasileiro SA and overweight allocations to banks Itau Unibanco Holdings
SA and Banco Bradesco SA helped relative performance. Also benefiting
results was a non-benchmark holding of Canadian-listed Colombian oil
company Pacific Rubiales Energy Corp. Stock selection in Mexico and Chile,
and overweight exposure to Peru and Panama-based Copa Holdings SA,
also had a positive impact on performance.
• Detracting from performance was an underweight exposure to Chile and
Colombia. Both of these markets performed well, despite their unattractive
valuations, due to significant purchasing activity from local pension funds.
Describe recent portfolio activity.
• During the 12-month period, we exited positions in Brazilian steel and pulp
& paper companies, which reduced the Fund’s exposure to Brazil. Our pur-
chase of non-benchmark stock Pacific Rubiales Energy Corp. initiated Fund
exposure to Colombia. We increased exposure to Chile (primarily consumer
exposure) and Peru (through increased mining exposure). The Fund’s expo-
sure to Argentina was reduced when we exited our position in Tenaris.
Describe Fund positioning at period end.
• At period end, the Fund remains positioned to benefit from domestic growth,
especially in Brazil where the Fund’s notable overweights are in the financial
and consumer areas, with particular emphasis on homebuilders. Following
the conclusion of the presidential election in Brazil, its market continues to
trade at attractive multiples relative to other emerging markets. Mexico, on
the other hand, continues to face strong headwinds given that its economy
is highly dependent on economic growth in the United States, which has
been subpar. Mexican stocks are trading at a premium relative to the aver-
age for emerging markets on a relative value basis. Increasing concerns
about security incidents also present challenges for Mexico. Chile continues
to trade at a significant premium relative to most markets in the world.
• We continue to maintain selective positions in the smaller markets of the
Latin American region. Overall, we continue to believe that Latin America
in general, and Brazil specifically, offers a favorable combination of strong
top-down story and attractive bottom-up valuation, resulting in our bullish
view of the region.
The views expressed reflect the opinions of BlackRock as of the date of this report and are subject to change based on changes in market, economic or other conditions.
These views are not intended to be a forecast of future events and are no guarantee of future results.
| |
| Portfolio Information | |
| | Percent of |
| | Long-Term |
| Ten Largest Holdings | Investments |
| Vale SA — ADR | 9% |
| Itau Unubanco Holdings SA — ADR | 9 |
| Petroleo Brasileiro SA — ADR | 9 |
| America Movil, SA de CV — ADR | 9 |
| Banco Bredesco SA — ADR | 5 |
| Cia de Bebidas das Americas, Preference Shares — ADR | 4 |
| OGX Petroleo e Gas Participacoes SA | 4 |
| Fomento Economico Mexicano, SA de CV — ADR | 3 |
| Itausa-Investimentos Itau SA, Preference Shares | 2 |
| Cia De Minas Buenaventura SA — ADR | 2 |
| |
| | Percent of |
| | Long-Term |
| Geographic Allocation | Investments |
| Brazil | 72% |
| Mexico | 17 |
| Peru | 4 |
| Chile | 3 |
| Colombia | 2 |
| Panama | 1 |
| Argentina | 1 |
6 ANNUAL REPORT
OCTOBER 31, 2010
BlackRock Latin America Fund, Inc.
Total Return Based on a $10,000 Investment
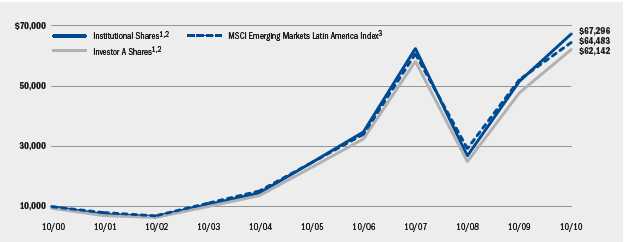
1 Assuming maximum sales charges, if any, transaction costs and other operating expenses, including advisory fees. Institutional Shares do not have
a sales charge.
2 The Fund invests primarily in Latin America equity and debt securities.
3 This unmanaged market-capitalization-weighted index by Morgan Stanley Capital International is comprised of a representative sampling of stocks of
large-, medium-, and small-capitalization companies in Argentina, Brazil, Chile and Mexico, which are freely purchasable by foreign investors.
| | | | | | | |
| Performance Summary for the Period Ended October 31, 2010 | | | | | | |
| | | | | Average Annual Total Returns4 | | |
| | | 1 Year | | 5 Years | | 10 Years |
| | 6-Month | w/o sales | w/sales | w/o sales | w/sales | w/o sales | w/sales |
| | Total Returns | charge | charge | charge | charge | charge | charge |
| Institutional | 15.85% | 30.52% | N/A | 22.35% | N/A | 21.00% | N/A |
| Investor A | 15.70 | 30.15 | 23.32% | 22.02 | 20.71% | 20.69 | 20.04% |
| Investor B | 15.23 | 29.06 | 24.56 | 21.01 | 20.82 | 19.93 | 19.93 |
| Investor C | 15.24 | 29.15 | 28.15 | 21.07 | 21.07 | 19.74 | 19.74 |
| MSCI Emerging Markets Latin America Index | 10.34 | 23.75 | N/A | 21.31 | N/A | 20.49 | N/A |
4 Assuming maximum sales charges, if any. Average annual total returns with and without sales charges reflect reductions for distribution and service fees. See “About Fund
Performance” on page 10 for a detailed description of share classes, including any related sales charges and fees.
N/A — Not applicable as share class and index do not have a sales charge.
| | | | | | | |
| Expense Example | | | | | | | |
| | | Actual | | | Hypothetical6 | | |
| | Beginning | Ending | | Beginning | Ending | | |
| | Account Value | Account Value | Expenses Paid | Account Value | Account Value | Expenses Paid | Annualized |
| | May 1, 2010 | October 31, 2010 | During the Period5 | May 1, 2010 | October 31, 2010 | During the Period5 | Expense Ratio |
| Institutional | $1,000.00 | $1,158.50 | $ 6.91 | $1,000.00 | $1,018.80 | $ 6.46 | 1.27% |
| Investor A | $1,000.00 | $1,157.00 | $ 8.37 | $1,000.00 | $1,017.44 | $ 7.83 | 1.54% |
| Investor B | $1,000.00 | $1,152.30 | $12.75 | $1,000.00 | $1,013.35 | $11.93 | 2.35% |
| Investor C | $1,000.00 | $1,152.40 | $12.75 | $1,000.00 | $1,013.35 | $11.93 | 2.35% |
5 For each class of the Fund, expenses are equal to the expense ratio for the class, multiplied by the average account value over the period, multiplied by 184/365 (to reflect the
one-half year period shown).
6 Hypothetical 5% annual return before expenses is calculated by pro rating the number of days in the most recent fiscal half year divided by 365.
Past performance is not indicative of future results.
ANNUAL REPORT OCTOBER 31, 2010 7
Fund Summary as of October 31, 2010
BlackRock International Fund of BlackRock Series, Inc.
Portfolio Management Commentary
How did the Fund perform?
• Effective March 1, 2010, the Fund changed its primary benchmark from
the MSCI EAFE Index to the MSCI All Country World Index ex-US. Fund
management believes the MSCI All Country World Index ex-US is more
representative of the industry standard benchmark for funds with similar
investment strategies.
• For the 12-month period ended October 31, 2010, the Fund, through its
investment in BlackRock Master International Portfolio (the “Portfolio”)
outperformed both the MSCI All Country World Index ex-US and its former
benchmark, the MSCI EAFE Index. The following discussion of relative
performance pertains to the MSCI All Country World Index ex-US.
What factors influenced performance?
• A combination of stock selection and sector allocation contributed positively
to the Fund’s outperformance for the period. The Fund benefited from an
overweight in consumer-related sectors and an underweight in the weak
financials sector.
• With respect to individual stocks, Taiwanese smartphone manufacturer HTC
Corp. was the largest contributor to performance after reporting strong
growth in shipments, which were aided by increasing demand stemming
from the global economic recovery. Furthermore, in the consumer area,
Macau-based casino operator Sands China Ltd. performed well on sharply
increasing casino revenues in the world’s gambling hub. The Swatch Group
Ltd. benefited from positive economic news from Switzerland suggesting that
increasing export activity, supported by the resilient emerging market con-
sumer, was helping the recovery gain traction. Focus Media Holding Ltd. and
German vehicle manufacturer Daimler AG also contributed positively.
• The Portfolio’s position in Greek retail bank EFG Eurobank Ergasis SA
detracted from performance following downgrades to Greece’s sovereign
debt. Exposure to the energy sector also detracted as share prices declined
for companies associated with the oil spill in the Gulf of Mexico, including
holdings of Transocean Ltd., which was directly related to the spill.
Describe recent portfolio activity.
• Recently we have focused on the emerging market consumer, high quality
stocks offering high yields and the recovery in corporate capital expenditure.
Notable purchases include Rogers Communications, Inc., a leading
Canadian wireless and cable company with attractive growth prospects. We
increased the Portfolio’s exposure to Latin America through the purchase of
Telefonica SA, which offers a substantial dividend yield. We also purchased
the South American e-commerce company MercadoLibre Inc., which we
believe is well positioned to benefit from consumer growth in the region.
• Among the stocks we sold during the period, the most notable was Nestle
SA, which was sold on strength. We reduced the Portfolio’s exposure to
European financial stocks through sales of 3i Group Plc, ING Groep NV
CVA and UniCredit SpA.
Describe Portfolio positioning at period end.
• We continue to believe the mix of economic indicators is commensurate
with a period of sustained, but subdued, global growth, rather than a “dou-
ble-dip” recession. We note that many companies currently have huge oper-
ational leverage to support their growth, and weakness in equity markets has
allowed us to buy strong companies, trading below what we regard as fair
value. We continue to favor companies that we believe offer growth at a rea-
sonable price while our focus remains on the resilient and growing emerging
market consumer, particularly in Asia and Latin America, and corporate capi-
tal expenditure, as companies are playing catch-up following the recession,
particularly with respect to their investment in information technology.
The views expressed reflect the opinions of BlackRock as of the date of this report and are subject to change based on changes in market, economic or other conditions.
These views are not intended to be a forecast of future events and are no guarantee of future results.
8 ANNUAL REPORT
OCTOBER 31, 2010
BlackRock International Fund of BlackRock Series, Inc.
Total Return Based on a $10,000 Investment

1 Assuming maximum sales charges, transaction costs and other operating expenses, including administration fees, if any. Institutional Shares do not have a
sales charge.
2 The Fund invests all of its assets in BlackRock Master International Portfolio of BlackRock Master LLC. The Portfolio invests primarily in a diversified portfolio
of equity securities of companies located outside of the United States.
3 This unmanaged broad-based index measures the total returns of developed foreign stock markets in Europe, Australasia and the Far East.
4 This market capitalization weighted index is designed to provide a broad measure of stock performance throughout the world, with the exception of
US-based companies. The index includes both developed and emerging markets. The Fund now uses this index as its benchmark rather than the
MSCI EAFE Index because Fund management believes it is more representative of the industry standard benchmark for funds with similar strategies.
| | | | | | | |
| Performance Summary for the Period Ended October 31, 2010 | | | | | | |
| | | | | Average Annual Total Returns5 | | |
| | | 1 Year | | 5 Years | | 10 Years |
| | 6-Month | w/o sales | w/sales | w/o sales | w/sales | w/o sales | w/sales |
| | Total Returns | charge | charge | charge | charge | charge | charge |
| Institutional | 13.30% | 17.87% | N/A | 4.48% | N/A | 2.42% | N/A |
| Investor A | 13.24 | 17.66 | 11.48% | 4.17 | 3.05% | 2.13 | 1.58% |
| Investor B | 12.55 | 16.31 | 11.81 | 3.10 | 2.74 | 1.44 | 1.44 |
| Investor C | 12.78 | 16.73 | 15.73 | 3.41 | 3.41 | 1.35 | 1.35 |
| MSCI EAFE Index | 5.74 | 8.36 | N/A | 3.31 | N/A | 3.17 | N/A |
| MSCI All Country World Index ex-US | 6.48 | 12.62 | N/A | 5.74 | N/A | 5.02 | N/A |
5 Assuming maximum sales charges, if any. Average annual total returns with and without sales charges reflect reductions for distribution and service fees. See “About Fund
Performance” on page 10 for a detailed description of share classes, including any related sales charges and fees.
N/A — Not applicable as share class and index do not have a sales charge.
| | | | | | | |
| Expense Example | | | | | | | |
| | | Actual | | | Hypothetical7 | | |
| | Beginning | Ending | | Beginning | Ending | | |
| | Account Value | Account Value | Expenses Paid | Account Value | Account Value | Expenses Paid | Annualized |
| | May 1, 2010 | October 31, 2010 | During the Period6 | May 1, 2010 | October 31, 2010 | During the Period6 | Expense Ratio |
| Institutional | $1,000.00 | $1,133.00 | $ 9.46 | $1,000.00 | $1,016.33 | $ 8.94 | 1.76% |
| Investor A | $1,000.00 | $1,132.40 | $11.18 | $1,000.00 | $1,014.71 | $10.56 | 2.08% |
| Investor B | $1,000.00 | $1,125.50 | $16.88 | $1,000.00 | $1,009.32 | $15.95 | 3.15% |
| Investor C | $1,000.00 | $1,127.80 | $14.96 | $1,000.00 | $1,011.14 | $14.14 | 2.79% |
6 For each class of the Fund, expenses are equal to the expense ratio for the class, multiplied by the average account value over the period, multiplied by 184/365 (to reflect the
one-half year period shown).
7 Hypothetical 5% annual return before expenses is calculated by pro rating the number of days in the most recent fiscal half year divided by 365.
Past performance is not indicative of future results.
ANNUAL REPORT OCTOBER 31, 2010 9
About Fund Performance
• Institutional Shares are not subject to any sales charge. Institutional
Shares bear no ongoing distribution or service fees and are available only
to eligible investors.
• Investor A Shares incur a maximum initial sales charge (front-end load) of
5.25% and a service fee of 0.25% per year (but no distribution fee).
• Investor B Shares are subject to a maximum contingent deferred sales
charge of 4.50% declining to 0% after six years. In addition, Investor B
Shares are subject to a distribution fee of 0.75% per year and a service
fee of 0.25% per year. These shares automatically convert to Investor A
Shares after approximately eight years. (There is no initial sales charge
for automatic share conversions.) All returns for periods greater than
eight years reflect this conversion. Investor B Shares of the Funds are
only available through exchanges and dividend reinvestments by existing
shareholders or for purchase by certain qualified employee benefit plans.
• Investor C Shares are subject to a distribution fee of 0.75% and a service
fee of 0.25%. In addition, Investor C Shares are subject to a 1% contingent
deferred sales charge if redeemed within one year of purchase.
Performance information reflects past performance and does not guarantee
future results. Current performance may be lower or higher than the per-
formance data quoted. Refer to www.blackrock.com/funds to obtain per-
formance data current to the most recent month-end. Performance results
do not reflect the deduction of taxes that a shareholder would pay on fund
distributions or the redemption of fund shares. The Funds may charge a 2%
redemption fee for sales or exchanges of shares within 30 days of pur-
chase or exchange. Performance data does not reflect this potential fee.
Figures shown in the performance tables on pages 5, 7 and 9 assume
reinvestment of all dividends and capital gain distributions, if any, at net
asset value on the ex-dividend date. Investment return and principal value
of shares will fluctuate so that shares, when redeemed, may be worth more
or less than their original cost. Dividends paid to each class of shares will
vary because of the different levels of service, distribution and transfer
agency fees applicable to each class, which are deducted from the income
available to be paid to shareholders.
Disclosure of Expenses
Shareholders of these Funds may incur the following charges: (a) expenses
related to transactions, including sales charges, redemption fees and
exchange fees; and (b) operating expenses including advisory fees, dis-
tribution fees including 12b-1 fees and other Fund expenses. The expense
examples on pages 5, 7 and 9 (which are based on a hypothetical invest-
ment of $1,000 invested on May 1, 2010 and held through October 31,
2010) are intended to assist shareholders both in calculating expenses
based on an investment in the Funds and in comparing these expenses
with similar costs of investing in other mutual funds.
The tables provide information about actual account values and actual
expenses. In order to estimate the expenses a shareholder paid during the
period covered by this report, shareholders can divide their account value
by $1,000 and then multiply the result by the number corresponding to
their share class under the heading “Expenses Paid During the Period.”
The tables also provide information about hypothetical account values and
hypothetical expenses based on each Fund’s actual expense ratio and an
assumed rate of return of 5% per year before expenses. In order to assist
shareholders in comparing the ongoing expenses of investing in these
Funds and other funds, compare the 5% hypothetical examples with the
5% hypothetical examples that appear in other funds’ shareholder reports.
The expenses shown in the tables are intended to highlight shareholders’
ongoing costs only and do not reflect any transactional expenses, such as
sales charges, redemption fees or exchange fees. Therefore, the hypotheti-
cal examples are useful in comparing ongoing expenses only, and will not
help shareholders determine the relative total expenses of owning different
funds. If these transactional expenses were included, shareholder expenses
would have been higher.
Derivative Financial Instruments
The Funds and Portfolio may invest in various derivative instruments,
including foreign currency exchange contracts and options, as specified
in Note 2 of the Notes to Financial Statements, which constitute forms
of economic leverage. Such instruments are used to obtain exposure to a
market without owning or taking physical custody of securities or to hedge
market, equity and/or foreign currency exchange rate risks. Such derivative
instruments involve risks, including the imperfect correlation between the
value of a derivative instrument and the underlying asset, possible default
of the counterparty to the transaction and illiquidity of the derivative instru-
ment. The Funds’ and Portfolio’s ability to successfully use a derivative
instrument depends on the investment advisor’s ability to accurately
predict pertinent market movements, which cannot be assured. The use
of derivative instruments may result in losses greater than if they had
not been used, may require the Funds and Portfolio to sell or purchase
portfolio securities at inopportune times or at distressed values, may limit
the amount of appreciation the Funds and Portfolio can realize on an
investment or may cause the Funds and Portfolio to hold a security that
they might otherwise sell. The Funds’ and Portfolio’s investments in these
instruments are discussed in detail in the Notes to Financial Statements.
10 ANNUAL REPORT
OCTOBER 31, 2010
Schedule of Investments October 31, 2010
BlackRock Global Emerging Markets Fund, Inc.
(Percentages shown are based on Net Assets)
| | |
| Common Stocks | Shares | Value |
| Brazil — 19.1% | | |
| Cia de Bebidas das Americas, Preference | | |
| Shares — ADR | 52,018 | $ 7,242,986 |
| Cia de Concessoes Rodoviarias | 168,010 | 4,545,351 |
| Cia Energetica de Minas Gerais — ADR | 273,203 | 4,873,942 |
| Cyrela Brazil Realty SA | 355,444 | 4,887,538 |
| Itau Unibanco Holdings SA — ADR | 638,261 | 15,675,690 |
| Lojas Renner SA | 87,243 | 3,461,397 |
| OGX Petroleo e Gas Participacoes SA (a) | 431,000 | 5,634,964 |
| Petroleo Brasileiro SA — ADR | 97,934 | 3,054,561 |
| Vale SA — ADR | 351,990 | 10,112,673 |
| | | 59,489,102 |
| Chile — 0.5% | | |
| Empresa Nacional de Telecomunicaciones SA | 98,000 | 1,558,704 |
| China — 14.3% | | |
| Bank of China Ltd. | 9,772,000 | 5,869,372 |
| CNOOC Ltd. | 3,501,000 | 7,309,101 |
| China Coal Energy Co. | 2,373,000 | 4,126,006 |
| China Mobile Ltd. | 1,108,000 | 11,315,243 |
| Ctrip.com International Ltd. — ADR (a) | 61,563 | 3,205,586 |
| Focus Media Holding Ltd. — ADR (a) | 184,579 | 4,568,330 |
| Melco Crown Entertainment Ltd. — ADR (a) | 693,117 | 4,345,844 |
| Want Want China Holdings Ltd. | 3,890,000 | 3,595,451 |
| | | 44,334,933 |
| Egypt — 0.3% | | |
| Orascom Construction Industries — GDR | 12,285 | 570,325 |
| Orascom Construction Industries | 5,704 | 259,763 |
| | | 830,088 |
| Indonesia — 1.5% | | |
| Bank Rakyat Indonesia Tbk PT | 3,746,000 | 4,795,904 |
| Israel — 1.1% | | |
| Teva Pharmaceutical Industries Ltd. — ADR | 65,405 | 3,394,519 |
| Luxembourg — 0.9% | | |
| Oriflame Cosmetics SA — SDR | 48,744 | 2,762,429 |
| Mexico — 5.2% | | |
| America Movil, SA de CV — ADR | 227,564 | 13,030,315 |
| Fomento Economico Mexicano, SA de CV — ADR | 57,719 | 3,169,350 |
| | | 16,199,665 |
| Panama — 1.2% | | |
| Copa Holdings SA, Class A | 73,947 | 3,751,331 |
| Peru — 2.6% | | |
| Cia de Minas Buenaventura SA — ADR | 92,840 | 4,924,233 |
| Credicorp Ltd. | 24,019 | 3,023,512 |
| | | 7,947,745 |
| Poland — 1.1% | | |
| Bank Pekao SA | 53,872 | 3,516,338 |
| Russia — 5.6% | | |
| Evraz Group SA — GDR (a) | 123,000 | 3,729,360 |
| MMC Norilsk Nickel — ADR | 172,379 | 3,208,024 |
| OAO Gazprom — ADR | 145,829 | 3,186,364 |
| Uralkali — GDR | 125,624 | 3,104,166 |
| VTB Bank OJSC — GDR | 69,009 | 456,839 |
| VimpelCom Ltd. — ADR (a) | 240,281 | 3,683,508 |
| | | 17,368,261 |
| South Africa — 7.1% | | |
| | |
| Common Stocks | Shares | Value |
| African Bank Investments Ltd. | 834,725 | $ 4,278,281 |
| Aveng Ltd. | 500,827 | 3,147,995 |
| Foschini Ltd. | 280,968 | 3,407,937 |
| MTN Group Ltd. | 420,922 | 7,572,361 |
| Tiger Brands Ltd. | 141,727 | 3,799,271 |
| | | 22,205,845 |
| South Korea — 9.5% | | |
| Celltrion, Inc. (a) | 78,008 | 1,728,367 |
| Doosan Infracore Co. Ltd. (a) | 224,880 | 5,564,956 |
| Hyundai Mobis | 21,868 | 5,445,802 |
| LG Chem Ltd. | 14,656 | 4,535,046 |
| NHN Corp. (a) | 19,138 | 3,386,028 |
| Samsung Electronics Co., Ltd. | 9,017 | 5,982,110 |
| Shinhan Financial Group Co., Ltd. | 78,113 | 3,026,114 |
| | | 29,668,423 |
| Taiwan — 7.2% | | |
| Acer, Inc. | 1,147,000 | 3,340,187 |
| Delta Electronics, Inc. | 1,024,000 | 4,230,387 |
| HON HAI Precision Industry Co., Ltd. | 2,022,280 | 7,648,336 |
| Taiwan Semiconductor Manufacturing Co., Ltd. | 2,341,000 | 4,816,165 |
| Taiwan Semiconductor Manufacturing | | |
| Co., Ltd. — ADR | 220,580 | 2,406,528 |
| | | 22,441,603 |
| Thailand — 1.5% | | |
| Banpu PCL | 63,200 | 1,636,270 |
| Kasikornbank PCL | 754,500 | 2,949,884 |
| | | 4,586,154 |
| Turkey — 4.6% | | |
| Koza Altin Isletmeleri AS | 254,801 | 3,015,183 |
| Sekerbank TAS | 1,335,074 | 1,674,027 |
| Turk Hava Yollari (a) | 633,076 | 2,598,669 |
| Turkiye Garanti Bankasi AS | 381,535 | 2,303,126 |
| Yapi ve Kredi Bankasi (a) | 1,284,833 | 4,846,161 |
| | | 14,437,166 |
| Total Common Stocks — 83.3% | | 259,288,210 |
| | Par | |
| Structured Notes | (000) | |
| India — 6.9% | | |
| Deutsche Bank AG: | | |
| (Axis Bank), due 8/17/17 | $ 146 | 4,791,411 |
| (Lanco Infratech Ltd.), due 11/23/16 (a) | 2,522 | 3,591,861 |
| Morgan Stanley Asia Products Ltd. (ITC Ltd.), | | |
| due 7/03/14 | 1,676 | 6,457,940 |
| Morgan Stanley BV (Rolta India Ltd.), due 5/26/14 | 479 | 1,800,439 |
| UBS AG (Glenmark Pharmaceuticals Ltd.), | | |
| due 12/18/12 | 621 | 4,733,778 |
| | | 21,375,429 |
| Qatar — 2.3% | | |
| Deutsche Bank AG (Commercial Bank of Qatar Inc.), | | |
| due 5/26/17 | 142 | 3,249,000 |
| Morgan Stanley BV (Industries Qatar), due 11/30/10 | 120 | 3,793,540 |
| | | 7,042,540 |
| Saudi Arabia — 1.1% | | |
| | | | |
| Portfolio Abbreviations | | | | |
| To simplify the listings of portfolio holdings in | ADR | American Depositary Receipts | KRW | South Korean Won |
| the Schedules of Investments, the names and | BRL | Brazilian Real | MXN | Mexican Peso |
| descriptions of many of the securities have been | CAD | Canadian Dollar | SDR | Swedish Depositary Receipts |
| abbreviated according to the following list: | CLP | Chilean Peso | USD | US Dollar |
| | GDR | Global Depositary Receipts | ZAR | South African Rand |
| See Notes to Financial Statements. | | | | |
ANNUAL REPORT
OCTOBER 31, 2010
11
Schedule of Investments (continued)
BlackRock Global Emerging Markets Fund, Inc.
(Percentages shown are based on Net Assets)
| | |
| | Par | |
| Structured Notes | (000) | Value |
| HSBC Bank Plc: | | |
| (Abdullah Al Othaim Markets), due 9/05/11 | $ 97 | $ 1,830,008 |
| (Co. for Cooperative Insurance), due 9/24/11 (a) | 66 | 1,754,634 |
| | | 3,584,642 |
| United States — 4.5% | | |
| Citigroup Global Markets Holdings, Inc.: | | |
| (United Phosphorus), due 10/24/12 | 709 | 3,166,735 |
| (Yes Bank Ltd.) due 10/24/12 (a) | 385 | 3,098,865 |
| JPMorgan Structured Products BV (Larsen | | |
| & Toubro) due 9/08/14 (a) | 102 | 4,631,820 |
| UBS AG (Unitech Ltd.), due 6/16/11 (a) | 1,639 | 3,201,655 |
| | | 14,099,075 |
| Total Structured Notes — 14.8% | | 46,101,686 |
| Total Long-Term Investments | | |
| (Cost — $242,095,153) — 98.1% | | 305,389,896 |
| Short-Term Securities | Shares | |
| Time Deposits — 0.8% | | |
| United States — 0.8% | | |
| Brown Brothers Harriman & Co., 0.11%, 11/01/2010 | 2,398 | 2,397,891 |
| Money Market Fund — 0.8% | | |
| BlackRock Liquidity Funds, TempFund, Institutional | | |
| Class, 0.21% (b)(c) | 2,579,161 | 2,579,161 |
| Total Short-Term Securities | | |
| (Cost — $4,977,052) — 1.6% | | 4,977,052 |
| Total Investments (Cost — $247,072,205*) — 99.7% | | 310,366,948 |
| Other Assets Less Liabilities — 0.3% | | 1,002,742 |
| Net Assets — 100.0% | | $ 311,369,690 |
* The cost and unrealized appreciation (depreciation) of investments as of
October 31, 2010, as computed for federal income tax purposes, were as follows:
| |
| Aggregate cost | $ 252,829,837 |
| Gross unrealized appreciation | $ 58,794,013 |
| Gross unrealized depreciation | (1,256,902) |
| Net unrealized appreciation | $ 57,537,111 |
(a) Non-income producing security.
(b) Investments in companies considered to be an affiliate of the Fund during the
year, for purposes of Section 2(a)(3) of the Investment Company Act of 1940, as
amended, were as follows:
| | | | |
| | Shares Held at | Shares Held at | |
| | October 31, | Net | October 31, | |
| Affiliate | 2009 | Activity | 2010 | Income |
| BlackRock Liquidity | | | | |
| Funds, TempFund, | | | | |
| Institutional Class | 6,661,505 | (4,082,344) | 2,579,161 | $8,582 |
| (c) Represents the current yield as of report date. | | |
• Foreign currency exchange contracts as of October 31, 2010 were as follows:
| | | | | | | |
| Currency | Currency | | Settlement Unrealized |
| Purchased | | Sold | Counterparty Date | Depreciation |
| USD | 2,694,160 | KRW 3,033,220,342 | Brown | | | |
| | | | | Brothers | | | |
| | | | | Harriman & Co. 11/01/2010 | $(1,437) |
| ZAR | 3,201,072 | USD | 463,225 | JPMorgan | | |
| | | | | Chase | | | |
| | | | | Bank NA | 11/01/2010 | (6,256) |
| CLP 771,509,606 | USD | 1,586,163 | Brown | | | |
| | | | | Brothers | | | |
| | | | | Harriman & Co. 11/02/2010 | (8,917) |
| Total | | | | | | $ (16,610) |
See Notes to Financial Statements.
12 ANNUAL REPORT
OCTOBER 31, 2010
Schedule of Investments (concluded)
BlackRock Global Emerging Markets Fund, Inc.
• Fair Value Measurements — Various inputs are used in determining the fair value of
investments and derivatives, which are as follows:
• Level 1 — price quotations in active markets/exchanges for identical assets
and liabilities
• Level 2 — other observable inputs (including, but not limited to: quoted prices
for similar assets or liabilities in markets that are active, quoted prices for iden-
tical or similar assets or liabilities in markets that are not active, inputs other
than quoted prices that are observable for the assets or liabilities (such as
interest rates, yield curves, volatilities, prepayment speeds, loss severities, credit
risks and default rates) or other market-corroborated inputs)
• Level 3 — unobservable inputs based on the best information available in the
circumstances, to the extent observable inputs are not available (including the
Fund’s own assumptions used in determining the fair value of investments
and derivatives)
The inputs or methodologies used for valuing securities are not necessarily an
indication of the risk associated with investing in those securities. For information
about the Fund’s policy regarding valuation of investments and other significant
accounting policies, please refer to Note 1 of the Notes to Financial Statements.
The following tables summarize the inputs used as of October 31, 2010 in deter-
mining the fair valuation of the Fund’s investments and derivatives:
| | | | |
| Valuation Inputs | Level 1 | Level 2 | Level 3 | Total |
| Assets: | | | | |
| Investments in | | | | |
| Securities: | | | | |
| Common Stocks: | | | | |
| Brazil | $ 59,489,102 | — | — | $ 59,489,102 |
| Chile | 1,558,704 | — | — | 1,558,704 |
| China | 12,119,760 | $ 32,215,173 | — | 44,334,933 |
| Egypt | 570,325 | 259,763 | — | 830,088 |
| Indonesia | — | 4,795,904 | — | 4,795,904 |
| Israel | 3,394,519 | — | — | 3,394,519 |
| Luxembourg | — | 2,762,429 | — | 2,762,429 |
| Mexico | 16,199,665 | — | — | 16,199,665 |
| Panama | 3,751,331 | — | — | 3,751,331 |
| Peru | 7,947,745 | — | — | 7,947,745 |
| Poland | — | 3,516,338 | — | 3,516,338 |
| Russia | 17,368,261 | — | — | 17,368,261 |
| South Africa | — | 22,205,845 | — | 22,205,845 |
| South Korea . | — | 29,668,423 | — | 29,668,423 |
| Taiwan | 2,406,528 | 20,035,075 | — | 22,441,603 |
| Thailand | — | 4,586,154 | — | 4,586,154 |
| Turkey | — | 14,437,166 | — | 14,437,166 |
| Structured Notes: | | | | |
| India | — | — | $ 21,375,429 | 21,375,429 |
| Qatar | — | — | 7,042,540 | 7,042,540 |
| Saudi Arabia . | — | — | 3,584,642 | 3,584,642 |
| United States | — | — | 14,099,075 | 14,099,075 |
| Short-Term | | | | |
| Securities: | | | | |
| Time Deposits | — | 2,397,891 | — | 2,397,891 |
| Money Market | | | | |
| Fund | 2,579,161 | — | — | 2,579,161 |
| Total | $127,385,101 | $136,880,161 | $ 46,101,686 | $310,366,948 |
| | | | | |
| Derivative Financial Instruments1 |
|
| Valuation Inputs | Level 1 | Level 2 | Level 3 | | Total |
| Liabilities: | | | | | |
| Foreign | | | | | |
| currency | | | | | |
| exchange | | | | | |
| contracts | — | $(16,610) | — | | $(16,610) |
1 Derivative financial instruments are foreign currency exchange contracts.
Foreign currency exchange contracts are shown at the unrealized appreciation/
depreciation on the instrument.
The following table is a reconciliation of Level 3 investments for which significant
unobservable inputs were used in determining fair value:
| |
| | Structured |
| | Notes |
| Assets: | |
| Balance, as of October 31, 2009 | $ 18,760,194 |
| Accrued discounts/premiums | — |
| Net realized gain (loss) | 426,583 |
| Net change in unrealized appreciation/depreciation2 | 6,789,812 |
| Purchases | 43,587,833 |
| Sales | (23,462,736) |
| Transfers in3 | — |
| Transfers out3 | — |
| Balance, as of October 31, 2010 | $ 46,101,686 |
2 Included in the related net change in unrealized appreciation/depreciation
in the Statements of Operations. The change in unrealized appreciation/
depreciation on securities still held at October 31, 2010 was $6,540,830.
3 The Fund’s policy is to recognize transfers in and transfers out as of the end of
the period of the event or the change in circumstances that caused the transfer.
See Notes to Financial Statements.
ANNUAL REPORT
OCTOBER 31, 2010
13
Schedule of Investments October 31, 2010
BlackRock Latin America Fund, Inc.
(Percentages shown are based on Net Assets)
| | |
| Common Stocks | Shares | Value |
| Argentina — 0.6% | | |
| Ternium SA — ADR | 170,000 | $ 5,827,600 |
| Brazil — 66.4% | | |
| AES Tiete SA | 179,000 | 2,091,825 |
| AES Tiete SA, Preference Shares | 184,000 | 2,553,902 |
| Anhanguera Educaional Participacoes SA | 545,000 | 10,660,883 |
| BM&F Bovespa SA | 1,860,000 | 15,511,851 |
| BR Malls Participacoes SA | 530,000 | 4,978,004 |
| BR Properties SA | 580,000 | 5,618,185 |
| Banco ABC Brasil SA, Preference Shares | 505,000 | 4,648,150 |
| Banco Bradesco SA — ADR | 2,550,000 | 53,040,000 |
| Banco do Brasil SA | 1,050,000 | 20,329,354 |
| Banco Industrial e Comercial SA, Preference Shares | 555,000 | 5,144,269 |
| Bradespar SA, Preference Shares | 795,000 | 20,105,276 |
| Cia de Bebidas das Americas, Preference | | |
| Shares — ADR | 308,000 | 42,885,920 |
| Cia de Concessoes Rodoviarias | 475,000 | 12,850,673 |
| Cia Energetica de Minas Gerais — ADR (a) | 615,000 | 10,971,600 |
| Cia Energetica de Minas Gerais, Preference Shares | 49,000 | 858,790 |
| Cia Energetica de Sao Paulo, Preference ‘B’ Shares | 610,000 | 9,543,022 |
| Cyrela Brazil Realty SA | 1,390,000 | 19,113,215 |
| Diagnosticos da America SA | 387,000 | 4,700,082 |
| Hypermarcas SA (b) | 860,000 | 14,212,786 |
| Iguatemi Empresa de Shopping Centers SA | 105,000 | 2,455,949 |
| Iochpe-Maxion SA | 555,000 | 8,029,759 |
| Itau Unibanco Holdings SA — ADR | 3,840,000 | 94,310,400 |
| Itau Unibanco Holdings SA — ADR (c) | 500,000 | 12,280,000 |
| Itausa-Investimentos Itau SA, Preference Shares | 2,760,000 | 21,605,364 |
| Light SA | 187,000 | 2,355,784 |
| Localiza Rent A Car SA | 625,000 | 10,347,439 |
| Lojas Renner SA | 50,000 | 1,983,768 |
| MRV Engenharia e Participacoes SA | 220,000 | 2,141,387 |
| Marcopolo SA, Preference Shares | 665,000 | 2,659,531 |
| Metalfrio Solutions SA | 165,000 | 1,211,080 |
| Multiplus SA | 570,000 | 9,554,196 |
| Natura Cosmeticos SA | 2,000 | 57,166 |
| OGX Petroleo e Gas Participacoes SA (b) | 2,782,300 | 36,376,245 |
| PDG Realty SA Empreendimentos e Participacoes | 1,450,000 | 17,951,244 |
| Petroleo Brasileiro SA — ADR | 3,010,000 | 93,881,900 |
| Profarma Distribuidora de Produtos | | |
| Farmaceuticos SA | 362,000 | 3,534,200 |
| Rossi Residencial SA | 274,000 | 2,686,338 |
| Tim Participacoes SA — ADR | 149,000 | 4,806,740 |
| Totvs SA | 57,000 | 5,172,675 |
| Tractebel Energia SA | 357,000 | 5,375,051 |
| Vale SA — ADR | 3,425,000 | 98,400,250 |
| Weg SA | 202,000 | 2,637,417 |
| | | 699,631,670 |
| Chile — 3.5% | | |
| Banco Santander Chile SA — ADR (a) | 132,000 | 12,228,480 |
| Empresa Nacional de Electricidad SA — ADR | 112,000 | 5,976,320 |
| Empresa Nacional de Telecomunicaciones SA | 298,000 | 4,739,732 |
| Empresas La Polar SA | 278,000 | 1,982,856 |
| Lan Airlines SA | 159,000 | 4,939,191 |
| SACI Falabella | 725,000 | 7,262,598 |
| | | 37,129,177 |
| Colombia — 1.6% | | |
| Pacific Rubiales Energy Corp. (b) | 535,000 | 17,053,486 |
| Mexico — 16.9% | | |
| America Movil, SA de CV — ADR | 1,570,000 | 89,898,200 |
| Banco Compartamos SA de CV | 645,500 | 4,547,983 |
| Empresas ICA Sociedad Controladora, SA de CV (b) | 915,000 | 2,412,731 |
| Fomento Economico Mexicano, SA de CV — ADR | 565,000 | 31,024,150 |
| Genomma Lab Internacional SA de CV (b) | 3,520,000 | 7,585,617 |
| Grupo Mexico, SA de CV | 4,310,000 | 14,195,635 |
| | | |
| Common Stocks | | Shares | Value |
| Mexico (concluded) | | | |
| Grupo Televisa, SA — ADR | 780,000 | $ 17,511,000 |
| Wal-Mart de Mexico, SA de CV | 4,070,000 | 11,140,752 |
| | | | 178,316,068 |
| Panama — 1.0% | | | |
| Copa Holdings SA, Class A | 208,000 | 10,551,840 |
| Peru — 4.0% | | | |
| Cia de Minas Buenaventura SA — ADR | 405,000 | 21,481,200 |
| Credicorp Ltd. | | 83,000 | 10,448,040 |
| Southern Copper Corp. | 252,000 | 10,785,600 |
| | | | 42,714,840 |
| Total Common Stocks — 94.0% | | | 991,224,681 |
| | | Par | |
| Corporate Bonds | | (000) | |
| Brazil — 0.1% | | | |
| Lupatech SA, 6.50%, 4/15/18 (d) | BRL | 2,128 | 1,266,510 |
| Total Corporate Bonds — 0.1% | | | 1,266,510 |
| Structured Notes | | | |
| Brazil — 4.2% | | | |
| Deutsche Bank AG (Cyrela Brazil Realty SA), | | | |
| due 6/09/15 | USD | 325 | 4,466,800 |
| Morgan Stanley BV: | | | |
| (Cyrela Brazil Realty SA Empreendimentos e | | | |
| Participacoes), due 4/05/12 | | 400 | 5,552,400 |
| (Hypermarcas SA), due 6/12/11 | | 25 | 416,168 |
| (Itausa — Investimentos Itau SA), due 4/05/12 | 6 | 46,583 |
| (Lojas Renner SA), due 11/17/10 | | 400 | 16,216,080 |
| (Lojas Renner SA), due 3/04/11 | | 50 | 2,030,920 |
| (Lojas Renner SA), due 7/29/11 | | 33 | 1,322,356 |
| (MRV Engenharia e Participacoes SA) | | | |
| due 10/29/12 | | 425 | 4,126,580 |
| (Natura Cosmetico SA), due 7/29/11 | | 95 | 2,744,901 |
| (Natura Cosmeticos SA), due 10/29/12 | | 27 | 761,057 |
| (OGX Petroleo e Gas Participacoes SA), | | | |
| due 4/05/12 | | 162 | 2,118,707 |
| (PDG Realty SA), due 4/05/12 | | 177 | 2,205,526 |
| (Rossi Residencial SA), due 4/05/12 | | 200 | 1,988,540 |
| Total Structured Notes — 4.2% | | | 43,996,618 |
| Total Long-Term Investments | | | |
| (Cost — $654,332,313) — 98.3% | | | 1,036,487,809 |
| Short-Term Securities | | Shares | |
| BlackRock Liquidity Funds, TempFund, | | | |
| Institutional Class, 0.21% (e)(f) | 5,978,803 | $ 5,978,803 |
| | Beneficial | |
| | | Interest | |
| | | (000) | |
| BlackRock Liquidity Series, LLC Money | | | |
| Market Series, 0.39% (e)(f)(g) | USD | 62,122 | 62,121,755 |
| Total Short-Term Securities | | | |
| (Cost — $68,100,558) — 6.5% | | | 68,100,558 |
| Total Investments (Cost — $722,432,871*) — 104.8% | | 1,104,588,367 |
| Liabilities in Excess of Other Assets — (4.8)% | | | (50,534,016) |
| Net Assets — 100.0% | | | $1,054,054,351 |
See Notes to Financial Statements.
14 ANNUAL REPORT
OCTOBER 31, 2010
Schedule of Investments (concluded)
BlackRock Latin America Fund, Inc.
* The cost and unrealized appreciation (depreciation) of investments as of
October 31, 2010, as computed for federal income tax purposes, were as follows:
| |
| Aggregate cost | $ 769,430,741 |
| Gross unrealized appreciation | $ 338,404,175 |
| Gross unrealized depreciation | (3,246,549) |
| Net unrealized appreciation | $ 335,157,626 |
(a) Security, or a portion of security, is on loan.
(b) Non-income producing security.
(c) Security exempt from registration under Rule 144A of the Securities Act of 1933.
These securities may be resold in transactions exempt from registration to qualified
institutional investors.
(d) Convertible security.
(e) Investments in companies considered to be an affiliate of the Fund during the
year, for purposes of Section 2(a)(3) of the Investment Company Act of 1940, as
amended, were as follows:
| | | | | | |
| | Shares/Beneficial | | Shares/Beneficial | |
| | Interest Held at | Net | Interest Held at | |
| Affiliate | October 31, 2009 | Activity | October 31, 2010 | Income |
| BlackRock Liquidity | | | | | |
| Funds, TempFund, | | | | | |
| Institutional Class | 9,596,587 | (3,617,784) 5,978,803 | $ 13,219 |
| BlackRock | | | | | | |
| Liquidity Series, | | | | | |
| LLC Money | | | | | | |
| Market Series | $156,541,250 | $(94,419,495) | $62,121,755 | $ 158,589 |
(f) Represents the current yield as of report date.
(g) Security was purchased with the cash collateral from loaned securities.
• Foreign currency exchange contracts as of October 31, 2010 were as follows:
| | | | | | |
| | | | | | | Unrealized |
| Currency | Currency | | Settlement | Appreciation |
| Purchased | | Sold | Counterparty | Date | (Depreciation) |
| USD | 153,157 | CAD | 158,104 | State Street | | |
| | | | | Global Markets | 11/01/10 | $ (1,862) |
| USD | 275,784 | MXN | 3,441,914 | State Street | | |
| | | | | Global Markets | 11/01/10 | (2,959) |
| USD | 126,050 | CLP | 61,310,912 | Brown Brothers | | |
| | | | | Harriman & Co. | 11/02/10 | 709 |
| Total | | | | | | $ (4,112) |
• Fair Value Measurements — Various inputs are used in determining the fair value of
investments and derivatives, which are as follows:
• Level 1 — price quotations in active markets/exchanges for identical assets
and liabilities
• Level 2 — other observable inputs (including, but not limited to: quoted prices
for similar assets or liabilities in markets that are active, quoted prices for iden-
tical or similar assets or liabilities in markets that are not active, inputs other
than quoted prices that are observable for the assets or liabilities (such as
interest rates, yield curves, volatilities, prepayment speeds, loss severities, credit
risks and default rates) or other market-corroborated inputs)
• Level 3 — unobservable inputs based on the best information available in the
circumstances, to the extent observable inputs are not available (including the
Fund’s own assumptions used in determining the fair value of investments
and derivatives)
The inputs or methodologies used for valuing securities are not necessarily an
indication of the risk associated with investing in those securities. For information
about the Fund’s policy regarding valuation of investments and other significant
accounting policies, please refer to Note 1 of the Notes to Financial Statements.
The following tables summarize the inputs used as of October 31, 2010 in deter-
mining the fair valuation of the Fund’s investments and derivatives:
| | | | | | |
| Valuation Inputs | | Level 1 | Level 2 | | Level 3 | Total |
| Assets: | | | | | | |
| Investments in | | | | | | |
| Securities: | | | | | | |
| Common Stocks: | | | | | | |
| Argentina | $ 5,827,600 | — | | — | $ 5,827,600 |
| Brazil | 699,631,670 | — | | — | 699,631,670 |
| Chile | 37,129,177 | — | | — | 37,129,177 |
| Colombia | 17,053,486 | — | | — | 17,053,486 |
| Mexico | 178,316,068 | — | | — | 178,316,068 |
| Panama | 10,551,840 | — | | — | 10,551,840 |
| Peru | 42,714,840 | — | | — | 42,714,840 |
| Corporate | | | | | | |
| Bonds | | — | — | $ 1,266,510 | 1,266,510 |
| Structured | | | | | | |
| Notes | | — | — | | 43,996,618 | 43,996,618 |
| Short-Term | | | | | | |
| Securities | | 5,978,803 | $62,121,755 | — | 68,100,558 |
| Total | $997,203,484 | $62,121,755 | $45,263,128 | $1,104,588,367 |
| Derivative Financial Instruments1 |
|
| Valuation Inputs | | Level 1 | Level 2 | | Level 3 | Total |
| Assets: | | | | | | |
| Foreign currency | | | | | |
| exchange contracts | — | $ 709 | — | $ 709 |
| Liabilities: | | | | | | |
| Foreign currency | | | | | |
| exchange contracts | — | (4,821) | — | (4,821) |
| Total | | — | $ (4,112) | — | $ (4,112) |
1 Derivative financial instruments are foreign currency exchange contracts.
Foreign currency exchange contracts are shown at the unrealized appreciation/
depreciation on the instrument.
The following table is a reconciliation of Level 3 investments for which significant
unobservable inputs were used in determining fair value:
| | | |
| | Corporate | Structured | |
| | Bonds | Notes | Total |
| Assets: | | | |
| Balance, as of October 31, 2009 | $ 1,753,383 | $ 20,909,528 | $ 22,662,911 |
| Accrued discounts/premiums | — | — | — |
| Net realized gain (loss) | — | 6,239,023 | 6,239,023 |
| Net change in unrealized | | | |
| appreciation/depreciation2 | (209,321) | 3,528,997 | 3,319,676 |
| Purchases | — | 31,464,465 | 31,464,465 |
| Sales | (277,552) | (18,145,395) | (18,422,947) |
| Transfers in3 | — | — | — |
| Transfers out3 | — | — | — |
| Balance, as of October 31, 2010 | $ 1,266,510 | $ 43,996,618 | $ 45,263,128 |
2 Included in the related net change in unrealized appreciation/depreciation in
the Statements of Operations. The change in unrealized appreciation/deprecia-
tion on securities still held at October 31, 2010 was $8,108,613.
3 The Fund’s policy is to recognize transfers in and transfers out as of the end of
the period of the event or the change in circumstances that caused the transfer.
See Notes to Financial Statements.
ANNUAL REPORT
OCTOBER 31, 2010
15
| | | |
| Statements of Assets and Liabilities | | | |
| | BlackRock | BlackRock | |
| | Global Emerging | Latin | BlackRock |
| | Markets | America | International |
| October 31, 2010 | Fund, Inc. | Fund, Inc. | Fund |
| Assets | | | |
| Investments at value — unaffiliated1,2 | $ 307,787,787 | $1,036,487,809 | — |
| Investment at value — Master International Portfolio of BlackRock Master LLC (the “Portfolio”) (cost $55,070,995) | — | — | $ 65,317,863 |
| Investments at value — affiliated3 | 2,579,161 | 68,100,558 | — |
| Unrealized appreciation on foreign currency exchange contracts | — | 709 | — |
| Foreign currency at value4 | 2,569,700 | 453,292 | — |
| Investments sold receivable | 2,695,597 | 18,093,901 | — |
| Capital shares sold receivable | 828,894 | 12,668,076 | 125,279 |
| Dividends receivable | 324,484 | 2,834,111 | — |
| Prepaid expenses | 26,668 | 33,375 | 29,681 |
| Interest receivable | — | 44,130 | — |
| Securities lending income receivable — affiliated | — | 15,503 | — |
| Other assets | 226 | 828 | — |
| Total assets | 316,812,517 | 1,138,732,292 | 65,472,823 |
| Liabilities | | | |
| Collateral on securities loaned, at value | — | 62,121,755 | — |
| Unrealized depreciation on foreign currency exchange contracts | 16,610 | 4,821 | — |
| Investments purchased payable | 4,120,437 | 10,696,522 | — |
| Capital shares redeemed payable | 746,587 | 9,862,657 | 83,520 |
| Investment advisory fees payable | 250,499 | 821,763 | — |
| Deferred foreign capital gain tax | 67,906 | 340,017 | — |
| Distribution fees payable | 62,378 | 305,840 | 27,314 |
| Other affiliates payable | 3,883 | 16,181 | 399 |
| Officer's and Directors' fees payable | 72 | 226 | 9 |
| Administration fees payable | — | — | 12,760 |
| Contributions payable to the Portfolio | — | — | 41,759 |
| Other accrued expenses payable | 172,415 | 475,579 | 93,032 |
| Other liabilities payable | 2,040 | 32,580 | — |
| Total liabilities | 5,442,827 | 84,677,941 | 258,793 |
| Net Assets | $ 311,369,690 | $1,054,054,351 | $ 65,214,030 |
| Net Assets Consist of | | | |
| Paid-in capital | $ 291,691,709 | $ 774,888,939 | $ 90,080,994 |
| Undistributed (accumulated) net investment income (loss) | 728,820 | 858,976 | (181,468) |
| Accumulated net realized loss | (44,249,792) | (103,567,727) | — |
| Net unrealized appreciation/depreciation | 63,198,953 | 381,874,163 | — |
| Accumulated net realized loss allocated from the Portfolio | — | — | (34,932,364) |
| Net unrealized appreciation/depreciation allocated from the Portfolio | — | — | 10,246,868 |
| Net Assets | $ 311,369,690 | $1,054,054,351 | $ 65,214,030 |
| 1 Investments at cost — unaffiliated | $ 244,493,044 | $ 654,332,313 | — |
| 2 Securities loaned at value | — | $ 60,150,176 | — |
| 3 Investments at cost — affiliated | $ 2,579,161 | $ 68,100,558 | — |
| 4 Foreign currency at cost | $ 2,565,394 | $ 505,207 | — |
| Net Asset Value | | | |
| Institutional: | | | |
| Net assets | $ 123,006,574 | $ 200,980,363 | $ 2,645,253 |
| Shares outstanding, 100 million shares authorized | 5,999,481 | 2,667,164 | 205,656 |
| Par value per share | $ 0.10 | $ 0.10 | $ 0.0001 |
| Net asset value | $ 20.50 | $ 75.35 | $ 12.86 |
| Investor A: | | | |
| Net assets | $ 144,975,779 | $ 616,663,759 | $ 37,034,532 |
| Shares outstanding, 100 million shares authorized | 7,320,005 | 8,325,046 | 2,926,117 |
| Par value per share | $ 0.10 | $ 0.10 | $ 0.0001 |
| Net asset value | $ 19.81 | $ 74.07 | $ 12.66 |
| Investor B: | | | |
| Net assets | $ 4,676,611 | $ 18,660,469 | $ 11,898,336 |
| Shares outstanding, 100 million shares authorized | 264,168 | 269,218 | 1,005,069 |
| Par value per share | $ 0.10 | $ 0.10 | $ 0.0001 |
| Net asset value | $ 17.70 | $ 69.31 | $ 11.84 |
| Investor C: | | | |
| Net assets | $ 38,710,726 | $ 217,749,760 | $ 13,635,909 |
| Shares outstanding, 100 million shares authorized | 2,246,910 | 3,206,039 | 1,136,142 |
| Par value per share | $ 0.10 | $ 0.10 | $ 0.0001 |
| Net asset value | $ 17.23 | $ 67.92 | $ 12.00 |
| See Notes to Financial Statements. | | | |
16 ANNUAL REPORT
OCTOBER 31, 2010
| | | |
| Statements of Operations | | | |
| | BlackRock | BlackRock | |
| | Global Emerging | Latin | BlackRock |
| | Markets | America | International |
| Year Ended October 31, 2010 | Fund, Inc. | Fund, Inc. | Fund |
| Investment Income | | | |
| Interest | $ 333 | $ 103,092 | — |
| Dividends | 5,729,503 | 22,934,876 | — |
| Foreign taxes withheld | (498,564) | (1,815,019) | — |
| Dividends — affiliated | 8,582 | 13,219 | — |
| Securities lending — affiliated | — | 158,589 | — |
| Investment income allocated from the Portfolio: | | | |
| Dividends | — | — | $ 1,101,708 |
| Income — affiliated | — | — | 3,121 |
| Foreign taxes withheld | — | — | (100,924) |
| Expenses | — | — | (658,508) |
| Total income | 5,239,854 | 21,394,757 | 345,397 |
| Expenses | | | |
| Investment advisory | 2,534,474 | 8,414,848 | — |
| Service — Investor A | 313,782 | 1,234,845 | 78,963 |
| Service and distribution — Investor B | 46,551 | 179,981 | 157,602 |
| Service and distribution — Investor C | 317,446 | 1,807,260 | 124,824 |
| Transfer agent — Institutional | 98,974 | 171,372 | 9,493 |
| Transfer agent — Investor A | 219,594 | 729,196 | 98,780 |
| Transfer agent — Investor B | 12,094 | 44,372 | 106,818 |
| Transfer agent — Investor C | 84,047 | 343,330 | 35,247 |
| Administration | — | — | 159,676 |
| Custodian | 173,348 | 458,785 | — |
| Professional | 120,245 | 77,795 | 64,523 |
| Accounting services | 99,914 | 255,461 | — |
| Registration | 88,732 | 131,007 | 55,846 |
| Printing | 45,132 | 109,935 | 20,484 |
| Officer and Directors | 10,909 | 22,783 | 33 |
| Miscellaneous | 32,975 | 45,286 | 13,186 |
| Total expenses | 4,198,217 | 14,026,256 | 925,475 |
| Less fees waived by advisor | (3,315) | (5,031) | — |
| Total expenses after fees waived | 4,194,902 | 14,021,225 | 925,475 |
| Net investment income (loss) | 1,044,952 | 7,373,532 | (580,078) |
| Realized and Unrealized Gain (Loss) | | | |
| Net realized gain (loss) from: | | | |
| Investments | 30,105,7511 | 52,842,3272 | — |
| Foreign currency transactions | (438,825) | (1,568,796) | — |
| Investments and foreign currency transactions allocated from the Portfolio | — | — | 6,856,088 |
| | 29,666,926 | 51,273,531 | 6,856,088 |
| Net change in unrealized appreciation/depreciation on: | | | |
| Investments | 20,408,0403 | 155,280,2664 | — |
| Foreign currency transactions | (26,827) | 96,356 | — |
| Investments and foreign currency transactions allocated from the Portfolio | — | — | 2,749,700 |
| | 20,381,213 | 155,376,622 | 2,749,700 |
| Total realized and unrealized gain | 50,048,139 | 206,650,153 | 9,605,788 |
| Net Increase in Net Assets Resulting from Operations | $ 51,093,091 | $ 214,023,685 | $ 9,025,710 |
1 Including $2,040 foreign capital gain tax.
2 Including $32,580 foreign capital gain tax.
3 Net of $67,906 deferred foreign capital gain tax.
4 Net of $340,017 deferred foreign capital gain tax.
See Notes to Financial Statements.
ANNUAL REPORT
OCTOBER 31, 2010
17
| | | | | | | |
| Statements of Changes in Net Assets | | | | | | |
| | BlackRock Global Emerging | BlackRock Latin | BlackRock | |
| | Markets Fund, Inc. | America Fund, Inc. | International Fund |
| | Year Ended October 31, | Year Ended October 31, | Year Ended October 31, |
| Increase (Decrease) in Net Assets: | 2010 | 2009 | 2010 | 2009 | 2010 | | 2009 |
| Operations | | | | | | | |
| Net investment income (loss) | $ 1,044,952 | $ 1,267,163 | $ 7,373,532 | $ 5,021,003 | $ (580,078) | $ 64,482 |
| Net realized gain (loss) | 29,666,926 | (23,216,908) | 51,273,531 | (72,628,541) | 6,856,088 | | (15,605,920) |
| Net change in unrealized appreciation/depreciation | 20,381,213 | 106,105,709 | 155,376,622 | 364,608,806 | 2,749,700 | | 31,035,081 |
| Net increase in net assets resulting from operations | 51,093,091 | 84,155,964 | 214,023,685 | 297,001,268 | 9,025,710 | | 15,493,643 |
| Dividends to Shareholders From | | | | | | | |
| Net investment income: | | | | | | | |
| Institutional | (571,284) | (252,551) | (2,062,764) | — | — | | — |
| Investor A | (495,119) | (232,391) | (7,759,663) | — | — | | — |
| Investor B | — | — | (151,277) | — | — | | — |
| Investor C | (20,174) | — | (1,878,791) | — | — | | — |
| Decrease in net assets resulting from dividends | | | | | | | |
| to shareholders | (1,086,577) | (484,942) | (11,852,495) | — | — | | — |
| Capital Share Transactions | | | | | | | |
| Net increase (decrease) in net assets derived | | | | | | | |
| from capital share transactions | 32,159,861 | 18,024,424 | 92,196,491 | 142,193,743 | (10,726,181) | | (7,735,440) |
| Redemption Fee | | | | | | | |
| Redemption fee | 24,599 | 7,513 | 232,820 | 162,049 | 21,640 | | 15,098 |
| Net Assets | | | | | | | |
| Total increase (decrease) in net assets | 82,190,974 | 101,702,959 | 294,600,501 | 439,357,060 | (1,678,831) | | 7,773,301 |
| Beginning of year | 229,178,716 | 127,475,757 | 759,453,850 | 320,096,790 | 66,892,861 | | 59,119,560 |
| End of year | $ 311,369,690 | $ 229,178,716 | $1,054,054,351 | $ 759,453,850 | $ 65,214,030 | $ 66,892,861 |
| Undistributed (distributions in excess of) net | | | | | | | |
| investment income | $ 728,820 | $ 1,086,964 | $ 858,976 | $ 6,907,334 | $ (181,468) | $ 60,661 |
See Notes to Financial Statements.
18 ANNUAL REPORT
OCTOBER 31, 2010
| | | | | | | |
| Financial Highlights | | | BlackRock Global Emerging Markets Fund, Inc. |
| | | | Period | | | | |
| | | | July 1, 2008 | | | | |
| | Year Ended October 31, | | | Year Ended June 30, | |
| | | | to October 31, | | | | |
| | 2010 | 2009 | 2008 | 2008 | 20071 | | 20061 |
| | | | Institutional | | | |
| Per Share Operating Performance | | | | | | | |
| Net asset value, beginning of period | $ 17.01 | $ 10.17 | $ 22.45 | $ 27.91 | $ 24.14 | $ 17.74 |
| Net investment income2 | 0.13 | 0.14 | 0.07 | 0.12 | 0.09 | | 0.22 |
| Net realized and unrealized gain (loss)3 | 3.47 | 6.75 | (10.34) | 1.28 | 8.37 | | 6.28 |
| Net increase (decrease) from investment operations | 3.60 | 6.89 | (10.27) | 1.40 | 8.46 | | 6.50 |
| Dividends and distributions from: | | | | | | | |
| Net investment income | (0.11) | (0.05) | (0.01) | - | (0.28) | | (0.10) |
| Net realized gain | — | — | (2.00) | (6.86) | (4.41) | | — |
| Total dividends and distributions | (0.11) | (0.05) | (2.01) | (6.86) | (4.69) | | (0.10) |
| Net asset value, end of period | $ 20.50 | $ 17.01 | $ 10.17 | $ 22.45 | $ 27.91 | $ 24.14 |
| Total Investment Return4 | | | | | | | |
| Based on net asset value | 21.28% | 68.14% | (48.15)%5 | 3.84% | 41.99% | | 36.80% |
| Ratios to Average Net Assets | | | | | | | |
| Total expenses | 1.33% | 1.48% | 1.56%6 | 1.40% | 1.44% | | 1.50% |
| Total expenses after fees waived | 1.33% | 1.48% | 1.54%6 | 1.37% | 1.40% | | 1.50% |
| Net investment income | 0.71% | 1.10% | 1.31%6 | 0.45% | 0.36% | | 0.99% |
| Supplemental Data | | | | | | | |
| Net assets, end of period (000) | $ 123,007 | $ 86,173 | $ 42,803 | $ 80,399 | $ 86,385 | $ 73,914 |
| Portfolio turnover | 135% | 191% | 76% | 163% | 140% | | 121% |
| | | | Investor A | | | |
| Per Share Operating Performance | | | | | | | |
| Net asset value, beginning of period | $ 16.45 | $ 9.85 | $ 21.80 | $ 27.27 | $ 23.68 | $ 17.41 |
| Net investment income2 | 0.07 | 0.10 | 0.05 | 0.04 | 0.02 | | 0.17 |
| Net realized and unrealized gain (loss)3 | 3.36 | 6.53 | (10.02) | 1.25 | 8.21 | | 6.16 |
| Net increase (decrease) from investment operations | 3.43 | 6.63 | (9.97) | 1.29 | 8.23 | | 6.33 |
| Dividends and distributions from: | | | | | | | |
| Net investment income | (0.07) | (0.03) | — | — | (0.23) | | (0.06) |
| Net realized gain | — | — | (1.98) | (6.76) | (4.41) | | — |
| Total dividends and distributions | (0.07) | (0.03) | (1.98) | (6.76) | (4.64) | | (0.06) |
| Net asset value, end of period | $ 19.81 | $ 16.45 | $ 9.85 | $ 21.80 | $ 27.27 | $ 23.68 |
| Total Investment Return4 | | | | | | | |
| Based on net asset value | 20.93% | 67.59% | (48.18)%5 | 3.49% | 41.66% | | 36.46% |
| Ratios to Average Net Assets | | | | | | | |
| Total expenses | 1.65% | 1.83% | 1.87%6 | 1.68% | 1.71% | | 1.75% |
| Total expenses after fees waived | 1.65% | 1.83% | 1.85%6 | 1.65% | 1.66% | | 1.75% |
| Net investment income | 0.43% | 0.80% | 0.98%6 | 0.16% | 0.10% | | 0.74% |
| Supplemental Data | | | | | | | |
| Net assets, end of period (000) | $ 144,976 | $ 111,850 | $ 67,614 | $ 145,781 | $ 151,309 | $ 122,331 |
| Portfolio turnover. | 135% | 191% | 76% | 163% | 140% | | 121% |
1 Consolidated Financial Highlights. See Note 1 of the Notes to Financial Statements.
2 Based on average shares outstanding.
3 Includes a redemption fee, which is less than $0.01 per share.
4 Where applicable, total investment returns exclude the effect of any sales charges
and include the reinvestment of dividends and distributions.
5 Aggregate total investment return.
6 Annualized.
See Notes to Financial Statements.
ANNUAL REPORT
OCTOBER 31, 2010
19
| | | | | | | | |
| Financial Highlights (concluded) | | | BlackRock Global Emerging Markets Fund, Inc. |
| | | | Period | | | | | |
| | | | July 1, 2008 | | | | | |
| | Year Ended October 31, | | | | Year Ended June 30, | |
| | | | to October 31, | | | | | |
| | 2010 | 2009 | 2008 | | 2008 | 20071 | | 20061 |
| | | | Investor B | | | | |
| Per Share Operating Performance | | | | | | | | |
| Net asset value, beginning of period | $ 14.76 | $ 8.89 | $ 19.86 | $ 25.20 | $ 22.10 | $ 16.32 |
| Net investment income (loss)2 | (0.07) | (0.01) | 0.01 | | (0.14) | (0.15) | | (0.00)3 |
| Net realized and unrealized gain (loss)4 | 3.01 | 5.88 | (8.98) | | 1.18 | 7.62 | | 5.78 |
| Net increase (decrease) from investment operations | 2.94 | 5.87 | (8.97) | | 1.04 | 7.47 | | 5.78 |
| Dividends and distributions from: | | | | | | | | |
| Net investment income | — | — | — | | — | (0.13) | | — |
| Net realized gain | — | — | (2.00) | | (6.38) | (4.24) | | — |
| Total dividends and distributions | — | — | (2.00) | | (6.38) | (4.37) | | — |
| Net asset value, end of period | $ 17.70 | $ 14.76 | $ 8.89 | $ 19.86 | $ 25.20 | $ 22.10 |
| Total Investment Return5 | | | | | | | | |
| Based on net asset value | 19.92% | 66.03% | (48.33)%6 | | 2.70% | 40.59% | | 35.42% |
| Ratios to Average Net Assets | | | | | | | | |
| Total expenses | 2.49% | 2.71% | 2.71%7 | | 2.47% | 2.48% | | 2.53% |
| Total expenses after fees waived | 2.49% | 2.71% | 2.69%7 | | 2.44% | 2.45% | | 2.53% |
| Net investment income (loss) | (0.45)% | (0.08)% | 0.13%7 | | (0.60)% | (0.68)% | | (0.02)% |
| Supplemental Data | | | | | | | | |
| Net assets, end of period (000) | $ 4,677 | $ 4,809 | $ 3,487 | $ 7,955 | $ 13,280 | $ 17,238 |
| Portfolio turnover | 135% | 191% | 76% | | 163% | 140% | | 121% |
| | | | Investor C | | | | |
| Per Share Operating Performance | | | | | | | | |
| Net asset value, beginning of period | $ 14.38 | $ 8.65 | $ 19.42 | $ 24.91 | $ 22.01 | $ 16.25 |
| Net investment income (loss)2 | (0.06) | (0.01) | 0.01 | | (0.14) | (0.14) | | (0.01) |
| Net realized and unrealized gain (loss)4 | 2.92 | 5.74 | (8.89) | | 1.18 | 7.53 | | 5.77 |
| Net increase (decrease) from investment operations | 2.86 | 5.73 | (8.88) | | 1.04 | 7.39 | | 5.76 |
| Dividends and distributions from: | | | | | | | | |
| Net investment income | (0.01) | — | — | | — | (0.13) | | — |
| Net realized gain | — | — | (1.89) | | (6.53) | (4.36) | | — |
| Total dividends and distributions | (0.01) | — | (1.89) | | (6.53) | (4.49) | | — |
| Net asset value, end of period | $ 17.23 | $ 14.38 | $ 8.65 | $ 19.42 | $ 24.91 | $ 22.01 |
| Total Investment Return5 | | | | | | | | |
| Based on net asset value | 19.90% | 66.24% | (48.35)%6 | | 2.70% | 40.58% | | 35.45% |
| Ratios to Average Net Assets | | | | | | | | |
| Total expenses | 2.49% | 2.66% | 2.69%7 | | 2.45% | 2.47% | | 2.52% |
| Total expenses after fees waived | 2.49% | 2.66% | 2.67%7 | | 2.42% | 2.43% | | 2.52% |
| Net investment income (loss) | (0.38)% | (0.08)% | 0.15%7 | | (0.61)% | (0.66)% | | (0.05)% |
| Supplemental Data | | | | | | | | |
| Net assets, end of period (000) | $ 38,711 | $ 26,347 | $ 13,572 | $ 31,948 | $ 32,208 | $ 24,674 |
| Portfolio turnover. | 135% | 191% | 76% | | 163% | 140% | | 121% |
1 Consolidated Financial Highlights. See Note 1 of the Notes to Financial Statements.
2 Based on average shares outstanding.
3 Amount is less than $(0.01) per share.
4 Includes a redemption fee, which is less than $0.01 per share.
5 Where applicable, total investment returns exclude the effect of any sales charges
and include the reinvestment of dividends and distributions.
6 Aggregate total investment return.
7 Annualized.
See Notes to Financial Statements.
20 ANNUAL REPORT
OCTOBER 31, 2010
| | | | | | | |
| Financial Highlights | | | | | BlackRock Latin America Fund, Inc. |
| | | | Period | | | | |
| | | | December 1, 2007 | | | |
| | Year Ended October 31, | | | Year Ended November 30, |
| | | | to October 31, | | | | |
| | 2010 | 20091 | 20081 | | 20071 | 20061 | 20051 |
| | | | Institutional | | |
| Per Share Operating Performance | | | | | | | |
| Net asset value, beginning of period | $ 58.63 | $ 30.53 | $ 78.57 | $ 50.67 | $ 37.27 | $ 22.64 |
| Net investment income2 | 0.85 | 0.64 | 0.61 | | 0.50 | 0.65 | 0.57 |
| Net realized and unrealized gain (loss) | 16.82 | 27.45 | (36.41) | | 28.10 | 13.32 | 14.42 |
| Net increase (decrease) from investment operations | 17.67 | 28.09 | (35.80) | | 28.60 | 13.97 | 14.99 |
| Dividends and distributions from: | | | | | | | |
| Net investment income | (0.97) | — | (0.80) | | (0.72) | (0.58) | (0.41) |
| Net realized gain | — | — | (11.47) | | — | — | — |
| Total dividends and distributions | (0.97) | — | (12.27) | | (0.72) | (0.58) | (0.41) |
| Redemption fee | 0.02 | 0.01 | 0.03 | | 0.02 | 0.01 | 0.05 |
| Net asset value, end of period | $ 75.35 | $ 58.63 | $ 30.53 | $ 78.57 | $ 50.67 | $ 37.27 |
| Total Investment Return3 | | | | | | | |
| Based on net asset value | 30.52% | 92.04% | (53.70)%4 | | 57.20%5 | 38.12% | 67.55% |
| Ratios to Average Net Assets | | | | | | | |
| Total expenses | 1.25% | 1.35% | 1.30%6 | | 1.26% | 1.31% | 1.43% |
| Total expenses after fees waived | 1.25% | 1.35% | 1.30%6 | | 1.26% | 1.31% | 1.43% |
| Net investment income | 1.31% | 1.60% | 1.04%6 | | 0.87% | 1.49% | 1.98% |
| Supplemental Data | | | | | | | |
| Net assets, end of period (000) | $ 200,980 | $ 114,101 | $ 58,877 | $ 128,094 | $ 191,085 | $ 135,279 |
| Portfolio turnover. | 64% | 50% | 61% | | 72% | 48% | 47% |
| | | | Investor A | | |
| Per Share Operating Performance | | | | | | | |
| Net asset value, beginning of period | $ 57.73 | $ 30.15 | $ 77.78 | $ 50.17 | $ 36.93 | $ 22.45 |
| Net investment income2 | 0.65 | 0.51 | 0.44 | | 0.60 | 0.53 | 0.51 |
| Net realized and unrealized gain (loss) | 16.54 | 27.06 | (35.97) | | 27.60 | 13.21 | 14.29 |
| Net increase (decrease) from investment operations | 17.19 | 27.57 | (35.53) | | 28.20 | 13.74 | 14.80 |
| Dividends and distributions from: | | | | | | | |
| Net investment income | (0.88) | — | (0.66) | | (0.61) | (0.51) | (0.37) |
| Net realized gain | — | — | (11.47) | | — | — | — |
| Total dividends and distributions | (0.88) | — | (12.13) | | (0.61) | (0.51) | (0.37) |
| Redemption fee | 0.03 | 0.01 | 0.03 | | 0.02 | 0.01 | 0.05 |
| Net asset value, end of period | $ 74.07 | $ 57.73 | $ 30.15 | $ 77.78 | $ 50.17 | $ 36.93 |
| Total Investment Return3 | | | | | | | |
| Based on net asset value | 30.15% | 91.48% | (53.82)%4 | | 56.85%5 | 37.77% | 67.10% |
| Ratios to Average Net Assets | | | | | | | |
| Total expenses | 1.53% | 1.63% | 1.55%6 | | 1.51% | 1.57% | 1.68% |
| Total expenses after fees waived | 1.53% | 1.63% | 1.55%6 | | 1.51% | 1.57% | 1.68% |
| Net investment income | 1.00% | 1.26% | 0.76%6 | | 0.92% | 1.23% | 1.81% |
| Supplemental Data | | | | | | | |
| Net assets, end of period (000) | $ 616,664 | $ 475,611 | $ 176,711 | $ 433,844 | $ 191,187 | $ 139,062 |
| Portfolio turnover. | 64% | 50% | 61% | | 72% | 48% | 47% |
1 Consolidated Financial Highlights. See Note 1 to the Notes to Financial Statements.
2 Based on average shares outstanding.
3 Where applicable, total investment returns exclude the effect of any sales charges
and include the reinvestment of dividends and distributions.
4 Aggregate total investment return.
5 The investment advisor reimbursed the Fund in order to resolve a regulatory issue
relating to an investment, which increased the return by 0.02%.
6 Annualized.
See Notes to Financial Statements.
ANNUAL REPORT
OCTOBER 31, 2010
21
| | | | | | | |
| Financial Highlights (concluded) | | | | | BlackRock Latin America Fund, Inc. |
| | | | Period | | | | |
| | | | December 1, 2007 | | | |
| | Year Ended October 31, | | | Year Ended November 30, |
| | | | to October 31, | | | | |
| | 2010 | 20091 | 20081 | | 20071 | 20061 | 20051 |
| | | | Investor B | | |
| Per Share Operating Performance | | | | | | | |
| Net asset value, beginning of period | $ 54.12 | $ 28.54 | $ 74.38 | $ 48.00 | $ 35.33 | $ 21.45 |
| Net investment income (loss)2 | 0.12 | 0.15 | (0.04) | | 0.05 | 0.20 | 0.29 |
| Net realized and unrealized gain (loss) | 15.50 | 25.42 | (34.09) | | 26.52 | 12.68 | 13.70 |
| Net increase (decrease) from investment operations | 15.62 | 25.57 | (34.13) | | 26.57 | 12.88 | 13.99 |
| Dividends and distributions from: | | | | | | | |
| Net investment income | (0.45) | — | (0.27) | | (0.21) | (0.22) | (0.16) |
| Net realized gain | — | — | (11.47) | | — | — | — |
| Total dividends and distributions | (0.45) | — | (11.74) | | (0.21) | (0.22) | (0.16) |
| Redemption fee | 0.02 | 0.01 | 0.03 | | 0.02 | 0.01 | 0.05 |
| Net asset value, end of period | $ 69.31 | $ 54.12 | $ 28.54 | $ 74.38 | $ 48.00 | $ 35.33 |
| Total Investment Return3 | | | | | | | |
| Based on net asset value | 29.06% | 89.63% | (54.18)%4 | | 55.61%5 | 36.72% | 65.91% |
| Ratios to Average Net Assets | | | | | | | |
| Total expenses | 2.37% | 2.62% | 2.39%6 | | 2.32% | 2.34% | 2.46% |
| Total expenses after fees waived | 2.37% | 2.62% | 2.39%6 | | 2.32% | 2.34% | 2.46% |
| Net investment income (loss) | 0.21% | 0.40% | (0.08)%6 | | 0.09% | 0.48% | 1.10% |
| Supplemental Data | | | | | | | |
| Net assets, end of period (000) | $ 18,660 | $ 18,695 | $ 11,794 | $ 31,268 | $ 13,911 | $ 12,144 |
| Portfolio turnover. | 64% | 50% | 61% | | 72% | 48% | 47% |
| | | | Investor C | | |
| Per Share Operating Performance | | | | | | | |
| Net asset value, beginning of period | $ 53.17 | $ 28.01 | $ 73.28 | $ 47.40 | $ 35.07 | $ 21.38 |
| Net investment income (loss)2 | 0.14 | 0.17 | (0.01) | | 0.11 | 0.17 | 0.25 |
| Net realized and unrealized gain (loss) | 15.21 | 24.98 | (33.46) | | 26.08 | 12.56 | 13.64 |
| Net increase (decrease) from investment operations | 15.35 | 25.15 | (33.47) | | 26.19 | 12.73 | 13.89 |
| Dividends and distributions from: | | | | | | | |
| Net investment income | (0.62) | — | (0.36) | | (0.33) | (0.41) | (0.25) |
| Net realized gain | — | — | (11.47) | | — | — | — |
| Total dividends and distributions | (0.62) | — | (11.83) | | (0.33) | (0.41) | (0.25) |
| Redemption fee | 0.02 | 0.01 | 0.03 | | 0.02 | 0.01 | 0.05 |
| Net asset value, end of period | $ 67.92 | $ 53.17 | $ 28.01 | $ 73.28 | $ 47.40 | $ 35.07 |
| Total Investment Return3 | | | | | | | |
| Based on net asset value | 29.15% | 89.82% | (54.16)%4 | | 55.62%5 | 36.75% | 65.90% |
| Ratios to Average Net Assets | | | | | | | |
| Total expenses | 2.32% | 2.49% | 2.35%6 | | 2.29% | 2.34% | 2.45% |
| Total expenses after fees waived | 2.32% | 2.49% | 2.35%6 | | 2.29% | 2.34% | 2.45% |
| Net investment income (loss) | 0.24% | 0.46% | (0.02)%6 | | 0.17% | 0.42% | 0.94% |
| Supplemental Data | | | | | | | |
| Net assets, end of period (000) | $ 217,750 | $ 151,046 | $ 72,714 | $ 164,742 | $ 50,609 | $ 25,071 |
| Portfolio turnover. | 64% | 50% | 61% | | 72% | 48% | 47% |
1 Consolidated Financial Highlights. See Note 1 to the Notes to Financial Statements.
2 Based on average shares outstanding.
3 Where applicable, total investment returns exclude the effect of any sales charges
and include the reinvestment of dividends and distributions.
4 Aggregate total investment return.
5 The investment advisor reimbursed the Fund in order to resolve a regulatory issue
relating to an investment, which increased the return by 0.02%.
6 Annualized.
See Notes to Financial Statements.
22 ANNUAL REPORT
OCTOBER 31, 2010
| | | | | | | | |
| Financial Highlights | | | | | | BlackRock International Fund |
| | | | Period | | | | | |
| | | | June 1, 2008 | | | | | |
| | Year Ended October 31, | | | | Year Ended May 31, | |
| | | | to October 31, | | | | | |
| | 2010 | 2009 | 2008 | | 2008 | 2007 | | 2006 |
| | | | Institutional | | | |
| Per Share Operating Performance | | | | | | | | |
| Net asset value, beginning of period | $ 10.91 | $ 8.20 | $ 15.01 | $ 14.18 | $ 12.38 | $ 10.05 |
| Net investment income (loss)1 | (0.01) | 0.09 | 0.04 | | 0.19 | 0.12 | | 0.08 |
| Net realized and unrealized gain (loss)2 | 1.96 | 2.62 | (6.68) | | 0.73 | 1.87 | | 2.39 |
| Net increase (decrease) from investment operations | 1.95 | 2.71 | (6.64) | | 0.92 | 1.99 | | 2.47 |
| Dividends from net investment income | — | — | (0.17) | | (0.09) | (0.19) | | (0.14) |
| Net asset value, end of period | $ 12.86 | $ 10.91 | $ 8.20 | $ 15.01 | $ 14.18 | $ 12.38 |
| Total Investment Return3 | | | | | | | | |
| Based on net asset value | 17.87% | 33.05% | (44.63)%4 | | 6.58% | 16.29% | | 24.80% |
| Ratios to Average Net Assets5 | | | | | | | | |
| Total expenses | 1.77% | 2.03% | 1.70%6 | | 1.54% | 1.65% | | 1.74% |
| Net investment income (loss) | (0.13)% | 0.99% | 0.75%6 | | 1.32% | 0.97% | | 0.72% |
| Supplemental Data | | | | | | | | |
| Net assets, end of period (000) | $ 2,645 | $ 5,133 | $ 5,161 | $ 10,904 | $ 12,133 | $ 12,453 |
| Portfolio turnover of the Portfolio | 154% | 178% | 78% | | 153% | 151% | | 96% |
| | | | Investor A | | | | |
| Per Share Operating Performance | | | | | | | | |
| Net asset value, beginning of period | $ 10.76 | $ 8.12 | $ 14.85 | $ 14.04 | $ 12.26 | $ 9.94 |
| Net investment income (loss)1 | (0.06) | 0.05 | 0.02 | | 0.17 | 0.10 | | 0.06 |
| Net realized and unrealized gain (loss)2 | 1.96 | 2.59 | (6.62) | | 0.70 | 1.84 | | 2.36 |
| Net increase (decrease) from investment operations | 1.90 | 2.64 | (6.60) | | 0.87 | 1.94 | | 2.42 |
| Dividends from net investment income | — | — | (0.13) | | (0.06) | (0.16) | | (0.10) |
| Net asset value, end of period | $ 12.66 | $ 10.76 | $ 8.12 | $ 14.85 | $ 14.04 | $ 12.26 |
| Total Investment Return3 | | | | | | | | |
| Based on net asset value | 17.66% | 32.51% | (44.72)%4 | | 6.25% | 16.02% | | 24.51% |
| Ratios to Average Net Assets5 | | | | | | | | |
| Total expenses | 2.08% | 2.40% | 2.02%6 | | 1.84% | 1.91% | | 1.98% |
| Net investment income (loss) | (0.51)% | 0.54% | 0.50%6 | | 1.18% | 0.77% | | 0.53% |
| Supplemental Data | | | | | | | | |
| Net assets, end of period (000) | $ 37,035 | $ 28,949 | $ 22,537 | $ 42,052 | $ 35,750 | $ 21,807 |
| Portfolio turnover of the Portfolio | 154% | 178% | 78% | | 153% | 151% | | 96% |
1 Based on average shares outstanding.
2 Includes a redemption fee, which is less than $0.01 per share.
3 Where applicable, total investment returns exclude the effect of any sales charges
and include the reinvestment of dividends and distributions.
4 Aggregate total investment return.
5 Includes the Fund’s share of the Portfolio’s allocated expenses and/or net invest-
ment income (loss).
6 Annualized.
See Notes to Financial Statements.
ANNUAL REPORT
OCTOBER 31, 2010
23
| | | | | | | | |
| Financial Highlights (concluded) | | | | | | BlackRock International Fund |
| | | | Period | | | | | |
| | | | June 1, 2008 | | | | | |
| | Year Ended October 31, | | | | Year Ended May 31, | |
| | | | to October 31, | | | | | |
| | 2010 | 2009 | 2008 | | 2008 | 2007 | | 2006 |
| | | | Investor B | | | | |
| Per Share Operating Performance | | | | | | | | |
| Net asset value, beginning of period | $ 10.18 | $ 7.77 | $ 14.13 | $ 13.44 | $ 11.75 | $ 9.54 |
| Net investment loss1 | (0.17) | (0.04) | (0.03) | | (0.01) | (0.02) | | (0.03) |
| Net realized and unrealized gain (loss)2 | 1.83 | 2.45 | (6.33) | | 0.70 | 1.78 | | 2.27 |
| Net increase (decrease) from investment operations | 1.66 | 2.41 | (6.36) | | 0.69 | 1.76 | | 2.24 |
| Dividends from net investment income | — | — | — | | — | (0.07) | | (0.03) |
| Net asset value, end of period | $ 11.84 | $ 10.18 | $ 7.77 | $ 14.13 | $ 13.44 | $ 11.75 |
| Total Investment Return3 | | | | | | | | |
| Based on net asset value | 16.31% | 31.02% | (45.01)%4 | | 5.13% | 15.02% | | 23.52% |
| Ratios to Average Net Assets5 | | | | | | | | |
| Total expenses | 3.21% | 3.61% | 3.17%6 | | 2.90% | 2.76% | | 2.76% |
| Net investment loss | (1.65)% | (0.54)% | (0.70)%6 | | (0.11)% | (0.20)% | | (0.31)% |
| Supplemental Data | | | | | | | | |
| Net assets, end of period (000) | $ 11,898 | $ 20,342 | $ 20,878 | $ 44,254 | $ 56,428 | $ 71,575 |
| Portfolio turnover of the Portfolio | 154% | 178% | 78% | | 153% | 151% | | 96% |
| | | | Investor C | | | | |
| Per Share Operating Performance | | | | | | | | |
| Net asset value, beginning of period | $ 10.28 | $ 7.81 | $ 14.19 | $ 13.45 | $ 11.75 | $ 9.54 |
| Net investment income (loss)1 | (0.13) | (0.01) | (0.01) | | 0.04 | (0.01) | | (0.03) |
| Net realized and unrealized gain (loss)2 | 1.85 | 2.48 | (6.35) | | 0.70 | 1.78 | | 2.27 |
| Net increase (decrease) from investment operations | 1.72 | 2.47 | (6.36) | | 0.74 | 1.77 | | 2.24 |
| Dividends from net investment income | — | — | (0.02) | | — | (0.07) | | (0.03) |
| Net asset value, end of period | $ 12.00 | $ 10.28 | $ 7.81 | $ 14.19 | $ 13.45 | $ 11.75 |
| Total Investment Return3 | | | | | | | | |
| Based on net asset value | 16.73% | 31.63% | (44.87)%4 | | 5.50% | 15.09% | | 23.47% |
| Ratios to Average Net Assets5 | | | | | | | | |
| Total expenses | 2.80% | 3.09% | 2.74%6 | | 2.57% | 2.68% | | 2.77% |
| Net investment income (loss) | (1.23)% | (0.07)% | (0.25)%6 | | 0.32% | (0.09)% | | (0.32)% |
| Supplemental Data | | | | | | | | |
| Net assets, end of period (000) | $ 13,636 | $ 12,470 | $ 10,543 | $ 20,892 | $ 22,133 | $ 23,463 |
| Portfolio turnover of the Portfolio | 154% | 178% | 78% | | 153% | 151% | | 96% |
1 Based on average shares outstanding.
2 Includes a redemption fee, which is less than $0.01 per share.
3 Where applicable, total investment returns exclude the effect of any sales charges
and include the reinvestment of dividends and distributions.
4 Aggregate total investment return.
5 Includes the Fund’s share of the Portfolio’s allocated expenses and/or net invest-
ment income (loss).
6 Annualized.
See Notes to Financial Statements.
24 ANNUAL REPORT
OCTOBER 31, 2010
Notes to Financial Statements
1. Organization and Significant Accounting Policies:
BlackRock Global Emerging Markets Fund, Inc. (“Global Emerging
Markets”), BlackRock Latin America Fund, Inc. (“Latin America”) and
BlackRock International Fund (“International”) of BlackRock Series, Inc.
(the “Corporation”) (collectively the “Funds” or individually the “Fund”),
are registered under the Investment Company Act of 1940, as amended
(the “1940 Act”). Each Fund is organized as a Maryland corporation.
International is registered as a diversified, open-end management invest-
ment company. Global Emerging Markets and Latin America are registered
as non-diversified, open-end management investment companies. The
Funds’ financial statements are prepared in conformity with accounting
principles generally accepted in the United States of America ("US GAAP"),
which may require management to make estimates and assumptions that
affect the reported amounts and disclosures in the financial statements.
Actual results could differ from those estimates. Each Fund offers multiple
classes of shares. Institutional Shares are sold without a sales charge and
only to certain eligible investors. Investor A Shares are generally sold with a
front-end sales charge. Investor B and Investor C Shares may be subject to
a contingent deferred sales charge. All classes of shares have identical vot-
ing, dividend, liquidation and other rights and the same terms and condi-
tions, except that Investor A, Investor B and Investor C Shares bear certain
expenses related to the shareholder servicing of such shares, and Investor
B and Investor C Shares also bear certain expenses related to the distri-
bution of such shares. Investor B Shares automatically convert to Investor
A Shares after approximately eight years. Investor B Shares are only avail-
able through exchanges, dividend reinvestment by existing shareholders or
for purchase by certain qualified employee benefit plans. Each class has
exclusive voting rights with respect to matters relating to its shareholder
servicing and distribution expenditures (except that Investor B shareholders
may vote on material changes to the Investor A distribution plan).
International seeks to achieve its investment objective by investing all of
its assets in BlackRock Master International Portfolio (the “Portfolio”) of
BlackRock Master LLC (the “Master LLC”), which has the same investment
objective and strategies as the Fund. The value of the Fund’s investment in
the Portfolio reflects the Fund’s proportionate interest in the net assets of
the Portfolio. The performance of the Fund is directly affected by the per-
formance of the Portfolio. The financial statements of the Portfolio, includ-
ing the Schedule of Investments, are included elsewhere in this report
and should be read in conjunction with the Fund’s financial statements.
The percentage of the Portfolio owned by the Fund at October 31, 2010
was 100%.
The following is a summary of significant accounting policies followed by
the Funds:
Valuation: The Funds fair value their financial instruments at market value
using independent dealers or pricing services under policies approved by
the Board of Directors (the "Board"). Equity investments traded on a recog-
nized securities exchange or the NASDAQ Global Market System are valued
at the last reported sale price that day or the NASDAQ official closing price,
if applicable. For equity investments traded on more than one exchange,
the last reported sale price on the exchange where the stock is primarily
traded is used. Equity investments traded on a recognized exchange for
which there were no sales on that day are valued at the last available bid
price. If no bid price is available, the prior day’s price will be used, unless it
is determined that such prior day’s price no longer reflects the fair value of
the security. Investments in open-end investment companies are valued at
net asset value each business day. Short-term securities with remaining
maturities of 60 days or less may be valued at amortized cost, which
approximates fair value.
The Funds value their investments in BlackRock Liquidity Series, LLC Money
Market Series (the “Money Market Series”) at fair value, which is ordinarily
based upon their pro rata ownership in the net assets of the underlying
fund. The Money Market Series seeks current income consistent with main-
taining liquidity and preserving capital. Although the Money Market Series
is not registered under the 1940 Act, its investments will follow the param-
eters of investments by a money market fund that is subject to Rule 2a-7
promulgated by the Securities and Exchange Commission (“SEC”) under
the 1940 Act. The Funds may withdraw up to 25% of their investment daily,
although the manager of the Money Market Series, in its sole discretion,
may permit an investor to withdraw more than 25% on any one day.
Securities and other assets and liabilities denominated in foreign curren-
cies are translated into US dollars using exchange rates determined as of
the close of business on the New York Stock Exchange (“NYSE”). Foreign
currency exchange contracts are valued at the mean between the bid and
ask prices and are determined as of the close of business on the NYSE.
Interpolated values are derived when the settlement date of the contract
is an interim date for which quotations are not available.
In the event that application of these methods of valuation results in a
price for an investment which is deemed not to be representative of the
market value of such investment or is not available, the investment will
be valued in accordance with a policy approved by the Board as reflecting
fair value (“Fair Value Assets”). When determining the price for Fair Value
Assets, the investment advisor and/or the sub-advisor seeks to determine
the price that each Fund might reasonably expect to receive from the cur-
rent sale of that asset in an arm’s-length transaction. Fair value determina-
tions shall be based upon all available factors that the investment advisor
and/or sub-advisor deems relevant. The pricing of all Fair Value Assets is
subsequently reported to the Board or a committee thereof.
Generally, trading in foreign instruments is substantially completed
each day at various times prior to the close of business on the NYSE.
Occasionally, events affecting the values of such instruments may occur
between the foreign market close and the close of business on the NYSE
that may not be reflected in the computation of each Fund's net assets.
If events (for example, a company announcement, market volatility or a
natural disaster) occur during such periods that are expected to materially
affect the value of such instruments, those instruments may be Fair Value
Assets and be valued at their fair value, as determined in good faith by the
investment advisor using a pricing service and/or policies approved by the
Board. Each business day, the Funds use a pricing service to assist with
ANNUAL REPORT
OCTOBER 31, 2010
25
Notes to Financial Statements (continued)
the valuation of certain foreign exchange-traded equity securities and for-
eign exchange-traded and OTC options (the “Systematic Fair Value Price”).
Using current market factors, the Systematic Fair Value Price is designed to
value such foreign securities and foreign options at fair value as of the
close of business on the NYSE, which follows the close of the
local markets.
International records its investment in the Portfolio at fair value based
on the Fund’s proportionate interest in the net assets of the Portfolio.
Valuation of securities held by the Portfolio, including categorization of fair
value measurements, is discussed in Note 1 of the Portfolio’s Notes to
Financial Statements, which are included elsewhere in this report.
Foreign Currency Transactions: The Funds' books and records are main-
tained in US dollars. Purchases and sales of investment securities are
recorded at the rates of exchange prevailing on the date the transactions
are entered into. Generally, when the US dollar rises in value against a
foreign currency, the Funds' investments denominated in that currency
will lose value because its currency is worth fewer US dollars; the
opposite effect occurs if the US dollar falls in relative value.
The Funds report foreign currency related transactions as components of
realized gain (loss) for financial reporting purposes, whereas such compo-
nents are treated as ordinary income for federal income tax purposes.
Segregation and Collateralization: In cases in which the 1940 Act and
the interpretive positions of the SEC require that the Funds either deliver
collateral or segregate assets in connection with certain investments (e.g.,
foreign currency exchange contracts), the Funds will, consistent with SEC
rules and/or certain interpretive letters issued by the SEC, segregate collat-
eral or designate on their books and records cash or other liquid securities
having a market value at least equal to the amount that would otherwise
be required to be physically segregated. Furthermore, based on require-
ments and agreements with certain exchanges and third party broker-
dealers, each party has requirements to deliver/deposit securities as
collateral for certain investments.
Investment Transactions and Investment Income: For financial reporting
purposes, investment transactions are recorded on the dates the trans-
actions are entered into (the trade dates). Realized gains and losses
on investment transactions are determined on the identified cost basis.
Dividend income is recorded on the ex-dividend dates. Dividends from
foreign securities where the ex-dividend date may have passed are sub-
sequently recorded when the Funds have determined the ex-dividend
date. Under the applicable foreign tax laws, a withholding tax at various
rates may be imposed on capital gains, dividends and interest. Upon
notification from issuers, some of the dividend income received from a
real estate investment trust may be redesignated as a reduction of cost
of the related investment and/or realized gain. Interest income, including
amortization and accretion of premiums and discounts on debt securities,
is recognized on the accrual basis. Income and realized and unrealized
gains and losses are allocated daily to each class based on its relative
net assets.
Dividends and Distributions: Dividends and distributions paid by the Funds
are recorded on the ex-dividend dates. The amount and timing of dividends
and distributions are determined in accordance with federal income tax
regulations, which may differ from US GAAP.
Securities Lending: Global Emerging Markets and Latin America may lend
securities to financial institutions that provide cash as collateral, which will
be maintained at all times in an amount equal to at least 100% of the
current market value of the loaned securities. The market value of the
loaned securities is determined at the close of business of the Funds
and any additional required collateral is delivered to the Funds on the next
business day. Securities lending income, as disclosed in the Statements of
Operations, represents the income earned from the investment of the cash
collateral, net of rebates paid to, or fees paid by, borrowers and less the
fees paid to the securities lending agent. During the term of the loan, the
Funds are entitled to dividend and interest payments on the securities
loaned. Loans of securities are terminable at any time and the borrower,
after notice, is required to return borrowed securities within the standard
time period for settlement of securities transactions. In the event that the
borrower defaults on its obligation to return borrowed securities because
of insolvency or for any other reason, the Funds could experience delays
and costs in gaining access to the collateral. The Funds also could suffer
a loss if the value of an investment purchased with cash collateral falls
below the market value of loaned securities or if the value of an investment
purchased with cash collateral falls below the value of the original cash
collateral received.
Income Taxes: It is each Fund's policy to comply with the requirements
of the Internal Revenue Code of 1986, as amended, applicable to regu-
lated investment companies and to distribute substantially all of its
taxable income to its shareholders. Therefore, no federal income tax
provision is required.
Each Fund files US federal and various state and local tax returns. No
income tax returns are currently under examination. The statute of limita-
tions on Global Emerging Market’s US federal tax returns remains open for
the two years ended October 31, 2010, the period ended October 31,
2008 and the year ended June 30, 2008. The statute of limitations on
Latin America’s US federal tax returns remains open for the two years
ended October 31, 2010, the period ended October 31, 2008 and
the year ended November 30, 2007. The statute of limitations on
International’s US federal tax returns remains open for the two years
ended October 31, 2010, the period ended October 31, 2008 and the
year ended May 31, 2008. The statutes of limitations on each Fund’s
state and local tax returns may remain open for an additional year
depending upon the jurisdiction. There are no uncertain tax positions
that require recognition of a tax liability.
26 ANNUAL REPORT
OCTOBER 31, 2010
Notes to Financial Statements (continued)
Basis of Consolidation:
Global Emerging Markets
The Fund’s accompanying consolidated Financial Highlights for each of the
years in the two-year period ended June 30, 2007 include the accounts of
Inversiones en Marcado Accionario de Valores Chile Limitada, a wholly
owned subsidiary of the Fund. The subsidiary was created for regulatory
purposes to invest in Chilean securities. Intercompany accounts and
transactions have been eliminated. During the year ended June 30,
2007, Inversiones en Marcado Accionario de Valores Chile Limitada
was dissolved.
Latin America
The Fund’s accompanying consolidated Statements of Changes in Net
Assets for the year ended October 31, 2009 and the accompanying con-
solidated Financial Highlights for each of the three years ended November
30, 2007 and for the two periods ended October 31, 2009, include the
accounts of Merrill Lynch Latin America Fund Chile Ltd., a wholly owned
subsidiary of the Fund. The subsidiary was created for regulatory purposes
to invest in Chilean securities. Intercompany accounts and transactions
have been eliminated. During the year ended October 31, 2009, Merrill
Lynch Latin America Fund Chile Ltd. was dissolved.
Other: Expenses directly related to each Fund or its classes are charged
to that Fund or class. Other operating expenses shared by several funds
are pro rated among those funds on the basis of relative net assets or
other appropriate methods. Other expenses of the Fund are allocated daily
to each class based on its relative net assets. Each Fund has an arrange-
ment with the custodian whereby fees may be reduced by credits earned
on uninvested cash balances, which if applicable are shown as fees paid
indirectly in the Statements of Operations. The custodian imposes fees on
overdrawn cash balances, which can be offset by accumulated credits
earned or may result in additional custody charges.
2. Derivative Financial Instruments:
The Funds engage in various portfolio investment strategies using derivative
contracts both to increase the returns of the Funds and to economically
hedge, or protect, their exposure to certain risks such as foreign currency
exchange rate risk.
Losses may arise if the value of the contract decreases due to an unfav-
orable change in the market rates or values of the underlying instrument
or if the counterparty does not perform under the contract. The Funds'
maximum risk of loss from counterparty credit risk on OTC derivatives is
generally the aggregate unrealized gain netted against any collateral
pledged by/posted to the counterparty. Counterparty risk related to
exchange-traded financial futures contracts and options is minimal
because of the protection against defaults provided by the exchange
on which these contracts trade.
The Funds may mitigate counterparty risk by procuring collateral and
through netting provisions included within an International Swaps and
Derivatives Association, Inc. (“ISDA”) Master Agreement implemented
between a Fund and each of its respective counterparties. The ISDA Master
Agreement allows each Fund to offset with each separate counterparty
certain derivative financial instrument’s payables and/or receivables with
collateral held. The amount of collateral moved to/from applicable count-
erparties is generally based upon minimum transfer amounts of up to
$500,000. To the extent amounts due to the Funds from their counter-
parties are not fully collateralized contractually or otherwise, the Funds
bear the risk of loss from counterparty non-performance. See Note 1
“Segregation and Collateralization” for information with respect to collateral
practices. In addition, each Fund manages counterparty risk by entering
into agreements only with counterparties that it believes have the financial
resources to honor their obligations and by monitoring the financial stability
of those counterparties.
Certain ISDA Master Agreements allow counterparties to OTC derivatives to
terminate derivative contracts prior to maturity in the event the Funds’ net
assets decline by a stated percentage or the Funds fail to meet the terms
of its ISDA Master Agreements, which would cause the Funds to accelerate
payment of any net liability owed to the counterparty.
Foreign Currency Exchange Contracts: The Funds enter into foreign cur-
rency exchange contracts as an economic hedge against either specific
transactions or portfolio instruments or to obtain exposure to foreign cur-
rencies (foreign currency exchange rate risk). A foreign currency exchange
contract is an agreement between two parties to buy and sell a currency at
a set exchange rate on a future date. Foreign currency exchange contracts,
when used by the Funds, help to manage the overall exposure to the cur-
rency backing some of the investments held by the Funds. The contract is
marked-to-market daily and the change in market value is recorded by the
Funds as an unrealized gain or loss. When the contract is closed, the Funds
record a realized gain or loss equal to the difference between the value at
the time it was opened and the value at the time it was closed. The use of
foreign currency exchange contracts involves the risk that the value of a for-
eign currency exchange contract changes unfavorably due to movements in
the value of the referenced foreign currencies and the risk that a counter-
party to the contract does not perform its obligations under the agreement.
| | |
| Derivatives Categorized by Risk Exposure: | |
| The Effect of Derivative Instruments on the Statements of Operations |
| Year Ended October 31, 2010 |
|
| Net Realized Gain From |
|
| | Global | |
| | Emerging Markets | Latin America |
| Foreign currency exchange contracts: | | |
| Foreign currency transactions | $ (429,150) | $ (1,112,544) |
| Net Change in Unrealized Appreciation/Depreciation on |
|
| | Global | |
| | Emerging Markets | Latin America |
| Foreign currency exchange contracts: | | |
| Foreign currency transactions | $ (14,837) | $ (11,952) |
ANNUAL REPORT OCTOBER 31, 2010 27
| | | | | |
| Notes to Financial Statements (continued) |
| Fair Values of Derivative Instruments as of October 31, 2010 |
|
| Asset Derivatives |
|
| | | | Global | | |
| | | | Emerging | | |
| | | | Markets | Latin America |
| | Statement of Assets | | |
| | and Liabilities | | | |
| | Location | | | Value | |
| | Unrealized appreciation | | |
| Foreign currency | on foreign currency | | | |
| exchange contracts | exchange contracts | — | $ 709 |
| Liability Derivatives |
|
| | | | Global | | |
| | | | Emerging | | |
| | | | Markets | Latin America |
| | Statement of Assets | | |
| | and Liabilities | | | |
| | Location | | | Value | |
| | Unrealized depreciation | | |
| Foreign currency | on foreign currency | | | |
| exchange contracts | exchange contracts | $16,610 | $ 4,821 |
| For the year ended October 31, 2010, the average quarterly balance of |
| outstanding derivative financial instruments was as follows: | |
| | | | Global | | |
| | | Emerging Markets | Latin America |
| Foreign currency exchange contracts: | | | | |
| Average number of contracts-US | | | | |
| dollars purchased | | | 6 | | 6 |
| Average number of contracts-US | | | | |
| dollars sold | | | 3 | | 1 |
| Average US dollar amounts purchased | $ 1,835,732 | $ 555,533 |
| Average US dollar amounts sold | $ 1,735,913 | $ 224,016 |
3. Investment Advisory Agreement and Other Transactions
with Affiliates:
The PNC Financial Services Group, Inc. ("PNC"), Bank of America
Corporation ("BAC") and Barclays Bank PLC ("Barclays") are the largest
stockholders of BlackRock, Inc. ("BlackRock"). Due to the ownership struc-
ture, PNC is an affiliate of the Funds for 1940 Act purposes, but BAC and
Barclays are not.
Global Emerging Markets and Latin America each entered into an
Investment Advisory Agreement with BlackRock Advisors, LLC (the
“Manager”), each Fund’s investment advisor, an indirect, wholly owned
subsidiary of BlackRock, to provide investment advisory and administration
services. The Manager is responsible for the management of each Fund's
portfolio and provides the necessary personnel, facilities, equipment and
certain other services necessary to the operations of each Fund. For such
services, Global Emerging Markets and Latin America pay the Manager a
monthly fee at an annual rate of 1.00% of each Fund's average daily
net assets.
The Manager voluntarily agreed to waive its investment advisory fees by
the amount of investment advisory fees each Fund pays to the Manager
indirectly through its investment in affiliated money market funds, however,
the Manager does not waive its investment advisory fees by the amount
of investment advisory fees paid through each Fund's investment in other
affiliated investment companies, if any. These amounts are included in fees
waived by advisor in the Statements of Operations.
The Manager entered into a sub-advisory agreement with BlackRock
Investment Management, LLC (“BIM”) with respect to each Fund and
BlackRock International Limited, with respect to Global Emerging Markets
and Latin America, both affiliates of the Manager. The Manager pays each
sub-advisor for services it provides, a monthly fee that is a percentage of
the investment advisory fees paid by the Funds to the Manager.
The Corporation, on behalf of International, entered into an Administration
Agreement with the Manager to provide administrative services (other than
investment advice and related portfolio activities). For such services, the
Fund pays the Manager a monthly fee at an annual rate of 0.25% of the
average daily value of the Fund’s net assets. The Fund does not pay an
investment advisory fee or investment management fee.
For the year ended ended October 31, 2010, Global Emerging Markets and
Latin America reimbursed the Manager for certain accounting services,
which are included in accounting services in the Statements of Operations.
The reimbursements were as follows:
| |
| Global Emerging Markets | $ 4,834 |
| Latin America | $16,074 |
The Funds received an exemptive order from the SEC permitting them,
among other things, to pay an affiliated securities lending agent a fee
based on a share of the income derived from the securities lending activi-
ties and has retained BIM as the securities lending agent. BIM may, on
behalf of the Funds, invest cash collateral received by the Funds for such
loans, among other things, in a private investment company managed by
the Manager or in registered money market funds advised by the Manager
or its affiliates. The market value of securities on loan and the value of the
related collateral are shown in the Statements of Assets and Liabilities as
securities loaned and collateral on securities loaned at value, respectively.
The cash collateral invested by BIM is disclosed in the Schedules of
Investments. The share of income earned by the Funds on such invest-
ments is shown as securities lending — affiliated in the Statements of
Operations. For the year ended October 31, 2010, BIM received $39,197
in securities lending agent fees from Latin America.
Global Emerging Markets, Latin America and the Corporation (on behalf of
International) entered into a Distribution Agreement and Distribution and
Service Plan with BlackRock Investments, LLC (”BRIL“), an affiliate of
BlackRock. Pursuant to the Distribution and Service Plan and in accor-
dance with Rule 12b-1 under the 1940 Act, each Fund pays BRIL ongoing
service and distribution fees. The fees are accrued daily and paid monthly
at annual rates based upon the average daily net assets of the shares of
Funds, as follows:
| | |
| | Service | Distribution |
| | Fee | Fee |
| Investor A | 0.25% | — |
| Investor B | 0.25% | 0.75% |
| Investor C | 0.25% | 0.75% |
28 ANNUAL REPORT
OCTOBER 31, 2010
Notes to Financial Statements (continued)
Pursuant to sub-agreements with BRIL, broker-dealers and BRIL provide
shareholder servicing and distribution services to each Fund. The ongoing
service and/or distribution fee compensates BRIL and each broker-dealer
for providing shareholder servicing and/or distribution related services to
Investor A, Investor B and Investor C shareholders.
For the year ended October 31, 2010, affiliates earned underwriting
discounts, direct commissions and dealer concessions on sales of the
Fund’s Investor A Shares as follows:
| |
| | Investor A |
| Global Emerging Markets | $ 26,345 |
| Latin America | $ 167,736 |
| International | $ 1,461 |
For the year ended October 31, 2010, affiliates received the following
contingent deferred sales charges relating to transactions in Investor B
and Investor C Shares:
| | |
| | Investor B | Investor C |
| Global Emerging Markets | $ 3,801 | $ 8,699 |
| Latin America | $ 62,251 | $ 137,317 |
| International | $ 1,988 | $ 981 |
Furthermore, affiliates received contingent deferred sales charges relating
to transactions subject to front-end sales charge waivers on Investor A
Shares as follows.
| |
| | Investor A |
| Global Emerging Markets | $ 2,070 |
| Latin America | $ 4,769 |
| International | $ 88 |
BNY Mellon Investment Servicing (U.S.) Inc. (“BNYMIS”) (formerly PNC
Global Investment Servicing (U.S.) Inc. ("PNCGIS")), serves as transfer
agent and dividend disbursing agent. On July 1, 2010, the Bank of New
York Mellon Corporation purchased PNCGIS, which prior to this date was an
indirect, wholly owned subsidiary of PNC and an affiliate of the Manager.
Transfer agency fees borne by each Fund are comprised of those fees
charged for all shareholder communications including mailing of share-
holder reports, dividend and distribution notices, and proxy materials for
shareholder meetings, as well as per account and per transaction fees
related to servicing and maintenance of shareholder accounts, including
the issuing, redeeming and transferring of shares, check writing, anti-money
laundering services, and customer identification services. Pursuant to writ-
ten agreements, certain financial intermediaries, some of which may be
affiliates, provide the Funds with sub-accounting, recordkeeping, sub-trans-
fer agency and other administrative services with respect to sub-accounts
they service. For these services, these entities receive a fee that could vary
depending on, among other things, shareholder accounts, share class and
net assets. For the year ended October 31, 2010, the Fund’s paid the fol-
lowing to affiliates in return for these services, which is included in transfer
agent in the Statements of Operations:
| |
| Global Emerging Markets | $ 40,220 |
| Latin America | $ 218,419 |
| International | $ 5,992 |
The Funds may earn income on positive cash balances in demand
deposit accounts that are maintained by BNYMIS on behalf of the Funds.
International earned $20 for the year ended October 31, 2010, which is
included in income — affiliated in the Statements of Operations.
The Manager maintains a call center, which is responsible for providing cer-
tain shareholder services to the Funds, such as responding to shareholder
inquiries and processing transactions based upon instructions from share-
holders with respect to the subscription and redemption of Fund shares.
For the year ended October 31, 2010, the Funds reimbursed the Manager
the following amounts for costs incurred in running the call center, which
are included in transfer agent — class specific in the Statements
of Operations:
| | | |
| Global |
| | Emerging | Latin | |
| Call Center Fees | Markets | America | International |
| Institutional | $1,230 | $ 2,670 | $ 78 |
| Investor A | $4,614 | $23,951 | $660 |
| Investor B | $ 285 | $ 1,791 | $152 |
| Investor C | $1,258 | $ 9,687 | $440 |
Certain officers and/or directors of Global Emerging Markets, Latin America
and the Corporation are officers and/or directors of BlackRock or its
affiliates. The Funds reimburse the Manager for compensation paid to
the Chief Compliance Officer of Global Emerging Markets, Latin America
and the Corporation.
4. Investments:
Purchases and sales of investments excluding short-term securities, for the
year ended October 31, 2010, were as follows:
| | |
| | Purchases | Sales |
| Global Emerging Markets | $371,972,325 | $333,934,745 |
| Latin America | $603,874,648 | $531,091,299 |
5. Income Tax Information:
Reclassifications: US GAAP require that certain components of net assets be adjusted to reflect permanent differences between financial and tax reporting.
These reclassifications have no effect on net assets or net asset values per share. The following permanent differences as of October 31, 2010 attributable
to foreign currency transactions, the sale of stock of passive foreign investment companies, net operating losses, the characterization of expenses and the
expiration of capital loss carryforwards were reclassified to the following accounts:
| | | |
| | Global | | |
| | Emerging | Latin | |
| | Markets | America | International |
| Paid-in capital | — | — | $ (32,307,769) |
| Undistributed net investment income | $ (316,519) | $ (1,569,395) | $ 337,949 |
| Accumulated net realized loss | $ 316,519 | $ 1,569,395 | $ 31,969,820 |
ANNUAL REPORT
OCTOBER 31, 2010
29
Notes to Financial Statements (continued)
| | |
| The tax character of distributions paid during the fiscal years ended October 31, 2010 and October 31, 2009 was as follows: | | |
| | Global | |
| | Emerging | Latin |
| | Markets | America |
| Ordinary income | | |
| 10/31/2010 | $ 1,086,577 | $ 11,852,495 |
| 10/31/2009 | 484,942 | — |
| Total distributions | | |
| 10/31/2010 | $ 1,086,577 | $ 11,852,495 |
| 10/31/2009 | $ 484,942 | — |
| | | |
| As of October 31, 2010 the tax components of net undistributed earnings (accumulated losses) were as follows: | | |
| | Global | | |
| | Emerging | Latin | |
| | Markets | America | International |
| Undistributed ordinary income | $ 2,000,426 | $ 15,261,495 | — |
| Capital loss carryforwards | (39,771,459) | (70,977,198) | $ (34,716,518) |
| Net unrealized gains* | 57,449,014 | 334,881,115 | 9,849,554 |
| Total | $ 19,677,981 | $ 279,165,412 | $ (24,866,964) |
| * The differences between book-basis and tax-basis net unrealized gains were attributable primarily to the tax deferral of losses on wash sales, the realization for tax purposes of |
| unrealized gains/losses on certain foreign currency contracts, the timing and recognition of partnership income, and the realization for tax purposes of unrealized gains on |
| investments in passive foreign investment companies. | | | |
| | | |
| As of October 31, 2010, the Funds had capital loss carryforwards available to offset future realized capital gains through the indicated expiration dates: |
| | Global | | |
| | Emerging | Latin | |
| Expires October 31, | Markets | America | International |
| 2016 | $ 17,062,380 | $ 6,626,092 | $ 19,370,107 |
| 2017 | 22,709,079 | 64,351,106 | 15,346,411 |
| Total | $ 39,771,459 | $ 70,977,198 | $ 34,716,518 |
6. Borrowings:
Global Emerging Markets and Latin America, along with certain other funds
managed by the Manager and its affiliates, is a party to a $500 million
credit agreement with a group of lenders, which expires in November 2010
and was subsequently renewed until November 2011. The Funds may bor-
row under the credit agreement to fund shareholder redemptions. Effective
November 2008, the credit agreement had the following terms: 0.02%
upfront fee on the aggregate commitment amount which was allocated to
each Fund based on its net assets as of October 31, 2008, a commitment
fee of 0.08% per annum based on each Fund's pro rata share of the
unused portion of the credit agreement, which is included in miscellaneous
in the Statements of Operations, and interest at a rate equal to the higher
of (a) federal funds effective rate and (b) reserve adjusted one-month
LIBOR, plus, in each case, the higher of (i) 1.50% and (ii) 50% of the CDX
Index (as defined in the credit agreement) on amounts borrowed. Effective
November 2009, the credit agreement was renewed with the following
terms: 0.02% upfront fee on the aggregate commitment amount which was
allocated to each Fund based on its net assets as of October 31, 2009, a
commitment fee of 0.10% per annum based on each Fund's pro rata
share of the unused portion of the credit agreement and interest at a rate
equal to the higher of (a) the one-month LIBOR plus 1.25% per annum
and (b) the Fed Funds rate plus 1.25% per annum on amounts borrowed.
The Funds did not borrow under the credit agreement during the year
ended October 31, 2010.
7. Concentration, Market and Credit Risk:
In the normal course of business, Global Emerging Markets and Latin
America invest in securities and enter into transactions where risks exist
due to fluctuations in the market (market risk) or failure of the issuer of a
security to meet all its obligations (issuer credit risk). The value of securities
held by the Funds may decline in response to certain events, including
those directly involving the issuers whose securities are owned by the
Funds; conditions affecting the general economy; overall market changes;
local, regional or global political, social or economic instability; and cur-
rency and interest rate and price fluctuations. Similar to issuer credit risk,
the Funds may be exposed to counterparty credit risk, or the risk that an
entity with which the Funds has unsettled or open transactions may fail to
be unable to perform on its commitments. The Funds manage counterparty
credit risk by entering into transactions only with counterparties that they
believe have the financial resources to honor their obligations and by
30 ANNUAL REPORT OCTOBER 31, 2010
Notes to Financial Statements (continued)
monitoring the financial stability of those counterparties. Financial assets,
which potentially expose the Funds to market, issuer and counterparty
credit risks, consist principally of financial instruments and receivables
due from counterparties. The extent of the Funds’ exposure to market,
issuer and counterparty credit risks with respect to these financial assets
is generally approximated by their value recorded in the Funds’ Statements
of Assets and Liabilities, less any collateral held by the Funds.
Global Emerging Markets and Latin America invest a substantial amount
of their assets in issuers located in a single country or a limited number
of countries. At October 31, 2010, Latin America invested 72% of its net
assets in Brazil. When the Funds concentrate their investments in this
manner, they assume the risk that economic, political and social conditions
in those countries may have a significant impact on their investment per-
formance. Please see the Schedules of Investments for concentrations
in specific countries.
As of October 31, 2010, Global Emerging Markets and Latin America had
the following industry classifications:
| |
| Global Emerging Markets | |
| | Percent of |
| | Long-Term |
| Industry | Investments |
| Commercial Banks | 19% |
| Wireless Telecommunication Services | 14 |
| Metals & Mining | 10 |
| Oil, Gas & Consumable Fuels | 10 |
| Electronic Equipment, Instruments & Components | 5 |
| Semiconductors & Semiconductor Equipment | 5 |
| Other* | 37 |
| Latin America | |
| | Percent of |
| | Long-Term |
| Industry | Investments |
| Commercial Banks | 23% |
| Metals & Mining | 17 |
| Oil, Gas & Consumable Fuels | 15 |
| Wireless Telecommunication Services | 10 |
| Beverages | 7 |
| Other* | 28 |
*All other industries held were each less than 5% of long-term investments.
8. Capital Share Transactions:
| | | | |
| Transactions in capital shares for each class were as follows: | | | | |
| | | Year Ended | | Year Ended |
| | October 31, 2010 | October 31, 2009 |
| Global Emerging Markets | Shares | Amount | Shares | Amount |
| Institutional | | | | |
| Shares sold | 3,841,676 | $ 68,294,096 | 2,427,202 | $ 31,998,241 |
| Shares issued to shareholders in reinvestment of dividends and distributions | 23,866 | 415,421 | 22,603 | 228,222 |
| Total issued | 3,865,542 | 68,709,517 | 2,449,805 | 32,226,463 |
| Shares redeemed | (2,932,071) | (51,255,137) | (1,593,248) | (20,139,564) |
| Net increase | 933,471 | $ 17,454,380 | 856,557 | $ 12,086,899 |
| Investor A | | | | |
| Shares sold and automatic conversion of shares | 2,040,890 | $ 35,939,082 | 1,279,420 | $ 18,123,676 |
| Shares issued to shareholders in reinvestment of dividends and distributions | 25,718 | 433,581 | 20,613 | 201,779 |
| Total issued | 2,066,608 | 36,372,663 | 1,300,033 | 18,325,455 |
| Shares redeemed | (1,547,152) | (27,299,341) | (1,364,931) | (16,128,173) |
| Net increase (decrease) | 519,456 | $ 9,073,322 | (64,898) | $ 2,197,282 |
| Investor B | | | | |
| Shares sold | 38,154 | $ 608,042 | 75,705 | $ 876,794 |
| Shares issued to shareholders in reinvestment of dividends and distributions | — | — | — | — |
| Total issued | 38,154 | 608,042 | 75,705 | 876,794 |
| Shares redeemed and automatic conversion of shares | (99,750) | (1,587,503) | (142,339) | (1,419,591) |
| Net decrease | (61,596) | $ (979,461) | (66,634) | $ (542,797) |
| Investor C | | | | |
| Shares sold and automatic conversion of shares | 1,010,363 | $ 15,533,210 | 778,580 | $ 9,627,317 |
| Shares issued to shareholders in reinvestment of dividends and distributions | 1,202 | 17,774 | — | — |
| Total issued | 1,011,565 | 15,550,984 | 778,580 | 9,627,317 |
| Shares redeemed | (597,216) | (8,939,364) | (514,884) | (5,344,277) |
| Net increase | 414,349 | $ 6,611,620 | 263,696 | $ 4,283,040 |
ANNUAL REPORT
OCTOBER 31, 2010
31
| | | | |
| Notes to Financial Statements (concluded) | | | | |
| | | Year Ended | | Year Ended |
| | October 31, 2010 | October 31, 2009 |
| Latin America | Shares | Amount | Shares | Amount |
| Institutional | | | | |
| Shares sold | 1,682,887 | $ 110,636,374 | 1,056,535 | $ 48,081,433 |
| Shares issued to shareholders in reinvestment of dividends and distributions | 28,822 | 1,796,411 | — | — |
| Total issued | 1,711,709 | 112,432,785 | 1,056,535 | 48,081,433 |
| Shares redeemed | (990,683) | (61,114,645) | (1,038,791) | (36,964,049) |
| Net increase | 721,026 | $ 51,318,140 | 17,744 | $ 11,117,384 |
| Investor A | | | | |
| Shares sold and automatic conversion of shares | 4,685,471 | $ 303,041,998 | 4,344,050 | $ 191,578,027 |
| Shares issued to shareholders in reinvestment of dividends and distributions | 111,800 | 6,869,769 | — | — |
| Total issued | 4,797,271 | 309,911,767 | 4,344,050 | 191,578,027 |
| Shares redeemed | (4,710,334) | (288,779,539) | (1,966,080) | (76,595,525) |
| Net increase | 86,937 | $ 21,132,228 | 2,377,970 | $ 114,982,502 |
| Investor B | | | | |
| Shares sold | 17,319 | $ 1,070,001 | 68,592 | $ 2,737,186 |
| Shares issued to shareholders in reinvestment of dividends and distributions | 2,352 | 136,208 | — | — |
| Total issued | 19,671 | 1,206,209 | 68,592 | 2,737,186 |
| Shares redeemed and automatic conversion of shares | (95,906) | (5,586,278) | (136,323) | (4,829,849) |
| Net decrease | (76,235) | $ (4,380,069) | (67,731) | $ (2,092,663) |
| Investor C | | | | |
| Shares sold | 1,336,936 | $ 79,199,064 | 1,124,791 | $ 48,207,477 |
| Shares issued to shareholders in reinvestment of dividends and distributions | 30,234 | 1,714,776 | — | — |
| Total issued | 1,367,170 | 80,913,840 | 1,124,791 | 48,207,477 |
| Shares redeemed | (1,001,833) | (56,787,648) | (879,816) | (30,020,957) |
| Net increase | 365,337 | $ 24,126,192 | 244,975 | $ 18,186,520 |
| International | | | | |
| Institutional | | | | |
| Shares sold | 63,958 | $ 754,224 | 72,049 | $ 573,143 |
| Shares redeemed | (328,865) | (3,388,448) | (231,246) | (1,934,401) |
| Net decrease | (264,907) | $ (2,634,224) | (159,197) | $ (1,361,258) |
| Investor A | | | | |
| Shares sold | 1,547,376 | $ 17,444,412 | 1,149,898 | $ 10,086,404 |
| Shares redeemed | (1,310,799) | (14,329,639) | (1,236,681) | (10,173,305) |
| Net increase (decrease) | 236,577 | $ 3,114,773 | (86,783) | $ (86,901) |
| Investor B | | | | |
| Shares sold | 356,832 | $ 3,766,604 | 718,550 | $ 5,916,834 |
| Shares redeemed | (1,350,265) | (14,158,071) | (1,406,707) | (11,208,094) |
| Net decrease | (993,433) | $ (10,391,467) | (688,157) | $ (5,291,260) |
| Investor C | | | | |
| Shares sold | 181,265 | $ 1,939,156 | 199,307 | $ 1,688,311 |
| Shares redeemed | (258,153) | (2,754,419) | (336,919) | (2,684,332) |
| Net decrease | (76,888) | $ (815,263) | (137,612) | $ (996,021) |
9. Subsequent Events:
Management's evaluation of the impact of all subsequent events on the
Funds' financial statements was completed through the date the financial
statements were issued and the following items were noted:
Certain Funds paid a net investment income dividend on December
21, 2010 to Common Shareholders of record on December 17, 2010
as follows:
| |
| | Dividend Per |
| | Share |
| Global Emerging Markets | |
| Institutional Shares | $0.196062 |
| Class A Shares | $0.147610 |
| Class C Shares | $0.043578 |
| Latin America | |
| Institutional Shares | $1.284815 |
| Class A Shares | $1.114486 |
| Class B Shares | $0.497679 |
| Class C Shares | $0.690064 |
32 ANNUAL REPORT
OCTOBER 31, 2010
Report of Independent Registered Public Accounting Firm
To the Shareholders and Board of Directors of
BlackRock Global Emerging Markets Fund, Inc.
BlackRock Latin America Fund, Inc.
BlackRock International Fund of BlackRock Series, Inc.
(collectively, the “Funds”):
We have audited the accompanying statement of assets and liabilities,
including the schedule of investments, of BlackRock Global Emerging
Markets Fund, Inc. as of October 31, 2010, and the related statement of
operations for the year then ended, the statements of changes in net
assets for each of the two years in the period then ended, and the financial
highlights for each of the two years in the period then ended, for the period
July 1, 2008 to October 31, 2008, and for each of the three years in the
period ended June 30, 2008. We also have audited the accompanying
statement of assets and liabilities, including the schedule of investments,
of BlackRock Latin American Fund, Inc. as of October 31, 2010, and the
related statement of operations for the year then ended, the statements of
changes in net assets for each of the two years in the period then ended,
and the financial highlights for each of the two years in the period then
ended, for the period December 1, 2007 to October 31, 2008, and for
each of the three years in the period ended November 30, 2007. We have
also audited the accompanying statement of assets and liabilities of the
BlackRock International Fund, one of the series constituting the BlackRock
Series, Inc. as of October 31, 2010, and the related statement of opera-
tions for the year then ended, the statements of changes in net assets for
each of the two years in the period then ended, and the financial highlights
for each of the two years in the period then ended, for the period June 1,
2008 to October 31, 2008, and for each of the three years in the period
ended May 31, 2008. These financial statements and financial highlights
are the responsibility of the Funds’ management. Our responsibility is to
express an opinion on these financial statements and financial highlights
based on our audits.
We conducted our audits in accordance with the standards of the Public
Company Accounting Oversight Board (United States). Those standards
require that we plan and perform the audits to obtain reasonable assur-
ance about whether the financial statements and financial highlights are
free of material misstatement. The Funds are not required to have, nor
were we engaged to perform, audits of their internal control over financial
reporting. Our audits included consideration of internal control over finan-
cial reporting as a basis for designing audit procedures that are appropri-
ate in the circumstances, but not for the purpose of expressing an opinion
on the effectiveness of the Funds’ internal control over financial reporting.
Accordingly, we express no such opinion. An audit also includes examining,
on a test basis, evidence supporting the amounts and disclosures in the
financial statements, assessing the accounting principles used and signifi-
cant estimates made by management, as well as evaluating the overall
financial statement presentation. Our procedures included confirmation of
securities owned as of October 31, 2010, by correspondence with the cus-
todian and brokers; where replies were not received from the brokers, we
performed other auditing procedures. We believe that our audits provide a
reasonable basis for our opinion.
In our opinion , the financial statements and financial highlights referred to
above present fairly, in all material respects, the financial position of
BlackRock Global Emerging Markets Fund, Inc. as of October 31, 2010,
the results of its operations for the year then ended, the changes in its
net assets for each of the two years in the period then ended, and the
financial highlights for the each of the two years in the period then ended,
for the period July 1, 2008 to October 31, 2008, and for each of the three
years in the period ended June 30, 2008, in conformity with accounting
principles generally accepted in the United States of America. Additionally,
in our opinion, the financial statements and financial highlights referred
to above present fairly, in all material respects, the financial position of
BlackRock Latin America Fund, Inc. as of October 31, 2010, the results
of its operations for the year then ended, the changes in its net assets
for each of the two years in the period then ended, and the financial high-
lights for each of the two years in the period then ended, for the period
December 1, 2007 to October 31, 2008, and for each of the three years
in the period ended November 30, 2007, in conformity with accounting
principles generally accepted in the United States of America. Additionally,
in our opinion, the financial statements and financial highlights referred
to above present fairly, in all material respects, the financial position of
BlackRock International Fund of BlackRock Series, Inc. as of October 31,
2010, the results of its operations for the year then ended, the changes in
its net assets for each of the two years in the period then ended, and the
financial highlights for each of the two years in the period then ended, for
the period June 1, 2008 to October 31, 2008, and for each of the three
years in the period ended May 31, 2008, in conformity with accounting
principles generally accepted in the United States of America.
Deloitte & Touche LLP
Princeton, New Jersey
December 28, 2010
ANNUAL REPORT
OCTOBER 31, 2010
33
Important Tax Information
The following information is provided with respect to the ordinary income distributions paid during the fiscal year ended October 31, 2010.
| | | |
| | | Latin | Global Emerging |
| | Payable Date | America | Markets |
| Qualified Dividend Income for Individuals † | 12/21/2009 | 76.11% | 100% |
| Foreign Source Income † | 12/21/2009 | 68.51% | 100% |
| Foreign Taxes Paid Per Share | 12/21/2009 | $0.078711 | $0.023296 |
| †† Expressed as a percentage of the cash distribution grossed-up for foreign taxes. | | | |
The foreign taxes paid represent taxes incurred by the Fund on income received by the Fund from foreign sources. Foreign taxes paid may be included in
taxable income with an offsetting deduction from gross income or may be taken as a credit for taxes paid to foreign governments. You should consult your
tax advisor regarding the appropriate treatment of foreign taxes paid.
34 ANNUAL REPORT
OCTOBER 31, 2010
Portfolio Information as of October 31, 2010
BlackRock Master International Portfolio
| |
| BlackRock Master International Portfolio | |
| | Percent of |
| | Long-Term |
| Ten Largest Holdings | Investments |
| Sanofi — Aventis | 5% |
| Heineken NV | 4 |
| British American Tobacco Plc | 4 |
| Nissan Motor Co., Ltd. | 3 |
| Novartis AG, Registered Shares | 3 |
| Telefonica SA | 3 |
| BG Group Plc | 3 |
| ABB Ltd | 3 |
| Credit Suisse Group AG | 3 |
| Reckitt Benckiser Plc | 3 |
| |
| | Percent of |
| | Long-Term |
| Geographic Allocation | Investments |
| United Kingdom | 21% |
| Switzerland | 13 |
| Japan | 13 |
| United States | 12 |
| France | 7 |
| Netherlands | 6 |
| Taiwan | 4 |
| Spain | 3 |
| China | 3 |
| Canada | 3 |
| Luxembourg | 2 |
| South Korea | 2 |
| South Africa | 2 |
| Germany | 2 |
| Hong Kong | 2 |
| Russia | 2 |
| Brazil | 1 |
| Singapore | 1 |
| Philippines | 1 |
ANNUAL REPORT
OCTOBER 31, 2010
35
Schedule of Investments October 31, 2010
BlackRock Master International Portfolio
(Percentages shown are based on Net Assets)
| | |
| Common Stocks | Shares | Value |
| Brazil — 1.2% | | |
| OGX Petroleo e Gas Participacoes SA (a) | 59,800 | $ 781,835 |
| Canada — 2.4% | | |
| Rogers Communications, Inc., Class B | 42,910 | 1,563,423 |
| China — 2.7% | | |
| Focus Media Holding Ltd. — ADR (a) | 40,353 | 998,737 |
| VanceInfo Technologies, Inc. — ADR (a) | 20,313 | 738,784 |
| | | 1,737,521 |
| France — 6.6% | | |
| Sanofi-Aventis | 46,777 | 3,277,290 |
| Societe Generale SA | 17,114 | 1,026,240 |
| | | 4,303,530 |
| Germany — 1.9% | | |
| Daimler AG (a) | 18,350 | 1,208,428 |
| Hong Kong — 1.7% | | |
| Sands China Ltd. (a) | 518,000 | 1,129,593 |
| Japan — 12.3% | | |
| Makita Corp. | 49,500 | 1,735,610 |
| Nissan Motor Co., Ltd. | 244,000 | 2,144,470 |
| Nitto Denko Corp. | 46,000 | 1,721,297 |
| Sumitomo Heavy Industries Ltd. | 252,000 | 1,432,303 |
| Tokio Marine Holdings, Inc. | 35,100 | 986,866 |
| | | 8,020,546 |
| Luxembourg — 2.2% | | |
| ArcelorMittal | 45,207 | 1,462,834 |
| Netherlands — 5.6% | | |
| ASML Holding NV | 34,895 | 1,156,771 |
| Heineken NV | 49,871 | 2,531,716 |
| | | 3,688,487 |
| Philippines — 0.5% | | |
| Cebu Air, Inc. (a) | 112,000 | 324,128 |
| Russia — 1.6% | | |
| Sberbank | 309,924 | 1,027,088 |
| Singapore — 1.2% | | |
| Genting Singapore Plc (a) | 450,000 | 757,117 |
| South Africa — 2.0% | | |
| MTN Group Ltd. | 72,250 | 1,299,774 |
| South Korea — 2.0% | | |
| Samsung Electronics Co., Ltd. | 1,980 | 1,313,583 |
| Spain — 3.1% | | |
| Telefonica SA | 76,060 | 2,055,344 |
| Switzerland — 12.9% | | |
| ABB Ltd. | 93,233 | 1,931,202 |
| Credit Suisse Group AG | 46,011 | 1,904,792 |
| Julius Baer Group Ltd. | 33,271 | 1,404,010 |
| Novartis AG, Registered Shares | 36,390 | 2,108,536 |
| The Swatch Group Ltd., Bearer Shares | 2,811 | 1,074,458 |
| | | 8,422,998 |
| | |
| Common Stocks | Shares | Value |
| Taiwan — 4.2% | | |
| HON HAI Precision Industry Co., Ltd. | 193,440 | $ 731,597 |
| HTC Corp. | 39,300 | 891,222 |
| Taiwan Semiconductor Manufacturing | | |
| Co., Ltd. — ADR | 102,354 | 1,116,682 |
| | | 2,739,501 |
| United Kingdom — 19.8% | | |
| BG Group Plc | 101,028 | 1,966,635 |
| Barclays Plc | 262,680 | 1,154,338 |
| British American Tobacco Plc | 58,669 | 2,235,083 |
| Lloyds TSB Group Plc (a) | 846,081 | 929,952 |
| Man Group Plc | 201,165 | 840,796 |
| Reckitt Benckiser Plc | 32,343 | 1,806,963 |
| Rio Tinto Plc, Registered Shares | 23,061 | 1,497,826 |
| Tullow Oil Plc | 60,513 | 1,149,337 |
| Xstrata Plc | 71,229 | 1,379,946 |
| | | 12,960,876 |
| United States — 12.0% | | |
| Activision Blizzard, Inc. | 151,464 | 1,737,292 |
| The Goldman Sachs Group, Inc. | 9,890 | 1,591,796 |
| Lam Research Corp. (a) | 26,190 | 1,199,240 |
| Liberty Global, Inc. (a) | 31,232 | 1,180,257 |
| MercadoLibre, Inc. (a) | 9,003 | 595,368 |
| NII Holdings, Inc. (a) | 36,427 | 1,523,013 |
| | | 7,826,966 |
| Total Long-Term Investments | | |
| (Cost — $52,430,973) — 95.9% | | 62,623,572 |
| Short-Term Securities | | |
| BlackRock Liquidity Funds, TempFund, Institutional | | |
| Class, 0.21% (b)(c) | 3,168,986 | 3,168,986 |
| Total Short-Term Securities | | |
| (Cost — $3,168,986) — 4.8% | | 3,168,986 |
| Total Investments (Cost — $55,599,959*) — 100.7% | | 65,792,558 |
| Liabilities in Excess of Other Assets — (0.7)% | | (474,695) |
| Net Assets – 100.0% | | $ 65,317,863 |
* The cost and unrealized appreciation (depreciation) of investments as of
October 31, 2010, as computed for federal income tax purposes, were as follows:
| |
| Aggregate cost | $ 55,998,599 |
| Gross unrealized appreciation | $ 10,312,501 |
| Gross unrealized depreciation | (518,542) |
| Net unrealized appreciation | $ 9,793,959 |
| | | | |
| Portfolio Abbreviations | | | | |
| To simplify the listing of portfolio holdings in the Schedule | ADR | American Depositary Receipts | GBP | British Pound |
| of Investments, the names and descriptions of many of the | CAD | Canadian Dollar | USD | US Dollar |
| securities have been abbreviated according to the following | | | | |
| list: | | | | |
| See Notes to Financial Statements. | | | | |
36 ANNUAL REPORT
OCTOBER 31, 2010
Schedule of Investments (concluded)
BlackRock Master International Portfolio
(a) Non-income producing security.
(b) Represents the current yield as of report date.
(c) Investments in companies considered to be an affiliate of the Portfolio during the
year, for purposes of Section 2(a)(3) of the Investment Company Act of 1940, as
amended, were as follows:
| | | | | | | | |
| | | | Shares Held at | Shares Held at | |
| | | | October 31, | Net | October 31, | | |
| | Affiliate | | 2009 | | Activity | 2010 | | Income |
| | BlackRock Liquidity | | | | | | |
| | Funds, TempFund, | | | | | | |
| | Institutional Class | 1,466,787 | 1,702,199 | 3,168,986 | $ 3,121 |
| • | Foreign currency exchange contracts as of October 31, 2010 were as follows: |
| | Currency | | Currency | | | Settlement | Unrealized |
| | Purchased | | Sold | Counterparty | Date | Depreciation |
| | CAD 287,600 | USD 282,626 | JPMorgan Chase | | |
| | | | | | Bank NA | 11/03/10 | $ (667) |
| | GBP 735,004 | USD 1,178,358 | JPMorgan Chase | | |
| | | | | | Bank NA | 11/03/10 | | (659) |
| | Total | | | | | | $ (1,326) |
• Fair Value Measurements — Various inputs are used in determining the fair value of
investments and derivatives, which are as follows:
• Level 1 — price quotations in active markets/exchanges for identical assets
and liabilities
• Level 2 — other observable inputs (including, but not limited to: quoted prices for
similar assets or liabilities in markets that are active, quoted prices for identical
or similar assets or liabilities in markets that are not active, inputs other than
quoted prices that are observable for the assets or liabilities (such as interest
rates, yield curves, volatilities, prepayment speeds, loss severities, credit risks and
default rates) or other market-corroborated inputs)
• Level 3 — unobservable inputs based on the best information available in the
circumstances, to the extent observable inputs are not available (including the
Portfolio’s own assumptions used in determining the fair value of investments
and derivatives)
The inputs or methodologies used for valuing securities are not necessarily an indication
of the risk associated with investing in those securities. For information about the
Portfolio’s policy regarding valuation of investments and other significant accounting
policies, please refer to Note 1 of the Notes to Financial Statements.
The following tables summarize the inputs used as of October 31, 2010 in determining
the fair valuation of the Portfolio’s investments and derivatives:
| | | | |
| Valuation Inputs | Level 1 | Level 2 | Level 3 | Total |
| Assets: | | | | |
| Investments in | | | | |
| Securities: | | | | |
| Long-Term Investments: | | | | |
| Common Stocks: | | | | |
| Brazil | $ 781,835 | — | — | $ 781,835 |
| Canada | 1,563,423 | — | — | 1,563,423 |
| China. | 1,737,521 | — | — | 1,737,521 |
| France | — | $ 4,303,530 | — | 4,303,530 |
| Germany | — | 1,208,428 | — | 1,208,428 |
| Hong Kong | — | 1,129,593 | — | 1,129,593 |
| Japan | — | 8,020,546 | — | 8,020,546 |
| Luxembourg | — | 1,462,834 | — | 1,462,834 |
| Netherlands | — | 3,688,487 | — | 3,688,487 |
| Philippines | 324,128 | — | — | 324,128 |
| Russia | 1,027,088 | — | — | 1,027,088 |
| Singapore | — | 757,117 | — | 757,117 |
| South Africa | — | 1,299,774 | — | 1,299,774 |
| South Korea. | — | 1,313,583 | — | 1,313,583 |
| Spain. | — | 2,055,344 | — | 2,055,344 |
| Switzerland | — | 8,422,998 | — | 8,422,998 |
| Taiwan | 1,116,682 | 1,622,819 | — | 2,739,501 |
| United Kingdom | — | 12,960,876 | — | 12,960,876 |
| United States | 7,826,966 | — | — | 7,826,966 |
| Short-Term Securities | 3,168,986 | — | — | 3,168,986 |
| Total | $ 17,546,629 | $ 48,245,929 | — | $ 65,792,558 |
| | Derivative Financial Instruments1 | |
| Valuation Inputs | Level 1 | Level 2 | Level 3 | Total |
| Liabilities: | | | | |
| Foreign currency | | | | |
| exchange contracts | — | $ (1,326) | — | $ (1,326) |
1 Derivative financial instruments are foreign currency exchange contracts. Foreign
currency exchange contracts are shown at the unrealized appreciation/depreciation
on the instrument.
See Notes to Financial Statements.
ANNUAL REPORT
OCTOBER 31, 2010
37
| |
| Statement of Assets and Liabilities | BlackRock Master International Portfolio |
| October 31, 2010 | |
| Assets | |
| Investments at value — unaffiliated (cost — $52,430,973) | $ 62,623,572 |
| Investments at value — affiliated (cost — $3,168,986) | 3,168,986 |
| Foreign currency at value (cost — $11,657) | 11,792 |
| Dividends receivable | 583,336 |
| Investments sold receivable | 430,411 |
| Contributions receivable from investor | 41,759 |
| Prepaid expenses | 1,651 |
| Total assets | 66,861,507 |
| Liabilities | |
| Unrealized depreciation on foreign currency exchange contracts | 1,326 |
| Investments purchased payable | 1,459,728 |
| Investment advisory fees payable | 38,190 |
| Other affiliates payable | 368 |
| Directors' fees payable | 7 |
| Other accrued expenses payable | 44,025 |
| Total liabilities | 1,543,644 |
| Net Assets | $ 65,317,863 |
| Net Assets Consist of | |
| Investor's capital | $ 55,070,995 |
| Net unrealized appreciation/depreciation | 10,246,868 |
| Net Assets | $ 65,317,863 |
See Notes to Financial Statements.
38 ANNUAL REPORT
OCTOBER 31, 2010
| |
| Statement of Operations | BlackRock Master International Portfolio |
| Year Ended October 31, 2010 | |
| Investment Income | |
| Dividends | $ 1,101,708 |
| Income — affiliated | 3,121 |
| Foreign taxes withheld | (100,924) |
| Total income | 1,003,905 |
| Expenses | |
| Investment advisory | 479,690 |
| Professional | 61,647 |
| Accounting services | 53,296 |
| Custodian | 43,440 |
| Directors | 6,983 |
| Printing | 1,292 |
| Miscellaneous | 13,500 |
| Total expenses | 659,848 |
| Less fees waived by advisor | (1,340) |
| Total expenses after fees waived | 658,508 |
| Net investment income | 345,397 |
| Realized and Unrealized Gain (Loss) | |
| Net realized gain (loss) from: | |
| Investments | 7,116,768 |
| Foreign currency transactions | (260,680) |
| | 6,856,088 |
| Net change in unrealized appreciation/depreciation on: | |
| Investments | 2,669,497 |
| Foreign currency transactions | 80,203 |
| | 2,749,700 |
| Total realized and unrealized gain | 9,605,788 |
| Net Increase in Net Assets Resulting from Operations | $ 9,951,185 |
See Notes to Financial Statements.
ANNUAL REPORT
OCTOBER 31, 2010
39
| | | | | | | |
| Statements of Changes in Net Assets | | | | BlackRock Master International Portfolio |
| | | | | | Year Ended October 31, |
| Increase (Decrease) in Net Assets: | | | | | 2010 | | 2009 |
| Operations | | | | | | | |
| Net investment income | | | | $ 345,397 | $ 1,084,347 |
| Net realized gain (loss) | | | | | 6,856,088 | | (15,605,920) |
| Net change in unrealized appreciation/depreciation | | | | | 2,749,700 | | 31,035,081 |
| Net increase in net assets resulting from operations | | | | | 9,951,185 | | 16,513,508 |
| Capital Transactions | | | | | | | |
| Proceeds from contributions | | | | | 23,926,035 | | 18,264,692 |
| Value of withdrawals | | | | | (35,534,497) | | (27,020,407) |
| Net decrease in net assets derived from capital transactions | | | | | (11,608,462) | | (8,755,715) |
| Net Assets | | | | | | | |
| Total increase (decrease) in net assets | | | | | (1,657,277) | | 7,757,793 |
| Beginning of year | | | | | 66,975,140 | | 59,217,347 |
| End of year | | | | $ 65,317,863 | $ 66,975,140 |
| Financial Highlights | | | | BlackRock Master International Portfolio |
| | | | Period | | | | |
| | | | June 1, 2008 | | | | |
| | Year Ended October 31, | | Year Ended May 31, | |
| | | | to October 31, | | | | |
| | 2010 | 2009 | 2008 | 2008 | 2007 | | 2006 |
| Total Investment Return | | | | | | | |
| Total investment return | 18.59% | 33.94% | (44.29)%1 | 7.12% | 16.99% | | 25.58% |
| Average Net Ratios to Assets | | | | | | | |
| Total expenses | 1.03% | 1.11% | 1.04%2 | 0.99% | 0.96% | | 0.98% |
| Total expenses after fees waived | 1.03% | 1.11% | 1.04%2 | 0.99% | 0.96% | | 0.98% |
| Net investment income | 0.54% | 1.89% | 1.44%2 | 1.90% | 1.64% | | 1.48% |
| Supplemental Data | | | | | | | |
| Net assets, end of period (000) | $ 65,318 | $66,975 | $ 59,217 | $118,236 | $ 126,594 | $ 129,475 |
| Portfolio turnover | 154% | 178% | 78% | 153% | 151% | | 96% |
1 Aggregate total investment return.
2 Annualized.
See Notes to Financial Statements.
40 ANNUAL REPORT
OCTOBER 31, 2010
Notes to Financial Statements
BlackRock Master International Portfolio
1. Organization and Significant Accounting Policies:
BlackRock Master International Portfolio (the “Portfolio”) of BlackRock
Master LLC (the “Master LLC”) is registered under the Investment Company
Act of 1940, as amended (the “1940 Act”), and is organized as
a Delaware limited liability company. The Limited Liability Company
Agreement permits the Directors to issue non-transferable interests in
the Master LLC, subject to certain limitations. The Portfolio's financial
statements are prepared in conformity with accounting principles generally
accepted in the United States of America ("US GAAP"), which may require
management to make estimates and assumptions that affect the reported
amounts and disclosures in the financial statements. Actual results could
differ from those estimates.
The following is a summary of significant accounting policies followed by
the Portfolio:
Valuation: The Master LLC's policy is to fair value its financial instruments
at market value using independent dealers or pricing services selected
under the supervision of the Board of Directors (the "Board"). Equity invest
ments traded on a recognized securities exchange or the NASDAQ Global
Market System are valued at the last reported sale price that day or the
NASDAQ official closing price, if applicable. For equity investments traded
on more than one exchange, the last reported sale price on the exchange
where the stock is primarily traded is used. Equity investments traded on a
recognized exchange for which there were no sales on that day are valued
at the last available bid price. If no bid price is available, the prior day’s
price will be used, unless it is determined that such prior day’s price no
longer reflects the fair value of the security. Investments in open-end
investment companies are valued at net asset value each business day.
Short-term securities with remaining maturities of 60 days or less may
be valued at amortized cost, which approximates fair value.
Securities and other assets and liabilities denominated in foreign curren-
cies are translated into US dollars using exchange rates determined as of
the close of business on the New York Stock Exchange (“NYSE”). Foreign
currency exchange contracts are valued at the mean between the bid and
ask prices and are determined as of the close of business on the NYSE.
Interpolated values are derived when the settlement date of the contract is
an interim date for which quotations are not available.
In the event that application of these methods of valuation results in a
price for an investment which is deemed not to be representative of the
market value of such investment or is not available, the investment will
be valued in accordance with a policy approved by the Board as reflecting
fair value (“Fair Value Assets”). When determining the price for Fair Value
Assets, the investment advisor and/or the sub-advisor seeks to determine
the price that the Portfolio might reasonably expect to receive from the
current sale of that asset in an arm’s-length transaction. Fair value deter-
minations shall be based upon all available factors that the investment
advisor and/or sub-advisor deems relevant. The pricing of all Fair Value
Assets is subsequently reported to the Board or a committee thereof.
Generally, trading in foreign instruments is substantially completed
each day at various times prior to the close of business on the NYSE.
Occasionally, events affecting the values of such instruments may occur
between the foreign market close and the close of business on the NYSE
that may not be reflected in the computation of the Portfolio’s net assets.
If events (for example, a company announcement, market volatility or a
natural disaster) occur during such periods that are expected to materially
affect the value of such instruments, those instruments may be Fair Value
Assets and be valued at their fair value, as determined in good faith by the
investment advisor using a pricing service and/or policies approved by the
Board. Each business day, the Portfolio uses a pricing service to assist with
the valuation of certain foreign exchange-traded equity securities and for-
eign exchange-traded and OTC options (the “Systematic Fair Value Price”).
Using current market factors, the Systematic Fair Value Price is designed
to value such foreign securities and foreign options at fair value as of
the close of business on the NYSE, which follows the close of the
local markets.
Foreign Currency Transactions: The Portfolio’s books and records are
maintained in US dollars. Purchases and sales of investment securities are
recorded at the rates of exchange prevailing on the date the transactions
are entered into. Generally, when the US dollar rises in value against a for-
eign currency, the Portfolio’s investments denominated in that currency will
lose value because its currency is worth fewer US dollars; the opposite
effect occurs if the US dollar falls in relative value.
The Portfolio reports foreign currency related transactions as components
of realized gain (loss) for financial reporting purposes, whereas such com-
ponents are treated as ordinary income for federal income tax purposes.
Segregation and Collateralization: In cases in which the 1940 Act and the
interpretive positions of the SEC require that the Portfolio either delivers
collateral or segregates assets in connection with certain investments (e.g.,
foreign currency exchange contracts), the Portfolio will, consistent with SEC
rules and/or certain interpretive letters issued by the SEC, segregate collat-
eral or designate on its books and records cash or other liquid securities
having a market value at least equal to the amount that would otherwise
be required to be physically segregated. Furthermore, based on require-
ments and agreements with certain exchanges and third party broker-deal-
ers, each party has requirements to deliver/deposit securities as collateral
for certain investments.
Investment Transactions and Investment Income: For financial reporting
purposes, investment transactions are recorded on the dates the trans-
actions are entered into (the trade dates). Realized gains and losses
on investment transactions are determined on the identified cost basis.
Dividend income is recorded on the ex-dividend dates. Dividends from
foreign securities where the ex-dividend date may have passed are sub-
sequently recorded when the Portfolio has determined the ex-dividend
date. Under the applicable foreign tax laws, a withholding tax at various
rates may be imposed on capital gains, dividends and interest. Interest
income, including amortization and accretion of premiums and discounts
on debt securities, is recognized on the accrual basis.
ANNUAL REPORT
OCTOBER 31, 2010
41
Notes to Financial Statements (continued)
BlackRock Master International Portfolio
Income Taxes: The Portfolio is disregarded as an entity separate from its
owner for tax purposes. As such, the owner of the Portfolio is treated as the
owner of the net assets, income, expenses and realized and unrealized
gains and losses of the Master LLC. Therefore, no federal income tax provi-
sion is required. It is intended that the Portfolio’s assets will be managed
so the owner of the Master LLC can satisfy the requirements of Subchapter
M of the Internal Revenue Code of 1986, as amended.
Other: Expenses directly related to the Portfolio are charged to the
Portfolio. Other operating expenses shared by several funds are pro rated
among those funds on the basis of relative net assets or other appropriate
methods. The Portfolio has an arrangement with the custodian whereby
fees may be reduced by credits earned on uninvested cash balances,
which if applicable are shown as fees paid indirectly in the Statement of
Operations. The custodian imposes fees on overdrawn cash balances,
which can be offset by accumulated credits earned or may result in
additional custody charges.
2. Derivative Financial Instruments:
The Portfolio engages in various portfolio investment strategies using
derivative contracts both to increase the returns of the Portfolio and to
economically hedge, or protect, their exposure to certain risks such as
foreign currency exchange rate risk.
Losses may arise if the value of the contract decreases due to an unfavor-
able change in the market rates or values of the underlying instrument or
if the counterparty does not perform under the contract. The Portfolio’s
maximum risk of loss from counterparty credit risk on OTC derivatives is
generally the aggregate unrealized gain netted against any collateral
pledged by/posted to the counterparty. Counterparty risk related to
exchange-traded financial futures contracts and options is minimal
because of the protection against defaults provided by the exchange
on which these contracts trade.
The Portfolio may mitigate counterparty risk by procuring collateral and
through netting provisions included within an International Swaps and
Derivatives Association, Inc. (“ISDA”) Master Agreement implemented
between the Portfolio and each of its respective counterparties. The ISDA
Master Agreement allows the Portfolio to offset with each separate counter-
party certain derivative financial instrument’s payables and/or receivables
with collateral held. The amount of collateral moved to/from applicable
counterparties is generally based upon minimum transfer amounts of up
to $500,000. To the extent amounts due to the Portfolio from its counter-
parties are not fully collateralized contractually or otherwise, the Portfolio
bears the risk of loss from counterparty non-performance. See Note 1
“Segregation and Collateralization” for information with respect to collateral
practices. In addition, the Portfolio manages counterparty risk by entering
into agreements only with counterparties that it believes have the financial
resources to honor their obligations and by monitoring the financial stability
of those counterparties.
Certain ISDA Master Agreements allow counterparties to OTC derivatives to
terminate derivative contracts prior to maturity in the event the Portfolio’s
net assets decline by a stated percentage or the Portfolio fails to meet the
terms of its ISDA Master Agreements, which would cause the Portfolio to
accelerate payment of any net liability owed to the counterparty.
Foreign Currency Exchange Contracts: The Portfolio enters into foreign
currency exchange contracts as an economic hedge against either specific
transactions or portfolio instruments or to obtain exposure to foreign cur-
rencies (foreign currency exchange rate risk). A foreign currency exchange
contract is an agreement between two parties to buy and sell a currency at
a set exchange rate on a future date. Foreign currency exchange contracts,
when used by the Portfolio, help to manage the overall exposure to the cur-
rency backing some of the investments held by the Portfolio. The contract is
marked-to-market daily and the change in market value is recorded by the
Portfolio as an unrealized gain or loss. When the contract is closed, the
Portfolio records a realized gain or loss equal to the difference between the
value at the time it was opened and the value at the time it was closed.
The use of foreign currency exchange contracts involves the risk that the
value of a foreign currency exchange contract changes unfavorably due to
movements in the value of the referenced foreign currencies and the risk
that a counterparty to the contract does not perform its obligations under
the agreement.
Derivatives Categorized by Risk Exposure:
Fair Values of Derivative Instruments as of October 31, 2010
| | |
| | Liability Derivatives | |
| | Statement of Assets and | |
| | Liabilities Location | Value |
| Foreign currency | Unrealized depreciation on | |
| exchange contracts | foreign currency exchange contracts | $ 1,326 |
The Effect of Derivative Instruments on the Statement of Operations
Year Ended October 31, 2010
| | |
| Net Realized Gain (loss) From |
|
| Foreign currency exchange transactions | $ (193,450) |
| Net Change in Unrealized Appreciation/Depreciation on |
|
| Foreign currency exchange transactions | $ 109,278 |
For the year ended October 31, 2010, the average quarterly balance of
outstanding derivative financial instruments was as follows:
| |
| Foreign currency exchange contracts: | |
| Average number of contracts-US dollars purchased | 3 |
| Average number of contracts-US dollars sold | 4 |
| Average US dollar amounts purchased | $ 2,423,912 |
| Average US dollar amounts sold | $ 4,150,964 |
3. Investment Advisory Agreement and Other Transactions
with Affiliates:
The PNC Financial Services Group, Inc. ("PNC"), Bank of America
Corporation ("BAC") and Barclays Bank PLC ("Barclays") are the largest
stockholders of BlackRock, Inc. ("BlackRock"). Due to the ownership struc-
ture, PNC is an affiliate of the Portfolio for 1940 Act purposes, but BAC and
Barclays are not.
The Master LLC, on behalf of the Portfolio, entered into an Investment
Advisory Agreement with BlackRock Advisors, LLC (the “Manager”), the
Master LLC's investment advisor, an indirect, wholly owned subsidiary of
42 ANNUAL REPORT
OCTOBER 31, 2010
Notes to Financial Statements (concluded)
BlackRock Master International Portfolio
BlackRock, to provide investment advisory and administration services. The
Manager is responsible for the management of the Portfolio’s portfolio and
provides the necessary personnel, facilities, equipment and certain other
services necessary to the operations of the Portfolio. For such services, the
Portfolio pays the Manager a monthly fee at the following annual rates of
the Portfolio’s average daily net assets:
| |
| Portion of Average Daily Value of Net Assets | Rate |
| Not exceeding $500 million | 0.75% |
| In excess of $500 million | 0.70% |
The Manager voluntarily agreed to waive its investment advisory fees by
the amount of investment advisory fees the Portfolio pays to the Manager
indirectly through its investment in affiliated money market funds, however,
the Manager does not waive its investment advisory fees by the amount of
investment advisory fees paid through the Portfolio’s investment in other
affiliated investment companies, if any. These amounts are included in fees
waived by advisor in the Statement of Operations.
The Manager has entered into a separate sub-advisory agreement with
BlackRock International Limited, an affiliate of the Manager. The Manager
pays the sub-advisor for services it provides, a monthly fee that is a
percentage of the investment advisory fees paid by the Portfolio to
the Manager.
For the year ended October 31, 2010, the Portfolio reimbursed the
Manager $1,208 for certain accounting services, which is included in
accounting services in the Statement of Operations.
Certain officers and/or directors of the Master LLC are officers and/or
directors of BlackRock or its affiliates.
4. Investments:
Purchases and sales of investments, excluding short-term securities for the
year ended October 31, 2010, were $94,105,511 and $107,169,987,
respectively.
5. Borrowings:
The Portfolio, along with certain other funds managed by the Manager and
its affiliates, is a party to a $500 million credit agreement with a group of
lenders, which expires in November 2010 and was subsequently renewed
until November 2011. The Portfolio may borrow under the credit agreement
to fund shareholder redemptions. Effective November 2008, the credit
agreement had the following terms: 0.02% upfront fee on the aggregate
commitment amount which was allocated to the Portfolio based on its net
assets as of October 31, 2008, a commitment fee of 0.08% per annum
based on the Portfolio's pro rata share of the unused portion of the credit
agreement, which is included in miscellaneous in the Statement of
Operations, and interest at a rate equal to the higher of (a) federal funds
effective rate and (b) reserve adjusted one-month LIBOR, plus, in each
case, the higher of (i) 1.50% and (ii) 50% of the CDX Index (as defined in
the credit agreement) on amounts borrowed. Effective November 2009, the
credit agreement was renewed with the following terms: 0.02% upfront fee
on the aggregate commitment amount which was allocated to the Portfolio
based on its net assets as of October 31, 2009, a commitment fee of
0.10% per annum based on the Portfolio's pro rata share of the unused
portion of the credit agreement and interest at a rate equal to the higher
of (a) the one-month LIBOR plus 1.25% per annum and (b) the Fed
Funds rate plus 1.25% per annum on amounts borrowed. The portfolio
did not borrow under the credit agreement during the year ended
October 31, 2010.
6. Geographic, Market and Credit Risk:
In the normal course of business, the Portfolio invests in securities and
enters into transactions where risks exist due to fluctuations in the market
(market risk) or failure of the issuer of a security to meet all its obligations
(issuer credit risk). The value of securities held by the Portfolio may decline
in response to certain events, including those directly involving the issuers
whose securities are owned by the Portfolio; conditions affecting the gen-
eral economy; overall market changes; local, regional or global political,
social or economic instability; and currency and interest rate and price
fluctuations. Similar to issuer credit risk, the Portfolio may be exposed to
counterparty credit risk, or the risk that an entity with which the Portfolio
has unsettled or open transactions may fail to or be unable to perform on
its commitments. The Portfolio manages counterparty credit risk by entering
into transactions only with counterparties that it believes have the financial
resources to honor their obligations and by monitoring the financial stability
of those counterparties. Financial assets, which potentially expose the
Portfolio to market, issuer and counterparty credit risks, consist principally
of financial instruments and receivables due from counterparties. The
extent of the Portfolio’s exposure to market, issuer and counterparty credit
risks with respect to these financial assets is generally approximated by
their value recorded in the Portfolio’s Statement of Assets and Liabilities,
less any collateral held by the Portfolio.
As of October 31, 2010, the Portfolio had the following industry
classifications:
| |
| | Percent of |
| | Long-Term |
| Industry | Investments |
| Capital Markets | 9% |
| Pharmaceuticals | 9 |
| Semiconductors & Semiconductor Equipment | 8 |
| Commercial Banks. | 7 |
| Metals & Mining | 7 |
| Wireless Telecommunication Services | 7 |
| Oil, Gas & Consumable Fuels | 6 |
| Other* | 47 |
*All other industries held were each less than 5% of long-term investments.
7. Subsequent Events:
Management has evaluated the impact of all subsequent events on the
Portfolio through the date the financial statements were issued and has
determined that there were no subsequent events requiring adjustment or
additional disclosure in the financial statements.
ANNUAL REPORT
OCTOBER 31, 2010
43
Report of Independent Registered Public Accounting Firm
BlackRock Master International Portfolio
To the Investor and Board of Directors of
BlackRock Master LLC:
We have audited the accompanying statement of assets and liabilities,
including the schedule of investments, of BlackRock Master International
Portfolio, one of the series constituting BlackRock Master LLC (the “Master
LLC”) as of October 31, 2010, and the related statement of operations for
the year then ended, the statements of changes in net assets for each of
the two years then ended, and the financial highlights for each of the two
years in the period then ended, for the period June 1, 2008 to October 31,
2008 and for each of the three years in the period ended May 31, 2008.
These financial statements and financial highlights are the responsibility of
the Master LLC’s management. Our responsibility is to express an opinion
on these financial statements and financial highlights based on our audits.
We conducted our audits in accordance with the standards of the Public
Company Accounting Oversight Board (United States). Those standards
require that we plan and perform the audit to obtain reasonable assurance
about whether the financial statements and financial highlights are free of
material misstatement. The Master LLC is not required to have, nor were we
engaged to perform, an audit of its internal control over financial reporting.
Our audits included consideration of internal control over financial report-
ing as a basis for designing audit procedures that are appropriate in the
circumstances, but not for the purpose of expressing an opinion on the
effectiveness of the Master LLC’s internal control over financial reporting.
Accordingly, we express no such opinion. An audit also includes examining,
on a test basis, evidence supporting the amounts and disclosures in the
financial statements, assessing the accounting principles used and signifi-
cant estimates made by management, as well as evaluating the overall
financial statement presentation. Our procedures included confirmation of
securities owned as of October 31, 2010, by correspondence with the cus-
todian and brokers; where replies were not received from brokers, we per-
formed other auditing procedures. We believe that our audits provide a
reasonable basis for our opinion.
In our opinion, the financial statements and financial highlights referred
to above present fairly, in all material respects, the financial position of
BlackRock Master International Portfolio of BlackRock Master LLC as of
October 31, 2010, the results of its operations for the year then ended,
the changes in its net assets for each of the two years in the period then
ended, and the financial highlights for each of the two years in the period
then ended, for the period June 1, 2008 to October 31, 2008 and for each
of the three years in the period ended May 31, 2008, in conformity with
accounting principles generally accepted in the United States of America.
Deloitte & Touche LLP
Princeton, New Jersey
December 28, 2010
44 ANNUAL REPORT
OCTOBER 31, 2010
Disclosure of Investment Advisory Agreements and Sub-Advisory Agreements
The Board of Directors of BlackRock Global Emerging Markets Fund,
Inc. (“Global Emerging Markets Fund”) met on April 20, 2010 and May
18 — 19, 2010 to consider the approval of Global Emerging Market Fund’s
investment advisory agreement (the “Global Emerging Markets Advisory
Agreement”) with BlackRock Advisors, LLC (the “Manager”), its investment
advisor. The Board of Directors of Global Emerging Markets Fund also con-
sidered the approval of the separate sub-advisory agreements (the “Global
Emerging Markets Sub-Advisory Agreements”) (i) between the Manager and
BlackRock International Limited (“BIL”) and (ii) between the Manager and
BlackRock Investment Management, LLC (“BIM,” and collectively with BIL,
the “Sub-Advisors”).
The Board of Directors of BlackRock Latin America Fund, Inc. (“Latin
America Fund”) met on April 20, 2010 and May 18 — 19, 2010 to
consider the approval of Latin America Fund’s investment advisory agree-
ment (the “Latin America Advisory Agreement”) with BlackRock Advisors,
LLC (the “Manager”), its investment advisor. The Board of Directors of Latin
America Fund also considered the approval of the separate sub-advisory
agreements (the “Latin America Sub-Advisory Agreements”) (i) between the
Manager and BlackRock International Limited (“BIL”) and (ii) between the
Manager and BlackRock Investment Management, LLC (“BIM,” and collec-
tively with BIL, the “Sub-Advisors”).
The Board of Directors of BlackRock Master LLC (the “Master LLC”) met
on April 20, 2010 and May 18 — 19, 2010 to consider the approval of
the investment advisory agreement (the “Master LLC Advisory Agreement”)
with BlackRock Advisors, LLC (the “Manager”), the Master LLC’s investment
advisor, on behalf of BlackRock Master International Portfolio (the “Master
Portfolio”), a series of the Master LLC. The Board of Directors of the
Master LLC also considered the approval of the sub-advisory agreement
between the Manager and BlackRock International Limited (“BIL”) with
respect to the Master Portfolio (the “Master LLC Sub-Advisory Agreement”
and together with the Master LLC Advisory Agreement, the “Master LLC
Agreements”). BlackRock International Fund (“International Fund”), a series
of BlackRock Series, Inc. (“Series Fund”), is a “feeder” fund that invests
all of its investable assets in the Master Portfolio. Accordingly, the Board
of Directors of Series Fund also considered the approval of the Master
LLC Agreements.
Global Emerging Markets Fund, Latin America Fund, the Master LLC
(with respect to the Master Portfolio) and Series Fund (with respect to
International Fund) are referred to herein individually as a “Fund” or
collectively as the “Funds.” The Manager and the Sub-Advisors are
referred to herein as “BlackRock.” The Global Emerging Markets Advisory
Agreement, the Global Emerging Markets Sub-Advisory Agreements,
the Latin America Advisory Agreement, the Latin America Sub-Advisory
Agreements, the Master LLC Advisory Agreement and the Master LLC Sub-
Advisory Agreement are referred to herein as the “Agreements.” For simplic-
ity, the Board of Directors of Global Emerging Markets Fund, the Board of
Directors of Latin America Fund, the Board of Directors of the Master LLC
and the Board of Directors of Series Fund, which are comprised of the
same thirteen individuals, are referred to herein collectively as the “Boards”
and the members are referred to as “Board Members.”
Activities and Composition of the Boards
Each Board consists of thirteen individuals, eleven of whom are not “inter-
ested persons” of any Fund as defined in the Investment Company Act of
1940, as amended (the “1940 Act”) (the “Independent Board Members”).
The Board Members are responsible for the oversight of the operations of
the Funds and perform the various duties imposed on the directors of
investment companies by the 1940 Act. The Independent Board Members
have retained independent legal counsel to assist them in connection with
their duties. The Co-Chairs of each Board are each Independent Board
Members. Each Board has established five standing committees: an Audit
Committee, a Governance and Nominating Committee, a Compliance
Committee, a Performance Oversight and Contract Committee and an
Executive Committee, each of which is composed of Independent Board
Members (except for the Executive Committee, which also has one inter-
ested Board Member) and is chaired by Independent Board Members.
Each Board also has one ad hoc committee, the Joint Product Pricing
Committee, which consists of Independent Board Members and
directors/trustees of the boards of certain other BlackRock-managed
funds, who are not “interested persons” of their respective funds.
The Agreements
Pursuant to the 1940 Act, the Boards are required to consider the
continuation of the Agreements on an annual basis. In connection with
this process, the Boards assessed, among other things, the nature,
scope and quality of the services provided to the Funds by the personnel
of BlackRock and its affiliates, including investment management, adminis-
trative and shareholder services, oversight of fund accounting and custody,
marketing services and assistance in meeting applicable legal and regula-
tory requirements.
From time to time throughout the year, the Boards, acting directly and
through their committees, consider at each of their meetings factors that
are relevant to their annual consideration of the renewal of the Agreements,
including the services and support provided by BlackRock to the Funds
and their respective shareholders or interestholders, as applicable (referred
to herein as “shareholders”). Among the matters the Boards considered,
with respect to each Fund, were: (a) investment performance for one-,
three- and five-year periods, as applicable, against peer funds, and
applicable benchmarks, if any, as well as senior management’s and portfo-
lio managers’ analysis of the reasons for any over performance or under-
performance against a Fund’s peers and/or benchmark, as applicable;
(b) fees, including advisory, administration, if applicable, and other
amounts paid to BlackRock and its affiliates by the Fund for services,
such as transfer agency, marketing and distribution, call center and fund
accounting; (c) Fund operating expenses; (d) the resources devoted to
and compliance reports relating to the Fund’s investment objective, policies
and restrictions; (e) the compliance of each of the Funds with its respec-
tive Code of Ethics and compliance policies and procedures; (f) the nature,
cost and character of non-investment management services provided by
BlackRock and its affiliates; (g) BlackRock’s and other service providers’
internal controls; (h) BlackRock’s implementation of the proxy voting poli-
cies approved by the Boards; (i) the use of brokerage commissions and
execution quality of portfolio transactions; (j) BlackRock’s implementation
ANNUAL REPORT
OCTOBER 31, 2010
45
Disclosure of Investment Advisory Agreements and Sub-Advisory Agreements (continued)
of each Fund’s valuation and liquidity procedures; (k) an analysis of con-
tractual and actual management fees for products with similar investment
objectives across the open-end fund, closed-end fund and institutional
account product channels, as applicable; and (l) periodic updates on
BlackRock’s business.
Board Considerations in Approving the Agreements
The Approval Process: Prior to the April 20, 2010 meeting, the Boards
requested and received materials specifically relating to the Agreements.
The Boards are engaged in a process with BlackRock to periodically
review the nature and scope of the information provided to better assist
their deliberations. The materials provided in connection with the April
meeting included (a) information independently compiled and prepared
by Lipper, Inc. (“Lipper”) on the fees and expenses of each Fund, and the
investment performance of Global Emerging Markets Fund, Latin America
Fund and International Fund as compared with a peer group of funds as
determined by Lipper (collectively, “Peers”); (b) information on the prof-
itability of the Agreements to BlackRock and a discussion of fall-out bene-
fits to BlackRock and its affiliates and significant shareholders; (c) a
general analysis provided by BlackRock concerning investment advisory
fees charged to other clients, such as institutional clients and closed-end
funds, under similar investment mandates, as well as the performance of
such other clients, as applicable; (d) the impact of economies of scale;
(e) a summary of aggregate amounts paid by each Fund to BlackRock;
(f) sales and redemption data regarding the shares of Global Emerging
Markets Fund, Latin America Fund and International Fund; and (g) if appli-
cable, a comparison of management fees to similar BlackRock open-end
funds, as classified by Lipper.
At an in-person meeting held on April 20, 2010, the Boards reviewed
materials relating to their consideration of the Agreements. As a result of
the discussions that occurred during the April 20, 2010 meeting, the
Boards presented BlackRock with questions and requests for additional
information and BlackRock responded to these requests with additional
written information in advance of the May 18 — 19, 2010 Board meeting.
At an in-person meeting held on May 18 — 19, 2010, (a) the Board
Members of Global Emerging Markets Fund, including the Independent
Board Members, unanimously approved the continuation of (i) the Global
Emerging Markets Advisory Agreement between the Manager and Global
Emerging Markets Fund, (ii) the Global Emerging Markets Sub-Advisory
Agreement between the Manager and BIL and (iii) the Global Emerging
Markets Sub-Advisory Agreement between the Manager and BIM; (b) the
Board Members of Latin America Fund, including the Independent Board
Members, unanimously approved the continuation of (i) the Latin America
Advisory Agreement between the Manager and Latin America Fund, (ii) the
Latin America Sub-Advisory Agreement between the Manager and BIL and
(iii) the Latin America Sub-Advisory Agreement between the Manager and
BIM with respect to Latin America Fund; and (c) the Board Members of
the Master LLC, including the Independent Board Members, unanimously
approved the continuation of (i) the Master LLC Advisory Agreement
between the Manager and the Master LLC on behalf of the Master Portfolio
and (ii) the Master LLC Sub-Advisory Agreement between the Manager and
BIM with respect to the Master Portfolio, each for a one-year term ending
June 30, 2011. The Board Members of Series Fund, including the
Independent Board Members, also considered the continuation of the
Master LLC Agreements and found the Master LLC Agreements to be
satisfactory. In approving the continuation of the Agreements, each
Board considered, with respect to the applicable Fund: (a) the nature,
extent and quality of the services provided by BlackRock; (b) the invest-
ment performance of the Fund and BlackRock; (c) the advisory fee and
the cost of the services and profits to be realized by BlackRock and its
affiliates from their relationship with the Fund; (d) economies of scale;
and (e) other factors deemed relevant by the Board Members.
Each Board also considered other matters it deemed important to the
approval process, such as payments made to BlackRock or its affiliates
relating to the distribution of the applicable Fund’s shares, services related
to the valuation and pricing of portfolio holdings of the applicable Fund,
direct and indirect benefits to BlackRock and its affiliates and significant
shareholders from their relationship with the applicable Fund and advice
from independent legal counsel with respect to the review process and
materials submitted for the Board’s review. The Board noted the willingness
of BlackRock personnel to engage in open, candid discussions with the
Boards. The Boards did not identify any particular information as control-
ling, and each Board Member may have attributed different weights to the
various items considered.
A. Nature, Extent and Quality of the Services Provided by BlackRock:
Each Board, including the Independent Board Members, reviewed the
nature, extent and quality of services provided by BlackRock, including
the investment advisory services and the resulting performance of the
applicable Fund. Throughout the year, each Board compared the perform-
ance of the applicable Fund to the performance of a comparable group of
mutual funds, and the performance of a relevant benchmark, if any. The
Boards met with BlackRock’s senior management personnel responsible
for investment operations, including the senior investment officers. Each
Board also reviewed the materials provided by the applicable Fund’s
portfolio management team discussing Fund performance and the Fund’s
investment objective, strategies and outlook.
Each Board considered, among other factors, the number, education
and experience of BlackRock’s investment personnel generally and the
applicable Fund’s portfolio management team, investments by portfolio
managers in the funds they manage, BlackRock’s portfolio trading capabili-
ties, BlackRock’s use of technology, BlackRock’s commitment to compli-
ance, BlackRock’s credit analysis capabilities, BlackRock’s risk analysis
capabilities and BlackRock’s approach to training and retaining portfolio
managers and other research, advisory and management personnel. Each
Board also reviewed a general description of BlackRock’s compensation
structure with respect to the applicable Fund’s portfolio management team
and BlackRock’s ability to attract and retain high-quality talent.
In addition to advisory services, the Boards considered the quality of the
administrative and non-investment advisory services provided to the Funds.
BlackRock and its affiliates and significant shareholders provide the Funds
with certain administrative, transfer agency, shareholder and other services
(in addition to any such services provided to the Funds by third parties)
46 ANNUAL REPORT
OCTOBER 31, 2010
Disclosure of Investment Advisory Agreements and Sub-Advisory Agreements (continued)
and officers and other personnel as are necessary for the operations of
the Funds. In addition to investment advisory services, BlackRock and its
affiliates provide the Funds with other services, including (i) preparing dis-
closure documents, such as the prospectus, the statement of additional
information and periodic shareholder reports; (ii) assisting with daily
accounting and pricing; (iii) overseeing and coordinating the activities of
other service providers; (iv) organizing Board meetings and preparing the
materials for such Board meetings; (v) providing legal and compliance
support; and (vi) performing other administrative functions necessary for
the operation of each of the Funds, such as tax reporting, fulfilling regula-
tory filing requirements, and call center services. The Boards reviewed the
structure and duties of BlackRock’s fund administration, accounting, legal
and compliance departments and considered BlackRock’s policies and
procedures for assuring compliance with applicable laws and regulations.
B. The Investment Performance of the Funds and BlackRock: The Boards,
including the Independent Board Members, also reviewed and considered
the performance history of Global Emerging Markets Fund, Latin America
Fund and the Master Portfolio and International Fund, as applicable. The
Board Members of each of the Master LLC and Series Fund noted that the
Master Portfolio’s investment results correspond directly to the investment
results of International Fund. In preparation for the April 20, 2010 meeting,
the Boards were provided with reports, independently prepared by Lipper,
which included a comprehensive analysis of the performance of each
of Global Emerging Markets Fund, Latin America Fund and International
Fund. The Boards also reviewed a narrative and statistical analysis of the
Lipper data that was prepared by BlackRock, which analyzed various fac-
tors that affect Lipper’s rankings. In connection with its review, each Board
received and reviewed information, as applicable, regarding the investment
performance of Global Emerging Markets Fund, Latin America Fund and
International Fund as compared to a representative group of similar funds
as determined by Lipper and to all funds in the applicable Lipper category.
The Boards were provided with a description of the methodology used by
Lipper to select peer funds. Each Board regularly reviews the performance
of Global Emerging Markets Fund, Latin America Fund, the Master Portfolio
and International Fund, as applicable, throughout the year. The Boards
attach more importance to performance over relatively long periods of
time, typically three to five years.
The Board of Global Emerging Markets Fund noted that, in general, the
Fund performed better than its Peers in that the Fund’s performance was at
or above the median of its Lipper Performance Universe in two of the one-,
three- and five-year periods reported.
The Board of Latin America Fund noted that, in general, the Fund per-
formed better than its Peers in that the Fund’s performance was at or
above the median of its Lipper Performance Universe in each of the one-,
three- and five-year periods reported.
The Boards of each of the Master LLC and Series Fund noted that, in gen-
eral, the International Fund performed better than its Peers in that the
Fund’s performance was at or above the median of its Lipper Performance
Universe in two of the one-, three- and five-year periods reported.
C. Consideration of the Advisory Fees and the Cost of the Services
and Profits to be Realized by BlackRock and its Affiliates from their
Relationship with the Funds: Each Board, including the Independent Board
Members, reviewed the applicable contractual advisory fee rate of Global
Emerging Markets Fund, Latin America Fund and the Master Portfolio com-
pared with the other funds in the applicable Fund’s Lipper category. Each
Board also compared the total expenses of Global Emerging Markets Fund,
Latin America Fund and International Fund, as well as actual management
fees, to those of other funds in its Lipper category. Each Board considered
the services provided and the fees charged by BlackRock to other types of
clients with similar investment mandates, including separately managed
institutional accounts.
The Boards received and reviewed statements relating to BlackRock’s finan-
cial condition and profitability with respect to the services it provided the
Funds. The Boards were also provided with a profitability analysis that
detailed the revenues earned and the expenses incurred by BlackRock for
services provided to the Funds. The Boards reviewed BlackRock’s profitabil-
ity with respect to the Funds and other funds the Boards currently oversee
for the year ended December 31, 2009 compared to available aggregate
profitability data provided for the year ended December 31, 2008. The
Boards reviewed BlackRock’s profitability with respect to other fund com-
plexes managed by the Manager and/or its affiliates. The Boards reviewed
BlackRock’s assumptions and methodology of allocating expenses in the
profitability analysis, noting the inherent limitations in allocating costs
among various advisory products. The Boards recognized that profitability
may be affected by numerous factors including, among other things, fee
waivers and expense reimbursements by the Manager, the types of funds
managed, expense allocations and business mix, and the difficulty of com-
paring profitability as a result of those factors.
The Boards noted that, in general, individual fund or product line profitabil-
ity of other advisors is not publicly available. Nevertheless, to the extent
such information was available, the Boards considered BlackRock’s operat-
ing margin, in general, compared to the operating margin for leading invest-
ment management firms whose operations include advising open-end
funds, among other product types. That data indicates that operating mar-
gins for BlackRock with respect to its registered funds are generally consis-
tent with margins earned by similarly situated publicly traded competitors.
In addition, the Boards considered, among other things, certain third party
data comparing BlackRock’s operating margin with that of other publicly-
traded asset management firms. That third party data indicates that larger
asset bases do not, in themselves, translate to higher profit margins.
In addition, each Board considered the cost of the services provided to the
applicable Fund by BlackRock, and BlackRock’s and its affiliates’ profits
relating to the management and distribution of the applicable Fund and
the other funds advised by BlackRock and its affiliates. As part of its analy-
sis, each Board reviewed BlackRock’s methodology in allocating its costs to
the management of the applicable Fund. Each Board also considered
whether BlackRock has the financial resources necessary to attract and
retain high quality investment management personnel to perform its obliga-
tions under the Agreements and to continue to provide the high quality of
services that is expected by that Board.
ANNUAL REPORT
OCTOBER 31, 2010
47
Disclosure of Investment Advisory Agreements and Sub-Advisory Agreements (concluded)
The Board of each of Global Emerging Markets Fund, Latin America Fund,
the Master LLC and Series Fund noted that the contractual advisory fee
rate of the applicable Fund was lower than or equal to the median contrac-
tual advisory fee rate paid by the Fund’s Peers, in each case before taking
into account any expense reimbursements or fee waivers. The Boards of
Series Fund and the Master LLC further noted that the Master Portfolio has
an advisory fee arrangement that includes breakpoints that adjust the fee
rate downward as the size of the Master Portfolio increases above certain
contractually specified levels.
D. Economies of Scale: Each Board, including the Independent Board
Members, considered the extent to which economies of scale might be
realized as the assets of the applicable Fund increase. Each Board also
considered the extent to which the applicable Fund benefits from such
economies and whether there should be changes in the advisory fee
rate or structure in order to enable Global Emerging Markets Fund, Latin
America Fund, the Master Portfolio and International Fund, as applicable,
to participate in these economies of scale, for example through the use
of breakpoints in the advisory fee based upon the applicable Fund’s asset
level, or, in the case of the Master Portfolio and International Fund, the use
of revised breakpoints based upon the Master Portfolio’s asset level.
E. Other Factors Deemed Relevant by the Board Members: Each Board,
including the Independent Board Members, also took into account other
ancillary or “fall-out” benefits that BlackRock or its affiliates and significant
shareholders may derive from their respective relationships with the
applicable Fund, both tangible and intangible, such as BlackRock’s ability
to leverage its investment professionals who manage other portfolios, an
increase in BlackRock’s profile in the investment advisory community, and
the engagement of BlackRock’s affiliates and significant shareholders
as service providers to the applicable Fund, including for administrative,
transfer agency and distribution services. Each Board also considered
BlackRock’s overall operations and its efforts to expand the scale of,
and improve the quality of, its operations. Each Board also noted that
BlackRock may use and benefit from third party research obtained by
soft dollars generated by certain mutual fund transactions to assist in man-
aging all or a number of its other client accounts. Each Board further noted
that BlackRock completed the acquisition of a complex of exchange-traded
funds (“ETFs”) on December 1, 2009, and that BlackRock’s funds may
invest in such ETFs without any offset against the management fees
payable by the funds to BlackRock.
In connection with its consideration of the Agreements, the Boards also
received information regarding BlackRock’s brokerage and soft dollar prac-
tices. The Boards received reports from BlackRock which included informa-
tion on brokerage commissions and trade execution practices throughout
the year.
The Boards noted the competitive nature of the open-end fund market-
place, and that shareholders are able to redeem their Fund shares if they
believe that the applicable Fund’s fees and expenses are too high or if they
are dissatisfied with the performance of the Fund.
Conclusion
The Board Members of Global Emerging Markets Fund, including the
Independent Board Members, unanimously approved the continuation of
(i) the Global Emerging Markets Advisory Agreement between the Manager
and Global Emerging Markets Fund, (ii) the Global Emerging Markets Sub-
Advisory Agreement between the Manager and BIL and (iii) the Global
Emerging Markets Sub-Advisory Agreement between the Manager and
BIM, each for a one-year term ending June 30, 2011. The Board Members
of Latin America Fund, including the Independent Board Members,
unanimously approved the continuation of (i) the Latin America Advisory
Agreement between the Manager and Latin America Fund, (ii) the Latin
America Sub-Advisory Agreement between the Manager and BIL and
(iii) the Latin America Sub-Advisory Agreement between the Manager
and BIM, each for a one-year term ending June 30, 2011. The Board
Members of the Master LLC, including the Independent Board Members,
unanimously approved the continuation of (i) the Master LLC Advisory
Agreement between the Manager and the Master LLC on behalf of the
Master Portfolio and (ii) the Master LLC Sub-Advisory Agreement between
the Manager and BIM with respect to the Master Portfolio, each for a one-
year term ending June 30, 2011. As part of its approval, the Board of each
of Global Emerging Markets Fund, Latin America Fund and the Master LLC
considered the discussions of BlackRock’s fee structure, as it applies to
the applicable Fund, being conducted by the ad hoc Joint Product Pricing
Committee. Based upon its evaluation of all of the aforementioned
factors in their totality, the Board of each of Global Emerging Markets
Fund, Latin America Fund and the Master LLC, including the Independent
Board Members, was satisfied that the terms of the Agreements were fair
and reasonable and in the best interest of the applicable Fund and its
shareholders. The Board of Series Fund, including the Independent Board
Members, also considered the continuation of the Master LLC Agreements
and found the Master LLC Agreements to be satisfactory.
In arriving at a decision to approve the Agreements, the Boards did not
identify any single factor or group of factors as all-important or controlling,
but considered all factors together, and different Board Members may
have attributed different weights to the various factors considered. The
Independent Board Members were also assisted by the advice of inde-
pendent legal counsel in making this determination. The contractual fee
arrangements for each of Global Emerging Markets Fund, Latin America
Fund and the Master LLC, as applicable, reflect the results of several
years of review by the Board Members and predecessor Board Members,
and discussions between such Board Members (and predecessor Board
Members) and BlackRock. Certain aspects of the arrangements may be
the subject of more attention in some years than in others, and the Board
Members’ conclusions may be based in part on their consideration of these
arrangements in prior years.
48 ANNUAL REPORT
OCTOBER 31, 2010
| | | | | |
| Officers and Directors | | | | |
| | | | | Number of BlackRock- | |
| | | | | Advised Registered | |
| | Position(s) | Length | | Investment Companies | |
| | Held with | of Time | | (“RICs”) Consisting of | |
| Name, Address | Funds/ | Served as | | Investment Portfolios | Public |
| and Year of Birth | Master LLC | a Director2 | Principal Occupation(s) During Past 5 Years | (“Portfolios”) Overseen | Directorships |
| Non-Interested Director1 | | | | |
| Ronald W. Forbes | Co-Chair of | Since | Professor Emeritus of Finance, School of Business, State University | 36 RICs consisting of | None |
| 55 East 52nd Street | the Board | 2000 | of New York at Albany since 2000. | 95 Portfolios | |
| New York, NY 10055 | and Director | | | | |
| 1940 | | | | | |
| Rodney D. Johnson | Co-Chair of | Since | President, Fairmount Capital Advisors, Inc. since 1987; Director, | 36 RICs consisting of | None |
| 55 East 52nd Street | the Board | 2007 | Fox Chase Cancer Center since 2004; Member of the Archdiocesan | 95 Portfolios | |
| New York, NY 10055 | and Director | | Investment Committee of the Archdiocese of Philadelphia since | | |
| 1941 | | | 2004; Director, The Committee of Seventy (civic) since 2006. | | |
| David O. Beim | Director | Since | Professor of Finance and Economics at the Columbia University | 36 RICs consisting of | None |
| 55 East 52nd Street | | 2007 | Graduate School of Business since 1991; Trustee, Phillips Exeter | 95 Portfolios | |
| New York, NY 10055 | | | Academy since 2002; Chairman, Wave Hill, Inc. (public garden and | | |
| 1940 | | | cultural center) from 1990 to 2006. | | |
| Dr. Matina S. Horner | Director | Since | Executive Vice President of Teachers Insurance and Annuity Association | 36 RICs consisting of | NSTAR (electric |
| 55 East 52nd Street | | 2007 | and College Retirement Equities Fund from 1989 to 2003. | 95 Portfolios | and gas utility) |
| New York, NY 10055 | | | | | |
| 1939 | | | | | |
| Herbert I. London | Director and | Since | Professor Emeritus, New York University since 2005; John M. Olin | 36 RICs consisting of | AIMS Worldwide, |
| 55 East 52nd Street | Member of | 2007 | Professor of Humanities, New York University from 1993 to 2005 | 95 Portfolios | Inc. (marketing) |
| New York, NY 10055 | the Audit | | and Professor thereof from 1980 to 2005; President, Hudson Institute | | |
| 1939 | Committee | | (policy research organization) since 1997 and Trustee thereof since | | |
| 1980; Chairman of the Board of Trustees for Grantham University |
| | | | since 2006; Director, InnoCentive, Inc. (strategic solutions company) | | |
| | | | since 2005; Director, Cerego, LLC (software development and design) | | |
| | | | since 2005. | | |
| Cynthia A. Montgomery | Director | Since | Professor, Harvard Business School since 1989; Director, Harvard | 36 RICs consisting of | Newell Rubbermaid, |
| 55 East 52nd Street | | 2000 | Business School Publishing since 2005; Director, McLean Hospital | 95 Portfolios | Inc. (manufacturing) |
| New York, NY 10055 | | | since 2005. | | |
| 1952 | | | | | |
| Joseph P. Platt | Director | Since | Director, The West Penn Allegheny Health System (a not-for-profit | 36 RICs consisting of | Greenlight Capital |
| 55 East 52nd Street | | 2007 | health system) since 2008; Director, Jones and Brown (Canadian | 95 Portfolios | Re, Ltd (reinsurance |
| New York, NY 10055 | | | insurance broker) since 1998; General Partner, Thorn Partners, LP | | company); WQED |
| 1947 | | | (private investment) since 1998; Partner, Amarna Corporation, LLC | | Multi-Media (public |
| | | | (private investment company) from 2002 to 2008. | | broadcasting not-for- |
| | | | | | profit) |
| Robert C. Robb, Jr. | Director | Since | Partner, Lewis, Eckert, Robb and Company (management and | 36 RICs consisting of | None |
| 55 East 52nd Street | | 2007 | financial consulting firm) since 1981. | 95 Portfolios | |
| New York, NY 10055 | | | | | |
| 1945 | | | | | |
| Toby Rosenblatt | Director | Since | President, Founders Investments Ltd. (private investments) since | 36 RICs consisting of | A.P. Pharma, Inc. |
| 55 East 52nd Street | | 2007 | 1999; Director, College Access Foundation of California (philanthropic | 95 Portfolios | (specialty |
| New York, NY 10055 | | | foundation) since 2009; Director, Forward Management, LLC since | | pharmaceuticals) |
| 1938 | | | 2007; Director, The James Irvine Foundation (philanthropic foundation) | | |
| | | | from 1998 to 2008. | | |
ANNUAL REPORT
OCTOBER 31, 2010
49
| | | | | |
| Officers and Directors (continued) | | |
| | | | | Number of BlackRock- | |
| | | | | Advised Registered | |
| | Position(s) | Length | | Investment Companies | |
| | Held with | of Time | | (“RICs”) Consisting of | |
| Name, Address | Funds/ | Served as | | Investment Portfolios | Public |
| and Year of Birth | Master LLC | a Director2 | Principal Occupation(s) During Past 5 Years | (“Portfolios”) Overseen | Directorships |
| Non-Interested Director1 (concluded) | | | | |
| Kenneth L. Urish | Chair of | Since | Managing Partner, Urish Popeck & Co., LLC (certified public | 36 RICs consisting of | None |
| 55 East 52nd Street | the Audit | 2007 | accountants and consultants) since 1976; Chairman Elect of | 95 Portfolios | |
| New York, NY 10055 | Committee | | the Professional Ethics Committee of the Pennsylvania Institute | | |
| 1951 | and Director | | of Certified Public Accountants and Committee Member thereof | | |
| | | | since 2007; Member of External Advisory Board, The Pennsylvania | | |
| | | | State University Accounting Department since 2001; Trustee, The | | |
| | | | Holy Family Foundation from 2001 to 2009; President and Trustee, | | |
| | | | Pittsburgh Catholic Publishing Associates from 2003 to 2008; | | |
| | | | Director, Inter-Tel from 2006 to 2007. | | |
| Frederick W. Winter | Director and | Since | Professor and Dean Emeritus of the Joseph M. Katz School of | 36 RICs consisting of | None |
| 55 East 52nd Street | Member of | 2007 | Business, University of Pittsburgh since 2005 and Dean thereof | 95 Portfolios | |
| New York, NY 10055 | the Audit | | from 1997 to 2005; Director, Alkon Corporation (pneumatics) | | |
| 1945 | Committee | | since 1992; Director, Tippman Sports (recreation) since 2005; | | |
| | | | Director, Indotronix International (IT services) from 2004 to 2008. | | |
1 Directors serve until their resignation, removal or death, or until December 31 of the year in which they turn 72. The Board has approved one-year
extensions in terms of Directors who turn 72 prior to December 31, 2013.
2 Date shown is the earliest date a person has served for the Funds/Master LLC covered by this annual report. Following the combination of Merrill Lynch
Investment Managers, L.P. (“MLIM”) and BlackRock, Inc. in September 2006, the various legacy MLIM and legacy BlackRock fund boards were realigned
and consolidated into three new fund boards in 2007. As a result, although the chart shows certain Directors as joining the Funds’/Master LLC’s Board in
2007, each Director first became a member of the board of other legacy MLIM or legacy BlackRock funds as follows: David O. Beim, 1998; Ronald W.
Forbes, 1977; Dr. Matina Horner, 2004; Rodney D. Johnson, 1995; Herbert I. London, 1987; Cynthia A. Montgomery, 1994; Joseph P. Platt, 1999; Robert
C. Robb, Jr., 1998; Toby Rosenblatt, 2005; Kenneth L. Urish, 1999; and Frederick W. Winter, 1999.
| | | | | |
| Interested Directors3 | | | | | |
| Richard S. Davis | Director | Since | Managing Director, BlackRock, Inc. since 2005; Chief Executive | 169 RICs consisting of | None |
| 55 East 52nd Street | | 2007 | Officer, State Street Research & Management Company from 2000 | 290 Portfolios | |
| New York, NY 10055 | | | to 2005; Chairman of the Board of Trustees, State Street Research | | |
| 1945 | | | Mutual Funds from 2000 to 2005. | | |
| Henry Gabbay | Director | Since | Consultant, BlackRock, Inc. from 2007 to 2008; Managing Director, | 169 RICs consisting of | None |
| 55 East 52nd Street | | 2007 | BlackRock, Inc. from 1989 to 2007; Chief Administrative Officer, | 290 Portfolios | |
| New York, NY 10055 | | | BlackRock Advisors, LLC from 1998 to 2007; President of BlackRock | | |
| 1947 | | | Funds and BlackRock Bond Allocation Target Shares from 2005 to | | |
| | | | 2007 and Treasurer of certain closed-end funds in the BlackRock | | |
| | | | fund complex from 1989 to 2006. | | |
3 Mr. Davis is an “interested person,” as defined in the 1940 Act, of the Funds/Master LLC based on his positions with BlackRock, Inc. and its affiliates. Mr.
Gabbay is an “interested person” of the Funds/Master LLC based on his former positions with BlackRock, Inc. and its affiliates as well as his ownership of
BlackRock, Inc. and The PNC Financial Services Group, Inc. securities. Directors serve until their resignation, removal or death, or until December 31 of the
year in which they turn 72. The Board has approved one-year extensions in terms of Directors who turn 72 prior to December 31, 2013.
50 ANNUAL REPORT
OCTOBER 31, 2010
| | | | | | |
| Officers and Directors (concluded) | | | |
| | Position(s) | | | | | |
| | Held with | | | | | |
| Name, Address | Funds/ | Length of | | | | |
| and Year of Birth | Master LLC | Time Served | Principal Occupation(s) During Past 5 Years | | |
| Officers1 | | | | | | |
| John M. Perlowski | President | Since | Managing Director of BlackRock, Inc. since 2009; Global Head of BlackRock Fund Administration since 2009; |
| 55 East 52nd Street | and Chief | 2010 | Managing Director and Chief Operating Officer of the Global Product Group at Goldman Sachs Asset Management, |
| New York, NY 10055 | Executive | | L.P. from 2003 to 2009; Treasurer of Goldman Sachs Mutual Funds from 2003 to 2009 and Senior Vice President |
| 1964 | Officer | | thereof from 2007 to 2009; Director of Goldman Sachs Offshore Funds from 2002 to 2009. |
| Jeffrey Holland, CFA | Vice | Since | Managing Director of BlackRock, Inc. since 2010; Director of BlackRock, Inc. from 2006 to 2009; Chief Operating Officer |
| 55 East 52nd Street | President | 2009 | of BlackRock’s US Retail Group since 2009; Co-head of Product Development and Management for BlackRock’s US Retail |
| New York, NY 10055 | | | Group from 2007 to 2009; Product Manager of Raymond James & Associates from 2003 to 2006. |
| 1971 | | | | | | |
| Brendan Kyne | Vice | Since | Managing Director of BlackRock, Inc. since 2010; Director of BlackRock, Inc. from 2008 to 2009; Head of Product |
| 55 East 52nd Street | President | 2009 | Development and Management for BlackRock’s US Retail Group since 2009, co-head thereof from 2007 to 2009; Vice |
| New York, NY 10055 | | | President of BlackRock, Inc. from 2005 to 2008; Associate of BlackRock, Inc. from 2002 to 2004. |
| 1977 | | | | | | |
| Brian Schmidt | Vice | Since | Managing Director of BlackRock, Inc. since 2004; Various positions with US Trust Company from 1991 to 2003 including |
| 55 East 52nd Street | President | 2009 | Director from 2001 to 2003 and Senior Vice President from 1998 to 2003; Vice President, Chief Financial Officer and |
| New York, NY 10055 | | | Treasurer of Excelsior Funds, Inc., Excelsior Tax-Exempt Funds, Inc. and Excelsior Funds Trust from 2001 to 2003. |
| 1958 | | | | | | |
| Neal Andrews | Chief | Since | Managing Director of BlackRock, Inc. since 2006; Senior Vice President and Line of Business Head of Fund Accounting |
| 55 East 52nd Street | Financial | 2007 | and Administration at PNC Global Investment Servicing (US) Inc. from 1992 to 2006. | |
| New York, NY 10055 | Officer | | | | | |
| 1966 | | | | | | |
| Jay Fife | Treasurer | Since | Managing Director of BlackRock, Inc. since 2007; Director of BlackRock, Inc. in 2006; Assistant Treasurer of the Merrill |
| 55 East 52nd Street | | 2007 | Lynch Investment Managers, L.P. (“MLIM”) and Fund Asset Management, L.P. advised funds from 2005 to 2006; Director |
| New York, NY 10055 | | | of MLIM Fund Services Group from 2001 to 2006. | |
| 1970 | | | | | | |
| Brian Kindelan | Chief | Since | Chief Compliance Officer of the BlackRock-advised funds since 2007; Managing Director and Senior Counsel of |
| 55 East 52nd Street | Compliance | 2007 | BlackRock, Inc. since 2005. | | |
| New York, NY 10055 | Officer | | | | | |
| 1959 | | | | | | |
| Howard Surloff | Secretary | Since | Managing Director and General Counsel of U.S. Funds at BlackRock, Inc. since 2006; General Counsel (U.S.) of Goldman |
| 55 East 52nd Street | | 2007 | Sachs Asset Management, L.P. from 1993 to 2006. | |
| New York, NY 10055 | | | | | | |
| 1965 | | | | | | |
| | 1 Officers of the Funds/Master LLC serve at the pleasure of the Board. | | |
| | Further information about the Corporation’s/Master LLC’s Officers and Directors is available in the Funds’ Statements of Additional Information, |
| | which can be obtained without charge by calling (800) 441-7762. | | |
| Investment Advisor | | Custodian | | Accounting Agent | Distributor | Address of the Funds |
| BlackRock Advisors, LLC | Brown Brothers | | State Street Bank | BlackRock Investments, LLC | 100 Bellevue Parkway |
| Wilmington, DE 19809 | Harriman & Co. | | and Trust Company | New York, NY 10022 | Wilmington, DE 19809 |
| | | Boston, MA 02109 | | Princeton, NJ 08540 | | |
| Sub-Advisors | | | | | Legal Counsel | |
| BlackRock Investment | | | | | Sidley Austin LLP | |
| Management, LLC1 | | Transfer Agent | | Independent | New York, NY 10019 | |
| Plainsboro, NJ 08536 | | BNY Mellon Investment | Registered Public | | |
| | Servicing (US) Inc. | | Accounting Firm | | |
| BlackRock | | Providence, RI 02940 | Deloitte & Touche LLP | | |
| International Limited2 | | | | Princeton, NJ 08540 | | |
| Edinburgh, Scotland | | | | | | |
| United Kingdom EH3 8JB | | | | | |
| 1 For Global Emerging Markets | | | | | |
| Fund and Latin America Fund. | | | | | |
| 2 For all Funds. | | Effective September 24, 2010, John M. Perlowski became | |
| President and Chief Executive Officer of the Funds/Master LLC. |
ANNUAL REPORT
OCTOBER 31, 2010
51
Additional Information
General Information
Electronic Delivery
Electronic copies of most financial reports and prospectuses are available
on the Funds’ website or shareholders can sign up for e-mail notifications of
quarterly statements, annual and semi-annual reports and prospectuses by
enrolling in the Funds’ electronic delivery program.
To enroll:
Shareholders Who Hold Accounts with Investment Advisors, Banks or
Brokerages:
Please contact your financial advisor. Please note that not all investment
advisers, banks or brokerages may offer this service.
Shareholders Who Hold Accounts Directly with BlackRock:
1) Access the BlackRock Web site at
http://www.blackrock.com/edelivery
2) Select “eDelivery” under the “More Information” section
3) Log into your account
Householding
The Funds will mail only one copy of shareholder documents, including
prospectuses, annual and semi-annual reports and proxy statements, to
shareholders with multiple accounts at the same address. This practice is
commonly called “householding” and is intended to reduce expenses and
eliminate duplicate mailings of shareholder documents. Mailings of your
shareholder documents may be householded indefinitely unless you instruct
us otherwise. If you do not want the mailing of these documents to be
combined with those for other members of your household, please
call (800) 441-7762.
Availability of Quarterly Portfolio Schedule of Investments
The Funds/Master LLC file their complete schedule of portfolio holdings
with the Securities and Exchange Commission (the “SEC”) for the first and
third quarters of each fiscal year on Form N-Q. The Funds’/Master LLC’s
Forms N-Q are available on the SEC’s website at http://www.sec.gov and
may also be reviewed and copied at the SEC’s Public Reference Room in
Washington, D.C. Information on the operation of the Public Reference
Room may be obtained by calling (800) SEC-0330. The Funds’/Master
LLC’s Forms N-Q may also be obtained upon request and without charge
by calling (800) 441-7762.
Availability of Proxy Voting Policies and Procedures
A description of the policies and procedures that the Funds/Master LLC
use to determine how to vote proxies relating to portfolio securities is
available (1) without charge, upon request, by calling (800) 441-7762;
(2) at http://www.blackrock.com; and (3) on the SEC’s website
at http://www.sec.gov.
Availability of Proxy Voting Record
Information about how the Funds/Master LLC voted proxies relating to
securities held in the Funds’/Master LLC’s portfolio during the most recent
12-month period ended June 30 is available upon request and without
charge (1) at http://www.blackrock.com or by calling (800) 441-7762
and (2) on the SEC’s website at http://www.sec.gov.
52 ANNUAL REPORT
OCTOBER 31, 2010
Additional Information (concluded)
Shareholder Privileges
Account Information
Call us at (800) 441-7762 from 8:00 AM to 6:00 PM EST on any
business day to get information about your account balances, recent
transactions and share prices. You can also reach us on the Web at
http://www.blackrock.com/funds.
Automatic Investment Plans
Investor Class shareholders who want to invest regularly can arrange to have
$50 or more automatically deducted from their checking or savings account
and invested in any of the BlackRock funds.
Systematic Withdrawal Plans
Investor Class shareholders can establish a systematic withdrawal plan and
receive periodic payments of $50 or more from their BlackRock funds, as
long as their account balance is at least $10,000.
Retirement Plans
Shareholders may make investments in conjunction with Traditional, Rollover,
Roth, Coverdell, Simple IRAs, SEP IRAs and 403(b) Plans.
BlackRock Privacy Principles
BlackRock is committed to maintaining the privacy of its current and
former fund investors and individual clients (collectively, “Clients”) and to
safeguarding their non-public personal information. The following information
is provided to help you understand what personal information BlackRock col-
lects, how we protect that information and why in certain cases we share
such information with select parties.
If you are located in a jurisdiction where specific laws, rules or regulations
require BlackRock to provide you with additional or different privacy-related
rights beyond what is set forth below, then BlackRock will comply with
those specific laws, rules or regulations.
BlackRock obtains or verifies personal non-public information from and
about you from different sources, including the following: (i) information we
receive from you or, if applicable, your financial intermediary, on applica-
tions, forms or other documents; (ii) information about your transactions
with us, our affiliates, or others; (iii) information we receive from a consumer
reporting agency; and (iv) from visits to our websites.
BlackRock does not sell or disclose to non-affiliated third parties any non-
public personal information about its Clients, except as permitted by law
or as is necessary to respond to regulatory requests or to service Client
accounts. These non-affiliated third parties are required to protect the
confidentiality and security of this information and to use it only for its
intended purpose.
We may share information with our affiliates to service your account
or to provide you with information about other BlackRock products or serv-
ices that may be of interest to you. In addition, BlackRock restricts access
to non-public personal information about its Clients to those BlackRock
employees with a legitimate business need for the information. BlackRock
maintains physical, electronic and procedural safeguards that are designed
to protect the non-public personal information of its Clients, including pro-
cedures relating to the proper storage and disposal of such information.
ANNUAL REPORT
OCTOBER 31, 2010
53
| | | | |
| A World-Class Mutual Fund Family | | | |
| BlackRock offers a diverse lineup of open-end mutual funds crossing all investment styles and managed by experts in equity, fixed income and |
| tax-exempt investing. | | | | |
| Equity Funds | | | | |
| BlackRock All-Cap Energy & Resources Portfolio | BlackRock Global SmallCap Fund | BlackRock Natural Resources Trust |
| BlackRock Asset Allocation Portfolio† | BlackRock Health Sciences Opportunities Portfolio | BlackRock Pacific Fund |
| BlackRock Balanced Capital Fund† | BlackRock Healthcare Fund | BlackRock Science & Technology |
| BlackRock Basic Value Fund | BlackRock Index Equity Portfolio* | Opportunities Portfolio |
| BlackRock Capital Appreciation Fund | BlackRock International Fund | BlackRock Small Cap Core Equity Portfolio |
| BlackRock Energy & Resources Portfolio | BlackRock International Index Fund | BlackRock Small Cap Growth Equity Portfolio |
| BlackRock Equity Dividend Fund | BlackRock International Opportunities Portfolio | BlackRock Small Cap Growth Fund II |
| BlackRock EuroFund | BlackRock International Value Fund | BlackRock Small Cap Index Fund |
| BlackRock Focus Growth Fund | BlackRock Large Cap Core Fund | BlackRock Small/Mid-Cap Growth Portfolio |
| BlackRock Focus Value Fund | BlackRock Large Cap Core Plus Fund | BlackRock S&P 500 Index Fund |
| BlackRock Global Allocation Fund† | BlackRock Large Cap Growth Fund | BlackRock S&P 500 Stock Fund |
| BlackRock Global Dynamic Equity Fund | BlackRock Large Cap Value Fund | BlackRock U.S. Opportunities Portfolio |
| BlackRock Global Emerging Markets Fund | BlackRock Latin America Fund | BlackRock Utilities and Telecommunications Fund |
| BlackRock Global Financial Services Fund | BlackRock Mid-Cap Growth Equity Portfolio | BlackRock Value Opportunities Fund |
| BlackRock Global Growth Fund | BlackRock Mid-Cap Value Equity Portfolio | BlackRock World Gold Fund |
| BlackRock Global Opportunities Portfolio | BlackRock Mid Cap Value Opportunities Fund | | |
| Fixed Income Funds | | | | |
| BlackRock Bond Index Fund | BlackRock High Yield Bond Portfolio | BlackRock Managed Income Portfolio |
| BlackRock Bond Portfolio | BlackRock Income Portfolio† | BlackRock Multi-Sector Bond Portfolio |
| BlackRock Emerging Market Debt Portfolio | BlackRock Inflation Protected Bond Portfolio | BlackRock Short-Term Bond Fund |
| BlackRock Floating Rate Income Portfolio | BlackRock Intermediate Government | BlackRock Strategic Income |
| BlackRock GNMA Portfolio | Bond Portfolio | | Opportunities Portfolio |
| BlackRock Global Dividend Income Portfolio† | BlackRock International Bond Portfolio | BlackRock Total Return Fund |
| BlackRock Government Income Portfolio | BlackRock Long Duration Bond Portfolio | BlackRock Total Return Portfolio II |
| BlackRock High Income Fund | BlackRock Low Duration Bond Portfolio | BlackRock World Income Fund |
| Municipal Bond Funds | | | | |
| BlackRock AMT-Free Municipal Bond Portfolio | BlackRock Kentucky Municipal Bond Portfolio | BlackRock New York Municipal Bond Fund |
| BlackRock California Municipal Bond Fund | BlackRock Municipal Insured Fund | BlackRock Ohio Municipal Bond Portfolio |
| BlackRock High Yield Municipal Fund | BlackRock National Municipal Fund | BlackRock Pennsylvania Municipal Bond Fund |
| BlackRock Intermediate Municipal Fund | BlackRock New Jersey Municipal Bond Fund | BlackRock Short-Term Municipal Fund |
| Target Risk & Target Date Funds† | | | | |
| BlackRock Prepared Portfolios | BlackRock Lifecycle Prepared Portfolios | BlackRock LifePath Portfolios |
| Conservative Prepared Portfolio | 2015 | 2035 | Retirement | 2040 |
| Moderate Prepared Portfolio | 2020 | 2040 | 2020 | 2045 |
| Growth Prepared Portfolio | 2025 | 2045 | 2025 | 2050 |
| Aggressive Growth Prepared Portfolio | 2030 | 2050 | 2030 | 2055 |
| | | | 2035 | |
* See the prospectus for information on specific limitations on investments in the fund.
† Mixed asset fund.
BlackRock mutual funds are currently distributed by BlackRock Investments, LLC. You should consider the investment objectives, risks, charges and
expenses of the funds under consideration carefully before investing. Each fund’s prospectus contains this and other information and is available at
www.blackrock.com or by calling (800) 441-7762 or from your financial advisor. The prospectus should be read carefully before investing.
54 ANNUAL REPORT OCTOBER 31, 2010

This report is not authorized for use as an offer of sale or a solicitation of an offer to buy shares of a Fund unless accompanied or
preceded by a Fund’s current prospectus. Past performance results shown in this report should not be considered a representation
of future performance. Investment return and principal value of shares will fluctuate so that shares, when redeemed, may be worth
more or less than their original cost. Statements and other information herein are as dated and are subject to change. Please see
each Fund’s prospectus for a description of risks associated with global investments.

Item 2 – Code of Ethics – The registrant (or the “Fund”) has adopted a code of ethics, as of the end
of the period covered by this report, applicable to the registrant’s principal executive officer,
principal financial officer and principal accounting officer, or persons performing similar
functions. During the period covered by this report, there have been no amendments to or
waivers granted under the code of ethics. A copy of the code of ethics is available without
charge at www.blackrock.com.
Item 3 – Audit Committee Financial Expert – The registrant’s board of directors or trustees, as
applicable (the “board of directors”), has determined that (i) the registrant has the following
audit committee financial expert serving on its audit committee and (ii) each audit
committee financial expert is independent:
Kenneth L. Urish
Under applicable securities laws, a person determined to be an audit committee financial
expert will not be deemed an “expert” for any purpose, including without limitation for the
purposes of Section 11 of the Securities Act of 1933, as a result of being designated or
identified as an audit committee financial expert. The designation or identification as an
audit committee financial expert does not impose on such person any duties, obligations, or
liabilities greater than the duties, obligations, and liabilities imposed on such person as a
member of the audit committee and board of directors in the absence of such designation or
identification.
Item 4 – Principal Accountant Fees and Services
| | | | | | | | |
| | (a) Audit Fees | (b) Audit-Related Fees1 | (c) Tax Fees2 | (d) All Other Fees3 |
| | Current | Previous | Current | Previous | Current | Previous | Current | Previous |
| | Fiscal Year | Fiscal Year | Fiscal Year | Fiscal Year | Fiscal Year | Fiscal Year | Fiscal Year | Fiscal Year |
| Entity Name | End | End | End | End | End | End | End | End |
| BlackRock Latin | $33,700 | $33,700 | $0 | $0 | $7,900 | $6,100 | $84 | $1,028 |
| America Fund, Inc. | | | | | | | | |
1 The nature of the services include assurance and related services reasonably related to the performance of the audit of
financial statements not included in Audit Fees.
2 The nature of the services include tax compliance, tax advice and tax planning.
3 The nature of the services include a review of compliance procedures and attestation thereto.
(e)(1) Audit Committee Pre-Approval Policies and Procedures:
The registrant’s audit committee (the “Committee”) has adopted policies and
procedures with regard to the pre-approval of services. Audit, audit-related and tax
compliance services provided to the registrant on an annual basis require specific pre-
approval by the Committee. The Committee also must approve other non-audit services
provided to the registrant and those non-audit services provided to the registrant’s affiliated
service providers that relate directly to the operations and the financial reporting of the
registrant. Certain of these non-audit services that the Committee believes are a) consistent
with the SEC’s auditor independence rules and b) routine and recurring services that will
not impair the independence of the independent accountants may be approved by the
Committee without consideration on a specific case-by-case basis (“general pre-approval”).
The term of any general pre-approval is 12 months from the date of the pre-approval, unless
the Committee provides for a different period. Tax or other non-audit services provided to
the registrant which have a direct impact on the operation or financial reporting of the
registrant will only be deemed pre-approved provided that any individual project does not
exceed $10,000 attributable to the registrant or $50,000 per project. For this purpose,
multiple projects will be aggregated to determine if they exceed the previously mentioned
cost levels.
Any proposed services exceeding the pre-approved cost levels will require specific
pre-approval by the Committee, as will any other services not subject to general pre-
approval (e.g., unanticipated but permissible services). The Committee is informed of each
service approved subject to general pre-approval at the next regularly scheduled in-person
board meeting. At this meeting, an analysis of such services is presented to the Committee
for ratification. The Committee may delegate to the Committee Chairman the authority to
approve the provision of and fees for any specific engagement of permitted non-audit
services, including services exceeding pre-approved cost levels.
(e)(2) None of the services described in each of Items 4(b) through (d) were approved by
the audit committee pursuant to paragraph (c)(7)(i)(C) of Rule 2-01 of Regulation S-X.
(f) Not Applicable
(g) Affiliates’ Aggregate Non-Audit Fees:
| | |
| | Current Fiscal Year | Previous Fiscal Year |
| Entity Name | End | End |
| BlackRock Latin America Fund, | $18,761 | $409,628 |
| Inc. | | |
(h) The registrant’s audit committee has considered and determined that the provision of
non-audit services that were rendered to the registrant’s investment adviser (not including
any non-affiliated sub-adviser whose role is primarily portfolio management and is
subcontracted with or overseen by the registrant’s investment adviser), and any entity
controlling, controlled by, or under common control with the investment adviser that
provides ongoing services to the registrant that were not pre-approved pursuant to paragraph
(c)(7)(ii) of Rule 2-01 of Regulation S-X is compatible with maintaining the principal
accountant’s independence.
Regulation S-X Rule 2-01(c)(7)(ii) – $10,777, 0%
Item 5 – Audit Committee of Listed Registrants – Not Applicable
Item 6 – Investments
(a) The registrant’s Schedule of Investments is included as part of the Report to
Stockholders filed under Item 1 of this form.
(b) Not Applicable due to no such divestments during the semi-annual period covered since
the previous Form N-CSR filing.
Item 7 – Disclosure of Proxy Voting Policies and Procedures for Closed-End Management
Investment Companies – Not Applicable
Item 8 – Portfolio Managers of Closed-End Management Investment Companies – Not Applicable
Item 9 – Purchases of Equity Securities by Closed-End Management Investment Company and
Affiliated Purchasers – Not Applicable
Item 10 – Submission of Matters to a Vote of Security Holders – The registrant’s Nominating and
Governance Committee will consider nominees to the board of directors recommended by
shareholders when a vacancy becomes available. Shareholders who wish to recommend a
nominee should send nominations which include biographical information and set forth the
qualifications of the proposed nominee to the registrant’s Secretary. There have been no
material changes to these procedures.
Item 11 – Controls and Procedures
11(a) – The registrant’s principal executive and principal financial officers or persons performing
similar functions have concluded that the registrant’s disclosure controls and procedures (as
defined in Rule 30a-3(c) under the Investment Company Act of 1940, as amended (the
“1940 Act”)) are effective as of a date within 90 days of the filing of this report based on the
evaluation of these controls and procedures required by Rule 30a-3(b) under the 1940 Act
and Rule 15d-15(b) under the Securities Exchange Act of 1934, as amended.
11(b) – There were no changes in the registrant’s internal control over financial reporting (as
defined in Rule 30a-3(d) under the 1940 Act) that occurred during the second fiscal quarter
of the period covered by this report that have materially affected, or are reasonably likely to
materially affect, the registrant’s internal control over financial reporting.
Item 12 – Exhibits attached hereto
12(a)(1) – Code of Ethics – See Item 2
12(a)(2) – Certifications – Attached hereto
12(a)(3) – Not Applicable
12(b) – Certifications – Attached hereto
Pursuant to the requirements of the Securities Exchange Act of 1934 and the Investment
Company Act of 1940, the registrant has duly caused this report to be signed on its behalf by
the undersigned, thereunto duly authorized.
BlackRock Latin America Fund, Inc.
By: /s/ John M. Perlowski
John M. Perlowski
Chief Executive Officer of
BlackRock Latin America Fund, Inc.
Date: January 5, 2011
Pursuant to the requirements of the Securities Exchange Act of 1934 and the Investment
Company Act of 1940, this report has been signed below by the following persons on behalf
of the registrant and in the capacities and on the dates indicated.
By: /s/ John M. Perlowski
John M. Perlowski
Chief Executive Officer (principal executive officer) of
BlackRock Latin America Fund, Inc.
Date: January 5, 2011
By: /s/ Neal J. Andrews
Neal J. Andrews
Chief Financial Officer (principal financial officer) of
BlackRock Latin America Fund, Inc.
Date: January 5, 2011