UNITED STATES
SECURITIES AND EXCHANGE COMMISSION
Washington, D.C. 20549
FORM N-CSR
CERTIFIED SHAREHOLDER REPORT OF REGISTERED MANAGEMENT INVESTMENT
COMPANIES
Investment Company Act file number 811-06349
Name of Fund: BlackRock Latin America Fund, Inc.
Fund Address: 100 Bellevue Parkway, Wilmington, DE 19809
Name and address of agent for service: John M. Perlowski, Chief Executive Officer, BlackRock Latin America Fund, Inc.,
55 East 52nd Street, New York, NY 10055
Registrant’s telephone number, including area code: (800) 441-7762
Date of fiscal year end: 10/31/2012
Date of reporting period: 10/31/2012
Item 1 – Report to Stockholders
| | |
 | | October 31, 2012 |
Annual Report
BlackRock Emerging Markets Fund, Inc.
BlackRock Latin America Fund, Inc.
BlackRock International Fund | of BlackRock Series, Inc.
Not FDIC Insured · No Bank Guarantee · May Lose Value
| | | | | | |
| | | | | | | |
| 2 | | ANNUAL REPORT | | OCTOBER 31, 2012 | | |
In the final months of 2011, financial markets were highly volatile but were in a mode of gradual improvement. Global central bank actions and better-than-expected economic data tempered investors’ anxiety after markets had been upended in the previous quarter by sovereign debt turmoil in the United States and Europe. Improving sentiment carried over into early 2012 as investors felt some relief from the world’s financial woes. Volatility was low and risk assets (including stocks, commodities and high yield bonds) moved boldly higher through the first two months of 2012, while climbing Treasury yields pressured higher-quality fixed income assets.
Markets reversed course in the spring when Europe’s debt problems boiled over once again. High levels of volatility returned as political instability threatened Greece’s membership in the eurozone and debt problems in Spain grew increasingly severe. Sovereign debt yields in peripheral European countries continued to rise while finance leaders deliberated over the fiscal integration of the currency bloc. Alongside the drama in Europe, investors were discouraged by gloomy economic reports from various parts of the world. A slowdown in China, a key powerhouse for global growth, emerged as a particular concern. In the United States, disappointing jobs reports dealt a crushing blow to investor sentiment. Risk assets sold off in the second quarter as investors retreated to safe haven assets.
Despite ongoing concerns about the health of the global economy and the debt crisis in Europe, most asset classes enjoyed a robust summer rally powered mainly by expectations for policy stimulus from central banks in Europe and the United States. Global economic data continued to be mixed, but the spate of downside surprises seen in the second quarter had receded and, outside of some areas of Europe, the risk of recession largely subsided. Additionally, in response to mounting debt pressures, the European Central Bank allayed fears by affirming its conviction to preserve the euro bloc. Early in September, the European Central Bank announced its plan to purchase sovereign debt in the eurozone’s most troubled nations. Later that month, the US Federal Reserve announced its long-awaited — and surprisingly aggressive — stimulus program, committing to purchase $40 billion of agency mortgage-backed securities per month until the US economy exhibits enough strength to sustain real growth and the labor market shows solid improvement. These central bank actions boosted investor confidence and risk assets rallied globally.
European stocks continued their advance in the final month of the reporting period as progress toward fiscal integration created a more positive atmosphere for investors. However, as corporate earnings season got underway in the United States, lackluster results pointed to the fragility of global growth and pushed US equity markets down for the month of October. The period ended with increasing concern about how and when US politicians would resolve the nation’s looming fiscal crisis, known as the “fiscal cliff.”
All asset classes performed well for the 12-month period ended October 31, 2012, with the strongest returns coming from US stocks and high yield bonds. For the six-month period ended October 31, 2012, equities underperformed fixed income investments, where high yield was the leading sector. US and international stocks finished the six-month period with modest gains, while emerging market stocks lagged other asset classes amid ongoing uncertainty. Near-zero short term interest rates continued to keep yields on money market securities near their all-time lows.
Although the financial world remains highly uncertain, we believe there are new avenues of opportunity — new ways to invest and new markets to consider. We believe it’s our responsibility to help investors adapt to today’s new world of investing and build the portfolios these times require. We encourage you to visit www.blackrock.com/newworld for more information.
Sincerely,

Rob Kapito
President, BlackRock Advisors, LLC

“Although the financial world remains highly uncertain, we believe there are new avenues of opportunity.”
Rob Kapito
President, BlackRock Advisors, LLC
| | | | | | | | |
| Total Returns as of October 31, 2012 | |
| | | 6-month | | | 12-month | |
US large cap equities
(S&P 500® Index) | | | 2.16 | % | | | 15.21 | % |
US small cap equities
(Russell 2000® Index) | | | 0.95 | | | | 12.08 | |
International equities
(MSCI Europe, Australasia,
Far East Index) | | | 2.12 | | | | 4.61 | |
Emerging market
equities (MSCI Emerging Markets Index) | | | (1.25 | ) | | | 2.63 | |
3-month Treasury
bill (BofA Merrill Lynch
3-Month US Treasury
Bill Index) | | | 0.06 | | | | 0.08 | |
US Treasury securities
(BofA Merrill Lynch 10-
Year US Treasury Index) | | | 3.49 | | | | 7.46 | |
US investment grade
bonds (Barclays US
Aggregate Bond Index) | | | 2.75 | | | | 5.25 | |
Tax-exempt municipal
bonds (S&P Municipal
Bond Index) | | | 3.65 | | | | 9.57 | |
US high yield bonds
(Barclays US Corporate
High Yield 2% Issuer
Capped Index) | | | 6.24 | | | | 13.58 | |
| Past performance is no guarantee of future results. Index performance is shown for illustrative purposes only. You cannot invest directly in an index. | |
| | | | | | |
| | | | | | | |
| | THIS PAGE NOT PART OF YOUR FUND REPORT | | | | 3 |
| | | | |
| Fund Summary as of October 31, 2012 | | BlackRock Emerging Markets Fund, Inc. |
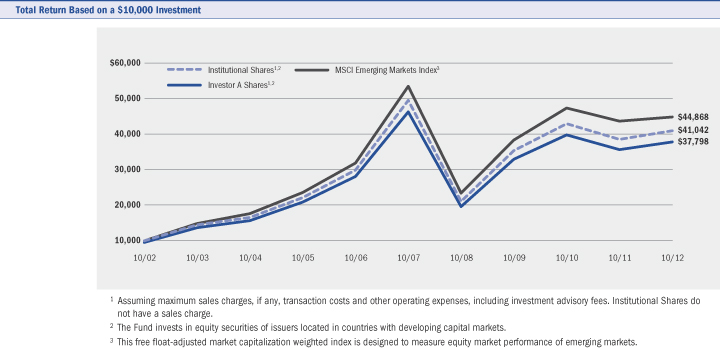
BlackRock Emerging Markets Fund, Inc.’s (the “Fund”) (formerly known as BlackRock Global Emerging Markets Fund, Inc.) investment objective is to seek long-term capital appreciation by investing in securities, principally equity securities, of issuers in countries having smaller capital markets.
| | |
| Portfolio Management Commentary | | |
How did the Fund perform?
| Ÿ | | For the 12-month period ended October 31, 2012, the Fund outperformed its benchmark, the MSCI Emerging Markets Index. |
What factors influenced performance?
| Ÿ | | Stock selection was the primary contributor to the Fund’s outperformance during the period. Among the larger individual contributors to performance was the Fund’s decision not to hold Brazilian oil producer Petroleo Brasileiro SA, which declined during the period. The Fund avoided Petroleo Brasileiro SA due to concerns about the rate of return to shareholders on its large capital expenditure (capex) program. Another notable contributor to performance was the Fund’s position in Panamanian airline operator Copa Holdings SA, which has a geographical advantage with its hub in Panama. Near the end of the reporting period, the company announced a 27% year-on-year increase in passenger traffic. |
| Ÿ | | The largest detractors from performance relative to the benchmark index were the Fund’s holdings in two Brazilian stocks. Oil & gas exploration & production company OGX Petroleo e Gas Participacoes SA disappointed investors with lower-than-expected flow rates from its drilling projects. The Fund also held CETIP SA-Mercados Organizados, an over-the-counter securities exchange for corporate fixed income, interbank notes and other derivatives instruments. Shares of CETIP SA-Mercados Organizados were down midway through the reporting period due to concerns about a slowdown in credit growth which could potentially impact profits for the company. |
Describe recent portfolio activity.
| Ÿ | | During the 12-month period, significant transactions in the Fund included the purchase of Indian generic and over-the-counter pharmaceutical |
manufacturer Dr. Reddy’s Laboratories Ltd. Fund management believes Dr. Reddy’s Laboratories Ltd. is well-positioned to benefit from new product approvals and growth in sales from its recently launched drugs. The Fund also purchased BM&F BOVESPA SA (Brazil), which combines the activities of the Brazilian stock exchange BOVESPA and futures and commodities exchange BM&F. The company has an integrated business model including clearing and settlement, financial products and trading and depository activities. Fund management believes BM&F BOVESPA SA is poised to benefit from a structural decline in interest rates and a strong pipeline of initial public offerings. The Fund reduced its holdings of CNOOC Ltd. after the company announced its agreement to acquire Canadian oil and gas producer Nexen, Inc. The Fund sold its position in CETIP SA-Mercados Organizados as Fund management viewed BM&F BOVESPA SA as being better placed in the current environment with a stronger competitive position.
|
Describe portfolio positioning at period end.
| Ÿ | | At the end of the period, the Fund was overweight relative to the MSCI Emerging Markets Index in materials stocks given their sensitivity to slowing commodity demand in China. The Fund was overweight in select information technology (“IT”) companies with strong competitive positions. From a geographic perspective, the Fund was overweight in Brazil, which benefits from monetary easing and increased infrastructure expenditure, and Thailand, where there are attractively priced opportunities in the banking sector. The Fund was underweight in Taiwan, where external demand remains a concern, and in South Africa. The Fund remained overweight in Russian equities, which appear cheap relative to their historical prices. |
The views expressed reflect the opinions of BlackRock as of the date of this report and are subject to change based on changes in market, economic or other conditions. These views are not intended to be a forecast of future events and are no guarantee of future results.
| | | | |
| Ten Largest Holdings | | Percent of
Long-Term
Investments | |
Samsung Electronics Co. Ltd. | | | 5 | % |
Taiwan Semiconductor Manufacturing Co. Ltd. — ADR | | | 3 | |
Sberbank — ADR | | | 2 | |
China Mobile Ltd. | | | 2 | |
Itau Unibanco Holdings SA — ADR | | | 2 | |
HON HAI Precision Industry Co. Ltd. | | | 2 | |
Yes Bank Ltd. | | | 2 | |
Copa Holdings SA, Class A | | | 2 | |
Kia Motors Corp. | | | 2 | |
Cia de Concessoes Rodoviarias | | | 2 | |
| | | | |
| Geographic Allocation | | Percent of
Long-Term
Investments | |
Brazil | | | 15 | % |
China | | | 12 | |
South Korea | | | 11 | |
Russia | | | 7 | |
India | | | 7 | |
Taiwan | | | 7 | |
Mexico | | | 7 | |
Hong Kong | | | 6 | |
Thailand | | | 5 | |
Indonesia | | | 4 | |
South Africa | | | 3 | |
Turkey | | | 3 | |
United States | | | 2 | |
Panama | | | 2 | |
Other1 | | | 9 | |
| | 1 | | Other includes a 1% holding or less in each of the following countries: Kazakhstan, Malaysia, Peru, Hungary, Italy, Argentina, Ireland, Chile and Colombia. |
| | | | | | |
| | | | | | | |
| 4 | | ANNUAL REPORT | | OCTOBER 31, 2012 | | |
| | |
| | | BlackRock Emerging Markets Fund, Inc. |
|
| Performance Summary for the Period Ended October 31, 2012 |
| | | | | | | | | | | | | | | | | | | | | | | | | | | | |
| | | | | | Average Annual Total Returns4 | |
| | | | | | 1 Year | | | 5 Years | | | 10 Years | |
| | | 6-Month
Total Returns | | | w/o sales
charge | | | w/sales
charge | | | w/o sales
charge | | | w/sales
charge | | | w/o sales
charge | | | w/sales
charge | |
Institutional | | | (2.08 | )% | | | 6.37 | % | | | N/A | | | | (3.71 | )% | | | N/A | | | | 15.17 | % | | | N/A | |
Investor A | | | (2.21 | ) | | | 6.02 | | | | 0.45 | % | | | (4.00 | ) | | | (5.03 | )% | | | 14.84 | | | | 14.22 | % |
Investor B | | | (2.77 | ) | | | 4.96 | | | | 0.46 | | | | (4.85 | ) | | | (5.14 | ) | | | 14.09 | | | | 14.09 | |
Investor C | | | (2.73 | ) | | | 5.07 | | | | 4.07 | | | | (4.81 | ) | | | (4.81 | ) | | | 13.91 | | | | 13.91 | |
MSCI Emerging Markets Index | | | (1.25 | ) | | | 2.63 | | | | N/A | | | | (3.47 | ) | | | N/A | | | | 16.20 | | | | N/A | |
| | 4 | | Assuming maximum sales charges, if any. Average annual total returns with and without sales charges reflect reductions for distribution and service fees. See “About Fund Performance” on page 10 for a detailed description of share classes, including any related sales charges and fees. |
| | | | N/A — Not applicable as share class and index do not have a sales charge. |
| | | | Past performance is not indicative of future results. |
| | | | | | | | | | | | | | | | | | | | | | | | | | | | |
| | | Actual | | | Hypothetical6 | | | | |
| | | Beginning
Account Value
May 1, 2012 | | | Ending
Account Value
October 31, 2012 | | | Expenses Paid
During the Period5 | | | Beginning
Account Value
May 1, 2012 | | | Ending
Account Value
October 31, 2012 | | | Expenses Paid
During the Period5 | | | Annualized
Expense Ratio | |
Institutional | | $ | 1,000.00 | | | $ | 979.20 | | | $ | 7.11 | | | $ | 1,000.00 | | | $ | 1,017.92 | | | $ | 7.25 | | | | 1.43 | % |
Investor A | | $ | 1,000.00 | | | $ | 977.90 | | | $ | 8.80 | | | $ | 1,000.00 | | | $ | 1,016.24 | | | $ | 8.97 | | | | 1.77 | % |
Investor B | | $ | 1,000.00 | | | $ | 972.30 | | | $ | 14.23 | | | $ | 1,000.00 | | | $ | 1,010.72 | | | $ | 14.51 | | | | 2.87 | % |
Investor C | | $ | 1,000.00 | | | $ | 972.70 | | | $ | 13.49 | | | $ | 1,000.00 | | | $ | 1,011.44 | | | $ | 13.75 | | | | 2.72 | % |
| | 5 | | For each class of the Fund, expenses are equal to the annualized expense ratio for the class, multiplied by the average account value over the period, multiplied by 184/366 (to reflect the one-half year period shown). |
| | 6 | | Hypothetical 5% annual return before expenses is calculated by pro rating the number of days in the most recent fiscal half year divided by 366. |
| | | | See “Disclosure of Expenses” on page 10 for further information on how expenses were calculated. |
| | | | | | |
| | | | | | | |
| | ANNUAL REPORT | | OCTOBER 31, 2012 | | 5 |
| | | | |
| Fund Summary as of October 31, 2012 | | BlackRock Latin America Fund, Inc. |
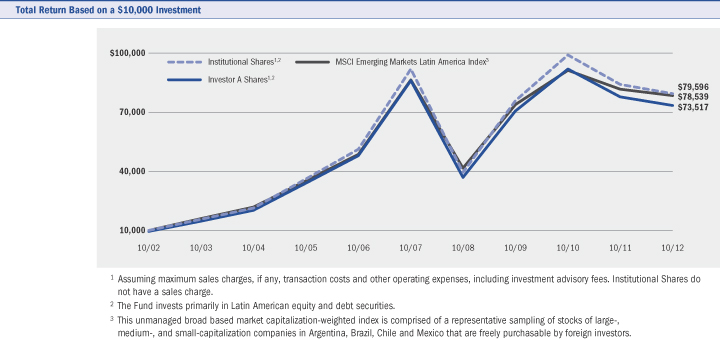
BlackRock Latin America Fund Inc.’s (the “Fund”) investment objective is to seek long-term capital appreciation by investing primarily in Latin American equity and debt securities.
| | |
| Portfolio Management Commentary | | |
How did the Fund perform?
| Ÿ | | For the 12-month period ended October 31, 2012, the Fund underperformed its benchmark, the MSCI Emerging Markets Latin America Index. |
What factors influenced performance?
| Ÿ | | Detracting from performance during the period was the Fund’s underweight relative to the benchmark index in Colombia. Stock selection and an underweight in Mexico also had a negative impact on returns. At the individual security level, an underweight position in Mexican cement name CEMEX hurt relative returns, as did the absence of Colombian stock Ecopetrol SA among the Fund’s holdings. Overweight positions in Brazilian homebuilder PDG Realty SA Empreendimentos e Participacoes and Brazilian bank Itau Unibanco Holdings SA also detracted. |
| Ÿ | | Positive contributors to performance included stock selection in Brazil and an overweight position in Panama via Copa Holdings SA. Notable individual performers during the period included Mexican beverage name Fomento Economico Mexicano SAB de CV, Brazilian toll road operator Cia de Concessoes Rodoviarias and underweights in Brazilian oil & gas stock Petróleo Brasileiro SA and Brazilian steel name Usinas Siderúrgicas de Minas Gerais. |
Describe recent portfolio activity.
| Ÿ | | During the 12-month period ended October 31, 2012, the Fund reduced absolute exposure to Brazil, although it increased relative exposure to the country. Within Brazil, the Fund increased exposure to consumer-related stocks, especially retailing, and reduced exposure to banks. The Fund |
reduced energy exposure via exploration & production names in Brazil, exiting OGX Petroleo e Gas Participaçoes SA after it delivered disappointing production figures in early 2012. The Fund also reduced exposure to Brazilian homebuilders during the period. Although they have grown very quickly during the last three years, they have been struggling to reach economies of scale (i.e., the cost advantages that an enterprise obtains due to expansion).
|
| Ÿ | | In Mexico, the Fund increased exposure to consumer-related stocks as well as industrial names that stand to benefit from the potential energy reform. |
Describe portfolio positioning at period end.
| Ÿ | | As of period end, Brazil remains the top overweight country in the Fund. The Brazilian equity market is struggling to digest the positives of the economic recovery underway as a result of the historic easing cycle that brought Brazil’s nominal interest rates down to 7.25% and all of the different stimuli implemented by the Brazilian government. Fund management acknowledges the risks of further government intervention in the private sector and continues to favor stocks positioned to benefit from the domestic recovery, headlined by retailers and banks. The allocation to Mexico stands at the highest level the Fund has had in the country in years. Valuations continue to approximate fair value, but expectations for economic growth and success in the reform agenda for the incoming Pena Nieto administration should be supportive for Mexican equities. The Fund continues to be underweight in countries in the Andean region given lower liquidity and rich valuations. |
The views expressed reflect the opinions of BlackRock as of the date of this report and are subject to change based on changes in market, economic or other conditions. These views are not intended to be a forecast of future events and are no guarantee of future results.
| | | | |
| Ten Largest Holdings | | Percent of
Long-Term
Investments | |
America Movil, SAB de CV Series L — ADR | | | 8 | % |
Petroleo Brasileiro SA — ADR | | | 8 | |
Vale SA, Preference ‘A’ Shares — ADR | | | 7 | |
Banco Bradesco SA — ADR | | | 6 | |
Itau Unibanco Holdings SA — ADR | | | 5 | |
Fomento Economico Mexicano SAB de CV — ADR | | | 4 | |
Cia de Concessoes Rodoviarias | | | 4 | |
Cia de Bebidas das Americas, Preference Shares — ADR | | | 4 | |
Grupo Televisa SA — ADR | | | 4 | |
BM&F Bovespa SA | | | 3 | |
| | | | |
| Geographic Allocation | | Percent of
Long-Term
Investments | |
Brazil | | | 65 | % |
Mexico | | | 24 | |
Chile | | | 5 | |
Panama | | | 2 | |
Peru | | | 2 | |
Argentina | | | 1 | |
Colombia | | | 1 | |
| | | | | | |
| | | | | | | |
| 6 | | ANNUAL REPORT | | OCTOBER 31, 2012 | | |
| | |
| | | BlackRock Latin America Fund, Inc. |
|
| Performance Summary for the Period Ended October 31, 2012 |
| | | | | | | | | | | | | | | | | | | | | | | | | | | | |
| | | | | | Average Annual Total Returns4 | |
| | | | | | 1 Year | | | 5 Years | | | 10 Years | |
| | | 6-Month
Total Returns | | | w/o sales
charge | | | w/sales
charge | | | w/o sales
charge | | | w/sales
charge | | | w/o sales
charge | | | w/sales
charge | |
Institutional | | | (5.33 | )% | | | (5.43 | )% | | | N/A | | | | (2.87 | )% | | | N/A | | | | 23.05 | % | | | N/A | |
Investor A | | | (5.41 | ) | | | (5.60 | ) | | | (10.56 | )% | | | (3.13 | ) | | | (4.17 | )% | | | 22.74 | | | | 22.08 | % |
Investor B | | | (5.86 | ) | | | (6.45 | ) | | | (10.66 | ) | | | (3.99 | ) | | | (4.30 | ) | | | 21.93 | | | | 21.93 | |
Investor C | | | (5.82 | ) | | | (6.38 | ) | | | (7.32 | ) | | | (3.92 | ) | | | (3.92 | ) | | | 21.77 | | | | 21.77 | |
MSCI Emerging Markets Latin America Index | | | (5.92 | ) | | | (3.98 | ) | | | N/A | | | | (1.92 | ) | | | N/A | | | | 22.89 | | | | N/A | |
| | 4 | | Assuming maximum sales charges, if any. Average annual total returns with and without sales charges reflect reductions for distribution and service fees. See “About Fund Performance” on page 10 for a detailed description of share classes, including any related sales charges and fees. |
| | N/A | | — Not applicable as share class and index do not have a sales charge. |
| | Past | | performance is not indicative of future results. |
| | | | | | | | | | | | | | | | | | | | | | | | | | | | |
| | | Actual | | | Hypothetical6 | | | | |
| | | Beginning
Account Value
May 1, 2012 | | | Ending
Account Value
October 31, 2012 | | | Expenses Paid
During the Period5 | | | Beginning
Account Value
May 1, 2012 | | | Ending
Account Value
October 31, 2012 | | | Expenses Paid
During the Period5 | | | Annualized
Expense Ratio | |
Institutional | | $ | 1,000.00 | | | $ | 946.70 | | | $ | 6.65 | | | $ | 1,000.00 | | | $ | 1,018.28 | | | $ | 6.90 | | | | 1.36 | % |
Investor A | | $ | 1,000.00 | | | $ | 945.90 | | | $ | 7.58 | | | $ | 1,000.00 | | | $ | 1,017.36 | | | $ | 7.86 | | | | 1.55 | % |
Investor B | | $ | 1,000.00 | | | $ | 941.40 | | | $ | 12.10 | | | $ | 1,000.00 | | | $ | 1,012.65 | | | $ | 12.55 | | | | 2.48 | % |
Investor C | | $ | 1,000.00 | | | $ | 941.80 | | | $ | 11.67 | | | $ | 1,000.00 | | | $ | 1,013.14 | | | $ | 12.09 | | | | 2.39 | % |
| | 5 | | For each class of the Fund, expenses are equal to the expense ratio for the class, multiplied by the average account value over the period, multiplied by 184/366 (to reflect the one-half year period shown). |
| | 6 | | Hypothetical 5% annual return before expenses is calculated by pro rating the number of days in the most recent fiscal half year divided by 366. |
| | | | See “Disclosure of Expenses” on page 10 for further information on how expenses were calculated. |
| | | | | | |
| | | | | | | |
| | ANNUAL REPORT | | OCTOBER 31, 2012 | | 7 |
| | |
| Fund Summary as of October 31, 2012 | | BlackRock International Fund of BlackRock Series, Inc. |
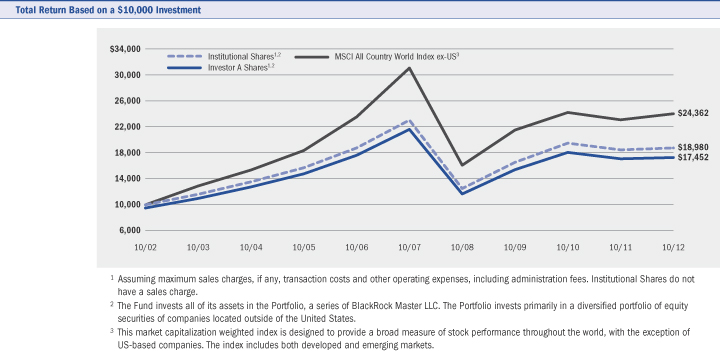
BlackRock International Fund’s (the “Fund”) investment objective is to seek long-term capital growth through investments primarily in a diversified portfolio of equity securities of companies located outside the United States.
| | |
| Portfolio Management Commentary | | |
How did the Fund perform?
| Ÿ | | For the 12-month period ended October 31, 2012, through its investment in BlackRock Master International Portfolio (the “Portfolio”) the Fund underperformed its benchmark, the MSCI All Country World Index ex-US. |
What factors influenced performance?
| Ÿ | | The Portfolio’s underweight position relative to the benchmark in the strong-performing IT sector detracted from performance during the 12-month period. Within the sector, stock selection had the largest impact, with names like Activision Blizzard, Inc., Universal Display Corp. and Infineon Technologies AG posting negative returns. The Portfolio’s underweight in industrials also hampered relative performance, as did its investment in Zoomlion Heavy Industry Science and Technology Co. Ltd. |
| Ÿ | | Conversely, the Portfolio’s overweight exposure to consumer staples had a positive impact on performance. In particular, Anheuser-Busch InBev NV was a top performer. In health care, a position in Sanofi SA aided returns. |
Describe recent portfolio activity.
| Ÿ | | During the 12-month period ended October 31, 2012, the Portfolio reduced its positioning in Europe and has increasingly strived to get |
exposure to emerging markets directly through companies located in those regions. The Portfolio’s cash position fluctuated over the course of the 12-month period, but was particularly elevated in August and September of 2012 as the Portfolio was more defensively positioned. This allocation had a negative impact on relative performance as equity markets rallied during that timeframe.
|
Describe portfolio positioning at period end.
| Ÿ | | As of period end, the Portfolio continued to focus on generating alpha (i.e., outperformance) through stock selection. The Portfolio sought attractive risk-adjusted opportunities, which have recently occurred mostly in telecommunications and health care, which remained the Portfolio’s largest sector overweights. The Portfolio continued to avoid the more cyclical sectors such as energy and financials. The Portfolio’s overall positioning reflects management’s belief that the global economy continued to be in a period of deleveraging, resulting in a slower-growth environment that may favor more defensive companies at the expense of cyclical ones, which are more correlated to global economic growth. |
The views expressed reflect the opinions of BlackRock as of the date of this report and are subject to change based on changes in market, economic or other conditions. These views are not intended to be a forecast of future events and are no guarantee of future results.
| | | | | | |
| | | | | | | |
| 8 | | ANNUAL REPORT | | OCTOBER 31, 2012 | | |
| | |
| | | BlackRock International Fund of BlackRock Series, Inc. |
| | |
| Performance Summary for the Period Ended October 31, 2012 | | |
| | | | | | | | | | | | | | | | | | | | | | | | | | | | |
| | | | | | Average Annual Total Returns4 | |
| | | | | | 1 Year | | | 5 Years | | | 10 Years | |
| | | 6-Month
Total Returns | | | w/o sales
charge | | | w/sales
charge | | | w/o sales
charge | | | w/sales
charge | | | w/o sales
charge | | | w/sales
charge | |
Institutional | | | (1.76 | )% | | | 1.63 | % | | | N/A | | | | (4.10 | )% | | | N/A | | | | 6.62 | % | | | N/A | |
Investor A | | | (2.04 | ) | | | 1.21 | | | | (4.10 | )% | | | (4.44 | ) | | | (5.46 | )% | | | 6.30 | | | | 5.73 | % |
Investor B | | | (2.56 | ) | | | 0.09 | | | | (4.41 | ) | | | (5.52 | ) | | | (5.90 | ) | | | 5.50 | | | | 5.50 | |
Investor C | | | (2.52 | ) | | | 0.23 | | | | (0.77 | ) | | | (5.18 | ) | | | (5.18 | ) | | | 5.47 | | | | 5.47 | |
Class R | | | (2.20 | ) | | | 0.90 | | | | N/A | | | | (4.64 | ) | | | N/A | | | | 6.06 | | | | N/A | |
MSCI All Country World Index ex-US | | | 1.21 | | | | 3.98 | | | | N/A | | | | (5.08 | ) | | | N/A | | | | 9.31 | | | | N/A | |
| | 4 | | Assuming maximum sales charges, if any. Average annual total returns with and without sales charges reflect reductions for distribution and service fees. See “About Fund Performance” on page 10 for a detailed description of share classes, including any related sales charges and fees. |
| | | | N/A — Not applicable as share class and index do not have a sales charge. |
| | | | Past performance is not indicative of future results. |
| | | | | | | | | | | | | | | | | | | | | | | | | | | | |
| | | Actual | | | Hypothetical6 | | | | |
| | | Beginning
Account Value
May 1, 2012 | | | Ending
Account Value
October 31, 2012 | | | Expenses Paid
During the Period5 | | | Beginning
Account Value
May 1, 2012 | | | Ending
Account Value
October 31, 2012 | | | Expenses Paid
During the Period5 | | | Annualized
Expense Ratio | |
Institutional | | $ | 1,000.00 | | | $ | 982.40 | | | $ | 5.03 | | | $ | 1,000.00 | | | $ | 1,020.04 | | | $ | 5.13 | | | | 1.00 | % |
Investor A | | $ | 1,000.00 | | | $ | 979.60 | | | $ | 6.92 | | | $ | 1,000.00 | | | $ | 1,018.15 | | | $ | 7.05 | | | | 1.38 | % |
Investor B | | $ | 1,000.00 | | | $ | 974.40 | | | $ | 12.21 | | | $ | 1,000.00 | | | $ | 1,012.78 | | | $ | 12.45 | | | | 2.44 | % |
Investor C | | $ | 1,000.00 | | | $ | 974.80 | | | $ | 12.06 | | | $ | 1,000.00 | | | $ | 1,012.91 | | | $ | 12.30 | | | | 2.42 | % |
Class R | | $ | 1,000.00 | | | $ | 978.00 | | | $ | 8.50 | | | $ | 1,000.00 | | | $ | 1,016.52 | | | $ | 8.67 | | | | 1.70 | % |
| | 5 | | For each class of the Fund, expenses are equal to the annualized expense ratio for the class, multiplied by the average account value over the period, multiplied by 184/366 (to reflect the one-half year period shown). Because the Fund is a feeder fund, the expense example reflects the expenses of both the Fund and master fund in which it invests. |
| | 6 | | Hypothetical 5% annual return before expenses is calculated by pro rating the number of days in the most recent fiscal half year divided by 366. |
| | | | See “Disclosure of Expenses” on page 10 for further information on how expenses were calculated. |
| | | | | | |
| | | | | | | |
| | ANNUAL REPORT | | OCTOBER 31, 2012 | | 9 |
| Ÿ | | Institutional Shares are not subject to any sales charge. These shares bear no ongoing distribution or service fees and are available only to eligible investors. |
| Ÿ | | Investor A Shares are subject to a maximum initial sales charge (front-end load) of 5.25% and a service fee of 0.25% per year (but no distribution fee). |
| Ÿ | | Investor B Shares are subject to a maximum contingent deferred sales charge (“CDSC”) of 4.50% declining to 0% after six years. In addition, these shares are subject to a distribution fee of 0.75% per year and a service fee of 0.25% per year. These shares automatically convert to Investor A Shares after approximately eight years. (There is no initial sales charge for automatic share conversions.) All returns for periods greater than eight years reflect this conversion. These shares are only available through exchanges, dividend reinvestment by existing shareholders or for purchase by certain qualified employee benefit plans. |
| Ÿ | | Investor C Shares are subject to a distribution fee of 0.75% and a service fee of 0.25%. In addition, these shares are subject to a 1.00% CDSC if redeemed within one year of purchase. |
| Ÿ | | Class R Shares are not subject to any sales charge. These shares are subject to a distribution fee of 0.25% per year and a service fee of 0.25% per year. These shares are available only to certain retirement plans. Prior to August 15, 2011, BlackRock International Fund’s Class R Shares’ performance results are those of Institutional Shares (which have no distribution or service fees) restated to reflect Class R Share fees. |
Performance information reflects past performance and does not guarantee future results. Current performance may be lower or higher than the performance data quoted. Refer to www.blackrock.com/funds to obtain performance data current to the most recent month end. Performance results do not reflect the deduction of taxes that a shareholder would pay on fund distributions or the redemption of fund shares. Figures shown in the performance tables on pages 5, 7 and 9 assume reinvestment of all dividends and capital gain distributions, if any, at net asset value (“NAV”) on the ex-dividend date. Investment return and principal value of shares will fluctuate so that shares, when redeemed, may be worth more or less than their original cost. Dividends paid to each class of shares will vary because of the different levels of service, distribution and transfer agency fees applicable to each class, which are deducted from the income available to be paid to shareholders. In certain periods, the Funds’ Manager waived a portion of its fees. Without such waiver, the Funds’ performance would have been lower.
Shareholders of these Funds may incur the following charges: (a) expenses related to transactions, including sales charges and exchange fees; and (b) operating expenses, including advisory fees, service and distribution fees, including 12b-1 fees and other Fund expenses. The expense examples on the previous pages (which are based on a hypothetical investment of $1,000 invested on May 1, 2012 and held through October 31, 2012) are intended to assist shareholders both in calculating expenses based on an investment in the Funds and in comparing these expenses with similar costs of investing in other mutual funds.
The expense examples provide information about actual account values and actual expenses. In order to estimate the expenses a shareholder paid during the period covered by this report, shareholders can divide their account value by $1,000 and then multiply the result by the number corresponding to their share class under the heading entitled “Expenses Paid During the Period.”
The expense examples also provide information about hypothetical account values and hypothetical expenses based on a Fund’s actual expense ratio and an assumed rate of return of 5% per year before expenses. In order to assist shareholders in comparing the ongoing expenses of investing in these Funds and other funds, compare the 5% hypothetical examples with the 5% hypothetical examples that appear in other funds’ shareholder reports.
The expenses shown in the expense examples are intended to highlight shareholders’ ongoing costs only and do not reflect any transactional expenses, such as sales charges or exchange fees, if any. Therefore, the hypothetical examples are useful in comparing ongoing expenses only, and will not help shareholders determine the relative total expenses of owning different funds. If these transactional expenses were included, shareholder expenses would have been higher.
| | |
| Derivative Financial Instruments | | |
The Funds and Portfolio may invest in various derivative financial instruments, including foreign currency exchange contracts and options, as specified in Note 2 of the Notes to Financial Statements, which may constitute forms of economic leverage. Such derivative financial instruments are used to obtain exposure to a market without owning or taking physical custody of securities or to hedge market, equity and/or foreign currency exchange rate risks. Derivative financial instruments involve risks, including the imperfect correlation between the value of a derivative financial instrument and the underlying asset, possible default of the counterparty to the transaction or illiquidity of the derivative financial instrument. The Funds’ and Portfolio’s ability to use a derivative financial instrument successfully
depends on the investment advisor’s ability to predict pertinent market movements accurately, which cannot be assured. The use of derivative financial instruments may result in losses greater than if they had not been used, may require the Funds and Portfolio to sell or purchase portfolio investments at inopportune times or for distressed values, may limit the amount of appreciation the Funds and Portfolio can realize on an investment, may result in lower dividends paid to shareholders or may cause the Funds and Portfolio to hold an investment that they might otherwise sell. The Funds’ and Portfolio’s investments in these instruments are discussed in detail in the Notes to Financial Statements.
| | | | | | |
| | | | | | | |
| 10 | | ANNUAL REPORT | | OCTOBER 31, 2012 | | |
| | |
Schedule of Investments October 31, 2012 | | BlackRock Emerging Markets Fund, Inc. (Percentages shown are based on Net Assets) |
| | | | | | | | |
| Common Stocks | | Shares | | | Value | |
| | | | | | | | |
Argentina — 1.0% | |
Tenaris SA — ADR | | | 109,500 | | | $ | 4,119,390 | |
Brazil — 14.3% | | | | | |
Banco do Brasil SA | | | 371,371 | | | | 3,962,290 | |
BM&FBOVESPA SA | | | 826,283 | | | | 5,288,732 | |
BR Malls Participacoes SA | | | 240,053 | | | | 3,155,715 | |
BRF — Brasil Foods SA | | | 237,232 | | | | 4,315,858 | |
Cia de Concessoes Rodoviarias | | | 739,842 | | | | 6,505,787 | |
Embraer SA | | | 471,584 | | | | 3,297,060 | |
Gerdau SA, Preference Shares | | | 499,837 | | | | 4,368,237 | |
Itau Unibanco Holdings SA — ADR | | | 539,318 | | | | 7,863,256 | |
Localiza Rent a Car SA | | | 257,925 | | | | 4,520,878 | |
Mills Estruturas e Servicos de Engenharia SA | | | 202,699 | | | | 3,107,775 | |
Natura Cosmeticos SA | | | 159,057 | | | | 4,240,632 | |
Tim Participacoes SA — ADR | | | 176,090 | | | | 3,060,444 | |
Vale SA | | | 165,446 | | | | 3,050,616 | |
| | | | | | | | |
| | | | | | | | 56,737,280 | |
Chile — 0.9% | | | | | | | | |
Empresa Nacional de Telecomunicaciones SA | | | 178,257 | | | | 3,647,201 | |
China — 11.7% | |
Anhui Conch Cement Co. Ltd. | | | 951,000 | | | | 3,266,459 | |
Baidu.com, Inc. — ADR (a) | | | 17,556 | | | | 1,871,821 | |
Bank of China Ltd. | | | 13,703,200 | | | | 5,613,958 | |
China Mobile Ltd. | | | 711,166 | | | | 7,888,066 | |
China Shenhua Energy Co. Ltd., Class H | | | 1,185,454 | | | | 5,023,003 | |
CNOOC Ltd. | | | 2,619,000 | | | | 5,389,839 | |
CNOOC Ltd. — ADR | | | 19,158 | | | | 3,937,927 | |
Hengan International Group Co. Ltd. | | | 182,000 | | | | 1,652,551 | |
Jiangxi Copper Co. Ltd., Class H | | | 1,739,455 | | | | 4,469,257 | |
Shanghai Electric Group Co. Ltd., Class H | | | 3,423,809 | | | | 1,383,990 | |
Tencent Holdings Ltd. | | | 168,862 | | | | 5,939,627 | |
| | | | | | | | |
| | | | | | | | 46,436,498 | |
Colombia — 0.7% | |
Pacific Rubiales Energy Corp. | | | 112,337 | | | | 2,642,099 | |
Hong Kong — 5.4% | |
AIA Group Ltd. | | | 1,345,800 | | | | 5,307,117 | |
China Overseas Land & Investment Ltd. | | | 2,166,000 | | | | 5,639,933 | |
Kunlun Energy Co. Ltd. | | | 2,652,000 | | | | 4,909,082 | |
Sands China Ltd. | | | 1,521,600 | | | | 5,687,905 | |
| | | | | | | | |
| | | | | | | | 21,544,037 | |
Hungary — 1.1% | |
Mol Magyar Olaj- es Gazipari Rt. | | | 50,165 | | | | 4,363,805 | |
India — 6.3% | |
Dr Reddy’s Laboratories Ltd. — ADR | | | 152,300 | | | | 4,955,842 | |
Hindalco Industries Ltd. | | | 1,175,471 | | | | 2,530,909 | |
ITC Ltd. | | | 952,036 | | | | 4,990,372 | |
Tata Motors Ltd. — ADR | | | 220,600 | | | | 5,327,490 | |
Yes Bank Ltd. | | | 954,960 | | | | 7,290,325 | |
| | | | | | | | |
| | | | | | | | 25,094,938 | |
Indonesia — 4.1% | |
Bank Mandiri Persero Tbk PT | | | 5,986,000 | | | | 5,113,720 | |
Indocement Tunggal Prakarsa Tbk PT | | | 2,302,500 | | | | 5,110,655 | |
Telekomunikasi Indonesia Tbk PT | | | 3,794,584 | | | | 3,854,002 | |
United Tractors Tbk PT | | | 991,500 | | | | 2,164,940 | |
| | | | | | | | |
| | | | | | | | 16,243,317 | |
| | | | | | | | |
| Common Stocks | | Shares | | | Value | |
| | | | | | | | |
Ireland — 1.0% | |
Dragon Oil Plc | | | 426,522 | | | $ | 3,829,291 | |
Italy — 1.1% | |
Prada SpA | | | 518,900 | | | | 4,210,225 | |
Kazakhstan — 1.4% | |
KazMunaiGas Exploration Production — GDR | | | 308,388 | | | | 5,473,887 | |
Malaysia — 1.3% | |
Malayan Banking Bhd | | | 1,707,700 | | | | 5,051,788 | |
Mexico — 6.2% | |
Alpek SAB de CV | | | 1,693,689 | | | | 4,421,131 | |
Fomento Economico Mexicano SAB de CV — ADR | | | 46,515 | | | | 4,214,724 | |
Grupo Financiero Banorte SA de CV ‘O’ | | | 903,863 | | | | 5,021,845 | |
Grupo Televisa SA — ADR | | | 247,492 | | | | 5,593,319 | |
Mexichem SAB de CV | | | 471,616 | | | | 2,337,190 | |
Wal-Mart de Mexico SA de CV, Series V | | | 1,052,035 | | | | 3,106,934 | |
| | | | | | | | |
| | | | | | | | 24,695,143 | |
Panama — 1.8% | |
Copa Holdings SA, Class A | | | 78,424 | | | | 7,279,316 | |
Peru — 1.3% | |
Credicorp Ltd. | | | 38,368 | | | | 4,962,517 | |
Russia — 6.5% | |
Lukoil OAO — ADR | | | 64,727 | | | | 3,896,565 | |
Magnit OJSC — GDR | | | 110,626 | | | | 3,936,870 | |
Mail.ru Group Ltd. — GDR | | | 119,498 | | | | 3,993,150 | |
NovaTek OAO — GDR | | | 3,385 | | | | 387,562 | |
Sberbank | | | 735,974 | | | | 2,163,623 | |
Sberbank — ADR | | | 690,994 | | | | 8,171,311 | |
Sistema JSFC — GDR | | | 175,615 | | | | 3,233,530 | |
| | | | | | | | |
| | | | | | | | 25,782,611 | |
South Africa — 3.0% | |
African Bank Investments Ltd. | | | 438,690 | | | | 1,484,370 | |
The Foschini Group Ltd. | | | 325,648 | | | | 4,728,025 | |
Shoprite Holdings Ltd. | | | 138,551 | | | | 2,849,302 | |
Standard Bank Group Ltd. | | | 239,711 | | | | 2,960,003 | |
| | | | | | | | |
| | | | | | | | 12,021,700 | |
South Korea — 10.5% | |
Celltrion, Inc. | | | 87,630 | | | | 2,158,224 | |
Hyundai Motor Co. | | | 29,347 | | | | 6,031,354 | |
Kia Motors Corp. | | | 128,612 | | | | 7,130,206 | |
LG Chem Ltd. | | | 9,277 | | | | 2,602,379 | |
LG Household & Health Care Ltd. | | | 8,896 | | | | 5,224,565 | |
Samsung Electronics Co. Ltd. | | | 15,517 | | | | 18,620,980 | |
| | | | | | | | |
| | | | | | | | 41,767,708 | |
Taiwan — 6.3% | |
Delta Electronics, Inc. | | | 869,000 | | | | 2,964,241 | |
HON HAI Precision Industry Co. Ltd. | | | 2,588,363 | | | | 7,848,008 | |
Quanta Computer, Inc. | | | 819,000 | | | | 1,869,187 | |
Taiwan Semiconductor Manufacturing Co. Ltd. | | | 694,224 | | | | 2,115,342 | |
Taiwan Semiconductor Manufacturing Co. Ltd. — ADR | | | 629,125 | | | | 10,003,088 | |
| | | | | | | | |
| | | | | | | | 24,799,866 | |
Thailand — 4.3% | |
Advanced Info Service PCL | | | 280,800 | | | | 1,809,396 | |
CP ALL Public Co. Ltd. | | | 3,033,700 | | | | 3,922,557 | |
To simplify the listings of portfolio holdings in the Schedules of Investments, the names and descriptions of many of the securities have been abbreviated according to the following list:
| | |
| ADR | | American Depositary Receipts |
| BRL | | Brazilian Real |
| CP | | Colombian Peso |
| GDR | | Global Depositary Receipts |
| | |
| HKD | | Hong Kong Dollar |
| MXN | | Mexican New Peso |
| PCL | | Public Company Limited |
| USD | | US Dollar |
See Notes to Financial Statements.
| | | | | | |
| | | | | | | |
| | ANNUAL REPORT | | OCTOBER 31, 2012 | | 11 |
| | |
Schedule of Investments (continued) | | BlackRock Emerging Markets Fund, Inc. (Percentages shown are based on Net Assets) |
| | | | | | | | |
| Common Stocks | | Shares | | | Value | |
| | | | | | | | |
Thailand (concluded) | | | | | | | | |
Kasikornbank Public Co. Ltd. | | | 953,200 | | | $ | 5,542,708 | |
Siam Commercial Bank Public Co. Ltd. | | | 1,101,900 | | | | 5,760,500 | |
| | | | | | | | |
| | | | | | | | 17,035,161 | |
Turkey — 2.5% | |
Koza Altin Isletmeleri AS | | | 205,953 | | | | 4,487,474 | |
Turkiye Garanti Bankasi AS | | | 1,131,006 | | | | 5,403,902 | |
| | | | | | | | |
| | | | | | | | 9,891,376 | |
United States — 2.3% | |
Cognizant Technology Solutions Corp., Class A (a) | | | 66,579 | | | | 4,437,490 | |
First Cash Financial Services, Inc. (a) | | | 101,129 | | | | 4,516,421 | |
| | | | | | | | |
| | | | | 8,953,911 | |
Total Long-Term Investments
(Cost — $334,167,197) — 95.0% | | | | 376,583,065 | |
| | | | | | | | |
| | |
| | |
| Short-Term Securities | | | | | | |
BlackRock Liquidity Funds, TempFund, Institutional Class, 0.17% (b)(c) | | | 12,893,760 | | | | 12,893,760 | |
Total Short-Term Securities
(Cost — $12,893,760) — 3.3% | | | | | | | 12,893,760 | |
| Total Investments (Cost — $347,060,957) — 98.3% | | | | 389,476,825 | |
| Other Assets Less Liabilities — 1.7% | | | | 6,853,631 | |
| | | | | | | | |
Net Assets — 100.0% | | | | | | $ | 396,330,456 | |
| | | | | | | | |
| |
| (a) | | Non-income producing security. |
| (b) | | Investments in issuers considered to be an affiliate of the Fund during the year ended October 31, 2012, for purposes of Section 2(a)(3) of the Investment Company Act of 1940, as amended, were as follows: |
| | | | | | | | | | | | | | | | |
| Affiliate | | Shares
Held at
October 31,
2011 | | | Net
Activity | | | Shares
Held at
October 31,
2012 | | | Income | |
BlackRock Liquidity Funds, TempFund, Institutional Class | | | 13,520,217 | | | | (626,457 | ) | | | 12,893,760 | | | $ | 20,234 | |
| (c) | | Represents the current yield as of report date. |
| Ÿ | | Foreign currency exchange contracts as of October 31, 2012 were as follows: |
| | | | | | | | | | | | | | |
Currency
Purchased | | Currency
Sold | | | Counterparty | | Settlement
Date | | | Unrealized
Appreciation
(Depreciation) | |
| MXN 2,665,046 | | | USD 204,456 | | | Goldman Sachs
Group, Inc. | | | 11/01/12 | | | $ | (924 | ) |
| USD 87,449 | | | HKD 677,748 | | | Citigroup, Inc. | | | 11/01/12 | | | | (2 | ) |
| USD 14,978 | | | MXN 196,096 | | | Bank of New York
Mellon Corp. | | | 11/01/12 | | | | 3 | |
| MXN 1,553,538 | | | USD 119,015 | | | Goldman Sachs
Group, Inc. | | | 11/05/12 | | | | (370 | ) |
| USD 196,612 | | | BRL 399,515 | | | Brown Brothers
Harriman & Co. | | | 11/05/12 | | | | (92 | ) |
| USD 53,764 | | | BRL 109,303 | | | Brown Brothers
Harriman & Co. | | | 11/05/12 | | | | (52 | ) |
| USD 36,376 | | | BRL 73,952 | | | Brown Brothers
Harriman & Co. | | | 11/05/12 | | | | (35 | ) |
| Total | | | | | | | | | | | | $ | (1,472 | ) |
| | | | | | | | | | | | | | |
| Ÿ | | Fair Value Measurements — Various inputs are used in determining the fair value of investments and derivative financial instruments. These inputs to valuation techniques are categorized into a disclosure hierarchy consisting of three broad levels for financial statement purposes as follows: |
| Ÿ | | Level 1 — unadjusted price quotations in active markets/exchanges for identical assets and liabilities that the Fund has the ability to access |
| Ÿ | | Level 2 — other observable inputs (including, but not limited to: quoted prices for similar assets or liabilities in markets that are active, quoted prices for identical or similar assets or liabilities in markets that are not active, inputs other than quoted prices that are observable for the assets or liabilities (such as interest rates, yield curves, volatilities, prepayment speeds, loss severities, credit risks and default rates) or other market-corroborated inputs) |
| Ÿ | | Level 3 — unobservable inputs based on the best information available in the circumstances, to the extent observable inputs are not available (including the Fund’s own assumptions used in determining the fair value of investments and derivative financial instruments) |
The hierarchy gives the highest priority to unadjusted quoted prices in active markets for identical assets or liabilities (Level 1 measurements) and the lowest priority to unobservable inputs (Level 3 measurements). Accordingly, the degree of judgment exercised in determining fair value is greatest for instruments categorized in Level 3. The inputs used to measure fair value may fall into different levels of the fair value hierarchy. In such cases, for disclosure purposes, the level in the fair value hierarchy within which the fair value measurement falls in its entirety is determined based on the lowest level input that is significant to the fair value measurement in its entirety.
Changes in valuation techniques may result in transfers into or out of an assigned level within the disclosure hierarchy. In accordance with the Fund’s policy, transfers between different levels of the fair value disclosure hierarchy are deemed to have occurred as of the beginning of the reporting period. The categorization of a value determined for investments and derivative financial instruments is based on the pricing transparency of the investment and derivative financial instrument and is not necessarily an indication of the risks associated with investing in those securities. For information about the Fund’s policy regarding valuation of investments and derivative financial instruments and other significant accounting policies, please refer to Note 1 of the Notes to Financial Statements.
The following tables summarize the Fund’s investments and derivative financial instruments categorized in the disclosure hierarchy as of October 31, 2012:
| | | | | | | | | | | | | | | | |
| | | Level 1 | | | Level 2 | | | Level 3 | | | Total | |
Assets: | | | | | | | | | | | | | | | | |
| Investments: | | | | | | | | | | | | | | | | |
Long-Term Investments: | | | | | | | | | | | | | |
Common Stocks: | | | | | | | | | | | | | | | | |
Argentina | | $ | 4,119,390 | | | | — | | | | — | | | $ | 4,119,390 | |
Brazil | | | 56,737,280 | | | | — | | | | — | | | | 56,737,280 | |
Chile | | | 3,647,201 | | | | — | | | | — | | | | 3,647,201 | |
China | | | 5,809,748 | | | $ | 40,626,750 | | | | — | | | | 46,436,498 | |
Colombia | | | 2,642,099 | | | | — | | | | — | | | | 2,642,099 | |
Hong Kong | | | — | | | | 21,544,037 | | | | — | | | | 21,544,037 | |
Hungary | | | — | | | | 4,363,805 | | | | — | | | | 4,363,805 | |
India | | | 10,283,332 | | | | 14,811,606 | | | | — | | | | 25,094,938 | |
Indonesia | | | — | | | | 16,243,317 | | | | — | | | | 16,243,317 | |
Ireland | | | — | | | | 3,829,291 | | | | — | | | | 3,829,291 | |
Italy | | | — | | | | 4,210,225 | | | | — | | | | 4,210,225 | |
Kazakhstan | | | 5,473,887 | | | | — | | | | — | | | | 5,473,887 | |
Malaysia | | | — | | | | 5,051,788 | | | | — | | | | 5,051,788 | |
Mexico | | | 24,695,143 | | | | — | | | | — | | | | 24,695,143 | |
Panama | | | 7,279,316 | | | | — | | | | — | | | | 7,279,316 | |
Peru | | | 4,962,517 | | | | — | | | | — | | | | 4,962,517 | |
Russia | | | 3,896,565 | | | | 21,886,046 | | | | — | | | | 25,782,611 | |
South Africa | | | — | | | | 12,021,700 | | | | — | | | | 12,021,700 | |
South Korea | | | — | | | | 41,767,708 | | | | — | | | | 41,767,708 | |
Taiwan | | | 10,003,088 | | | | 14,796,778 | | | | — | | | | 24,799,866 | |
Thailand | | | 1,809,396 | | | | 15,225,765 | | | | — | | | | 17,035,161 | |
Turkey | | | — | | | | 9,891,376 | | | | — | | | | 9,891,376 | |
United States | | | 8,953,911 | | | | — | | | | — | | | | 8,953,911 | |
Short-Term Securities | | | 12,893,760 | | | | — | | | | — | | | | 12,893,760 | |
| | | | |
Total | | $ | 163,206,633 | | | $ | 226,270,192 | | | | — | | | $ | 389,476,825 | |
| | | | |
See Notes to Financial Statements.
| | | | | | |
| | | | | | | |
| 12 | | ANNUAL REPORT | | OCTOBER 31, 2012 | | |
| | |
Schedule of Investments (concluded) | | BlackRock Emerging Markets Fund, Inc.
|
| | | | | | | | | | | | | | |
| | | Level 1 | | Level 2 | | | Level 3 | | | Total | |
| Derivative Financial Instruments1 | | | | | | | | | | | | | | |
Assets: | | | | | | | | | | | | | | |
Foreign currency exchange contracts | | — | | $ | 3 | | | | — | | | $ | 3 | |
Liabilities: | | | | | | | | | | | | | | |
Foreign currency exchange contracts | | — | | | (1,475 | ) | | | — | | | | (1,475 | ) |
| | | |
Total | | — | | $ | (1,472 | ) | | | — | | | $ | (1,472 | ) |
| | | |
| 1 | | Derivative financial instruments are foreign currency exchange contracts, which are valued at the unrealized appreciation/depreciation on the instrument. |
Certain of the Fund’s assets are held at carrying amount, which approximates fair value for financial statement purposes. As of October 31, 2012, foreign currency at value of $1,158,373 is categorized as Level 1 within the disclosure hierarchy.
Prior to April 30, 2012, only significant transfers between Level 1 and Level 2 were required to be disclosed. There were no significant transfers from the beginning of the period to April 30, 2012. For the interim period May 1, 2012 through October 31, 2012, all transfers between Level 1 and Level 2 are required to be disclosed. Certain foreign securities are fair valued utilizing an external pricing service to reflect any significant market movements between the time the Fund values such securities and the earlier closing of foreign markets. Such fair valuations are categorized as Level 2 in the disclosure hierarchy. As of April 30, 2012, there were securities with a value of $6,739,054 that were systematically fair valued due to significant market movements, but were not valued using systematic fair values as of October 31, 2012. Therefore, these securities were transferred from Level 2 to Level 1 during the period May 1, 2012 to October 31, 2012.
See Notes to Financial Statements.
| | | | | | |
| | | | | | | |
| | ANNUAL REPORT | | OCTOBER 31, 2012 | | 13 |
| | |
Schedule of Investments October 31, 2012 | | BlackRock Latin America Fund, Inc. (Percentages shown are based on Net Assets) |
| | | | | | | | |
| Common Stocks | | Shares | | | Value | |
| | | | | | | | |
Argentina — 0.9% | | | | | | | | |
Tenaris SA-ADR | | | 140,000 | | | $ | 5,266,800 | |
Brazil — 62.1% | | | | | | | | |
Arezzo Industria e Comercio SA | | | 169,000 | | | | 3,016,297 | |
Autometal SA | | | 342,000 | | | | 2,862,559 | |
Banco Bradesco SA — ADR | | | 2,031,000 | | | | 31,805,460 | |
Banco do Brasil SA | | | 1,051,000 | | | | 11,213,495 | |
BM&F Bovespa SA | | | 2,262,000 | | | | 14,478,226 | |
BR Malls Participacoes SA | | | 721,000 | | | | 9,478,201 | |
BR Properties SA | | | 463,000 | | | | 6,063,760 | |
BRF-Brasil Foods SA — ADR (a) | | | 684,000 | | | | 12,530,880 | |
BTG Pactual Participations Ltd. | | | 182,000 | | | | 2,867,482 | |
CETIP SA-Mercados Organizado | | | 503,000 | | | | 5,795,131 | |
Cia de Bebidas das Americas, Preference Shares — ADR | | | 540,000 | | | | 22,026,600 | |
Cia de Concessoes Rodoviarias | | | 2,639,000 | | | | 23,205,997 | |
Cia de Saneamento Basico do Estado de Sao Paulo —ADR | | | 78,000 | | | | 6,552,780 | |
Cia Energetica de Minas Gerais-ADR | | | 342,000 | | | | 4,100,580 | |
Cia Hering | | | 95,000 | | | | 2,182,467 | |
Cosan Ltd. Class A | | | 99,000 | | | | 1,624,590 | |
Cosan SA Industria e Comercio | | | 440,000 | | | | 8,438,000 | |
Cyrela Brazil Realty SA | | | 165,000 | | | | 1,398,932 | |
EDP-Energias do Brasil SA | | | 619,000 | | | | 3,870,560 | |
Embraer SA — ADR | | | 220,000 | | | | 6,140,200 | |
Even Construtora e Incorporadora SA | | | 430,000 | | | | 1,714,877 | |
Gerdau SA — ADR | | | 951,000 | | | | 8,359,290 | |
Itau Unibanco Holdings SA — ADR | | | 1,964,000 | | | | 28,635,120 | |
Localiza Rent a Car SA | | | 167,000 | | | | 2,927,156 | |
Lojas Renner SA | | | 35,000 | | | | 1,295,881 | |
LPS Brasil Consultoria de Imoveis SA | | | 282,000 | | | | 4,845,671 | |
Marcopolo SA, Preference Shares | | | 552,000 | | | | 3,236,907 | |
Metalfrio Solutions SA (b) | | | 112,000 | | | | 245,390 | |
Natura Cosmeticos SA | | | 340,000 | | | | 9,064,769 | |
Petroleo Brasileiro SA — ADR | | | 2,127,000 | | | | 43,667,310 | |
QGEP Participacoes SA | | | 489,000 | | | | 3,023,973 | |
Qualicorp SA (b) | | | 324,000 | | | | 3,324,468 | |
T4F Entretenimento SA | | | 461,000 | | | | 2,610,226 | |
Totvs SA | | | 137,000 | | | | 2,785,800 | |
Transmissora Alianca de Energia Eletrica SA | | | 88,000 | | | | 2,902,932 | |
Ultrapar Participacoes SA | | | 196,888 | | | | 4,129,602 | |
Usinas Siderurgicas de Minas Gerais SA, Preference ‘A’ Shares | | | 502,000 | | | | 2,424,667 | |
Vale SA — ADR | | | 160,000 | | | | 2,931,200 | |
Vale SA, Preference ‘A’ Shares — ADR | | | 2,251,000 | | | | 40,045,290 | |
| | | | | | | | |
| | | | | | | | 347,822,726 | |
Chile — 5.1% | | | | | | | | |
Banco Santander Chile SA — ADR | | | 197,410 | | | | 5,367,578 | |
Empresa Nacional de Electricidad SA — ADR | | | 120,000 | | | | 5,744,400 | |
Empresa Nacional de Telecomunicaciones SA | | | 177,000 | | | | 3,621,483 | |
SACI Falabella | | | 622,000 | | | | 6,380,428 | |
Sociedad Quimica y Minera de Chile SA — ADR | | | 125,000 | | | | 7,231,250 | |
| | | | | | | | |
| | | | | | | | 28,345,139 | |
Colombia — 1.4% | | | | | | | | |
Pacific Rubiales Energy Corp. | | | 342,000 | | | | 8,043,635 | |
Mexico — 23.9% | | | | | | | | |
Alfa SAB-Class A | | | 3,577,000 | | | | 6,597,262 | |
Alpek SAB de CV | | | 1,774,000 | | | | 4,630,772 | |
America Movil, SAB de CV Series L — ADR | | | 1,731,000 | | | | 43,776,990 | |
Fomento Economico Mexicano SAB de CV — ADR | | | 257,000 | | | | 23,286,770 | |
Grupo Financiero Banorte SA de CV ‘O’ | | | 1,475,000 | | | | 8,195,070 | |
Grupo Financiero Santander Mexico SAB de C.V. — ADR (b) | | | 700,000 | | | | 9,569,000 | |
Grupo Televisa SA — ADR | | | 932,000 | | | | 21,063,200 | |
Kimberly-Clark de Mexico SAB de CV, Class A | | | 1,150,000 | | | | 2,761,265 | |
Mexichem SAB de CV | | | 1,213,000 | | | | 6,011,270 | |
Wal-Mart de Mexico SA de CV | | | 2,675,000 | | | | 7,899,973 | |
| | | | | | | | |
| | | | | | | | 133,791,572 | |
| | | | | | | | |
| Common Stocks | | Shares | | | Value | |
| | | | | | | | |
Panama — 1.7% | | | | | | | | |
Copa Holdings SA, Class A | | | 103,000 | | | $ | 9,560,460 | |
Peru — 1.6% | | | | | | | | |
Credicorp Ltd. | | | 39,000 | | | | 5,044,260 | |
Southern Copper Corp. | | | 103,000 | | | | 3,924,300 | |
| | | | | | | | |
| | | | | | | | 8,968,560 | |
| Total Common Stocks — 96.7% | | | | 541,798,892 | |
| | | | | | | | | | | | |
| | | | | | | | | | | | |
| | | | | | | | | | | | | |
| Corporate Bonds | | | | | Par
(000) | | | | |
| | | | | | | | | | | | |
Brazil — 0.5% | | | | | | | | | | | | |
Hypermarcas SA: | | | | | | | | | | | | |
3.00%, 10/15/15 | | | BRL | | | | 1,648 | | | | 919,942 | |
11.30%, 10/15/18 | | | | | | | 1,648 | | | | 813,017 | |
Lupatech SA, 6.50%, 4/15/18 (c) | | | | | | | 2,128 | | | | 1,076,811 | |
| Total Corporate Bonds — 0.5% | | | | | | | | | | | 2,809,770 | |
| | | | | | | | | | | | |
| | | | | | | | | | | | | |
| | | |
| Participation Notes | | | | | | | | | |
Brazil — 2.3% | | | | | | | | | | | | |
Morgan Stanley BV: | | | | | | | | | | | | |
(BTG Pactual Participations Ltd.), due 6/6/14 | | | USD | | | | 75 | | | | 1,197,600 | |
(Lojas Renner SA), due 12/05/13 | | | | | | | 100 | | | | 3,900,520 | |
(Lojas Renner SA), due 2/25/14 | | | | | | | 50 | | | | 1,957,615 | |
(Lojas Renner SA), due 7/22/13 | | | | | | | 33 | | | | 1,273,331 | |
(Natura Cosmetico SA), due 10/29/12 | | | | | | | 27 | | | | 742,195 | |
(Natura Cosmetico SA), due 7/22/13 | | | | | | | 148 | | | | 4,068,328 | |
| Total Participation Notes — 2.3% | | | | | | | | | | | 13,139,589 | |
| | | | | | | | |
| | | | | | | | |
| | | | | | | | | |
| | |
| Warrants (d) — 0.0% | | Shares | | | | |
| | | | | | | | |
Brazil — 0.0% | | | | | | | | |
Hypermarcas SA (Expires 10/15/15) | | | 1,644 | | | | — | |
Total Long-Term Investments
(Cost — $421,933,075) — 99.5% | | | | | | | 557,748,251 | |
| | | | | | | | |
| | | | | | | | | |
| | |
| Short-Term Securities | | | | | | |
BlackRock Liquidity Funds, TempFund, Institutional Class, 0.17% (e)(f) | | | 4,263,188 | | | | 4,263,188 | |
| | |
| | | Beneficial
Interest
(000) | | | | |
BlackRock Liquidity Series LLC, Money Market Series, 0.22% (e)(f)(g) | | | 11,970 | | | | 11,970,000 | |
Total Short-Term Securities
(Cost — $16,233,188) — 2.9% | | | | 16,233,188 | |
| Total Investments (Cost — $438,166,263) — 102.4% | | | | | | | 573,981,439 | |
| Liabilities in Excess of Other Assets — (2.4)% | | | | | | | (13,644,284 | ) |
| | | | | | | | |
Net Assets — 100.0% | | | | | | $ | 560,337,155 | |
| | | | | | | | |
See Notes to Financial Statements.
| | | | | | |
| | | | | | | |
| 14 | | ANNUAL REPORT | | OCTOBER 31, 2012 | | |
| | |
Schedule of Investments (continued) | | BlackRock Latin America Fund, Inc.
|
| (a) | | Security, or a portion of security, is on loan. |
| (b) | | Non-income producing security. |
| (c) | | Convertible security. |
| (d) | | Warrants entitle the Fund to purchase a predetermined number of shares of common stock and are non-income producing. The purchase price and number of shares are subject to adjustment under certain conditions until the expiration date, if any. |
| (e) | | Investments in issuers considered to be an affiliate of the Fund during the year ended October 31, 2012, for purposes of Section 2(a)(3) of the Investment Company Act of 1940, as amended, were as follows: |
| | | | | | | | | | | | | | | | |
| Affiliate | | Shares/Beneficial
Interest Held at
October 31, 2011 | | | Net
Activity | | | Shares/Beneficial
Interest Held at
October 31, 2012 | | | Income | |
BlackRock Liquidity Funds, TempFund, Institutional Class | | | 7,334,598 | | | | (3,071,410 | ) | | | 4,263,188 | | | $ | 6,685 | |
BlackRock Liquidity Series LLC, Money Market Series | | $ | 2,210,000 | | | $ | 9,760,000 | | | $ | 11,970,000 | | | $ | 8,378 | |
| (f) | | Represents the current yield as of report date. |
| (g) | | Security was purchased with the cash collateral from loaned securities. |
| Ÿ | | Foreign currency exchange contracts as of October 31, 2012 were as follows: |
| | | | | | | | | | | | | | | | |
Currency
Purchased | | Currency
Sold | | | Counterparty | | | Settlement
Date | | | Unrealized
Depreciation | |
| USD 28,453 | | | BRL 57,846 | | |
| Brown Brothers
Harriman & Co. |
| | | 11/01/12 | | | $ | (27 | ) |
| USD 717,273 | | | BRL 1,458,000 | | |
| Brown Brothers
Harriman & Co. |
| | | 11/05/12 | | | | (583 | ) |
| USD 143,445 | | | BRL 291,623 | | |
| Brown Brothers
Harriman & Co. |
| | | 11/05/12 | | | | (138 | ) |
| Total | | | | | | | | | | | | | | $ | (748 | ) |
| Ÿ | | Fair Value Measurements — Various inputs are used in determining the fair value of investments and derivative financial instruments. These inputs to valuation techniques are categorized into a disclosure hierarchy consisting of three broad levels for financial statement purposes as follows: |
| Ÿ | | Level 1 — unadjusted price quotations in active markets/exchanges for identical assets and liabilities that the Fund has the ability to access |
| Ÿ | | Level 2 — other observable inputs (including, but not limited to: quoted prices for similar assets or liabilities in markets that are active, quoted prices for identical or similar assets or liabilities in markets that are not active, inputs other than quoted prices that are observable for the assets or liabilities (such as interest rates, yield curves, volatilities, prepayment speeds, loss severities, credit risks and default rates) or other market-corroborated inputs) |
| Ÿ | | Level 3 — unobservable inputs based on the best information available in the circumstances, to the extent observable inputs are not available (including the Fund’s own assumptions used in determining the fair value of investments and derivative financial instruments) |
The hierarchy gives the highest priority to unadjusted quoted prices in active markets for identical assets or liabilities (Level 1 measurements) and the lowest priority to unobservable inputs (Level 3 measurements). Accordingly, the degree of judgment exercised in determining fair value is greatest for instruments categorized in Level 3. The inputs used to measure fair value may fall into different levels of the fair value hierarchy. In such cases, for disclosure purposes, the level in the fair value hierarchy within which the fair value measurement falls in its entirety is determined based on the lowest level input that is significant to the fair value measurement in its entirety.
Changes in valuation techniques may result in transfers into or out of an assigned level within the disclosure hierarchy. In accordance with the Fund’s policy, transfers between different levels of the fair value disclosure hierarchy are deemed to have occurred as of the beginning of the reporting period. The categorization of a value determined for investments and derivative financial instruments is based on the pricing transparency of the investment and derivative financial instrument and is not necessarily an indication of the risks associated with investing in those securities. For information about the Fund’s policy regarding valuation of investments and derivative financial instruments
and other significant accounting policies, please refer to Note 1 of the Notes to Financial Statements.
The following tables summarize the Fund’s investments and derivative financial instruments categorized in the disclosure hierarchy as of October 31, 2012:
| | | | | | | | | | | | | | | | |
| | | Level 1 | | | Level 2 | | | Level 3 | | | Total | |
Assets: | | | | | | | | | | | | | | | | |
| Investments: | | | | | | | | | | | | | | | | |
Long-Term Investments: | | | | | | | | | | | | | | | | |
Common Stocks: | | | | | | | | | | | | | | | | |
Argentina | | $ | 5,266,800 | | | | — | | | | — | | | $ | 5,266,800 | |
Brazil | | | 347,822,726 | | | | — | | | | — | | | | 347,822,726 | |
Chile | | | 28,345,139 | | | | — | | | | — | | | | 28,345,139 | |
Colombia | | | 8,043,635 | | | | — | | | | — | | | | 8,043,635 | |
Mexico | | | 133,791,572 | | | | — | | | | — | | | | 133,791,572 | |
Panama | | | 9,560,460 | | | | — | | | | — | | | | 9,560,460 | |
Peru | | | 8,968,560 | | | | — | | | | — | | | | 8,968,560 | |
Corporate Bonds | | | — | | | | — | | | $ | 2,809,770 | | | | 2,809,770 | |
Participation Notes | | | — | | | | — | | | | 13,139,589 | | | | 13,139,589 | |
Short-Term Securities | | | 4,263,188 | | | $ | 11,970,000 | | | | — | | | | 16,233,188 | |
| | | | | | | | | | | | | | | | |
Total | | $ | 546,062,080 | | | $ | 11,970,000 | | | $ | 15,949,359 | | | $ | 573,981,439 | |
| | | | | | | | | | | | | | | | |
| | | | | | | | | | | | | | | | |
| | | Level 1 | | | Level 2 | | | Level 3 | | | Total | |
Derivative Financial Instruments1 | | | | | | | | | | | | | | | | |
Liabilities: | | | | | | | | | | | | | | | | |
Foreign currency exchange contracts | | | — | | | $ | (748 | ) | | | — | | | $ | (748 | ) |
| 1 | | Derivative financial instruments are foreign currency exchange contracts, which are valued at the unrealized appreciation/depreciation on the instrument. |
Certain of the Fund’s assets and liabilities are held at carrying amount or face value, which approximates fair value for financial statement purposes. As of October 31, 2012, such assets and liabilities are categorized within the disclosure hierarchy as follows:
| | | | | | | | | | | | | | |
| | | Level 1 | | | Level 2 | | | Level 3 | | Total | |
Assets: | | | | | | | | | | | | | | |
Foreign currency at value | | $ | 1,154,749 | | | | — | | | — | | $ | 1,154,749 | |
Liabilities: | | | | | | | | | | | | | | |
Collateral on securities loaned at value | | | — | | | $ | (11,970,000 | ) | | — | | | (11,970,000 | ) |
| | | | | | | | | | | | | | |
Total | | $ | 1,154,749 | | | $ | (11,970,000 | ) | | — | | $ | (10,815,251 | ) |
| | | | | | | | | | | | | | |
There were no transfers between Level 1 and Level 2 during the year ended October 31, 2012.
Certain of the Fund’s investments are categorized as Level 3 and were valued utilizing transaction prices or third party pricing information without adjustment. Such valuations are based on unobservable inputs. A significant change in the unobservable inputs could result in a significantly lower or higher value in such Level 3 investments.
See Notes to Financial Statements.
| | | | | | |
| | | | | | | |
| | ANNUAL REPORT | | OCTOBER 31, 2012 | | 15 |
| | |
Schedule of Investments (concluded) | | BlackRock Latin America Fund, Inc.
|
See Notes to Financial Statements.
A reconciliation of Level 3 investments is presented when the Fund had a significant amount of Level 3 investments at the beginning and/or end of the year in relation to net assets. The following table is a reconciliation of Level 3 investments for which significant unobservable inputs were used in determining fair value:
| | | | | | | | | | | | |
| | | Corporate
Bonds | | | Participation Notes | | | Total | |
Assets: | | | | | |
Opening balance, as of October 31, 2011 | | $ | 3,256,797 | | | | — | | | $ | 3,256,797 | |
Transfers into Level 31 | | | — | | | $ | 18,124,450 | | | | 18,124,450 | |
Accrued discounts/premiums | | | (4,399 | ) | | | — | | | | (4,399 | ) |
Net realized gain (loss) | | | — | | | | 4,877,808 | | | | 4,877,808 | |
Net change in unrealized appreciation/depreciation2 | | | (442,628 | ) | | | (530,934 | ) | | | (973,562 | ) |
Purchases | | | — | | | | 2,188,373 | | | | 2,188,373 | |
Sales | | | — | | | | (11,520,108 | ) | | | (11,520,108 | ) |
| | | | | | | | | | | | |
Closing Balance, as of October 31, 2012 | | $ | 2,809,770 | | | $ | 13,139,589 | | | $ | 15,949,359 | |
| | | | | | | | | | | | |
| 1 | | As of October 31, 2011, the Fund used observable inputs in determining the value of certain investments. As of October 31, 2012, the Fund used significant unobservable inputs in determining the value of the same investments. As a result, investments with a beginning of period value of $18,124,450 transferred from Level 2 to Level 3 in the disclosure hierarchy. |
| 2 | | Included in the related net change in unrealized appreciation/depreciation in the Statements of Operations. The net change in unrealized appreciation/depreciation on investments still held as of October 31, 2012 was $(973,562). |
| | | | | | |
| | | | | | | |
| 16 | | ANNUAL REPORT | | OCTOBER 31, 2012 | | |
| | |
| Statements of Assets and Liabilities | | |
| | | | | | | | | | | | |
| October 31, 2012 | | BlackRock
Emerging
Markets
Fund, Inc. | | | BlackRock
Latin
America
Fund, Inc. | | | BlackRock
International
Fund | |
| | | | | | | | | | | | |
| Assets | | | | | | | | | | | | |
Investments at value — unaffiliated1,2 | | $ | 376,583,065 | | | $ | 557,748,251 | | | | — | |
Investments at value — BlackRock Master International Portfolio of BlackRock Master LLC (the “Portfolio”) (cost — $666,397,470) | | | — | | | | — | | | $ | 709,589,168 | |
Investments at value — affiliated3 | | | 12,893,760 | | | | 16,233,188 | | | | — | |
Unrealized appreciation on foreign currency exchange contracts | | | 3 | | | | — | | | | — | |
Foreign currency at value4 | | | 1,158,373 | | | | 1,154,749 | | | | — | |
Capital shares sold receivable | | | 9,850,959 | | | | 179,510 | | | | 775,477 | |
Withdrawals receivable from the Portfolio | | | — | | | | — | | | | 134,476 | |
Dividends receivable | | | 132,081 | | | | 2,270,948 | | | | — | |
Investments sold receivable | | | 811,360 | | | | — | | | | — | |
Interest receivable | | | — | | | | 83,571 | | | | — | |
Securities lending income receivable — affiliated | | | — | | | | 474 | | | | — | |
Prepaid expenses | | | 1,900 | | | | 4,442 | | | | — | |
| | | | |
Total assets | | | 401,431,501 | | | | 577,675,133 | | | | 710,499,121 | |
| | | | |
| | | | | | | | | | | | |
| Liabilities | | | | | | | | | | | | |
Collateral on securities loaned at value | | | — | | | | 11,970,000 | | | | — | |
Capital shares redeemed payable | | | 842,446 | | | | 3,962,424 | | | | 909,953 | |
Investments purchased payable | | | 3,381,276 | | | | — | | | | — | |
Investment advisory fees payable | | | 328,478 | | | | 489,008 | | | | — | |
Service and distribution fees payable | | | 124,922 | | | | 170,377 | | | | 183,903 | |
Foreign capital gain tax payable | | | 36,579 | | | | 57,447 | | | | — | |
Other affiliates payable | | | 3,045 | | | | 5,967 | | | | — | |
Unrealized depreciation on foreign currency exchange contracts | | | 1,475 | | | | 748 | | | | — | |
Officer’s and Directors’ fees payable | | | 62 | | | | — | | | | 591 | |
Other accrued expenses payable | | | 382,762 | | | | 682,007 | | | | 500,277 | |
| | | | |
Total liabilities | | | 5,101,045 | | | | 17,337,978 | | | | 1,594,724 | |
| | | | |
Net Assets | | $ | 396,330,456 | | | $ | 560,337,155 | | | $ | 708,904,397 | |
| | | | |
| | | | | | | | | | | | |
| Net Assets Consist of | | | | | | | | | | | | |
Paid-in capital | | $ | 383,833,505 | | | $ | 505,634,058 | | | $ | 1,020,247,728 | |
Undistributed net investment income | | | 3,867,409 | | | | 4,380,620 | | | | 6,906,538 | |
Accumulated net realized loss | | | (33,787,122 | ) | | | (85,368,758 | ) | | | — | |
Net unrealized appreciation/depreciation | | | 42,416,664 | | | | 135,691,235 | | | | — | |
Accumulated net realized loss allocated from the Portfolio | | | — | | | | — | | | | (361,441,567 | ) |
Net unrealized appreciation/depreciation allocated from the Portfolio | | | — | | | | — | | | | 43,191,698 | |
| | | | |
Net Assets | | $ | 396,330,456 | | | $ | 560,337,155 | | | $ | 708,904,397 | |
| | | | |
1 Investments at cost — unaffiliated | | $ | 334,167,197 | | | $ | 421,933,075 | | | | — | |
2 Securities on loan at value | | | — | | | $ | 11,541,600 | | | | — | |
3 Investments at cost — affiliated | | $ | 12,893,760 | | | $ | 16,233,188 | | | | — | |
4 Foreign currency at cost | | $ | 1,156,385 | | | $ | 1,237,417 | | | | — | |
| | | | | | |
| See Notes to Financial Statements. | | | | |
| | | | | | | |
| | ANNUAL REPORT | | OCTOBER 31, 2012 | | 17 |
| | |
| Statements of Assets and Liabilities (concluded) | | |
| | | | | | | | | | | | |
| October 31, 2012 | | BlackRock
Emerging
Markets
Fund, Inc. | | | BlackRock
Latin
America
Fund, Inc. | | | BlackRock
International
Fund | |
| | | | | | | | | | | | |
| Net Asset Value | | | | | | | | | | | | |
Institutional: | | | | | | | | | | | | |
Net assets | | $ | 116,883,110 | | | $ | 125,473,473 | | | $ | 313,763,694 | |
| | | | |
Shares outstanding, 100 million shares authorized | | | 6,062,309 | | | | 2,133,166 | | | | 25,517,601 | |
| | | | |
Net asset value | | $ | 19.28 | | | $ | 58.82 | | | $ | 12.30 | |
| | | | |
Par value | | $ | 0.10 | | | $ | 0.10 | | | $ | 0.0001 | |
| | | | |
Investor A: | | | | | | | | | | | | |
Net assets | | $ | 174,636,537 | | | $ | 315,530,596 | | | $ | 221,364,571 | |
| | | | |
Shares outstanding, 100 million shares authorized | | | 9,385,814 | | | | 5,449,685 | | | | 18,397,812 | |
| | | | |
Net asset value | | $ | 18.61 | | | $ | 57.90 | | | $ | 12.03 | |
| | | | |
Par value | | $ | 0.10 | | | $ | 0.10 | | | $ | 0.0001 | |
| | | | |
Investor B: | | | | | | | | | | | | |
Net assets | | $ | 2,251,403 | | | $ | 7,989,228 | | | $ | 11,609,393 | |
| | | | |
Shares outstanding, 100 million shares authorized | | | 136,551 | | | | 148,054 | | | | 1,050,232 | |
| | | | |
Net asset value | | $ | 16.49 | | | $ | 53.96 | | | $ | 11.05 | |
| | | | |
Par value | | $ | 0.10 | | | $ | 0.10 | | | $ | 0.0001 | |
| | | | |
Investor C: | | | | | | | | | | | | |
Net assets | | $ | 102,559,406 | | | $ | 111,343,858 | | | $ | 135,279,847 | |
| | | | |
Shares outstanding, 100 million shares authorized | | | 6,400,379 | | | | 2,109,131 | | | | 12,048,580 | |
| | | | |
Net asset value | | $ | 16.02 | | | $ | 52.79 | | | $ | 11.23 | |
| | | | |
Par value | | $ | 0.10 | | | $ | 0.10 | | | $ | 0.0001 | |
| | | | |
Class R: | | | | | | | | | | | | |
Net assets | | | — | | | | — | | | $ | 26,886,892 | |
| | | | |
Shares outstanding, 100 million shares authorized | | | — | | | | — | | | | 2,243,988 | |
| | | | |
Net asset value | | | — | | | | — | | | $ | 11.98 | |
| | | | |
Par value | | | — | | | | — | | | $ | 0.0001 | |
| | | | |
| | | | | | |
| See Notes to Financial Statements. | | | | |
| | | | | | | |
| 18 | | ANNUAL REPORT | | OCTOBER 31, 2012 | | |
| | | | | | | | | | | | |
| Year Ended October 31, 2012 | | BlackRock
Emerging
Markets Fund, Inc. | | | BlackRock Latin America Fund, Inc. | | | BlackRock
International
Fund | |
| | | | | | | | | | | | |
| Investment Income | | | | | | | | | | | | |
Dividends — unaffiliated | | $ | 12,714,101 | | | $ | 20,739,559 | | | | — | |
Interest | | | — | | | | 210,697 | | | | — | |
Dividends — affiliated | | | 20,234 | | | | 6,685 | | | | — | |
Securities lending — affiliated | | | — | | | | 8,378 | | | | — | |
Foreign taxes withheld | | | (1,346,649 | ) | | | (2,053,336 | ) | | | — | |
Investment income allocated from the Portfolio: | | | | | | | | | | | | |
Dividends — unaffiliated | | | — | | | | — | | | $ | 19,101,779 | |
Dividends — affiliated | | | — | | | | — | | | | 54,678 | |
Foreign taxes withheld | | | — | | | | — | | | | (1,674,449 | ) |
Expenses | | | — | | | | — | | | | (6,171,038 | ) |
Fees waived | | | — | | | | — | | | | 26,625 | |
| | | | |
Total income | | | 11,387,686 | | | | 18,911,983 | | | | 11,337,595 | |
| | | | |
| | | | | | | | | | | | |
| Expenses | | | | | | | | | | | | |
Investment advisory | | | 3,923,503 | | | | 6,635,510 | | | | — | |
Administration | | | — | | | | — | | | | 1,893,017 | |
Service — Investor A | | | 415,963 | | | | 902,374 | | | | 525,848 | |
Service and distribution — Investor B | | | 28,230 | | | | 99,690 | | | | 170,086 | |
Service and distribution — Investor C | | | 1,001,345 | | | | 1,370,884 | | | | 1,408,713 | |
Service and distribution — Class R | | | — | | | | — | | | | 147,481 | |
Transfer agent — Institutional | | | 191,941 | | | | 296,584 | | | | 732,954 | |
Transfer agent — Investor A | | | 405,434 | | | | 546,951 | | | | 592,836 | |
Transfer agent — Investor B | | | 13,767 | | | | 28,354 | | | | 140,376 | |
Transfer agent — Investor C | | | 378,345 | | | | 304,826 | | | | 788,314 | |
Transfer agent — Class R | | | — | | | | — | | | | 94,306 | |
Custodian | | | 272,846 | | | | 402,795 | | | | — | |
Professional | | | 121,501 | | | | 123,730 | | | | 84,638 | |
Accounting services | | | 129,564 | | | | 171,317 | | | | — | |
Registration | | | 83,489 | | | | 69,567 | | | | 132,347 | |
Printing | | | 54,593 | | | | 41,920 | | | | 98,013 | |
Officer and Directors | | | 14,442 | | | | 15,685 | | | | 780 | |
Miscellaneous | | | 22,984 | | | | 25,817 | | | | 17,108 | |
| | | | |
Total expenses | | | 7,057,947 | | | | 11,036,004 | | | | 6,826,817 | |
Less fees waived by Manager | | | (9,948 | ) | | | (3,354 | ) | | | — | |
Less fees waived by administrator | | | — | | | | — | | | | (1,060,162 | ) |
Less transfer agent fees waived and/or reimbursed by Manager — class specific | | | — | | | | — | | | | (1,111,962 | ) |
| | | | |
Total expenses after fees waived | | | 7,047,999 | | | | 11,032,650 | | | | 4,654,693 | |
| | | | |
Net investment income | | | 4,339,687 | | | | 7,879,333 | | | | 6,682,902 | |
| | | | |
| | | | | | | | | | | | |
| Realized and Unrealized Gain (Loss) | | | | | | | | | | | | |
Net realized gain (loss) from: | | | | | | | | | | | | |
Investments | | | (14,945,576 | )1 | | | 18,326,065 | 2 | | | (64,817,973 | ) |
Foreign currency transactions | | | (437,480 | ) | | | (552,865 | ) | | | — | |
Investments and foreign currency transactions allocated from the Portfolio | | | — | | | | — | | | | 4,653,786 | |
| | | | |
| | | (15,383,056 | ) | | | 17,773,200 | | | | (60,164,187 | ) |
| | | | |
Net change in unrealized appreciation/depreciation on: | | | | | | | | | | | | |
Investments | | | 40,835,780 | | | | (67,889,455 | ) | | | 72,188,306 | |
Foreign currency translations | | | (5,267 | ) | | | (269,631 | ) | | | — | |
Investments and foreign currency translations allocated from the Portfolio | | | — | | | | — | | | | (3,696,432 | ) |
| | | | |
| | | 40,830,513 | | | | (68,159,086 | ) | | | 68,491,874 | |
| | | | |
Total realized and unrealized gain (loss) | | | 25,447,457 | | | | (50,385,886 | ) | | | 8,327,687 | |
| | | | |
Net Increase (Decrease) in Net Assets Resulting from Operations | | $ | 29,787,144 | | | $ | (42,506,553 | ) | | $ | 15,010,589 | |
| | | | |
| 1 | | Including $38,250 foreign capital gain tax. |
| 2 | | Including $22,974 foreign capital gain tax. |
| | | | | | |
| See Notes to Financial Statements. | | | | |
| | | | | | | |
| | ANNUAL REPORT | | OCTOBER 31, 2012 | | 19 |
| | |
| Statements of Changes in Net Assets | | |
| | | | | | | | | | | | | | | | | | | | | | | | | | | | |
| | | BlackRock Emerging
Markets Fund, Inc. | | | | | BlackRock Latin
America Fund, Inc. | | | | | BlackRock
International Fund | |
| | | Year Ended October 31, | | | | | Year Ended October 31, | | | | | Year Ended October 31, | |
| Increase (Decrease) in Net Assets: | | 2012 | | | 2011 | | | | | 2012 | | | 2011 | | | | | 2012 | | | 2011 | |
| | | | | | | | | | | | | | | | | | | | | | | | | | | | |
| Operations | | | | | | | | | | | | | | | | | | | | | | | | | | | | |
Net investment income (loss) | | $ | 4,339,687 | | | $ | 2,951,006 | | | | | $ | 7,879,333 | | | $ | 13,911,676 | | | | | $ | 6,682,902 | | | $ | (451,327 | ) |
Net realized gain (loss) | | | (15,383,056 | ) | | | 24,796,096 | | | | | | 17,773,200 | | | | 1,097,562 | | | | | | (60,164,187 | ) | | | (54,806,188 | ) |
Net change in unrealized appreciation/depreciation | | | 40,830,513 | | | | (61,612,802 | ) | | | | | (68,159,086 | ) | | | (178,023,842 | ) | | | | | 68,491,874 | | | | 34,396,421 | |
| | | | | | | | | | | | | | | | |
Net increase (decrease) in net assets resulting from operations | | | 29,787,144 | | | | (33,865,700 | ) | | | | | (42,506,553 | ) | | | (163,014,604 | ) | | | | | 15,010,589 | | | | (20,861,094 | ) |
| | | | | | | | | | | | | | | | |
| | | | | | | | | | | | | | | | | | | | | | | | | | | | |
| Dividends to Shareholders From1 | | | | | | | | | | | | | | | | | | | | | | | | | | | | |
Net investment income: | | | | | | | | | | | | | | | | | | | | | | | | | | | | |
Institutional | | | (655,387 | ) | | | (812,320 | ) | | | | | (1,452,355 | ) | | | (3,667,145 | ) | | | | | (2,249,032 | ) | | | — | |
Investor A | | | (376,139 | ) | | | (1,088,882 | ) | | | | | (1,922,455 | ) | | | (9,501,007 | ) | | | | | (841,498 | ) | | | — | |
Investor B | | | — | | | | — | | | | | | — | | | | (131,790 | ) | | | | | — | | | | — | |
Investor C | | | (70,513 | ) | | | (99,233 | ) | | | | | — | | | | (2,266,406 | ) | | | | | (300,200 | ) | | | — | |
Class R | | | — | | | | — | | | | | | — | | | | — | | | | | | (140,910 | ) | | | — | |
| | | | | | | | | | | | | | | | |
Decrease in net assets resulting from dividends to shareholders | | | (1,102,039 | ) | | | (2,000,435 | ) | | | | | (3,374,810 | ) | | | (15,566,348 | ) | | | | | (3,531,640 | ) | | | — | |
| | | | | | | | | | | | | | | | |
| | | | | | | | | | | | | | | | | | | | | | | | | | | | |
| Capital Share Transactions | | | | | | | | | | | | | | | | | | | | | | | | | | | | |
Net increase (decrease) in net assets derived from capital share transactions | | | (5,393,607 | ) | | | 97,517,396 | | | | | | (147,736,209 | ) | | | (121,555,893 | ) | | | | | (134,343,261 | ) | | | 787,412,165 | |
| | | | | | | | | | | | | | | | |
| | | | | | | | | | | | | | | | | | | | | | | | | | | | |
| Redemption Fee | | | | | | | | | | | | | | | | | | | | | | | | | | | | |
Redemption fee | | | — | | | | 18,007 | | | | | | — | | | | 37,221 | | | | | | — | | | | 3,608 | |
| | | | | | | | | | | | | | | | |
| | | | | | | | | | | | | | | | | | | | | | | | | | | | |
| Net Assets | | | | | | | | | | | | | | | |
Total increase in net assets | | | 23,291,498 | | | | 61,669,268 | | | | | | (193,617,572 | ) | | | (300,099,624 | ) | | | | | (122,864,312 | ) | | | 766,554,679 | |
Beginning of year | | | 373,038,958 | | | | 311,369,690 | | | | | | 753,954,727 | | | | 1,054,054,351 | | | | | | 831,768,709 | | | | 65,214,030 | |
| | | | | | | | | | | | | | | | |
End of year | | $ | 396,330,456 | | | $ | 373,038,958 | | | | | $ | 560,337,155 | | | $ | 753,954,727 | | | | | $ | 708,904,397 | | | $ | 831,768,709 | |
| | | | | | | | | | | | | | | | |
Undistributed (distributions in excess of) net investment income | | $ | 3,867,409 | | | $ | 1,071,786 | | | | | $ | 4,380,620 | | | $ | (2,092,649 | ) | | | | $ | 6,906,538 | | | $ | (1,051,618 | ) |
| | | | | | | | | | | | | | | | |
| 1 | | Dividends are determined in accordance with federal income tax regulations. |
| | | | | | |
| See Notes to Financial Statements. | | | | |
| | | | | | | |
| 20 | | ANNUAL REPORT | | OCTOBER 31, 2012 | | |
| | |
| Financial Highlights | | BlackRock Emerging Markets Fund, Inc. |
| | | | | | | | | | | | | | | | | | | | | | | | |
| | | Institutional | |
| | | Year Ended October 31, | | | Period July 1, 2008 to October 31,
2008 | | | Year Ended
June 30, 2008 | |
| | | 2012 | | | 2011 | | | 2010 | | | 2009 | | | |
| | | | | | | | | | | | | | | | | | | | | | | | |
| Per Share Operating Performance | | | | | | | | | | | | | | | | | |
Net asset value, beginning of period | | $ | 18.23 | | | $ | 20.50 | | | $ | 17.01 | | | $ | 10.17 | | | $ | 22.45 | | | $ | 27.91 | |
| | | | |
Net investment income1 | | | 0.29 | | | | 0.27 | | | | 0.13 | | | | 0.14 | | | | 0.07 | | | | 0.12 | |
Net realized and unrealized gain (loss) | | | 0.85 | | | | (2.34 | )2 | | | 3.47 | 2 | | | 6.75 | 2 | | | (10.34 | )2 | | | 1.28 | 2 |
| | | | |
Net increase (decrease) from investment operations | | | 1.14 | | | | (2.07 | ) | | | 3.60 | | | | 6.89 | | | | (10.27 | ) | | | 1.40 | |
| | | | |
| Dividends and distributions from:6 | | | | | | | | | | | | | | | | | | | | | | | | |
Net investment income | | | (0.09 | ) | | | (0.20 | ) | | | (0.11 | ) | | | (0.05 | ) | | | (0.01 | ) | | | — | |
Net realized gain | | | — | | | | — | | | | — | | | | — | | | | (2.00 | ) | | | (6.86 | ) |
| | | | |
Total dividends and distributions | | | (0.09 | ) | | | (0.20 | ) | | | (0.11 | ) | | | (0.05 | ) | | | (2.01 | ) | | | (6.86 | ) |
| | | | |
Net asset value, end of period | | $ | 19.28 | | | $ | 18.23 | | | $ | 20.50 | | | $ | 17.01 | | | $ | 10.17 | | | $ | 22.45 | |
| | | | |
| | | | | | | | | | | | | | | | | | | | | | | | |
| Total Investment Return3 | | | | | | | | | | | | | | | | | |
Based on net asset value | | | 6.37% | | | | (10.21)% | | | | 21.28% | | | | 68.14% | | | | (48.15) | %4 | | | 3.84% | |
| | | | |
| | | | | | | | | | | | | | | | | | | | | | | | |
| Ratios to Average Net Assets | | | | | | | | | | | | | | | | | |
Total expenses | | | 1.33% | | | | 1.28% | | | | 1.33% | | | | 1.48% | | | | 1.56% | 5 | | | 1.40% | |
| | | | |
Total expenses after fees waived | | | 1.33% | | | | 1.28% | | | | 1.33% | | | | 1.48% | | | | 1.54% | 5 | | | 1.37% | |
| | | | |
Net investment income | | | 1.53% | | | | 1.39% | | | | 0.71% | | | | 1.10% | | | | 1.31% | 5 | | | 0.45% | |
| | | | |
| | | | | | | | | | | | | | | | | | | | | | | | |
| Supplemental Data | | | | | | | | | | | | | | | | | |
Net assets, end of period (000) | | $ | 116,883 | | | $ | 127,181 | | | $ | 123,007 | | | $ | 86,173 | | | $ | 42,803 | | | $ | 80,399 | |
| | | | |
Portfolio turnover | | | 155% | | | | 138% | | | | 135% | | | | 191% | | | | 76% | | | | 163% | |
| | | | |
| 1 | | Based on average shares outstanding. |
| 2 | | Includes a redemption fee, which is less than $0.01 per share. |
| 3 | | Where applicable, total investment returns include the reinvestment of dividends and distributions. |
| 4 | | Aggregate total investment return. |
| 6 | | Dividends and distributions are determined in accordance with federal income tax regulations. |
| | | | | | |
| See Notes to Financial Statements. | | | | |
| | | | | | | |
| | ANNUAL REPORT | | OCTOBER 31, 2012 | | 21 |
| | |
| Financial Highlights (continued) | | BlackRock Emerging Markets Fund, Inc. |
| | | | | | | | | | | | | | | | | | | | | | | | |
| | | Investor A | |
| | | Year Ended October 31, | | | Period July 1, 2008
to October 31,
2008 | | | Year Ended June 30, 2008 | |
| | | 2012 | | | 2011 | | | 2010 | | | 2009 | | | |
| | | | | | | | | | | | | | | | | | | | | | | | |
| Per Share Operating Performance | | | | | | | | | | | | | | | | | |
Net asset value, beginning of period | | $ | 17.60 | | | $ | 19.81 | | | $ | 16.45 | | | $ | 9.85 | | | $ | 21.80 | | | $ | 27.27 | |
| | | | |
Net investment income1 | | | 0.22 | | | | 0.18 | | | | 0.07 | | | | 0.10 | | | | 0.05 | | | | 0.04 | |
Net realized and unrealized gain (loss) | | | 0.83 | | | | (2.24 | )2 | | | 3.36 | 2 | | | 6.53 | 2 | | | (10.02 | )2 | | | 1.25 | 2 |
| | | | |
Net increase (decrease) from investment operations | | | 1.05 | | | | (2.06 | ) | | | 3.43 | | | | 6.63 | | | | (9.97 | ) | | | 1.29 | |
| | | | |
| Dividends and distributions from:6 | | | | | | | | | | | | | | | | | | | | | | | | |
Net investment income | | | (0.04 | ) | | | (0.15 | ) | | | (0.07 | ) | | | (0.03 | ) | | | — | | | | — | |
Net realized gain | | | — | | | | — | | | | — | | | | — | | | | (1.98 | ) | | | (6.76 | ) |
| | | | |
Total dividends and distributions | | | (0.04 | ) | | | (0.15 | ) | | | (0.07 | ) | | | (0.03 | ) | | | (1.98 | ) | | | (6.76 | ) |
| | | | |
Net asset value, end of period | | $ | 18.61 | | | $ | 17.60 | | | $ | 19.81 | | | $ | 16.45 | | | $ | 9.85 | | | $ | 21.80 | |
| | | | |
| | | | | | | | | | | | | | | | | | | | | | | | |
| Total Investment Return3 | | | | | | | | | | | | | | | | | |
Based on net asset value | | | 6.02% | | | | (10.48)% | | | | 20.93% | | | | 67.59% | | | | (48.18)% | 4 | | | 3.49% | |
| | | | |
| | | | | | | | | | | | | | | | | | | | | | | | |
| Ratios to Average Net Assets | | | | | | | | | | | | | | | | | |
Total expenses | | | 1.67% | | | | 1.59% | | | | 1.65% | | | | 1.83% | | | | 1.87% | 5 | | | 1.68% | |
| | | | |
Total expenses after fees waived | | | 1.67% | | | | 1.59% | | | | 1.65% | | | | 1.83% | | | | 1.85% | 5 | | | 1.65% | |
| | | | |
Net investment income | | | 1.24% | | | | 0.93% | | | | 0.43% | | | | 0.80% | | | | 0.98% | 5 | | | 0.16% | |
| | | | |
| | | | | | | | | | | | | | | | | | | | | | | | |
| Supplemental Data | | | | | | | | | | | | | | | | | |
Net assets, end of period (000) | | $ | 174,637 | | | $ | 155,017 | | | $ | 144,976 | | | $ | 111,850 | | | $ | 67,614 | | | $ | 145,781 | |
| | | | |
Portfolio turnover | | | 155% | | | | 138% | | | | 135% | | | | 191% | | | | 76% | | | | 163% | |
| | | | |
| 1 | | Based on average shares outstanding. |
| 2 | | Includes a redemption fee, which is less than $0.01 per share. |
| 3 | | Where applicable, total investment returns exclude the effects of any sales charges and include the reinvestment of dividends and distributions. |
| 4 | | Aggregate total investment return. |
| 6 | | Dividends and distributions are determined in accordance with federal income tax regulations. |
| | | | | | |
| See Notes to Financial Statements. | | | | |
| | | | | | | |
| 22 | | ANNUAL REPORT | | OCTOBER 31, 2012 | | |
| | |
| Financial Highlights (continued) | | BlackRock Emerging Markets Fund, Inc. |
| | | | | | | | | | | | | | | | | | | | | | | | |
| | | Investor B | |
| | | Year Ended October 31, | | | Period
July 1, 2008
to October 31,
2008 | | | Year Ended
June 30, 2008 | |
| | 2012 | | | 2011 | | | 2010 | | | 2009 | | | |
| | | | | | | | | | | | | | | | | | | | | | | | |
| Per Share Operating Performance | | | | | | | | | | | | | | | | | |
Net asset value, beginning of period | | $ | 15.71 | | | $ | 17.70 | | | $ | 14.76 | | | $ | 8.89 | | | $ | 19.86 | | | $ | 25.20 | |
| | | | |
Net investment income (loss)1 | | | 0.04 | | | | (0.00 | )2 | | | (0.07 | ) | | | (0.01 | ) | | | 0.01 | | | | (0.14 | ) |
Net realized and unrealized gain (loss) | | | 0.74 | | | | (1.99 | )3 | | | 3.01 | 3 | | | 5.88 | 3 | | | (8.98 | )3 | | | 1.18 | 3 |
| | | | |
Net increase (decrease) from investment operations | | | 0.78 | | | | (1.99 | ) | | | 2.94 | | | | 5.87 | | | | (8.97 | ) | | | 1.04 | |
| | | | |
Dividends and distributions from net realized gain7 | | | — | | | | — | | | | — | | | | — | | | | (2.00 | ) | | | (6.38 | ) |
| | | | |
Total dividends and distributions | | | — | | | | — | | | | — | | | | — | | | | (2.00 | ) | | | (6.38 | ) |
| | | | |
Net asset value, end of period | | $ | 16.49 | | | $ | 15.71 | | | $ | 17.70 | | | $ | 14.76 | | | $ | 8.89 | | | $ | 19.86 | |
| | | | |
| | | | | | | | | | | | | | | | | | | | | | | | |
| Total Investment Return4 | | | | | | | | | | | | | | | | | |
Based on net asset value | | | 4.96% | | | | (11.24)% | | | | 19.92% | | | | 66.03% | | | | (48.33)% | 5 | | | 2.70% | |
| | | | |
| | | | | | | | | | | | | | | | | | | | | | | | |
| Ratios to Average Net Assets | | | | | | | | | | | | | | | | | |
Total expenses | | | 2.66% | | | | 2.45% | | | | 2.49% | | | | 2.71% | | | | 2.71% | 6 | | | 2.47% | |
| | | | |
Total expenses after fees waived | | | 2.66% | | | | 2.45% | | | | 2.49% | | | | 2.71% | | | | 2.69% | 6 | | | 2.44% | |
| | | | |
Net investment income (loss) | | | 0.25% | | | | (0.02)% | | | | (0.45)% | | | | (0.08)% | | | | 0.13% | 6 | | | (0.60)% | |
| | | | |
| | | | | | | | | | | | | | | | | | | | | | | | |
| Supplemental Data | | | | | | | | | | | | | | | | | |
Net assets, end of period (000) | | $ | 2,251 | | | $ | 3,386 | | | $ | 4,677 | | | $ | 4,809 | | | $ | 3,487 | | | $ | 7,955 | |
| | | | |
Portfolio turnover | | | 155% | | | | 138% | | | | 135% | | | | 191% | | | | 76% | | | | 163% | |
| | | | |
| 1 | | Based on average shares outstanding. |
| 2 | | Amount is less than $(0.01) per share. |
| 3 | | Includes a redemption fee, which is less than $0.01 per share. |
| 4 | | Where applicable, total investment returns exclude the effects of any sales charges and include the reinvestment of dividends and distributions. |
| 5 | | Aggregate total investment return. |
| 7 | | Dividends and distributions are determined in accordance with federal income tax regulations. |
| | | | | | |
| See Notes to Financial Statements. | | | | |
| | | | | | | |
| | ANNUAL REPORT | | OCTOBER 31, 2012 | | 23 |
| | |
| Financial Highlights (concluded) | | BlackRock Emerging Markets Fund, Inc. |
| | | | | | | | | | | | | | | | | | | | | | | | |
| | | Investor C | |
| | | Year Ended October 31, | | | Period
July 1, 2008
to October 31,
2008 | | | Year Ended
June 30, 2008 | |
| | | 2012 | | | 2011 | | | 2010 | | | 2009 | | | |
| | | | | | | | | | | | | | | | | | | | | | | | |
| Per Share Operating Performance | | | | | | | | | | | | | | | | | |
Net asset value, beginning of period | | $ | 15.26 | | | $ | 17.23 | | | $ | 14.38 | | | $ | 8.65 | | | $ | 19.42 | | | $ | 24.91 | |
| | | | |
Net investment income (loss)1 | | | 0.06 | | | | 0.05 | | | | (0.06 | ) | | | (0.01 | ) | | | 0.01 | | | | (0.14 | ) |
Net realized and unrealized gain (loss) | | | 0.71 | | | | (1.98 | )2 | | | 2.92 | 2 | | | 5.74 | 2 | | | (8.89 | )2 | | | 1.18 | 2 |
| | | | |
Net increase (decrease) from investment operations | | | 0.77 | | | | (1.93 | ) | | | 2.86 | | | | 5.73 | | | | (8.88 | ) | | | 1.04 | |
| | | | |
| Dividends and distributions from:6 | | | | | | | | | | | | | | | | | | | | | | | | |
Net investment income | | | (0.01 | ) | | | (0.04 | ) | | | (0.01 | ) | | | — | | | | — | | | | — | |
Net realized gain | | | — | | | | — | | | | — | | | | — | | | | (1.89 | ) | | | (6.53 | ) |
| | | | |
Total dividends and distributions | | | (0.01 | ) | | | (0.04 | ) | | | (0.01 | ) | | | — | | | | (1.89 | ) | | | (6.53 | ) |
| | | | |
Net asset value, end of period | | $ | 16.02 | | | $ | 15.26 | | | $ | 17.23 | | | $ | 14.38 | | | $ | 8.65 | | | $ | 19.42 | |
| | | | |
| | | | | | | | | | | | | | | | | | | | | | | | |
| Total Investment Return3 | | | | | | | | | | | | | | | | | |
Based on net asset value | | | 5.07% | | | | (11.21)% | | | | 19.90% | | | | 66.24% | | | | (48.35)% | 4 | | | 2.70% | |
| | | | |
| | | | | | | | | | | | | | | | | | | | | | | | |
| Ratios to Average Net Assets | | | | | | | | | | | | | | | | | |
Total expenses | | | 2.56% | | | | 2.37% | | | | 2.49% | | | | 2.66% | | | | 2.69% | 5 | | | 2.45% | |
| | | | |
Total expenses after fees waived | | | 2.56% | | | | 2.37% | | | | 2.49% | | | | 2.66% | | | | 2.67% | 5 | | | 2.42% | |
| | | | |
Net investment income (loss) | | | 0.38% | | | | 0.30% | | | | (0.38)% | | | | (0.08)% | | | | 0.15% | 5 | | | (0.61)% | |
| | | | |
| | | | | | | | | | | | | | | | | | | | | | | | |
| Supplemental Data | | | | | | | | | | | | | | | | | |
Net assets, end of period (000) | | $ | 102,559 | | | $ | 87,455 | | | $ | 38,711 | | | $ | 26,347 | | | $ | 13,572 | | | $ | 31,948 | |
| | | | |
Portfolio turnover | | | 155% | | | | 138% | | | | 135% | | | | 191% | | | | 76% | | | | 163% | |
| | | | |
| 1 | | Based on average shares outstanding. |
| 2 | | Includes a redemption fee, which is less than $0.01 per share. |
| 3 | | Where applicable, total investment returns exclude the effects of any sales charges and include the reinvestment of dividends and distributions. |
| 4 | | Aggregate total investment return. |
| 6 | | Dividends and distributions are determined in accordance with federal income tax regulations. |
| | | | | | |
| See Notes to Financial Statements. | | | | |
| | | | | | | |
| 24 | | ANNUAL REPORT | | OCTOBER 31, 2012 | | |
| | |
| Financial Highlights | | BlackRock Latin America Fund, Inc. |
| | | | | | | | | | | | | | | | | | | | | | | | |
| | | Institutional | |
| | | Year Ended October 31, | | | Period December 1,
2007 to October 31, 20081 | | | Year Ended November 30,
20071 | |
| | 2012 | | | 2011 | | | 2010 | | | 20091 | | | |
| | | | | | | | | | | | | | | | | | | | | | | | |
| Per Share Operating Performance | | | | | | | | | | | | | | | | | |
Net asset value, beginning of period | | $ | 62.80 | | | $ | 75.35 | | | $ | 58.63 | | | $ | 30.53 | | | $ | 78.57 | | | $ | 50.67 | |
| | | | |
Net investment income2 | | | 0.94 | | | | 1.31 | | | | 0.85 | | | | 0.64 | | | | 0.61 | | | | 0.50 | |
Net realized and unrealized gain (loss) | | | (4.38 | ) | | | (12.58 | ) | | | 16.82 | | | | 27.45 | | | | (36.41 | ) | | | 28.10 | |
| | | | |
Net increase (decrease) from investment operations | | | (3.44 | ) | | | (11.27 | ) | | | 17.67 | | | | 28.09 | | | | (35.80 | ) | | | 28.60 | |
| | | | |
| Dividends and distributions from:7 | | | | | | | | | | | | | | | | | | | | | | | | |
Net investment income | | | (0.54 | ) | | | (1.28 | ) | | | (0.97 | ) | | | — | | | | (0.80 | ) | | | (0.72 | ) |
Net realized gain | | | — | | | | — | | | | — | | | | — | | | | (11.47 | ) | | | — | |
| | | | |
Total dividends and distributions | | | (0.54 | ) | | | (1.28 | ) | | | (0.97 | ) | | | — | | | | (12.27 | ) | | | (0.72 | ) |
| | | | |
Redemption fee | | | — | | | | — | | | | 0.02 | | | | 0.01 | | | | 0.03 | | | | 0.02 | |
| | | | |
Net asset value, end of period | | $ | 58.82 | | | $ | 62.80 | | | $ | 75.35 | | | $ | 58.63 | | | $ | 30.53 | | | $ | 78.57 | |
| | | | |
| | | | | | | | | | | | | | | | | | | | | | | | |
| Total Investment Return3 | | | | | | | | | | | | | | | | | |
Based on net asset value | | | (5.43)% | | | | (15.18)% | | | | 30.52% | | | | 92.04% | | | | (53.70)% | 4 | | | 57.20% | 5 |
| | | | |
| | | | | | | | | | | | | | | | | | | | | | | | |
| Ratios to Average Net Assets | | | | | | | | | | | | | | | | | |
Total expenses | | | 1.32% | | | | 1.26% | | | | 1.25% | | | | 1.35% | | | | 1.30% | 6 | | | 1.26% | |
| | | | |
Total expenses after fees waived | | | 1.32% | | | | 1.26% | | | | 1.25% | | | | 1.35% | | | | 1.30% | 6 | | | 1.26% | |
| | | | |
Net investment income | | | 1.55% | | | | 1.89% | | | | 1.31% | | | | 1.60% | | | | 1.04% | 6 | | | 0.87% | |
| | | | |
| | | | | | | | | | | | | | | | | | | | | | | | |
| Supplemental Data | | | | | | | | | | | | | | | | | |
Net assets, end of period (000) | | $ | 125,473 | | | $ | 175,554 | | | $ | 200,980 | | | $ | 114,101 | | | $ | 58,877 | | | $ | 128,094 | |
| | | | |
Portfolio turnover | | | 50% | | | | 33% | | | | 64% | | | | 50% | | | | 61% | | | | 72% | |
| | | | |
| 1 | | Consolidated Financial Highlights. See Note 1 to the Notes to Financial Statements. |
| 2 | | Based on average shares outstanding. |
| 3 | | Where applicable, total investment returns include the reinvestment of dividends and distributions. |
| 4 | | Aggregate total investment return. |
| 5 | | The investment advisor reimbursed the Fund in order to resolve a regulatory issue relating to an investment, which increased the return by 0.02%. |
| 7 | | Dividends and distributions are determined in accordance with federal income tax regulations. |
| | | | | | |
| See Notes to Financial Statements. | | | | |
| | | | | | | |
| | ANNUAL REPORT | | OCTOBER 31, 2012 | | 25 |
| | |
| Financial Highlights (continued) | | BlackRock Latin America Fund, Inc. |
| | | | | | | | | | | | | | | | | | | | | | | | |
| | | Investor A | |
| | | Year Ended October 31, | | | Period December 1, 2007 to October 31, 20081 | | | Year Ended November 30, 20071 | |
| | 2012 | | | 2011 | | | 2010 | | | 20091 | | | |
| | | | | | | | | | | | | | | | | | | | | | | | |
| Per Share Operating Performance | | | | | | | | | | | | | | | | | |
Net asset value, beginning of period | | $ | 61.67 | | | $ | 74.07 | | | $ | 57.73 | | | $ | 30.15 | | | $ | 77.78 | | | $ | 50.17 | |
| | | | |
Net investment income2 | | | 0.78 | | | | 1.08 | | | | 0.65 | | | | 0.51 | | | | 0.44 | | | | 0.60 | |
Net realized and unrealized gain (loss) | | | (4.25 | ) | | | (12.37 | ) | | | 16.54 | | | | 27.06 | | | | (35.97 | ) | | | 27.60 | |
| | | | |
Net increase (decrease) from investment operations | | | (3.47 | ) | | | (11.29 | ) | | | 17.19 | | | | 27.57 | | | | (35.53 | ) | | | 28.20 | |
| | | | |
| Dividends and distributions from:7 | | | | | | | | | | | | | | | | | | | | | | | | |
Net investment income | | | (0.30 | ) | | | (1.11 | ) | | | (0.88 | ) | | | — | | | | (0.66 | ) | | | (0.61 | ) |
Net realized gain | | | — | | | | — | | | | — | | | | — | | | | (11.47 | ) | | | — | |
| | | | |
Total dividends and distributions | | | (0.30 | ) | | | (1.11 | ) | | | (0.88 | ) | | | — | | | | (12.13 | ) | | | (0.61 | ) |
| | | | |
Redemption fee | | | — | | | | — | | | | 0.03 | | | | 0.01 | | | | 0.03 | | | | 0.02 | |
| | | | |
Net asset value, end of period | | $ | 57.90 | | | $ | 61.67 | | | $ | 74.07 | | | $ | 57.73 | | | $ | 30.15 | | | $ | 77.78 | |
| | | | |
| | | | | | | | | | | | | | | | | | | | | | | | |
| Total Investment Return3 | | | | | | | | | | | | | | | | | |
Based on net asset value | | | (5.60)% | | | | (15.44)% | | | | 30.15% | | | | 91.48% | | | | (53.82)% | 4 | | | 56.85% | 5 |
| | | | |
| | | | | | | | | | | | | | | | | | | | | | | | |
| Ratios to Average Net Assets | | | | | | | | | | | | | | | | | |
Total expenses | | | 1.53% | | | | 1.55% | | | | 1.53% | | | | 1.63% | | | | 1.55%6 | | | | 1.51% | |
| | | | |
Total expenses after fees waived | | | 1.53% | | | | 1.55% | | | | 1.53% | | | | 1.63% | | | | 1.55%6 | | | | 1.51% | |
| | | | |
Net investment income | | | 1.32% | | | | 1.57% | | | | 1.00% | | | | 1.26% | | | | 0.76%6 | | | | 0.92% | |
| | | | |
| | | | | | | | | | | | | | | | | | | | | | | | |
| Supplemental Data | | | | | | | | | | | | | | | | | |
Net assets, end of period (000) | | $ | 315,531 | | | $ | 405,903 | | | $ | 616,664 | | | $ | 475,611 | | | $ | 176,711 | | | $ | 433,844 | |
| | | | |
Portfolio turnover | | | 50% | | | | 33% | | | | 64% | | | | 50% | | | | 61% | | | | 72% | |
| | | | |
| 1 | | Consolidated Financial Highlights. See Note 1 to the Notes to Financial Statements. |
| 2 | | Based on average shares outstanding. |
| 3 | | Where applicable, total investment returns exclude the effects of any sales charges and include the reinvestment of dividends and distributions. |
| 4 | | Aggregate total investment return. |
| 5 | | The investment advisor reimbursed the Fund in order to resolve a regulatory issue relating to an investment, which increased the return by 0.02%. |
| 7 | | Dividends and distributions are determined in accordance with federal income tax regulations. |
| | | | | | |
| See Notes to Financial Statements. | | | | |
| | | | | | | |
| 26 | | ANNUAL REPORT | | OCTOBER 31, 2012 | | |
| | |
| Financial Highlights (continued) | | BlackRock Latin America Fund, Inc. |
| | | | | | | | | | | | | | | | | | | | | | | | |
| | | Investor B | |
| | | Year Ended October 31, | | | Period December 1,
2007
to October 31, 20081 | | | Year Ended November 30, 20071 | |
| | 2012 | | | 2011 | | | 2010 | | | 20091 | | | |
| | | | | | | | | | | | | | | | | | | | | | | | |
| Per Share Operating Performance | |
Net asset value, beginning of period | | $ | 57.68 | | | $ | 69.31 | | | $ | 54.12 | | | $ | 28.54 | | | $ | 74.38 | | | $ | 48.00 | |
| | | | | | | | | | | | | | | | | | | | | | | | |
Net investment income (loss)2 | | | 0.24 | | | | 0.46 | | | | 0.12 | | | | 0.15 | | | | (0.04 | ) | | | 0.05 | |
Net realized and unrealized gain (loss) | | | (3.96 | ) | | | (11.59 | ) | | | 15.50 | | | | 25.42 | | | | (34.09 | ) | | | 26.52 | |
| | | | | | | | | | | | | | | | | | | | | | | | |
Net increase (decrease) from investment operations | | | (3.72 | ) | | | (11.13 | ) | | | 15.62 | | | | 25.57 | | | | (34.13 | ) | | | 26.57 | |
| | | | | | | | | | | | | | | | | | | | | | | | |
Dividends and distributions from:7 | | | | | | | | | | | | | | | | | | | | | | | | |
Net investment income | | | — | | | | (0.50 | ) | | | (0.45 | ) | | | — | | | | (0.27 | ) | | | (0.21 | ) |
Net realized gain | | | — | | | | — | | | | — | | | | — | | | | (11.47 | ) | | | — | |
| | | | | | | | | | | | | | | | | | | | | | | | |
Total dividends and distributions | | | — | | | | (0.50 | ) | | | (0.45 | ) | | | — | | | | (11.74 | ) | | | (0.21 | ) |
| | | | | | | | | | | | | | | | | | | | | | | | |
Redemption fee | | | — | | | | — | | | | 0.02 | | | | 0.01 | | | | 0.03 | | | | 0.02 | |
| | | | | | | | | | | | | | | | | | | | | | | | |
Net asset value, end of period | | $ | 53.96 | | | $ | 57.68 | | | $ | 69.31 | | | $ | 54.12 | | | $ | 28.54 | | | $ | 74.38 | |
| | | | | | | | | | | | | | | | | | | | | | | | |
| | | | | | | | | | | | | | | | | | | | | | | | |
| Total Investment Return3 | | | | | | | | | | | | | | | | | | | | | | | | |
Based on net asset value | | | (6.45)% | | | | (16.16)% | | | | 29.06% | | | | 89.63% | | | | (54.18)% | 4 | | | 55.61% | 5 |
| | | | | | | | | | | | | | | | | | | | | | | | |
| | | | | | | | | | | | | | | | | | | | | | | | |
| Ratios to Average Net Assets | | | | | | | | | | | | | | | | | | | | | | | | |
Total expenses | | | 2.41% | | | | 2.40% | | | | 2.37% | | | | 2.62% | | | | 2.39% | 6 | | | 2.32% | |
| | | | | | | | | | | | | | | | | | | | | | | | |
Total expenses after fees waived | | | 2.41% | | | | 2.40% | | | | 2.37% | | | | 2.62% | | | | 2.39% | 6 | | | 2.32% | |
| | | | | | | | | | | | | | | | | | | | | | | | |
Net investment income (loss) | | | 0.43% | | | | 0.71% | | | | 0.21% | | | | 0.40% | | | | (0.08)% | 6 | | | 0.09% | |
| | | | | | | | | | | | | | | | | | | | | | | | |
| | | | | | | | | | | | | | | | | | | | | | | | |
| Supplemental Data | | | | | | | | | | | | | | | | | | | | | | | | |
Net assets, end of period (000) | | $ | 7,989 | | | $ | 11,886 | | | $ | 18,660 | | | $ | 18,695 | | | $ | 11,794 | | | $ | 31,268 | |
| | | | | | | | | | | | | | | | | | | | | | | | |
Portfolio turnover | | | 50% | | | | 33% | | | | 64% | | | | 50% | | | | 61% | | | | 72% | |
| | | | | | | | | | | | | | | | | | | | | | | | |
| | 1 | | Consolidated Financial Highlights. See Note 1 to the Notes to Financial Statements. |
| | 2 | | Based on average shares outstanding. |
| | 3 | | Where applicable, total investment returns exclude the effects of any sales charges and include the reinvestment of dividends and distributions. |
| | 4 | | Aggregate total investment return. |
| | 5 | | The investment advisor reimbursed the Fund in order to resolve a regulatory issue relating to an investment, which increased the return by 0.02%. |
| 7 | | Dividends and distributions are determined in accordance with federal income tax regulations. |
| | | | | | |
| See Notes to Financial Statements. | | | | |
| | | | | | | |
| | ANNUAL REPORT | | OCTOBER 31, 2012 | | 27 |
| | |
| Financial Highlights (concluded) | | BlackRock Latin America Fund, Inc. |
| | | | | | | | | | | | | | | | | | | | | | | | |
| | | Investor C | |
| | | Year Ended October 31, | | | Period December 1,
2007 to October 31, 20081 | | | Year Ended November 30, 20071 | |
| | 2012 | | | 2011 | | | 2010 | | | 20091 | | | |
| | | | | | | | | | | | | | | | | | | | | | | | |
| Per Share Operating Performance | |
Net asset value, beginning of period | | $ | 56.39 | | | $ | 67.92 | | | $ | 53.17 | | | $ | 28.01 | | | $ | 73.28 | | | $ | 47.40 | |
| | | | | | | | | | | | | | | | | | | | | | | | |
Net investment income (loss)2 | | | 0.27 | | | | 0.51 | | | | 0.14 | | | | 0.17 | | | | (0.01 | ) | | | 0.11 | |
Net realized and unrealized gain (loss) | | | (3.87 | ) | | | (11.35 | ) | | | 15.21 | | | | 24.98 | | | | (33.46 | ) | | | 26.08 | |
| | | | | | | | | | | | | | | | | | | | | | | | |
Net increase (decrease) from investment operations | | | (3.60 | ) | | | (10.84 | ) | | | 15.35 | | | | 25.15 | | | | (33.47 | ) | | | 26.19 | |
| | | | | | | | | | | | | | | | | | | | | | | | |
Dividends and distributions from:7 | | | | | | | | | | | | | | | | | | | | | | | | |
Net investment income | | | — | | | | (0.69 | ) | | | (0.62 | ) | | | — | | | | (0.36 | ) | | | (0.33 | ) |
Net realized gain | | | — | | | | — | | | | — | | | | — | | | | (11.47 | ) | | | — | |
| | | | | | | | | | | | | | | | | | | | | | | | |
Total dividends and distributions | | | — | | | | (0.69 | ) | | | (0.62 | ) | | | — | | | | (11.83 | ) | | | (0.33 | ) |
| | | | | | | | | | | | | | | | | | | | | | | | |
Redemption fee | | | — | | | | — | | | | 0.02 | | | | 0.01 | | | | 0.03 | | | | 0.02 | |
| | | | | | | | | | | | | | | | | | | | | | | | |
Net asset value, end of period | | $ | 52.79 | | | $ | 56.39 | | | $ | 67.92 | | | $ | 53.17 | | | $ | 28.01 | | | $ | 73.28 | |
| | | | | | | | | | | | | | | | | | | | | | | | |
| | | | | | | | | | | | | | | | | | | | | | | | |
| Total Investment Return3 | | | | | | | | | | | | | | | | | | | | | | | | |
Based on net asset value | | | (6.38)% | | | | (16.10)% | | | | 29.15% | | | | 89.82% | | | | (54.16)%4 | | | | 55.62% | 5 |
| | | | | | | | | | | | | | | | | | | | | | | | |
| | | | | | | | | | | | | | | | | | | | | | | | |
| Ratios to Average Net Assets | | | | | | | | | | | | | | | | | | | | | | | | |
Total expenses | | | 2.35% | | | | 2.33% | | | | 2.32% | | | | 2.49% | | | | 2.35%6 | | | | 2.29% | |
| | | | | | | | | | | | | | | | | | | | | | | | |
Total expenses after fees waived | | | 2.35% | | | | 2.33% | | | | 2.32% | | | | 2.49% | | | | 2.35%6 | | | | 2.29% | |
| | | | | | | | | | | | | | | | | | | | | | | | |
Net investment income (loss) | | | 0.49% | | | | 0.80% | | | | 0.24% | | | | 0.46% | | | | (0.02)%6 | | | | 0.17% | |
| | | | | | | | | | | | | | | | | | | | | | | | |
| | | | | | | | | | | | | | | | | | | | | | | | |
| Supplemental Data | | | | | | | | | | | | | | | | | | | | | | | | |
Net assets, end of period (000) | | $ | 111,344 | | | $ | 160,612 | | | $ | 217,750 | | | $ | 151,046 | | | $ | 72,714 | | | $ | 164,742 | |
| | | | | | | | | | | | | | | | | | | | | | | | |
Portfolio turnover | | | 50% | | | | 33% | | | | 64% | | | | 50% | | | | 61% | | | | 72% | |
| | | | | | | | | | | | | | | | | | | | | | | | |
| | 1 | | Consolidated Financial Highlights. See Note 1 to the Notes to Financial Statements. |
| | 2 | | Based on average shares outstanding. |
| | 3 | | Where applicable, total investment returns exclude the effects of any sales charges and include the reinvestment of dividends and distributions. |
| | 4 | | Aggregate total investment return. |
| | 5 | | The investment advisor reimbursed the Fund in order to resolve a regulatory issue relating to an investment, which increased the return by 0.02%. |
| 7 | | Dividends and distributions are determined in accordance with federal income tax regulations. |
| | | | | | |
| See Notes to Financial Statements. | | | | |
| | | | | | | |
| 28 | | ANNUAL REPORT | | OCTOBER 31, 2012 | | |
| | |
| Financial Highlights | | BlackRock International Fund |
| | | | | | | | | | | | | | | | | | | | | | | | |
| | | Institutional | |
| | | Year Ended October 31, | | | Period
June 1, 2008
to October 31,
2008 | | | Year Ended
May 31, 2008 | |
| | | 2012 | | | 2011 | | | 2010 | | | 2009 | | | |
| | | | | | | | | | | | | | | | | | | | | | | | |
| Per Share Operating Performance | | | | | | | | | | | | | | | | | | | | | | | | |
Net asset value, beginning of period | | $ | 12.18 | | | $ | 12.86 | | | $ | 10.91 | | | $ | 8.20 | | | $ | 15.01 | | | $ | 14.18 | |
| | | | | | | | | | | | | | | | | | | | | | | | |
Net investment income (loss)1 | | | 0.16 | | | | 0.02 | | | | (0.01 | ) | | | 0.09 | | | | 0.04 | �� | | | 0.19 | |
Net realized and unrealized gain (loss) | | | 0.03 | | | | (0.70 | )2 | | | 1.96 | 2 | | | 2.62 | 2 | | | (6.68 | )2 | | | 0.73 | 2 |
| | | | | | | | | | | | | | | | | | | | | | | | |
Net increase (decrease) from investment operations | | | 0.19 | | | | (0.68 | ) | | | 1.95 | | | | 2.71 | | | | (6.64 | ) | | | 0.92 | |
| | | | | | | | | | | | | | | | | | | | | | | | |
Dividends from net investment income8 | | | (0.07 | ) | | | — | | | | — | | | | — | | | | (0.17 | ) | | | (0.09 | ) |
| | | | | | | | | | | | | | | | | | | | | | | | |
Net asset value, end of period | | $ | 12.30 | | | $ | 12.18 | | | $ | 12.86 | | | $ | 10.91 | | | $ | 8.20 | | | $ | 15.01 | |
| | | | | | | | | | | | | | | | | | | | | | | | |
| | | | | | | | | | | | | | | | | | | | | | | | |
| Total Investment Return3 | | | | | | | | | | | | | | | | | | | | | | | | |
Based on net asset value | | | 1.63% | | | | (5.29)% | | | | 17.87% | | | | 33.05% | | | | (44.63)% | 4 | | | 6.58% | |
| | | | | | | | | | | | | | | | | | | | | | | | |
| | | | | | | | | | | | | | | | | | | | | | | | |
| Ratios to Average Net Assets5 | | | | | | | | | | | | | | | | | | | | | | | | |
Total expenses | | | 1.31% | 6 | | | 1.30% | 6 | | | 1.77% | | | | 2.03% | | | | 1.70% | 7 | | | 1.54% | |
| | | | | | | | | | | | | | | | | | | | | | | | |
Total expenses after fees waived | | | 1.00% | 6 | | | 1.06% | 6 | | | 1.77% | | | | 2.03% | | | | 1.70% | 7 | | | 1.54% | |
| | | | | | | | | | | | | | | | | | | | | | | | |
Net investment income (loss) | | | 1.29% | 6 | | | 0.19% | 6 | | | (0.13)% | | | | 0.99% | | | | 0.75% | 7 | | | 1.32% | |
| | | | | | | | | | | | | | | | | | | | | | | | |
| | | | | | | | | | | | | | | | | | | | | | | | |
| Supplemental Data | | | | | | | | | | | | | | | | | | | | | | | | |
Net assets, end of period (000) | | $ | 313,764 | | | $ | 416,002 | | | $ | 2,645 | | | $ | 5,133 | | | $ | 5,161 | | | $ | 10,904 | |
| | | | | | | | | | | | | | | | | | | | | | | | |
Portfolio turnover of the Portfolio | | | 117% | | | | 156% | | | | 154% | | | | 178% | | | | 78% | | | | 153% | |
| | | | | | | | | | | | | | | | | | | | | | | | |
| | 1 | | Based on average shares outstanding. |
| | 2 | | Includes a redemption fee, which is less than $0.01 per share. |
| | 3 | | Where applicable, total investment returns include the reinvestment of dividends and distributions. |
| | 4 | | Aggregate total investment return. |
| | 5 | | Includes the Fund’s share of the Portfolio’s allocated expenses and/or net investment income. |
| | 6 | | Includes the Fund’s share of the Portfolio’s allocated fees waived of less than 0.01%. |
| | 8 | | Dividends are determined in accordance with federal income tax regulations. |
| | | | | | |
| See Notes to Financial Statements. | | | | |
| | | | | | | |
| | ANNUAL REPORT | | OCTOBER 31, 2012 | | 29 |
| | |
| Financial Highlights (continued) | | BlackRock International Fund |
| | | | | | | | | | | | | | | | | | | | | | | | |
| | | Investor A | |
| | | Year Ended October 31, | | | Period
June 1, 2008
to October 31,
2008 | | | Year Ended
May 31, 2008 | |
| | | 2012 | | | 2011 | | | 2010 | | | 2009 | | | |
| | | | | | | | | | | | | | | | | | | | | | | | |
| Per Share Operating Performance | | | | | | | | | | | | | | | | | | | | | | | | |
Net asset value, beginning of period | | $ | 11.94 | | | $ | 12.66 | | | $ | 10.76 | | | $ | 8.12 | | | $ | 14.85 | | | $ | 14.04 | |
| | | | | | | | | | | | | | | | | | | | | | | | |
Net investment income (loss)1 | | | 0.11 | | | | 0.00 | 2 | | | (0.06 | ) | | | 0.05 | | | | 0.02 | �� | | | 0.17 | |
Net realized and unrealized gain (loss) | | | 0.03 | | | | (0.72 | )3 | | | 1.96 | 3 | | | 2.59 | 3 | | | (6.62 | )3 | | | 0.70 | 3 |
| | | | | | | | | | | | | | | | | | | | | | | | |
Net increase (decrease) from investment operations | | | 0.14 | | | | (0.72 | ) | | | 1.90 | | | | 2.64 | | | | (6.60 | ) | | | 0.87 | |
| | | | | | | | | | | | | | | | | | | | | | | | |
Dividends from net investment income9 | | | (0.05 | ) | | | — | | | | — | | | | — | | | | (0.13 | ) | | | (0.06 | ) |
| | | | | | | | | | | | | | | | | | | | | | | | |
Net asset value, end of period | | $ | 12.03 | | | $ | 11.94 | | | $ | 12.66 | | | $ | 10.76 | | | $ | 8.12 | | | $ | 14.85 | |
| | | | | | | | | | | | | | | | | | | | | | | | |
| | | | | | | | | | | | | | | | | | | | | | | | |
| Total Investment Return4 | | | | | | | | | | | | | | | | | | | | | | | | |
Based on net asset value | | | 1.21% | | | | (5.69)% | | | | 17.66% | | | | 32.51% | | | | (44.72)% | 5 | | | 6.25% | |
| | | | | | | | | | | | | | | | | | | | | | | | |
| | | | | | | | | | | | | | | | | | | | | | | | |
| Ratios to Average Net Assets6 | | | | | | | | | | | | | | | | | | | | | | | | |
Total expenses | | | 1.64% | 7 | | | 1.80% | 7 | | | 2.08% | | | | 2.40% | | | | 2.02% | 8 | | | 1.84% | |
| | | | | | | | | | | | | | | | | | | | | | | | |
Total expenses after fees waived | | | 1.38% | 7 | | | 1.67% | 7 | | | 1.67% | | | | 2.40% | | | | 2.02% | 8 | | | 1.84% | |
| | | | | | | | | | | | | | | | | | | | | | | | |
Net investment income (loss) | | | 0.96% | 7 | | | 0.01% | 7 | | | (0.51)% | | | | 0.54% | | | | 0.50% | 8 | | | 1.18% | |
| | | | | | | | | | | | | | | | | | | | | | | | |
| | | | | | | | | | | | | | | | | | | | | | | | |
| Supplemental Data | | | | | | | | | | | | | | | | | | | | | | | | |
Net assets, end of period (000) | | $ | 221,365 | | | $ | 208,885 | | | $ | 37,035 | | | $ | 28,949 | | | $ | 22,537 | | | $ | 42,052 | |
| | | | | | | | | | | | | | | | | | | | | | | | |
Portfolio turnover of the Portfolio | | | 117% | | | | 156% | | | | 154% | | | | 178% | | | | 78% | | | | 153% | |
| | | | | | | | | | | | | | | | | | | | | | | | |
| | 1 | | Based on average shares outstanding. |
| | 2 | | Amount is less than $0.01 per share. |
| | 3 | | Includes a redemption fee, which is less than $0.01 per share. |
| | 4 | | Where applicable, total investment returns exclude the effects of any sales charges and include the reinvestment of dividends and distributions. |
| | 5 | | Aggregate total investment return. |
| | 6 | | Includes the Fund’s share of the Portfolio’s allocated expenses and/or net investment income. |
| | 7 | | Includes the Fund’s share of the Portfolio’s allocated fees waived of less than 0.01%. |
| | 9 | | Dividends are determined in accordance with federal income tax regulations. |
| | | | | | |
| See Notes to Financial Statements. | | | | |
| | | | | | | |
| 30 | | ANNUAL REPORT | | OCTOBER 31, 2012 | | |
| | |
| Financial Highlights (continued) | | BlackRock International Fund |
| | | | | | | | | | | | | | | | | | | | | | | | |
| | | Investor B | |
| | | Year Ended October 31, | | | Period
June 1, 2008
to October 31,
2008 | | | Year Ended
May 31,
2008 | |
| | | 2012 | | | 2011 | | | 2010 | | | 2009 | | | |
| | | | | | | | | | | | | | | | | | | | | | | | |
| Per Share Operating Performance | | | | | | | | | | | | | | | | | | | | | | | | |
Net asset value, beginning of period | | $ | 11.04 | | | $ | 11.84 | | | $ | 10.18 | | | $ | 7.77 | | | $ | 14.13 | | | $ | 13.44 | |
| | | | | | | | | | | | |
Net investment loss1 | | | (0.02 | ) | | | (0.12 | ) | | | (0.17 | ) | | | (0.04 | ) | | | (0.03 | ) | | | (0.01 | ) |
Net realized and unrealized gain (loss) | | | 0.03 | | | | (0.68 | )2 | | | 1.83 | 2 | | | 2.45 | 2 | | | (6.33 | )2 | | | 0.70 | 2 |
| | | | | | | | | | | | |
Net increase (decrease) from investment operations | | | 0.01 | | | | (0.80 | ) | | | 1.66 | | | | 2.41 | | | | (6.36 | ) | | | 0.69 | |
| | | | | | | | | | | | |
Net asset value, end of period | | $ | 11.05 | | | $ | 11.04 | | | $ | 11.84 | | | $ | 10.18 | | | $ | 7.77 | | | $ | 14.13 | |
| | | | | | | | | | | | |
| | | | | | | | | | | | | | | | | | | | | | | | |
| Total Investment Return3 | | | | | | | | | | | | | | | | | | | | | | | | |
Based on net asset value | | | 0.09% | | | | (6.76)% | | | | 16.31% | | | | 31.02% | | | | (45.01)% | 4 | | | 5.13% | |
| | | | | | | | | | | | |
| | | | | | | | | | | | | | | | | | | | | | | | |
| Ratios to Average Net Assets5 | | | | | | | | | | | | | | | | | | | | | | | | |
Total expenses | | | 2.93% | 6 | | | 3.08% | 6 | | | 3.21% | | | | 3.61% | | | | 3.17% | 7 | | | 2.90% | |
| | | | | | | | | | | | |
Total expenses after fees waived | | | 2.44% | 6 | | | 2.99% | 6 | | | 3.21% | | | | 3.61% | | | | 3.17% | 7 | | | 2.90% | |
| | | | | | | | | | | | |
Net investment loss | | | (0.16)% | 6 | | | (1.01)% | 6 | | | (1.65)% | | | | (0.54)% | | | | (0.70)% | 7 | | | (0.11)% | |
| | | | | | | | | | | | |
| | | | | | | | | | | | | | | | | | | | | | | | |
| Supplemental Data | | | | | | | | | | | | | | | | | | | | | | | | |
Net assets, end of period (000) | | $ | 11,609 | | | $ | 22,320 | | | $ | 11,898 | | | $ | 20,342 | | | $ | 20,878 | | | $ | 44,254 | |
| | | | | | | | | | | | |
Portfolio turnover of the Portfolio | | | 117% | | | | 156% | | | | 154% | | | | 178% | | | | 78% | | | | 153% | |
| | | | | | | | | | | | |
| | 1 | | Based on average shares outstanding. |
| | 2 | | Includes a redemption fee, which is less than $0.01 per share. |
| | 3 | | Where applicable, total investment returns exclude the effects of any sales charges and include the reinvestment of dividends and distributions. |
| | 4 | | Aggregate total investment return. |
| | 5 | | Includes the Fund’s share of the Portfolio’s allocated expenses and/or net investment income. |
| | 6 | | Includes the Fund’s share of the Portfolio’s allocated fees waived of less than 0.01%. |
| | | | | | |
| See Notes to Financial Statements. | | | | |
| | | | | | | |
| | ANNUAL REPORT | | OCTOBER 31, 2012 | | 31 |
| | |
| Financial Highlights (continued) | | BlackRock International Fund |
| | | | | | | | | | | | | | | | | | | | | | | | |
| | | Investor C | |
| | | Year Ended October 31, | | | Period
June 1, 2008
to October 31,
2008 | | | Year Ended
May 31,
2008 | |
| | | 2012 | | | 2011 | | | 2010 | | | 2009 | | | |
| | | | | | | | | | | | | | | | | | | | | | | | |
| Per Share Operating Performance | | | | | | | | | | | | | | | | | | | | | | | | |
Net asset value, beginning of period | | $ | 11.23 | | | $ | 12.00 | | | $ | 10.28 | | | $ | 7.81 | | | $ | 14.19 | | | $ | 13.45 | |
| | | | | | | | | | | | |
Net investment income (loss)1 | | | (0.01 | ) | | | (0.11 | ) | | | (0.13 | ) | | | (0.01 | ) | | | (0.01 | ) | | | 0.04 | |
Net realized and unrealized gain (loss) | | | 0.03 | | | | (0.66 | )2 | | | 1.85 | 2 | | | 2.48 | 2 | | | (6.35 | )2 | | | 0.70 | 2 |
| | | | | | | | | | | | |
Net increase (decrease) from investment operations | | | 0.02 | | | | (0.77 | ) | | | 1.72 | | | | 2.47 | | | | (6.36 | ) | | | 0.74 | |
| | | | | | | | | | | | |
Dividends from net investment income8 | | | (0.02 | ) | | | — | | | | — | | | | — | | | | (0.02 | ) | | | — | |
| | | | | | | | | | | | |
Net asset value, end of period | | $ | 11.23 | | | $ | 11.23 | | | $ | 12.00 | | | $ | 10.28 | | | $ | 7.81 | | | $ | 14.19 | |
| | | | | | | | | | | | |
| | | | | | | | | | | | | | | | | | | | | | | | |
| Total Investment Return3 | | | | | | | | | | | | | | | | | | | | | | | | |
Based on net asset value | | | 0.23% | | | | (6.42)% | | | | 16.73% | | | | 31.63% | | | | (44.87)%4 | | | | 5.50% | |
| | | | | | | | | | | | |
| | | | | | | | | | | | | | | | | | | | | | | | |
| Ratios to Average Net Assets5 | | | | | | | | | | | | | | | | | | | | | | | | |
Total expenses | | | 2.66% | 6 | | | 2.58% | 6 | | | 2.80% | | | | 3.09% | | | | 2.74% | 7 | | | 2.57% | |
| | | | | | | | | | | | |
Total expenses after fees waived | | | 2.41% | 6 | | | 2.53% | 6 | | | 2.80% | | | | 3.09% | | | | 2.74% | 7 | | | 2.57% | |
| | | | | | | | | | | | |
Net investment income (loss) | | | (0.09)% | 6 | | | (0.99)% | 6 | | | (1.23)% | | | | (0.07)% | | | | (0.25)% | 7 | | | 0.32% | |
| | | | | | | | | | | | |
| | | | | | | | | | | | | | | | | | | | | | | | |
| Supplemental Data | | | | | | | | | | | | | | | | | | | | | | | | |
Net assets, end of period (000) | | $ | 135,280 | | | $ | 151,594 | | | $ | 13,636 | | | $ | 12,470 | | | $ | 10,543 | | | $ | 20,892 | |
| | | | | | | | | | | | |
Portfolio turnover of the Portfolio | | | 117% | | | | 156% | | | | 154% | | | | 178% | | | | 78% | | | | 153% | |
| | | | | | | | | | | | |
| | 1 | | Based on average shares outstanding. |
| | 2 | | Includes a redemption fee, which is less than $0.01 per share. |
| | 3 | | Where applicable, total investment returns exclude the effects of any sales charges and include the reinvestment of dividends and distributions. |
| | 4 | | Aggregate total investment return. |
| | 5 | | Includes the Fund’s share of the Portfolio’s allocated expenses and/or net investment income. |
| | 6 | | Includes the Fund’s share of the Portfolio’s allocated fees waived of less than 0.01%. |
| | 8 | | Dividends are determined in accordance with federal income tax regulations. |
| | | | | | |
| See Notes to Financial Statements. | | | | |
| | | | | | | |
| 32 | | ANNUAL REPORT | | OCTOBER 31, 2012 | | |
| | |
| Financial Highlights (concluded) | | BlackRock International Fund |
| | | | | | | | |
| | | Class R | |
| | | Year Ended
October 31, 2012 | | | Period
August 15, 20111
to October 31,
2011 | |
| | | | | | | | |
| Per Share Operating Performance | |
Net asset value, beginning of period | | $ | 11.93 | | | $ | 12.11 | |
| | | | | | | | |
Net investment income (loss)2 | | | 0.07 | | | | (0.01 | ) |
Net realized and unrealized gain (loss) | | | 0.03 | | | | (0.17 | ) |
| | | | | | | | |
Net increase (decrease) from investment operations | | | 0.10 | | | | (0.18 | ) |
| | | | | | | | |
Dividends from net investment income8 | | | (0.05 | ) | | | — | |
| | | | | | | | |
Net asset value, end of period | | $ | 11.98 | | | $ | 11.93 | |
| | | | | | | | |
| | | | | | | | |
| Total Investment Return3 | | | | | | | | |
Based on net asset value | | | 0.90% | | | | (1.49)% | 4 |
| | | | | | | | |
| | | | | | | | |
| Ratios to Average Net Assets5 | | | | | | | | |
Total expenses | | | 1.92% | 6 | | | 1.91% | 6,7 |
| | | | | | | | |
Total expenses after fees waived | | | 1.70% | 6 | | | 1.71% | 6,7 |
| | | | | | | | |
Net investment income | | | 0.59% | 6 | | | (0.57)% | 6,7 |
| | | | | | | | |
| | | | | | | | |
| Supplemental Data | | | | | | | | |
Net assets, end of period (000) | | $ | 26,887 | | | $ | 32,968 | |
| | | | | | | | |
Portfolio turnover of the Portfolio | | | 117% | | | | 156% | |
| | | | | | | | |
| | 1 | | Commencement of operations. |
| | 2 | | Based on average shares outstanding. |
| | 3 | | Where applicable, total investment returns include the reinvestment of dividends and distributions. |
| | 4 | | Aggregate total investment return. |
| | 5 | | Includes the Fund’s share of the Portfolio’s allocated expenses and/or net investment income. |
| | 6 | | Includes the Fund’s share of the Portfolio’s allocated fees waived of less than 0.01%. |
| | 8 | | Dividends are determined in accordance with federal income tax regulations. |
| | | | | | |
| See Notes to Financial Statements. | | | | |
| | | | | | | |
| | ANNUAL REPORT | | OCTOBER 31, 2012 | | 33 |
| | |
| Notes to Financial Statements | | |
1. Organization and Significant Accounting Policies:
BlackRock Emerging Markets Fund, Inc. (formerly known as BlackRock Global Emerging Markets Fund, Inc.), (“Emerging Markets”), BlackRock Latin America Fund, Inc. (“Latin America”) and BlackRock International Fund (“International”), a series of BlackRock Series, Inc. (the “Corporation”) (collectively the “Funds” or individually a “Fund”), are registered under the Investment Company Act of 1940, as amended (the “1940 Act”), as open-end management investment companies. International is classified as a diversified. Emerging Markets and Latin America are classified as non-diversified. Emerging Markets, Latin America and the Corporation are each organized as a Maryland corporation. The Funds’ financial statements are prepared in conformity with accounting principles generally accepted in the United States of America (“US GAAP”), which may require management to make estimates and assumptions that affect the reported amounts of assets and liabilities in the financial statements and the reported amount of increases and decreases in net assets from operations during the reporting period. Actual results could differ from those estimates. Each Fund offers multiple classes of shares. Institutional Shares are sold without a sales charge and only to certain eligible investors. Investor A Shares are generally sold with a front-end sales charge. Investor B and Investor C Shares may be subject to a CDSC. Class R Shares are sold without a sales charge and only to certain retirement and other similar plans. All classes of shares have identical voting, dividend, liquidation and other rights and the same terms and conditions, except that Investor A, Investor B, Investor C and Class R Shares bear certain expenses related to the shareholder servicing of such shares, and Investor B, Investor C, and Class R Shares also bear certain expenses related to the distribution of such shares. Investor B Shares automatically convert to Investor A Shares after approximately eight years. Investor B Shares are only available through exchanges, dividend reinvestment by existing shareholders or for purchase by certain qualified employee benefit plans. Each class has exclusive voting rights with respect to matters relating to its shareholder servicing and distribution expenditures (except that Investor B shareholders may vote on material changes to the Investor A distribution and service plan).
International seeks to achieve its investment objective by investing all of its assets in BlackRock Master International Portfolio (the “Portfolio”), a series of BlackRock Master LLC (the “Master LLC”), which has the same investment objective and strategies as International. The value of the Fund’s investment in the Portfolio reflects International’s proportionate interest in the net assets of the Portfolio. The performance of International is directly affected by the performance of the Portfolio. The financial statements of the Portfolio, including the schedule of Investments, are included elsewhere in this report and should be read in conjunction with the Fund’s financial statements. The percentage of the Portfolio owned by the Fund at October 31, 2012 was 100%.
Reorganization: The Board of Directors (the “Board”) of International and the Board of Directors and shareholders of BlackRock International Value Fund of BlackRock International Value Trust (“International Value”) approved the reorganization of International Value into International pursuant to which International acquired substantially all of the assets and assumed certain stated liabilities of International Value in exchange for an equal aggregate value of International shares.
Each shareholder of International Value received shares of International with the same class designation and an aggregate net asset value of such shareholder’s International Value shares, as determined at the close of business on August 12, 2011. In connection with the reorganization, International issued newly created Class R shares.
On August 15, 2011, all of the portfolio securities held by International Value were subsequently contributed to the Portfolio in exchange for an investment in the Portfolio.
The reorganization was accomplished by a tax-free exchange of Shares of International in the following amounts and at the following conversion ratios:
| | | | | | | | | | | | |
| | | International
Value Shares Prior to
Reorganization | | | Conversion Ratio | | | Shares of International | |
Institutional | | | 19,299,569 | | | | 1.58306519 | | | | 30,552,476 | |
Investor A | | | 4,748,734 | | | | 1.61736207 | | | | 7,680,422 | |
Investor B | | | 883,023 | | | | 1.69710968 | | | | 1,498,587 | |
Investor C | | | 6,455,109 | | | | 1.63393522 | | | | 10,547,230 | |
Class R | | | 1,778,191 | | | | 1.58573234 | | | | 2,819,735 | |
International Value’s net assets and composition of net assets on August 12, 2011, the date of the reorganization, were as follows:
| | | | | | | | | | | | | | | | |
| Net Assets | | Paid-in Capital | | | Accumulated
Net Investment
Income | | | Accumulated
Net Realized Loss | | | Net Unrealized Depreciation | |
$641,256,387 | | $ | 918,350,609 | | | | — | | | $ | (207,150,757 | ) | | $ | (69,943,465 | ) |
For financial reporting purposes, assets received and shares issued by International were recorded at fair value; however, the cost basis of the investments received from International Value was carried forward to align ongoing reporting of International’s realized and unrealized gains and losses with amounts distributable to shareholders for tax purposes.
The aggregate net assets of International immediately after the acquisition amounted to $878,327,409. International Value’s fair value and cost of investments prior to the reorganization were $634,707,689 and $706,242,241, respectively.
The purpose of these transactions was to combine two funds managed by the Manager with the same or substantially similar (but not identical) investment objectives, investment policies, strategies, risks and restrictions. The reorganization was a tax-free event and was effective on August 15, 2011.
Assuming the acquisition had been completed on November 1, 2010, the beginning of the annual reporting period of International, the pro forma results of operations for the year ended October 31, 2011, are as follows:
| | Ÿ | | Net investment income: $14,419,881 |
| | Ÿ | | Net realized and change in unrealized gain/loss on investments: $(148,191,473) |
| | Ÿ | | Net increase/decrease in net assets resulting from operations: $(133,771,592) |
| | | | | | |
| | | | | | | |
| 34 | | ANNUAL REPORT | | OCTOBER 31, 2012 | | |
| | |
| Notes to Financial Statements (continued) | | |
Because the combined investment portfolios have been managed as a single integrated portfolio since the acquisition was completed, it is not practicable to separate the amounts of revenue and earnings of International Value that have been included in International’s Statement of Operations since August 15, 2011.
Reorganization costs incurred by International in connection with the reorganization were expensed by International.
The following is a summary of significant accounting policies followed by the Funds:
Valuation: US GAAP defines fair value as the price the Funds would receive to sell an asset or pay to transfer a liability in an orderly transaction between market participants at the measurement date. Emerging Markets and Latin America fair value their financial instruments at market value using independent dealers or pricing services under policies approved by the Board. The BlackRock Global Valuation Methodologies Committee (the “Global Valuation Committee”) is the committee formed by management to develop global pricing policies and procedures and to provide oversight of the pricing function for Emerging Markets and Latin America for all financial instruments.
International’s policy is to fair value its financial instruments at market value. International records its investments in the corresponding portfolio at fair value based on International’s proportionate interest in the net assets of the Portfolio. Valuation of securities held by the Portfolio is discussed in Note 1 of the Master LLC���s Notes to Financial Statements, which are included in this report.
Emerging Markets and Latin America equity investments traded on a recognized securities exchange or the NASDAQ Global Market System (“NASDAQ”) are valued at the last reported sale price that day or the NASDAQ official closing price, if applicable. For equity investments traded on more than one exchange, the last reported sale price on the exchange where the stock is primarily traded is used. Equity investments traded on a recognized exchange for which there were no sales on that day are valued at the last available bid (long positions) or ask (short positions) price. If no bid or ask price is available, the prior day’s price will be used, unless it is determined that such prior day’s price no longer reflects the fair value of the security.
Emerging Markets and Latin America value their investments in BlackRock Liquidity Series, LLC Money Market Series (the “Money Market Series”) at fair value, which is ordinarily based upon their pro rata ownership in the underlying fund’s net assets. The Money Market Series seeks current income consistent with maintaining liquidity and preserving capital. Although the Money Market Series is not registered under the 1940 Act, its investments will follow the parameters of investments by a money market fund that is subject to Rule 2a-7 under the 1940 Act. Emerging Markets and Latin America may withdraw up to 25% of its investment daily, although the manager of the Money Market Series, in its sole discretion, may permit an investor to withdraw more than 25% on any one day.
Securities and other assets and liabilities denominated in foreign currencies are translated into US dollars using exchange rates determined as of the close of business on the New York Stock Exchange (“NYSE”). Foreign currency exchange contracts are valued at the mean between the bid and
ask prices and are determined as of the close of business on the NYSE. Interpolated values are derived when the settlement date of the contract is an interim date for which quotations are not available.
In the event that application of these methods of valuation results in a price for an investment which is deemed not to be representative of the market value of such investment or if a price is not available, the investment will be valued by the Global Valuation Committee, or its delegate, in accordance with a policy approved by the Board as reflecting fair value (“Fair Value Assets”) for Emerging Markets and Latin America. When determining the price for Fair Value Assets, the Global Valuation Committee, or its delegate, seeks to determine the price that Emerging Markets and Latin America might reasonably expect to receive from the current sale of that asset in an arm’s-length transaction. Fair value determinations shall be based upon all available factors that the investment advisor and/or sub-advisor deems relevant consistent with the principles of fair value measurement which include the market approach, income approach and/or cost approach, as appropriate. A market approach generally consists of using comparable market transactions. The income approach generally is used to discount future cash flows to present value and adjusted for liquidity as appropriate. These factors include but are not limited to (i) attributes specific to the investment or asset; (ii) the principal market for the investment or asset; (iii) the customary participants in the principal market for the investment or asset; (iv) data assumptions by market participants for the investment or asset, if reasonably available; (v) quoted prices for similar investments or assets in active markets; and (vi) other factors, such as future cash flows, interest rates, yield curves, volatilities, prepayment speeds, loss severities, credit risks, recovery rates, liquidation amounts and/or default rates. Due to the inherent uncertainty of valuations of such investments, the fair values may differ from the values that would have been used had an active market existed. The Global Valuation Committee, or its delegate, employs various methods for calibrating valuation approaches for investments where an active market does not exist including regular due diligence of Emerging Markets and Latin America’s pricing vendors, a regular review of key inputs and assumptions, transactional back-testing or disposition analysis to compare unrealized gains and losses to realized gains and losses, reviews of missing or stale prices and large movements in market values and reviews of any market related activity. The pricing of all Fair Value Assets is subsequently reported to the Board or a committee thereof on a quarterly basis.
Generally, trading in foreign instruments is substantially completed each day at various times prior to the close of business on the NYSE. Occasionally, events affecting the values of such instruments may occur between the foreign market close and the close of business on the NYSE that may not be reflected in the computation of Emerging Markets and Latin America’s net assets. If events (for example, a company announcement, market volatility or a natural disaster) occur during such periods that are expected to affect the value of such instruments materially, those instruments may be Fair Value Assets and be valued at their fair value, as determined in good faith by the Global Valuation Committee using a pricing service and/or policies approved by the Board. Each business day, Emerging Markets and Latin America use a pricing service to assist with the valuation of certain foreign exchange-traded equity securities and foreign exchange-traded and OTC options (the “Systematic Fair Value
| | | | | | |
| | | | | | | |
| | ANNUAL REPORT | | OCTOBER 31, 2012 | | 35 |
| | |
| Notes to Financial Statements (continued) | | |
Price”). Using current market factors, the Systematic Fair Value Price is designed to value such foreign securities and foreign options at fair value as of the close of business on the NYSE, which follows the close of the local markets.
Foreign Currency: Emerging Markets and Latin America’s books and records are maintained in US dollars. Purchases and sales of investment securities are recorded at the rates of exchange prevailing on the respective date of such transactions. Generally, when the US dollar rises in value against a foreign currency, Emerging Markets and Latin America’s investments denominated in that currency will lose value because that currency is worth fewer US dollars; the opposite effect occurs if the US dollar falls in relative value.
Emerging Markets and Latin America do not isolate their portion of the results of operations arising as a result of changes in the foreign exchange rates from the changes in the market prices of investments held or sold for financial reporting purposes. Accordingly, the effects of changes in foreign currency exchange rates on investments are not segregated on the Statements of Operations from the effects of changes in market prices of those investments but are included as a component of net realized and unrealized gain (loss) from investments. Emerging Markets and Latin America report realized currency gains (losses) on foreign currency related transactions as components of net realized gain (loss) for financial reporting purposes, whereas such components are treated as ordinary income for federal income tax purposes.
Participation Notes: Emerging Markets and Latin America may invest in participation notes (“P-Notes”). P-Notes are promissory notes issued by banks or broker-dealers that are designed to offer the Funds a return measured by the change in the value of the underlying security or basket of securities (the “underlying security”) while not holding the actual shares of the underlying security. P-Notes are typically used to allow the Funds to gain exposure to securities traded in foreign markets that may be restricted due to country-specific regulations. When the P-Note matures, the issuer will pay to, or receive from, the Funds the difference between the value of the underlying security at the time of the purchase and the underlying security’s value at maturity of the P-Notes. Income received on P-Notes is recorded by the Funds as dividend income in the Statements of Operations. An investment in a P-Note involves additional risks beyond the risks normally associated with a direct investment in the underlying security. While the holder of a P-Note is entitled to receive from the bank or broker-dealer any dividends paid by the underlying security, the holder is not entitled to the same rights (e.g., voting rights) as a direct owner of the underlying security. P-Notes are considered general unsecured contractual obligations of the bank or broker-dealer. The Funds must rely on the creditworthiness of the issuer for their investment returns on the P-Notes and have no rights against the issuer of the underlying security. A P-Note may be more volatile and less liquid than other investments held by the Funds since the P-Note generally is dependent on the liquidity in the local trading market for the underlying security.
Segregation and Collateralization: In cases in which the 1940 Act and the interpretive positions of the Securities and Exchange Commission (“SEC”) require that Emerging Markets and Latin America either deliver collateral or segregate assets in connection with certain investments (e.g., foreign
currency exchange contracts), Emerging Markets and Latin America will, consistent with SEC rules and/or certain interpretive letters issued by the SEC, segregate collateral or designate on their books and records cash or liquid securities having a market value at least equal to the amount that would otherwise be required to be physically segregated. Furthermore, based on requirements and agreements with certain exchanges and third party broker-dealers, Emerging Markets and Latin America engaging in such transactions may have requirements to deliver/deposit securities to/with an exchange or broker-dealer as collateral for certain investments.
Investment Transactions and Investment Income: For financial reporting purposes, investment transactions are recorded on the dates the transactions are entered into (the trade dates). Realized gains and losses on investment transactions are determined on the identified cost basis. Dividend income is recorded on the ex-dividend dates. Dividends from foreign securities where the ex-dividend date may have passed are subsequently recorded when Emerging Markets and Latin America are informed of the ex-dividend date. Under the applicable foreign tax laws, a withholding tax at various rates may be imposed on capital gains, dividends and interest. Upon notification from issuers, some of the dividend income received from a real estate investment trust may be redesignated as a reduction of cost of the related investment and/or realized gain. Interest income, including amortization and accretion of premiums and discounts on debt securities, is recognized on the accrual basis. Income and realized and unrealized gains and losses are allocated daily to each class based on its relative net assets. Consent fees are compensation for agreeing to changes in the terms of debt instruments and are included in interest income in the Statements of Operations. For financial reporting purposes, contributions to and withdrawals from the Portfolio are accounted on a trade date basis. International records daily its proportionate share of the Portfolio’s income, expenses and realized and unrealized gains and losses. In addition, International accrues its own expenses. Income, expenses and realized and unrealized gains and losses are allocated daily to each class based on its relative net assets.
Dividends and Distributions: Dividends and distributions paid by the Funds are recorded on the ex-dividend dates. The portion of distributions that exceeds a Fund’s current and accumulated earnings and profits, which are measured on a tax basis, will constitute a nontaxable return of capital. Distributions in excess of a Fund’s taxable income and net capital gains, but not in excess of a Fund’s earnings and profits, will be taxable to shareholders as ordinary income and will not constitute a nontaxable return of capital. Capital losses carried forward from years beginning before 2011 do not reduce earnings and profits, even if such carried forward losses offset current year realized gains. The character and timing of dividends and distributions are determined in accordance with federal income tax regulations, which may differ from US GAAP.
Securities Lending: Latin America may lend securities to approved borrowers, such as banks, brokers and other financial institutions. The borrower pledges cash, securities issued or guaranteed by the US government or irrevocable letters of credit issued by a bank as collateral, which will be maintained at all times in an amount equal to at least 100% of the current market value of the loaned securities. The market value of the loaned securities is determined at the close of business of Latin America and any
| | | | | | |
| | | | | | | |
| 36 | | ANNUAL REPORT | | OCTOBER 31, 2012 | | |
| | | | |
| Notes to Financial Statements (continued) | | |
additional required collateral is delivered to Latin America on the next business day. Securities lending income, as disclosed in the Statements of Operations, represents the income earned from the investment of the cash collateral, net of rebates paid to, or fees paid by, borrowers and less the fees paid to the securities lending agent. During the term of the loan, Latin America earns dividend or interest income on the securities loaned but does not receive interest income on the securities received as collateral. Loans of securities are terminable at any time and the borrower, after notice, is required to return borrowed securities within the standard time period for settlement of securities transactions. In the event that the borrower defaults on its obligation to return borrowed securities because of insolvency or for any other reason, Latin America could experience delays and costs in gaining access to the collateral. Latin America also could suffer a loss if the value of an investment purchased with cash collateral falls below the market value of loaned securities or if the value of an investment purchased with cash collateral falls below the value of the original cash collateral received. During the year ended October 31, 2012, any securities on loan were collateralized by cash.
Income Taxes: It is the Funds’ policy to comply with the requirements of the Internal Revenue Code of 1986, as amended, applicable to regulated investment companies and to distribute substantially all of their taxable income to their shareholders. Therefore, no federal income tax provision is required.
Each Fund files US federal and various state and local tax returns. No income tax returns are currently under examination. The statute of limitations for each Fund’s US federal tax returns remains open for each of the four years ended October 31, 2012. The statutes of limitations on each Fund’s state and local tax returns may remain open for an additional year depending upon the jurisdiction. Management does not believe there are any uncertain tax positions that require recognition of a tax liability.
Basis of Consolidation:
Latin America
The Fund’s accompanying consolidated Financial Highlights for each of the two years ended November 30, 2007 and for the two periods ended October 31, 2009 includes the accounts of Merrill Lynch Latin America Fund Chile Ltd., a wholly owned subsidiary of the Fund. The subsidiary was created for regulatory purposes to invest in Chilean securities. Intercompany accounts and transactions have been eliminated. During the year ended October 31, 2009, Merrill Lynch Latin America Fund Chile Ltd. was dissolved.
Recent Accounting Standard: In December 2011, the Financial Accounting Standards Board issued guidance that will expand current disclosure requirements on the offsetting of certain assets and liabilities. The new disclosures will be required for investments and derivative financial instruments subject to master netting or similar agreements which are eligible for offset in the Statements of Assets and Liabilities and will require an entity to disclose both gross and net information about such investments and transactions in the financial statements. The guidance is effective for financial statements with fiscal years beginning on or after January 1, 2013, and interim periods within those fiscal years. Management is evaluating the impact of this guidance on the Funds’ financial statement disclosures.
Other: Expenses directly related to a Fund or its classes are charged to that Fund or class. Other operating expenses shared by several funds are pro rated among those funds on the basis of relative net assets or other appropriate methods. Expenses directly related to a Fund and other shared expenses prorated to a Fund are allocated daily to each class based on its relative net assets or other appropriate methods.
Emerging Markets and Latin America have an arrangement with the custodian whereby fees may be reduced by credits earned on uninvested cash balances, which, if applicable, are shown as fees paid indirectly in the Statements of Operations. The custodian imposes fees on overdrawn cash balances, which can be offset by accumulated credits earned or may result in additional custody charges.
2. Derivative Financial Instruments:
Emerging Markets and Latin America engage in various portfolio investment strategies using derivative contracts both, to increase the returns of Emerging Markets and Latin America and/or economically hedge, or protect their exposure to certain risks such as foreign currency exchange rate risk. These contracts may be transacted on an exchange or OTC.
Losses may arise if the value of the contract decreases due to an unfavorable change in the market rates or values of the underlying instrument or if the counterparty does not perform under the contract.
Emerging Markets and Latin America’s maximum risk of loss from counterparty credit risk on OTC derivatives is generally the aggregate unrealized gain netted against any collateral pledged by/posted to the counterparty.
Emerging Markets and Latin America may mitigate counterparty risk by procuring collateral and through netting provisions included within an International Swaps and Derivatives Association, Inc. master agreement (“ISDA Master Agreement”) implemented between a Fund and each of its respective counterparties. An ISDA Master Agreement allows Emerging Markets and Latin America to offset with each separate counterparty certain derivative financial instrument’s payables and/or receivables with collateral held. The amount of collateral moved to/from applicable counterparties is generally based upon minimum transfer amounts of up to $500,000.
To the extent amounts due to Emerging Markets and Latin America from their counterparties are not fully collateralized contractually or otherwise, each Fund bears the risk of loss from counterparty non-performance. See Note 1 “Segregation and Collateralization” for information with respect to collateral practices. In addition, Emerging Markets and Latin America manage counterparty risk by entering into agreements only with counterparties believed to have the financial resources to honor their obligations and by monitoring the financial stability of those counterparties.
Certain ISDA Master Agreements allow counterparties to OTC derivatives to terminate derivative contracts prior to maturity in the event a Fund’s net assets decline by a stated percentage or the Fund fails to meet the terms of its ISDA Master Agreements, which would cause the Funds to accelerate payment of any net liability owed to the counterparty.
Foreign Currency Exchange Contracts: Emerging Markets and Latin America enter into foreign currency exchange contracts as an economic hedge against either specific transactions or portfolio instruments or to
| | | | | | |
| | | | | | | |
| | ANNUAL REPORT | | OCTOBER 31, 2012 | | 37 |
| | |
| Notes to Financial Statements (continued) | | |
obtain exposure to foreign currencies (foreign currency exchange rate risk). A foreign currency exchange contract is an agreement between two parties to buy and sell a currency at a set exchange rate on a future date. Foreign currency exchange contracts, when used by the Fund, help to manage the overall exposure to the currencies in which some of the investments held by the Fund are denominated. The contract is marked-to-market daily and the change in market value is recorded by the Fund as an unrealized gain or loss. When the contract is closed, the Funds record a realized gain or loss equal to the difference between the value at the time it was opened and the value at the time it was closed. The use of foreign currency exchange contracts involves the risk that the value of a foreign currency exchange contract changes unfavorably due to movements in the value of the referenced foreign currencies and the risk that a counterparty to the contract does not perform its obligations under the agreement.
| | | | | | | | | | |
| Derivative Financial Instruments Categorized by Risk Exposure: | |
| Fair Values of Derivative Financial Instruments as of October 31, 2012 | |
| Asset Derivatives | |
| | | | | Emerging
Markets | | | Latin America | |
| | | Statements of Assets and Liabilities Location | | Value | |
Foreign currency
exchange contracts | | Unrealized appreciation on foreign currency exchange contracts | | $ | 3 | | | | — | |
| Liability Derivatives | |
| | | | | Emerging
Markets | | | Latin America | |
| | | Statements of Assets and Liabilities Location | | Value | |
Foreign currency
exchange contracts | | Unrealized depreciation on foreign currency exchange contracts | | $ | 1,475 | | | $ | 748 | |
| | | | | | | | |
The Effect of Derivative Financial Instruments In the Statements of Operations Year Ended October 31, 2012 | |
| | | Net Realized Gain (Loss) From | |
| | | Emerging Markets | | | Latin America | |
| Foreign currency exchange contracts: | | | | | | | | |
Foreign currency transactions | | $ | (766,535 | ) | | $ | 45,655 | |
| | | Net Change in Unrealized
Appreciation/Depreciation on | |
| | | Emerging Markets | | | Latin America | |
| Foreign currency exchange contracts: | | | | | | | | |
Foreign currency translations | | $ | 92,278 | | | $ | 34,777 | |
| | | | | | | | |
| For the year ended October 31, 2012, the average quarterly balances of outstanding derivative financial instruments were as follows: | |
| | | | | | | | |
| | | Emerging Markets | | | Latin America | |
| Foreign currency exchange contracts: | | | | | | | | |
Average number of contracts – US dollars purchased | | | 4 | | | | 5 | |
Average number of contracts – US dollars sold | | | 1 | | | | 3 | |
Average US dollar amounts purchased | | $ | 1,580,335 | | | $ | 1,161,550 | |
Average US dollar amounts sold | | $ | 950,605 | | | $ | 2,549,456 | |
3. Investment Advisory Agreement and Other Transactions with Affiliates:
The PNC Financial Services Group, Inc. (“PNC”) is the largest stockholder and an affiliate, for 1940 Act purposes, of BlackRock, Inc. (“BlackRock”).
Emerging Markets and Latin America each entered into an Investment Advisory Agreement with BlackRock Advisors, LLC (the “Manager”), the Funds’ investment advisor, an indirect, wholly owned subsidiary of BlackRock, to provide investment advisory and administration services. The Manager is responsible for the management of each Fund’s portfolio and provides the necessary personnel, facilities, equipment and certain other services necessary to the operations of each Fund. For such services, Emerging Markets and Latin America each pay the Manager a monthly fee based on a percentage of each Fund’s average daily net assets at the following annual rates:
| | | | |
| Average Daily Net Assets | | Investment Advisory
Fee | |
First $1 Billion | | | 1.00 | % |
$1 Billion - $3 Billion | | | 0.94 | % |
$3 Billion - $5 Billion | | | 0.90 | % |
$5 Billion - $10 Billion | | | 0.87 | % |
Greater than $10 Billion | | | 0.85 | % |
The Corporation, on behalf of International, entered into an Administration Agreement with BlackRock Advisors, LLC (the “Administrator”), an indirect, wholly owned subsidiary of BlackRock, to provide administrative services (other than investment advice and related portfolio activities). For such services, the Fund pays the Administrator a monthly fee at an annual rate of 0.25% of the average daily value of the Fund’s net assets. The Fund does not pay an investment advisory fee or investment management fee.
The Manager voluntarily agreed to waive its investment advisory fees by the amount of investment advisory fees Emerging Markets and Latin America pay to the Manager indirectly through their investment in affiliated money market funds. However, the Manager does not waive its investment advisory fees by the amount of investment advisory fees paid through each Fund’s investment in other affiliated investment companies, if any. These amounts are included in, fees waived by Manager in the Statements of Operations. For the year ended October 31, 2012, the amounts waived were as follows:
| | | | |
Emerging Markets | | $ | 9,948 | |
Latin America | | $ | 3,354 | |
The Manager entered into a sub-advisory agreement with BlackRock Investment Management, LLC (“BIM”) and BlackRock International Limited (“BIL”), with respect to Emerging Markets and Latin America. BIM and BIL are both affiliates of the Manager. The Manager pays each sub-advisor for services they provide, a monthly fee that is a percentage of the investment advisory fees paid by the Funds to the Manager.
For the year ended October 31, 2012, Emerging Markets and Latin America reimbursed the Manager for certain accounting services, which is included in accounting services in the Statements of Operations. The reimbursements were as follows:
| | | | |
Emerging Markets | | $ | 4,038 | |
Latin America | | $ | 6,423 | |
Emerging Markets, Latin America and the Corporation, on behalf of International, entered into a Distribution Agreement and Distribution and Service Plan with BlackRock Investments, LLC (“BRIL”), an affiliate of the Manager. Pursuant to the Distribution and Service Plan and in accordance with Rule 12b-1 under the 1940 Act, each Fund pays BRIL ongoing
| | | | | | |
| | | | | | | |
| 38 | | ANNUAL REPORT | | OCTOBER 31, 2012 | | |
| | |
| Notes to Financial Statements (continued) | | |
service and distribution fees. The fees are accrued daily and paid monthly at annual rates based upon the average daily net assets of the shares of each Fund as follows:
| | | | | | | | |
| | | Service Fee | | | Distribution Fee | |
Investor A | | | 0.25 | % | | | — | |
Investor B | | | 0.25 | % | | | 0.75 | % |
Investor C | | | 0.25 | % | | | 0.75 | % |
Class R | | | 0.25 | % | | | 0.25 | % |
Pursuant to sub-agreements with BRIL, broker-dealers and BRIL provide shareholder servicing and distribution services to each Fund. The ongoing service and/or distribution fee compensates BRIL and each broker-dealer for providing shareholder servicing and/or distribution related services to Investor A, Investor B, Investor C and Class R shareholders.
The Manager maintains a call center, which is responsible for providing certain shareholder services to the Funds, such as responding to shareholder inquiries and processing transactions based upon instructions from shareholders with respect to the subscription and redemption of Fund shares. For the year ended October 31, 2012, each Fund reimbursed the Manager the following amounts for costs incurred in running the call center, which are included in transfer agent — class specific in the Statements of Operations:
| | | | | | | | | | | | |
| | | Emerging
Markets | | | Latin America | | | International | |
Institutional | | $ | 1,431 | | | $ | 4,192 | | | $ | 5,303 | |
Investor A | | $ | 5,723 | | | $ | 23,423 | | | $ | 3,847 | |
Investor B | | $ | 310 | | | $ | 1,436 | | | $ | 538 | |
Investor C | | $ | 1,724 | | | $ | 9,108 | | | $ | 2,386 | |
Investor R | | | — | | | | — | | | $ | 378 | |
With respect to International, the Manager contractually agreed to waive and/or reimburse fees or expenses, excluding interest expense, dividend expense, acquired fund fees and expenses and certain other fund expenses, which constitute extraordinary expenses not incurred in the ordinary course of the Funds’ business, in order to limit expenses. The Manager has agreed not to reduce or discontinue this contractual waiver or reimbursement prior to March 1, 2014 unless approved by the Board, including a majority of the Independent Trustees.
The expense limitations as a percentage of average daily net assets are as follows:
| | | | |
| | | International | |
Institutional | | | 1.00 | % |
Investor A | | | 1.38 | % |
Investor B | | | 2.44 | % |
Investor C | | | 2.42 | % |
Class R | | | 1.70 | % |
For the year ended October 31, 2012, the Manager waived $1,060,162 of administration fees for International, which is shown as fees waived by the Administrator. In addition, the Manager waived the following amounts for International, which are included in transfer agent fees waived and/or reimbursed – class specific in the Statement of Operations:
| | | | |
| | | International | |
Institutional | | $ | 616,703 | |
Investor A | | $ | 253,442 | |
Investor B | | $ | 58,953 | |
Investor C | | $ | 157,647 | |
Class R | | $ | 25,217 | |
For the year ended October 31, 2012, affiliates earned underwriting discounts, direct commissions and dealer concessions on sales of the Funds’ Investor A Shares as follows:
| | | | |
| | | Investor A | |
Emerging Markets | | $ | 37,629 | |
Latin America | | $ | 37,485 | |
International | | $ | 28,590 | |
For the year ended October 31, 2012, affiliates received CDSCs as follows:
| | | | | | | | | | | | |
| | | Investor A | | | Investor B | | | Investor C | |
Emerging Markets | | $ | 1,927 | | | $ | 2,956 | | | $ | 27,718 | |
Latin America | | $ | 4,073 | | | $ | 28,190 | | | $ | 23,445 | |
International | | $ | 296 | | | $ | 1,875 | | | $ | 9,952 | |
Latin America received an exemptive order from the SEC permitting it, among other things, to pay an affiliated securities lending agent a fee based on a share of the income derived from the securities lending activities and has retained BIM as the securities lending agent. BIM may, on behalf of the Fund, invest cash collateral received by the Fund for such loans, among other things, in a private investment company managed by the Manager or in registered money market funds advised by the Manager or its affiliates. As securities lending agent, BIM is responsible for all transaction fees and all other operational costs relating to securities lending activities, other than extraordinary expenses. BIM does not receive any fees for managing the cash collateral. The market value of securities on loan and the value of the related collateral, if applicable, are shown in the Statements of Assets and Liabilities as securities loaned at value and collateral on securities loaned at value, respectively. The cash collateral invested by BIM is disclosed in the Schedules of Investments, if any. Securities lending income is equal to the total of income earned from the reinvestment of cash collateral, net of rebates paid to, or fees paid by, borrowers of securities. The Fund retains 65% of securities lending income and pays a fee to BIM equal to 35% of such income. The share of income earned by the Fund on the reinvestment of cash collateral is shown as securities lending — affiliated in the Statements of Operations. For the year ended October 31, 2012, BIM received $739 in securities lending agent fees related to securities lending activities for the Fund.
Certain officers and/or directors of Emerging Markets, Latin America and the Corporation are officers and/or directors of BlackRock or its affiliates. The Funds reimburse the Manager for compensation paid to the Chief Compliance Officer of Emerging Markets, Latin America and the Corporation.
4. Investments:
Purchases and sales of investments, excluding short-term securities, for the year ended October 31, 2012 were as follows:
| | | | | | | | |
| | | Purchases | | | Sales | |
Emerging Markets | | $ | 581,979,753 | | | $ | 593,250,893 | |
Latin America | | $ | 326,393,673 | | | $ | 459,054,722 | |
5. Income Tax Information:
US GAAP requires that certain components of net assets be adjusted to reflect permanent differences between financial and tax reporting. These reclassifications have no effect on net assets or net asset values per share. The following permanent differences as of October 31, 2012
| | | | | | |
| | | | | | | |
| | ANNUAL REPORT | | OCTOBER 31, 2012 | | 39 |
| | |
| Notes to Financial Statements (continued) | | |
attributable to foreign currency transactions, the sale of stock of passive foreign investment companies and foreign taxes paid were reclassified to the following accounts:
| | | | | | | | | | | | |
| | | Emerging
Markets | | | Latin
America | | | International | |
Undistributed net investment income | | $ | (442,025 | ) | | $ | 1,968,746 | | | $ | 4,806,894 | |
Accumulated net realized loss | | $ | 442,025 | | | $ | (1,968,746 | ) | | | — | |
Accumulated net realized loss allocated from the Portfolio | | | — | | | | — | | | $ | (4,806,894 | ) |
The tax character of distributions paid during the fiscal years ended October 31, 2012 and October 31, 2011 was as follows:
| | | | | | | | | | | | | | | | |
| | | | Emerging
Markets | | | Latin
America | | | International | |
| | | | | | | | | | | | | | | | |
Ordinary income | | | 10/31/2012 | | | $ | 1,102,039 | | | $ | 3,374,810 | | | $ | 3,531,640 | |
| | | 10/31/2011 | | | | 2,000,435 | | | | 15,566,348 | | | | — | |
| | | | | | | | |
Total | | | 10/31/2012 | | | $ | 1,102,039 | | | $ | 3,374,810 | | | $ | 3,531,640 | |
| | | | | | | | |
| | | 10/31/2011 | | | $ | 2,000,435 | | | $ | 15,566,348 | | | | — | |
| | | | | | | | |
As of October 31, 2012, the tax components of accumulated net earnings (losses) were as follows:
| | | | | | | | | | | | |
| | | Emerging
Markets | | | Latin
America | | | International | |
Undistributed ordinary income | | $ | 4,340,964 | | | $ | 7,208,755 | | | $ | 6,780,146 | �� |
Capital loss carryforwards | | | (26,478,408 | ) | | | (60,291,123 | ) | | | (354,429,707 | ) |
Net unrealized gains1 | | | 34,634,395 | | | | 107,785,465 | | | | 36,306,230 | |
| | | | |
| Total | | $ | 12,496,951 | | | $ | 54,703,097 | | | $ | (311,343,331 | ) |
| | | | |
| 1 | | The difference between book-basis and tax-basis net unrealized gains was attributable primarily to the tax deferral of losses on wash sales, the realization for tax purposes of unrealized gains/losses on certain foreign currency contracts and the realization for tax purposes of unrealized gain on investments in passive foreign investment companies. |
As of October 31, 2012, the Funds had capital loss carryforwards available to offset future realized capital gains through the indicated expiration dates as follows:
| | | | | | | | | | | | |
| Expires October 31, | | Emerging Markets | | | Latin America | | | International | |
2015 | | | — | | | | — | | | $ | 82,929,236 | |
2016 | | | — | | | | — | | | | 138,870,260 | |
2017 | | $ | 11,598,286 | | | $ | 60,291,123 | | | | 15,346,411 | |
2018 | | | — | | | | — | | | | 42,091,334 | |
| No expiration date2 | | | 14,880,122 | | | | — | | | | 75,192,466 | |
| | | | |
| Total | | $ | 26,478,408 | | | $ | 60,291,123 | | | $ | 354,429,707 | |
| | | | |
| 2 | | Must be utilized prior to losses subject to expiration. |
During the year ended October 31, 2012, Latin America utilized $6,995,844 of its capital loss carryforward.
As of October 31, 2012, gross unrealized appreciation and gross unrealized depreciation based on cost for federal income tax purposes were as follows:
| | | | | | | | |
| | | Emerging Markets | | | Latin America | |
Tax cost | | $ | 354,844,696 | | | $ | 466,072,782 | |
| | | | |
Gross unrealized appreciation | | $ | 46,995,256 | | | $ | 129,389,366 | |
Gross unrealized depreciation | | | (12,363,127 | ) | | | (21,480,709 | ) |
| | | | |
Net unrealized appreciation | | $ | 34,632,129 | | | $ | 107,908,657 | |
| | | | |
6. Borrowings:
Emerging Markets and Latin America, along with certain other funds managed by the Manager and its affiliates, is a party to a $500 million credit agreement with a group of lenders. The Funds may borrow under the credit agreement to fund shareholder redemptions. Effective November 2010 to November 2011, the credit agreement had the following terms: a commitment fee of 0.08% per annum based on the Fund’s pro rata share of the unused portion of the credit agreement and interest at a rate equal to the higher of (a) the one-month London Interbank Offered Rate (“LIBOR”) plus 1.00% per annum or (b) the Fed Funds rate plus 1.00% per annum on amounts borrowed. In addition, the Funds paid administration and arrangement fees which were allocated to the Funds based on their net assets as of October 31, 2010. The credit agreement, which expired in November 2011, was renewed until November 2012. Effective November 2011 to November 2012, the credit agreement has the following terms: a commitment fee of 0.065% per annum based on the Fund’s pro rata share of the unused portion of the credit agreement and interest at a rate equal to the higher of (a) the one-month LIBOR plus 0.80% per annum or (b) the Fed Funds rate plus 0.80% per annum on amounts borrowed. In addition, the Funds paid administration and arrangement fees which were allocated to the Funds based on their net assets as of October 31, 2011. The Funds did not borrow under the credit agreement during the year ended October 31, 2012.
7. Concentration, Market and Credit Risk:
In the normal course of business, Emerging Markets and Latin America invest in securities and enter into transactions where risks exist due to fluctuations in the market (market risk) or failure of the issuer of a security to meet all its obligations (issuer credit risk). The value of securities held by the Funds may decline in response to certain events, including those directly involving the issuers whose securities are owned by the Funds; conditions affecting the general economy; overall market changes; local, regional or global political, social or economic instability; and currency and interest rate and price fluctuations. Similar to issuer credit risk, the Funds may be exposed to counterparty credit risk, or the risk that an entity with which the Funds have unsettled or open transactions may fail to or be unable to perform on its commitments. The Funds manage counterparty credit risk by entering into transactions only with counterparties that they believe have the financial resources to honor their obligations and by monitoring the financial stability of those counterparties. Financial assets, which potentially expose the Funds to market, issuer and counterparty credit risks, consist principally of financial instruments and receivables due from counterparties. The extent of the Funds’ exposure to market, issuer and counterparty credit risks with respect to these financial assets is generally approximated by their value recorded in the Statements of Assets and Liabilities, less any collateral held by the Funds.
Emerging Markets and Latin America invest a substantial amount of their assets in issuers located in a single country or a limited number of countries. When the Funds concentrate their investments in this manner, they assume the risk that economic, political and social conditions in those countries may have a significant impact on their investment performance. Foreign issuers may not be subject to the same uniform accounting, auditing and financial reporting standards and practices as used in the
| | | | | | |
| | | | | | | |
| 40 | | ANNUAL REPORT | | OCTOBER 31, 2012 | | |
| | |
| Notes to Financial Statements (continued) | | |
US. Foreign securities markets may also be less liquid, more volatile, and less subject to governmental supervision not typically associated with investing in US securities. Please see the Schedules of Investments for concentrations in specific countries.
As of October 31, 2012, Emerging Markets and Latin America had the following industry classifications:
| | | | |
| Emerging Markets | | | |
| Industry | | Percent of
Long-Term
Investments | |
Commercial Banks | | | 20 | % |
Oil, Gas & Consumable Fuels | | | 11 | |
Semiconductors & Semiconductor | | | 8 | |
Automobiles | | | 5 | |
Metals & Mining. | | | 5 | |
Wireless Communication Services | | | 5 | |
Other1 | | | 46 | |
| | | | |
| Latin America | | | |
| Industry | | Percent of
Long-Term
Investments | |
Commercial Banks | | | 18 | % |
Oil, Gas & Consumable Fuels | | | 11 | |
Metals & Mining | | | 10 | |
Wireless Telecommunication Services | | | 9 | |
Beverages | | | 8 | |
Other1 | | | 44 | |
| 1 | | All other industries held were each less than 5% of long-term investments. |
8. Capital Share Transactions:
Transactions in capital shares for each class were as follows:
| | | | | | | | | | | | | | | | | | |
| | | Year Ended October 31, 2012 | | | | | Year Ended October 31, 2011 | |
| Emerging Markets | | Shares | | | Amount | | | | | Shares | | | Amount | |
| Institutional | | | | | | | | | | | | | | | | | | |
Shares sold | | | 7,072,715 | | | $ | 132,053,424 | | | | | | 5,497,082 | | | $ | 102,063,289 | |
Shares issued to shareholders in reinvestment of dividends and distributions | | | 22,113 | | | | 364,406 | | | | | | 23,825 | | | | 480,297 | |
Shares redeemed | | | (8,009,137 | ) | | | (156,758,283 | ) | | | | | (4,543,770 | ) | | | (88,682,170 | ) |
| | | | | | | | | | |
Net increase (decrease) | | | (914,309 | ) | | $ | (24,340,453 | ) | | | | | 977,137 | | | $ | 13,861,416 | |
| | | | | | | | | | |
| | | | | | | | | | | | | | | | | | |
| Investor A | | | | | | | | | | | | | | | | | | |
Shares sold and automatic conversion of shares | | | 2,780,465 | | | $ | 50,377,456 | | | | | | 3,156,813 | | | $ | 59,847,429 | |
Shares issued to shareholders in reinvestment of dividends and distributions | | | 21,269 | | | | 339,176 | | | | | | 49,417 | | | | 964,052 | |
Shares redeemed | | | (2,226,121 | ) | | | (40,490,696 | ) | | | | | (1,716,034 | ) | | | (32,633,778 | ) |
| | | | | | | | | | |
Net increase | | | 575,613 | | | $ | 10,225,936 | | | | | | 1,490,196 | | | $ | 28,177,703 | |
| | | | | | | | | | |
| | | | | | | | | | | | | | | | | | |
| Investor B | | | | | | | | | | | | | | | | | | |
Shares sold | | | 25,273 | | | $ | 408,330 | | | | | | 60,572 | | | $ | 1,024,275 | |
Shares redeemed and automatic conversion of shares | | | (104,256 | ) | | | (1,672,103 | ) | | | | | (109,206 | ) | | | (1,862,304 | ) |
| | | | | | | | | | |
Net decrease | | | (78,983 | ) | | $ | (1,263,773 | ) | | | | | (48,634 | ) | | $ | (838,029 | ) |
| | | | | | | | | | |
| | | | | | | | | | | | | | | | | | |
| Investor C | | | | | | | | | | | | | | | | | | |
Shares sold | | | 2,529,536 | | | $ | 39,102,370 | | | | | | 4,402,492 | | | $ | 71,319,189 | |
Shares issued to shareholders in reinvestment of dividends and distributions | | | 4,758 | | | | 65,842 | | | | | | 5,197 | | | | 88,496 | |
Shares redeemed | | | (1,864,861 | ) | | | (29,183,529 | ) | | | | | (923,653 | ) | | | (15,073,372 | ) |
| | | | | | | | | | |
Net increase | | | 669,433 | | | $ | 9,984,683 | | | | | | 3,484,036 | | | $ | 56,334,313 | |
| | | | | | | | | | |
Total Net Increase (Decrease) | | | 251,754 | | | $ | (5,393,607 | ) | | | | | 5,902,735 | | | $ | 97,535,403 | |
| | | | | | | | | | |
| | | |
| | | Year Ended October 31, 2012 | | | | | Year Ended October 31, 2011 | |
| Latin America | | Shares | | | Amount | | | | | Shares | | | Amount | |
| Institutional | | | | | | | | | | | | | | | | | | |
Shares sold | | | 923,394 | | | $ | 57,836,919 | | | | | | 1,670,457 | | | $ | 117,802,736 | |
Shares issued to shareholders in reinvestment of dividends and distributions | | | 22,927 | | | | 1,275,571 | | | | | | 44,878 | | | | 3,253,058 | |
Shares redeemed | | | (1,608,780 | ) | | | (98,060,968 | ) | | | | | (1,586,874 | ) | | | (107,250,014 | ) |
| | | | | | | | | | |
Net increase (decrease) | | | (662,459 | ) | | $ | (38,948,478 | ) | | | | | 128,461 | | | $ | 13,805,780 | |
| | | | | | | | | | |
| | | | | | | | | | | | | | | | | | |
| Investor A | | | | | | | | | | | | | | | | | | |
Shares sold and automatic conversion of shares | | | 1,039,359 | | | $ | 63,673,220 | | | | | | 2,177,418 | | | $ | 154,252,124 | |
Shares issued to shareholders in reinvestment of dividends and distributions | | | 31,367 | | | | 1,721,015 | | | | | | 120,575 | | | | 8,606,522 | |
Shares redeemed | | | (2,202,430 | ) | | | (131,281,751 | ) | | | | | (4,041,650 | ) | | | (274,668,646 | ) |
| | | | | | | | | | |
Net decrease | | | (1,131,704 | ) | | $ | (65,887,516 | ) | | | | | (1,743,657 | ) | | $ | (111,810,000 | ) |
| | | | | | | | | | |
| | | | | | |
| | | | | | | |
| | ANNUAL REPORT | | OCTOBER 31, 2012 | | 41 |
| | |
| Notes to Financial Statements (concluded) | | |
| | | | | | | | | | | | | | | | | | |
| | | |
| | | Year Ended October 31, 2012 | | | | | Year Ended October 31, 2011 | |
| Latin America (concluded) | | Shares | | | Amount | | | | | Shares | | | Amount | |
| Investor B | | | | | | | | | | | | | | | | | | |
Shares sold | | | 2,141 | | | $ | 118,286 | | | | | | 5,364 | | | $ | 363,466 | |
Shares issued to shareholders in reinvestment of dividends and distributions | | | — | | | | — | | | | | | 1,807 | | | | 121,495 | |
Shares redeemed and automatic conversion of shares | | | (60,135 | ) | | | (3,370,740 | ) | | | | | (70,342 | ) | | | (4,455,658 | ) |
| | | | | | | | | | |
Net decrease | | | (57,994 | ) | | $ | (3,252,454 | ) | | | | | (63,171 | ) | | $ | (3,970,697 | ) |
| | | | | | | | | | |
| | | | | | | | | | | | | | | | | | |
| Investor C | | | | | | | | | | | | | | | | | | |
Shares sold | | | 187,954 | | | $ | 10,524,845 | | | | | | 760,525 | | | $ | 49,713,690 | |
Shares issued to shareholders in reinvestment of dividends and distributions | | | — | | | | — | | | | | | 31,842 | | | | 2,092,221 | |
Shares redeemed | | | (926,885 | ) | | | (50,172,606 | ) | | | | | (1,150,343 | ) | | | (71,349,666 | ) |
| | | | | | | | | | |
Net decrease | | | (738,931 | ) | | $ | (39,647,761 | ) | | | | | (357,976 | ) | | $ | (19,543,755 | ) |
| | | | | | | | | | |
Total Net Decrease | | | (2,591,088 | ) | | $ | (147,736,209 | ) | | | | | (2,036,343 | ) | | $ | (121,518,672 | ) |
| | | | | | | | | | |
| | | |
| | | Year Ended October 31, 2012 | | | | | Year Ended October 31, 2011 | |
| International | | Shares | | | Amount | | | | | Shares | | | Amount | |
| Institutional | | | | | | | | | | | | | | | | | | |
Shares sold | | | 13,669,636 | | | $ | 165,260,488 | | | | | | 5,228,089 | | | $ | 66,016,412 | |
Shares issued to shareholders in reinvestment of dividends and distributions | | | 197,136 | | | | 2,138,075 | | | | | | — | | | | — | |
Shares issued resulting from reorganization | | | — | | | | — | | | | | | 30,557,228 | | | | 400,973,426 | |
Shares redeemed | | | (22,497,542 | ) | | | (279,434,868 | ) | | | | | (1,842,601 | ) | | | (22,082,697 | ) |
| | | | | | | | | | |
Net increase (decrease) | | | (8,630,770 | ) | | $ | (112,036,305 | ) | | | | | 33,942,716 | | | $ | 444,907,141 | |
| | | | | | | | | | |
| | | | | | | | | | | | | | | | | | |
| Investor A | | | | | | | | | | | | | | | | | | |
Shares sold | | | 5,231,505 | | | $ | 61,512,711 | | | | | | 13,049,751 | | | $ | 155,947,579 | |
Shares issued to shareholders in reinvestment of dividends and distributions | | | 70,047 | | | | 746,664 | | | | | | — | | | | — | |
Shares issued resulting from reorganization | | | — | | | | — | | | | | | 7,682,699 | | | | 110,164,043 | |
Shares redeemed | | | (4,393,963 | ) | | | (51,642,558 | ) | | | | | (6,168,344 | ) | | | (70,902,006 | ) |
| | | | | | | | | | |
Net increase | | | 907,589 | | | $ | 10,616,817 | | | | | | 14,564,106 | | | $ | 195,209,616 | |
| | | | | | | | | | |
| | | | | | | | | | | | | | | | | | |
| Investor B | | | | | | | | | | | | | | | | | | |
Shares sold | | | 242,781 | | | $ | 2,639,880 | | | | | | 266,854 | | | $ | 3,201,168 | |
Shares issued resulting from reorganization | | | — | | | | — | | | | | | 1,498,587 | | | | 10,047,654 | |
Shares redeemed | | | (1,214,484 | ) | | | (13,215,477 | ) | | | | | (748,576 | ) | | | (8,854,797 | ) |
| | | | | | | | | | |
Net increase (decrease) | | | (971,703 | ) | | $ | (10,575,597 | ) | | | | | 1,016,865 | | | $ | 4,394,025 | |
| | | | | | | | | | |
| | | | | | | | | | | | | | | | | | |
| Investor C | | | | | | | | | | | | | | | | | | |
Shares sold | | | 2,808,479 | | | $ | 30,985,976 | | | | | | 3,160,740 | | | $ | 38,639,458 | |
Shares issued to shareholders in reinvestment of dividends and distributions | | | 25,810 | | | | 258,855 | | | | | | — | | | | — | |
Shares issued resulting from reorganization | | | — | | | | — | | | | | | 10,552,529 | | | | 97,256,083 | |
Shares redeemed | | | (4,279,223 | ) | | | (47,424,433 | ) | | | | | (1,355,896 | ) | | | (15,266,144 | ) |
| | | | | | | | | | |
Net increase (decrease) | | | (1,444,934 | ) | | $ | (16,179,602 | ) | | | | | 12,357,373 | | | $ | 120,629,397 | |
| | | | | | | | | | |
| | | | | | | | | | | | | | | | | | |
| Class R | | | | | | | | | | | | | | | | | | |
Shares sold | | | 853,067 | | | $ | 9,943,035 | | | | | | 168,897 | | | $ | 1,984,962 | |
Shares issued to shareholders in reinvestment of dividends and distributions | | | 13,243 | | | | 140,910 | | | | | | — | | | | — | |
Shares issued resulting from reorganization | | | — | | | | — | | | | | | 2,819,735 | | | | 22,960,775 | |
Shares redeemed | | | (1,384,773 | ) | | | (16,252,519 | ) | | | | | (226,181 | ) | | | (2,670,143 | ) |
| | | | | | | | | | |
Net increase (decrease) | | | (518,463 | ) | | $ | (6,168,574 | ) | | | | | 2,762,451 | | | $ | 22,275,594 | |
| | | | | | | | | | |
Total Net Increase (Decrease) | | | (10,658,281 | ) | | $ | (134,343,261 | ) | | | | | 64,643,511 | | | $ | 787,415,773 | |
| | | | | | | | | | |
9. Subsequent Events:
Management has evaluated the impact of all subsequent events on each Fund through the date the financial statements were issued and has determined that there were no subsequent events requiring adjustment or additional disclosure in the financial statements.
| | | | | | |
| | | | | | | |
| 42 | | ANNUAL REPORT | | OCTOBER 31, 2012 | | |
| | |
| Report of Independent Registered Public Accounting Firm | | |
To the Shareholders and Board of Directors of BlackRock Emerging Markets Fund, Inc., BlackRock Latin America Fund, Inc., and BlackRock International Fund of BlackRock Series, Inc.:
We have audited the accompanying statements of assets and liabilities of BlackRock Emerging Markets Fund, Inc., BlackRock Latin America Fund, Inc. and BlackRock International Fund, a series of BlackRock Series, Inc. (collectively, the “Funds”), including the schedules of investments of BlackRock Emerging Markets Fund, Inc., BlackRock Latin America Fund, Inc., as of October 31, 2012, the related statements of operations for the year then ended, the statements of changes in net assets for each of the two years in the period then ended and the financial highlights for each of the periods presented. These financial statements and financial highlights are the responsibility of the Funds’ management. Our responsibility is to express an opinion on these financial statements and financial highlights based on our audits.
We conducted our audits in accordance with the standards of the Public Company Accounting Oversight Board (United States). Those standards require that we plan and perform the audit to obtain reasonable assurance about whether the financial statements and financial highlights are free of material misstatement. The Funds are not required to have, nor were we engaged to perform, an audit of its internal control over financial reporting. Our audits included consideration of internal control over financial reporting as a basis for designing audit procedures that are
appropriate in the circumstances, but not for the purpose of expressing an opinion on the effectiveness of the Funds’ internal control over financial reporting. Accordingly, we express no such opinion. An audit also includes examining, on a test basis, evidence supporting the amounts and disclosures in the financial statements, assessing the accounting principles used and significant estimates made by management, as well as evaluating the overall financial statement presentation. Our procedures included confirmation of securities owned as of October 31, 2012, by correspondence with the custodian and brokers; where replies were not received from brokers, we performed other auditing procedures. We believe that our audits provide a reasonable basis for our opinion.
In our opinion, the financial statements and financial highlights referred to above present fairly, in all material respects, the financial position of each of BlackRock Emerging Markets Fund, Inc., BlackRock Latin America Fund, Inc. and BlackRock International Fund of BlackRock Series, Inc. as of October 31, 2012, the results of their operations for the year then ended, the changes in their net assets for each of the two years in the period then ended and the financial highlights for each of the periods presented, in conformity with accounting principles generally accepted in the United States of America.
Deloitte & Touche LLP
Boston, Massachusetts
December 21, 2012
Important Tax Information (Unaudited)
The following information is provided with respect to the ordinary income distributions paid by the Funds during the fiscal year ended October 31, 2012.
| | | | | | | | | | | | | | | | |
| | | Payable Date | | | Emerging
Markets | | | Latin
America | | | International | |
Qualified Dividend Income for Individuals1,2 | | | 12/20/11 | | | | 100% | | | | 100% | | | | 88.02% | |
Foreign Source Income2 | | | 12/20/11 | | | | 100% | | | | 100% | | | | 53.38% | |
Foreign Taxes Paid Per Share | | | 12/20/11 | | | | $0.041768 | | | | $0.322264 | | | | $0.004415 | |
| 1 | | The Funds hereby designate the percentage indicated above or the maximum amount allowable by law. |
| 2 | | Expressed as a percentage of the cash distribution grossed-up for foreign taxes. |
| | | | | | |
| | | | | | | |
| | ANNUAL REPORT | | OCTOBER 31, 2012 | | 43 |
| | |
| Portfolio Information | | BlackRock Master International Portfolio |
| | | | |
| Ten Largest Holdings | | Percent of
Long-Term
Investments | |
Imperial Tobacco Group Plc | | | 6 | % |
Vodafone Group Plc | | | 6 | |
Roche Holding AG | | | 5 | |
Sanofi | | | 5 | |
Linde AG | | | 5 | |
Royal Dutch Shell Plc, Class B | | | 4 | |
British Sky Broadcasting Group Plc | | | 4 | |
BG Group Plc | | | 4 | |
Nissan Motor Co. Ltd. | | | 4 | |
Reckitt Benckiser Group Plc | | | 4 | |
| | | | |
| Geographic Allocation | | Percent of
Long-Term
Investments | |
United Kingdom | | | 34 | % |
Switzerland | | | 11 | |
Sweden | | | 8 | |
Japan | | | 7 | |
United States | | | 6 | |
France | | | 6 | |
Germany | | | 5 | |
Belgium | | | 3 | |
Canada | | | 3 | |
China | | | 3 | |
Indonesia | | | 3 | |
Israel | | | 2 | |
India | | | 2 | |
Argentina | | | 2 | |
Russia | | | 2 | |
Netherlands | | | 1 | |
Brazil | | | 1 | |
Czech Republic | | | 1 | |
| | | | | | |
| | | | | | | |
| 44 | | ANNUAL REPORT | | OCTOBER 31, 2012 | | |
| | |
Schedule of Investments October 31, 2012 | | BlackRock Master International Portfolio (Percentages shown are based on Net Assets) |
| | | | | | | | | | |
| Common Stocks | | | | Shares | | | Value | |
| | | | | | | | | | |
| | | | | | | | | | |
Argentina — 1.8% | |
MercadoLibre, Inc. | | | | | 150,132 | | | $ | 12,606,584 | |
Belgium — 3.1% | |
Anheuser-Busch InBev NV | | | | | 266,626 | | | | 22,298,217 | |
Brazil — 1.2% | |
Itau Unibanco Holding SA, Preference Shares | | | | | 603,703 | | | | 8,827,936 | |
Canada — 2.6% | |
Rogers Communications, Inc., Class B | | | | | 415,556 | | | | 18,240,776 | |
China — 2.5% | |
China Life Insurance Co. Ltd., Class H | | | | | 3,120,000 | | | | 9,174,389 | |
Want Want China Holdings Ltd. | | | | | 6,100,000 | | | | 8,304,651 | |
| | | | | | | | | | |
| | | | | | | | | | 17,479,040 | |
Czech Republic — 1.0% | |
Komercni Banka AS | | | | | 33,074 | | | | 6,767,960 | |
France — 5.8% | |
BNP Paribas SA | | | | | 175,475 | | | | 8,851,829 | |
Sanofi | | | | | 367,825 | | | | 32,305,116 | |
| | | | | | | | | | |
| | | | | | | | | | 41,156,945 | |
Germany — 4.4% | |
Linde AG | | | | | 184,021 | | | | 30,967,516 | |
India — 1.9% | |
ICICI Bank Ltd.—ADR | | | | | 340,320 | | | | 13,357,560 | |
Indonesia — 2.4% | |
Bank Rakyat Indonesia Persero Tbk PT | | | | | 22,643,000 | | | | 17,351,511 | |
Israel — 2.0% | |
Teva Pharmaceutical Industries Ltd. — ADR | | | | | 351,705 | | | | 14,215,916 | |
Japan — 7.1% | |
Nissan Motor Co. Ltd. | | | | | 2,838,900 | | | | 23,742,728 | |
NTT DoCoMo, Inc. | | | | | 6,560 | | | | 9,505,611 | |
SMC Corp. | | | | | 109,500 | | | | 17,263,619 | |
| | | | | | | | | | |
| | | | | | | | | | 50,511,958 | |
Netherlands — 1.6% | |
ASML Holding NV | | | | | 207,207 | | | | 11,390,633 | |
Russia — 1.8% | |
Sberbank | | | | | 4,367,915 | | | | 12,840,836 | |
Sweden — 7.4% | |
Assa Abloy AB, Class B | | | | | 444,923 | | | | 14,822,922 | |
Atlas Copco AB, Class A | | | | | 562,736 | | | | 13,838,364 | |
Hennes & Mauritz AB, Class B | | | | | 697,465 | | | | 23,648,580 | |
| | | | | | | | | | |
| | | | | | | | | | 52,309,866 | |
Switzerland — 10.5% | |
Roche Holding AG | | | | | 192,004 | | | | 36,984,789 | |
The Swatch Group AG, Bearer Shares | | | | | 46,649 | | | | 19,309,279 | |
Zurich Insurance Group AG | | | | | 72,616 | | | | 17,901,272 | |
| | | | | | | | | | |
| | | | | | | | | | 74,195,340 | |
United Kingdom — 32.8% | |
BG Group Plc | | | | | 1,337,987 | | | | 24,842,243 | |
British Sky Broadcasting Group Plc | | | | | 2,318,147 | | | | 26,530,858 | |
HSBC Holdings Plc | | | | | 1,474,577 | | | | 14,538,272 | |
Imperial Tobacco Group Plc | | | | | 1,045,245 | | | | 39,530,529 | |
Reckitt Benckiser Group Plc | | | | | 391,214 | | | | 23,701,370 | |
Rio Tinto Plc | | | | | 471,784 | | | | 23,568,635 | |
| | | | | | | | | | | | |
| Common Stocks | | | | | Shares | | | Value | |
| | | | | | | | | | | | |
United Kingdom (concluded) | |
Royal Dutch Shell Plc, Class B | | | | | | | 825,213 | | | $ | 29,189,763 | |
Tullow Oil Plc | | | | | | | 581,944 | | | | 13,221,043 | |
Vodafone Group Plc | | | | | | | 13,795,838 | | | | 37,464,414 | |
| | | | | | | | | | | | |
| | | | | | | | | | | | 232,587,127 | |
United States — 5.9% | |
Agilent Technologies, Inc. | | | | | | | 431,204 | | | | 15,519,032 | |
Liberty Global, Inc., Class A (a) | | | | | | | 237,589 | | | | 14,262,468 | |
Veeco Instruments, Inc. (a) | | | | | | | 392,499 | | | | 12,049,719 | |
| | | | | | | | | | | | |
| | | | | | | | | | | | 41,831,219 | |
Total Long-Term Investments (Cost — $635,479,074) — 95.8% | | | | | | | | | | | 678,936,940 | |
| | | | | | | | | | | | |
| | | | | | | | | | | | | |
| | | |
| Short-Term Securities | | | | | | | | | |
Money Market Funds — 5.0% | |
BlackRock Liquidity Funds,
TempFund, Institutional Class, 0.17% (b)(c) | | | | | | | 35,560,642 | | | | 35,560,642 | |
| | | | | | | | | | | | |
| | | |
| | | | | | Par (000) | | | | |
Time Deposits — 0.2% | |
Citigroup, Inc., (0.03)%, 11/01/12 | | | EUR | | | | 55 | | | | 71,468 | |
JPMorgan Chase & Co., 0.3%, 11/01/12 | | | SEK | | | | 6,869 | | | | 1,035,621 | |
| | | | | | | | | | | | |
| | | | | | | | | | | | 1,107,089 | |
Total Short-Term Securities
(Cost — $36,667,731) — 5.2% | | | | | | | | 36,667,731 | |
| Total Investments (Cost — $672,146,805*) — 101.0% | | | | | | | | 715,604,671 | |
| Liabilities in Excess of Other Assets — (1.0)% | | | | | | | | | | | (6,015,503 | ) |
| | | | | | | | | | | | |
Net Assets — 100.0% | | | | | | | | | | $ | 709,589,168 | |
| | | | | | | | | | | | |
| | | | | |
| * | | As of October 31, 2012, gross unrealized appreciation and gross unrealized depreciation based on cost for federal income tax purposes were as follows: |
| | | | |
Tax cost | | $ | 679,158,663 | |
| | | | |
Gross unrealized appreciation | | $ | 48,975,953 | |
Gross unrealized depreciation | | | (12,529,945 | ) |
| | | | |
Net unrealized appreciation | | $ | 36,446,008 | |
| | | | |
| (a) | | Non-income producing security. |
| (b) | | Investments in issuers considered to be an affiliate of the Portfolio during the year ended October 31, 2012, for purposes of Section 2(a)(3) of the Investment Company Act of 1940, as amended, were as follows: |
| | | | | | | | | | | | | | | | |
| Affiliate | | Shares
Held at
October 31,
2011 | | | Net
Activity | | | Shares
Held at
October 31,
2012 | | | Income | |
BlackRock Liquidity Funds, TempFund, Institutional Class | | | 24,233,486 | | | | 11,327,156 | | | | 35,560,642 | | | $ | 54,678 | |
| (c) | | Represents the current yield as of report date. |
To simplify the listings of portfolio holdings in the Schedule of Investments, the names and descriptions of many of the securities have been abbreviated according to the following list:
| | |
| ADR | | American Depositary Receipts |
| AUD | | Australian Dollar |
| CHF | | Swiss Franc |
| | |
| JPY | | Japanese Yen |
| SEK | | Swedish Krona |
| USD | | US Dollar |
See Notes to Financial Statements.
| | | | | | |
| | | | | | | |
| | ANNUAL REPORT | | OCTOBER 31, 2012 | | 45 |
| | |
| Schedule of Investments (concluded) | | BlackRock Master International Portfolio |
| Ÿ | | Foreign currency exchange contracts as of October 31, 2012 were as follows: |
| | | | | | | | | | | | | | | | | | |
Currency Purchased | | | Currency Sold | | | Counterparty | | Settlement Date | | Unrealized
Appreciation
(Depreciation) | |
| SEK | | | 16,865,266 | | | USD | | | 2,533,273 | | | Goldman Sachs Group, Inc. | | 11/01/12 | | $ | 9,395 | |
| SEK | | | 11,487,201 | | | USD | | | 1,739,299 | | | Goldman Sachs Group, Inc. | | 11/02/12 | | | (7,447 | ) |
| CHF | | | 13,053,368 | | | JPY | | | 1,095,175,000 | | | UBS AG | | 11/15/12 | | | 298,756 | |
| CHF | | | 538,846 | | | USD | | | 575,883 | | | Citigroup, Inc. | | 11/15/12 | | | 2,824 | |
| JPY | | | 1,095,175,000 | | | CHF | | | 13,592,214 | | | JPMorgan Chase & Co. | | 11/15/12 | | | (877,464 | ) |
| AUD | | | 28,804,000 | | | USD | | | 29,272,007 | | | HSBC Bank | | 1/17/13 | | | 447,543 | |
| Total | | | | | | | | | | | | | | | | $ | (126,393 | ) |
| | | | | | | | | | | | | | | | | | |
| Ÿ | | Fair Value Measurements — Various inputs are used in determining the fair value of investments and derivative financial instruments. These inputs to valuation techniques are categorized into a disclosure hierarchy consisting of three broad levels for financial statement purposes as follows: |
| Ÿ | | Level 1 — unadjusted price quotations in active markets/exchanges for identical assets and liabilities that the Portfolio has the ability to access |
| Ÿ | | Level 2 — other observable inputs (including, but not limited to: quoted prices for similar assets or liabilities in markets that are active, quoted prices for identical or similar assets or liabilities in markets that are not active, inputs other than quoted prices that are observable for the assets or liabilities (such as interest rates, yield curves, volatilities, prepayment speeds, loss severities, credit risks and default rates) or other market-corroborated inputs) |
| Ÿ | | Level 3 — unobservable inputs based on the best information available in the circumstances, to the extent observable inputs are not available (including the Portfolio’s own assumptions used in determining the fair value of investments and derivative financial instruments) |
The hierarchy gives the highest priority to unadjusted quoted prices in active markets for identical assets or liabilities (Level 1 measurements) and the lowest priority to unobservable inputs (Level 3 measurements). Accordingly, the degree of judgment exercised in determining fair value is greatest for instruments categorized in Level 3. The inputs used to measure fair value may fall into different levels of the fair value hierarchy. In such cases, for disclosure purposes, the level in the fair value hierarchy within which the fair value measurement falls in its entirety is determined based on the lowest level input that is significant to the fair value measurement in its entirety.
Changes in valuation techniques may result in transfers into or out of an assigned level within the disclosure hierarchy. In accordance with the Portfolio’s policy, transfers between different levels of the fair value disclosure hierarchy are deemed to have occurred as of the beginning of the reporting period. The categorization of a value determined for investments is based on the pricing transparency of the investment and is not necessarily an indication of the risks associated with investing in those securities. For information about the Portfolio’s policy regarding valuation of investments and derivative financial instruments and other significant accounting policies, please refer to Note 1 of the Notes to Financial Statements.
The following tables summarize the Portfolio’s investments and derivative financial instruments categorized in the disclosure hierarchy as of October 31, 2012:
| | | | | | | | | | | | | | | | |
| | | Level 1 | | | Level 2 | | | Level 3 | | | Total | |
| | | | | | | | | | | | | | | | |
Assets: | | | | | | | | | | | | | | | | |
| Investments: | | | | | | | | | | | | | | | | |
Long-Term Investments: | | | | | | | | | | | | | |
Common Stocks: | | | | | | | | | | | | | | | | |
Argentina | | $ | 12,606,584 | | | | — | | | | — | | | $ | 12,606,584 | |
Belgium | | | — | | | $ | 22,298,217 | | | | — | | | | 22,298,217 | |
Brazil | | | 8,827,936 | | | | — | | | | — | | | | 8,827,936 | |
Canada | | | 18,240,776 | | | | — | | | | — | | | | 18,240,776 | |
China | | | — | | | | 17,479,040 | | | | — | | | | 17,479,040 | |
Czech Republic | | | — | | | | 6,767,960 | | | | — | | | | 6,767,960 | |
France | | | — | | | | 41,156,945 | | | | — | | | | 41,156,945 | |
Germany | | | — | | | | 30,967,516 | | | | — | | | | 30,967,516 | |
India | | | 13,357,560 | | | | — | | | | — | | | | 13,357,560 | |
Indonesia | | | — | | | | 17,351,511 | | | | — | | | | 17,351,511 | |
Israel | | | 14,215,916 | | | | — | | | | — | | | | 14,215,916 | |
Japan | | | — | | | | 50,511,958 | | | | — | | | | 50,511,958 | |
Netherlands | | | — | | | | 11,390,633 | | | | — | | | | 11,390,633 | |
Russia | | | — | | | | 12,840,836 | | | | — | | | | 12,840,836 | |
Sweden | | | — | | | | 52,309,866 | | | | — | | | | 52,309,866 | |
Switzerland | | | — | | | | 74,195,340 | | | | — | | | | 74,195,340 | |
United Kingdom | | | — | | | | 232,587,127 | | | | — | | | | 232,587,127 | |
United States | | | 41,831,219 | | | | — | | | | — | | | | 41,831,219 | |
Short-Term Securities | | | 35,560,642 | | | | 1,107,089 | | | | — | | | | 36,667,731 | |
| | | | |
Total | | $ | 144,640,633 | | | $ | 570,964,038 | | | | — | | | $ | 715,604,671 | |
| | | | |
| | | | | | | | | | | | | | | | |
| | | Level 1 | | | Level 2 | | | Level 3 | | | Total | |
| | | | | | | | | | | | | | | | |
| Derivative Financial Instruments1 | | | | | | | | | | | | | | | | |
Assets: | | | | | | | | | | | | | | | | |
Foreign currency exchange contracts | | | — | | | $ | 758,518 | | | | — | | | $ | 758,518 | |
Liabilities: | | | | | | | | | | | | | | | | |
Foreign currency exchange contracts | | | — | | | | (884,911 | ) | | | — | | | | (884,911 | ) |
| | | | |
Total | | | — | | | $ | (126,393 | ) | | | — | | | $ | (126,393 | ) |
| | | | |
| 1 | | Derivative financial instruments are foreign currency exchange contracts, which are valued at the unrealized appreciation/depreciation on the instrument. |
Certain of the Portfolio’s assets are held at carrying amount, which approximates fair value for financial statement purposes. As of October 31, 2012, foreign currency at value of $1,379 is categorized as Level 1 within the disclosure hierarchy.
Prior to April 30, 2012, only significant transfers between Level 1 and Level 2 were required to be disclosed. There were no significant transfers from the beginning of the period to April 30, 2012. For the interim period May 1, 2012 through October 31, 2012, all transfers between Level 1 and Level 2 are required to be disclosed. Certain foreign securities are fair valued utilizing an external pricing service to reflect any significant market movements between the time the Portfolio values such securities and the earlier closing of foreign markets. Such fair valuations are categorized as Level 2 in the disclosure hierarchy. As of April 30, 2012, there were securities with a value of $24,387,244 that were not systematically fair valued, but were valued using systematic fair values as of October 31, 2012, due to significant market movements. Therefore, these securities were transferred from Level 1 to Level 2 during the period May 1, 2012 to October 31, 2012.
| | | | | | |
| See Notes to Financial Statements. | | | | |
| | | | | | | |
| 46 | | ANNUAL REPORT | | OCTOBER 31, 2012 | | |
See Notes to Financial Statements.
| | |
| Statement of Assets and Liabilities | | BlackRock Master International Portfolio |
| | | | |
| October 31, 2012 | | | |
| | | | |
| Assets | |
Investments at value — unaffiliated (cost — $636,586,163) | | $ | 680,044,029 | |
Investments at value — affiliated (cost — $35,560,642) | | | 35,560,642 | |
Dividends receivable | | | 3,467,932 | |
Unrealized appreciation on foreign currency exchange contracts | | | 758,518 | |
Foreign currency at value (cost — $1,379) | | | 1,379 | |
Prepaid expenses | | | 714 | |
| | | | |
Total assets | | | 719,833,214 | |
| | | | |
| | | | |
| Liabilities | | | | |
Investments purchased payable | | | 8,471,997 | |
Unrealized depreciation on foreign currency exchange contracts | | | 884,911 | |
Investment advisory fees payable | | | 445,671 | |
Withdrawals payable to investor | | | 134,476 | |
Other affiliates payable | | | 6,504 | |
Directors’ fees payable | | | 277 | |
Other accrued expenses payable | | | 300,210 | |
| | | | |
Total liabilities | | | 10,244,046 | |
| | | | |
Net Assets | | $ | 709,589,168 | |
| | | | |
| | | | |
| Net Assets Consist of | | | | |
Investors’ capital | | $ | 666,397,470 | |
Net unrealized appreciation/depreciation | | | 43,191,698 | |
| | | | |
Net Assets | | $ | 709,589,168 | |
| | | | |
| | | | | | |
| See Notes to Financial Statements. | | | | |
| | | | | | | |
| | ANNUAL REPORT | | OCTOBER 31, 2012 | | 47 |
| | |
| Statement of Operations | | BlackRock Master International Portfolio |
| | | | |
| Year Ended October 31, 2012 | | | |
| | | | |
| Investment Income | |
Dividends | | $ | 19,101,779 | |
Dividends — affiliated | | | 54,678 | |
Foreign taxes withheld | | | (1,674,449 | ) |
| | | | |
Total income | | | 17,482,008 | |
| | | | |
| | | | |
| Expenses | | | | |
Investment advisory | | | 5,555,753 | |
Custodian | | | 278,308 | |
Accounting services | | | 223,289 | |
Professional | | | 66,290 | |
Directors | | | 26,029 | |
Printing | | | 11,036 | |
Miscellaneous | | | 10,333 | |
| | | | |
Total expenses | | | 6,171,038 | |
Less fees waived by Manager | | | (26,625 | ) |
| | | | |
Total expenses after fees waived | | | 6,144,413 | |
| | | | |
Net investment income | | | 11,337,595 | |
| | | | |
| | | | |
| Realized and Unrealized Gain (Loss) | | | | |
| Net realized gain (loss) from: | | | | |
Investments | | | (64,817,973 | ) |
Foreign currency transactions | | | 4,653,786 | |
| | | | |
| | | (60,164,187 | ) |
| | | | |
Net change in unrealized appreciation/depreciation on: | | | | |
Investments | | | 72,188,306 | |
Foreign currency translations | | | (3,696,432 | ) |
| | | | |
| | | 68,491,874 | |
| | | | |
Total realized and unrealized gain | | | 8,327,687 | |
| | | | |
Net Increase in Net Assets Resulting from Operations | | $ | 19,665,282 | |
| | | | |
| | | | | | |
| See Notes to Financial Statements. | | | | |
| | | | | | | |
| 48 | | ANNUAL REPORT | | OCTOBER 31, 2012 | | |
| | |
| Statements of Changes in Net Assets | | BlackRock Master International Portfolio |
| | | | | | | | |
| | | Year Ended October 31, | |
| Increase (Decrease) in Net Assets: | | 2012 | | | 2011 | |
| | | | | | | | |
| Operations | | | | | | | | |
Net investment income | | $ | 11,337,595 | | | $ | 1,584,011 | |
Net realized loss | | | (60,164,187 | ) | | | (54,806,188 | ) |
Net change in unrealized appreciation/depreciation | | | 68,491,874 | | | | 34,396,421 | |
| | | | |
Net increase (decrease) in net assets resulting from operations | | | 19,665,282 | | | | (18,825,756 | ) |
| | | | |
| | | | | | | | |
| Capital Transactions | | | | | | | | |
Proceeds from contributions | | | 272,676,312 | | | | 907,191,561 | |
Value of withdrawals | | | (415,716,755 | ) | | | (120,719,339 | ) |
| | | | |
Net increase (decrease) in net assets derived from capital transactions | | | (143,040,443 | ) | | | 786,472,222 | |
| | | | |
| | | | | | | | |
| Net Assets | | | | | | | | |
Total increase (decrease) in net assets | | | (123,375,161 | ) | | | 767,646,466 | |
Beginning of year | | | 832,964,329 | | | | 65,317,863 | |
| | | | |
End of year | | $ | 709,589,168 | | | $ | 832,964,329 | |
| | | | |
| | | | | | |
| See Notes to Financial Statements. | | | | |
| | | | | | | |
| | ANNUAL REPORT | | OCTOBER 31, 2012 | | 49 |
| | |
| Financial Highlights | | BlackRock Master International Portfolio |
| | | | | | | | | | | | | | | | | | | | | | | | |
| | | Year Ended October 31, | | | Period
June 1,
2008 to
October 31,
2008 | | | Year Ended
May 31,
2008 | |
| | | 2012 | | | 2011 | | | 2010 | | | 2009 | | | |
| | | | | | | | | | | | | | | | | | | | | | | | |
| Total Investment Return | | | | | | | | | | | | | | | | | | | | | | | | |
Total investment return | | | 1.81% | | | | (5.10)% | | | | 18.59% | | | | 33.94% | | | | (44.29)%1 | | | | 7.12% | |
| | | | | | | | | | | | | | | | | | | | | | | | |
| | | | | | | | | | | | | | | | | | | | | | | | |
| Ratios to Average Net Assets | | | | | | | | | | | | | | | | | | | | | | | | |
Total expenses | | | 0.81% | | | | 0.85% | | | | 1.03% | | | | 1.11% | | | | 1.04%2 | | | | 0.99% | |
| | | | | | | | | | | | | | | | | | | | | | | | |
Total expenses after fees waived | | | 0.81% | | | | 0.85% | | | | 1.03% | | | | 1.11% | | | | 1.04%2 | | | | 0.99% | |
| | | | | | | | | | | | | | | | | | | | | | | | |
Net investment income | | | 1.50% | | | | 0.64% | | | | 0.54% | | | | 1.89% | | | | 1.44%2 | | | | 1.90% | |
| | | | | | | | | | | | | | | | | | | | | | | | |
| | | | | | | | | | | | | | | | | | | | | | | | |
| Supplemental Data | | | | | | | | | | | | | | | | | | | | | | | | |
Net assets, end of period (000) | | | $ 709,589 | | | | $ 832,964 | | | | $ 65,318 | | | | $ 66,975 | | | | $ 59,217 | | | | $ 118,236 | |
| | | | | | | | | | | | | | | | | | | | | | | | |
Portfolio turnover | | | 117% | | | | 156% | | | | 154% | | | | 178% | | | | 78% | | | | 153% | |
| | | | | | | | | | | | | | | | | | | | | | | | |
| | 1 | | Aggregate total investment return. |
| | | | | | |
| See Notes to Financial Statements. | | | | |
| | | | | | | |
| 50 | | ANNUAL REPORT | | OCTOBER 31, 2012 | | |
| | |
| Notes to Financial Statements | | BlackRock Master International Portfolio |
1. Organization and Significant Accounting Policies:
BlackRock Master International Portfolio (the “Portfolio”), a series of BlackRock Master LLC (the “Master LLC”), is registered as an investment company under the Investment Company Act of 1940, as amended (the “1940 Act”), and is organized as a Delaware limited liability company. The Master LLC’s Limited Liability Company Agreement permits the Board of Directors of the Master LLC (the “Board”) to issue non-transferable interests, subject to certain limitations. The Portfolio’s financial statements are prepared in conformity with accounting principles generally accepted in the United States of America (“US GAAP”), which may require management to make estimates and assumptions that affect the reported amounts of assets and liabilities in the financial statements and the reported amount of increases and decreases in net assets from operations during the reporting period. Actual results could differ from those estimates.
The following is a summary of significant accounting policies followed by the Portfolio:
Valuation: US GAAP defines fair value as the price the Portfolio would receive to sell an asset or pay to transfer a liability in an orderly transaction between market participants at the measurement date. The Portfolio fair values its financial instruments at market value using independent dealers or pricing services under policies approved by the Board. The BlackRock Global Valuation Methodologies Committee (the “Global Valuation Committee”) is the committee formed by management to develop global pricing policies and procedures and to provide oversight of the pricing function for the Portfolio for all financial instruments.
Equity investments traded on a recognized securities exchange or the NASDAQ Global Market System (“NASDAQ”) are valued at the last reported sale price that day or the NASDAQ official closing price, if applicable. For equity investments traded on more than one exchange, the last reported sale price on the exchange where the stock is primarily traded is used. Equity investments traded on a recognized exchange for which there were no sales on that day are valued at the last available bid (long positions) or ask (short positions) price. If no bid or ask price is available, the prior day’s price will be used, unless it is determined that such prior day’s price no longer reflects the fair value of the security. Investments in open-end registered investment companies are valued at NAV each business day. Short-term securities with remaining maturities of 60 days or less may be valued at amortized cost, which approximates fair value.
Securities and other assets and liabilities denominated in foreign currencies are translated into US dollars using exchange rates determined as of the close of business on the New York Stock Exchange (“NYSE”). Foreign currency exchange contracts are valued at the mean between the bid and ask prices and are determined as of the close of business on the NYSE. Interpolated values are derived when the settlement date of the contract is an interim date for which quotations are not available.
In the event that application of these methods of valuation results in a price for an investment which is deemed not to be representative of the market value of such investment or if a price is not available, the investment will be valued by the Global Valuation Committee, or its delegate, in accordance with a policy approved by the Board as reflecting fair value (“Fair Value Assets”). When determining the price for Fair Value Assets,
the Global Valuation Committee, or its delegate, seeks to determine the price that the portfolio might reasonably expect to receive from the current sale of that asset in an arm’s-length transaction. Fair value determinations shall be based upon all available factors that the investment advisor and/or sub-advisor deems relevant consistent with the principles of fair value measurement which include the market approach, income approach and/or cost approach, as appropriate. A market approach generally consists of using comparable market transactions. The income approach generally is used to discount future cash flows to present value and adjusted for liquidity as appropriate. These factors include but are not limited to (i) attributes specific to the investment or asset; (ii) the principal market for the investment or asset; (iii) the customary participants in the principal market for the investment or asset; (iv) data assumptions by market participants for the investment or asset, if reasonably available; (v) quoted prices for similar investments or assets in active markets; and (vi) other factors, such as future cash flows, interest rates, yield curves, volatilities, prepayment speeds, loss severities, credit risks, recovery rates, liquidation amounts and/or default rates. Due to the inherent uncertainty of valuations of such investments, the fair values may differ from the values that would have been used had an active market existed. The Global Valuation Committee, or its delegate, employs various methods for calibrating valuation approaches for investments where an active market does not exist including regular due diligence of the Portfolio pricing vendors, a regular review of key inputs and assumptions, transactional back-testing or disposition analysis to compare unrealized gains and losses to realized gains and losses, reviews of missing or stale prices and large movements in market values and reviews of any market related activity. The pricing of all Fair Value Assets is subsequently reported to the Board or a committee thereof on a quarterly basis.
Generally, trading in foreign instruments is substantially completed each day at various times prior to the close of business on the NYSE. Occasionally, events affecting the values of such instruments may occur between the foreign market close and the close of business on the NYSE that may not be reflected in the computation of the Portfolio’s net assets. If events (for example, a company announcement, market volatility or a natural disaster) occur during such periods that are expected to effect the value of such instruments materially, those instruments may be Fair Value Assets and be valued at their fair value, as determined in good faith by the Global Valuation Committee using a pricing service and/or policies approved by the Board. Each business day, the Portfolio uses a pricing service to assist with the valuation of certain foreign exchange-traded equity securities and foreign exchange-traded and over-the-counter (“OTC”) options (the “Systematic Fair Value Price”). Using current market factors, the Systematic Fair Value Price is designed to value such foreign securities and foreign options at fair value as of the close of business on the NYSE, which follows the close of the local markets.
Foreign Currency: The Portfolio’s books and records are maintained in US dollars. Purchases and sales of investment securities are recorded at the rates of exchange prevailing on the respective date of such transactions. Generally, when the US dollar rises in value against a foreign currency, the Portfolio’s investments denominated in that currency will lose value because that currency is worth fewer US dollars; the opposite effect occurs if the US dollar falls in relative value.
| | | | | | |
| | | | | | | |
| | ANNUAL REPORT | | OCTOBER 31, 2012 | | 51 |
| | |
| Notes to Financial Statements (continued) | | BlackRock Master International Portfolio |
The Portfolio does not isolate the portion of the results of operations arising as a result of changes in the foreign exchange rates from the changes in the market prices of investments held or sold for financial reporting purposes. Accordingly, the effects of changes in foreign currency exchange rates on investments are segregated on the Statement of Operations from the effects of changes in market prices of those investments but are included as a component of net realized and unrealized gain (loss) from investments. The Portfolio reports realized currency gains (losses) on foreign currency related transactions as components of net realized gain (loss) for financial reporting purposes, whereas such components are treated as ordinary income for federal income tax purposes.
Segregation and Collateralization: In cases in which the 1940 Act and the interpretive positions of the Securities and Exchange Commission (“SEC”) require that the Portfolio either deliver collateral or segregate assets in connection with certain investments (e.g., foreign currency exchange contracts), the Portfolio will, consistent with SEC rules and/or certain interpretive letters issued by the SEC, segregate collateral or designate on its books and records cash or liquid securities having a market value at least equal to the amount that would otherwise be required to be physically segregated. Furthermore, based on requirements and agreements with certain exchanges and third party broker-dealers, the Portfolio engaging in such transactions may have requirements to deliver/deposit securities to/with an exchange or broker-dealer as collateral for certain investments.
Investment Transactions and Investment Income: For financial reporting purposes, investment transactions are recorded on the dates the transactions are entered into (the trade dates). Realized gains and losses on investment transactions are determined on the identified cost basis. Dividend income is recorded on the ex-dividend dates. Dividends from foreign securities where the ex-dividend date may have passed are subsequently recorded when the Portfolio is informed of the ex-dividend date. Under the applicable foreign tax laws, a withholding tax at various rates may be imposed on capital gains, dividends and interest. Upon notification from issuers, some of the dividend income received from a real estate investment trust may be redesignated as a reduction of cost of the related investment and/or realized gain. Interest income, including amortization and accretion of premiums and discounts on debt securities, is recognized on the accrual basis.
Income Taxes: The Portfolio is disregarded as an entity separate from its owner for tax purposes. As such, the owner of the Portfolio is treated as the owner of the net assets, income, expenses and realized and unrealized gains and losses of the Portfolio. Therefore, no federal tax provision is required. It is intended that the Portfolio’s assets will be managed so the owner of the Portfolio can satisfy the requirements of Subchapter M of the Internal Revenue Code of 1986, as amended.
Recent Accounting Standard: In December 2011, the Financial Accounting Standards Board issued guidance that will expand current disclosure requirements on the offsetting of certain assets and liabilities. The new disclosures will be required for investments and derivative financial instruments subject to master netting or similar agreements which are eligible for offset in the Statements of Assets and Liabilities and will require an entity to disclose both gross and net information about such
investments and transactions in the financial statements. The guidance is effective for financial statements with fiscal years beginning on or after January 1, 2013, and interim periods within those fiscal years. Management is evaluating the impact of this guidance on the Portfolio’s financial statement disclosures.
Other: Expenses directly related to the Portfolio are charged to the Portfolio. Other operating expenses shared by several funds are pro rated among those funds on the basis of relative net assets or other appropriate methods.
The Portfolio has an arrangement with the custodian whereby fees may be reduced by credits earned on uninvested cash balances, which, if applicable, are shown as fees paid indirectly in the Statement of Operations. The custodian imposes fees on overdrawn cash balances, which can be offset by accumulated credits earned or may result in additional custody charges.
2. Derivative Financial Instruments:
The Portfolio engages in various portfolio investment strategies using derivative contracts both to increase the returns of the Portfolio and to economically hedge, or protect, its exposure to certain risks such as foreign currency exchange rate risk. These contracts may be transacted on an exchange or OTC.
Losses may arise if the value of the contract decreases due to an unfavorable change in the market rates or values of the underlying instrument or if the counterparty does not perform under the contract. For OTC options purchased, the Portfolio bears the risk of loss in the amount of the premiums paid plus the positive change in market values net of any collateral received on the options should the counterparty fail to perform under the contracts. Options written by the Portfolio do not give rise to counterparty credit risk, as options written obligate the Portfolio to perform and not the counterparty. Counterparty risk related to exchange-traded financial futures contracts and options is deemed to be minimal due to the protection against defaults provided by the exchange on which these contracts trade.
The Portfolio may mitigate counterparty risk by procuring collateral and through netting provisions included within an International Swaps and Derivatives Association, Inc. master agreement (“ISDA Master Agreement”) implemented between the Portfolio and each of its respective counterparties. An ISDA Master Agreement allows the Portfolio to offset with each separate counterparty certain derivative financial instrument’s payables and/or receivables with collateral held. The amount of collateral moved to/from applicable counterparties is generally based upon minimum transfer amounts of up to $500,000. To the extent amounts due to the Portfolio from its counterparties are not fully collateralized contractually or otherwise, the Portfolio bears the risk of loss from counterparty non-performance. See Note 1 “Segregation and Collateralization” for information with respect to collateral practices. In addition, the Portfolio manages counterparty risk by entering into agreements only with counterparties that it believes have the financial resources to honor its obligations and by monitoring the financial stability of those counterparties.
| | | | | | |
| | | | | | | |
| 52 | | ANNUAL REPORT | | OCTOBER 31, 2012 | | |
| | |
| Notes to Financial Statements (continued) | | BlackRock Master International Portfolio |
Certain ISDA Master Agreements allow counterparties to OTC derivatives to terminate derivative contracts prior to maturity in the event the Portfolio’s net assets decline by a stated percentage or the Portfolio fails to meet the terms of its ISDA Master Agreements, which would cause the Portfolio to accelerate payment of any net liability owed to the counterparty.
Foreign Currency Exchange Contracts: The Portfolio enters into foreign currency exchange contracts as an economic hedge against either specific transactions or portfolio instruments or to obtain exposure to foreign currencies (foreign currency exchange rate risk). A foreign currency exchange contract is an agreement between two parties to buy and sell a currency at a set exchange rate on a future date. Foreign currency exchange contracts, when used by the Portfolio, help to manage the overall exposure to the currencies in which some of the investments held by the Portfolio are denominated. The contract is marked-to-market daily and the change in market value is recorded by the Portfolio as an unrealized gain or loss. When the contract is closed, the Portfolio records a realized gain or loss equal to the difference between the value at the time it was opened and the value at the time it was closed. The use of foreign currency exchange contracts involves the risk that the value of a foreign currency exchange contract changes unfavorably due to movements in the value of the referenced foreign currencies and the risk that a counterparty to the contract does not perform its obligations under the agreement.
| | | | | | |
| Derivative Financial Instruments Categorized by Risk Exposure: | |
| Fair Values of Derivative Financial Instruments as of October 31, 2012 | |
| Asset Derivatives | |
| | | Statement
of Assets and
Liabilities Location | | Value | |
| Foreign currency exchange contracts | | Unrealized appreciation on foreign currency exchange contracts | | $ | 758,518 | |
| Liability Derivatives | |
| | | Statement
of Assets and
Liabilities Location | | Value | |
| Foreign currency exchange contracts | | Unrealized depreciation on foreign currency exchange contracts | | $ | 884,911 | |
| | | | | | | |
| | | | |
The Effect of Derivative Financial Instruments
in the Statement of Operations
Year Ended October 31, 2012 | |
| | | Net Realized Gain From | |
| Foreign currency exchange contracts: | | | | |
Foreign currency transactions | | $ | 3,555,509 | |
| | | Net Change in Unrealized
Appreciation/Depreciation on | |
| Foreign currency exchange contracts: | | | | |
Foreign currency translations | | $ | (2,619,340 | ) |
For the year ended October 31, 2012, the average quarterly balances of outstanding derivative financial instruments were as follows:
| | | | |
| Foreign currency exchange contracts: | | | | |
Average number of contracts – US dollars purchased | | | 3 | |
Average number of contracts – US dollars sold | | | 4 | |
Average US dollar amount purchased | | $ | 26,201,512 | |
Average US dollar amounts purchased | | $ | 45,173,468 | |
3. Investment Advisory Agreement and Other Transactions with Affiliates:
The PNC Financial Services Group, Inc. (“PNC”) is the largest stockholder and an affiliate, for 1940 Act purposes, of BlackRock, Inc. (“BlackRock”).
The Master LLC, on behalf of the Portfolio, entered into an Investment Advisory Agreement with BlackRock Advisors, LLC (the “Manager”), the Portfolio’s investment advisor, an indirect, wholly owned subsidiary of BlackRock, to provide investment advisory and administration services. The Manager is responsible for the management of the Portfolio’s portfolio and provides the necessary personnel, facilities, equipment and certain other services necessary to the operations of the Portfolio. For such services, the Portfolio pays the Manager a monthly fee based on a percentage of the average daily net assets at the following rates:
| | | | |
| Average Daily Net Assets | | Investment
Advisory Fee | |
Not exceeding $500 Million. | | | 0.75% | |
In excess of $500 Million.. | | | 0.70% | |
The Manager voluntarily agreed to waive its investment advisory fees by the amount of investment advisory fees the Portfolio pays to the Manager indirectly through its investment in affiliated money market funds. However, the Manager does not waive its investment advisory fees by the amount of investment advisory fees paid in connection with the Portfolio’s investment in other affiliated investment companies, if any. These amounts are included in fees waived by manager in the Statement of Operations.
The Manager entered into a sub-advisory agreement with BlackRock International Limited (“BIL”), an affiliate of the Manager. The Manager pays BIL for services it provides, a monthly fee that is a percentage of the investment advisory fees paid by the Portfolio to the Manager.
For the year ended October 31, 2012, the Portfolio reimbursed the Manager $8,337 for certain accounting services, which are included in accounting services in the Statement of Operations.
Certain officers and/or directors of the Master LLC are officers and/or directors of BlackRock or its affiliates.
4. Investments:
Purchases and sales of investments, excluding short-term securities, for the year ended October 31, 2012, were $839,815,576 and $951,186,610, respectively.
5. Borrowings:
The Portfolio, along with certain other funds managed by the Manager and its affiliates, is a party to a $500 million credit agreement with a group of lenders. The Portfolio may borrow under the credit agreement to fund shareholder redemptions. Effective November 2010 to November 2011, the credit agreement had the following terms: a commitment fee of 0.08% per annum based on the Portfolio’s pro rata share of the unused portion of the credit agreement and interest at a rate equal to the higher of (a) the one-month London Interbank Offered Rate (“LIBOR”) plus 1.00% per annum or (b) the Fed Funds rate plus 1.00% per annum on amounts borrowed. In addition, the Portfolio paid administration and
| | | | | | |
| | | | | | | |
| | ANNUAL REPORT | | OCTOBER 31, 2012 | | 53 |
| | |
| Notes to Financial Statements (concluded) | | BlackRock Master International Portfolio |
arrangement fees, which were allocated to the Portfolio based on its net assets as of October 31, 2010. The credit agreement, which expired in November 2011, was renewed until November 2012. Effective November 2011 to November 2012, the credit agreement has the following terms: a commitment fee of 0.065% per annum based on the Portfolio’s pro rata share of the unused portion of the credit agreement and interest at a rate equal to the higher of (a) the one-month LIBOR plus 0.80% per annum or (b) the Fed Funds rate plus 0.80% per annum on amounts borrowed. In addition, the Portfolio paid administration and arrangement fees which were allocated to the Portfolio based on its net assets as of October 31, 2011. The Portfolio did not borrow under the credit agreement during the year ended October 31, 2012.
6. Geographic, Market and Credit Risk:
In the normal course of business, the Portfolio invests in securities and enters into transactions where risks exist due to fluctuations in the market (market risk) or failure of the issuer of a security to meet all its obligations (issuer credit risk). The value of securities held by the Portfolio may decline in response to certain events, including those directly involving the issuers whose securities are owned by the Portfolio; conditions affecting the general economy; overall market changes; local, regional or global political, social or economic instability; and currency and interest rate and price fluctuations. Similar to issuer credit risk, the Portfolio may be exposed to counterparty credit risk, or the risk that an entity with which the Portfolio has unsettled or open transactions may fail to or be unable to perform on its commitments. The Portfolio manages counterparty credit risk by entering into transactions only with counterparties that it believes have the financial resources to honor their obligations and by monitoring the financial stability of those counterparties. Financial assets, which potentially expose the Portfolio to market, issuer and counterparty credit risks, consist principally of financial instruments and receivables due from counterparties. The extent of the Portfolio’s exposure to market, issuer and counterparty credit risks with respect to these financial assets is generally approximated by their value recorded in the Statement of Assets and Liabilities, less any collateral held by the Portfolio.
As of October 31, 2012, the Portfolio had the following industry classifications:
| | | | |
| Industry | | Percent of
Long-Term
Investments | |
Pharmaceuticals | | | 12 | % |
Commercial Banks | | | 12 | |
Oil, Gas & Consumable Fuels | | | 10 | |
Wireless Telecommunications Services | | | 10 | |
Media | | | 6 | |
Tobacco | | | 6 | |
Chemicals | | | 5 | |
Machinery | | | 5 | |
Other1 | | | 34 | |
| 1 | | All other industries held were each less than 5% of long-term investments. |
7. Reorganization:
On August 15, 2011, an investor of the Portfolio acquired all of the net assets of BlackRock International Value Fund of BlackRock International Value Trust, pursuant to a plan of reorganization. As a result of the reorganization, which included $69,943,465 of net unrealized depreciation, the Portfolio received an in-kind contribution of portfolio securities.
8. Subsequent Events:
Management has evaluated the impact of all subsequent events on the Portfolio through the date the financial statements were issued and has determined that there were no subsequent events requiring adjustment or additional disclosure in the financial statements.
| | | | | | |
| | | | | | | |
| 54 | | ANNUAL REPORT | | OCTOBER 31, 2012 | | |
| | |
| Report of Independent Registered Public Accounting Firm | | BlackRock Master International Portfolio |
To the Investor and Board of Directors of BlackRock Master LLC:
We have audited the accompanying statement of assets and liabilities, including the schedule of investments, of BlackRock Master International Portfolio, one of the series constituting BlackRock Master LLC (the “Master LLC”) as of October 31, 2012, and the related statement of operations for the year then ended, the statements of changes in net assets for each of the two years in the period then ended and the financial highlights for each of the periods presented. These financial statements and financial highlights are the responsibility of the Master LLC’s management. Our responsibility is to express an opinion on these financial statements and financial highlights based on our audits.
We conducted our audits in accordance with the standards of the Public Company Accounting Oversight Board (United States). Those standards require that we plan and perform the audit to obtain reasonable assurance about whether the financial statements and financial highlights are free of material misstatement. The Master LLC is not required to have, nor were we engaged to perform, an audit of its internal control over financial reporting. Our audits included consideration of internal control over financial reporting as a basis for designing audit procedures that are appropriate in the circumstances, but not for the purpose of expressing an opinion on the effectiveness of the Master LLC’s internal control over
financial reporting. Accordingly, we express no such opinion. An audit also includes examining, on a test basis, evidence supporting the amounts and disclosures in the financial statements, assessing the accounting principles used and significant estimates made by management, as well as evaluating the overall financial statement presentation. Our procedures included confirmation of securities owned as of October 31, 2012, by correspondence with the custodian and brokers; where replies were not received from brokers, we performed other auditing procedures. We believe that our audits provide a reasonable basis for our opinion.
In our opinion, the financial statements and financial highlights referred to above present fairly, in all material respects, the financial position of BlackRock Master International Portfolio of BlackRock Master LLC as of October 31, 2012, the results of its operations for the year then ended, the changes in its net assets for each of the two years in the period then ended and the financial highlights for each of the periods presented, in conformity with accounting principles generally accepted in the United States of America.
Deloitte & Touche LLP
Boston, Massachusetts
December 21, 2012
| | | | | | |
| | | | | | | |
| | ANNUAL REPORT | | OCTOBER 31, 2012 | | 55 |
| | | | |
| Disclosure of Investment Advisory Agreements and Sub-Advisory Agreements |
The Board of Directors of BlackRock Emerging Markets Fund, Inc. (“Emerging Markets Fund”) met on April 17, 2012 and May 15-16, 2012 to consider the approval of Emerging Markets Fund’s investment advisory agreement (the “Emerging Markets Advisory Agreement”) with BlackRock Advisors, LLC (the “Manager”), its investment advisor. The Board of Directors of Emerging Markets Fund also considered the approval of the separate sub-advisory agreements (the “Emerging Markets Sub-Advisory Agreements”) (i) between the Manager and BlackRock International Limited (“BIL”) and (ii) between the Manager and BlackRock Investment Management, LLC (“BIM,” and together with BIL, the “Sub-Advisors”).
The Board of Directors of BlackRock Latin America Fund, Inc. (“Latin America Fund”) met on April 17, 2012 and May 15-16, 2012 to consider the approval of Latin America Fund’s investment advisory agreement (the “Latin America Advisory Agreement”) with the Manager, its investment advisor. The Board of Directors of Latin America Fund also considered the approval of the separate sub-advisory agreements (the “Latin America Sub-Advisory Agreements”) (i) between the Manager and BIL and (ii) between the Manager and BIM.
The Board of Directors of BlackRock Master LLC (the “Master LLC”) met on April 17, 2012 and May 15-16, 2012 to consider the approval of the investment advisory agreement (the “Master LLC Advisory Agreement”) with the Manager, the Master LLC’s investment advisor, on behalf of BlackRock Master International Portfolio (the “Master Portfolio”), a series of the Master LLC. The Board of Directors of the Master LLC also considered the approval of the sub-advisory agreement between the Manager and BIL with respect to the Master Portfolio (the “Master LLC Sub-Advisory Agreement” and together with the Master LLC Advisory Agreement, the “Master LLC Agreements”). BlackRock International Fund (“International Fund”), a series of BlackRock Series, Inc. (“Series Fund”), is a “feeder” fund that invests all of its investable assets in the Master Portfolio. Accordingly, the Board of Directors of Series Fund also considered the approval of the Master LLC Agreements.
Emerging Markets Fund, Latin America Fund, the Master LLC (with respect to the Master Portfolio) and Series Fund (with respect to International Fund) are referred to herein individually as a “Fund” or collectively as the “Funds.” The Manager and the Sub-Advisors are referred to herein as “BlackRock.” The Emerging Markets Advisory Agreement, the Emerging Markets Sub-Advisory Agreements, the Latin America Advisory Agreement, the Latin America Sub-Advisory Agreements, the Master LLC Advisory Agreement and the Master LLC Sub-Advisory Agreement are referred to herein as the “Agreements.” For simplicity, the Board of Directors of Emerging Markets Fund, the Board of Directors of Latin America Fund, the Board of Directors of the Master LLC and the Board of Directors of Series Fund, which are comprised of the same fourteen individuals, are referred to herein individually as the “Board” and collectively as the “Boards” and the members are referred to as “Board Members.”
Activities and Composition of the Boards
Each Board consists of fourteen individuals, twelve of whom are not “interested persons” of any Fund as defined in the Investment Company Act of 1940, as amended (the “1940 Act”) (the “Independent Board Members”). The Board Members are responsible for the oversight of the operations of the Funds and perform the various duties imposed on the directors of investment
companies by the 1940 Act. The Independent Board Members have retained independent legal counsel to assist them in connection with their duties. The Co-Chairs of the Boards are each Independent Board Members. Each Board has established five standing committees: an Audit Committee, a Governance and Nominating Committee, a Compliance Committee, a Performance Oversight and Contract Committee and an Executive Committee, each of which is chaired by an Independent Board Member and composed of Independent Board Members (except for the Executive Committee, which also has one interested Board Member).
The Agreements
Pursuant to the 1940 Act, the Boards are required to consider the continuation of the Agreements on an annual basis. The Boards have four quarterly meetings per year, each extending over two days, and a fifth meeting to consider specific information surrounding the consideration of renewing the Agreements. In connection with this process, the Boards assessed, among other things, the nature, scope and quality of the services provided to the Funds by BlackRock, its personnel and its affiliates, including investment management, administrative and shareholder services, oversight of fund accounting and custody, marketing services, risk oversight, compliance and assistance in meeting applicable legal and regulatory requirements.
The Boards, acting directly and through their committees, consider at each of their meetings, and from time to time as appropriate, factors that are relevant to their annual consideration of the renewal of the Agreements, including the services and support provided by BlackRock to the Funds and their shareholders. Among the matters the Boards considered, with respect to each Fund, were: (a) investment performance for one-, three- and five-year periods, as applicable, against peer funds, and applicable benchmarks, if any, as well as senior management’s and portfolio managers’ analysis of the reasons for any over performance or underperformance against the Fund’s peers and/or benchmark, as applicable; (b) fees, including advisory, administration, if applicable, and other amounts paid to BlackRock and its affiliates by the Fund for services, such as marketing and distribution, call center and fund accounting; (c) Fund operating expenses and how BlackRock allocates expenses to the Funds; (d) the resources devoted to, risk oversight of, and compliance reports relating to, implementation of the Fund’s investment objective, policies and restrictions; (e) the compliance of each Fund with its respective Code of Ethics and other compliance policies and procedures; (f) the nature, cost and character of non-investment management services provided by BlackRock and its affiliates; (g) BlackRock’s and other service providers’ internal controls and risk and compliance oversight mechanisms; (h) BlackRock’s implementation of the proxy voting policies approved by the Boards; (i) the use of brokerage commissions and execution quality of portfolio transactions; (j) BlackRock’s implementation of each Fund’s valuation and liquidity procedures; (k) an analysis of management fees for products with similar investment objectives across the open-end fund, exchange traded fund (“ETF”), closed-end fund and institutional account product channels, as applicable; (l) BlackRock’s compensation methodology for its investment professionals and the incentives it creates; and (m) periodic updates on BlackRock’s business.
The Boards have engaged in an ongoing strategic review with BlackRock of opportunities to consolidate funds and of BlackRock’s commitment to
| | | | | | |
| | | | | | | |
| 56 | | ANNUAL REPORT | | OCTOBER 31, 2012 | | |
| | |
| Disclosure of Investment Advisory Agreements and Sub-Advisory Agreements (continued) |
investment performance. In addition, the Boards requested, to the extent reasonably possible, an analysis of the risk and return relative to selected funds in peer groups. BlackRock provides information to the Boards in response to specific questions. These questions covered issues such as profitability, investment performance and management fee levels. The Boards considered the importance of: (i) managing fixed income assets with a view toward preservation of capital; (ii) portfolio managers’ investments in the funds they manage; (iii) BlackRock’s controls surrounding the coding of quantitative investment models; and (iv) BlackRock’s oversight of relationships with third party service providers.
Board Considerations in Approving the Agreements
The Approval Process: Prior to the April 17, 2012 meeting, the Boards requested and received materials specifically relating to the Agreements. The Boards are engaged in a process with their independent legal counsel and BlackRock to review periodically the nature and scope of the information provided to better assist their deliberations. The materials provided in connection with the April meeting included (a) information independently compiled and prepared by Lipper, Inc. (“Lipper”) on fees and expenses of each Fund and the investment performance of Emerging Markets Fund, Latin America Fund and International Fund as compared with a peer group of funds as determined by Lipper (collectively, “Peers”); (b) information on the profitability of the Agreements to BlackRock and a discussion of fall-out benefits to BlackRock and its affiliates; (c) a general analysis provided by BlackRock concerning investment management fees (a combination of the advisory fee and the administration fee, if any) charged to other clients, such as institutional clients, ETFs and closed-end funds, under similar investment mandates, as well as the performance of such other clients, as applicable; (d) the existence, impact and sharing of potential economies of scale; (e) a summary of aggregate amounts paid by each Fund to BlackRock; (f) sales and redemption data regarding the shares of Emerging Markets Fund, Latin America Fund and International Fund; and (g) if applicable, a comparison of management fees to similar BlackRock open-end funds, as classified by Lipper.
At an in-person meeting held on April 17, 2012, each Board reviewed materials relating to its consideration of the pertinent Agreements. As a result of the discussions that occurred during the April 17, 2012 meeting, and as a culmination of each Board’s year-long deliberative process, the Boards presented BlackRock with questions and requests for additional information. BlackRock responded to these requests with additional written information in advance of the May 15-16, 2012 Board meeting.
At an in-person meeting held on May 15-16, 2012, (a) the Board Members of Emerging Markets Fund, including the Independent Board Members, unanimously approved the continuation of (i) the Emerging Markets Advisory Agreement between the Manager and Emerging Markets Fund, (ii) the Emerging Markets Sub-Advisory Agreement between the Manager and BIL and (iii) the Emerging Markets Sub-Advisory Agreement between the Manager and BIM, each for a one-year term ending June 30, 2013; (b) the Board Members of Latin America Fund, including the Independent Board Members, unanimously approved the continuation of (i) the Latin America Advisory Agreement between the Manager and Latin America Fund, (ii) the Latin America Sub-Advisory Agreement between the Manager and BIL and (iii) the Latin America Sub-Advisory Agreement between the Manager and BIM, each for a one-year term ending June 30,
2013; and (c) the Board Members of the Master LLC, including the Independent Board Members, unanimously approved the continuation of (i) the Master LLC Advisory Agreement between the Manager and the Master LLC on behalf of the Master Portfolio and (ii) the Master LLC Sub-Advisory Agreement between the Manager and BIL with respect to the Master Portfolio, each for a one-year term ending June 30, 2013. The Board Members of Series Fund, including the Independent Board Members, also considered the continuation of the Master LLC Agreements and found the Master LLC Agreements to be satisfactory.
In approving the continuation of the Agreements, each Board considered, with respect to the applicable Fund: (a) the nature, extent and quality of the services provided by BlackRock; (b) the investment performance of the Fund and BlackRock; (c) the advisory fee and the cost of the services and profits to be realized by BlackRock and its affiliates from their relationship with the Fund; (d) economies of scale; (e) fall-out benefits to BlackRock as a result of its relationship with the Fund; and (f) other factors deemed relevant by the Board Members.
Each Board also considered other matters it deemed important to the approval process, such as payments made to BlackRock or its affiliates relating to the distribution of the applicable Fund’s shares and securities lending, services related to the valuation and pricing of portfolio holdings of the applicable Fund, direct and indirect benefits to BlackRock and its affiliates from their relationship with the applicable Fund and advice from independent legal counsel with respect to the review process and materials submitted for the Board’s review. Each Board noted the willingness of BlackRock personnel to engage in open, candid discussions with the Board. The Boards did not identify any particular information as controlling, and each Board Member may have attributed different weights to the various items considered.
A. Nature, Extent and Quality of the Services Provided by BlackRock: Each Board, including the Independent Board Members, reviewed the nature, extent and quality of services provided by BlackRock, including the investment advisory services and the resulting performance of the applicable Fund. Throughout the year, each Board compared Fund performance to the performance of a comparable group of mutual funds and/or the performance of a relevant benchmark, if any. The Boards met with BlackRock’s senior management personnel responsible for investment operations, including the senior investment officers. Each Board also reviewed the materials provided by the applicable Fund’s portfolio management team discussing Fund performance and the Fund’s investment objective, strategies and outlook.
Each Board considered, among other factors, the number, education and experience of BlackRock’s investment personnel generally and the applicable Fund’s portfolio management team, investments by portfolio managers in the funds they manage, BlackRock’s portfolio trading capabilities, BlackRock’s use of technology, BlackRock’s commitment to compliance, BlackRock’s credit analysis capabilities, BlackRock’s risk analysis and oversight capabilities and BlackRock’s approach to training and retaining portfolio managers and other research, advisory and management personnel. Each Board engaged in a review of BlackRock’s compensation structure with respect to the applicable Fund’s portfolio management team and BlackRock’s ability to attract and retain high-quality talent and create performance incentives.
| | | | | | |
| | | | | | | |
| | ANNUAL REPORT | | OCTOBER 31, 2012 | | 57 |
| | | | |
| Disclosure of Investment Advisory Agreements and Sub-Advisory Agreements (continued) |
In addition to advisory services, the Boards considered the quality of the administrative and non-investment advisory services provided to the Funds. BlackRock and its affiliates provide the Funds with certain administrative, shareholder and other services (in addition to any such services provided to the Funds by third parties) and officers and other personnel as are necessary for the operations of the Funds. In particular, BlackRock and its affiliates provide the Funds with the following administrative services, including, among others: (i) preparing disclosure documents, such as the prospectus, the statement of additional information and periodic shareholder reports; (ii) assisting with daily accounting and pricing; (iii) overseeing and coordinating the activities of other service providers; (iv) organizing Board meetings and preparing the materials for such Board meetings; (v) providing legal and compliance support; and (vi) performing other administrative functions necessary for the operation of each Fund, such as tax reporting, fulfilling regulatory filing requirements and call center services. The Boards reviewed the structure and duties of BlackRock’s fund administration, accounting, legal and compliance departments and considered BlackRock’s policies and procedures for assuring compliance with applicable laws and regulations.
B. The Investment Performance of each Fund and BlackRock: The Boards, including the Independent Board Members, also reviewed and considered the performance history of Emerging Markets Fund, Latin America Fund and the Master Portfolio/International Fund, as applicable. The Board Members of each of the Master LLC and Series Fund noted that the Master Portfolio’s investment results correspond directly to the investment results of International Fund. In preparation for the April 17, 2012 meeting, the Boards worked with their independent legal counsel, BlackRock and Lipper to develop a template for, and were provided with, reports independently prepared by Lipper, which included a comprehensive analysis of the performance of each of Emerging Markets Fund, Latin America Fund and International Fund. The Boards also reviewed a narrative and statistical analysis of the Lipper data that was prepared by BlackRock, which analyzed various factors that affect Lipper’s rankings. In connection with their review, the Boards received and reviewed information regarding the investment performance of Emerging Markets Fund, Latin America Fund and International Fund as compared to funds in the applicable Lipper category. The Boards were provided with a description of the methodology used by Lipper to select peer funds and periodically meet with Lipper representatives to review their methodology. Each Board and the Board’s Performance Oversight and Contract Committee regularly review, and meet with Fund management to discuss, the performance of the Fund throughout the year.
The Board of Emerging Markets Fund noted that, in general, Emerging Markets Fund performed better than its Peers in that the Fund’s performance was at or above the median of its Lipper Performance Universe in each of the one-, three- and five-year periods reported.
The Boards of each of the Master LLC, Series Fund and Latin America Fund noted that, in general, International Fund and Latin America Fund each performed better than its Peers in that each Fund’s performance was at or above the median of its Lipper Performance Universe in the three- and five-year periods reported, although performance for the one-year period reported was below the median. The Boards and BlackRock reviewed and discussed the reasons for the underperformance of these Funds during the one-year-period and will monitor closely the performance of each of these Funds in the coming year.
C. Consideration of the Advisory/Management Fees and the Cost of the Services and Profits to be Realized by BlackRock and its Affiliates from their Relationship with the Funds: Each Board, including the Independent Board Members, reviewed the applicable contractual management fee rate of each of Emerging Markets Fund, Latin America Fund and Master Portfolio/International Fund compared with the other funds in the applicable Fund’s Lipper category. Each Board also compared the total expense ratio, as well as the actual management fee ratio, of Emerging Markets Fund, Latin America Fund and Master Portfolio/International Fund to those of other funds in the applicable Fund’s Lipper category. Each Board considered the services provided and the fees charged by BlackRock to other types of clients with similar investment mandates, including separately managed institutional accounts.
The Boards received and reviewed statements relating to BlackRock’s financial condition and profitability with respect to the services it provided the Funds. Each Board was also provided with a profitability analysis that detailed the revenues earned and the expenses incurred by BlackRock for services provided to the Funds. The Boards reviewed BlackRock’s profitability with respect to the Funds and other funds the Board currently oversees for the year ended December 31, 2011 compared to available aggregate profitability data provided for the years ended December 31, 2010 and December 31, 2009. The Boards reviewed BlackRock’s profitability with respect to other fund complexes managed by the Manager and/or its affiliates. The Boards reviewed BlackRock’s assumptions and methodology of allocating expenses in the profitability analysis, noting the inherent limitations in allocating costs among various advisory products. The Boards recognized that profitability may be affected by numerous factors including, among other things, fee waivers and expense reimbursements by the Manager, the types of funds managed, expense allocations and business mix, and the difficulty of comparing profitability as a result of those factors.
The Boards noted that, in general, individual fund or product line profitability of other advisors is not publicly available. The Boards considered BlackRock’s operating margin, in general, compared to the operating margin for leading investment management firms whose operations include advising open-end funds, among other product types. In addition, the Boards considered, among other things, certain third party data comparing BlackRock’s operating margin with that of other publicly-traded asset management firms. The Boards considered the differences between BlackRock and these other firms, including the contribution of technology at BlackRock, BlackRock’s expense management and the relative product mix.
In addition, each Board considered the cost of the services provided to the applicable Fund by BlackRock, and BlackRock’s and its affiliates’ profits relating to the management and distribution of the applicable Fund and the other funds advised by BlackRock and its affiliates. As part of its analysis, each Board reviewed BlackRock’s methodology in allocating its costs to the management of the applicable Fund. Each Board also considered whether BlackRock has the financial resources necessary to attract and retain high quality investment management personnel to perform its obligations under the Agreements and to continue to provide the high quality of services that is expected by that Board.
The Board of each of Emerging Markets Fund and Latin America Fund noted that the contractual management fee ratio (a combination of the
| | | | | | |
| | | | | | | |
| 58 | | ANNUAL REPORT | | OCTOBER 31, 2012 | | |
| | |
| Disclosure of Investment Advisory Agreements and Sub-Advisory Agreements (concluded) |
advisory fee and the administration fee, if any) of each of these Funds was lower than or equal to the median contractual management fee ratio paid by the respective Fund’s Peers, in each case before taking into account any expense reimbursements or fee waivers.
The Board of each of the Master LLC and Series Fund noted that the contractual management fee ratio (a combination of the advisory fee and the administration fee, if any) of the Master Portfolio/International Fund was above the median contractual management fee paid by International Fund’s Peers, in each case before taking into account any expense reimbursements or fee waivers. The Boards also noted, however, that the actual management fee ratio of the Master Portfolio/International Fund, after giving effect to any expense reimbursements or fee waivers by BlackRock, was reasonable relative to the median actual management fee ratio paid by International Fund’s Peers, after giving effect to any expense reimbursements or fee waivers. The Boards also noted that BlackRock has contractually agreed to waive fees and/or reimburse expenses in order to limit, to a specified amount, International Fund’s total operating expenses as a percentage of International Fund’s average daily net assets on a class-by-class basis, as applicable.
The Boards also noted that each of Emerging Markets Fund, Latin America Fund and the Master Portfolio has an advisory fee arrangement that adjusts the fee rate downward as the size of Emerging Markets Fund, Latin America Fund or the Master Portfolio, as applicable, increases above certain contractually specified levels.
D. Economies of Scale: Each Board, including the Independent Board Members, considered the extent to which economies of scale might be realized as the assets of the applicable Fund increase, as well as the existence of expense caps. Each Board also considered the extent to which the applicable Fund benefits from such economies and whether there should be changes in the advisory fee rate or structure in order to enable Emerging Markets Fund, Latin America Fund, the Master Portfolio and International Fund, as applicable, to participate in these economies of scale, for example through the use of revised breakpoints in the advisory fee based upon the asset level of the applicable Fund’s asset level. In its consideration, each Board took into account the existence of expense caps and further considered the continuation and/or implementation, as applicable, of such caps.
E. Other Factors Deemed Relevant by the Board Members: Each Board, including the Independent Board Members, also took into account other ancillary or “fall-out” benefits that BlackRock or its affiliates and significant shareholder may derive from their respective relationships with the applicable Fund, both tangible and intangible, such as BlackRock’s ability to leverage its investment professionals who manage other portfolios and risk management personnel, an increase in BlackRock’s profile in the investment advisory community, and the engagement of BlackRock’s affiliates as service providers to the Fund, including for administrative, distribution, securities lending and cash management services. The Boards also considered BlackRock’s overall operations and its efforts to expand the scale of, and improve the quality of, its operations. The Boards also noted that BlackRock may use and benefit from third party research obtained by soft dollars generated by certain registered fund transactions to assist in managing all or a number of its other client
accounts. Each Board further noted that it had considered the investment by BlackRock’s funds in ETFs without any offset against the management fees payable by the funds to BlackRock.
In connection with their consideration of the Agreements, the Boards also received information regarding BlackRock’s brokerage and soft dollar practices. The Boards received reports from BlackRock which included information on brokerage commissions and trade execution practices throughout the year.
The Boards noted the competitive nature of the open-end fund marketplace, and that shareholders are able to redeem their Fund shares if they believe that the applicable Fund’s fees and expenses are too high or if they are dissatisfied with the performance of the Fund.
Conclusion
The Board Members of Emerging Markets Fund, including the Independent Board Members, unanimously approved the continuation of (i) the Emerging Markets Advisory Agreement between the Manager and Emerging Markets Fund, (ii) the Emerging Markets Sub-Advisory Agreement between the Manager and BIL and (iii) the Emerging Markets Sub-Advisory Agreement between the Manager and BIM, each for a one-year term ending June 30, 2013. The Board Members of Latin America Fund, including the Independent Board Members, unanimously approved the continuation of (i) the Latin America Advisory Agreement between the Manager and Latin America Fund, (ii) the Latin America Sub-Advisory Agreement between the Manager and BIL and (iii) the Latin America Sub-Advisory Agreement between the Manager and BIM, each for a one-year term ending June 30, 2013. The Board Members of the Master LLC, including the Independent Board Members, unanimously approved the continuation of (i) the Master LLC Advisory Agreement between the Manager and the Master LLC with respect to the Master Portfolio and (ii) the Master LLC Sub-Advisory Agreement between the Manager and BIL with respect to the Master Portfolio, each for a one-year term ending June 30, 2013. Based upon its evaluation of all of the aforementioned factors in their totality, the Board of each of Emerging Markets Fund, Latin America Fund and the Master LLC, including the Independent Board Members, was satisfied that the terms of the Agreements were fair and reasonable and in the best interest of the applicable Fund and its shareholders. The Board of Series Fund, including the Independent Board Members, also considered the continuation of the Master LLC Agreements and found the Master LLC Agreements to be satisfactory.
In arriving at a decision to approve the applicable Agreements, the Boards did not identify any single factor or group of factors as all-important or controlling, but considered all factors together, and different Board Members may have attributed different weights to the various factors considered. The Independent Board Members were also assisted by the advice of independent legal counsel in making this determination. The contractual fee arrangements for each of Emerging Markets Fund, Latin America Fund and the Master Portfolio reflect the results of several years of review by the pertinent Board Members and predecessor Board Members, and discussions between such Board Members (and predecessor Board Members) and BlackRock. As a result, the Board Members’ conclusions may be based in part on their consideration of these arrangements in prior years.
| | | | | | |
| | | | | | | |
| | ANNUAL REPORT | | OCTOBER 31, 2012 | | 59 |
| | | | | | | | | | |
Name, Address
and Year of Birth | | Position(s)
Held with
Funds/
Master LLC | | Length
of Time
Served as
a Director2 | | Principal Occupation(s) During Past Five Years | | Number of BlackRock-
Advised Registered
Investment Companies
(“RICs”) Consisting of
Investment Portfolios
(“Portfolios”) Overseen | | Public
Directorships |
| Independent Directors1 | | | | | | | | | | |
Ronald W. Forbes 55 East 52nd Street
New York, NY 10055 1940 | | Co-Chairman of the Board and Director | | Since
2000 | | Professor Emeritus of Finance, School of Business, State University of New York at Albany since 2000. | | 33 RICs consisting of
103 Portfolios | | None |
Rodney D. Johnson 55 East 52nd Street
New York, NY 10055 1941 | | Co-Chairman of the Board and Director | | Since
2007 | | President, Fairmount Capital Advisors, Inc. since 1987; Member of the Archdiocesan Investment Committee of the Archdiocese of Philadelphia since 2004; Director, The Committee of Seventy (civic) since 2006; Director, Fox Chase Cancer Center from 2004 to 2011. | | 33 RICs consisting of
103 Portfolios | | None |
David O. Beim 55 East 52nd Street
New York, NY 10055 1940 | | Director | | Since
2007 | | Professor of Professional Practice at the Columbia University Graduate School of Business since 1991; Trustee, Phillips Exeter Academy since 2002; Chairman, Wave Hill, Inc. (public garden and cultural center) from 1990 to 2006. | | 33 RICs consisting of
103 Portfolios | | None |
Dr. Matina S. Horner 55 East 52nd Street
New York, NY 10055 1939 | | Director | | Since
2007 | | Executive Vice President of Teachers Insurance and Annuity Association and College Retirement Equities Fund from 1989 to 2003. | | 33 RICs consisting of
103 Portfolios | | NSTAR (electric and gas utility) |
Herbert I. London 55 East 52nd Street
New York, NY 10055 1939 | | Director | | Since
2007 | | Professor Emeritus, New York University since 2005; John M. Olin Professor of Humanities, New York University from 1993 to 2005 and Professor thereof from 1980 to 2005; President Emeritus, Hudson Institute (policy research organization) since 2011, President thereof from 1997 to 2011 and Trustee since 1980; Chairman of the Board of Trustees for Grantham University since 2006; Director, InnoCentive, Inc. (strategic solutions company) since 2005; Director, Cerego, LLC (software development and design) since 2005; Director, Cybersettle (dispute resolution technology) since 2009. | | 33 RICs consisting of
103 Portfolios | | AIMS Worldwide, Inc. (marketing) |
Ian A. MacKinnon 55 East 52nd Street
New York, NY 10055 1948 | | Director | | Since
2012 | | Director, Kennett Capital, Inc. (investments) since 2006; Director, Free Library of Philadelphia from 1999 to 2008. | | 33 RICs consisting of
103 Portfolios | | None |
Cynthia A. Montgomery 55 East 52nd Street
New York, NY 10055 1952 | | Director | | Since
2000 | | Professor, Harvard Business School since 1989; Director, McLean Hospital since 2005; Director, Harvard Business School Publishing from 2005 to 2010. | | 33 RICs consisting of
103 Portfolios | | Newell Rubbermaid, Inc. (manufacturing) |
Joseph P. Platt 55 East 52nd Street
New York, NY 10055 1947 | | Director | | Since
2007 | | Director, The West Penn Allegheny Health System (a not-for-profit health system) since 2008; Director, Jones and Brown (Canadian insurance broker) since 1998; General Partner, Thorn Partners, LP (private investments) since 1998; Director, WQED Multi-Media (public broadcasting not-for-profit) since 2001; Partner, Amarna Corporation, LLC (private investment company) from 2002 to 2008. | | 33 RICs consisting of
103 Portfolios | | Greenlight Capital Re, Ltd (reinsurance company) |
Robert C. Robb, Jr. 55 East 52nd Street
New York, NY 10055 1945 | | Director | | Since
2007 | | Partner, Lewis, Eckert, Robb and Company (management and financial consulting firm) since 1981. | | 33 RICs consisting of
103 Portfolios | | None |
Toby Rosenblatt 55 East 52nd Street
New York, NY 10055 1938 | | Director | | Since
2007 | | President, Founders Investments Ltd. (private investments) since 1999; Director, Forward Management, LLC since 2007; Director, College Access Foundation of California (philanthropic foundation) since 2009; Director, A.P. Pharma, Inc. (specialty pharmaceuticals) from 1983 to 2011; Director, The James Irvine Foundation (philanthropic foundation) from 1998 to 2008. | | 33 RICs consisting of
103 Portfolios | | None |
| | | | | | |
| | | | | | | |
| 60 | | ANNUAL REPORT | | OCTOBER 31, 2012 | | |
| | |
| Officers and Directors (continued) | | |
| | | | | | | | | | |
Name, Address
and Year of Birth | | Position(s)
Held with
Funds/
Master LLC | | Length
of Time
Served as
a Director2 | | Principal Occupation(s) During Past Five Years | | Number of BlackRock-
Advised Registered
Investment Companies
(“RICs”) Consisting of
Investment Portfolios
(“Portfolios”) Overseen | | Public
Directorships |
| Independent Directors1 (concluded) | | | | | | | | |
Kenneth L. Urish 55 East 52nd Street New York, NY 10055 1951 | | Director | | Since
2007 | | Managing Partner, Urish Popeck & Co., LLC (certified public accountants and consultants) since 1976; Chairman Elect of the Professional Ethics Committee of the Pennsylvania Institute of Certified Public Accountants and Committee Member thereof since 2007; Member of External Advisory Board, The Pennsylvania State University Accounting Department since 2001; Trustee, The Holy Family Institute from 2001 to 2010; President and Trustee, Pittsburgh Catholic Publishing Associates from 2003 to 2008; Director, Inter-Tel from 2006 to 2007. | | 33 RICs consisting of
103 Portfolios | | None |
Frederick W. Winter 55 East 52nd Street New York, NY 10055 1945 | | Director | | Since
2007 | | Professor and Dean Emeritus of the Joseph M. Katz School of Business, University of Pittsburgh since 2005 and Dean thereof from 1997 to 2005; Director, Alkon Corporation (pneumatics) since 1992; Director, Tippman Sports (recreation) since 2005; Director, Indotronix International (IT services) from 2004 to 2008. | | 33 RICs consisting of
103 Portfolios | | None |
| | 1 Directors serve until their resignation, removal or death, or until December 31 of the year in which they turn 72. The Board has approved extensions in terms of Directors who turn 72 prior to December 31, 2013. |
| | 2 Date shown is the earliest date a person has served for the Funds/Master LLC covered by this annual report. Following the combination of Merrill Lynch Investment Managers, L.P. (“MLIM”) and BlackRock, Inc. (“BlackRock”) in September 2006, the various legacy MLIM and legacy BlackRock Fund boards were realigned and consolidated into three new Fund boards in 2007. As a result, although the chart shows certain Directors as joining the Funds’/Master LLC’s board in 2007, each Director first became a member of the board of other legacy MLIM or legacy BlackRock Funds as follows: David O. Beim, 1998; Ronald W. Forbes, 1977; Dr. Matina S. Horner, 2004; Rodney D. Johnson, 1995; Herbert I. London, 1987; Cynthia A. Montgomery, 1994; Joseph P. Platt, 1999; Robert C. Robb, Jr., 1998; Toby Rosenblatt, 2005; Kenneth L. Urish, 1999; and Frederick W. Winter, 1999. |
| Interested Directors3 | | | | | | | | | | |
Paul L. Audet 55 East 52nd Street New York, NY 10055 1953 | | Director | | Since
2011 | | Senior Managing Director of BlackRock and Head of U.S. Mutual Funds since 2011; Chair of the U.S. Mutual Funds Committee reporting to the Global Executive Committee since 2011; Head of BlackRock’s Real Estate business from 2008 to 2011; Member of BlackRock’s Global Operating and Corporate Risk Management Committees and of the BlackRock Alternative Investors Executive Committee and Investment Committee for the Private Equity Fund of Funds business since 2008; Head of BlackRock’s Global Cash Management business from 2005 to 2010; Acting Chief Financial Officer of BlackRock from 2007 to 2008; Chief Financial Officer of BlackRock from 1998 to 2005. | | 158 Funds
277 Portfolios | | None |
Henry Gabbay 55 East 52nd Street New York, NY 10055 1947 | | Director | | Since
2007 | | Consultant, BlackRock from 2007 to 2008; Managing Director, BlackRock from 1989 to 2007; Chief Administrative Officer, BlackRock Advisors, LLC from 1998 to 2007; President of BlackRock Funds and BlackRock Bond Allocation Target Shares from 2005 to 2007 and Treasurer of certain closed-end funds in the BlackRock fund complex from 1989 to 2006. | | 158 RICs consisting of
277 Portfolios | | None |
| | 3 Mr. Audet is an “interested person,” as defined in the 1940 Act, of the Funds/Master LLC based on his positions with BlackRock and its affiliates. Mr. Gabbay is an “interested person” of the Funds/Master LLC based on his former positions with BlackRock and its affiliates as well as his ownership of BlackRock and The PNC Financial Services Group, Inc. securities. Mr. Audet and Mr. Gabbay are also Directors of the BlackRock registered closed-end funds and Directors of other BlackRock registered open-end funds. Directors serve until their resignation, removal or death, or until December 31 of the year in which they turn 72. |
| | | | | | |
| | | | | | | |
| | ANNUAL REPORT | | OCTOBER 31, 2012 | | 61 |
| | | | |
| Officers and Directors (concluded) | | |
| | | | | | |
Name, Address
and Year of Birth | | Position(s)
Held with
Funds/
Master LLC | | Length
of Time
Served | | Principal Occupation(s) During Past Five Years |
| Officers1 | | | | | | |
John M. Perlowski 55 East 52nd Street New York, NY 10055 1964 | | President and Chief Executive
Officer | | Since
2010 | | Managing Director of BlackRock since 2009; Global Head of BlackRock Fund Administration since 2009; Managing Director and Chief Operating Officer of the Global Product Group at Goldman Sachs Asset Management, L.P. from 2003 to 2009; Treasurer of Goldman Sachs Mutual Funds from 2003 to 2009 and Senior Vice President thereof from 2007 to 2009; Director of Goldman Sachs Offshore Funds from 2002 to 2009; Director of Family Resource Network (charitable foundation) since 2009. |
Brendan Kyne 55 East 52nd Street New York, NY 10055 1977 | | Vice President | | Since
2009 | | Managing Director of BlackRock since 2010; Director of BlackRock from 2008 to 2009; Head of Product Development and Management for BlackRock’s U.S. Retail Group since 2009 and Co-head thereof from 2007 to 2009; Vice President of BlackRock from 2005 to 2008. |
Neal Andrews 55 East 52nd Street New York, NY 10055 1966 | | Chief
Financial
Officer | | Since
2007 | | Managing Director of BlackRock since 2006; Senior Vice President and Line of Business Head of Fund Accounting and Administration at PNC Global Investment Servicing (U.S.) Inc. from 1992 to 2006. |
Jay Fife 55 East 52nd Street New York, NY 10055 1970 | | Treasurer | | Since
2007 | | Managing Director of BlackRock since 2007; Director of BlackRock in 2006; Assistant Treasurer of the MLIM and Fund Asset Management, L.P. advised funds from 2005 to 2006; Director of MLIM Fund Services Group from 2001 to 2006. |
Brian Kindelan 55 East 52nd Street New York, NY 10055 1959 | | Chief
Compliance Officer and Anti-Money Laundering Officer | | Since
2007 | | Chief Compliance Officer of the BlackRock-advised funds since 2007; Managing Director and Senior Counsel of BlackRock since 2005. |
Benjamin Archibald 55 East 52nd Street New York, NY 10055 1975 | | Secretary | | Since
2012 | | Director of BlackRock since 2010; Assistant Secretary to the funds from 2010 to 2012; General Counsel and Chief Operating Officer of Uhuru Capital Management from 2009 to 2010; Executive Director and Counsel of Goldman Sachs Asset Management from 2005 to 2009. |
| | 1 Officers of the Funds/Master LLC serve at the pleasure of the Board. |
| | | Further information about the Officers and Directors is available in the Funds’ Statements of Additional Information, which can be obtained without charge by calling (800) 441-7762. |
| | | | | | | | |
Investment Advisor BlackRock Advisors, LLC Wilmington, DE 19809 | | Custodian Brown Brothers
Harriman & Co. Boston, MA 02109 | | Accounting Agent State Street Bank
and Trust Company Boston, MA 02110 | | Distributor BlackRock Investments, LLC New York, NY 10022 | | Address of the Funds 100 Bellevue Parkway Wilmington, DE 19809 |
| | | | |
Sub-Advisors BlackRock Investment Management, LLC2 Princeton, NJ 08540 BlackRock
International Limited3 Edinburgh, Scotland United Kingdom EH3 8JB | | Transfer Agent BNY Mellon Investment Servicing (US) Inc. Wilmington, DE 19809 | | Independent Registered Public Accounting Firm Deloitte & Touche LLP Boston, MA 02116 | | Legal Counsel Sidley Austin LLP New York, NY 10019 | | |
| | 2 | | For Emerging Markets Fund and Latin America |
Effective May 15, 2012, Ian A. MacKinnon became a Director of the Funds and Master LLC.
Effective May 16, 2012, Ira P. Shapiro resigned as Secretary of the Funds and Master LLC and Benjamin Archibald became Secretary of the Funds and Master LLC.
| | | | | | |
| | | | | | | |
| 62 | | ANNUAL REPORT | | OCTOBER 31, 2012 | | |
Electronic Delivery
Electronic copies of most financial reports and prospectuses are available on the Funds’ website or shareholders can sign up for e-mail notifications of quarterly statements, annual and semi-annual reports and prospectuses by enrolling in the Funds’ electronic delivery program.
To enroll:
Shareholders Who Hold Accounts with Investment Advisors, Banks or Brokerages:
Please contact your financial advisor. Please note that not all investment advisors, banks or brokerages may offer this service.
Shareholders Who Hold Accounts Directly with BlackRock:
| 1) | Access the BlackRock Web site at http://www.blackrock.com/edelivery |
| 2) | Select “eDelivery” under the “More Information” section |
Householding
The Funds will mail only one copy of shareholder documents, including prospectuses, annual and semi-annual reports and proxy statements, to shareholders with multiple accounts at the same address. This practice is commonly called “householding” and is intended to reduce expenses and eliminate duplicate mailings of shareholder documents. Mailings of your shareholder documents may be householded indefinitely unless you instruct us otherwise. If you do not want the mailing of these documents to be combined with those for other members of your household, please call the Funds at (800) 441-7762.
Availability of Quarterly Schedule of Investments
The Funds/Portfolio file their complete schedule of portfolio holdings with the SEC for the first and third quarters of each fiscal year on Form N-Q. The Funds’/Portfolio’s Forms N-Q are available on the SEC’s website at http://www.sec.gov and may also be reviewed and copied at the SEC’s Public Reference Room in Washington, DC. Information on how to access documents on the SEC’s website without charge may be obtained by calling (800) SEC-0330. The Funds’/Portfolio’s Forms N-Q may also be obtained upon request and without charge by calling (800) 441-7762.
Availability of Proxy Voting Policies and Procedures
A description of the policies and procedures that the Funds/Portfolio use to determine how to vote proxies relating to portfolio securities is available (1) without charge, upon request, by calling (800) 441-7762; (2) at http://www.blackrock.com; and (3) on the SEC’s website at http://www.sec.gov.
Availability of Proxy Voting Record
Information about how the Funds/Portfolio voted proxies relating to securities held in the Funds’/Portfolio’s portfolios during the most recent 12-month period ended June 30 is available upon request and without charge (1) at http://www.blackrock.com or by calling (800) 441-7762 and (2) on the SEC’s website at http://www.sec.gov.
| | | | | | |
| | | | | | | |
| | ANNUAL REPORT | | OCTOBER 31, 2012 | | 63 |
| | |
| Additional Information (continued) | | |
Account Information
Call us at (800) 441-7762 from 8:00 AM to 6:00 PM EST on any business day to get information about your account balances, recent transactions and share prices. You can also reach us on the Web at http://www.blackrock.com/funds.
Automatic Investment Plans
Investor Class shareholders who want to invest regularly can arrange to have $50 or more automatically deducted from their checking or savings account and invested in any of the BlackRock funds.
Systematic Withdrawal Plans
Investor Class shareholders can establish a systematic withdrawal plan and receive periodic payments of $50 or more from their BlackRock funds, as long as their account balance is at least $10,000.
Retirement Plans
Shareholders may make investments in conjunction with Traditional, Rollover, Roth, Coverdell, Simple IRAs, SEP IRAs and 403(b) Plans.
| | | | | | |
| | | | | | | |
| 64 | | ANNUAL REPORT | | OCTOBER 31, 2012 | | |
| | |
| Additional Information (concluded) | | |
|
| BlackRock Privacy Principles |
BlackRock is committed to maintaining the privacy of its current and former fund investors and individual clients (collectively, “Clients”) and to safeguarding their non-public personal information. The following information is provided to help you understand what personal information BlackRock collects, how we protect that information and why in certain cases we share such information with select parties.
If you are located in a jurisdiction where specific laws, rules or regulations require BlackRock to provide you with additional or different privacy-related rights beyond what is set forth below, then BlackRock will comply with those specific laws, rules or regulations.
BlackRock obtains or verifies personal non-public information from and about you from different sources, including the following: (i) information we receive from you or, if applicable, your financial intermediary, on applications, forms or other documents; (ii) information about your transactions with us, our affiliates, or others; (iii) information we receive from a consumer reporting agency; and (iv) from visits to our websites.
BlackRock does not sell or disclose to non-affiliated third parties any non-public personal information about its Clients, except as permitted by law or as is necessary to respond to regulatory requests or to service Client accounts. These non-affiliated third parties are required to protect the confidentiality and security of this information and to use it only for its intended purpose.
We may share information with our affiliates to service your account or to provide you with information about other BlackRock products or services that may be of interest to you. In addition, BlackRock restricts access to non-public personal information about its Clients to those BlackRock employees with a legitimate business need for the information. BlackRock maintains physical, electronic and procedural safeguards that are designed to protect the non-public personal information of its Clients, including procedures relating to the proper storage and disposal of such information.
| | | | | | |
| | | | | | | |
| | ANNUAL REPORT | | OCTOBER 31, 2012 | | 65 |
| | |
| A World-Class Mutual Fund Family | | |
BlackRock offers a diverse lineup of open-end mutual funds crossing all investment styles and managed by experts in equity, fixed income and tax-exempt investing.
BlackRock ACWI ex-US Index Fund
BlackRock All-Cap Energy & Resources Portfolio
BlackRock Balanced Capital Fund†
BlackRock Basic Value Fund
BlackRock Capital Appreciation Fund
BlackRock China Fund
BlackRock Commodity Strategies Fund
BlackRock Emerging Markets Fund
BlackRock Emerging Markets Long/Short Equity Fund
BlackRock Energy & Resources Portfolio
BlackRock Equity Dividend Fund
BlackRock EuroFund
BlackRock Flexible Equity Fund
BlackRock Focus Growth Fund
BlackRock Global Allocation Fund†
BlackRock Global Dividend Income Portfolio
BlackRock Global Opportunities Portfolio
BlackRock Global SmallCap Fund
BlackRock Health Sciences Opportunities Portfolio
BlackRock Index Equity Portfolio
BlackRock India Fund
BlackRock International Fund
BlackRock International Index Fund
BlackRock International Opportunities Portfolio
BlackRock Large Cap Core Fund
BlackRock Large Cap Core Plus Fund
BlackRock Large Cap Growth Fund
BlackRock Large Cap Value Fund
BlackRock Latin America Fund
BlackRock Long-Horizon Equity Fund
BlackRock Managed Volatility Portfolio†
BlackRock Mid-Cap Growth Equity Portfolio
BlackRock Mid Cap Value Opportunities Fund
BlackRock Natural Resources Trust
BlackRock Pacific Fund
BlackRock Real Estate Securities Fund
BlackRock Russell 1000 Index Fund
BlackRock Science & Technology Opportunities Portfolio
BlackRock Small Cap Growth Equity Portfolio
BlackRock Small Cap Growth Fund II
BlackRock Small Cap Index Fund
BlackRock S&P 500 Index Fund
BlackRock S&P 500 Stock Fund
BlackRock U.S. Opportunities Portfolio
BlackRock Value Opportunities Fund
BlackRock World Gold Fund
| | |
| Taxable Fixed Income Funds | | |
BlackRock Bond Index Fund
BlackRock Core Bond Portfolio
BlackRock CoreAlpha Bond Fund
BlackRock Emerging Market Local Debt Portfolio
BlackRock Floating Rate Income Portfolio
BlackRock Global Long/Short Credit Fund
BlackRock GNMA Portfolio
BlackRock High Yield Bond Portfolio
BlackRock Inflation Protected Bond Portfolio
BlackRock International Bond Portfolio
BlackRock Long Duration Bond Portfolio
BlackRock Low Duration Bond Portfolio
BlackRock Multi-Asset Income Portfolio†
BlackRock Secured Credit Portfolio
BlackRock Strategic Income Opportunities Portfolio
BlackRock Total Return Fund
BlackRock US Government Bond Portfolio
BlackRock US Mortgage Portfolio
BlackRock World Income Fund
| | |
| Municipal Fixed Income Funds | | |
BlackRock California Municipal Bond Fund
BlackRock High Yield Municipal Fund
BlackRock Intermediate Municipal Fund
BlackRock National Municipal Fund
BlackRock New Jersey Municipal Bond Fund
BlackRock New York Municipal Bond Fund
BlackRock Pennsylvania Municipal Bond Fund
BlackRock Short-Term Municipal Fund
| | |
| Target Risk & Target Date Funds† | | |
| | | | | | | | | | | | | | | | | | | | |
| BlackRock Prepared Portfolios | | LifePath Active Portfolios | | | | LifePath Portfolios | | LifePath Index Portfolios |
Conservative Prepared Portfolio | | | | 2015 | | 2035 | | | | Retirement | | 2040 | | | | Retirement | | 2040 |
Moderate Prepared Portfolio | | | | 2020 | | 2040 | | | | 2020 | | 2045 | | | | 2020 | | 2045 |
Growth Prepared Portfolio | | | | 2025 | | 2045 | | | | 2025 | | 2050 | | | | 2025 | | 2050 |
Aggressive Growth Prepared Portfolio | | | | 2030 | | 2050 | | | | 2030 | | 2055 | | | | 2030 | | 2055 |
| | | | | | | | | | | | 2035 | | | | | | 2035 | | |
BlackRock mutual funds are currently distributed by BlackRock Investments, LLC. You should consider the investment objectives, risks, charges and expenses of the funds under consideration carefully before investing. Each fund’s prospectus contains this and other information and is available at www.blackrock.com or by calling (800) 441-7762 or from your financial advisor. The prospectus should be read carefully before investing.
| | | | | | |
| | | | | | | |
| 66 | | ANNUAL REPORT | | OCTOBER 31, 2012 | | |
This report is not authorized for use as an offer of sale or a solicitation of an offer to buy shares of a Fund unless accompanied or preceded by a Fund’s current prospectus. Past performance results shown in this report should not be considered a representation of future performance. Investment returns and principal value of shares will fluctuate so that shares, when redeemed, may be worth more or less than their original cost. Statements and other information herein are as dated and are subject to change. Please see each Fund’s prospectus for a description of risks associated with global investments.

| | |
| #EMLAIF-10/12-AR | |  |
| | |
Item 2 – | | Code of Ethics – The registrant (or the “Fund”) has adopted a code of ethics, as of the end of the period covered by this report, applicable to the registrant’s principal executive officer, principal financial officer, principal accounting officer or controller, or persons performing similar functions. During the period covered by this report, there have been no amendments to or waivers granted under the code of ethics. A copy of the code of ethics is available without charge at www.blackrock.com. |
| |
Item 3 – | | Audit Committee Financial Expert – The registrant’s board of directors (the “board of directors”), has determined that (i) the registrant has the following audit committee financial expert serving on its audit committee and (ii) each audit committee financial expert is independent: Kenneth L. Urish |
| |
| | Under applicable securities laws, a person determined to be an audit committee financial expert will not be deemed an “expert” for any purpose, including without limitation for the purposes of Section 11 of the Securities Act of 1933, as a result of being designated or identified as an audit committee financial expert. The designation or identification of a person as an audit committee financial expert does not impose on such person any duties, obligations, or liabilities greater than the duties, obligations, and liabilities imposed on such person as a member of the audit committee and board of directors in the absence of such designation or identification. |
| |
Item 4 – | | Principal Accountant Fees and Services |
| |
| | The following table presents fees billed by Deloitte & Touche LLP (“D&T”) in each of the last two fiscal years for the services rendered to the Fund: |
| | | | | | | | | | | | | | | | |
| | | (a) Audit Fees | | (b) Audit-Related Fees1 | | (c) Tax Fees2 | | (d) All Other Fees3 |
| Entity Name | | Current
Fiscal Year
End | | Previous
Fiscal Year
End | | Current
Fiscal Year
End | | Previous
Fiscal Year
End | | Current
Fiscal Year
End | | Previous
Fiscal Year
End | | Current
Fiscal Year
End | | Previous
Fiscal Year
End |
| BlackRock Latin America Fund, Inc. | | $35,200 | | $34,700 | | $0 | | $0 | | $13,350 | | $13,350 | | $0 | | $0 |
| | |
| | The following table presents fees billed by D&T that were required to be approved by the registrant’s audit committee (the “Committee”) for services that relate directly to the operations or financial reporting of the Fund and that are rendered on behalf of BlackRock Advisors, LLC (“Investment Adviser” or “BlackRock”) and entities controlling, controlled by, or under common control with BlackRock (not including any sub-adviser whose role is primarily portfolio management and is subcontracted with or overseen by another investment adviser) that provide ongoing services to the Fund (“Fund Service Providers”): |
| | | | |
| | | Current Fiscal Year End | | Previous Fiscal Year End |
(b) Audit-Related Fees1 | | $0 | | $0 |
(c) Tax Fees2 | | $0 | | $0 |
(d) All Other Fees3 | | $2,970,000 | | $3,030,000 |
1 The nature of the services includes assurance and related services reasonably related to the performance of the audit of financial statements not included in Audit Fees.
2 The nature of the services includes tax compliance, tax advice and tax planning.
3 Aggregate fees borne by BlackRock in connection with the review of compliance procedures and attestation thereto performed by D&T with respect to all of the registered closed-end funds and some of the registered open-end funds advised by BlackRock.
2
(e)(1) Audit Committee Pre-Approval Policies and Procedures:
The Committee has adopted policies and procedures with regard to the pre-approval of services. Audit, audit-related and tax compliance services provided to the registrant on an annual basis require specific pre-approval by the Committee. The Committee also must approve other non-audit services provided to the registrant and those non-audit services provided to the Investment Adviser and Fund Service Providers that relate directly to the operations and the financial reporting of the registrant. Certain of these non-audit services that the Committee believes are a) consistent with the SEC’s auditor independence rules and b) routine and recurring services that will not impair the independence of the independent accountants may be approved by the Committee without consideration on a specific case-by-case basis (“general pre-approval”). The term of any general pre-approval is 12 months from the date of the pre-approval, unless the Committee provides for a different period. Tax or other non-audit services provided to the registrant which have a direct impact on the operations or financial reporting of the registrant will only be deemed pre-approved provided that any individual project does not exceed $10,000 attributable to the registrant or $50,000 per project. For this purpose, multiple projects will be aggregated to determine if they exceed the previously mentioned cost levels.
Any proposed services exceeding the pre-approved cost levels will require specific pre-approval by the Committee, as will any other services not subject to general pre-approval (e.g., unanticipated but permissible services). The Committee is informed of each service approved subject to general pre-approval at the next regularly scheduled in-person board meeting. At this meeting, an analysis of such services is presented to the Committee for ratification. The Committee may delegate to the Committee Chairman the authority to approve the provision of and fees for any specific engagement of permitted non-audit services, including services exceeding pre-approved cost levels.
(e)(2) None of the services described in each of Items 4(b) through (d) were approved by the Committee pursuant to the de minimus exception in paragraph (c)(7)(i)(C) of Rule 2-01 of Regulation S-X.
(f) Not Applicable
(g) The aggregate non-audit fees paid to the accountant for services rendered by the accountant to the registrant, the Investment Adviser and the Fund Service Providers were:
| | | | |
| Entity Name | | Current Fiscal Year End | | Previous Fiscal Year End |
| BlackRock Latin America Fund, Inc. | | $13,350 | | $13,350 |
Additionally, SSAE 16 Review (Formerly, SAS No. 70) fees for the current and previous fiscal years of $2,970,000 and $3,030,000, respectively, were billed by D&T to the Investment Adviser.
(h) The Committee has considered and determined that the provision of non-audit services that were rendered to the Investment Adviser, and the Fund Service Providers that were not pre-approved pursuant to paragraph (c)(7)(ii) of Rule 2-01 of Regulation S-X is compatible with maintaining the principal accountant’s independence.
Item 5 – Audit Committee of Listed Registrants – Not Applicable
Item 6 – Investments
(a) The registrant’s Schedule of Investments is included as part of the Report to Stockholders filed under
3
| | |
| | Item 1 of this Form. (b) Not Applicable due to no such divestments during the semi-annual period covered since the previous Form N-CSR filing. |
| |
Item 7 – | | Disclosure of Proxy Voting Policies and Procedures for Closed-End Management Investment Companies – Not Applicable |
| |
Item 8 – | | Portfolio Managers of Closed-End Management Investment Companies – Not Applicable |
| |
Item 9 – | | Purchases of Equity Securities by Closed-End Management Investment Company and Affiliated Purchasers – Not Applicable |
| |
Item 10 – | | Submission of Matters to a Vote of Security Holders – There have been no material changes to these procedures. |
| |
Item 11 – | | Controls and Procedures |
| |
11(a) – | | The registrant’s principal executive and principal financial officers, or persons performing similar functions, have concluded that the registrant’s disclosure controls and procedures (as defined in Rule 30a-3(c) under the Investment Company Act of 1940, as amended (the “1940 Act”)) are effective as of a date within 90 days of the filing of this report based on the evaluation of these controls and procedures required by Rule 30a-3(b) under the 1940 Act and Rule 15d-15(b) under the Securities Exchange Act of 1934, as amended. |
| |
11(b) – | | There were no changes in the registrant’s internal control over financial reporting (as defined in Rule 30a-3(d) under the 1940 Act) that occurred during the second fiscal quarter of the period covered by this report that have materially affected, or are reasonably likely to materially affect, the registrant’s internal control over financial reporting. |
| |
Item 12 – | | Exhibits attached hereto |
| |
12(a)(1) – | | Code of Ethics – See Item 2 |
| |
12(a)(2) – | | Certifications – Attached hereto |
| |
12(a)(3) – | | Not Applicable |
| |
12(b) – | | Certifications – Attached hereto |
4
Pursuant to the requirements of the Securities Exchange Act of 1934 and the Investment Company Act of 1940, the registrant has duly caused this report to be signed on its behalf by the undersigned, thereunto duly authorized.
BlackRock Latin America Fund, Inc.
| | |
By: | | /s/ John M. Perlowski |
| | John M. Perlowski |
| | Chief Executive Officer (principal executive officer) of |
| | BlackRock Latin America Fund, Inc. |
Date: January 3, 2013
Pursuant to the requirements of the Securities Exchange Act of 1934 and the Investment Company Act of 1940, this report has been signed below by the following persons on behalf of the registrant and in the capacities and on the dates indicated.
| | |
By: | | /s/ John M. Perlowski |
| | John M. Perlowski |
| | Chief Executive Officer (principal executive officer) of |
| | BlackRock Latin America Fund, Inc. |
Date: January 3, 2013
| | |
By: | | /s/ Neal J. Andrews |
| | Neal J. Andrews |
| | Chief Financial Officer (principal financial officer) of |
| | BlackRock Latin America Fund, Inc. |
Date: January 3, 2013
5