UNITED STATES
SECURITIES AND EXCHANGE COMMISSION
Washington, D.C. 20549
FORM N-CSR
CERTIFIED SHAREHOLDER REPORT OF REGISTERED MANAGEMENT INVESTMENT COMPANIES
Investment Company Act file number: 811-06349
Name of Fund: BlackRock Latin America Fund, Inc.
Fund Address: 100 Bellevue Parkway, Wilmington, DE 19809
Name and address of agent for service: John M. Perlowski, Chief Executive Officer, BlackRock Latin America Fund, Inc., 55 East 52nd Street, New York, NY 10055
Registrant’s telephone number, including area code: (800) 441-7762
Date of fiscal year end: 10/31/2017
Date of reporting period: 10/31/2017
Item 1 – Report to Stockholders
OCTOBER 31, 2017
| | |
ANNUAL REPORT | |  |
BlackRock Emerging Markets Fund, Inc.
BlackRock Latin America Fund, Inc.
|
| Not FDIC Insured • May Lose Value • No Bank Guarantee |
The Markets in Review
Dear Shareholder,
In the 12 months ended October 31, 2017, risk assets, such as stocks and high-yield bonds, continued to deliver strong performance. These markets showed great resilience during a period with big political surprises, including the aftermath of the U.K.’s vote to leave the European Union and the outcome of the U.S. presidential election, which brought only brief spikes in equity market volatility. In contrast, closely watched elections in France, the Netherlands, and Australia countered the isolationist and nationalist political developments in the U.K. and the United States.
Interest rates rose, which worked against high-quality assets with more interest rate sensitivity. Consequently, longer-term U.S. Treasuries posted negative returns, as rising energy prices, modest wage increases, and steady job growth led to expectations of higher inflation and further interest rate increases by the U.S. Federal Reserve (the “Fed”).
The market’s performance reflected reflationary expectations early in the reporting period, as investors began to sense that a global recovery was afoot. Thereafter, many countries throughout the world experienced sustained and synchronized growth for the first time since the financial crisis. Growth rates and inflation are still relatively low, but they are finally rising together.
The Fed responded to these positive developments by increasing short-term interest rates three times and setting expectations for additional interest rate increases. The Fed also began reducing the vast balance sheet reserves that had accumulated in the wake of the financial crisis. In October 2017, the Fed reduced its $4.5 trillion balance sheet by only $10 billion, while setting expectations for additional modest reductions and rate hikes in 2018.
By contrast, the European Central Bank (“ECB”) and the Bank of Japan (“BoJ”) both continued to expand their balance sheets despite nascent signs of sustained economic growth. The Eurozone and Japan are both approaching the limits of central banks’ ownership share of debt issued by their respective governments, which is a structural pressure point that limits their capacity to deliver additional monetary stimulus. In October 2017, the ECB announced plans to cut the amount of its bond purchases in half for 2018, while the BoJ reiterated its commitment to economic stimulus until the inflation rate rises to its target of 2.0%.
Emerging market growth also stabilized, as accelerating growth in China, the second largest economy in the world and the most influential of all developing economies, improved the outlook for corporate profits and economic growth across most developing nations. Chinese demand for commodities and other raw materials allayed concerns about the country’s banking system, leading to rising equity prices and foreign investment flows.
While escalating tensions between the United States and North Korea and our nation’s divided politics are significant concerns, benign credit conditions, modest inflation, solid corporate earnings, and the positive outlook for growth in the world’s largest economies have kept markets relatively tranquil.
High valuations across most assets have laid the groundwork for muted returns going forward. At current valuation levels, potential equity gains will likely be closely tied to the pace of earnings growth, which has remained solid thus far in 2017, particularly in emerging markets. In this environment, investors need to think globally, extend their scope across a broad array of asset classes, and be nimble as market conditions change. We encourage you to talk with your financial advisor and visit blackrock.com for further insight about investing in today’s markets.
Sincerely,

Rob Kapito
President, BlackRock Advisors, LLC

Rob Kapito
President, BlackRock Advisors, LLC
| | | | |
| Total Returns as of October 31, 2017 |
| | | 6-month | | 12-month |
U.S. large cap equities
(S&P 500® Index) | | 9.10% | | 23.63% |
U.S. small cap equities
(Russell 2000® Index) | | 8.01 | | 27.85 |
International equities
(MSCI Europe, Australasia,
Far East Index) | | 10.74 | | 23.44 |
Emerging market equities
(MSCI Emerging Markets Index) | | 16.14 | | 26.45 |
3-month Treasury bills
(BofA Merrill Lynch 3-Month
U.S. Treasury Bill Index) | | 0.49 | | 0.72 |
U.S. Treasury securities
(BofA Merrill Lynch
10-Year U.S. Treasury
Index) | | 0.15 | | (2.98) |
U.S. investment grade bonds
(Bloomberg Barclays U.S.
Aggregate Bond Index) | | 1.58 | | 0.90 |
Tax-exempt municipal bonds
(S&P Municipal Bond Index) | | 2.22 | | 1.80 |
U.S. high yield bonds
(Bloomberg Barclays U.S. Corporate High Yield 2% Issuer
Capped Index) | | 3.44 | | 8.92 |
| Past performance is no guarantee of future results. Index performance is shown for illustrative purposes only. You cannot invest directly in an index. |
| | |
| 2 | | THIS PAGEISNOT PARTOF YOUR FUND REPORT |
Table of Contents

| | |
| Fund Summary as of October 31, 2017 | | BlackRock Emerging Markets Fund, Inc. |
Investment Objective
BlackRock Emerging Markets Fund, Inc.’s (the “Fund”) investment objective is to seek long-term capital appreciation by investing in securities, principally equity securities, of issuers in countries having smaller capital markets.
Portfolio Management Commentary
How did the Fund perform?
| • | | For the 12-month period ended October 31, 2017, the Fund underperformed the benchmark, the MSCI Emerging Markets Index. |
What factors influenced performance?
| • | | During the period, the Fund’s South Korean exposure weighed on performance. In particular, the decision not to hold Samsung Electronics Co. Ltd. for much of the period detracted from returns as the stock performed well based on strong memory product and OLED display panel demand, as well as positive fourth quarter results. Exposure to Indonesia was another detractor, as that market lagged the benchmark during the 12 months. Lastly, a non-benchmark position in the Turkish mining name Eldorado Gold Corp. detracted as the company experienced a temporary production decline. |
| • | | Conversely, the Fund’s underweight to South Africa represented the top contributor to relative performance amid continued political volatility within the country, recently exemplified by President Zuma’s second cabinet reshuffle this year. In addition, stock selection in India across sectors continued to be a source of positive return, as global markets maintained their “risk-on” sentiment with regard to Indian equities, driven by the persistent upturn in global growth. The Fund’s positioning in Russia also benefited performance as the market there was boosted by recent strength in oil prices. Within Russia, leading bank Sberbank of Russia PJSC, and natural gas producer Novatek PJSC were among the top performers. A non-benchmark allocation in Turkish Airlines Inc. was the Fund’s largest individual contributor for the period as the stock rallied based on positive earning revisions, encouraging industry trends and signs of operational improvement. |
Describe recent portfolio activity.
| • | | The Fund decreased its exposure to the consumer staples and information technology (“IT”) sectors, preferring companies that are more geared toward a global cyclical recovery. Along those lines, the Fund has been steadily increasing its holdings within financials, most notably initiating positions in Bank of China Ltd., HDFC Bank Ltd. and Ping An Insurance Group Co. of China Ltd. On a country basis, exposure to South Korea and India was increased, while the Fund took profits within its Brazilian and Argentine holdings. |
Describe portfolio positioning at period end.
| • | | Relative to the MSCI Emerging Markets Index, the Fund ended the period overweight in India and Mexico, and underweight in Taiwan and China. The Fund also maintained a non-benchmark allocation to Argentina. At the sector level, the Fund was overweight in financials and underweight in IT. |
The views expressed reflect the opinions of BlackRock as of the date of this report and are subject to change based on changes in market, economic or other conditions. These views are not intended to be a forecast of future events and are no guarantee of future results.
| | |
| 4 | | 2017 BLACKROCK ANNUAL REPORTTO SHAREHOLDERS |
| | |
| Fund Summary as of October 31, 2017 (continued) | | BlackRock Emerging Markets Fund, Inc. |
TOTAL RETURN BASED ON A $10,000 INVESTMENT
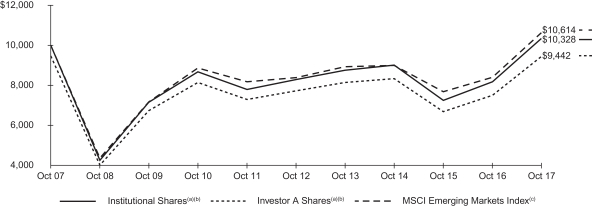
| (a) | Assuming maximum sales charges, if any, transaction costs and other operating expenses, including investment advisory fees. Institutional Shares do not have a sales charge. |
| (b) | Under normal conditions, the Fund invests at least 80% of its net assets plus any borrowings for investment purposes in equity securities of issuers located in countries with developing capital markets. |
| (c) | A free float-adjusted market capitalization index that is designed to measure equity market performance of emerging markets. The MSCI Emerging Markets Index consists of the following 24 emerging market country indexes: Brazil, Chile, China, Colombia, Czech Republic, Egypt, Greece, Hungary, India, Indonesia, Korea, Malaysia, Mexico, Pakistan, Peru, Philippines, Poland, Qatar, Russia, South Africa, Taiwan, Thailand, Turkey and United Arab Emirates. |
Performance Summary for the Period Ended October 31, 2017
| | | | | | | | | | | | | | | | | | | | | | | | | | | | | | | | | | | | | | | | |
| | | | | | | | | Average Annual Total Returns (d) | |
| | | | | | | | | 1 Year | | | | | | 5 Years | | | | | | 10 Years | |
| | | 6-Month
Total Returns | | | | | | w/o sales
charge | | | w/sales
charge | | | | | | w/o sales
charge | | | w/sales
charge | | | | | | w/o sales
charge | | | w/sales
charge | |
Institutional | | | 16.32 | % | | | | | | | 26.35 | % | | | N/A | | | | | | | | 4.52 | % | | | N/A | | | | | | | | 0.32 | % | | | N/A | |
Investor A | | | 16.14 | | | | | | | | 25.95 | | | | 19.34 | % | | | | | | | 4.09 | | | | 2.98 | % | | | | | | | (0.04 | ) | | | (0.57 | )% |
Investor C | | | 15.63 | | | | | | | | 24.84 | | | | 23.84 | | | | | | | | 3.24 | | | | 3.24 | | | | | | | | (0.87 | ) | | | (0.87 | ) |
MSCI Emerging Markets Index | | | 16.14 | | | | | | | | 26.45 | | | | N/A | | | | | | | | 4.83 | | | | N/A | | | | | | | | 0.60 | | | | N/A | |
| | (d) | Assuming maximum sales charges, if any. Average annual total returns with and without sales charges reflect reductions for distribution and service fees. See “About Fund Performance” on page 9 for a detailed description of share classes, including any related sales charges and fees. | |
N/A — Not applicable as share class and index do not have a sales charge.
Past performance is not indicative of future results.
Performance results may include adjustments made for financial reporting purposes in accordance with U.S. generally accepted accounting principles.
Expense Example
| | | | | | | | | | | | | | | | | | | | | | | | | | | | | | | | |
| | | Actual | | | | | | Hypothetical (b) | | | | |
| | | Beginning
Account Value
(05/01/17) | | | Ending
Account Value
(10/31/17) | | | Expenses
Paid During
the Period (a) | | | | | | Beginning
Account Value
(05/01/17) | | | Ending
Account Value
(10/31/17) | | | Expenses
Paid During
the Period (a) | | | Annualized
Expense
Ratio | |
Institutional | | $ | 1,000.00 | | | $ | 1,163.20 | | | $ | 7.47 | | | | | | | $ | 1,000.00 | | | $ | 1,018.30 | | | $ | 6.97 | | | | 1.37 | % |
Investor A | | | 1,000.00 | | | | 1,161.40 | | | | 9.21 | | | | | | | | 1,000.00 | | | | 1,016.69 | | | | 8.59 | | | | 1.69 | |
Investor C | | | 1,000.00 | | | | 1,156.30 | | | | 13.86 | | | | | | | | 1,000.00 | | | | 1,012.35 | | | | 12.93 | | | | 2.55 | |
| | (a) | For each class of the Fund, expenses are equal to the annualized net expense ratio for the class, multiplied by the average account value over the period, multiplied by 184/365 (to reflect the one-half year period shown). | |
| | (b) | Hypothetical 5% return before expenses is calculated by prorating the number of days in the most recent fiscal half year divided by 365. | |
See “Disclosure of Expenses” on page 9 for further information on how expenses were calculated.
| | |
| Fund Summary as of October 31, 2017 | | BlackRock Latin America Fund, Inc. |
Investment Objective
BlackRock Latin America Fund Inc.’s (the “Fund”) investment objective is to seek long-term capital appreciation by investing primarily in Latin American equity and debt securities.
Portfolio Management Commentary
How did the Fund perform?
| • | | For the 12-month period ended October 31, 2017, the Fund’s Institutional Shares outperformed its benchmark, the MSCI Emerging Markets Latin America Index, while the Fund’s Investor A, Investor B and Investor C Shares underperformed. |
What factors influenced performance?
| • | | Stock selection in Brazil was the top contributor for the period as lower inflation, monetary easing and a pickup in macroeconomic activity all pointed toward a rebound in Brazil’s GDP. Holdings in the Brazilian railway logistics firm Rumo SA continued to perform strongly as shareholders approved a capital raising plan that should improve the company’s positioning in their concession renewal negotiations and ease financing terms with the Brazilian Development Bank. The Fund’s position in footwear and accessory retailer Arezzo Industria e Comercio SA also helped performance, as domestic consumption in Brazil picked up. Additionally, a non-benchmark allocation to Argentina contributed to relative performance, supported by improving investor confidence, strong economic data and positive mid-term election results for President Macri’s coalition. The utility Pampa Energia SA and the banking group Grupo Supervielle SA were among the top individual contributors. |
| • | | An underweight to Chile was the largest detractor from returns as the country has continued to be a relative outperformer in the region, attributed primarily to improving sentiment regarding the upcoming presidential election. Stock selection in Mexico also weighed on relative return, as an underweight to the telecommunications firm America Movil SAB de CV detracted after the company posted strong first quarter results. An overweight to Mexican real estate also detracted as tensions surrounding the complexity of NAFTA negotiations increased. In terms of individual positioning, a lack of holdings in the Chilean materials company SQM (Sociedad Quimica y Minera SA) detracted from performance as the stock was supported by strong price momentum for lithium. An overweight to Petrobras (Petróleo Brasileiro SA) was the largest individual detractor for the period. |
Describe recent portfolio activity.
| • | | During the 12-month period, the Fund’s exposure within Mexico shifted. An underweight stance there was effectively increased as the recent round of NAFTA negotiations and uncertainties regarding next year’s presidential election caused the investment adviser to maintain its cautious view regarding Mexican growth. In particular, exposure to Mexican real estate was reduced, while the Fund also exited positions in the budget airline Volaris (Controladora Vuela Cia de Aviacion SAB de CV) and the airport operator OMA (Grupo Aeroportuario del Centro Norte SAB de CV). Conversely, America Movil was reintroduced to the portfolio as the company’s competitive and regulatory pressures showed signs of easing. The Fund also added exposure to Brazilian domestic consumer names, deploying some cash toward the retail chain Magazine Luiza SA’s follow-on offering, while also increasing positions in Lojas Americanas SA and Lojas Renner SA. |
Describe portfolio positioning at period end.
| • | | At period end, the Fund was overweight in Brazil and Peru and underweight in Chile, Mexico and Colombia. The Fund also maintained a non-benchmark allocation to Argentina. At the sector level, the Fund was overweight in domestic consumer and energy, while underweight in utilities and materials. |
The views expressed reflect the opinions of BlackRock as of the date of this report and are subject to change based on changes in market, economic or other conditions. These views are not intended to be a forecast of future events and are no guarantee of future results.
| | |
| 6 | | 2017 BLACKROCK ANNUAL REPORTTO SHAREHOLDERS |
| | |
| Fund Summary as of October 31, 2017 (continued) | | BlackRock Latin America Fund, Inc. |
TOTAL RETURN BASED ON A $10,000 INVESTMENT
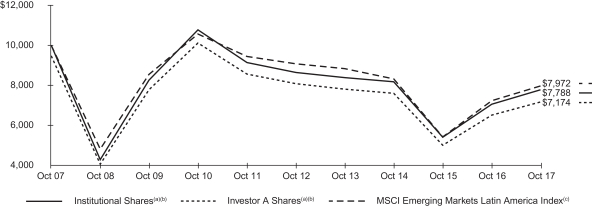
| (a) | Assuming maximum sales charge, if any, transaction costs and other operating expenses, including investment advisory fees. Institutional Shares do not have a sales charge. |
| (b) | Under normal market conditions, the Fund will invest at least 80% of its net assets plus any borrowings for investment purposes in Latin American securities. |
| (c) | A free float-adjusted market capitalization weighted index that is designed to measure the equity market performance of emerging markets in Latin America. |
Performance Summary for the Period Ended October 31, 2017
| | | | | | | | | | | | | | | | | | | | | | | | | | | | | | | | | | | | | | | | |
| | | | | | | | | Average Annual Total Returns (d) | |
| | | | | | | | | 1 Year | | | | | | 5 Years | | | | | | 10 Years | |
| | | 6-Month
Total Returns | | | | | | w/o sales
charge | | | w/sales
charge | | | | | | w/o sales
charge | | | w/sales
charge | | | | | | w/o sales
charge | | | w/sales
charge | |
Institutional | | | 9.04 | % | | | | | | | 10.37 | % | | | N/A | | | | | | | | (2.07 | )% | | | N/A | | | | | | | | (2.47 | )% | | | N/A | |
Investor A | | | 8.87 | | | | | | | | 10.03 | | | | 4.25 | % | | | | | | | (2.36 | ) | | | (3.40 | )% | | | | | | | (2.74 | ) | | | (3.27 | )% |
Investor B | | | 8.36 | | | | | | | | 8.75 | | | | 4.25 | | | | | | | | (3.42 | ) | | | (3.80 | ) | | | | | | | (3.46 | ) | | | (3.46 | ) |
Investor C | | | 8.43 | | | | | | | | 9.12 | | | | 8.12 | | | | | | | | (3.17 | ) | �� | | (3.17 | ) | | | | | | | (3.54 | ) | | | (3.54 | ) |
MSCI Emerging Markets Latin America Index | | | 9.01 | | | | | | | | 10.14 | | | | N/A | | | | | | | | (2.56 | ) | | | N/A | | | | | | | | (2.24 | ) | | | N/A | |
| | (d) | Assuming maximum sales charges, if any. Average annual total returns with and without sales charges reflect reductions for distribution and service fees. See “About Fund Performance” on page 9 for a detailed description of share classes, including any related sales charges and fees. | |
N/A — Not applicable as share class and index do not have a sales charge.
Past performance is not indicative of future results.
Performance results may include adjustments made for financial reporting purposes in accordance with U.S. generally accepted accounting principles.
Expense Example
| | | | | | | | | | | | | | | | | | | | | | | | | | | | | | | | |
| | | Actual | | | | | | Hypothetical (b) | | | | |
| | | Beginning
Account Value
(05/01/17) | | | Ending
Account Value
(10/31/17) | | | Expenses
Paid During
the Period (a) | | | | | | Beginning
Account Value
(05/01/17) | | | Ending
Account Value
(10/31/17) | | | Expenses
Paid During
the Period (a) | | | Annualized
Expense
Ratio | |
Institutional | | $ | 1,000.00 | | | $ | 1,090.40 | | | $ | 6.85 | | | | | | | $ | 1,000.00 | | | $ | 1,018.65 | | | $ | 6.61 | | | | 1.30 | % |
Investor A | | | 1,000.00 | | | | 1,088.70 | | | | 8.37 | | | | | | | | 1,000.00 | | | | 1,017.19 | | | | 8.08 | | | | 1.59 | |
Investor B | | | 1,000.00 | | | | 1,083.60 | | | | 13.60 | | | | | | | | 1,000.00 | | | | 1,012.15 | | | | 13.14 | | | | 2.59 | |
Investor C | | | 1,000.00 | | | | 1,084.30 | | | | 12.77 | | | | | | | | 1,000.00 | | | | 1,012.96 | | | | 12.33 | | | | 2.43 | |
| | (a) | For each class of the Fund, expenses are equal to the annualized net expense ratio for the class, multiplied by the average account value over the period, multiplied by 184/365 (to reflect the one-half year period shown). | |
| | (b) | Hypothetical 5% annual return before expenses is calculated by prorating the number of days in the most recent fiscal half year divided by 365. | |
See “Disclosure of Expenses” on page 9 for further information on how expenses were calculated.
| | |
| Portfolio Information as of October 31, 2017 | | |
BlackRock Emerging Markets Fund, Inc.
TEN LARGEST HOLDINGS
| | | | |
| | | Percent of
Net Assets | |
Alibaba Group Holding Ltd. — ADR | | | 4 | % |
Bank of China Ltd., Class H | | | 4 | |
Samsung Electronics Co. Ltd. | | | 3 | |
Tencent Holdings Ltd. | | | 3 | |
Baidu, Inc. — ADR | | | 3 | |
Housing Development Finance Corp. | | | 3 | |
Ping An Insurance Group Co. of China Ltd., Class H | | | 2 | |
CNOOC Ltd. | | | 2 | |
America Movil SAB de CV, Series L — ADR | | | 2 | |
Erste Group Bank AG | | | 2 | |
GEOGRAPHIC ALLOCATION
| | | | |
| | | Percent of
Net Assets | |
China | | | 27 | % |
South Korea | | | 15 | |
India | | | 12 | |
Brazil | | | 6 | |
Mexico | | | 6 | |
Taiwan | | | 5 | |
Indonesia | | | 4 | |
Russia | | | 4 | |
South Africa | | | 4 | |
United States | | | 4 | |
Argentina | | | 3 | |
Austria | | | 2 | |
Turkey | | | 2 | |
Thailand | | | 2 | |
Hong Kong | | | 2 | |
Greece | | | 1 | |
Philippines | | | 1 | |
Poland | | | — | (a) |
| | (a) | Represents less than 1% of Net Assets. | |
BlackRock Latin America Fund, Inc.
TEN LARGEST HOLDINGS
| | | | |
| | | Percent of
Net Assets | |
Banco Bradesco SA — ADR | | | 7 | % |
Petroleo Brasileiro SA — ADR | | | 7 | |
Itau Unibanco Holding SA, Preference Shares — ADR | | | 7 | |
Vale SA — ADR | | | 6 | |
America Movil SAB de CV, Series L — ADR | | | 5 | |
AMBEV SA — ADR | | | 4 | |
B3 SA — Brasil Bolsa Balcao | | | 4 | |
Fomento Economico Mexicano SAB de CV — ADR | | | 3 | |
Grupo Financiero Banorte SAB de CV, Series O | | | 3 | |
Credicorp Ltd. | | | 3 | |
GEOGRAPHIC ALLOCATION
| | | | |
| | | Percent of
Net Assets | |
Brazil | | | 67 | % |
Mexico | | | 22 | |
Peru | | | 4 | |
Argentina | | | 3 | |
Chile | | | 2 | |
Other | | | 1 | (a) |
Other Assets Less Liabilities | | | 1 | |
| | (a) | Other includes a 1% or less investment in each of the following countries: | |
Colombia and Panama.
| | |
| 8 | | 2017 BLACKROCK ANNUAL REPORTTO SHAREHOLDERS |
About Fund Performance
Institutional Shares are not subject to any sales charge. These shares bear no ongoing distribution or service fees and are available only to certain eligible investors.
Investor A Shares are subject to a maximum initial sales charge (front-end load) of 5.25% and a service fee of 0.25% per year (but no distribution fee). Certain redemptions of these shares may be subject to a contingent deferred sales charge (“CDSC”) where no initial sales charge was paid at the time of purchase. These shares are generally available through financial intermediaries.
Investor B Shares (available only in BlackRock Latin America Fund, Inc.) are subject to a maximum CDSC of 4.50% declining to 0% after six years. In addition, these shares are subject to a distribution fee of 0.75% per year and a service fee of 0.25% per year. These shares automatically convert to Investor A Shares after approximately eight years. (There is no initial sales charge for automatic share conversions.) All returns for periods greater than eight years reflect this conversion. These shares are only available through exchanges and dividend and capital gain reinvestments by current holders and for purchase by certain employer-sponsored retirement plans.
Investor C Shares are subject to a 1.00% CDSC if redeemed within one year of purchase. In addition, these shares are subject to a distribution fee of 0.75% per year and a service fee of 0.25% per year. These shares are generally available through financial intermediaries.
Performance information reflects past performance and does not guarantee future results. Current performance may be lower or higher than the performance data quoted. Refer to www.blackrock.com to obtain performance data current to the most recent month end. Performance results do not reflect the deduction of taxes that a shareholder would pay on fund distributions or the redemption of fund shares. Figures shown in the performance tables on the previous pages assume reinvestment of all distributions, if any, at net asset value (“NAV”) on the ex-dividend date. Investment return and principal value of shares will fluctuate so that shares, when redeemed, may be worth more or less than their original cost. Distributions paid to each class of shares will vary because of the different levels of service, distribution and transfer agency fees applicable to each class, which are deducted from the income available to be paid to shareholders.
BlackRock Advisors, LLC (the “Manager”), each Fund’s investment adviser, waived a portion of the Funds’ expenses. Without such waiver, the Funds’ performance would have been lower. The Manager is under no obligation to waive or to continue waiving its fees and such voluntary waiver may be reduced or discontinued at any time. See Note 6 of the Notes to Financial Statements for additional information on waivers.
Disclosure of Expenses
Shareholders of the Funds may incur the following charges: (a) transactional expenses, such as sales charges; and (b) operating expenses, including investment advisory fees, service and distribution fees, including 12b-1 fees, acquired fund fees and expenses, and other fund expenses. The expense examples on the previous pages (which are based on a hypothetical investment of $1,000 invested on May 1, 2017 and held through October 31, 2017) are intended to assist shareholders both in calculating expenses based on an investment in each Fund and in comparing these expenses with similar costs of investing in other mutual funds.
The expense examples provide information about actual account values and actual expenses. In order to estimate the expenses a shareholder paid during the period covered by this report, shareholders can divide their account value by $1,000 and then multiply the result by the number corresponding to their Fund and share class under the heading entitled “Expenses Paid During the Period.”
The expense examples also provide information about hypothetical account values and hypothetical expenses based on a Fund’s actual expense ratio and an assumed rate of return of 5% per year before expenses. In order to assist shareholders in comparing the ongoing expenses of investing in these Funds and other funds, compare the 5% hypothetical examples with the 5% hypothetical examples that appear in shareholder reports of other funds.
The expenses shown in the expense examples are intended to highlight shareholders’ ongoing costs only and do not reflect any transactional expenses, such as sales charges, if any. Therefore, the hypothetical examples are useful in comparing ongoing expenses only, and will not help shareholders determine the relative total expenses of owning different funds. If these transactional expenses were included, shareholder expenses would have been higher.
Derivative Financial Instruments
The Funds may invest in various derivative financial instruments. These instruments are used to obtain exposure to a security, commodity, index, market, and/or other assets without owning or taking physical custody of securities, commodities and/or other referenced assets or to manage market, equity, credit, interest rate, foreign currency exchange rate, commodity and/or other risks. Derivative financial instruments may give rise to a form of economic leverage and involve risks, including the imperfect correlation between the value of a derivative financial instrument and the underlying asset, possible default of the counterparty to the transaction or illiquidity of the instrument. The Funds’ successful use of a derivative financial instrument depends on the investment adviser’s ability to predict pertinent market movements accurately, which cannot be assured. The use of these instruments may result in losses greater than if they had not been used, may limit the amount of appreciation a Fund can realize on an investment and/or may result in lower distributions paid to shareholders. The Funds’ investments in these instruments, if any, are discussed in detail in the Notes to Financial Statements.
| | | | |
| ABOUT FUND PERFORMANCE / DISCLOSUREOF EXPENSES / DERIVATIVE FINANCIAL INSTRUMENTS | | | 9 | |
| | |
Schedule of Investments October 31, 2017 | | BlackRock Emerging Markets Fund, Inc. (Percentages shown are based on Net Assets) |
| | | | | | | | |
| Security | | Shares | | | Value | |
Common Stocks | | | | | | | | |
|
| Argentina — 3.3% | |
Grupo Supervielle SA — ADR | | | 218,780 | | | $ | 5,865,492 | |
Pampa Energia SA — ADR(a) | | | 77,938 | | | | 5,286,534 | |
| | | | | | | | |
| | | | | | | 11,152,026 | |
| Austria — 2.2% | |
Erste Group Bank AG(a) | | | 173,342 | | | | 7,440,693 | |
| | | | | | | | |
| Brazil — 6.2% | |
Banco Nacional SA, Preference Shares(a)(b) | | | 42,567,626 | | | | — | |
BR Malls Participacoes SA | | | 1,328,478 | | | | 5,149,490 | |
Companhia Hering SA | | | 486,734 | | | | 4,344,644 | |
Cyrela Brazil Realty SA Empreendimentos e Participacoes | | | 89,219 | | | | 349,098 | |
EcoRodovias Infraestrutura e Logistica SA | | | 1,507,279 | | | | 5,621,252 | |
Kroton Educacional SA | | | 1,024,359 | | | | 5,633,301 | |
| | | | | | | | |
| | | | | | | 21,097,785 | |
| China — 25.7% | |
Alibaba Group Holding Ltd. — ADR(a) | | | 75,668 | | | | 13,990,256 | |
Baidu, Inc. — ADR(a) | | | 38,127 | | | | 9,300,700 | |
Bank of China Ltd., Class H | | | 26,162,200 | | | | 13,074,893 | |
China Literature Ltd.(a)(c) | | | 208 | | | | 1,481 | |
China National Building Material Co. Ltd., Class H | | | 5,372,000 | | | | 4,534,118 | |
China Overseas Land & Investment Ltd. | | | 1,756,000 | | | | 5,701,760 | |
CNOOC Ltd. | | | 6,101,000 | | | | 8,330,262 | |
Huaneng Power International, Inc., Class H | | | 3,126,000 | | | | 2,090,634 | |
Jiangsu Expressway Co. Ltd., Class H | | | 1,500,000 | | | | 2,299,769 | |
Ping An Insurance Group Co. of China Ltd., Class H | | | 964,500 | | | | 8,475,967 | |
Silergy Corp. | | | 238,000 | | | | 5,140,498 | |
Skyworth Digital Holdings Ltd. | | | 6,512,000 | | | | 2,998,890 | |
Tencent Holdings Ltd. | | | 261,510 | | | | 11,753,590 | |
| | | | | | | | |
| | | | | | | 87,692,818 | |
| Greece — 1.3% | |
Alpha Bank AE(a) | | | 2,234,166 | | | | 4,454,758 | |
| | | | | | | | |
| Hong Kong — 1.8% | |
MGM China Holdings Ltd. | | | 2,764,400 | | | | 6,236,223 | |
| | | | | | | | |
| India — 12.2% | |
Bharat Petroleum Corp. Ltd. | | | 633,239 | | | | 5,298,175 | |
Housing Development Finance Corp. | | | 329,700 | | | | 8,695,111 | |
Indiabulls Housing Finance Ltd. | | | 298,227 | | | | 5,733,641 | |
Jindal Steel & Power Ltd.(a) | | | 1,602,109 | | | | 4,036,437 | |
Lupin Ltd. | | | 348,839 | | | | 5,540,503 | |
NTPC Ltd. | | | 1,832,235 | | | | 5,130,883 | |
Sun TV Network Ltd. | | | 302,052 | | | | 3,995,722 | |
Yes Bank Ltd. | | | 620,110 | | | | 3,014,238 | |
| | | | | | | | |
| | | | | | | 41,444,710 | |
| Indonesia — 4.4% | |
Astra International Tbk PT | | | 10,221,900 | | | | 6,029,556 | |
Bank Central Asia Tbk PT | | | 2,467,624 | | | | 3,801,228 | |
Bumi Serpong Damai Tbk PT | | | 913,200 | | | | 115,905 | |
Semen Indonesia Persero Tbk PT | | | 6,227,100 | | | | 5,003,045 | |
| | | | | | | | |
| | | | | | | 14,949,734 | |
| Mexico — 6.0% | |
America Movil SAB de CV, Series L — ADR | | | 466,024 | | | | 7,978,331 | |
Fomento Economico Mexicano SAB de CV | | | 458,168 | | | | 3,999,822 | |
Grupo Financiero Banorte SAB de CV, Series O | | | 810,130 | | | | 4,807,938 | |
PLA Administradora Industrial S de RL de
CV(a) | | | 2,463,448 | | | | 3,791,847 | |
| | | | | | | | |
| | | | | | | 20,577,938 | |
| Philippines — 1.0% | |
Metropolitan Bank & Trust Co. | | | 1,931,080 | | | | 3,240,489 | |
| | | | | | | | |
| Poland — 0.0% | |
KGHM Polska Miedz SA | | | 2,218 | | | | 74,970 | |
| | | | | | | | |
| | | | | | | | |
| Security | | Shares | | | Value | |
| Russia — 4.0% | |
Novatek PJSC — GDR | | | 51,099 | | | $ | 5,832,215 | |
Sberbank of Russia PJSC | | | 1,818,242 | | | | 6,024,979 | |
Sberbank of Russia PJSC — ADR | | | 133,986 | | | | 1,922,995 | |
| | | | | | | | |
| | | | | | | 13,780,189 | |
| South Africa — 3.9% | |
Naspers Ltd., Class N | | | 30,153 | | | | 7,346,251 | |
Sanlam Ltd. | | | 1,220,975 | | | | 6,111,422 | |
| | | | | | | | |
| | | | | | | 13,457,673 | |
| South Korea — 14.6% | |
Korea Aerospace Industries Ltd. | | | 111,372 | | | | 5,653,518 | |
Pan Ocean Co. Ltd.(a) | | | 1,288,075 | | | | 6,050,806 | |
POSCO | | | 23,495 | | | | 6,848,450 | |
Samsung Electronics Co. Ltd. | | | 4,824 | | | | 11,891,665 | |
Samsung Electronics Co. Ltd., Preference Shares | | | 1,515 | | | | 3,034,309 | |
Shinhan Financial Group Co. Ltd. | | | 146,972 | | | | 6,601,716 | |
SK Holdings Co. Ltd. | | | 19,130 | | | | 4,950,268 | |
WONIK IPS Co. Ltd.(a) | | | 147,999 | | | | 4,806,641 | |
| | | | | | | | |
| | | | | | | 49,837,373 | |
| Taiwan — 4.9% | |
Land Mark Optoelectronics Corp. | | | 388,000 | | | | 4,952,726 | |
MediaTek, Inc. | | | 642,000 | | | | 7,305,647 | |
Nanya Technology Corp. | | | 1,619,000 | | | | 4,401,297 | |
| | | | | | | | |
| | | | | | | 16,659,670 | |
| | | | | | | | |
| Thailand — 2.0% | | | | | | |
Indorama Ventures PCL — NVDR | | | 2,577,100 | | | | 3,569,719 | |
Kasikornbank PCL — NVDR | | | 482,100 | | | | 3,193,086 | |
| | | | | | | | |
| | | | | | | 6,762,805 | |
| | | | | | | | |
| Turkey — 2.2% | | | | | | |
Eldorado Gold Corp. | | | 769,775 | | | | 966,619 | |
Koza Altin Isletmeleri AS(a)(d) | | | 232,091 | | | | 2,016,286 | |
Turk Hava Yollari(a) | | | 1,598,398 | | | | 4,386,554 | |
| | | | | | | | |
| | | | | | | 7,369,459 | |
| | | | | | | | |
Total Common Stocks — 95.7% | | | | | | | 326,229,313 | |
| | | | | | | | |
| | |
Participation Notes — 0.8% | | | | | | | | |
| | |
| China — 0.8% | | | | | | |
Deutsche Bank AG, (Kweichow Moutai) due 5/22/26(a) | | | 27,153 | | | | 2,532,119 | |
| | | | | | | | |
| | |
| Thailand — 0.0% | | | | | | |
Deutsche Bank AG (Kasikornbank PCL), due 3/10/25(a) | | | 16,995 | | | | 112,550 | |
| | | | | | | | |
| | | | | | | 2,644,669 | |
| | | | | | | | |
Total Long-Term Investments — 96.5%
(Cost — $290,527,981) | | | | | | | 328,873,982 | |
| | | | | | | | |
| | |
Short-Term Securities | | | | | | | | |
BlackRock Liquidity Funds, T-Fund, Institutional Class, 0.93%(e)(g) | | | 7,768,386 | | | | 7,768,386 | |
SL Liquidity Series, LLC, Money Market Series, 1.32%(e)(f)(g) | | | 5,599,441 | | | | 5,600,000 | |
| | | | | | | | |
Total Short-Term Securities — 3.9%
(Cost — $13,368,386) | | | | 13,368,386 | |
| | | | | | | | |
| |
Total Investments — 100.4%
(Cost — $303,896,367) | | | | 342,242,368 | |
Liabilities in Excess of Other
Assets — (0.4)% | | | | (1,445,570 | ) |
| | | | | | | | |
Net Assets — 100.0% | | | $ | 340,796,798 | |
| | | | | | | | |
| | |
| 10 | | 2017 BLACKROCK ANNUAL REPORTTO SHAREHOLDERS |
| | |
Schedule of Investments (continued) October 31, 2017 | | BlackRock Emerging Markets Fund, Inc. (Percentages shown are based on Net Assets) |
| (a) | Non-income producing security. |
| (b) | Security is valued using significant unobservable inputs and is classified as Level 3 in the fair value hierarchy. |
| (c) | Security exempt from registration pursuant to Rule 144A under the Securities Act of 1933, as amended. These securities may be resold in transactions exempt from registration to qualified institutional investors. |
| (d) | Security, or a portion of the security, is on loan. |
| (e) | Annualized 7-day yield as of period end. |
| (f) | Security was purchased with the cash collateral from loaned securities. |
| (g) | During the year ended October 31, 2017, investments in issuers considered to be affiliates of the Fund for purposes of Section 2(a)(3) of the Investment Company Act of 1940, as amended, were as follows: |
| | | | | | | | | | | | | | | | | | | | | | | | | | | | |
| Affiliate | | Shares
Held at
10/31/16 | | | Net
Activity | | | Shares
Held at
10/31/17 | | | Value at
10/31/17 | | | Income | | | Net
Realized
Gain (Loss) (a) | | | Change in
Unrealized
Appreciation
(Depreciation) | |
BlackRock Liquidity Funds, T-Fund, Institutional Class | | | 3,774,950 | | | | 3,993,436 | | | | 7,768,386 | | | $ | 7,768,386 | | | $ | 32,094 | | | $ | 16 | | | $ | — | |
SL Liquidity Series, LLC, Money Market Series | | | — | | | | 5,599,441 | | | | 5,599,441 | | | | 5,600,000 | | | | 23,142 | (b) | | | (353 | ) | | | — | |
| | | | | | | | | | | | | | | | | | | | | | | | | | | | |
| | | | | | | | | | | | | | $ | 13,368,386 | | | $ | 55,236 | | | $ | (337 | ) | | $ | — | |
| | | | | | | | | | | | | | | | | | | | | | | | | | | | |
| | (a) | Includes net capital gain distributions, if applicable. | |
| | (b) | Represents securities lending income earned from the reinvestment of cash collateral from loaned securities, net of fees and collateral investment expenses, and other payments to and from borrowers of securities. | |
Derivative Financial Instruments Outstanding as of Period End
Futures Contracts
| | | | | | | | | | | | | | | | |
| Description | | Number of
Contracts | | | Expiration
Date | | | Notional
Amount (000) | | | Value/
Unrealized
Appreciation
(Depreciation) | |
Long Contracts | | | | | | | | | | | | | | | | |
MSCI Emerging Markets Index | | | 47 | | | | 12/15/2017 | | | $ | 2,642 | | | $ | 13,957 | |
| | | | | | | | | | | | | | | | |
Derivative Financial Instruments Categorized by Risk Exposure
As of period end, the fair values of derivative financial instruments located in the Statements of Assets and Liabilities were as follows:
| | | | | | | | | | | | | | | | | | | | | | | | | | | | |
| | | Commodity
Contracts | | | Credit
Contracts | | | Equity
Contracts | | | Foreign
Currency
Exchange
Contracts | | | Interest Rate
Contracts | | | Other
Contracts | | | Total | |
Assets — Derivative Financial Instruments | | | | | | | | | | | | | | | | | | | | | | | | | | | | |
Futures contracts | | | | | | | | | | | | | | | | | | | | | | | | | | | | |
Net unrealized appreciation(a) | | $ | — | | | $ | — | | | $ | 13,957 | | | $ | — | | | $ | — | | | $ | — | | | $ | 13,957 | |
| | | | | | | | | | | | | | | | | | | | | | | | | | | | |
| | (a) | Includes cumulative appreciation (depreciation) on futures contracts, if any, as reported in the Schedule of Investments. Only current day’s variation margin is reported within the Statements of Assets and Liabilities. | |
For the year ended October 31, 2017, the effect of derivative financial instruments in the Statements of Operations was as follows:
| | | | | | | | | | | | | | | | | | | | | | | | | | | | |
| | | Commodity
Contracts | | | Credit
Contracts | | | Equity
Contracts | | | Foreign
Currency
Exchange
Contracts | | | Interest Rate
Contracts | | | Other
Contracts | | | Total | |
Net Realized Gain (Loss) from: | | | | | | | | | | | | | | | | | | | | | | | | | | | | |
Futures contracts | | $ | — | | | $ | — | | | $ | 543,202 | | | $ | — | | | $ | — | | | $ | — | | | $ | 543,202 | |
| | | | | | | | | | | | | | | | | | | | | | | | | | | | |
| Net Change in Unrealized Appreciation (Depreciation) on: | | | | | | | | | | | | | | | | | | | |
Futures contracts | | $ | — | | | $ | — | | | $ | 13,957 | | | $ | — | | | $ | — | | | $ | — | | | $ | 13,957 | |
| | | | | | | | | | | | | | | | | | | | | | | | | | | | |
| | | | |
| SCHEDULES OF INVESTMENTS | | | 11 | |
| | |
Schedule of Investments (continued) October 31, 2017 | | BlackRock Emerging Markets Fund, Inc. (Percentages shown are based on Net Assets) |
Average Quarterly Balances of Outstanding Derivative Financial Instruments
| | | | |
Futures contracts: | | | | |
Average notional value of contracts — long | | $ | 2,403,586 | |
For more information about the Fund’s investment risks regarding derivative financial instruments, refer to the Notes to Financial Statements.
Fair Value Hierarchy as of Period End
Various inputs are used in determining the fair value of investments and derivative financial instruments. For information about the Fund’s policy regarding valuation of investments and derivative financial instruments, refer to the Notes to Financial Statements.
The following table summarizes the Fund’s investments and derivative financial instruments categorized in the disclosure hierarchy:
| | | | | | | | | | | | | | | | |
| | | Level 1 | | | Level 2 | | | Level 3 | | | Total | |
Assets: | |
Investments: | |
Common Stocks: | | | | | | | | | | | | | | | | |
Argentina | | $ | 11,152,026 | | | $ | — | | | $ | — | | | $ | 11,152,026 | |
Austria | | | — | | | | 7,440,693 | | | | — | | | | 7,440,693 | |
Brazil | | | 21,097,785 | | | | — | | | | — | | | | 21,097,785 | |
China | | | 23,290,956 | | | | 64,401,862 | | | | — | | | | 87,692,818 | |
Greece | | | — | | | | 4,454,758 | | | | — | | | | 4,454,758 | |
Hong Kong | | | — | | | | 6,236,223 | | | | — | | | | 6,236,223 | |
India | | | — | | | | 41,444,710 | | | | — | | | | 41,444,710 | |
Indonesia | | | — | | | | 14,949,734 | | | | — | | | | 14,949,734 | |
Mexico | | | 20,577,938 | | | | — | | | | — | | | | 20,577,938 | |
Philippines | | | — | | | | 3,240,489 | | | | — | | | | 3,240,489 | |
Poland | | | — | | | | 74,970 | | | | — | | | | 74,970 | |
Russia | | | — | | | | 13,780,189 | | | | — | | | | 13,780,189 | |
South Africa | | | — | | | | 13,457,673 | | | | — | | | | 13,457,673 | |
South Korea | | | — | | | | 49,837,373 | | | | — | | | | 49,837,373 | |
Taiwan | | | — | | | | 16,659,670 | | | | — | | | | 16,659,670 | |
Thailand | | | — | | | | 6,762,805 | | | | — | | | | 6,762,805 | |
Turkey | | | 966,619 | | | | 6,402,840 | | | | — | | | | 7,369,459 | |
Participation Notes | | | — | | | | 2,644,669 | | | | — | | | | 2,644,669 | |
Short-Term Securities | | | 7,768,386 | | | | — | | | | — | | | | 7,768,386 | |
| | | | | | | | | | | | | | | | |
Subtotal | | $ | 84,853,710 | | | $ | 251,788,658 | | | $ | — | | | $ | 336,642,368 | |
| | | | | | | | | | | | | | | | |
Investments Valued at NAV(a) | | | | 5,600,000 | |
| | | | | | | | | | | | | | | | |
| | | $ | 342,242,368 | |
| | | | | | | | | | | | | | | | |
| | | | |
Derivative Financial Instruments(b) | | | | | | | | | | | | | | | | |
Assets: | | | | | | | | | | | | | | | | |
Equity contracts | | $ | 13,957 | | | $ | — | | | $ | — | | | $ | 13,957 | |
| | | | | | | | | | | | | | | | |
| | (a) | As of October 31, 2017, certain investments of the Fund were fair valued using NAV per share as no quoted market value is available and therefore have been excluded from the fair value hierarchy. | |
| | (b) | Derivative financial instruments are futures contracts which are valued at the unrealized appreciation (depreciation) on the instrument. | |
During the year ended October 31, 2017, there were no transfers between Level 1 and Level 2.
| | |
| 12 | | 2017 BLACKROCK ANNUAL REPORTTO SHAREHOLDERS |
| | |
Schedule of Investments (continued) October 31, 2017 | | BlackRock Emerging Markets Fund, Inc. (Percentages shown are based on Net Assets) |
A reconciliation of Level 3 investments is presented when the Fund had a significant amount of Level 3 investments at the beginning and/or end of the period in relation to net assets. The following table is a reconciliation of Level 3 investments for which significant unobservable inputs were used in determining fair value:
| | | | | | | | | | | | |
| | | Common
Stocks | | | Participation Notes | | | Total | |
Assets: | | | | | | | | | | | | |
Opening Balance, as of October 31, 2016 | | $ | 133 | | | $ | 3,653,808 | | | $ | 3,653,941 | |
Transfers into Level 3 | | | — | | | | — | | | | — | |
Transfers out of Level 3 | | | — | | | | — | | | | — | |
Accrued discounts/premiums | | | — | | | | — | | | | — | |
Net realized gain (loss) | | | — | | | | 732,736 | | | | 732,736 | |
Net change in unrealized appreciation (depreciation)(a)(b) | | | (133 | ) | | | (751,034 | ) | | | (751,167 | ) |
Purchases | | | — | | | | 186,422 | | | | 186,422 | |
Sales | | | — | | | | (3,821,932 | ) | | | (3,821,932 | ) |
| | | | | | | | | | | | |
Closing Balance, as of October 31, 2017 | | $ | — | | | $ | — | | | $ | — | |
| | | | | | | | | | | | |
Net change in unrealized appreciation (depreciation) on investments still held at October 31, 2017(b) | | $ | (133 | ) | | $ | — | | | $ | (133 | ) |
| | | | | | | | | | | | |
| | (a) | Included in the related net change in unrealized appreciation (depreciation) in the Statements of Operations. | |
| | (b) | Any difference between net change in unrealized appreciation (depreciation) and net change in unrealized appreciation (depreciation) on investments still held at October 31, 2017 is generally due to investments no longer held or categorized as Level 3 at period end. | |
See notes to financial statements.
| | | | |
| SCHEDULES OF INVESTMENTS | | | 13 | |
| | |
Schedule of Investments October 31, 2017 | | BlackRock Latin America Fund, Inc. (Percentages shown are based on Net Assets) |
| | | | | | | | |
Security | | Shares | | | Value | |
Common Stocks | | | | | | | | |
| | |
| Argentina — 3.5% | | | | | | |
Adecoagro SA(a) | | | 77,000 | | | $ | 782,320 | |
Grupo Financiero Galicia SA — ADR | | | 19,000 | | | | 1,043,100 | |
Grupo Supervielle SA — ADR | | | 75,000 | | | | 2,010,750 | |
MercadoLibre, Inc. | | | 3,956 | | | | 950,667 | |
Pampa Energia SA — ADR(a) | | | 27,000 | | | | 1,831,410 | |
| | | | | | | | |
| | | | | | | 6,618,247 | |
| Brazil — 66.4% | | | | | | |
AMBEV SA | | | 350,000 | | | | 2,236,114 | |
AMBEV SA — ADR | | | 1,286,000 | | | | 8,140,380 | |
Arezzo Industria e Comercio SA | | | 96,000 | | | | 1,483,447 | |
B3 SA — Brasil Bolsa Balcao | | | 905,000 | | | | 6,611,897 | |
Banco Bradesco SA — ADR | | | 1,338,000 | | | | 14,142,660 | |
Banco do Brasil SA | | | 342,000 | | | | 3,600,550 | |
Biotoscana Investments SA(a) | | | 89,000 | | | | 639,348 | |
BR Malls Participacoes SA | | | 745,000 | | | | 2,887,721 | |
Bradespar SA, Preference Shares | | | 182,000 | | | | 1,335,249 | |
CCR SA | | | 630,000 | | | | 3,505,029 | |
Cia Energetica de Sao Paulo, Preference B Shares | | | 218,000 | | | | 866,322 | |
Companhia Hering SA | | | 106,078 | | | | 946,864 | |
Eneva SA(a) | | | 260,000 | | | | 1,061,046 | |
Iguatemi Empresa de Shopping Centers SA | | | 212,000 | | | | 2,493,737 | |
Iochpe-Maxion SA | | | 288,000 | | | | 1,971,180 | |
IRB Brasil Resseguros SA(a) | | | 149,000 | | | | 1,494,418 | |
Itau Unibanco Holding SA, Preference Shares — ADR | | | 1,035,000 | | | | 13,258,350 | |
Kroton Educacional SA | | | 794,000 | | | | 4,366,478 | |
Linx SA | | | 178,000 | | | | 1,119,812 | |
Localiza Rent a Car SA | | | 53,000 | | | | 937,581 | |
Lojas Americanas SA, Preference Shares | | | 683,000 | | | | 3,670,449 | |
Lojas Renner SA | | | 414,000 | | | | 4,363,623 | |
Magazine Luiza SA | | | 111,000 | | | | 2,163,131 | |
MRV Engenharia e Participacoes SA | | | 332,000 | | | | 1,283,832 | |
Petroleo Brasileiro SA — ADR(a) | | | 1,332,000 | | | | 13,820,200 | |
Raia Drogasil SA | | | 111,000 | | | | 2,653,780 | |
Rumo SA(a) | | | 1,338,001 | | | | 5,194,453 | |
Sao Martinho SA | | | 167,000 | | | | 939,831 | |
Telefonica Brasil SA — ADR | | | 71,000 | | | | 1,093,400 | |
Telefonica Brasil SA, Preference Shares | | | 73,000 | | | | 1,126,922 | |
Ultrapar Participacoes SA | | | 207,000 | | | | 4,941,980 | |
Vale SA — ADR | | | 1,121,000 | | | | 10,974,590 | |
| | | | | | | | |
| | | | | | | 125,324,374 | |
| Chile — 1.6% | | | | | | |
SACI Falabella | | | 313,000 | | | | 2,989,813 | |
| | | | | | | | |
| Colombia — 0.4% | | | | | | |
Cemex Latam Holdings SA(a) | | | 202,000 | | | | 715,820 | |
| | | | | | | | |
| Mexico — 22.3% | | | | | | |
Alsea SAB de CV | | | 303,000 | | | | 918,558 | |
America Movil SAB de CV, Series L — ADR | | | 505,000 | | | | 8,645,600 | |
Arca Continental SAB de CV | | | 553,000 | | | | 3,519,320 | |
Cemex SAB de CV — ADR(a) | | | 578,000 | | | | 4,687,580 | |
Corp. Inmobiliaria Vesta SAB de CV | | | 981,000 | | | | 1,217,823 | |
Fomento Economico Mexicano SAB de CV — ADR | | | 70,000 | | | | 6,142,500 | |
Gruma SAB de CV, Class B | | | 67,000 | | | | 877,630 | |
Grupo Financiero Banorte SAB de CV, Series O | | | 1,010,000 | | | | 5,994,122 | |
Grupo Mexico SAB de CV, Series B | | | 1,510,000 | | | | 4,910,006 | |
PLA Administradora Industrial S de RL de CV(a) | | | 726,000 | | | | 1,117,491 | |
Wal-Mart de Mexico SAB de CV | | | 1,806,000 | | | | 4,035,575 | |
| | | | | | | | |
| | | | | | | 42,066,205 | |
| Panama — 0.4% | | | | | | |
Copa Holdings SA, Class A | | | 7,000 | | | | 862,330 | |
| | | | | | | | |
| | | | | | | | |
Security | | Shares/Par
(000) | | | Value | |
| Peru — 4.0% | | | | | | |
Credicorp Ltd. | | | 26,000 | | | $ | 5,445,440 | |
Southern Copper Corp. | | | 50,000 | | | | 2,147,500 | |
| | | | | | | | |
| | | | | | | 7,592,940 | |
| | | | | | | | |
Total Common Stocks — 98.6% | | | | | | | 186,169,729 | |
| | | | | | | | |
| | |
Corporate Bonds | | | | | | | | |
| | |
| Brazil — 0.4% | | | | | | |
Hypermarcas SA, 11.30%, 10/15/18(b) | | BRL | 412 | | | | 20,551 | |
Klabin SA: | | | | | | | | |
8.00%, 1/08/19(c)(d) | | | 25 | | | | 488,251 | |
7.25%, 6/15/20 | | | 22 | | | | 128,735 | |
2.50%, 6/15/22 | | | 17 | | | | 99,027 | |
Lupatech SA, Series 1, 6.50%, 4/15/18(a)(d)(e) | | | 2,128 | | | | 32,525 | |
| | | | | | | | |
Total Corporate Bonds — 0.4% | | | | | | | 769,089 | |
| | | | | | | | |
| | |
Warrants(a) | | | | | | | | |
| | |
| Brazil — 0.0% | | | | | | |
Iochpe-Maxion SA (Expires 06/03/19) | | | 9,478 | | | | 30,422 | |
Klabin SA (Expires 06/15/20)(b) | | | 22,282 | | | | — | |
| | | | | | | | |
Total Warrants — 0.0% | | | | | | | 30,422 | |
| | | | | | | | |
| |
Total Investments — 99.0%
(Cost — $145,735,416) | | | | 186,969,240 | |
Other Assets Less Liabilities — 1.0% | | | | 1,797,264 | |
| | | | | | | | |
Net Assets — 100.0% | | | $ | 188,766,504 | |
| | | | | | | | |
| (a) | Non-income producing security. |
| (b) | Security is valued using significant unobservable inputs and is classified as Level 3 in the fair value hierarchy. |
| (c) | Step-up bond that pays an initial coupon rate for the first period and then a higher coupon rate for the following periods. Rate as of period end. |
| (d) | Convertible security. |
| (e) | Issuer filed for bankruptcy and/or is in default. |
| | |
| 14 | | 2017 BLACKROCK ANNUAL REPORTTO SHAREHOLDERS |
| | |
Schedule of Investments (continued) October 31, 2017 | | BlackRock Latin America Fund, Inc. (Percentages shown are based on Net Assets) |
During the year ended October 31, 2017, investments in issuers considered to be an affiliate of the Fund for purposes of Section 2(a)(3) of the Investment Company Act of 1940, as amended, were as follows:
| | | | | | | | | | | | | | | | | | | | | | | | | | | | |
| Affiliate | | Shares
Held at
10/31/16 | | | Net
Activity | | | Shares
Held at
10/31/17 | | | Value at
10/31/17 | | | Income | | | Net
Realized
Gain (a) | | | Change in
Unrealized
Appreciation
(Depreciation) | |
BlackRock Liquidity Funds, T-Fund, Institutional Class | | | 639,493 | | | | (639,493 | ) | | | — | | | $ | — | | | $ | 12,107 | | | $ | 1 | | | $ | — | |
| | | | | | | | | | | | | | | | | | | | | | | | | | | | |
| | (a) | Includes net capital gain distributions, if applicable. | |
Fair Value Hierarchy as of Period End
Various inputs are used in determining the fair value of investments. For information about the Fund’s policy regarding valuation of investments, refer to the Notes to Financial Statements.
The following table summarizes the Fund’s investments categorized in the disclosure hierarchy:
| | | | | | | | | | | | | | | | |
| | | Level 1 | | | Level 2 | | | Level 3 | | | Total | |
Assets: | | | | | | | | | | | | | | | | |
Investments: | | | | | | | | | | | | | | | | |
Common Stocks: | | | | | | | | | | | | | | | | |
Argentina | | $ | 6,618,247 | | | $ | — | | | $ | — | | | $ | 6,618,247 | |
Brazil | | | 125,324,374 | | | | — | | | | — | | | | 125,324,374 | |
Chile | | | 2,989,813 | | | | — | | | | — | | | | 2,989,813 | |
Colombia | | | 715,820 | | | | — | | | | — | | | | 715,820 | |
Mexico | | | 42,066,205 | | | | — | | | | — | | | | 42,066,205 | |
Panama | | | 862,330 | | | | — | | | | — | | | | 862,330 | |
Peru | | | 7,592,940 | | | | — | | | | — | | | | 7,592,940 | |
Corporate Bonds | | | — | | | | 748,538 | | | | 20,551 | | | | 769,089 | |
Warrants | | | 30,422 | | | | — | | | | — | | | | 30,422 | |
| | | | | | | | | | | | | | | | |
| | $ | 186,200,151 | | | $ | 748,538 | | | $ | 20,551 | | | $ | 186,969,240 | |
| | | | | | | | | | | | | | | | |
During the year ended October 31, 2017, there were no transfers between Level 1 and Level 2.
A reconciliation of Level 3 investments is presented when the Fund had a significant amount of Level 3 investments at the beginning and/or end of the period in relation to net assets. The following table is a reconciliation of Level 3 investments for which significant unobservable inputs were used in determining fair value:
| | | | | | | | | | | | |
| | | Corporate Bonds | | | Participation Notes | | | Total | |
Assets: | | | | | | | | | | | | |
Opening Balance, as of October 31, 2016 | | $ | 57,023 | | | $ | 1,861,766 | | | $ | 1,918,789 | |
Transfers into Level 3 | | | — | | | | — | | | | — | |
Transfers out of Level 3 | | | — | | | | — | | | | — | |
Accrued discounts/premiums | | | — | | | | — | | | | — | |
Net realized gain (loss) | | | (37,397 | ) | | | 733,107 | | | | 695,710 | |
Net change in unrealized appreciation (depreciation)(a)(b) | | | 45,167 | | | | (1,081,887 | ) | | | (1,036,720 | ) |
Purchases | | | | | | | | | | | | |
Sales | | | (44,242 | ) | | | (1,512,986 | ) | | | (1,557,228 | ) |
| | | | | | | | | | | | |
Closing Balance, as of October 31, 2017 | | $ | 20,551 | | | $ | — | | | $ | 20,551 | |
| | | | | | | | | | | | |
Net change in unrealized appreciation (depreciation) on investments still held at October 31, 2017(b) | | $ | 45,167 | | | $ | — | | | $ | 45,167 | |
| | | | | | | | | | | | |
| | (a) | Included in the related net change in unrealized appreciation (depreciation) in the Statements of Operations. | |
| | (b) | Any difference between net change in unrealized appreciation (depreciation) and net change in unrealized appreciation (depreciation) on investments still held at October 31, 2017 is generally due to investments no longer held or categorized as Level 3 at period end. | |
See notes to financial statements.
| | | | |
| SCHEDULES OF INVESTMENTS | | | 15 | |
Statements of Assets and Liabilities
October 31, 2017
| | | | | | | | |
| | | BlackRock
Emerging Markets
Fund, Inc. | | | BlackRock
Latin America
Fund, Inc. | |
| | |
ASSETS | | | | | | | | |
Investments at value — unaffiliated(a)(b) | | $ | 328,873,982 | | | $ | 186,969,240 | |
Investments at value — affiliated(c) | | | 13,368,386 | | | | — | |
Cash pledged for futures contracts | | | 110,000 | | | | — | |
Foreign currency at value(d) | | | 765,170 | | | | 93,829 | |
Receivables: | | | | | | | | |
Investments sold | | | 4,577,506 | | | | 2,602,854 | |
Capital shares sold | | | 717,396 | | | | 143,143 | |
Dividends — unaffiliated | | | 358,428 | | | | 287,333 | |
Variation margin on futures contracts | | | 22,795 | | | | — | |
Dividends — affiliated | | | 4,732 | | | | 753 | |
Securities lending income — affiliated | | | 2,604 | | | | — | |
Interest — unaffiliated | | | — | | | | 30,187 | |
Prepaid expenses | | | 49,356 | | | | 47,726 | |
| | | | | | | | |
Total assets | | | 348,850,355 | | | | 190,175,065 | |
| | | | | | | | |
| | |
LIABILITIES | | | | | | | | |
Cash collateral on securities loaned at value | | | 5,600,000 | | | | — | |
Bank overdraft | | | — | | | | 773,953 | |
Payables: | | | | | | | | |
Capital shares redeemed | | | 768,067 | | | | 197,663 | |
Investments purchased | | | 680,840 | | | | — | |
Investment advisory fees | | | 289,744 | | | | 173,880 | |
Deferred foreign capital gain tax | | | 184,927 | | | | 14,310 | |
Service and distribution fees | | | 91,075 | | | | 40,516 | |
Officer’s and Directors’ fees | | | 1,166 | | | | 753 | |
Other affiliates | | | 904 | | | | 482 | |
Other accrued expenses | | | 436,834 | | | | 207,004 | |
| | | | | | | | |
Total liabilities | | | 8,053,557 | | | | 1,408,561 | |
| | | | | | | | |
| | |
NET ASSETS | | $ | 340,796,798 | | | $ | 188,766,504 | |
| | | | | | | | |
| | |
NET ASSETS CONSIST OF | | | | | | | | |
Paid-in capital | | $ | 325,747,944 | | | $ | 176,272,049 | |
Undistributed net investment income | | | 739,845 | | | | 1,375,059 | |
Accumulated net realized loss | | | (23,865,849 | ) | | | (30,087,632 | ) |
Net unrealized appreciation (depreciation) | | | 38,174,858 | | | | 41,207,028 | |
| | | | | | | | |
NET ASSETS | | $ | 340,796,798 | | | $ | 188,766,504 | |
| | | | | | | | |
| | |
(a) Investments at cost — unaffiliated | | $ | 290,527,981 | | | $ | 145,735,416 | |
(b) Securities loaned at value | | $ | 1,085,935 | | | $ | — | |
(c) Investments at cost — affiliated | | $ | 13,368,386 | | | $ | — | |
(d) Foreign currency at cost | | $ | 765,002 | | | $ | 93,829 | |
See notes to financial statements.
| | |
| 16 | | 2017 BLACKROCK ANNUAL REPORTTO SHAREHOLDERS |
Statements of Assets and Liabilities (continued)
October 31, 2017
| | | | | | | | |
| | | BlackRock
Emerging Markets
Fund, Inc. | | | BlackRock
Latin America
Fund, Inc. | |
| | |
Institutional: | | | | | | | | |
Net assets | | $ | 77,114,566 | | | $ | 64,009,478 | |
| | | | | | | | |
Shares outstanding, 100 million shares authorized | | | 3,390,598 | | | | 1,300,947 | |
| | | | | | | | |
Net asset value | | $ | 22.74 | | | $ | 49.20 | |
| | | | | | | | |
Par value | | $ | 0.100 | | | $ | 0.100 | |
| | | | | | | | |
| | |
Investor A: | | | | | | | | |
Net assets | | $ | 210,354,749 | | | $ | 107,992,103 | |
| | | | | | | | |
Shares outstanding, 100 million shares authorized | | | 9,612,597 | | | | 2,226,961 | |
| | | | | | | | |
Net asset value | | $ | 21.88 | | | $ | 48.49 | |
| | | | | | | | |
Par value | | $ | 0.100 | | | $ | 0.100 | |
| | | | | | | | |
| | |
Investor B: | | | | | | | | |
Net assets | | $ | — | | | $ | 18,909 | |
| | | | | | | | |
Shares outstanding, 100 million shares authorized | | | — | | | | 421.47 | |
| | | | | | | | |
Net asset value | | $ | — | | | $ | 44.86 | |
| | | | | | | | |
Par value | | $ | — | | | $ | 0.100 | |
| | | | | | | | |
| | |
Investor C: | | | | | | | | |
Net assets | | $ | 53,327,483 | | | $ | 16,746,014 | |
| | | | | | | | |
Shares outstanding, 100 million shares authorized | | | 2,882,487 | | | | 380,782 | |
| | | | | | | | |
Net asset value | | $ | 18.50 | | | $ | 43.98 | |
| | | | | | | | |
Par value | | $ | 0.100 | | | $ | 0.100 | |
| | | | | | | | |
See notes to financial statements.
Statements of Operations
Year Ended October 31, 2017
| | | | | | | | |
| | | BlackRock
Emerging Markets
Fund, Inc. | | | BlackRock
Latin America
Fund, Inc. | |
| | |
INVESTMENT INCOME | | | | | | | | |
Dividends — unaffiliated | | $ | 7,522,189 | | | $ | 4,372,450 | |
Dividends — affiliated | | | 32,094 | | | | 12,107 | |
Interest — unaffiliated | | | 571 | | | | 76,339 | |
Securities lending income — affiliated — net | | | 23,142 | | | | — | |
Foreign taxes withheld | | | (746,420 | ) | | | (464,403 | ) |
| | | | | | | | |
Total investment income | | | 6,831,576 | | | | 3,996,493 | |
| | | | | | | | |
| | |
EXPENSES | | | | | | | | |
Investment advisory | | | 3,334,657 | | | | 1,805,192 | |
Service and distribution — class specific | | | 1,232,244 | | | | 455,514 | |
Transfer agent — class specific | | | 922,327 | | | | 320,357 | |
Custodian | | | 209,331 | | | | 89,318 | |
Professional | | | 100,094 | | | | 61,905 | |
Accounting services | | | 64,627 | | | | 56,554 | |
Registration | | | 62,098 | | | | 69,326 | |
Printing | | | 60,066 | | | | 29,736 | |
Officer and Directors | | | 13,730 | | | | 11,154 | |
Miscellaneous | | | 24,127 | | | | 20,757 | |
| | | | | | | | |
Total expenses | | | 6,023,301 | | | | 2,919,813 | |
Less fees waived by the Manager | | | (3,153 | ) | | | (1,268 | ) |
| | | | | | | | |
Total expenses after fees waived | | | 6,020,148 | | | | 2,918,545 | |
| | | | | | | | |
Net investment income | | | 811,428 | | | | 1,077,948 | |
| | | | | | | | |
| | |
REALIZED AND UNREALIZED GAIN (LOSS) | | | | | | | | |
Net realized gain (loss) from: | | | | | | | | |
Investments — unaffiliated | | | 104,040,739 | | | | 23,862,450 | (a) |
Investments — affiliated | | | (353 | ) | | | — | |
Futures contracts | | | 543,202 | | | | — | |
Foreign currency transactions | | | (106,264 | ) | | | (25,782 | ) |
Capital gain distributions from investment companies — affiliated | | | 16 | | | | 1 | |
| | | | | | | | |
| | | 104,477,340 | | | | 23,836,669 | |
| | | | | | | | |
Net change in unrealized appreciation (depreciation) on: | | | | | | | | |
Investments — unaffiliated | | | (34,529,111 | )(b) | | | (8,836,537 | )(c) |
Futures contracts | | | 13,957 | | | | — | |
Foreign currency translations | | | 5,597 | | | | (30,081 | ) |
| | | | | | | | |
| | | (34,509,557 | ) | | | (8,866,618 | ) |
| | | | | | | | |
Net realized and unrealized gain | | | 69,967,783 | | | | 14,970,051 | |
| | | | | | | | |
NET INCREASE IN NET ASSETS RESULTING FROM OPERATIONS | | $ | 70,779,211 | | | $ | 16,047,999 | |
| | | | | | | | |
| (a) | Includes $56,132 realized foreign capital gain tax. |
| (b) | Includes $(184,927) unrealized foreign capital gain tax. |
| (c) | Includes $(14,310) unrealized foreign capital gain tax. |
See notes to financial statements.
| | |
| 18 | | 2017 BLACKROCK ANNUAL REPORTTO SHAREHOLDERS |
Statements of Changes in Net Assets
| | | | | | | | | | | | | | | | | | | | |
| | | BlackRock Emerging Markets
Fund, Inc. | | | | | | BlackRock Latin America
Fund, Inc. | |
| | | Year Ended October 31, | | | | | | Year Ended October 31, | |
| | | 2017 | | | 2016 | | | | | | 2017 | | | 2016 | |
| | | | | |
INCREASE (DECREASE) IN NET ASSETS: | | | | | | | | | | | | | | | | | | | | |
| | | | | |
OPERATIONS | | | | | | | | | | | | | | | | | | | | |
Net investment income | | $ | 811,428 | | | $ | 1,950,723 | | | | | | | $ | 1,077,948 | | | $ | 1,919,601 | |
Net realized gain (loss) | | | 104,477,340 | | | | (6,775,370 | ) | | | | | | | 23,836,669 | | | | (14,393,611 | ) |
Net change in unrealized appreciation (depreciation) | | | (34,509,557 | ) | | | 53,534,997 | | | | | | | | (8,866,618 | ) | | | 55,778,211 | |
| | | | | | | | | | | | | | | | | | | | |
Net increase in net assets resulting from operations | | | 70,779,211 | | | | 48,710,350 | | | | | | | | 16,047,999 | | | | 43,304,201 | |
| | | | | | | | | | | | | | | | | | | | |
| | | | | |
DISTRIBUTIONS TO SHAREHOLDERS(a) | | | | | | | | | | | | | | | | | | | | |
From net investment income: | | | | | | | | | | | | | | | | | | | | |
Institutional | | | (836,175 | ) | | | (1,981,110 | ) | | | | | | | (679,329 | ) | | | (342,238 | ) |
Investor A | | | (2,476,565 | ) | | | (1,730,786 | ) | | | | | | | (1,077,921 | ) | | | (365,980 | ) |
Investor C | | | (659,003 | ) | | | (298,064 | ) | | | | | | | (73,597 | ) | | | — | |
| | | | | | | | | | | | | | | | | | | | |
Decrease in net assets resulting from distributions to shareholders | | | (3,971,743 | ) | | | (4,009,960 | ) | | | | | | | (1,830,847 | ) | | | (708,218 | ) |
| | | | | | | | | | | | | | | | | | | | |
| | | | | |
CAPITAL SHARE TRANSACTIONS | | | | | | | | | | | | | | | | | | | | |
Net decrease in net assets derived from capital share transactions | | | (137,323,779 | ) | | | (106,972,143 | ) | | | | | | | (12,084,602 | ) | | | (18,647,180 | ) |
| | | | | | | | | | | | | | | | | | | | |
| | | | | |
NET ASSETS | | | | | | | | | | | | | | | | | | | | |
Total increase (decrease) in net assets | | | (70,516,311 | ) | | | (62,271,753 | ) | | | | | | | 2,132,550 | | | | 23,948,803 | |
Beginning of year | | | 411,313,109 | | | | 473,584,862 | | | | | | | | 186,633,954 | | | | 162,685,151 | |
| | | | | | | | | | | | | | | | | | | | |
End of year | | $ | 340,796,798 | | | $ | 411,313,109 | | | | | | | $ | 188,766,504 | | | $ | 186,633,954 | |
| | | | | | | | | | | | | | | | | | | | |
Undistributed net investment income, end of year | | $ | 739,845 | | | $ | 1,833,247 | | | | | | | $ | 1,375,059 | | | $ | 1,822,779 | |
| | | | | | | | | | | | | | | | | | | | |
| (a) | Distributions for annual periods determined in accordance with U.S. federal income tax regulations. |
See notes to financial statements.
Financial Highlights
(For a share outstanding throughout each period)
| | | | | | | | | | | | | | | | | | | | |
| | | BlackRock Emerging Markets Fund, Inc. | |
| | | Institutional | |
| | | Year Ended October 31, | |
| | | 2017 | | | 2016 | | | 2015 | | | 2014 | | | 2013 | |
Net asset value, beginning of year | | $ | 18.32 | | | $ | 16.51 | | | $ | 20.56 | | | $ | 20.10 | | | $ | 19.28 | |
| | | | | | | | | | | | | | | | | | | | |
Net investment income(a) | | | 0.14 | | | | 0.16 | | | | 0.19 | | | | 0.18 | | | | 0.19 | |
Net realized and unrealized gain (loss) | | | 4.58 | | | | 1.86 | | | | (4.13 | ) | | | 0.39 | | | | 0.90 | |
| | | | | | | | | | | | | | | | | | | | |
Net increase (decrease) from investment operations | | | 4.72 | | | | 2.02 | | | | (3.94 | ) | | | 0.57 | | | | 1.09 | |
| | | | | | | | | | | | | | | | | | | | |
Distributions from net investment income(b) | | | (0.30 | ) | | | (0.21 | ) | | | (0.11 | ) | | | (0.11 | ) | | | (0.27 | ) |
| | | | | | | | | | | | | | | | | | | | |
Net asset value, end of year | | $ | 22.74 | | | $ | 18.32 | | | $ | 16.51 | | | $ | 20.56 | | | $ | 20.10 | |
| | | | | | | | | | | | | | | | | | | | |
| | | | | |
Total Return(c) | | | | | | | | | | | | | | | | | | | | |
Based on net asset value | | | 26.35 | % | | | 12.47 | % | | | (19.24 | )% | | | 2.86 | % | | | 5.67 | %(d) |
| | | | | | | | | | | | | | | | | | | | |
| | | | | |
Ratios to Average Net Assets | | | | | | | | | | | | | | | | | | | | |
Total expenses | | | 1.34 | % | | | 1.20 | % | | | 1.17 | %(e) | | | 1.17 | % | | | 1.29 | % |
| | | | | | | | | | | | | | | | | | | | |
Total expenses after fees waived and paid indirectly | | | 1.34 | % | | | 1.20 | % | | | 1.17 | %(e) | | | 1.16 | % | | | 1.29 | % |
| | | | | | | | | | | | | | | | | | | | |
Net investment income | | | 0.72 | % | | | 0.97 | % | | | 0.98 | %(e) | | | 0.88 | % | | | 0.95 | % |
| | | | | | | | | | | | | | | | | | | | |
| | | | | |
Supplemental Data | | | | | | | | | | | | | | | | | | | | |
Net assets, end of year (000) | | $ | 77,115 | | | $ | 120,939 | | | $ | 169,509 | | | $ | 467,132 | | | $ | 186,724 | |
| | | | | | | | | | | | | | | | | | | | |
Portfolio turnover rate | | | 126 | % | | | 92 | % | | | 103 | % | | | 94 | % | | | 71 | % |
| | | | | | | | | | | | | | | | | | | | |
| (a) | Based on average shares outstanding. |
| (b) | Distributions for annual periods determined in accordance with U.S.federal income tax regulations. |
| (c) | Where applicable, assumes the reinvestment of distributions. |
| (d) | Includes a payment from an affiliate to compensate for forgone securities lending revenue which impacted the Fund’s total return. Not including this payment, the Fund’s total return would have been 5.51%. |
| (e) | Ratios do not include expenses incurred indirectly as a result of investments in underlying funds of approximately 0.01% for the year ended October 31, 2015. |
See notes to financial statements.
| | |
| 20 | | 2017 BLACKROCK ANNUAL REPORTTO SHAREHOLDERS |
Financial Highlights (continued)
(For a share outstanding throughout each period)
| | | | | | | | | | | | | | | | | | | | |
| | | BlackRock Emerging Markets Fund, Inc. | |
| | | Investor A | |
| | | Year Ended October 31, | |
| | | 2017 | | | 2016 | | | 2015 | | | 2014 | | | 2013 | |
Net asset value, beginning of year | | $ | 17.62 | | | $ | 15.89 | | | $ | 19.81 | | | $ | 19.38 | | | $ | 18.61 | |
| | | | | | | | | | | | | | | | | | | | |
Net investment income(a) | | | 0.07 | | | | 0.08 | | | | 0.10 | | | | 0.06 | | | | 0.13 | |
Net realized and unrealized gain (loss) | | | 4.42 | | | | 1.79 | | | | (3.99 | ) | | | 0.42 | | | | 0.86 | |
| | | | | | | | | | | | | | | | | | | | |
Net increase (decrease) from investment operations | | | 4.49 | | | | 1.87 | | | | (3.89 | ) | | | 0.48 | | | | 0.99 | |
| | | | | | | | | | | | | | | | | | | | |
Distributions from net investment income(b) | | | (0.23 | ) | | | (0.14 | ) | | | (0.03 | ) | | | (0.05 | ) | | | (0.22 | ) |
| | | | | | | | | | | | | | | | | | | | |
Net asset value, end of year | | $ | 21.88 | | | $ | 17.62 | | | $ | 15.89 | | | $ | 19.81 | | | $ | 19.38 | |
| | | | | | | | | | | | | | | | | | | | |
| | | | | |
Total Return(c) | | | | | | | | | | | | | | | | | | | | |
Based on net asset value | | | 25.95 | % | | | 11.95 | % | | | (19.67 | )% | | | 2.46 | % | | | 5.30 | %(d) |
| | | | | | | | | | | | | | | | | | | | |
| | | | | |
Ratios to Average Net Assets | | | | | | | | | | | | | | | | | | | | |
Total expenses | | | 1.68 | % | | | 1.68 | % | | | 1.62 | %(e) | | | 1.58 | % | | | 1.60 | % |
| | | | | | | | | | | | | | | | | | | | |
Total expenses after fees waived and paid indirectly | | | 1.68 | % | | | 1.68 | % | | | 1.62 | %(e) | | | 1.58 | % | | | 1.60 | % |
| | | | | | | | | | | | | | | | | | | | |
Net investment income | | | 0.39 | % | | | 0.51 | % | | | 0.56 | %(e) | | | 0.32 | % | | | 0.69 | % |
| | | | | | | | | | | | | | | | | | | | |
| | | | | |
Supplemental Data | | | | | | | | | | | | | | | | | | | | |
Net assets, end of year (000) | | $ | 210,355 | | | $ | 191,205 | | | $ | 193,165 | | | $ | 231,467 | | | $ | 215,490 | |
| | | | | | | | | | | | | | | | | | | | |
Portfolio turnover rate | | | 126 | % | | | 92 | % | | | 103 | % | | | 94 | % | | | 71 | % |
| | | | | | | | | | | | | | | | | | | | |
| (a) | Based on average shares outstanding. |
| (b) | Distributions for annual periods determined in accordance with U.S. federal income tax regulations. |
| (c) | Where applicable, excludes the effects of any sales charges and assumes the reinvestment of distributions. |
| (d) | Includes a payment from an affiliate to compensate for forgone securities lending revenue which impacted the Fund’s total return. Not including this payment, the Fund’s total return would have been 5.13%. |
| (e) | Ratios do not include expenses incurred indirectly as a result of investments in underlying funds of approximately 0.01% for the year ended October 31, 2015. |
See notes to financial statements.
Financial Highlights (continued)
(For a share outstanding throughout each period)
| | | | | | | | | | | | | | | | | | | | |
| | | BlackRock Emerging Markets Fund, Inc. | |
| | | Investor C | |
| | | Year Ended October 31, | |
| | | 2017 | | | 2016 | | | 2015 | | | 2014 | | | 2013 | |
Net asset value, beginning of year | | $ | 14.93 | | | $ | 13.48 | | | $ | 16.91 | | | $ | 16.65 | | | $ | 16.02 | |
| | | | | | | | | | | | | | | | | | | | |
Net investment loss(a) | | | (0.09 | ) | | | (0.04 | ) | | | (0.04 | ) | | | (0.08 | ) | | | (0.03 | ) |
Net realized and unrealized gain (loss) | | | 3.76 | | | | 1.53 | | | | (3.39 | ) | | | 0.34 | | | | 0.74 | |
| | | | | | | | | | | | | | | | | | | | |
Net increase (decrease) from investment operations | | | 3.67 | | | | 1.49 | | | | (3.43 | ) | | | 0.26 | | | | 0.71 | |
| | | | | | | | | | | | | | | | | | | | |
Distributions from net investment income(b) | | | (0.10 | ) | | | (0.04 | ) | | | — | | | | — | | | | (0.08 | ) |
| | | | | | | | | | | | | | | | | | | | |
Net asset value, end of year | | $ | 18.50 | | | $ | 14.93 | | | $ | 13.48 | | | $ | 16.91 | | | $ | 16.65 | |
| | | | | | | | | | | | | | | | | | | | |
| | | | | |
Total Return(c) | | | | | | | | | | | | | | | | | | | | |
Based on net asset value | | | 24.84 | % | | | 11.07 | % | | | (20.28 | )% | | | 1.56 | % | | | 4.45 | %(d) |
| | | | | | | | | | | | | | | | | | | | |
| | | | | |
Ratios to Average Net Assets | | | | | | | | | | | | | | | | | | | | |
Total expenses | | | 2.53 | % | | | 2.52 | % | | | 2.44 | %(e) | | | 2.41 | % | | | 2.46 | % |
| | | | | | | | | | | | | | | | | | | | |
Total expenses after fees waived and paid indirectly | | | 2.53 | % | | | 2.52 | % | | | 2.44 | %(e) | | | 2.41 | % | | | 2.46 | % |
| | | | | | | | | | | | | | | | | | | | |
Net investment loss | | | (0.57 | )% | | | (0.33 | )% | | | (0.26 | )%(e) | | | (0.49 | )% | | | (0.18 | )% |
| | | | | | | | | | | | | | | | | | | | |
| | | | | |
Supplemental Data | | | | | | | | | | | | | | | | | | | | |
Net assets, end of year (000) | | $ | 53,327 | | | $ | 99,170 | | | $ | 110,911 | | | $ | 128,684 | | | $ | 119,015 | |
| | | | | | | | | | | | | | | | | | | | |
Portfolio turnover rate | | | 126 | % | | | 92 | % | | | 103 | % | | | 94 | % | | | 71 | % |
| | | | | | | | | | | | | | | | | | | | |
| (a) | Based on average shares outstanding. |
| (b) | Distributions for annual periods determined in accordance with U.S. federal income tax regulations. |
| (c) | Where applicable, excludes the effects of any sales charges and assumes the reinvestment of distributions. |
| (d) | Includes a payment from an affiliate to compensate for forgone securities lending revenue which impacted the Fund’s total return. Not including this payment, the Fund’s total return would have been 4.27%. |
| (e) | Ratios do not include expenses incurred indirectly as a result of investments in underlying funds of approximately 0.01% for the year ended October 31, 2015. |
See notes to financial statements.
| | |
| 22 | | 2017 BLACKROCK ANNUAL REPORTTO SHAREHOLDERS |
Financial Highlights
(For a share outstanding throughout each period)
| | | | | | | | | | | | | | | | | | | | |
| | | BlackRock Latin America Fund, Inc. | |
| | | Institutional | |
| | | Year Ended October 31, | |
| | | 2017 | | | 2016 | | | 2015 | | | 2014 | | | 2013 | |
Net asset value, beginning of year | | $ | 45.22 | | | $ | 34.98 | | | $ | 54.16 | | | $ | 56.13 | | | $ | 58.82 | |
| | | | | | | | | | | | | | | | | | | | |
Net investment income(a) | | | 0.40 | | | | 0.56 | | | | 0.49 | | | | 1.08 | | | | 0.79 | |
Net realized and unrealized gain (loss) | | | 4.15 | | | | 9.95 | | | | (18.53 | ) | | | (2.52 | ) | | | (2.48 | ) |
| | | | | | | | | | | | | | | | | | | | |
Net increase (decrease) from investment operations | | | 4.55 | | | | 10.51 | | | | (18.04 | ) | | | (1.44 | ) | | | (1.69 | ) |
| | | | | | | | | | | | | | | | | | | | |
Distributions from net investment income(b) | | | (0.57 | ) | | | (0.27 | ) | | | (1.14 | ) | | | (0.53 | ) | | | (1.00 | ) |
| | | | | | | | | | | | | | | | | | | | |
Net asset value, end of year | | $ | 49.20 | | | $ | 45.22 | | | $ | 34.98 | | | $ | 54.16 | | | $ | 56.13 | |
| | | | | | | | | | | | | | | | | | | | |
| | | | | |
Total Return(c) | | | | | | | | | | | | | | | | | | | | |
Based on net asset value | | | 10.37 | % | | | 30.32 | % | | | (33.77 | )% | | | (2.51 | )% | | | (3.01 | )% |
| | | | | | | | | | | | | | | | | | | | |
| | | | | |
Ratios to Average Net Assets | | | | | | | | | | | | | | | | | | | | |
Total expenses | | | 1.31 | % | | | 1.33 | % | | | 1.32 | % | | | 1.25 | % | | | 1.27 | % |
| | | | | | | | | | | | | | | | | | | | |
Total expenses after fees waived and paid indirectly | | | 1.31 | % | | | 1.33 | % | | | 1.32 | % | | | 1.25 | % | | | 1.27 | % |
| | | | | | | | | | | | | | | | | | | | |
Net investment income | | | 0.88 | % | | | 1.52 | % | | | 1.14 | % | | | 1.99 | % | | | 1.36 | % |
| | | | | | | | | | | | | | | | | | | | |
| | | | | |
Supplemental Data | | | | | | | | | | | | | | | | | | | | |
Net assets, end of year (000) | | $ | 64,009 | | | $ | 56,867 | | | $ | 45,472 | | | $ | 87,941 | | | $ | 110,295 | |
| | | | | | | | | | | | | | | | | | | | |
Portfolio turnover rate | | | 56 | % | | | 58 | % | | | 35 | % | | | 42 | % | | | 66 | % |
| | | | | | | | | | | | | | | | | | | | |
| (a) | Based on average shares outstanding. |
| (b) | Distributions for annual periods determined in accordance with U.S. federal income tax regulations. |
| (c) | Where applicable, assumes the reinvestment of distributions. |
See notes to financial statements.
Financial Highlights (continued)
(For a share outstanding throughout each period)
| | | | | | | | | | | | | | | | | | | | |
| | | BlackRock Latin America Fund, Inc. | |
| | | Investor A | |
| | | Year Ended October 31, | |
| | | 2017 | | | 2016 | | | 2015 | | | 2014 | | | 2013 | |
Net asset value, beginning of year | | $ | 44.57 | | | $ | 34.45 | | | $ | 53.31 | | | $ | 55.21 | | | $ | 57.90 | |
| | | | | | | | | | | | | | | | | | | | |
Net investment income(a) | | | 0.26 | | | | 0.42 | | | | 0.35 | | | | 0.92 | | | | 0.61 | |
Net realized and unrealized gain (loss) | | | 4.10 | | | | 9.83 | | | | (18.24 | ) | | | (2.47 | ) | | | (2.43 | ) |
| | | | | | | | | | | | | | | | | | | | |
Net increase (decrease) from investment operations | | | 4.36 | | | | 10.25 | | | | (17.89 | ) | | | (1.55 | ) | | | (1.82 | ) |
| | | | | | | | | | | | | | | | | | | | |
Distributions from net investment income(b) | | | (0.44 | ) | | | (0.13 | ) | | | (0.97 | ) | | | (0.35 | ) | | | (0.87 | ) |
| | | | | | | | | | | | | | | | | | | | |
Net asset value, end of year | | $ | 48.49 | | | $ | 44.57 | | | $ | 34.45 | | | $ | 53.31 | | | $ | 55.21 | |
| | | | | | | | | | | | | | | | | | | | |
| | | | | |
Total Return(c) | | | | | | | | | | | | | | | | | | | | |
Based on net asset value | | | 10.03 | % | | | 29.91 | % | | | (33.96 | )% | | | (2.78 | )% | | | (3.27 | )% |
| | | | | | | | | | | | | | | | | | | | |
| | | | | |
Ratios to Average Net Assets | | | | | | | | | | | | | | | | | | | | |
Total expenses | | | 1.62 | % | | | 1.65 | % | | | 1.61 | % | | | 1.53 | % | | | 1.53 | % |
| | | | | | | | | | | | | | | | | | | | |
Total expenses after fees waived and paid indirectly | | | 1.62 | % | | | 1.65 | % | | | 1.61 | % | | | 1.53 | % | | | 1.53 | % |
| | | | | | | | | | | | | | | | | | | | |
Net investment income | | | 0.58 | % | | | 1.17 | % | | | 0.83 | % | | | 1.72 | % | | | 1.06 | % |
| | | | | | | | | | | | | | | | | | | | |
| | | | | |
Supplemental Data | | | | | | | | | | | | | | | | | | | | |
Net assets, end of year (000) | | $ | 107,992 | | | $ | 105,414 | | | $ | 93,494 | | | $ | 178,571 | | | $ | 236,205 | |
| | | | | | | | | | | | | | | | | | | | |
Portfolio turnover rate | | | 56 | % | | | 58 | % | | | 35 | % | | | 42 | % | | | 66 | % |
| | | | | | | | | | | | | | | | | | | | |
| (a) | Based on average shares outstanding. |
| (b) | Distributions for annual periods determined in accordance with U.S. federal income tax regulations. |
| (c) | Where applicable, excludes the effects of any sales charges and assumes the reinvestment of distributions. |
See notes to financial statements.
| | |
| 24 | | 2017 BLACKROCK ANNUAL REPORTTO SHAREHOLDERS |
Financial Highlights (continued)
(For a share outstanding throughout each period)
| | | | | | | | | | | | | | | | | | | | |
| | | BlackRock Latin America Fund, Inc. | |
| | | Investor B | |
| | | Year Ended October 31, | |
| | | 2017 | | | 2016 | | | 2015 | | | 2014 | | | 2013 | |
Net asset value, beginning of year | | $ | 41.25 | | | $ | 32.18 | | | $ | 49.60 | | | $ | 51.51 | | | $ | 53.96 | |
| | | | | | | | | | | | | | | | | | | | |
Net investment income (loss)(a) | | | (0.21 | ) | | | 0.07 | | | | (0.11 | ) | | | 0.35 | | | | 0.08 | |
Net realized and unrealized gain (loss) | | | 3.82 | | | | 9.00 | | | | (17.04 | ) | | | (2.26 | ) | | | (2.28 | ) |
| | | | | | | | | | | | | | | | | | | | |
Net increase (decrease) from investment operations | | | 3.61 | | | | 9.07 | | | | (17.15 | ) | | | (1.91 | ) | | | (2.20 | ) |
| | | | | | | | | | | | | | | | | | | | |
Distributions from net investment income(b) | | | — | | | | — | | | | (0.27 | ) | | | — | | | | (0.25 | ) |
| | | | | | | | | | | | | | | | | | | | |
Net asset value, end of year | | $ | 44.86 | | | $ | 41.25 | | | $ | 32.18 | | | $ | 49.60 | | | $ | 51.51 | |
| | | | | | | | | | | | | | | | | | | | |
| | | | | |
Total Return(c) | | | | | | | | | | | | | | | | | | | | |
Based on net asset value | | | 8.75 | % | | | 28.18 | % | | | (34.71 | )% | | | (3.71 | )% | | | (4.12 | )% |
| | | | | | | | | | | | | | | | | | | | |
| | | | | |
Ratios to Average Net Assets | | | | | | | | | | | | | | | | | | | | |
Total expenses | | | 3.06 | % | | | 3.01 | % | | | 2.69 | % | | | 2.51 | % | | | 2.44 | % |
| | | | | | | | | | | | | | | | | | | | |
Total expenses after fees waived and paid indirectly | | | 3.05 | % | | | 3.00 | % | | | 2.69 | % | | | 2.51 | % | | | 2.44 | % |
| | | | | | | | | | | | | | | | | | | | |
Net investment income (loss) | | | (0.53 | )% | | | 0.23 | % | | | (0.27 | )% | | | 0.71 | % | | | 0.15 | % |
| | | | | | | | | | | | | | | | | | | | |
| | | | | |
Supplemental Data | | | | | | | | | | | | | | | | | | | | |
Net assets, end of year (000) | | $ | 19 | | | $ | 236 | | | $ | 932 | | | $ | 2,820 | | | $ | 5,009 | |
| | | | | | | | | | | | | | | | | | | | |
Portfolio turnover rate | | | 56 | % | | | 58 | % | | | 35 | % | | | 42 | % | | | 66 | % |
| | | | | | | | | | | | | | | | | | | | |
| (a) | Based on average shares outstanding. |
| (b) | Distributions for annual periods determined in accordance with U.S. federal income tax regulations. |
| (c) | Where applicable, excludes the effects of any sales charges and assumes the reinvestment of distributions. |
See notes to financial statements.
Financial Highlights (continued)
(For a share outstanding throughout each period)
| | | | | | | | | | | | | | | | | | | | |
| | | BlackRock Latin America Fund, Inc. | |
| | | Investor C | |
| | | Year Ended October 31, | |
| | | 2017 | | | 2016 | | | 2015 | | | 2014 | | | 2013 | |
Net asset value, beginning of year | | $ | 40.45 | | | $ | 31.41 | | | $ | 48.57 | | | $ | 50.37 | | | $ | 52.79 | |
| | | | | | | | | | | | | | | | | | | | |
Net investment income (loss)(a) | | | (0.06 | ) | | | 0.12 | | | | (0.02 | ) | | | 0.43 | | | | 0.13 | |
Net realized and unrealized gain (loss) | | | 3.72 | | | | 8.92 | | | | (16.64 | ) | | | (2.23 | ) | | | (2.24 | ) |
| | | | | | | | | | | | | | | | | | | | |
Net increase (decrease) from investment operations | | | 3.66 | | | | 9.04 | | | �� | (16.66 | ) | | | (1.80 | ) | | | (2.11 | ) |
| | | | | | | | | | | | | | | | | | | | |
Distributions from net investment income(b) | | | (0.13 | ) | | | — | | | | (0.50 | ) | | | — | | | | (0.31 | ) |
| | | | | | | | | | | | | | | | | | | | |
Net asset value, end of year | | $ | 43.98 | | | $ | 40.45 | | | $ | 31.41 | | | $ | 48.57 | | | $ | 50.37 | |
| | | | | | | | | | | | | | | | | | | | |
| | | | | |
Total Return(c) | | | | | | | | | | | | | | | | | | | | |
Based on net asset value | | | 9.12 | % | | | 28.78 | % | | | (34.53 | )% | | | (3.57 | )% | | | (4.05 | )% |
| | | | | | | | | | | | | | | | | | | | |
| | | | | |
Ratios to Average Net Assets | | | | | | | | | | | | | | | | | | | | |
Total expenses | | | 2.47 | % | | | 2.51 | % | | | 2.48 | % | | | 2.36 | % | | | 2.35 | % |
| | | | | | | | | | | | | | | | | | | | |
Total expenses after fees waived and paid indirectly | | | 2.47 | % | | | 2.51 | % | | | 2.47 | % | | | 2.36 | % | | | 2.35 | % |
| | | | | | | | | | | | | | | | | | | | |
Net investment income (loss) | | | (0.16 | )% | | | 0.37 | % | | | (0.04 | )% | | | 0.88 | % | | | 0.25 | % |
| | | | | | | | | | | | | | | | | | | | |
| | | | | |
Supplemental Data | | | | | | | | | | | | | | | | | | | | |
Net assets, end of year (000) | | $ | 16,746 | | | $ | 24,117 | | | $ | 22,787 | | | $ | 49,724 | | | $ | 72,047 | |
| | | | | | | | | | | | | | | | | | | | |
Portfolio turnover rate | | | 56 | % | | | 58 | % | | | 35 | % | | | 42 | % | | | 66 | % |
| | | | | | | | | | | | | | | | | | | | |
| (a) | Based on average shares outstanding. |
| (b) | Distributions for annual periods determined in accordance with U.S. federal income tax regulations. |
| (c) | Where applicable, excludes the effects of any sales charges and assumes the reinvestment of distributions. |
See notes to financial statements.
| | |
| 26 | | 2017 BLACKROCK ANNUAL REPORTTO SHAREHOLDERS |
Notes to Financial Statements
BlackRock Emerging Markets Fund, Inc. and BlackRock Latin America Fund, Inc. are each registered under the Investment Company Act of 1940, as amended (the “1940 Act”), as open-end management investment companies. Each Fund is organized as a Maryland corporation. The following are referred to herein collectively as the “Funds” or individually as a “Fund”:
| | | | |
| Fund Name | | Herein Referred To As | | Diversification
Classification |
BlackRock Emerging Markets Fund, Inc. | | Emerging Markets | | Non-diversified |
BlackRock Latin America Fund, Inc. | | Latin America | | Non-diversified |
Each Fund offers multiple classes of shares. All classes of shares have identical voting, dividend, liquidation and other rights and are subject to the same terms and conditions, except that certain classes bear expenses related to the shareholder servicing and distribution of such shares. Institutional Shares are sold only to certain eligible investors. Investor A and Investor C Shares are generally available through financial intermediaries. Investor B Shares are available only through exchanges and dividend and capital gain reinvestments by current holders, and for purchase by certain employer-sponsored retirement plans. Each class has exclusive voting rights with respect to matters relating to its shareholder servicing and distribution expenditures (except that Investor B shareholders may vote on material changes to the Investor A distribution and service plan).
| | | | | | | | |
| Share Class | | Initial Sales Charge | | CDSC | | | Conversion Privilege |
Institutional Shares | | No | | | No | | | None |
Investor A Shares | | Yes | | | No | (a) | | None |
Investor B Shares(b) | | No | | | Yes | | | To Investor A Shares after approximately 8 years |
Investor C Shares | | No | | | Yes | | | None |
| | (a) | Investor A Shares may be subject to a contingent deferred sales charge (“CDSC”) for certain redemptions where no initial sales charge was paid at the time of purchase. | |
| | (b) | Effective on or about the close of business on December 27, 2017, all issued and outstanding Investor B Shares of Latin America will be converted into Investor A Shares. | |
The Funds, together with certain other registered investment companies advised by BlackRock Advisors, LLC (the “Manager”) or its affiliates, are included in a complex of open-end funds referred to as the Equity-Liquidity Complex.
| 2. | SIGNIFICANT ACCOUNTING POLICIES: |
The financial statements are prepared in conformity with accounting principles generally accepted in the United States of America (“U.S. GAAP”), which may require management to make estimates and assumptions that affect the reported amounts of assets and liabilities in the financial statements, disclosure of contingent assets and liabilities at the date of the financial statements and the reported amounts of increases and decreases in net assets from operations during the reporting period. Actual results could differ from those estimates. Each Fund is considered an investment company under U.S. GAAP and follows the accounting and reporting guidance applicable to investment companies. Below is a summary of significant accounting policies:
Investment Transactions and Income Recognition: For financial reporting purposes, investment transactions are recorded on the dates the transactions are entered into (the “trade dates”). Realized gains and losses on investment transactions are determined on the identified cost basis. Dividend income is recorded on the ex-dividend date. Dividends from foreign securities where the ex-dividend date may have passed are subsequently recorded when the Funds are informed of the ex-dividend date. Under the applicable foreign tax laws, a withholding tax at various rates may be imposed on capital gains, dividends and interest. Interest income, including amortization and accretion of premiums and discounts on debt securities, are recognized on an accrual basis. Income, expenses and realized and unrealized gains and losses are allocated daily to each class based on its relative net assets.
Foreign Currency Translation: Each Fund’s books and records are maintained in U.S. dollars. Securities and other assets and liabilities denominated in foreign currencies are translated into U.S. dollars using exchange rates determined as of the close of trading on the New York Stock Exchange (“NYSE”). Purchases and sales of investments are recorded at the rates of exchange prevailing on the respective dates of such transactions. Generally, when the U.S. dollar rises in value against a foreign currency, the investments denominated in that currency will lose value; the opposite effect occurs if the U.S. dollar falls in relative value.
Each Fund does not isolate the portion of the results of operations arising as a result of changes in the exchange rates from the changes in the market prices of investments held or sold for financial reporting purposes. Accordingly, the effects of changes in exchange rates on investments are not segregated in the Statements of Operations from the effects of changes in market prices of those investments, but are included as a component of net realized and unrealized gain (loss) from investments. Each Fund reports realized currency gains (losses) on foreign currency related transactions as components of net realized gain (loss) for financial reporting purposes, whereas such components are generally treated as ordinary income for U.S. federal income tax purposes.
Segregation and Collateralization: In cases where a Fund enters into certain investments (e.g., futures contracts and forward foreign currency exchange contracts) that would be treated as “senior securities” for 1940 Act purposes, a Fund may segregate or designate on its books and records cash or liquid assets having a market value at least equal to the amount of its future obligations under such investments. Doing so allows the investment to be excluded from treatment as a “senior security.” Furthermore, if required by an exchange or counterparty agreement, the Funds may be required to deliver/deposit cash and/or securities to/with an exchange, or broker-dealer or custodian as collateral for certain investments or obligations.
Distributions: Distributions paid by the Funds are recorded on the ex-dividend date. The character and timing of distributions are determined in accordance with U.S. federal income tax regulations, which may differ from U.S. GAAP.
| | | | |
| NOTESTO FINANCIAL STATEMENTS | | | 27 | |
Notes to Financial Statements (continued)
Recent Accounting Standard: In March 2017, the Financial Accounting Standards Board issued Accounting Standards Update “Premium Amortization of Purchased Callable Debt Securities” which amends the amortization period for certain purchased callable debt securities. Under the new guidance, the premium amortization of purchased callable debt securities that have explicit, non-contingent call features and are callable at fixed prices will be amortized to the earliest call date. The guidance will be applied on a modified retrospective basis and is effective for fiscal years, and their interim periods, beginning after December 15, 2018. Management is currently evaluating the impact of this guidance to the Funds.
Indemnifications: In the normal course of business, a Fund enters into contracts that contain a variety of representations that provide general indemnification. A Fund’s maximum exposure under these arrangements is unknown because it involves future potential claims against a Fund, which cannot be predicted with any certainty.
Other: Expenses directly related to a Fund or its classes are charged to that Fund or the applicable class. Other operating expenses shared by several funds, including other funds managed by the Manager, are prorated among those funds on the basis of relative net assets or other appropriate methods. Expenses directly related to the Funds and other shared expenses prorated to the Funds are allocated daily to each class based on their relative net assets or other appropriate methods.
The Funds have an arrangement with their custodian whereby credits are earned on uninvested cash balances, which could be used to reduce custody fees and/or overdraft charges. The Funds may incur charges on certain uninvested cash balances and overdrafts, subject to certain conditions.
| 3. | INVESTMENT VALUATION AND FAIR VALUE MEASUREMENTS: |
Investment Valuation Policies: The Funds’ investments are valued at fair value (also referred to as “market value” within the financial statements) as of the close of trading on the New York Stock Exchange (“NYSE”) (generally 4:00 p.m., Eastern time). U.S. GAAP defines fair value as the price the Funds would receive to sell an asset or pay to transfer a liability in an orderly transaction between market participants at the measurement date. The Funds determine the fair values of their financial instruments using various independent dealers or pricing services under policies approved by the Board of Directors of each Fund (the “Board”). The BlackRock Global Valuation Methodologies Committee (the “Global Valuation Committee”) is the committee formed by management to develop global pricing policies and procedures and to oversee the pricing function for all financial instruments.
Fair Value Inputs and Methodologies: The following methods and inputs are used to establish the fair value of each Fund’s assets and liabilities:
| | • | | Equity investments traded on a recognized securities exchange are valued at the official closing price each day, if available. For equity investments traded on more than one exchange, the official closing price on the exchange where the stock is primarily traded is used. Equity investments traded on a recognized exchange for which there were no sales on that day may be valued at the last available bid (long positions) or ask (short positions) price. |
| | • | | Fixed-income securities for which market quotations are readily available are generally valued using the last available bid prices or current market quotations provided by independent dealers or third party pricing services. Floating rate loan interests are valued at the mean of the bid prices from one or more independent brokers or dealers as obtained from a third party pricing service. Pricing services generally value fixed-income securities assuming orderly transactions of an institutional round lot size, but a fund may hold or transact in such securities in smaller, odd lot sizes. Odd lots often trade at lower prices than institutional round lots. The pricing services may use matrix pricing or valuation models that utilize certain inputs and assumptions to derive values, including transaction data (e.g., recent representative bids and offers), credit quality information, perceived market movements, news, and other relevant information. Certain fixed-income securities, including asset-backed and mortgage related securities may be valued based on valuation models that consider the estimated cash flows of each tranche of the entity, establish a benchmark yield and develop an estimated tranche specific spread to the benchmark yield based on the unique attributes of the tranche. The amortized cost method of valuation may be used with respect to debt obligations with sixty days or less remaining to maturity unless the Manager determines such method does not represent fair value. |
Generally, trading in foreign instruments is substantially completed each day at various times prior to the close of trading on the NYSE. Occasionally, events affecting the values of such instruments may occur between the foreign market close and the close of trading on the NYSE that may not be reflected in the computation of the Funds’ net assets. Each business day, the Funds use a pricing service to assist with the valuation of certain foreign exchange-traded equity securities and foreign exchange-traded and over-the-counter (“OTC”) options (the “Systematic Fair Value Price”). Using current market factors, the Systematic Fair Value Price is designed to value such foreign securities and foreign options at fair value as of the close of trading on the NYSE, which follows the close of the local markets.
| | • | | The Funds value their investment in SL Liquidity Series, LLC, Money Market Series (the “Money Market Series”) at fair value, which is ordinarily based upon their pro rata ownership in the underlying fund’s net assets. The Money Market Series seeks current income consistent with maintaining liquidity and preserving capital. Although the Money Market Series is not registered under the 1940 Act, its investments may follow the parameters of investments by a money market fund that is subject to Rule 2a-7 under the 1940 Act. |
| | • | | Futures contracts traded on exchanges are valued at their last sale price. |
| | • | | Forward foreign currency exchange contracts are valued at the mean between the bid and ask prices and are determined as of the close of trading on the NYSE. Interpolated values are derived when the settlement date of the contract is an interim date for which quotations are not available. |
| | • | | Participation notes are valued on the basis of last available bid prices or current market quotations provided by dealers or pricing services. |
If events (e.g., a company announcement, market volatility or a natural disaster) occur that are expected to materially affect the value of such investments, or in the event that the application of these methods of valuation results in a price for an investment that is deemed not to be representative of the market value of such investment, or if a price is not available, the investment will be valued by the Global Valuation Committee, or its delegate, in accordance with a policy approved by the Board as reflecting fair value (“Fair Valued Investments”). The fair valuation approaches that may be used by the Global Valuation Committee will include Market approach, Income approach and
| | |
| 28 | | 2017 BLACKROCK ANNUAL REPORTTO SHAREHOLDERS |
Notes to Financial Statements (continued)
Cost approach. Valuation techniques such as discounted cash flow, use of market comparables and matrix pricing are types of valuation approaches and are typically used in determining fair value. When determining the price for Fair Valued Investments, the Global Valuation Committee, or its delegate, seeks to determine the price that each Fund might reasonably expect to receive or pay from the current sale or purchase of that asset or liability in an arm’s-length transaction. Fair value determinations shall be based upon all available factors that the Global Valuation Committee, or its delegate, deems relevant and consistent with the principles of fair value measurement.
The Global Valuation Committee, or its delegate, employs various methods for calibrating valuation approaches for investments where an active market does not exist, including regular due diligence of each Fund’s pricing vendors, regular reviews of key inputs and assumptions, transactional back-testing or disposition analysis to compare unrealized gains and losses to realized gains and losses, reviews of missing or stale prices and large movements in market values and reviews of any market related activity. The pricing of all Fair Valued Investments is subsequently reported to the Board or a committee thereof on a quarterly basis. As a result of the inherent uncertainty in valuation of these investments, the fair values may differ from the values that would have been used had an active market existed.
For investments in equity or debt issued by privately held companies or funds (“Private Company” or collectively, the “Private Companies”) and other Fair Valued Investments, the fair valuation approaches that are used by third party pricing services utilize one or a combination of, but not limited to, the following inputs.
| | |
| | | Standard Inputs Generally Considered By Third Party Pricing Services |
Market approach | | (i) recent market transactions, including subsequent rounds of financing, in the underlying investment or comparable issuers; (ii) recapitalizations and other transactions across the capital structure; and (iii) market multiples of comparable issuers. |
Income approach | | (i) future cash flows discounted to present and adjusted as appropriate for liquidity, credit, and/or market risks; (ii) quoted prices for similar investments or assets in active markets; and (iii) other risk factors, such as interest rates, yield curves, volatilities, prepayment speeds, loss severities, credit risks, recovery rates, liquidation amounts and/or default rates. |
Cost approach | | (i) audited or unaudited financial statements, investor communications and financial or operational metrics issued by the Private Company; (ii) changes in the valuation of relevant indices or publicly traded companies comparable to the Private Company; (iii) relevant news and other public sources; and (iv) known secondary market transactions in the Private Company’s interests and merger or acquisition activity in companies comparable to the Private Company. |
Investments in series of preferred stock issued by Private Companies are typically valued utilizing Market approach in determining the enterprise value of the company. Such investments often contain rights and preferences that differ from other series of preferred and common stock of the same issuer. Valuation techniques such as an option pricing model (“OPM”), a probability weighted expected return model (“PWERM”) or a hybrid of those techniques are used in allocating enterprise value of the company, as deemed appropriate under the circumstances. The use of OPM and PWERM techniques involve a determination of the exit scenarios of the investment in order to appropriately allocate the enterprise value of the company among the various parts of its capital structure.
The Private Companies are not subject to the public company disclosure, timing, and reporting standards as other investments held by a Fund. Typically, the most recently available information by a Private Company is as of a date that is earlier than the date a Fund is calculating its NAV. This factor may result in a difference between the value of the investment and the price a Fund could receive upon the sale of the investment.
Fair Value Hierarchy: Various inputs are used in determining the fair value of investments and derivative financial instruments. These inputs to valuation techniques are categorized into a fair value hierarchy consisting of three broad levels for financial statement purposes as follows:
| | • | | Level 1 — Unadjusted price quotations in active markets/exchanges for identical assets or liabilities that each Fund has the ability to access |
| | • | | Level 2 — Other observable inputs (including, but not limited to, quoted prices for similar assets or liabilities in markets that are active, quoted prices for identical or similar assets or liabilities in markets that are not active, inputs other than quoted prices that are observable for the assets or liabilities (such as interest rates, yield curves, volatilities, prepayment speeds, loss severities, credit risks and default rates) or other market–corroborated inputs) |
| | • | | Level 3 — Unobservable inputs based on the best information available in the circumstances, to the extent observable inputs are not available (including each Fund’s own assumptions used in determining the fair value of investments) |
The hierarchy gives the highest priority to unadjusted quoted prices in active markets for identical assets or liabilities (Level 1 measurements) and the lowest priority to unobservable inputs (Level 3 measurements). Accordingly, the degree of judgment exercised in determining fair value is greatest for instruments categorized in Level 3. The inputs used to measure fair value may fall into different levels of the fair value hierarchy. In such cases, for disclosure purposes, the fair value hierarchy classification is determined based on the lowest level input that is significant to the fair value measurement in its entirety. Investments classified within Level 3 have significant unobservable inputs used by the Global Valuation Committee in determining the price for Fair Valued Investments. Level 3 investments include equity or debt issued by Private Companies. There may not be a secondary market, and/or there are a limited number of investors. Level 3 investments may also be adjusted to reflect illiquidity and/or non-transferability, with the amount of such discount estimated by the Global Valuation Committee in the absence of market information.
Changes in valuation techniques may result in transfers into or out of an assigned level within the hierarchy. In accordance with each Fund’s policy, transfers between different levels of the fair value hierarchy are deemed to have occurred as of the beginning of the reporting period. The categorization of a value determined for investments and derivative financial instruments is based on the pricing transparency of the investments and derivative financial instruments and is not necessarily an indication of the risks associated with investing in those securities.
As of October 31, 2017, certain investments of the Funds were valued using NAV per share or its equivalent as no quoted market value is available and therefore have been excluded from the fair value hierarchy.
| | | | |
| NOTESTO FINANCIAL STATEMENTS | | | 29 | |
Notes to Financial Statements (continued)
| 4. | SECURITIES AND OTHER INVESTMENTS: |
Participation Notes: Participation notes (“P-Notes”) are promissory notes issued by banks or broker-dealers that are designed to offer a return measured by the change in the value of the underlying security or basket of securities (the “underlying security”) while not holding the actual shares of the underlying security. These investments are typically used to gain exposure to securities traded in foreign markets that may be restricted due to country-specific regulations. When the P-Note matures, the issuer will pay or receive the difference between the value of the underlying security at the time of the purchase and the underlying security’s value at maturity of the P-Notes. Income received on P-Notes is recorded by a fund as dividend income in the Statements of Operations. An investment in a P-Note involves additional risks beyond the risks normally associated with a direct investment in the underlying security. While the holder of a P-Note is entitled to receive from the bank or broker-dealer any dividends paid by the underlying security, the holder is not entitled to the same rights (e.g., voting rights) as a direct owner of the underlying security. P-Notes are considered general unsecured contractual obligations of the bank or broker-dealer. The holder of a P-Note must rely on the creditworthiness of the issuer for its investment returns on the P-Notes and has no rights against the issuer of the underlying security. A P-Note may be more volatile and less liquid than other investments held by a fund since the P-Note generally is dependent on the liquidity in the local trading market for the underlying security.
Warrants: Warrants entitle a fund to purchase a specified number of shares of common stock and are non-income producing. The purchase price and number of shares are subject to adjustment under certain conditions until the expiration date of the warrants, if any. If the price of the underlying stock does not rise above the strike price before the warrant expires, the warrant generally expires without any value and a fund will lose any amount it paid for the warrant. Thus, investments in warrants may involve more risk than investments in common stock. Warrants may trade in the same markets as their underlying stock; however, the price of the warrant does not necessarily move with the price of the underlying stock.
Securities Lending: The Funds may lend their securities to approved borrowers, such as brokers, dealers and other financial institutions. The borrower pledges and maintains with the Funds collateral consisting of cash, an irrevocable letter of credit issued by a bank, or securities issued or guaranteed by the U.S. Government. The initial collateral received by each Fund is required to have a value of at least 102% of the current value of the loaned securities for securities traded on U.S. exchanges and a value of at least 105% for all other securities. The collateral is maintained thereafter at a value equal to at least 100% of the current market value of the securities on loan. The market value of the loaned securities is determined at the close of each business day of the Fund and any additional required collateral is delivered to the Fund, or excess collateral returned by the Fund, on the next business day. During the term of the loan, the Funds are entitled to all distributions made on or in respect of the loaned securities, but do not receive interest income on securities received as collateral. Loans of securities are terminable at any time and the borrower, after notice, is required to return borrowed securities within the standard time period for settlement of securities transactions.
The market value of any securities on loan, all of which were classified as common stocks in the Funds’ Schedules of Investments, and the value of any related collateral are shown separately in the Statements of Assets and Liabilities as a component of investments at value-unaffiliated, and collateral on securities loaned at value, respectively. As of period end, any securities on loan were collateralized by cash and/or U.S. Government obligations. Cash collateral invested by the securities lending agent, BlackRock Investment Management, LLC (“BIM”), if any, is disclosed in the Schedules of Investments.
Securities lending transactions are entered into by the Funds under Master Securities Lending Agreements (each, an “MSLA”), which provide the right, in the event of default (including bankruptcy or insolvency), for the non-defaulting party to liquidate the collateral and calculate a net exposure to the defaulting party or request additional collateral. In the event that a borrower defaults, the Funds, as lender, would offset the market value of the collateral received against the market value of the securities loaned. When the value of the collateral is greater than that of the market value of the securities loaned, the lender is left with a net amount payable to the defaulting party. However, bankruptcy or insolvency laws of a particular jurisdiction may impose restrictions on or prohibitions against such a right of offset in the event of an MSLA counterparty’s bankruptcy or insolvency. Under the MSLA, absent an event of default, the borrower can resell or re-pledge the loaned securities, and a Fund can reinvest cash collateral received in connection with loaned securities. Upon an event of default, the parties’ obligations to return the securities or collateral to the other party are extinguished, and the parties can resell or re-pledge the loaned securities or the collateral received in connection with the loaned securities in order to satisfy the defaulting party’s net payment obligation for all transactions under the MSLA. The defaulting party remains liable for any deficiency.
As of period end, the following table is a summary of the Funds’ securities lending agreements by counterparty which are subject to offset under an MSLA:
| | | | | | | | | | | | |
| Emerging Markets | | | | | | | | | |
| Counterparty | | Securities
Loaned at Value | | | Cash Collateral
Received (a) | | | Net
Amount | |
Deutsche Bank Securities Inc | | $ | 1,085,935 | | | $ | (1,085,935 | ) | | $ | — | |
| | | | | | | | | | | | |
| | (a) | Cash collateral with a value of $ 5,600,000 has been received in connection with securities lending agreements, of which $4,450,000 relates to unsettled loan transactions. Collateral received in excess of the value of securities loaned from the individual counterparty is not shown for financial reporting purposes in the table above. | |
The risks of securities lending include the risk that the borrower may not provide additional collateral when required or may not return the securities when due. To mitigate these risks, the Funds benefit from a borrower default indemnity provided by BIM. BIM’s indemnity allows for full replacement of the securities loaned if the collateral received does not cover the value on the securities loaned in the event of borrower default. Each Fund could incur a loss if the value of an investment purchased with cash collateral falls below the market value of loaned securities or if the value of an investment purchased with cash collateral falls below the value of the original cash collateral received.
| | |
| 30 | | 2017 BLACKROCK ANNUAL REPORTTO SHAREHOLDERS |
Notes to Financial Statements (continued)
| 5. | DERIVATIVE FINANCIAL INSTRUMENTS: |
The Funds engage in various portfolio investment strategies using derivative contracts both to increase the returns of the Funds and/or to manage their exposure to certain risks such as credit risk, equity risk, interest rate risk, foreign currency exchange rate risk, commodity price risk or other risks (e.g., inflation risk). Derivative financial instruments categorized by risk exposure are included in the Schedules of Investments. These contracts may be transacted on an exchange or OTC.
Futures Contracts: Futures contracts are purchased or sold to gain exposure to, or manage exposure to, changes in interest rates (interest rate risk), changes in the value of equity securities (equity risk) or foreign currencies (foreign currency exchange rate risk).
Futures contracts are agreements between the Funds and a counterparty to buy or sell a specific quantity of an underlying instrument at a specified price and on a specified date. Depending on the terms of a contract, it is settled either through physical delivery of the underlying instrument on the settlement date or by payment of a cash amount on the settlement date. Upon entering into a futures contract, the Funds are required to deposit initial margin with the broker in the form of cash or securities in an amount that varies depending on a contract’s size and risk profile. The initial margin deposit must then be maintained at an established level over the life of the contract.
Securities deposited as initial margin are designated in the Schedules of Investments and cash deposited, if any, is shown as cash pledged for futures contracts in the Statements of Assets and Liabilities. Pursuant to the contract, the Funds agree to receive from or pay to the broker an amount of cash equal to the daily fluctuation in market value of the contract (“variation margin”). Variation margin is recorded as unrealized appreciation (depreciation) and, if any, shown as variation margin receivable (or payable) on futures contracts in the Statements of Assets and Liabilities. When the contract is closed, a realized gain or loss is recorded in the Statements of Operations equal to the difference between the value of the contract at the time it was opened and the value at the time it was closed. The use of futures contracts involves the risk of an imperfect correlation in the movements in the price of futures contracts and interest, foreign currency exchange rates or underlying assets.
| 6. | INVESTMENT ADVISORY AGREEMENT AND OTHER TRANSACTIONS WITH AFFILIATES: |
The PNC Financial Services Group, Inc. is the largest stockholder and an affiliate of BlackRock, Inc. (“BlackRock”) for 1940 Act purposes.
Investment Advisory: Each Fund entered into an Investment Advisory Agreement with the Manager, the Funds’ investment adviser, an indirect, wholly-owned subsidiary of BlackRock, to provide investment advisory and administrative services. The Manager is responsible for the management of each Fund’s portfolio and provides the personnel, facilities, equipment and certain other services necessary to the operations of each Fund.
For such services, each Fund pays the Manager a monthly fee at an annual rate equal to the following percentages of the average daily value of each Fund’s net assets:
| | | | |
| Average Daily Net Assets | | Investment
Advisory Fees | |
First $1 Billion | | | 1.00 | % |
$1 Billion — $3 Billion | | | 0.94 | |
$3 Billion — $5 Billion | | | 0.90 | |
$5 Billion — $10 Billion | | | 0.87 | |
Greater than $10 Billion | | | 0.85 | |
With respect to each Fund, the Manager entered into separate sub-advisory agreements with BlackRock International Limited (“BIL”), an affiliate of the Manager. The Manager pays BIL, for services it provides, a monthly fee that is a percentage of the investment advisory fees paid by each Fund to the Manager.
With respect to Emerging Markets, the Manager entered into a separate sub-advisory agreement with BlackRock Asset Management North Asia Limited (“BAMNAL”). The Manager pays BAMNAL, for services it provides, a monthly fee that is a percentage of the investment advisory fees paid by the Fund to the Manager.
Service and Distribution Fees: The Funds entered into a Distribution Agreement and Distribution Plans with BlackRock Investments, LLC (“BRIL”), an affiliate of the Manager. Pursuant to the Distribution Plans and in accordance with Rule 12b-1 under the 1940 Act, each Fund pays BRIL ongoing service and distribution fees. The fees are accrued daily and paid monthly at annual rates based upon the average daily net assets of the relevant share class of each Fund as follows:
| | | | | | | | |
| | | Service
Fee | | | Distribution
Fee | |
Investor A | | | 0.25 | % | | | — | % |
Investor B | | | 0.25 | | | | 0.75 | |
Investor C | | | 0.25 | | | | 0.75 | |
BRIL and broker-dealers, pursuant to sub-agreements with BRIL, provide shareholder servicing and distribution services to the Funds. The ongoing service and/or distribution fee compensates BRIL and each broker-dealer for providing shareholder servicing and/or distribution related services to shareholders.
For the year ended October 31, 2017, the following table shows the class specific service and distribution fees borne directly by each share class of each Fund:
| | | | | | | | | | | | | | | | |
| | | Investor A | | | Investor B | | | Investor C | | | Total | |
Emerging Markets | | $ | 491,144 | | | $ | — | | | $ | 741,100 | | | $ | 1,232,244 | |
Latin America | | | 257,814 | | | | 1,063 | | | | 196,637 | | | | 455,514 | |
| | | | |
| NOTESTO FINANCIAL STATEMENTS | | | 31 | |
Notes to Financial Statements (continued)
Transfer Agent: Pursuant to written agreements, certain financial intermediaries, some of which may be affiliates, provide the Funds with sub-accounting, recordkeeping, sub-transfer agency and other administrative services with respect to sub-accounts they service. For these services, these entities receive an asset-based fee or an annual fee per shareholder account, which will vary depending on share class and/or net assets.
The Manager maintains a call center that is responsible for providing certain shareholder services to the Funds. Shareholder services include responding to inquiries and processing subscriptions and redemptions based upon instructions from shareholders. For the year ended October 31, 2017, each Fund reimbursed the Manager the following amounts for costs incurred in running the call center, which are included in transfer agent — class specific in the Statements of Operations:
| | | | | | | | | | | | | | | | | | | | |
| | | Institutional | | | Investor A | | | Investor B | | | Investor C | | | Total | |
Emerging Markets | | $ | 1,119 | | | $ | 7,568 | | | $ | — | | | $ | 2,352 | | | $ | 11,039 | |
Latin America | | | 826 | | | | 9,445 | | | | 44 | | | | 1,047 | | | | 11,362 | |
For the year ended October 31, 2017, the following table shows the class specific transfer agent fees borne directly by each class of each Fund:
| | | | | | | | | | | | | | | | | | | | |
| | | Institutional | | | Investor A | | | Investor B | | | Investor C | | | Total | |
Emerging Markets | | $ | 117,188 | | | $ | 529,971 | | | $ | — | | | $ | 275,168 | | | $ | 922,327 | |
Latin America | | | 72,850 | | | | 191,656 | | | | 914 | | | | 54,937 | | | | 320,357 | |
Other Fees: For the year ended October 31, 2017, affiliates earned underwriting discounts, direct commissions and dealer concessions on sales of each Fund’s Investor A Shares as follows:
| | | | | | | | |
| | | Emerging Markets | | | Latin America | |
Investor A | | $ | 9,074 | | | $ | 3,110 | |
For the year ended October 31, 2017, affiliates received CDSCs as follows:
| | | | | | | | |
| | | Emerging Markets | | | Latin America | |
Investor A | | $ | 4,286 | | | $ | — | |
Investor C | | | 8,227 | | | | 3,017 | |
Expense Waivers and Reimbursements: With respect to each Fund, the Manager voluntarily agreed to waive its investment advisory fees by the amount of investment advisory fees each Fund pays to the Manager indirectly through its investment in affiliated money market funds (the “affiliated money market fund waiver”). These amounts are included in fees waived by the Manager in the Statements of Operations. For the year ended October 31, 2017, the amounts waived were as follows:
| | | | | | | | |
| | | Emerging Markets | | | Latin America | |
Amounts waived | | $ | 3,153 | | | $ | 1,268 | |
The Manager has contractually agreed to waive its investment advisory fee with respect to any portion of the Funds’ assets invested in affiliated equity and fixed-income mutual funds and affiliated exchange-traded funds that have a contractual management fee through February 28, 2018. The agreement may be terminated upon 90 days’ notice, each subject to approval by a majority of the independent directors who are not “interested persons” of a Fund, as defined in the 1940 Act (the “Independent Directors”) or by a vote of a majority of the outstanding voting securities of a Fund. For the year ended October 31, 2017, there were no fees waived by the Manager.
For the year ended October 31, 2017, the Funds reimbursed the Manager for certain accounting services, which is included in accounting services in the Statements of Operations. The reimbursements were as follows:
| | | | | | | | |
| | | Emerging Markets | | | Latin America | |
Amounts reimbursed | | $ | 2,871 | | | $ | 2,076 | |
Securities Lending: The U.S. Securities and Exchange Commission (“SEC”) has issued an exemptive order which permits BIM, an affiliate of the Manager, to serve as securities lending agent for the Funds, subject to applicable conditions. As securities lending agent, BIM bears all operational costs directly related to securities lending. The Funds are responsible for expenses in connection with the investment of cash collateral received for securities on loan (the “collateral investment expenses”). The cash collateral is invested in a private investment company managed by the Manager or its affiliates. However, BIM has agreed to cap the collateral investment expenses of the private investment company to an annual rate of 0.04%. The investment adviser to the private investment company will not charge any advisory fees with respect to shares purchased by the Funds. The private investment company in which the cash collateral has been invested may, under certain circumstances, impose a liquidity fee of up to 2% on the value redeemed or temporarily restrict redemptions for up to 10 business days during a 90 day period, in the event that the money market fund’s weekly liquid assets fall below certain thresholds.
Securities lending income is equal to the total of income earned from the reinvestment of cash collateral, net of fees and other payments to and from borrowers of securities, and less the collateral investment expenses. Each Fund retains a portion of securities lending income and remits a remaining portion to BIM as compensation for its services as securities lending agent. Pursuant to a securities lending agreement, BIM may lend securities only when the difference between the borrower rebate rate and the risk free rate exceeds a certain level (such securities, the “specials only securities”).
| | |
| 32 | | 2017 BLACKROCK ANNUAL REPORTTO SHAREHOLDERS |
Notes to Financial Statements (continued)
Pursuant to such agreement, each Fund retains 80% of securities lending income. In addition, commencing the business day following the date that the aggregate securities lending income earned across certain funds in the Equity-Liquidity Complex in a calendar year exceeds a specified threshold, each Fund, pursuant to the securities lending agreement, will retain for the remainder of the calendar year securities lending income in an amount equal to 85% of securities lending income.
The share of securities lending income earned by each Fund is shown as securities lending — affiliated — net in the Statements of Operations. For the year ended October 31, 2017, each Fund paid BIM the following amounts for securities lending agent services:
| | | | |
Emerging Markets | | $ | 5,785 | |
Latin America | | | — | |
Interfund Lending: In accordance with an exemptive order (the “Order”) from the SEC, Emerging Markets may participate in a joint lending and borrowing facility for temporary purposes (the “Interfund Lending Program”), subject to compliance with the terms and conditions of the Order, and to the extent permitted by Emerging Market’s investment policies and restrictions. Emerging Markets is currently permitted to borrow under the Interfund Lending Program.
A lending BlackRock fund may lend in aggregate up to 15% of its net assets, but may not lend more than 5% of its net assets to any one borrowing fund through the Interfund Lending Program. A borrowing BlackRock fund may not borrow through the Interfund Lending Program or from any other source more than 33 1/3% of its total assets (or any lower threshold provided for by the fund’s investment restrictions). If a borrowing BlackRock fund’s total outstanding borrowings exceed 10% of its total assets, each of its outstanding interfund loans will be subject to collateralization of at least 102% of the outstanding principal value of the loan. All interfund loans are for temporary or emergency purposes and the interest rate to be charged will be the average of the highest current overnight repurchase agreement rate available to a lending fund and the bank loan rate, as calculated according to a formula established by the Board. During the year ended October 31, 2017, Emerging Markets did not participate in the Interfund Lending Program.
Officers and Directors: Certain officers and/or directors of the Funds are officers and/or directors of BlackRock or its affiliates. The Funds reimburse the Manager for a portion of the compensation paid to the Funds’ Chief Compliance Officer, which is included in Officer and Directors in the Statements of Operations.
Other Transactions: The Funds may purchase securities from, or sell securities to, an affiliated fund provided the affiliation is due solely to having a common investment adviser, common officers, or common directors. For the year ended October 31, 2017, the purchase and sale transactions and any net realized gains (losses) with an affiliated fund in compliance with Rule 17a-7 under the 1940 Act were as follows:
| | | | | | | | | | | | |
| | | Purchases | | | Sales | | | Net
Realized
Gain (Loss) | |
Emerging Markets | | $ | 97,688 | | | $ | — | | | $ | — | |
Latin America | | | — | | | | — | | | | — | |
For the year ended October 31, 2017, purchases and sales of investments, excluding short-term securities, were as follows:
| | | | | | | | |
| | | Emerging Markets | | | Latin America | |
Purchases | | $ | 418,557,922 | | | $ | 99,809,774 | |
Sales | | | 565,285,684 | | | | 114,222,325 | |
| 8. | INCOME TAX INFORMATION: |
It is each Fund’s policy to comply with the requirements of the Internal Revenue Code of 1986, as amended, applicable to regulated investment companies, and to distribute substantially all of its taxable income to its shareholders. Therefore, no U.S. federal income tax provision is required.
Each Fund files U.S. federal and various state and local tax returns. No income tax returns are currently under examination. The statute of limitations on each Fund’ U.S. federal tax returns generally remains open for each of the four years ended October 31, 2017. The statutes of limitations on each Fund’ state and local tax returns may remain open for an additional year depending upon the jurisdiction.
Management has analyzed tax laws and regulations and their application to the Funds as of October 31, 2017, inclusive of the open tax return years, and does not believe that there are any uncertain tax positions that require recognition of a tax liability in the Funds’ financial statements.
U.S. GAAP requires that certain components of net assets be adjusted to reflect permanent differences between financial and tax reporting. These reclassifications have no effect on net assets or net asset values per share. As of period end, the following permanent differences attributable to the expiration of capital loss carryforwards, foreign currency transactions, the characterization of expenses and the sale of stock of passive foreign investment companies were reclassified to the following accounts:
| | | | | | | | |
| | | Emerging Markets | | | Latin America | |
Paid in capital | | $ | (11,598,286 | ) | | $ | (43,968,644 | ) |
Undistributed net investment income | | | 2,066,913 | | | | 305,179 | |
Accumulated net realized loss | | | 9,531,373 | | | | 43,663,465 | |
| | | | |
| NOTESTO FINANCIAL STATEMENTS | | | 33 | |
Notes to Financial Statements (continued)
The tax character of distributions paid was as follows:
| | | | | | | | |
| | | Emerging Markets | | | Latin America | |
Ordinary income | | | | | | | | |
10/31/17 | | $ | 3,971,743 | | | $ | 1,830,847 | |
10/31/16 | | | 4,009,960 | | | | 708,218 | |
As of period end, the tax components of accumulated net earnings (losses) were as follows:
| | | | | | | | |
| | | Emerging Markets | | | Latin America | |
Undistributed ordinary income | | $ | 739,447 | | | $ | 1,620,384 | |
Capital loss carryforwards | | | (23,386,424 | ) | | | (27,150,045 | ) |
Net unrealized gains(a) | | | 37,695,831 | | | | 38,024,116 | |
| | | | | | | | |
Total | | $ | 15,048,854 | | | $ | 12,494,455 | |
| | | | | | | | |
| | (a) | The difference between book-basis and tax-basis net unrealized gains was attributable primarily to the tax deferral of losses on wash sales, the realization for tax purposes of unrealized gains/losses on certain futures and foreign currency contracts and the realization for tax purposes of unrealized gain on investments in passive foreign investment companies. | |
As of October 31, 2017, the Funds had capital loss carryforwards, with no expiration dates, available to offset future realized capital gains as follows:
| | | | | | | | |
| | | Emerging Markets | | | Latin America | |
No expiration date | | $ | 23,386,424 | | | $ | 27,150,045 | |
During the year ended October 31, 2017, the Funds listed below utilized the following amounts of their respective capital loss carryforward:
| | | | | | | | |
| | | Emerging Markets | | | Latin America | |
Amount utilized | | $ | 96,963,742 | | | $ | 18,966,341 | |
As of October 31, 2017, gross unrealized appreciation and depreciation for investments and derivatives based on cost for U.S. federal income tax purposes were as follows:
| | | | | | | | |
| | | Emerging Markets | | | Latin America | |
Tax cost | | $ | 304,361,835 | | | $ | 148,912,005 | |
| | | | | | | | |
Gross unrealized appreciation | | $ | 45,156,159 | | | $ | 42,979,600 | |
Gross unrealized depreciation | | | (7,275,626 | ) | | | (4,922,365 | ) |
| | | | | | | | |
Net unrealized appreciation | | $ | 37,880,533 | | | $ | 38,057,235 | |
| | | | | | | | |
The Funds, along with certain other funds managed by the Manager and its affiliates (“Participating Funds”), is a party to a 364-day, $2.1 billion credit agreement with a group of lenders. Under this agreement, the Funds may borrow to fund shareholder redemptions. Excluding commitments designated for certain individual funds, the Participating Funds, including the Funds, can borrow up to an aggregate commitment amount of $1.6 billion at any time outstanding, subject to asset coverage and other limitations as specified in the agreement. The credit agreement has the following terms: a fee of 0.12% per annum on unused commitment amounts and interest at a rate equal to the higher of (a) one-month LIBOR (but, in any event, not less than 0.00%) on the date the loan is made plus 0.80% per annum or (b) the Fed Funds rate (but, in any event, not less than 0.00%) in effect from time to time plus 0.80% per annum on amounts borrowed. The agreement expires in April 2018 unless extended or renewed. Participating Funds paid administration, legal and arrangement fees, which, if applicable, are included in miscellaneous expenses in the Statements of Operations. These fees were allocated among such funds based upon portions of the aggregate commitment available to them and relative net assets of Participating Funds. During the year ended October 31, 2017, the Funds did not borrow under the credit agreement.
In the normal course of business, certain Funds invest in securities or other instruments and may enter into certain transactions, and such activities subject each Fund to various risks, including among others, fluctuations in the market (market risk) or failure of an issuer to meet all of its obligations. The value of securities or other instruments may also be affected by various factors, including, without limitation: (i) general economy; (ii) overall market as well as local, regional or global political and/or social instability; (iii) regulation, taxation or international tax treaties between various countries; or (iv) currency, interest rate and price fluctuations. Each Fund’s prospectus provides details of the risks to which each Fund is subject.
Investments in the securities of issuers domiciled in countries with emerging capital markets involve certain additional risks that do not generally apply to investments in securities of issuers in more developed capital markets, such as (i) low or nonexistent trading volume, resulting in a lack of liquidity and increased volatility in prices for such securities; (ii) uncertain national policies and social, political and economic instability, increasing the potential for expropriation of assets, confiscatory taxation, high rates of inflation or unfavorable diplomatic developments; and (iii) possible fluctuations in exchange rates, differing legal systems and the existence or possible imposition of exchange controls, custodial restrictions or other foreign or U.S. governmental laws or restrictions applicable to such investments.
| | |
| 34 | | 2017 BLACKROCK ANNUAL REPORTTO SHAREHOLDERS |
Notes to Financial Statements (continued)
On October 11, 2016, BlackRock implemented certain changes required by amendments to Rule 2a-7 under the 1940 Act, which governs the operations of U.S. money market funds. The Funds may be exposed to additional risks when reinvesting cash collateral in money market funds that do not seek to maintain a stable NAV per share of $1.00 and which may be subject to redemption gates or liquidity fees under certain circumstances.
Valuation Risk: The market values of equities, such as common stocks and preferred securities or equity related investments, such as futures and options, may decline due to general market conditions which are not specifically related to a particular company. They may also decline due to factors which affect a particular industry or industries. A Fund may invest in illiquid investments and may experience difficulty in selling those investments in a timely manner at the price that they believe the investments are worth. Prices may fluctuate widely over short or extended periods in response to company, market or economic news. Markets also tend to move in cycles, with periods of rising and falling prices. This volatility may cause each Fund’s NAV to experience significant increases or decreases over short periods of time. If there is a general decline in the securities and other markets, the NAV of a Fund may lose value, regardless of the individual results of the securities and other instruments in which a Fund invests.
The price a Fund could receive upon the sale of any particular portfolio investment may differ from a Fund’s valuation of the investment, particularly for securities that trade in thin or volatile markets or that are valued using a fair valuation technique or a price provided by an independent pricing service. Changes to significant unobservable inputs and assumptions (i.e., publicly traded company multiples, growth rate, time to exit) due to the lack of observable inputs may significantly impact the resulting fair value and therefore a Fund’s results of operations. As a result, the price received upon the sale of an investment may be less than the value ascribed by a Fund, and a Fund could realize a greater than expected loss or lesser than expected gain upon the sale of the investment. A Fund’s ability to value its investments may also be impacted by technological issues and/or errors by pricing services or other third party service providers.
Counterparty Credit Risk: The Funds may be exposed to counterparty credit risk, or the risk that an entity may fail to or be unable to perform on its commitments related to unsettled or open transactions. The Funds manage counterparty credit risk by entering into transactions only with counterparties that the Manager believes have the financial resources to honor their obligations and by monitoring the financial stability of those counterparties. Financial assets, which potentially expose the Funds to market, issuer and counterparty credit risks, consist principally of financial instruments and receivables due from counterparties. The extent of the Funds’ exposure to market, issuer and counterparty credit risks with respect to these financial assets is approximately their value recorded in the Statements of Assets and Liabilities, less any collateral held by the Funds.
A derivative contract may suffer a mark-to-market loss if the value of the contract decrease due to an unfavorable change in the market rates or values of the underlying instrument. Losses can also occur if the counterparty does not perform under the contract.
With futures, there is less counterparty credit risk to the Funds since the exchange or clearinghouse, as counterparty to such instruments, guarantees against a possible default. The clearinghouse stands between the buyer and the seller of the contract; therefore, credit risk is limited to failure of the clearinghouse. While offset rights may exist under applicable law, a Fund does not have a contractual right of offset against a clearing broker or clearinghouse in the event of a default (including the bankruptcy or insolvency). Additionally, credit risk exists in exchange-traded futures with respect to initial and variation margin that is held in a clearing broker’s customer accounts. While clearing brokers are required to segregate customer margin from their own assets, in the event that a clearing broker becomes insolvent or goes into bankruptcy and at that time there is a shortfall in the aggregate amount of margin held by the clearing broker for all its clients, typically the shortfall would be allocated on a pro rata basis across all the clearing broker’s customers, potentially resulting in losses to the Funds.
Concentration Risk: Emerging Markets and Latin America invests a substantial amount of their assets in issuers located in a single country or a limited number of countries. When the Funds concentrate their investments in this manner, they assume the risk that economic, political and social conditions in those countries may have a significant impact on their investment performance. Foreign issuers may not be subject to the same uniform accounting, auditing and financial reporting standards and practices as used in the United States. Foreign securities markets may also be less liquid, more volatile and less subject to governmental supervision not typically associated with investing in U.S. securities. Investment percentages in specific countries are presented in the Schedules of Investments.
As of period end, Latin America’s investments had the following industry classifications:
| | | | |
| Industry | | Percent of
Net Assets | |
Banks | | | 24 | % |
Beverages | | | 11 | |
Metals & Mining | | | 10 | |
Oil, Gas & Consumable Fuels | | | 10 | |
Multiline Retail | | | 7 | |
Wireless Telecommunication Services | | | 5 | |
Other(a) | | | 33 | |
| | (a) | All other industries held was less than 5% of net assets. | |
| | | | |
| NOTESTO FINANCIAL STATEMENTS | | | 35 | |
Notes to Financial Statements (continued)
| 11. | CAPITAL SHARE TRANSACTIONS: |
Transactions in capital shares for each class were as follows:
| | | | | | | | | | | | | | | | | | | | |
| | | Year Ended October 31, | |
| | | 2017 | | | | | | 2016 | |
| Emerging Markets | | Shares | | | Amount | | | | | | Shares | | | Amount | |
Institutional | | | | | | | | | | | | | | | | | | | | |
Shares sold | | | 1,833,606 | | | $ | 35,745,857 | | | | | | | | 1,277,003 | | | $ | 20,250,856 | |
Shares issued in reinvestment of distributions | | | 39,799 | | | | 675,417 | | | | | | | | 120,690 | | | | 1,861,033 | |
Shares redeemed | | | (5,082,554 | ) | | | (89,252,616 | ) | | | | | | | (5,065,591 | ) | | | (84,653,192 | ) |
| | | | | | | | | | | | | | | | | | | | |
Net decrease | | | (3,209,149 | ) | | $ | (52,831,342 | ) | | | | | | | (3,667,898 | ) | | $ | (62,541,303 | ) |
| | | | | | | | | | | | | | | | | | | | |
| | | | | | | | | | | | | | | | | | | | |
Investor A | | | | | | | | | | | | | | | | | | | | |
Shares sold | | | 3,288,582 | | | $ | 62,351,366 | | | | | | | | 2,880,670 | | | $ | 45,551,784 | |
Shares issued in reinvestment of distributions | | | 140,259 | | | | 2,296,161 | | | | | | | | 108,713 | | | | 1,619,830 | |
Shares redeemed | | | (4,664,831 | ) | | | (88,593,196 | ) | | | | | | | (4,294,309 | ) | | | (69,108,610 | ) |
| | | | | | | | | | | | | | | | | | | | |
Net decrease | | | (1,235,990 | ) | | $ | (23,945,669 | ) | | | | | | | (1,304,926 | ) | | $ | (21,936,996 | ) |
| | | | | | | | | | | | | | | | | | | | |
| | | | | | | | | | | | | | | | | | | | |
Investor C | | | | | | | | | | | | | | | | | | | | |
Shares sold | | | 459,205 | | | $ | 7,010,945 | | | | | | | | 1,360,604 | | | $ | 17,544,192 | |
Shares issued in reinvestment of distributions | | | 43,365 | | | | 604,948 | | | | | | | | 21,912 | | | | 278,503 | |
Shares redeemed | | | (4,263,557 | ) | | | (68,162,661 | ) | | | | | | | (2,964,944 | ) | | | (40,316,539 | ) |
| | | | | | | | | | | | | | | | | | | | |
Net decrease | | | (3,760,987 | ) | | $ | (60,546,768 | ) | | | | | | | (1,582,428 | ) | | $ | (22,493,844 | ) |
| | | | | | | | | | | | | | | | | | | | |
Total Net Decrease | | | (8,206,126 | ) | | $ | (137,323,779 | ) | | | | | | | (6,555,252 | ) | | $ | (106,972,143 | ) |
| | | | | | | | | | | | | | | | | | | | |
| | | | | | | | | | | | | | | | | | | | |
| | | Year Ended October 31, | |
| | | 2017 | | | | | | 2016 | |
| Latin America | | Shares | | | Amount | | | | | | Shares | | | Amount | |
Institutional | | | | | | | | | | | | | | | | | | | | |
Shares sold | | | 534,770 | | | $ | 24,212,392 | | | | | | | | 591,555 | | | $ | 20,946,101 | |
Shares issued in reinvestment of distributions | | | 15,890 | | | | 625,263 | | | | | | | | 9,396 | | | | 309,433 | |
Shares redeemed | | | (507,333 | ) | | | (22,607,576 | ) | | | | | | | (643,196 | ) | | | (22,358,941 | ) |
| | | | | | | | | | | | | | | | | | | | |
Net increase (decrease) | | | 43,327 | | | $ | 2,230,079 | | | | | | | | (42,245 | ) | | $ | (1,103,407 | ) |
| | | | | | | | | | | | | | | | | | | | |
| | | | | | | | | | | | | | | | | | | | |
Investor A | | | | | | | | | | | | | | | | | | | | |
Shares sold | | | 758,414 | | | $ | 34,703,901 | | | | | | | | 1,063,826 | | | $ | 39,117,103 | |
Shares issued in reinvestment of distributions | | | 24,413 | | | | 949,511 | | | | | | | | 9,973 | | | | 324,519 | |
Shares redeemed | | | (921,131 | ) | | | (41,148,332 | ) | | | | | | | (1,422,316 | ) | | | (52,041,960 | ) |
| | | | | | | | | | | | | | | | | | | | |
Net decrease | | | (138,304 | ) | | $ | (5,494,920 | ) | | | | | | | (348,517 | ) | | $ | (12,600,338 | ) |
| | | | | | | | | | | | | | | | | | | | |
| | | | | | | | | | | | | | | | | | | | |
Investor B | | | | | | | | | | | | | | | | | | | | |
Shares sold | | | — | | | $ | — | | | | | | | | — | | | $ | 17 | |
Shares redeemed | | | (5,309 | ) | | | (217,247 | ) | | | | | | | (23,242 | ) | | | (766,561 | ) |
| | | | | | | | | | | | | | | | | | | | |
Net decrease | | | (5,309 | ) | | $ | (217,247 | ) | | | | | | | (23,242 | ) | | $ | (766,544 | ) |
| | | | | | | | | | | | | | | | | | | | |
| | | | | | | | | | | | | | | | | | | | |
Investor C | | | | | | | | | | | | | | | | | | | | |
Shares sold | | | 47,739 | | | $ | 1,924,181 | | | | | | | | 63,884 | | | $ | 2,038,804 | |
Shares issued in reinvestment of distributions | | | 1,865 | | | | 66,256 | | | | | | | | — | | | | — | |
Shares redeemed | | | (265,050 | ) | | | (10,592,951 | ) | | | | | | | (193,111 | ) | | | (6,215,695 | ) |
| | | | | | | | | | | | | | | | | | | | |
Net decrease | | | (215,446 | ) | | $ | (8,602,514 | ) | | | | | | | (129,227 | ) | | $ | (4,176,891 | ) |
| | | | | | | | | | | | | | | | | | | | |
Total Net Decrease | | | (315,732 | ) | | $ | (12,084,602 | ) | | | | | | | (543,231 | ) | | $ | (18,647,180 | ) |
| | | | | | | | | | | | | | | | | | | | |
Management has evaluated the impact of all subsequent events on the Funds through the date the financial statements were issued and has determined that there were no subsequent events requiring adjustment or additional disclosure in the financial statements.
| | |
| 36 | | 2017 BLACKROCK ANNUAL REPORTTO SHAREHOLDERS |
Report of Independent Registered Public Accounting Firm
To the Shareholders and Board of Directors of
BlackRock Emerging Markets Fund, Inc. and BlackRock Latin America Fund, Inc.:
We have audited the accompanying statements of assets and liabilities of BlackRock Emerging Markets Fund, Inc. and BlackRock Latin America Fund, Inc. (collectively, the “Funds”), including the schedules of investments as of October 31, 2017, the related statements of operations for the year then ended, the statements of changes in net assets for each of the two years in the period then ended and the financial highlights for each of the five years in the period then ended. These financial statements and financial highlights are the responsibility of the Funds’ management. Our responsibility is to express an opinion on these financial statements and financial highlights based on our audits.
We conducted our audits in accordance with the standards of the Public Company Accounting Oversight Board (United States). Those standards require that we plan and perform the audit to obtain reasonable assurance about whether the financial statements and financial highlights are free of material misstatement. The Funds are not required to have, nor were we engaged to perform, an audit of their internal control over financial reporting. Our audit included consideration of internal control over financial reporting as a basis for designing audit procedures that are appropriate in the circumstances, but not for the purpose of expressing an opinion on the effectiveness of the Funds’ internal control over financial reporting. Accordingly, we express no such opinion. An audit also includes examining, on a test basis, evidence supporting the amounts and disclosures in the financial statements, assessing the accounting principles used and significant estimates made by management, as well as evaluating the overall financial statement presentation. Our procedures included confirmation of securities owned as of October 31, 2017, by correspondence with the custodian and brokers; when replies were not received from brokers, we performed other auditing procedures. We believe that our audits provide a reasonable basis for our opinion.
In our opinion, such financial statements and financial highlights referred to above present fairly, in all material respects, the financial position of BlackRock Emerging Markets Fund, Inc. and BlackRock Latin America Fund, Inc. as of October 31, 2017, the results of their operations for the year then ended, the changes in their net assets for each of the two years in the period then ended and the financial highlights for each of the five years in the period then ended, in conformity with accounting principles generally accepted in the United States of America.
Deloitte & Touche LLP
Boston, Massachusetts
December 21, 2017
Important Tax Information (Unaudited)
During fiscal year ended October 31, 2017, the following information is provided with respect to the ordinary income distribution paid by the Funds:
| | | | | | | | | | |
| | | Payable Date | | Emerging Markets | | | Latin America | |
Qualified Dividend Income for Individuals(a),(b) | | 12/14/16 | | | 100% | | | | 100% | |
Foreign Source Income(b) | | 12/14/16 | | | 83.67% | | | | 100% | |
Foreign Taxes Paid Per Share(c) | | 12/14/16 | | $ | 0.046084 | | | $ | 0.084700 | |
| | (a) | The Funds hereby designate the percentage indicated above or the maximum allowable by law. | |
| | (b) | Expressed as a percentage of the cash distribution grossed-up for foreign taxes. | |
| | (c) | The foreign taxes paid represent taxes incurred by the Fund on income received by the Fund from foreign sources. Foreign taxes paid may be included in taxable income with an offsetting deduction from gross income or may be taken as a credit for taxes paid to foreign governments. You should consult your tax advisor regarding the appropriate treatment of foreign taxes paid. | |
| | | | |
| REPORT OF INDEPENDENT REGISTERED PUBLIC ACCOUNTING FIRM / IMPORTANT TAX INFORMATION | | | 37 | |
Disclosure of Investment Advisory Agreements and Sub-Advisory Agreements
The Board of Directors of BlackRock Emerging Markets Fund, Inc. (“Emerging Markets Fund”) met in person on April 20, 2017 and May 24-25, 2017 to consider the approval of the investment advisory agreement (the “Emerging Markets Advisory Agreement”) between Emerging Markets Fund and BlackRock Advisors, LLC (the “Manager”), its investment advisor. The Board of Directors of Emerging Markets Fund also considered the approval of the sub-advisory agreement between the Manager and BlackRock Asset Management North Asia Limited (“BAMNA”) with respect to Emerging Markets Fund (the “Emerging Markets BAMNA Sub-Advisory Agreement”) and the sub-advisory agreement between the Manager and BlackRock International Limited (“BIL,” and together with BAMNA, the “Sub-Advisors”) with respect to Emerging Markets Fund (the “Emerging Markets BIL Sub-Advisory Agreement”).
The Board of Directors of BlackRock Latin America Fund, Inc. (“Latin America Fund”) met in person on April 20, 2017 and May 24-25, 2017 to consider the approval of the investment advisory agreement (the “Latin America Advisory Agreement”) between Latin America Fund and the Manager, its investment advisor. The Board of Directors of Latin America Fund also considered the approval of the sub-advisory agreement between the Manager and BIL with respect to Latin America Fund (the “Latin America BIL Sub-Advisory Agreement”).
Emerging Markets Fund and Latin America Fund are referred to herein individually as a “Fund” or collectively as the “Funds.” The Manager and the Sub-Advisors are referred to herein as “BlackRock.” The Emerging Markets Advisory Agreement, the Emerging Markets BAMNA Sub-Advisory Agreement, the Emerging Markets BIL Sub-Advisory Agreement, the Latin America Advisory Agreement and the Latin America BIL Sub-Advisory Agreement are referred to herein individually as an “Agreement” or collectively as the “Agreements.” For simplicity: (a) the Board of Directors of Emerging Markets Fund and the Board of Directors of Latin America Fund are referred to herein individually as the “Board” and collectively as the “Boards” and the members are referred to as “Board Members”; and (b) the meetings held on April 20, 2017 are referred to as the “April Meeting” and the meetings held on May 24-25, 2017 are referred to as the “May Meeting.”
Activities and Composition of the Boards
On the date of the May Meeting, each Board consisted of thirteen individuals, eleven of whom were not “interested persons” of the pertinent Fund as defined in the Investment Company Act of 1940, as amended (the “1940 Act”) (the “Independent Board Members”). The Board Members are responsible for the oversight of the operations of the pertinent Fund and perform the various duties imposed on the directors of investment companies by the 1940 Act. The Independent Board Members have retained independent legal counsel to assist them in connection with their duties. The Chair of each Board is an Independent Board Member. Each Board has established five standing committees: an Audit Committee, a Governance and Nominating Committee, a Compliance Committee, a Performance Oversight and Contract Committee and an Executive Committee, each of which is chaired by an Independent Board Member and composed of Independent Board Members (except for the Executive Committee, which also has one interested Board Member).
The Agreements
Pursuant to the 1940 Act, each Board is required to consider the continuation of the pertinent Agreements on an annual basis. The Boards have four quarterly meetings per year, each extending over two days, a fifth one-day meeting to consider specific information surrounding the consideration of renewing the pertinent Agreements and additional in-person and telephonic meetings as needed. In connection with this year-long deliberative process, the Boards assessed, among other things, the nature, extent and quality of the services provided to the Funds by BlackRock, BlackRock’s personnel and affiliates, including (as applicable): investment management; administrative and shareholder services; the oversight of fund service providers; marketing; risk oversight; compliance; and ability to meet applicable legal and regulatory requirements.
The Boards, acting directly and through their committees, consider at each of their meetings, and from time to time as appropriate, factors that are relevant to their annual consideration of the renewal of the Agreements, including the services and support provided by BlackRock to the Funds and their shareholders. BlackRock also furnished additional information to the Boards in response to specific questions from the Boards. This additional information is discussed further below in the section titled “Board Considerations in Approving the Agreements.” Among the matters the Boards considered, with respect to each Fund, as pertinent, were: (a) investment performance for one-year, three-year, five-year, ten-year, and/or since inception periods, as applicable, against peer funds, applicable benchmark, and performance metrics, as applicable, as well as senior management’s and portfolio managers’ analysis of the reasons for any over-performance or underperformance relative to its peers, benchmarks, and other performance metrics, as applicable; (b) fees, including advisory, administration, if applicable, and other amounts paid to BlackRock and its affiliates by the Fund for services; (c) Fund operating expenses and how BlackRock allocates expenses to the Fund; (d) the resources devoted to, risk oversight of, and compliance reports relating to, implementation of the Fund’s investment objective(s), policies and restrictions, and meeting regulatory requirements; (e) the Fund’s adherence to its compliance policies and procedures; (f) the nature, cost and character of non-investment management services provided by BlackRock and its affiliates; (g) BlackRock’s and other service providers’ internal controls and risk and compliance oversight mechanisms; (h) BlackRock’s implementation of the proxy voting policies approved by the Board; (i) the use of brokerage commissions and execution quality of portfolio transactions; (j) BlackRock’s implementation of the Fund’s valuation and liquidity procedures; (k) an analysis of management fees for products with similar investment mandates across the open-end fund, exchange-traded fund (“ETF”), closed-end fund, sub-advised mutual fund, separately managed account, collective investment trust, and institutional separate account product channels, as applicable, and the similarities and differences between these products and the services provided as compared to the Fund; (l) BlackRock’s compensation methodology for its investment professionals and the incentives and accountability it creates, along with investment professionals’ investments in the fund(s) they manage; and (m) periodic updates on BlackRock’s business.
Board Considerations in Approving the Agreements
The Approval Process: Prior to the April Meeting, the Boards requested and received materials specifically relating to the Agreements. The Boards are continuously engaged in a process with their independent legal counsel and BlackRock to review the nature and scope of the information provided to better assist their deliberations. The materials provided in connection with the April Meeting included (a) information independently compiled and prepared by Broadridge Financial Solutions, Inc. (“Broadridge”) on the fees and expenses of each Fund as compared with a peer group of funds as determined by Broadridge (“Expense Peers”) and the investment
| | |
| 38 | | 2017 BLACKROCK ANNUAL REPORTTO SHAREHOLDERS |
Disclosure of Investment Advisory Agreements and Sub-Advisory Agreements (continued)
performance of each Fund as compared with a peer group of funds as determined by Broadridge(a) and the applicable Morningstar Classification; (b) information on the profits realized by BlackRock and its affiliates pursuant to the Agreements and a discussion of fall-out benefits to BlackRock and its affiliates; (c) a general analysis provided by BlackRock concerning investment management fees charged to other clients, such as institutional clients, sub-advised mutual funds, ETFs, closed-end funds, and separately managed accounts under similar investment mandates, as well as the performance of such other clients, as applicable; (d) review of non-management fees; (e) the existence, impact and sharing of potential economies of scale; (f) a summary of aggregate amounts paid by each Fund to BlackRock; and (g) sales and redemption data regarding each Fund’s shares.
At the April Meeting, each Board reviewed materials relating to its consideration of the pertinent Agreements. As a result of the discussions that occurred during the April Meeting, and as a culmination of each Board’s year-long deliberative process, the Boards presented BlackRock with questions and requests for additional information. BlackRock responded to these requests with additional written information in advance of the May Meeting.
At the May Meeting, (a) the Board of Emerging Markets Fund, including the Independent Board Members, approved the continuation of the Emerging Markets Advisory Agreement between the Manager and Emerging Markets Fund, the Emerging Markets BAMNA Sub-Advisory Agreement between the Manager and BAMNA with respect to the Fund and the Emerging Markets BIL Sub-Advisory Agreement between the Manager and BIL with respect to the Fund, each for a one-year term ending June 30, 2018; and (b) the Board of Latin America Fund, including the Independent Board Members, approved the continuation of the Latin America Advisory Agreement between the Manager and Latin America Fund and the Latin America BIL Sub-Advisory Agreement between the Manager and BIL with respect to the Fund, each for a one-year term ending June 30, 2018. In approving the continuation of the pertinent Agreements, each Board considered, with respect to the applicable Fund, (a) the nature, extent and quality of the services provided by BlackRock; (b) the investment performance of the Fund; (c) the advisory fee and the cost of the services and profits to be realized by BlackRock and its affiliates from their relationship with the Fund; (d) the Fund’s costs to investors compared to the costs of Expense Peers and performance compared to the relevant performance metrics as previously discussed; (e) the sharing of potential economies of scale; (f) fall-out benefits to BlackRock and its affiliates as a result of its relationship with the Fund; and (g) other factors deemed relevant by the Board Members.
Each Board also considered other matters it deemed important to the approval process, such as other payments made to BlackRock or its affiliates, securities lending and cash management, services related to the valuation and pricing of the portfolio holdings of the applicable Fund, and advice from independent legal counsel with respect to the review process and materials submitted for the Board’s review. Each Board noted the willingness of BlackRock personnel to engage in open, candid discussions with the Board. The Boards did not identify any particular information as determinative, and each Board Member may have attributed different weights to the various items considered.
A. Nature, Extent and Quality of the Services Provided by BlackRock: Each Board, including the Independent Board Members, reviewed the nature, extent and quality of services provided by BlackRock, including the investment advisory services and the resulting performance of the applicable Fund. Throughout the year, each Board compared Fund performance to the performance of a comparable group of mutual funds, relevant benchmark, and performance metrics, as applicable. The Boards met with BlackRock’s senior management personnel responsible for investment activities, including the senior investment officers. Each Board also reviewed the materials provided by the applicable Fund’s portfolio management team discussing the Fund’s performance and the Fund’s investment objective(s), strategies and outlook.
Each Board considered, among other factors, with respect to BlackRock: the number, education and experience of investment personnel generally and the applicable Fund’s portfolio management team; BlackRock’s research capabilities; investments by portfolio managers in the funds they manage; portfolio trading capabilities; use of technology; commitment to compliance; credit analysis capabilities; risk analysis and oversight capabilities; and the approach to training and retaining portfolio managers and other research, advisory and management personnel. Each Board engaged in a review of BlackRock’s compensation structure with respect to the applicable Fund’s portfolio management team and BlackRock’s ability to attract and retain high-quality talent and create performance incentives.
In addition to investment advisory services, the Boards considered the quality of the administrative and other non-investment advisory services provided to the Funds. BlackRock and its affiliates provide the Funds with certain administrative, shareholder and other services (in addition to any such services provided to the Funds by third parties) and officers and other personnel as are necessary for the operations of the Funds. In particular, BlackRock and its affiliates provide the Funds with administrative services including, among others: (i) preparing disclosure documents, such as the prospectus, the summary prospectus (as applicable), the statement of additional information and periodic shareholder reports; (ii) oversight of daily accounting and pricing; (iii) preparing periodic filings with regulators; (iv) overseeing and coordinating the activities of other service providers; (v) organizing Board meetings and preparing the materials for such Board meetings; (vi) providing legal and compliance support; (vii) furnishing analytical and other support to assist the Boards in their consideration of strategic issues such as the merger, consolidation or repurposing of certain open-end funds; and (viii) performing other administrative functions necessary for the operation of the Funds, such as tax reporting, fulfilling regulatory filing requirements and call center services. The Boards reviewed the structure and duties of BlackRock’s fund administration, shareholder services, and legal & compliance departments and considered BlackRock’s policies and procedures for assuring compliance with applicable laws and regulations.
B. The Investment Performance of the Funds and BlackRock: Each Board, including the Independent Board Members, also reviewed and considered the performance history of the applicable Fund. In preparation for the April Meeting, the Boards were provided with reports independently prepared by Broadridge, which included a comprehensive analysis of each Fund’s performance. The Boards also reviewed a narrative and statistical analysis of the Broadridge data that was prepared by BlackRock. In connection with their review, the Boards received and reviewed information regarding the investment performance of each Fund as compared to other funds in the Fund’s applicable Broadridge category and the applicable Morningstar Classification. The Boards were provided with a description of the methodology used by Broadridge to select peer funds and periodically meet with Broadridge representatives to review its methodology. Each Board was provided with information on the composition of the Broadridge performance universes and expense universes. Each Board and its Performance Oversight and Contract Committee regularly review, and meet with Fund management to discuss, the performance of the pertinent Fund throughout the year.
| (a) | Funds are ranked by Broadridge in quartiles, ranging from first to fourth, where first is the most desirable quartile position and fourth is the least desirable. |
| | | | |
| DISCLOSUREOF INVESTMENT ADVISORY AGREEMENTSAND SUB-ADVISORY AGREEMENTS | | | 39 | |
Disclosure of Investment Advisory Agreements and Sub-Advisory Agreements (continued)
In evaluating performance, the Boards recognized that the performance data reflects a snapshot of a period as of a particular date and that selecting a different performance period could produce significantly different results. Further, the Boards recognized that it is possible that long-term performance can be adversely affected by even one period of significant underperformance so that a single investment decision or theme has the ability to affect long-term performance disproportionately.
BlackRock believes that the Morningstar Performance Universe is an appropriate performance metric for each Fund.
The Board of Latin America Fund noted that for the one-, three- and five-year periods reported, Latin America Fund ranked in the third, second, and second quartiles, respectively, against its Morningstar Performance Universe. The Board and BlackRock reviewed the Fund’s underperformance during the one-year period. The Board was informed that, among other things, poor stock selection in Brazil coupled with an overweight position in Mexico were the primary drivers of underperformance over the one-year period.
The Board of Latin America Fund and BlackRock discussed BlackRock’s strategy for improving Latin America Fund’s investment performance. Discussions covered topics such as: investment risks undertaken by the Fund; performance attribution; the Fund’s investment personnel; and the resources appropriate to support the Fund’s investment processes.
The Board of Emerging Markets Fund noted that for the one-, three- and five-year periods reported, Emerging Markets Fund ranked in the third, fourth and third quartiles, respectively, against its Morningstar Performance Universe. The Board and BlackRock reviewed the Fund’s underperformance during these periods. The Board was informed that, among other things, the Fund’s underperformance in 2015 was the main driver of underperformance during both the three- and five-year periods. Slowing markets coupled with a sharp deceleration in the Chinese economy, a collapse in global commodity prices, and rising political instability across the asset class were the primary detractors from performance in 2015.
The Board of Emerging Markets Fund and BlackRock discussed BlackRock’s strategy for improving Emerging Markets Fund’s investment performance. Discussions covered topics such as: investment risks undertaken by the Fund; performance attribution; the Fund’s investment personnel; and the resources appropriate to support the Fund’s investment processes. BlackRock and the Board previously had discussed changes within the portfolio management team. Both BlackRock and the Board are hopeful that these changes will result in improved performance going forward, although there can be no assurance that will be the case. The Board will continue to monitor the Fund’s performance.
C. Consideration of the Advisory/Management Fees and the Cost of the Services and Profits to be Realized by BlackRock and its Affiliates from their Relationship with the Funds: Each Board, including the Independent Board Members, reviewed the applicable Fund’s contractual management fee rate compared with the other funds in its Broadridge category. The contractual management fee rate represents a combination of the advisory fee and any administrative fees, before taking into account any reimbursements or fee waivers. Each Board also compared the applicable Fund’s total expense ratio, as well as its actual management fee rate, to those of other funds in its Broadridge category. The total expense ratio represents a fund’s total net operating expenses, including any 12b-1 or non 12b-1 service fees. The total expense ratio gives effect to any expense reimbursements or fee waivers that benefit a fund, and the actual management fee rate gives effect to any management fee reimbursements or waivers that benefit a fund. The Boards considered the services provided and the fees charged by BlackRock and its affiliates to other types of clients with similar investment mandates, as applicable, including institutional accounts and sub-advised mutual funds (including mutual funds sponsored by third parties).
The Boards received and reviewed statements relating to BlackRock’s financial condition. The Boards reviewed BlackRock’s profitability methodology and were also provided with a profitability analysis that detailed the revenues earned and the expenses incurred by BlackRock for services provided to the Funds. The Boards reviewed BlackRock’s profitability with respect to the Funds and other funds the Board currently oversees for the year ended December 31, 2016 compared to available aggregate profitability data provided for the prior two years. The Boards reviewed BlackRock’s profitability with respect to certain other U.S. fund complexes managed by the Manager and/or its affiliates. The Boards reviewed BlackRock’s assumptions and methodology of allocating expenses in the profitability analysis, noting the inherent limitations in allocating costs among various advisory products. The Boards recognized that profitability may be affected by numerous factors including, among other things, fee waivers and expense reimbursements by the Manager, the types of funds managed, precision of expense allocations and business mix. As a result, calculating and comparing profitability at individual fund levels is difficult.
The Boards noted that, in general, individual fund or product line profitability of other advisors is not publicly available. The Boards reviewed BlackRock’s overall operating margin, in general, compared to that of certain other publicly-traded asset management firms. The Boards considered the differences between BlackRock and these other firms, including the contribution of technology at BlackRock, BlackRock’s expense management, and the relative product mix.
In addition, each Board considered the cost of the services provided to the applicable Fund by BlackRock, and BlackRock’s and its affiliates’ profits relating to the management and distribution of the applicable Fund and the other funds advised by BlackRock and its affiliates. As part of its analysis, each Board reviewed BlackRock’s methodology in allocating its costs of managing the applicable Fund, to the Fund. The Boards may receive and review information from independent third parties as part of their annual evaluation. Each Board considered whether BlackRock has the financial resources necessary to attract and retain high quality investment management personnel to perform its obligations under the pertinent Agreements and to continue to provide the high quality of services that is expected by that Board. The Boards further considered factors including but not limited to BlackRock’s commitment of time, assumption of risk, and liability profile in servicing the Funds in contrast to what is required of BlackRock with respect to other products with similar investment mandates across the open-end fund, ETF, closed-end fund, sub-advised mutual fund, separately managed account, collective investment trust, and institutional separate account product channels, as applicable.
The Board of Emerging Markets Fund noted that Emerging Markets Fund’s contractual management fee rate ranked in the first quartile, and that the actual management fee rate and total expense ratio ranked in the second and third quartiles, respectively, relative to the Fund’s Expense Peers.
The Board of Latin America Fund noted that Latin America Fund’s contractual management fee rate ranked in the first quartile, and that the actual management fee rate and total expense ratio each ranked in the third quartile, relative to the Fund’s Expense Peers.
| | |
| 40 | | 2017 BLACKROCK ANNUAL REPORTTO SHAREHOLDERS |
Disclosure of Investment Advisory Agreements and Sub-Advisory Agreements (continued)
The Boards also noted that each Fund has an advisory fee arrangement that includes breakpoints that adjust the fee rate downward as the size of the Fund increases above certain contractually specified levels.
D. Economies of Scale: Each Board, including the Independent Board Members, considered the extent to which economies of scale might be realized as the assets of the applicable Fund increase, as well as the existence of expense caps, as applicable. Each Board also considered the extent to which the applicable Fund benefits from such economies in a variety of ways and whether there should be changes in the advisory fee rate or breakpoint structure in order to enable the Fund to more fully participate in these economies of scale. Each Board considered the applicable Fund’s asset levels and whether the current fee schedule was appropriate. In their consideration, the Board Members took into account the existence of any expense caps and further considered the continuation and/or implementation, as applicable, of such caps.
E. Other Factors Deemed Relevant by the Board Members: Each Board, including the Independent Board Members, also took into account other ancillary or “fall-out” benefits that BlackRock or its affiliates may derive from their respective relationships with the applicable Fund, both tangible and intangible, such as BlackRock’s ability to leverage its investment professionals who manage other portfolios and risk management personnel, an increase in BlackRock’s profile in the investment advisory community, and the engagement of BlackRock’s affiliates as service providers to the Fund, including for administrative, distribution, securities lending and cash management services. The Boards also considered BlackRock’s overall operations and its efforts to expand the scale of, and improve the quality of, its operations. The Boards also noted that BlackRock may use and benefit from third party research obtained by soft dollars generated by certain registered fund transactions to assist in managing all or a number of its other client accounts.
In connection with their consideration of the Agreements, the Boards also received information regarding BlackRock’s brokerage and soft dollar practices. The Boards received reports from BlackRock which included information on brokerage commissions and trade execution practices throughout the year.
The Boards noted the competitive nature of the open-end fund marketplace, and that shareholders are able to redeem their Fund shares if they believe that the pertinent Fund’s fees and expenses are too high or if they are dissatisfied with the performance of the Fund.
Conclusion
The Board of Emerging Markets Fund, including the Independent Board Members, approved the continuation of the Emerging Markets Advisory Agreement between the Manager and Emerging Markets Fund, the Emerging Markets BAMNA Sub-Advisory Agreement between the Manager and BAMNA with respect to the Fund, and the Emerging Markets BIL Sub-Advisory Agreement between the Manager and BIL with respect to the Fund, each for a one-year term ending June 30, 2018. The Board of Latin America Fund, including the Independent Board Members, approved the continuation of the Latin America Advisory Agreement between the Manager and Latin America Fund and the Latin America BIL Sub-Advisory Agreement between the Manager and BIL with respect to the Fund, each for a one-year term ending June 30, 2018.
Based upon its evaluation of all of the aforementioned factors in their totality, as well as other information, each Board, including the Independent Board Members, was satisfied that the terms of the applicable Agreements were fair and reasonable and in the best interest of the applicable Fund and its shareholders. In arriving at a decision to approve the applicable Agreements, each Board did not identify any single factor or group of factors as all-important or controlling, but considered all factors together, and different Board Members may have attributed different weights to the various factors considered. The Independent Board Members were also assisted by the advice of independent legal counsel in making this determination. The contractual fee arrangements for each Fund reflect the results of several years of review by the pertinent Board Members and predecessor Board Members, and discussions between such Board Members (and predecessor Board Members) and BlackRock. As a result, the Board Members’ conclusions may be based in part on their consideration of these arrangements in prior years.
| | | | |
| DISCLOSUREOF INVESTMENT ADVISORY AGREEMENTSAND SUB-ADVISORY AGREEMENTS | | | 41 | |
Director and Officer Information
| | | | | | | | |
| | | | | Independent Directors (a) | | | | |
| | | | | |
Name
Year of Birth (b) | | Position(s) Held
(Length of Service) (c) | | Principal Occupation(s) During Past Five Years | | Number of BlackRock-Advised
Registered Investment Companies
(“RICs”) Consisting of Investment
Portfolios (“Portfolios”) Overseen | | Public Directorships |
Rodney D. Johnson 1941 | | Chair of the Board and Director
(Since 2007) | | President, Fairmount Capital Advisors, Inc. from 1987 to 2013; Member of the Archdiocesan Investment Committee of the Archdiocese of Philadelphia from 2004 to 2012; Director, The Committee of Seventy (civic) from 2006 to 2012; Director, Fox Chase Cancer Center from 2004 to 2011; Director, The Mainstay (non-profit) since 2016. | | 26 RICs consisting of
144 Portfolios | | None |
Susan J. Carter 1956 | | Director
(Since 2016) | | Director, Pacific Pension Institute since 2014; Advisory Board Member, Center for Private Equity and Entrepreneurship at Tuck School of Business since 1997; Senior Advisor, Commonfund Capital, Inc. (“CCI”) (investment adviser) in 2015; Chief Executive Officer, CCI from 2013 to 2014; President & Chief Executive Officer, CCI from 1997 to 2013; Advisory Board Member, Girls Who Invest since 2015; Advisory Board Member, Bridges Ventures since 2016; Trustee, Financial Accounting Foundation since 2017. | | 26 RICs consisting of
144 Portfolios | | None |
Collette Chilton 1958 | | Director
(Since 2015) | | Chief Investment Officer, Williams College since 2006; Chief Investment Officer, Lucent Asset Management Corporation from 1998 to 2006. | | 26 RICs consisting of
144 Portfolios | | None |
Neil A. Cotty 1954 | | Director
(Since 2016) | | Bank of America Corporation from 1996 to 2015, serving in various senior finance leadership roles, including Chief Accounting Officer, from 2009 to 2015, Chief Financial Officer of Global Banking, Markets and Wealth Management from 2008 to 2009, Chief Accounting Officer from 2004 to 2008, Chief Financial Officer of Consumer Bank from 2003 to 2004, Chief Financial Officer of Global Corporate Investment Bank from 1999 to 2002. | | 26 RICs consisting of
144 Portfolios | | None |
Cynthia A. Montgomery 1952 | | Director
(Since 2007) | | Professor, Harvard Business School since 1989; Director, McLean Hospital from 2005 to 2012. | | 26 RICs consisting of
144 Portfolios | | Newell Rubbermaid, Inc. (manufacturing) |
Joseph P. Platt 1947 | | Director
(Since 2007) | | General Partner, Thorn Partners, LP (private investments) since 1998; Director, WQED Multi-Media (public broadcasting not-for-profit) since 2001; Chair, Basic Health International (non-profit) since 2015. | | 26 RICs consisting of
144 Portfolios | | Greenlight Capital Re, Ltd. (reinsurance company); Consol Energy Inc. |
Robert C. Robb, Jr. 1945 | | Director
(Since 2007) | | Partner, Lewis, Eckert, Robb and Company (management and financial consulting firm) since 1981 and Principal since 2010. | | 26 RICs consisting of
144 Portfolios | | None |
Mark Stalnecker 1951 | | Director
(Since 2015) | | Chief Investment Officer, University of Delaware from 1999 to 2013; Trustee, Winterthur Museum and Country Estate from 2001 to 2015; Member of the Investment Committee, Delaware Public Employees’ Retirement System since 2002; Member of the Investment Committee, Christiana Care Health System since 2009; Member of the Investment Committee, Delaware Community Foundation from 2013 to 2014; Director, SEI Private Trust Co. from 2001 to 2014. | | 26 RICs consisting of
144 Portfolios | | None |
Kenneth L. Urish 1951 | | Director
(Since 2007) | | Managing Partner, Urish Popeck & Co., LLC (certified public accountants and consultants) since 1976; Past-Chairman of the Professional Ethics Committee of the Pennsylvania Institute of Certified Public Accountants and Committee Member thereof since 2007; Member of External Advisory Board, The Pennsylvania State University Accounting Department since founding in 2001; Principal, UP Strategic Wealth Investment Advisors, LLC since 2013; Trustee, The Holy Family Institute from 2001 to 2010; President and Trustee, Pittsburgh Catholic Publishing Associates from 2003 to 2008; Director, Inter-Tel from 2006 to 2007. | | 26 RICs consisting of
144 Portfolios | | None |
| | |
| 42 | | 2017 BLACKROCK ANNUAL REPORTTO SHAREHOLDERS |
Director and Officer Information (continued)
| | | | | | | | |
| | | | | Independent Directors (a) | | | | |
| | | | | |
Name
Year of Birth (b) | | Position(s) Held
(Length of Service) (c) | | Principal Occupation(s) During Past Five Years | | Number of BlackRock-Advised
Registered Investment Companies
(“RICs”) Consisting of Investment
Portfolios (“Portfolios”) Overseen | | Public Directorships |
Claire A. Walton 1957 | | Director
(Since 2016) | | Chief Operating Officer and Chief Financial Officer of Liberty Square Asset Management, LP from 1998 to 2015; General Partner of Neon Liberty Capital Management, LLC since 2003; Director, Boston Hedge Fund Group since 2009; Director, Woodstock Ski Runners since 2013; Director, Massachusetts Council on Economic Education from 2013 to 2015. | | 26 RICs consisting of
144 Portfolios | | None |
Frederick W. Winter 1945 | | Director
(Since 2007) | | Director, Alkon Corporation since 1992; Dean Emeritus of the Joseph M. Katz School of Business, University of Pittsburgh, Dean and Professor from 1997 to 2005, Professor until 2013. | | 26 RICs consisting of
144 Portfolios | | None |
|
| Interested Directors (d) |
Barbara G. Novick 1960 | | Director
(Since 2015) | | Vice Chairman of BlackRock, Inc. since 2006; Chair of BlackRock's Government Relations Steering Committee since 2009; Head of the Global Client Group of BlackRock, Inc. from 1988 to 2008. | | 100 RICs consisting of
218 Portfolios | | None |
John M. Perlowski 1964 | | Director
(Since 2015), President and Chief Executive Officer (Since 2010) | | Managing Director of BlackRock, Inc. since 2009; Head of BlackRock Global Fund & Accounting Services since 2009; Managing Director and Chief Operating Officer of the Global Product Group at Goldman Sachs Asset Management, L.P. from 2003 to 2009; Treasurer of Goldman Sachs Mutual Funds from 2003 to 2009 and Senior Vice President thereof from 2007 to 2009; Director of Goldman Sachs Offshore Funds from 2002 to 2009; Advisory Director of Family Resource Network (charitable foundation) since 2009. | | 127 RICs consisting of
316 Portfolios | | None |
| (a) | The address of each Director is c/o BlackRock, Inc., 55 East 52nd Street, New York, NY 10055. |
| (b) | Independent Directors serve until their resignation, retirement, removal or death, or until December 31 of the year in which they turn 75. The Board may determine to extend the terms of Independent Directors on a case-by-case basis, as appropriate. |
| (c) | Following the combination of Merrill Lynch Investment Managers, L.P. (“MLIM”) and BlackRock, Inc. (“BlackRock”) in September 2006, the various legacy MLIM and legacy BlackRock fund boards were realigned and consolidated into three new fund boards in 2007. As a result, although the chart shows certain Independent Directors as joining the Board in 2007, those Independent Directors first became members of the boards of other legacy MLIM or legacy BlackRock funds as follows: Rodney D. Johnson, 1995; Cynthia A. Montgomery, 1994; Joseph P. Platt, 1999; Robert C. Robb, Jr., 1999; Kenneth L. Urish, 1999; and Frederick W. Winter, 1999. |
| (d) | Ms. Novick and Mr. Perlowski are both “interested persons,” as defined in the 1940 Act, of the Funds based on their positions with BlackRock and its affiliates. Ms. Novick and Mr. Perlowski are also board members of certain complexes of BlackRock registered open-end and closed-end funds. Ms. Novick is a board member of the BlackRock Closed-End Complex and Mr. Perlowski is also a board member of the BlackRock Equity-Bond Complex and the BlackRock Closed-End Complex. |
| | | | |
| DIRECTORAND OFFICER INFORMATION | | | 43 | |
Director and Officer Information (continued)
| | | | |
| Officers Who Are Not Directors (a) |
| | | |
Name Year of Birth (b) | | Position(s) Held
(Length of Service) | | Principal Occupation(s) During Past Five Years |
Jennifer McGovern 1977 | | Vice President
(Since 2014) | | Managing Director of BlackRock, Inc. since 2016; Director of BlackRock, Inc. from 2011 to 2015; Head of Product Structure and Oversight for BlackRock’s U.S. Wealth Advisory Group since 2013; Vice President of BlackRock, Inc. from 2008 to 2010. |
Neal J. Andrews 1966 | | Chief Financial Officer
(Since 2007) | | Managing Director of BlackRock, Inc. since 2006; Senior Vice President and Line of Business Head of Fund Accounting and Administration at PNC Global Investment Servicing (U.S.) Inc. from 1992 to 2006. |
Jay M. Fife 1970 | | Treasurer
(Since 2007) | | Managing Director of BlackRock, Inc. since 2007; Director of BlackRock, Inc. in 2006; Assistant Treasurer of the MLIM and Fund Asset Management, L.P. advised funds from 2005 to 2006; Director of MLIM Fund Services Group from 2001 to 2006. |
Charles Park 1967 | | Chief Compliance Officer (Since 2014) | | Anti-Money Laundering Compliance Officer for the BlackRock-advised Funds in the Equity-Bond Complex, the Equity-Liquidity Complex and the Closed-End Complex from 2014 to 2015; Chief Compliance Officer of BlackRock Advisors, LLC and the BlackRock-advised Funds in the Equity-Bond Complex, the Equity-Liquidity Complex and the Closed-End Complex since 2014; Principal of and Chief Compliance Officer for iShares® Delaware Trust Sponsor LLC since 2012 and BlackRock Fund Advisors (“BFA”) since 2006; Chief Compliance Officer for the BFA-advised iShares® exchange traded funds since 2006; Chief Compliance Officer for BlackRock Asset Management International Inc. since 2012. |
Fernanda Piedra 1969 | | Anti-Money Laundering Compliance Officer
(Since 2015) | | Director of BlackRock, Inc. since 2014; Anti-Money Laundering Compliance Officer and Regional Head of Financial Crime for the Americas at BlackRock, Inc. since 2014; Head of Regulatory Changes and Remediation for the Asset Wealth Management Division of Deutsche Bank from 2010 to 2014; Vice President of Goldman Sachs (Anti-Money Laundering/Suspicious Activities Group) from 2004 to 2010. |
Benjamin Archibald 1975 | | Secretary
(Since 2012) | | Managing Director of BlackRock, Inc. since 2014; Director of BlackRock, Inc. from 2010 to 2013; Secretary of the iShares® exchange traded funds since 2015; Secretary of the BlackRock-advised mutual funds since 2012. |
| (a) | The address of each Officer is c/o BlackRock, Inc., 55 East 52nd Street, New York, NY 10055. |
| (b) | Officers of the Funds serve at the pleasure of the Board. |
Further information about the Funds' Directors and Officers is available in the Funds' Statement of Additional Information, which can be obtained without charge by calling (800) 441-7762.
| | |
| Investment Adviser | | Independent Registered Public Accounting Firm |
| BlackRock Advisors, LLC | | Deloitte & Touche LLP |
| Wilmington, DE 19809 | | Boston, MA 02116 |
| | |
| Distributor | | Custodian |
| BlackRock Investments, LLC | | Brown Brothers Harriman & Co. |
| New York, NY 10022 | | Boston, MA 02109 |
| | |
| Sub-Advisers | | Legal Counsel |
| BlackRock International Limited | | Sidley Austin LLP |
| Edinburgh, EH3 8BL | | New York, NY 10019 |
| United Kingdom | | |
| | |
| BlackRock Asset Management | | Transfer Agent |
| North Asia Limited(a) | | BNY Mellon Investment Servicing (US) Inc. |
| Hong Kong | | Wilmington, DE 19809 |
| | |
| | Accounting Agent |
| | State Street Bank and Trust Company |
| | Boston, MA 02110 |
| | |
| | Address of the Funds |
| | 100 Bellevue Parkway |
| | Wilmington, DE 19809 |
| (a) | For Emerging Markets only. |
| | |
| 44 | | 2017 BLACKROCK ANNUAL REPORTTO SHAREHOLDERS |
Additional Information
General Information
Electronic Delivery
Shareholders can sign up for e-mail notifications of quarterly statements, annual and semi-annual shareholder reports and prospectuses by enrolling in the electronic delivery program. Electronic copies of shareholder reports and prospectuses are available on BlackRock’s website.
To enroll in electronic delivery:
Shareholders Who Hold Accounts with Investment Advisers, Banks or Brokerages:
Please contact your financial advisor. Please note that not all investment advisers, banks or brokerages may offer this service.
Householding
The Funds will mail only one copy of shareholder documents, including prospectuses, annual and semi-annual reports and proxy statements, to shareholders with multiple accounts at the same address. This practice is commonly called “householding” and is intended to reduce expenses and eliminate duplicate mailings of shareholder documents. Mailings of your shareholder documents may be householded indefinitely unless you instruct us otherwise. If you do not want the mailing of these documents to be combined with those for other members of your household, please call the Funds at (800) 441-7762.
Availability of Quarterly Schedule of Investments
The Funds file their complete schedule of portfolio holdings with the SEC for the first and third quarters of each fiscal year on Form N-Q. The Funds’ Forms N-Q are available on the SEC’s website at http://www.sec.gov and may also be reviewed and copied at the SEC’s Public Reference Room in Washington, D.C. Information on the operation of the Public Reference Room or how to access documents on the SEC’s website without charge may be obtained by calling (800) SEC-0330. The Funds’ Forms N-Q may also be obtained upon request and without charge by calling (800) 441-7762.
Availability of Proxy Voting Policies and Procedures
A description of the policies and procedures that the Funds use to determine how to vote proxies relating to portfolio securities is available upon request and without charge (1) by calling (800) 441-7762; (2) at http://www.blackrock.com; and (3) on the SEC’s website at http://www.sec.gov.
Availability of Proxy Voting Record
Information about how the Funds voted proxies relating to securities held in the Funds’ portfolios during the most recent 12-month period ended June 30 is available upon request and without charge (1) at http://www.blackrock.com; or by calling (800) 441-7762 and (2) on the SEC’s website at http://www.sec.gov.
BlackRock’s Mutual Fund Family
BlackRock offers a diverse lineup of open-end mutual funds crossing all investment styles and managed by experts in equity, fixed-income and tax-exempt investing. Visit http://www.blackrock.com for more information.
Shareholder Privileges
Account Information
Call us at (800) 441-7762 from 8:00 AM to 6:00 PM ET on any business day to get information about your account balances, recent transactions and share prices. You can also reach us on the Web at http://www.blackrock.com.
Automatic Investment Plans
Investor Class shareholders who want to invest regularly can arrange to have $50 or more automatically deducted from their checking or savings account and invested in any of the BlackRock funds.
Systematic Withdrawal Plans
Investor Class shareholders can establish a systematic withdrawal plan and receive periodic payments of $50 or more from their BlackRock funds, as long as their account balance is at least $10,000.
Retirement Plans
Shareholders may make investments in conjunction with Traditional, Rollover, Roth, Coverdell, Simple IRAs, SEP IRAs and 403(b) Plans.
| | | | |
| ADDITIONAL INFORMATION | | | 45 | |
Additional Information (continued)
BlackRock Privacy Principles
BlackRock is committed to maintaining the privacy of its current and former fund investors and individual clients (collectively, “Clients”) and to safeguarding their non-public personal information. The following information is provided to help you understand what personal information BlackRock collects, how we protect that information and why in certain cases we share such information with select parties.
If you are located in a jurisdiction where specific laws, rules or regulations require BlackRock to provide you with additional or different privacy-related rights beyond what is set forth below, then BlackRock will comply with those specific laws, rules or regulations.
BlackRock obtains or verifies personal non-public information from and about you from different sources, including the following: (i) information we receive from you or, if applicable, your financial intermediary, on applications, forms or other documents; (ii) information about your transactions with us, our affiliates, or others; (iii) information we receive from a consumer reporting agency; and (iv) from visits to our websites.
BlackRock does not sell or disclose to non-affiliated third parties any non-public personal information about its Clients, except as permitted by law or as is necessary to respond to regulatory requests or to service Client accounts. These non-affiliated third parties are required to protect the confidentiality and security of this information and to use it only for its intended purpose.
We may share information with our affiliates to service your account or to provide you with information about other BlackRock products or services that may be of interest to you. In addition, BlackRock restricts access to non-public personal information about its Clients to those BlackRock employees with a legitimate business need for the information. BlackRock maintains physical, electronic and procedural safeguards that are designed to protect the non-public personal information of its Clients, including procedures relating to the proper storage and disposal of such information.
| | |
| 46 | | 2017 BLACKROCK ANNUAL REPORTTO SHAREHOLDERS |
Glossary of Terms Used in this Report
| | |
| Portfolio Abbreviations |
| |
| ADR | | American Depositary Receipts |
| BRL | | Brazilian Real |
| GDR | | Global Depositary Receipt |
| NVDR | | Non-voting Depository Receipts |
| | | | |
| GLOSSARYOF TERMS USEDINTHIS REPORT | | | 47 | |
This report is intended for current holders. It is not authorized for use as an offer of sale or a solicitation of an offer to buy shares of a Fund unless preceded or accompanied by the Fund’s current prospectus. Past performance results shown in this report should not be considered a representation of future performance. Investment returns and principal value of shares will fluctuate so that shares, when redeemed, may be worth more or less than their original cost. Statements and other information herein are as dated and are subject to change.

| | |
| EMLA-10/17-AR | |  |
| | |
Item 2 – | | Code of Ethics – The registrant (or the “Fund”) has adopted a code of ethics, as of the end of the period covered by this report, applicable to the registrant’s principal executive officer, principal financial officer, principal accounting officer or controller, or persons performing similar functions. During the period covered by this report, the code of ethics was amended to clarify an inconsistency as to whom persons covered by the code should report suspected violations of the code. The amendment clarifies that such reporting should be made to BlackRock Advisors, LLC’s (“Investment Adviser” or “BlackRock”) General Counsel, and retains the alternative option of anonymous reporting following “whistleblower” policies. Other non-material changes were also made in connection with this amendment. During the period covered by this report, there have been no waivers granted under the code of ethics. The registrant undertakes to provide a copy of the code of ethics to any person upon request, without charge, who calls 1-800-441-7762. |
| |
Item 3 – | | Audit Committee Financial Expert – The registrant’s board of directors (the “board of directors”), has determined that (i) the registrant has the following audit committee financial expert serving on its audit committee and (ii) each audit committee financial expert is independent: Kenneth L. Urish |
| |
| | Under applicable securities laws, a person determined to be an audit committee financial expert will not be deemed an “expert” for any purpose, including without limitation for the purposes of Section 11 of the Securities Act of 1933, as a result of being designated or identified as an audit committee financial expert. The designation or identification of a person as an audit committee financial expert does not impose on such person any duties, obligations, or liabilities greater than the duties, obligations, and liabilities imposed on such person as a member of the audit committee and board of directors in the absence of such designation or identification. |
| |
Item 4 – | | Principal Accountant Fees and Services |
| |
| | The following table presents fees billed by Deloitte & Touche LLP (“D&T”) in each of the last two fiscal years for the services rendered to the Fund: |
| | | | | | | | | | | | | | | | |
| | | (a) Audit Fees | | (b) Audit-Related Fees1 | | (c) Tax Fees2 | | (d) All Other Fees |
| Entity Name | | Current
Fiscal Year
End | | Previous
Fiscal Year
End | | Current
Fiscal Year
End | | Previous
Fiscal Year
End | | Current
Fiscal Year
End | | Previous
Fiscal Year
End | | Current
Fiscal Year
End | | Previous
Fiscal Year
End |
| BlackRock Latin America Fund, Inc. | | $37,273 | | $38,493 | | $0 | | $0 | | $15,027 | | $14,127 | | $0 | | $0 |
| | |
| | The following table presents fees billed by D&T that were required to be approved by the registrant’s audit committee (the “Committee”) for services that relate directly to the operations or financial reporting of the Fund and that are rendered on behalf of BlackRock and entities controlling, controlled by, or under common control with BlackRock (not including any sub-adviser whose role is primarily portfolio management and is subcontracted with or overseen by another investment adviser) that provide ongoing services to the Fund (“Affiliated Service Providers”): |
| | | | |
| | | Current Fiscal Year End | | Previous Fiscal Year End |
(b) Audit-Related Fees1 | | $0 | | $0 |
(c) Tax Fees2 | | $0 | | $0 |
(d) All Other Fees3 | | $2,129,000 | | $2,154,000 |
2
1 The nature of the services includes assurance and related services reasonably related to the performance of the audit or review of financial statements not included in Audit Fees, including accounting consultations, agreed-upon procedure reports, attestation reports, comfort letters, out-of-pocket expenses and internal control reviews not required by regulators.
2 The nature of the services includes tax compliance and/or tax preparation, including services relating to the filing or amendment of federal, state or local income tax returns, regulated investment company qualification reviews, taxable income and tax distribution calculations.
3 Non-audit fees of $2,129,000 and $2,154,000 for the current fiscal year and previous fiscal year, respectively, were paid to the Fund’s principal accountant in their entirety by BlackRock, in connection with services provided to the Affiliated Service Providers of the Fund and of certain other funds sponsored and advised by BlackRock or its affiliates for a service organization review and an accounting research tool subscription. These amounts represent aggregate fees paid by BlackRock and were not allocated on a per fund basis.
(e)(1) Audit Committee Pre-Approval Policies and Procedures:
| | |
| | The Committee has adopted policies and procedures with regard to the pre-approval of services. Audit, audit-related and tax compliance services provided to the registrant on an annual basis require specific pre-approval by the Committee. The Committee also must approve other non-audit services provided to the registrant and those non-audit services provided to the Investment Adviser and Affiliated Service Providers that relate directly to the operations and the financial reporting of the registrant. Certain of these non-audit services that the Committee believes are (a) consistent with the SEC’s auditor independence rules and (b) routine and recurring services that will not impair the independence of the independent accountants may be approved by the Committee without consideration on a specific case-by-case basis (“general pre-approval”). The term of any general pre-approval is 12 months from the date of the pre-approval, unless the Committee provides for a different period. Tax or other non-audit services provided to the registrant which have a direct impact on the operations or financial reporting of the registrant will only be deemed pre-approved provided that any individual project does not exceed $10,000 attributable to the registrant or $50,000 per project. For this purpose, multiple projects will be aggregated to determine if they exceed the previously mentioned cost levels. Any proposed services exceeding the pre-approved cost levels will require specific pre-approval by the Committee, as will any other services not subject to general pre-approval (e.g., unanticipated but permissible services). The Committee is informed of each service approved subject to general pre-approval at the next regularly scheduled in-person board meeting. At this meeting, an analysis of such services is presented to the Committee for ratification. The Committee may delegate to the Committee Chairman the authority to approve the provision of and fees for any specific engagement of permitted non-audit services, including services exceeding pre-approved cost levels. |
| | |
| | (e)(2) None of the services described in each of Items 4(b) through (d) were approved by the Committee pursuant to the de minimus exception in paragraph (c)(7)(i)(C) of Rule 2-01 of Regulation S-X. |
| |
| | (f) Not Applicable |
| |
| | (g) The aggregate non-audit fees, defined as the sum of the fees shown under “Audit-Related Fees,” “Tax Fees” and “All Other Fees,” paid to the accountant for services rendered by the accountant to the registrant, the Investment Adviser and the Affiliated Service Providers were: |
| | | | | | |
| | | Entity Name | | Current Fiscal Year End | | Previous Fiscal Year End |
| | BlackRock Latin America Fund, Inc. | | $15,027 | | $14,127 |
3
| | |
| | Additionally, the amounts billed by D&T in connection with services provided to the Affiliated Service Providers of the Fund and of other funds sponsored and advised by BlackRock or its affiliates during the current and previous fiscal years for a service organization review and an accounting research tool subscription were: |
| | |
Current Fiscal Year
End | | Previous Fiscal Year
End |
$2,129,000 | | $2,154,000 |
| | |
| | These amounts represent aggregate fees paid by BlackRock and were not allocated on a per fund basis. |
| |
| | (h) The Committee has considered and determined that the provision of non-audit services that were rendered to the Investment Adviser and the Affiliated Service Providers that were not pre-approved pursuant to paragraph (c)(7)(ii) of Rule 2-01 of Regulation S-X is compatible with maintaining the principal accountant’s independence. |
| |
Item 5 – | | Audit Committee of Listed Registrants – Not Applicable |
| |
Item 6 – | | Investments |
| | (a) The registrant’s Schedule of Investments is included as part of the Report to Stockholders filed under Item 1 of this Form. |
| |
| | (b) Not Applicable due to no such divestments during the semi-annual period covered since the previous Form N-CSR filing. |
| |
Item 7 – | | Disclosure of Proxy Voting Policies and Procedures for Closed-End Management Investment Companies – Not Applicable |
| |
Item 8 – | | Portfolio Managers of Closed-End Management Investment Companies – Not Applicable |
| |
Item 9 – | | Purchases of Equity Securities by Closed-End Management Investment Company and Affiliated Purchasers – Not Applicable |
| |
Item 10 – | | Submission of Matters to a Vote of Security Holders – There have been no material changes to these procedures. |
| |
Item 11 – | | Controls and Procedures |
| |
| | (a) The registrant’s principal executive and principal financial officers, or persons performing similar functions, have concluded that the registrant’s disclosure controls and procedures (as defined in Rule 30a-3(c) under the Investment Company Act of 1940, as amended (the “1940 Act”)) are effective as of a date within 90 days of the filing of this report based on the evaluation of these controls and procedures required by Rule 30a-3(b) under the 1940 Act and Rule 15d-15(b) under the Securities Exchange Act of 1934, as amended. |
| |
| | (b) There were no changes in the registrant’s internal control over financial reporting (as defined in Rule 30a-3(d) under the 1940 Act) that occurred during the second fiscal quarter of the period covered by this report that have materially affected, or are reasonably likely to materially affect, the registrant’s internal control over financial reporting. |
4
| | |
Item 12 – | | Disclosure of Securities Lending Activities for Closed-End Management Investment Companies – Not Applicable to the registrant. |
| |
Item 13 – | | Exhibits attached hereto |
(a)(1) Code of Ethics – See Item 2
(a)(2) Certifications – Attached hereto
(a)(3) Not Applicable
(a)(4) Not Applicable
(b) Certifications – Attached hereto
5
Pursuant to the requirements of the Securities Exchange Act of 1934 and the Investment Company Act of 1940, the registrant has duly caused this report to be signed on its behalf by the undersigned, thereunto duly authorized.
BlackRock Latin America Fund, Inc.
| | |
By: | | /s/ John M. Perlowski |
| | John M. Perlowski |
| | Chief Executive Officer (principal executive officer) of |
| | BlackRock Latin America Fund, Inc. |
Date: January 5, 2018
Pursuant to the requirements of the Securities Exchange Act of 1934 and the Investment Company Act of 1940, this report has been signed below by the following persons on behalf of the registrant and in the capacities and on the dates indicated.
| | |
By: | | /s/ John M. Perlowski |
| | John M. Perlowski |
| | Chief Executive Officer (principal executive officer) of |
| | BlackRock Latin America Fund, Inc. |
Date: January 5, 2018
| | |
By: | | /s/ Neal J. Andrews |
| | Neal J. Andrews |
| | Chief Financial Officer (principal financial officer) of |
| | BlackRock Latin America Fund, Inc. |
Date: January 5, 2018
6