UNITED STATES
SECURITIES AND EXCHANGE COMMISSION
Washington, D.C. 20549
FORMN-CSR
CERTIFIED SHAREHOLDER REPORT OF REGISTERED MANAGEMENT INVESTMENT COMPANIES
Investment Company Act file number: 811-06349
Name of Fund: BlackRock Latin America Fund, Inc.
Fund Address: 100 Bellevue Parkway, Wilmington, DE 19809
Name and address of agent for service: John M. Perlowski, Chief Executive Officer, BlackRock Latin America
Fund, Inc., 55 East 52nd Street, New York, NY 10055
Registrant’s telephone number, including area code: (800) 441-7762
Date of fiscal year end: 10/31/2019
Date of reporting period: 10/31/2019
Item 1 – Report to Stockholders
| | |
 | | OCTOBER 31, 2019 |
BlackRock Emerging Markets Fund, Inc.
BlackRock Latin America Fund, Inc.
Beginning on January 1, 2021, as permitted by regulations adopted by the Securities and Exchange Commission, paper copies of each Fund’s shareholder reports will no longer be sent by mail, unless you specifically request paper copies of the reports from BlackRock or from your financial intermediary, such as a broker-dealer or bank. Instead, the reports will be made available on a website, and you will be notified by mail each time a report is posted and provided with a website link to access the report.
You may elect to receive all future reports in paper free of charge. If you hold accounts directly with BlackRock, you can call (800) 441-7762 to inform BlackRock that you wish to continue receiving paper copies of your shareholder reports. If you hold accounts through a financial intermediary, you can follow the instructions included with this disclosure, if applicable, or contact your financial intermediary to request that you continue to receive paper copies of your shareholder reports. Please note that not all financial intermediaries may offer this service. Your election to receive reports in paper will apply to all funds advised by BlackRock Advisors, LLC, BlackRock Fund Advisors or their affiliates, or all funds held with your financial intermediary, as applicable.
If you already elected to receive shareholder reports electronically, you will not be affected by this change and you need not take any action. You may elect to receive electronic delivery of shareholder reports and other communications by: (i) accessing the BlackRock website at blackrock.com/edelivery and logging into your accounts, if you hold accounts directly with BlackRock, or (ii) contacting your financial intermediary, if you hold accounts through a financial intermediary. Please note that not all financial intermediaries may offer this service.
|
| Not FDIC Insured • May Lose Value • No Bank Guarantee |
The Markets in Review
Dear Shareholder,
Investment performance in the 12 months ended October 31, 2019 was a tale of two markets. The first half of the reporting period was characterized by restrictive monetary policy, deteriorating economic growth, equity market volatility, and rising fear of an imminent recession. During the second half of the reporting period, stocks and bonds rebounded sharply, as influential central banks shifted toward accommodative monetary policy, which led to broad-based optimism that a near-term recession could be averted.
After the dust settled, equity and bond markets posted mixed returns while weathering significant volatility. U.S. large cap equities and U.S. bonds advanced, while equities at the high end of the risk spectrum — emerging markets and U.S. small cap — posted modest negative returns.
Fixed-income securities played an important role in diversified portfolios by delivering strong returns amid economic uncertainty, as interest rates declined (and bond prices rose). Long-term bonds, particularly long-term Treasuries, proved to be an effective ballast for diversified investors. Investment-grade and high-yield corporate bonds posted positive returns, as the credit fundamentals in corporate markets remained relatively solid.
In the U.S. equity market, volatility spiked in late 2018, as a wide variety of risks were brought to bear on markets, including rising interest rates, slowing global growth, and heightened trade tensions. Volatility also rose in emerging markets, as the appreciating U.S. dollar and higher interest rates in the U.S. disrupted economic growth abroad. Despite an economic slowdown in Europe and ongoing uncertainty about Brexit, European equities posted a modest positive return.
As equity performance faltered and global economic growth slowed, the U.S. Federal Reserve (the “Fed”) shifted away from policies designed to decrease inflation in favor of renewed efforts to stimulate economic activity. The Fed left interest rates unchanged in January 2019, then reduced interest rates three times thereafter, starting in July 2019. Similarly, the Fed took measures to support liquidity in short-term lending markets. Following in the Fed’s footsteps, the European Central Bank announced aggressive economic stimulus measures, including lower interest rates and the return of its bond purchasing program. The Bank of Japan signaled a continuation of accommodative monetary policy, while China committed to looser credit conditions and an increase in fiscal spending.
The outpouring of global economic stimulus led to a sharp rally in risk assets throughout the world despite the headwind of rising geopolitical and trade tensions. Hopes continued to remain high as the current economic expansion became the longest in U.S. history.
We continue to expect a slowing expansion with additional room to run. Despite a sharp slowdown in trade and manufacturing across the globe, U.S. consumers continued to spend at a relatively healthy pace, benefiting from the lowest unemployment rate in 50 years and rising wages. However, trade disputes and the resulting disruptions in global supply chains, as well as geopolitical tensions, particularly in the Middle East, continued to have a negative impact on global growth.
Overall, we favor reducing investment risk due to rising economic uncertainty. We believe U.S. equities remain relatively attractive, but we are shifting to a more cautious stance by emphasizing factors that seek lower-volatility and higher-quality stocks. In fixed income, government bonds continue to be important portfolio stabilizers, while emerging market bonds offer relatively attractive income opportunities.
In this environment, investors need to think globally, extend their scope across a broad array of asset classes, and be nimble as market conditions change. We encourage you to talk with your financial advisor and visitblackrock.com for further insight about investing in today’s markets.
Sincerely,

Rob Kapito
President, BlackRock Advisors, LLC

Rob Kapito
President, BlackRock Advisors, LLC
| | | | |
| Total Returns as of October 31, 2019 |
| | | 6-month | | 12-month |
U.S. large cap equities
(S&P 500® Index) | | 4.16% | | 14.33% |
U.S. small cap equities
(Russell 2000® Index) | | (1.09) | | 4.90 |
International equities
(MSCI Europe, Australasia, Far East Index) | | 3.35 | | 11.04 |
Emerging market equities
(MSCI Emerging Markets Index) | | (1.67) | | 11.86 |
3-month Treasury bills
(ICE BofAML3-Month U.S. Treasury Bill Index) | | 1.21 | | 2.40 |
U.S. Treasury securities
(ICE BofAML10-Year U.S. Treasury Index) | | 8.17 | | 15.85 |
U.S. investment grade bonds
(Bloomberg Barclays U.S. Aggregate Bond Index) | | 5.71 | | 11.51 |
Tax-exempt municipal bonds
(S&P Municipal Bond Index) | | 3.52 | | 9.07 |
U.S. high yield bonds
(Bloomberg Barclays U.S. Corporate High Yield 2% Issuer Capped Index) | | 2.69 | | 8.38 |
| Past performance is no guarantee of future results. Index performance is shown for illustrative purposes only. You cannot invest directly in an index. |
| | |
| 2 | | THIS PAGEISNOT PARTOF YOUR FUND REPORT |
Table of Contents

| | |
| Fund Summary as of October 31, 2019 | | BlackRock Emerging Markets Fund, Inc. |
Investment Objective
BlackRock Emerging Markets Fund, Inc.’s (the “Fund”) investment objective is to seek long-term capital appreciation by investing in securities, principally equity securities, of issuers in countries having smaller capital markets.
Portfolio Management Commentary
How did the Fund perform?
For the 12-month period ended October 31, 2019, the Fund outperformed its benchmark, the MSCI Emerging Markets Index.
What factors influenced performance?
The Fund’s outperformance relative to the benchmark over the 12-month period was driven primarily by stock selection in China and Brazil. On an individual stock level, an overweight position in Brazilian health care company Notre Dame Intermedica Participacoes SA was the largest contributor to Fund performance as the company benefited from a strong earnings report. Chinese sportswear company Li Ning Co. Ltd. was also a top contributor. Li Ning launched an overhaul of its business operations in 2017, which was reflected in improved earnings and a significant increase in net income during the first half of 2019.
Issuer selection within India and the United Arab Emirates (“UAE”) weighed most heavily on Fund performance over the period. In terms of individual stocks, an underweight position in Taiwan Semiconductor Manufacturing Co. Ltd. detracted as the stock posted gains based on encouraging second quarter results. Additionally, holdings in the UAE hospital operator NMC Health PLC detracted significantly from Fund performance.
At period end, the Fund held an elevated cash balance, which included committed funds against positions that had not yet settled. The Fund’s cash position did not have a material impact on performance.
Describe recent portfolio activity.
The Fund shifted its overweight position in India to an underweight during the period on concerns surrounding India’s financial sector, particularly non-banking financial companies. The Fund added to its China exposure in early 2019, shifting from a material underweight to an overweight given improved liquidity and fiscal support. As the period progressed, given unrest in Hong Kong and U.S./China trade tensions, the Fund’s currency exposures to Hong Kong dollar-priced assets and casino operators Wynn Macau Ltd. and SJM Holdings Ltd. were reduced. In addition, the Fund added to its holdings in Mexico on the outlook for an improving economy and political backdrop. Finally, the Fund’s overweight position in Saudi Arabia was shifted to a significant underweight as valuations there have risen.
Describe portfolio positioning at period end.
Relative to the MSCI Emerging Markets Index, the Fund ended the period overweight in Brazil and Mexico, and underweight in South Africa and Taiwan. At the sector level, the Fund was overweight in health care and consumer discretionary, and underweight in materials and financials.
The views expressed reflect the opinions of BlackRock as of the date of this report and are subject to change based on changes in market, economic or other conditions. These views are not intended to be a forecast of future events and are no guarantee of future results.
| | |
| 4 | | 2019 BLACKROCK ANNUAL REPORTTO SHAREHOLDERS |
| | |
| Fund Summary as of October 31, 2019 (continued) | | BlackRock Emerging Markets Fund, Inc. |
TOTAL RETURN BASED ON A $10,000 INVESTMENT
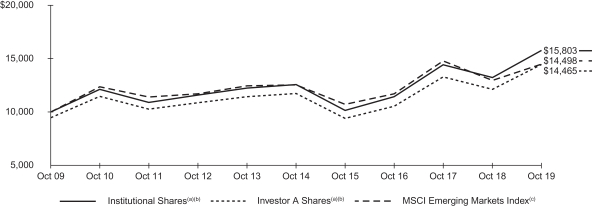
| (a) | Assuming maximum sales charges, if any, transaction costs and other operating expenses, including investment advisory fees. Institutional Shares do not have a sales charge. |
| (b) | Under normal conditions, the Fund invests at least 80% of its net assets plus any borrowings for investment purposes in equity securities of issuers located in countries with developing capital markets. |
| (c) | A free float-adjusted market capitalization index that is designed to measure equity market performance of emerging markets. The MSCI Emerging Markets Index consists of the following 26 emerging market country indexes: Argentina, Brazil, Chile, China, Colombia, Czech Republic, Egypt, Greece, Hungary, India, Indonesia, Korea, Malaysia, Mexico, Pakistan, Peru, Philippines, Poland, Qatar, Russia, Saudi Arabia, South Africa, Taiwan, Thailand, Turkey and United Arab Emirates. |
Performance Summary for the Period Ended October 31, 2019
| | | | | | | | | | | | | | | | | | | | | | | | | | | | | | | | | | | | | | | | |
| | | | | | | | | Average Annual Total Returns (a) | |
| | | | | | | | | 1 Year | | | | | | 5 Years | | | | | | 10 Years | |
| | | 6-Month
Total Returns | | | | | | w/o sales
charge | | | w/sales
charge | | | | | | w/o sales
charge | | | w/sales
charge | | | | | | w/o sales
charge | | | w/sales
charge | |
Institutional | | | 2.72 | % | | | | | | | 19.39 | % | | | N/A | | | | | | | | 4.65 | % | | | N/A | | | | | | | | 4.68 | % | | | N/A | |
Investor A | | | 2.61 | | | | | | | | 19.11 | | | | 12.86 | % | | | | | | | 4.28 | | | | 3.16 | % | | | | | | | 4.32 | | | | 3.76 | % |
Investor C | | | 2.22 | | | | | | | | 18.25 | | | | 17.25 | | | | | | | | 3.45 | | | | 3.45 | | | | | | | | 3.47 | | | | 3.47 | |
Class K | | | 2.77 | | | | | | | | 19.48 | | | | N/A | | | | | | | | 4.68 | | | | N/A | | | | | | | | 4.69 | | | | N/A | |
MSCI Emerging Markets Index | | | (1.67 | ) | | | | | | | 11.86 | | | | N/A | | | | | | | | 2.93 | | | | N/A | | | | | | | | 3.78 | | | | N/A | |
| | (a) | Assuming maximum sales charges, if any. Average annual total returns with and without sales charges reflect reductions for distribution and service fees. See “About Fund Performance” on page 9 for a detailed description of share classes, including any related sales charges and fees, and how performance was calculated for certain share classes. | |
N/A — Not applicable as share class and index do not have a sales charge.
Past performance is not indicative of future results.
Performance results may include adjustments made for financial reporting purposes in accordance with U.S. generally accepted accounting principles.
Expense Example
| | | | | | | | | | | | | | | | | | | | | | | | | | | | | | | | |
| | | Actual | | | | | | Hypothetical (b) | | | | |
| | | Beginning
Account Value
(05/01/19) | | | Ending
Account Value
(10/31/19) | | | Expenses
Paid During
the Period (a) | | | | | | Beginning
Account Value
(05/01/19) | | | Ending
Account Value
(10/31/19) | | | Expenses
Paid During
the Period (a) | | | Annualized
Expense
Ratio | |
Institutional | | $ | 1,000.00 | | | $ | 1,027.20 | | | $ | 4.91 | | | | | | | $ | 1,000.00 | | | $ | 1,020.37 | | | $ | 4.89 | | | | 0.96 | % |
Investor A | | | 1,000.00 | | | | 1,026.10 | | | | 6.18 | | | | | | | | 1,000.00 | | | | 1,019.11 | | | | 6.16 | | | | 1.21 | |
Investor C | | | 1,000.00 | | | | 1,022.20 | | | | 9.99 | | | | | | | | 1,000.00 | | | | 1,015.32 | | | | 9.96 | | | | 1.96 | |
Class K | | | 1,000.00 | | | | 1,027.70 | | | | 4.65 | | | | | | | | 1,000.00 | | | | 1,020.62 | | | | 4.63 | | | | 0.91 | |
| | (a) | For each class of the Fund, expenses are equal to the annualized expense ratio for the class, multiplied by the average account value over the period, multiplied by 184/365 (to reflect theone-half year period shown). | |
| | (b) | Hypothetical 5% return before expenses is calculated by prorating the number of days in the most recent fiscal half year divided by 365. | |
See “Disclosure of Expenses” on page 9 for further information on how expenses were calculated.
| | |
| Fund Summary as of October 31, 2019 | | BlackRock Latin America Fund, Inc. |
Investment Objective
BlackRock Latin America Fund, Inc.’s (the “Fund”) investment objective is to seek long-term capital appreciation by investing primarily in Latin American equity and debt securities.
Portfolio Management Commentary
How did the Fund perform?
For the 12-month period ended October 31, 2019, all of the Fund’s share classes outperformed its benchmark, the MSCI Emerging Markets Latin America Index, with the exception of Investor C Shares, which underperformed.
What factors influenced performance?
During the period, the Fund’s underweight positioning in Chile was the largest contributor to Fund performance amid persistent equity market weakness and currency depreciation within that country. Stock selection in Argentina also was additive to Fund returns. At the individual stock level, Brazilian homebuilders Cyrela Brazil Realty SA and MRV Engenharia e Participacoes SA were the top contributors for the period as the segment was boosted by increased lending support for Brazilian home buyers. In addition, holdings in Argentine information technology company Globant SA contributed significantly as the company’s shares rallied with help from a weaker peso.
At the country level, stock selection in Colombia detracted most from Fund performance. At the stock level, the Fund’s lack of holdings in JBS SA detracted most from performance, as shares of the Brazilian food producer were boosted by the negative effects of the Asian swine flu epidemic on global meat product supply chains. An underweight to Wal-Mart de Mexico SAB de CV also detracted meaningfully from the Fund’s returns.
Describe recent portfolio activity.
During the 12-month period, the Fund reduced its exposure to Brazil by trimming some names that had performed strongly. The Fund also reduced its holdings in Argentina following the country’s primary elections in August on the view that the extent of debt issuance required over the next several years would prove difficult for the Argentine government to execute. The Fund took advantage of price and currency weakness to add to positions in Mexico, including Wal-Mart de Mexico SAB de CV, bringing broader positioning to an overweight stance in that country. The investment adviser sees equity valuations in Mexico as trading at multi-year lows, reflecting a slower growth environment, and sees easing monetary policy, the eventual approval of a new North American trade agreement and the launch of a national infrastructure plan in Mexico as catalysts to improve the country’s business sentiment. The Fund was also underweight in Peru as President Vizcarra’s initiatives to dissolve Peru’s Congress led to further political uncertainty and reduced business confidence. Finally, the Fund maintained an underweight position in Chile amid a background of protests related to social inequality and signs of a deceleration in economic growth.
Describe portfolio positioning at period end.
At period end, the Fund was overweight in Brazil and Mexico, and underweight in Chile, Colombia and Peru, with a slight underweight to Argentina. At the sector level, the Fund was overweight in health care and industrials, and underweight in financials and materials.
The views expressed reflect the opinions of BlackRock as of the date of this report and are subject to change based on changes in market, economic or other conditions. These views are not intended to be a forecast of future events and are no guarantee of future results.
| | |
| 6 | | 2019 BLACKROCK ANNUAL REPORTTO SHAREHOLDERS |
| | |
| Fund Summary as of October 31, 2019 (continued) | | BlackRock Latin America Fund, Inc. |
TOTAL RETURN BASED ON A $10,000 INVESTMENT
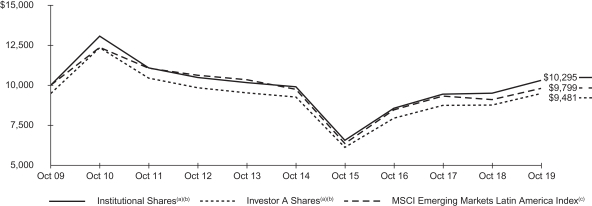
| (a) | Assuming maximum sales charges, if any, transaction costs and other operating expenses, including investment advisory fees. Institutional Shares do not have a sales charge. |
| (b) | Under normal market conditions, the Fund will invest at least 80% of its net assets plus any borrowings for investment purposes in Latin American securities. |
| (c) | A free float-adjusted market capitalization weighted index that is designed to measure equity market performance of emerging markets in Latin America. |
Performance Summary for the Period Ended October 31, 2019
| | | | | | | | | | | | | | | | | | | | | | | | | | | | | | | | | | | | | | | | |
| | | | | | | | | Average Annual Total Returns (a) | |
| | | | | | | | | 1 Year | | | | | | 5 Years | | | | | | 10 Years | |
| | | 6-Month
Total Returns | | | | | | w/o sales
charge | | | w/sales
charge | | | | | | w/o sales
charge | | | w/sales
charge | | | | | | w/o sales
charge | | | w/sales
charge | |
Institutional | | | 3.17 | % | | | | | | | 8.53 | % | | | N/A | | | | | | | | 0.79 | % | | | N/A | | | | | | | | 0.29 | % | | | N/A | |
Investor A | | | 3.03 | | | | | | | | 8.20 | | | | 2.52 | % | | | | | | | 0.48 | | | | (0.60 | )% | | | | | | | 0.01 | | | | (0.53 | )% |
Investor C | | | 2.60 | | | | | | | | 7.31 | | | | 6.31 | | | | | | | | (0.36 | ) | | | (0.36 | ) | | | | | | | (0.81 | ) | | | (0.81 | ) |
Class K | | | 3.17 | | | | | | | | 8.55 | | | | N/A | | | | | | | | 0.80 | | | | N/A | | | | | | | | 0.30 | | | | N/A | |
MSCI Emerging Markets Latin America Index | | | 2.53 | | | | | | | | 7.73 | | | | N/A | | | | | | | | 0.11 | | | | N/A | | | | | | | | (0.20 | ) | | | N/A | |
| | (a) | Assuming maximum sales charges, if any. Average annual total returns with and without sales charges reflect reductions for distribution and service fees. See “About Fund Performance” on page 9 for a detailed description of share classes, including any related sales charges and fees, and how performance was calculated for certain share classes. | |
N/A — Not applicable as share class and index do not have a sales charge.
Past performance is not indicative of future results.
Performance results may include adjustments made for financial reporting purposes in accordance with U.S. generally accepted accounting principles.
Expense Example
| | | | | | | | | | | | | | | | | | | | | | | | | | | | | | | | |
| | | Actual | | | | | | Hypothetical (b) | | | | |
| | | Beginning
Account Value
(05/01/19) | | | Ending
Account Value
(10/31/19) | | | Expenses
Paid During
the Period (a) | | | | | | Beginning
Account Value
(05/01/19) | | | Ending
Account Value
(10/31/19) | | | Expenses
Paid During
the Period (a) | | | Annualized
Expense
Ratio | |
Institutional | | $ | 1,000.00 | | | $ | 1,031.70 | | | $ | 6.55 | | | | | | | $ | 1,000.00 | | | $ | 1,018.75 | | | $ | 6.51 | | | | 1.28 | % |
Investor A | | | 1,000.00 | | | | 1,030.30 | | | | 8.09 | | | | | | | | 1,000.00 | | | | 1,017.24 | | | | 8.03 | | | | 1.58 | |
Investor C | | | 1,000.00 | | | | 1,026.00 | | | | 12.10 | | | | | | | | 1,000.00 | | | | 1,013.26 | | | | 12.03 | | | | 2.37 | |
Class K | | | 1,000.00 | | | | 1,031.70 | | | | 6.50 | | | | | | | | 1,000.00 | | | | 1,018.80 | | | | 6.46 | | | | 1.27 | |
| | (a) | For each class of the Fund, expenses are equal to the annualized expense ratio for the class, multiplied by the average account value over the period, multiplied by 184/365 (to reflect the one-half year period shown). | |
| | (b) | Hypothetical 5% annual return before expenses is calculated by prorating the number of days in the most recent fiscal half year divided by 365. | |
See “Disclosure of Expenses” on page 9 for further information on how expenses were calculated.
| | |
| Portfolio Information as of October 31, 2019 | | |
BlackRock Emerging Markets Fund, Inc.
TEN LARGEST HOLDINGS
| | | | |
| | | Percent of
Total Investments (a) | |
Samsung Electronics Co. Ltd. | | | 7 | % |
Alibaba Group Holding Ltd. — ADR | | | 6 | |
Taiwan Semiconductor Manufacturing Co. Ltd. | | | 5 | |
Petroleo Brasileiro SA — ADR | | | 3 | |
Sberbank of Russia PJSC — ADR | | | 3 | |
Ping An Insurance Group Co. of China Ltd., Class H | | | 2 | |
Notre Dame Intermedica Participacoes SA | | | 2 | |
SJM Holdings Ltd. | | | 2 | |
Astra International Tbk PT | | | 2 | |
Asymchem Laboratories Tianjin Co. Ltd. | | | 2 | |
| | (a) | Excludes short-term securities. | |
GEOGRAPHIC ALLOCATION
| | | | | | | | | | | | | | | | | | | | |
| | | Percent of
Total Investments (a) | |
| Country | | Long | | | | | | Short | | | | | | Total | |
China | | | 30 | % | | | | | | | — | % | | | | | | | 30 | % |
South Korea | | | 12 | | | | | | | | — | | | | | | | | 12 | |
Brazil | | | 11 | | | | | | | | — | | | | | | | | 11 | |
Taiwan | | | 8 | | | | | | | | — | | | | | | | | 8 | |
India | | | 8 | | | | | | | | — | | | | | | | | 8 | |
Russia | | | 6 | | | | | | | | — | | | | | | | | 6 | |
Mexico | | | 6 | | | | | | | | — | | | | | | | | 6 | |
Indonesia | | | 3 | | | | | | | | — | | | | | | | | 3 | |
Thailand | | | 3 | | | | | | | | — | | | | | | | | 3 | |
United Kingdom | | | 2 | | | | | | | | — | | | | | | | | 2 | |
Philippines | | | 2 | | | | | | | | — | | | | | | | | 2 | |
Turkey | | | 2 | | | | | | | | — | | | | | | | | 2 | |
Poland | | | 2 | | | | | | | | — | | | | | | | | 2 | |
Panama | | | 1 | | | | | | | | — | | | | | | | | 1 | |
Egypt | | | 1 | | | | | | | | — | | | | | | | | 1 | |
Hong Kong | | | 1 | | | | | | | | — | | | | | | | | 1 | |
United Arab Emirates | | | 1 | | | | | | | | — | | | | | | | | 1 | |
Italy | | | 1 | | | | | | | | — | | | | | | | | 1 | |
Israel(b) | | | 0 | | | | | | | | — | | | | | | | | 0 | |
| | | 100 | % | | | | | | | — | % | | | | | | | 100 | % |
| | (a) | Total investments include the gross notional values of long and short equity securities of the underlying derivative contracts utilized by the Fund and exclude short-term securities. | |
| | (b) | Represents less than 1% of long-term investments. | |
BlackRock Latin America Fund, Inc.
TEN LARGEST HOLDINGS
| | | | |
| | | Percent of
Net Assets | |
Petroleo Brasileiro SA — ADR | | | 10 | % |
Itau Unibanco Holding SA, Preference Shares — ADR | | | 9 | |
Banco Bradesco SA — ADR | | | 6 | |
Vale SA — ADR | | | 5 | |
America Movil SAB de CV | | | 5 | |
B3 SA — Brasil Bolsa Balcao | | | 4 | |
Fomento Economico Mexicano SAB de CV — ADR | | | 4 | |
Banco do Brasil SA | | | 4 | |
Grupo Financiero Banorte SAB de CV, Series O | | | 3 | |
Wal-Mart de Mexico SAB de CV | | | 3 | |
GEOGRAPHIC ALLOCATION
| | | | |
| | | Percent of
Net Assets | |
Brazil | | | 70 | % |
Mexico | | | 23 | |
United States | | | 4 | |
Peru | | | 1 | |
Argentina | | | 1 | |
Colombia | | | 1 | |
Chile | | | 1 | |
Panama | | | 1 | |
Liabilities in Excess of Other Assets | | | (2 | ) |
| | |
| 8 | | 2019 BLACKROCK ANNUAL REPORTTO SHAREHOLDERS |
About Fund Performance
Institutional and Class K Sharesare not subject to any sales charge. These shares bear no ongoing distribution or service fees and are available only to certain eligible investors. Class K Shares performance shown prior to the Class K Shares inception date of January 25, 2018 is that of Institutional Shares. The performance of each Fund’s Class K Shares would be substantially similar to Institutional Shares because Class K Shares and Institutional Shares invest in the same portfolio of securities and performance would only differ to the extent that Class K Shares and Institutional Shares have different expenses. The actual returns of Class K Shares would have been higher than those of the Institutional Shares because Class K Shares have lower expenses than Institutional Shares.
Investor A Sharesare subject to a maximum initial sales charge(front-end load) of 5.25% and a service fee of 0.25% per year (but no distribution fee). Certain redemptions of these shares may be subject to a contingent deferred sales charge (“CDSC”) where no initial sales charge was paid at the time of purchase. These shares are generally available through financial intermediaries.
Investor C Shares are subject to a 1.00% CDSC if redeemed within one year of purchase. In addition, these shares are subject to a distribution fee of 0.75% per year and a service fee of 0.25% per year. These shares are generally available through financial intermediaries. Effective November 8, 2018, the Funds adopted an automatic conversion feature whereby Investor C Shares held for approximately ten years will be automatically converted into Investor A Shares.
Performance information reflects past performance and does not guarantee future results. Current performance may be lower or higher than the performance data quoted. Refer toblackrock.com to obtain performance data current to the most recent month-end. Performance results do not reflect the deduction of taxes that a shareholder would pay on fund distributions or the redemption of fund shares. Figures shown in the performance tables on the previous pages assume reinvestment of all distributions, if any, at NAV on theex-dividend date. Investment return and principal value of shares will fluctuate so that shares, when redeemed, may be worth more or less than their original cost. Distributions paid to each class of shares will vary because of the different levels of service, distribution and transfer agency fees applicable to each class, which are deducted from the income available to be paid to shareholders.
BlackRock Advisors, LLC (the “Manager”), each Fund’s investment adviser, has contractually and/or voluntarily agreed to waive and/or reimburse a portion of each Fund’s expenses. Without such waiver and/or reimbursement, each Fund’s performance would have been lower. With respect to each Fund’s voluntary waiver, the Manager is under no obligation to waive and/or reimburse or to continue waiving and/or reimbursing its fees and such voluntary waiver may be reduced or discontinued at any time. With respect to each Fund’s contractual waivers, the Manager is under no obligation to continue waiving and/or reimbursing its fees after the applicable termination date of such agreement. See Note 6 of the Notes to Financial Statements for additional information on waivers and/or reimbursements.
Disclosure of Expenses
Shareholders of each Fund may incur the following charges: (a) transactional expenses, such as sales charges; and (b) operating expenses, including investment advisory fees, service and distribution fees, including12b-1 fees, acquired fund fees and expenses, and other fund expenses. The expense examples shown on the previous pages (which are based on a hypothetical investment of $1,000 invested on May 1, 2019 and held through October 31, 2019) are intended to assist shareholders both in calculating expenses based on an investment in each Fund and in comparing these expenses with similar costs of investing in other mutual funds.
The expense examples provide information about actual account values and actual expenses. In order to estimate the expenses a shareholder paid during the period covered by this report, shareholders can divide their account value by $1,000 and then multiply the result by the number corresponding to their Fund and share class under the heading entitled “Expenses Paid During the Period.”
The expense examples also provide information about hypothetical account values and hypothetical expenses based on a Fund’s actual expense ratio and an assumed rate of return of 5% per year before expenses. In order to assist shareholders in comparing the ongoing expenses of investing in these Funds and other funds, compare the 5% hypothetical examples with the 5% hypothetical examples that appear in shareholder reports of other funds.
The expenses shown in the expense examples are intended to highlight shareholders’ ongoing costs only and do not reflect transactional expenses, such as sales charges, if any. Therefore, the hypothetical examples are useful in comparing ongoing expenses only, and will not help shareholders determine the relative total expenses of owning different funds. If these transactional expenses were included, shareholder expenses would have been higher.
Derivative Financial Instruments
The Funds may invest in various derivative financial instruments. These instruments are used to obtain exposure to a security, commodity, index, market, and/or other assets without owning or taking physical custody of securities, commodities and/or other referenced assets or to manage market, equity, credit, interest rate, foreign currency exchange rate, commodity and/or other risks. Derivative financial instruments may give rise to a form of economic leverage and involve risks, including the imperfect correlation between the value of a derivative financial instrument and the underlying asset, possible default of the counterparty to the transaction or illiquidity of the instrument. The Funds’ successful use of a derivative financial instrument depends on the investment adviser’s ability to predict pertinent market movements accurately, which cannot be assured. The use of these instruments may result in losses greater than if they had not been used, may limit the amount of appreciation a Fund can realize on an investment and/or may result in lower distributions paid to shareholders. The Funds’ investments in these instruments, if any, are discussed in detail in the Notes to Financial Statements.
| | | | |
| ABOUT FUND PERFORMANCE / DISCLOSUREOF EXPENSES / DERIVATIVE FINANCIAL INSTRUMENTS | | | 9 | |
| | |
Schedule of Investments October 31, 2019 | | BlackRock Emerging Markets Fund, Inc. (Percentages shown are based on Net Assets) |
| | | | | | | | |
| Security | | Shares | | | Value | |
|
Common Stocks — 87.8% | |
|
| Brazil — 9.6% | |
B2W Cia Digital(a) | | | 520,432 | | | $ | 6,592,182 | |
BB Seguridade Participacoes SA | | | 1,209,519 | | | | 10,244,947 | |
Cia Brasileira de Distribuicao, Preference Shares, ADR | | | 104,600 | | | | 2,156,852 | |
Neoenergia SA | | | 1,836,806 | | | | 9,599,664 | |
Notre Dame Intermedica Participacoes SA | | | 949,226 | | | | 14,201,112 | |
Petroleo Brasileiro SA — ADR | | | 1,245,073 | | | | 20,219,986 | |
| | | | | | | | |
| | | | 63,014,743 | |
|
| China — 23.5% | |
Alibaba Group Holding Ltd. — ADR(a) | | | 204,409 | | | | 36,112,938 | |
Asymchem Laboratories Tianjin Co. Ltd., Class A | | | 685,000 | | | | 12,407,833 | |
ENN Energy Holdings Ltd. | | | 1,035,600 | | | | 11,814,691 | |
Geely Automobile Holdings Ltd. | | | 5,050,000 | | | | 9,555,667 | |
Health & Happiness H&H International Holdings Ltd. | | | 779,000 | | | | 3,084,166 | |
Kunlun Energy Co. Ltd. | | | 6,618,000 | | | | 6,159,611 | |
Li Ning Co. Ltd. | | | 2,587,000 | | | | 8,772,049 | |
Meituan Dianping, Class B(a) | | | 924,800 | | | | 11,031,145 | |
Momo, Inc., ADR | | | 299,505 | | | | 10,039,408 | |
NetEase, Inc. — ADR | | | 28,523 | | | | 8,153,585 | |
Ping An Insurance Group Co. of China Ltd., Class H | | | 1,266,500 | | | | 14,617,665 | |
Shenzhen MindrayBio-Medical Electronics Co. Ltd., Class A | | | 291,444 | | | | 7,350,134 | |
SJM Holdings Ltd. | | | 13,237,000 | | | | 14,140,308 | |
Wuhan Raycus Fiber Laser Technologies Co. Ltd., Class A | | | 12,395 | | | | 159,605 | |
| | | | | | | | |
| | | | 153,398,805 | |
|
| Egypt — 1.3% | |
Commercial International Bank Egypt SAE | | | 1,658,684 | | | | 8,324,251 | |
| | | | | | | | |
|
| Hong Kong — 1.2% | |
Hang Lung Properties Ltd. | | | 3,610,000 | | | | 7,935,507 | |
| | | | | | | | |
|
| India — 7.4% | |
Bharti Airtel Ltd. | | | 1,501,766 | | | | 7,923,951 | |
Fortis Healthcare Ltd.(a) | | | 3,031,883 | | | | 6,273,128 | |
HDFC Bank Ltd. | | | 622,224 | | | | 10,780,827 | |
Jindal Steel & Power Ltd.(a) | | | 2,629,629 | | | | 4,300,217 | |
Petronet LNG Ltd. | | | 2,594,291 | | | | 10,468,457 | |
Tech Mahindra Ltd. | | | 829,354 | | | | 8,635,811 | |
| | | | | | | | |
| | | | 48,382,391 | |
|
| Indonesia — 3.1% | |
Astra International Tbk PT | | | 25,484,300 | | | | 12,604,551 | |
Bank Mandiri Persero Tbk PT | | | 15,308,700 | | | | 7,652,345 | |
| | | | | | | | |
| | | | | | | 20,256,896 | |
|
| Israel — 0.4% | |
Israel Chemicals Ltd. | | | 551,586 | | | | 2,451,832 | |
| | | | | | | | |
|
| Italy — 0.9% | |
Prada SpA(b) | | | 1,647,000 | | | | 5,662,167 | |
| | | | | | | | |
|
| Mexico — 5.7% | |
Fomento Economico Mexicano SAB de CV | | | 687,809 | | | | 6,103,449 | |
Fomento Economico Mexicano SAB de CV — ADR | | | 93,640 | | | | 8,335,833 | |
Grupo Aeroportuario del Pacifico SAB de CV, ADR | | | 47,105 | | | | 4,922,943 | |
Grupo Aeroportuario del Pacifico SAB de CV, Class B | | | 616,540 | | | | 6,463,951 | |
Grupo Financiero Banorte SAB de CV, Series O | | | 2,082,927 | | | | 11,369,393 | |
| | | | | | | | |
| | | | | | | 37,195,569 | |
|
| Panama — 1.4% | |
Copa Holdings SA, Class A | | | 88,286 | | | | 8,982,218 | |
| | | | | | | | |
|
| Philippines — 1.8% | |
Bank of the Philippine Islands | | | 6,171,360 | | | | 11,790,263 | |
| | | | | | | | |
| | | | | | | | |
| Security | | Shares | | | Value | |
|
| Poland — 1.5% | |
Bank Polska Kasa Opieki SA | | | 357,926 | | | $ | 10,108,086 | |
| | | | | | | | |
|
| Russia — 4.9% | |
Mobile TeleSystems OJSC | | | 1,177,851 | | | | 5,242,426 | |
Mobile TeleSystems PJSC — ADR | | | 582,099 | | | | 5,209,786 | |
Polyus PJSC | | | 25,988 | | | | 3,027,087 | |
Sberbank of Russia PJSC | | | 547,192 | | | | 2,005,410 | |
Sberbank of Russia PJSC — ADR | | | 1,111,629 | | | | 16,370,180 | |
| | | | | | | | |
| | | | 31,854,889 | |
|
| South Korea — 11.1% | |
NCSoft Corp. | | | 18,654 | | | | 8,278,561 | |
Samsung Electronics Co. Ltd. | | | 895,353 | | | | 38,697,019 | |
Samsung SDI Co. Ltd. | | | 43,751 | | | | 8,537,820 | |
SK Hynix, Inc. | | | 152,421 | | | | 10,717,629 | |
Woongjin Coway Co. Ltd. | | | 85,000 | | | | 6,706,777 | |
| | | | | | | | |
| | | | 72,937,806 | |
|
| Taiwan — 7.7% | |
Hon Hai Precision Industry Co. Ltd. | | | 2,571,000 | | | | 6,790,275 | |
Merry Electronics Co. Ltd. | | | 322,976 | | | | 1,580,561 | |
Nanya Technology Corp. | | | 2,352,000 | | | | 5,379,740 | |
Silicon Motion Technology Corp. — ADR | | | 218,467 | | | | 9,186,537 | |
Taiwan Semiconductor Manufacturing Co. Ltd. | | | 2,833,000 | | | | 27,762,828 | |
| | | | | | | | |
| | | | 50,699,941 | |
|
| Thailand — 2.6% | |
Charoen Pokphand Foods PCL — NVDR | | | 10,547,700 | | | | 8,823,641 | |
Land & Houses PCL, Foreign Registered Shares | | | 2,528,000 | | | | 817,059 | |
Land & Houses PCL — NVDR | | | 22,523,700 | | | | 7,236,637 | |
| | | | | | | | |
| | | | 16,877,337 | |
|
| Turkey — 1.7% | |
Koza Altin Isletmeleri AS(a) | | | 463,186 | | | | 5,693,301 | |
Tupras Turkiye Petrol Rafinerileri AS | | | 243,144 | | | | 5,292,349 | |
| | | | | | | | |
| | | | 10,985,650 | |
|
| United Arab Emirates — 0.7% | |
NMC Health PLC | | | 172,704 | | | | 4,895,582 | |
| | | | | | | | |
|
| United Kingdom — 1.3% | |
Prudential PLC | | | 486,511 | | | | 8,497,808 | |
| | | | | | | | |
| |
Total Common Stocks — 87.8%
(Cost — $511,458,968) | | | | 574,251,741 | |
| | | | | | | | |
|
Participation Notes — 0.0% | |
|
Taiwan — 0.0% | |
Deutsche Bank AG (Merry Electronics Co. Ltd.), due 02/01/28(a) | | | 1,169 | | | | 5,722 | |
| | | | | | | | |
| |
Total Participation Notes — 0.0%
(Cost — $4,249) | | | | 5,722 | |
| | | | | | | | |
|
Preferred Stocks — 2.4% | |
|
Brazil — 1.2% | |
Banco Nacional SA, Preference Shares, 0.00%(a)(c) | | | 42,567,626 | | | | 106 | |
Cia Brasileira de Distribuicao, Preference Shares, 0.00% | | | 360,402 | | | | 7,457,864 | |
| | | | | | | | |
| | | | 7,457,970 | |
|
| Russia — 1.2% | |
Surgutneftegas PJSC, Preference Shares, 0.00% | | | 13,666,008 | | | | 8,040,730 | |
| | | | | | | | |
| |
Total Preferred Stocks — 2.4%
(Cost — $15,126,462) | | | | 15,498,700 | |
| | | | | | | | |
| |
Total Long-Term Investments — 90.2%
(Cost — $526,589,679) | | | | 589,756,163 | |
| | | | | | | | |
| | |
| 10 | | 2019 BLACKROCK ANNUAL REPORTTO SHAREHOLDERS |
| | |
Schedule of Investments (continued) October 31, 2019 | | BlackRock Emerging Markets Fund, Inc. (Percentages shown are based on Net Assets) |
| | | | | | | | |
| Security | | Shares | | | Value | |
|
Short-Term Securities — 9.3% | |
BlackRock Liquidity Funds,T-Fund, Institutional Class, 1.70%(d)(f) | | | 60,286,005 | | | $ | 60,286,005 | |
SL Liquidity Series, LLC, Money Market Series, 2.02%(d)(e)(f) | | | 202,871 | | | | 202,911 | |
| | | | | | | | |
| |
Total Short-Term Securities — 9.3%
(Cost — $60,488,862) | | | | 60,488,916 | |
| | | | | | | | |
| |
Total Investments — 99.5%
(Cost — $587,078,541) | | | | 650,245,079 | |
| |
Other Assets Less Liabilities — 0.5% | | | | 3,464,984 | |
| | | | | | | | |
| |
Net Assets — 100.0% | | | $ | 653,710,063 | |
| | | | | | | | |
| (a) | Non-income producing security. |
| (b) | Security, or a portion of the security, is on loan. |
| (c) | Security is valued using significant unobservable inputs and is classified as Level 3 in the fair value hierarchy. |
| (d) | Annualized7-day yield as of period end. |
| (e) | All or a portion of the security was purchased with the cash collateral from loaned securities. |
| (f) | During the year ended October 31, 2019, investments in issuers considered to be an affiliate/affiliates of the Fund for purposes of Section 2(a)(3) of the Investment Company Act of 1940, as amended, were as follows: |
| | | | | | | | | | | | | | | | | | | | | | | | | | | | |
| Affiliate | | Shares
Held at
10/31/18 | | | Net
Activity | | | Shares
Held at
10/31/19 | | | Value at
10/31/19 | | | Income | | | Net
Realized
Gain (Loss) (a) | | | Change in
Unrealized
Appreciation
(Depreciation) | |
BlackRock Liquidity Funds,T-Fund, Institutional Class | | | 12,423,517 | | | | 47,862,488 | | | | 60,286,005 | | | $ | 60,286,005 | | | $ | 676,749 | | | $ | — | | | $ | — | |
SL Liquidity Series, LLC, Money Market Series | | | 4,869,518 | | | | (4,666,647 | ) | | | 202,871 | | | | 202,911 | | | | 149,184 | (b) | | | 1,681 | | | | 278 | |
| | | | | | | | | | | | | | | | | | | | | | | | | | | | |
| | | | | | | | | | | | | | $ | 60,488,916 | | | $ | 825,933 | | | $ | 1,681 | | | $ | 278 | |
| | | | | | | | | | | | | | | | | | | | | | | | | | | | |
| | (a) | Includes net capital gain distributions, if applicable. | |
| | (b) | Represents securities lending income earned from the reinvestment of cash collateral from loaned securities, net of fees and collateral investment expenses, and other payments to and from borrowers of securities. | |
Derivative Financial Instruments Outstanding as of Period End
Futures Contracts
| | | | | | | | | | | | | | | | | | | | | | | | |
| Description | | | Number of
Contracts | | | Expiration
Date | | | Notional
Amount (000) | | | Value/
Unrealized
Appreciation
(Depreciation) | |
Long Contracts | | | | | | | | | | | | | | | | | | | | | | | | |
MSCI Emerging Markets Index | | | | | | | | | | | 289 | | | | 12/20/19 | | | $ | 15,048 | | | $ | 347,603 | |
| | | | | | | | | | | | | | | | | | | | | | | | |
Forward Foreign Currency Exchange Contracts
| | | | | | | | | | | | | | | | | | | | |
Currency
Purchased | | | Currency
Sold | | | Counterparty | | Settlement Date | | | Unrealized
Appreciation
(Depreciation) | |
| TRY | | | 31,382,650 | | | USD | | | 5,372,362 | | | HSBC Bank USA N.A. | | | 01/10/20 | | | $ | 17,971 | |
| | | | | | | | | | | | | | | | | | | | |
| USD | | | 10,769,153 | | | KRW | | | 13,044,352,303 | | | HSBC Bank USA N.A. | | | 11/22/19 | | | | (380,437 | ) |
| USD | | | 5,114,513 | | | TRY | | | 31,382,650 | | | HSBC Bank USA N.A. | | | 01/10/20 | | | | (275,820 | ) |
| USD | | | 28,252,335 | | | HKD | | | 222,006,846 | | | JPMorgan Chase Bank N.A. | | | 08/26/20 | | | | (84,894 | ) |
| | | | | | | | | | | | | | | | | | | | |
| | | | | | | | | | | | | | | | | | | (741,151 | ) |
| | | | | | | | | | | | | | | | | | | | |
| | | | | | | | | | | | | | | $ | (723,180 | ) |
| | | | | | | | | | | | | | | | | | | | |
OTC Total Return Swaps (a)
| | | | | | | | | | | | | | | | | | | | |
| Reference Entity | | Counterparty | | Expiration
Date | | | Net Notional
Amount | | Unrealized
Appreciation (Depreciation) | | | Net Value of
Reference Entities | | | Gross Notional Amount Net Asset Percentage | |
Equity Securities | | JPMorgan Chase Bank N.A. | | | 02/28/23 | | | $40,852,763 | | $ | 175,475 | (b) | | $ | 41,081,176 | | | | 6.25 | % |
| | | | | | | | | | | | | | | | | | | | |
| | | | |
| SCHEDULES OF INVESTMENTS | | | 11 | |
| | |
Schedule of Investments (continued) October 31, 2019 | | BlackRock Emerging Markets Fund, Inc. |
| | (a) | In regards to total return swaps with multiple financing rate benchmarks, the Fund receives or pays the total return on a portfolio of long positions underlying the total return swap. In addition, the Fund pays or receives a variable rate of interest, based on a specified benchmark, plus or minus a spread in a range of55-95 basis points. The benchmark and spread are determined based upon the country and/or currency of the individual underlying positions. The following are the specified benchmarks used in determining the variable rate of interest: | |
HKD — 1M Hong Kong Interbank Offer rate (HIBOR)
USD — 1D Overnight Bank Funding Rate (OBFR01)
USD — 1M US Dollar LIBOR BBA
| | (b) | Amount includes $(52,938) of net dividends and financing fees. | |
The following table represents the individual long positions and related values of the equity securities underlying the total return swap with JPMorgan Chase Bank N.A. as of October 31, 2019 expiration date 02/28/23:
| | | | | | | | | | | | |
| | | Shares | | | Value | | | % of
Basket
Value | |
|
Reference Entity — Long | |
| | | |
| China | | | | | | | | | |
Bank of China Ltd., Class H | | | 34,944,000 | | | $ | 14,234,063 | | | | 34.6 | % |
Tencent Holdings Ltd. | | | 524,800 | | | | 21,262,676 | | | | 51.8 | |
| | | | | | | | | | | | |
| | | | 35,496,739 | | | | | |
|
| Egypt | |
Commercial International Bank Egypt SAE | | | 106,395 | | | | 533,953 | | | | 1.3 | |
| | | | | | | | | | | | |
|
| United Arab Emirates | |
NMC Health PLC | | | 46,121 | | | | 1,307,376 | | | | 3.2 | |
| | | | | | | | | | | | |
|
| United Kingdom | |
Prudential PLC | | | 214,298 | | | | 3,743,108 | | | | 9.1 | |
| | | | | | | | | | | | |
| | | |
Total Reference Entity — Long | | | | | | | 41,081,176 | | | | | |
| | | | | | | | | | | | |
| | | |
Net Value of Reference Entity — JPMorgan Chase Bank N.A. | | | | | | $ | 41,081,176 | | | | | |
| | | | | | | | | | | | |
| | | | | | | | | | | | |
Balances Reported in the Statements of Assets and Liabilities for OTC Swaps
| | | | | | | | | | | | | | | | | | |
| | | Swap
Premiums
Paid | | | Swap
Premiums
Received | | | Unrealized
Appreciation | | | Unrealized
Depreciation | |
OTC Swaps | | $ | — | | | $ | — | | | $ | 175,475 | | | $ | — | |
Derivative Financial Instruments Categorized by Risk Exposure
As of period end, the fair values of derivative financial instruments located in the Statements of Assets and Liabilities were as follows:
| | | | | | | | | | | | | | | | | | | | | | | | | | | | |
| | | Commodity
Contracts | | | Credit
Contracts | | | Equity
Contracts | | | Foreign
Currency
Exchange
Contracts | | | Interest
Rate
Contracts | | | Other
Contracts | | | Total | |
Assets — Derivative Financial Instruments | | | | | | | | | | | | | | | | | | | | | | | | | | | | |
Futures contracts | | | | | | | | | | | | | | | | | | | | | | | | | | | | |
Unrealized appreciation on futures contracts(a) | | $ | — | | | $ | — | | | $ | 347,603 | | | $ | — | | | $ | — | | | $ | — | | | $ | 347,603 | |
Forward foreign currency exchange contracts | | | | | | | | | | | | | | | | | | | | | | | | | | | | |
Unrealized appreciation on forward foreign currency exchange contracts | | | — | | | | — | | | | — | | | | 17,971 | | | | — | | | | — | | | | 17,971 | |
Swaps — OTC | | | | | | | | | | | | | | | | | | | | | | | | | | | | |
Unrealized appreciation on OTC swaps; Swap premiums paid | | | — | | | | — | | | | 175,475 | | | | — | | | | — | | | | — | | | | 175,475 | |
| | | | | | | | | | | | | | | | | | | | | | | | | | | | |
| | $ | — | | | $ | — | | | $ | 523,078 | | | $ | 17,971 | | | $ | — | | | $ | — | | | $ | 541,049 | |
| | | | | | | | | | | | | | | | | | | | | | | | | | | | |
Liabilities — Derivative Financial Instruments | | | | | | | | | | | | | | | | | | | | | | | | | | | | |
Forward foreign currency exchange contracts | | | | | | | | | | | | | | | | | | | | | | | | | | | | |
Unrealized depreciation on forward foreign currency exchange contracts | | $ | — | | | $ | — | | | $ | — | | | $ | 741,151 | | | $ | — | | | $ | — | | | $ | 741,151 | |
| | | | | | | | | | | | | | | | | | | | | | | | | | | | |
| | (a) | Net cumulative unrealized appreciation (depreciation) on futures contracts, if any, are reported in the Schedule of Investments. In the Statements of Assets and Liabilities, only current day’s variation margin is reported in receivables or payables and the net cumulative unrealized appreciation (depreciation) is included in accumulated earnings (loss). | |
| | |
| 12 | | 2019 BLACKROCK ANNUAL REPORTTO SHAREHOLDERS |
| | |
Schedule of Investments (continued) October 31, 2019 | | BlackRock Emerging Markets Fund, Inc. |
For the year ended October 31, 2019, the effect of derivative financial instruments in the Statements of Operations was as follows:
| | | | | | | | | | | | | | | | | | | | | | | | | | | | |
| | | Commodity
Contracts | | | Credit
Contracts | | | Equity
Contracts | | | Foreign
Currency
Exchange
Contracts | | | Interest
Rate
Contracts | | | Other Contracts | | | Total | |
Net Realized Gain (Loss) from: | | | | | | | | | | | | | | | | | | | | | | | | | | | | |
Futures contracts | | $ | — | | | $ | — | | | $ | 409,574 | | | $ | — | | | $ | — | | | $ | — | | | $ | 409,574 | |
Forward foreign currency exchange contracts | | | — | | | | — | | | | — | | | | 910,915 | | | | — | | | | — | | | | 910,915 | |
Swaps | | | — | | | | — | | | | 970,569 | | | | — | | | | — | | | | — | | | | 970,569 | |
| | | | | | | | | | | | | | | | | | | | | | | | | | | | |
| | $ | — | | | $ | — | | | $ | 1,380,143 | | | $ | 910,915 | | | $ | — | | | $ | — | | | $ | 2,291,058 | |
| | | | | | | | | | | | | | | | | | | | | | | | | | | | |
| | | | | | | |
| Net Change in Unrealized Appreciation (Depreciation) on: | | | | | | | | | | | | | | | | | | | | | |
Futures contracts | | $ | — | | | $ | — | | | $ | 977,371 | | | $ | — | | | $ | — | | | $ | — | | | $ | 977,371 | |
Forward foreign currency exchange contracts | | | — | | | | — | | | | — | | | | (723,180 | ) | | | — | | | | — | | | | (723,180 | ) |
Swaps | | | — | | | | — | | | | 175,475 | | | | — | | | | — | | | | — | | | | 175,475 | |
| | | | | | | | | | | | | | | | | | | | | | | | | | | | |
| | $ | — | | | $ | — | | | $ | 1,152,846 | | | $ | (723,180 | ) | | $ | — | | | $ | — | | | $ | 429,666 | |
| | | | | | | | | | | | | | | | | | | | | | | | | | | | |
Average Quarterly Balances of Outstanding Derivative Financial Instruments
| | | | |
Futures contracts: | | | | |
Average notional value of contracts — long | | $ | 18,260,595 | |
Forward foreign currency exchange contracts: | | | | |
Average amounts purchased — in USD | | $ | 18,670,367 | |
Average amounts sold — in USD | | $ | 1,343,090 | |
Total return swaps: | | | | |
Average notional amount | | $ | 10,213,191 | |
| |
For more information about the Fund’s investment risks regarding derivative financial instruments, refer to the Notes to Financial Statements.
Derivative Financial Instruments — Offsetting as of Period End
The Fund’s derivative assets and liabilities (by type) were as follows:
| | | | | | | | | | | | | | |
| | | Assets | | | Liabilities | |
Derivative Financial Instruments: | | | | | | | | |
Futures contracts | | $ | — | | | $ | 114,155 | |
Forward foreign currency exchange contracts | | | 17,971 | | | | 741,151 | |
Swaps — OTC(a) | | | 175,475 | | | | — | |
| | | | | | | | |
Total derivative assets and liabilities in the Statements of Assets and Liabilities | | $ | 193,446 | | | $ | 855,306 | |
| | | | | | | | |
Derivatives not subject to a Master Netting Agreement or similar agreement (“MNA”) | | | — | | | | (114,155 | ) |
| | | | | | | | |
Total derivative assets and liabilities subject to an MNA | | $ | 193,446 | | | $ | 741,151 | |
| | | | | | | | | | | | | | |
| | (a) | Includes unrealized appreciation (depreciation) on OTC swaps and swap premiums (paid/received) in the Statements of Assets and Liabilities. | |
The following table presents the Fund’s derivative assets (and liabilities) by counterparty net of amounts available for offset under an MNA and net of the related collateral received (and pledged) by the Fund:
| | | | | | | | | | | | | | | | | | | | |
| Counterparty | | Derivative
Assets
Subject to
an MNA by
Counterparty | | | Derivatives
Available
for Offset (a) | | | Non-cash
Collateral
Received | | | Cash
Collateral Received (b) | | | Net Amount of Derivative Assets | |
HSBC Bank USA N.A. | | $ | 17,971 | | | $ | (17,971 | ) | | $ | — | | | $ | — | | | $ | — | |
JPMorgan Chase Bank N.A. | | | 175,475 | | | | (84,894 | ) | | | — | | | | (90,581 | ) | | | — | |
| | | | | | | | | | | | | | | | | | | | |
| | $ | 193,446 | | | $ | (102,865 | ) | | $ | — | | | $ | (90,581 | ) | | $ | — | |
| | | | | | | | | | | | | | | | | | | | |
| | | | |
| SCHEDULES OF INVESTMENTS | | | 13 | |
| | |
Schedule of Investments (continued) October 31, 2019 | | BlackRock Emerging Markets Fund, Inc. |
| | | | | | | | | | | | | | | | | | | | |
| Counterparty | | Derivative
Liabilities
Subject to
an MNA by
Counterparty | | | Derivatives
Available
for Offset (a) | | | Non-cash
Collateral
Pledged | | | Cash
Collateral
Pledged | | | Net Amount
of Derivative
Liabilities (c) | |
HSBC Bank USA N.A. | | $ | 656,257 | | | $ | (17,971 | ) | | $ | — | | | $ | (420,000 | ) | | $ | 218,286 | |
JPMorgan Chase Bank N.A. | | | 84,894 | | | | (84,894 | ) | | | — | | | | — | | | | — | |
| | | | | | | | | | | | | | | | | | | | |
| | $ | 741,151 | | | $ | (102,865 | ) | | $ | — | | | $ | (420,000 | ) | | $ | 218,286 | |
| | | | | | | | | | | | | | | | | | | | |
| | (a) | The amount of derivatives available for offset is limited to the amount of derivative asset and/or liabilities that are subject to an MNA. | |
| | (b) | Excess of collateral received from the individual counterparty is not shown for financial reporting purposes. | |
| | (c) | Net amount represents the net amount payable due to counterparty in the event of default. | |
Fair Value Hierarchy as of Period End
Various inputs are used in determining the fair value of investments. For information about the Fund’s policy regarding valuation of investments, refer to the Notes to Financial Statements.
The following tables summarize the Fund’s investments categorized in the disclosure hierarchy:
| | | | | | | | | | | | | | | | |
| | | Level 1 | | | Level 2 | | | Level 3 | | | Total | |
Assets: | | | | | | | | | | | | | | | | |
Investments: | | | | | | | | | | | | | | | | |
Common Stocks: | | | | | | | | | | | | | | | | |
Brazil | | $ | 63,014,743 | | | $ | — | | | $ | — | | | $ | 63,014,743 | |
China | | | 54,305,931 | | | | 99,092,874 | | | | — | | | | 153,398,805 | |
Egypt | | | 8,324,251 | | | | — | | | | — | | | | 8,324,251 | |
Hong Kong | | | — | | | | 7,935,507 | | | | — | | | | 7,935,507 | |
India | | | 7,923,951 | | | | 40,458,440 | | | | — | | | | 48,382,391 | |
Indonesia | | | — | | | | 20,256,896 | | | | — | | | | 20,256,896 | |
Israel | | | — | | | | 2,451,832 | | | | — | | | | 2,451,832 | |
Italy | | | — | | | | 5,662,167 | | | | — | | | | 5,662,167 | |
Mexico | | | 37,195,569 | | | | — | | | | — | | | | 37,195,569 | |
Panama | | | 8,982,218 | | | | — | | | | — | | | | 8,982,218 | |
Philippines | | | — | | | | 11,790,263 | | | | — | | | | 11,790,263 | |
Poland | | | — | | | | 10,108,086 | | | | — | | | | 10,108,086 | |
Russia | | | 8,236,873 | | | | 23,618,016 | | | | — | | | | 31,854,889 | |
South Korea | | | 6,706,777 | | | | 66,231,029 | | | | — | | | | 72,937,806 | |
Taiwan | | | 9,186,537 | | | | 41,513,404 | | | | — | | | | 50,699,941 | |
Thailand | | | — | | | | 16,877,337 | | | | — | | | | 16,877,337 | |
Turkey | | | — | | | | 10,985,650 | | | | — | | | | 10,985,650 | |
United Arab Emirates | | | — | | | | 4,895,582 | | | | — | | | | 4,895,582 | |
United Kingdom | | | — | | | | 8,497,808 | | | | — | | | | 8,497,808 | |
Participation Notes | | | — | | | | 5,722 | | | | — | | | | 5,722 | |
Preferred Stocks(a) | | | 7,457,864 | | | | 8,040,730 | | | | 106 | | | | 15,498,700 | |
Short-Term Securities | | | 60,286,005 | | | | — | | | | — | | | | 60,286,005 | |
| | | | | | | | | | | | | | | | |
Subtotal | | $ | 271,620,719 | | | $ | 378,421,343 | | | $ | 106 | | | $ | 650,042,168 | |
| | | | | | | | | | | | | | | | |
Investments Valued at NAV(b) | | | | | | | | | | | | | | | 202,911 | |
| | | | | | | | | | | | | | | | |
Total Investments | | | | | | | | | | | | | | $ | 650,245,079 | |
| | | | | | | | | | | | | | | | |
Derivative Financial Instruments(c) | |
Assets: | |
Equity contracts | | $ | 347,603 | | | $ | 175,475 | | | $ | — | | | $ | 523,078 | |
Forward foreign currency exchange contracts | | | — | | | | 17,971 | | | | — | | | | 17,971 | |
Liabilities: | |
Forward foreign currency exchange contracts | | | — | | | | (741,151 | ) | | | — | | | | (741,151 | ) |
| | | | | | | | | | | | | | | | |
| | $ | 347,603 | | | $ | (547,705 | ) | | $ | — | | | $ | (200,102 | ) |
| | | | | | | | | | | | | | | | |
| | (a) | See above Schedule of Investments for values in each country. | |
| | (b) | Certain investments of the Fund were fair valued using NAV per share as no quoted market value is available and therefore have been excluded from the fair value hierarchy. | |
| | (c) | Derivative financial instruments are swaps, futures contracts and forward foreign currency exchange contracts. Swaps, futures contracts and forward foreign currency exchange contracts are valued at the unrealized appreciation (depreciation) on the instrument. | |
See notes to financial statements.
| | |
| 14 | | 2019 BLACKROCK ANNUAL REPORTTO SHAREHOLDERS |
| | |
Schedule of Investments October 31, 2019 | | BlackRock Latin America Fund, Inc. (Percentages shown are based on Net Assets) |
| | | | | | | | |
| Security | |
Shares | | | Value | |
| |
Common Stocks — 93.5% | | | | | |
| | |
| Argentina — 1.2% | | | | | | |
Banco Macro SA — ADR | | | 5,472 | | | $ | 125,309 | |
MercadoLibre, Inc.(a) | | | 2,010 | | | | 1,048,255 | |
YPF SA, ADR | | | 71,433 | | | | 668,613 | |
| | | | | | | | |
| | | | | | | 1,842,177 | |
| | |
| Brazil — 65.4% | | | | | | |
AMBEV SA — ADR | | | 1,042,489 | | | | 4,493,128 | |
Arco Platform Ltd., Class A(a) | | | 37,761 | | | | 1,567,081 | |
Azul SA — ADR(a)(b) | | | 40,105 | | | | 1,563,293 | |
B2W Cia Digital(a) | | | 182,860 | | | | 2,316,242 | |
B3 SA — Brasil Bolsa Balcao | | | 533,390 | | | | 6,434,462 | |
Banco Bradesco SA — ADR | | | 1,059,879 | | | | 9,284,540 | |
Banco do Brasil SA | | | 457,644 | | | | 5,494,467 | |
BB Seguridade Participacoes SA | | | 285,900 | | | | 2,421,649 | |
BRF SA(a) | | | 75,229 | | | | 666,097 | |
C&A Modas Ltda(a) | | | 329,683 | | | | 1,395,840 | |
Cyrela Brazil Realty SA Empreendimentos e Participacoes | | | 124,644 | | | | 836,969 | |
Energisa SA | | | 196,895 | | | | 2,352,626 | |
Hapvida Participacoes e Investimentos SA(c) | | | 54,177 | | | | 760,545 | |
Iochpe-Maxion SA | | | 224,703 | | | | 977,140 | |
Itau Unibanco Holding SA, Preference Shares — ADR | | | 1,405,245 | | | | 12,689,362 | |
Light SA | | | 254,100 | | | | 1,260,838 | |
Linx SA | | | 172,130 | | | | 1,488,889 | |
Natura Cosmeticos SA | | | 171,320 | | | | 1,331,089 | |
Neoenergia SA | | | 419,784 | | | | 2,193,909 | |
Notre Dame Intermedica Participacoes SA | | | 146,800 | | | | 2,196,235 | |
Oi SA(a) | | | 1,252,034 | | | | 296,580 | |
Petrobras Distribuidora SA | | | 195,987 | | | | 1,382,000 | |
Petroleo Brasileiro SA — ADR | | | 983,390 | | | | 15,338,501 | |
Qualicorp Consultoria e Corretora de Seguros SA | | | 268,830 | | | | 2,138,306 | |
Rumo SA(a) | | | 666,623 | | | | 3,789,803 | |
Sul America SA | | | 206,206 | | | | 2,482,904 | |
Suzano SA | | | 304,575 | | | | 2,478,825 | |
Vale SA — ADR(a) | | | 585,081 | | | | 6,868,851 | |
Via Varejo SA(a) | | | 514,950 | | | | 952,731 | |
| | | | | | | | |
| | | | | | | 97,452,902 | |
| | |
| Chile — 1.1% | | | | | | |
Enersis Chile SA | | | 19,595,013 | | | | 1,611,515 | |
| | | | | | | | |
| | |
| Colombia — 1.2% | | | | | | |
Ecopetrol SA, — ADR | | | 96,500 | | | | 1,761,125 | |
| | | | | | | | |
| | |
| Mexico — 22.7% | | | | | | |
America Movil SAB de CV, Class L — ADR | | | 429,557 | | | | 6,791,296 | |
Arca Continental SAB de CV | | | 369,964 | | | | 2,066,906 | |
Cemex SAB de CV — ADR(b) | | | 535,490 | | | | 2,018,797 | |
Corp. Inmobiliaria Vesta SAB de CV | | | 793,417 | | | | 1,323,565 | |
Fibra Uno Administracion SA de CV | | | 1,441,800 | | | | 2,190,076 | |
Fomento Economico Mexicano SAB de CV — ADR | | | 68,365 | | | | 6,085,852 | |
Grupo Aeroportuario del Pacifico SAB de CV, ADR | | | 19,903 | | | | 2,080,063 | |
Grupo Aeroportuario del Pacifico SAB de CV, Class B | | | 50,344 | | | | 527,818 | |
Grupo Cementos de Chihuahua SAB de CV | | | 147,300 | | | | 823,391 | |
Grupo Financiero Banorte SAB de CV, Series O | | | 914,173 | | | | 4,989,898 | |
Orbia Advance Corp. SAB de CV | | | 109,400 | | | | 236,072 | |
Wal-Mart de Mexico SAB de CV | | | 1,568,800 | | | | 4,708,072 | |
| | | | | | | | |
| | | | | | | 33,841,806 | |
| | |
| Panama — 0.6% | | | | | | |
Copa Holdings SA, Class A | | | 9,604 | | | | 977,111 | |
| | | | | | | | |
| | |
| Peru — 1.3% | | | | | | |
Southern Copper Corp. | | | 53,200 | | | | 1,892,856 | |
| | | | | | | | |
Total Common Stocks — 93.5%
(Cost — $101,757,784) | | | | | | | 139,379,492 | |
| | | | | | | | |
| | | | | | | | |
| | | Par
(000) | | | Value | |
| | |
Corporate Bonds — 0.1% | | | | | | | | |
| | |
| Brazil — 0.1% | | | | | | |
Klabin SA: | | | | | | | | |
7.25%, 06/15/20 | | BRL | 22 | | | $ | 87,894 | |
2.50%, 06/15/22 | | | 10 | | | | 40,567 | |
Lupatech SA, 6.50%, 04/15/20(a)(d)(e) | | | 2,128 | | | | — | |
| | | | | | | | |
Total Corporate Bonds — 0.1%
(Cost — $1,291,907) | | | | | | | 128,461 | |
| | | | | | | | |
| | |
| | | Shares | | | | |
|
| Preferred Stocks — 4.7% | |
|
| Brazil — 4.7% | |
Cia Brasileira de Distribuicao, Preference Shares | | | 178,081 | | | | 3,685,062 | |
Cia Energetica de Minas Gerais, Preference Shares | | | 550,553 | | | | 1,873,843 | |
Gol Linhas Aereas Inteligentes SA, Preference Shares(a) | | | 152,997 | | | | 1,396,258 | |
| | | | | | | | |
Total Preferred Stocks — 4.7%
(Cost — $5,965,993) | | | | 6,955,163 | |
| | | | | | | | |
| | |
Warrants — 0.0% | | | | | | | | |
| | |
Brazil — 0.0% | | | | | | | | |
Klabin SA (Expires 06/15/20)(d) | | | 22,282 | | | | — | |
| | | | | | | | |
Total Warrants — 0.0%
(Cost — $ —) | | | | — | |
| | | | | | | | |
Total Long-Term Investments — 98.3%
(Cost — $109,015,684) | | | | 146,463,116 | |
| | | | | | | | |
|
Short-Term Securities — 3.9% | |
BlackRock Liquidity Funds,T-Fund, Institutional Class, 1.70%(f)(h) | | | 2,150,514 | | | | 2,150,514 | |
SL Liquidity Series, LLC, Money Market Series,
2.02%(f)(g)(h) | | | 3,691,652 | | | | 3,692,390 | |
| | | | | | | | |
Total Short-Term Securities — 3.9%
(Cost — $5,842,428) | | | | 5,842,904 | |
| | | | | | | | |
Total Investments — 102.2%
(Cost — $114,858,112) | | | | 152,306,020 | |
Liabilities in Excess of Other Assets — (2.2)% | | | | (3,341,405 | ) |
| | | | | | | | |
Net Assets — 100.0% | | | $ | 148,964,615 | |
| | | | | | | | |
| (a) | Non-income producing security. |
| (b) | Security, or a portion of the security, is on loan. |
| (c) | Security exempt from registration pursuant to Rule 144A under the Securities Act of 1933, as amended. These securities may be resold in transactions exempt from registration to qualified institutional investors. |
| (d) | Security is valued using significant unobservable inputs and is classified as Level 3 in the fair value hierarchy. |
| (e) | Issuer filed for bankruptcy and/or is in default. |
| (f) | Annualized7-day yield as of period end. |
| (g) | Security was purchased with the cash collateral from loaned securities. |
| | | | |
| SCHEDULES OF INVESTMENTS | | | 15 | |
| | |
Schedule of Investments (continued) October 31, 2019 | | BlackRock Latin America Fund, Inc. |
| (h) | During the year ended October 31, 2019, investments in issuers considered to be an affiliate/affiliates of the Fund for purposes of Section 2(a)(3) of the Investment Company Act of 1940, as amended, were as follows: |
| | | | | | | | | | | | | | | | | | | | | | | | | | | | |
| Affiliate | | Shares
Held at
10/31/18 | | | Net
Activity | | | Shares
Held at
10/31/19 | | | Value at
10/31/19 | | | Income | | | Net
Realized
Gain (Loss) (a) | | | Change in
Unrealized
Appreciation
(Depreciation) | |
BlackRock Liquidity Funds,T-Fund, Institutional Class | | | 3,756,487 | | | | (1,605,973 | ) | | | 2,150,514 | | | $ | 2,150,514 | | | $ | 36,290 | | | $ | — | | | $ | — | |
SL Liquidity Series, LLC, Money Market Series | | | 15,049,666 | | | | (11,358,014 | ) | | | 3,691,652 | | | | 3,692,390 | | | | 19,403 | (b) | | | (709 | ) | | | 1,217 | |
| | | | | | | | | | | | | | | | | | | | | | | | | | | | |
| | | $ | 5,842,904 | | | $ | 55,693 | | | $ | (709 | ) | | $ | 1,217 | |
| | | | | | | | | | | | | | | | | | | | | | | | | | | | |
| | (a) | Includes net capital gain distributions, if applicable. | |
| | (b) | Represents securities lending income earned from the reinvestment of cash collateral from loaned securities, net of fees and collateral investment expenses, and other payments to and from borrowers of securities. | |
Fair Value Hierarchy as of Period End
Various inputs are used in determining the fair value of investments. For information about the Fund’s policy regarding valuation of investments, refer to the Notes to Financial Statements.
The following table summarizes the Fund’s investments categorized in the disclosure hierarchy:
| | | | | | | | | | | | | | | | |
| | | Level 1 | | | Level 2 | | | Level 3 | | | Total | |
Assets: | | | | | | | | | | | | | | | | |
Investments: | | | | | | | | | | | | | | | | |
Common Stocks(a) | | $ | 139,379,492 | | | $ | — | | | $ | — | | | $ | 139,379,492 | |
Corporate Bonds(a) | | | — | | | | 128,461 | | | | — | | | | 128,461 | |
Preferred Stocks(a) | | | 6,955,163 | | | | — | | | | — | | | | 6,955,163 | |
Short-Term Securities | | | 2,150,514 | | | | — | | | | — | | | | 2,150,514 | |
| | | | | | | | | | | | | | | | |
Subtotal | | $ | 148,485,169 | | | $ | 128,461 | | | $ | — | | | $ | 148,613,630 | |
| | | | | | | | | | | | | | | | |
Investments Valued at NAV(b) | | | | | | | | | | | | | | | 3,692,390 | |
| | | | | | | | | | | | | | | | |
Total Investments | | | | | | | | | | | | | | $ | 152,306,020 | |
| | | | | | | | | | | | | | | | |
| | (a) | See above Schedule of Investments for values in each country. | |
| | (b) | Certain investments of the Fund were fair valued using NAV per share as no quoted market value is available and therefore have been excluded from the fair value hierarchy. | |
See notes to financial statements.
| | |
| 16 | | 2019 BLACKROCK ANNUAL REPORTTO SHAREHOLDERS |
Statements of Assets and Liabilities
October 31, 2019
| | | | | | | | |
| | | BlackRock Emerging
Markets Fund, Inc. | | | BlackRock Latin
America Fund, Inc. | |
| | |
ASSETS | | | | | | | | |
Investments at value — unaffiliated(a)(b) | | $ | 589,756,163 | | | $ | 146,463,116 | |
Investments at value — affiliated(c) | | | 60,488,916 | | | | 5,842,904 | |
Cash pledged: | | | | | | | | |
Collateral — OTC derivatives | | | 420,000 | | | | — | |
Futures contracts | | | 835,000 | | | | — | |
Foreign currency at value(d) | | | 173,627 | | | | 65,370 | |
Receivables: | | | | | | | | |
Investments sold | | | 8,928,739 | | | | 911,502 | |
Securities lending income — affiliated | | | 6,275 | | | | 622 | |
Swaps | | | 591,343 | | | | — | |
Capital shares sold | | | 2,148,085 | | | | 5,684 | |
Dividends — affiliated | | | 104,913 | | | | 2,667 | |
Dividends — unaffiliated | | | 599,909 | | | | 375,716 | |
Interest — unaffiliated | | | — | | | | 1,512 | |
Unrealized appreciation on: | | | | | | | | |
Forward foreign currency exchange contracts | | | 17,971 | | | | — | |
OTC Swaps | | | 175,475 | | | | — | |
Prepaid expenses | | | 55,222 | | | | 32,412 | |
| | | | | | | | |
Total assets | | | 664,301,638 | | | | 153,701,505 | |
| | | | | | | | |
|
LIABILITIES | |
Cash collateral on securities loaned at value | | | 201,274 | | | | 3,692,951 | |
Bank overdraft | | | — | | | | 14,979 | |
Cash received as collateral for OTC derivatives | | | 780,000 | | | | — | |
Payables: | |
Investments purchased | | | 6,411,740 | | | | 549,757 | |
Capital shares redeemed | | | 1,400,846 | | | | 131,088 | |
Investment advisory fees | | | 373,571 | | | | 123,421 | |
Directors’ and Officer’s fees | | | 1,267 | | | | 3,231 | |
Other accrued expenses | | | 498,403 | | | | 196,782 | |
Other affiliates | | | 1,009 | | | | 585 | |
Service and distribution fees | | | 68,159 | | | | 24,096 | |
Variation margin on futures contracts | | | 114,155 | | | | — | |
Unrealized depreciation on forward foreign currency exchange contracts | | | 741,151 | | | | — | |
| | | | | | | | |
Total liabilities | | | 10,591,575 | | | | 4,736,890 | |
| | | | | | | | |
| | |
NET ASSETS | | $ | 653,710,063 | | | $ | 148,964,615 | |
| | | | | | | | |
|
NET ASSETS CONSIST OF | |
Paid-in capital | | $ | 594,887,475 | | | $ | 128,000,879 | |
Accumulated earnings | | | 58,822,588 | | | | 20,963,736 | |
| | | | | | | | |
NET ASSETS | | $ | 653,710,063 | | | $ | 148,964,615 | |
| | | | | | | | |
| | |
(a) Investments at cost — unaffiliated | | $ | 526,589,679 | | | $ | 109,015,684 | |
(b) Securities loaned at value | | $ | 191,608 | | | $ | 3,419,801 | |
(c) Investments at cost — affiliated | | $ | 60,488,862 | | | $ | 5,842,428 | |
(d) Foreign currency at cost | | $ | 173,690 | | | $ | 65,565 | |
See notes to financial statements.
Statements of Assets and Liabilities (continued)
October 31, 2019
| | | | | | | | |
| | | BlackRock Emerging
Markets Fund, Inc. | | | BlackRock Latin
America Fund, Inc. | |
| | |
NET ASSET VALUE | | | | | | | | |
| | |
| Institutional | | | | | | |
Net assets | | $ | 308,718,542 | | | $ | 52,123,389 | |
| | | | | | | | |
Shares outstanding, 100 million shares authorized | | | 12,593,163 | | | | 994,116 | |
| | | | | | | | |
Net asset value | | $ | 24.51 | | | $ | 52.43 | |
| | | | | | | | |
Par value | | $ | 0.10 | | | $ | 0.10 | |
| | | | | | | | |
|
| Investor A | |
Net assets | | $ | 204,060,501 | | | $ | 89,685,854 | |
| | | | | | | | |
Shares outstanding, 100 million shares authorized | | | 8,640,913 | | | | 1,734,874 | |
| | | | | | | | |
Net asset value | | $ | 23.62 | | | $ | 51.70 | |
| | | | | | | | |
Par value | | $ | 0.10 | | | $ | 0.10 | |
| | | | | | | | |
|
| Investor C | |
Net assets | | $ | 31,362,388 | | | $ | 6,396,887 | |
| | | | | | | | |
Shares outstanding, 100 million shares authorized | | | 1,581,835 | | | | 136,259 | |
| | | | | | | | |
Net asset value | | $ | 19.83 | | | $ | 46.95 | |
| | | | | | | | |
Par value | | $ | 0.10 | | | $ | 0.10 | |
| | | | | | | | |
|
| Class K | |
Net assets | | $ | 109,568,632 | | | $ | 758,485 | |
| | | | | | | | |
Shares outstanding, 2 billion shares authorized | | | 4,468,268 | | | | 14,466 | |
| | | | | | | | |
Net asset value | | $ | 24.52 | | | $ | 52.43 | |
| | | | | | | | |
Par value per share | | $ | 0.10 | | | $ | 0.10 | |
| | | | | | | | |
See notes to financial statements.
| | |
| 18 | | 2019 BLACKROCK ANNUAL REPORTTO SHAREHOLDERS |
Statements of Operations
Year Ended October 31, 2019
| | | | | | | | |
| | | BlackRock Emerging
Markets Fund, Inc. | | | BlackRock Latin America Fund, Inc. | |
|
INVESTMENT INCOME | |
Dividends — affiliated | | $ | 676,749 | | | $ | 36,290 | |
Dividends — unaffiliated | | | 13,544,742 | | | | 5,413,185 | |
Interest — unaffiliated | | | 14,947 | | | | 30,260 | |
Securities lending income — affiliated — net | | | 149,184 | | | | 19,403 | |
Foreign taxes withheld | | | (1,282,359 | ) | | | (457,936 | ) |
| | | | | | | | |
Total investment income | | | 13,103,263 | | | | 5,041,202 | |
| | | | | | | | |
|
EXPENSES | |
Investment advisory | | | 4,320,990 | | | | 1,593,554 | |
Service and distribution — class specific | | | 805,726 | | | | 313,934 | |
Transfer agent — class specific | | | 762,181 | | | | 221,203 | |
Custodian | | | 184,348 | | | | 44,177 | |
Professional | | | 117,354 | | | | 85,099 | |
Registration | | | 99,520 | | | | 70,897 | |
Accounting services | | | 94,283 | | | | 45,939 | |
Printing | | | 34,920 | | | | 27,183 | |
Board realignment and consolidation | | | 15,473 | | | | 4,873 | |
Directors and Officer | | | 13,726 | | | | 12,998 | |
Offering | | | 8,064 | | | | 7,804 | |
Miscellaneous | | | 26,819 | | | | 18,921 | |
| | | | | | | | |
Total expenses excluding interest expense and fees | | | 6,483,404 | | | | 2,446,582 | |
| | | | | | | | |
Total expenses | | | 6,483,404 | | | | 2,446,582 | |
Less: | |
Fees waived and/or reimbursed by the Manager | | | (383,357 | ) | | | (4,008 | ) |
Fees paid indirectly | | | (318 | ) | | | (301 | ) |
Transfer agent fees waived and/or reimbursed | | | (550,119 | ) | | | — | |
| | | | | | | | |
Total expenses after fees waived and/or reimbursed and paid indirectly | | | 5,549,610 | | | | 2,442,273 | |
| | | | | | | | |
Net investment income | | | 7,553,653 | | | | 2,598,929 | |
| | | | | | | | |
|
REALIZED AND UNREALIZED GAIN (LOSS) | |
Net realized gain (loss) from: | |
Investments — unaffiliated | | | (6,491,435 | ) | | | 4,828,508 | |
Investments — affiliated | | | 1,681 | | | | (709 | ) |
Futures contracts | | | 409,574 | | | | — | |
Forward foreign currency exchange contracts | | | 910,915 | | | | — | |
Foreign currency transactions | | | (155,905 | ) | | | (167,689 | ) |
Swaps | | | 970,569 | | | | — | |
| | | | | | | | |
| | | (4,354,601 | ) | | | 4,660,110 | |
| | | | | | | | |
Net change in unrealized appreciation (depreciation) on: | | | | | | | | |
Investments — unaffiliated | | | 71,104,819 | | | | 5,382,692 | |
Investments — affiliated | | | 278 | | | | 1,217 | |
Futures contracts | | | 977,371 | | | | — | |
Forward foreign currency exchange contracts | | | (723,180 | ) | | | — | |
Foreign currency translations | | | 1,612 | | | | 6,711 | |
Swaps | | | 175,475 | | | | — | |
| | | | | | | | |
| | | 71,536,375 | | | | 5,390,620 | |
| | | | | | | | |
Net realized and unrealized gain | | | 67,181,774 | | | | 10,050,730 | |
| | | | | | | | |
NET INCREASE IN NET ASSETS RESULTING FROM OPERATIONS | | $ | 74,735,427 | | | $ | 12,649,659 | |
| | | | | | | | |
See notes to financial statements.
Statements of Changes in Net Assets
| | | | | | | | |
| | | BlackRock Emerging
Markets Fund, Inc. | |
| | | Year Ended October 31, | |
| | | 2019 | | | 2018 | |
|
INCREASE (DECREASE) IN NET ASSETS | |
|
OPERATIONS | |
Net investment income | | $ | 7,553,653 | | | $ | 2,364,389 | |
Net realized gain (loss) | | | (4,354,601 | ) | | | 16,252,435 | |
Net change in unrealized appreciation (depreciation) | | | 71,536,375 | | | | (46,744,083 | ) |
| | | | | | | | |
Net increase (decrease) in net assets resulting from operations | | | 74,735,427 | | | | (28,127,259 | ) |
| | | | | | | | |
|
DISTRIBUTIONS TO SHAREHOLDERS(a) | |
Institutional | | | (1,031,885 | ) | | | (385,038 | ) |
Investor A | | | (1,095,473 | ) | | | (354,409 | ) |
Class K | | | (15,478 | ) | | | — | |
| | | | | | | | |
Decrease in net assets resulting from distributions to shareholders | | | (2,142,836 | ) | | | (739,447 | ) |
| | | | | | | | |
|
CAPITAL SHARE TRANSACTIONS | |
Net increase (decrease) in net assets derived from capital share transactions | | | 281,188,608 | | | | (12,001,228 | ) |
| | | | | | | | |
| | |
NET ASSETS | | | | | | | | |
Total increase (decrease) in net assets | | | 353,781,199 | | | | (40,867,934 | ) |
Beginning of year | | | 299,928,864 | | | | 340,796,798 | |
| | | | | | | | |
End of year | | $ | 653,710,063 | | | $ | 299,928,864 | |
| | | | | | | | |
| (a) | Distributions for annual periods determined in accordance with U.S. federal income tax regulations. |
See notes to financial statements.
| | |
| 20 | | 2019 BLACKROCK ANNUAL REPORTTO SHAREHOLDERS |
Statements of Changes in Net Assets (continued)
| | | | | | | | |
| | | BlackRock Latin America Fund, Inc. | |
| | | Year Ended October 31, | |
| | | 2019 | | | 2018 | |
| | |
INCREASE (DECREASE) IN NET ASSETS | | | | | | | | |
| | |
OPERATIONS | | | | | | | | |
Net investment income | | $ | 2,598,929 | | | $ | 1,525,576 | |
Net realized gain | | | 4,660,110 | | | | 6,474,108 | |
Net change in unrealized appreciation (depreciation) | | | 5,390,620 | | | | (9,147,748 | ) |
| | | | | | | | |
Net increase (decrease) in net assets resulting from operations | | | 12,649,659 | | | | (1,148,064 | ) |
| | | | | | | | |
|
DISTRIBUTIONS(a) | |
Institutional | | | (684,146 | ) | | | (746,930 | ) |
Investor A | | | (765,993 | ) | | | (873,457 | ) |
Class K | | | (9,377 | ) | | | — | |
| | | | | | | | |
Decrease in net assets resulting from distributions to shareholders | | | (1,459,516 | ) | | | (1,620,387 | ) |
| | | | | | | | |
|
CAPITAL SHARE TRANSACTIONS | |
Net decrease in net assets derived from capital share transactions | | | (25,171,244 | ) | | | (23,052,337 | ) |
| | | | | | | | |
|
NET ASSETS | |
Total decrease in net assets | | | (13,981,101 | ) | | | (25,820,788 | ) |
Beginning of year | | | 162,945,716 | | | | 188,766,504 | |
| | | | | | | | |
End of year | | $ | 148,964,615 | | | $ | 162,945,716 | |
| | | | | | | | |
| (a) | Distributions for annual periods determined in accordance with U.S. federal income tax regulations. |
See notes to financial statements.
Financial Highlights
(For a share outstanding throughout each period)
| | | | | | | | | | | | | | | | | | | | |
| | | BlackRock Emerging Markets Fund, Inc. | |
| |
| | | Institutional | |
| |
| | | Year Ended October 31, | |
| | | 2019 | | | 2018 | | | 2017 | | | 2016 | | | 2015 | |
| | | | | |
Net asset value, beginning of year | | $ | 20.73 | | | $ | 22.74 | | | $ | 18.32 | | | $ | 16.51 | | | $ | 20.56 | |
| | | | | | | | | | | | | | | | | | | | |
Net investment income(a) | | | 0.40 | | | | 0.24 | | | | 0.14 | | | | 0.16 | | | | 0.19 | |
Net realized and unrealized gain (loss) | | | 3.58 | | | | (2.14 | ) | | | 4.58 | | | | 1.86 | | | | (4.13 | ) |
| | | | | | | | | | | | | | | | | | | | |
Net increase (decrease) from investment operations | | | 3.98 | | | | (1.90 | ) | | | 4.72 | | | | 2.02 | | | | (3.94 | ) |
| | | | | | | | | | | | | | | | | | | | |
Distributions from net investment income(b) | | | (0.20 | ) | | | (0.11 | ) | | | (0.30 | ) | | | (0.21 | ) | | | (0.11 | ) |
| | | | | | | | | | | | | | | | | | | | |
| | | | | |
Net asset value, end of year | | $ | 24.51 | | | $ | 20.73 | | | $ | 22.74 | | | $ | 18.32 | | | $ | 16.51 | |
| | | | | | | | | | | | | | | | | | | | |
| | | | | |
Total Return(c) | | | | | | | | | | | | | | | | | | | | |
Based on net asset value | | | 19.39 | % | | | (8.39 | )% | | | 26.35 | % | | | 12.47 | % | | | (19.24 | )% |
| | | | | | | | | | | | | | | | | | | | |
| | | | | |
Ratios to Average Net Assets | | | | | | | | | | | | | | | | | | | | |
Total expenses | | | 1.14 | %(d) | | | 1.31 | %(d) | | | 1.34 | % | | | 1.20 | % | | | 1.17 | %(d) |
| | | | | | | | | | | | | | | | | | | | |
Total expenses after fees waived and/or reimbursed and paid indirectly | | | 0.97 | %(d) | | | 1.11 | %(d) | | | 1.34 | % | | | 1.20 | % | | | 1.17 | %(d) |
| | | | | | | | | | | | | | | | | | | | |
Net investment income | | | 1.73 | %(d) | | | 1.05 | %(d) | | | 0.72 | % | | | 0.97 | % | | | 0.98 | %(d) |
| | | | | | | | | | | | | | | | | | | | |
| | | | | |
Supplemental Data | | | | | | | | | | | | | | | | | | | | |
Net assets, end of year (000) | | $ | 308,719 | | | $ | 98,990 | | | $ | 77,115 | | | $ | 120,939 | | | $ | 169,509 | |
| | | | | | | | | | | | | | | | | | | | |
Portfolio turnover rate | | | 119 | % | | | 121 | % | | | 126 | % | | | 92 | % | | | 103 | % |
| | | | | | | | | | | | | | | | | | | | |
| (a) | Based on average shares outstanding. |
| (b) | Distributions for annual periods determined in accordance with U.S. federal income tax regulations. |
| (c) | Where applicable, assumes the reinvestment of distributions. |
| (d) | Excludes expenses incurred indirectly as a result of investments in underlying funds as follows: |
| | | | | | | | | | | | | | | | | | | | | | | | | | | | | | | | | | | | | | | | |
| | | Year Ended October 31, | |
| | | 2019 | | | | | | 2018 | | | | | | 2017 | | | | | | 2016 | | | | | | 2015 | | | | |
Investments in underlying funds | | | 0.01 | % | | | | | | | 0.01 | % | | | | | | | — | % | | | | | | | — | % | | | | | | | 0.01 | % | | | | |
| | | | | | | | | | | | | | | | | | | | | | | | | | | | | | | | | | | | | | | | |
See notes to financial statements.
| | |
| 22 | | 2019 BLACKROCK ANNUAL REPORTTO SHAREHOLDERS |
Financial Highlights (continued)
(For a share outstanding throughout each period)
| | | | | | | | | | | | | | | | | | | | |
| | | BlackRock Emerging Markets Fund, Inc. (continued) | |
| |
| | | Investor A | |
| |
| | | Year Ended October 31, | |
| | | 2019 | | | 2018 | | | 2017 | | | 2016 | | | 2015 | |
| | | | | |
Net asset value, beginning of year | | $ | 19.96 | | | $ | 21.88 | | | $ | 17.62 | | | $ | 15.89 | | | $ | 19.81 | |
| | | | | | | | | | | | | | | | | | | | |
Net investment income(a) | | | 0.29 | | | | 0.16 | | | | 0.07 | | | | 0.08 | | | | 0.10 | |
Net realized and unrealized gain (loss) | | | 3.50 | | | | (2.04 | ) | | | 4.42 | | | | 1.79 | | | | (3.99 | ) |
| | | | | | | | | | | | | | | | | | | | |
Net increase (decrease) from investment operations | | | 3.79 | | | | (1.88 | ) | | | 4.49 | | | | 1.87 | | | | (3.89 | ) |
| | | | | | | | | | | | | | | | | | | | |
Distributions from net investment income(b) | | | (0.13 | ) | | | (0.04 | ) | | | (0.23 | ) | | | (0.14 | ) | | | (0.03 | ) |
| | | | | | | | | | | | | | | | | | | | |
| | | | | |
Net asset value, end of year | | $ | 23.62 | | | $ | 19.96 | | | $ | 21.88 | | | $ | 17.62 | | | $ | 15.89 | |
| | | | | | | | | | | | | | | | | | | | |
| | | | | |
Total Return(c) | | | | | | | | | | | | | | | | | | | | |
Based on net asset value | | | 19.11 | % | | | (8.62 | )% | | | 25.95 | % | | | 11.95 | % | | | (19.67 | )% |
| | | | | | | | | | | | | | | | | | | | |
| | | | | |
Ratios to Average Net Assets | | | | | | | | | | | | | | | | | | | | |
Total expenses | | | 1.45 | %(d) | | | 1.60 | %(d) | | | 1.68 | % | | | 1.68 | % | | | 1.62 | %(d) |
| | | | | | | | | | | | | | | | | | | | |
Total expenses after fees waived and/or reimbursed and paid indirectly | | | 1.22 | %(d) | | | 1.40 | %(d) | | | 1.68 | % | | | 1.68 | % | | | 1.62 | %(d) |
| | | | | | | | | | | | | | | | | | | | |
Net investment income | | | 1.31 | %(d) | | | 0.72 | %(d) | | | 0.39 | % | | | 0.51 | % | | | 0.56 | %(d) |
| | | | | | | | | | | | | | | | | | | | |
| | | | | |
Supplemental Data | | | | | | | | | | | | | | | | | | | | |
Net assets, end of year (000) | | $ | 204,061 | | | $ | 164,683 | | | $ | 210,355 | | | $ | 191,205 | | | $ | 193,165 | |
| | | | | | | | | | | | | | | | | | | | |
Portfolio turnover rate | | | 119 | % | | | 121 | % | | | 126 | % | | | 92 | % | | | 103 | % |
| | | | | | | | | | | | | | | | | | | | |
| (a) | Based on average shares outstanding. |
| (b) | Distributions for annual periods determined in accordance with U.S. federal income tax regulations. |
| (c) | Where applicable, excludes the effects of any sales charges and assumes the reinvestment of distributions. |
| (d) | Excludes expenses incurred indirectly as a result of investments in underlying funds as follows: |
| | | | | | | | | | | | | | | | | | | | | | | | | | | | | | | | | | | | | | | | |
| | | Year Ended October 31, | |
| | | 2019 | | | | | | 2018 | | | | | | 2017 | | | | | | 2016 | | | | | | 2015 | | | | |
Investments in underlying funds | | | 0.01 | % | | | | | | | 0.01 | % | | | | | | | — | % | | | | | | | — | % | | | | | | | 0.01 | % | | | | |
| | | | | | | | | | | | | | | | | | | | | | | | | | | | | | | | | | | | | | | | |
See notes to financial statements.
Financial Highlights (continued)
(For a share outstanding throughout each period)
| | | | | | | | | | | | | | | | | | | | |
| | | BlackRock Emerging Markets Fund, Inc. (continued) | |
| |
| | | Investor C | |
| |
| | | Year Ended October 31, | |
| | | 2019 | | | 2018 | | | 2017 | | | 2016 | | | 2015 | |
| | | | | |
Net asset value, beginning of year | | $ | 16.77 | | | $ | 18.50 | | | $ | 14.93 | | | $ | 13.48 | | | $ | 16.91 | |
| | | | | | | | | | | | | | | | | | | | |
Net investment income (loss)(a) | | | 0.09 | | | | (0.02 | ) | | | (0.09 | ) | | | (0.04 | ) | | | (0.04 | ) |
Net realized and unrealized gain (loss) | | | 2.97 | | | | (1.71 | ) | | | 3.76 | | | | 1.53 | | | | (3.39 | ) |
| | | | | | | | | | | | | | | | | | | | |
Net increase (decrease) from investment operations | | | 3.06 | | | | (1.73 | ) | | | 3.67 | | | | 1.49 | | | | (3.43 | ) |
| | | | | | | | | | | | | | | | | | | | |
Distributions from net investment income(b) | | | — | | | | — | | | | (0.10 | ) | | | (0.04 | ) | | | — | |
| | | | | | | | | | | | | | | | | | | | |
| | | | | |
Net asset value, end of year | | $ | 19.83 | | | $ | 16.77 | | | $ | 18.50 | | | $ | 14.93 | | | $ | 13.48 | |
| | | | | | | | | | | | | | | | | | | | |
| | | | | |
Total Return(c) | | | | | | | | | | | | | | | | | | | | |
Based on net asset value | | | 18.25 | % | | | (9.35 | )% | | | 24.84 | % | | | 11.07 | % | | | (20.28 | )% |
| | | | | | | | | | | | | | | | | | | | |
| | | | | |
Ratios to Average Net Assets | | | | | | | | | | | | | | | | | | | | |
Total expenses | | | 2.31 | %(d) | | | 2.41 | %(d) | | | 2.53 | % | | | 2.52 | % | | | 2.44 | %(d) |
| | | | | | | | | | | | | | | | | | | | |
Total expenses after fees waived and/or reimbursed and paid indirectly | | | 1.98 | %(d) | | | 2.18 | %(d) | | | 2.53 | % | | | 2.52 | % | | | 2.44 | %(d) |
| | | | | | | | | | | | | | | | | | | | |
Net investment income (loss) | | | 0.50 | %(d) | | | (0.10 | )%(d) | | | (0.57 | )% | | | (0.33 | )% | | | (0.26 | )%(d) |
| | | | | | | | | | | | | | | | | | | | |
| | | | | |
Supplemental Data | | | | | | | | | | | | | | | | | | | | |
Net assets, end of year (000) | | $ | 31,362 | | | $ | 34,756 | | | $ | 53,327 | | | $ | 99,170 | | | $ | 110,911 | |
| | | | | | | | | | | | | | | | | | | | |
Portfolio turnover rate | | | 119 | % | | | 121 | % | | | 126 | % | | | 92 | % | | | 103 | % |
| | | | | | | | | | | | | | | | | | | | |
| (a) | Based on average shares outstanding. |
| (b) | Distributions for annual periods determined in accordance with U.S. federal income tax regulations. |
| (c) | Where applicable, excludes the effects of any sales charges and assumes the reinvestment of distributions. |
| (d) | Excludes expenses incurred indirectly as a result of investments in underlying funds as follows: |
| | | | | | | | | | | | | | | | | | | | | | | | | | | | | | | | | | | | | | | | |
| | | Year Ended October 31, | |
| | | 2019 | | | | | | 2018 | | | | | | 2017 | | | | | | 2016 | | | | | | 2015 | | | | |
Investments in underlying funds | | | 0.01 | % | | | | | | | 0.01 | % | | | | | | | — | % | | | | | | | — | % | | | | | | | 0.01 | % | | | | |
| | | | | | | | | | | | | | | | | | | | | | | | | | | | | | | | | | | | | | | | |
See notes to financial statements.
| | |
| 24 | | 2019 BLACKROCK ANNUAL REPORTTO SHAREHOLDERS |
Financial Highlights (continued)
(For a share outstanding throughout each period)
| | | | | | | | |
| | | BlackRock Emerging
Markets Fund, Inc.
(continued) | |
| |
| | | Class K | |
| | | Year Ended
October 31, 2019 | | | Period from 01/25/18 (a) to 10/31/18 | |
| | |
Net asset value, beginning of period | | $ | 20.74 | | | $ | 25.97 | |
| | | | | | | | |
Net investment income(b) | | | 0.48 | | | | 0.32 | |
Net realized and unrealized gain (loss) | | | 3.52 | | | | (5.55 | ) |
| | | | | | | | |
Net increase (decrease) from investment operations | | | 4.00 | | | | (5.23 | ) |
| | | | | | | | |
Distributions from net investment income(c) | | | (0.22 | ) | | | — | |
| | | | | | | | |
| | |
Net asset value, end of period | | $ | 24.52 | | | $ | 20.74 | |
| | | | | | | | |
| | |
Total Return(d) | | | | | | | | |
Based on net asset value | | | 19.48 | % | | | (20.14 | )%(e) |
| | | | | | | | |
| | |
Ratios to Average Net Assets(f) | | | | | | | | |
Total expenses | | | 0.98 | % | | | 1.16 | %(g) |
| | | | | | | | |
Total expenses after fees waived and/or reimbursed and paid indirectly | | | 0.92 | % | | | 0.95 | %(g) |
| | | | | | | | |
Net investment income | | | 2.08 | % | | | 1.82 | %(g) |
| | | | | | | | |
| | |
Supplemental Data | | | | | | | | |
Net assets, end of period (000) | | $ | 109,569 | | | $ | 1,500 | |
| | | | | | | | |
Portfolio turnover rate | | | 119 | % | | | 121 | % |
| | | | | | | | |
| (a) | Commencement of operations. |
| (b) | Based on average shares outstanding. |
| (c) | Distributions for annual periods determined in accordance with U.S. federal income tax regulations. |
| (d) | Where applicable, assumes the reinvestment of distributions. |
| (e) | Aggregate total return. |
| (f) | Excludes expenses incurred indirectly as a result of investments in underlying funds as follows: |
| | | | | | | | | | | | | | | | |
| | | Year Ended
10/31/19 | | | | | | Period from 01/25/18 (a) to 10/31/18 | | | | |
Investments in underlying funds | | | 0.01 | % | | | | | | | 0.01 | % | | | | |
| | | | | | | | | | | | | | | | |
See notes to financial statements.
Financial Highlights (continued)
(For a share outstanding throughout each period)
| | | | | | | | | | | | | | | | | | | | |
| | | BlackRock Latin America Fund, Inc | |
| |
| | | Institutional | |
| |
| | | Year Ended October 31, | |
| | | 2019 | | | 2018 | | | 2017 | | | 2016 | | | 2015 | |
| | | | | |
Net asset value, beginning of year | | $ | 48.89 | | | $ | 49.20 | | | $ | 45.22 | | | $ | 34.98 | | | $ | 54.16 | |
| | | | | | | | | | | | | | | | | | | | |
Net investment income(a) | | | 0.94 | | | | 0.56 | | | | 0.40 | | | | 0.56 | | | | 0.49 | |
Net realized and unrealized gain (loss) | | | 3.15 | | | | (0.29 | ) | | | 4.15 | | | | 9.95 | | | | (18.53 | ) |
| | | | | | | | | | | | | | | | | | | | |
Net increase (decrease) from investment operations | | | 4.09 | | | | 0.27 | | | | 4.55 | | | | 10.51 | | | | (18.04 | ) |
| | | | | | | | | | | | | | | | | | | | |
Distributions from net investment income(b) | | | (0.55 | ) | | | (0.58 | ) | | | (0.57 | ) | | | (0.27 | ) | | | (1.14 | ) |
| | | | | | | | | | | | | | | | | | | | |
| | | | | |
Net asset value, end of year | | $ | 52.43 | | | $ | 48.89 | | | $ | 49.20 | | | $ | 45.22 | | | $ | 34.98 | |
| | | | | | | | | | | | | | | | | | | | |
|
Total Return(c) | |
Based on net asset value | | | 8.53 | % | | | 0.58 | % | | | 10.37 | % | | | 30.32 | % | | | (33.77 | )% |
| | | | | | | | | | | | | | | | | | | | |
|
Ratios to Average Net Assets | |
Total expenses | | | 1.30 | % | | | 1.36 | % | | | 1.31 | % | | | 1.33 | % | | | 1.32 | % |
| | | | | | | | | | | | | | | | | | | | |
Total expenses after fees waived and/or reimbursed and paid indirectly | | | 1.30 | % | | | 1.35 | % | | | 1.31 | % | | | 1.33 | % | | | 1.32 | % |
| | | | | | | | | | | | | | | | | | | | |
Net investment income | | | 1.85 | % | | | 1.13 | % | | | 0.88 | % | | | 1.52 | % | | | 1.14 | % |
| | | | | | | | | | | | | | | | | | | | |
|
Supplemental Data | |
Net assets, end of year (000) | | $ | 52,123 | | | $ | 59,535 | | | $ | 64,009 | | | $ | 56,867 | | | $ | 45,472 | |
| | | | | | | | | | | | | | | | | | | | |
Portfolio turnover rate | | | 70 | % | | | 48 | % | | | 56 | % | | | 58 | % | | | 35 | % |
| | | | | | | | | | | | | | | | | | | | |
| (a) | Based on average shares outstanding. |
| (b) | Distributions for annual periods determined in accordance with U.S. federal income tax regulations. |
| (c) | Where applicable, assumes the reinvestment of distributions. |
See notes to financial statements.
| | |
| 26 | | 2019 BLACKROCK ANNUAL REPORTTO SHAREHOLDERS |
Financial Highlights (continued)
(For a share outstanding throughout each period)
| | | | | | | | | | | | | | | | | | | | |
| | | BlackRock Latin America Fund, Inc (continued) | |
| |
| | | Investor A | |
| |
| | | Year Ended October 31, | |
| | | 2019 | | | 2018 | | | 2017 | | | 2016 | | | 2015 | |
| | | | | |
Net asset value, beginning of year | | $ | 48.20 | | | $ | 48.49 | | | $ | 44.57 | | | $ | 34.45 | | | $ | 53.31 | |
| | | | | | | | | | | | | | | | | | | | |
Net investment income(a) | | | 0.78 | | | | 0.40 | | | | 0.26 | | | | 0.42 | | | | 0.35 | |
Net realized and unrealized gain (loss) | | | 3.12 | | | | (0.27 | ) | | | 4.10 | | | | 9.83 | | | | (18.24 | ) |
| | | | | | | | | | | | | | | | | | | | |
Net increase (decrease) from investment operations | | | 3.90 | | | | 0.13 | | | | 4.36 | | | | 10.25 | | | | (17.89 | ) |
| | | | | | | | | | | | | | | | | | | | |
Distributions from net investment income(b) | | | (0.40 | ) | | | (0.42 | ) | | | (0.44 | ) | | | (0.13 | ) | | | (0.97 | ) |
| | | | | | | | | | | | | | | | | | | | |
| | | | | |
Net asset value, end of year | | $ | 51.70 | | | $ | 48.20 | | | $ | 48.49 | | | $ | 44.57 | | | $ | 34.45 | |
| | | | | | | | | | | | | | | | | | | | |
|
Total Return(c) | |
Based on net asset value | | | 8.20 | % | | | 0.29 | % | | | 10.03 | % | | | 29.91 | % | | | (33.96 | )% |
| | | | | | | | | | | | | | | | | | | | |
|
Ratios to Average Net Assets | |
Total expenses | | | 1.60 | % | | | 1.66 | % | | | 1.62 | % | | | 1.65 | % | | | 1.61 | % |
| | | | | | | | | | | | | | | | | | | | |
Total expenses after fees waived and/or reimbursed and paid indirectly | | | 1.60 | % | | | 1.65 | % | | | 1.62 | % | | | 1.65 | % | | | 1.61 | % |
| | | | | | | | | | | | | | | | | | | | |
Net investment income | | | 1.57 | % | | | 0.83 | % | | | 0.58 | % | | | 1.17 | % | | | 0.83 | % |
| | | | | | | | | | | | | | | | | | | | |
|
Supplemental Data | |
Net assets, end of year (000) | | $ | 89,686 | | | $ | 90,613 | | | $ | 107,992 | | | $ | 105,414 | | | $ | 93,494 | |
| | | | | | | | | | | | | | | | | | | | |
Portfolio turnover rate | | | 70 | % | | | 48 | % | | | 56 | % | | | 58 | % | | | 35 | % |
| | | | | | | | | | | | | | | | | | | | |
| (a) | Based on average shares outstanding. |
| (b) | Distributions for annual periods determined in accordance with U.S. federal income tax regulations. |
| (c) | Where applicable, excludes the effects of any sales charges and assumes the reinvestment of distributions. |
See notes to financial statements.
Financial Highlights (continued)
(For a share outstanding throughout each period)
| | | | | | | | | | | | | | | | | | | | |
| | | BlackRock Latin America Fund, Inc (continued) | |
| |
| | | Investor C | |
| |
| | | Year Ended October 31, | |
| | | 2019 | | | 2018 | | | 2017 | | | 2016 | | | 2015 | |
| | | | | |
Net asset value, beginning of year | | $ | 43.75 | | | $ | 43.98 | | | $ | 40.45 | | | $ | 31.41 | | | $ | 48.57 | |
| | | | | | | | | | | | | | | | | | | | |
Net investment income (loss)(a) | | | 0.35 | | | | 0.03 | | | | (0.06 | ) | | | 0.12 | | | | (0.02 | ) |
Net realized and unrealized gain (loss) | | | 2.85 | | | | (0.26 | ) | | | 3.72 | | | | 8.92 | | | | (16.64 | ) |
| | | | | | | | | | | | | | | | | | | | |
Net increase (decrease) from investment operations | | | 3.20 | | | | (0.23 | ) | | | 3.66 | | | | 9.04 | | | | (16.66 | ) |
| | | | | | | | | | | | | | | | | | | | |
Distributions from net investment income(b) | | | — | | | | — | | | | (0.13 | ) | | | — | | | | (0.50 | ) |
| | | | | | | | | | | | | | | | | | | | |
| | | | | |
Net asset value, end of year | | $ | 46.95 | | | $ | 43.75 | | | $ | 43.98 | | | $ | 40.45 | | | $ | 31.41 | |
| | | | | | | | | | | | | | | | | | | | |
|
Total Return(c) | |
Based on net asset value | | | 7.31 | % | | | (0.52 | )% | | | 9.12 | % | | | 28.78 | % | | | (34.53 | )% |
| | | | | | | | | | | | | | | | | | | | |
|
Ratios to Average Net Assets | |
Total expenses | | | 2.42 | % | | | 2.47 | % | | | 2.47 | % | | | 2.51 | % | | | 2.48 | % |
| | | | | | | | | | | | | | | | | | | | |
Total expenses after fees waived and/or reimbursed and paid indirectly | | | 2.42 | % | | | 2.46 | % | | | 2.47 | % | | | 2.51 | % | | | 2.47 | % |
| | | | | | | | | | | | | | | | | | | | |
Net investment income (loss) | | | 0.77 | % | | | 0.06 | % | | | (0.16 | )% | | | 0.37 | % | | | (0.04 | )% |
| | | | | | | | | | | | | | | | | | | | |
|
Supplemental Data | |
Net assets, end of year (000) | | $ | 6,397 | | | $ | 12,014 | | | $ | 16,746 | | | $ | 24,117 | | | $ | 22,787 | |
| | | | | | | | | | | | | | | | | | | | |
Portfolio turnover rate | | | 70 | % | | | 48 | % | | | 56 | % | | | 58 | % | | | 35 | % |
| | | | | | | | | | | | | | | | | | | | |
| (a) | Based on average shares outstanding. |
| (b) | Distributions for annual periods determined in accordance with U.S. federal income tax regulations. |
| (c) | Where applicable, excludes the effects of any sales charges and assumes the reinvestment of distributions. |
See notes to financial statements.
| | |
| 28 | | 2019 BLACKROCK ANNUAL REPORTTO SHAREHOLDERS |
Financial Highlights (continued)
(For a share outstanding throughout each period)
| | | | | | | | |
| | | BlackRock Latin America Fund, Inc
(continued) | |
| |
| | | Class K | |
| | | Year Ended
October 31, 2019 | | | Period from 01/25/18(a) to 10/31/18 | |
| | |
Net asset value, beginning of period | | $ | 48.92 | | | $ | 55.91 | |
| | | | | | | | |
Net investment income(b) | | | 0.96 | | | | 0.31 | |
Net realized and unrealized gain (loss) | | | 3.14 | | | | (7.30 | ) |
| | | | | | | | |
Net increase (decrease) from investment operations | | | 4.10 | | | | (6.99 | ) |
| | | | | | | | |
Distributions from net investment income(b) | | | (0.59 | ) | | | — | |
| | | | | | | | |
| | |
Net asset value, end of period | | $ | 52.43 | | | $ | 48.92 | |
| | | | | | | | |
|
Total Return(c) | |
Based on net asset value | | | 8.55 | % | | | (12.50 | )%(d) |
| | | | | | | | |
|
Ratios to Average Net Assets | |
Total expenses | | | 1.27 | % | | | 1.33 | %(e) |
| | | | | | | | |
Total expenses after fees waived and/or reimbursed and paid indirectly | | | 1.27 | % | | | 1.32 | %(e) |
| | | | | | | | |
Net investment income | | | 1.90 | % | | | 0.84 | %(e) |
| | | | | | | | |
|
Supplemental Data | |
Net assets, end of period (000) | | $ | 758 | | | $ | 784 | |
| | | | | | | | |
Portfolio turnover rate | | | 70 | % | | | 48 | % |
| | | | | | | | |
| (a) | Commencement of operations. |
| (b) | Based on average shares outstanding. |
| (c) | Where applicable, assumes the reinvestment of distributions. |
| (d) | Aggregate total return. |
See notes to financial statements.
Notes to Financial Statements
BlackRock Emerging Markets Fund, Inc. and BlackRock Latin America Fund, Inc. are each registered under the Investment Company Act of 1940, as amended (the “1940 Act”), asopen-end management investment companies. Each Fund is organized as a Maryland corporation. The following are referred to herein collectively as the “Funds” or individually as a “Fund”:
| | | | |
| Fund Name | | Herein Referred To As | | Diversification
Classification |
BlackRock Emerging Markets Fund, Inc. | | Emerging Markets | | Non-diversified |
BlackRock Latin America Fund, Inc. | | Latin America | | Non-diversified |
Each Fund offers multiple classes of shares. All classes of shares have identical voting, dividend, liquidation and other rights and are subject to the same terms and conditions, except that certain classes bear expenses related to the shareholder servicing and distribution of such shares. Institutional and Class K Shares are sold without a sales charge and only to certain eligible investors. Investor A Shares are generally sold with an initial sales charge, and may be subject to a contingent deferred sales charge (“CDSC”) for certain redemptions where no initial sales charge was paid at the time of purchase. Investor C Shares may be subject to a 1.00% CDSC if redeemed within one year of purchase. Investor A and Investor C bear certain expenses related to shareholder servicing of such shares, and Investor C Shares also bear certain expenses related to the distribution of such shares. Investor A and Investor C Shares are generally available through financial intermediaries. Effective November 8, 2018, the Fund adopted an automatic conversion feature whereby Investor C Shares held for approximately ten years will be automatically converted into Investor A Shares. Each class has exclusive voting rights with respect to matters relating to its shareholder servicing and distribution expenditures (except that Investor C shareholders may vote on material changes to the Investor A Shares distribution and service plan).
| | | | | | | | |
| Share Class | | Initial Sales Charge | | CDSC | | | Conversion Privilege |
Institutional and Class K Shares | | No | | | No | | | None |
Investor A Shares | | Yes | | | No | (a) | | None |
Investor C Shares | | No | | | Yes | (b) | | To Investor A Shares after approximately 10 years |
| | (a) | Investor A Shares may be subject to CDSC for certain redemptions where no initial sales charge was paid at the time of purchase. | |
| | (b) | There is no CDSC on Investor C Shares after one year. | |
The Funds, together with certain other registered investment companies advised by BlackRock Advisors, LLC (the “Manager”) or its affiliates, are included in a complex of equity, multi-asset, index and money market funds referred to as the BlackRock Multi-Asset Complex.
| 2. | SIGNIFICANT ACCOUNTING POLICIES |
The financial statements are prepared in conformity with accounting principles generally accepted in the United States of America (“U.S. GAAP”), which may require management to make estimates and assumptions that affect the reported amounts of assets and liabilities in the financial statements, disclosure of contingent assets and liabilities at the date of the financial statements and the reported amounts of increases and decreases in net assets from operations during the reporting period. Actual results could differ from those estimates. Each Fund is considered an investment company under U.S. GAAP and follows the accounting and reporting guidance applicable to investment companies. Below is a summary of significant accounting policies:
Investment Transactions and Income Recognition:For financial reporting purposes, investment transactions are recorded on the dates the transactions are executed. Realized gains and losses on investment transactions are determined on the identified cost basis. Dividend income is recorded on theex-dividend date. Dividends from foreign securities where theex-dividend date may have passed are subsequently recorded when the Funds are informed of theex-dividend date. Under the applicable foreign tax laws, a withholding tax at various rates may be imposed on capital gains, dividends and interest. Interest income, including amortization and accretion of premiums and discounts on debt securities, are recognized on an accrual basis. Income, expenses and realized and unrealized gains and losses are allocated daily to each class based on its relative net assets.
Foreign Currency Translation:Each Fund’s books and records are maintained in U.S. dollars. Securities and other assets and liabilities denominated in foreign currencies are translated into U.S. dollars using exchange rates determined as of the close of trading on the New York Stock Exchange (“NYSE”). Purchases and sales of investments are recorded at the rates of exchange prevailing on the respective dates of such transactions. Generally, when the U.S. dollar rises in value against a foreign currency, the investments denominated in that currency will lose value; the opposite effect occurs if the U.S. dollar falls in relative value.
Each Fund does not isolate the portion of the results of operations arising as a result of changes in the exchange rates from the changes in the market prices of investments held or sold for financial reporting purposes. Accordingly, the effects of changes in exchange rates on investments are not segregated in the Statements of Operations from the effects of changes in market prices of those investments, but are included as a component of net realized and unrealized gain (loss) from investments. Each Fund reports realized currency gains (losses) on foreign currency related transactions as components of net realized gain (loss) for financial reporting purposes, whereas such components are generally treated as ordinary income for U.S. federal income tax purposes.
Segregation and Collateralization:In cases where a Fund enters into certain investments (e.g. futures contracts, forward foreign currency exchange contracts and swaps) that would be treated as “senior securities” for 1940 Act purposes, a Fund may segregate or designate on itsbooks and records cash or liquid assets having a market value at least equal to the amount of its future obligations under such investments. Doing so allows the investment to be excluded from treatment as a “senior security.” Furthermore, if required by an exchange or counterparty agreement, the Funds may be required to deliver/deposit cash and/or securities to/with an exchange, or broker-dealer or custodian as collateral for certain investments or obligations.
Distributions: Distributions paid by each Fund are recorded on theex-dividend date. The character and timing of distributions are determined in accordance with U.S. federal income tax regulations, which may differ from U.S. GAAP.
| | |
| 30 | | 2019 BLACKROCK ANNUAL REPORTTO SHAREHOLDERS |
Notes to Financial Statements (continued)
Offering Costs:Offering costs are amortized over a12-month period beginning with the commencement of operations of a class of shares.
Recent Accounting Standards:In March 2017, the Financial Accounting Standards Board issued Accounting Standards Update “Premium Amortization of Purchased Callable Debt Securities” which amends the amortization period for certain purchased callable debt securities. Under the new guidance, the premium amortization of purchased callable debt securities that have explicit,non-contingent call features and are callable at fixed prices will be amortized to the earliest call date. The guidance will be applied on a modified retrospective basis and is effective for fiscal years, and their interim periods, beginning after December 15, 2018. Management continues to evaluate the impact of this guidance on the Funds.
Indemnifications:In the normal course of business, a Fund enters into contracts that contain a variety of representations that provide general indemnification. A Fund’s maximum exposure under these arrangements is unknown because it involves future potential claims against a Fund, which cannot be predicted with any certainty.
Other: Expenses directly related to a Fund or its classes are charged to that Fund or the applicable class. Other operating expenses shared by several funds, including other funds managed by the Manager, are prorated among those funds on the basis of relative net assets or other appropriate methods. Expenses directly related to the Funds and other shared expenses prorated to the Funds are allocated daily to each class based on their relative net assets or other appropriate methods.
The Funds have an arrangement with their custodian whereby credits are earned on uninvested cash balances, which could be used to reduce custody fees and/or overdraft charges. The Funds may incur charges on certain uninvested cash balances and overdrafts, subject to certain conditions.
| 3. | INVESTMENT VALUATION AND FAIR VALUE MEASUREMENTS |
Investment Valuation Policies: The Funds’ investments are valued at fair value (also referred to as “market value” within the financial statements) as of the close of trading on the NYSE (generally 4:00 p.m., Eastern time). U.S. GAAP defines fair value as the price the Funds would receive to sell an asset or pay to transfer a liability in an orderly transaction between market participants at the measurement date. The Funds determine the fair values of their financial instruments using various independent dealers or pricing services under policies approved by the Board of Directors of each Fund (the “Board”). The BlackRock Global Valuation Methodologies Committee (the “Global Valuation Committee”) is the committee formed by management to develop global pricing policies and procedures and to oversee the pricing function for all financial instruments.
Fair Value Inputs and Methodologies: The following methods and inputs are used to establish the fair value of each Fund’s assets and liabilities:
| | • | | Equity investments traded on a recognized securities exchange are valued at the official closing price each day, if available. For equity investments traded on more than one exchange, the official closing price on the exchange where the stock is primarily traded is used. Equity investments traded on a recognized exchange for which there were no sales on that day may be valued at the last available bid (long positions) or ask (short positions) price. |
| | • | | Fixed-income securities for which market quotations are readily available are generally valued using the last available bid prices or current market quotations provided by independent dealers or third party pricing services. Floating rate loan interests are valued at the mean of the bid prices from one or more independent brokers or dealers as obtained from a third party pricing service. Pricing services generally value fixed-income securities assuming orderly transactions of an institutional round lot size, but a fund may hold or transact in such securities in smaller, odd lot sizes. Odd lots may trade at lower prices than institutional round lots. The pricing services may use matrix pricing or valuation models that utilize certain inputs and assumptions to derive values, including transaction data (e.g., recent representative bids and offers), credit quality information, perceived market movements, news, and other relevant information. Certain fixed-income securities, including asset-backed and mortgage related securities may be valued based on valuation models that consider the estimated cash flows of each tranche of the entity, establish a benchmark yield and develop an estimated tranche specific spread to the benchmark yield based on the unique attributes of the tranche. The amortized cost method of valuation may be used with respect to debt obligations with sixty days or less remaining to maturity unless the Manager determines such method does not represent fair value. |
Generally, trading in foreign instruments is substantially completed each day at various times prior to the close of trading on the NYSE. Occasionally, events affecting the values of such instruments may occur between the foreign market close and the close of trading on the NYSE that may not be reflected in the computation of the Funds’ net assets. Each business day, the Funds use a pricing service to assist with the valuation of certain foreign exchange-traded equity securities and foreign exchange-traded andover-the-counter (“OTC”) options (the “Systematic Fair Value Price”). Using current market factors, the Systematic Fair Value Price is designed to value such foreign securities and foreign options at fair value as of the close of trading on the NYSE, which follows the close of the local markets.
| | • | | The Funds value their investment in SL Liquidity Series, LLC, Money Market Series (the “Money Market Series”) at fair value, which is ordinarily based upon their pro rata ownership in the underlying fund’s net assets. The Money Market Series seeks current income consistent with maintaining liquidity and preserving capital. Although the Money Market Series is not registered under the 1940 Act, its investments may follow the parameters of investments by a money market fund that is subject to Rule2a-7 under the 1940 Act. |
| | • | | Futures contracts traded on exchanges are valued at their last sale price. |
| | • | | Forward foreign currency exchange contracts are valued at the mean between the bid and ask prices and are determined as of the close of trading on the NYSE based on that day’s prevailing forward exchange rate for the underlying currencies. Interpolated values are derived when the settlement date of the contract is an interim date for which quotations are not available. |
| | • | | Swap agreements are valued utilizing quotes received daily by the Funds’ pricing service or through brokers, which are derived using daily swap curves and models that incorporate a number of market data factors, such as discounted cash flows, trades and values of the underlying reference instruments. |
| | • | | Participation notes are valued on the basis of last available bid prices or current market quotations provided by dealers or pricing services. |
| | | | |
| NOTESTO FINANCIAL STATEMENTS | | | 31 | |
Notes to Financial Statements (continued)
If events (e.g., a company announcement, market volatility or a natural disaster) occur that are expected to materially affect the value of such investments, or in the event that the application of these methods of valuation results in a price for an investment that is deemed not to be representative of the market value of such investment, or if a price is not available, the investment will be valued by the Global Valuation Committee, or its delegate, in accordance with a policy approved by the Board as reflecting fair value (“Fair Valued Investments”). The fair valuation approaches that may be used by the Global Valuation Committee will include market approach, income approach and cost approach. Valuation techniques such as discounted cash flow, use of market comparables and matrix pricing are types of valuation approaches and are typically used in determining fair value. When determining the price for Fair Valued Investments, the Global Valuation Committee, or its delegate, seeks to determine the price that each Fund might reasonably expect to receive or pay from the current sale or purchase of that asset or liability in anarm’s-length transaction. Fair value determinations shall be based upon all available factors that the Global Valuation Committee, or its delegate, deems relevant and consistent with the principles of fair value measurement. The pricing of all Fair Valued Investments is subsequently reported to the Board or a committee thereof on a quarterly basis.
For investments in equity or debt issued by privately held companies or funds (“Private Company” or collectively, the “Private Companies”) and other Fair Valued Investments, the fair valuation approaches that are used by the Global Valuation Committee and third party pricing services utilize one or a combination of, but not limited to, the following inputs.
| | |
| | | Standard Inputs Generally Considered By Third Party Pricing Services |
Market approach | | (i) recent market transactions, including subsequent rounds of financing, in the underlying investment or comparable issuers; (ii) recapitalizations and other transactions across the capital structure; and (iii) market multiples of comparable issuers. |
Income approach | | (i) future cash flows discounted to present and adjusted as appropriate for liquidity, credit, and/or market risks; (ii) quoted prices for similar investments or assets in active markets; and (iii) other risk factors, such as interest rates, yield curves, volatilities, prepayment speeds, loss severities, credit risks, recovery rates, liquidation amounts and/or default rates. |
Cost approach | | (i) audited or unaudited financial statements, investor communications and financial or operational metrics issued by the Private Company; (ii) changes in the valuation of relevant indices or publicly traded companies comparable to the Private Company; (iii) relevant news and other public sources; and (iv) known secondary market transactions in the Private Company’s interests and merger or acquisition activity in companies comparable to the Private Company. |
Investments in series of preferred stock issued by Private Companies are typically valued utilizing market approach in determining the enterprise value of the company. Such investments often contain rights and preferences that differ from other series of preferred and common stock of the same issuer. Valuation techniques such as an option pricing model (“OPM”), a probability weighted expected return model (“PWERM”) or a hybrid of those techniques are used in allocating enterprise value of the company, as deemed appropriate under the circumstances. The use of OPM and PWERM techniques involve a determination of the exit scenarios of the investment in order to appropriately allocate the enterprise value of the company among the various parts of its capital structure.
The Private Companies are not subject to the public company disclosure, timing, and reporting standards as other investments held by a Fund. Typically, the most recently available information by a Private Company is as of a date that is earlier than the date a Fund is calculating its net asset value (“NAV”). This factor may result in a difference between the value of the investment and the price a Fund could receive upon the sale of the investment.
Fair Value Hierarchy: Various inputs are used in determining the fair value of investments and derivative financial instruments. These inputs to valuation techniques are categorized into a fair value hierarchy consisting of three broad levels for financial statement purposes as follows:
| | • | | Level 1 — Unadjusted price quotations in active markets/exchanges for identical assets or liabilities that each Fund has the ability to access |
| | • | | Level 2 — Other observable inputs (including, but not limited to, quoted prices for similar assets or liabilities in markets that are active, quoted prices for identical or similar assets or liabilities in markets that are not active, inputs other than quoted prices that are observable for the assets or liabilities (such as interest rates, yield curves, volatilities, prepayment speeds, loss severities, credit risks and default rates) or other market–corroborated inputs) |
| | • | | Level 3 — Unobservable inputs based on the best information available in the circumstances, to the extent observable inputs are not available (including the Global Valuation Committee’s assumptions used in determining the fair value of investments and derivative financial instruments) |
The hierarchy gives the highest priority to unadjusted quoted prices in active markets for identical assets or liabilities (Level 1 measurements) and the lowest priority to unobservable inputs (Level 3 measurements). Accordingly, the degree of judgment exercised in determining fair value is greatest for instruments categorized in Level 3. The inputs used to measure fair value may fall into different levels of the fair value hierarchy. In such cases, for disclosure purposes, the fair value hierarchy classification is determined based on the lowest level input that is significant to the fair value measurement in its entirety. Investments classified within Level 3 have significant unobservable inputs used by the Global Valuation Committee in determining the price for Fair Valued Investments. Level 3 investments include equity or debt issued byPrivate Companies. There may not be a secondary market, and/or there are a limited number of investors. The categorization of a value determined for investments and derivative financial instruments is based on the pricing transparency of the investments and derivative financial instruments and is not necessarily an indication of the risks associated with investing in those securities.
As of October 31, 2019, certain investments of the Funds were valued using NAV as no quoted market value is available and therefore have been excluded from the fair value hierarchy.
| 4. | SECURITIES AND OTHER INVESTMENTS |
Participation Notes: Participation notes(“P-Notes”) are promissory notes issued by banks or broker-dealers that are designed to offer a return measured by the change in the value of the underlying security or basket of securities (the “underlying security”) while not holding the actual shares of the underlying security. These investments are typically used to gain exposure to securities traded in foreign markets that may be restricted due to country-specific regulations. When theP-Note matures, the issuer will pay or receive the difference between the value of the underlying security at the time of the purchase and the underlying security’s value at maturity of theP-Notes. Income received onP-Notes is recorded by a fund as dividend income in the Statements of Operations. An investment in aP-Note involves additional risks beyond the
| | |
| 32 | | 2019 BLACKROCK ANNUAL REPORTTO SHAREHOLDERS |
Notes to Financial Statements (continued)
risks normally associated with a direct investment in the underlying security. While the holder of aP-Note is entitled to receive from the bank or broker-dealer any dividends paid by the underlying security, the holder is not entitled to the same rights (e.g., voting rights) as a direct owner of the underlying security.P-Notes are considered general unsecured contractual obligations of the bank or broker-dealer. The holder of aP-Note must rely on the creditworthiness of the issuer for its investment returns on theP-Notes and has no rights against the issuer of the underlying security. AP-Note may be more volatile and less liquid than other investments held by a fund since theP-Note generally is dependent on the liquidity in the local trading market for the underlying security.
Preferred Stocks:Preferred stock has a preference over common stock in liquidation (and generally in receiving dividends as well), but is subordinated to the liabilities of the issuer in all respects. As a general rule, the market value of preferred stock with a fixed dividend rate and no conversion element varies inversely with interest rates and perceived credit risk, while the market price of convertible preferred stock generally also reflects some element of conversion value. Because preferred stock is junior to debt securities and other obligations of the issuer, deterioration in the credit quality of the issuer will cause greater changes in the value of a preferred stock than in a more senior debt security with similar stated yield characteristics. Unlike interest payments on debt securities, preferred stock dividends are payable only if declared by the issuer’s board of directors. Preferred stock also may be subject to optional or mandatory redemption provisions.
Warrants:Warrants entitle a fund to purchase a specified number of shares of common stock and arenon-income producing. The purchase price and number of shares are subject to adjustment under certain conditions until the expiration date of the warrants, if any. If the price of the underlying stock does not rise above the strike price before the warrant expires, the warrant generally expires without any value and a fund will lose any amount it paid for the warrant. Thus, investments in warrants may involve more risk than investments in common stock. Warrants may trade in the same markets as their underlying stock; however, the price of the warrant does not necessarily move with the price of the underlying stock.
Forward Commitments, When-Issued and Delayed Delivery Securities: Certain funds may purchase securities on a when-issued basis and may purchase or sell securities on a forward commitment basis. Settlement of such transactions normally occurs within a month or more after the purchase or sale commitment is made. A fund may purchase securities under such conditions with the intention of actually acquiring them, but may enter into a separate agreement to sell the securities before the settlement date. Since the value of securities purchased may fluctuate prior to settlement, a fund may be required to pay more at settlement than the security is worth. In addition, a fund is not entitled to any of the interest earned prior to settlement. When purchasing a security on a delayed delivery basis, a fund assumes the rights and risks of ownership of the security, including the risk of price and yield fluctuations. In the event of default by the counterparty, a fund’s maximum amount of loss is the unrealized appreciation of unsettled when-issued transactions.
Securities Lending:The Funds may lend their securities to approved borrowers, such as brokers, dealers and other financial institutions. The borrower pledges and maintains with the Funds collateral consisting of cash, an irrevocable letter of credit issued by a bank, or securities issued or guaranteed by the U.S. Government. The initial collateral received by each Fund is required to have a value of at least 102% of the current value of the loaned securities for securities traded on U.S. exchanges and a value of at least 105% for all other securities. The collateral is maintained thereafter at a value equal to at least 100% of the current market value of the securities on loan. The market value of the loaned securities is determined at the close of each business day of the Fund and any additional required collateral is delivered to the Fund, or excess collateral returned by the Fund, on the next business day. During the term of the loan, the Funds are entitled to all distributions made on or in respect of the loaned securities, but do not receive interest income on securities received as collateral. Loans of securities are terminable at any time and the borrower, after notice, is required to return borrowed securities within the standard time period for settlement of securities transactions.
The market value of any securities on loan, all of which were classified as common stocks in the Funds’ Schedules of Investments, and the value of any related collateral are shown separately in the Statements of Assets and Liabilities as a component of investments at value-unaffiliated, and collateral on securities loaned at value, respectively. As of period end, any securities on loan were collateralized by cash and/or U.S. Government obligations. Cash collateral invested by the securities lending agent, BlackRock Investment Management, LLC (“BIM”), if any, is disclosed in the Schedules of Investments.
Securities lending transactions are entered into by the Funds under Master Securities Lending Agreements (each, an “MSLA”), which provide the right, in the event of default (including bankruptcy or insolvency), for thenon-defaulting party to liquidate the collateral and calculate a net exposure to the defaulting party or request additional collateral. In the event that a borrower defaults, the Funds, as lender, would offset the market value of the collateral received against the market value of the securities loaned. When the value of the collateral is greater than that of the market value of the securities loaned, the lender is left with a net amount payable to the defaulting party. However, bankruptcy or insolvency laws of a particular jurisdiction may impose restrictions on or prohibitions against such a right of offset in the event of an MSLA counterparty’s bankruptcy or insolvency. Under the MSLA, absent an event of default, the borrower can resell orre-pledge the loaned securities, and a Fund can reinvest cash collateral received in connection with loaned securities. Upon an event of default, the parties’ obligations to return the securities or collateral to the other party are extinguished, and the parties can resell orre-pledge the loaned securities or the collateral received in connection with the loaned securities in order to satisfy the defaulting party’s net payment obligation for all transactions under the MSLA. The defaulting party remains liable for any deficiency.
As of period end, the following table is a summary of the Funds’ securities lending agreements by counterparty which are subject to offset under an MSLA:
| | | | | | | | | | | | |
| Counterparty | | Securities
Loaned at Value | | | Cash Collateral
Received (a) | | | Net
Amount | |
BlackRock Emerging Markets Fund, Inc. | | | | | | | | | | | | |
Citigroup Global Markets Inc. | | $ | 191,608 | | | $ | (191,608 | ) | | $ | — | |
| | | | | | | | | | | | |
| | | |
BlackRock Latin America Fund, Inc. | | | | | | | | | | | | |
Credit Suisse Securities (USA) LLC | | $ | 1,949 | | | $ | (1,949 | ) | | $ | — | |
JP Morgan Securities LLC | | | 1,479,603 | | | | (1,479,603 | ) | | | — | |
Morgan Stanley & Co. LLC. | | | 1,640,423 | | | | (1,640,423 | ) | | | — | |
State Street Bank & Trust Company | | | 297,826 | | | | (297,826 | ) | | | — | |
| | | | | | | | | | | | |
| | $ | 3,419,801 | | | $ | (3,419,801 | ) | | $ | — | |
| | | | | | | | | | | | |
| | (a) | Collateral received in excess of the market value of securities on loan is not presented in this table. The total cash collateral received by each Fund is disclosed in the Fund’s Statements of Assets and Liabilities. | |
| | | | |
| NOTESTO FINANCIAL STATEMENTS | | | 33 | |
Notes to Financial Statements (continued)
The risks of securities lending include the risk that the borrower may not provide additional collateral when required or may not return the securities when due. To mitigate these risks, the Funds benefit from a borrower default indemnity provided by BIM.BIM’s indemnity allows for full replacement of the securities loaned to the extent the collateral received does not cover the value on the securities loaned in the event of borrower default. Each Fund could incur a loss if the value of an investment purchased with cash collateral falls below the market value of loaned securities or if the value of an investment purchased with cash collateral falls below the value of the original cash collateral received. Such losses are borne entirely by the Funds.
| 5. | DERIVATIVE FINANCIAL INSTRUMENTS |
The Funds engage in various portfolio investment strategies using derivative contracts both to increase the returns of the Funds and/or to manage their exposure to certain risks such as credit risk, equity risk, interest rate risk, foreign currency exchange rate risk, commodity price risk or other risks (e.g., inflation risk). Derivative financial instruments categorized by risk exposure are included in the Schedules of Investments. These contracts may be transacted on an exchange or OTC.
Futures Contracts:Futures contracts are purchased or sold to gain exposure to, or manage exposure to, changes in interest rates (interest rate risk) and changes in the value of equity securities (equity risk) or foreign currencies (foreign currency exchange rate risk).
Futures contracts are agreements between the Funds and a counterparty to buy or sell a specific quantity of an underlying instrument at a specified price and on a specified date. Depending on the terms of a contract, it is settled either through physical delivery of the underlying instrument on the settlement date or by payment of a cash amount on the settlement date. Upon entering into a futures contract, the Funds are required to deposit initial margin with the broker in the form of cash or securities in an amount that varies depending on a contract’s size and risk profile. The initial margin deposit must then be maintained at an established level over the life of the contract. Amounts pledged, which are considered restricted, are included in cash pledged for futures contracts in the Statements of Assets and Liabilities.
Securities deposited as initial margin are designated in the Schedules of Investments and cash deposited, if any, are shown as cash pledged for futures contracts in the Statements of Assets and Liabilities. Pursuant to the contract, the Funds agree to receive from or pay to the broker an amount of cash equal to the daily fluctuation in market value of the contract (“variation margin”). Variation margin is recorded as unrealized appreciation (depreciation) and, if any, shown as variation margin receivable (or payable) on futures contracts in the Statements of Assets and Liabilities. When the contract is closed, a realized gain or loss is recorded in the Statements of Operations equal to the difference between the notional amount of the contract at the time it was opened and the notional amount at the time it was closed. The use of futures contracts involves the risk of an imperfect correlation in the movements in the price of futures contracts and interest, foreign currency exchange rates or underlying assets.
Forward Foreign Currency Exchange Contracts:Forward foreign currency exchange contracts are entered into to gain or reduce exposure to foreign currencies (foreign currency exchange rate risk).
A forward foreign currency exchange contract is an agreement between two parties to buy and sell a currency at a set exchange rate on a specified date. These contracts help to manage the overall exposure to the currencies in which some of the investments held by the Funds are denominated and in some cases, may be used to obtain exposure to a particular market.
The contract ismarked-to-market daily and the change in market value is recorded as unrealized appreciation (depreciation) in the Statements of Assets and Liabilities. When a contract is closed, a realized gain or loss is recorded in the Statements of Operations equal to the difference between the value at the time it was opened and the value at the time it was closed.Non-deliverable forward foreign currency exchange contracts are settled with the counterparty in cash without the delivery of foreign currency. The use of forward foreign currency exchange contracts involves the risk that the value of a forward foreign currency exchange contract changes unfavorably due to movements in the value of the referenced foreign currencies, and such value may exceed the amount(s) reflected in the Statements of Assets and Liabilities. Cash amounts pledged for forward foreign currency exchange contracts are considered restricted and are included in cash pledged as collateral for OTC derivatives in the Statements of Assets and Liabilities.
Swaps: Swap contracts are entered into to manage exposure to issuers, markets and securities. Such contracts are agreements between the Funds and a counterparty to make periodic net payments on a specified notional amount or a net payment upon termination. Swap agreements are privately negotiated in the OTC market and may be entered into as a bilateral contract (“OTC swaps”) or centrally cleared (“centrally cleared swaps”).
For OTC swaps, any upfront premiums paid and any upfront fees received are shown as swap premiums paid and swap premiums received, respectively, in the Statements of Assets and Liabilities and amortized over the term of the contract. The daily fluctuation in market value is recorded as unrealized appreciation (depreciation) on OTC Swaps in the Statements of Assets and Liabilities. Payments received or paid are recorded in the Statements of Operations as realized gains or losses, respectively. When an OTC swap is terminated, a realized gain or loss is recorded in the Statements of Operations equal to the difference between the proceeds from (or cost of) the closing transaction and the Funds’ basis in the contract, if any. Generally, the basis of the contract is the premium received or paid.
In a centrally cleared swap, immediately following execution of the swap contract, the swap contract is novated to a central counterparty (the “CCP”) and the Funds’ counterparty on the swap agreement becomes the CCP. The Funds are required to interface with the CCP through the broker. Upon entering into a centrally cleared swap, the Funds are required to deposit initial margin with the broker in the form of cash or securities in an amount that varies depending on the size and risk profile of the particular swap. Securities deposited as initial margin are designated in the Schedules of Investments and cash deposited is shown as cash pledged for centrally cleared swaps in the Statements of Assets and Liabilities. Amounts pledged, which are considered restricted cash, are included in cash pledged for centrally cleared swaps in the Statements of Assets and Liabilities. Pursuant to the contract, the Funds agree to receive from or pay to the broker an amount of cash equal to the daily fluctuation in market value of the contract (“variation margin”). Variation margin is recorded as unrealized appreciation (depreciation) and shown as variation margin receivable (or payable) on centrally cleared swaps in the Statements of Assets and Liabilities. Payments received from (paid to) the counterparty, including at termination, are recorded as realized gains (losses) in the Statements of Operations.
| • | | Total return swaps — Total return swaps are entered into to obtain exposure to a security or market without owning such security or investing directly in such market or to exchange the risk/return of one security or market (e.g., fixed-income) with another security or market (e.g., equity or commodity prices) (equity risk, commodity price risk and/or interest rate risk). |
| | |
| 34 | | 2019 BLACKROCK ANNUAL REPORTTO SHAREHOLDERS |
Notes to Financial Statements (continued)
Total return swaps are agreements in which there is an exchange of cash flows whereby one party commits to make payments based on the total return (distributions plus capital gains/losses) of an underlying instrument, or basket of underlying instruments, in exchange for fixed or floating rate interest payments. If the total return of the instrument or index underlying the transaction exceeds or falls short of the offsetting fixed or floating interest rate obligation, the Funds receive payment from or make a payment to the counterparty.
Certain total return swaps are designed to function as a portfolio of direct investments in long and short equity positions. This means each Fund has the ability to trade in and out of these long and short positions within the swap and will receive the economic benefits and risks equivalent to direct investment in these positions, subject to certain adjustments due to events related to the counterparty. Benefits and risks include capital appreciation (depreciation), corporate actions and dividends received and paid, all of which are reflected in the swap’s market value. The market value also includes interest charges and credits (“financing fees”) related to the notional values of the long and short positions and cash balances within the swap. These interest charges and credits are based on a specified benchmark rate plus or minus a specified spread determined based upon the country and/or currency of the positions in the portfolio.
Positions within the swap and financing fees are reset periodically. During a reset, any unrealized appreciation (depreciation) on positions and accrued financing fees become available for cash settlement between the Funds and the counterparty. The amounts that are available for cash settlement are recorded as realized gains or losses in the Statements of Operations. Cash settlement in and out of the swap may occur at a reset date or any other date, at the discretion of the Funds and the counterparty, over the life of the agreement. Certain swaps have no stated expiration and can be terminated by either party at any time.
Swap transactions involve, to varying degrees, elements of interest rate, credit and market risk in excess of the amounts recognized in the Statements of Assets and Liabilities. Such risks involve the possibility that there will be no liquid market for these agreements, that the counterparty to the agreements may default on its obligation to perform or disagree as to the meaning of the contractual terms in the agreements, and that there may be unfavorable changes in interest rates and/or market values associated with these transactions.
Master Netting Arrangements: In order to define their contractual rights and to secure rights that will help them mitigate their counterparty risk, the Funds may enter into an International Swaps and Derivatives Association, Inc. Master Agreement (“ISDA Master Agreement”) or similar agreement with their counterparties. An ISDA Master Agreement is a bilateral agreement between each Fund and a counterparty that governs certain OTC derivatives and typically contains, among other things, collateral posting terms and netting provisions in the event of a default and/or termination event. Under an ISDA Master Agreement, each Fund may, under certain circumstances, offset with the counterparty certain derivative financial instruments’ payables and/or receivables with collateral held and/or posted and create one single net payment. The provisions of the ISDA Master Agreement typically permit a single net payment in the event of default including the bankruptcy or insolvency of the counterparty. Bankruptcy or insolvency laws of a particular jurisdiction may restrict or prohibit the right of offset in bankruptcy, insolvency or other events.
Collateral Requirements: For derivatives traded under an ISDA Master Agreement, the collateral requirements are typically calculated by netting themark-to-market amount for each transaction under such agreement and comparing that amount to the value of any collateral currently pledged by the Fund and the counterparty.
Cash collateral that has been pledged to cover obligations of the Funds and cash collateral received from the counterparty, if any, is reported separately in the Statements of Assets and Liabilities as cash pledged as collateral and cash received as collateral, respectively.Non-cash collateral pledged by the Funds, if any, is noted in the Schedules of Investments. Generally, the amount of collateral due from or to a counterparty is subject to a certain minimum transfer amount threshold before a transfer is required, which is determined at the close of business of the Funds. Any additional required collateral is delivered to/pledged by the Funds on the next business day. Typically, the counterparty is not permitted to sell,re-pledge or use cash andnon-cash collateral it receives. A Fund generally agrees not to usenon-cash collateral that it receives but may, absent default or certain other circumstances defined in the underlying ISDA Master Agreement, be permitted to use cash collateral received. In such cases, interest may be paid pursuant to the collateral arrangement with the counterparty. To the extent amounts due to the Funds from their counterparties are not fully collateralized, they bear the risk of loss from counterpartynon-performance. Likewise, to the extent the Funds have delivered collateral to a counterparty and stand ready to perform under the terms of their agreement with such counterparty, they bear the risk of loss from a counterparty in the amount of the value of the collateral in the event the counterparty fails to return such collateral. Based on the terms of agreements, collateral may not be required for all derivative contracts.
For financial reporting purposes, the Funds do not offset derivative assets and derivative liabilities that are subject to netting arrangements, if any, in the Statements of Assets and Liabilities.
| 6. | INVESTMENT ADVISORY AGREEMENT AND OTHER TRANSACTIONS WITH AFFILIATES |
Investment Advisory:Each Fund entered into an Investment Advisory Agreement with the Manager, the Funds’ investment adviser and an indirect, wholly-owned subsidiary of BlackRock, Inc. (“BlackRock”), to provide investment advisory and administrative services. The Manager is responsible for the management of each Fund’s portfolio and provides the personnel, facilities, equipment and certain other services necessary to the operations of each Fund.
Effective September 19, 2019, for such services, Emerging Markets pays the Manager a monthly fee at an annual rate equal to the following percentages of the average daily value of the Fund’s net assets.
| | | | |
| Average Daily Net Assets | | Investment
Advisory Fees | |
First $1 Billion | | | 0.81 | % |
$1 Billion — $3 Billion | | | 0.76 | |
$3 Billion — $5 Billion | | | 0.73 | |
$5 Billion — $10 Billion | | | 0.70 | |
Greater than $10 Billion | | | 0.69 | |
| | | | |
| NOTESTO FINANCIAL STATEMENTS | | | 35 | |
Notes to Financial Statements (continued)
Prior to September 19, 2019, for such services, Emerging Markets paid the Manager a monthly fee at an annual rate equal to the following percentages of the average daily value of the Fund’s net assets:
| | | | |
| Average Daily Net Assets | | Investment
Advisory Fees | |
First $1 billion | | | 0.89 | % |
$1 billion to $3 billion | | | 0.84 | |
$3 billion to $5 billion | | | 0.80 | |
$5 billion to $10 billion | | | 0.77 | |
Greater than $10 billion | | | 0.76 | |
For such services, Latin America pays the Manager a monthly fee at an annual rate equal to the following percentages of the average daily value of the Fund’s net assets:
| | | | |
| Average Daily Net Assets | | Investment
Advisory Fees | |
First $1 Billion | | | 1.00 | % |
$1 Billion — $3 Billion | | | 0.94 | |
$3 Billion — $5 Billion | | | 0.90 | |
$5 Billion — $10 Billion | | | 0.87 | |
Greater than $10 Billion | | | 0.85 | |
With respect to Emerging Markets, the Manager entered into asub-advisory agreement with BlackRock Asset Management North Asia Limited (“BAMNAL”), an affiliate of the Manager. The Manager pays BAMNAL for services it provides for that portion of the Fund for which BAMNAL acts assub-adviser, a monthly fee that is equal to a percentage of the investment advisory fees paid by the Fund to the Manager.
Service and Distribution Fees:The Funds entered into a Distribution Agreement and Distribution Plans with BlackRock Investments, LLC (“BRIL”), an affiliate of the Manager. Pursuant to the Distribution Plans and in accordance with Rule12b-1 under the 1940 Act, each Fund pays BRIL ongoing service and distribution fees. The fees are accrued daily and paid monthly at annual rates based upon the average daily net assets of the relevant share class of each Fund as follows:
| | | | | | | | |
| | | Service Fee | | | Distribution Fee | |
Investor A | | | 0.25 | % | | | — | % |
Investor C | | | 0.25 | | | | 0.75 | |
BRIL and broker-dealers, pursuant tosub-agreements with BRIL, provide shareholder servicing and distribution services to the Funds. The ongoing service and/or distribution fee compensates/reimburses BRIL and each broker-dealer for providing shareholder servicing and/or distribution related services to shareholders.
For the year ended October 31, 2019, the following table shows the class specific service and distribution fees borne directly by each share class of each Fund:
| | | | | | | | | | | | |
| | | Investor A | | | Investor C | | | Total | |
Emerging Markets | | $ | 475,866 | | | $ | 329,860 | | | $ | 805,726 | |
Latin America | | | 231,665 | | | | 82,269 | | | | 313,934 | |
Transfer Agent: Pursuant to written agreements, certain financial intermediaries, some of which may be affiliates, provide the Funds withsub-accounting, recordkeeping,sub-transfer agency and other administrative services with respect to servicing of underlying investor accounts. For these services, these entities receive an asset-based fee or an annual fee per shareholder account, which will vary depending on share class and/or net assets. For the year ended October 31, 2019, the Funds did not pay any amounts to affiliates in return for these services.
The Manager maintains a call center that is responsible for providing certain shareholder services to the Funds. Shareholder services include responding to inquiries and processing purchases and sales based upon instructions from shareholders. For the year ended October 31, 2019, each Fund reimbursed the Manager the following amounts for costs incurred in running the call center, which are included in transfer agent — class specific in the Statements of Operations:
| | | | | | | | | | | | | | | | | | | | |
| | | Institutional | | | Investor A | | | Investor C | | | Investor K | | | Total | |
Emerging Markets | | $ | 1,384 | | | $ | 7,232 | | | $ | 2,233 | | | $ | 147 | | | $ | 10,996 | |
Latin America | | | 790 | | | | 7,298 | | | | 720 | | | | 16 | | | | 8,824 | |
For the year ended October 31, 2019, the following table shows the class specific transfer agent fees borne directly by each share class of each Fund:
| | | | | | | | | | | | | | | | | | | | |
| | | Institutional | | | Investor A | | | Investor C | | | Class K | | | Total | |
Emerging Markets | | $ | 290,656 | | | $ | 371,812 | | | $ | 98,643 | | | $ | 1,070 | | | $ | 762,181 | |
Latin America | | | 58,885 | | | | 143,509 | | | | 18,263 | | | | 546 | | | | 221,203 | |
Other Fees: For the year ended October 31, 2019, affiliates earned underwriting discounts, direct commissions and dealer concessions on sales of the Fund’s Investor A Shares as follows:
| | | | | | | | |
| | | Emerging Markets | | | Latin America | |
Investor A | | $ | 10,937 | | | $ | 1,227 | |
| | |
| 36 | | 2019 BLACKROCK ANNUAL REPORTTO SHAREHOLDERS |
Notes to Financial Statements (continued)
For the year ended October 31, 2019, affiliates received CDSCs as follows:
| | | | | | | | |
| | | Emerging Markets | | | Latin America | |
Investor A | | $ | 2,952 | | | $ | 43 | |
Investor C | | | 1,357 | | | | 454 | |
Expense Limitations, Waivers, Reimbursements, and Recoupments:With respect to Emerging Markets, the Manager contractually agreed to waive and/or reimburse fees or expenses in order to limit expenses, excluding interest expense, dividend expense, tax expense, acquired fund fees and expenses, and certain other fund expenses, which constitute extraordinary expenses not incurred in the ordinary course of the Fund’s business (“expense limitation”). Effective September 19, 2019, the expense limitations as a percentage of average daily net assets are as follows:
| | | | |
| | | Emerging Markets | |
Institutional | | | 0.86 | % |
Investor A | | | 1.11 | |
Investor C | | | 1.86 | |
Class K | | | 0.81 | |
Prior to September 19, 2019, the expense limitations as a percentage of average daily net assets were as follows:
| | | | |
| | | Emerging Markets | |
Institutional | | | 0.99 | % |
Investor A | | | 1.24 | |
Investor C | | | 1.99 | |
Class K | | | 0.94 | |
The Manager has agreed not to reduce or discontinue these contractual expense limitations through February 28, 2021, unless approved by the Board, including a majority of the directors who are not “interested persons” of the Fund, as defined in the 1940 Act (“Independent Directors”) or by a vote of a majority of the outstanding voting securities of the Fund.
These amounts waived and/or reimbursed are included in fees waived and/or reimbursed by the Manager, transfer agent fees waived and/or reimbursed — class specific, in the Statements of Operations. For the year ended October 31, 2019, class specific expense waivers and/or reimbursements are as follows:
| | | | | | | | | | | | | | | | | | | | |
| Fees waived and/or reimbursed | | Institutional | | | Investor A | | | Investor C | | | Class K | | | Total | |
Emerging Markets | | $ | 136,189 | | | $ | 145,190 | | | $ | 26,014 | | | $ | 37,354 | | | $ | 344,747 | |
| | | | | | | | | | | | | | | | | | | | |
| Transfer agent fees waived and/or reimbursed — class specific | | Institutional | | | Investor A | | | Investor C | | | Class K | | | Total | |
Emerging Markets | | $ | 190,004 | | | $ | 276,897 | | | $ | 82,150 | | | $ | 1,068 | | | $ | 550,119 | |
With respect to each Fund, the Manager voluntarily agreed to waive its investment advisory fees by the amount of investment advisory fees each Fund pays to the Manager indirectly through its investment in affiliated money market funds (the “affiliated money market fund waiver”). The amount of waivers and/or reimbursements of fees and expenses made pursuant to the expense limitation described below will be reduced by the amount of the affiliated money market fund waiver. These amounts are included in fees waived and/or reimbursed by the Manager in the Statements of Operations. For the year ended October 31, 2019, the amounts waived were as follows:
| | | | | | | | |
| | | Emerging Markets | | | Latin America | |
Amounts waived | | $ | 23,137 | | | $ | 1,199 | |
The Manager has contractually agreed to waive its investment advisory fee with respect to any portion of each Fund’s assets invested in affiliated equity and fixed-income mutual funds and affiliated exchange-traded funds that have a contractual management fee through February 29, 2020. The contractual agreement may be terminated upon 90 days’ notice by a majority of the Independent Directors or by a vote of a majority of the outstanding voting securities of a Fund. For the year ended October 31, 2019, there were no fees waived and/or reimbursed by the Manager pursuant to this arrangement.
The Funds have incurred expenses in connection with the realignment and consolidation of the boards of directors of certain BlackRock-advised funds. The Manager has voluntarily agreed to reimburse the Funds for all or a portion of such expenses, which amounts are included in fees waived and/or reimbursed by the Manager in the Statements of Operations. For the year ended October 31, 2019, the amounts reimbursed were as follows:
| | | | | | | | |
| | | Emerging Markets | | | Latin America | |
Amounts reimbursed | | $ | 15,473 | | | $ | 2,809 | |
For the year ended October 31, 2019, the Funds reimbursed the Manager for certain accounting services, which is included in accounting services in the Statements of Operations. The reimbursements were as follows:
| | | | | | | | |
| | | Emerging Markets | | | Latin America | |
Amounts reimbursed | | $ | 5,010 | | | $ | 2,043 | |
| | | | |
| NOTESTO FINANCIAL STATEMENTS | | | 37 | |
Notes to Financial Statements (continued)
With respect to Emerging Markets contractual expense limitation, if during Emerging Market’s fiscal year the operating expenses of a share class, that at any time during the prior two fiscal years received a waiver and/or reimbursement from the Manager, are less than the current expense limitation for that share class, the Manager is entitled to be reimbursed by such share class up to the lesser of: (a) the amount of fees waived and/or expenses reimbursed during those prior two fiscal years under the agreement and (b) an amount not to exceed either the current expense limitation of that share class or the expense limitation of the share class in effect at the time that the share class received the applicable waiver and/or reimbursement, provided that:
(1) the Fund, has more than $50 million in assets for the fiscal year, and
(2) the Manager or an affiliate continues to serve as the Fund’s investment adviser or administrator.
This repayment applies only to the contractual expense limitation on net expenses and does not apply to the contractual investment advisory fee waiver described above or any voluntary waivers that may be in effect from time to time.
As of October 31, 2019, Emerging Market’s fund level and class specific waivers and/or reimbursements subject to possible future recoupment under the expense limitation agreement are as follows:
| | | | | | | | |
| | | Expiring October 31, | |
| | | 2020 | | | 2021 | |
Fund level | | $ | 349,388 | | | $ | 344,747 | |
Institutional | | | 66,015 | | | | 190,004 | |
Investor A | | | 161,433 | | | | 276,897 | |
Investor C | | | 52,939 | | | | 82,150 | |
Class K | | | 324 | | | | 1,068 | |
Securities Lending:The U.S. Securities and Exchange Commission (“SEC”) has issued an exemptive order which permits BIM, an affiliate of the Manager, to serve as securities lending agent for the Funds, subject to applicable conditions. As securities lending agent, BIM bears all operational costs directly related to securities lending. The Funds are responsible for expenses in connection with the investment of cash collateral received for securities on loan (the “collateral investment expenses”). The cash collateral is invested in a private investment company managed by the Manager or its affiliates. However, BIM has agreed to cap the collateral investment expenses of the private investment company to an annual rate of 0.04%. The investment adviser to the private investment company will not charge any advisory fees with respect to shares purchased by the Funds. The private investment company in which the cash collateral has been invested may, under certain circumstances, impose a liquidity fee of up to 2% of the value withdrawn or temporarily restrict withdrawals for up to 10 business days during a 90 day period, in the event that the private investment company’s weekly liquid assets fall below certain thresholds.
Securities lending income is equal to the total of income earned from the reinvestment of cash collateral, net of fees and other payments to and from borrowers of securities, and less the collateral investment expenses. Each Fund retains a portion of securities lending income and remits a remaining portion to BIM as compensation for its services as securities lending agent.
Pursuant to the current securities lending agreement, each Fund retains 82% of securities lending income (which excludes collateral investment expenses), and this amount retained can never be less than 70% of the total of securities lending income plus the collateral investment expenses.
In addition, commencing the business day following the date that the aggregate securities lending income earned across the BlackRock Multi-Asset Complex in a calendar year exceeds a specified threshold, each Fund, pursuant to the securities lending agreement, will retain for the remainder of that calendar year securities lending income in an amount equal to 85% of securities lending income (which excludes collateral investment expenses), and this amount retained can never be less than 70% of the total of securities lending income plus the collateral investment expenses.
Prior to January 1, 2019, each Fund retained 80% of securities lending income (which excluded collateral investment expenses) and the amount retained could never be less than 70% of the total of securities lending income plus the collateral investment expenses. In addition, commencing the business day following the date that the aggregate securities lending income earned across a complex ofopen-end funds referred to as the Equity-Liquidity Complex in a calendar year exceeded a specified threshold, each Fund would retain for the remainder of that calendar year 85% of securities lending income (which excluded collateral investment expenses), and the amount retained could never be less than 70% of the total of securities lending income plus the collateral investment expenses.
The share of securities lending income earned by each Fund is shown as securities lending income — affiliated — net in the Statements of Operations. For the year ended October 31, 2019, each Fund paid BIM the following amounts for securities lending agent services:
| | | | | | | | |
| | | Emerging Markets | | | Latin America | |
Securities lending services | | $ | 31,231 | | | $ | 4,049 | |
Interfund Lending: In accordance with an exemptive order (the “Order”) from the SEC, each Fund may participate in a joint lending and borrowing facility for temporary purposes (the “Interfund Lending Program”), subject to compliance with the terms and conditions of the Order, and to the extent permitted by each Fund’s investment policies and restrictions. Each Fund is currently permitted to borrow under the Interfund Lending Program.
A lending BlackRock fund may lend in aggregate up to 15% of its net assets, but may not lend more than 5% of its net assets to any one borrowing fund through the Interfund Lending Program. A borrowing BlackRock fund may not borrow through the Interfund Lending Program or from any other source more than 331⁄3% of its total assets (or any lower threshold provided for by the fund’s investment restrictions). If a borrowing BlackRock fund’s total outstanding borrowings exceed 10% of its total assets, each of its outstanding interfund loans will be subject to collateralization of at least 102% of the outstanding principal value of the loan. All interfund loans are for temporary or emergency purposes and the interest rate to be charged will be the average of the highest current overnight repurchase agreement rate available to a lending fund and the bank loan rate, as calculated according to a formula established by the Board.
| | |
| 38 | | 2019 BLACKROCK ANNUAL REPORTTO SHAREHOLDERS |
Notes to Financial Statements (continued)
During the year ended October 31, 2019, the Funds did not participate in the Interfund Lending Program.
Directors and Officers:Certain directors and/or officers of the Funds are directors and/or officers of BlackRock or its affiliates. The Funds reimburse the Manager for a portion of the compensation paid to the Funds’ Chief Compliance Officer, which is included in Directors and Officer in the Statements of Operations.
Other Transactions:The Funds may purchase securities from, or sell securities to, an affiliated fund provided the affiliation is due solely to having a common investment adviser, common officers, or common directors. For the year ended October 31, 2019, the purchase and sale transactions and any net realized gains (losses) with affiliated funds in compliance with Rule17a-7 under the 1940 Act were as follows:
| | | | | | | | | | | | |
| | | Purchases | | | Sales | | | Net Realized (Loss) | |
Emerging Markets | | $ | — | | | $ | 3,222,759 | | | $ | (700,091 | ) |
For the year ended October 31, 2019, purchases and sales of investments, excluding short-term securities, were as follows:
| | | | | | | | |
| | | Emerging Markets | | | Latin America | |
Purchases | | $ | 775,281,925 | | | $ | 110,113,024 | |
Sales | | | 539,360,936 | | | | 135,381,827 | |
It is each Fund’s policy to comply with the requirements of the Internal Revenue Code of 1986, as amended, applicable to regulated investment companies, and to distribute substantially all of its taxable income to its shareholders. Therefore, no U.S. federal income tax provision is required.
Each Fund files U.S. federal and various state and local tax returns. No income tax returns are currently under examination. The statute of limitations on each Fund’s U.S. federal tax returns generally remains open for each of the four years ended October 31, 2019. The statutes of limitations on each Fund’s state and local tax returns may remain open for an additional year depending upon the jurisdiction.
Management has analyzed tax laws and regulations and their application to the Funds as of October 31, 2019, inclusive of the open tax return years, and does not believe that there are any uncertain tax positions that require recognition of a tax liability in the Funds’ financial statements.
U.S. GAAP requires that certain components of net assets be adjusted to reflect permanent differences between financial and tax reporting. These reclassifications have no effect on net assets or NAVs per share. As of period end, the following permanent differences attributable to non-deductible expenses were reclassified to the following accounts:
| | | | | | | | |
| | | Emerging Markets | | | Latin America | |
Paid-in capital | | $ | (8,064 | ) | | $ | (7,804 | ) |
Accumulated earnings | | | 8,064 | | | | 7,804 | |
The tax character of distributions paid was as follows:
| | | | | | | | |
| | | Emerging Markets | | | Latin America | |
Ordinary income | | | | | | | | |
10/31/19 | | $ | 2,142,836 | | | $ | 1,459,516 | |
10/31/18 | | | 739,447 | | | | 1,620,387 | |
As of period end, the tax components of accumulated net earnings (losses) were as follows:
| | | | | | | | |
| | | Emerging Markets | | | Latin America | |
Undistributed ordinary income | | $ | 10,180,112 | | | $ | 2,476,422 | |
Non-expiring capital loss carryforwards(a). | | | (9,431,290 | ) | | | (15,796,643 | ) |
Net unrealized gains(b) | | | 58,073,766 | | | | 34,283,957 | |
| | | | | | | | |
| | $ | 58,822,588 | | | $ | 20,963,736 | |
| | | | | | | | |
| | (a) | Amounts available to offset future realized capital gains. | |
| | (b) | The difference between book-basis and tax-basis net unrealized gains was attributable primarily to the tax deferral of losses on wash sales, the realization for tax purposes of unrealized gains on investments in passive foreign investment companies, the realization for tax purposes of unrealized gains/losses on certain futures and foreign currency contracts, the accounting for swap agreements and the timing and recognition of partnership income. | |
During the year ended October 31, 2019, the Fund listed below utilized the following amounts of their respective capital loss carryforward:
| | | | |
| | | Latin America | |
Amount utilized | | $ | 4,249,426 | |
| | | | |
| NOTESTO FINANCIAL STATEMENTS | | | 39 | |
Notes to Financial Statements (continued)
As of October 31, 2019, gross unrealized appreciation and depreciation for investments and derivatives based on cost for U.S. federal income tax purposes were as follows:
| | | | | | | | |
| | | Emerging Markets | | | Latin America | |
Tax cost. | | $ | 592,111,805 | | | $ | 118,044,745 | |
| | | | | | | | |
Gross unrealized appreciation | | $ | 70,611,512 | | | $ | 37,722,034 | |
Gross unrealized depreciation | | | (12,563,132 | ) | | | (3,460,759 | ) |
| | | | | | | | |
Net unrealized appreciation | | $ | 58,048,380 | | | $ | 34,261,275 | |
| | | | | | | | |
The Funds, along with certain other funds managed by the Manager and its affiliates (“Participating Funds”), is a party to a364-day, $2.25 billion credit agreement with a group of lenders. Under this agreement, the Funds may borrow to fund shareholder redemptions. Excluding commitments designated for certain individual funds, the Participating Funds, including the Funds, can borrow up to an aggregate commitment amount of $1.75 billion at any time outstanding, subject to asset coverage and other limitations as specified in the agreement. The credit agreement has the following terms: a fee of 0.10% per annum on unused commitment amounts and interest at a rate equal to the higher of(a) one-month LIBOR (but, in any event, not less than 0.00%) on the date the loan is made plus 0.80% per annum or (b) the Fed Funds rate (but, in any event, not less than 0.00%) in effect from time to time plus 0.80% per annum on amounts borrowed. The agreement expires in April 2020 unless extended or renewed. Prior to April 18, 2019, Participating Funds paid an upfront commitment fee of 0.02% on the total commitment amounts, in addition to administration, legal and arrangement fees, which are included in miscellaneous expenses in the Statements of Operations. These fees were allocated among such funds based upon portions of the aggregate commitment available to them and relative net assets of Participating Funds. During the year ended October 31, 2019, the Funds did not borrow under the credit agreement.
In the normal course of business, certain Funds invest in securities or other instruments and may enter into certain transactions, and such activities subject each Fund to various risks, including among others, fluctuations in the market (market risk) or failure of an issuer to meet all of its obligations. The value of securities or other instruments may also be affected by various factors, including, without limitation: (i) the general economy; (ii) the overall market as well as local, regional or global political and/or social instability; (iii) regulation, taxation or international tax treaties between various countries; or (iv) currency, interest rate and price fluctuations. Each Fund’s prospectus provides details of the risks to which each Fund is subject.
Investments in the securities of issuers domiciled in countries with emerging capital markets involve certain additional risks that do not generally apply to investments in securities of issuers in more developed capital markets, such as (i) low or nonexistent trading volume, resulting in a lack of liquidity and increased volatility in prices for such securities; (ii) uncertain national policies and social, political and economic instability, increasing the potential for expropriation of assets, confiscatory taxation, high rates of inflation or unfavorable diplomatic developments; and (iii) possible fluctuations in exchange rates, differing legal systems and the existence or possible imposition of exchange controls, custodial restrictions or other foreign or U.S. governmental laws or restrictions applicable to such investments.
The Funds may be exposed to additional risks when reinvesting cash collateral in money market funds that do not seek to maintain a stable NAV per share of $1.00, which may be subject to redemption gates or liquidity fees under certain circumstances.
Valuation Risk: The market values of equities, such as common stocks and preferred securities or equity related investments, such as futures and options, may decline due to general market conditions which are not specifically related to a particular company. They may also decline due to factors which affect a particular industry or industries. A Fund may invest in illiquid investments. An illiquid investment is any investment that a Fund reasonably expects cannot be sold or disposed of in current market conditions in seven calendar days or less without the sale or disposition significantly changing the market value of the investment. A Fund may experience difficulty in selling illiquid investments in a timely manner at the price that they believe the investments are worth. Prices may fluctuate widely over short or extended periods in response to company, market or economic news. Markets also tend to move in cycles, with periods of rising and falling prices. This volatility may cause each Fund’s NAV to experience significant increases or decreases over short periods of time. If there is a general decline in the securities and other markets, the NAV of a Fund may lose value, regardless of the individual results of the securities and other instruments in which a Fund invests.
The price a Fund could receive upon the sale of any particular portfolio investment may differ from a Fund’s valuation of the investment, particularly for securities that trade in thin or volatile markets or that are valued using a fair valuation technique or a price provided by an independent pricing service. Changes to significant unobservable inputs and assumptions (i.e., publicly traded company multiples, growth rate, time to exit) due to the lack of observable inputs may significantly impact the resulting fair value and therefore a Fund’s results of operations. As a result, the price received upon the sale of an investment may be less than the value ascribed by a Fund, and a Fund could realize a greater than expected loss or lesser than expected gain upon the sale of the investment. A Fund’s ability to value its investments may also be impacted by technological issues and/or errors by pricing services or other third party service providers.
Counterparty Credit Risk:The Funds may be exposed to counterparty credit risk, or the risk that an entity may fail to or be unable to perform on its commitments related to unsettled or open transactions. The Funds manage counterparty credit risk by entering into transactions only with counterparties that the Manager believes have the financial resources to honor their obligations and by monitoring the financial stability of those counterparties. Financial assets, which potentially expose the Funds to market, issuer and counterparty credit risks, consist principally of financial instruments and receivables due from counterparties. The extent of the Funds’ exposure to market, issuer and counterparty credit risks with respect to these financial assets is approximately their value recorded in the Statements of Assets and Liabilities, less any collateral held by the Funds.
| | |
| 40 | | 2019 BLACKROCK ANNUAL REPORTTO SHAREHOLDERS |
Notes to Financial Statements (continued)
A derivative contract may suffer amark-to-market loss if the value of the contract decreases due to an unfavorable change in the market rates or values of the underlying instrument. Losses can also occur if the counterparty does not perform under the contract.
With exchange-traded futures, there is less counterparty credit risk to the Funds since the exchange or clearinghouse, as counterparty to such instruments, guarantees against a possible default. The clearinghouse stands between the buyer and the seller of the contract; therefore, credit risk is limited to failure of the clearinghouse. While offset rights may exist under applicable law, a Fund does not have a contractual right of offset against a clearing broker or clearinghouse in the event of a default (including the bankruptcy or insolvency). Additionally, credit risk exists in exchange-traded futures with respect to initial and variation margin that is held in a clearing broker’s customer accounts. While clearing brokers are required to segregate customer margin from their own assets, in the event that a clearing broker becomes insolvent or goes into bankruptcy and at that time there is a shortfall in the aggregate amount of margin held by the clearing broker for all its clients, typically the shortfall would be allocated on a pro rata basis across all the clearing broker’s customers, potentially resulting in losses to the Funds.
Concentration Risk:Latin America invests a substantial amount of their assets in issuers located in a single country or a limited number of countries. When the Fund concentrates its investments in this manner, it assumes the risk that economic, political and social conditions in those countries may have a significant impact on their investment performance. Foreign issuers may not be subject to the same uniform accounting, auditing and financial reporting standards and practices as used in the United States. Foreign securities markets may also be more volatile and less liquid than U.S. securities and may be less subject to governmental supervision not typically associated with investing in U.S. securities. Investment percentages in specific countries are presented in the Schedules of Investments.
Emerging Markets invests a significant portion of its assets in securities of issuers located in Asia or with significant exposure to Asian issuers or countries. The Asian financial markets have recently experienced volatility and adverse trends due to concerns in several Asian countries regarding monetary policy, government intervention in the markets, rising government debt levels or economic downturns. These events may spread to other countries in Asia and may affect the value and liquidity of certain of the Fund’s investments.
| 11. | CAPITAL SHARE TRANSACTIONS |
Transactions in capital shares for each class were as follows:
| | | | | | | | | | | | | | | | |
| | | Year Ended
10/31/19 | | | Year Ended
10/31/18 | |
| Emerging Markets | | Shares | | | Amount | | | Shares | | | Amount | |
Institutional | | | | | | | | | | | | | | | | |
Shares sold | | | 12,088,561 | | | $ | 278,694,896 | | | | 3,384,432 | | | $ | 77,931,207 | |
Shares issued in reinvestment of distributions | | | 36,673 | | | | 763,179 | | | | 13,350 | | | | 305,849 | |
Shares redeemed | | | (4,307,217 | ) | | | (98,532,465 | ) | | | (2,013,234 | ) | | | (46,255,182 | ) |
| | | | | | | | | | | | | | | | |
Net increase | | | 7,818,017 | | | $ | 180,925,610 | | | | 1,384,548 | | | $ | 31,981,874 | |
| | | | | | | | | | | | | | | | |
| | | | |
Investor A | | | | | | | | | | | | | | | | |
Shares sold | | | 2,162,003 | | | $ | 47,765,956 | | | | 1,053,700 | | | $ | 23,758,562 | |
Shares issued in reinvestment of distributions | | | 49,886 | | | | 1,002,228 | | | | 14,732 | | | | 325,576 | |
Shares redeemed | | | (1,823,297 | ) | | | (40,087,204 | ) | | | (2,428,708 | ) | | | (54,510,104 | ) |
| | | | | | | | | | | | | | | | |
Net increase (decrease) | | | 388,592 | | | $ | 8,680,980 | | | | (1,360,276 | ) | | $ | (30,425,966 | ) |
| | | | | | | | | | | | | | | | |
| | | | |
Investor C | | | | | | | | | | | | | | | | |
Shares sold | | | 197,076 | | | $ | 3,588,726 | | | | 175,217 | | | $ | 3,372,402 | |
Shares redeemed | | | (687,693 | ) | | | (12,548,184 | ) | | | (985,252 | ) | | | (18,697,435 | ) |
| | | | | | | | | | | | | | | | |
Net decrease | | | (490,617 | ) | | $ | (8,959,458 | ) | | | (810,035 | ) | | $ | (15,325,033 | ) |
| | | | | | | | | | | | | | | | |
| | |
| | | | | |
| Period from
01/25/18 (a) to 10/31/18 |
|
| | | | |
Class K | | | | | | | | | | | | | | | | |
Shares sold | | | 4,575,144 | | | $ | 104,690,393 | | | | 88,877 | | | $ | 2,136,812 | |
Shares issued in reinvestment of distributions | | | 662 | | | | 13,780 | | | | — | | | | — | |
Shares redeemed | | | (179,827 | ) | | | (4,162,697 | ) | | | (16,588 | ) | | | (368,915 | ) |
| | | | | | | | | | | | | | | | |
Net increase | | | 4,395,979 | | | $ | 100,541,476 | | | | 72,289 | | | $ | 1,767,897 | |
| | | | | | | | | | | | | | | | |
Total Net Increase (Decrease) | | | 12,111,971 | | | | 281,188,608 | | | | (713,474 | ) | | $ | (12,001,228 | ) |
| | | | | | | | | | | | | | | | |
| | | | |
| NOTESTO FINANCIAL STATEMENTS | | | 41 | |
Notes to Financial Statements (continued)
| | | | | | | | | | | | | | | | |
| | | Year Ended
10/31/19 | | | Year Ended
10/31/18 | |
| Latin America | | Shares | | | Amount | | | Shares | | | Amount | |
Institutional | | | | | | | | | | | | | | | | |
Shares sold | | | 397,884 | | | $ | 20,090,723 | | | | 511,404 | | | $ | 25,829,818 | |
Shares issued in reinvestment of distributions | | | 13,576 | | | | 627,207 | | | | 14,173 | | | | 678,883 | |
Shares redeemed | | | (635,011 | ) | | | (32,333,395 | ) | | | (608,857 | ) | | | (29,561,536 | ) |
| | | | | | | | | | | | | | | | |
Net decrease | | | (223,551 | ) | | $ | (11,615,465 | ) | | | (83,280 | ) | | $ | (3,052,835 | ) |
| | | | | | | | | | | | | | | | |
| | | | |
Investor A | | | | | | | | | | | | | | | | |
Shares sold | | | 246,309 | | | $ | 12,263,903 | | | | 188,703 | | | $ | 9,443,430 | |
Shares issued in reinvestment of distributions | | | 14,495 | | | | 662,163 | | | | 15,993 | | | | 757,299 | |
Shares redeemed | | | (405,893 | ) | | | (20,258,538 | ) | | | (551,694 | ) | | | (26,525,071 | ) |
| | | | | | | | | | | | | | | | |
Net decrease | | | (145,089 | ) | | $ | (7,332,472 | ) | | | (346,998 | ) | | $ | (16,324,342 | ) |
| | | | | | | | | | | | | | | | |
| | | | |
Investor B(b) | | | | | | | | | | | | | | | | |
Shares redeemed | | | — | | | $ | — | | | | (421 | ) | | $ | (19,131 | ) |
| | | | | | | | | | | | | | | | |
Net decrease | | | — | | | $ | — | | | | (421 | ) | | $ | (19,131 | ) |
| | | | | | | | | | | | | | | | |
| | | | |
Investor C | | | | | | | | | | | | | | | | |
Shares sold | | | 7,139 | | | $ | 329,235 | | | | 17,719 | | | $ | 828,685 | |
Shares issued in reinvestment of distributions | | | — | | | | — | | | | — | | | | — | |
Shares redeemed | | | (145,500 | ) | | | (6,472,095 | ) | | | (123,881 | ) | | | (5,384,242 | ) |
| | | | | | | | | | | | | | | | |
Net decrease | | | (138,361 | ) | | $ | (6,142,860 | ) | | | (106,162 | ) | | $ | (4,555,557 | ) |
| | | | | | | | | | | | | | | | |
| | |
| | | | | | Period from
01/25/18 (a)
to 10/31/18 | |
Class K | | | | | | | | | | | | | | | | |
Shares sold | | | 2,386 | | | $ | 120,960 | | | | 21,112 | | | $ | 1,132,641 | |
Shares issued in reinvestment of distributions | | | 157 | | | | 7,260 | | | | — | | | | — | |
Shares redeemed | | | (4,107 | ) | | | (208,667 | ) | | | (5,082 | ) | | | (233,113 | ) |
| | | | | | | | | | | | | | | | |
Net increase (decrease) | | | (1,564 | ) | | $ | (80,447 | ) | | | 16,030 | | | $ | 899,528 | |
| | | | | | | | | | | | | | | | |
Total Net Decrease | | | (508,565 | ) | | $ | (25,171,244 | ) | | | (520,831 | ) | | $ | (23,052,337 | ) |
| | | | | | | | | | | | | | | | |
| | (a) | Commencement of operations. | |
| | (b) | On December 27, 2017, all issued and outstanding Investor B Shares were converted into Investor A Shares. | |
As of October 31, 2019, shares owned by BlackRock Financial Management, Inc., an affiliate of the Funds, were as follows:
| | | | |
| | | Class K | |
Emerging Markets | | | 7,701 | |
Latin America | | | 3,577 | |
Management’s evaluation of the impact of all subsequent events on the Funds’ financial statements was completed through the date the financial statements were issued and the following items were noted:
On November 13, 2019, the Board approved a change in the fiscal year end (“FYE”) of Emerging Markets and Latin America, effective as of April 30, 2020, as follows:
| | | | | | | | |
| | | Current FYE | | | Approved FYE | |
Emerging Markets | | | October 31 | | | | April 30 | |
Latin America | | | October 31 | | | | April 30 | |
| | |
| 42 | | 2019 BLACKROCK ANNUAL REPORTTO SHAREHOLDERS |
Report of Independent Registered Public Accounting Firm
To the Shareholders and Board of Directors of BlackRock Emerging Markets Fund, Inc. and BlackRock Latin America Fund, Inc.:
Opinion on the Financial Statements and Financial Highlights
We have audited the accompanying statements of assets and liabilities of BlackRock Emerging Markets Fund, Inc. and BlackRock Latin America Fund, Inc. (the “Funds”), including the schedules of investments as of October 31, 2019, the related statements of operations for the year then ended, the statements of changes in net assets for each of the two years in the period then ended, the financial highlights for each of the five years in the period then ended, and the related notes. In our opinion, the financial statements and financial highlights present fairly, in all material respects, the financial position of the Funds as of October 31, 2019, the results of their operations for the year then ended, the changes in their net assets for each of the two years in the period then ended, and the financial highlights for each of the five years in the period then ended, in conformity with accounting principles generally accepted in the United States of America.
Basis for Opinion
These financial statements and financial highlights are the responsibility of the Funds’ management. Our responsibility is to express an opinion on the Funds’ financial statements and financial highlights based on our audits. We are a public accounting firm registered with the Public Company Accounting Oversight Board (United States) (PCAOB) and are required to be independent with respect to the Funds in accordance with the U.S. federal securities laws and the applicable rules and regulations of the Securities and Exchange Commission and the PCAOB.
We conducted our audits in accordance with the standards of the PCAOB. Those standards require that we plan and perform the audit to obtain reasonable assurance about whether the financial statements and financial highlights are free of material misstatement, whether due to error or fraud. The Funds are not required to have, nor were we engaged to perform, an audit of their internal control over financial reporting. As part of our audits we are required to obtain an understanding of internal control over financial reporting but not for the purpose of expressing an opinion on the effectiveness of the Funds’ internal control over financial reporting. Accordingly, we express no such opinion.
Our audits included performing procedures to assess the risks of material misstatement of the financial statements and financial highlights, whether due to error or fraud, and performing procedures that respond to those risks. Such procedures included examining, on a test basis, evidence regarding the amounts and disclosures in the financial statements and financial highlights. Our audits also included evaluating the accounting principles used and significant estimates made by management, as well as evaluating the overall presentation of the financial statements and financial highlights. Our procedures included confirmation of securities owned as of October 31, 2019, by correspondence with the custodian and brokers; when replies were not received from brokers, we performed other auditing procedures. We believe that our audits provide a reasonable basis for our opinion.
Deloitte & Touche LLP
Boston, Massachusetts
December 20, 2019
We have served as the auditor of one or more BlackRock investment companies since 1992.
Important Tax Information (unaudited)
During fiscal year ended October 31, 2019, the following information is provided with respect to the ordinary income distributions paid by the Funds:
| | | | | | | | | | |
| | | Payable Date | | Emerging Markets | | | Latin America | |
Qualified Dividend Income for Individuals(a)(b). | | 12/17/18 | | | 100.00% | | | | 100.00% | |
| | 12/17/18 | | | 1.07 | | | | 1.35 | |
Foreign Source Income(b) | | 12/17/18 | | | 97.36 | | | | 91.80 | |
Foreign Taxes Paid Per Share(c) | | 12/17/18 | | $ | 0.040418 | | | $ | 0.127561 | |
| | (a) | The Funds hereby designate the percentage indicated above or the maximum allowable by law. | |
| | (b) | Expressed as a percentage of the cash distribution grossed-up for foreign taxes. | |
| | (c) | The foreign taxes paid represent taxes incurred by the Fund on income received by the Fund from foreign sources. Foreign taxes paid may be included in taxable income with an offsetting deduction from gross income or may be taken as a credit for taxes paid to foreign governments. You should consult your tax advisor regarding the appropriate treatment of foreign taxes paid. | |
| | | | |
| REPORT OF INDEPENDENT REGISTERED PUBLIC ACCOUNTING FIRM | | | 43 | |
Disclosure of Investment Advisory Agreements and Sub-Advisory Agreement
The Board of Directors of BlackRock Emerging Markets Fund, Inc. (“Emerging Markets Fund”) met in person on April 17, 2019 and May 14-15, 2019 to consider the approval of the investment advisory agreement (the “Emerging Markets Advisory Agreement”) between Emerging Markets Fund and BlackRock Advisors, LLC (the “Manager”), its investment advisor. The Board of Directors of Emerging Markets Fund also considered the approval of the sub-advisory agreement (the “Emerging Markets Sub-Advisory Agreement”) between the Manager and BlackRock Asset Management North Asia Limited (the “Sub-Advisor”) with respect to Emerging Markets Fund.
The Board of Directors of BlackRock Latin America Fund, Inc. (“Latin America Fund”) met in person on April 17, 2019 and May 14-15, 2019 to consider the approval of the investment advisory agreement (the “Latin America Advisory Agreement”) between Latin America Fund and the Manager, its investment advisor.
Emerging Markets Fund and Latin America Fund are referred to herein individually as a “Fund” or collectively as the “Funds.” The Manager and the Sub-Advisor are referred to herein as “BlackRock.” The Emerging Markets Advisory Agreement, the Emerging Markets Sub-Advisory Agreement and the Latin America Advisory Agreement are referred to herein individually as an “Agreement” or collectively as the “Agreements.” For simplicity: (a) the Board of Directors of Emerging Markets Fund and the Board of Directors of Latin America Fund are referred to herein individually as the “Board” and collectively as the “Boards” and the members are referred to as “Board Members”; and (b) the meetings held on April 17, 2019 are referred to as the “April Meeting” and the meetings held on May 14-15, 2019 are referred to as the “May Meeting.”
Activities and Composition of the Boards
On the date of the May Meeting, each Board consisted of fifteen individuals, thirteen of whom were not “interested persons” of the pertinent Fund as defined in the Investment Company Act of 1940, as amended (the “1940 Act”) (the “Independent Board Members”). The Board Members are responsible for the oversight of the operations of the pertinent Fund and perform the various duties imposed on the directors of investment companies by the 1940 Act. The Independent Board Members have retained independent legal counsel to assist them in connection with their duties. The Chair of each Board is an Independent Board Member. Each Board has established five standing committees: an Audit Committee, a Governance and Nominating Committee, a Compliance Committee, a Performance Oversight Committee and an Ad Hoc Topics Committee, each of which is chaired by an Independent Board Member and composed of Independent Board Members (except for the Ad Hoc Topics Committee, which also has one interested Board Member).
The Agreements
Consistent with the requirements of the 1940 Act, each Board considers the continuation of the pertinent Agreement(s) on an annual basis. The Boards have four quarterly meetings per year, each typically extending for two days, and additional in-person and telephonic meetings throughout the year, as needed. While the Boards also have a fifth one-day meeting to consider specific information surrounding the renewal of the pertinent Agreement(s), each Board’s consideration entails a year-long deliberative process whereby the Board and its committees assess BlackRock’s services to the Fund. In particular, the Board assessed, among other things, the nature, extent and quality of the services provided to the pertinent Fund by BlackRock, BlackRock’s personnel and affiliates, including (as applicable): investment management; accounting, administrative and shareholder services; oversight of the pertinent Fund’s service providers; risk management and oversight; legal and compliance services; and ability to meet applicable legal and regulatory requirements. Throughout the year, including during the contract renewal process, the Independent Board Members were advised by independent legal counsel, and met with independent legal counsel in various executive sessions outside of the presence of management.
During the year, the Boards, acting directly and through their committees, consider information that is relevant to their annual consideration of the renewal of the pertinent Agreement(s), including the services and support provided by BlackRock to the Funds and their shareholders. BlackRock also furnished additional information to the Boards in response to specific questions from the Boards. This additional information is discussed further below in the section titled “Board Considerations in Approving the Agreements.” Among the matters the Boards considered, with respect to each Fund, as pertinent, were: (a) investment performance for one-year, three-year, five-year, ten-year, and/or since inception periods, as applicable, against peer funds, applicable benchmark, and performance metrics, as applicable, as well as senior management’s and portfolio managers’ analyses of the reasons for any over-performance or under-performance relative to its peers, benchmarks, and other performance metrics, as applicable; (b) fees, including advisory, administration, if applicable, and other amounts paid to BlackRock and its affiliates by the Fund for services; (c) Fund operating expenses and how BlackRock allocates expenses to the Fund; (d) the resources devoted to, risk oversight of, and compliance reports relating to, implementation of the Fund’s investment objective, policies and restrictions, and meeting regulatory requirements; (e) BlackRock and the Fund’s adherence to applicable compliance policies and procedures; (f) the nature, character and scope of non-investment management services provided by BlackRock and its affiliates and the estimated cost of such services; (g) BlackRock’s and other service providers’ internal controls and risk and compliance oversight mechanisms; (h) BlackRock’s implementation of the proxy voting policies approved by the Board; (i) the use of brokerage commissions and execution quality of portfolio transactions; (j) BlackRock’s implementation of the Fund’s valuation and liquidity procedures; (k) an analysis of management fees for products with similar investment mandates across the open-end fund, exchange-traded fund (“ETF”), closed-end fund, sub-advised mutual fund, separately managed account, collective investment trust, and institutional separate account product channels, as applicable, and the similarities and differences between these products and the services provided as compared to the Fund; (l) BlackRock’s compensation methodology for its investment professionals and the incentives and accountability it creates, along with investment professionals’ investments in the fund(s) they manage; and (m) periodic updates on BlackRock’s business.
Board Considerations in Approving the Agreements
The Approval Process: Prior to the April Meeting, the Boards requested and received materials specifically relating to the Agreements. The Independent Board Members are continuously engaged in a process with their independent legal counsel and BlackRock to review the nature and scope of the information provided to better assist their deliberations. The materials provided in connection with the April Meeting included, among other things: (a) information independently compiled and prepared by Broadridge Financial Solutions, Inc. (“Broadridge”), based on either a Lipper classification or Morningstar category, regarding the fees and expenses of each Fund as compared with a peer group of funds as determined by Broadridge (“Expense Peers”) and the investment performance of each Fund as compared with a peer group of funds (“Performance Peers”) and other metrics, as applicable; (b) information on the composition of the Expense Peers and Performance Peers, and a description of Broadridge’s methodology; (c) information on the estimated profits realized by BlackRock and its affiliates pursuant to the Agreements and a discussion of fall-out benefits
| | |
| 44 | | 2019 BLACKROCK ANNUAL REPORTTO SHAREHOLDERS |
Disclosure of Investment Advisory Agreements and Sub-Advisory Agreement (continued)
to BlackRock and its affiliates; (d) a general analysis provided by BlackRock concerning investment management fees received in connection with other types of investment products, such as institutional accounts, sub-advised mutual funds, ETFs, closed-end funds, open-end funds, and separately managed accounts, under similar investment mandates, as well as the performance of such other products, as applicable; (e) review of non-management fees; (f) the existence, impact and sharing of potential economies of scale, if any, with the Funds; (g) a summary of aggregate amounts paid by each Fund to BlackRock; (h) sales and redemption data regarding each Fund’s shares; and (i) various additional information requested by the Boards as appropriate regarding BlackRock’s and the Funds’ operations.
At the April Meeting, each Board reviewed materials relating to its consideration of the pertinent Agreements. As a result of the discussions that occurred during the April Meeting, and as a culmination of each Board’s year-long deliberative process, the Boards presented BlackRock with questions and requests for additional information. BlackRock responded to these requests with additional written information in advance of the May Meeting.
At the May Meeting, each Board concluded, with respect to the pertinent Fund, its assessment of, among other things: (a) the nature, extent and quality of the services provided by BlackRock; (b) the investment performance of the Fund as compared with Performance Peers and other metrics, as applicable; (c) the advisory fee and the estimated cost of the services and estimated profits realized by BlackRock and its affiliates from their relationship with the Fund; (d) the Fund’s fees and expenses compared to Expense Peers; (e) the sharing of potential economies of scale; (f) fall-out benefits to BlackRock and its affiliates as a result of BlackRock’s relationship with the Fund; and (g) other factors deemed relevant by the Board Members.
Each Board also considered other matters it deemed important to the approval process, such as other payments made to BlackRock or its affiliates relating to securities lending and cash management, and BlackRock’s services related to the valuation and pricing of the portfolio holdings of the pertinent Fund. Each Board noted the willingness of BlackRock personnel to engage in open, candid discussions with the Board. The Boards did not identify any particular information as determinative, and each Board Member may have attributed different weights to the various items considered.
A. Nature, Extent and Quality of the Services Provided by BlackRock: Each Board, including the Independent Board Members, reviewed the nature, extent and quality of services provided by BlackRock, including the investment advisory services and the resulting performance of the applicable Fund. Throughout the year, each Board compared Fund performance to the performance of a comparable group of mutual funds, relevant benchmark, and performance metrics, as applicable. The Boards met with BlackRock’s senior management personnel responsible for investment activities, including the senior investment officers. Each Board also reviewed the materials provided by the applicable Fund’s portfolio management team discussing the Fund’s performance and the Fund’s investment objective, strategies and outlook.
Each Board considered, among other factors, with respect to BlackRock: the number, education and experience of investment personnel generally and the applicable Fund’s portfolio management team; BlackRock’s research capabilities; investments by portfolio managers in the funds they manage; portfolio trading capabilities; use of technology; commitment to compliance; credit analysis capabilities; risk analysis and oversight capabilities; and the approach to training and retaining portfolio managers and other research, advisory and management personnel. The Boards also considered BlackRock’s overall risk management program, including the continued efforts of BlackRock and its affiliates to address cybersecurity risks and the role of BlackRock’s Risk and Quantitative Analysis Group. Each Board engaged in a review of BlackRock’s compensation structure with respect to the applicable Fund’s portfolio management team and BlackRock’s ability to attract and retain high-quality talent and create performance incentives.
In addition to investment advisory services, the Boards considered the nature and quality of the administrative and other non-investment advisory services provided to the Funds. BlackRock and its affiliates provide the Funds with certain administrative, shareholder and other services (in addition to any such services provided to the Funds by third parties) and officers and other personnel as are necessary for the operations of the Funds. In particular, BlackRock and its affiliates provide each Fund with administrative services including, among others: (i) responsibility for disclosure documents, such as the prospectus, the summary prospectus (as applicable), the statement of additional information and periodic shareholder reports; (ii) oversight of daily accounting and pricing; (iii) responsibility for periodic filings with regulators; (iv) overseeing and coordinating the activities of other service providers, including, among others, the Fund’s custodian, fund accountant, transfer agent, and auditor; (v) organizing Board meetings and preparing the materials for such Board meetings; (vi) providing legal and compliance support; (vii) furnishing analytical and other support to assist the Fund’s Board in its consideration of strategic issues such as the merger, consolidation or repurposing of certain open-end funds; and (viii) performing or managing administrative functions necessary for the operation of the Fund, such as tax reporting, expense management, fulfilling regulatory filing requirements, overseeing the Fund’s distribution partners, and shareholder call center and other services. The Boards reviewed the structure and duties of BlackRock’s fund administration, shareholder services, and legal and compliance departments and considered BlackRock’s policies and procedures for assuring compliance with applicable laws and regulations.
B. The Investment Performance of the Funds and BlackRock: Each Board, including the Independent Board Members, also reviewed and considered the performance history of the applicable Fund. In preparation for the April Meeting, the Boards were provided with reports independently prepared by Broadridge, which included a comprehensive analysis of each Fund’s performance as of December 31, 2018. Broadridge ranks funds in quartiles, ranging from first to fourth, where first is the most desirable quartile position and fourth is the least desirable. In connection with its review, each Board received and reviewed information regarding the investment performance of the pertinent Fund as compared to its Performance Peers. Each Board and its Performance Oversight Committee regularly review, and meet with Fund management to discuss, the performance of the pertinent Fund throughout the year.
In evaluating performance, the Boards focused particular attention on funds with less favorable performance records. The Board also noted that while it found the data provided by Broadridge generally useful, it recognized the limitations of such data, including in particular, that notable differences may exist between a fund and the Performance Peer funds (for example, the investment objective(s) and investment strategies). Further, the Boards recognized that the performance data reflects a snapshot of a period as of a particular date and that selecting a different performance period could produce significantly different results. The Board also acknowledged that long-term performance could be impacted by even one period of significant outperformance or underperformance, and that a single investment theme could have the ability to affect long-term performance disproportionately.
The Board noted that for the one-, three- and five-year periods reported, Emerging Markets Fund ranked in the first, first and second quartiles, respectively, against its Performance Peers.
| | | | |
| DISCLOSUREOF INVESTMENT ADVISORY AGREEMENTSAND SUB-ADVISORY AGREEMENT | | | 45 | |
Disclosure of Investment Advisory Agreements and Sub-Advisory Agreement (continued)
The Board noted that for the one-, three- and five-year periods reported, Latin America Fund ranked in the second, fourth, and second quartiles, respectively, against its Performance Peers. The Board and BlackRock reviewed the Fund’s underperformance during the applicable period. The Board was informed that, among other things, asset allocation decisions surrounding Brazil, Mexico and Chile impacted the Fund’s peer relative performance. The Board and BlackRock discussed BlackRock’s strategy for improving the Fund’s investment performance. Discussions covered topics such as performance attribution, the Fund’s investment personnel, and the resources appropriate to support the Fund’s investment processes.
C. Consideration of the Advisory/Management Fees and the Estimated Cost of the Services and Estimated Profits Realized by BlackRock and its Affiliates from their Relationship with the Funds: Each Board, including the Independent Board Members, reviewed the applicable Fund’s contractual management fee rate compared with those of its Expense Peers. The contractual management fee rate represents a combination of the advisory fee and any administrative fees, before taking into account any reimbursements or fee waivers. Each Board also compared the applicable Fund’s total expense ratio, as well as its actual management fee rate, to those of its Expense Peers. The total expense ratio represents a fund’s total net operating expenses, including any 12b-1 or non 12b-1 service fees. The total expense ratio gives effect to any expense reimbursements or fee waivers that benefit a fund, and the actual management fee rate gives effect to any management fee reimbursements or waivers that benefit a fund. The Boards considered the services provided and the fees charged by BlackRock and its affiliates to other types of clients with similar investment mandates, as applicable, including institutional accounts and sub-advised mutual funds (including mutual funds sponsored by third parties).
The Boards received and reviewed statements relating to BlackRock’s financial condition. The Boards reviewed BlackRock’s profitability methodology and were also provided with an estimated profitability analysis that detailed the revenues earned and the expenses incurred by BlackRock for services provided to the Funds. The Boards reviewed BlackRock’s estimated profitability with respect to the Funds and other funds the Boards currently oversee for the year ended December 31, 2018 compared to available aggregate estimated profitability data provided for the prior two years. The Boards reviewed BlackRock’s estimated profitability with respect to certain other U.S. fund complexes managed by the Manager and/or its affiliates. The Boards reviewed BlackRock’s assumptions and methodology of allocating expenses in the estimated profitability analysis, noting the inherent limitations in allocating costs among various advisory products. The Boards recognized that profitability may be affected by numerous factors including, among other things, fee waivers and expense reimbursements by the Manager, the types of funds managed, precision of expense allocations and business mix. The Boards thus recognized that calculating and comparing profitability at individual fund levels is difficult.
The Boards noted that, in general, individual fund or product line profitability of other advisors is not publicly available. The Boards reviewed BlackRock’s overall operating margin, in general, compared to that of certain other publicly-traded asset management firms. The Boards considered the differences between BlackRock and these other firms, including the contribution of technology at BlackRock, BlackRock’s expense management, and the relative product mix.
In addition, each Board considered the estimated cost of the services provided to the applicable Fund by BlackRock, and BlackRock’s and its affiliates’ estimated profits relating to the management of the applicable Fund and the other funds advised by BlackRock and its affiliates. As part of its analysis, each Board reviewed BlackRock’s methodology in allocating its costs of managing the applicable Fund, to the Fund. Each Board considered whether BlackRock has the financial resources necessary to attract and retain high quality investment management personnel to perform its obligations under the pertinent Agreement(s) and to continue to provide the high quality of services that is expected by the Board. The Boards further considered factors including but not limited to BlackRock’s commitment of time, assumption of risk, and liability profile in servicing the Funds, including in contrast to what is required of BlackRock with respect to other products with similar investment mandates across the open-end fund, ETF, closed-end fund, sub-advised mutual fund, separately managed account, collective investment trust, and institutional separate account product channels, as applicable.
The Board noted that Emerging Markets Fund’s contractual management fee rate ranked in the first quartile, and that the actual management fee rate and total expense ratio each ranked in the first quartile, relative to the Fund’s Expense Peers. The Board also noted that the Fund has an advisory fee arrangement that includes breakpoints that adjust the fee rate downward as the size of the Fund increases above certain contractually specified levels. The Board noted that if the size of the Fund were to decrease, the Fund could lose the benefit of one or more breakpoints. The Board further noted that BlackRock and the Board agreed to a contractual adjustment to reduce specified levels within the breakpoint schedule. This adjustment was implemented on March 15, 2018. In addition, the Board noted that BlackRock and the Board agreed to a contractual expense cap on the Fund’s total expenses as a percentage of the Fund’s average daily net assets on a class-by-class basis. The contractual expense cap was implemented on March 15, 2018.
The Board noted that Latin America Fund’s contractual management fee rate ranked in the second quartile, and that the actual management fee rate and total expense ratio each ranked in the fourth quartile, relative to the Fund’s Expense Peers. The Board also noted that the Fund has an advisory fee arrangement that includes breakpoints that adjust the fee rate downward as the size of the Fund increases above certain contractually specified levels. The Board noted that if the size of the Fund were to decrease, the Fund could lose the benefit of one or more breakpoints.
D. Economies of Scale: Each Board, including the Independent Board Members, considered the extent to which economies of scale might be realized as the assets of the pertinent Fund increase, including the existence of fee waivers and/or expense caps, as applicable, noting that any contractual fee waivers and expense caps had been approved by the Board. Each Board also considered the extent to which the applicable Fund benefits from such economies in a variety of ways and whether there should be changes in the advisory fee rate or breakpoint structure in order to enable the Fund to more fully participate in these economies of scale. Each Board considered the applicable Fund’s asset levels and whether the current fee schedule was appropriate. In their consideration, the Board Members took into account the existence of any expense caps and further considered the continuation and/or implementation, as applicable, of such caps.
E. Other Factors Deemed Relevant by the Board Members: Each Board, including the Independent Board Members, also took into account other ancillary or “fall-out” benefits that BlackRock or its affiliates may derive from BlackRock’s respective relationships with the applicable Fund, both tangible and intangible, such as BlackRock’s ability to leverage its investment professionals who manage other portfolios and risk management personnel, an increase in BlackRock’s profile in the investment advisory community, and the engagement of BlackRock’s affiliates as service providers to the Fund, including for administrative, distribution, securities lending and cash management services. The Board also considered BlackRock’s overall operations and its efforts to expand the scale of, and improve the quality of, its operations. The Board also noted that, subject to applicable law, BlackRock may use and benefit from third-party research obtained by soft dollars generated by certain registered fund transactions to assist in managing all or a number of its other client accounts.
| | |
| 46 | | 2019 BLACKROCK ANNUAL REPORTTO SHAREHOLDERS |
Disclosure of Investment Advisory Agreements and Sub-Advisory Agreement (continued)
In connection with their consideration of the Agreements, the Boards also received information regarding BlackRock’s brokerage and soft dollar practices. The Boards received reports from BlackRock which included information on brokerage commissions and trade execution practices throughout the year.
The Boards noted the competitive nature of the open-end fund marketplace, and that shareholders are able to redeem their Fund shares if they believe that the pertinent Fund’s fees and expenses are too high or if they are dissatisfied with the performance of the Fund.
Conclusion
The Board of Emerging Markets Fund, including the Independent Board Members, unanimously approved the continuation of the Emerging Markets Advisory Agreement between the Manager and Emerging Markets Fund for a one-year term ending June 30, 2020, and the Emerging Markets Sub-Advisory Agreement between the Manager and the Sub-Advisor with respect to Emerging Markets Fund for a one-year term ending June 30, 2020.
The Board of Latin America Fund, including the Independent Board Members, unanimously approved the continuation of the Latin America Advisory Agreement between the Manager and Latin America Fund for a one-year term ending June 30, 2020.
Based upon their evaluation of all of the aforementioned factors in their totality, as well as other information, the Boards, including the Independent Board Members, were satisfied that the terms of the Agreements were fair and reasonable and in the best interest of each Fund, as pertinent, and its shareholders. In arriving at its decision to approve the Agreements, the Boards did not identify any single factor or group of factors as all-important or controlling, but considered all factors together, and different Board Members may have attributed different weights to the various factors considered. The Independent Board Members were also assisted by the advice of independent legal counsel in making this determination.
| | | | |
| DISCLOSUREOF INVESTMENT ADVISORY AGREEMENTSAND SUB-ADVISORY AGREEMENT | | | 47 | |
Director and Officer Information
| | | | | | | | |
| Independent Directors (a) |
| | | | | |
Name
Year of Birth (b) | | Position(s) Held
(Length of Service) (c) | | Principal Occupation(s) During Past Five Years | | Number of BlackRock-Advised
Registered Investment Companies
(“RICs”) Consisting of
Investment Portfolios
(“Portfolios”) Overseen | | Public Company and Other Investment Company
Directorships Held During
Past Five Years |
Mark Stalnecker 1951 | | Chair of the Board (Since 2019) and Director (Since 2015) | | Chief Investment Officer, University of Delaware from 1999 to 2013; Trustee and Chair of the Finance and Investment Committees, Winterthur Museum and Country Estate from 2005 to 2016; Member of the Investment Committee, Delaware Public Employees’ Retirement System since 2002; Member of the Investment Committee, Christiana Care Health System from 2009 to 2017; Member of the Investment Committee, Delaware Community Foundation from 2013 to 2014; Director and Chair of the Audit Committee, SEI Private Trust Co. from 2001 to 2014. | | 37 RICs consisting of 181 Portfolios | | None |
Bruce R. Bond 1946 | | Director (Since 2019) | | Board Member, Amsphere Limited (software) since 2018; Trustee and Member of the Governance Committee, State Street Research Mutual Funds from 1997 to 2005; Board Member of Governance, Audit and Finance Committee, Avaya Inc. (computer equipment) from 2003 to 2007. | | 37 RICs consisting of 181 Portfolios | | None |
Susan J. Carter 1956 | | Director (Since 2016) | | Director, Pacific Pension Institute from 2014 to 2018; Advisory Board Member, Center for Private Equity and Entrepreneurship at Tuck School of Business since 1997; Senior Advisor, Commonfund Capital, Inc. (“CCI”) (investment adviser) in 2015; Chief Executive Officer, CCI from 2013 to 2014; President & Chief Executive Officer, CCI from 1997 to 2013; Advisory Board Member, Girls Who Invest from 2015 to 2018 and Board Member thereof since 2018; Advisory Board Member, Bridges Fund Management since 2016; Trustee, Financial Accounting Foundation since 2017; Practitioner Advisory Board Member, Private Capital Research Institute (“PCRI”) since 2017. | | 37 RICs consisting of 181 Portfolios | | None |
Collette Chilton 1958 | | Director (Since 2015) | | Chief Investment Officer, Williams College since 2006; Chief Investment Officer, Lucent Asset Management Corporation from 1998 to 2006. | | 37 RICs consisting of 181 Portfolios | | None |
Neil A. Cotty 1954 | | Director (Since 2016) | | Bank of America Corporation from 1996 to 2015, serving in various senior finance leadership roles, including Chief Accounting Officer from 2009 to 2015, Chief Financial Officer of Global Banking, Markets and Wealth Management from 2008 to 2009, Chief Accounting Officer from 2004 to 2008, Chief Financial Officer of Consumer Bank from 2003 to 2004, Chief Financial Officer of Global Corporate Investment Bank from 1999 to 2002. | | 37 RICs consisting of 181 Portfolios | | None |
Lena G. Goldberg 1949 | | Director (Since 2019) | | Senior Lecturer, Harvard Business School, since 2008; Director, Charles Stark Draper Laboratory, Inc. since 2013; FMR LLC/Fidelity Investments (financial services) from 1996 to 2008, serving in various senior roles including Executive Vice President — Strategic Corporate Initiatives and Executive Vice President and General Counsel; Partner, Sullivan & Worcester LLP from 1985 to 1996 and Associate thereof from 1979 to 1985. | | 37 RICs consisting of 181 Portfolios | | None |
Robert M. Hernandez 1944 | | Director (Since 2019) | | Director, Vice Chairman and Chief Financial Officer of USX Corporation (energy and steel business) from 1991 to 2001; Director andnon-executive Chairman, RTI International Metals, Inc. from 1990 to 2015; Director, TE Connectivity (electronics) from 2006 to 2012. | | 37 RICs consisting of 181 Portfolios | | Chubb Limited (insurance company); Eastman Chemical Company
|
| | |
| 48 | | 2019 BLACKROCK ANNUAL REPORTTO SHAREHOLDERS |
Director and Officer Information (continued)
| | | | | | | | |
| Independent Directors (a)(continued) |
| | | | | |
Name
Year of Birth (b) | | Position(s) Held
(Length of Service) (c) | | Principal Occupation(s) During Past Five Years | | Number of BlackRock-Advised
Registered Investment Companies
(“RICs”) Consisting of
Investment Portfolios
(“Portfolios”) Overseen | | Public Company and Other Investment Company
Directorships Held During
Past Five Years |
Henry R. Keizer 1956 | | Director (Since 2019) | | Director, Park Indemnity Ltd. (captive insurer) since 2010; Director, MUFG Americas Holdings Corporation and MUFG Union Bank, N.A. (financial and bank holding company) from 2014 to 2016; Director, American Institute of Certified Public Accountants from 2009 to 2011; Director, KPMG LLP (audit, tax and advisory services) from 2004 to 2005 and 2010 to 2012; Director, KPMG International in 2012, Deputy Chairman and Chief Operating Officer thereof from 2010 to 2012 and U.S. Vice Chairman of Audit thereof from 2005 to 2010; Global Head of Audit, KPMGI (consortium of KPMG firms) from 2006 to 2010; Director, YMCA of Greater New York from 2006 to 2010. | | 37 RICs consisting of 181 Portfolios | | Hertz Global Holdings (car rental); Montpelier Re Holdings, Ltd. (publicly held property and casualty reinsurance) from 2013 until 2015; Sealed Air Corp. (packaging); WABCO (commercial vehicle safety systems) |
Cynthia A. Montgomery 1952 | | Director (Since 2007) | | Professor, Harvard Business School since 1989. | | 37 RICs consisting of 181 Portfolios | | Newell Rubbermaid, Inc. (manufacturing) |
Donald C. Opatrny 1952 | | Director (Since 2019) | | Trustee, Vice Chair, Member of the Executive Committee and Chair of the Investment Committee, Cornell University since 2004; President, Trustee and Member of the Investment Committee, The Aldrich Contemporary Art Museum from 2007 to 2014; Member of the Board and Investment Committee, University School from 2007 to 2018; Member of the Investment Committee, Mellon Foundation from 2009 to 2015; Trustee, Artstor (a Mellon Foundation affiliate) from 2010 to 2015; President and Trustee, the Center for the Arts, Jackson Hole from 2011 to 2018; Director, Athena Capital Advisors LLC (investment management firm) since 2013; Trustee and Chair of the Investment Committee, Community Foundation of Jackson Hole since 2014; Member of Affordable Housing Supply Board of Jackson, Wyoming since 2018; Member, Investment Funds Committee, State of Wyoming since 2017; Trustee, Phoenix Art Museum since 2018. | | 37 RICs consisting of 181 Portfolios | | None |
Joseph P. Platt 1947 | | Director (Since 2007) | | General Partner, Thorn Partners, LP (private investments) since 1998; Director, WQED Multi-Media (public broadcastingnot-for-profit) since 2001; Chair, Basic Health International(non-profit) since 2015. | | 37 RICs consisting of 181 Portfolios | | Greenlight Capital Re, Ltd. (reinsurance company); Consol Energy Inc. |
Kenneth L. Urish 1951 | | Director (Since 2007) | | Managing Partner, Urish Popeck & Co., LLC (certified public accountants and consultants) since 1976; Past-Chairman of the Professional Ethics Committee of the Pennsylvania Institute of Certified Public Accountants and Committee Member thereof since 2007; Member of External Advisory Board, The Pennsylvania State University Accounting Department since founding in 2001; Principal, UP Strategic Wealth Investment Advisors, LLC since 2013; Trustee, The Holy Family Institute from 2001 to 2010; President and Trustee, Pittsburgh Catholic Publishing Associates from 2003 to 2008; Director,Inter-Tel from 2006 to 2007. | | 37 RICs consisting of 181 Portfolios | | None |
Claire A. Walton 1957 | | Director (Since 2016) | | Chief Operating Officer and Chief Financial Officer of Liberty Square Asset Management, LP from 1998 to 2015; General Partner of Neon Liberty Capital Management, LLC since 2003; Director, Boston Hedge Fund Group from 2009 to 2018; Director, Woodstock Ski Runners since 2013; Director, Massachusetts Council on Economic Education from 2013 to 2015. | | 37 RICs consisting of 181 Portfolios | | None |
| | | | |
| DIRECTORAND OFFICER INFORMATION | | | 49 | |
Director and Officer Information (continued)
| | | | | | | | |
| Interested Directors (a)(d) |
| | | | | |
Name
Year of Birth (b) | | Position(s) Held
(Length of Service) (c) | | Principal Occupation(s) During Past Five Years | | Number of Black Rock-Advised
Registered Investment Companies
(“RICs”) Consisting of
Investment Portfolios
(“Portfolios”) Overseen | | Public Company and Other
Investment Company
Directorships Held During
Past Five Years |
Robert Fairbairn 1965 | | Director (Since 2018) | | Vice Chairman of BlackRock, Inc. since 2019; Member of BlackRock’s Global Executive and Global Operating Committees;Co-Chair of BlackRock’s Human Capital Committee; Senior Managing Director of BlackRock, Inc. from 2010 to 2019; oversaw BlackRock’s Strategic Partner Program and Strategic Product Management Group from 2012 to 2019; Member of the Board of Managers of BlackRock Investments, LLC from 2011 to 2018; Global Head of BlackRock’s Retail and iShares® businesses from 2012 to 2016. | | 123 RICs consisting of 291 Portfolios | | None |
John M. Perlowski (e) 1964 | | Director (Since 2015) President and Chief Executive Officer (Since 2010) | | Managing Director of BlackRock, Inc. since 2009; Head of BlackRock Global Accounting and Product Services since 2009; Advisory Director of Family Resource Network (charitable foundation) since 2009. | | 124 RICs consisting of 292 Portfolios | | None |
(a) The address of each Director is c/o BlackRock, Inc.,55 East 52nd Street, New York, New York 10055. |
(b) Independent Directors serve until their resignation, retirement, removal or death, or until December 31 of the year in which they turn 75. The Board may determine to extend the terms of Independent Directors on acase-by-case basis, as appropriate. |
(c) Following the combination of MLIM and BlackRock, Inc. in September 2006, the various legacy MLIM and legacy BlackRock fund boards were realigned and consolidated into three new fund boards in 2007. Furthermore, effective January 1, 2019, three BlackRock Fund Complexes were realigned and consolidated into two BlackRock Fund Complexes. As a result, although the chart shows the year that each Independent Director joined the Board, certain Independent Directors first became members of the boards of other BlackRock-advised Fund, legacy MLIM funds or legacy BlackRock funds as follows: Bruce R. Bond, 2005; Robert M. Hernandez, 1996; Cynthia A. Montgomery, 1994; Joseph P. Platt, 1999; Kenneth L. Urish, 1999; Lena G. Goldberg, 2016; Henry R. Keizer, 2016; Donald C. Opatrny, 2015. |
(d) Mr. Fairbairn and Mr. Perlowski are both “interested persons,” as defined in the 1940 Act, of the Funds based on their positions with BlackRock, Inc. and its affiliates. Mr. Fairbairn and Mr. Perlowski are also board members of the BlackRock Fixed-Income Complex. |
(e) Mr. Perlowski is also a trustee of the BlackRock Credit Strategies Fund. |
| | |
| 50 | | 2019 BLACKROCK ANNUAL REPORTTO SHAREHOLDERS |
Director and Officer Information (continued)
| | | | |
| Officers Who Are Not Directors (a) |
| | | |
Name
Year of Birth(b) | | Position(s) Held
(Length of Service) | | Principal Occupation(s) During Past Five Years |
Jennifer McGovern 1977 | | Vice President (Since 2014) | | Managing Director of BlackRock, Inc. since 2016; Director of BlackRock, Inc. from 2011 to 2015; Head of Product Development and Oversight for BlackRock’s Strategic Product Management Group since 2019; Head of Product Structure and Oversight for BlackRock’s U.S. Wealth Advisory Group from 2013 to 2019. |
Neal J. Andrews 1966 | | Chief Financial Officer (Since 2007) | | Chief Financial Officer of the iShares® exchange traded funds since 2019; Managing Director of BlackRock, Inc. since 2006. |
Jay M. Fife 1970 | | Treasurer (Since 2007) | | Managing Director of BlackRock, Inc. since 2007. |
Charles Park 1967 | | Chief Compliance Officer (Since 2014) | | Anti-Money Laundering Compliance Officer for certain BlackRock-advised Funds from 2014 to 2015; Chief Compliance Officer of BlackRock Advisors, LLC and the BlackRock-advised Funds in the BlackRock Multi-Asset Complex and the BlackRock Fixed-Income Complex since 2014; Principal of and Chief Compliance Officer for iShares® Delaware Trust Sponsor LLC since 2012 and BlackRock Fund Advisors (“BFA”) since 2006; Chief Compliance Officer for theBFA-advised iShares® exchange traded funds since 2006; Chief Compliance Officer for BlackRock Asset Management International Inc. since 2012. |
Lisa Belle 1968 | | Anti-Money Laundering Compliance Officer (Since 2019) | | Managing Director of BlackRock, Inc. since 2019; Global Financial Crime Head for Asset and Wealth Management of JP Morgan from 2013 to 2019; Managing Director of RBS Securities from 2012 to 2013; Head of Financial Crimes for Barclays Wealth Americas from 2010 to 2012. |
Janey Ahn 1975 | | Secretary (Since 2019) | | Managing Director of BlackRock, Inc. since 2018; Director of BlackRock, Inc. from 2009 to 2017. |
(a) The address of each Officer is c/o BlackRock, Inc., 55 East 52nd Street, New York, New York 10055. |
(b) Officers of the Fund serve at the pleasure of the Board. |
Further information about the Funds’ Directors and Officers is available in the Funds’ Statement of Additional Information, which can be obtained without charge by calling (800)441-7762.
Effective September 19, 2019, Lisa Belle replaced John MacKessy as the Anti-Money Laundering Compliance Officer of the Funds.
Effective September 19, 2019, Janey Ahn replaced Benjamin Archibald as the Secretary of the Funds.
Investment Adviser
BlackRock Advisors, LLC
Wilmington, DE 19809
Distributor
BlackRock Investments, LLC
New York, NY 10022
Sub-Adviser
BlackRock Asset Management
North Asia Limited(a)
Hong Kong
Independent Registered Public Accounting Firm
Deloitte & Touche LLP
Boston, MA 02116
Custodian
Brown Brothers Harriman & Co.
Boston, MA 02109
Legal Counsel
Sidley Austin LLP
New York, NY 10019
Transfer Agent
BNY Mellon Investment Servicing (US) Inc.
Wilmington, DE 19809
Accounting Agent
State Street Bank and Trust Company
Boston, MA 02111
Address of the Funds
100 Bellevue Parkway
Wilmington, DE 19809
| (a) | For Emerging Markets only. |
| | | | |
| DIRECTORAND OFFICER INFORMATION | | | 51 | |
Additional Information
General Information
Electronic Delivery
Shareholders can sign up for e-mail notifications of quarterly statements, annual and semi-annual shareholder reports and prospectuses by enrolling in the electronic delivery program. Electronic copies of shareholder reports and prospectuses are available on BlackRock’s website.
To enroll in electronic delivery:
Shareholders Who Hold Accounts with Investment Advisers, Banks or Brokerages:
Please contact your financial advisor. Please note that not all investment advisers, banks or brokerages may offer this service.
Householding
The Funds will mail only one copy of shareholder documents, including prospectuses, annual and semi-annual reports and proxy statements, to shareholders with multiple accounts at the same address. This practice is commonly called “householding” and is intended to reduce expenses and eliminate duplicate mailings of shareholder documents. Mailings of your shareholder documents may be householded indefinitely unless you instruct us otherwise. If you do not want the mailing of these documents to be combined with those for other members of your household, please call the Funds at(800) 441-7762.
Availability of Quarterly Schedule of Investments
The Funds file their complete schedule of portfolio holdings with the SEC for the first and third quarters of each fiscal year as an exhibit to its reports on Form N-PORT, and for reporting periods ended prior to March 31, 2019, filed such information on FormN-Q. The Funds’ Forms N-PORT andN-Q are available on the SEC’s website at sec.gov. The Funds’ FormsN-Q may also be obtained upon request and without charge by calling(800) 441-7762.
Availability of Proxy Voting Policies and Procedures
A description of the policies and procedures that the Funds use to determine how to vote proxies relating to portfolio securities is available upon request and without charge (1) by calling(800) 441-7762; (2) atblackrock.com; and (3) on the SEC’s website at sec.gov.
Availability of Proxy Voting Record
Information about how the Funds voted proxies relating to securities held in the Funds’ portfolios during the most recent12-month period ended June 30 is available upon request and without charge (1) atblackrock.com; or by calling(800) 441-7762 and (2) on the SEC’s website at sec.gov.
BlackRock’s Mutual Fund Family
BlackRock offers a diverse lineup of open-end mutual funds crossing all investment styles and managed by experts in equity, fixed-income and tax-exempt investing. Visitblackrock.com for more information.
Shareholder Privileges
Account Information
Call us at(800) 441-7762 from 8:00 AM to 6:00 PM ET on any business day to get information about your account balances, recent transactions and share prices. You can also reach us on the Web atblackrock.com.
Automatic Investment Plans
Investor class shareholders who want to invest regularly can arrange to have $50 or more automatically deducted from their checking or savings account and invested in any of the BlackRock funds.
Systematic Withdrawal Plans
Investor class shareholders can establish a systematic withdrawal plan and receive periodic payments of $50 or more from their BlackRock funds, as long as their account balance is at least $10,000.
Retirement Plans
Shareholders may make investments in conjunction with Traditional, Rollover, Roth, Coverdell, Simple IRAs, SEP IRAs and 403(b) Plans.
| | |
| 52 | | 2019 BLACKROCK ANNUAL REPORTTO SHAREHOLDERS |
Additional Information (continued)
BlackRock Privacy Principles
BlackRock is committed to maintaining the privacy of its current and former fund investors and individual clients (collectively, “Clients”) and to safeguarding theirnon-public personal information. The following information is provided to help you understand what personal information BlackRock collects, how we protect that information and why in certain cases we share such information with select parties.
If you are located in a jurisdiction where specific laws, rules or regulations require BlackRock to provide you with additional or different privacy-related rights beyond what is set forth below, then BlackRock will comply with those specific laws, rules or regulations.
BlackRock obtains or verifies personalnon-public information from and about you from different sources, including the following: (i) information we receive from you or, if applicable, your financial intermediary, on applications, forms or other documents; (ii) information about your transactions with us, our affiliates, or others; (iii) information we receive from a consumer reporting agency; and (iv) from visits to our websites.
BlackRock does not sell or disclose tonon-affiliated third parties anynon-public personal information about its Clients, except as permitted by law or as is necessary to respond to regulatory requests or to service Client accounts. Thesenon-affiliated third parties are required to protect the confidentiality and security of this information and to use it only for its intended purpose.
We may share information with our affiliates to service your account or to provide you with information about other BlackRock products or services that may be of interest to you. In addition, BlackRock restricts access tonon-public personal information about its Clients to those BlackRock employees with a legitimate business need for the information. BlackRock maintains physical, electronic and procedural safeguards that are designed to protect thenon-public personal information of its Clients, including procedures relating to the proper storage and disposal of such information.
Glossary of Terms Used in this Report
| | |
| Currency |
| |
| KRW | | Korean Won |
| | |
| Portfolio Abbreviations |
| |
| ADR | | American Depositary Receipts |
| |
| NVDR | | Non-voting Depository Receipts |
| | | | |
| ADDITIONAL INFORMATION | | | 53 | |
Want to know more?
blackrock.com | 877-275-1255 (1-877-ASK-1BLK)
This report is intended for current holders. It is not authorized for use as an offer of sale or a solicitation of an offer to buy shares of a Fund unless preceded or accompanied by the Fund’s current prospectus. Past performance results shown in this report should not be considered a representation of future performance. Investment returns and principal value of shares will fluctuate so that shares, when redeemed, may be worth more or less than their original cost. Statements and other information herein are as dated and are subject to change.
EMLA-10/19-AR
| | |
| |  |
| | |
Item 2 – | | Code of Ethics – The registrant (or the “Fund”) has adopted a code of ethics, as of the end of the period covered by this report, applicable to the registrant’s principal executive officer, principal financial officer, principal accounting officer or controller, or persons performing similar functions. During the period covered by this report, the code of ethics was amended to update certain information and to make other non-material changes. During the period covered by this report, there have been no waivers granted under the code of ethics. The registrant undertakes to provide a copy of the code of ethics to any person upon request, without charge, who calls 1-800-441-7762. |
| |
Item 3 – | | Audit Committee Financial Expert – The registrant’s board of directors (the “board of directors”), has determined that (i) the registrant has the following audit committee financial experts serving on its audit committee and (ii) each audit committee financial expert is independent: |
| |
| | Neil A. Cotty Robert M. Hernandez Henry R. Keizer Kenneth L. Urish Claire A. Walton |
| |
| | Under applicable securities laws, a person determined to be an audit committee financial expert will not be deemed an “expert” for any purpose, including without limitation for the purposes of Section 11 of the Securities Act of 1933, as a result of being designated or identified as an audit committee financial expert. The designation or identification of a person as an audit committee financial expert does not impose on such person any duties, obligations, or liabilities greater than the duties, obligations, and liabilities imposed on such person as a member of the audit committee and board of directors in the absence of such designation or identification. The designation or identification of a person as an audit committee financial expert does not affect the duties, obligations, or liability of any other member of the audit committee or board of directors. |
| |
Item 4 – | | Principal Accountant Fees and Services |
| |
| | The following table presents fees billed by Deloitte & Touche LLP (“D&T”) in each of the last two fiscal years for the services rendered to the Fund: |
| | | | | | | | | | | | | | | | | | |
| | | (a) Audit Fees | | (b) Audit-Related Fees1 | | (c) Tax Fees2 | | (d) All Other Fees | |
|
| Entity Name | | Current
Fiscal Year
End | | Previous
Fiscal Year
End | | Current
Fiscal Year
End | | Previous
Fiscal Year
End | | Current
Fiscal Year
End | | Previous
Fiscal Year
End | | Current
Fiscal Year
End | | Previous
Fiscal Year
End |
| BlackRock Latin America Fund, Inc. | | $36,006 | | $37,230 | | $2,000 | | $0 | | $16,200 | | $16,500 | | $0 | | $0 |
| | |
| | The following table presents fees billed by D&T that were required to be approved by the registrant’s audit committee (the “Committee”) for services that relate directly to the operations or financial reporting of the Fund and that are rendered on behalf of BlackRock Advisors, LLC (the “Investment Advisor” or “BlackRock”) and entities controlling, controlled by, or under common control with BlackRock (not including any sub-adviser whose role is primarily portfolio management and is subcontracted with or overseen by another investment adviser) that provide ongoing services to the Fund (“Affiliated Service Providers”): |
2
| | | | |
| | | Current Fiscal Year End | | Previous Fiscal Year End |
| (b) Audit-Related Fees1 | | $0 | | $0 |
| (c) Tax Fees2 | | $0 | | $0 |
| (d) All Other Fees3 | | $2,050,500 | | $2,274,000 |
1 The nature of the services includes assurance and related services reasonably related to the performance of the audit or review of financial statements not included in Audit Fees, including accounting consultations, agreed-upon procedure reports, attestation reports, comfort letters, out-of-pocket expenses and internal control reviews not required by regulators.
2 The nature of the services includes tax compliance and/or tax preparation, including services relating to the filing or amendment of federal, state or local income tax returns, regulated investment company qualification reviews, taxable income and tax distribution calculations.
3 Non-audit fees of $2,050,500 and $2,274,000 for the current fiscal year and previous fiscal year, respectively, were paid to the Fund’s principal accountant in their entirety by BlackRock, in connection with services provided to the Affiliated Service Providers of the Fund and of certain other funds sponsored and advised by BlackRock or its affiliates for a service organization review and an accounting research tool subscription. These amounts represent aggregate fees paid by BlackRock and were not allocated on a per fund basis.
(e)(1) Audit CommitteePre-Approval Policies and Procedures:
| | |
| | The Committee has adopted policies and procedures with regard to the pre-approval of services. Audit, audit-related and tax compliance services provided to the registrant on an annual basis require specific pre-approval by the Committee. The Committee also must approve other non-audit services provided to the registrant and those non-audit services provided to the Investment Adviser and Affiliated Service Providers that relate directly to the operations and the financial reporting of the registrant. Certain of these non-audit services that the Committee believes are (a) consistent with the SEC’s auditor independence rules and (b) routine and recurring services that will not impair the independence of the independent accountants may be approved by the Committee without consideration on a specific case-by-case basis (“general pre-approval”). The term of any general pre-approval is 12 months from the date of the pre-approval, unless the Committee provides for a different period. Tax or other non-audit services provided to the registrant which have a direct impact on the operations or financial reporting of the registrant will only be deemed pre-approved provided that any individual project does not exceed $10,000 attributable to the registrant or $50,000 per project. For this purpose, multiple projects will be aggregated to determine if they exceed the previously mentioned cost levels. |
| |
| | Any proposed services exceeding the pre-approved cost levels will require specific pre-approval by the Committee, as will any other services not subject to general pre-approval (e.g., unanticipated but permissible services). The Committee is informed of each service approved subject to general pre-approval at the next regularly scheduled in-person board meeting. At this meeting, an analysis of such services is presented to the Committee for ratification. The Committee may delegate to the Committee Chairman the authority to approve the provision of and fees for any specific engagement of permitted non-audit services, including services exceeding pre-approved cost levels. |
| |
| | (e)(2) None of the services described in each of Items 4(b) through (d) were approved by the Committee pursuant to the de minimus exception in paragraph (c)(7)(i)(C) of Rule 2-01 of Regulation S-X. |
| |
| | (f) Not Applicable |
| |
| | (g) The aggregate non-audit fees, defined as the sum of the fees shown under “Audit-Related Fees,” “Tax Fees” and “All Other Fees,” paid to the accountant for services rendered by the accountant to the registrant, the Investment Adviser and the Affiliated Service Providers were: |
| | | | | | |
| | Entity Name | | Current Fiscal Year
End | | Previous Fiscal Year
End |
| | BlackRock Latin America Fund, Inc. | | $18,200 | | $16,500 |
3
| | |
| | Additionally, the amounts billed by D&T in connection with services provided to the Affiliated Service Providers of the Fund and of other funds sponsored and advised by BlackRock or its affiliates during the current and previous fiscal years for a service organization review and an accounting research tool subscription were: |
| | |
Current Fiscal Year End | | Previous Fiscal Year
End |
$2,050,500 | | $2,274,000 |
| | |
| | These amounts represent aggregate fees paid by BlackRock and were not allocated on a per fund basis. |
| |
| | (h) The Committee has considered and determined that the provision of non-audit services that were rendered to the Investment Adviser and the Affiliated Service Providers that were not pre-approved pursuant to paragraph (c)(7)(ii) of Rule 2-01 of Regulation S-X is compatible with maintaining the principal accountant’s independence. |
| |
Item 5 – | | Audit Committee of Listed Registrants – Not Applicable |
| |
Item 6 – | | Investments |
| | (a) The registrant’s Schedule of Investments is included as part of the Report to Stockholders filed under Item 1 of this Form. |
| |
| | (b) Not Applicable due to no such divestments during the semi-annual period covered since the previous Form N-CSR filing. |
| |
Item 7 – | | Disclosure of Proxy Voting Policies and Procedures for Closed-End Management Investment Companies – Not Applicable |
| |
Item 8 – | | Portfolio Managers of Closed-End Management Investment Companies – Not Applicable |
| |
Item 9 – | | Purchases of Equity Securities by Closed-End Management Investment Company and Affiliated Purchasers – Not Applicable |
| |
Item 10 – | | Submission of Matters to a Vote of Security Holders – There have been no material changes to these procedures. |
| |
Item 11 – | | Controls and Procedures |
| |
| | (a) The registrant’s principal executive and principal financial officers, or persons performing similar functions, have concluded that the registrant’s disclosure controls and procedures (as defined in Rule 30a-3(c) under the Investment Company Act of 1940, as amended (the “1940 Act”)) are effective as of a date within 90 days of the filing of this report based on the evaluation of these controls and procedures required by Rule 30a-3(b) under the 1940 Act and Rule 15d-15(b) under the Securities Exchange Act of 1934, as amended. |
| |
| | (b) There were no changes in the registrant’s internal control over financial reporting (as defined in Rule 30a-3(d) under the 1940 Act) that occurred during the period covered by this report that have materially affected, or are reasonably likely to materially affect, the registrant’s internal control over financial reporting. |
| |
| | |
4
| | |
| |
Item 12 – | | Disclosure of Securities Lending Activities forClosed-End Management Investment Companies – Not Applicable to the registrant. |
| |
Item 13 – | | Exhibits attached hereto |
| |
| | (a)(1) Code of Ethics – See Item 2 |
| |
| | (a)(2) Certifications – Attached hereto |
| |
| | (a)(3) Not Applicable |
| |
| | (a)(4) Not Applicable |
| |
| | (b) Certifications – Attached hereto |
5
Pursuant to the requirements of the Securities Exchange Act of 1934 and the Investment Company Act of 1940, the registrant has duly caused this report to be signed on its behalf by the undersigned, thereunto duly authorized.
BlackRock Latin America Fund, Inc.
| | |
| By: | | /s/ John M. Perlowski |
| | John M. Perlowski |
| | Chief Executive Officer (principal executive officer) of |
| | BlackRock Latin America Fund, Inc. |
| |
| Date: | | January 3, 2020 |
Pursuant to the requirements of the Securities Exchange Act of 1934 and the Investment Company Act of 1940, this report has been signed below by the following persons on behalf of the registrant and in the capacities and on the dates indicated.
| | |
| By: | | /s/ John M. Perlowski |
| | John M. Perlowski |
| | Chief Executive Officer (principal executive officer) of |
| | BlackRock Latin America Fund, Inc. |
| |
| Date: | | January 3, 2020 |
| |
| By: | | /s/ Neal J. Andrews |
| | Neal J. Andrews |
| | Chief Financial Officer (principal financial officer) of |
| | BlackRock Latin America Fund, Inc. |
| |
| Date: | | January 3, 2020 |
6