UNITED STATES
SECURITIES AND EXCHANGE COMMISSION
Washington, D.C. 20549
FORM N-CSR
CERTIFIED SHAREHOLDER REPORT OF REGISTERED MANAGEMENT
INVESTMENT COMPANIES
Investment Company Act File Number 811-06351
Green Century Funds
114 State Street
Suite 200
Boston, MA 02109
(Address of principal executive offices)
Green Century Capital Management, Inc.
114 State Street
Suite 200
Boston, MA 02109
(Name and address of agent for service)
Registrant’s telephone number, including area code: (617) 482-0800
Date of fiscal year end: July 31
Date of reporting period: January 31, 2009
| Item 1. | Reports to Stockholders |
The following is a copy of the report transmitted to shareholders pursuant to Rule 30e-1 under the Investment Company Act of 1940 (17 CFR 270.30e-1).
 | SEMI-ANNUAL REPORT Green Century Balanced Fund Green Century Equity Fund January 31, 2009 | |
| An investment for your future.® | 114 State Street, Boston, Massachusetts 02109 | |
For information on the Green Century Funds®, call 1-800-93-GREEN. For information on how to open an account and account services, call 1-800-221-5519 8:00 am to 6:00 pm Eastern Time, Monday through Friday. For share price and account information, call 1-800-221-5519, twenty-four hours a day.
Dear Green Century Funds Shareholder:
For investors, 2008 as well as the six months ended January 31, 2009 were very disappointing. You lost money whether you were invested in the Green Century Balanced Fund or the Green Century Equity Fund (or in most all other mutual funds invested in the stock market). So did I. While it does not diminish the sting to know that others are in a similar position, we want you to know that Green Century Capital Management (Green Century) views the “business as usual” causes of the market downturn as strong evidence of the need to create a new path.
It is often difficult to change entrenched patterns of behavior without significant upheaval. We view this market disruption as an opportunity to showcase the value that a sustainable economy might bring. Though it has been painful, a door has been opened for this new economy—one we hope will value long-term investments over short-term profits; understands that we as shareholders, employees, customers, and suppliers are part of a holistic system; and recognizes that social and environmental factors can influence financial performance. Perhaps the time has come for more investors to search for companies that incorporate this new framework.
The bleak financial situation of recent months was characterized by a significant drop in investment returns, a severe lack of credit, stagnant housing markets, bankruptcies and a downturn in the economy that subsequently led to a large number of corporate lay-offs. These hardships are afflicting a great many people in all regions of the country.
Nonetheless, Green Century believes there are glimmers of hope. A significant beacon was the historic presidential election. While it is too soon to evaluate the effectiveness of the new administration’s policies, Green Century believes it is refreshing to have a change of course and to think that as a country we are back on a path of leadership and responsibility.
We have seen evidence that the new administration may bring renewed support for alternative and renewable energy, a sector that has long been a mainstay of our Funds’ portfolios. We also believe the new administration may strengthen the rights of shareholders in our country’s major corporations, rights we have advocated for since the inception of the Funds. Green Century’s staff has advocated for an increase in resources for renewables and for more democratic and transparent corporate governance. We intend to continue to do so and believe our opportunities for success will be better now than they were over the past several years.
Green Century believes that shareholder advocacy—the promotion of corporate environmental responsibly by pressing companies to improve their policies and practices—is a critical component of environmentally
responsible investing. Advocating for corporate environmental responsibility has been a primary mission of Green Century since our inception in 1991. This year, Green Century has filed numerous shareholder resolutions and is in direct dialogue with major corporations on several critical environmental issues. From encouraging major home improvement retailer Lowe’s Companies Inc.1 to halt its attempts to build a big box store on critical wetlands in the Florida Everglades to pressuring oil giant ExxonMobil1 to stay out of the pristine Arctic National Wildlife Refuge, Green Century is directly challenging corporate practices that threaten our wilderness and biodiversity.
Our advocacy team is also pressuring companies to move away from products found to be harmful to the environment and human health, and encouraging them to provide alternatives. As a result of our continued engagement with Whole Foods1, the company is taking steps to eliminate the chemical Bisphenol A (BPA) from multiple store products. Whole Foods has agreed to work with Green Century as we pressure chemical and can manufacturers to develop alternatives to BPA. We are also reaching out to other major packaged food companies and will release a report ranking these companies on their use of BPA and their efforts to identify and implement alternatives.
As environmental issues have achieved increased prominence, many companies are attempting to tout their environmental credentials. For example, while Chevron1 recently embarked on a multi-million dollar advertising campaign promoting its efforts to be more “green,” it is also engaged in what we believe to be environmentally devastating methods of fossil fuel exploration.
Green Century filed a resolution at Chevron for the second year in a row raising concerns regarding its plans to extract oil from the Canadian tar sands. Tar sands drilling and exploration has been deemed “the most destructive project on Earth” by Canada’s Environmental Defence and is several times more carbon-intensive than conventional oil recovery projects. We believe entering the tar sands is a risky and unwise business decision for major energy companies.
Green Century will continue to pressure companies and continue to expose discrepancies between a company’s words and its actions so consumers and investors have the facts necessary to make informed decisions.
Green Century is not able to predict the future. But we do try to prepare for it. By staying the course, investing for the long-term, searching for solid green holdings, and engaging with companies to improve their environmental performance, we intend to continue to contribute to building a sustainable economy.
If you have any questions, please do not hesitate to contact us at 1-800-93-GREEN or visit us on-line at: www.GreenCentury.com.
Sincerely,

Kristina Curtis
President
Green Century Funds
2
THE GREEN CENTURY BALANCED FUND
The Green Century Balanced Fund seeks capital growth and income from a diversified portfolio of stocks and bonds that meet Green Century’s standards for corporate environmental performance. The portfolio manager of the Balanced Fund aims to invest in companies that are in the business of solving environmental problems or that are committed to reducing their environmental impact.
AVERAGE ANNUAL RETURN* Total expense ratio: 1.38% | Six Months | One Year | Five Years | Ten Years | ||||||
| December 31, 2008 | Green Century Balanced Fund | –19.19% | –25.94% | –3.06% | 4.27% | |||||
| Lipper Balanced Fund Index2 | –21.21% | –26.18% | 0.12% | 1.53% | ||||||
| January 31, 2009 | Green Century Balanced Fund | –22.31% | –25.05% | –4.10% | 3.62% | |||||
| Lipper Balanced Fund Index2 | –23.89% | –27.19% | –1.11% | 0.89% |
* The performance data quoted represents past performance and is not a guarantee of future results. Investment return and principal value of an investment will fluctuate so that an investor’s shares, when redeemed, may be worth more or less than their original cost. Current performance may be lower or higher than the performance information quoted. To obtain performance information as of the most recent month-end, call 1-800-93-GREEN. Performance includes the reinvestment of income dividends and capital gain distributions. Performance shown does not reflect the deduction of taxes that a shareholder might pay on Fund distributions or the redemption of Fund shares.
During the six month periods ended December 31, 2008 and January 31, 2009, the Balanced Fund outperformed the Lipper Balanced Fund Index though both the Fund and that Index were significantly down. For the six months ended January 31, 2009, the Fund returned –22.31%, outperforming the Lipper Balanced Fund Index during one of the worst declines of the stock market in memory. The diversification of the Balanced Fund into bonds and cash as well as stocks somewhat mitigated the damage as the Fund declined less than the overall equity market.
The Balanced Fund’s bond holdings assisted in limiting its exposure to the banking crisis, but there were some exceptions. The Fund realized large losses in a Lehman Brothers1 bond as well as a bond of an AIG subsidiary, American General Financial1.
The portfolio manager further diversified the Fund and added to its positive environmental profile by making initial investments in two
GREEN CENTURY BALANCED FUND
INVESTMENTS BY INDUSTRY
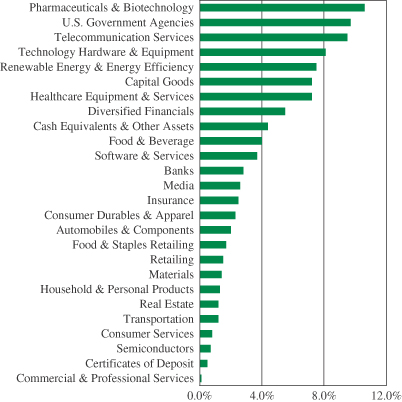
3
community development financial institutions with a focus on the environment: Self-Help Credit Union1 and ShoreBank Pacific1.
The Fund’s equity holdings which positively contributed to its performance during the six months ended January 31, 2009 included: J.M. Smucker Company1, Genzyme, Inc.1, Chubb Corporation1, and Baxter International, Inc.1 while poor performers included Jarden Corporation1, Deckers Outdoor Corporation 1, Johnson Controls, Inc. 1, and Royal Bank of Canada1.
The Green Century Balanced Fund invests in the stocks and bonds of environmentally responsible corporations of various sizes, including small, medium, and large companies. The value of the stocks held in the Balanced Fund will fluctuate in response to factors that may affect a single issuer, industry, or sector of the economy or may affect the market as a whole. Bonds are subject to a variety of risks including interest rate, credit, and inflation risk.
THE GREEN CENTURY EQUITY FUND
The Green Century Equity Fund invests essentially all of its assets in the stocks which make up the Domini 400 Social Index (the “Index”), comprised of 400 primarily large capitalization U.S. companies selected based on a comprehensive range of social and environmental sustainability criteria. The Equity Fund seeks to provide shareholders with a long-term total return that matches that of the Index.
AVERAGE ANNUAL RETURN* Total expense ratio: 0.95% | Six Months | One Year | Five Years | Ten Years | ||||||
| December 31, 2008 | Green Century Equity Fund | –25.63% | –35.48% | –3.90% | –3.10% | |||||
| S&P 500® Index3 | –28.48% | –37.00% | –2.19% | –1.38% | ||||||
| January 31, 2009 | Green Century Equity Fund | –32.01% | –37.21% | –5.94% | –4.51% | |||||
| S&P 500® Index3 | –33.95% | –38.63% | –4.24% | –2.65% |
* The performance data quoted represents past performance and is not a guarantee of future results. Investment return and principal value of an investment will fluctuate so that an investor’s shares, when redeemed, may be worth more or less than their original cost. Current performance may be lower or higher than the performance information quoted. To obtain performance information as of the most recent month-end, call 1-800-93-GREEN. Performance includes the reinvestment of income dividends and capital gain distributions. Performance shown does not reflect the deduction of taxes that a shareholder might pay on Fund distributions or the redemption of Fund shares.
4
The Green Century Equity Fund outperformed the S&P 500® Index for the six-month periods ending December 31, 2008 and January 31, 2009. For the six months ended January 31, 2009, the Equity Fund’s return was –32.01%, while the S&P 500® Index was down –33.95%. The Fund and the overall economy were hurt by the sharp declines in the U.S stock market during the six month periods ended December 31, 2008 and January 31, 2009. Despite efforts by the Federal Reserve Bank to cut interest rates to historically low levels in an attempt to stimulate growth, economic data remained predominantly negative during this time due to the global financial crisis.
During the six months ended January 31, 2009, the performance of the Fund was helped by underweighting investments in companies in the diversified financials, industrials, energy equipment, and insurance sectors relative to the S&P 500® Index. In particular, the Equity Fund’s performance was helped by not owning Bank of America1, Citigroup1 , or General Electric1 which experienced poor stock performance due to the deepening recession that spread from financials into other sectors. In addition, the Fund benefited from overweighting telecommunication services companies, such as AT&T1 and Verizon1.
Conversely, relative overweighting of bank stocks hurt the Equity Fund’s performance relative to the S&P 500® Index with poor returns from Wells Fargo1 and U.S. Bancorp1. These companies were among the worst performers as housing prices continued to decline steadily and the economy fell deeper into a recession. The Fund was also hurt by underweighting the energy sector and by not owning ExxonMobil1 and Chevron1 . These companies performed significantly better than the overall market during the period even as energy prices began to fall back sharply in response to reduced demand from the global recession.
The Equity Fund, like other mutual funds invested primarily in stocks, carries the risk of investing in the stock market. The large companies in which the Equity Fund is invested may perform worse than the stock market as a whole. The Equity Fund will not shift concentration from one industry to another or from stocks to bonds or cash, in order to defend against a falling stock market.
GREEN CENTURY EQUITY FUND
INVESTMENT BY INDUSTRY
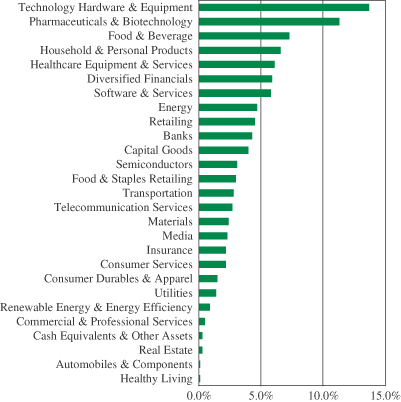
5
The Green Century Funds’ proxy voting guidelines and a record of the Funds’ proxy votes for the year ended June 30, 2008 are available without charge, upon request, (i) at www.greencentury.com, (ii) by calling 1-800-93-GREEN, (iii) sending an e-mail to info@greencentury.com, and (iv) on the Securities and Exchange Commission’s website at www.sec.gov.
The Green Century Funds file their complete schedule of portfolio holdings with the SEC for the first and third quarters of the year on Form N-Q. The Green Century Funds’ Forms N-Q are available on the EDGAR database on the SEC’s website at www.sec.gov. These Forms may also be reviewed and copied at the SEC’s Public Reference Room in Washington D.C. Information about the operation of the Public Reference Room may be obtained by calling 1-800-SEC-0330. The information on Form N-Q may also be obtained by calling 1-800-93-GREEN, or by e-mailing a request to info@greencentury.com.
1 As of January 31, 2009, neither of the Green Century Funds was invested in Exxon Mobil, Chevron, Lehman Brothers, American General Financial, Citigroup, or General Electric. As of January 31, 2009 Self-Help Credit Union comprised 0.24%, ShoreBank Pacific comprised 0.24%, J. M. Smucker Company comprised 1.47%, Genzyme, Inc. comprised 1.99%, Chubb Corporation comprised 1.20%, Baxter International, Inc. comprised 1.84%, Jarden Corporation comprised 0.59%, Deckers Outdoor Corporation comprised 0.55%, Johnson Controls, Inc. comprised 1.42%, Royal Bank of Canada comprised 1.09%, Bank of America comprised 0.22%, AT&T Inc. comprised 3.82%, Verizon comprised 1.27%, and Wells Fargo & Company comprised 0.47% of the Green Century Balanced Fund. As of January 31, 2009, the Balanced Fund was not invested in Lowe’s Companies, Inc., Whole Foods Market, Inc. or U.S. Bancorp. As of January 31, 2009, Lowe’s Companies, Inc. comprised 0.72%, Whole Foods Market, Inc. comprised 0.04%, Genzyme, Inc. comprised 0.50%, Chubb Corporation comprised 0.40%, Baxter International, Inc. comprised 0.98%, Deckers Outdoor Corporation comprised 0.02%, Johnson Controls, Inc. comprised 0.19%, Verizon comprised 2.27%, Wells Fargo & Company comprised 2.13% and U.S. Bancorp comprised 0.69% of the Green Century Equity Fund. As of January 31, 2009, the Equity Fund was not invested in Self-Help Credit Union, ShoreBank Pacific, J. M. Smucker Company, Jarden Corporation, Royal Bank of Canada, Bank of America or AT&T Inc. Portfolio composition will change due to ongoing management of the Funds. References to specific securities should not be construed as a recommendation of the securities by the Funds, their administrator, or their distributor.
2 Lipper Analytical Services, Inc. (“Lipper”) is a respected mutual fund reporting service. The Lipper Balanced Fund Index includes the 30 largest funds whose primary objective is to conserve principal by maintaining at all times a balanced portfolio of both stocks and bonds. Typically the stock/bond ratio ranges around 60%/40%. The Lipper Intermediate Investment Grade Bond Index includes the 30 largest funds whose primary objective is to invest in investment-grade debt (rated in the top four classifications) with dollar weighted average maturities of five to ten years.
3 The S&P 500® Index is an unmanaged index of 500 selected common stocks, most of which are listed on the New York Stock Exchange. The S&P 500® Index is heavily weighted toward stocks with large market capitalization and represents approximately two-thirds of the total market value of all domestic stocks. It is not possible to invest directly in the S&P 500® Index.
This material must be preceded or accompanied by a current prospectus.
Distributor: UMB Distribution Services, LLC, 3/09
6
GREEN CENTURY FUNDS EXPENSE EXAMPLE
For the six months ended January 31, 2009
As a shareholder of the Green Century Funds (the “Funds”), you incur two types of costs: (1) transaction costs, including redemption fees on certain redemptions; and (2) ongoing costs, including management fees and other Fund expenses. This example is intended to help you understand your ongoing costs (in dollars) of investing in the Funds and to compare these costs with the ongoing costs of investing in other mutual funds.
The example is based on an investment of $1,000 invested at the beginning of the period and held for the entire period from August 1, 2008 to January 31, 2009 (the “period”).
Actual Expenses. The first line of the table below provides information about actual account values and actual expenses. You may use the information in this line, together with the amount you invested, to estimate the expenses you paid over the period. Simply divide your account value by $1,000 (for example, an $8,600 account value divided by $1,000 equals 8.6), then multiply the result by the number in the first line under the heading entitled “Expenses Paid During the Period” to estimate the expenses you paid on your account during the period.
Hypothetical Example for Comparison Purposes. The second line of the table below provides information about hypothetical account values and hypothetical expenses based on the Funds’ actual expense ratios and an assumed rate of return of 5% per year before expenses, which is not the actual return of either of the Funds. The hypothetical account values and expenses may not be used to estimate the actual ending account balance or expenses you paid for the period. You may use this information to compare the ongoing costs of investing in the Funds and other funds. To do so, compare this 5% hypothetical example with the 5% hypothetical examples that appear in the shareholder reports of other funds.
Please note that the expenses shown in the table are meant to highlight your ongoing costs only and do not reflect any transactional costs, such as redemption fees on shares held for 60 days or less. Therefore, the second line of the table is useful in comparing the ongoing costs only, and will not help you determine the relative total costs of owning different funds. In addition, if these transactional costs were included, your costs could have been higher.
| BEGINNING ACCOUNT VALUE AUGUST 1, 2008 | ENDING ACCOUNT VALUE JANUARY 31, 2009 | EXPENSES PAID DURING THE PERIOD1 | |||||||
Balanced Fund | |||||||||
Actual Expenses | $ | 1,000.00 | $ | 776.90 | $ | 6.18 | |||
Hypothetical Example, assuming a 5% return before expenses | 1,000.00 | 1,018.14 | 7.02 | ||||||
Equity Fund | |||||||||
Actual Expenses | 1,000.00 | 679.90 | 4.02 | ||||||
Hypothetical Example, assuming a 5% return before expenses | 1,000.00 | 1,020.21 | 4.84 | ||||||
1 Expenses are equal to the Funds’ annualized expense ratios (1.38% for the Balanced Fund and .95% for the Equity Fund), multiplied by the average account value over the period, multiplied by 184/365 (to reflect the one-half year period).
7
GREEN CENTURY BALANCED FUND PORTFOLIO OF INVESTMENTS January 31, 2009 (unaudited) |
COMMON STOCKS — 58.5% | |||||
| SHARES | VALUE | ||||
Capital Goods — 7.2% | |||||
3M Company | 10,795 | $ | 580,663 | ||
Emerson Electric Company | 13,660 | 446,682 | |||
Gardner Denver, Inc. (a) | 8,400 | 182,868 | |||
Illinois Tool Works, Inc. | 13,990 | 456,913 | |||
Koninklijke Philips Electronics NV American Depositary Receipt (b) | 9,000 | 163,710 | |||
Lincoln Electric Holdings, Inc. | 9,000 | 370,530 | |||
Pentair, Inc. | 19,500 | 445,965 | |||
Quanta Services, Inc. (a) | 9,600 | 205,248 | |||
| 2,852,579 | |||||
Pharmaceuticals & Biotechnology — 6.7% | |||||
Amgen, Inc. (a) | 4,500 | 246,825 | |||
Genentech, Inc. (a) | 2,150 | 174,666 | |||
Genzyme Corporation (a) | 11,600 | 799,472 | |||
Johnson & Johnson | 13,640 | 786,892 | |||
Teva Pharmaceutical Industries Ltd. American Depositary Receipt (b) | 11,485 | 476,053 | |||
Waters Corporation (a) | 5,000 | 180,850 | |||
| 2,664,758 | |||||
Renewable Energy & Energy Efficiency — 6.5% | |||||
Applied Materials, Inc. | 31,350 | 293,749 | |||
Cree, Inc. (a) | 7,000 | 139,510 | |||
Energy Conversion Devices, Inc. (a) | 6,000 | 151,020 | |||
First Solar, Inc. (a) | 2,015 | 287,742 | |||
Fuel Systems Solutions, Inc. (a) | 7,260 | 189,776 | |||
International Rectifier Corporation (a) | 14,000 | 190,680 | |||
Itron, Inc. (a) | 3,720 | 242,916 | |||
Johnson Controls, Inc. | 14,250 | 178,268 | |||
MEMC Electronic Materials, Inc. (a) | 10,600 | 144,160 | |||
OM Group, Inc. (a) | 8,600 | 166,668 | |||
Ormat Technologies, Inc. | 7,800 | 241,722 | |||
SunPower Corporation, Class A (a) | 6,600 | 221,496 | |||
Ultralife Corporation (a) | 21,000 | 168,210 | |||
| 2,615,917 | |||||
Technology Hardware & Equipment — 5.8% | |||||
Apple, Inc. (a) | 3,235 | 291,571 | |||
Brocade Communications Systems, Inc. (a) | 30,000 | 114,300 | |||
Cisco Systems, Inc. (a) | 18,940 | 283,532 | |||
| SHARES | VALUE | ||||
Technology Hardware & Equipment — (continued) | |||||
Hewlett-Packard Company | 19,000 | $ | 660,250 | ||
International Business Machines Corporation | 10,700 | 980,654 | |||
| 2,330,307 | |||||
Healthcare Equipment & Services — 5.1% | |||||
Baxter International, Inc. | 12,600 | 738,989 | |||
Dentsply International, Inc. | 6,400 | 172,224 | |||
Gen-Probe, Inc. (a) | 2,685 | 120,879 | |||
Hologic, Inc. (a) | 14,950 | 176,261 | |||
Medtronic, Inc. | 18,750 | 627,938 | |||
UnitedHealth Group, Inc. | 7,530 | 213,325 | |||
| 2,049,616 | |||||
Food & Beverage — 4.0% | |||||
General Mills, Inc. | 16,900 | 999,635 | |||
JM Smucker Company (The) | 13,105 | 591,691 | |||
| 1,591,326 | |||||
Telecommunication Services — 3.0% | |||||
AT&T, Inc. | 18,475 | 454,855 | |||
BT Group PLC American Depositary Receipt (b) | 8,500 | 129,540 | |||
Telefonica S.A. American Depositary Receipt (b) | 11,900 | 637,959 | |||
| 1,222,354 | |||||
Media — 2.6% | |||||
John Wiley & Sons, Inc. | 20,225 | 716,572 | |||
McGraw-Hill Companies, Inc. (The) | 15,310 | 336,667 | |||
| 1,053,239 | |||||
Insurance — 2.5% | |||||
Chubb Corporation | 11,345 | 483,070 | |||
Horace Mann Educators Corporation | 17,000 | 158,950 | |||
WR Berkley Corporation | 14,000 | 370,720 | |||
| 1,012,740 | |||||
Software & Services — 2.4% | |||||
Adobe Systems, Inc. (a) | 4,000 | 77,240 | |||
Microsoft Corporation | 21,950 | 375,345 | |||
Oracle Corporation (a) | 30,200 | 508,266 | |||
| 960,851 | |||||
8
GREEN CENTURY BALANCED FUND PORTFOLIO OF INVESTMENTS January 31, 2009 (unaudited) | continued |
| SHARES | VALUE | ||||
Food & Staples Retailing — 1.7% | |||||
Sysco Corporation | 31,235 | $ | 696,228 | ||
Diversified Financials — 1.7% | |||||
American Express Company | 5,755 | 96,281 | |||
Bank of America Corporation | 13,370 | 87,975 | |||
Goldman Sachs Group, Inc. (The) | 2,500 | 201,825 | |||
JPMorgan Chase & Company | 11,570 | 295,150 | |||
| 681,231 | |||||
Banks — 1.6% | |||||
Barclays PLC American Depositary Receipt (b) | 5,000 | 28,550 | |||
Royal Bank of Canada | 17,850 | 438,753 | |||
Wells Fargo & Company | 10,000 | 189,000 | |||
| 656,303 | |||||
Retailing — 1.5% | |||||
Advance Auto Parts, Inc. | 18,450 | 603,869 | |||
Materials — 1.4% | |||||
Air Products & Chemicals, Inc. | 11,300 | 568,390 | |||
Household & Personal Products — 1.3% | |||||
Church & Dwight Company, Inc. | 9,875 | 525,646 | |||
Consumer Durables & Apparel — 1.1% | |||||
Deckers Outdoor Corporation (a) | 4,225 | 220,714 | |||
Jarden Corporation (a) | 22,900 | 238,847 | |||
| 459,561 | |||||
Automobiles & Components — 0.8% | |||||
Toyota Motor Corporation American Depositary Receipt (b) | 5,340 | 339,143 | |||
Consumer Services — 0.8% | |||||
Chipotle Mexican Grill, Inc. (a) | 3,200 | 145,664 | |||
Starwood Hotels & Resorts Worldwide, Inc. | 11,350 | 171,612 | |||
| 317,276 | |||||
Semiconductors — 0.7% | |||||
Intel Corporation | 22,000 | 283,800 | |||
Commercial & Professional Services — 0.1% | |||||
Interface, Inc., Class A | 11,600 | 47,328 | |||
Total Common Stocks | 23,532,462 | ||||
CORPORATE BONDS & NOTES — 26.9% | ||||||
| PRINCIPAL AMOUNT | VALUE | |||||
Telecommunication Services — 6.5% | ||||||
| AT&T Corporation | ||||||
7.30%, due 11/15/11 (c) | $ | 1,000,000 | $ | 1,081,039 | ||
| BellSouth Corporation | ||||||
4.75%, due 11/15/12 | 500,000 | 507,970 | ||||
| France Telecom S.A. | ||||||
7.75%, due 3/1/11 (b) | 500,000 | 528,906 | ||||
| Verizon Communications, Inc. | ||||||
5.25%, due 4/15/13 | 500,000 | 509,624 | ||||
| 2,627,539 | ||||||
Pharmaceuticals & Biotechnology — 3.9% | ||||||
| Abbott Laboratories | ||||||
5.60%, due 11/30/17 | 500,000 | 535,325 | ||||
| Amgen, Inc. | ||||||
4.85%, due 11/18/14 | 500,000 | 509,389 | ||||
| Wyeth | ||||||
5.50%, due 3/15/13 (c) | 500,000 | 529,042 | ||||
| 1,573,756 | ||||||
Diversified Financials — 3.8% | ||||||
| Goldman Sachs Group, Inc. (The) | ||||||
6.60%, due 1/15/12 | 500,000 | 500,738 | ||||
| JPMorgan Chase & Company | ||||||
4.60%, due 1/17/11 | 500,000 | 503,216 | ||||
| JPMorgan Chase & Company | ||||||
4.50%, due 1/15/12 | 500,000 | 502,419 | ||||
| 1,506,373 | ||||||
Technology Hardware & Equipment — 2.3% | ||||||
| Xerox Corporation | ||||||
7.625%, due 6/15/13 | 1,000,000 | 942,993 | ||||
Healthcare Equipment & Services — 2.1% | ||||||
| Aetna, Inc. | ||||||
5.75%, due 6/15/11 | 595,000 | 585,897 | ||||
| UnitedHealth Group, Inc. | ||||||
4.875%, due 4/1/13 | 250,000 | 237,255 | ||||
| 823,152 | ||||||
Software & Services — 1.3% | ||||||
| Oracle Corporation | ||||||
5.00%, due 1/15/11 | 500,000 | 522,040 | ||||
9
GREEN CENTURY BALANCED FUND PORTFOLIO OF INVESTMENTS January 31, 2009 (unaudited) | concluded |
| PRINCIPAL AMOUNT | VALUE | |||||
Banks — 1.2% | ||||||
| M&I Marshall & Ilsley Bank | ||||||
3.95%, due 8/14/09 | $ | 500,000 | $ | 495,387 | ||
Consumer Durables & Apparel — 1.2% | ||||||
| Newell Rubbermaid, Inc. | ||||||
4.00%, due 5/1/10 | 500,000 | 487,400 | ||||
Transportation — 1.2% | ||||||
| Ryder System, Inc. | ||||||
4.625%, due 4/1/10 | 500,000 | 479,334 | ||||
Automobiles & Components — 1.2% | ||||||
| Toyota Motor Credit Corporation | ||||||
5.50%, due 7/25/17 (b)(c) | 500,000 | 474,160 | ||||
Real Estate — 1.2% | ||||||
| Simon Property Group LP | ||||||
4.875%, due 8/15/10 | 500,000 | 463,993 | ||||
Renewable Energy & Energy Efficiency — 1.0% | ||||||
| Johnson Controls, Inc. | ||||||
5.50%, due 1/15/16 | 500,000 | 391,057 | ||||
Total Corporate Bonds & Notes (Cost $11,008,592) | 10,787,184 | |||||
U.S. GOVERNMENT AGENCIES — 9.7% | ||||||
| Fannie Mae Pool | ||||||
5.50%, due 3/1/12 | 136,309 | 139,825 | ||||
| Federal Farm Credit Bank | ||||||
4.50%, due 10/25/11 | 500,000 | 533,439 | ||||
| Federal Home Loan Bank | ||||||
3.125%, due 12/13/13 | 550,000 | 554,444 | ||||
| Federal Home Loan Bank | ||||||
4.265%, due 7/8/15 | 500,000 | 501,958 | ||||
| Federal Home Loan Bank | ||||||
3.875%, due 12/14/18 | 550,000 | 525,881 | ||||
Federal National Mortgage Association | ||||||
5.05%, due 11/5/12 | 500,000 | 505,319 | ||||
Federal National Mortgage Association | ||||||
5.45%, due 2/28/18 | 500,000 | 500,379 | ||||
| SLM Corporation | ||||||
4.00%, due 7/25/14 (d) | 1,235,000 | 633,393 | ||||
Total U.S. Government Agencies | 3,894,638 | |||||
CERTIFICATES OF DEPOSIT — 0.5% | ||||||
| PRINCIPAL AMOUNT | VALUE | |||||
Self Help Credit Union Environmental Certificate of Deposit | ||||||
3.40%, due 8/8/10 | $ | 95,000 | $ | 95,025 | ||
Shorebank Pacific Time Deposit Receipt | ||||||
3.75%, due 8/8/11 | 95,000 | 95,000 | ||||
Total Certificates Of Deposit | 190,025 | |||||
SHORT-TERM OBLIGATION — 4.0% | ||||||
Repurchase Agreement— | 1,596,854 | |||||
TOTAL INVESTMENTS (e) — 99.6% | ||||||
(Cost $48,170,780) | 40,001,163 | |||||
Other Assets Less Liabilities —0.4% | 153,130 | |||||
NET ASSETS — 100.0% | $ | 40,154,293 | ||||
| (a) | Non-income producing security. |
| (b) | Securities whose values are determined or significantly influenced by trading in markets other than the United States or Canada. |
| (c) | Step rate bond. Rate shown is currently in effect at January 31, 2009. |
| (d) | Floating rate bond. Rate shown is currently in effect at January 31, 2009. |
| (e) | The cost of investments for federal income tax purposes is $48,174,034 resulting in gross unrealized appreciation and depreciation of $1,075,557 and $9,248,428 respectively, or net unrealized depreciation of $8,172,871. |
See Notes to Financial Statements
10
GREEN CENTURY EQUITY FUND PORTFOLIO OF INVESTMENTS January 31, 2009 (unaudited) |
COMMON STOCKS — 99.7% | |||||
| SHARES | VALUE | ||||
Technology Hardware & Equipment — 13.7% | |||||
3Com Corporation (a) | 3,600 | $ | 8,388 | ||
Adaptec, Inc. (a) | 800 | 2,232 | |||
ADC Telecommunications, Inc. (a) | 1,000 | 5,070 | |||
Apple, Inc. (a) | 7,678 | 692,018 | |||
Arrow Electronics, Inc. (a) | 1,050 | 20,024 | |||
Cisco Systems, Inc. (a) | 50,560 | 756,882 | |||
Corning, Inc. | 13,361 | 135,080 | |||
Dell, Inc. (a) | 14,931 | 141,845 | |||
EMC Corporation (a) | 17,630 | 194,635 | |||
Gerber Scientific, Inc. (a) | 200 | 628 | |||
Hewlett-Packard Company | 21,150 | 734,962 | |||
Imation Corporation | 300 | 2,922 | |||
International Business Machines Corporation | 11,641 | 1,066,897 | |||
Lexmark International, Inc. (a) | 700 | 16,576 | |||
Molex, Inc. | 1,300 | 17,381 | |||
NetApp, Inc. (a) | 2,950 | 43,749 | |||
Palm, Inc. (a) | 1,000 | 7,670 | |||
Plantronics, Inc. | 400 | 4,060 | |||
Polycom, Inc. (a) | 800 | 11,240 | |||
QUALCOMM, Inc. | 14,305 | 494,238 | |||
Seagate Technology | 4,400 | 16,676 | |||
Sun Microsystems, Inc. (a) | 6,675 | 27,768 | |||
Tellabs, Inc. (a) | 3,300 | 13,629 | |||
Xerox Corporation | 7,830 | 51,991 | |||
| 4,466,561 | |||||
Pharmaceuticals & Biotechnology — 11.3% | |||||
Affymetrix, Inc. (a) | 500 | 1,590 | |||
Allergan, Inc. | 2,636 | 100,484 | |||
Amgen, Inc. (a) | 9,154 | 502,097 | |||
Amylin Pharmaceuticals, Inc. (a) | 1,050 | 12,138 | |||
Biogen Idec, Inc. (a) | 2,508 | 122,014 | |||
Dionex Corporation (a) | 150 | 7,596 | |||
Endo Pharmaceuticals Holdings, Inc. (a) | 1,020 | 22,919 | |||
Forest Laboratories, Inc. (a) | 2,532 | 63,401 | |||
Genzyme Corporation (a) | 2,333 | 160,790 | |||
Gilead Sciences, Inc. (a) | 7,981 | 405,195 | |||
Illumina, Inc. (a) | 1,124 | 30,753 | |||
Johnson & Johnson | 24,037 | 1,386,695 | |||
King Pharmaceuticals, Inc. (a) | 2,232 | 19,508 | |||
Life Technologies Corporation (a) | 1,550 | 39,463 | |||
Merck & Company, Inc. | 18,267 | 521,523 | |||
| SHARES | VALUE | ||||
Pharmaceuticals & Biotechnology — (continued) | |||||
Millipore Corporation (a) | 500 | $ | 27,580 | ||
Mylan, Inc. (a) | 2,800 | 31,724 | |||
Techne Corporation | 350 | 20,990 | |||
Thermo Fisher Scientific, Inc. (a) | 3,613 | 129,815 | |||
Waters Corporation (a) | 900 | 32,553 | |||
Watson Pharmaceuticals, Inc. (a) | 900 | 24,552 | |||
| 3,663,380 | |||||
Food & Beverage — 7.3% | |||||
Campbell Soup Company | 1,696 | 51,508 | |||
Coca-Cola Company (The) | 17,183 | 734,057 | |||
Dean Foods Company (a) | 1,400 | 27,076 | |||
Flowers Foods, Inc. | 700 | 15,043 | |||
General Mills, Inc. | 2,885 | 170,648 | |||
Green Mountain Coffee Roasters, Inc. (a) | 66 | 2,525 | |||
H.J. Heinz Company | 2,696 | 98,404 | |||
Hershey Company (The) | 1,367 | 50,962 | |||
JM Smucker Company (The) | 1,050 | 47,408 | |||
Kellogg Company | 2,156 | 94,196 | |||
Kraft Foods, Inc., Class A | 12,748 | 357,581 | |||
McCormick & Company, Inc. | 1,150 | 36,846 | |||
PepsiCo, Inc. | 13,414 | 673,785 | |||
Tootsie Roll Industries, Inc. | 212 | 5,060 | |||
| 2,365,099 | |||||
Household & Personal Products — 6.6% | |||||
Alberto-Culver Company | 600 | 14,676 | |||
Avon Products, Inc. | 3,642 | 74,479 | |||
Church & Dwight Company, Inc. | 634 | 33,748 | |||
Clorox Company | 1,250 | 62,688 | |||
Colgate-Palmolive Company | 4,383 | 285,070 | |||
Energizer Holdings, Inc. (a) | 500 | 23,815 | |||
Estee Lauder Companies, Inc. (The), Class A | 1,050 | 27,563 | |||
Kimberly-Clark Corporation | 3,575 | 184,005 | |||
Nu Skin Enterprises, Inc., Class A | 500 | 4,745 | |||
Procter & Gamble Company | 25,865 | 1,409,642 | |||
| 2,120,431 | |||||
Healthcare Equipment & Services — 6.1% | |||||
Baxter International, Inc. | 5,376 | 315,302 | |||
Beckman Coulter, Inc. | 559 | 27,793 | |||
Becton Dickinson & Company | 2,094 | 152,171 | |||
Cerner Corporation (a) | 611 | 20,603 | |||
11
GREEN CENTURY EQUITY FUND PORTFOLIO OF INVESTMENTS January 31, 2009 (unaudited) | continued |
| SHARES | VALUE | ||||
Healthcare Equipment & Services — (continued) | |||||
CIGNA Corporation | 2,500 | $ | 43,400 | ||
CR Bard, Inc. | 835 | 71,451 | |||
Cross Country Healthcare, Inc. (a) | 200 | 1,498 | |||
Edwards Lifesciences Corporation (a) | 500 | 28,745 | |||
Gen-Probe, Inc. (a) | 491 | 22,105 | |||
Health Management Associates, Inc., Class A (a) | 2,200 | 3,498 | |||
Henry Schein, Inc. (a) | 800 | 29,944 | |||
Hill-Rom Holdings, Inc. | 600 | 8,448 | |||
Humana, Inc. (a) | 1,482 | 56,212 | |||
Idexx Laboratories, Inc. (a) | 538 | 17,646 | |||
IMS Health, Inc. | 1,600 | 23,232 | |||
Intuitive Surgical, Inc. (a) | 350 | 36,131 | |||
Invacare Corporation | 300 | 5,718 | |||
McKesson Corporation | 2,360 | 104,312 | |||
Medtronic, Inc. | 9,707 | 325,088 | |||
Molina Healthcare, Inc. (a) | 100 | 1,754 | |||
Patterson Companies, Inc. (a) | 850 | 15,632 | |||
Quest Diagnostics, Inc. | 1,333 | 65,784 | |||
St Jude Medical, Inc. (a) | 2,949 | 107,255 | |||
Stryker Corporation | 2,070 | 87,437 | |||
UnitedHealth Group, Inc. | 10,468 | 296,558 | |||
Varian Medical Systems, Inc. (a) | 1,095 | 40,657 | |||
Zimmer Holdings, Inc. (a) | 1,893 | 68,905 | |||
| 1,977,279 | |||||
Diversified Financials — 5.9% | |||||
Allied Capital Corporation | 1,400 | 2,184 | |||
American Express Company | 10,019 | 167,618 | |||
Bank of New York Mellon Corporation (The) | 9,943 | 255,933 | |||
BlackRock, Inc. | 195 | 21,216 | |||
Capital One Financial Corporation | 3,358 | 53,191 | |||
Charles Schwab Corporation (The) | 8,047 | 109,359 | |||
CIT Group, Inc. | 2,382 | 6,646 | |||
CME Group, Inc. | 575 | 99,998 | |||
Franklin Resources, Inc. | 1,265 | 61,251 | |||
JPMorgan Chase & Company | 32,231 | 822,212 | |||
Medallion Financial Corporation | 100 | 676 | |||
Northern Trust Corporation | 1,910 | 109,863 | |||
PHH Corporation (a) | 500 | 5,525 | |||
SLM Corporation (a) | 4,200 | 48,090 | |||
State Street Corporation | 3,719 | 86,541 | |||
| SHARES | VALUE | ||||
Diversified Financials — (continued) | |||||
T. Rowe Price Group, Inc. | 2,179 | $ | 60,097 | ||
TradeStation Group, Inc. (a) | 200 | 1,102 | |||
| 1,911,502 | |||||
Software & Services — 5.8% | |||||
Adobe Systems, Inc. (a) | 4,549 | 87,841 | |||
Advent Software, Inc. (a) | 100 | 2,183 | |||
Autodesk, Inc. (a) | 2,050 | 33,948 | |||
Automatic Data Processing, Inc. | 4,384 | 159,271 | |||
BMC Software, Inc. (a) | 1,700 | 43,061 | |||
Compuware Corporation (a) | 2,208 | 14,352 | |||
Convergys Corporation (a) | 1,100 | 8,283 | |||
eBay, Inc. (a) | 9,228 | 110,921 | |||
Electronic Arts, Inc. (a) | 2,887 | 44,575 | |||
Microsoft Corporation | 66,284 | 1,133,456 | |||
Novell, Inc. (a) | 3,000 | 11,100 | |||
Paychex, Inc. | 2,703 | 65,656 | |||
Red Hat, Inc. (a) | 1,700 | 24,905 | |||
Salesforce.com, Inc. (a) | 950 | 25,280 | |||
Sapient Corporation (a) | 700 | 2,982 | |||
Symantec Corporation (a) | 7,291 | 111,771 | |||
| 1,879,585 | |||||
Energy — 4.7% | |||||
Apache Corporation | 2,895 | 217,125 | |||
Cameron International Corporation (a) | 1,971 | 45,648 | |||
Chesapeake Energy Corporation | 4,556 | 72,030 | |||
Clean Energy Fuels Corporation (a) | 200 | 1,384 | |||
Devon Energy Corporation | 3,826 | 235,681 | |||
EOG Resources, Inc. | 2,150 | 145,706 | |||
Helmerich & Payne, Inc. | 953 | 21,404 | |||
National Oilwell Varco, Inc. (a) | 3,525 | 93,201 | |||
Newfield Exploration Company (a) | 1,200 | 23,028 | |||
Noble Energy, Inc. | 1,470 | 71,927 | |||
Pioneer Natural Resources Company | 1,100 | 16,104 | |||
Quicksilver Resources, Inc. (a) | 1,000 | 6,930 | |||
Smith International, Inc. | 1,950 | 44,265 | |||
Southwestern Energy Company (a) | 2,932 | 92,798 | |||
Spectra Energy Corporation | 5,216 | 75,684 | |||
Sunoco, Inc. | 1,058 | 49,007 | |||
Ultra Petroleum Corporation (a) | 1,230 | 44,071 | |||
12
GREEN CENTURY EQUITY FUND PORTFOLIO OF INVESTMENTS January 31, 2009 (unaudited) | continued |
| SHARES | VALUE | ||||
Energy — (continued) | |||||
Williams Companies, Inc. | 4,870 | $ | 68,911 | ||
XTO Energy, Inc. | 4,980 | 184,708 | |||
| 1,509,612 | |||||
Retailing — 4.5% | |||||
Autozone, Inc. (a) | 350 | 46,512 | |||
Bed Bath & Beyond, Inc. (a) | 2,283 | 53,034 | |||
Best Buy Company, Inc. | 2,826 | 79,185 | |||
Carmax, Inc. (a) | 1,900 | 15,713 | |||
Charming Shoppes, Inc. (a) | 800 | 864 | |||
Family Dollar Stores, Inc. | 1,265 | 35,129 | |||
Foot Locker, Inc. | 1,300 | 9,568 | |||
Gap, Inc. (The) | 4,252 | 47,963 | |||
Genuine Parts Company | 1,313 | 42,042 | |||
Home Depot, Inc. | 14,718 | 316,878 | |||
J.C. Penney Company, Inc. | 2,000 | 33,500 | |||
Kohl’s Corporation (a) | 2,606 | 95,666 | |||
Limited Brands, Inc. | 1,926 | 15,254 | |||
Lowe’s Companies, Inc. | 12,701 | 232,047 | |||
Men’s Wearhouse, Inc. (The) | 500 | 5,825 | |||
Nordstrom, Inc. | 1,432 | 18,172 | |||
Office Depot, Inc. (a) | 2,500 | 5,400 | |||
PEP Boys – Manny, Moe & Jack | 300 | 867 | |||
RadioShack Corporation | 1,200 | 13,752 | |||
Staples, Inc. | 6,123 | 97,601 | |||
Target Corporation | 6,512 | 203,174 | |||
Tiffany & Company | 1,100 | 22,825 | |||
TJX Companies, Inc. | 3,506 | 68,087 | |||
| 1,459,058 | |||||
Banks — 4.3% | |||||
Bank of Hawaii Corporation | 338 | 12,124 | |||
BB&T Corporation | 4,752 | 94,042 | |||
Cathay General Bancorp | 400 | 5,080 | |||
Comerica, Inc. | 1,362 | 22,691 | |||
Fifth Third Bancorp | 4,697 | 11,226 | |||
First Horizon National Corporation | 1,860 | 17,707 | |||
FirstFed Financial Corporation (a) | 100 | 85 | |||
Heartland Financial USA, Inc. | 100 | 1,377 | |||
Keycorp | 4,479 | 32,607 | |||
M&T Bank Corporation | 700 | 27,237 | |||
MGIC Investment Corporation | 1,100 | 3,036 | |||
NewAlliance Bancshares, Inc. | 1,000 | 10,990 | |||
People’s United Financial, Inc. | 3,100 | 50,716 | |||
| SHARES | VALUE | ||||
Banks — (continued) | |||||
PNC Financial Services Group, Inc. | 3,719 | $ | 120,942 | ||
Popular, Inc. | 2,400 | 6,576 | |||
Regions Financial Corporation | 5,618 | 19,438 | |||
SunTrust Banks, Inc. | 2,969 | 36,400 | |||
Synovus Financial Corporation | 2,500 | 9,900 | |||
U.S. Bancorp | 14,995 | 222,526 | |||
Wainwright Bank & Trust Company | 52 | 399 | |||
Wells Fargo & Company | 36,444 | 688,792 | |||
| 1,393,891 | |||||
Capital Goods — 4.0% | |||||
3M Company | 6,015 | 323,546 | |||
A.O. Smith Corporation | 84 | 2,308 | |||
Apogee Enterprises, Inc. | 300 | 3,075 | |||
Baldor Electric Company | 400 | 5,604 | |||
Brady Corporation, Class A | 450 | 9,414 | |||
CLARCOR, Inc. | 450 | 13,653 | |||
Cooper Industries Ltd., Class A | 1,415 | 38,078 | |||
Cummins, Inc. | 1,800 | 43,164 | |||
Deere & Company | 3,679 | 127,808 | |||
Donaldson Company, Inc. | 712 | 22,157 | |||
EMCOR Group, Inc. (a) | 600 | 12,354 | |||
Emerson Electric Company | 6,640 | 217,128 | |||
Fastenal Company | 1,150 | 39,307 | |||
GATX Corporation | 400 | 9,640 | |||
General Cable Corporation (a) | 450 | 7,407 | |||
Graco, Inc. | 500 | 10,635 | |||
Granite Construction, Inc. | 298 | 10,496 | |||
Hubbell, Inc., Class B | 500 | 15,500 | |||
Illinois Tool Works, Inc. | 3,383 | 110,489 | |||
Kadant, Inc. (a) | 100 | 1,004 | |||
Lawson Products, Inc. | 50 | 956 | |||
Lincoln Electric Holdings, Inc. | 304 | 12,516 | |||
Masco Corporation | 3,300 | 25,806 | |||
NCI Building Systems, Inc. (a) | 200 | 2,318 | |||
Nordson Corporation | 311 | 9,395 | |||
Pall Corporation | 1,050 | 27,374 | |||
Quanta Services, Inc. (a) | 1,811 | 38,719 | |||
Rockwell Automation, Inc. | 1,148 | 29,894 | |||
Simpson Manufacturing Company, Inc. | 300 | 6,021 | |||
Spirit Aerosystems Holdings, Inc. (a) | 900 | 12,240 | |||
SPX Corporation | 490 | 20,634 | |||
13
GREEN CENTURY EQUITY FUND PORTFOLIO OF INVESTMENTS January 31, 2009 (unaudited) | continued |
| SHARES | VALUE | ||||
Capital Goods — (continued) | |||||
Tennant Company | 150 | $ | 2,031 | ||
Thomas & Betts Corporation (a) | 521 | 11,144 | |||
Toro Company | 350 | 10,364 | |||
Trex Company, Inc. (a) | 100 | 1,479 | |||
W.W. Grainger, Inc. | 587 | 42,822 | |||
| 1,276,480 | |||||
Semiconductors — 3.1% | |||||
Advanced Micro Devices, Inc. (a) | 5,400 | 11,826 | |||
Analog Devices, Inc. | 2,630 | 52,547 | |||
Entegris, Inc. (a) | 800 | 1,112 | |||
Intel Corporation | 48,042 | 619,742 | |||
Lam Research Corporation (a) | 1,100 | 22,231 | |||
LSI Corporation (a) | 5,700 | 18,126 | |||
Micron Technology, Inc. (a) | 6,800 | 25,296 | |||
National Semiconductor Corporation | 1,750 | 17,745 | |||
Novellus Systems, Inc. (a) | 900 | 12,411 | |||
Texas Instruments, Inc. | 11,186 | 167,231 | |||
Xilinx, Inc. | 2,500 | 42,125 | |||
| 990,392 | |||||
Food & Staples Retailing — 3.0% | |||||
Costco Wholesale Corporation | 3,732 | 168,052 | |||
CVS Caremark Corporation | 12,269 | 329,790 | |||
Safeway, Inc. | 3,662 | 78,477 | |||
SUPERVALU, Inc. | 1,900 | 33,326 | |||
Sysco Corporation | 5,151 | 114,816 | |||
Walgreen Company | 8,561 | 234,657 | |||
| 959,118 | |||||
Transportation — 2.8% | |||||
Alaska Air Group, Inc. (a) | 300 | 7,908 | |||
AMR Corporation (a) | 2,531 | 15,034 | |||
Arkansas Best Corporation | 200 | 4,678 | |||
CSX Corporation | 3,385 | 98,030 | |||
Expeditors International of Washington, Inc. | 1,778 | 49,446 | |||
FedEx Corporation | 2,686 | 136,825 | |||
Genesee & Wyoming, Inc., Class A (a) | 300 | 8,151 | |||
JB Hunt Transport Services, Inc. | 700 | 15,589 | |||
JetBlue Airways Corporation (a) | 1,700 | 9,571 | |||
Kansas City Southern (a) | 800 | 14,528 | |||
Norfolk Southern Corporation | 3,190 | 122,368 | |||
| SHARES | VALUE | ||||
Transportation — (continued) | |||||
Ryder System, Inc. | 500 | $ | 16,890 | ||
Southwest Airlines Company | 6,103 | 42,904 | |||
United Parcel Service, Inc., Class B | 8,635 | 366,901 | |||
| 908,823 | |||||
Telecommunication Services — 2.7% | |||||
Frontier Communications Corporation | 2,900 | 23,519 | |||
Leap Wireless International, Inc. (a) | 482 | 12,146 | |||
Sprint Nextel Corporation (a) | 26,200 | 63,666 | |||
Telephone & Data Systems, Inc. | 964 | 29,412 | |||
Verizon Communications, Inc. | 24,530 | 732,711 | |||
| 861,454 | |||||
Materials — 2.4% | |||||
Air Products & Chemicals, Inc. | 1,791 | 90,087 | |||
Airgas, Inc. | 750 | 26,483 | |||
Bemis Company, Inc. | 900 | 20,313 | |||
Cabot Corporation | 550 | 7,348 | |||
Calgon Carbon Corporation (a) | 400 | 5,028 | |||
Domtar Corporation (a) | 4,900 | 7,301 | |||
Ecolab, Inc. | 1,412 | 47,952 | |||
H.B. Fuller Company | 400 | 5,588 | |||
Lubrizol Corporation | 596 | 20,336 | |||
MeadWestvaco Corporation | 1,550 | 18,042 | |||
Minerals Technologies, Inc. | 150 | 5,672 | |||
Nalco Holding Company | 1,300 | 12,753 | |||
Nucor Corporation | 2,700 | 110,133 | |||
Praxair, Inc. | 2,659 | 165,548 | |||
Rock-Tenn Company, Class A | 346 | 10,785 | |||
Rohm and Haas Company | 1,062 | 58,612 | |||
Schnitzer Steel Industries, Inc., Class A | 192 | 7,540 | |||
Sealed Air Corporation | 1,400 | 18,970 | |||
Sigma-Aldrich Corporation | 1,026 | 37,018 | |||
Sonoco Products Company | 901 | 20,660 | |||
Valspar Corporation | 900 | 15,615 | |||
Wausau Paper Corporation | 442 | 4,203 | |||
Weyerhaeuser Company | 1,836 | 50,196 | |||
Worthington Industries, Inc. | 600 | 6,036 | |||
| 772,219 | |||||
14
GREEN CENTURY EQUITY FUND PORTFOLIO OF INVESTMENTS January 31, 2009 (unaudited) | continued |
| SHARES | VALUE | ||||
Media — 2.3% | |||||
Discovery Communications, Inc., Class A (a) | 1,250 | $ | 18,125 | ||
EW Scripps Company | 133 | 214 | |||
Lee Enterprises, Inc. | 300 | 93 | |||
McClatchy Company (The) | 400 | 264 | |||
Meredith Corporation | 350 | 5,590 | |||
New York Times Company (The), Class A | 1,000 | 4,970 | |||
Omnicom Group, Inc. | 2,643 | 68,427 | |||
Scholastic Corporation | 200 | 2,180 | |||
Time Warner, Inc. | 31,144 | 290,574 | |||
Walt Disney Company (The) | 16,066 | 332,245 | |||
Washington Post Company (The), Class B | 54 | 21,090 | |||
| 743,772 | |||||
Insurance — 2.2% | |||||
Aflac, Inc. | 4,026 | 93,443 | |||
Ambac Financial Group, Inc. | 2,600 | 2,964 | |||
Chubb Corporation | 3,066 | 130,551 | |||
Cincinnati Financial Corporation | 1,470 | 32,237 | |||
Erie Indemnity Company | 300 | 10,635 | |||
Hartford Financial Services Group, Inc. | 2,700 | 35,532 | |||
Lincoln National Corporation | 2,300 | 34,799 | |||
MBIA, Inc. (a) | 1,800 | 6,948 | |||
Phoenix Companies, Inc. (The) | 1,000 | 1,750 | |||
Principal Financial Group, Inc. | 2,131 | 35,353 | |||
Progressive Corporation (The) (a) | 5,706 | 69,328 | |||
StanCorp Financial Group, Inc. | 420 | 10,844 | |||
Travelers Companies, Inc. (The) | 5,058 | 195,442 | |||
Unum Group | 2,687 | 38,048 | |||
Wesco Financial Corporation | 10 | 3,016 | |||
| 700,890 | |||||
Consumer Services — 2.2% | |||||
Capella Education Company (a) | 128 | 7,082 | |||
Choice Hotels International, Inc. | 300 | 7,896 | |||
Darden Restaurants, Inc. | 1,206 | 31,621 | |||
DeVry, Inc. | 556 | 29,790 | |||
McDonald’s Corporation | 9,629 | 558,676 | |||
Starbucks Corporation (a) | 6,600 | 62,304 | |||
| 697,369 | |||||
| SHARES | VALUE | ||||
Consumer Durables & Apparel — 1.5% | |||||
Black & Decker Corporation | 543 | $ | 15,698 | ||
Centex Corporation | 1,100 | 9,361 | |||
Champion Enterprises, Inc. (a) | 500 | 230 | |||
Coach, Inc. (a) | 2,682 | 39,157 | |||
D.R. Horton, Inc. | 2,500 | 14,900 | |||
Deckers Outdoor Corporation (a) | 100 | 5,224 | |||
Harman International Industries, Inc. | 500 | 8,045 | |||
KB Home | 700 | 7,469 | |||
Leggett & Platt, Inc. | 1,400 | 17,486 | |||
Liz Claiborne, Inc. | 900 | 1,980 | |||
Mattel, Inc. | 2,943 | 41,761 | |||
Newell Rubbermaid, Inc. | 2,500 | 20,200 | |||
NIKE, Inc., Class B | 3,386 | 153,217 | |||
Phillips-Van Heusen Corporation | 500 | 9,510 | |||
Pulte Homes, Inc. | 1,935 | 19,640 | |||
Snap-On, Inc. | 500 | 15,090 | |||
Stanley Works (The) | 686 | 21,444 | |||
Timberland Company (The) (a) | 400 | 4,396 | |||
Tupperware Brands Corporation | 600 | 12,336 | |||
VF Corporation | 777 | 43,528 | |||
Whirlpool Corporation | 538 | 17,985 | |||
| 478,657 | |||||
Utilities —1.4% | |||||
AGL Resources, Inc. | 700 | 21,581 | |||
Alliant Energy Corporation | 1,000 | 28,830 | |||
Atmos Energy Corporation | 800 | 19,640 | |||
Avista Corporation | 500 | 9,520 | |||
Cleco Corporation | 500 | 11,425 | |||
Energen Corporation | 649 | 18,957 | |||
Equitable Resources, Inc. | 1,134 | 38,817 | |||
IDACORP, Inc. | 400 | 11,644 | |||
MGE Energy, Inc. | 201 | 6,442 | |||
National Fuel Gas Company | 750 | 22,470 | |||
New Jersey Resources Corporation | 400 | 16,036 | |||
Nicor, Inc. | 400 | 13,684 | |||
NiSource, Inc. | 2,500 | 24,200 | |||
Northwest Natural Gas Company | 243 | 10,434 | |||
NSTAR | 929 | 31,419 | |||
OGE Energy Corporation | 800 | 19,744 | |||
Pepco Holdings, Inc. | 1,954 | 34,801 | |||
Piedmont Natural Gas Company | 630 | 16,323 | |||
Questar Corporation | 1,550 | 52,670 | |||
15
GREEN CENTURY EQUITY FUND PORTFOLIO OF INVESTMENTS January 31, 2009 (unaudited) | concluded |
| SHARES | VALUE | ||||
Utilities — (continued) | |||||
UGI Corporation | 795 | $ | 20,169 | ||
WGL Holdings, Inc. | 450 | 14,445 | |||
| 443,251 | |||||
Renewable Energy & Energy Efficiency — 0.9% | |||||
Applied Materials, Inc. | 11,524 | 107,980 | |||
Cree, Inc. (a) | 800 | 15,944 | |||
Energy Conversion Devices, Inc. (a) | 450 | 11,327 | |||
First Solar, Inc. (a) | 370 | 52,836 | |||
Itron, Inc. (a) | 300 | 19,590 | |||
Johnson Controls, Inc. | 4,987 | 62,387 | |||
Ormat Technologies, Inc. | 164 | 5,082 | |||
SunPower Corporation, Class A (a) | 750 | 25,170 | |||
Zoltek Companies, Inc. (a) | 250 | 1,770 | |||
| 302,086 | |||||
Commercial & Professional Services — 0.5% | |||||
Avery Dennison Corporation | 796 | 19,287 | |||
Deluxe Corporation | 450 | 5,189 | |||
Herman Miller, Inc. | 500 | 5,495 | |||
HNI Corporation | 400 | 5,284 | |||
Interface, Inc., Class A | 400 | 1,632 | |||
Kelly Services, Inc. | 200 | 1,812 | |||
Manpower, Inc. | 723 | 20,577 | |||
Monster Worldwide, Inc. (a) | 1,150 | 10,592 | |||
Pitney Bowes, Inc. | 1,850 | 41,180 | |||
R.R. Donnelley & Sons Company | 1,850 | 18,056 | |||
Robert Half International, Inc. | 1,400 | 23,730 | |||
Standard Register Company (The) | 100 | 727 | |||
Steelcase, Inc. | 500 | 2,160 | |||
Team, Inc. (a) | 100 | 1,975 | |||
Tetra Tech, Inc. (a) | 380 | 8,827 | |||
| 166,523 | |||||
Real Estate — 0.3% | |||||
Brookfield Properties Corporation | 1,800 | 9,702 | |||
CB Richard Ellis Group, Inc., Class A (a) | 1,942 | 6,991 | |||
Forest City Enterprises, Inc., Class A | 650 | 4,394 | |||
Jones Lang LaSalle, Inc. | 350 | 8,264 | |||
Liberty Property Trust | 888 | 17,760 | |||
| SHARES | VALUE | |||||
Real Estate — (continued) |
| |||||
ProLogis | 2,350 | $ | 23,523 | |||
Regency Centers Corporation | 650 | 22,945 | ||||
| 93,579 | ||||||
Automobiles & Components — 0.1% |
| |||||
BorgWarner, Inc. | 1,000 | 16,880 | ||||
Harley-Davidson, Inc. | 1,769 | 21,546 | ||||
Modine Manufacturing Company | 200 | 548 | ||||
| 38,974 | ||||||
Healthy Living — 0.1% |
| |||||
Gaiam, Inc. (a) | 100 | 357 | ||||
Hain Celestial Group, Inc. (The) (a) | 350 | 5,327 | ||||
United Natural Foods, Inc. (a) | 400 | 6,216 | ||||
Whole Foods Market, Inc. | 1,250 | 12,813 | ||||
| 24,713 | ||||||
Total Securities | 32,204,698 | |||||
SHORT-TERM OBLIGATION — 0.5% |
| |||||
Repurchase Agreement— | 148,954 | |||||
TOTAL INVESTMENTS (b) — 100.2% |
| |||||
(Cost $48,827,815) | 32,353,652 | |||||
Liabilities Less Other Assets — (0.2)% | (66,426 | ) | ||||
NET ASSETS — 100.0% | $ | 32,287,226 | ||||
| (a) | Non-income producing security |
| (b) | The cost of investments for federal income tax purposes is $49,547,313 resulting in gross unrealized appreciation and depreciation of $410,489 and $17,604,150 respectively, or net unrealized depreciation of $17,193,661. |
See Notes to Financial Statements
16
GREEN CENTURY FUNDS STATEMENTS OF ASSETS AND LIABILITIES
January 31, 2009
(unaudited)
| BALANCED FUND | EQUITY FUND | |||||||
ASSETS: | ||||||||
Investments, at value (cost $48,170,780 and $48,827,815 respectively) | $ | 40,001,163 | $ | 32,353,652 | ||||
Receivables for: | ||||||||
Securities sold | — | 12,108 | ||||||
Capital stock sold | 6,350 | 16,210 | ||||||
Interest | 154,161 | — | ||||||
Dividends | 42,024 | 57,612 | ||||||
Total assets | 40,203,698 | 32,439,582 | ||||||
LIABILITIES: | ||||||||
Payable for securities purchased | — | 125,296 | ||||||
Payable for capital stock repurchased | 1,310 | 1,616 | ||||||
Accrued expenses | 48,095 | 25,444 | ||||||
Total liabilities | 49,405 | 152,356 | ||||||
NET ASSETS | $ | 40,154,293 | $ | 32,287,226 | ||||
NET ASSETS CONSIST OF: | ||||||||
Paid-in capital | $ | 64,931,633 | $ | 53,285,152 | ||||
Undistributed net investment income | 48,447 | 48,575 | ||||||
Accumulated net realized losses on investments | (16,656,352 | ) | (4,572,338 | ) | ||||
Net unrealized depreciation on investments | (8,169,435 | ) | (16,474,163 | ) | ||||
NET ASSETS | $ | 40,154,293 | $ | 32,287,226 | ||||
SHARES OUTSTANDING | 3,168,999 | 2,543,724 | ||||||
NET ASSET VALUE, REDEMPTION PRICE AND OFFERING PRICE PER SHARE | $ | 12.67 | $ | 12.69 | ||||
GREEN CENTURY FUNDS STATEMENTS OF OPERATIONS
For the period ended January 31, 2009
(unaudited)
| BALANCED FUND | EQUITY FUND | |||||||
INVESTMENT INCOME: | ||||||||
Interest income | $ | 460,108 | $ | 125 | ||||
Dividend and other income (net of $4,011 and $76 foreign withholding taxes, respectively) | 366,304 | 489,116 | ||||||
Total investment income | 826,412 | 489,241 | ||||||
EXPENSES: | ||||||||
Administrative services fee | 166,899 | 145,238 | ||||||
Investment advisory fee | 148,612 | 51,872 | ||||||
Total expenses | 315,511 | 197,110 | ||||||
NET INVESTMENT INCOME | 510,901 | 292,131 | ||||||
NET REALIZED AND UNREALIZED LOSSES: | ||||||||
Net realized losses on investments: | (4,099,886 | ) | (4,349,604 | ) | ||||
Change in net unrealized depreciation on investments: | (8,118,116 | ) | (11,715,854 | ) | ||||
NET REALIZED AND UNREALIZED LOSSES ON INVESTMENTS | (12,218,002 | ) | (16,065,458 | ) | ||||
NET DECREASE IN NET ASSETS RESULTING FROM OPERATIONS | $ | (11,707,101 | ) | $ | (15,773,327 | ) | ||
See Notes to Financial Statements
17
GREEN CENTURY FUNDS STATEMENTS OF CHANGES IN NET ASSETS
| BALANCED FUND | EQUITY FUND | |||||||||||||||
| FOR THE SIX MONTHS ENDED JANUARY 31, 2009 (UNAUDITED) | FOR THE YEAR ENDED JULY 31, 2008 (AUDITED) | FOR THE SIX MONTHS ENDED JANUARY 31, 2009 (UNAUDITED) | FOR THE YEAR ENDED JULY 31, 2008 (AUDITED) | |||||||||||||
INCREASE (DECREASE) IN NET ASSETS: | ||||||||||||||||
| From operations: | ||||||||||||||||
Net investment income | $ | 510,901 | $ | 787,164 | $ | 292,131 | $ | 420,257 | ||||||||
Net realized losses on investments | (4,099,886 | ) | (541,702 | ) | (4,349,604 | ) | (200,802 | ) | ||||||||
Change in net unrealized depreciation on Investments | (8,118,116 | ) | (3,217,819 | ) | (11,715,854 | ) | (6,052,516 | ) | ||||||||
Net decrease in net assets resulting from operations | (11,707,101 | ) | (2,972,357 | ) | (15,773,327 | ) | (5,833,061 | ) | ||||||||
| Dividends and distributions to shareholders: | ||||||||||||||||
From net investment income | (531,557 | ) | (818,386 | ) | (293,798 | ) | (416,913 | ) | ||||||||
From net realized gains | — | — | (11,945 | ) | (1,920,696 | ) | ||||||||||
Total dividends and distributions | (531,557 | ) | (818,386 | ) | (305,743 | ) | (2,337,609 | ) | ||||||||
| Capital share transactions: | ||||||||||||||||
Proceeds from sales of shares | 1,845,478 | 9,765,077 | 4,041,147 | 19,728,464 | ||||||||||||
Reinvestment of dividends and distributions | 517,178 | 794,658 | 303,003 | 2,312,227 | ||||||||||||
Payments for shares redeemed | (2,673,076 | ) | (5,819,177 | ) | (6,100,551 | ) | (5,979,111 | ) | ||||||||
Net increase (decrease) in net assets resulting from capital share transactions | (310,420 | ) | 4,740,558 | (1,756,401 | ) | 16,061,580 | ||||||||||
Total increase (decrease) in net assets | (12,549,078 | ) | 949,815 | (17,835,471 | ) | 7,890,910 | ||||||||||
NET ASSETS: | ||||||||||||||||
Beginning of period | 52,703,371 | 51,753,556 | 50,122,697 | 42,231,787 | ||||||||||||
End of period | $ | 40,154,293 | $ | 52,703,371 | $ | 32,287,226 | $ | 50,122,697 | ||||||||
Undistributed net investment income | 48,447 | 69,103 | 48,575 | 50,242 | ||||||||||||
See Notes to Financial Statements
18
GREEN CENTURY BALANCED FUND FINANCIAL HIGHLIGHTS
| SIX MONTHS ENDED JANUARY 31, 2009 | FOR THE YEARS ENDED JULY 31, | |||||||||||||||||||||||
| (UNAUDITED) | 2008 | 2007 | 2006 | 2005 | 2004 | |||||||||||||||||||
Net Asset Value, beginning of period | $ | 16.52 | $ | 17.78 | $ | 16.29 | $ | 16.52 | $ | 14.11 | $ | 13.88 | ||||||||||||
| Income from investment operations: | ||||||||||||||||||||||||
Net investment income | 0.16 | 0.28 | 0.22 | 0.03 | 0.05 | 0.12 | ||||||||||||||||||
Net realized and unrealized gain (loss) on investments | (3.84 | ) | (1.27 | ) | 1.48 | (0.23 | ) | 2.42 | 0.23 | |||||||||||||||
Total increase (decrease) from investment operations | (3.68 | ) | (0.99 | ) | 1.70 | (0.20 | ) | 2.47 | 0.35 | |||||||||||||||
| Less dividends: | ||||||||||||||||||||||||
Dividends from net investment income | (0.17 | ) | (0.27 | ) | (0.21 | ) | (0.03 | ) | (0.06 | ) | (0.12 | ) | ||||||||||||
Net Asset Value, end of period | $ | 12.67 | $ | 16.52 | $ | 17.78 | $ | 16.29 | $ | 16.52 | $ | 14.11 | ||||||||||||
Total return | (22.31 | )%(a) | (5.62 | )% | 10.40 | % | (1.22 | )% | 17.41 | % | 2.49 | % | ||||||||||||
| Ratios/Supplemental data: | ||||||||||||||||||||||||
Net assets, end of period (in 000’s) | $ | 40,154 | $ | 52,703 | $ | 51,754 | $ | 50,230 | $ | 62,449 | $ | 50,398 | ||||||||||||
Ratio of expenses to average net assets | 1.38 | %(b) | 1.38 | % | 1.44 | % | 2.39 | % | 2.38 | % | 2.37 | % | ||||||||||||
Ratio of net investment income to average net assets | 2.23 | %(b) | 1.50 | % | 1.24 | % | 0.15 | % | 0.35 | % | 0.71 | % | ||||||||||||
Portfolio turnover | 17 | %(a) | 44 | % | 35 | % | 110 | % | 86 | % | 81 | % | ||||||||||||
| (a) | Not annualized |
| (b) | Annualized |
GREEN CENTURY EQUITY FUND FINANCIAL HIGHLIGHTS
| SIX MONTHS ENDED JANUARY 31, 2009 | FOR THE YEARS ENDED JULY 31, | |||||||||||||||||||||||
| (UNAUDITED) | 2008 | 2007 | 2006 | 2005 | 2004 | |||||||||||||||||||
Net Asset Value, beginning of period | $ | 18.83 | $ | 22.66 | $ | 19.91 | $ | 19.91 | $ | 18.18 | $ | 16.45 | ||||||||||||
| Income from investment operations: | ||||||||||||||||||||||||
Net investment income | 0.12 | 0.18 | 0.19 | 0.04 | 0.12 | — | ||||||||||||||||||
Net realized and unrealized gain (loss) on investments | (6.14 | ) | (2.81 | ) | 2.75 | (0.01 | ) | 1.72 | 1.74 | |||||||||||||||
Total increase/(decrease) from investment operations | (6.02 | ) | (2.63 | ) | 2.94 | 0.03 | 1.84 | 1.74 | ||||||||||||||||
| Less dividends: | ||||||||||||||||||||||||
Dividends from net investment income | (0.12 | ) | (0.19 | ) | (0.19 | ) | (0.03 | ) | (0.11 | ) | (0.01 | ) | ||||||||||||
Distributions from net realized gains | — | (1.01 | ) | — | — | — | — | |||||||||||||||||
Total decrease from dividends | (0.12 | ) | (1.20 | ) | (0.19 | ) | (0.03 | ) | (0.11 | ) | (0.01 | ) | ||||||||||||
Net Asset Value, end of period | $ | 12.69 | $ | 18.83 | $ | 22.66 | $ | 19.91 | $ | 19.91 | $ | 18.18 | ||||||||||||
Total return | (32.01 | )%(a) | (12.28 | )% | 14.76 | % | 0.16 | % | 10.10 | % | 10.61 | % | ||||||||||||
| Ratios/Supplemental data: | ||||||||||||||||||||||||
Net assets, end of period (in 000’s) | $ | 32,287 | $ | 50,123 | $ | 42,232 | $ | 32,938 | $ | 35,383 | $ | 33,152 | ||||||||||||
Ratio of expenses to average net assets | 0.95 | %(b) | 0.95 | % | 0.95 | % | 1.50 | % | 1.50 | % | 1.50 | % | ||||||||||||
Ratio of net investment income (loss) to average net assets | 1.41 | %(b) | 0.98 | % | 0.89 | % | 0.20 | % | 0.64 | % | (0.01 | )% | ||||||||||||
Portfolio turnover | 11 | %(a) | 6 | % | 8 | %(c) | 12 | %(d) | 9 | %(d) | 8 | %(d) | ||||||||||||
| (a) | Not annualized. |
| (b) | Annualized. |
| (c) | Represents portfolio turnover for the Equity Fund from November 28, 2006 to July 31, 2007. Portfolio turnover for the Domini Trust from August 1, 2006 to November 27, 2006 was 1%. For further information regarding the withdrawal of the Equity Fund’s investment in the Domini Trust, please see the notes to the financial statements. |
| (d) | Represents portfolio turnover for the Domini Social Equity Trust (“Domini Trust”) for the years ended 2006, 2005 and 2004. |
19
See Notes to Financial Statements
GREEN CENTURY FUNDS NOTES TO FINANCIAL STATEMENTS
(unaudited)
NOTE 1 — Organization and Significant Accounting Policies
Green Century Funds (the “Trust”) is a Massachusetts business trust which offers two separate series, the Green Century Balanced Fund (the “Balanced Fund”) and the Green Century Equity Fund (the “Equity Fund”), collectively, the “Funds”. The Trust is registered under the Investment Company Act of 1940, as amended (the “Act”), as an open-end management investment company. The Trust accounts separately for the assets, liabilities and operations of each series. The Balanced Fund commenced operations on March 18, 1992 and the Equity Fund commenced operations on September 13, 1995.
Through November 27, 2006, the Equity Fund invested substantially all of its assets in the Domini Social Equity Trust (the “Domini Trust”), an open-end, diversified management investment company which had the same investment objective as the Fund. The Equity Fund accounted for its investment in the Domini Trust as a partnership investment and recorded its share of the Domini Trust income, expenses and realized and unrealized gains and losses daily. The value of such investment reflected the Fund’s proportionate interest in the net assets of the Domini Trust (2.57% at November 27, 2006). Effective November 28, 2006, the Equity Fund withdrew its investment from the Domini Trust and directly invested in the securities of the companies included in the Domini 400 SocialSM Index (the “Domini Index”).
The preparation of financial statements in conformity with U.S. generally accepted accounting principles requires management to make estimates and assumptions that affect the reported amounts of assets and liabilities and disclosure of contingent assets and liabilities at the date of the financial statements and the reported amounts of revenues and expenses during the reporting period. Actual results could differ from those estimates. The following is a summary of the Funds’ significant accounting policies:
(A) | Investment Valuation: Equity securities listed on national securities exchanges other than NASDAQ are valued at last sale price. If a last sale price is not available, securities listed on national exchanges other than NASDAQ are valued at the mean between the closing bid and closing ask prices. NASDAQ National Market® and SmallCapSM securities are valued at the NASDAQ Official Closing Price (“NOCP”). The NOCP is based on the last traded price if it falls within the concurrent best bid and ask prices and is normalized pursuant to NASDAQ’s published procedures if it falls outside this range. If an NOCP is not available for any such security, the security is valued at the last sale price, or, if there have been no sales that day, at the mean between the closing bid and closing ask prices. Unlisted equity securities are valued at last sale price, or when last sale prices are not available, at the last quoted bid price. Debt securities (other than certificates of deposit and short-term obligations maturing in sixty days or less) are valued on the basis of valuations furnished by a pricing service which takes into account appropriate factors such as institution-size trading in similar groups of securities, yield, quality, coupon rate, maturity, type of issue, and other market data, without exclusive reliance on quoted prices or exchange or over-the-counter prices, since such valuations are believed to reflect more accurately the fair value of the securities. Securities, if any, for which there are no such valuations or quotations available, or for which the market quotation is not reliable, are valued at fair value by management as determined in good faith under guidelines established by the Trustees. Certificates of deposit are valued at cost plus accrued interest. Short-term obligations maturing in sixty days or less are valued at amortized cost, which approximates market value. |
Various inputs are used in determining the value of the Fund’s investments. These inputs are summarized in the three broad levels listed below:
Level 1 — quoted prices for active markets for identical securities. An active market for the security is a market in which transactions occur with sufficient frequency and volume to provide pricing information on an ongoing basis. A quoted price in an active market provides the most reliable evidence of fair value.
20
GREEN CENTURY FUNDS NOTES TO FINANCIAL STATEMENTS (unaudited) | continued |
Level 2 — other significant observable inputs (including quoted prices for similar securities, interest rates, prepayment speeds, credit risk, etc.) Quoted prices for identical or similar assets in markets that are not active. Inputs that are derived principally from or corroborated by observable market data. An adjustment to any observable input that is significant to the fair value may render the measurement a Level 3 measurement.
Level 3 — significant unobservable inputs, including the Fund’s own assumptions in determining the fair value of investments
The inputs or methodology used for valuing securities are not necessarily an indication of the risk associated with investing in those securities.
The following is a summary of the inputs used to value the Balanced Fund’s net assets as of 1/31/09:
VALUATION INPUTS | INVESTMENT IN SECURITIES | OTHER FINANCIAL INSTRUMENTS* | ||
Level 1 — Quoted Prices | $26,653,881 | — | ||
Level 2 — Other Significant Observable Inputs | 13,347,282 | — | ||
Level 3 — Significant Unobservable Inputs | — | — | ||
Total | $40,001,163 | — | ||
The following is a summary of the inputs used to value the Equity Fund’s net assets as of 1/31/09:
VALUATION INPUTS | INVESTMENT IN SECURITIES | OTHER FINANCIAL INSTRUMENTS* | ||
Level 1 — Quoted Prices | $32,204,698 | — | ||
Level 2 — Other Significant Observable Inputs | 148,954 | — | ||
Level 3 — Significant Unobservable Inputs | — | — | ||
Total | $32,353,652 | — | ||
* Other financial instruments are derivatives instruments not reflected in the Schedule of Investments, such as futures, forwards and swap contracts, which are valued at the unrealized appreciation/depreciation on the investment.
| (B) | Securities Transactions and Investment Income: Securities transactions are recorded on a trade date basis. Realized gains and losses from securities transactions are determined using the identified cost basis. Interest income, including amortization of premiums and accretion of discounts on bonds, is recognized on the accrual basis and dividend income is recorded on ex-dividend date. |
| (C) | Options Transactions: The Balanced Fund may utilize options to hedge or protect from adverse movements in the market values of its portfolio securities and to enhance return. The Equity Fund may utilize options to hedge against possible increases in the value of securities which are expected to be purchased by the Equity Fund or possible declines in the value of securities which are expected to be sold by the Equity Fund. The use of options may involve risks such as the possibility of illiquid markets or imperfect correlation between the value of the option and the underlying securities. The Funds may write put or call options. Premiums received upon writing put or call options are recorded as an asset with a corresponding liability which is |
21
GREEN CENTURY FUNDS NOTES TO FINANCIAL STATEMENTS (unaudited) | continued |
subsequently adjusted to the current market value of the option. Changes between the initial premiums received and the current market value of the options are recorded as unrealized gains or losses. When an option is closed, expired or exercised, a gain or loss is realized and the liability is eliminated. The Funds continue to bear the risk of adverse movements in the price of the underlying assets during the period of the option, although any potential loss during the period would be reduced by the amount of the option premium received. As required by the Act, liquid securities are designated as collateral in an amount equal to the market value of open options contracts. |
| (D) | Repurchase Agreements: The Funds may enter into repurchase agreements with selected banks or broker-dealers that are deemed by the Funds’ adviser to be creditworthy pursuant to guidelines established by the Board of Trustees. Each repurchase agreement is recorded at cost, which approximates fair value. The Funds require that the market value of collateral, represented by securities (primarily U.S. Government securities), be sufficient to cover payments of interest and principal and that the collateral be maintained in a segregated account with a custodian bank in a manner sufficient to enable the Funds to obtain those securities in the event of a default of the counterparty. In the event of default or bankruptcy by the counterparty to the repurchase agreement, retention of the collateral may be subject to legal proceedings. |
| (E) | Distributions: Distributions to shareholders are recorded on the ex-dividend date. The Funds declare and pay dividends of net investment income, if any, semi-annually and distribute net realized capital gains, if any, annually. The amount and character of income and net realized gains to be distributed are determined in accordance with Federal income tax rules and regulations, which may differ from U.S. generally accepted accounting principles. To the extent that these differences are attributable to permanent book and tax accounting differences, the components of net assets have been adjusted. |
| (F) | Federal Taxes: Each series of the Trust is treated as a separate entity for Federal income tax purposes. Each Fund’s policy is to comply with the provisions of the Internal Revenue Code applicable to regulated investment companies. Accordingly, no provisions for Federal income or excise tax are necessary. |
In July 2006, the Financial Accounting Standards Board (FASB) issued Interpretation No. 48, “Accounting for Uncertainty in Income Taxes” (FIN 48). FIN 48 addresses the accounting for uncertainty in income taxes and establishes for all entities, including pass-through entities such as the Funds, a minimum threshold for financial statement recognition of the benefit of positions taken in filing tax returns (including whether an entity is taxable in a particular jurisdiction). The Funds recognize tax benefits only if it is more likely than not that a tax position (including the Funds’ assertion that their income is exempt from tax) will be sustained upon examination. The Funds adopted FIN 48 in fiscal year 2008. The Funds had no material uncertain tax positions and have not recorded a liability for unrecognized tax benefits as of January 31, 2009. Also, the Funds had recognized no interest and penalties related to uncertain tax benefits through January 31, 2009. At January 31, 2009, the tax years 2005 through 2009 remain open to examination by the Internal Revenue Service.
| (G) | Redemption Fee: A 2.00% redemption fee is retained by the Funds to offset the effect of transaction costs and other expenses associated with short-term investing. The fee is imposed on redemptions or exchanges of shares held 60 days or less from their purchase date. For the six months ended January 31, 2009, the Balanced Fund and Equity Fund received $120 and $4,719, respectively, in redemption fees. Redemption fees are recorded as an adjustment to paid-in capital. |
NOTE 2 — Transactions With Affiliates
| (A) | Investment Adviser: Green Century Capital Management, Inc. (“Green Century”) is the adviser (“the Adviser”) for the Funds. Green Century is owned by Paradigm Partners. Green Century oversees the |
22
GREEN CENTURY FUNDS NOTES TO FINANCIAL STATEMENTS (unaudited) | continued |
portfolio management of the Funds on a day-to-day basis. The Balanced Fund pays Green Century a fee, accrued daily and paid monthly, at an annual rate equal to 0.65% of the Balanced Fund’s average daily net assets. The Equity Fund pays Green Century a fee, accrued daily and paid monthly, at an annual rate of 0.25% of the Equity Fund’s average daily net assets up to but not including $100 million, 0.22% of average daily net assets including $100 million up to but not including $500 million, 0.17% of average daily net assets including $500 million up to but not including $1 billion and 0.12% of average daily net assets equal to or in excess of $1 billion. |
| (B) | Subadvisers: Trillium Asset Management Corporation (“Trillium”) is the subadviser for the Balanced Fund. Trillium is paid a fee by the Adviser at an annual rate of 0.40% on the first $30 million of average daily net assets and 0.35% on average daily net assets in excess of $30 million for its services. For the six months ended January 31, 2009, Green Century accrued fees of $87,584 to Trillium. Mellon Capital Management Corporation (“Mellon”) is the subadviser for the Equity Fund. Mellon is paid a fee by the Adviser the greater of $50,000 or 0.08% of the value of the average daily net assets of the Fund up to but not including $100 million, 0.05% of the average daily net assets of the Fund from and including $100 million up to but not including $500 million, 0.02% of the average daily net assets of the Fund from and including $500 million up to but not including $1 billion and 0.01% of the average daily net assets of the Fund equal to or in excess of $1 billion for its services. For the six months ended January 31, 2009, Green Century accrued fees of $25,205 to Mellon. |
| (C) | Administrator: Green Century is the administrator (“the Administrator”) of the Green Century Funds. Pursuant to the Administrative Services Agreement, Green Century pays all the expenses of each Fund other than the investment advisory fees; interest; taxes; brokerage costs and other capital expenses; expenses of non-interested trustees (including counsel fees) and any extraordinary expenses. The Balanced Fund pays Green Century a fee at a rate such that immediately following any payment to the Administrator, the total operating expenses of the Fund, on an annual basis, do not exceed 1.38% of the Fund’s average daily net assets. The Equity Fund pays Green Century a fee at a rate such that immediately following any payment to the Administrator, the total operating expenses of the Fund, on an annual basis, do not exceed 0.95% of the Fund’s average daily net assets. |
| (D) | Subadministrator: Pursuant to a Subadministrative Services Agreement with the Administrator, UMB Fund Services, Inc. (“UMBFS”) as Subadministrator, is responsible for conducting certain day-to-day administration of the Trust subject to the supervision and direction of the Administrator. For the six months ended January 31, 2009, Green Century accrued fees of $42,767 and $42,767 to UMBFS related to services performed on behalf of the Balanced Fund and the Equity Fund, respectively. |
| (E) | Index Agreement: The Equity Fund invests in the securities of the companies included in the Domini Index. The Domini Index is owned and maintained by KLD Research and Analytics, Inc. (“KLD”). For the use of the Index, KLD is paid a fee by the Adviser the greater of $50,000 or at an annual rate of 0.10% on the first $500 million of average daily net assets, 0.075% on average daily net assets on the next $500 million, and 0.05% on average daily net assets in excess of $1 billion. For the six months ended January 31 2009, Green Century accrued fees of $25,205 to KLD. |
NOTE 3 — Investment Transactions
The Balanced Fund’s cost of purchases and proceeds from sales of securities, other than short-term securities, aggregated $7,431,921 and $8,421,581, respectively, for the six months ended January 31, 2009. The Equity Fund’s cost of purchases and proceeds from sales of securities, other than short-term securities, aggregated $4,567,938 and $6,354,997, respectively.
23
GREEN CENTURY FUNDS NOTES TO FINANCIAL STATEMENTS (unaudited) | concluded |
NOTE 4 — Federal Income Tax Information
The tax basis of the components of distributable net earnings (deficit) at July 31, 2008 were as follows:
| BALANCED FUND | EQUITY FUND | |||||||
Undistributed ordinary income | $ | 69,103 | $ | 60,351 | ||||
Undistributed long-term capital gains | 0 | 564 | ||||||
Tax accumulated earnings | 69,103 | 60,915 | ||||||
Accumulated capital and other losses | (12,553,212 | ) | (38,687 | ) | ||||
Unrealized depreciation | (54,457 | ) | (4,941,084 | ) | ||||
Unrealized depreciation on foreign currency | (116 | ) | 0 | |||||
Distributable net earnings (deficit) | $ | (12,538,682 | ) | $ | (4,918,856 | ) | ||
The Balanced Fund has an accumulated capital loss carryforward of $11,693,400 of which $2,323,170 expires in the year 2010 and $9,370,230 expires in the year 2011. To the extent that the Fund realizes future net capital gains, those gains will be offset by any unused capital loss carryforwards.
The Balanced Fund utilized $262,222 of its capital loss carryforwards during the year ended July 31, 2008.
At July 31, 2008, the Balanced and Equity Fund had net realized capital losses from transactions between November 1, 2007 and July 31, 2008 of $859,812 and $38,687, respectively, which for tax purposes, are deferred and will be recognized in fiscal year 2009.
The tax character of distributions paid during the fiscal years ended July 31, 2008 and July 31, 2007 were as follows:
| BALANCED FUND | EQUITY FUND | |||||||||||
| YEAR ENDED JULY 31, 2008 | YEAR ENDED JULY 31, 2007 | YEAR ENDED JULY 31, 2008 | YEAR ENDED JULY 31, 2007 | |||||||||
Ordinary income | $ | 818,386 | $ | 612,601 | $ | 416,913 | $ | 335,455 | ||||
Long-term capital gains | — | — | 1,920,696 | — | ||||||||
NOTE 5 — Capital Share Transactions
Capital Share transactions for the Balanced Fund and the Equity Fund were as follows:
| BALANCED FUND | EQUITY FUND | |||||||||||
| SIX MONTHS ENDED JANUARY 31, 2009 | YEAR ENDED JULY 31, 2008 | SIX MONTHS ENDED JANUARY 31, 2009 | YEAR ENDED JULY 31, 2008 | |||||||||
Shares sold | 129,256 | 565,799 | 281,007 | 977,702 | ||||||||
Reinvestment of dividends | 39,747 | 45,757 | 22,164 | 107,012 | ||||||||
Shares redeemed | (190,074 | ) | (331,445 | ) | (420,704 | ) | (287,203 | ) | ||||
| (21,071 | ) | 280,111 | (117,533 | ) | 797,511 | |||||||
24
BOARD OF TRUSTEES’ CONSIDERATION OF ADVISORY AND SUBADVISORY AGREEMENTS
The Board of Trustees of the Green Century Funds considered and approved the continuance of four advisory and subadvisory agreements during the six months ended January 31, 2009.
INVESTMENT ADVISORY AGREEMENTS WITH GREEN CENTURY CAPITAL MANAGEMENT, INC.
The Board, including the Independent Trustees, approved the continuance of the Investment Advisory Agreements (the “Advisory Agreements”) between the Trust, on behalf of the Balanced Fund and the Equity Fund (the “Funds” and each a “Fund”), and Green Century Capital Management (“Green Century” or the “Adviser”), at a meeting on December 3, 2008. In connection with their deliberations at the meetings, and at separate executive sessions of the Independent Trustees held on November 26, 2008 and on December 3, 2008, the Trustees considered, among other things, information provided by Green Century regarding the investment performance of each Fund; the expenses of each Fund and the advisory fee to be paid to Green Century by each Fund; and the profitability to Green Century of its proposed advisory relationship to each Fund. The Independent Trustees were assisted by independent counsel in considering these materials and the approval and continuance of the Advisory Agreements. The Trustees considered all the information provided to them by Green Century, including information provided throughout the year. In approving the Advisory Agreements, the Board, including the Independent Trustees, did not identify any single factor as determinative. Matters considered in connection with their approval of the Advisory Agreements included the following.
Nature, Quality, and Extent of Services Performed. The Trustees considered the scope and quality of the services to be performed for each of the Funds by the Adviser, including the resources to be dedicated by the Adviser. With respect to the Equity Fund, these services included monitoring the Equity Fund’s performance and tracking error relative to the Domini 400 SocialSM Index (the “Index”); implementing the environmental policies of the Funds by voting the Equity Fund’s shareholder proxies; and overall compliance oversight provided by the Adviser. With respect to the Balanced Fund, the services performed included the oversight and monitoring of the portfolio management and performance of the Balanced Fund; monitoring the implementation of the Balanced Fund’s environmental screens; implementing the environmental policies of the Funds by voting the Balanced Fund’s shareholder proxies; and overall compliance oversight provided by the Adviser. In addition, the Trustees considered the administrative services provided by the Adviser to both Funds, including the coordination of the activities of all of the Funds’ other service providers.
Based on its review of all of the services provided, the Trustees concluded that the nature, quality and extent of services provided by the Adviser supported the continuance of the Advisory Agreements with respect to the Equity Fund and the Balanced Fund.
The Costs of Services Provided and Profitability. The Trustees considered the costs of the services provided to the Funds and the profitability and fall-out benefits to the Adviser from its arrangements with the Funds.
The Trustees reviewed and considered an analysis of the advisory fees and total expenses ratios of each Fund and comparative data for multiple categories of mutual funds included in and as defined by Strategic Insight’s mutual fund database of over 7,000 mutual funds. For the Equity Fund, the Trustees noted that, based on the information provided, the Fund’s advisory fee was lower than the average advisory fee for socially conscious funds, socially conscious growth and income funds, all growth and income funds and growth and income funds which have under $100 million in assets. For the Balanced Fund, the Trustees noted that, based on the information provided, the Fund’s advisory fee was higher than the average advisory fee for socially conscious funds (by 5 basis points), socially conscious balanced Funds (by 12 basis points), all balanced funds (by 14 basis points) and balanced funds which have under $100 million in assets (by 12 basis points). The Trustees considered that Green Century had reduced its advisory fee by 10 basis points in 2006. The Trustees also noted that the total expense ratio of the Balanced Funds was capped at 1.38% and that the total expense ratio was in line with the average total expense ratio for each of the four categories of comparison funds.
25
Green Century provided the Trustees with information relating to the profitability to Green Century of its proposed advisory relationships to the Funds. In that regard, the Trustees considered the subadvisory fees and the other expenses incurred by the Adviser in providing advisory services to the Funds. The Trustees also considered the fee received by Green Century for providing administrative services to the Funds and the expenses incurred in providing those services. In considering the cost allocation methodology used by Green Century, the Trustees took into consideration that the Adviser does not provide advisory or administrative services to other mutual funds or non-mutual fund clients. The Trustees also considered Green Century’s non-profit ownership structure, its cost structure and personnel needs, and its investment in shareholder advocacy to further the Funds’ stated objective of promoting greater corporate environmental accountability. After reviewing the information described above, the Independent Trustees concluded that the fees specified in the Advisory Agreements, taking into account the costs of the services provided by the Adviser and the profitability to the Adviser of its relationships with the Funds, supported the continuance of the Advisory Agreements with respect to the Equity Fund and the Balanced Fund.
Other Benefits. With respect to fall-out benefits, the Trustees considered that neither Green Century nor any affiliate of Green Century receives any brokerage fees, soft dollar benefits, liquidity rebates from electronic communications networks or payments for order flow from the trades executed for either Fund. The Trustees noted that Green Century does benefit intangibly from its relationship with the Funds due to the Funds’ reputation as the first family of no-load environmentally responsible mutual funds. Further, pursuant to the Advisory Agreements, Green Century has reserved for itself the rights to the names “Green Century Funds” and any similar names; thus, Green Century may benefit in the future from developing other funds or investment products with the Green Century brand. The Trustees concluded that the fall-out benefits to be realized by Green Century were appropriate and supported the continuance of the Advisory Agreements with respect to the Equity Fund and the Balanced Fund.
Investment Performance. With respect to the Equity Fund, the Trustees considered that due to the Equity Fund’s passive investment strategy, the principal concern with regard to investment performance was the extent to which the Equity Fund tracked the Index and noted that the Equity Fund’s performance closely followed that of the Index for the period ended September 30, 2008. After considering all the factors deemed appropriate, the Trustees, including the Independent Trustees, concluded that the performance of the Equity Fund supported the continuance of the Advisory Agreement with respect to the Equity Fund.
With respect to the Balanced Fund, the Trustees reviewed and considered information regarding the investment performance of the Balanced Fund and comparative data with respect to the performance of other funds designated by Morningstar to have similar investment objectives as well as the Balanced Fund’s performance measured against the Lipper Balanced Fund Index, a broad-based balanced fund market index. The Trustees noted that as of the period ended September 30, 2008, the Balanced Fund’s one- and ten-year average annual returns had outperformed the Lipper Balanced Fund Index, while the Balanced Fund’s three- and five-year average annual returns had underperformed the benchmark. The Trustees also considered the performance information they had been provided throughout the year. After considering all the factors deemed appropriate, the Trustees, including the Independent Trustees, concluded that the performance of the Balanced Fund supported the continuance of the Advisory Agreement with respect to the Balanced Fund.
Economies of Scale. The Trustees also considered whether economies of scale could be realized by the Adviser as the Funds grew in asset size and the extent to which such economies of scale were reflected in the level of fees charged. They noted the relatively small size of each Fund and the resultant difficulty for the Adviser to achieve meaningful economies of scale. They considered that if the assets were to increase, the Funds could have the opportunity to experience economies of scale as fixed costs would become a smaller percentage of the Funds’ assets and some of the Funds’ service providers’ fees, as a percentage of the Funds’ assets, could decrease. The Trustees noted that the subadvisory fee structure for the Equity Fund included break-points and that the Equity Fund’s advisory fee would decrease as assets increased. The Trustees concluded that economies of scale could be realized as the Funds grew and that if assets increased significantly the Trustees would have opportunities to negotiate decreases in fees with the Adviser.
26
Based on a review of all factors deemed relevant, the Trustees, including the Independent Trustees, concluded that the Advisory Agreements with respect to the Balanced Fund and the Equity Fund should be continued and that they would consider whether to renew each Agreement after a one-year period.
INVESTMENT SUBADVISORY AGREEMENT WITH TRILLIUM ASSET MANAGEMENT CORPORATION
At the meeting on December 3, 2008, the Board of Trustees of the Balanced Fund, including a majority of the Independent Trustees, considered the continuance of the subadvisory agreement between the Trust, on behalf of the Balanced Fund, Green Century, and Trillium Asset Management Corporation (“Trillium”) (the “Subadvisory Agreement”). In connection with their deliberations at the meeting, and at separate executive sessions of the Independent Trustees held on November 26, 2008 and on December 3, 2008, the Trustees considered, among other things, information provided by Trillium regarding the investment performance of the Balanced Fund, the subadvisory fees paid to Trillium, and the profitability to Trillium of its subadvisory relationship to the Balanced Fund. The Independent Trustees were assisted by independent counsel in considering these materials and the continuance of the Subadvisory Agreement. The Trustees considered all the information provided to them by Trillium, including information provided throughout the year. In approving the continuance of the Subadvisory Agreement, the Board, including the Independent Trustees, did not identify any single factor as determinative. Matters considered in connection with their approval of the Subadvisory Agreement included the following.
Nature, Quality, and Extent of Services Performed. The Trustees noted that under the terms of the Subadvisory Agreement, Trillium provided the day-to-day portfolio management of the Balanced Fund, including determining asset and sector allocation; conducting securities selection and discovery; researching and analyzing environmental policies and practices of companies and implementing the Balanced Fund’s environmental screening criteria; managing volatility, risk, and portfolio turnover; and investing the portfolio consistent with the Balanced Fund’s investment objective and policies. The Trustees considered the professional expertise, tenure, and qualifications of the portfolio management team and noted that Trillium was devoted exclusively to environmentally and socially responsible investing and managed approximately $1 billion in assets. The Trustees also considered Trillium’s compliance record as well as the professional experience and responsiveness of Trillium’s compliance staff. The Trustees also considered Trillium’s leadership in social and environmental responsibility, including its shareholder advocacy efforts.
Based on its review of all of the services provided and to be provided, the Trustees concluded that the nature, quality and extent of services provided by Trillium supported the continuance of the Subadvisory Agreement.
Costs of Services Provided and Profitability. The Trustees considered that the subadvisory fees paid by Green Century to Trillium under the Subadvisory Agreement were 0.40% of the value of the average daily net assets of the Balanced Fund up to $30 million, and 0.35% of the value of the average daily net assets of the Balanced Fund in excess of $30 million. The Trustees reviewed the subadvisory fees against comparative data for multiple categories of mutual funds presented in four categories: socially conscious funds, socially conscious balanced funds, all balanced funds, and balanced funds of under $100 million in assets. The Trustees noted that, based on the information provided, the subadvisory fees were within two basis points of those of all socially conscious , all socially conscious balanced funds, all balanced funds and balanced funds of under $100 million in assets. The Trustees also noted that the subadvisory fees are paid by Green Century, and are not in addition to the advisory fees paid to Green Century by shareholders.
In evaluating the profitability of the Subadvisory Agreement to Trillium, the Trustees noted that based on information provided by Trillium, the relationship was not profitable. The Trustees noted that Trillium stated that it would not realize a level of profitability similar to that of its other advisory clients on the management of the Balanced Fund until assets approach $100 million. The Trustees considered the financial resources Trillium dedicated and the other expenses Trillium incurred in providing subadvisory services to the Balanced Fund, including startup costs relating to the relationship, and additional personnel, legal, trading analysis and compliance costs required in the context of providing
27
subadvisory services to a mutual fund. In considering the cost allocation methodology used by Trillium, the Trustees took under consideration that Trillium does not provide advisory or subadvisory services to other mutual fund clients. The Trustees also considered Trillium’s fee structure and noted, based on the information provided, that the subadvisory fees were lower than the fees Trillium charges its other institutional clients.
After reviewing the information described above, the Trustees concluded that the fees specified in the Subadvisory Agreement, taking into account the nature and quality of services provided and the costs of the services provided by Trillium, supported the continuance of the Subadvisory Agreement.
Other Benefits. The Trustees evaluated potential other benefits Trillium may realize from its relationship with the Balanced Fund. The Trustees considered the brokerage practices of Trillium, including the soft dollar commissions that were generated with respect to the Balanced Fund’s portfolio transactions. The Trustees considered that Trillium was not affiliated with a broker/dealer and therefore no benefit would be realized by Trillium through transactions with affiliated brokers. The Trustees also considered the reputational and other advantages Trillium may gain from its relationship with the Balanced Fund. The Trustees concluded that the benefits received by Trillium were reasonable in the context of the relationship between Trillium and the Balanced Fund, and supported the continuance of the Subadvisory Agreement.
Investment Performance. The Trustees reviewed and considered information regarding the investment performance of the Balanced Fund and comparative data with respect to the performance of mutual funds with similar investment objectives as well as other broad-based market indexes. The Trustees noted that as of the period ended September 30, 2008, the Balanced Fund’s one-year return outperformed the Lipper Balanced Fund Index, while the three-year return had underperformed the Lipper Index. Trillium became the Balanced Fund’s subadviser on November 28, 2005. The Trustees also considered the Balanced Fund’s decrease in volatility in the three years since Trillium became the Balanced Fund’s subadvisor. After considering all the factors deemed appropriate, the Trustees concluded that the performance of the Balanced Fund together with Trillium’s investment process, philosophies and experience in environmentally and socially responsible investing supported the continuance of the Subadvisory Agreement.
Economies of Scale. The Trustees also considered whether economies of scale would be realized by Trillium as the Balanced Fund grew in asset size and the extent to which such economies of scale might be reflected in the subadvisory fees. They noted the relatively small size of the Balanced Fund and considered that if the assets were to increase, Trillium could have the opportunity to experience economies of scale. They also noted that pursuant to the Subadvisory Agreement, the subadvisory fees paid to Trillium by Green Century include a breakpoint at $30 million, so that fees as a percentage of net assets decrease as assets in the Balanced Fund increase. The Trustees concluded that economies of scale could be realized as the Fund grew, and that the fee schedule as specified was appropriate, and supported the continuance of the Subadvisory Agreement.
Based on a review of all factors deemed relevant, the Trustees, including the Independent Trustees, concluded that the Subadvisory Agreement should be continued and that they would consider whether to renew it after a one-year period.
INVESTMENT SUBADVISORY AGREEMENT WITH MELLON CAPITAL MANAGEMENT
Also at the meeting on December 3, 2008, the Board of Trustees of the Equity Fund, including a majority of the Independent Trustees, considered the continuance of the subadvisory agreement between the Trust, on behalf of the Equity Fund, Green Century, and Mellon Capital Management (“Mellon”) (the “Subadvisory Agreement”). In connection with their deliberations at the meeting, and at separate executive sessions of the Independent Trustees, the Trustees considered, among other things, information provided by Mellon regarding the investment performance of the Equity Fund, including the success with which the Fund tracked the Index; the subadvisory fees paid to Mellon, and the profitability to Mellon of its subadvisory relationship to the Equity Fund. The Independent Trustees were advised by independent counsel in considering these materials and the continuance of the Subadvisory Agreement. The Trustees considered all the information provided to them by Mellon, including information provided throughout the initial
28
two-year term of the Subadvisory Agreement. In approving the continuance of the Subadvisory Agreement, the Board, including the Independent Trustees, did not identify any single factor as determinative. Matters considered in connection with their approval of the Subadvisory Agreement included the following.
Nature, Quality, and Extent of Services Performed. The Trustees noted that under the terms of the Subadvisory Agreement, Mellon provided the day-to-day portfolio management of the Equity Fund, making purchases and sales of portfolio securities consistent with the Equity Fund’s investment objective and policies and with changes to the Index. The Trustees considered the professional expertise, tenure, and qualification of the portfolio management team for the Equity Fund, as well as the team’s experience in passive management. The Trustees also considered Mellon’s handling of daily inflows and outflows, transaction costs, tracking error, and the portfolio turnover rates for the Equity Fund. The Trustees also considered Mellon’s compliance record as well as the professional experience and responsiveness of Mellon’s compliance staff.
Based on its review of all of the services provided, the Trustees concluded that the nature, quality and extent of services provided by Mellon supported the continuance of the Subadvisory Agreement.
Costs of Services Provided and Profitability. The Trustees considered that the subadvisory fees paid by Green Century to Mellon were 0.08% of the value of the average daily net assets of the Equity Fund up to $100 million, 0.05% of the value of the average daily net assets of the Equity Fund from $100 to $500 million, 0.02% of the value of the average daily net assets of the Equity Fund from $500 million to $1 billion, and 0.01% of the value of the average daily net assets of the Equity Fund in excess of $1 billion, subject to a minimum fee of $50,000 per year. The Trustees reviewed and considered an analysis of the subadvisory fees against comparative data for multiple categories of mutual funds. The Trustees noted that, based on the information provided, the subadvisory fees paid to Mellon were lower than the average subadvisory fees paid to subadvisors of socially conscious funds, socially conscious growth and income funds, all growth and income funds and growth and income funds under $100 million in assets. The Trustees noted that the subadvisory fee paid at current asset levels was higher than subadvisory fees paid by equity index funds, but that this was due in part to the imposition of the yearly minimum fee and that the fee would decrease in terms of basis points as assets increased. The Trustees also noted that the subadvisory fees are paid by Green Century, and are not in addition to the advisory fees paid to Green Century by shareholders.
Green Century provided the Trustees with information prepared by Mellon related to the profitability of the Subadvisory Agreement. The Trustees considered the subadvisory fees and the financial resources Mellon dedicates and the other expenses it incurs in providing subadvisory services to the Equity Fund. In considering the cost allocation methodology used by Mellon, the Trustees noted that Mellon allocated its costs to all its clients equally although Mellon stated that passively managed accounts are less expensive to service than actively managed accounts. The Trustees noted that based on the information provided by Mellon, the relationship was not profitable to Mellon.
After reviewing the information described above, the Trustees concluded that the fees specified in the Subadvisory Agreement, taking into account the costs of the services provided by Mellon, supported the continuance of the Subadvisory Agreement. The Trustees also concluded that the fees specified in the Subadvisory Agreement were fair and reasonable in light of the usual and customary charges made by others for services of the same nature and quality.
Other Benefits. The Trustees evaluated other potential benefits Mellon may realize from its relationship with the Equity Fund. The Trustees considered the brokerage practices of Mellon, including Mellon’s policy that it does not execute transactions for client portfolios through any affiliated broker/dealer and thus no benefit would be realized by Mellon through transactions with affiliated brokers. The Trustees also considered that Mellon does not use trades for index portfolios for the generation of soft dollars, nor does Mellon receive liquidity rebates or payment for order flow from electronic communications networks associated with Equity Fund trades. The Trustees further considered the reputational and other advantages Mellon may gain from its relationship with the Equity Fund. The Trustees concluded
29
that the benefits expected to be received by Mellon were reasonable in the context of the relationship between Mellon and the Equity Fund, and supported the continuance of the Subadvisory Agreement.
Investment Performance. The Trustees considered that the Equity Fund follows a passive investment strategy designed to track the Index and therefore the analysis of its investment performance should be based on the extent to which the Equity Fund successfully tracked the Index. The Trustees reviewed the performance of the Equity Fund, exclusive of the expenses of the fund, as compared to that of the Index for the periods ended September 30, 2008. After considering all the factors deemed appropriate, the Trustees concluded that the performance of the Equity Fund together with Mellon’s investment process and experience in passive portfolio management supported the continuance of the Subadvisory Agreement.
Economies of Scale. The Trustees also considered whether economies of scale would be realized by Mellon as the Equity Fund grew in assets and the extent to which such economies of scale might be reflected in the specified fee schedule. They noted the relatively small size of the Equity Fund and considered that if the assets were to increase, Mellon could have the opportunity to experience economies of scale. They also noted that pursuant to the Subadvisory Agreement, the subadvisory fees specified paid to Mellon by Green Century include breakpoints at $100 million, $500 million, and $1 billion.
Based on the foregoing considerations, the Trustees, including the Independent Trustees, determined that the Subadvisory Agreement should be continued and that they would consider whether to renew it again after a one year period.
30
Semi-Annual Report
INVESTMENT ADVISER AND ADMINISTRATOR
Green Century Capital Management, Inc.
114 State Street
Boston, MA 02109
1-800-93-GREEN
www.greencentury.com
info@greencentury.com
INVESTMENT SUBADVISER (Balanced Fund)
Trillium Asset Management Corporation
711 Atlantic Avenue
Boston, MA 02111
INVESTMENT SUBADVISER (Equity Fund)
Mellon Capital Management Corporation
500 Grant Street Suite 4200
Pittsburgh PA 15258
SUBADMINISTRATOR and DISTRIBUTOR
UMB Fund Services, Inc. (Subadministrator)
UMB Distribution Services, LLC (Distributor)
803 West Michigan Street, Suite A
Milwaukee, WI 53233
CUSTODIAN
State Street Bank and Trust Company
200 Clarendon Street
Boston, MA 02116
TRANSFER AGENT
Unified Fund Services, Inc.
2960 North Meridian Street, Suite 300
Indianapolis, IN 46208
INDEPENDENT REGISTERED PUBLIC ACCOUNTING FIRM
KPMG LLP
99 High Street
Boston, MA 02110
January 31, 2009
Balanced
Fund
An investment for your future.
Printed on recycled paper with soy-based ink. | Equity Fund |
| Item 2. | Code of Ethics |
Not applicable to semi-annual reports.
| Item 3. | Audit Committee Financial Expert |
Not applicable to semi-annual reports.
| Item 4. | Principal Accountant Fees and Services |
Not applicable to semi-annual reports.
| Item 5. | Audit Committee of Listed Registrants |
Not applicable.
| Item 6. | Schedule of Investments |
Included as part of the report to shareholders filed under item 1 of this Form N-CSR
| Item 7. | Disclosure of Proxy Voting Policies and Procedures for Closed-End Management Investment Companies |
Not applicable.
| Item 8. | Portfolio Managers of Closed-End Management Investment Companies |
Not applicable.
| Item 9. | Purchases of Equity Securities by Closed-End Management Investment Company and Affiliated Purchasers |
Not applicable.
| Item 10. | Submission of Matters to a Vote of Security Holders |
There were no material changes to the procedures by which shareholders may recommend nominees to the registrant’s Board of Trustees.
| Item 11. | Controls and Procedures |
| (a) | Based on an evaluation of the disclosure controls and procedures (as defined in Rule 30a-3(c) under the Investment Company Act of 1940, as amended, the “Disclosure Controls”) as of a |
date within 90 days of the filing date (the “Filing Date”) of this Form N-CSR (the “Report”), the registrant’s principal executive officer and principal financial officer have concluded that the Disclosure Controls are effectively designed to ensure that information that is required to be disclosed by the registrant in the Report is recorded, processed, summarized and reported within the time periods specified in the Securities and Exchange Commission’s rules and forms, including ensuring that information required to be disclosed in the Report is accumulated and communicated to the registrant’s management, including the registrant’s principal executive officer and principal financial officer, as appropriate to allow timely decisions regarding required disclosures. |
| (b) | There were no changes in the registrant’s internal controls over financial reporting (as defined in Rule 30 a-3(d) under the Investment Company Act of 1940) that occurred during the second fiscal quarter of the period covered by this report that have materially affected, or are reasonably likely to materially affect, the registrant’s internal control over financial reporting. |
| Item 12. | Exhibits |
| (a)(1) | Not applicable. |
| (2) | Certifications for each principal executive and principal financial officer as required by Rule 30a-2(a) under the Investment Company Act of 1940, as amended, (17 CFR 270.30a-2(a)) are filed herewith. |
| (b) | Certifications required by Rule 30a-2 (b) under the Investment Company Act of 1940, as amended, (17 CFR 270.30a-2 (b)) are filed herewith. |
SIGNATURES
Pursuant to the requirements of the Securities Exchange Act of 1934 and the Investment Company Act of 1940, the registrant has duly caused this report to be signed on its behalf by the undersigned, thereunto duly authorized.
Green Century Funds |
/s/ |
Kristina A. Curtis |
President |
April 8, 2009
Pursuant to the requirements of the Securities Exchange Act of 1934 and the Investment Company Act of 1940, this report has been signed below by the following persons on behalf of the registrant and in the capacities and on the dates indicated.
/s/ |
Kristina A. Curtis |
President and Principal Executive Officer |
April 8, 2009
/s/ |
Kristina A. Curtis |
Treasurer and Principal Financial Officer |
April 8, 2009