UNITED STATES
SECURITIES AND EXCHANGE COMMISSION
Washington, D.C. 20549
FORM N-CSR
CERTIFIED SHAREHOLDER REPORT OF REGISTERED
MANAGEMENT INVESTMENT COMPANIES
Investment Company Act File Number 811-06351
Green Century Funds
114 State Street
Suite 200
Boston, MA 02109
(Address of principal executive offices)
Green Century Capital Management, Inc.
114 State Street
Suite 200
Boston, MA 02109
(Name and address of agent for service)
Registrant’s telephone number, including area code: (617) 482-0800
Date of fiscal year end: July 31
Date of reporting period: January 31, 2015
Item 1. Reports to Stockholders
The following is a copy of the report transmitted to shareholders pursuant to Rule 30e-1 under the Investment Company Act of 1940 (17 CFR 270.30e-1).
| | |
 | | SEMI-ANNUAL REPORT Green Century Balanced Fund Green Century Equity Fund January 31, 2015 |
| |
| An investment for your future.® | | 114 State Street, Boston, Massachusetts 02109 |
For information on the Green Century Funds®, call 1-800-93-GREEN. For information on how to open an account and account services, call 1-800-221-5519 8:00 am to 6:00 pm Eastern Time, Monday through Friday. For share price and account information, call 1-800-221-5519, twenty-four hours a day.
Dear Green Century Funds Shareholder:
Whether you are a new investor with Green Century—or one that has been with us over the decades—we appreciate the trust that you have placed in us.
Since our last update six months ago, Green Century has reached some important milestones that we want to share with you.
Funds Reach New Growth Milestones. The net assets in the two Green Century Funds—the Green Century Equity Fund and the Green Century Balanced Fund—grew by 135% from January 1, 2012 to December 31, 2014, as a result of both market appreciation and net new investments.
In addition, the combined net assets of the two Funds hit the $250M mark since the last update with each of the Funds surpassing the $100M threshold.
Many of our newest investors specifically sought out fossil fuel free funds and found Green Century. Whether they are looking to match their investments with their values, seeking to invest in companies that promote clean energy solutions or want to avoid potential devalued assets in fossil fuel companies that
may accompany a “carbon bubble,” Green Century investors are turning away from coal, oil and gas companies.
Investing in Sustainable Companies. But, Green Century’s investment strategy does not stop with avoiding the industry that has driven climate change or the companies that produce genetically modified organisms (GMOs), engage in factory farming or produce firearms.
Green Century also proactively seeks to invest in companies that produce clean energy and promote energy efficiency. For example, both Funds hold Johnson Controls,1 which retrofits commercial office buildings with hybrid solar cells that collect 75% of solar energy to cool and power the buildings.
Avoiding the worst polluters and investing in companies we view as leaders of a green economy has helped make Green Century’s Balanced Fund nearly 50% less carbon intensive than the S&P 500® Index as of January 31, 2013, according to a study

Johnson Controls has reduced energy use by retrofitting the Empire State Building
Photo: “Empire State” by Jeff Hitchcock is licensed under CC BY 2.0.
performed by Trucost, a leading environmental data and analysis firm. In this follow up to the first carbon footprint report prepared for a U.S. mutual fund, Trucost measured the tons of carbon emissions per million dollars of revenue of the companies held by the Balanced Fund and those of the companies included in the S&P 500® Index and found the Balanced Fund to be the low carbon solution.
Making an Impact through Your Investments. As a core part of its mission, Green Century leverages its clout as a shareholder to press top U.S. companies to be more environmentally sustainable. Green Century led a campaign to reduce carbon pollution by protecting forests around the world. Specifically, Green Century pressed Kelloggs,1 ConAgra,1 and JM Smuckers1 to only buy palm oil that is grown without burning and razing rainforests. By persuading these companies to change, Green Century has helped transform the full supply chain—in just 12 months, the percentage of traded palm oil covered by zero deforestation agreements jumped from 5% to 96%.
These supply chain changes are producing concrete reductions in the carbon pollution that causes global warming—one company’s pledge alone will save an estimated 1.5 gigatons of carbon dioxide from being released, equal to the annual emissions from Central and South America combined in 2010.
Your Investments Benefit Environmental Groups. Green Century supports non-profit environmental groups through its unique ownership structure. Green Century Capital Management is the only mutual fund company founded and owned by environmental advocacy organizations. This means that all the net profits that Green Century earns on the management of the Green Century Funds belong to its founders, the Public Interest Research Groups (PIRGs), which are part of the Public Interest Network that also includes U.S.PIRG and Environment America.
We thank you for your investment in the Green Century Funds and look forward to continuing to partner with you to build a sustainable future.
Respectfully,
Leslie Samuelrich, President, Green Century Capital Management
p.s. To get more information on the Funds and advocacy successes, please sign up for our free e-newsletter. Visit: www.greencentury.com/news/signup, email info@greencentury.com or call 1-800-93-GREEN.

Green Century has helped dramatically change the palm oil supply chain to protect endangered species, protect rainforests, and reduce carbon pollution
2
THE GREEN CENTURY EQUITY FUND
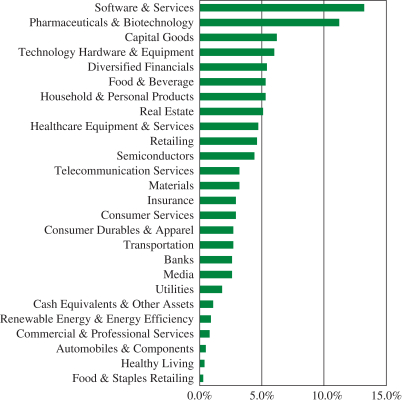
The Green Century Equity Fund invests essentially all of its assets in the stocks which make up the MSCI KLD 400 Social ex Fossil Fuels Index (the KLD 400 Index or the Index), comprised primarily of large capitalization U.S. companies selected based on comprehensive social and environmental sustainability criteria. The Equity Fund seeks to provide shareholders with a long-term total return that matches that of the Index.
| | | | | | | | | | | | | | | | | | |
| | | Average Annual Return* Total expense ratio: 1.25% | | Six Months | | | One Year | | | Five Years | | | Ten Years | |
| December 31, 2014 | | Green Century Equity Fund | | | 6.92% | | | | 12.81% | | | | 13.58% | | | | 6.40% | |
| | | S&P 500® Index2 | | | 6.12% | | | | 13.69% | | | | 15.45% | | | | 7.67% | |
| January 31, 2015 | | Green Century Equity Fund | | | 4.75% | | | | 12.94% | | | | 13.73% | | | | 6.41% | |
| | | S&P 500® Index2 | | | 4.37% | | | | 14.22% | | | | 15.60% | | | | 7.61% | |
* The performance data quoted represents past performance and is not a guarantee of future results. Investment return and principal value of an investment will fluctuate so that an investor’s shares, when redeemed, may be worth more or less than their original cost. Current performance may be lower or higher than the performance information quoted. To obtain performance information as of the most recent month-end, call 1-800-93-GREEN. Performance includes the reinvestment of income dividends and capital gain distributions. Performance shown does not reflect the deduction of taxes that a shareholder might pay on Fund distributions or the redemption of Fund shares. A redemption fee of 2.00% may be imposed on redemptions or exchanges of shares you have owned for 60 days or less. Please see the Prospectus for more information.
The Green Century Equity Fund, which closely tracks the KLD 400 Index, returned 4.75% for the six month period ended January 31, 2015, while the S&P 500® Index (the S&P 500®) returned 4.37% during the same period.
The difference in performance of the Equity Fund relative to the S&P 500® was largely due to differences in sector allocation and stock selection criteria between the two portfolios. The energy sector was the worst-performing sector in the S&P 500® during the period, losing more than 19%. As a function of becoming fossil fuel free on April 1, 2014, the Equity Fund did not hold any stocks in the traditional energy sector during the period, contributing significantly to its outperformance versus the S&P 500®. However, the Equity Fund’s performance relative to the S&P 500® was hurt by stock selection in the information technology sector. In particular, the Equity Fund does not hold Apple,1 which was the largest constituent of the S&P 500® and performed well.
GREEN CENTURY EQUITY FUND
INVESTMENT BY INDUSTRY
3
According to an analysis by the Equity Fund’s portfolio managers, U.S. equities performed positively in the second half of 2014. U.S. equity returns were boosted in the third quarter by improving economic data, which could lead to the U.S. Federal Reserve implementing an interest rate increase in the near future. U.S. equities also benefitted from improved corporate earnings results and rebounded from a drop in late July after the announcement of additional sanctions imposed on Russia. Furthermore, growing tension in the Middle East had a limited, but negative, impact on U.S. equities.
U.S. equities also saw positive gains in the fourth quarter of 2014, boosted by improving economic data, strong corporate earnings and further declines in overseas growth, leading investors to seek the relative safety of U.S. assets. Strong earnings helped U.S. equities rebound from an October swoon as worries of global economic weakness sparked fears of a market correction. Following a December policy meeting, Janet Yellen said the Federal Reserve could potentially raise short-term interest rates in 2015 amid encouraging economic signs, but this would not likely occur until at least mid-2015. Despite economic improvements in the U.S., geopolitical tension, an extended decline in oil prices, and weaker economic conditions globally continue to be an overhang on investor optimism.
The Equity Fund, like other mutual funds invested primarily in stocks, carries the risk of investing in the stock market. The large companies in which the Equity Fund is invested may perform worse than the stock market as a whole. The Equity Fund will not shift concentration from one industry to another or from stocks to bonds or cash, in order to defend against a falling stock market.
THE GREEN CENTURY BALANCED FUND
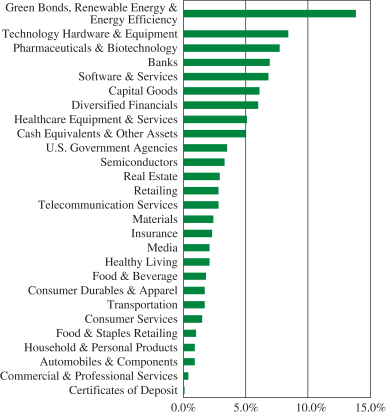
The Green Century Balanced Fund seeks capital growth and income from a diversified portfolio of stocks and bonds that meet Green Century’s standards for corporate environmental performance. The portfolio managers of the Balanced Fund do not invest in fossil fuel companies and aim to invest in companies that are in the business of solving environmental problems or that are committed to reducing their environmental impact.
| | | | | | | | | | | | | | | | | | |
| | | Average Annual Return* Total expense ratio: 1.48% | | Six Months | | | One Year | | | Five Years | | | Ten Years | |
| December 31, 2014 | | Green Century Balanced Fund | | | 3.66% | | | | 7.20% | | | | 10.29% | | | | 5.35% | |
| | | Custom Balanced Fund Index3 | | | 3.74% | | | | 9.17% | | | | 10.94% | | | | 6.66% | |
| January 31, 2015 | | Green Century Balanced Fund | | | 3.85% | | | | 8.84% | | | | 10.44% | | | | 5.57% | |
| | | Custom Balanced Fund Index3 | | | 3.85% | | | | 9.80% | | | | 11.04% | | | | 6.70% | |
* The performance data quoted represents past performance and is not a guarantee of future results. Investment return and principal value of an investment will fluctuate so that an investor’s shares, when redeemed, may be worth more or less than their original cost. Current performance may be lower or higher than the performance information quoted. To obtain performance information as of the most recent month-end, call 1-800-93-GREEN. Performance includes the reinvestment of income dividends and capital gain distributions. Performance shown does not reflect the deduction of taxes that a shareholder might pay on Fund distributions or the redemption of Fund shares. A redemption fee of 2.00% may be imposed on redemptions or exchanges of shares you have owned for 60 days or less. Please see the Prospectus for more information.
4
During the six month period ended January 31, 2015, the Balanced Fund matched the performance of the Custom Balanced Index, with both the Balanced Fund and the Custom Balanced Index returning 3.85%.
In the view of the Balanced Fund’s portfolio managers, during the twelve months ended January 31, 2015, investors largely focused on negative factors such as the potential increase in interest rates, a weakening global economy, and geopolitical risks, offset by the positive effects of a slowly strengthening U.S. economy. Throughout 2014, U.S. economic conditions were largely positive with steady, moderate, sustained growth throughout the year, even as the Federal Reserve conducted its “tapering” program to draw excess liquidity from the U.S. banking system. Surprisingly, during the past year, longer term interest rates fell, reflecting capital inflows from abroad, as overseas investors faced significantly lower interest rates in their home currencies. The Balanced Fund’s portfolio managers continue to expect substantially higher returns from stocks than from bonds. However, the portfolio managers have extended bond maturities slightly, and bond returns for the Balanced Fund were in line with overall intermediate bond market returns.
As the Balanced Fund is managed to be free of fossil fuel companies, the Fund does not own any holdings in the traditional energy sector. During the twelve months ended January 31, 2015, the spot price of oil swung between a low of $44 per barrel and a high of $108, and fossil fuel energy stock performance was considerably below that of the broader market. The Fund benefitted from its lack of exposure to fossil fuel energy, but clean energy, clean tech, and conservation company stocks were also hurt by falling oil prices. The average Balanced Fund holding of these stocks fell by 8% for the twelve months ended January 31, 2015.
The Fund’s equity holdings which positively contributed to its performance during the twelve months ended January 31, 2015 included: Apple, Inc.,1 Shire PLC ADR,1 UnitedHealth Group,1 NXP Semiconductors NV,1 and Keurig Green Mountain, Inc.1 Poor performers included QUALCOMM, Inc.,1 Valmont Industries, Inc.,1 Fifth Third Bancorp,1 F5 Networks, Inc.,1 and Deckers Outdoor Corp. 1
GREEN CENTURY BALANCED FUND
INVESTMENT BY INDUSTRY
5
The Balanced Fund’s portfolio managers believe the Fund is positioned to benefit from the moderate economic growth expected for the U.S. in 2015. The Fund’s equity holdings are slightly weighted toward more cyclical sectors such as industrials stocks, and the Fund’s bond holdings are weighted toward short to intermediate maturity and high quality bonds.
The Green Century Balanced Fund invests in the stocks and bonds of environmentally responsible corporations of various sizes, including small, medium, and large companies. The Green Century Balanced Fund does not invest in fossil fuel companies though most other diversified mutual funds do.
The value of the stocks held in the Balanced Fund will fluctuate in response to factors that may affect a single issuer, industry, or sector of the economy or may affect the market as a whole. Bonds are subject to a variety of risks including interest rate, credit, and inflation risk.
The Green Century Funds’ proxy voting guidelines and a record of the Funds’ proxy votes for the year ended June 30, 2014 are available without charge, upon request, (i) at www.greencentury.com, (ii) by calling 1-800-93-GREEN, (iii) sending an e-mail to info@greencentury.com, and (iv) on the Securities and Exchange Commission’s website at www.sec.gov.
The Green Century Funds file their complete schedule of portfolio holdings with the SEC for the first and third quarters of the year on Form N-Q. The Green Century Funds’ Forms N-Q are available on the EDGAR database on the SEC’s website at www.sec.gov. These Forms may also be reviewed and copied at the SEC’s Public Reference Room in Washington D.C. Information about the operation of the Public Reference Room may be obtained by calling 1-800-SEC-0330. The information on Form N-Q may also be obtained by calling 1-800-93-GREEN, or by e-mailing a request to info@greencentury.com.
1 As of January 31, 2015, the following companies comprised the listed percentages of each of the Green Century Funds:
| | | | | | | | |
| Portfolio Holding | | GREEN CENTURY
BALANCED FUND | | | GREEN CENTURY
EQUITY FUND | |
Johnson Controls, Inc. | | | 1.54 | % | | | 0.44 | % |
Kellogg Company | | | 0.00 | % | | | 0.25 | % |
ConAgra Foods, Inc. | | | 0.00 | % | | | 0.00 | % |
The JM Smucker Company | | | 0.48 | % | | | 0.15 | % |
Apple, Inc. | | | 2.41 | % | | | 0.00 | % |
Shire PLC ADR | | | 2.03 | % | | | 0.00 | % |
UnitedHealth Group, Inc. | | | 1.63 | % | | | 0.00 | % |
NXP Semiconductors NV | | | 1.78 | % | | | 0.00 | % |
Keurig Green Mountain, Inc. | | | 0.29 | % | | | 0.21 | % |
QUALCOMM, Inc. | | | 1.12 | % | | | 1.48 | % |
Valmont Industries, Inc. | | | 0.79 | % | | | 0.00 | % |
Fifth Third Bancorp | | | 0.75 | % | | | 0.00 | % |
F5 Networks, Inc. | | | 1.44 | % | | | 0.00 | % |
Deckers Outdoor Corp. | | | 0.55 | % | | | 0.03 | % |
6
Portfolio composition will change due to ongoing management of the Funds. Please refer to the Green Century Funds website for current information regarding the Funds’ portfolio holdings. These holdings are subject to risk as described in the Funds’ Prospectus. References to specific investments should not be construed as a recommendation of the securities by the Funds, their administrator, or their distributor.
2 The S&P 500® Index is an unmanaged index of 500 selected common stocks, most of which are listed on the New York Stock Exchange. The S&P 500® Index is heavily weighted toward stocks with large market capitalization and represents approximately two-thirds of the total market value of all domestic stocks. It is not possible to invest directly in the S&P 500® Index.
3 The Custom Balanced Index is comprised of a 60% weighting in the S&P 1500 Index and a 40% weighting in the BofA Merrill Lynch 1-10 Year US Corporate & Government Index (the BofA Merrill Lynch Index). The S&P Supercomposite 1500 Index is an unmanaged broad-based capitalization-weighted index comprising 1500 stocks of large-cap, mid-cap, and small-cap U.S. companies. The BofA Merrill Lynch Index tracks the performance of U.S. dollar-denominated investment grade government and corporate public debt issued in the U.S. domestic bond market with at least 1 year and less than 10 years remaining maturity, including U.S. treasury, U.S. agency, foreign government, supranational and corporate securities. It is not possible to invest directly in the Custom Balanced Index, the S&P Supercomposite 1500 Index, or the BofA Merrill Lynch Index.
The Funds’ environmental criteria limit the investments available to the Funds compared to mutual funds that do not use environmental criteria.
This information has been prepared from sources believed reliable. The views expressed are as of the date of publication and are those of the Advisor to the Funds.
This material must be preceded or accompanied by a current Prospectus.
Distributor: UMB Distribution Services, LLC, 3/15
The Green Century Equity Fund (the “Fund”) is not sponsored, endorsed, or promoted by MSCI, its affiliates, information providers or any other third party involved in, or related to, compiling, computing or creating the MSCI indices (the “MSCI Parties”), and the MSCI Parties bear no liability with respect to the Fund or any index on which the Fund is based. The MSCI Parties are not sponsors of the Fund and are not affiliated with the Fund in any way. The Statement of Additional Information contains a more detailed description of the limited relationship the MSCI Parties have with Green Century Capital Management and the Fund.
7
GREEN CENTURY FUNDS EXPENSE EXAMPLE
For the six months ended January 31, 2015 (unaudited)
As a shareholder of the Green Century Funds (the “Funds”), you incur two types of costs: (1) transaction costs, including redemption fees on certain redemptions; and (2) ongoing costs, including management fees and other Fund expenses. This example is intended to help you understand your ongoing costs (in dollars) of investing in the Funds and to compare these costs with the ongoing costs of investing in other mutual funds.
The example is based on an investment of $1,000 invested at the beginning of the period and held for the entire period from August 1, 2014 to January 31, 2015 (the “period”).
Actual Expenses The first line of the table below provides information about actual account values and actual expenses. You may use the information in this line, together with the amount you invested, to estimate the expenses you paid over the period. Simply divide your account value by $1,000 (for example, an $8,600 account value divided by $1,000 equals 8.6), then multiply the result by the number in the first line under the heading entitled “Expenses Paid During the Period” to estimate the expenses you paid on your account during the period.
Hypothetical Example for Comparison Purposes The second line of the table below provides information about hypothetical account values and hypothetical expenses based on the Funds’ actual expense ratios and an assumed rate of return of 5% per year before expenses, which is not the actual return of either of the Funds. The hypothetical account values and expenses may not be used to estimate the actual ending account balance or expenses you paid for the period. You may use this information to compare the ongoing costs of investing in the Funds and other funds. To do so, compare this 5% hypothetical example with the 5% hypothetical examples that appear in the shareholder reports of other funds.
Please note that the expenses shown in the table are meant to highlight your ongoing costs only and do not reflect any transactional costs, such as redemption fees on shares held for 60 days or less. Therefore, the second line of the table is useful in comparing the ongoing costs only, and will not help you determine the relative total costs of owning different funds. In addition, if these transactional costs were included, your costs could have been higher.
| | | | | | | | | | | | |
| | | BEGINNING
ACCOUNT VALUE
AUGUST 1, 2014 | | | ENDING
ACCOUNT VALUE
JANUARY 31, 2015 | | | EXPENSES
PAID DURING
THE PERIOD1 | |
Balanced Fund | | | | | | | | | | | | |
Actual Expenses | | $ | 1,000.00 | | | $ | 1,038.50 | | | $ | 7.61 | |
Hypothetical Example, assuming a 5% return before expenses | | | 1,000.00 | | | | 1,017.54 | | | | 7.53 | |
| | | |
Equity Fund | | | | | | | | | | | | |
Actual Expenses | | | 1,000.00 | | | | 1,047.50 | | | | 6.45 | |
Hypothetical Example, assuming a 5% return before expenses | | | 1,000.00 | | | | 1,018.70 | | | | 6.36 | |
1 Expenses are equal to the Funds’ annualized expense ratios (1.48% for the Balanced Fund and 1.25% for the Equity Fund), multiplied by the average account value over the period, multiplied by 184/365 (to reflect the one-half year period).
8
| | |
GREEN CENTURY BALANCED FUND PORTFOLIO OF INVESTMENTS January 31, 2015 (unaudited) | | |
| | | | | | | | |
COMMON STOCKS — 66.2% | |
| | | SHARES | | | VALUE | |
| | | | | | | | |
Technology Hardware & Equipment — 7.7% | |
Apple, Inc. | | | 28,238 | | | $ | 3,308,364 | |
Cisco Systems, Inc. | | | 78,524 | | | | 2,070,285 | |
F5 Networks, Inc. (a) | | | 17,684 | | | | 1,973,888 | |
Palo Alto Networks, Inc. (a) | | | 10,487 | | | | 1,325,452 | |
QUALCOMM, Inc. | | | 24,699 | | | | 1,542,700 | |
SanDisk Corporation | | | 5,351 | | | | 406,194 | |
| | | | | | | | |
| | | | | | | 10,626,883 | |
| | | | | | | | |
Pharmaceuticals & Biotechnology — 6.3% | |
Amgen, Inc. | | | 13,976 | | | | 2,127,986 | |
Gilead Sciences, Inc. (a) | | | 22,048 | | | | 2,311,292 | |
Novartis A.G. American Depositary Receipt (b) | | | 13,937 | | | | 1,357,464 | |
Shire PLC American Depositary Receipt (b) | | | 12,735 | | | | 2,792,276 | |
| | | | | | | | |
| | | | | | | 8,589,018 | |
| | | | | | | | |
Capital Goods — 5.5% | |
Cummins, Inc. | | | 6,059 | | | | 844,988 | |
Hexcel Corporation | | | 29,452 | | | | 1,302,662 | |
Lincoln Electric Holdings, Inc. | | | 24,209 | | | | 1,644,033 | |
Middleby Corporation (The) (a) | | | 6,045 | | | | 574,396 | |
Pentair PLC | | | 8,937 | | | | 552,396 | |
Valmont Industries, Inc. | | | 9,052 | | | | 1,087,326 | |
W.W. Grainger, Inc. | | | 2,176 | | | | 513,188 | |
Wabtec Corporation | | | 12,298 | | | | 1,026,268 | |
| | | | | | | | |
| | | | | | | 7,545,257 | |
| | | | | | | | |
Healthcare Equipment & Services — 4.4% | |
Baxter International, Inc. | | | 12,707 | | | | 893,429 | |
Hologic, Inc. (a) | | | 27,988 | | | | 849,856 | |
Omnicell, Inc. (a) | | | 34,317 | | | | 1,092,310 | |
UnitedHealth Group, Inc. | | | 21,130 | | | | 2,245,063 | |
Zimmer Holdings, Inc. | | | 8,952 | | | | 1,003,519 | |
| | | | | | | | |
| | | | | | | 6,084,177 | |
| | | | | | | | |
Banks — 4.4% | |
East West Bancorp, Inc. | | | 23,205 | | | | 839,557 | |
Fifth Third Bancorp | | | 59,794 | | | | 1,034,436 | |
First Republic Bank | | | 12,079 | | | | 615,063 | |
SVB Financial Group (a) | | | 12,259 | | | | 1,384,041 | |
Umpqua Holdings Corporation | | | 54,515 | | | | 845,528 | |
Wells Fargo & Company | | | 26,213 | | | | 1,360,979 | |
| | | | | | | | |
| | | | | | | 6,079,604 | |
| | | | | | | | |
| | | | | | | | |
| | | SHARES | | | VALUE | |
| | | | | | | | |
Diversified Financials — 4.1% | |
American Express Company | | | 4,365 | | | $ | 352,212 | |
Charles Schwab Corporation (The) | | | 29,124 | | | | 756,642 | |
Citigroup, Inc. | | | 31,911 | | | | 1,498,221 | |
Stifel Financial Corporation (a) | | | 45,527 | | | | 2,146,598 | |
T. Rowe Price Group, Inc. | | | 11,013 | | | | 866,943 | |
| | | | | | | | |
| | | | | | | 5,620,616 | |
| | | | | | | | |
Software & Services — 3.6% | |
Citrix Systems, Inc. (a) | | | 12,453 | | | | 737,965 | |
eBay, Inc. (a) | | | 10,068 | | | | 533,604 | |
Google, Inc., Class A (a) | | | 1,195 | | | | 642,372 | |
Google, Inc., Class C (a) | | | 1,195 | | | | 638,752 | |
MasterCard, Inc., Class A | | | 10,709 | | | | 878,459 | |
Microsoft Corporation | | | 38,442 | | | | 1,553,057 | |
| | | | | | | | |
| | | | | | | 4,984,209 | |
| | | | | | | | |
Semiconductors — 3.3% | | | | | | | | |
ARM Holdings PLC American Depositary Receipt (b) | | | 18,970 | | | | 888,555 | |
Intel Corporation | | | 15,114 | | | | 499,367 | |
NXP Semiconductors NV (a)(b) | | | 30,760 | | | | 2,440,498 | |
Xilinx, Inc. | | | 19,926 | | | | 768,645 | |
| | | | | | | | |
| | | | | | | 4,597,065 | |
| | | | | | | | |
Renewable Energy & Energy Efficiency — 2.9% | |
EnerNOC, Inc. (a) | | | 20,794 | | | | 358,073 | |
First Solar, Inc. (a) | | | 14,364 | | | | 607,884 | |
Johnson Controls, Inc. | | | 34,178 | | | | 1,588,252 | |
Ormat Technologies, Inc. | | | 35,670 | | | | 954,172 | |
SolarCity Corporation (a) | | | 9,192 | | | | 446,823 | |
| | | | | | | | |
| | | | | | | 3,955,204 | |
| | | | | | | | |
Retailing — 2.8% | | | | | | | | |
Home Depot, Inc. (The) | | | 10,868 | | | | 1,134,837 | |
Men’s Wearhouse, Inc. (The) | | | 10,952 | | | | 508,939 | |
Priceline Group, Inc. (The) (a) | | | 656 | | | | 662,219 | |
TJX Companies, Inc. (The) | | | 23,348 | | | | 1,539,567 | |
| | | | | | | | |
| | | | | | | 3,845,562 | |
| | | | | | | | |
Materials — 2.4% | | | | | | | | |
Minerals Technologies, Inc. | | | 19,482 | | | | 1,272,759 | |
Sealed Air Corporation | | | 48,847 | | | | 1,978,304 | |
| | | | | | | | |
| | | | | | | 3,251,063 | |
| | | | | | | | |
9
| | |
GREEN CENTURY BALANCED FUND PORTFOLIO OF INVESTMENTS January 31, 2015 (unaudited) | | continued |
| | | | | | | | |
| | | SHARES | | | VALUE | |
| | | | | | | | |
Insurance — 2.3% | | | | | | | | |
Aflac, Inc. | | | 26,068 | | | $ | 1,487,961 | |
Lincoln National Corporation | | | 16,489 | | | | 824,120 | |
Reinsurance Group of America, Inc. | | | 10,865 | | | | 899,731 | |
| | | | | | | | |
| | | | | | | 3,211,812 | |
| | | | | | | | |
Real Estate — 2.1% | | | | | | | | |
CBRE Group, Inc., Class A (a) | | | 55,564 | | | | 1,796,940 | |
Forest City Enterprises, Inc., Class A (a) | | | 43,881 | | | | 1,075,084 | |
| | | | | | | | |
| | | | | | | 2,872,024 | |
| | | | | | | | |
Healthy Living — 2.1% | | | | | | | | |
United Natural Foods, Inc. (a) | | | 16,707 | | | | 1,291,117 | |
Whole Foods Market, Inc. | | | 29,412 | | | | 1,532,218 | |
| | | | | | | | |
| | | | | | | 2,823,335 | |
| | | | | | | | |
Food & Beverage — 1.8% | | | | | | | | |
General Mills, Inc. | | | 300 | | | | 15,744 | |
JM Smucker Company (The) | | | 6,458 | | | | 666,143 | |
Keurig Green Mountain, Inc. | | | 3,228 | | | | 395,624 | |
Unilever NV American Depositary Receipt (b) | | | 31,749 | | | | 1,376,954 | |
| | | | | | | | |
| | | | | | | 2,454,465 | |
| | | | | | | | |
Consumer Durables & Apparel — 1.7% | |
Deckers Outdoor Corporation (a) | | | 11,435 | | | | 755,282 | |
Jarden Corporation (a) | | | 20,524 | | | | 985,562 | |
lululemon athletica, Inc. (a) | | | 9,899 | | | | 655,710 | |
| | | | | | | | |
| | | | | | | 2,396,554 | |
| | | | | | | | |
Transportation — 1.7% | | | | | | | | |
J.B. Hunt Transport Services, Inc. | | | 11,215 | | | | 892,826 | |
United Parcel Service, Inc., Class B | | | 14,699 | | | | 1,452,849 | |
| | | | | | | | |
| | | | | | | 2,345,675 | |
| | | | | | | | |
Consumer Services — 1.5% | | | | | | | | |
Panera Bread Company, Class A (a) | | | 8,722 | | | | 1,498,963 | |
Starbucks Corporation | | | 275 | | | | 24,071 | |
Starwood Hotels & Resorts Worldwide, Inc. | | | 7,632 | | | | 549,275 | |
| | | | | | | | |
| | | | | | | 2,072,309 | |
| | | | | | | | |
| | | | | | | | |
| | | SHARES | | | VALUE | |
| | | | | | | | |
Telecommunication Services — 1.5% | |
BT Group PLC American Depositary Receipt (b) | | | 13,254 | | | $ | 832,086 | |
SBA Communications Corporation, Class A (a) | | | 10,189 | | | | 1,189,056 | |
| | | | | | | | |
| | | | | | | 2,021,142 | |
| | | | | | | | |
Media — 1.3% | |
Discovery Communications, Inc., Class A (a) | | | 20,215 | | | | 585,932 | |
Discovery Communications, Inc., Class C (a) | | | 4,016 | | | | 111,966 | |
IMAX Corporation (a) | | | 31,470 | | | | 1,048,895 | |
| | | | | | | | |
| | | | | | | 1,746,793 | |
| | | | | | | | |
Household & Personal Products — 0.9% | |
Church & Dwight Company, Inc. | | | 15,909 | | | | 1,287,356 | |
| | | | | | | | |
Automobiles & Components — 0.9% | |
BorgWarner, Inc. | | | 21,911 | | | | 1,183,413 | |
| | | | | | | | |
Food & Staples Retailing — 0.6% | |
Costco Wholesale Corporation | | | 5,952 | | | | 851,077 | |
| | | | | | | | |
Commercial & Professional Services — 0.4% | |
Interface, Inc. | | | 34,302 | | | | 538,884 | |
| | | | | | | | |
Total Common Stocks
(Cost $72,110,607) | | | | | | | 90,983,497 | |
| | | | | | | | |
| | | PRINCIPAL
AMOUNT | | | | |
BONDS & NOTES — 28.7% | |
Green Bonds, Renewable Energy & Energy Efficiency — 10.9% | | | | | |
African Development Bank
0.75%, due 10/18/16 (b) | | $ | 1,000,000 | | | | 1,004,174 | |
Bank of America Corporation
1.35%, due 11/21/16 | | | 1,000,000 | | | | 1,001,943 | |
European Investment Bank
2.50%, due 10/15/24 | | | 1,000,000 | | | | 1,059,718 | |
Export-Import Bank of Korea
1.75%, due 2/27/18 (b) | | | 1,000,000 | | | | 1,001,605 | |
International Bank for Reconstruction & Development
0.375%, due 8/24/15 | | | 1,000,000 | | | | 1,000,872 | |
10
| | |
GREEN CENTURY BALANCED FUND PORTFOLIO OF INVESTMENTS January 31, 2015 (unaudited) | | continued |
| | | | | | | | |
| | | PRINCIPAL
AMOUNT | | | VALUE | |
| | | | | | | | |
Green Bonds, Renewable Energy & Energy Efficiency — (continued) | | | | | |
International Bank for Reconstruction & Development
2.00%, due 10/20/16 | | $ | 500,000 | | | $ | 512,479 | |
International Bank for Reconstruction & Development
2.25%, due 9/30/24 (c) | | | 750,000 | | | | 758,615 | |
International Finance Corporation
0.625%, due 11/15/16 | | | 1,000,000 | | | | 1,001,169 | |
Johnson Controls, Inc.
5.50%, due 1/15/16 | | | 500,000 | | | | 522,522 | |
KFW
1.75%, due 10/15/19 | | | 1,500,000 | | | | 1,534,579 | |
Nordic Investment Bank
2.25%, due 9/30/21 | | | 1,500,000 | | | | 1,564,654 | |
Overseas Private Investment Corporation
3.28%, due 9/15/29 | | | 800,000 | | | | 869,322 | |
Overseas Private Investment Corporation
3.33%, due 5/15/33 | | | 250,000 | | | | 268,505 | |
Overseas Private Investment Corporation
3.43%, due 6/1/33 | | | 250,000 | | | | 272,104 | |
Regency Centers LP
3.75%, due 6/15/24 | | | 1,500,000 | | | | 1,577,560 | |
Vornado Realty LP
2.50%, due 6/30/19 | | | 1,000,000 | | | | 1,010,802 | |
| | | | | | | | |
| | | | | | | 14,960,623 | |
| | | | | | | | |
U.S. Government Agencies — 3.5% | |
Federal Farm Credit Bank
5.125%, due 8/25/16 | | | 500,000 | | | | 535,365 | |
Federal Farm Credit Bank
2.26%, due 11/13/24 | | | 1,000,000 | | | | 1,019,269 | |
Federal Home Loan Bank
5.625%, due 6/13/16 | | | 1,000,000 | | | | 1,071,335 | |
Federal Home Loan Bank
3.875%, due 12/14/18 | | | 550,000 | | | | 606,170 | |
Federal Home Loan Bank
2.00%, due 6/25/27 (c) | | | 1,000,000 | | | | 1,001,162 | |
Federal Home Loan Mortgage Corporation
3.75%, due 3/27/19 | | | 500,000 | | | | 552,834 | |
| | | | | | | | |
| | | | | | | 4,786,135 | |
| | | | | | | | |
| | | | | | | | |
| | | PRINCIPAL
AMOUNT | | | VALUE | |
| | | | | | | | |
Software & Services — 3.2% | | | | | |
International Business Machines Corporation
2.00%, due 1/5/16 | | $ | 500,000 | | | $ | 507,472 | |
International Business Machines Corporation
8.375%, due 11/1/19 | | | 500,000 | | | | 653,898 | |
Microsoft Corporation
1.625%, due 9/25/15 | | | 500,000 | | | | 504,413 | |
Oracle Corporation
1.20%, due 10/15/17 | | | 500,000 | | | | 502,452 | |
Oracle Corporation
5.00%, due 7/8/19 | | | 1,000,000 | | | | 1,142,630 | |
Symantec Corporation
4.20%, due 9/15/20 | | | 1,000,000 | | | | 1,052,752 | |
| | | | | | | | |
| | | | | | | 4,363,617 | |
| | | | | | | | |
Banks — 2.5% | | | | | | | | |
HSBC Bank USA N.A.
6.00%, due 8/9/17 | | | 500,000 | | | | 553,275 | |
HSBC Holdings PLC
5.10%, due 4/5/21 | | | 1,500,000 | | | | 1,733,109 | |
JPMorgan Chase & Company
4.40%, due 7/22/20 | | | 1,000,000 | | | | 1,107,487 | |
| | | | | | | | |
| | | | | | | 3,393,871 | |
| | | | | | | | |
Diversified Financials — 1.9% | | | | | |
Bank of New York Mellon Corporation (The)
3.55%, due 9/23/21 | | | 1,000,000 | | | | 1,076,486 | |
Citigroup, Inc.
3.953%, due 6/15/16 | | | 500,000 | | | | 519,564 | |
Deutsche Bank A.G.
3.25%, due 1/11/16 (b) | | | 500,000 | | | | 511,147 | |
Morgan Stanley
3.80%, due 4/29/16 | | | 500,000 | | | | 517,056 | |
| | | | | | | | |
| | | | | | | 2,624,253 | |
| | | | | | | | |
Pharmaceuticals & Biotechnology — 1.4% | |
Amgen, Inc.
5.70%, due 2/1/19 | | | 1,250,000 | | | | 1,428,843 | |
Thermo Fisher Scientific, Inc.
2.40%, due 2/1/19 | | | 500,000 | | | | 510,411 | |
| | | | | | | | |
| | | | | | | 1,939,254 | |
| | | | | | | | |
11
| | |
GREEN CENTURY BALANCED FUND PORTFOLIO OF INVESTMENTS January 31, 2015 (unaudited) | | concluded |
| | | | | | | | |
| | | PRINCIPAL
AMOUNT | | | VALUE | |
| | | | | | | | |
Telecommunication Services — 1.3% | |
America Movil SAB de C.V.
5.00%, due 10/16/19 (b) | | $ | 750,000 | | | $ | 843,838 | |
AT&T, Inc.
2.50%, due 8/15/15 | | | 333,000 | | | | 336,441 | |
Verizon Communications, Inc.
6.35%, due 4/1/19 | | | 500,000 | | | | 586,216 | |
| | | | | | | | |
| | | | | | | 1,766,495 | |
| | | | | | | | |
Media — 0.8% | | | | | | | | |
Discovery Communications LLC
5.625%, due 8/15/19 | | | 1,000,000 | | | | 1,138,285 | |
| | | | | | | | |
Real Estate — 0.8% | | | | | | | | |
HCP, Inc.
3.875%, due 8/15/24 | | | 1,000,000 | | | | 1,046,950 | |
| | | | | | | | |
Technology Hardware & Equipment — 0.7% | |
Dell, Inc.
2.30%, due 9/10/15 | | | 500,000 | | | | 502,125 | |
EMC Corporation
1.875%, due 6/1/18 | | | 500,000 | | | | 505,850 | |
| | | | | | | | |
| | | | | | | 1,007,975 | |
| | | | | | | | |
Healthcare Equipment & Services — 0.7% | |
Baxter International, Inc.
1.85%, due 6/15/18 | | | 500,000 | | | | 505,097 | |
Stryker Corporation
1.30%, due 4/1/18 | | | 500,000 | | | | 499,418 | |
| | | | | | | | |
| | | | | | | 1,004,515 | |
| | | | | | | | |
Capital Goods — 0.6% | | | | | | | | |
Koninklijke Philips NV
5.75%, due 3/11/18 | | | 750,000 | | | | 842,559 | |
| | | | | | | | |
Food & Staples Retailing — 0.4% | |
CVS Health Corporation
2.25%, due 12/5/18 | | | 500,000 | | | | 512,936 | |
| | | | | | | | |
Total Bonds & Notes
(Cost $38,294,373) | | | | | | | 39,387,468 | |
| | | | | | | | |
| | | | |
CERTIFICATES OF DEPOSIT — 0.1% |
| | | | | | | | |
| | | PRINCIPAL
AMOUNT | | | VALUE | |
| | | | | | | | |
Self Help Credit Union Environmental Certificate
of Deposit
1.01%, due 8/10/16 | | $ | 95,000 | | | $ | 95,000 | |
| | | | | | | | |
Total Certificates Of Deposit
(Cost $95,000) | | | | | | | 95,000 | |
| | | | | | | | |
SHORT-TERM OBLIGATION — 4.8% | |
Repurchase Agreement — State Street Bank & Trust Repurchase Agreement,
0.00%, dated 1/30/15, due 2/2/15, proceeds $6,618,394 (collateralized by Fannie Mae, 3.50%, due 2/25/42, value $6,751,400)
(Cost $6,618,394) | | | | | | | 6,618,394 | |
| | | | | | | | |
TOTAL INVESTMENTS (d) — 99.8% | |
(Cost $117,118,374) | | | | | | | 137,084,359 | |
Other Assets Less Liabilities — 0.2% | | | | 282,727 | |
| | | | | | | | |
NET ASSETS — 100.0% | | | | | | $ | 137,367,086 | |
| | | | | | | | |
| (a) | Non-income producing security. |
| (b) | Securities whose values are determined or significantly influenced by trading in markets other than the United States or Canada. |
| (c) | Step rate bond. Rate shown is currently in effect at January 31, 2015. |
| (d) | The cost of investments for federal income tax purposes is $117,169,918 resulting in gross unrealized appreciation and depreciation of $21,594,839 and $1,680,398 respectively, or net unrealized appreciation of $19,914,441. |
See Notes to Financial Statements
12
| | |
GREEN CENTURY EQUITY FUND PORTFOLIO OF INVESTMENTS January 31, 2015 (unaudited) | | |
| | | | | | | | |
COMMON STOCKS — 98.9% | | | | | | | | |
| | | SHARES | | | VALUE | |
| | | | | | | | |
Software & Services — 13.2% | | | | | |
Accenture PLC, Class A | | | 10,515 | | | $ | 883,575 | |
Adobe Systems, Inc. (a) | | | 7,908 | | | | 554,588 | |
ANSYS, Inc. (a) | | | 1,540 | | | | 124,232 | |
Autodesk, Inc. (a) | | | 3,790 | | | | 204,679 | |
CA, Inc. | | | 5,624 | | | | 170,407 | |
Cognizant Technology Solutions Corporation, Class A (a) | | | 10,170 | | | | 550,502 | |
Convergys Corporation | | | 1,507 | | | | 28,874 | |
Equinix, Inc. (a) | | | 893 | | | | 193,656 | |
FactSet Research Systems, Inc. | | | 674 | | | | 96,780 | |
FleetCor Technologies, Inc. (a) | | | 1,295 | | | | 181,948 | |
Google, Inc., Class A (a) | | | 4,730 | | | | 2,542,612 | |
Google, Inc., Class C (a) | | | 4,799 | | | | 2,565,161 | |
International Business Machines Corporation | | | 15,811 | | | | 2,423,984 | |
Intuit, Inc. | | | 4,523 | | | | 392,687 | |
NetSuite, Inc. (a) | | | 588 | | | | 57,877 | |
Oracle Corporation | | | 59,491 | | | | 2,492,078 | |
Rackspace Hosting, Inc. (a) | | | 1,986 | | | | 89,291 | |
salesforce.com, Inc. (a) | | | 9,841 | | | | 555,524 | |
Symantec Corporation | | | 11,578 | | | | 286,787 | |
Teradata Corporation (a) | | | 2,635 | | | | 117,416 | |
Workday, Inc., Class A (a) | | | 1,627 | | | | 129,281 | |
Xerox Corporation | | | 18,157 | | | | 239,128 | |
Yahoo!, Inc. (a) | | | 15,760 | | | | 693,282 | |
| | | | | | | | |
| | | | 15,574,349 | |
| | | | | | | | |
Pharmaceuticals & Biotechnology — 11.2% | |
Affymetrix, Inc. (a) | | | 1,246 | | | | 13,756 | |
Agilent Technologies, Inc. | | | 5,558 | | | | 209,926 | |
Amgen, Inc. | | | 12,684 | | | | 1,931,266 | |
Bio-Techne Corporation | | | 575 | | | | 53,486 | |
Biogen Idec, Inc. (a) | | | 3,943 | | | | 1,534,458 | |
BioMarin Pharmaceutical, Inc. (a) | | | 2,609 | | | | 253,490 | |
Bristol-Myers Squibb Company | | | 27,701 | | | | 1,669,539 | |
Cepheid (a) | | | 1,157 | | | | 65,382 | |
Fluidigm Corporation (a) | | | 431 | | | | 16,606 | |
Gilead Sciences, Inc. (a) | | | 25,232 | | | | 2,645,071 | |
Merck & Company, Inc. | | | 48,172 | | | | 2,903,808 | |
Mettler-Toledo International, Inc. (a) | | | 476 | | | | 144,680 | |
PAREXEL International Corporation (a) | | | 902 | | | | 54,986 | |
| | | | | | | | |
| | | SHARES | | | VALUE | |
| | | | | | | | |
Pharmaceuticals & Biotechnology — (continued) | |
Thermo Fisher Scientific, Inc. | | | 6,625 | | | $ | 829,516 | |
Vertex Pharmaceuticals, Inc. (a) | | | 3,969 | | | | 437,146 | |
VIVUS, Inc. (a) | | | 1,906 | | | | 4,994 | |
Waters Corporation (a) | | | 1,381 | | | | 164,408 | |
Zoetis, Inc. | | | 8,390 | | | | 358,505 | |
| | | | | | | | |
| | | | 13,291,023 | |
| | | | | | | | |
Capital Goods — 6.2% | | | | | | | | |
3M Company | | | 10,271 | | | | 1,666,983 | |
A.O. Smith Corporation | | | 1,195 | | | | 70,995 | |
AGCO Corporation | | | 1,496 | | | | 64,837 | |
Air Lease Corporation | | | 1,697 | | | | 59,293 | |
American Science & Engineering, Inc. | | | 117 | | | | 5,429 | |
Applied Industrial Technologies, Inc. | | | 691 | | | | 27,937 | |
Builders FirstSource, Inc. (a) | | | 977 | | | | 5,784 | |
Caterpillar, Inc. | | | 9,972 | | | | 797,461 | |
CLARCOR, Inc. | | | 883 | | | | 55,214 | |
Cummins, Inc. | | | 2,934 | | | | 409,176 | |
Deere & Company | | | 5,659 | | | | 482,090 | |
Dover Corporation | | | 2,834 | | | | 198,493 | |
EMCOR Group, Inc. | | | 1,126 | | | | 45,445 | |
Fastenal Company | | | 4,728 | | | | 209,923 | |
Graco, Inc. | | | 1,002 | | | | 71,382 | |
Granite Construction, Inc. | | | 586 | | | | 19,971 | |
H&E Equipment Services, Inc. | | | 568 | | | | 9,963 | |
Illinois Tool Works, Inc. | | | 6,300 | | | | 586,467 | |
Ingersoll-Rand PLC | | | 4,467 | | | | 296,609 | |
Lincoln Electric Holdings, Inc. | | | 1,260 | | | | 85,567 | |
Masco Corporation | | | 6,005 | | | | 149,164 | |
Meritor, Inc. (a) | | | 1,478 | | | | 18,918 | |
Middleby Corporation (The) (a) | | | 945 | | | | 89,794 | |
Nordson Corporation | | | 1,021 | | | | 74,390 | |
Owens Corning | | | 1,692 | | | | 67,765 | |
Pall Corporation | | | 1,845 | | | | 178,522 | |
Parker Hannifin Corporation | | | 2,495 | | | | 290,568 | |
Quanta Services, Inc. (a) | | | 3,576 | | | | 94,693 | |
Rockwell Automation, Inc. | | | 2,385 | | | | 259,774 | |
Snap-on, Inc. | | | 955 | | | | 126,738 | |
Tennant Company | | | 276 | | | | 17,998 | |
Timken Company (The) | | | 1,249 | | | | 47,475 | |
United Rentals, Inc. (a) | | | 1,638 | | | | 135,708 | |
W.W. Grainger, Inc. | | | 1,025 | | | | 241,736 | |
WABCO Holdings, Inc. (a) | | | 955 | | | | 90,887 | |
13
| | |
GREEN CENTURY EQUITY FUND PORTFOLIO OF INVESTMENTS January 31, 2015 (unaudited) | | continued |
| | | | | | | | |
| | | SHARES | | | VALUE | |
| | | | | | | | |
Capital Goods — (continued) | |
Wabtec Corporation | | | 1,609 | | | $ | 134,271 | |
Xylem, Inc. | | | 3,089 | | | | 105,335 | |
| | | | | | | | |
| | | | 7,292,755 | |
| | | | | | | | |
Technology Hardware & Equipment — 6.0% | |
Black Box Corporation | | | 196 | | | | 4,118 | |
Calix, Inc. (a) | | | 639 | | | | 6,134 | |
Cisco Systems, Inc. | | | 85,484 | | | | 2,253,786 | |
Corning, Inc. | | | 21,574 | | | | 512,814 | |
EMC Corporation | | | 33,794 | | | | 876,278 | |
Flextronics International Ltd. (a) | | | 10,064 | | | | 111,912 | |
Hewlett-Packard Company | | | 31,200 | | | | 1,127,256 | |
Lexmark International, Inc. | | | 954 | | | | 38,074 | |
Motorola Solutions, Inc. | | | 3,731 | | | | 232,852 | |
Plantronics, Inc. | | | 661 | | | | 30,294 | |
Polycom, Inc. (a) | | | 2,170 | | | | 28,861 | |
QUALCOMM, Inc. | | | 27,977 | | | | 1,747,443 | |
Silicon Graphics International Corporation (a) | | | 443 | | | | 4,177 | |
Super Micro Computer, Inc. (a) | | | 582 | | | | 21,284 | |
Trimble Navigation Ltd. (a) | | | 4,307 | | | | 102,679 | |
| | | | | | | | |
| | | | 7,097,962 | |
| | | | | | | | |
Diversified Financials — 5.4% | | | | | |
American Express Company | | | 15,670 | | | | 1,264,412 | |
Ameriprise Financial, Inc. | | | 3,176 | | | | 396,810 | |
Bank of New York Mellon Corporation (The) | | | 18,938 | | | | 681,768 | |
BlackRock, Inc. | | | 2,222 | | | | 756,613 | |
Charles Schwab Corporation (The) | | | 19,618 | | | | 509,676 | |
CME Group, Inc. | | | 5,299 | | | | 452,005 | |
Franklin Resources, Inc. | | | 6,795 | | | | 350,146 | |
Intercontinental Exchange, Inc. | | | 1,895 | | | | 389,858 | |
Invesco Ltd. | | | 7,302 | | | | 268,203 | |
Legg Mason, Inc. | | | 1,748 | | | | 96,909 | |
Northern Trust Corporation | | | 3,487 | | | | 227,980 | |
PHH Corporation (a) | | | 779 | | | | 19,428 | |
State Street Corporation | | | 7,117 | | | | 508,937 | |
T. Rowe Price Group, Inc. | | | 4,402 | | | | 346,525 | |
TD Ameritrade Holding Corporation | | | 4,663 | | | | 151,035 | |
| | | | | | | | |
| | | | 6,420,305 | |
| | | | | | | | |
| | | | | | | | |
| | | SHARES | | | VALUE | |
| | | | | | | | |
Food & Beverage — 5.3% | | | | | |
Bunge Ltd. | | | 2,429 | | | $ | 217,468 | |
Campbell Soup Company | | | 3,435 | | | | 157,117 | |
Coca-Cola Enterprises, Inc. | | | 3,901 | | | | 164,232 | |
Darling Ingredients, Inc. (a) | | | 2,855 | | | | 48,478 | |
Dr. Pepper Snapple Group, Inc. | | | 3,278 | | | | 253,291 | |
General Mills, Inc. | | | 10,272 | | | | 539,075 | |
JM Smucker Company (The) | | | 1,713 | | | | 176,696 | |
Kellogg Company | | | 4,570 | | | | 299,701 | |
Keurig Green Mountain, Inc. | | | 2,033 | | | | 249,164 | |
Kraft Foods Group, Inc. | | | 9,942 | | | | 649,610 | |
McCormick & Company, Inc. | | | 2,012 | | | | 143,637 | |
Mondelez International, Inc., Class A | | | 28,167 | | | | 992,605 | |
PepsiCo, Inc. | | | 25,142 | | | | 2,357,817 | |
| | | | | | | | |
| | | | 6,248,891 | |
| | | | | | | | |
Household & Personal Products — 5.3% | |
Avon Products, Inc. | | | 7,317 | | | | 56,633 | |
Clorox Company (The) | | | 2,149 | | | | 229,320 | |
Colgate-Palmolive Company | | | 15,275 | | | | 1,031,368 | |
Energizer Holdings, Inc. | | | 1,023 | | | | 130,954 | |
Estee Lauder Companies, Inc. (The), Class A | | | 3,896 | | | | 275,019 | |
Kimberly-Clark Corporation | | | 6,260 | | | | 675,830 | |
Procter & Gamble Company (The) | | | 45,198 | | | | 3,809,739 | |
| | | | | | | | |
| | | | 6,208,863 | |
| | | | | | | | |
Real Estate — 5.1% | | | | | |
American Tower Corporation | | | 6,626 | | | | 642,391 | |
AvalonBay Communities, Inc. | | | 2,211 | | | | 382,481 | |
Boston Properties, Inc. | | | 2,587 | | | | 359,076 | |
CBRE Group, Inc., Class A (a) | | | 4,934 | | | | 159,565 | |
Corporate Office Properties Trust | | | 1,505 | | | | 45,150 | |
Digital Realty Trust, Inc. | | | 2,286 | | | | 166,741 | |
Duke Realty Corporation | | | 5,849 | | | | 127,684 | |
Equity Residential | | | 5,746 | | | | 445,947 | |
Federal Realty Investment Trust | | | 1,169 | | | | 168,067 | |
Forest City Enterprises, Inc., Class A (a) | | | 2,492 | | | | 61,054 | |
HCP, Inc. | | | 7,676 | | | | 362,998 | |
Host Hotels & Resorts, Inc. | | | 12,720 | | | | 291,161 | |
Iron Mountain, Inc. | | | 2,744 | | | | 109,321 | |
Jones Lang LaSalle, Inc. | | | 753 | | | | 110,751 | |
Liberty Property Trust | | | 2,489 | | | | 100,307 | |
14
| | |
GREEN CENTURY EQUITY FUND PORTFOLIO OF INVESTMENTS January 31, 2015 (unaudited) | | continued |
| | | | | | | | |
| | | SHARES | | | VALUE | |
| | | | | | | | |
Real Estate — (continued) | | | | | |
Macerich Company (The) | | | 2,365 | | | $ | 203,414 | |
Plum Creek Timber Company, Inc. | | | 2,936 | | | | 130,711 | |
Potlatch Corporation | | | 727 | | | | 28,978 | |
Prologis, Inc. | | | 8,408 | | | | 379,537 | |
Simon Property Group, Inc. | | | 5,223 | | | | 1,037,601 | |
UDR, Inc. | | | 4,277 | | | | 142,253 | |
Vornado Realty Trust | | | 2,851 | | | | 314,864 | |
Weyerhaeuser Company | | | 8,825 | | | | 316,376 | |
| | | | | | | | |
| | | | 6,086,428 | |
| | | | | | | | |
Healthcare Equipment & Services — 4.7% | | | | | |
AmerisourceBergen Corporation | | | 3,702 | | | | 351,875 | |
Becton, Dickinson and Company | | | 3,202 | | | | 442,132 | |
Cardinal Health, Inc. | | | 5,596 | | | | 465,531 | |
Cerner Corporation (a) | | | 5,176 | | | | 343,428 | |
Cigna Corporation | | | 4,411 | | | | 471,227 | |
Cooper Companies, Inc. (The) | | | 797 | | | | 125,647 | |
DENTSPLY International, Inc. | | | 2,364 | | | | 118,259 | |
Edwards Lifesciences Corporation (a) | | | 1,764 | | | | 221,117 | |
Henry Schein, Inc. (a) | | | 1,410 | | | | 194,679 | |
Hologic, Inc. (a) | | | 3,681 | | | | 111,774 | |
Humana, Inc. | | | 2,572 | | | | 376,644 | |
IDEXX Laboratories, Inc. (a) | | | 847 | | | | 134,182 | |
Laboratory Corporation of America Holdings (a) | | | 1,412 | | | | 162,069 | |
Medtronic PLC | | | 23,575 | | | | 1,683,255 | |
Molina Healthcare, Inc. (a) | | | 478 | | | | 24,335 | |
MWI Veterinary Supply, Inc. (a) | | | 223 | | | | 42,296 | |
Patterson Companies, Inc. | | | 1,353 | | | | 67,772 | |
Select Medical Holdings Corporation | | | 1,397 | | | | 18,887 | |
Team Health Holdings, Inc. (a) | | | 1,215 | | | | 62,816 | |
Varian Medical Systems, Inc. (a) | | | 1,675 | | | | 155,038 | |
| | | | | | | | |
| | | | 5,572,963 | |
| | | | | | | | |
Retailing — 4.6% | | | | | |
ANN, Inc. (a) | | | 721 | | | | 23,865 | |
Bed Bath & Beyond, Inc. (a) | | | 3,378 | | | | 252,573 | |
Best Buy Company, Inc. | | | 5,004 | | | | 176,141 | |
Blue Nile, Inc. (a) | | | 189 | | | | 5,874 | |
Brown Shoe Company, Inc. | | | 637 | | | | 18,084 | |
Buckle, Inc. (The) | | | 489 | | | | 24,836 | |
CarMax, Inc. (a) | | | 3,641 | | | | 226,106 | |
Foot Locker, Inc. | | | 2,430 | | | | 129,325 | |
| | | | | | | | |
| | | SHARES | | | VALUE | |
| | | | | | | | |
Retailing — (continued) | | | | | |
GameStop Corporation, Class A | | | 1,874 | | | $ | 66,059 | |
Gap, Inc. (The) | | | 3,962 | | | | 163,195 | |
Genuine Parts Company | | | 2,542 | | | | 236,253 | |
HSN, Inc. | | | 533 | | | | 41,276 | |
Kohl’s Corporation | | | 3,466 | | | | 206,990 | |
LKQ Corporation (a) | | | 5,151 | | | | 132,947 | |
Lowe’s Companies, Inc. | | | 16,448 | | | | 1,114,517 | |
Men’s Wearhouse, Inc. (The) | | | 642 | | | | 29,834 | |
Netflix, Inc. (a) | | | 951 | | | | 420,152 | |
Nordstrom, Inc. | | | 2,310 | | | | 176,022 | |
Nutrisystem, Inc. | | | 323 | | | | 5,756 | |
Office Depot, Inc. (a) | | | 8,457 | | | | 64,273 | |
PetSmart, Inc. | | | 1,541 | | | | 125,907 | |
Pier 1 Imports, Inc. | | | 1,411 | | | | 23,719 | |
Pool Corporation | | | 706 | | | | 43,920 | |
Shutterfly, Inc. (a) | | | 594 | | | | 26,059 | |
Signet Jewelers Ltd. | | | 1,264 | | | | 153,083 | |
Staples, Inc. | | | 10,791 | | | | 183,987 | |
Tiffany & Company | | | 2,175 | | | | 188,442 | |
TJX Companies, Inc. (The) | | | 11,517 | | | | 759,431 | |
Tractor Supply Company | | | 2,319 | | | | 188,233 | |
TripAdvisor, Inc. (a) | | | 1,943 | | | | 130,200 | |
Ulta Salon, Cosmetics & Fragrance, Inc. (a) | | | 1,026 | | | | 135,370 | |
Weyco Group, Inc. | | | 120 | | | | 3,242 | |
| | | | | | | | |
| | | | 5,475,671 | |
| | | | | | | | |
Semiconductors — 4.4% | | | | | |
Advanced Micro Devices, Inc. (a) | | | 11,622 | | | | 29,869 | |
Analog Devices, Inc. | | | 5,183 | | | | 270,060 | |
Applied Materials, Inc. | | | 20,352 | | | | 464,840 | |
Intel Corporation | | | 82,595 | | | | 2,728,939 | |
Lam Research Corporation | | | 2,713 | | | | 207,382 | |
Microchip Technology, Inc. | | | 3,311 | | | | 149,326 | |
NVIDIA Corporation | | | 9,123 | | | | 175,207 | |
Skyworks Solutions, Inc. | | | 3,170 | | | | 263,268 | |
Texas Instruments, Inc. | | | 17,764 | | | | 949,486 | |
| | | | | | | | |
| | | | 5,238,377 | |
| | | | | | | | |
Telecommunication Services — 3.2% | | | | | |
CenturyLink, Inc. | | | 9,507 | | | | 353,375 | |
Cincinnati Bell, Inc. (a) | | | 3,478 | | | | 10,191 | |
Level 3 Communications, Inc. (a) | | | 4,758 | | | | 236,663 | |
Sprint Corporation (a) | | | 13,014 | | | | 55,960 | |
Verizon Communications, Inc. | | | 69,195 | | | | 3,162,903 | |
| | | | | | | | |
| | | | 3,819,092 | |
| | | | | | | | |
15
| | |
GREEN CENTURY EQUITY FUND PORTFOLIO OF INVESTMENTS January 31, 2015 (unaudited) | | continued |
| | | | | | | | |
| | | SHARES | | | VALUE | |
| | | | | | | | |
Materials — 3.2% | | | | | |
Air Products & Chemicals, Inc. | | | 3,568 | | | $ | 519,536 | |
Albemarle Corporation | | | 1,871 | | | | 90,294 | |
Avery Dennison Corporation | | | 1,610 | | | | 84,155 | |
Ball Corporation | | | 2,208 | | | | 139,833 | |
Compass Minerals International, Inc. | | | 535 | | | | 46,759 | |
Domtar Corporation | | | 1,079 | | | | 41,326 | |
Ecolab, Inc. | | | 4,499 | | | | 466,861 | |
H.B. Fuller Company | | | 811 | | | | 33,373 | |
International Flavors & Fragrances, Inc. | | | 1,344 | | | | 142,612 | |
MeadWestvaco Corporation | | | 2,839 | | | | 142,745 | |
Minerals Technologies, Inc. | | | 569 | | | | 37,173 | |
Mosaic Company (The) | | | 5,369 | | | | 261,417 | |
Praxair, Inc. | | | 4,897 | | | | 590,529 | |
Rock-Tenn Company, Class A | | | 2,415 | | | | 156,733 | |
Schnitzer Steel Industries, Inc., Class A | | | 354 | | | | 5,975 | |
Sealed Air Corporation | | | 3,454 | | | | 139,887 | |
Sherwin-Williams Company (The) | | | 1,392 | | | | 377,608 | |
Sigma-Aldrich Corporation | | | 1,968 | | | | 270,639 | |
Sonoco Products Company | | | 1,694 | | | | 74,875 | |
Valspar Corporation (The) | | | 1,328 | | | | 110,795 | |
Wausau Paper Corporation | | | 607 | | | | 6,167 | |
| | | | | | | | |
| | | | 3,739,292 | |
| | | | | | | | |
Insurance — 2.9% | | | | | |
ACE Ltd. | | | 5,607 | | | | 605,332 | |
Aflac, Inc. | | | 7,551 | | | | 431,011 | |
Chubb Corporation (The) | | | 3,960 | | | | 387,684 | |
Hartford Financial Services Group, Inc. | | | 7,479 | | | | 290,933 | |
Marsh & McLennan Companies, Inc. | | | 9,065 | | | | 487,425 | |
PartnerRe Ltd. | | | 735 | | | | 84,084 | |
Principal Financial Group, Inc. | | | 4,980 | | | | 233,711 | |
Progressive Corporation (The) | | | 9,422 | | | | 244,501 | |
Travelers Companies, Inc. (The) | | | 5,633 | | | | 579,185 | |
Willis Group Holdings PLC | | | 2,667 | | | | 115,481 | |
| | | | | | | | |
| | | | 3,459,347 | |
| | | | | | | | |
Consumer Services — 2.9% | | | | | |
Choice Hotels International, Inc. | | | 515 | | | | 29,587 | |
Darden Restaurants, Inc. | | | 2,205 | | | | 135,343 | |
DeVry Education Group, Inc. | | | 1,009 | | | | 42,792 | |
| | | | | | | | |
| | | SHARES | | | VALUE | |
| | | | | | | | |
Consumer Services — (continued) | | | | | |
Jack in the Box, Inc. | | | 635 | | | $ | 53,842 | |
Marriott International, Inc., Class A | | | 3,921 | | | | 292,114 | |
McDonald’s Corporation | | | 16,403 | | | | 1,516,293 | |
Royal Caribbean Cruises Ltd. | | | 2,812 | | | | 212,447 | |
Starbucks Corporation | | | 12,538 | | | | 1,097,451 | |
Vail Resorts, Inc. | | | 590 | | | | 51,778 | |
| | | | | | | | |
| | | | 3,431,647 | |
| | | | | | | | |
Consumer Durables & Apparel — 2.7% | | | | | |
Callaway Golf Company | | | 1,006 | | | | 8,209 | |
Columbia Sportswear Company | | | 453 | | | | 19,253 | |
CSS Industries, Inc. | | | 90 | | | | 2,448 | |
Deckers Outdoor Corporation (a) | | | 602 | | | | 39,762 | |
Ethan Allen Interiors, Inc. | | | 406 | | | | 11,051 | |
Hanesbrands, Inc. | | | 1,694 | | | | 188,678 | |
Hasbro, Inc. | | | 1,886 | | | | 103,579 | |
Jarden Corporation (a) | | | 3,078 | | | | 147,806 | |
La-Z-Boy, Inc. | | | 868 | | | | 23,167 | |
Mattel, Inc. | | | 5,667 | | | | 152,442 | |
Meritage Homes Corporation (a) | | | 653 | | | | 23,776 | |
Michael Kors Holdings Ltd. (a) | | | 3,415 | | | | 241,748 | |
Mohawk Industries, Inc. (a) | | | 1,028 | | | | 169,661 | |
Newell Rubbermaid, Inc. | | | 4,553 | | | | 167,869 | |
NIKE, Inc., Class B | | | 11,514 | | | | 1,062,166 | |
Oxford Industries, Inc. | | | 232 | | | | 12,978 | |
PVH Corporation | | | 1,398 | | | | 154,143 | |
Tupperware Brands Corporation | | | 873 | | | | 59,024 | |
Under Armour, Inc., Class A (a) | | | 2,801 | | | | 201,896 | |
VF Corporation | | | 5,732 | | | | 397,629 | |
Wolverine World Wide, Inc. | | | 1,654 | | | | 46,560 | |
| | | | | | | | |
| | | | 3,233,845 | |
| | | | | | | | |
Transportation — 2.7% | | | | | |
ArcBest Corporation | | | 399 | | | | 14,867 | |
Avis Budget Group, Inc. (a) | | | 1,731 | | | | 99,204 | |
C.H. Robinson Worldwide, Inc. | | | 2,484 | | | | 176,910 | |
CSX Corporation | | | 16,633 | | | | 553,879 | |
Echo Global Logistics, Inc. (a) | | | 270 | | | | 7,128 | |
Expeditors International of Washington, Inc. | | | 3,229 | | | | 141,043 | |
Genesee & Wyoming, Inc., Class A (a) | | | 906 | | | | 74,700 | |
Hertz Global Holdings, Inc. (a) | | | 7,611 | | | | 156,178 | |
Norfolk Southern Corporation | | | 5,151 | | | | 525,247 | |
16
| | |
GREEN CENTURY EQUITY FUND PORTFOLIO OF INVESTMENTS January 31, 2015 (unaudited) | | continued |
| | | | | | | | |
| | | SHARES | | | VALUE | |
| | | | | | | | |
Transportation — (continued) | | | | | |
Ryder System, Inc. | | | 868 | | | $ | 71,862 | |
Southwest Airlines Company | | | 2,863 | | | | 129,350 | |
United Parcel Service, Inc., Class B | | | 11,791 | | | | 1,165,422 | |
Wesco Aircraft Holdings, Inc. (a) | | | 1,084 | | | | 14,135 | |
| | | | | | | | |
| | | | 3,129,925 | |
| | | | | | | | |
Banks — 2.6% | | | | | |
Bank of Hawaii Corporation | | | 774 | | | | 43,700 | |
Cathay General Bancorp | | | 1,189 | | | | 28,405 | |
CIT Group, Inc. | | | 3,039 | | | | 133,169 | |
Comerica, Inc. | | | 3,025 | | | | 125,537 | |
Heartland Financial USA, Inc. | | | 278 | | | | 7,678 | |
International Bancshares Corporation | | | 923 | | | | 20,777 | |
KeyCorp | | | 14,548 | | | | 188,979 | |
M&T Bank Corporation | | | 1,983 | | | | 224,396 | |
New York Community Bancorp, Inc. | | | 7,620 | | | | 117,729 | |
Old National Bancorp | | | 2,033 | | | | 27,263 | |
People’s United Financial, Inc. | | | 5,269 | | | | 74,135 | |
PNC Financial Services Group, Inc. (The) | | | 9,024 | | | | 762,889 | |
Popular, Inc. (a) | | | 1,706 | | | | 52,596 | |
U.S. Bancorp | | | 30,088 | | | | 1,260,988 | |
Umpqua Holdings Corporation | | | 3,774 | | | | 58,535 | |
| | | | | | | | |
| | | | 3,126,776 | |
| | | | | | | | |
Media — 2.6% | | | | | |
Charter Communications, Inc., Class A (a) | | | 1,279 | | | | 193,276 | |
Discovery Communications, Inc., Class A (a) | | | 2,565 | | | | 74,347 | |
Discovery Communications, Inc., Class C (a) | | | 4,672 | | | | 130,255 | |
DreamWorks Animation SKG, Inc., Class A (a) | | | 1,126 | | | | 21,022 | |
John Wiley & Sons, Inc., Class A | | | 795 | | | | 49,258 | |
Liberty Global PLC, Class A (a) | | | 4,154 | | | | 194,075 | |
Liberty Global PLC, Series C (a) | | | 10,563 | | | | 481,567 | |
New York Times Company (The), Class A | | | 2,340 | | | | 29,461 | |
Scholastic Corporation | | | 404 | | | | 14,859 | |
Scripps Networks Interactive, Inc., Class A | | | 1,311 | | | | 93,199 | |
Time Warner Cable, Inc. | | | 4,671 | | | | 635,863 | |
| | | | | | | | |
| | | SHARES | | | VALUE | |
| | | | | | | | |
Media — (continued) | | | | | |
Time Warner, Inc. | | | 14,261 | | | $ | 1,111,360 | |
| | | | | | | | |
| | | | 3,028,542 | |
| | | | | | | | |
Utilities — 1.8% | | | | | |
American Water Works Company, Inc. | | | 3,202 | | | | 179,760 | |
Avista Corporation | | | 1,350 | | | | 50,126 | |
CenterPoint Energy, Inc. | | | 7,178 | | | | 165,740 | |
CMS Energy Corporation | | | 4,898 | | | | 184,802 | |
Consolidated Edison, Inc. | | | 5,018 | | | | 347,647 | |
Integrys Energy Group, Inc. | | | 1,481 | | | | 120,109 | |
MGE Energy, Inc. | | | 789 | | | | 36,215 | |
New Jersey Resources Corporation | | | 840 | | | | 53,659 | |
Northeast Utilities | | | 5,450 | | | | 302,911 | |
Pepco Holdings, Inc. | | | 4,624 | | | | 126,929 | |
Piedmont Natural Gas Company, Inc. | | | 1,537 | | | | 61,311 | |
Sempra Energy | | | 4,003 | | | | 448,016 | |
WGL Holdings, Inc. | | | 1,023 | | | | 57,799 | |
| | | | | | | | |
| | | | 2,135,024 | |
| | | | | | | | |
Renewable Energy & Energy Efficiency — 0.9% | |
ITC Holdings Corporation | | | 2,874 | | | | 122,260 | |
Itron, Inc. (a) | | | 636 | | | | 23,666 | |
Johnson Controls, Inc. | | | 11,236 | | | | 522,137 | |
Ormat Technologies, Inc. | | | 647 | | | | 17,307 | |
SunPower Corporation (a) | | | 740 | | | | 17,849 | |
Tesla Motors, Inc. (a) | | | 1,457 | | | | 296,645 | |
| | | | | | | | |
| | | | 999,864 | |
| | | | | | | | |
Commercial & Professional Services — 0.8% | |
ACCO Brands Corporation (a) | | | 1,919 | | | | 15,198 | |
CBIZ, Inc. (a) | | | 516 | | | | 4,272 | |
Copart, Inc. (a) | | | 1,919 | | | | 70,235 | |
Corporate Executive Board Company (The) | | | 555 | | | | 38,029 | |
Deluxe Corporation | | | 867 | | | | 56,294 | |
Dun & Bradstreet Corporation (The) | | | 622 | | | | 71,598 | |
Exponent, Inc. | | | 195 | | | | 15,627 | |
Heidrick & Struggles International, Inc. | | | 301 | | | | 6,670 | |
HNI Corporation | | | 814 | | | | 40,089 | |
ICF International, Inc. (a) | | | 241 | | | | 9,004 | |
IHS, Inc., Class A (a) | | | 1,127 | | | | 129,752 | |
17
| | |
GREEN CENTURY EQUITY FUND PORTFOLIO OF INVESTMENTS January 31, 2015 (unaudited) | | concluded |
| | | | | | | | |
| | | SHARES | | | VALUE | |
| | | | | | | | |
Commercial & Professional Services — (continued) | |
Interface, Inc. | | | 1,076 | | | $ | 16,904 | |
Kelly Services, Inc. | | | 413 | | | | 6,980 | |
Knoll, Inc. | | | 776 | | | | 15,900 | |
ManpowerGroup, Inc. | | | 1,361 | | | | 99,190 | |
Navigant Consulting, Inc. (a) | | | 784 | | | | 11,313 | |
On Assignment, Inc. (a) | | | 777 | | | | 27,296 | |
R.R. Donnelley & Sons Company | | | 3,516 | | | | 57,909 | |
Resources Connection, Inc. | | | 655 | | | | 10,938 | |
Robert Half International, Inc. | | | 2,268 | | | | 131,680 | |
RPX Corporation (a) | | | 613 | | | | 7,571 | |
Steelcase, Inc. | | | 1,436 | | | | 24,240 | |
Team, Inc. (a) | | | 300 | | | | 11,442 | |
Tetra Tech, Inc. | | | 1,000 | | | | 23,030 | |
TrueBlue, Inc. (a) | | | 679 | | | | 14,979 | |
United Stationers, Inc. | | | 702 | | | | 28,298 | |
| | | | | | | | |
| | | | 944,438 | |
| | | | | | | | |
Automobiles & Components — 0.5% | | | | | |
Autoliv, Inc. | | | 1,543 | | | | 163,651 | |
BorgWarner, Inc. | | | 3,832 | | | | 206,966 | |
Harley-Davidson, Inc. | | | 3,612 | | | | 222,860 | |
| | | | | | | | |
| | | | 593,477 | |
| | | | | | | | |
Healthy Living — 0.4% | | | | | |
Hain Celestial Group, Inc. (The) (a) | | | 1,677 | | | | 88,495 | |
United Natural Foods, Inc. (a) | | | 844 | | | | 65,225 | |
Whole Foods Market, Inc. | | | 6,043 | | | | 314,810 | |
| | | | | | | | |
| | | | 468,530 | |
| | | | | | | | |
| | | | | | | | |
| | | SHARES | | | VALUE | |
| | | | | | | | |
Food & Staples Retailing — 0.3% | | | | | |
Sysco Corporation | | | 9,806 | | | $ | 384,101 | |
| | | | | | | | |
Total Common Stocks
(Cost $88,863,660) | | | | | | | 117,001,487 | |
| | | | | | | | |
SHORT-TERM OBLIGATION — 0.9% | |
Repurchase Agreement—State Street Bank & Trust Repurchase Agreement,
0.00%, dated 1/30/15, due 2/2/15, proceeds $1,073,747 (collateralized by Fannie Mae, 3.50%, due 3/25/42,
value $1,098,665)
(Cost $1,073,747) | | | | | | | 1,073,747 | |
| | | | | | | | |
TOTAL INVESTMENTS (b) — 99.8% | |
(Cost $89,937,407) | | | | | | | 118,075,234 | |
Other Assets Less Liabilities — 0.2% | | | | 254,527 | |
| | | | | | | | |
NET ASSETS — 100.0% | | | | | | $ | 118,329,761 | |
| | | | | | | | |
| (a) | Non-income producing security. |
| (b) | The cost of investments for federal income tax purposes is $91,186,385 resulting in gross unrealized appreciation and depreciation of $29,328,836 and $2,439,987 respectively, or net unrealized appreciation of $26,888,849. |
See Notes to Financial Statements
18
GREEN CENTURY FUNDS STATEMENTS OF ASSETS AND LIABILITIES
January 31, 2015
(unaudited)
| | | | | | | | |
| | | BALANCED FUND | | | EQUITY FUND | |
ASSETS: | | | | | | | | |
Investments, at value (cost $117,118,374 and $89,937,407, respectively) | | $ | 137,084,359 | | | $ | 118,075,234 | |
| Receivables for: | | | | | | | | |
Securities sold | | | — | | | | 128,500 | |
Capital stock sold | | | 96,690 | | | | 144,526 | |
Interest | | | 336,735 | | | | — | |
Dividends | | | 27,845 | | | | 136,508 | |
Other receivables | | | 3,128 | | | | — | |
| | | | | | | | |
Total assets | | | 137,548,757 | | | | 118,484,768 | |
| | | | | | | | |
LIABILITIES: | | | | | | | | |
Payable for capital stock repurchased | | | 9,461 | | | | 28,780 | |
Accrued expenses | | | 172,210 | | | | 126,227 | |
| | | | | | | | |
Total liabilities | | | 181,671 | | | | 155,007 | |
| | | | | | | | |
NET ASSETS | | $ | 137,367,086 | | | $ | 118,329,761 | |
| | | | | | | | |
NET ASSETS CONSIST OF: | | | | | | | | |
Paid-in capital | | $ | 115,025,507 | | | $ | 90,811,644 | |
Undistributed net investment income/(loss) | | | (45,030 | ) | | | 124,165 | |
Accumulated net realized gains/(losses) on investments | | | 2,420,624 | | | | (743,875 | ) |
Net unrealized appreciation on investments | | | 19,965,985 | | | | 28,137,827 | |
| | | | | | | | |
NET ASSETS | | $ | 137,367,086 | | | $ | 118,329,761 | |
| | | | | | | | |
SHARES OUTSTANDING (UNLIMITED NUMBER OF SHARES AUTHORIZED @ $0.01 PAR VALUE) | | | 5,848,780 | | | | 3,801,949 | |
| | | | | | | | |
NET ASSET VALUE, REDEMPTION PRICE AND OFFERING PRICE PER SHARE | | $ | 23.49 | | | $ | 31.12 | |
| | | | | | | | |
GREEN CENTURY FUNDS STATEMENTS OF OPERATIONS
For the six months ended January 31, 2015
(unaudited)
| | | | | | | | |
| | | BALANCED FUND | | | EQUITY FUND | |
INVESTMENT INCOME: | | | | | | | | |
Interest income | | $ | 442,548 | | | $ | — | |
Dividend and other income (net of $3,614 and $0 foreign withholding taxes, respectively) | | | 591,257 | | | | 1,050,401 | |
| | | | | | | | |
Total investment income | | | 1,033,805 | | | | 1,050,401 | |
| | | | | | | | |
EXPENSES: | | | | | | | | |
Administrative services fee | | | 542,881 | | | | 549,400 | |
Investment advisory fee | | | 425,070 | | | | 135,682 | |
| | | | | | | | |
Total expenses | | | 967,951 | | | | 685,082 | |
| | | | | | | | |
NET INVESTMENT INCOME | | | 65,854 | | | | 365,319 | |
| | | | | | | | |
NET REALIZED AND UNREALIZED GAIN: | | | | | | | | |
Net realized gain on investments | | | 2,580,742 | | | | 659,378 | |
Change in net unrealized appreciation on investments | | | 1,994,700 | | | | 3,620,622 | |
| | | | | | | | |
NET REALIZED AND UNREALIZED GAIN ON INVESTMENTS | | | 4,575,442 | | | | 4,280,000 | |
| | | | | | | | |
NET INCREASE IN NET ASSETS RESULTING FROM OPERATIONS | | $ | 4,641,296 | | | $ | 4,645,319 | |
| | | | | | | | |
See Notes to Financial Statements
19
GREEN CENTURY FUNDS STATEMENTS OF CHANGES IN NET ASSETS
| | | | | | | | | | | | | | | | |
| | | BALANCED FUND | | | EQUITY FUND | |
| | | FOR THE SIX MONTHS ENDED
JANUARY 31, 2015
(UNAUDITED) | | | FOR THE YEAR ENDED JULY 31, 2014 | | | FOR THE SIX MONTHS ENDED JANUARY 31, 2015 (UNAUDITED) | | | FOR THE YEAR ENDED JULY 31, 2014 | |
INCREASE (DECREASE) IN NET ASSETS: | | | | | | | | | | | | | | | | |
| From operations: | | | | | | | | | | | | | | | | |
Net investment income | | $ | 65,854 | | | $ | 455,631 | | | $ | 365,319 | | | $ | 568,220 | |
Net realized gain on investments | | | 2,580,742 | | | | 8,602,576 | | | | 659,378 | | | | 5,398,934 | |
Change in net unrealized appreciation on Investments | | | 1,994,700 | | | | 1,362,675 | | | | 3,620,622 | | | | 4,878,712 | |
| | | | | | | | | | | | | | | | |
Net increase in net assets resulting from operations | | | 4,641,296 | | | | 10,420,882 | | | | 4,645,319 | | | | 10,845,866 | |
| | | | | | | | | | | | | | | | |
| Dividends and distributions to shareholders: | | | | | | | | | | | | | | | | |
From net investment income | | | (128,866 | ) | | | (440,410 | ) | | | (308,663 | ) | | | (486,355 | ) |
From net realized gains | | | (6,321,658 | ) | | | — | | | | (1,274,237 | ) | | | — | |
| | | | | | | | | | | | | | | | |
Total dividends and distributions | | | (6,450,524 | ) | | | (440,410 | ) | | | (1,582,900 | ) | | | (486,355 | ) |
| | | | | | | | | | | | | | | | |
| Capital share transactions: | | | | | | | | | | | | | | | | |
Proceeds from sales of shares | | | 17,549,680 | | | | 36,540,154 | | | | 24,060,662 | | | | 26,577,277 | |
Reinvestment of dividends and distributions | | | 6,310,894 | | | | 428,141 | | | | 1,550,377 | | | | 476,684 | |
Payments for shares redeemed | | | (6,591,143 | ) | | | (10,692,351 | ) | | | (5,701,823 | ) | | | (8,864,143 | ) |
| | | | | | | | | | | | | | | | |
Net increase in net assets resulting from capital share transactions | | | 17,269,431 | | | | 26,275,944 | | | | 19,909,216 | | | | 18,189,818 | |
| | | | | | | | | | | | | | | | |
Total increase in net assets | | | 15,460,203 | | | | 36,256,416 | | | | 22,971,635 | | | | 28,549,329 | |
NET ASSETS: | | | | | | | | | | | | | | | | |
Beginning of period | | | 121,906,883 | | | | 85,650,467 | | | | 95,358,126 | | | | 66,808,797 | |
| | | | | | | | | | | | | | | | |
End of period | | $ | 137,367,086 | | | $ | 121,906,883 | | | $ | 118,329,761 | | | $ | 95,358,126 | |
| | | | | | | | | | | | | | | | |
Undistributed net investment income/(loss) | | | (45,030 | ) | | | 17,982 | | | | 124,165 | | | | 67,509 | |
See Notes to Financial Statements
20
GREEN CENTURY BALANCED FUND FINANCIAL HIGHLIGHTS
| | | | | | | | | | | | | | | | | | | | | | | | |
| | | SIX MONTHS ENDED
JANUARY 31, 2015 | | | FOR THE YEARS ENDED JULY 31, | |
| | | (UNAUDITED) | | | 2014 | | | 2013 | | | 2012 | | | 2011 | | | 2010 | |
Net Asset Value, beginning of period | | $ | 23.74 | | | $ | 21.43 | | | $ | 18.06 | | | $ | 17.50 | | | $ | 15.76 | | | $ | 14.75 | |
| | | | | | | | | | | | | | | | | | | | | | | | |
| Income from investment operations: | | | | | | | | | | | | | | | | | | | | | | | | |
Net investment income | | | 0.01 | | | | 0.09 | | | | 0.13 | | | | 0.10 | | | | 0.13 | | | | 0.18 | |
Net realized and unrealized gain on investments | | | 0.93 | | | | 2.31 | | | | 3.37 | | | | 0.56 | | | | 1.75 | | | | 1.01 | |
| | | | | | | | | | | | | | | | | | | | | | | | |
Total increase from investment operations | | | 0.94 | | | | 2.40 | | | | 3.50 | | | | 0.66 | | | | 1.88 | | | | 1.19 | |
| | | | | | | | | | | | | | | | | | | | | | | | |
| Less dividends: | | | | | | | | | | | | | | | | | | | | | | | | |
Dividends from net investment income | | | (0.02 | ) | | | (0.09 | ) | | | (0.13 | ) | | | (0.10 | ) | | | (0.14 | ) | | | (0.18 | ) |
Distributions from net realized gains | | | (1.17 | ) | | | — | | | | — | | | | — | | | | — | | | | — | |
| | | | | | | | | | | | | | | | | | | | | | | | |
Total decrease from dividends | | | (1.19 | ) | | | (0.09 | ) | | | (0.13 | ) | | | (0.10 | ) | | | (0.14 | ) | | | (0.18 | ) |
| | | | | | | | | | | | | | | | | | | | | | | | |
Net Asset Value, end of period | | $ | 23.49 | | | $ | 23.74 | | | $ | 21.43 | | | $ | 18.06 | | | $ | 17.50 | | | $ | 15.76 | |
| | | | | | | | | | | | | | | | | | | | | | | | |
Total return | | | 3.85 | %(a) | | | 11.20 | % | | | 19.44 | % | | | 3.81 | % | | | 11.92 | % | | | 8.07 | % |
| Ratios/Supplemental data: | | | | | | | | | | | | | | | | | | | | | | | | |
Net assets, end of period (in 000’s) | | $ | 137,367 | | | $ | 121,907 | | | $ | 85,650 | | | $ | 58,798 | | | $ | 58,410 | | | $ | 52,761 | |
Ratio of expenses to average net assets | | | 1.48 | %(b) | | | 1.48 | % | | | 1.48 | % | | | 1.45 | % | | | 1.38 | % | | | 1.38 | % |
Ratio of net investment income to average net assets | | | 0.10 | %(b) | | | 0.44 | % | | | 0.66 | % | | | 0.58 | % | | | 0.72 | % | | | 1.13 | % |
Portfolio turnover | | | 22 | %(a) | | | 42 | % | | | 31 | % | | | 58 | % | | | 70 | % | | | 48 | % |
GREEN CENTURY EQUITY FUND FINANCIAL HIGHLIGHTS
| | | | | | | | | | | | | | | | | | | | | | | | |
| | | SIX MONTHS ENDED
JANUARY 31, 2015 | | | FOR THE YEARS ENDED JULY 31, | |
| | | (UNAUDITED) | | | 2014 | | | 2013 | | | 2012 | | | 2011 | | | 2010 | |
Net Asset Value, beginning of period | | $ | 30.11 | | | $ | 26.30 | | | $ | 20.81 | | | $ | 19.99 | | | $ | 17.44 | | | $ | 15.65 | |
| | | | | | | | | | | | | | | | | | | | | | | | |
| Income from investment operations: | | | | | | | | | | | | | | | | | | | | | | | | |
Net investment income | | | 0.10 | | | | 0.19 | | | | 0.21 | | | | 0.19 | | | | 0.18 | | | | 0.17 | |
Net realized and unrealized gain on investments | | | 1.35 | | | | 3.79 | | | | 5.48 | | | | 0.83 | | | | 2.57 | | | | 1.77 | |
| | | | | | | | | | | | | | | | | | | | | | | | |
Total increase from investment operations | | | 1.45 | | | | 3.98 | | | | 5.69 | | | | 1.02 | | | | 2.75 | | | | 1.94 | |
| | | | | | | | | | | | | | | | | | | | | | | | |
| Less dividends: | �� | | | | | | | | | | | | | | | | | | | | | | | |
Dividends from net investment income | | | (0.09 | ) | | | (0.17 | ) | | | (0.20 | ) | | | (0.20 | ) | | | (0.20 | ) | | | (0.15 | ) |
Distributions from net realized gains | | | (0.35 | ) | | | — | | | | — | | | | — | | | | — | | | | — | |
| | | | | | | | | | | | | | | | | | | | | | | | |
Total decrease from dividends | | | (0.44 | ) | | | (0.17 | ) | | | (0.20 | ) | | | (0.20 | ) | | | (0.20 | ) | | | (0.15 | ) |
| | | | | | | | | | | | | | | | | | | | | | | | |
Net Asset Value, end of period | | $ | 31.12 | | | $ | 30.11 | | | $ | 26.30 | | | $ | 20.81 | | | $ | 19.99 | | | $ | 17.44 | |
| | | | | | | | | | | | | | | | | | | | | | | | |
Total return | | | 4.75 | %(a) | | | 15.16 | % | | | 27.49 | % | | | 5.14 | % | | | 15.77 | % | | | 12.39 | % |
| Ratios/Supplemental data: | | | | | | | | | | | | | | | | | | | | | | | | |
Net assets, end of period (in 000’s) | | $ | 118,330 | | | $ | 95,358 | | | $ | 66,809 | | | $ | 50,972 | | | $ | 53,363 | | | $ | 46,591 | |
Ratio of expenses to average net assets | | | 1.25 | %(b) | | | 1.25 | % | | | 1.25 | % | | | 1.16 | % | | | 0.95 | % | | | 0.95 | % |
Ratio of net investment income to average net assets | | | 0.67 | %(b) | | | 0.72 | % | | | 0.92 | % | | | 0.97 | % | | | 0.92 | % | | | 0.97 | % |
Portfolio turnover | | | 6 | %(a) | | | 32 | % | | | 17 | % | | | 14 | % | | | 13 | % | | | 13 | % |
See Notes to Financial Statements
21
| | |
GREEN CENTURY FUNDS NOTES TO FINANCIAL STATEMENTS (unaudited) | | |
NOTE 1 — Organization and Significant Accounting Policies
Green Century Funds (the “Trust”) is a Massachusetts business trust which offers two separate series, the Green Century Balanced Fund (the “Balanced Fund”) and the Green Century Equity Fund (the “Equity Fund”), collectively, the “Funds”. The Trust is registered under the Investment Company Act of 1940, as amended (the “Act”), as an open-end, diversified management investment company. The Trust accounts separately for the assets, liabilities and operations of each series. The Balanced Fund commenced operations on March 18, 1992 and the Equity Fund commenced operations on September 13, 1995.
The preparation of financial statements in conformity with U.S. generally accepted accounting principles (“U.S. GAAP”) requires management to make estimates and assumptions that affect the reported amounts of assets and liabilities and disclosure of contingent assets and liabilities at the date of the financial statements and the reported amounts of revenues and expenses during the reporting period. Actual results could differ from those estimates.
The following is a summary of the Funds’ significant accounting policies:
| | (A) | Investment Valuation: Equity securities listed on national securities exchanges other than NASDAQ are valued at last sale price. If a last sale price is not available, securities listed on national exchanges other than NASDAQ are valued at the mean between the closing bid and closing ask prices. NASDAQ National Market® and SmallCapSM securities are valued at the NASDAQ Official Closing Price (“NOCP”). The NOCP is based on the last traded price if it falls within the concurrent best bid and ask prices and is normalized pursuant to NASDAQ’s published procedures if it falls outside this range. If a NOCP is not available for any such security, the security is valued at the last sale price, or, if there have been no sales that day, at the mean between the closing bid and closing ask prices. Unlisted equity securities are valued at last sale price, or when last sale prices are not available, at the last quoted bid price. Debt securities (other than certificates of deposit and short-term obligations maturing in sixty days or less) are valued on the basis of valuations furnished by a pricing service which takes into account appropriate factors such as institution-size trading in similar groups of securities, yield, quality, coupon rate, maturity, type of issue, and other market data, without exclusive reliance on quoted prices or exchange or over-the-counter prices, since such valuations are believed to reflect more accurately the fair value of the securities. Securities, if any, for which there are no such valuations or quotations available, or for which the market quotation or valuation provided by a pricing service is deemed not reliable, are valued at fair value by management as determined in good faith under guidelines established by the Trustees. Certificates of deposit are valued at cost plus accrued interest, and short-term obligations maturing in sixty days or less are valued at amortized cost, both of which approximate market value. |
Various inputs are used in determining the value of the Fund’s investments. These inputs are summarized in the three broad levels listed below:
Level 1 — quoted prices for active markets for identical securities. An active market for the security is a market in which transactions occur with sufficient frequency and volume to provide pricing information on an ongoing basis. A quoted price in an active market provides the most reliable evidence of fair value.
Level 2 — other significant observable inputs (including quoted prices for similar securities, interest rates, prepayment speeds, credit risk, etc.). Quoted prices for identical or similar assets in markets that are not active. Investments valued at amortized cost. Inputs that are derived principally from or corroborated by observable market data. An adjustment to any observable input that is significant to the fair value may render the measurement a Level 3 measurement.
22
| | |
GREEN CENTURY FUNDS NOTES TO FINANCIAL STATEMENTS (unaudited) | | continued |
Level 3 — significant unobservable inputs, including the Fund’s own assumptions in determining the fair value of investments.
The inputs or methodology used for valuing securities are not necessarily an indication of the risk associated with investing in those securities.
The following is a summary of the inputs used to value the Balanced Fund’s net assets as of January 31, 2015:
| | | | | | | | | | | | | | | | |
| | | LEVEL 1 | | | LEVEL 2 | | | LEVEL 3 | | | TOTAL | |
COMMON STOCKS | | | $90,983,497 | | | | $ — | | | | $ — | | | | $90,983,497 | |
BONDS & NOTES | | | — | | | | 39,387,468 | | | | — | | | | 39,387,468 | |
CERTIFICATES OF DEPOSIT | | | — | | | | 95,000 | | | | — | | | | 95,000 | |
SHORT-TERM OBLIGATIONS | | | — | | | | 6,618,394 | | | | — | | | | 6,618,394 | |
| | | | | | | | | | | | | | | | |
TOTAL | | | $90,983,497 | | | | $46,100,862 | | | | $ — | | | | $137,084,359 | |
| | | | | | | | | | | | | | | | |
The following is a summary of the inputs used to value the Equity Fund’s net assets as of January 31, 2015:
| | | | | | | | | | | | | | | | |
| | | LEVEL 1 | | | LEVEL 2 | | | LEVEL 3 | | | TOTAL | |
COMMON STOCKS | | | $117,001,487 | | | | $ — | | | | $ — | | | | $117,001,487 | |
SHORT-TERM OBLIGATIONS | | | — | | | | 1,073,747 | | | | — | | | | 1,073,747 | |
| | | | | | | | | | | | | | | | |
TOTAL | | | $117,001,487 | | | | $1,073,747 | | | | $ — | | | | $118,075,234 | |
| | | | | | | | | | | | | | | | |
The Funds adopted the Financial Accounting Standards Board (“FASB”) amendments to authoritative guidance which require the Funds to disclose details of transfers in and out of Level 1 and Level 2 measurements and Level 2 and Level 3 measurements and the reasons for the transfers. For the six months ended January 31, 2015, there were no transfers in and out of Level 1, Level 2 and Level 3. Neither of the Funds held any Level 3 securities during the six months ended January 31, 2015. It is the Funds’ policy to recognize transfers into and out of all Levels at the end of the reporting period.
| | (B) | Securities Transactions and Investment Income: Securities transactions are recorded on a trade date basis. Realized gains and losses from securities transactions are determined using the identified cost basis. Interest income, including amortization of premiums and accretion of discounts on bonds, is recognized on the accrual basis and dividend income is recorded on ex-dividend date. |
| | (C) | Options Transactions: The Balanced Fund may utilize options to hedge or protect from adverse movements in the market values of its portfolio securities and to enhance return. The Equity Fund is authorized to utilize options to hedge against possible increases in the value of securities which are expected to be purchased by the Equity Fund or possible declines in the value of securities which are expected to be sold by the Equity Fund. The use of options involves risk such as the possibility of illiquid markets or imperfect correlation between the value of the option and the underlying securities. The Funds are also authorized to write put and call options. Premiums received upon writing put or call options are recorded as an asset with a corresponding liability which is subsequently adjusted to the current market value of the option. Changes between the initial premiums received and the current market value of the options are recorded as unrealized gains or losses. When an option is closed, expired or exercised, a gain or loss is realized and the liability is eliminated. The |
23
| | |
GREEN CENTURY FUNDS NOTES TO FINANCIAL STATEMENTS (unaudited) | | continued |
| | Funds continue to bear the risk of adverse movements in the price of the underlying assets during the period of the option, although any potential loss during the period would be reduced by the amount of the option premium received. As required by the Act, liquid securities are designated as collateral in an amount equal to the market value of open options contracts. In the six months ended January 31, 2015, neither the Balanced Fund nor the Equity Fund utilized options or wrote put or call options. |
| | (D) | Repurchase Agreements: The Funds enter into repurchase agreements with selected banks or broker-dealers that are deemed by the Funds’ adviser to be creditworthy pursuant to guidelines established by the Board of Trustees. Each repurchase agreement is recorded at cost, which approximates fair value. The Funds require that the market value of collateral, represented by securities (primarily U.S. Government securities), be sufficient to cover payments of interest and principal and that the collateral be maintained in a segregated account with a custodian bank in a manner sufficient to enable the Funds to obtain those securities in the event of a default of the counterparty. In the event of default or bankruptcy by the counterparty to the repurchase agreement, retention of the collateral may be subject to legal proceedings. |
| | (E) | Distributions: Distributions to shareholders are recorded on the ex-dividend date. The Funds declare and pay dividends of net investment income, if any, semi-annually and distribute net realized capital gains, if any, annually. The amount and character of income and net realized gains to be distributed are determined in accordance with Federal income tax rules and regulations, which may differ from U.S. GAAP. To the extent that these differences are attributable to permanent book and tax accounting differences, the components of net assets have been adjusted. |
| | (F) | Federal Taxes: Each series of the Trust is treated as a separate entity for Federal income tax purposes. Each Fund’s policy is to comply with the provisions of the Internal Revenue Code applicable to regulated investment companies (“RICs”). Accordingly, no provisions for Federal income or excise tax are necessary. |
In July 2006, the FASB issued Accounting for Uncertainty in Income Taxes. This interpretation addresses the accounting for uncertainty in income taxes and establishes for all entities, including pass-through entities such as the Funds, a minimum threshold for financial statement recognition of the benefit of positions taken in filing tax returns (including whether an entity is taxable in a particular jurisdiction). The Funds recognize tax benefits only if it is more likely than not that a tax position (including the Funds’ assertion that their income is exempt from tax) will be sustained upon examination. The Funds adopted Accounting for Uncertainty in Income Taxes in fiscal year 2008. The Funds had no material uncertain tax positions and have not recorded a liability for unrecognized tax benefits as of January 31, 2015. Also, the Funds had recognized no interest and penalties related to uncertain tax benefits through January 31, 2015. At January 31, 2015, the tax years 2011 through 2014 remain open to examination by the Internal Revenue Service.
The Regulated Investment Company Modernization Act of 2010 (“RIC MOD”) was signed into law on December 22, 2010. RIC MOD makes changes to a number of the federal income and excise tax provisions impacting RICs, including simplification provisions on asset diversification and qualifying income tests, provisions aimed at preserving the character of the distributions made by the RIC and coordination of the income and excise tax distribution requirements, and provisions for allowing unlimited years carryforward for capital losses.
| | (G) | Redemption Fee: A 2.00% redemption fee is retained by the Funds to offset the effect of transaction costs and other expenses associated with short-term investing. The fee is imposed on redemptions or exchanges of shares held 60 days or less from their purchase date. For the six months ended January 31, 2015, the Balanced Fund |
24
| | |
GREEN CENTURY FUNDS NOTES TO FINANCIAL STATEMENTS (unaudited) | | continued |
| | and Equity Fund received $1,177 and $1,613, respectively, in redemption fees. Redemption fees are recorded as an adjustment to paid-in capital. |
| | (H) | Indemnification: The Fund’s organizational documents provide that trustees and officers are indemnified against certain liabilities arising out of the performance of their duties to the Funds. In the normal course of business, the Funds may also enter into contracts that provide general indemnifications. The Funds’ maximum exposure under these arrangements is unknown as this would be dependent on future claims that may be made against the Funds. The risk of material loss from such claims is considered remote. As of the six months ended January 31, 2015, no liability has been accrued. |
| | (I) | Offsetting of Assets and Liabilities: As of January 31, 2015, there are no master netting arrangements related to the Funds. The Funds’ Statements of Assets and Liabilities present derivative instruments on a gross basis, if applicable. As of January 31, 2015, no derivative instruments were held by the Funds. |
NOTE 2 — Transactions With Affiliates
| | (A) | Investment Adviser: Green Century Capital Management, Inc. (“Green Century”) is the adviser (“the Adviser”) for the Funds. Green Century is owned by Paradigm Partners. Green Century oversees the portfolio management of the Funds on a day-to-day basis. The Balanced Fund pays Green Century a fee, accrued daily and paid monthly, at an annual rate equal to 0.65% of the Balanced Fund’s average daily net assets. The Equity Fund pays Green Century a fee, accrued daily and paid monthly, at an annual rate of 0.25% of the Equity Fund’s average daily net assets up to but not including $100 million, 0.22% of average daily net assets including $100 million up to but not including $500 million, 0.17% of average daily net assets including $500 million up to but not including $1 billion and 0.12% of average daily net assets equal to or in excess of $1 billion. |
| | (B) | Subadvisers: Trillium Asset Management, LLC (“Trillium”) is the subadviser for the Balanced Fund. Trillium is paid a fee by the Adviser at an annual rate of 0.40% on the first $30 million of average daily net assets and 0.35% on average daily net assets in excess of $30 million for its services. For the six months ended January 31, 2015, Green Century accrued fees of $236,446 to Trillium. Northern Trust Investments, Inc. (“Northern Trust”) is the subadviser for the Equity Fund. Northern Trust is paid a fee by the Adviser based on Northern Trust’s fee schedule of the greater of $75,000 or 0.10% of the value of the average daily net assets of the Fund up to but not including $50 million, 0.05% of the average daily net assets of the Fund from and including $50 million up to but not including $100 million and 0.03% of the average daily net assets of the Fund equal to or in excess of $100 million for its services. For the six months ended January 31, 2015 Green Century accrued fees of $39,125 to Northern Trust. |
| | (C) | Administrator: Green Century is the administrator (“the Administrator”) of the Green Century Funds. Pursuant to the Administrative Services Agreement, Green Century pays all the expenses of each Fund other than the investment advisory fees; interest; taxes; brokerage costs and other capital expenses; expenses of non-interested trustees (including counsel fees) and any extraordinary expenses. The Balanced Fund pays Green Century a fee at a rate such that immediately following any payment to the Administrator, the total operating expenses of the Fund, on an annual basis, do not exceed 1.48% of the Fund’s average daily net assets. The Equity Fund pays Green Century a fee at a rate such that immediately following any payment to the Administrator, the total operating expenses of the Fund, on an annual basis, do not exceed 1.25% of the Fund’s average daily net assets. |
| | (D) | Subadministrator: Pursuant to a Subadministrative Services Agreement with the Administrator, UMB Fund Services, Inc. (“UMBFS”) as Subadministrator, is responsible for conducting certain day-to-day administration |
25
| | |
GREEN CENTURY FUNDS NOTES TO FINANCIAL STATEMENTS (unaudited) | | continued |
| | of the Trust subject to the supervision and direction of the Administrator. For the six months ended January 31, 2015, Green Century accrued fees of $57,427 and $54,248 to UMBFS related to services performed on behalf of the Balanced Fund and the Equity Fund, respectively. |
| | (E) | Index Agreement: The Equity Fund invests in the securities of the companies included in the MSCI KLD 400 Social ex Fossil Fuels Index (the “Index”). The Index is owned and maintained by MSCI ESG Research (“MSCI”). For the use of the Index, MSCI is paid by the Adviser an annual license fee of $26,000, plus the greater of $26,000 or at an annual rate of 0.05% on the first $100 million of average daily net assets, 0.04% on the next $100 million of average daily net assets, and 0.03% on average daily net assets in excess of $200 million. For the six months ended January 31, 2015, Green Century accrued fees of $40,068 to MSCI. |
NOTE 3 — Investment Transactions
The Balanced Fund’s cost of purchases and proceeds from sales of securities, other than short-term securities, aggregated $41,738,704 and $27,580,971, respectively, for the six months ended January 31, 2015. The Equity Fund’s cost of purchases and proceeds from sales of securities, other than short-term securities, aggregated $24,830,772 and $6,550,386, respectively.
NOTE 4 — Federal Income Tax Information
The tax basis of the components of distributable net earnings (deficit) at July 31, 2014 were as follows:
| | | | | | | | |
| | | BALANCED FUND | | | EQUITY FUND | |
Undistributed ordinary income | | $ | 15,349 | | | $ | 51,229 | |
Undistributed long-term capital gains | | | 6,161,540 | | | | 1,029,129 | |
| | | | | | | | |
Tax accumulated earnings | | | 6,176,889 | | | | 1,080,358 | |
| | | | | | | | |
Accumulated capital and other losses | | | 0 | | | | 0 | |
Unrealized appreciation (depreciation) | | | 17,973,918 | | | | 23,375,339 | |
| | | | | | | | |
Distributable net earnings (deficit) | | $ | 24,150,807 | | | $ | 24,455,697 | |
| | | | | | | | |
Capital loss carryovers are available to offset future realized capital gains and thereby reduce further taxable gain distributions. During the year ended July 31, 2014, the Balanced and Equity Fund utilized $2,441,130 and $4,414,798, respectively of their capital loss carryovers.
The tax character of distributions paid during the fiscal years ended July 31, 2014 and July 31, 2013 were as follows:
| | | | | | | | | | | | | | | | |
| | | BALANCED FUND | | | EQUITY FUND | |
| | | YEAR ENDED
JULY 31, 2014 | | | YEAR ENDED
JULY 31, 2013 | | | YEAR ENDED
JULY 31, 2014 | | | YEAR ENDED
JULY 31, 2013 | |
Ordinary income | | $ | 440,410 | | | $ | 437,535 | | | $ | 486,355 | | | $ | 489,952 | |
Long-term capital gains | | | — | | | | — | | | | — | | | | — | |
26
| | |
GREEN CENTURY FUNDS NOTES TO FINANCIAL STATEMENTS (unaudited) | | concluded |
NOTE 5 — Capital Share Transactions
Capital Share transactions for the Balanced Fund and the Equity Fund were as follows:
| | | | | | | | | | | | | | | | |
| | | BALANCED FUND | | | EQUITY FUND | |
| | | SIX MONTHS ENDED
JANUARY 31, 2015 | | | YEAR ENDED
JULY 31, 2014 | | | SIX MONTHS ENDED
JANUARY 31, 2015 | | | YEAR ENDED
JULY 31, 2014 | |
Shares sold | | | 725,777 | | | | 1,581,678 | | | | 767,901 | | | | 922,022 | |
Reinvestment of dividends | | | 262,516 | | | | 17,927 | | | | 47,851 | | | | 16,188 | |
Shares redeemed | | | (273,721 | ) | | | (462,258 | ) | | | (180,783 | ) | | | (311,923 | ) |
| | | | | | | | | | | | | | | | |
| | | 714,572 | | | | 1,137,347 | | | | 634,969 | | | | 626,287 | |
| | | | | | | | | | | | | | | | |
NOTE 6 — Subsequent Events
Subsequent to January 31, 2015 and through the date on which the financial statements were available for issuance, management has evaluated subsequent events and concluded there were no subsequent events requiring accrual or disclosure.
27
RESULTS OF THE SPECIAL MEETING OF SHAREHOLDERS (UNAUDITED)
A special meeting of shareholders of the Green Century Balanced Fund and the Green Century Equity Fund was held on September 22, 2014 to consider the proposal below. The proposal was approved. Shareholders of record as of July 22, 2014 were entitled to vote. The results of the vote at the meeting were as follows:
To elect Trustees of the Funds
| | | | | | | | | | | | |
| | | Affirmative | | | Withheld | | | Total | |
John Comerford | | | 3,344,720.572 | | | | 1,844,717.045 | | | | 5,189,437.617 | |
Jonathan Darnell | | | 4,680,277.919 | | | | 509,159.698 | | | | 5,189,437.617 | |
Laurie Moskowitz | | | 4,722,952.061 | | | | 466,485.556 | | | | 5,189,437.617 | |
Douglas H. Phelps | | | 3,351,955.014 | | | | 1,837,482.603 | | | | 5,189,437.617 | |
Bancroft R. Poor | | | 4,692,217.740 | | | | 497,219.877 | | | | 5,189,437.617 | |
Mary Raftery | | | 4,730,090.613 | | | | 459,347.004 | | | | 5,189,437.617 | |
James H. Starr | | | 4,683,823.033 | | | | 505,614.584 | | | | 5,189,437.617 | |
Wendy Wendlandt | | | 4,725,735.836 | | | | 463,701.781 | | | | 5,189,437.617 | |
28
BOARD OF TRUSTEES’ CONSIDERATION OF ADVISORY AND SUBADVISORY AGREEMENTS
The Board of Trustees of the Green Century Funds considered and approved the continuance of two advisory and two subadvisory agreements during the six months ended January 31, 2015.
INVESTMENT ADVISORY AGREEMENTS WITH GREEN CENTURY CAPITAL MANAGEMENT, INC.
The Board, including the Independent Trustees, approved the continuance of the Investment Advisory Agreements (the “Advisory Agreements”) between the Trust, on behalf of the Balanced Fund and the Equity Fund (the “Funds” and each a “Fund”), and Green Century Capital Management (“Green Century” or the “Adviser”), at a meeting on November 21, 2014. The Trustees considered, among other things, information provided by Green Century regarding the investment performance of each Fund; the expenses of each Fund and the advisory fee paid to Green Century by each Fund; and the profitability to Green Century of its advisory relationship with each Fund. The Independent Trustees were assisted by independent counsel in considering these materials and the approval and continuance of the Advisory Agreements. The Trustees considered all the information provided to them by Green Century, including information provided throughout the year. The Trustees also received a memorandum from independent legal counsel advising them of their duties and responsibilities in connection with the review of the Advisory Agreements. In approving the Advisory Agreements, the Board, including the Independent Trustees, did not identify any single factor as determinative. Matters considered in connection with their approval of the Advisory Agreements included the following.
Nature, Quality, and Extent of Services Performed. The Trustees considered the scope and quality of the services performed for each of the Funds by the Adviser, including the resources dedicated by the Adviser. With respect to the Equity Fund, these services included monitoring the Equity Fund’s performance and tracking error relative to the MSCI KLD 400 Social ex Fossil Fuels Index (the “Index”); implementing the environmental and other policies of the Trust by voting the Equity Fund’s shareholder proxies; and overall compliance oversight provided by the Adviser. The Trustees also considered the Adviser’s supervision of Northern Trust Investments, Inc. (“Northern Trust”), the subadviser of the Equity Fund, which performs day-to-day portfolio management for the Fund.
With respect to the Balanced Fund, the services performed included the oversight and monitoring of the portfolio management and performance of the Balanced Fund; monitoring the implementation of the Balanced Fund’s environmental screens; implementing the environmental and other policies of the Trust by voting the Balanced Fund’s shareholder proxies; and overall compliance oversight provided by the Adviser. The Trustees also considered the Adviser’s supervision of Trillium Asset Management, LLC (“Trillium”), the subadviser of the Balanced Fund, which performs the day-to-day portfolio management for the Fund.
In addition, the Trustees considered the Adviser’s ongoing efforts and commitment with respect to shareholder advocacy and corporate environmental responsibility. They also considered the administrative services provided by the Adviser to both Funds under a separate agreement, including the coordination of the activities of the Funds’ other service providers. Based on its review of all of the services provided, the Trustees concluded that the nature, quality, and extent of services provided by the Adviser supported the continuance of the Advisory Agreements with respect to the Equity Fund and the Balanced Fund.
Investment Performance. With respect to the Equity Fund, the Trustees considered that due to the Equity Fund’s passive investment strategy, the principal concern with regard to investment performance was the extent to which the Equity Fund tracked the Index. The Trustees reviewed the performance of the Equity Fund, exclusive of the expenses of the Fund, as compared to that of the Index for the periods ended September 30, 2014, and noted that the Equity Fund’s performance closely followed that of the Index. In particular, they observed that 38 basis points of the Equity Fund’s one-year variance from the Index’s performance was attributable to factors other than Fund fees and expenses. After
29
considering all the factors deemed appropriate, the Trustees, including the Independent Trustees, concluded that the performance of the Equity Fund supported the continuance of the Advisory Agreement with respect to the Equity Fund.
With respect to the Balanced Fund, the Trustees reviewed and considered information regarding the investment performance of the Balanced Fund and comparative data with respect to the performance of other funds designated by Morningstar to have similar investment objectives as well as the Balanced Fund’s performance measured against the Lipper Balanced Fund Index (“Lipper”), which is a broad-based balanced fund market index, and a custom balanced index (“Custom Index”) comprised of a 60% weighting in the S&P 1500 Index and a 40% weighting in the BofA Merrill Lynch 1-10 Year US Corporate and Government Index. The Trustees noted that as of the period ended September 30, 2014, the Balanced Fund’s one-, three- and five-year average annual returns outperformed the Lipper and its ten-year average annual returns underperformed the Lipper. The Trustees also noted that as of the period ended September 30, 2014, the Balanced Fund’s one- and three-year average annual returns outperformed the Custom Index and its five- and ten-year average annual returns had underperformed the Custom Index. The Trustees also considered the performance information they had been provided throughout the year. After weighing all the factors deemed appropriate, including the environmental screens applied to the Fund’s investment process, the Trustees, including the Independent Trustees, concluded that the performance of the Balanced Fund supported the continuance of the Advisory Agreement with respect to the Balanced Fund.
The Costs of Services Provided and Profitability. The Trustees considered the costs of the services provided to the Funds and the profitability and fall-out benefits to the Adviser from its arrangements with the Funds.
The Trustees reviewed and considered an analysis of the advisory fees and total expenses ratios of each Fund and comparative data for multiple categories of mutual funds included in and as defined by Morningstar’s mutual fund database of over 7,000 mutual funds. For the Equity Fund, the Trustees noted that, based on the information provided, the Fund’s advisory fee was lower than the average advisory fee for socially conscious funds by 38 basis points, lower than the average advisory fee for socially conscious growth and income funds by 8 basis points, lower than that of the average growth and income funds by 31 basis points and higher than the average of growth and income index funds by 3 basis points. The Trustees also noted that the total expense ratio of the Equity Fund was capped at 1.25%, and that the total expense ratio was higher than that of the average of socially conscious funds by 5 basis points and higher than that of the average of all growth and income funds by 25 basis points, and higher than that of the average growth and income index funds by 71 basis points. For the Balanced Fund, the Trustees noted that, based on the information provided, the Fund’s advisory fee was higher than the average advisory fee for socially conscious funds (by 2 basis points), socially conscious balanced Funds (by 7 basis points), all balanced funds (by 15 basis points) and balanced funds which have between $100 million and $200 million in assets (by 17 basis points). The Trustees also noted that the total expense ratio of the Balanced Fund was capped at 1.48% and that the total expense ratio was higher than that of the average of socially conscious funds by 28 basis points, higher than that of the average of socially conscious balanced funds by 51 basis points, higher than that of the average of all balanced funds by 46 basis points, and higher than that of the average of balanced funds with assets between $100 million and $200 million by 58 basis points.
Green Century provided the Trustees with information relating to the profitability to Green Century of its advisory relationships to the Funds. The Trustees noted that based on information provided by Green Century, the relationship had not been profitable for several years, though recent growth in Fund assets was projected to result in a modest profit in the current fiscal year. In that regard, the Trustees considered the subadvisory fees and the other expenses incurred by the Adviser in providing advisory services to the Funds. The Trustees also considered the fee received by Green Century for providing administrative services to the Funds and the expenses incurred in providing those services. In considering the cost allocation methodology used by Green Century, the Trustees took into consideration that the Adviser does not provide advisory or administrative services to other mutual funds or non-mutual fund clients. The Trustees also considered Green Century’s non-profit ownership structure, its cost structure and personnel needs, and its investment in shareholder advocacy that aligns with the Funds’ stated intention to promote greater corporate
30
environmental accountability. After reviewing the information described above, the Independent Trustees concluded that the fees specified in the Advisory Agreements, taking into account the costs of the services provided by the Adviser and the profitability to the Adviser of its relationships with the Funds, supported the continuance of the Advisory Agreements with respect to the Equity Fund and the Balanced Fund.
Other Benefits. With respect to fall-out benefits, the Trustees considered that neither Green Century nor any affiliate of Green Century receives any brokerage fees, soft dollar benefits, liquidity rebates from electronic communications networks or payments for order flow from the trades executed for either Fund. The Trustees noted that Green Century does potentially benefit from its relationship with the Funds due to the Funds’ reputation as the first family of no-load environmentally responsible mutual funds and, more recently, as the first and only family of responsible and diversified fossil fuel free mutual funds in the nation. The Trustees considered that the association with the Funds supports Green Century’s own stated mission of advocating for corporate environmental responsibility. Further, pursuant to the Advisory Agreements, Green Century has reserved for itself the rights to the names “Green Century Funds” and any similar names; thus, Green Century may benefit in the future from developing other funds or investment products with the Green Century brand. The Trustees concluded that the fall-out benefits to be realized by Green Century were appropriate and supported the continuance of the Advisory Agreements with respect to the Equity Fund and the Balanced Fund.
Economies of Scale. The Trustees also considered whether economies of scale could be realized by the Adviser as the Funds grew in asset size and the extent to which such economies of scale were reflected in the level of fees charged. They noted the relatively small size of each Fund and the resultant difficulty of achieving meaningful economies of scale. They considered that if the assets were to increase, the Funds could have the opportunity to experience economies of scale as fixed costs would become a smaller percentage of the Funds’ assets and some of the Funds’ service providers’ fees, as a percentage of the Funds’ assets, could decrease. The Trustees noted that the advisory fee structure for the Equity Fund included break-points that would cause the advisory fee to decrease as a percentage of net assets as the Fund increased in size. The Trustees concluded that economies of scale could be realized as the Funds grew and that if assets increased significantly the Trustees would have opportunities to negotiate decreases in fees with the Adviser.
Based on a review of all factors deemed relevant, the Trustees, including the Independent Trustees, concluded that the Advisory Agreements with respect to the Balanced Fund and the Equity Fund should be continued for an additional one-year period.
INVESTMENT SUBADVISORY AGREEMENT WITH TRILLIUM ASSET MANAGEMENT LLC RELATING TO THE BALANCED FUND
At the meeting on November 21, 2014, the Board of Trustees of the Balanced Fund, including a majority of the Independent Trustees, considered the continuance of the subadvisory agreement between the Trust, on behalf of the Balanced Fund, Green Century, and Trillium (the “Subadvisory Agreement”). In connection with their deliberations at the meeting, and in separate executive session of the Independent Trustees, the Trustees considered, among other things, information provided by Trillium regarding the investment performance of the Balanced Fund, the subadvisory fees paid to Trillium, and the profitability to Trillium of its subadvisory relationship to the Balanced Fund. The Independent Trustees were assisted by independent counsel in considering these materials and the continuance of the Subadvisory Agreement. The Trustees considered all the information provided to them by Trillium, including information provided throughout the year. The Trustees also received a memorandum from independent legal counsel advising them of their duties and responsibilities in connection with the review of the Subadvisory Agreement. In approving the continuance of the Subadvisory Agreement, the Board, including the Independent Trustees, did not identify any single factor as determinative. Matters considered in connection with their approval of the Subadvisory Agreement included the following.
Nature, Quality, and Extent of Services Performed. The Trustees noted that under the terms of the Subadvisory Agreement, Trillium provided the day-to-day portfolio management of the Balanced Fund, including determining asset
31
and sector allocation; conducting securities selection and discovery; researching and analyzing environmental policies and practices of companies and implementing the Balanced Fund’s environmental screening criteria; managing the volatility, risk, and turnover of the portfolio; and investing the portfolio consistent with the Balanced Fund’s investment objective and policies. The Trustees considered the professional expertise, tenure, and qualifications of the portfolio management team and noted that Trillium was devoted exclusively to environmentally and socially responsible investing and managed over $1 billion in assets. The Trustees also considered Trillium’s compliance record as well as the professional experience and responsiveness of Trillium’s compliance staff. The Trustees also considered Trillium’s leadership in social and environmental responsibility, including its shareholder advocacy efforts.
Based on its review of all of the services provided and to be provided, the Trustees concluded that the nature, quality, and extent of services provided by Trillium supported the continuance of the Subadvisory Agreement.
Investment Performance. The Trustees reviewed and considered information regarding the investment performance of the Balanced Fund and comparative data with respect to the performance of mutual funds with similar investment objectives as well as other broad-based market indexes. The Trustees noted that as of the period ended September 30, 2014, the Balanced Fund’s one-, three- and five- year average annual returns outperformed the Lipper and its ten- year average annual returns underperformed the Lipper. The Trustees also noted that as of the period ended September 30, 2014, the Balanced Fund’s one- and three-year average annual returns outperformed the Custom Index and its five- and ten- year average annual returns had underperformed the Custom Index. Trillium became the Balanced Fund’s subadviser on November 28, 2005. After considering all the factors deemed appropriate, the Trustees concluded that the performance of the Balanced Fund together with Trillium’s investment process, philosophies and experience in environmentally and socially responsible investing, supported the continuance of the Subadvisory Agreement.
Costs of Services Provided and Profitability. The Trustees considered that the subadvisory fees paid by Green Century to Trillium under the Subadvisory Agreement were 0.40% of the value of the average daily net assets of the Balanced Fund up to $30 million, and 0.35% of the value of the average daily net assets of the Balanced Fund in excess of $30 million. The Trustees also considered that the subadvisory fees are paid by Green Century, and are not in addition to the advisory fees paid to Green Century by the Balanced Fund.
In evaluating the profitability of the Subadvisory Agreement to Trillium, the Trustees noted that based on information provided by Trillium, the relationship was slightly profitable. The Trustees noted that Trillium stated that now that the Balanced Fund assets have exceeded $100 million, the Balanced Fund generates for Trillium a level of profitability similar to that of its other advisory clients. The Trustees considered the financial resources Trillium dedicated and the other expenses Trillium incurred in providing subadvisory services to the Balanced Fund, including startup costs relating to the relationship, and additional personnel, legal, trading analysis and compliance costs required in the context of providing subadvisory services to a mutual fund. In considering the cost allocation methodology used by Trillium, the Trustees took under consideration that Trillium has recently announced its intention to acquire another investment adviser, which currently manages a mutual fund. The Trustees also considered Trillium’s fee structure and noted, based on the information provided, that the subadvisory fees were lower than the fees Trillium receives from its institutional clients with separate accounts of similar size as the Balanced Fund.
After reviewing the information described above, the Trustees concluded that the fees specified in the Subadvisory Agreement, taking into account the nature and quality of services provided and the costs of the services provided by Trillium, supported the continuance of the Subadvisory Agreement.
Other Benefits. The Trustees evaluated potential other benefits Trillium may realize from its relationship with the Balanced Fund. The Trustees considered the brokerage practices of Trillium, including the soft dollar commissions that were generated with respect to the Balanced Fund’s portfolio transactions. The Trustees considered that Trillium was not affiliated with a broker/dealer and therefore no benefit would be realized by Trillium through transactions with
32
affiliated brokers. The Trustees also considered the reputational and other advantages Trillium may gain from its relationship with the Balanced Fund. The Trustees concluded that the benefits received by Trillium were reasonable in the context of the relationship between Trillium and the Balanced Fund, and supported the continuance of the Subadvisory Agreement.
Economies of Scale. The Trustees also considered whether economies of scale would be realized by Trillium as the Balanced Fund grew in asset size and the extent to which such economies of scale might be reflected in the subadvisory fees. They noted the relatively small size of the Balanced Fund and considered that as the assets increased, Trillium could have the opportunity to experience economies of scale. They also noted that pursuant to the Subadvisory Agreement, the subadvisory fees paid to Trillium by Green Century (out of its flat 0.65% advisory fee) include a breakpoint at $30 million, so that fees as a percentage of net assets decrease as assets in the Balanced Fund increase. The Trustees concluded that economies of scale could be realized as the Fund grew, and that the fee schedule as specified was appropriate, and supported the continuance of the Subadvisory Agreement.
Based on a review of all factors deemed relevant, the Trustees, including the Independent Trustees, concluded that the Subadvisory Agreement should be continued for an additional one-year period.
INVESTMENT SUBADVISORY AGREEMENT WITH NORTHERN TRUST INVESTMENTS, INC. RELATING TO THE EQUITY FUND
At the meeting on November 21, 2014, the Board of Trustees, including a majority of the Independent Trustees, considered the continuance of the subadvisory agreement between the Trust, on behalf of the Equity Fund, Green Century, and Northern Trust (the “Subadvisory Agreement”). In connection with their deliberations at the meeting, and in separate executive session of the Independent Trustees, the Trustees considered, among other things, information provided by Northern Trust regarding the investment performance of the Equity Fund, including the success with which the Fund tracked the Index, the subadvisory fees paid to Northern Trust, and the profitability to Northern Trust of its subadvisory relationship to the Equity Fund. The Independent Trustees were assisted by independent counsel in considering these materials and the continuance of the Subadvisory Agreement. The Trustees considered all the information provided to them by Northern Trust, including information provided throughout the year. The Trustees also received a memorandum from independent legal counsel advising them of their duties and responsibilities in connection with the review of the Subadvisory Agreement. In approving the continuance of the Subadvisory Agreement, the Board, including the Independent Trustees, did not identify any single factor as determinative. Matters considered in connection with their approval of the Subadvisory Agreement included the following.
Nature, Quality, and Extent of Services Performed. The Trustees noted that under the terms of the Subadvisory Agreement, Northern Trust provided the day-to-day portfolio management of the Equity Fund, making purchases and sales of portfolio securities consistent with the Equity Fund’s investment objective and policies and with changes to the Index. The Trustees considered the professional expertise, tenure, and qualifications of the portfolio management team as well as the team’s experience in passive management. The Trustees also considered Northern Trust’s handling of daily inflows and outflows, transaction costs, tracking error, and the portfolio turnover rates for the Equity Fund. The Trustees also considered Northern Trust’s compliance record as well as the professional experience and responsiveness of Northern Trust’s compliance staff.
Based on its review of all of the services provided and to be provided, the Trustees concluded that the nature, quality, and extent of services provided by Northern Trust supported the continuance of the Subadvisory Agreement.
Investment Performance. The Trustees considered that the Equity Fund follows a passive investment strategy designed to track the Index and therefore the analysis of its investment performance should be based on the extent to which the Equity Fund successfully tracked the Index. The Trustees reviewed the performance of the Equity Fund, exclusive of the expenses of the Fund, as compared to that of the Index for the periods ended September 30, 2014, and noted that the Equity Fund’s performance closely followed that of the Index. In particular, they observed that 38 basis
33
points of the Equity Fund’s one-year variance from the Index’s performance was attributable to factors other than Fund fees and expenses. After considering all the factors deemed appropriate, the Trustees concluded that the performance of the Equity Fund together with Northern Trust’s investment process and experience in passive portfolio management supported the continuance of the Subadvisory Agreement.
Costs of Services Provided and Profitability. The Trustees considered that the subadvisory fees paid by Green Century to Northern Trust under the Subadvisory Agreement were 0.10% of the value of the average daily net assets of the Equity Fund up to but not including $50 million, 0.05% of the value of the average daily net assets of the Equity Fund from and including $50 million up to but not including $100 million, and 0.03% of the value of the average daily net assets of the Equity Fund equal to or in excess of $100 million, subject to a minimum fee of $75,000 per annum. Based on the Equity Fund’s net assets as of September 30, 2014, the annual fee was approximately 0.073%. The Trustees also considered that the subadvisory fees are paid by Green Century, and are not in addition to the advisory fees paid to Green Century by the Equity Fund.
The Trustees reviewed and considered an analysis of the subadvisory fees against comparative data for index funds managed by Northern Trust and for similar socially responsible index funds. The Trustees noted that the Fund paid subadvisory fees comparable to those paid to Northern Trust by other subadvised index funds with similar levels of net assets. In evaluating the profitability of the Subadvisory Agreement to Northern Trust, the Trustees noted that Northern Trust does not calculate earnings at the subadvisory client level. Nevertheless, Northern Trust noted that it is continuing to grow its assets under management, including a significant amount of assets in the socially responsible mutual fund market.
After reviewing the information described above, the Trustees concluded that the fees specified in the Subadvisory Agreement, taking into account the nature and quality of services provided and the costs of the services provided by Northern Trust, supported the continuance of the Subadvisory Agreement.
Other Benefits. The Trustees evaluated potential other benefits Northern Trust may realize from its relationship with the Equity Fund. The Trustees considered the brokerage practices of Northern Trust, including that Northern Trust does not trade for the Equity Fund through its affiliated broker. The Trustees also considered that no soft dollars have been or will be paid in connection with Northern Trust’s management of the Equity Fund. The Trustees further considered the reputational and other advantages Northern Trust may gain from its relationship with the Equity Fund, including that Northern Trust’s management of the Equity Fund will broaden its exposure to the socially responsible mutual fund market, which may assist in its marketing efforts. The Trustees concluded that the benefits received by Northern Trust were reasonable in the context of the relationship between Northern Trust and the Equity Fund, and supported the continuance of the Subadvisory Agreement.
Economies of Scale. The Trustees also considered whether economies of scale would be realized by Northern Trust as the Equity Fund grew in asset size and the extent to which such economies of scale might be reflected in the subadvisory fees. They noted the relatively small size of the Equity Fund and considered that if the assets were to increase, Northern Trust could have the opportunity to experience economies of scale. They also noted that pursuant to the Subadvisory Agreement, the subadvisory fees paid to Northern Trust by Green Century (out of its advisory fee, which is subject to breakpoints) include breakpoints at $50 million and $100 million (subject to a minimum annual fee of $75,000), so that fees as a percentage of net assets decrease as assets in the Equity Fund increase. The Trustees concluded that economies of scale could be realized as the Fund grew, and that the fee schedule as specified was appropriate, and supported the continuance of the Subadvisory Agreement.
Based on a review of all factors deemed relevant, the Trustees, including the Independent Trustees, concluded that the Subadvisory Agreement should be continued for an additional one-year period.
34
Semi-Annual Report
INVESTMENT ADVISER AND ADMINISTRATOR
Green Century Capital Management, Inc.
114 State Street
Boston, MA 02109
1-800-93-GREEN
www.greencentury.com
info@greencentury.com
INVESTMENT SUBADVISER (Balanced Fund)
Trillium Asset Management, LLC
Two Financial Center
60 South Street, Suite 1100
Boston, MA 02111
INVESTMENT SUBADVISER (Equity Fund)
Northern Trust Investments, Inc.
50 South LaSalle Street
Chicago, IL 60603
SUBADMINISTRATOR and DISTRIBUTOR
UMB Fund Services, Inc. (Subadministrator)
UMB Distribution Services, LLC (Distributor)
235 West Galena Street
Milwaukee, WI 53212
CUSTODIAN
State Street Bank and Trust Company
State Street Financial Center
One Lincoln Street
Boston, MA 02111
TRANSFER AGENT
Huntington Asset Services, Inc.
2960 North Meridian Street, Suite 300
Indianapolis, IN 46208
INDEPENDENT REGISTERED PUBLIC ACCOUNTING FIRM
KPMG LLP
Two Financial Center
60 South Street
Boston, MA 02111
January 31, 2015
Balanced
Fund
| | | | |
An investment for your future. Printed on recycled paper with soy-based ink. | |
| Equity
Fund |
|
Item 2. Code of Ethics
Not applicable to semi-annual reports.
Item 3. Audit Committee Financial Expert
Not applicable to semi-annual reports.
Item 4. Principal Accountant Fees and Services
Not applicable to semi-annual reports.
Item 5. Audit Committee of Listed Registrants
Not applicable.
Item 6. Schedule of Investments
Included as part of the report to shareholders filed under item 1 of this Form N-CSR.
Item 7. Disclosure of Proxy Voting Policies and Procedures for Closed-End Management Investment Companies
Not applicable.
Item 8. Portfolio Managers of Closed-End Management Investment Companies
Not applicable.
Item 9. Purchases of Equity Securities by Closed-End Management Investment Company and Affiliated Purchasers
Not applicable.
Item 10. Submission of Matters to a Vote of Security Holders
There were no material changes to the procedures by which shareholders may recommend nominees to the registrant’s Board of Trustees.
Item 11. Controls and Procedures
| (a) | Based on an evaluation of the disclosure controls and procedures (as defined in Rule 30a-3(c) under the Investment Company Act of 1940, as amended, the “Disclosure Controls”) as of a date within 90 days of the filing date (the “Filing Date”) of this Form N-CSR (the “Report”), the registrant’s principal executive officer and principal financial officer have concluded that the Disclosure Controls are effectively designed to ensure that information that is required to be disclosed by the registrant in the Report is recorded, processed, summarized and reported within the time periods specified in the Securities and Exchange Commission’s rules and forms, including ensuring that information required to be disclosed in the Report is |
| | accumulated and communicated to the registrant’s management, including the registrant’s principal executive officer and principal financial officer, as appropriate to allow timely decisions regarding required disclosures. |
| (b) | There were no changes in the registrant’s internal controls over financial reporting (as defined in Rule 30a-3(d) under the Investment Company Act of 1940) that occurred during the fiscal period covered by this report that have materially affected, or are reasonably likely to materially affect, the registrant’s internal control over financial reporting. |
Item 12. Exhibits
| (2) | Certifications for each principal executive and principal financial officer as required by Rule 30a-2(a) under the Investment Company Act of 1940, as amended, (17 CFR 270.30a-2(a)) are filed herewith. |
| (b) | Certifications required by Rule 30a-2(b) under the Investment Company Act of 1940, as amended, (17 CFR 270.30a-2(b)) are filed herewith. |
SIGNATURES
Pursuant to the requirements of the Securities Exchange Act of 1934 and the Investment Company Act of 1940, the registrant has duly caused this report to be signed on its behalf by the undersigned, thereunto duly authorized.
Green Century Funds
|
/s/ Kristina A. Curtis |
| Kristina A. Curtis |
| President and Principal Executive Officer |
| April 9, 2015 |
Pursuant to the requirements of the Securities Exchange Act of 1934 and the Investment Company Act of 1940, this report has been signed below by the following persons on behalf of the registrant and in the capacities and on the dates indicated.
|
/s/ Kristina A. Curtis |
| Kristina A. Curtis |
| President and Principal Executive Officer |
| April 9, 2015 |
|
/s/ Kristina A. Curtis |
| Kristina A. Curtis |
| Treasurer and Principal Financial Officer |
| April 9, 2015 |