UNITED STATES
SECURITIES AND EXCHANGE COMMISSION
Washington, D.C. 20549
FORM N-CSR
CERTIFIED SHAREHOLDER REPORT OF REGISTERED
MANAGEMENT INVESTMENT COMPANIES
Investment Company Act File Number 811-06351
Green Century Funds
114 State Street
Suite 200
Boston, MA 02109
(Address of principal executive offices)
Green Century Capital Management, Inc.
114 State Street
Suite 200
Boston, MA 02109
(Name and address of agent for service)
Registrant’s telephone number, including area code: (617) 482-0800
Date of fiscal year end: July 31
Date of reporting period: July 31, 2017
| Item 1. | Reports to Stockholders |
The following is a copy of the report transmitted to shareholders pursuant to Rule 30e-1 under the Investment Company Act of 1940 (17 CFR 270.30e-1).
| | |
 | | ANNUAL REPORT Green Century Balanced Fund Green Century Equity Fund Green Century International Index Fund July 31, 2017 |
An investment for your future.®114 State Street, Boston, Massachusetts 02109
For information on the Green Century Funds®, call 1-800-93-GREEN. For information on how to open an account and account services, call 1-800-221-5519 8:00 am to 6:00 pm Eastern Time, Monday through Friday. For share price and account information, call 1-800-221-5519, twenty-four hours a day.
Dear Green Century Funds Shareholder:
The responsible investing movement that Green Century helped start over 25 years ago has grown significantly. One out of every five dollars of professionally managed assets in the U.S. is now invested with consideration of environmental, social and governance factors, according to the U.S. Forum for Sustainable and Responsible Investment (US SIF).1
Whether you are a long-time investor with Green Century or have recently started investing in our Funds, you are part of a movement that is being joined by investors around the globe every day. All of you have chosen to use the power of investing to create change and we are proud to be your partners in this endeavor.
Green Century’s three-pronged approach to sustainable investing offers you a way to make a difference in a way that no other environmentally or socially responsible mutual fund family can. In this Annual Report, we share some highlights from the past year on how you make a difference through your investments with Green Century.
Investing with Your Values
All of Green Century’s mutual funds avoid the most environmentally dangerous corporations and instead invest in companies with outstanding ratings on environmental, social and governance factors. Our newest Fund, the Green Century MSCI International Index Fund, extends our fossil fuel free offerings and provides a way for shareholders to invest in international environmental leaders, such as Vestas Wind Systems,2 the only global energy company dedicated exclusively to wind power. Vestas Wind System turbines account for 16% of global wind production, making it a worldwide leader in the effort to move away from dirty fossil fuels and adopt renewable energy sources for a safer and more sustainable future.
The Green Century International Index Fund provides shareholders the opportunity to invest in companies such as Vestas while diversifying your portfolio by choosing a Fund that invests in companies outside the U.S. The Fund will invest in companies chosen for their outstanding environmental, social and governance ratings in about 22 developed countries. Its ticker symbols are GCINX for the Fund’s Individual Investor Share Class and GCIFX for the Fund’s Institutional Share Class.
Leading Shareholder Advocacy Program
Even corporate sustainability leaders have room for improvement, which is why Green Century works with dozens of companies each year to improve their environmental policies, including the policies of companies in their supply chains. We believe that when companies protect the environment, the communities in which they operate, and public health, they may avoid brand and reputational damage, which can protect shareholder interests. Also, given the current rollback and attacks on our environmental laws, advances in company practices are a powerful force for positive change.
Through our Forest Protection Campaign, we are reducing carbon emissions, protecting habitats of endangered species and promoting sustainable agricultural practices in the growing of palm oil, soy and other key commodities. Green Century began this campaign five years ago and has helped transform the palm oil industry by working with the world’s largest palm oil producers and traders to stop burning down rainforests to create palm oil plantations. This summer, one of Green Century’s shareholder advocates, Kate Kroll, traveled to Jakarta to represent Green Century, the only U.S. investor invited to meet with the world’s biggest palm oil producers to ensure that their zero-deforestation agreements are being implemented in Southeast Asia. Kate is pictured below on a tour of a palm oil plantation owned by Wilmar,2 the world’s largest palm oil trader. Wilmar’s zero-deforestation palm oil policy will keep 1.5 gigatons of carbon pollution out of the air by 2020.

Supporting Environmental and Public Health Organizations
100 percent of the profits Green Century Capital Management earns managing our Funds support non-profit environmental and public health advocacy organizations. We do that through our unique ownership structure—Green Century Capital Management is the only mutual fund company founded and owned by
2
environmental non-profit organizations. Most recently these organizations, the Public Interest Research Groups, have been working to protect the effectiveness of life-saving antibiotics by convincing Subway2 and KFC2 to serve antibiotic free chicken.
Thank you for using your investments to make a difference and for choosing Green Century. We appreciate your support and are always here to answer your questions.
We also want to share more of the ways you are making an impact through our free online newsletter. You can sign up by visiting www.greencentury.com, emailing us at info@greencentury.com or calling us at 1-800-934-7336.
Respectfully,
Leslie Samuelrich, President
Green Century Capital Management
Green Century on the Web
E-News. For more regular updates on the Green Century Funds and on our advocacy efforts, please consider signing up for our e-newsletter. Call 1-800-934-7336, visit www.greencentury.com, or email info@greencentury.com.
Online Access. Information on your account is available on our website at www.greencentury.com. From the home page, click on Access My Account. Shareholders may also perform online transactions on the site. While there, please consider registering for e-delivery of your statements and other fund documents.
Twitter. Green Century is on Twitter. Follow us at Twitter.com/Green__Century for a sustainable investor’s perspective on critical issues.
The Green Century Funds’ proxy voting guidelines and a record of the Funds’ proxy votes for the year ended June 30, 2017 are available without charge, upon request, (i) at www.greencentury.com, (ii) by calling 1-800-934-7336, (iii) by sending an e-mail to info@greencentury.com, and (iv) on the Securities and Exchange Commission’s website at www.sec.gov.
The Green Century Funds file their complete schedule of portfolio holdings with the SEC for the first and third quarters of the year on Form N-Q. The Green Century Funds’ Forms N-Q are available on the EDGAR database on the SEC’s website at www.sec.gov. These Forms may also be reviewed and copied at the SEC’s Public Reference Room in Washington D.C. Information about the operation of the Public Reference Room may be obtained by calling 1-800-SEC-0330. The information on Form N-Q may also be obtained by calling us at 1-800-934-7336, or by e-mailing a request to info@greencentury.com.
3
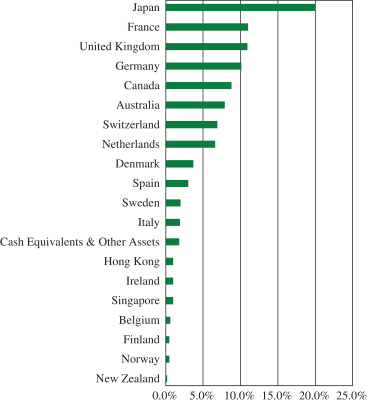
MANAGEMENT’S DISCUSSION OF FUND PERFORMANCE GREEN CENTURY MSCI INTERNATIONAL INDEX FUND
Investment Objective The Green Century MSCI International Index Fund (the International Fund or the Fund) seeks to achieve long-term total return that matches the performance of an index comprised of the stocks of foreign companies selected based on environmental, social and governance criteria.
Portfolio Orientation The Fund seeks to achieve its objective by investing in the stocks included in the MSCI World ex USA SRI ex Fossil Fuels Index3 (the Index), a custom index calculated by MSCI, Inc. The Index is comprised of the common stocks of the approximately 239 companies in the MSCI World ex USA SRI Index,4 minus the stocks of the companies that explore for, extract, process, refine or distribute coal, oil or gas. The Index also does not include companies that produce or transmit electricity derived from fossil fuels, transmit natural gas, or own carbon reserves.
The International Fund is the only responsible, diversified fossil fuel free international index fund available in the U.S. The Fund is also broadly diversified and responsibly screened. Like other index funds, the International Fund is not actively managed in the traditional investment sense, but rather seeks to be nearly fully invested at all times in a broad and diverse portfolio of stocks which meet certain environmental, social and governance criteria.
The Fund invests in the stocks of companies selected for inclusion in the Index based on a thorough review of environmental, social, and governance factors and includes those companies believed to have the best overall sustainability records. Green Century believes that certain industries impose unique and onerous risks and/or costs on society. Companies involved in these industries are evaluated based on their level of involvement as well as the impact of that involvement on society. Therefore, companies that derive significant revenues from the manufacture of tobacco products,
GREEN CENTURY MSCI INTERNATIONAL INDEX FUND
INVESTMENT BY COUNTRY (unaudited)
4
alcoholic beverages, genetically modified organisms (GMOs), or the operation of gambling enterprises; or have a significant direct ownership share in, operate or design nuclear power plants are not eligible for the Index. Major military contractors and firearms manufacturers are also ineligible. The Index excludes all companies that explore for, extract, produce, manufacture, or refine coal, oil or gas. The Index also does not include companies that produce or transmit electricity derived from fossil fuels, transmit natural gas, or own carbon reserves.
Investment Strategy and Performance Green Century believes that companies that minimize their negative social and environmental impact and follow governance standards could enjoy competitive advantages and be less likely to incur certain legal liabilities that may be assessed when a product or service is determined to be harmful. Green Century also believes that such investments may, over the long term, provide investors with a return that is competitive with enterprises that do not exhibit such social and environmental awareness.
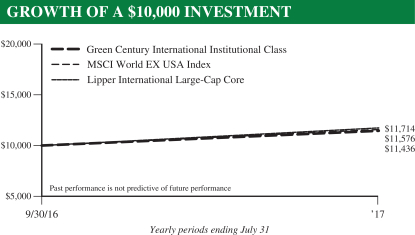
The International Fund’s total return for the calendar year to date ended July 31, 2017 was 17.75% for the individual share class and 17.91% for the institutional share class, while the MSCI World ex USA Index returned 16.18% for the same period. Additional results for various time periods are below:*
| | | | | | | | | | |
| | | | | CUMULATIVE RETURN* | |
| | | | | Inception Date:
September 30, 2016 | |
Green Century MSCI International Fund Total expense ratio: 1.28% for Individual Share Class and 0.98% for Institutional Share Class | | Calendar Year to
Date | | | Since
Inception | |
| June 30, 2017 | | Green Century MSCI International Index Fund — Individual Share Class | | | 14.11% | | | | 10.65% | |
| | | Green Century MSCI International Index Fund — Institutional Share Class | | | 14.26% | | | | 10.83% | |
| | | MSCI World ex USA Index | | | 12.82% | | | | 12.41% | |
| July 31, 2017 | | Green Century MSCI International Index Fund — Individual Share Class | | | 17.75% | | | | 14.18% | |
| | | Green Century MSCI International Index Fund — Institutional Share Class | | | 17.91% | | | | 14.36% | |
| | | MSCI World ex USA Index | | | 16.18% | | | | 15.76% | |
* The performance data quoted represents past performance and is not a guarantee of future results. Investment return and principal value of an investment will fluctuate so that an investor’s shares, when redeemed, may be worth more or less than their original cost. Current performance may be lower or higher than the performance information quoted. To obtain Fund prices and performance information as of the most recent month-end, call 1-800-93-GREEN/1-800-934-7336. Performance includes the reinvestment of income dividends and capital gains distributions. Performance shown does not reflect the deduction of taxes that a shareholder might pay on Fund distributions or the redemption of Fund shares. A redemption fee of 2.00% may be imposed on redemptions or exchanges of shares you have owned for 60 days or less. Please see the prospectus for more information.
For the fiscal period ended July 31, 2017, the International Fund’s performance relative to the MSCI World ex USA Index was hindered by stock selection in the Consumer Discretionary and Industrials sectors. The Fund also had relatively lower exposure to the stronger performing Materials and Information Technology sectors. In addition, the Fund was hurt by exposure to companies in France and the Netherlands.
The Fund’s performance was helped relative to the MSCI World ex USA Index because of its lower exposure to the Telecommunication Services and Health Care sectors, which were among the worst-performing sectors of the MSCI World ex USA Index during the period. The Fund was also helped by exposure to companies in Denmark, Singapore, and Switzerland.
For the calendar year to date period ended July 31, 2017, both share classes of the International Fund performed above the MSCI World ex USA Index, outperforming by more than 1.5%. As the MSCI World ex USA SRI ex Fossil Fuels Index does not include all of the stocks in the MSCI World ex USA Index, the
5
performance of the Fund can be expected to differ from the performance of its benchmark. The difference in performance of the International Fund relative to the Index was largely due to differences in sector allocation and stock selection criteria between the Fund and the Index.
According to the Fund’s subadvisor, global equity returns have remained strong during the first part of 2017, with growth oriented securities outpacing value securities. The economies within the global developed markets continue to improve with advances in German manufacturing production and Japanese industrial production and vehicle sales. To date, the economic improvements have not led to a significant increase in inflation or interest rates. These positive factors suggest the global economy is improving, which has lifted investor sentiment.
The International Fund, like many other mutual funds invested primarily in stocks, carries the risk of investing in the stock market. The large companies in which the International Fund is invested may perform worse than the stock market as a whole. The developed ex-U.S. equities in which the International Fund is invested may also perform worse than the stock market as a whole. Foreign securities are subject to additional risks such as currency fluctuations, regional economic and political conditions, differences in accounting methods, and other unique risks compared to investing in securities of U.S. issuers. The International Fund will not shift concentration from one industry to another or from stocks to bonds or cash, in order to defend against a falling stock market. The Fund’s environmental criteria limit the investments available to the Fund compared to mutual funds that do not use environmental criteria.

The MSCI World ex USA Index is a custom index calculated by MSCI Inc. The MSCI World ex USA Index includes large and mid-cap stocks across 22 of 23 Developed Markets (DM) countries and excludes the United States. With 1,023 constituents, the index covers approximately 85% of the free float-adjusted market capitalization in each country. The MSCI World ex USA Index is a free float-adjusted market capitalization index. Unlike the Fund, the MSCI World ex USA Index’s performance does not include management and other operating expenses. It is not possible to invest directly in an index.
6
MANAGEMENT’S DISCUSSION OF FUND PERFORMANCE
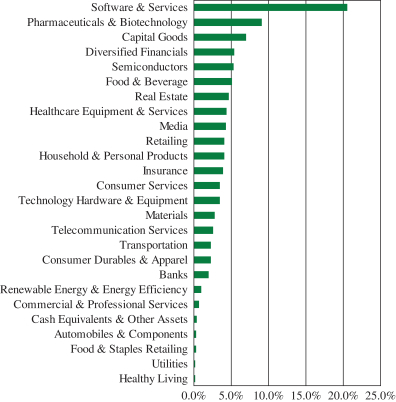
GREEN CENTURY EQUITY FUND
Investment Objective The Green Century Equity Fund (the Equity Fund or the Fund) seeks to achieve long-term total return that matches the performance of an index comprised of the stocks of companies selected based on environmental, social and governance criteria.
Portfolio Orientation The Fund seeks to achieve its objective by investing in the stocks which make up the MSCI KLD 400 Social ex Fossil Fuels Index5 (the KLD400 ex Fossil Fuels Index or the Index), a custom index calculated by MSCI, Inc. The KLD400 ex Fossil Fuels Index is comprised of the common stocks of the approximately 400 companies in the MSCI KLD 400 Social Index (the KLD400 Index), minus the stocks of the companies that explore for, extract, produce, manufacture, or refine coal, oil or gas that are included in
the KLD400 Index. The Index also does not include companies that produce or transmit electricity derived from fossil fuels, transmit natural gas, or own carbon reserves.
The KLD400 Index, formerly named the Domini 400 Social Index, is the longest-running socially responsible index. Like other index funds, the Equity Fund is not actively managed in the traditional investment sense, but rather seeks to be nearly fully invested at all times in a broad and diverse portfolio of stocks which meet certain environmental, social and governance criteria. The Equity Fund, like many other mutual funds invested primarily in stocks, carries the risk of investing in the stock market. The large companies in which the Equity Fund is invested may perform worse than the stock market as a whole. The Fund’s environmental criteria limit the investments available to the Fund compared to mutual funds that do not use environmental criteria.
The Fund invests in the stocks of companies selected for inclusion in
GREEN CENTURY EQUITY FUND
INVESTMENT BY INDUSTRY (unaudited)
7
the Index based on a thorough review of environmental, social, and governance factors and includes those companies believed to have the best overall sustainability records. Green Century believes that certain industries impose unique and onerous risks and/or costs on society. Companies involved in these industries are evaluated based on their level of involvement as well as the impact of that involvement on society. Therefore, companies that derive significant revenues from the manufacture of tobacco products, alcoholic beverages, genetically modified organisms (GMOs), or the operation of gambling enterprises; or have a significant direct ownership share in, operate or design nuclear power plants are not eligible for the Index. Major military contractors and firearms manufacturers are also ineligible. The Index excludes all companies that explore for, extract, produce, manufacture, or refine coal, oil or gas. The Index also does not include companies that produce or transmit electricity derived from fossil fuels, transmit natural gas, or own carbon reserves.
Investment Strategy and Performance Green Century believes that companies that minimize their negative social and environmental impact and follow governance standards could enjoy competitive advantages and be less likely to incur certain legal liabilities that may be assessed when a product or service is determined to be harmful. Green Century also believes that such investments may, over the long term, provide investors with a return that is competitive with enterprises that do not exhibit such social and environmental awareness.
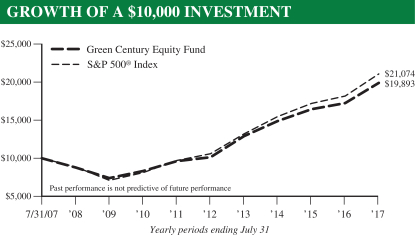
The Equity Fund’s total return calendar year to date for the period ended July 31, 2017 was 12.92%, while the S&P 500® Index6 returned 11.59% for the same period. Additional results for various time periods are below:*
| | | | | | | | | | | | | | | | | | |
Green Century Equity Fund Total expense ratio: 1.25% | | CUMULATIVE
RETURN* | | | AVERAGE ANNUAL RETURN* | |
| | Calendar Year to Date | | | One Year | | | Five Years | | | Ten Years | |
| June 30, 2017 | | Green Century Equity Fund | | | 10.51% | | | | 17.94% | | | | 14.10% | | | | 6.57% | |
| | | S&P 500® Index | | | 9.34% | | | | 17.90% | | | | 14.63% | | | | 7.18% | |
| July 31, 2017 | | Green Century Equity Fund | | | 12.92% | | | | 15.42% | | | | 14.45% | | | | 7.12% | |
| | | S&P 500® Index | | | 11.59% | | | | 16.04% | | | | 14.78% | | | | 7.74% | |
* The performance data quoted represents past performance and is not a guarantee of future results. Investment return and principal value of an investment will fluctuate so that an investor’s shares, when redeemed, may be worth more or less than their original cost. Current performance may be lower or higher than the performance information quoted. To obtain Fund prices and performance information as of the most recent month-end, call 1-800-93-GREEN/1-800-934-7336. Performance includes the reinvestment of income dividends and capital gains distributions. Performance shown does not reflect the deduction of taxes that a shareholder might pay on Fund distributions or the redemption of Fund shares. A redemption fee of 2.00% may be imposed on redemptions or exchanges of shares you have owned for 60 days or less. Please see the prospectus for more information. As of April 1, 2014, the Equity Fund invests in the common stocks which make up the MSCI KLD 400 Social ex Fossil Fuels Index; prior to April 1, 2014, the Fund invested in the common stocks which made up the MSCI KLD 400 Social Index.
For the year ended July 31, 2017, the performance of the Fund, relative to the S&P 500® Index, was most helped by not owning the low performing Energy sector. The relative performance of the Fund was also helped by the Fund’s stock selection within the Consumer Discretionary and Industrials sectors as well as its low exposure to the Utilities sector, owning only one water utility.
The strongest performing sectors in the Equity Fund and the S&P 500® Index for the year ended July 31, 2017 were Financials, Information Technology, and Industrials. The worst performing sectors in the Equity
8
Fund were Telecommunication Services, Real Estate, and Consumer Staples. In the S&P 500® Index, the Energy sector underperformed the Consumer Staples sector.
For the calendar year to date period ended July 31, 2017, the Equity Fund outperformed the S&P 500® Index by more than one percent. As the MSCI KLD 400 Social ex Fossil Fuels Index does not include all of the stocks in the S&P 500® Index and includes some stocks not included in the S&P 500® Index, the performance of the Fund can be expected to differ from the performance of the broader benchmark.
According to the Fund’s subadvisor, in the U.S., the first part of 2017 saw the S&P 500® Index reach all-time highs. Investors remained positive on the market despite numerous concerns: legislation delays on health care and tax overhaul bills, weak first quarter GDP (gross domestic product) numbers, and a 0.25% increase in interest rates. The Federal Reserve increased short-term rates by 25 basis points late in June, from 1.00% to 1.25%. The Federal Reserve’s projections still call for additional rate hikes in 2017 and 2018. Overall, economic data supported the market increases as industrial production continues to improve, inflation remains low, and unemployment declined to 4.3%.
The S&P 500® Index is an unmanaged index of 500 stocks. Similar to the Equity Fund, the S&P 500® Index’s performance reflects reinvestment of dividends and distributions. Unlike the Fund, however, the S&P 500® Index’s performance does not include management and other operating expenses. It is not possible to invest directly in an index.
9
MANAGEMENT’S DISCUSSION OF FUND PERFORMANCE
GREEN CENTURY BALANCED FUND
Investment Objective The Green Century Balanced Fund seeks capital growth and income from a diversified portfolio of stocks and bonds that meet Green Century’s standards for corporate environmental responsibility.
Portfolio Orientation As of the fiscal year ended July 31, 2017, the Green Century Balanced Fund (the Balanced Fund or the Fund) was diversified in a number of ways. Equity holdings represented 63.3% and bonds constituted 32.0% of the Fund’s net asset value. The Fund also held 0.1% of its net assets in community investment certificates of deposit and had 4.6% invested in cash, cash equivalents, and other assets, less liabilities. The Fund’s portfolio managers view equities as the primary source of potential long-term growth, while emphasizing the importance of diversification in seeking to lower volatility. The Fund’s equity holdings were diversified across 81 equity holdings at fiscal year-end, none of which
represented more than 2.6% of total net assets. Generally, larger, less-volatile companies constitute larger positions in the Fund’s portfolio than smaller companies. The portfolio managers seek to mitigate risk by investing primarily in companies they believe have demonstrated records of profitability, above-average growth prospects and reasonable valuations.
As of July 31st, the stocks held by the Balanced Fund were also diversified by industry, with (as a percent of total net assets) Software & Services (9.7%), Healthcare Equipment & Services (5.9%), and Banks (5.2%) as the largest sectors.
In line with its environmental mandate, the Fund had exposure to what Green Century considers environmental leaders in a number of industries including Healthy Living, Capital Goods and Transportation. Green Century’s environmental screens keep the Fund out of
GREEN CENTURY BALANCED FUND
INVESTMENT BY INDUSTRY (unaudited)
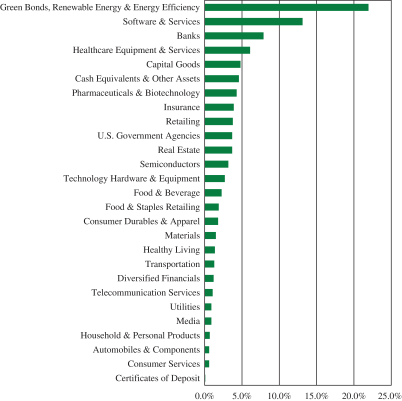
10
traditional Energy and Utility companies, while the Fund has broad exposure to Information Technology, Health Care, Financial, Consumer, and Industrial companies.
In addition to its equity exposure to environmental leaders, the Fund invests in designated Green Bonds. The issuers of Green Bonds have indicated that the proceeds from the bonds will be used for such environmentally positive goals as greenhouse gas reduction, climate adaptation, and climate change mitigation. As of July 31st, 18.6% of the total portfolio and 58.2% of the market value of the bonds held in the Fund were designated Green and Sustainability Bonds.
Higher quality, intermediate maturity bonds can typically lower volatility and provide a stable source of income. At fiscal year end, the Balanced Fund held 56 bonds diversified across corporate and government agency issuers. In an effort to dampen volatility, the weighted average maturity (3.85 years) and duration (3.35 years) remained in the intermediate-range. The weighted average yield to maturity was 2.08%. The Fund’s portfolio managers deem two of the current fixed income holdings, a Symantec2 4.2% bond due 9/15/2020 and an EMC2 1.875% bond due 6/1/2018 (now a subsidiary of Dell Corp.2), to be below investment grade, although both were above investment grade at the time of purchase. These two bonds comprised 1.00% of total portfolio assets as of July 31, 2017, and at this time the portfolio managers are comfortable continuing to hold them until maturity. All other fixed income holdings are either rated BBB- or higher by S&P, are backed by the U.S. government, or are issued by supra-national agencies with AAA equivalent ratings.
Economic Environment. According to the Fund’s subadvisor, eight years into the economic recovery following the financial crisis, the U.S. economy struggles to maintain growth over 2.5%. Inflation rates remain persistently below the Federal Reserve’s policy target of 2%. The unemployment rate has dropped to 4.3%, indicating that there is limited labor market slack. The November 2016 Presidential election led to widespread business and consumer expectations that the Trump administration would follow very pro-growth policies, including cutting taxes and reducing regulations. As a result, measures of both consumer confidence and business confidence increased, and the stock market rallied on the expectation of lower taxes and a faster-growing economy. While those expectations remain high, economic growth, consumer spending, and business investment have yet to expand, leaving economic growth below 2.5% and building in downside risk for the equity markets. The Fund’s portfolio managers anticipate that the Federal Reserve will continue to increase interest rates gradually, balancing its response to address both persistently low inflation rates and a tightening labor market. In this rising-rate environment, current valuations for U.S. stocks look more attractive than either bonds or cash. At the same time, stocks appear expensive relative to the persistently slow outlook for economic growth, and the Fund’s portfolio managers believe that current stock market valuations also present significant risks.
Investment Strategy and Performance. Green Century believes that strong environmental, social, and governance practices may enhance corporate profitability and reduce certain types of risks. We specifically avoid risks associated with exposure to fossil fuels. Green Century believes that companies with strong balance sheets, strategic leadership in their products and markets, and strong environmental, social, and governance policies will have the financial flexibility and leadership wisdom to navigate choppy and volatile economic conditions.
11
The Balanced Fund holds a number of stocks which the portfolio managers believe have attractive environmental, social, and financial characteristics. New holdings over the period include American Water Works,2 the largest and most geographically diverse publicly traded water and wastewater utility company in the U.S., as measured by both operating revenues and population served. The company provides drinking water, wastewater, and other related services to an estimated 15 million people in 47 states, D.C., and Ontario, Canada. Federal Realty Trust2 is a REIT (real estate investment trust) that was also added to the Balanced Fund. It has created a program focused on increased environmental sustainability called “Green Box,” designed to incorporate sustainable building practices into the redevelopments of existing properties as well as new construction projects.
The Fund holds over $41 million in Green and Sustainability Bonds and Notes, including notes issued by Bank of America,2 Export Import Bank of Korea,2 International Finance Corp.,2 International Bank for Reconstruction and Development (World Bank),2 Regency Centers LP,2 Vornado Realty,2 and Overseas Private Investment Corp.2
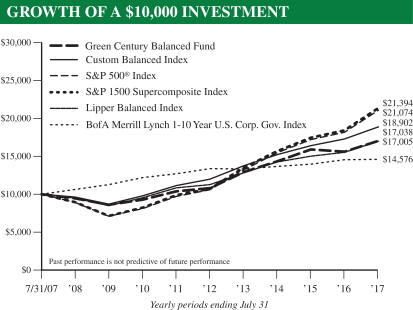
For the year ending July 31, 2017, the Balanced Fund’s return was 9.07%, slightly underperforming the 9.41% return for its Custom Balanced Index.7 The slight underperformance reflects the allocation of the Fund between stocks, bonds, and cash. In late September of 2016, the Fund’s portfolio managers moved to a slightly more cautious positioning, reflecting their belief that the level of risk in the equity market had risen. As a result, the Fund had a somewhat lower exposure to stocks at the time of the Presidential election, and did not fully participate in the sharp run-up in equity prices after the election. In the view of the Fund’s portfolio managers, valuations in the stock market continue to be high, and are not fully supported by underlying economic conditions; thus the portfolio managers have not increased the percentage allocation to stocks.
For the calendar year to date period ending July 31, 2017, the Balanced Fund’s returns were 8.19%, slightly outperforming the 7.40% of the Custom Balanced Index,7 an index comprised of the S&P 1500 Index8 (60% weighting) and of the BofA Merrill Lynch 1-10 Year US Corporate and Government Index9 (40% weighting).
| | | | | | | | | | | | | | | | | | |
Green Century Balanced Fund Total expense ratio: 1.48% | | CUMULATIVE
RETURN* | | | AVERAGE ANNUAL RETURN* | |
| | Calendar
Year to Date | | | One Year | | | Five Years | | | Ten Years | |
| June 30, 2017 | | Green Century Balanced Fund | | | 7.22% | | | | 12.45% | | | | 9.23% | | | | 5.09% | |
| | | Custom Balanced Index | | | 5.98% | | | | 10.52% | | | | 9.51% | | | | 6.26% | |
| July 31, 2017 | | Green Century Balanced Fund | | | 8.19% | | | | 9.07% | | | | 9.55% | | | | 5.47% | |
| | | Custom Balanced Index | | | 7.40% | | | | 9.41% | | | | 9.56% | | | | 6.58% | |
* The performance data quoted represents past performance and is not a guarantee of future results. Investment return and principal value of an investment will fluctuate so that an investor’s shares, when redeemed, may be worth more or less than their original cost. Current performance may be lower or higher than the performance information quoted. To obtain Fund prices and performance information as of the most recent month-end, call 1-800-93-GREEN/1-800-934-7336. Performance includes the reinvestment of income dividends and capital gain distributions. Performance shown does not reflect the deduction of taxes that a shareholder might pay on Fund distributions or the redemption of Fund shares. A redemption fee of 2.00% may be imposed on redemptions or exchanges of shares you have owned for 60 days or less. Please see the prospectus for more information.
12
A comparison of the Fund’s equity holdings to the S&P 1500 Supercomposite Index (the S&P 1500), which like the Fund includes stocks across a range of capitalizations, provides some insight into relative performance. For the fiscal year ended July 31, 2017, on a gross-of-fee basis, the stocks held by the Balanced Fund outperformed those included in the S&P 1500, 16.75% versus 16.00%.
The Fund’s outperformance relative to the equity market, as represented by the S&P 1500 Index returns, is primarily based on positioning the portfolio toward a slow to moderate growth economy with rising interest rates. During the past twelve months, performance attribution analysis provided by the Fund’s portfolio manager indicates that the Fund’s equity investments in the Financials and Health Care sectors were the largest contributors to the Fund’s outperformance relative to the S&P 1500. The Fund’s avoidance of fossil fuel energy investments also improved the Funds’ performance relative to the S&P 1500 Index returns.
The companies held in the portfolio that contributed most toward the Fund’s equity performance relative to the S&P 1500 included Autodesk,2 PNC Financial,2 KeyCorp,2 PayPal,2 and Lincoln National Corporation.2 Companies the Fund held that detracted most from performance relative to the S&P 1500 included Tractor Supply Company,2 Zimmer Biomet Holdings,2 United Natural Foods,2 Target,2 T J Maxx,2 and Acuity Brands.2
The fixed income portion of the portfolio continued to be managed with the goal of seeking to reduce risk and generating income for the Fund. For the one year ended July 31, 2017 gross of fees, the fixed income portion of the Fund’s portfolio returned 0.22%, above the Bank of America Merrill Lynch 1-10 Year U.S. Corporate Government Index return of 0.03% and the Barclays Government/Credit Intermediate Bond Index return of –0.03%.
The S&P 500® Index and the S&P Supercomposite 1500 Index (the S&P 1500 Index) are unmanaged indexes of 500 and 1500 stocks, respectively. The Custom Balanced Index is comprised of a 60% weighting in the S&P 1500 Index and a 40% weighting in the BofA Merrill Lynch 1-10 Year US Corporate & Government Index (the BofA Merrill Lynch Index). The BofA Merrill Lynch Index tracks the performance of U.S. dollar-denominated investment grade government and corporate public debt issued in the U.S. domestic bond market with at least 1 year and less than 10 years remaining maturity, including U.S. Treasury, U.S. Agency, foreign government, supranational and corporate securities. Similar to the Balanced Fund, the performance of the S&P 500® Index and the S&P 1500 Index, the Custom Balanced Index and the BofA Merrill Lynch Index reflect reinvestment of dividends and distributions. Unlike the Fund, however, the performance of the S&P 500® Index, the S&P 1500 Index, the Custom Balanced Index and the BofA Merrill Lynch Index does not include management and other operating expenses. It is not possible to invest directly in an index.
13
The Fund’s portfolio managers do not anticipate any significant changes in investment strategy for the Fund, believing that the investment environment may be favorable to the Fund’s core holdings in what the portfolio managers consider high-quality, environmentally responsible companies with strong growth prospects and reasonable valuations. In addition, the Fund’s portfolio managers anticipate that the U.S. will experience a rising interest-rate environment for at least the next twelve months, with short-term interest rates likely to rise slightly more than intermediate-term interest rates. In response, the Fund’s portfolio managers have slightly shortened the average maturity and duration of the portfolio, but do not anticipate shortening further at this time.
The Balanced Fund consistently includes stocks and bonds of what Green Century believes to be environmentally responsible corporations of various sizes, including small, medium, and large companies. The value of the stocks held in the Balanced Fund will fluctuate in response to factors that may affect the single issuer, industry, or sector of the economy or may affect the market as a whole. Bonds are subject to a variety of risks including interest rate, credit, and inflation risk. The Funds’ environmental criteria limit the investments available to the Funds compared to mutual funds that do not use environmental criteria.
1 http://www.ussif.org/sribasics
2 As of July 31, 2017, the following companies comprised the listed percentages of each of the Green Century Funds:
| | | | | | | | | | | | |
| Portfolio Holdings | | GREEN
CENTURY
INTERNATIONAL
INDEX FUND | | | GREEN
CENTURY
BALANCED
FUND | | | GREEN
CENTURY
EQUITY
FUND | |
Vestas Wind Systems | | | 0.69 | % | | | 0.00 | % | | | 0.00 | % |
Symantec Corporation | | | 0.00 | % | | | 0.70 | % | | | 0.21 | % |
Dell Technologies, Inc. | | | 0.00 | % | | | 0.00 | % | | | 0.15 | % |
American Water Works Company, Inc. | | | 0.00 | % | | | 0.86 | % | | | 0.16 | % |
Federal Realty Investment Trust | | | 0.00 | % | | | 0.57 | % | | | 0.11 | % |
Bank of America Corporation | | | 0.00 | % | | | 0.78 | % | | | 0.00 | % |
Export-Import Bank of Korea | | | 0.00 | % | | | 0.44 | % | | | 0.00 | % |
International Finance Corporation | | | 0.00 | % | | | 0.22 | % | | | 0.00 | % |
International Bank for Reconstruction and Development | | | 0.00 | % | | | 0.87 | % | | | 0.00 | % |
Regency Centers LP | | | 0.00 | % | | | 0.91 | % | | | 0.00 | % |
Vornado Realty LP | | | 0.00 | % | | | 0.89 | % | | | 0.15 | % |
| | | | | | | | | | | | |
| Portfolio Holdings | | GREEN
CENTURY
INTERNATIONAL
INDEX FUND | | | GREEN
CENTURY
BALANCED
FUND | | | GREEN
CENTURY
EQUITY
FUND | |
Overseas Private Investment Corporation | | | 0.00 | % | | | 0.58 | % | | | 0.00 | % |
Autodesk, Inc. | | | 0.00 | % | | | 1.18 | % | | | 0.24 | % |
PNC Financial Services Group, Inc. | | | 0.00 | % | | | 1.24 | % | | | 0.68 | % |
KeyCorp | | | 0.00 | % | | | 1.07 | % | | | 0.21 | % |
PayPal Holdings, Inc. | | | 0.00 | % | | | 1.31 | % | | | 0.00 | % |
Lincoln National Corporation | | | 0.00 | % | | | 0.87 | % | | | 0.00 | % |
Tractor Supply Company | | | 0.00 | % | | | 0.66 | % | | | 0.08 | % |
Zimmer Biomet Holdings, Inc. | | | 0.00 | % | | | 0.62 | % | | | 0.00 | % |
United Natural Foods, Inc. | | | 0.00 | % | | | 0.47 | % | | | 0.02 | % |
Target Corporation | | | 0.00 | % | | | 0.53 | % | | | 0.00 | % |
TJX Companies, Inc. | | | 0.00 | % | | | 0.80 | % | | | 0.00 | % |
Acuity Brands, Inc. | | | 0.00 | % | | | 0.43 | % | | | 0.10 | % |
Portfolio composition will change due to ongoing management of the Funds. Please refer to the Green Century Funds website for current information regarding the Funds’ portfolio holdings. Note that some of the holdings discussed above may not have been held by any Fund during the fiscal year ended July 31, 2017, or may have been held by a Fund for a portion of the fiscal year, or may have been held by a Fund for the entire fiscal year. These holdings are subject to risk as described in the Funds’ prospectus. References to specific investments should not be construed as a recommendation of the securities by the Funds, their administrator, or their distributor.
14
3 The World ex USA SRI ex Fossil Fuels Index is a custom index calculated by MSCI Inc. The World ex USA SRI ex Fossil Fuels Index is comprised of the common stocks of the companies in the MSCI World ex USA SRI Index (the World ex USA SRI Index), minus the stocks of the companies that explore for, extract, produce, manufacture or refine coal, oil or gas or produce or transmit electricity derived from fossil fuels or transmit natural gas or have carbon reserves that are included in the World ex USA SRI (Socially Responsible Investment) Index. The World ex USA SRI Index includes large and mid-cap stocks from approximately 22 developed markets countries (excluding the U.S.). The World ex USA SRI Index is a capitalization weighted index that provides exposure to companies with what MSCI calculates to have outstanding Environmental, Social and Governance (ESG) ratings and excludes companies whose products have negative social or environmental impacts. It is not possible to invest directly in an index.
4 The MSCI World ex USA Index is a custom index calculated by MSCI Inc. The MSCI World ex USA Index includes large and mid-cap stocks across 22 of 23 Developed Markets (DM) countries and excludes the United States. With 1,023 constituents, the index covers approximately 85% of the free float-adjusted market capitalization in each country. The MSCI World ex USA Index is a free float-adjusted market capitalization index. It is not possible to invest directly in the MSCI World ex USA Index.
5 The MSCI KLD 400 Social ex Fossil Fuels Index (the KLD400 ex Fossil Fuels Index) is a custom index calculated by MSCI Inc. The KLD400 ex Fossil Fuels Index is comprised of the common stocks of the approximately 400 companies in the MSCI KLD 400 Social Index (the KLD400 Index), minus the stocks of the companies that explore for, extract, produce, manufacture, or refine coal, oil or gas or produce or transmit electricity derived from fossil fuels or transmit natural gas or have carbon reserves that are included in the KLD400 Index. The KLD400 Index is a free float-adjusted market capitalization index designed to provide exposure to U.S. companies that have positive ESG characteristics and consists of approximately 400 companies selected from the MSCI USA Investable Market Index. It is not possible to invest directly in an index.
6 The S&P 500® Index is an unmanaged index of 500 selected common stocks, most of which are listed on the New York Stock Exchange. The S&P 500® Index is heavily weighted toward stocks with large market capitalization and represents approximately two-thirds of the total market value of all domestic stocks. It is not possible to invest directly in the S&P 500® Index.
7 The Custom Balanced Index is comprised of a 60% weighting in the S&P 1500 Index and a 40% weighting in the BofA Merrill Lynch 1-10 Year US Corporate & Government Index (the BofA Merrill Lynch Index).
8 The S&P Supercomposite 1500 Index is an unmanaged broad-based capitalization-weighted index comprising 1500 stocks of large-cap, mid-cap, and small-cap U.S. companies. It is not possible to invest directly in the S&P Supercomposite 1500 Index.
9 The BofA Merrill Lynch Index tracks the performance of U.S. dollar-denominated investment grade government and corporate public debt issued in the U.S. domestic bond market with at least 1 year and less than 10 years remaining maturity, including U.S. treasury, U.S. agency, foreign government, supranational and corporate securities. It is not possible to invest directly in the BofA Merrill Lynch Index.
Stocks will fluctuate in response to factors that may affect a single company, industry, sector, country, region or the market as a whole and may perform worse than the market. Foreign securities are subject to additional risks such as currency fluctuations, regional economic and political conditions, differences in accounting methods, and other unique risks compared to investing in securities of U.S. issuers. Bonds are subject to risks including interest rate, credit, and inflation. The Funds’ environmental criteria limit the investments available to the Funds compared to mutual funds that do not use environmental criteria.
This material must be preceded or accompanied by a current prospectus.
Distributor: UMB Distribution Services, LLC 9/17
Neither the Green Century Equity Fund nor the Green Century MSCI International Index Fund (each a “Fund” and together the “Funds”) is sponsored, endorsed, or promoted by MSCI, its affiliates, information providers or any other third party involved in, or related to, compiling, computing or creating the MSCI indices (the “MSCI Parties”), and the MSCI Parties bear no liability with respect to a Fund or any index on which a Fund is based. The MSCI Parties are not sponsors of either of the Funds and are not affiliated with the Funds in any way. The Statement of Additional Information contains a more detailed description of the limited relationship the MSCI Parties have with Green Century Capital Management and the Funds.
15
GREEN CENTURY FUNDS EXPENSE EXAMPLE
For the six months ended July 31, 2017 (unaudited)
As a shareholder of the Green Century Funds (the “Funds”), you incur two types of costs: (1) transaction costs, including redemption fees on certain redemptions; and (2) ongoing costs, including management fees and other Fund expenses. This example is intended to help you understand your ongoing costs (in dollars) of investing in the Funds and to compare these costs with the ongoing costs of investing in other mutual funds.
The example is based on an investment of $1,000 invested at the beginning of the period and held for the entire period from February 1, 2017 to July 31, 2017 (the “period”).
Actual Expenses The first line of the table below provides information about actual account values and actual expenses. You may use the information in this line, together with the amount you invested, to estimate the expenses you paid over the period. Simply divide your account value by $1,000 (for example, an $8,600 account value divided by $1,000 equals 8.6), then multiply the result by the number in the first line under the heading entitled “Expenses Paid During the Period” to estimate the expenses you paid on your account during the period.
Hypothetical Example for Comparison Purposes The second line of the table below provides information about hypothetical account values and hypothetical expenses based on the Funds’ actual expense ratios and an assumed rate of return of 5% per year before expenses, which is not the actual return of either of the Funds. The hypothetical account values and expenses may not be used to estimate the actual ending account balance or expenses you paid for the period. You may use this information to compare the ongoing costs of investing in the Funds and other funds. To do so, compare this 5% hypothetical example with the 5% hypothetical examples that appear in the shareholder reports of other funds.
Please note that the expenses shown in the table are meant to highlight your ongoing costs only and do not reflect any transactional costs, such as redemption fees on shares held for 60 days or less. Therefore, the second line of the table is useful in comparing the ongoing costs only, and will not help you determine the relative total costs of owning different funds. In addition, if these transactional costs were included, your costs could have been higher.
| | | | | | | | | | | | |
| | | BEGINNING
ACCOUNT VALUE
FEBRUARY 1, 2017 | | | ENDING
ACCOUNT VALUE
JULY 31, 2017 | | | EXPENSES
PAID DURING
THE PERIOD1 | |
Balanced Fund | | | | | | | | | | | | |
Actual Expenses | | $ | 1,000.00 | | | $ | 1,067.50 | | | $ | 7.59 | |
Hypothetical Example, assuming a 5% return before expenses | | | 1,000.00 | | | | 1,017.66 | | | | 7.40 | |
| | | |
Equity Fund | | | | | | | | | | | | |
Actual Expenses | | | 1,000.00 | | | | 1,099.90 | | | | 6.51 | |
Hypothetical Example, assuming a 5% return before expenses | | | 1,000.00 | | | | 1,018.80 | | | | 6.26 | |
16
| | | | | | | | | | | | |
| | | BEGINNING
ACCOUNT VALUE
FEBRUARY 1, 2017 | | | ENDING
ACCOUNT VALUE
JULY 31, 2017 | | | EXPENSES
PAID DURING
THE PERIOD1 | |
International Index Fund | | | | | | | | | | | | |
Actual Expenses — Individual Investor Class | | $ | 1,000.00 | | | $ | 1,146.70 | | | $ | 6.81 | |
Actual Expenses — Institutional Class | | | 1,000.00 | | | | 1,148.20 | | | | 5.22 | |
Hypothetical Example, assuming a 5% return before expenses
— Individual Investor Class | | | 1,000.00 | | | | 1,018.65 | | | | 6.41 | |
Hypothetical Example, assuming a 5% return before expenses
— Institutional Class | | | 1,000.00 | | | | 1,020.14 | | | | 4.91 | |
1 Expenses are equal to the Funds’ annualized expense ratios (1.48% for the Balanced Fund, 1.25% for the Equity Fund, 1.28% for the International Index Fund Individual Investor Class and 0.98% for the International Index Fund Institutional Class), multiplied by the average account value over the period, multiplied by 181/365 (to reflect the one-half year period).
17
| | |
GREEN CENTURY BALANCED FUND PORTFOLIO OF INVESTMENTS July 31, 2017 | | |
| | | | | | | | |
COMMON STOCKS — 63.3% | | | | | | | | |
| | | SHARES | | | VALUE | |
Software & Services — 9.7% | | | | | |
Adobe Systems, Inc. (a) | | | 6,573 | | | $ | 962,879 | |
Alphabet, Inc., Class A (a) | | | 6,261 | | | | 5,919,775 | |
ANSYS, Inc. (a) | | | 19,510 | | | | 2,527,521 | |
Autodesk, Inc. (a) | | | 24,032 | | | | 2,662,505 | |
Facebook, Inc., Class A (a) | | | 9,840 | | | | 1,665,420 | |
MasterCard, Inc., Class A | | | 19,606 | | | | 2,505,647 | |
Microsoft Corporation | | | 37,870 | | | | 2,753,149 | |
PayPal Holdings, Inc. (a) | | | 50,348 | | | | 2,947,875 | |
| | | | | | | | |
| | | | 21,944,771 | |
| | | | | | | | |
Healthcare Equipment & Services — 5.9% | |
Cardinal Health, Inc. | | | 18,034 | | | | 1,393,307 | |
Cigna Corporation | | | 22,049 | | | | 3,826,824 | |
Edwards Lifesciences Corporation (a) | | | 13,372 | | | | 1,540,187 | |
Hologic, Inc. (a) | | | 53,946 | | | | 2,384,953 | |
Medtronic PLC (b) | | | 14,550 | | | | 1,221,764 | |
Quest Diagnostics, Inc. | | | 13,466 | | | | 1,458,502 | |
Zimmer Biomet Holdings, Inc. | | | 11,441 | | | | 1,388,022 | |
| | | | | | | | |
| | | | 13,213,559 | |
| | | | | | | | |
Banks — 5.2% | | | | | | | | |
East West Bancorp, Inc. | | | 22,236 | | | | 1,267,007 | |
Fifth Third Bancorp | | | 57,295 | | | | 1,529,777 | |
First Republic Bank | | | 22,973 | | | | 2,304,881 | |
KeyCorp | | | 133,909 | | | | 2,415,718 | |
PNC Financial Services Group, Inc. (The) | | | 21,808 | | | | 2,808,871 | |
Umpqua Holdings Corporation | | | 71,619 | | | | 1,327,816 | |
| | | | | | | | |
| | | | 11,654,070 | |
| | | | | | | | |
Capital Goods — 4.8% | | | | | | | | |
A.O. Smith Corporation | | | 25,088 | | | | 1,343,463 | |
Hexcel Corporation | | | 37,314 | | | | 1,909,357 | |
Illinois Tool Works, Inc. | | | 19,517 | | | | 2,746,237 | |
Middleby Corporation (The) (a) | | | 7,137 | | | | 932,663 | |
Wabtec Corporation | | | 27,176 | | | | 2,047,983 | |
Xylem, Inc. | | | 33,464 | | | | 1,898,413 | |
| | | | | | | | |
| | | | 10,878,116 | |
| | | | | | | | |
Insurance — 3.9% | | | | | | | | |
Aflac, Inc. | | | 28,391 | | | | 2,264,182 | |
Chubb Ltd. (b) | | | 15,375 | | | | 2,251,823 | |
Lincoln National Corporation | | | 26,948 | | | | 1,968,821 | |
Reinsurance Group of America, Inc. | | | 16,034 | | | | 2,247,967 | |
| | | | | | | | |
| | | | 8,732,793 | |
| | | | | | | | |
| | | | | | | | |
| | | SHARES | | | VALUE | |
Retailing — 3.8% | | | | | | | | |
Home Depot, Inc. (The) | | | 13,443 | | | $ | 2,011,073 | |
Priceline Group, Inc. (The) (a) | | | 968 | | | | 1,963,588 | |
Target Corporation | | | 21,122 | | | | 1,196,984 | |
TJX Companies, Inc. (The) | | | 25,802 | | | | 1,814,138 | |
Tractor Supply Company | | | 26,359 | | | | 1,479,267 | |
| | | | | | | | |
| | | | 8,465,050 | |
| | | | | | | | |
Pharmaceuticals & Biotechnology — 3.5% | |
Biogen, Inc. (a) | | | 3,742 | | | | 1,083,646 | |
Celgene Corporation (a) | | | 10,135 | | | | 1,372,380 | |
Merck & Company, Inc. | | | 55,816 | | | | 3,565,526 | |
Novartis A.G. American Depositary Receipt (b) | | | 22,065 | | | | 1,879,938 | |
| | | | | | | | |
| | | | | | | 7,901,490 | |
| | | | | | | | |
Renewable Energy & Energy Efficiency — 3.3% | |
8point3 Energy Partners LP | | | 96,278 | | | | 1,420,101 | |
Acuity Brands, Inc. | | | 4,829 | | | | 978,597 | |
EnerNOC, Inc. (a) | | | 45,945 | | | | 351,479 | |
First Solar, Inc. (a) | | | 16,509 | | | | 814,059 | |
Hannon Armstrong Sustainable Infrastructure Capital, Inc. | | | 53,040 | | | | 1,233,180 | |
Johnson Controls International, PLC | | | 28,702 | | | | 1,117,943 | |
Ormat Technologies, Inc. | | | 26,328 | | | | 1,561,250 | |
| | | | | | | | |
| | | | | | | 7,476,609 | |
| | | | | | | | |
Real Estate — 3.2% | | | | | | | | |
AvalonBay Communities, Inc. | | | 10,785 | | | | 2,074,495 | |
Federal Realty Investment Trust | | | 9,754 | | | | 1,293,673 | |
Forest City Realty Trust, Inc., Class A | | | 42,047 | | | | 1,025,106 | |
HCP, Inc. | | | 48,042 | | | | 1,520,529 | |
SBA Communications Corporation, Class A (a) | | | 9,695 | | | | 1,333,547 | |
| | | | | | | | |
| | | | | | | 7,247,350 | |
| | | | | | | | |
Semiconductors — 3.2% | | | | | | | | |
Analog Devices, Inc. | | | 28,893 | | | | 2,282,836 | |
ASML Holding NV (b) | | | 10,141 | | | | 1,524,496 | |
NXP Semiconductors NV (a)(b) | | | 11,145 | | | | 1,229,628 | |
Xilinx, Inc. | | | 34,708 | | | | 2,195,628 | |
| | | | | | | | |
| | | | | | | 7,232,588 | |
| | | | | | | | |
18
| | |
GREEN CENTURY BALANCED FUND PORTFOLIO OF INVESTMENTS July 31, 2017 | | continued |
| | | | | | | | |
| | | SHARES | | | VALUE | |
Technology Hardware & Equipment — 2.4% | |
Cisco Systems, Inc. | | | 66,227 | | | $ | 2,082,839 | |
F5 Networks, Inc. (a) | | | 12,973 | | | | 1,566,490 | |
Palo Alto Networks, Inc. (a) | | | 13,944 | | | | 1,837,540 | |
| | | | | | | | |
| | | | | | | 5,486,869 | |
| | | | | | | | |
Food & Beverage — 2.3% | | | | | | | | |
General Mills, Inc. | | | 300 | | | | 16,698 | |
McCormick & Company, Inc. | | | 16,261 | | | | 1,549,673 | |
Unilever NV (b) | | | 62,545 | | | | 3,638,243 | |
| | | | | | | | |
| | | | | | | 5,204,614 | |
| | | | | | | | |
Consumer Durables & Apparel — 1.8% | | | | | |
Newell Brands, Inc. | | | 33,175 | | | | 1,748,986 | |
NIKE, Inc., Class B | | | 19,253 | | | | 1,136,890 | |
VF Corporation | | | 19,571 | | | | 1,217,120 | |
| | | | | | | | |
| | | | | | | 4,102,996 | |
| | | | | | | | |
Food & Staples Retailing — 1.7% | | | | | |
Costco Wholesale Corporation | | | 15,608 | | | | 2,474,024 | |
CVS Health Corporation | | | 17,093 | | | | 1,366,244 | |
| | | | | | | | |
| | | | | | | 3,840,268 | |
| | | | | | | | |
Materials — 1.5% | | | | | | | | |
Ball Corporation | | | 25,182 | | | | 1,055,126 | |
International Flavors & Fragrances, Inc. | | | 9,107 | | | | 1,212,870 | |
Sealed Air Corporation | | | 27,148 | | | | 1,181,210 | |
| | | | | | | | |
| | | | | | | 3,449,206 | |
| | | | | | | | |
Transportation — 1.3% | | | | | | | | |
J.B. Hunt Transport Services, Inc. | | | 15,309 | | | | 1,388,679 | |
United Parcel Service, Inc., Class B | | | 14,085 | | | | 1,553,435 | |
| | | | | | | | |
| | | | | | | 2,942,114 | |
| | | | | | | | |
Healthy Living — 1.1% | | | | | | | | |
United Natural Foods, Inc. (a) | | | 27,516 | | | | 1,060,191 | |
Whole Foods Market, Inc. | | | 35,284 | | | | 1,473,460 | |
| | | | | | | | |
| | | | | | | 2,533,651 | |
| | | | | | | | |
Utilities — 0.9% | | | | | | | | |
American Water Works Company, Inc. | | | 23,952 | | | | 1,942,507 | |
| | | | | | | | |
Diversified Financials — 0.7% | | | | | |
Charles Schwab Corporation (The) | | | 38,304 | | | | 1,643,242 | |
| | | | | | | | |
| | | | | | | | |
| | | SHARES | | | VALUE | |
Telecommunication Services — 0.7% | |
Verizon Communications, Inc. | | | 31,835 | | | $ | 1,540,814 | |
| | | | | | | | |
Household & Personal Products — 0.7% | |
Church & Dwight Company, Inc. | | | 28,772 | | | | 1,534,986 | |
| | | | | | | | |
Automobiles & Components — 0.6% | | | | | |
BorgWarner, Inc. | | | 29,100 | | | | 1,360,134 | |
| | | | | | | | |
Consumer Services — 0.6% | | | | | |
Starbucks Corporation | | | 24,912 | | | | 1,344,750 | |
| | | | | | | | |
Media — 0.5% | | | | | | | | |
Omnicom Group, Inc. | | | 15,070 | | | | 1,186,612 | |
| | | | | | | | |
Total Common Stocks
(Cost $108,516,579) | | | | | | | 142,859,159 | |
| | | | | | | | |
| | | PRINCIPAL
AMOUNT | | | | |
BONDS & NOTES — 32.0% | | | | | |
Green and Sustainability Bonds, Renewable Energy & Energy Efficiency — 18.6% | |
Apple, Inc.
2.85%, due 2/23/23 | | $ | 2,000,000 | | | | 2,052,284 | |
Apple, Inc.
3.00%, due 6/20/27 | | | 1,000,000 | | | | 997,801 | |
Asian Development Bank
2.125%, due 3/19/25 (b) | | | 1,000,000 | | | | 987,232 | |
Bank of America Corporation
2.151%, due 11/9/20 | | | 1,750,000 | | | | 1,749,667 | |
Digital Realty Trust LP
3.95%, due 7/1/22 | | | 2,000,000 | | | | 2,111,508 | |
European Bank for Reconstruction & Development
0.875%, due 7/22/19 (b) | | | 1,500,000 | | | | 1,476,444 | |
European Investment Bank
2.50%, due 10/15/24 (b) | | | 2,000,000 | | | | 2,031,010 | |
European Investment Bank
2.125%, due 4/13/26 (b) | | | 500,000 | | | | 488,668 | |
Export-Import Bank of Korea
1.75%, due 2/27/18 (b) | | | 1,000,000 | | | | 999,667 | |
International Bank for Reconstruction & Development
2.125%, due 3/3/25 (b) | | | 2,000,000 | | | | 1,972,766 | |
International Finance Corporation
2.125%, due 4/7/26 (b) | | | 500,000 | | | | 489,406 | |
19
| | |
GREEN CENTURY BALANCED FUND PORTFOLIO OF INVESTMENTS July 31, 2017 | | continued |
| | | | | | | | |
| | | PRINCIPAL
AMOUNT | | | VALUE | |
Green and Sustainability Bonds, Renewable Energy & Energy Efficiency — (continued) | |
Kommunalbanken AS
1.375%, due 10/26/20 (b)(c) | | $ | 2,000,000 | | | $ | 1,974,358 | |
Kommuninvest I Sverige AB
1.50%, due 4/23/19 (b)(c) | | | 1,000,000 | | | | 999,531 | |
Korea Development Bank (The)
2.027%, due 7/6/22 (b)(d) | | | 1,250,000 | | | | 1,249,975 | |
Kreditanstalt fuer Wiederaufbau
1.75%, due 10/15/19 (b) | | | 3,000,000 | | | | 3,012,396 | |
Kreditanstalt fuer Wiederaufbau
2.00%, due 11/30/21 (b) | | | 1,000,000 | | | | 1,004,187 | |
Local Initiatives Support Corporation
3.782%, due 3/1/27 | | | 2,000,000 | | | | 2,046,568 | |
Morgan Stanley
2.20%, due 12/7/18 | | | 3,000,000 | | | | 3,017,106 | |
Nederlandse Waterschapsbank NV
2.375%, due 3/24/26 (b)(c) | | | 1,000,000 | | | | 985,038 | |
Nordic Investment Bank
2.25%, due 9/30/21 (b) | | | 1,500,000 | | | | 1,521,633 | |
Overseas Private Investment Corporation
3.28%, due 9/15/29 | | | 797,046 | | | | 818,551 | |
Overseas Private Investment Corporation
3.33%, due 5/15/33 | | | 234,742 | | | | 239,176 | |
Overseas Private Investment Corporation
3.43%, due 6/1/33 | | | 236,412 | | | | 243,090 | |
Regency Centers LP
3.75%, due 6/15/24 | | | 2,000,000 | | | | 2,046,434 | |
Starbucks Corporation
2.45%, due 6/15/26 | | | 2,000,000 | | | | 1,934,638 | |
Sumitomo Mitsui Banking Corporation
2.45%, due 10/20/20 (b) | | | 2,000,000 | | | | 2,012,984 | |
Svensk Exportkredit AB
1.875%, due 6/23/20 (b) | | | 1,500,000 | | | | 1,506,318 | |
Vornado Realty LP
2.50%, due 6/30/19 | | | 2,000,000 | | | | 2,019,078 | |
| | | | | | | | |
| | | | | | | 41,987,514 | |
| | | | | | | | |
| | | | | | | | |
| | | PRINCIPAL
AMOUNT | | | VALUE | |
U.S. Government Agencies — 3.7% | | | | | |
Fannie Mae Pool
1.76%, due 7/1/23 | | $ | 460,342 | | | $ | 459,395 | |
Federal Farm Credit Bank
1.80%, due 6/15/20 | | | 200,000 | | | | 201,251 | |
Federal Farm Credit Bank
2.26%, due 11/13/24 | | | 500,000 | | | | 488,159 | |
Federal Home Loan Bank
3.875%, due 12/14/18 | | | 550,000 | | | | 569,087 | |
Federal Home Loan Bank
1.25%, due 1/16/19 | | | 3,000,000 | | | | 2,996,430 | |
Federal Home Loan Mortgage Corporation
3.75%, due 3/27/19 | | | 500,000 | | | | 519,586 | |
Federal Home Loan Mortgage Corporation
0.00%, due 11/29/19 | | | 200,000 | | | | 192,019 | |
Federal National Mortgage Association
1.70%, due 1/27/20 | | | 3,000,000 | | | | 3,000,024 | |
| | | | | | | | |
| | | | | | | 8,425,951 | |
| | | | | | | | |
Software & Services — 3.4% | | | | | |
International Business Machines Corporation
8.375%, due 11/1/19 | | | 500,000 | | | | 572,607 | |
Microsoft Corporation
1.10%, due 8/8/19 | | | 3,000,000 | | | | 2,976,528 | |
Oracle Corporation
1.20%, due 10/15/17 | | | 500,000 | | | | 499,827 | |
Oracle Corporation
5.00%, due 7/8/19 | | | 1,000,000 | | | | 1,064,792 | |
Oracle Corporation
2.50%, due 5/15/22 | | | 1,000,000 | | | | 1,014,698 | |
Symantec Corporation
4.20%, due 9/15/20 | | | 1,500,000 | | | | 1,586,250 | |
| | | | | | | | |
| | | | | | | 7,714,702 | |
| | | | | | | | |
Banks — 2.8% | | | | | | | | |
HSBC Bank USA N.A.
6.00%, due 8/9/17 | | | 500,000 | | | | 500,387 | |
HSBC Holdings PLC
5.10%, due 4/5/21 (b) | | | 1,500,000 | | | | 1,639,741 | |
JPMorgan Chase & Company
4.40%, due 7/22/20 | | | 1,000,000 | | | | 1,066,913 | |
U.S. Bancorp
1.95%, due 11/15/18 | | | 3,000,000 | | | | 3,016,770 | |
| | | | | | | | |
| | | | | | | 6,223,811 | |
| | | | | | | | |
20
| | |
GREEN CENTURY BALANCED FUND PORTFOLIO OF INVESTMENTS July 31, 2017 | | concluded |
| | | | | | | | |
| | | PRINCIPAL
AMOUNT | | | VALUE | |
Pharmaceuticals & Biotechnology — 0.8% | |
Amgen, Inc.
5.70%, due 2/1/19 | | $ | 1,250,000 | | | $ | 1,323,925 | |
Thermo Fisher Scientific, Inc.
2.40%, due 2/1/19 | | | 500,000 | | | | 504,244 | |
| | | | | | | | |
| | | | | | | 1,828,169 | |
| | | | | | | | |
Diversified Financials — 0.5% | | | | | |
Bank of New York Mellon Corporation (The)
3.55%, due 9/23/21 | | | 1,000,000 | | | | 1,049,962 | |
| | | | | | | | |
Real Estate — 0.5% | | | | | | | | |
HCP, Inc.
3.875%, due 8/15/24 | | | 1,000,000 | | | | 1,035,426 | |
| | | | | | | | |
Telecommunication Services — 0.4% | | | | | |
America Movil SAB de C.V.
5.00%, due 10/16/19 (b) | | | 750,000 | | | | 804,538 | |
| | | | | | | | |
Media — 0.3% | | | | | | | | |
Discovery Communications LLC
5.625%, due 8/15/19 | | | 705,000 | | | | 752,987 | |
| | | | | | | | |
Technology Hardware & Equipment — 0.3% | |
EMC Corporation
1.875%, due 6/1/18 | | | 700,000 | | | | 697,591 | |
| | | | | | | | |
Healthy Living — 0.3% | | | | | | | | |
Whole Foods Market, Inc.
5.20%, due 12/3/25 (c) | | | 500,000 | | | | 576,554 | |
| | | | | | | | |
Food & Staples Retailing — 0.2% | | | | | |
CVS Health Corporation
2.25%, due 12/5/18 | | | 500,000 | | | | 503,555 | |
| | | | | | | | |
Healthcare Equipment & Services — 0.2% | |
Stryker Corporation
1.30%, due 4/1/18 | | | 500,000 | | | | 499,289 | |
| | | | | | | | |
Total Bonds & Notes
(Cost $71,476,874) | | | | | | | 72,100,049 | |
| | | | | | | | |
CERTIFICATES OF DEPOSIT — 0.1% | | | | | |
Self-Help Credit Union
1.30%, due 6/21/19 | | | 95,000 | | | | 94,272 | |
Self-Help Federal Credit Union
1.40%, due 3/17/20 | | | 240,000 | | | | 237,791 | |
| | | | | | | | |
Total Certificates Of Deposit
(Cost $335,000) | | | | | | | 332,063 | |
| | | | | | | | |
| | | | | | | | |
SHORT-TERM INVESTMENT — 4.6% | |
| | | | | | VALUE | |
UMB Money Market Fiduciary
Account , 0.01% (e)
(Cost $10,401,526) | | | | | | $ | 10,401,526 | |
| | | | | | | | |
Total Short-term Investments
(Cost $10,401,526) | | | | | | | 10,401,526 | |
| | | | | | | | |
TOTAL INVESTMENTS (f) — 100.0% | |
(Cost $190,729,979) | | | | | | | 225,692,797 | |
Liabilities Less Other Assets — 0.0% | | | | | | | (22,868 | ) |
| | | | | | | | |
NET ASSETS — 100.0% | | | | | | $ | 225,669,929 | |
| | | | | | | | |
| (a) | Non-income producing security. |
| (b) | Securities whose values are determined or significantly influenced by trading in markets other than the United States or Canada. |
| (c) | Security exempt from registration under Rule 144A of the Securities Act of 1933. These securities are restricted and may be resold in transactions exempt from registration normally to qualified institutional buyers. The total value of these securities is $4,535,481. |
| (d) | Floating rate bond. Rate shown is currently in effect at July 31, 2017. |
| (e) | The rate quoted is the annualized seven-day yield of the fund at the period end. |
| (f) | The cost of investments for federal income tax purposes is $190,373,269 resulting in gross unrealized appreciation and depreciation of $38,963,251 and $3,643,723 respectively, or net unrealized appreciation of $35,319,528. |
See Notes to Financial Statements
21
| | |
GREEN CENTURY EQUITY FUND PORTFOLIO OF INVESTMENTS July 31, 2017 | | |
| | | | | | | | |
COMMON STOCKS — 99.6% | |
| | | SHARES | | | VALUE | |
Software & Services — 20.5% | |
Accenture PLC, Class A (a) | | | 14,082 | | | $ | 1,814,043 | |
Adobe Systems, Inc. (b) | | | 11,171 | | | | 1,636,440 | |
Alphabet, Inc., Class A (b) | | | 6,720 | | | | 6,353,760 | |
Alphabet, Inc., Class C (b) | | | 7,062 | | | | 6,571,191 | |
ANSYS, Inc. (b) | | | 1,913 | | | | 247,829 | |
Autodesk, Inc. (b) | | | 4,540 | | | | 502,987 | |
Automatic Data Processing, Inc. | | | 10,156 | | | | 1,207,650 | |
CA, Inc. | | | 7,152 | | | | 221,998 | |
Cadence Design Systems, Inc. (b) | | | 6,379 | | | | 235,385 | |
Citrix Systems, Inc. (b) | | | 3,557 | | | | 280,932 | |
Cognizant Technology Solutions Corporation, Class A | | | 13,723 | | | | 951,278 | |
Convergys Corporation | | | 2,036 | | | | 48,803 | |
Dell Technologies, Inc. Class V (b) | | | 4,858 | | | | 312,224 | |
FleetCor Technologies, Inc. (b) | | | 2,063 | | | | 313,700 | |
Fortinet, Inc. (b) | | | 3,379 | | | | 124,719 | |
International Business Machines Corporation | | | 20,429 | | | | 2,955,463 | |
Intuit, Inc. | | | 5,507 | | | | 755,615 | |
Microsoft Corporation | | | 166,022 | | | | 12,069,799 | |
Oracle Corporation | | | 69,588 | | | | 3,474,529 | |
salesforce.com, Inc. (b) | | | 14,975 | | | | 1,359,730 | |
Symantec Corporation | | | 14,014 | | | | 434,294 | |
Teradata Corporation (b) | | | 2,941 | | | | 93,583 | |
Western Union Company (The) | | | 11,032 | | | | 217,882 | |
Workday, Inc., Class A (b) | | | 2,811 | | | | 287,031 | |
| | | | | | | | |
| | | | 42,470,865 | |
| | | | | | | | |
Pharmaceuticals & Biotechnology — 9.1% | |
Agilent Technologies, Inc. | | | 7,289 | | | | 435,809 | |
Amgen, Inc. | | | 16,654 | | | | 2,906,289 | |
Bio-Techne Corporation | | | 860 | | | | 99,683 | |
Biogen, Inc. (b) | | | 4,883 | | | | 1,414,068 | |
BioMarin Pharmaceutical, Inc. (b) | | | 3,930 | | | | 344,779 | |
Bristol-Myers Squibb Company | | | 37,834 | | | | 2,152,755 | |
Celgene Corporation (b) | | | 17,585 | | | | 2,381,185 | |
Gilead Sciences, Inc. | | | 29,559 | | | | 2,249,144 | |
Jazz Pharmaceuticals PLC (a)(b) | | | 1,360 | | | | 208,910 | |
Merck & Company, Inc. | | | 62,349 | | | | 3,982,854 | |
Mettler-Toledo International, Inc. (b) | | | 582 | | | | 333,532 | |
PAREXEL International Corporation (b) | | | 1,162 | | | | 101,698 | |
Quintiles IMS Holdings, Inc. (b) | | | 3,212 | | | | 290,847 | |
Vertex Pharmaceuticals, Inc. (b) | | | 5,630 | | | | 854,747 | |
| | | | | | | | |
| | | SHARES | | | VALUE | |
Pharmaceuticals & Biotechnology — (continued) | |
Waters Corporation (b) | | | 1,795 | | | $ | 311,325 | |
Zoetis, Inc. | | | 11,158 | | | | 697,598 | |
| | | | | | | | |
| | | | 18,765,223 | |
| | | | | | | | |
Capital Goods — 7.0% | |
3M Company | | | 13,470 | | | | 2,709,760 | |
A.O. Smith Corporation | | | 3,385 | | | | 181,267 | |
AGCO Corporation | | | 1,456 | | | | 105,036 | |
Air Lease Corporation | | | 2,223 | | | | 87,986 | |
Allegion PLC (a) | | | 2,195 | | | | 178,322 | |
Applied Industrial Technologies, Inc. | | | 892 | | | | 50,398 | |
Builders FirstSource, Inc. (b) | | | 2,174 | | | | 34,067 | |
Caterpillar, Inc. | | | 13,262 | | | | 1,511,205 | |
Cummins, Inc. | | | 3,622 | | | | 608,134 | |
Deere & Company | | | 6,107 | | | | 783,406 | |
Dover Corporation | | | 3,552 | | | | 298,368 | |
Eaton Corporation PLC | | | 10,158 | | | | 794,863 | |
EMCOR Group, Inc. | | | 1,349 | | | | 91,058 | |
Fastenal Company | | | 6,476 | | | | 278,209 | |
Flowserve Corporation | | | 2,910 | | | | 119,688 | |
Fortive Corporation | | | 7,062 | | | | 457,194 | |
Fortune Brands Home & Security, Inc. | | | 3,507 | | | | 230,305 | |
Graco, Inc. | | | 1,276 | | | | 148,067 | |
Granite Construction, Inc. | | | 946 | | | | 46,373 | |
H&E Equipment Services, Inc. | | | 681 | | | | 15,370 | |
Illinois Tool Works, Inc. | | | 7,050 | | | | 992,005 | |
Ingersoll-Rand PLC | | | 5,868 | | | | 515,680 | |
Lincoln Electric Holdings, Inc. | | | 1,343 | | | | 117,190 | |
Masco Corporation | | | 7,210 | | | | 274,917 | |
Meritor, Inc. (b) | | | 1,997 | | | | 34,508 | |
Middleby Corporation (The) (b) | | | 1,292 | | | | 168,839 | |
Owens Corning | | | 2,524 | | | | 169,234 | |
Parker Hannifin Corporation | | | 3,020 | | | | 501,260 | |
Quanta Services, Inc. (b) | | | 3,464 | | | | 116,841 | |
Rockwell Automation, Inc. | | | 2,916 | | | | 481,227 | |
Roper Technologies, Inc. | | | 2,303 | | | | 535,355 | |
Sensata Technologies Holding NV (b) | | | 3,850 | | | | 173,712 | |
Snap-on, Inc. | | | 1,328 | | | | 204,778 | |
Stanley Black & Decker, Inc. | | | 3,452 | | | | 485,662 | |
Tennant Company | | | 363 | | | | 27,425 | |
Timken Company (The) | | | 1,610 | | | | 73,255 | |
United Rentals, Inc. (b) | | | 1,928 | | | | 229,355 | |
W.W. Grainger, Inc. | | | 1,270 | | | | 211,760 | |
22
| | |
GREEN CENTURY EQUITY FUND PORTFOLIO OF INVESTMENTS July 31, 2017 | | continued |
| | | | | | | | |
| | | SHARES | | | VALUE | |
Capital Goods — (continued) | |
WABCO Holdings, Inc. (b) | | | 1,164 | | | $ | 160,131 | |
Wabtec Corporation | | | 1,965 | | | | 148,082 | |
Wesco Aircraft Holdings, Inc. (b) | | | 1,261 | | | | 13,682 | |
Xylem, Inc. | | | 4,091 | | | | 232,082 | |
| | | | | | | | |
| | | | | | | 14,596,056 | |
| | | | | | | | |
Diversified Financials — 5.4% | |
Ally Financial, Inc. | | | 10,695 | | | | 242,135 | |
American Express Company | | | 17,306 | | | | 1,474,990 | |
Ameriprise Financial, Inc. | | | 3,489 | | | | 505,486 | |
Bank of New York Mellon Corporation (The) | | | 23,467 | | | | 1,244,455 | |
BlackRock, Inc. | | | 2,738 | | | | 1,167,839 | |
Charles Schwab Corporation (The) | | | 27,171 | | | | 1,165,636 | |
CME Group, Inc. | | | 7,687 | | | | 942,580 | |
FactSet Research Systems, Inc. | | | 890 | | | | 148,826 | |
Franklin Resources, Inc. | | | 7,727 | | | | 346,015 | |
Invesco Ltd. | | | 9,189 | | | | 319,502 | |
Legg Mason, Inc. | | | 2,008 | | | | 80,340 | |
Moody’s Corporation | | | 3,895 | | | | 512,699 | |
Northern Trust Corporation | | | 4,734 | | | | 414,272 | |
S&P Global, Inc. | | | 5,841 | | | | 897,119 | |
State Street Corporation | | | 8,650 | | | | 806,439 | |
T. Rowe Price Group, Inc. | | | 5,523 | | | | 456,863 | |
TD Ameritrade Holding Corporation | | | 5,933 | | | | 271,316 | |
Voya Financial, Inc. | | | 4,304 | | | | 168,889 | |
| | | | | | | | |
| | | | | | | 11,165,401 | |
| | | | | | | | |
Semiconductors — 5.3% | | | | | | | | |
Advanced Micro Devices, Inc. (b) | | | 18,798 | | | | 255,841 | |
Analog Devices, Inc. | | | 8,215 | | | | 649,067 | |
Applied Materials, Inc. | | | 24,424 | | | | 1,082,227 | |
Intel Corporation | | | 106,944 | | | | 3,793,304 | |
Lam Research Corporation | | | 3,680 | | | | 586,813 | |
Microchip Technology, Inc. | | | 4,899 | | | | 392,116 | |
NVIDIA Corporation | | | 12,190 | | | | 1,980,997 | |
Skyworks Solutions, Inc. | | | 4,185 | | | | 438,881 | |
Texas Instruments, Inc. | | | 22,620 | | | | 1,840,815 | |
| | | | | | | | |
| | | | | | | 11,020,061 | |
| | | | | | | | |
Food & Beverage — 5.1% | |
Archer-Daniels-Midland Company | | | 12,907 | | | | 544,417 | |
Bunge Ltd. | | | 3,133 | | | | 245,596 | |
| | | | | | | | |
| | | SHARES | | | VALUE | |
Food & Beverage — (continued) | |
Campbell Soup Company | | | 4,212 | | | $ | 222,520 | |
Coca-Cola Company (The) | | | 92,220 | | | | 4,227,365 | |
Darling Ingredients, Inc. (b) | | | 3,820 | | | | 62,151 | |
Dr. Pepper Snapple Group, Inc. | | | 4,152 | | | | 378,496 | |
General Mills, Inc. | | | 13,062 | | | | 727,031 | |
Hormel Foods Corporation | | | 6,634 | | | | 226,684 | |
Ingredion, Inc. | | | 1,651 | | | | 203,601 | |
JM Smucker Company (The) | | | 2,608 | | | | 317,915 | |
Kellogg Company | | | 5,971 | | | | 406,028 | |
Kraft Heinz Company (The) | | | 13,763 | | | | 1,203,712 | |
McCormick & Company, Inc. | | | 2,556 | | | | 243,587 | |
Mondelez International, Inc., Class A | | | 34,527 | | | | 1,519,879 | |
| | | | | | | | |
| | | | | | | 10,528,982 | |
| | | | | | | | |
Real Estate — 4.7% | |
American Tower Corporation | | | 9,660 | | | | 1,316,948 | |
AvalonBay Communities, Inc. | | | 3,095 | | | | 595,323 | |
Boston Properties, Inc. | | | 3,485 | | | | 421,371 | |
CBRE Group, Inc., Class A (b) | | | 6,812 | | | | 258,788 | |
Corporate Office Properties Trust | | | 2,215 | | | | 73,737 | |
Digital Realty Trust, Inc. | | | 3,597 | | | | 414,878 | |
Duke Realty Corporation | | | 7,958 | | | | 227,519 | |
Equinix, Inc. | | | 1,742 | | | | 785,172 | |
Equity Residential | | | 8,279 | | | | 563,469 | |
Federal Realty Investment Trust | | | 1,642 | | | | 217,779 | |
Forest City Realty Trust, Inc., Class A | | | 4,555 | | | | 111,051 | |
HCP, Inc. | | | 10,659 | | | | 337,357 | |
Host Hotels & Resorts, Inc. | | | 16,914 | | | | 315,615 | |
Iron Mountain, Inc. | | | 5,769 | | | | 210,165 | |
Jones Lang LaSalle, Inc. | | | 1,056 | | | | 134,344 | |
Liberty Property Trust | | | 3,334 | | | | 140,095 | |
Macerich Company (The) | | | 2,745 | | | | 157,536 | |
Potlatch Corporation | | | 860 | | | | 41,151 | |
Prologis, Inc. | | | 11,944 | | | | 726,315 | |
Realogy Holdings Corporation | | | 3,114 | | | | 103,385 | |
SBA Communications Corporation, Class A (b) | | | 2,745 | | | | 377,575 | |
Simon Property Group, Inc. | | | 7,237 | | | | 1,147,065 | |
UDR, Inc. | | | 6,012 | | | | 235,009 | |
Vornado Realty Trust | | | 3,881 | | | | 307,957 | |
Weyerhaeuser Company | | | 16,951 | | | | 559,722 | |
| | | | | | | | |
| | | | | | | 9,779,326 | |
| | | | | | | | |
23
| | |
GREEN CENTURY EQUITY FUND PORTFOLIO OF INVESTMENTS July 31, 2017 | | continued |
| | | | | | | | |
| | | SHARES | | | VALUE | |
Healthcare Equipment & Services — 4.4% | |
Align Technology, Inc. (b) | | | 1,720 | | | $ | 287,636 | |
AmerisourceBergen Corporation | | | 3,696 | | | | 346,759 | |
Becton, Dickinson and Company | | | 5,112 | | | | 1,029,557 | |
Cardinal Health, Inc. | | | 7,120 | | | | 550,091 | |
Centene Corporation (b) | | | 3,865 | | | | 306,958 | |
Cerner Corporation (b) | | | 6,736 | | | | 433,596 | |
Cigna Corporation | | | 5,812 | | | | 1,008,731 | |
Cooper Companies, Inc. (The) | | | 1,111 | | | | 270,940 | |
Dentsply Sirona, Inc. | | | 5,264 | | | | 326,526 | |
Edwards Lifesciences Corporation (b) | | | 4,797 | | | | 552,518 | |
Envision Healthcare Holdings, Inc. (b) | | | 2,643 | | | | 149,145 | |
HCA Holdings, Inc. (b) | | | 6,717 | | | | 539,644 | |
Henry Schein, Inc. (b) | | | 1,804 | | | | 328,707 | |
Hologic, Inc. (b) | | | 6,333 | | | | 279,982 | |
Humana, Inc. | | | 3,366 | | | | 778,219 | |
IDEXX Laboratories, Inc. (b) | | | 2,005 | | | | 333,752 | |
Laboratory Corporation of America Holdings (b) | | | 2,325 | | | | 369,466 | |
MEDNAX, Inc. (b) | | | 2,083 | | | | 97,859 | |
Patterson Companies, Inc. | | | 1,893 | | | | 78,976 | |
Quest Diagnostics, Inc. | | | 3,078 | | | | 333,378 | |
ResMed, Inc. | | | 3,176 | | | | 244,933 | |
Select Medical Holdings Corporation (b) | | | 2,541 | | | | 41,164 | |
Varian Medical Systems, Inc. (b) | | | 2,086 | | | | 202,592 | |
VCA, Inc. (b) | | | 1,843 | | | | 170,625 | |
| | | | | | | | |
| | | | | | | 9,061,754 | |
| | | | | | | | |
Media — 4.3% | | | | | | | | |
Charter Communications, Inc., Class A (b) | | | 4,866 | | | | 1,907,034 | |
Discovery Communications, Inc., Class A (b) | | | 3,410 | | | | 83,886 | |
Discovery Communications, Inc., Class C (b) | | | 5,006 | | | | 115,789 | |
John Wiley & Sons, Inc., Class A | | | 1,008 | | | | 55,692 | |
Liberty Global PLC LiLAC, Class A (a)(b) | | | 1,064 | | | | 27,366 | |
Liberty Global PLC LiLAC, Class C (a)(b) | | | 2,675 | | | | 68,266 | |
Liberty Global PLC, Class A (a)(b) | | | 5,477 | | | | 185,451 | |
Liberty Global PLC, Series C (a)(b) | | | 13,578 | | | | 444,951 | |
New York Times Company (The), Class A | | | 2,785 | | | | 52,915 | |
| | | | | | | | |
| | | SHARES | | | VALUE | |
Media — (continued) | | | | | | | | |
Scholastic Corporation | | | 689 | | | $ | 28,545 | |
Scripps Networks Interactive, Inc., Class A | | | 1,979 | | | | 172,985 | |
Time Warner, Inc. | | | 17,497 | | | | 1,792,043 | |
Walt Disney Company (The) | | | 35,756 | | | | 3,930,657 | |
| | | | | | | | |
| | | | | | | 8,865,580 | |
| | | | | | | | |
Household & Personal Products — 4.1% | |
Avon Products, Inc. (a)(b) | | | 9,248 | | | | 33,663 | |
Clorox Company (The) | | | 2,918 | | | | 389,524 | |
Colgate-Palmolive Company | | | 18,975 | | | | 1,369,995 | |
Estee Lauder Companies, Inc. (The), Class A | | | 5,039 | | | | 498,811 | |
Kimberly-Clark Corporation | | | 8,047 | | | | 991,068 | |
Procter & Gamble Company (The) | | | 57,797 | | | | 5,249,123 | |
| | | | | | | | |
| | | | | | | 8,532,184 | |
| | | | | | | | |
Retailing — 4.1% | | | | | | | | |
AutoNation, Inc. (b) | | | 1,516 | | | | 64,248 | |
Best Buy Company, Inc. | | | 6,412 | | | | 374,076 | |
Buckle, Inc. (The) | | | 624 | | | | 10,670 | |
Caleres Inc. | | | 927 | | | | 25,289 | |
CarMax, Inc. (b) | | | 4,300 | | | | 284,875 | |
Foot Locker, Inc. | | | 3,028 | | | | 142,891 | |
GameStop Corporation, Class A | | | 2,214 | | | | 48,022 | |
Gap, Inc. (The) | | | 5,458 | | | | 130,064 | |
HSN, Inc. | | | 723 | | | | 28,667 | |
Kohl’s Corporation | | | 4,012 | | | | 165,896 | |
LKQ Corporation (b) | | | 7,151 | | | | 247,139 | |
Lowe’s Companies, Inc. | | | 19,662 | | | | 1,521,839 | |
Netflix, Inc. (b) | | | 9,735 | | | | 1,768,460 | |
Nordstrom, Inc. | | | 2,825 | | | | 137,210 | |
Nutrisystem, Inc. | | | 634 | | | | 35,346 | |
Office Depot, Inc. | | | 11,972 | | | | 70,276 | |
Pier 1 Imports, Inc. | | | 1,662 | | | | 7,662 | |
Pool Corporation | | | 902 | | | | 97,524 | |
Priceline Group, Inc. (The) (b) | | | 1,112 | | | | 2,255,692 | |
Shutterfly, Inc. (b) | | | 661 | | | | 32,415 | |
Signet Jewelers Ltd. | | | 1,387 | | | | 84,829 | |
Staples, Inc. | | | 14,776 | | | | 149,976 | |
Tiffany & Company | | | 2,840 | | | | 271,248 | |
Tractor Supply Company | | | 2,985 | | | | 167,518 | |
Ulta Beauty, Inc. (b) | | | 1,341 | | | | 336,873 | |
Weyco Group, Inc. | | | 142 | | | | 3,959 | |
| | | | | | | | |
| | | | | | | 8,462,664 | |
| | | | | | | | |
24
| | |
GREEN CENTURY EQUITY FUND PORTFOLIO OF INVESTMENTS July 31, 2017 | | continued |
| | | | | | | | |
| | | SHARES | | | VALUE | |
Insurance — 3.9% | | | | | | | | |
Aflac, Inc. | | | 9,066 | | | $ | 723,013 | |
Allstate Corporation (The) | | | 8,270 | | | | 752,570 | |
Chubb Ltd. (a) | | | 10,526 | | | | 1,541,638 | |
Hartford Financial Services Group, Inc. (The) | | | 8,364 | | | | 460,020 | |
Loews Corporation | | | 6,542 | | | | 318,465 | |
Marsh & McLennan Companies, Inc. | | | 11,652 | | | | 908,506 | |
Principal Financial Group, Inc. | | | 6,546 | | | | 436,946 | |
Progressive Corporation (The) | | | 13,102 | | | | 617,497 | |
Prudential Financial, Inc. | | | 9,723 | | | | 1,100,935 | |
Travelers Companies, Inc. (The) | | | 6,302 | | | | 807,223 | |
Willis Towers Watson PLC (a) | | | 2,935 | | | | 436,963 | |
| | | | | | | | |
| | | | | | | 8,103,776 | |
| | | | | | | | |
Technology Hardware & Equipment — 3.5% | |
Calix, Inc. (b) | | | 982 | | | | 6,727 | |
Cisco Systems, Inc. | | | 113,282 | | | | 3,562,719 | |
Corning, Inc. | | | 21,014 | | | | 612,348 | |
F5 Networks, Inc. (b) | | | 1,489 | | | | 179,797 | |
Flex Ltd. (b) | | | 11,970 | | | | 191,400 | |
Hewlett Packard Enterprise Company | | | 37,565 | | | | 657,763 | |
HP, Inc. | | | 38,319 | | | | 731,893 | |
Motorola Solutions, Inc. | | | 3,701 | | | | 335,607 | |
Plantronics, Inc. | | | 709 | | | | 32,032 | |
Super Micro Computer, Inc. (b) | | | 833 | | | | 22,366 | |
TE Connectivity Ltd. (a) | | | 8,045 | | | | 646,737 | |
Trimble, Inc. (b) | | | 5,698 | | | | 213,276 | |
Xerox Corporation | | | 4,904 | | | | 150,406 | |
| | | | | | | | |
| | | | | | | 7,343,071 | |
| | | | | | | | |
Consumer Services — 3.5% | | | | | | | | |
Aramark | | | 5,572 | | | | 222,100 | |
Choice Hotels International, Inc. | | | 858 | | | | 55,470 | |
Darden Restaurants, Inc. | | | 2,856 | | | | 239,561 | |
Domino’s Pizza, Inc. | | | 1,096 | | | | 204,404 | |
Hilton Worldwide Holdings, Inc. | | | 4,501 | | | | 281,447 | |
Jack in the Box, Inc. | | | 694 | | | | 64,375 | |
Marriott International, Inc., Class A | | | 7,345 | | | | 765,276 | |
McDonald’s Corporation | | | 18,769 | | | | 2,911,823 | |
Royal Caribbean Cruises Ltd. | | | 3,884 | | | | 439,164 | |
Starbucks Corporation | | | 32,951 | | | | 1,778,695 | |
Vail Resorts, Inc. | | | 908 | | | | 191,370 | |
| | | | | | | | |
| | | | | | | 7,153,685 | |
| | | | | | | | |
| | | | | | | | |
| | | SHARES | | | VALUE | |
Materials — 2.8% | | | | | | | | |
Air Products & Chemicals, Inc. | | | 4,912 | | | $ | 698,241 | |
Albemarle Corporation | | | 2,554 | | | | 295,753 | |
Avery Dennison Corporation | | | 2,000 | | | | 185,860 | |
Axalta Coating Systems Ltd. (b) | | | 4,871 | | | | 153,437 | |
Ball Corporation | | | 7,561 | | | | 316,806 | |
Compass Minerals International, Inc. | | | 794 | | | | 54,826 | |
Domtar Corporation | | | 1,466 | | | | 57,262 | |
Ecolab, Inc. | | | 5,947 | | | | 783,041 | |
H.B. Fuller Company | | | 1,102 | | | | 56,775 | |
International Flavors & Fragrances, Inc. | | | 1,809 | | | | 240,923 | |
Minerals Technologies, Inc. | | | 809 | | | | 57,277 | |
Mosaic Company (The) | | | 7,506 | | | | 181,195 | |
PPG Industries, Inc. | | | 5,814 | | | | 611,923 | |
Praxair, Inc. | | | 6,464 | | | | 841,354 | |
Schnitzer Steel Industries, Inc., Class A | | | 531 | | | | 13,700 | |
Sealed Air Corporation | | | 4,428 | | | | 192,662 | |
Sherwin-Williams Company (The) | | | 1,891 | | | | 637,778 | |
Sonoco Products Company | | | 2,230 | | | | 108,110 | |
WestRock Company | | | 5,621 | | | | 322,758 | |
| | | | | | | | |
| | | | | | | 5,809,681 | |
| | | | | | | | |
Telecommunication Services — 2.6% | |
CenturyLink, Inc. | | | 12,290 | | | | 285,988 | |
Cincinnati Bell, Inc. (b) | | | 821 | | | | 15,312 | |
Level 3 Communications, Inc. (b) | | | 6,980 | | | | 409,586 | |
Sprint Corporation (b) | | | 18,000 | | | | 143,640 | |
Verizon Communications, Inc. | | | 92,221 | | | | 4,463,497 | |
| | | | | | | | |
| | | | | | | 5,318,023 | |
| | | | | | | | |
Transportation — 2.3% | | | | | | | | |
ArcBest Corporation | | | 526 | | | | 14,623 | |
Avis Budget Group, Inc. (b) | | | 1,727 | | | | 53,157 | |
C.H. Robinson Worldwide, Inc. | | | 3,184 | | | | 208,870 | |
CSX Corporation | | | 20,945 | | | | 1,033,426 | |
Delta Air Lines, Inc. | | | 4,146 | | | | 204,647 | |
Echo Global Logistics, Inc. (b) | | | 579 | | | | 7,903 | |
Expeditors International of Washington, Inc. | | | 4,098 | | | | 241,290 | |
Genesee & Wyoming, Inc., Class A (b) | | | 1,408 | | | | 91,745 | |
Hertz Global Holdings, Inc. (b) | | | 1,088 | | | | 14,873 | |
Kansas City Southern | | | 2,425 | | | | 250,236 | |
25
| | |
GREEN CENTURY EQUITY FUND PORTFOLIO OF INVESTMENTS July 31, 2017 | | continued |
| | | | | | | | |
| | | SHARES | | | VALUE | |
Transportation — (continued) | | | | | |
Norfolk Southern Corporation | | | 6,587 | | | $ | 741,565 | |
Ryder System, Inc. | | | 1,183 | | | | 86,075 | |
Southwest Airlines Company | | | 3,483 | | | | 193,341 | |
United Parcel Service, Inc., Class B | | | 15,585 | | | | 1,718,870 | |
| | | | | | | | |
| | | | | | | 4,860,621 | |
| | | | | | | | |
Consumer Durables & Apparel — 2.3% | |
Callaway Golf Company | | | 2,022 | | | | 25,740 | |
Columbia Sportswear Company | | | 605 | | | | 36,651 | |
CSS Industries, Inc. | | | 200 | | | | 5,354 | |
Deckers Outdoor Corporation (b) | | | 738 | | | | 47,867 | |
Ethan Allen Interiors, Inc. | | | 534 | | | | 17,115 | |
Garmin Ltd. (a) | | | 2,935 | | | | 147,308 | |
Hanesbrands, Inc. | | | 8,464 | | | | 193,995 | |
Hasbro, Inc. | | | 2,515 | | | | 266,288 | |
La-Z-Boy, Inc. | | | 1,044 | | | | 35,287 | |
Mattel, Inc. | | | 7,809 | | | | 156,336 | |
Meritage Homes Corporation (b) | | | 818 | | | | 33,333 | |
Michael Kors Holdings Ltd. (a)(b) | | | 3,725 | | | | 135,739 | |
Mohawk Industries, Inc. (b) | | | 1,432 | | | | 356,554 | |
Newell Brands, Inc. | | | 10,890 | | | | 574,121 | |
NIKE, Inc., Class B | | | 29,969 | | | | 1,769,669 | |
PVH Corporation | | | 1,782 | | | | 212,575 | |
Tupperware Brands Corporation | | | 1,142 | | | | 69,331 | |
Under Armour, Inc., Class A (b) | | | 4,076 | | | | 81,601 | |
Under Armour, Inc., Class A (b) | | | 4,274 | | | | 77,402 | |
VF Corporation | | | 8,056 | | | | 501,003 | |
Wolverine World Wide, Inc. | | | 2,141 | | | | 60,376 | |
| | | | | | | | |
| | | | | | | 4,803,645 | |
| | | | | | | | |
Banks — 2.0% | | | | | | | | |
Bank of Hawaii Corporation | | | 968 | | | | 80,993 | |
Cathay General Bancorp | | | 1,613 | | | | 60,407 | |
CIT Group, Inc. | | | 3,293 | | | | 156,912 | |
Citizens Financial Group, Inc. | | | 11,587 | | | | 406,472 | |
Comerica, Inc. | | | 3,982 | | | | 287,938 | |
Heartland Financial USA, Inc. | | | 474 | | | | 22,325 | |
International Bancshares Corporation | | | 1,199 | | | | 42,445 | |
KeyCorp | | | 24,436 | | | | 440,826 | |
M&T Bank Corporation | | | 3,161 | | | | 515,717 | |
New York Community Bancorp, Inc. | | | 11,009 | | | | 144,548 | |
Old National Bancorp | | | 3,156 | | | | 51,443 | |
People’s United Financial, Inc. | | | 7,630 | | | | 133,067 | |
| | | | | | | | |
| | | SHARES | | | VALUE | |
Banks — (continued) | | | | | | | | |
PNC Financial Services Group, Inc. (The) | | | 10,960 | | | $ | 1,411,648 | |
Signature Bank (b) | | | 1,261 | | | | 174,749 | |
SVB Financial Group (b) | | | 1,201 | | | | 214,306 | |
Umpqua Holdings Corporation | | | 4,939 | | | | 91,569 | |
| | | | | | | | |
| | | | | | | 4,235,365 | |
| | | | | | | | |
Renewable Energy & Energy Efficiency — 1.0% | |
Acuity Brands, Inc. | | | 998 | | | | 202,245 | |
Itron, Inc. (b) | | | 769 | | | | 56,137 | |
Johnson Controls International, PLC | | | 21,176 | | | | 824,810 | |
Ormat Technologies, Inc. | | | 868 | | | | 51,472 | |
SunPower Corporation (b) | | | 1,332 | | | | 14,838 | |
Tesla Motors, Inc. (b) | | | 2,911 | | | | 941,621 | |
| | | | | | | | |
| | | | | | | 2,091,123 | |
| | | | | | | | |
Commercial & Professional Services — 0.7% | |
ACCO Brands Corporation (b) | | | 2,275 | | | | 26,504 | |
Copart, Inc. (b) | | | 4,617 | | | | 145,389 | |
Deluxe Corporation | | | 1,042 | | | | 75,232 | |
Dun & Bradstreet Corporation (The) | | | 853 | | | | 94,478 | |
Essendant, Inc. | | | 801 | | | | 9,996 | |
Exponent, Inc. | | | 556 | | | | 36,251 | |
Heidrick & Struggles International, Inc. | | | 327 | | | | 5,919 | |
HNI Corporation | | | 941 | | | | 35,523 | |
ICF International, Inc. (b) | | | 392 | | | | 17,738 | |
IHS Markit Ltd. (a)(b) | | | 8,425 | | | | 393,026 | |
Interface, Inc. | | | 1,400 | | | | 26,530 | |
Kelly Services, Inc. | | | 596 | | | | 13,273 | |
Knoll, Inc. | | | 1,049 | | | | 20,309 | |
ManpowerGroup, Inc. | | | 1,550 | | | | 166,082 | |
Navigant Consulting, Inc. (b) | | | 1,017 | | | | 17,218 | |
On Assignment, Inc. (b) | | | 1,119 | | | | 55,111 | |
R.R. Donnelley & Sons Company | | | 1,494 | | | | 18,466 | |
Resources Connection, Inc. | | | 605 | | | | 8,077 | |
Robert Half International, Inc. | | | 2,944 | | | | 133,216 | |
RPX Corporation (b) | | | 998 | | | | 13,643 | |
Steelcase, Inc. | | | 1,843 | | | | 25,157 | |
Team, Inc. (b) | | | 585 | | | | 8,395 | |
Tetra Tech, Inc. | | | 1,334 | | | | 63,298 | |
TrueBlue, Inc. (b) | | | 911 | | | | 23,276 | |
| | | | | | | | |
| | | | | | | 1,432,107 | |
| | | | | | | | |
26
| | |
GREEN CENTURY EQUITY FUND PORTFOLIO OF INVESTMENTS July 31, 2017 | | concluded |
| | | | | | | | |
| | | SHARES | | | VALUE | |
Automobiles & Components — 0.3% | |
Autoliv, Inc. (a) | | | 2,021 | | | $ | 219,056 | |
BorgWarner, Inc. | | | 4,769 | | | | 222,903 | |
Harley-Davidson, Inc. | | | 4,029 | | | | 196,092 | |
| | | | | | | | |
| | | | | | | 638,051 | |
| | | | | | | | |
Food & Staples Retailing — 0.3% | |
Sysco Corporation | | | 11,601 | | | | 610,445 | |
| | | | | | | | |
Healthy Living — 0.2% | | | | | | | | |
Hain Celestial Group, Inc. (The) (b) | | | 2,291 | | | | 102,431 | |
United Natural Foods, Inc. (b) | | | 1,194 | | | | 46,005 | |
Whole Foods Market, Inc. | | | 7,173 | | | | 299,544 | |
| | | | | | | | |
| | | | | | | 447,980 | |
| | | | | | | | |
Utilities — 0.2% | | | | | | | | |
American Water Works Company, Inc. | | | 4,040 | | | | 327,644 | |
| | | | | | | | |
Total Common Stocks
(Cost $141,532,232) | | | | | | | 206,423,313 | |
| | | | | | | | |
| | | | | | | | |
SHORT-TERM INVESTMENT — 0.1% | |
| | | SHARES | | | VALUE | |
UMB Money Market Fiduciary
Account, 0.01% (c)
(Cost $304,548) | | | | | | $ | 304,548 | |
| | | | | | | | |
Total Short-term Investments
(Cost $304,548) | | | | | | | 304,548 | |
| | | | | | | | |
TOTAL INVESTMENTS (d) — 99.7% | |
(Cost $141,836,780) | | | | | | | 206,727,861 | |
Other Assets Less Liabilities — 0.3% | | | | | | | 554,219 | |
| | | | | | | | |
NET ASSETS — 100.0% | | | | | | $ | 207,282,080 | |
| | | | | | | | |
| (a) | Securities whose values are determined or significantly influenced by trading in markets other than the United States or Canada. |
| (b) | Non-income producing security. |
| (c) | The rate quoted is the annualized seven-day yield of the fund at the period end. |
| (d) | The cost of investments for federal income tax purposes is $145,058,879 resulting in gross unrealized appreciation and depreciation of $65,026,302 and $3,357,320 respectively, or net unrealized appreciation of $61,668,982. |
See Notes to Financial Statements
27
| | |
GREEN CENTURY MSCI INTERNATIONAL INDEX FUND PORTFOLIO OF INVESTMENTS July 31, 2017 | | |
| | | | | | | | |
COMMON STOCKS — 98.2% | |
| | | SHARES | | | VALUE | |
Japan — 20.0% | | | | | | | | |
Aeon Company, Ltd. | | | 9,200 | | | $ | 138,626 | |
Ajinomoto Company, Inc. | | | 5,100 | | | | 102,575 | |
Asahi Kasei Corporation | | | 11,000 | | | | 125,619 | |
Astellas Pharma, Inc. | | | 16,200 | | | | 206,316 | |
Daikin Industries Ltd. | | | 1,800 | | | | 190,572 | |
Daiwa House Industry Company, Ltd. | | | 5,400 | | | | 188,359 | |
Denso Corporation | | | 3,500 | | | | 168,089 | |
East Japan Railway Company | | | 2,700 | | | | 253,212 | |
Eisai Company, Ltd. | | | 3,600 | | | | 192,930 | |
FUJIFILM Holdings Corporation | | | 3,300 | | | | 121,303 | |
Fujitsu Ltd. | | | 16,000 | | | | 119,148 | |
Honda Motor Company, Ltd. | | | 10,900 | | | | 305,111 | |
KDDI Corporation | | | 12,300 | | | | 325,913 | |
Komatsu Ltd. | | | 6,500 | | | | 174,314 | |
Kubota Corporation | | | 7,700 | | | | 133,711 | |
Kyocera Corporation | | | 2,600 | | | | 157,950 | |
Murata Manufacturing Company, Ltd. | | | 1,200 | | | | 186,683 | |
Nissan Motor Company, Ltd. | | | 15,800 | | | | 156,882 | |
Nitto Denko Corporation | | | 1,500 | | | | 133,754 | |
NTT DOCOMO, Inc. | | | 9,600 | | | | 222,931 | |
Panasonic Corporation | | | 15,000 | | | | 206,599 | |
Sekisui House Ltd. | | | 6,900 | | | | 119,440 | |
Sompo Holdings, Inc. | | | 2,500 | | | | 98,056 | |
Sony Corporation | | | 8,300 | | | | 341,000 | |
Sumitomo Metal Mining Company, Ltd. | | | 6,000 | | | | 90,616 | |
Sumitomo Mitsui Trust Holdings, Inc. | | | 2,200 | | | | 80,791 | |
Sysmex Corporation | | | 1,200 | | | | 68,694 | |
Toray Industries, Inc. | | | 14,500 | | | | 130,934 | |
| | | | | | | | |
| | | | 4,740,128 | |
| | | | | | | | |
France — 11.0% | | | | | | | | |
Air Liquide SA | | | 2,617 | | | | 320,894 | |
AXA SA | | | 12,787 | | | | 377,661 | |
Danone SA | | | 4,163 | | | | 310,658 | |
Essilor International SA | | | 1,608 | | | | 203,592 | |
Kering | | | 523 | | | | 182,808 | |
L’Oreal SA | | | 1,677 | | | | 347,457 | |
Legrand SA | | | 2,719 | | | | 187,830 | |
Schneider Electric SE (a) | | | 3,696 | | | | 290,087 | |
Unibail-Rodamco SE | | | 896 | | | | 224,103 | |
Vivendi SA | | | 7,129 | | | | 164,786 | |
| | | | | | | | |
| | | | 2,609,876 | |
| | | | | | | | |
| | | | | | | | |
| | | SHARES | | | VALUE | |
United Kingdom — 10.9% | | | | | | | | |
Barratt Developments PLC | | | 13,094 | | | $ | 106,348 | |
Ferguson PLC | | | 2,842 | | | | 169,694 | |
Kingfisher PLC | | | 19,925 | | | | 77,326 | |
Legal & General Group PLC | | | 61,601 | | | | 218,119 | |
Marks & Spencer Group PLC | | | 19,278 | | | | 81,935 | |
Old Mutual PLC | | | 38,349 | | | | 99,467 | |
RELX PLC | | | 12,490 | | | | 272,056 | |
Standard Chartered PLC (a) | | | 21,976 | | | | 245,659 | |
Unilever PLC | | | 8,429 | | | | 480,742 | |
Vodafone Group PLC | | | 180,471 | | | | 529,031 | |
Whitbread PLC | | | 2,083 | | | | 105,778 | |
WPP PLC | | | 9,457 | | | | 192,870 | |
| | | | | | | | |
| | | | 2,579,025 | |
| | | | | | | | |
Germany — 10.1% | | | | | | | | |
adidas AG | | | 1,248 | | | | 285,049 | |
Allianz SE | | | 3,225 | | | | 687,465 | |
Deutsche Boerse AG | | | 1,511 | | | | 157,781 | |
Henkel AG & Company KGaA | | | 1,830 | | | | 259,227 | |
Muenchener Rueckversicherungs-Gesellschaft AG in Muenchen | | | 1,439 | | | | 309,110 | |
SAP SE | | | 6,440 | | | | 681,931 | |
| | | | | | | | |
| | | | 2,380,563 | |
| | | | | | | | |
Canada — 8.8% | | | | | | | | |
Agnico Eagle Mines Ltd. | | | 1,830 | | | | 85,438 | |
Bank of Montreal | | | 4,949 | | | | 375,343 | |
Bank of Nova Scotia (The) | | | 8,511 | | | | 530,197 | |
Canadian Imperial Bank of Commerce | | | 3,356 | | | | 291,295 | |
Canadian National Railway Company | | | 5,954 | | | | 470,475 | |
Potash Corporation of Saskatchewan, Inc. | | | 7,181 | | | | 128,438 | |
Rogers Communications, Inc., Class B | | | 3,970 | | | | 206,428 | |
| | | | | | | | |
| | | | 2,087,614 | |
| | | | | | | | |
Australia — 7.9% | | | | | | | | |
AMP Ltd. | | | 38,119 | | | | 164,330 | |
Brambles Ltd. | | | 13,548 | | | | 100,171 | |
Goodman Group | | | 26,662 | | | | 169,909 | |
National Australia Bank Ltd. | | | 17,569 | | | | 421,178 | |
Ramsay Health Care Ltd. | | | 2,117 | | | | 119,539 | |
Stockland | | | 40,541 | | | | 136,309 | |
Transurban Group | | | 22,112 | | | | 201,939 | |
Westpac Banking Corporation | | | 21,451 | | | | 546,789 | |
| | | | | | | | |
| | | | 1,860,164 | |
| | | | | | | | |
28
| | |
GREEN CENTURY MSCI INTERNATIONAL INDEX FUND PORTFOLIO OF INVESTMENTS July 31, 2017 | | concluded |
| | | | | | | | |
| | | SHARES | | | VALUE | |
Switzerland — 6.9% | | | | | | | | |
Givaudan SA | | | 85 | | | $ | 169,108 | |
Lonza Group AG (a) | | | 676 | | | | 160,660 | |
Roche Holding AG | | | 4,243 | | | | 1,074,142 | |
SGS SA | | | 103 | | | | 227,637 | |
| | | | | | | | |
| | | | 1,631,547 | |
| | | | | | | | |
Netherlands — 6.6% | | | | | | | | |
Akzo Nobel NV | | | 1,709 | | | | 154,729 | |
ASML Holding NV | | | 2,408 | | | | 363,145 | |
Koninklijke Philips NV | | | 6,829 | | | | 260,989 | |
RELX NV | | | 9,263 | | | | 194,572 | |
Unilever NV | | | 10,309 | | | | 600,811 | |
| | | | | | | | |
| | | | 1,574,246 | |
| | | | | | | | |
Denmark — 3.7% | | | | | | | | |
Novo Nordisk A/S, Class B | | | 11,842 | | | | 503,630 | |
Novozymes A/S | | | 2,503 | | | | 115,576 | |
Pandora A/S | | | 765 | | | | 88,042 | |
Vestas Wind Systems A/S | | | 1,678 | | | | 163,993 | |
| | | | | | | | |
| | | | 871,241 | |
| | | | | | | | |
Spain — 3.0% | | | | | | | | |
Banco Bilbao Vizcaya Argentaria SA | | | 41,877 | | | | 378,905 | |
Industria de Diseno Textil SA | | | 8,543 | | | | 339,124 | |
| | | | | | | | |
| | | | 718,029 | |
| | | | | | | | |
Sweden — 2.0% | | | | | | | | |
Assa Abloy AB, Class B | | | 9,702 | | | | 207,845 | |
Boliden AB | | | 2,835 | | | | 89,002 | |
Essity AB, Class B (a) | | | 5,872 | | | | 170,259 | |
| | | | | | | | |
| | | | 467,106 | |
| | | | | | | | |
Italy — 1.9% | | | | | | | | |
Assicurazioni Generali SpA | | | 9,031 | | | | 163,813 | |
Intesa Sanpaolo SpA | | | 80,854 | | | | 278,342 | |
| | | | | | | | |
| | | | 442,155 | |
| | | | | | | | |
Hong Kong — 1.6% | | | | | | | | |
BOC Hong Kong Holdings Ltd. | | | 30,000 | | | | 147,494 | |
Hang Seng Bank Ltd. | | | 10,617 | | | | 230,820 | |
| | | | | | | | |
| | | | 378,314 | |
| | | | | | | | |
Ireland — 1.0% | | | | | | | | |
CRH PLC | | | 6,881 | | | | 241,540 | |
| | | | | | | | |
| | | | | | | | |
| | | SHARES | | | VALUE | |
Singapore — 1.0% | | | | | | | | |
DBS Group Holdings Ltd. | | | 14,449 | | | $ | 230,506 | |
| | | | | | | | |
Belgium — 0.6% | | | | | | | | |
KBC Group NV | | | 1,809 | | | | 149,564 | |
| | | | | | | | |
Finland — 0.5% | | | | | | | | |
UPM-Kymmene OYJ | | | 4,447 | | | | 121,067 | |
| | | | | | | | |
Norway — 0.5% | | | | | | | | |
Orkla ASA | | | 10,754 | | | | 110,777 | |
| | | | | | | | |
New Zealand — 0.2% | | | | | | | | |
Fletcher Building Ltd. | | | 9,301 | | | | 55,832 | |
| | | | | | | | |
Total Common Stocks
(Cost $21,372,003) | | | | | | | 23,249,294 | |
| | | | | | | | |
SHORT-TERM INVESTMENT — 0.4% | |
UMB Money Market Fiduciary
Account , 0.01% (b)
(Cost $89,006) | | | | | | | 89,006 | |
| | | | | | | | |
Total Short-term Investments
(Cost $89,006) | | | | | | | 89,006 | |
| | | | | | | | |
TOTAL INVESTMENTS (c) — 98.6% | | | | | |
(Cost $21,461,009) | | | | | | | 23,338,300 | |
Other Assets Less Liabilities — 1.4% | | | | | | | 322,685 | |
| | | | | | | | |
NET ASSETS — 100.0% | | | $ | 23,660,985 | |
| | | | | | | | |
| (a) | Non-income producing security. |
| (b) | The rate quoted is the annualized seven-day yield of the fund at the period end. |
| (c) | The cost of investments for federal income tax purposes is $21,512,089 resulting in gross unrealized appreciation and depreciation of $2,057,574 and $231,363 respectively, or net unrealized appreciation of $1,826,211. |
See Notes to Financial Statements
29
GREEN CENTURY FUNDS STATEMENTS OF ASSETS AND LIABILITIES
July 31, 2017
| | | | | | | | | | | | |
| | | BALANCED FUND | | | EQUITY FUND | | | INTERNATIONAL INDEX
FUND | |
ASSETS: | | | | | | | | | | | | |
Investments, at value (cost $190,729,979, $141,836,780 and $21,461,009, respectively) | | $ | 225,692,797 | | | $ | 206,727,861 | | | $ | 23,338,300 | |
Foreign cash, at value (cost $61,535) | | | — | | | | — | | | | 62,604 | |
| Receivables for: | | | | | | | | | | | | |
Securities sold | | | — | | | | 3,385 | | | | — | |
Capital stock sold | | | 121,111 | | | | 634,488 | | | | 269,543 | |
Interest | | | 462,875 | | | | 7 | | | | 2 | |
Dividends | | | 68,055 | | | | 221,898 | | | | 50,818 | |
| | | | | | | | | | | | |
Total assets | | | 226,344,838 | | | | 207,587,639 | | | | 23,721,267 | |
| | | | | | | | | | | | |
LIABILITIES: | | | | | | | | | | | | |
Payable for investment securities purchased | | | — | | | | — | | | | 37,755 | |
Payable for capital stock repurchased | | | 392,237 | | | | 87,953 | | | | 2,386 | |
Accrued expenses | | | 282,672 | | | | 217,606 | | | | 20,141 | |
| | | | | | | | | | | | |
Total liabilities | | | 674,909 | | | | 305,559 | | | | 60,282 | |
| | | | | | | | | | | | |
NET ASSETS | | $ | 225,669,929 | | | $ | 207,282,080 | | | $ | 23,660,985 | |
| | | | | | | | | | | | |
NET ASSETS CONSIST OF: | | | | | | | | | | | | |
Paid-in capital | | $ | 187,483,790 | | | $ | 144,404,271 | | | $ | 21,719,449 | |
Undistributed net investment income/accumulated net investment loss | | | 59,796 | | | | 80,431 | | | | (2,540 | ) |
Accumulated net realized gains/(losses) on investments and foreign currency transactions | | | 3,163,525 | | | | (2,093,703 | ) | | | 64,517 | |
| Net unrealized appreciation on: | | | | | | | | | | | | |
Investments | | | 34,962,818 | | | | 64,891,081 | | | | 1,877,291 | |
Foreign currency translations | | | — | | | | — | | | | 2,268 | |
| | | | | | | | | | | | |
NET ASSETS | | $ | 225,669,929 | | | $ | 207,282,080 | | | $ | 23,660,985 | |
| | | | | | | | | | | | |
NET ASSET VALUE PER SHARE PER CLASS: | | | | | | | | | | | | |
| Individual Investor Class Shares: | | | | | | | | | | | | |
Net assets applicable to shares outstanding | | $ | 225,669,929 | | | $ | 207,282,080 | | | $ | 8,086,631 | |
Shares of beneficial interest issued and outstanding | | | 8,833,117 | | | | 5,447,748 | | | | 715,260 | |
Net asset value per share | | $ | 25.55 | | | $ | 38.05 | | | $ | 11.31 | |
| | | | | | | | | | | | |
| Institutional Class Shares: | | | | | | | | | | | | |
Net assets applicable to shares outstanding | | $ | — | | | $ | — | | | $ | 15,574,354 | |
Shares of beneficial interest issued and outstanding | | | — | | | | — | | | | 1,377,315 | |
Net asset value per share | | $ | — | | | $ | — | | | $ | 11.31 | |
| | | | | | | | | | | | |
See Notes to Financial Statements
30
GREEN CENTURY FUNDS STATEMENTS OF OPERATIONS
| | | | | | | | | | | | |
| | | FOR THE
YEAR ENDED
JULY 31, 2017 | | | FOR THE PERIOD
SEPTEMBER 30, 2016
(COMMENCEMENT OF
OPERATIONS) TO
JULY 31, 2017 | |
| | | BALANCED FUND | | | EQUITY FUND | | | INTERNATIONAL INDEX
FUND | |
INVESTMENT INCOME: | | | | | | | | | | | | |
Interest income (net of $282, $0 and $0 foreign withholding taxes, respectively) | | $ | 1,428,135 | | | $ | 74 | | | $ | 16 | |
Dividend and other income (net of $20,391, $0 and $30,188 foreign withholding taxes, respectively) | | | 2,278,870 | | | | 3,761,545 | | | | 298,346 | |
| | | | | | | | | | | | |
Total investment income | | | 3,707,005 | | | | 3,761,619 | | | | 298,362 | |
| | | | | | | | | | | | |
EXPENSES: | | | | | | | | | | | | |
Administrative services fee | | | 1,715,606 | | | | 1,895,645 | | | | 77,645 | |
Investment advisory fee | | | 1,343,546 | | | | 441,303 | | | | 27,207 | |
| | | | | | | | | | | | |
Total expenses | | | 3,059,152 | | | | 2,336,948 | | | | 104,852 | |
| | | | | | | | | | | | |
NET INVESTMENT INCOME | | | 647,853 | | | | 1,424,671 | | | | 193,510 | |
| | | | | | | | | | | | |
NET REALIZED AND UNREALIZED GAIN (LOSS): | | | | | | | | | | | | |
| Net realized gain (loss) on: | | | | | | | | | | | | |
Investments | �� | | 3,776,773 | | | | 1,436,238 | | | | 64,517 | |
Foreign currency transactions | | | — | | | | — | | | | (4,358 | ) |
| Change in net unrealized appreciation on: | | | | | | | | | | | | |
Investments | | | 13,909,438 | | | | 23,990,608 | | | | 1,877,291 | |
Foreign currency translations | | | — | | | | — | | | | 2,268 | |
| | | | | | | | | | | | |
NET REALIZED AND UNREALIZED GAIN ON INVESTMENTS | | | 17,686,211 | | | | 25,426,846 | | | | 1,939,718 | |
| | | | | | | | | | | | |
NET INCREASE IN NET ASSETS RESULTING FROM OPERATIONS | | $ | 18,334,064 | | | $ | 26,851,517 | | | $ | 2,133,228 | |
| | | | | | | | | | | | |
See Notes to Financial Statements
31
GREEN CENTURY FUNDS STATEMENTS OF CHANGES IN NET ASSETS
| | | | | | | | | | | | | | | | | | | | |
| | | BALANCED FUND | | | EQUITY FUND | | | INTERNATIONAL INDEX
FUND | |
| | | FOR THE
YEAR ENDED
JULY 31, 2017 | | | FOR THE
YEAR ENDED
JULY 31, 2016 | | | FOR THE
YEAR ENDED
JULY 31, 2017 | | | FOR THE
YEAR ENDED
JULY 31, 2016 | | | FOR THE PERIOD
SEPTEMBER 30, 2016
(COMMENCEMENT OF
OPERATIONS) TO
JULY 31, 2017 | |
INCREASE (DECREASE) IN NET ASSETS: | | | | | | | | | | | | | | | | | | | | |
| From operations: | | | | | | | | | | | | | | | | | | | | |
Net investment income | | $ | 647,853 | | | $ | 172,822 | | | $ | 1,424,671 | | | $ | 1,328,839 | | | $ | 193,510 | |
Net realized gain on investments and foreign currency transactions | | | 3,776,773 | | | | 2,879,774 | | | | 1,436,238 | | | | 432,901 | | | | 60,159 | |
Change in net unrealized appreciation (depreciation) on investments and foreign currency translations | | | 13,909,438 | | | | (5,590,572 | ) | | | 23,990,608 | | | | 7,175,126 | | | | 1,879,559 | |
| | | | | | | | | | | | | | | | | | | | |
Net increase (decrease) in net assets resulting from operations | | | 18,334,064 | | | | (2,537,976 | ) | | | 26,851,517 | | | | 8,936,866 | | | | 2,133,228 | |
| | | | | | | | | | | | | | | | | | | | |
| Dividends and distributions to shareholders: | | | | | | | | | | | | | | | | | | | | |
From net investment income | | | | | | | | | | | | | | | | | | | | |
Individual Investor Class | | | (284,607 | ) | | | — | | | | (1,131,540 | ) | | | (1,224,322 | ) | | | (56,292 | ) |
Institutional Class | | | — | | | | — | | | | — | | | | — | | | | (135,400 | ) |
From net realized gains | | | | | | | | | | | | | | | | | | | | |
Individual Investor Class | | | (3,916,901 | ) | | | (5,191,912 | ) | | | (2,567,630 | ) | | | (1,678,100 | ) | | | — | |
Institutional Class | | | — | | | | — | | | | — | | | | — | | | | — | |
| | | | | | | | | | | | | | | | | | | | |
Total dividends and distributions | | | (4,201,508 | ) | | | (5,191,912 | ) | | | (3,699,170 | ) | | | (2,902,422 | ) | | | (191,692 | ) |
| | | | | | | | | | | | | | | | | | | | |
| Capital share transactions: | | | | | | | | | | | | | | | | | | | | |
Proceeds from sales of shares | | | | | | | | | | | | | | | | | | | | |
Individual Investor Class | | | 43,679,879 | | | | 52,916,098 | | | | 53,553,039 | | | | 49,302,683 | | | | 10,129,789 | |
Institutional Class | | | — | | | | — | | | | — | | | | — | | | | 15,819,621 | |
Reinvestment of dividends and distributions | | | | | | | | | | | | | | | | | | | | |
Individual Investor Class | | | 4,074,147 | | | | 5,058,188 | | | | 3,611,454 | | | | 2,834,260 | | | | 55,005 | |
Institutional Class | | | — | | | | — | | | | — | | | | — | | | | 135,400 | |
Payments for shares redeemed | | | | | | | | | | | | | | | | | | | | |
Individual Investor Class1 | | | (30,021,602 | ) | | | (36,153,833 | ) | | | (46,519,786 | ) | | | (23,089,037 | ) | | | (2,850,001 | ) |
Institutional Class2 | | | — | | | | — | | | | — | | | | — | | | | (1,570,365 | ) |
| | | | | | | | | | | | | | | | | | | | |
Net increase in net assets resulting from capital share transactions | | | 17,732,424 | | | | 21,820,453 | | | | 10,644,707 | | | | 29,047,906 | | | | 21,719,449 | |
| | | | | | | | | | | | | | | | | | | | |
Total increase in net assets | | | 31,864,980 | | | | 14,090,565 | | | | 33,797,054 | | | | 35,082,350 | | | | 23,660,985 | |
NET ASSETS: | | | | | | | | | | | | | | | | | | | | |
Beginning of year | | | 193,804,949 | | | | 179,714,384 | | | | 173,485,026 | | | | 138,402,676 | | | | — | |
| | | | | | | | | | | | | | | | | | | | |
End of year | | $ | 225,669,929 | | | $ | 193,804,949 | | | $ | 207,282,080 | | | $ | 173,485,026 | | | $ | 23,660,985 | |
| | | | | | | | | | | | | | | | | | | | |
Undistributed net investment income/accumulated net investment loss at end of period | | | 59,796 | | | | — | | | | 80,431 | | | | 20,271 | | | | (2,540 | ) |
| 1 | Net of redemption fee proceeds of $7,443, $13,790, $5,463, $2,898 and $514, respectively. |
| 2 | Net of redemption fee proceeds of $0, $0, $0, $0 and $243, respectively. |
See Notes to Financial Statements
32
GREEN CENTURY BALANCED FUND FINANCIAL HIGHLIGHTS
| | | | | | | | | | | | | | | | | | | | |
| | | FOR THE YEARS ENDED JULY 31, | |
| | | 2017 | | | 2016 | | | 2015 | | | 2014 | | | 2013 | |
Net Asset Value, beginning of year | | $ | 23.93 | | | $ | 25.07 | | | $ | 23.74 | | | $ | 21.43 | | | $ | 18.06 | |
| | | | | | | | | | | | | | | | | | | | |
| Income (loss) from investment operations: | | | | | | | | | | | | | | | | | | | | |
Net investment income | | | 0.08 | | | | 0.02 | | | | 0.01 | | | | 0.09 | | | | 0.13 | |
Net realized and unrealized gain (loss) on investments | | | 2.05 | | | | (0.48 | ) | | | 2.51 | | | | 2.31 | | | | 3.37 | |
| | | | | | | | | | | | | | | | | | | | |
Total increase (decrease) from investment operations | | | 2.13 | | | | (0.46 | ) | | | 2.52 | | | | 2.40 | | | | 3.50 | |
| | | | | | | | | | | | | | | | | | | | |
| Less dividends: | | | | | | | | | | | | | | | | | | | | |
Dividends from net investment income | | | (0.03 | ) | | | — | | | | (0.02 | ) | | | (0.09 | ) | | | (0.13 | ) |
Distributions from net realized gains | | | (0.48 | ) | | | (0.68 | ) | | | (1.17 | ) | | | — | | | | — | |
| | | | | | | | | | | | | | | | | | | | |
Total decrease from dividends | | | (0.51 | ) | | | (0.68 | ) | | | (1.19 | ) | | | (0.09 | ) | | | (0.13 | ) |
| | | | | | | | | | | | | | | | | | | | |
Net Asset Value, end of year | | $ | 25.55 | | | $ | 23.93 | | | $ | 25.07 | | | $ | 23.74 | | | $ | 21.43 | |
| | | | | | | | | | | | | | | | | | | | |
Total return | | | 9.07 | % | | | (1.73 | )% | | | 10.84 | % | | | 11.20 | % | | | 19.44 | % |
| Ratios/Supplemental data: | | | | | | | | | | | | | | | | | | | | |
Net assets, end of year (in 000’s) | | $ | 225,670 | | | $ | 193,805 | | | $ | 179,714 | | | $ | 121,907 | | | $ | 85,650 | |
Ratio of expenses to average net assets | | | 1.48 | % | | | 1.48 | % | | | 1.48 | % | | | 1.48 | % | | | 1.48 | % |
Ratio of net investment income to average net assets | | | 0.31 | % | | | 0.10 | % | | | 0.03 | % | | | 0.44 | % | | | 0.66 | % |
Portfolio turnover | | | 26 | % | | | 24 | % | | | 30 | % | | | 42 | % | | | 31 | % |
GREEN CENTURY EQUITY FUND FINANCIAL HIGHLIGHTS
| | | | | | | | | | | | | | | | | | | | |
| | | FOR THE YEARS ENDED JULY 31, | |
| | | 2017 | | | 2016 | | | 2015 | | | 2014 | | | 2013 | |
Net Asset Value, beginning of year | | $ | 33.65 | | | $ | 32.73 | | | $ | 30.11 | | | $ | 26.30 | | | $ | 20.81 | |
| | | | | | | | | | | | | | | | | | | | |
| Income from investment operations: | | | | | | | | | | | | | | | | | | | | |
Net investment income | | | 0.27 | | | | 0.27 | | | | 0.20 | | | | 0.19 | | | | 0.21 | |
Net realized and unrealized gain on investments | | | 4.84 | | | | 1.27 | | | | 2.96 | | | | 3.79 | | | | 5.48 | |
| | | | | | | | | | | | | | | | | | | | |
Total increase from investment operations | | | 5.11 | | | | 1.54 | | | | 3.16 | | | | 3.98 | | | | 5.69 | |
| | | | | | | | | | | | | | | | | | | | |
| Less dividends: | | | | | | | | | | | | | | | | | | | | |
Dividends from net investment income | | | (0.22 | ) | | | (0.25 | ) | | | (0.19 | ) | | | (0.17 | ) | | | (0.20 | ) |
Distributions from net realized gains | | | (0.49 | ) | | | (0.37 | ) | | | (0.35 | ) | | | — | | | | — | |
| | | | | | | | | | | | | | | | | | | | |
Total decrease from dividends | | | (0.71 | ) | | | (0.62 | ) | | | (0.54 | ) | | | (0.17 | ) | | | (0.20 | ) |
| | | | | | | | | | | | | | | | | | | | |
Net Asset Value, end of year | | $ | 38.05 | | | $ | 33.65 | | | $ | 32.73 | | | $ | 30.11 | | | $ | 26.30 | |
| | | | | | | | | | | | | | | | | | | | |
Total return | | | 15.42 | % | | | 4.83 | % | | | 10.54 | % | | | 15.16 | % | | | 27.49 | % |
| Ratios/Supplemental data: | | | | | | | | | | | | | | | | | | | | |
Net assets, end of year (in 000’s) | | $ | 207,282 | | | $ | 173,485 | | | $ | 138,403 | | | $ | 95,358 | | | $ | 66,809 | |
Ratio of expenses to average net assets | | | 1.25 | % | | | 1.25 | % | | | 1.25 | % | | | 1.25 | % | | | 1.25 | % |
Ratio of net investment income to average net assets | | | 0.76 | % | | | 0.89 | % | | | 0.68 | % | | | 0.72 | % | | | 0.92 | % |
Portfolio turnover | | | 17 | % | | | 19 | % | | | 13 | % | | | 32 | % | | | 17 | % |
See Notes to Financial Statements
33
GREEN CENTURY MSCI INTERNATIONAL INDEX FUND INDIVIDUAL INVESTOR CLASS FINANCIAL HIGHLIGHTS
| | | | |
| | | FOR THE PERIOD
SEPTEMBER 30, 2016
(COMMENCEMENT OF
OPERATIONS) TO
JULY 31, 2017 | |
Net Asset Value, beginning of period | | $ | 10.00 | |
| | | | |
| Income from investment operations: | | | | |
Net investment income | | | 0.10 | |
Net realized and unrealized gain on investments | | | 1.31 | |
| | | | |
Total increase from investment operations | | | 1.41 | |
| | | | |
| Less dividends: | | | | |
Dividends from net investment income | | | (0.10 | ) |
Distributions from net realized gains | | | — | |
| | | | |
Total decrease from dividends | | | (0.10 | ) |
| | | | |
Net Asset Value, end of period | | $ | 11.31 | |
| | | | |
Total return | | | 14.18 | %(a) |
| Ratios/Supplemental data: | | | | |
Net assets, end of period (in 000’s) | | $ | 8,087 | |
Ratio of expenses to average net assets | | | 1.28 | %(b) |
Ratio of net investment income to average net assets | | | 1.79 | %(b) |
Portfolio turnover | | | 13 | %(a) |
GREEN CENTURY MSCI INTERNATIONAL INDEX FUND INSTITUTIONAL CLASS FINANCIAL HIGHLIGHTS
| | | | |
| | | FOR THE PERIOD
SEPTEMBER 30, 2016
(COMMENCEMENT OF
OPERATIONS) TO
JULY 31, 2017 | |
Net Asset Value, beginning of period | | $ | 10.00 | |
| | | | |
| Income from investment operations: | | | | |
Net investment income | | | 0.12 | |
Net realized and unrealized gain on investments | | | 1.31 | |
| | | | |
Total increase from investment operations | | | 1.43 | |
| | | | |
| Less dividends: | | | | |
Dividends from net investment income | | | (0.12 | ) |
Distributions from net realized gains | | | — | |
| | | | |
Total decrease from dividends | | | (0.12 | ) |
| | | | |
Net Asset Value, end of period | | $ | 11.31 | |
| | | | |
Total return | | | 14.36 | %(a) |
| Ratios/Supplemental data: | | | | |
Net assets, end of period (in 000’s) | | $ | 15,574 | |
Ratio of expenses to average net assets | | | 0.98 | %(b) |
Ratio of net investment income to average net assets | | | 2.09 | %(b) |
Portfolio turnover | | | 13 | %(a) |
See Notes to Financial Statements
34
| | |
GREEN CENTURY FUNDS NOTES TO FINANCIAL STATEMENTS | | |
NOTE 1 — Organization and Signif 1/2 icant Accounting Policies
Green Century Funds (the “Trust”) is a Massachusetts business trust which offers three separate series, the Green Century Balanced Fund (the “Balanced Fund”), the Green Century Equity Fund (the “Equity Fund”) and the Green Century MSCI International Index Fund (the “Inte rnational Index Fund”), each a “Fund” and collectively, the “Funds”. The Trust is registered under the Investment Company Act of 1940, as amended (the “Act”), as an open-end, diversified management investment company. The Trust accounts separately for the assets, liabilities and operations of each series. The Balanced Fund commenced operations on March 18, 1992, the Equity Fund commenced operations on September 13, 1995 and the International Index Fund commenced operations on September 30, 2016.
The preparation of financial statements in conformity with U.S. generally accepted accounting principles (“U.S. GAAP”) requires management to make estimates and assumptions that affect the reported amounts of assets and liabilities and disclosure of contingent assets and liabilities at the date of the financial statements and the reported amounts of revenues and expenses during the reporting period. Actual results could differ from those estimates.
Each Fund is an investment company and accordingly follows the investment company accounting and reporting guidance of the Financial Accounting Standards Board (the “FASB”) Accounting Standard Codification Topic 946 “Financial Services—Investment Companies”.
The following is a summary of the Funds’ significant accounting policies:
| | (A) | Investment Valuation: Equity securities listed on U.S. national securities exchanges other than NASDAQ are valued at last sale price. If a last sale price is not available, securities listed on U.S. national exchanges other than NASDAQ are valued at the mean between the closing bid and closing ask prices. NASDAQ National Market® and SmallCapSM securities are valued at the NASDAQ Official Closing Price (“NOCP”). The NOCP is based on the last traded price if it falls within the concurrent best bid and ask prices and is normalized pursuant to NASDAQ’s published procedures if it falls outside this range. If a NOCP is not available for any such security, the security is valued at the last sale price, or, if there have been no sales that day, at the mean between the closing bid and closing ask prices. Unlisted U.S. equity securities are valued at last sale price, or when last sale prices are not available, at the last quoted bid price. Debt securities (other than certificates of deposit and short-term obligations maturing in sixty days or less) are valued on the basis of valuations furnished by a pricing service which takes into account appropriate factors such as institution-size trading in similar groups of securities, yield, quality, coupon rate, maturity, type of issue, and other market data, without exclusive reliance on quoted prices or exchange or over-the-counter prices. Securities, if any, for which there are no such valuations or quotations available, or for which the market quotation or valuation provided by a pricing service is deemed not reliable, are valued at fair value by management as determined in good faith under guidelines established by the Trustees. Certificates of deposit are valued at cost plus accrued interest, and short-term obligations maturing in sixty days or less are valued at amortized cost, both of which approximate market value. |
For non-U.S. securities traded in foreign markets, the International Index Fund uses a fair value model developed by an independent pricing service to assist in valuing those securities. If an event occurs after the time at which the market for foreign securities held by the Fund closes but before the time that the Fund’s next
35
| | |
GREEN CENTURY FUNDS NOTES TO FINANCIAL STATEMENTS | | continued |
NAV is calculated, such event may cause the closing price on the foreign exchange to not represent the readily available reliable market value quotation for such securities at the time the Fund determines its NAV. In such a case, the Fund will use the fair value of such securities as determined under the Fund’s valuation procedures. Events after the close of trading on a foreign market that could require a Fund to fair value some or all of its foreign securities include, among others, securities trading in the U.S. and other markets, corporate announcements, natural and other disasters, and political and other events. Among other elements of analysis in the determination of a security’s fair value, the Board has authorized the use of one or more independent research services to assist with such determinations. An independent research service may use statistical analyses and quantitative models to help determine fair value as of the time the Fund calculates its NAV. There can be no assurance that such models accurately reflect the behavior of the applicable markets or the effect of the behavior of such markets on the fair value of securities, or that such markets will continue to behave in a fashion that is consistent with such models. Unlike the closing price of a security on an exchange, fair value determinations employ elements of judgment. Consequently, the fair value assigned to a security may not represent the actual value that the Fund could obtain if it were to sell the security at the time of the close of the NYSE. Pursuant to procedures adopted by the Board, the Fund is not obligated to use the fair valuations suggested by any research service, and valuation recommendations provided by such research services may be overridden if other events have occurred or if other fair valuations are determined in good faith to be more accurate. Unless an event is such that it causes the Fund to determine that the closing prices for one or more securities do not represent readily available reliable market value quotations at the time the Fund determines its NAV, events that occur between the time of the close of the foreign market on which they are traded and the close of regular trading on the NYSE will not be reflected in the Fund’s NAV.
Various inputs are used in determining the value of the Fund’s investments. These inputs are summarized in the three broad levels listed below:
Level 1 — quoted prices for active markets for identical securities. An active market for the security is a market in which transactions occur with sufficient frequency and volume to provide pricing information on an ongoing basis. A quoted price in an active market provides the most reliable evidence of fair value.
Level 2 — other significant observable inputs (including quoted prices for similar securities, interest rates, prepayment speeds, credit risk, etc.). Quoted prices for identical or similar assets in markets that are not active. Investments valued at amortized cost. Inputs that are derived principally from or corroborated by observable market data. An adjustment to any observable input that is significant to the fair value may render the measurement a Level 3 measurement.
Level 3 — significant unobservable inputs, including the Fund’s own assumptions in determining the fair value of investments.
The inputs or methodology used for valuing securities are not necessarily an indication of the risk associated with investing in those securities.
The following is a summary of the inputs used to value the Balanced Fund’s net assets as of July 31, 2017:
| | | | | | | | | | | | | | | | |
| | | LEVEL 1 | | | LEVEL 2 | | | LEVEL 3 | | | TOTAL | |
COMMON STOCKS | | | $142,859,159 | | | | $ — | | | | $ — | | | | $142,859,159 | |
BONDS & NOTES | | | — | | | | 72,100,049 | | | | — | | | | 72,100,049 | |
CERTIFICATES OF DEPOSIT | | | — | | | | 332,063 | | | | — | | | | 332,063 | |
SHORT-TERM OBLIGATIONS | | | — | | | | 10,401,526 | | | | — | | | | 10,401,526 | |
| | | | | | | | | | | | | | | | |
TOTAL | | | $142,859,159 | | | | $82,833,638 | | | | $ — | | | | $225,692,797 | |
| | | | | | | | | | | | | | | | |
36
| | |
GREEN CENTURY FUNDS NOTES TO FINANCIAL STATEMENTS | | continued |
The following is a summary of the inputs used to value the Equity Fund’s net assets as of July 31, 2017:
| | | | | | | | | | | | | | | | |
| | | LEVEL 1 | | | LEVEL 2 | | | LEVEL 3 | | | TOTAL | |
COMMON STOCKS | | | $206,423,313 | | | | $ — | | | | $ — | | | | $206,423,313 | |
SHORT-TERM OBLIGATIONS | | | — | | | | 304,548 | | | | — | | | | 304,548 | |
| | | | | | | | | | | | | | | | |
TOTAL | | | $206,423,313 | | | | $304,548 | | | | $ — | | | | $206,727,861 | |
| | | | | | | | | | | | | | | | |
The following is a summary of the inputs used to value the International Index Fund’s net assets as of July 31, 2017:
| | | | | | | | | | | | | | | | |
| | | LEVEL 1 | | | LEVEL 2 | | | LEVEL 3 | | | TOTAL | |
| COMMON STOCKS | | | | | | | | | | | | | | | | |
JAPAN | | | $ — | | | | $4,740,128 | | | | $ — | | | | $4,740,128 | |
FRANCE | | | — | | | | 2,609,876 | | | | — | | | | 2,609,876 | |
UNITED KINGDOM | | | — | | | | 2,579,025 | | | | — | | | | 2,579,025 | |
GERMANY | | | — | | | | 2,380,563 | | | | — | | | | 2,380,563 | |
CANADA | | | 2,087,614 | | | | — | | | | — | | | | 2,087,614 | |
AUSTRALIA | | | — | | | | 1,860,164 | | | | — | | | | 1,860,164 | |
SWITZERLAND | | | — | | | | 1,631,547 | | | | — | | | | 1,631,547 | |
NETHERLANDS | | | — | | | | 1,574,246 | | | | — | | | | 1,574,246 | |
DENMARK | | | — | | | | 871,241 | | | | — | | | | 871,241 | |
SPAIN | | | — | | | | 718,029 | | | | — | | | | 718,029 | |
SWEDEN | | | 170,259 | | | | 296,847 | | | | — | | | | 467,106 | |
ITALY | | | — | | | | 442,155 | | | | — | | | | 442,155 | |
HONG KONG | | | — | | | | 378,314 | | | | — | | | | 378,314 | |
IRELAND | | | — | | | | 241,540 | | | | — | | | | 241,540 | |
SINGAPORE | | | — | | | | 230,506 | | | | — | | | | 230,506 | |
BELGIUM | | | — | | | | 149,564 | | | | — | | | | 149,564 | |
FINLAND | | | — | | | | 121,067 | | | | — | | | | 121,067 | |
NORWAY | | | — | | | | 110,777 | | | | — | | | | 110,777 | |
NEW ZEALAND | | | — | | | | 55,832 | | | | — | | | | 55,832 | |
| | | | | | | | | | | | | | | | |
TOTAL COMMONS STOCKS | | | 2,257,873 | | | | 20,991,421 | | | | — | | | | 23,249,294 | |
| | | | | | | | | | | | | | | | |
SHORT-TERM OBLIGATIONS | | | — | | | | 89,006 | | | | — | | | | 89,006 | |
| | | | | | | | | | | | | | | | |
TOTAL | | | $2,257,873 | | | | $21,080,427 | | | | $ — | | | | $23,338,300 | |
| | | | | | | | | | | | | | | | |
The Funds adopted the FASB amendments to authoritative guidance which require the Funds to disclose details of transfers in and out of Level 1 and Level 2 measurements and Level 2 and Level 3 measurements and the reasons for the transfers. For the period ended July 31, 2017, there were no transfers in and out of Level 1, Level 2 and Level 3. None of the Funds held any Level 3 securities during the period ended July 31, 2017. It is the Funds’ policy to recognize transfers into and out of all Levels at the end of the reporting period.
| | (B) | Securities Transactions and Investment Income: Securities transactions are recorded on a trade date basis. Realized gains and losses from securities transactions are determined using the identified cost basis. Interest income, including amortization of premiums and accretion of discounts on bonds, is recognized on the accrual basis and dividend income is recorded on ex-dividend date. Income, expenses and realized and unrealized gains and losses on investments are allocated to each class of shares in proportion to their relative shares outstanding. |
37
| | |
GREEN CENTURY FUNDS NOTES TO FINANCIAL STATEMENTS | | continued |
| | (C) | Options Transactions: The Balanced Fund may utilize options to hedge or protect from adverse movements in the market values of its portfolio securities and to enhance return. The Equity Fund and the International Index Fund are authorized to utilize options to hedge against possible increases in the value of securities which are expected to be purchased by the Equity Fund or the International Index Fund or possible declines in the value of securities which are expected to be sold by the Equity Fund or the International Index Fund. The use of options involves risk such as the possibility of illiquid markets or imperfect correlation between the value of the option and the underlying securities. The Funds are also authorized to write put and call options. Premiums received upon writing put or call options are recorded as an asset with a corresponding liability which is subsequently adjusted to the current market value of the option. Changes between the initial premiums received and the current market value of the options are recorded as unrealized gains or losses. When an option is closed, expired or exercised, a gain or loss is realized and the liability is eliminated. The Funds continue to bear the risk of adverse movements in the price of the underlying assets during the period of the option, although any potential loss during the period would be reduced by the amount of the option premium received. As required by the Act, liquid securities are designated as collateral in an amount equal to the market value of open options contracts. In the period ended July 31, 2017, neither the Balanced Fund, the Equity Fund nor the International Index Fund utilized options or wrote put or call options. |
| | (D) | Repurchase Agreements: The Funds may enter into repurchase agreements with selected banks or broker-dealers that are deemed by the Funds’ adviser to be creditworthy pursuant to guidelines established by the Board of Trustees. Each repurchase agreement is recorded at cost, which approximates fair value. The Funds require that the market value of collateral, represented by securities (primarily U.S. Government securities), be sufficient to cover payments of interest and principal, and that the collateral be maintained in a segregated account with a custodian bank in a manner sufficient to enable the Funds to obtain those securities in the event of a default of the counterparty. In the event of default or bankruptcy by the counterparty to the repurchase agreement, retention of the collateral may be subject to legal proceedings. As of July 31, 2017, neither the Balanced Fund, the Equity Fund, nor the International Index Fund held repurchase agreements. |
| | (E) | Currency Translation and Contracts: Securities and other assets and liabilities denominated in foreign currencies are translated into U.S. dollar amounts on the date of valuation. Purchases and sales of securities, and income and expense items denominated in foreign currencies, are translated into U.S. dollar amounts on the respective dates of such transactions. Occasionally, events impact the availability or reliability of foreign exchange rates used to convert the U.S. dollar equivalent value. If such an event occurs, the foreign exchange rate will be valued at fair value using procedures established and approved by the Board of Trustees. The Funds do not separately report the effect of fluctuations in foreign exchange rates from changes in market prices on securities held. Such fluctuations are included with the net realized and unrealized gain or loss from investments. Realized foreign exchange gains or losses arise from sales of foreign currencies, currency gains or losses realized between the trade and settlement dates on securities transactions, and the difference between the recorded amounts of dividends, interest, and foreign withholding taxes and the U.S. dollar equivalent of the amounts actually received or paid. Net unrealized foreign exchange gains and losses arise from changes in fair value of assets and liabilities other than investments in securities held at the end of the reporting period, resulting from changes in exchange rates. When a Fund purchases or sells foreign securities, it enters into foreign exchange contracts to minimize foreign exchange risk from the trade date to the settlement date of the transactions. A foreign exchange contract is an agreement between two parties to exchange different currencies at an agreed-upon exchange rate on a specified date. The International Index Fund had no open foreign currency spot contracts outstanding as of July 31, 2017. |
38
| | |
GREEN CENTURY FUNDS NOTES TO FINANCIAL STATEMENTS | | continued |
| | (F) | Distributions: Distributions to shareholders are recorded on the ex-dividend date. The Funds declare and pay dividends of net investment income, if any, semi-annually and distribute net realized capital gains, if any, annually. The amount and character of income and net realized gains to be distributed are determined in accordance with Federal income tax rules and regulations, which may differ from U.S. GAAP. To the extent that these differences are attributable to permanent book and tax accounting differences, the components of net assets have been adjusted. |
| | (G) | Federal Taxes: Each series of the Trust is treated as a separate entity for Federal income tax purposes. Each Fund’s policy is to comply with the provisions of the Internal Revenue Code applicable to regulated investment companies (“RICs”). Accordingly, no provisions for Federal income or excise tax are necessary. |
Accounting for Uncertainty in Income Taxes addresses the accounting for uncertainty in income taxes and establishes for all entities, including pass-through entities such as the Funds, a minimum threshold for financial statement recognition of the benefit of positions taken in filing tax returns (including whether an entity is taxable in a particular jurisdiction). The Funds recognize tax benefits only if it is more likely than not that a tax position (including the Funds’ assertion that their income is exempt from tax) will be sustained upon examination. The Funds had no material uncertain tax positions and have not recorded a liability for unrecognized tax benefits as of July 31, 2017. Also, the Funds had recognized no interest and penalties related to uncertain tax benefits through July 31, 2017. At July 31, 2017, the tax years 2014 through 2017 remain open to examination by the Internal Revenue Service.
| | (H) | Redemption Fee: A 2.00% redemption fee is retained by the Funds to offset the effect of transaction costs and other expenses associated with short-term investing. The fee is imposed on redemptions or exchanges of shares held 60 days or less from their purchase date. For the period ended July 31, 2017, the Balanced Fund, Equity Fund and International Index Fund received $7,443, $5,463 and $757 respectively, in redemption fees. Redemption fees are recorded as an adjustment to paid-in capital. |
| | (I) | Indemnification: The Funds’ organizational documents provide that trustees and officers are indemnified against certain liabilities arising out of the performance of their duties to the Funds. In the normal course of business, the Funds may also enter into contracts that provide general indemnifications. The Funds’ maximum exposure under these arrangements is unknown as this would be dependent on future claims that may be made against the Funds. The risk of material loss from such claims is considered remote. As of July 31, 2017, no liability has been accrued. |
| | (J) | Offsetting of Assets and Liabilities: As of July 31, 2017, there are no master netting arrangements related to the Funds. The Funds’ Statements of Assets and Liabilities present derivative instruments on a gross basis, if applicable. As of July 31, 2017, no derivative instruments were held by the Funds. |
NOTE 2 — Transactions With Affiliates
| | (A) | Investment Adviser: Green Century Capital Management, Inc. (“Green Century”) is the adviser (“the Adviser”) for the Funds. Green Century is owned by Paradigm Partners. Green Century oversees the portfolio management of the Funds on a day-to-day basis. The Balanced Fund pays Green Century a fee, accrued daily and paid monthly, at an annual rate equal to 0.65% of the Balanced Fund’s average daily net assets. The Equity Fund pays Green Century a fee, accrued daily and paid monthly, at an annual rate of 0.25% of the Equity Fund’s average daily net assets up to but not including $100 million, 0.22% of average daily net assets including $100 million up to but not including $500 million, 0.17% of average daily net assets including $500 million up to but not including $1 billion and 0.12% of average daily net assets equal to or in excess of $1 billion. The International Index Fund pays Green Century a fee, accrued daily and paid monthly, at an annual rate of 0.28% of the International Index Fund’s average daily net assets. |
39
| | |
GREEN CENTURY FUNDS NOTES TO FINANCIAL STATEMENTS | | continued |
| | (B) | Subadvisers: Trillium Asset Management, LLC (“Trillium”) is the subadviser for the Balanced Fund. Trillium is paid a fee by the Adviser at an annual rate of 0.40% on the first $30 million of average daily net assets and 0.35% on average daily net assets in excess of $30 million for its services. For the year ended July 31, 2017, Green Century accrued fees of $738,451 to Trillium. Northern Trust Investments, Inc. (“Northern Trust”) is the subadviser for the Equity Fund and International Index Fund. For the Equity Fund, Northern Trust is paid a fee by the Adviser based on Northern Trust’s fee schedule of the greater of $75,000 or 0.10% of the value of the average daily net assets of the Fund up to but not including $50 million, 0.05% of the average daily net assets of the Fund from and including $50 million up to but not including $100 million and 0.03% of the average daily net assets of the Fund equal to or in excess of $100 million for its services. For the International Index Fund, Northern Trust is paid a fee by the Adviser based on Northern Trust’s fee schedule of the greater of $100,000 or 0.17% of the value of the average daily net assets of the Fund up to but not including $50 million, 0.12% of the average daily net assets of the Fund from and including $50 million up to but not including $100 million and 0.08% of the average daily net assets of the Fund equal to or in excess of $100 million for its services. For the year ended July 31, 2017, Green Century accrued fees of $101,087 to Northern Trust for the Equity Fund and for the period ended July 31, 2017, Green Century accrued fees of $83,562 to Northern trust for the International Index Fund. |
| | (C) | Administrator: Green Century is the administrator (“the Administrator”) of the Green Century Funds. Pursuant to the Administrative Services Agreement, Green Century pays all the expenses of each Fund other than the investment advisory fees; interest; taxes; brokerage costs and other capital expenses; expenses of non-interested trustees (including counsel fees) and any extraordinary expenses. The Balanced Fund pays Green Century a fee at a rate such that immediately following any payment to the Administrator, the total operating expenses of the Fund, on an annual basis, do not exceed 1.48% of the Fund’s average daily net assets. The Equity Fund pays Green Century a fee at a rate such that immediately following any payment to the Administrator, the total operating expenses of the Fund, on an annual basis, do not exceed 1.25% of the Fund’s average daily net assets. The International Index Fund pays Green Century a fee at a rate such that immediately following any payment to the Administrator, the total operating expenses of the Fund, on an annual basis, do not exceed 1.28% of the Fund’s Individual Investor Class average daily net assets, and 0.98% of the Fund’s Institutional Class average daily net assets. |
| | (D) | Subadministrator: Pursuant to a Subadministrative and Fund Accounting Services Agreement with the Administrator, UMB Fund Services, Inc. (“UMBFS”) as Subadministrator and Fund Accountant, is responsible for conducting fund accounting and certain day-to-day administration of the Trust subject to the supervision and direction of the Administrator. For the year ended July 31, 2017, Green Century accrued fees of $125,102 and $113,255, to UMBFS related to services performed on behalf of the Balanced Fund and the Equity Fund, respectively. For the period ended July 31, 2017, Green Century accrued fees of $75,973 to UMBFS related to services performed on behalf of the International Index Fund. |
| | (E) | Index Agreements: The Equity Fund invests in the securities of the companies included in the MSCI KLD 400 Social ex Fossil Fuels Index (the “KLD Index”). The Index is owned and maintained by MSCI ESG Research (“MSCI”). For the use of the KLD Index for the Equity Fund, MSCI is paid by the Adviser an annual license fee of $26,000, plus the greater of $26,000 or at an annual rate of 0.05% on the first $100 million of average daily net assets, 0.04% on the next $100 million of average daily net assets, and 0.03% on average daily net assets in excess of $200 million. The International Index Fund invests in the securities included in the MSCI World ex USA SRI ex Fossil Fuels Index (the “World Index”). The Index is owned and maintained by MSCI. For the use of the World Index for the International Index Fund, MSCI is paid by the Adviser an annual license fee of $16,000, plus the greater of $25,000 or at an annual rate of 0.05% on the first $100 million of average daily net |
40
| | |
GREEN CENTURY FUNDS NOTES TO FINANCIAL STATEMENTS | | continued |
| | assets, 0.04% on the next $100 million of average daily net assets, and 0.03% on average daily net assets in excess of $200 million. For the year ended July 31, 2017, Green Century accrued fees of $110,783 to MSCI for the Equity Fund. For the period ended July 31, 2017, Green Century accrued fees of $22,877 for the International Index Fund. |
NOTE 3 — Investment Transactions
For the period ended July 31, 2017, the Balanced Fund’s cost of purchases and proceeds from sales of securities, other than short-term securities, aggregated $59,204,616 and $51,684,948, respectively. The Equity Fund’s cost of purchases and proceeds from sales of securities, other than short-term securities, aggregated $39,691,783 and $31,669,479, respectively. The International Index Fund’s cost of purchases and proceeds from sales of securities, other than short-term securities, aggregated $22,822,067 and $1,515,612, respectively.
NOTE 4 — Federal Income Tax Information
The tax basis of the components of distributable net earnings (deficit) at July 31, 2017 were as follows:
| | | | | | | | | | | | |
| | | BALANCED FUND | | | EQUITY FUND | | | INTERNATIONAL INDEX FUND | |
Undistributed ordinary income | | $ | 1,399,014 | | | $ | 333,532 | | | $ | 33,001 | |
Undistributed long-term capital gains | | | 1,467,597 | | | | 875,295 | | | | 80,056 | |
| | | | | | | | | | | | |
Tax accumulated earnings | | | 2,866,611 | | | | 1,208,827 | | | | 113,057 | |
| | | | | | | | | | | | |
Accumulated capital and other losses | | | — | | | | — | | | | — | |
Unrealized appreciation (depreciation) | | | 35,319,528 | | | | 61,668,982 | | | | 1,826,211 | |
Foreign currency translations | | | — | | | | — | | | | 2,268 | |
| | | | | | | | | | | | |
Distributable net earnings (deficit) | | $ | 38,186,139 | | | $ | 62,877,809 | | | $ | 1,941,536 | |
| | | | | | | | | | | | |
The tax character of distributions paid during the period ended July 31, 2017 and the fiscal year ended July 31, 2016 were as follows:
| | | | | | | | | | | | | | | | |
| | | BALANCED FUND | | | EQUITY FUND | |
| | | YEAR ENDED
JULY 31, 2017 | | | YEAR ENDED
JULY 31, 2016 | | | YEAR ENDED
JULY 31, 2017 | | | YEAR ENDED
JULY 31, 2016 | |
Ordinary income | | $ | 694,269 | | | $ | 385,878 | | | $ | 1,131,540 | | | $ | 1,461,588 | |
Long-term capital gains | | | 3,507,239 | | | | 4,806,034 | | | | 2,567,630 | | | | 1,440,834 | |
| | | | |
| | | INTERNATIONAL INDEX FUND | |
| | | PERIOD ENDED JULY 31, 2017 | |
Ordinary income | | $ | 191,692 | |
Long-term capital gains | | | — | |
41
| | |
GREEN CENTURY FUNDS NOTES TO FINANCIAL STATEMENTS | | concluded |
NOTE 5 — Capital Share Transactions
Capital Share transactions for the Balanced Fund, the Equity Fund and the International Index Fund were as follows:
| | | | | | | | | | | | | | | | |
| | | BALANCED FUND | | | EQUITY FUND | |
| | | YEAR ENDED
JULY 31, 2017 | | | YEAR ENDED
JULY 31, 2016 | | | YEAR ENDED
JULY 31, 2017 | | | YEAR ENDED
JULY 31, 2016 | |
Shares sold | | | 1,795,775 | | | | 2,284,256 | | | | 1,531,879 | | | | 1,578,127 | |
Reinvestment of dividends | | | 171,939 | | | | 219,635 | | | | 105,260 | | | | 88,899 | |
Shares redeemed | | | (1,234,278 | ) | | | (1,573,793 | ) | | | (1,345,694 | ) | | | (739,540 | ) |
| | | | | | | | | | | | | | | | |
| | | 733,436 | | | | 930,098 | | | | 291,445 | | | | 927,486 | |
| | | | | | | | | | | | | | | | |
| | | | | | | | |
| | | INTERNATIONAL INDEX INDIVIDUAL
INVESTOR CLASS | | | INTERNATIONAL INDEX
INSTITUTIONAL CLASS | |
| | | PERIOD ENDED JULY 31, 2017 | | | PERIOD ENDED
JULY 31, 2017 | |
Shares sold | | | 983,656 | | | | 1,508,010 | |
Reinvestment of dividends | | | 5,042 | | | | 12,463 | |
Shares redeemed | | | (273,438 | ) | | | (143,158 | ) |
| | | | | | | | |
| | | 715,260 | | | | 1,377,315 | |
| | | | | | | | |
NOTE 6 — Subsequent Events
Subsequent to July 31, 2017 and through the date on which the financial statements were available for issuance, management has evaluated subsequent events and concluded there were no subsequent events requiring accrual or disclosure.
42
REPORT OF INDEPENDENT REGISTERED PUBLIC ACCOUNTING FIRM
Board of Trustees and Shareholders of
Green Century Funds:
We have audited the accompanying statements of assets and liabilities, including the portfolios of investments, of Green Century Balanced Fund, Green Century Equity Fund, and Green Century MSCI International Index Fund (collectively, the “Funds”), each a series of Green Century Funds, as of July 31, 2017, and the related statements of operations for the year or period then ended, the statements of changes in net assets for each of the years or periods in the two-year period then ended, and the financial highlights for each of the years or periods in the five-year period then ended. These financial statements and financial highlights are the responsibility of the Funds’ management. Our responsibility is to express an opinion on these financial statements and financial highlights based on our audits.
We conducted our audits in accordance with auditing standards of the Public Company Accounting Oversight Board (United States). Those standards require that we plan and perform the audit to obtain reasonable assurance about whether the financial statements and financial highlights are free of material misstatement. An audit includes examining, on a test basis, evidence supporting the amounts and disclosures in the financial statements. Our procedures included confirmation of securities owned as of July 31, 2017, by correspondence with custodian and brokers, or by other appropriate auditing procedures. An audit also includes assessing the accounting principles used and significant estimates made by management, as well as evaluating the overall financial statement presentation. We believe that our audits provide a reasonable basis for our opinion.
In our opinion, the financial statements and financial highlights referred to above present fairly, in all material respects, the financial position of the aforementioned Funds as of July 31, 2017, and the results of their operations for the year or period then ended, the changes in their net assets for each of the years or periods in the two-year period then ended, and the financial highlights for each of the years or periods in the five-year period then ended, in conformity with U.S. generally accepted accounting principles.
Boston, Massachusetts
September 29, 2017
43
TAX INFORMATION
For the year ended July 31, 2017, the Balanced Fund and Equity Fund had 77.48% and 100%, respectively, of dividends paid from net investment income qualified for the 70% dividends received deduction available to corporate shareholders. For the period ended July 31, 2017, the International Fund had 0% of dividends paid from net investment income qualified for the 70% dividends received deduction available to corporate shareholders.
For the year ended July 31, 2017, the Balanced Fund and Equity Fund had 87.75% and 100%, respectively, of dividends paid from net investment income, designated as qualified dividend income. For the period ended July 31, 2017, the International Fund had 100% of dividends paid from net investment income, designated as qualified dividend income.
GREEN CENTURY FUNDS TRUSTEES AND OFFICERS
The following table presents information about each Trustee and each Officer of the Trust as of July 31, 2017. Each Trustee and each Officer of the Trust noted as an “interested person” (as defined in the 1940 Act), and noted with an asterisk, is interested by virtue of his or her position with Green Century as described below. The Trust does not hold annual shareholder meetings for the purpose of electing Trustees, and Trustees are not elected for fixed terms. This means that each Trustee will be elected to hold office until his or her successor is elected or until he or she retires, resigns, dies, or is removed from office.
The Trust’s Registration Statement includes additional information about the Trustees and is available, without charge, upon request by calling the following toll-free number: 1-800-93-GREEN.
| | | | | | | | |
| NAME, ADDRESS AND AGE | | POSITION(S) HELD WITH THE TRUST AND LENGTH OF TIME SERVED | | PRINCIPAL OCCUPATION(S) DURING PAST 5 YEARS AND OTHER DIRECTORSHIPS HELD | | NUMBER OF PORTFOLIOS OVERSEEN BY TRUSTEE | |
| Independent Trustees: | | | | | | |
Jonathan Darnell 114 State Street Suite 200 Boston, MA 02109 Age: 57 | | Trustee since 2014 | | Managing Director, AltEnergy, LLC (since 2016); Managing Director, Pickwick Capital Partners (since 2014); President/Founder, Patolan Partners (since 2011); Vice President, Morgan Stanley, Private Wealth Management Group (2004 to 2011); Advisory Board member, CardioReady LLC (since 2011); Board member, Voices for Progress (since 2014). | | | 3 | |
| | | |
Daniel S. Kern 114 State Street Suite 200 Boston, MA 02109 Age: 56 | | Trustee since 2015 | | Chief Investment Officer, TFC Financial Management (since 2015); President and Chief Investment Officer, Advisor Partners (2011-2015); Managing Director and Portfolio Manager, Charles Schwab Investment Management (2003-2011) | | | 3 | |
| | | |
Peter D. Kinder 114 State Street Suite 200 Boston, MA 02109 Age: 70 | | Trustee since 2015 | | Retired; Director, Trillium Asset Management (2013-2014) | | | 3 | |
44
| | | | | | | | |
| NAME, ADDRESS AND AGE | | POSITION(S) HELD WITH THE TRUST AND LENGTH OF TIME SERVED | | PRINCIPAL OCCUPATION(S) DURING PAST 5 YEARS AND OTHER DIRECTORSHIPS HELD | | NUMBER OF PORTFOLIOS OVERSEEN BY TRUSTEE | |
| | | |
Laurie Moskowitz 114 State Street Suite 200 Boston, MA 02109 Age: 52 | | Trustee since 2014 | | Senior Director, US Campaigns, The ONE Campaign (since 2011); Founder and Principal Partner, FieldWorks (1999 to 2011). | | | 3 | |
| | | |
Bancroft R. Poor 114 State Street Suite 200 Boston, MA 02109 Age: 61 | | Trustee since 2014 | | Vice President for Operations/Chief Financial Officer/Assistant Treasurer, Massachusetts Audubon Society (since 1994); Trustee and Chair of Finance and Administration Committee, the Quebec Labrador Foundation (since 2007); Director and Treasurer of US Offshore Wind Collaborative (2010 to 2013). | | | 3 | |
| | | |
Mary Raftery 114 State Street Suite 200 Boston, MA 02109 Age: 52 | | Trustee since 2009 | | Senior Advisor, Funder Collaborations, ClimateWorks Foundation (since 2014); Organizational Development Consultant, Self-employed (since 2007); Director of Major Donor Development and Special Projects, BlueGreen Alliance (2011 to 2012); Chief Operating Officer, Apollo Alliance (2007 to 2011). | | | 3 | |
| | | |
James H. Starr 114 State Street Suite 200 Boston, MA 02109 Age: 69 | | Chairperson since 2009; Trustee since 1991 | | Consultant, Rainville Petito, PLLC (since 2016); Consultant, Danielson Rainville Attorneys, PLLC (2015); Director and President, Gunnison Valley Housing Foundation (since 2011); Director (since 2011) and President (since 2016), Coal Creek Watershed Coalition; President, Peanut Mine, Inc. (2002 to 2012); Senior Attorney, Starr and Associates, PC (1982-2014). | | | 3 | |
| | | |
| Interested Trustees: | | | | | | | | |
Douglas H. Phelps* 114 State Street Suite 200 Boston, MA 02109 Age: 70 | | Trustee since 1997 | | President (1996 to 2003) and Director (since 1996), Green Century Capital Management, Inc.; President and Executive Director, The Public Interest Network (since 1982); President, U.S. PIRG (since 1983); President, Environment America (since 2007); President, Telefund, Inc. (since 1988); President, Grassroots Campaigns, Inc. (since 2003). | | | 3 | |
| | | |
Wendy Wendlandt* 114 State Street Suite 200 Boston, MA 02109 Age: 55 | | Trustee since 1991 | | President (2006 to 2013) and Director (since 2006), Green Century Capital Management, Inc.; Political Director, The Public Interest Network (since 1989); Senior Staff, Center for Public Interest Research (since 1989); Acting Director, Fair Share (since 2012); President, Environment America Research and Policy Center (since 2007). | | | 3 | |
| | | |
| Officers: | | | | | | | | |
Kristina A. Curtis* 114 State Street Suite 200 Boston, MA 02109 Age: 64 | | President since 2005; Treasurer since 2008 and from 1991-2005 | | Senior Vice President of Finance and Operations (since 2002), Treasurer and Director (since 1991), Senior Vice President (since 1991), Green Century Capital Management, Inc. | |
| Not
applicable |
|
| | | |
Amy Puffer* 114 State Street Suite 200 Boston, MA 02109 Age: 58 | | Chief Compliance Officer since 2004; Secretary and Assistant Treasurer since 2006 | | Chief Compliance Officer (since 2004), Clerk and Director (since 2006), Green Century Capital Management, Inc. | |
| Not
applicable |
|
45
INVESTMENT ADVISER AND ADMINISTRATOR
Green Century Capital Management, Inc.
114 State Street
Boston, MA 02109
1-800-93-GREEN
www.greencentury.com
info@greencentury.com
INVESTMENT SUBADVISER (Balanced Fund)
Trillium Asset Management, LLC
Two Financial Center
60 South Street, Suite 1100
Boston, MA 02111
INVESTMENT SUBADVISER (Equity Fund and International Fund)
Northern Trust Investments, Inc.
50 South LaSalle Street
Chicago, IL 60603
SUBADMINISTRATOR and DISTRIBUTOR
UMB Fund Services, Inc. (Subadministrator)
UMB Distribution Services, LLC (Distributor)
235 West Galena Street
Milwaukee, WI 53212
CUSTODIAN
UMB Bank, n.a.
928 Grand Blvd
Kansas City, MO 64106
TRANSFER AGENT
Atlantic Shareholder Services, LLC
Three Canal Plaza
Portland, ME 04101
INDEPENDENT REGISTERED PUBLIC ACCOUNTING FIRM
KPMG LLP
Two Financial Center
60 South Street
Boston, MA 02111
July 31, 2017
| | |
| | Balanced Fund Equity Fund International Fund |
| | | | |
An investment for your future. Printed on recycled paper with soy-based ink. | | | | |
| | (a) | The registrant has adopted a Code of Ethics applicable to the registrant’s principal executive officer, principal financial officer and principal accounting officer or controller. |
| | (c) | During the period covered by this report, there were no amendments to the provisions of the Code of Ethics referred to in Item 2(a) above. |
| | (d) | During the period covered by this report, there were no implicit or explicit waivers to the provisions of the Code of Ethics referred to in Item 2(a) above. |
| | (f) | The Code of Ethics is filed as an exhibit to this Form N-CSR. |
| Item 3. | Audit Committee Financial Expert |
The Board of Trustees of the registrant has determined that Bancroft R. Poor, a member of the Board’s audit committee, qualifies as an “audit committee financial expert” as that term is defined in the instructions to Item 3 of Form N-CSR. Mr. Poor is “independent” as that term is defined in the instructions to Item 3 of Form N-CSR.
| Item 4. | Principal Accountant Fees and Services |
| | (a) | Audit Fees. The aggregate fees billed for each of the last two fiscal years for professional services rendered by the principal accountant for the audit of the registrant’s annual financial statements or services that are normally provided by the accountant in connection with statutory and regulatory filings or engagements for those fiscal years are as follows. |
For the fiscal year ended 7/31/17: $67,800.00
For the fiscal year ended 7/31/16: $43,100.00
| | (b) | Audit-Related Fees. No fees were billed in either of the last two fiscal years for assurance and related services by the principal accountant that are reasonably related to the performance of the audit of the registrant’s financial statements and are not reported under paragraph (a) of this item. |
| | (c) | Tax Fees. The aggregate fees billed for each of the last two fiscal years for professional services rendered by the principal accountant for tax compliance, tax advice and tax planning are as follows. The services comprising the fees disclosed under this category are tax compliance monitoring and tax filing preparation. |
For the fiscal year ended 7/31/17: $13,900.00
For the fiscal year ended 7/31/16: $11,400.00
| | (d) | All Other Fees. No fees were billed in each of the last two fiscal years for products and services provided by the principal accountant, other than the services reported in paragraphs (a) through (c) of this item. |
| | (e)(1) | The Charter of the Audit Committee of the Board requires that the Committee approve (a) all audit and permissible non-audit services to be provided to the Funds and (b) all permissible non-audit services to be provided by the Funds’ independent auditors to the Funds’ investment adviser or administrator or any entity controlling, controlled by, or under common control with the investment adviser or administrator that provides ongoing services to the Funds, if the engagement relates directly to the operations and financial reporting of the Funds. The Audit Committee has the duty to consider whether the non-audit services provided by the Funds’ auditor to the Funds’ investment adviser, administrator, or any adviser affiliate that provides ongoing services to the Funds, which services were not pre-approved by the Audit Committee, are compatible with maintaining the auditor’s independence and to review and approve the fees proposed to be charged to the Funds by the auditors for each audit and non-audit service. |
| | (e)(2) | Zero percent of the services described in each of paragraphs (b) through (d) of this Item were approved by the Audit Committee pursuant to paragraph (c)(7)(i)(C) of Rule 2-01 of Regulation S-X. |
| | (g) | The aggregate non-audit fees billed by the registrant’s accountant for services rendered to the registrant were the tax compliance, tax advice and tax planning fees listed in paragraph (c) of this Item and are as follows. No non-audit fees were billed by the registrant’s accountant for services rendered to the registrant’s investment adviser or any entity controlling, controlled by, or under common control with the adviser that provides ongoing services to the registrant for each of the last two fiscal years of the registrant. |
For the fiscal year ended 7/31/17: $13,900.00
For the fiscal year ended 7/31/16: $11,400.00
| Item 5. | Audit Committee of Listed Registrants |
Not applicable.
| Item 6. | Schedule of Investments |
Included as part of the report to shareholders filed under Item 1 of this Form N-CSR.
| Item 7. | Disclosure of Proxy Voting Policies and Procedures for Closed-End Management Investment Companies |
Not applicable.
| Item 8. | Portfolio Managers of Closed-End Management Investment Companies |
Not applicable.
| Item 9. | Purchases of Equity Securities by Closed-End Management Investment Company and Affiliated Purchasers |
Not applicable.
| Item 10. | Submission of Matters to a Vote of Security Holders |
There were no material changes to the procedures by which shareholders may recommend nominees to the registrant’s Board of Trustees.
Item 11. Controls and Procedures
| (a) | Based on an evaluation of the disclosure controls and procedures (as defined in Rule 30a-3(c) under the Investment Company Act of 1940, as amended, the “Disclosure Controls”) as of a date within 90 days of the filing date (the “Filing Date”) of this Form N-CSR (the “Report”), the registrant’s principal executive officer and principal financial officer have concluded that the Disclosure Controls are effectively designed to ensure that information that is required to be disclosed by the registrant in the Report is recorded, processed, summarized and reported within the time periods specified in the Securities and Exchange Commission’s rules and forms, including ensuring that information required to be disclosed in the Report is accumulated and communicated to the registrant’s management, including the registrant’s principal executive officer and principal financial officer, as appropriate to allow timely decisions regarding required disclosures. |
| (b) | There were no changes in the registrant’s internal controls over financial reporting (as defined in Rule 30a-3(d) under the Investment Company Act of 1940) that occurred during the fiscal period covered by this report that have materially affected, or are reasonably likely to materially affect, the registrant’s internal control over financial reporting. |
| (a)(1) | Code of Ethics: Incorporated by reference to the Registrant’s Form N-CSR filed on October 7, 2013. |
| (2) | Certifications for each principal executive and principal financial officer as required by Rule 30a-2(a) under the Investment Company Act of 1940, as amended, (17 CFR 270.30a-2(a)) are filed herewith. |
| (b) | Certifications required by Rule 30a-2(b) under the Investment Company Act of 1940, as amended, (17 CFR 270.30a-2(b)) are filed herewith. |
SIGNATURES
Pursuant to the requirements of the Securities Exchange Act of 1934 and the Investment Company Act of 1940, the registrant has duly caused this report to be signed on its behalf by the undersigned, thereunto duly authorized.
Green Century Funds
|
|
| /s/ Kristina A. Curtis |
Kristina A. Curtis President and Principal Executive Officer October 10, 2017 |
Pursuant to the requirements of the Securities Exchange Act of 1934 and the Investment Company Act of 1940, this report has been signed below by the following persons on behalf of the registrant and in the capacities and on the dates indicated.
|
|
| /s/ Kristina A. Curtis |
Kristina A. Curtis President and Principal Executive Officer October 10, 2017 |
|
|
| /s/ Kristina A. Curtis |
Kristina A. Curtis Treasurer and Principal Financial Officer October 10, 2017 |