UNITED STATES
SECURITIES AND EXCHANGE COMMISSION
Washington, D.C. 20549
FORM N-CSR
CERTIFIED SHAREHOLDER REPORT OF REGISTERED
MANAGEMENT INVESTMENT COMPANIES
Investment Company Act File Number 811-06351
Green Century Funds
114 State Street
Suite 200
Boston, MA 02109
(Address of principal executive offices)
Green Century Capital Management, Inc.
114 State Street
Suite 200
Boston, MA 02109
(Name and address of agent for service)
Registrant’s telephone number, including area code: (617) 482-0800
Date of fiscal year end: July 31
Date of reporting period: July 31, 2015
Item 1. Reports to Stockholders
The following is a copy of the report transmitted to shareholders pursuant to Rule 30e-1 under the Investment Company Act of 1940 (17 CFR 270.30e-1)
| | |
 | | ANNUAL REPORT Green Century Balanced Fund Green Century Equity Fund July 31, 2015 |
An investment for your future.®114 State Street, Boston, Massachusetts 02109
For information on the Green Century Funds®, call 1-800-93-GREEN. For information on how to open an account and account services, call 1-800-221-5519 8:00 am to 6:00 pm Eastern Time, Monday through Friday. For share price and account information, call 1-800-221-5519, twenty-four hours a day.
Dear Green Century Funds Shareholder:
Whether you are a new investor with Green Century—or one who has been with us over the decades—we appreciate the trust that you have placed in us.
Since our last update, Green Century has reached some important milestones that we want to share.
Funds Reach Record Highs
In the year ended July 31, 2015, the Green Century Funds have gathered more net new assets than at any time in our history, reaching over $315 million in assets under management. Thank you for investing with Green Century, referring friends and sharing our online updates. (Please sign up for our e-newsletter at www.greencentury.com if you do not yet receive it).
Making an Impact in Three Key Ways
In addition to seeking competitive returns, Green Century provides you three ways to make an impact, getting more from your investments:
Investment Strategy
Green Century has long followed an investment strategy rooted in the belief that companies that are environmentally and socially responsible could avoid potential business risks and costly litigation while enjoying competitive advantages such as access to expanding markets. In the last several years, a growing body of evidence has provided additional support for this approach.
Employing this strategy results in Green Century Funds shareholders supporting companies like Johnson Controls,1 a worldwide leader in energy efficiency, and Tesla,1 the leading electric vehicle company. Investors in Green Century’s Balanced Fund also are supporting specific climate mitigation projects, such as the largest solar photovoltaic project in Latin America, located in Chile.
Green Century has long avoided investing in polluting industries and is proud to be the first and only family of responsible and diversified fossil fuel free funds. Please go to Fossil Fuel Free Investing at www.greencentury.com/fossil-fuel-free for more resources and information.
Non-Profit Ownership
Green Century Capital Management is the only mutual fund company founded and owned by environmental advocacy organizations. This means that 100% of the net profits that Green Century earns
Green Century is the only mutual fund company owned by environmental non-profits, making it a pioneer in impact investing.
on the management of the Green Century Funds belong to its non-profit founders, the Public Interest Research Groups (PIRGs). Recently, these non-profits have pressed for legislation to label food containing GMOs (genetically modified organisms) and have organized for political spending reform.

U.S.PIRG coalition of more than 10,000 doctors and members of the medical community, including the above, spoke out to stop the use of antibiotics on factory farms.
Making Companies More Sustainable
Green Century has successfully used its clout as a shareholder to convince companies to establish more sustainable policies and practices. Recent highlights include:
| | • | | Persuading ADM,1 Kellogg’s,1 and Starbucks1 to reduce carbon pollution by buying palm oil grown on plantations not created by burning rainforests. |
| | • | | Pressuring Pepsi1 to support sustainable agriculture and bee populations by purchasing products without neonicotinoid pesticides. |
| | • | | Convincing Avon1 to eliminate the hormonally active chemical triclosan from its cosmetics and personal care line. |

President Leslie Samuelrich spoke about potential financial advantages of divesting from fossil fuel companies at Harvard University in April 2015.
We want to hear from you and stay in touch. If you are not receiving our e-newsletter with up to date impact stories and more, please visit www.greencentury.com, email us at info@greencentury.com or call us at 1-800-93-GREEN.
Respectfully,
Green Century Capital Management
2
Green Century on the Web
E-News. For more regular updates on the Green Century Funds and on our advocacy efforts, please consider signing up for our e-newsletter. Call 1-800-93-GREEN/1-800-934-7336, visit www.greencentury.com, or email info@greencentury.com.
Online Access. Information on your account is available on our website at www.greencentury.com. From the home page, click on Access My Account. Shareholders may also perform online transactions on the site. While there, please consider registering for e-delivery of your statements and other fund documents.
Twitter. Green Century is on Twitter. Follow us at Twitter.com/Green__Century for a sustainable investor’s perspective on critical issues.
The Green Century Funds’ proxy voting guidelines and a record of the Funds’ proxy votes for the year ended June 30, 2015 are available without charge, upon request, (i) at www.greencentury.com, (ii) by calling 1-800-93-GREEN/1-800-934-7336, (iii) by sending an e-mail to info@greencentury.com, and (iv) on the Securities and Exchange Commission’s website at www.sec.gov.
The Green Century Funds file their complete schedule of portfolio holdings with the SEC for the first and third quarters of the year on Form N-Q. The Green Century Funds’ Forms N-Q are available on the EDGAR database on the SEC’s website at www.sec.gov. These Forms may also be reviewed and copied at the SEC’s Public Reference Room in Washington D.C. Information about the operation of the Public Reference Room may be obtained by calling 1-800-SEC-0330. The information on Form N-Q may also be obtained by calling 1-800-93-GREEN/1-800-934-7336, or by e-mailing a request to info@greencentury.com.
3
MANAGEMENT’S DISCUSSION OF FUND PERFORMANCE (unaudited)
GREEN CENTURY BALANCED FUND
Investment Objective The Green Century Balanced Fund seeks capital growth and income from a diversified portfolio of stocks and bonds that meet Green Century’s standards for corporate environmental responsibility.
Portfolio Orientation As of the fiscal year ended July 31, 2015, the Green Century Balanced Fund (the Balanced Fund or the Fund) was diversified in a number of ways. Equity holdings represented 63.9% and bonds constituted 25.9% of the Fund’s net asset value. The Fund also held 0.1% of its net assets in a community investment certificate of deposit and had 10.1% invested in cash, cash equivalents and other assets, less liabilities. The portfolio managers view equities as the primary source of potential long-term
growth, while emphasizing the importance of diversification in seeking to lower volatility. The Fund’s equity holdings were diversified across 84 equity holdings at fiscal year-end, none of which represented more than 2.1% of total net assets. Generally, larger, less-volatile companies constituted larger positions in the Fund’s portfolio than smaller companies. The portfolio managers seek to mitigate risk by investing primarily in companies they believe have demonstrated records of profitability, above-average growth prospects and reasonable valuations.
As of July 31st, the stocks held by the Balanced Fund were also diversified by industry, with (as a percent of total net assets) Technology Hardware and Equipment (7.4%), Pharmaceuticals & Biotechnology (5.8%), and Banks (5.2%), as the largest separate industry groupings.
In line with its environmental mandate, the Fund had exposure to what Green Century considers
GREEN CENTURY BALANCED FUND
INVESTMENTS BY INDUSTRY (unaudited)
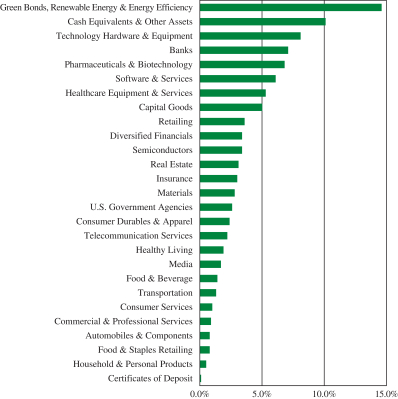
4
environmental leaders in a number of industries including Healthy Living, Capital Goods and Transportation. Green Century’s environmental screens keep the Fund out of traditional energy and utility companies, while the Fund has broad exposure to Information Technology, Health Care, Financial, Consumer and Industrial companies.
In addition to its equity exposure to environmental leaders, the Fund invests in designated Green Bonds. The issuers of Green Bonds have indicated that the proceeds from the bonds will be used for greenhouse gas reduction, climate adaptation, and climate change mitigation. As of July 31st, 10.9% of the total portfolio and 42.2% of the market value of the bonds held in the Fund were designated Green Bonds.
Higher quality, intermediate maturity bonds can typically lower volatility and provide a stable source of income. At fiscal year end, the Balanced Fund held 54 bonds diversified across corporate and government agency issuers. In an effort to dampen volatility, the weighted average maturity (4.75 years) and duration (4.21 years) remained in the intermediate-range. The weighted average yield to maturity was 2.05%. Except for one bond holding, a Dell, Inc.1 bond maturing in September, 2015, which is 0.3% of the total portfolio, all fixed income holdings are investment grade, as rated by Moody’s Investor Service.
Economic Environment As we expected, U.S. economic activity seems to be recovering from a very weak first quarter. In July 2015, both the unemployment rate (5.3%) and the number of unemployed persons (8.3 million) were unchanged from the month before, according to the Bureau of Labor Statistics. Over the year, the unemployment rate and the number of unemployed persons were down by 0.9 percentage points (from 6.2%) and 1.4 million, respectively. The unemployment rate is at its lowest since May 2008. As of June 30, 2015, groundbreakings on new homes have surged 26.6% with permits to build new homes rising 30% compared to twelve months earlier. The portfolio managers believe that recovery in housing construction is even more important than recovery in housing prices as a stimulus to the economy. Over the last 12 months ending June 30th, the Consumer Price Index for All Urban Consumers index rose 0.1%.
As the U.S. economy normalizes, investors are closely watching the U.S. Federal Reserve for hints about when the bank will raise interest rates; this has been widely forecast, and should not be a surprise when it happens. Consumer confidence, as measured by the Consumer Confidence Index® dropped from 99.8 in June to 90.9 in July 2015, but is relatively stable when viewed year over year.
Real Gross Domestic Product (GDP), or the value of the production of goods and services in the United States, increased at an estimated annual rate of 2.3% in the second quarter of 2015. In the first quarter, real GDP increased 0.6%. The Fund’s portfolio managers continue to be positive on domestic US economic conditions, but we have slightly lowered our expected economic growth in 2015 to 2.5% from 3.0%.
After mid-May, concerns about Greek debt began to escalate and as of this writing the country is currently negotiating its third bailout deal with its creditors. At this point, we are more concerned with the effect of a gathering economic slowdown in China. China has a 15.4% share of world GDP with exports at $2,049 billion per year and imports are $1,818 billion. In recent years, Chinese economic policy has attempted to change the composition of economic growth from investment-led to consumption-led. Although the Chinese consumer sector is expanding, it is much smaller than the investment sector, causing a significant slowdown in Chinese economic growth. The International Monetary Fund forecasts China’s 2015 growth to be 6.8%,
5
but other estimates based on electricity use, railroad cargo loadings, and bank loan growth all indicate underlying economic growth of about 2%. This significant change in both the composition and the rate of Chinese economic growth has driven down commodity prices, including oil, copper, nickel, and aluminum.
As a result, the Fund’s portfolio managers have emphasized companies with strong domestic sales over companies with primarily international sales.
Investment Strategy and Performance Green Century believes that environmental responsibility may enhance corporate profitability, which in turn may produce competitive returns. Environmentally sound companies may enjoy higher profitability through lower costs and participation in growth sectors of the market. In addition, this investment strategy seeks to avoid companies at risk due to exposure to environmental liabilities. As of July 31, 2015, job creation remains strong, inflation is well contained, and our positive view on the U.S. economy should support current stock levels. However, as a result of the increase in the value of the U.S. dollar, corporate earnings for the S&P 500 are expected to be essentially flat for 2015, and companies with greater foreign sales exposure significantly reduced their earnings forecasts after the first quarter of 2015.
The Fund’s portfolio managers are currently emphasizing stocks over bonds. While expectations for corporate profit growth are modest, the expected return for stocks is still higher than that for bonds.
The Balanced Fund holds a number of stocks which the portfolio managers believe have attractive environmental, social and financial characteristics. Holdings include EnerNOC,1 a leading provider of energy management applications, services, and products for the smart grid including demand response and data driven efficiency, and Gilead Sciences Inc.,1 which has developed a treatment that offers a potential cure for hepatitis C.
The Fund holds over $19 million in Green Bonds and Notes, including notes issued by African Development Bank,1 Export Import Bank of Korea,1 International Finance Corp.,1 International Bank for Reconstruction and Development (World Bank),1 Regency Centers LP,1 Vornado Realty LP,1 and Overseas Private Investment Corp.1
For the year ending July 31, 2015, the Balanced Fund’s returns were 10.84%, significantly outperforming the 7.74% return for its Custom Balanced Index,2 an index comprised of the S&P 1500 Index2 (60% weighting) and of the BofA Merrill Lynch 1-10 Year US Corporate and Government Index2 (40% weighting).* The Fund also significantly outperformed the 5.31% return of the Lipper Balanced Index2 for the same twelve month period.
6
| | | | | | | | | | | | | | | | | | |
Green Century Balanced Fund Total expense ratio: 1.48% | | AVERAGE ANNUAL RETURN* | |
| | One Year | | | Three Years | | | Five Years | | | Ten Years | |
June 30, 2015 | | Green Century Balanced Fund | | | 8.08% | | | | 13.31% | | | | 12.13% | | | | 5.90% | |
| | | Custom Balanced Index | | | 5.18% | | | | 11.02% | | | | 11.62% | | | | 6.76% | |
| | | Lipper Balanced Fund Index | | | 3.11% | | | | 10.22% | | | | 10.39% | | | | 6.10% | |
July 31, 2015 | | Green Century Balanced Fund | | | 10.84% | | | | 13.76% | | | | 11.33% | | | | 5.66% | |
| | | Custom Balanced Index | | | 7.74% | | | | 11.06% | | | | 10.89% | | | | 6.68% | |
| | | Lipper Balanced Fund Index | | | 5.31% | | | | 10.11% | | | | 9.55% | | | | 5.97% | |
* The performance data quoted represents past performance and is not a guarantee of future results. Investment return and principal value of an investment will fluctuate so that an investor’s shares, when redeemed, may be worth more or less than their original cost. Current performance may be lower or higher than the performance information quoted. To obtain Fund prices and performance information as of the most recent month-end, call 1-800-93-GREEN/1-800-934-7336. Performance includes the reinvestment of income dividends and capital gain distributions. Performance shown does not reflect the deduction of taxes that a shareholder might pay on Fund distributions or the redemption of Fund shares. A redemption fee of 2.00% may be imposed on redemptions or exchanges of shares you have owned for 60 days or less. Please see the prospectus for more information.
A comparison of the Fund’s equity holdings to the S&P 1500 Supercomposite Index (the S&P 1500),2 which like the Fund includes stocks across a range of capitalizations, provides some insight into relative performance; for the fiscal year ended July 31, 2015, the stocks held by the Balanced Fund outperformed those included in the S&P 1500, 16.90% versus 11.25%. A performance attribution analysis provided by the Fund’s portfolio manager indicates that the Fund’s Materials, Information Technology, Industrials, Utilities, Financials, and Telecommunication Services equity investments boosted the Fund’s performance, while the Fund’s Consumer Discretionary, Consumer Staples, and Health Care investments provided weaker returns relative to the S&P 1500. In the U.S. equity market, Energy stock
returns were significantly lower than the overall market, and therefore the Fund’s policy of non-investment in fossil-fuel companies added substantially to investment performance over the year.
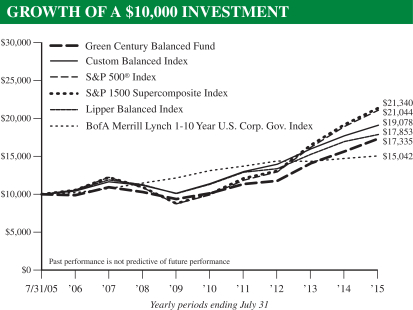
The S&P 500® Index and the S&P Supercomposite 1500 Index (the S&P 1500 Index) are unmanaged indexes of 500 and 1500 stocks, respectively. The Custom Balanced Index is comprised of a 60% weighting in the S&P 1500 Index and a 40% weighting in the BofA Merrill Lynch 1-10 Year US Corporate & Government Index (the BofA Merrill Lynch Index). The BofA Merrill Lynch Index tracks the performance of U.S. dollar-denominated investment grade government and corporate public debt issued in the U.S. domestic bond market with at least 1 year and less than 10 years remaining maturity, including U.S. treasury, U.S. agency, foreign government, supranational and corporate securities. Similar to the Balanced Fund, the performance of the S&P 500® Index and the S&P 1500 Index, the Custom Balanced Index and the BofA Merrill Lynch Index reflect reinvestment of dividends and distributions. Unlike the Fund, however, the performance of the S&P 500® Index, the S&P 1500 Index, the Custom Balanced Index and the BofA Merrill Lynch Index does not include management and other operating expenses. It is not possible to invest directly in an index.
The Lipper Balanced Fund Index includes the 30 largest funds whose primary objective is to conserve principal by maintaining at all times a balanced portfolio of both stocks and bonds. Typically the stock/bond ratio ranges around 60%/40%.
7
The companies held in the portfolio that contributed most toward the Fund’s equity performance relative to the S&P 1500 included Palo Alto Networks, Inc.,1 Sealed Air Corporation,1 NXP Semiconductors,1 Cigna Corporation,1 and Interface, Inc.1 Companies the Fund held that detracted most from performance relative to the S&P 1500 included Valmont Industries Inc.,1 BorgWarner Inc.,1 United Natural Foods, Inc.,1 Deckers Outdoor Corporation,1 and Biogen Inc.1
The fixed income portion of the portfolio continued to be managed with the goal of seeking to reduce risk and generating income for the Fund. For the 12 months ended July 31, 2015, gross of fees, the note- and bond-only portion of the Fund’s portfolio returned 2.51%, slightly above the Bank of America Merrill Lynch 1-10 Year U.S. Corporate Government Index return of 2.41%. In addition, the Fund held considerable cash reserves for precautionary purposes (9.8% of assets as of July 31, 2015), which generated a return of 0.00% for the twelve months. Slightly stronger fixed income returns came from yield curve positioning. While the Fund’s fixed income holdings were conservatively positioned, during the year the Fund’s managers slightly extended maturities and duration positioning.
The Fund’s portfolio managers do not anticipate any significant changes in investment strategy for the Fund, believing that the investment environment may be favorable to the Fund’s core holdings in what the portfolio managers consider high-quality, environmentally responsible companies with strong growth prospects and reasonable valuations. In addition, the Fund’s portfolio managers anticipate that the U.S. will experience a rising interest-rate environment for at least the next twelve months, with short-term interest rates likely to rise slightly more than intermediate-term interest rates. In response, the Fund’s portfolio managers have slightly lengthened the average maturity and duration of the portfolio, but do not anticipate extending further at this time.
The Balanced Fund consistently includes stocks and bonds of what Green Century believes to be environmentally responsible corporations of various sizes, including small, medium, and large companies. The value of the stocks held in the Balanced Fund will fluctuate in response to factors that may affect the single issuer, industry, or sector of the economy or may affect the market as a whole. Bonds are subject to a variety of risks including interest rate, credit, and inflation risk. The Fund’s environmental criteria limit the investments available to the Fund compared to mutual funds that do not use environmental criteria.
8
MANAGEMENT’S DISCUSSION OF FUND PERFORMANCE (unaudited)
GREEN CENTURY EQUITY FUND
Investment Objective The Green Century Equity Fund (the Equity Fund or the Fund) seeks to achieve long-term total return that matches the performance of an index comprised of the stocks of companies selected based on environmental, social and governance criteria.
Portfolio Orientation The Fund seeks to achieve its objective by investing in the stocks which make up the MSCI KLD 400 Social ex Fossil Fuels Index (the KLD400 ex Fossil Fuels Index or the Index), a custom index calculated by MSCI, Inc. The KLD400 ex Fossil Fuels Index is comprised of the common stocks of the approximately 400 companies in the MSCI KLD 400 Social Index (the KLD400 Index), minus the stocks of the companies that explore for, extract, process, or refine coal, oil or gas that are included in the KLD400
Index. The KLD400 Index, formerly named the Domini 400 Social Index, is the longest-running socially responsible index. Like other index funds, the Equity Fund is not actively managed in the traditional investment sense, but rather seeks to be nearly fully invested at all times in a broad and diverse portfolio of stocks which meet certain environmental, social and governance criteria. The Equity Fund, like many other mutual funds invested primarily in stocks, carries the risk of investing in the stock market. The large companies in which the Equity Fund is invested may perform worse than the stock market as a whole. The Fund’s environmental criteria limit the investments available to the Fund compared to mutual funds that do not use environmental criteria.
In evaluating whether a company meets the criteria for inclusion in the Index, a company’s dedication to sustainability is analyzed across five key categories: environment; community and society; employees and supply chain; customers; and
GREEN CENTURY EQUITY FUND
INVESTMENT BY INDUSTRY (unaudited)
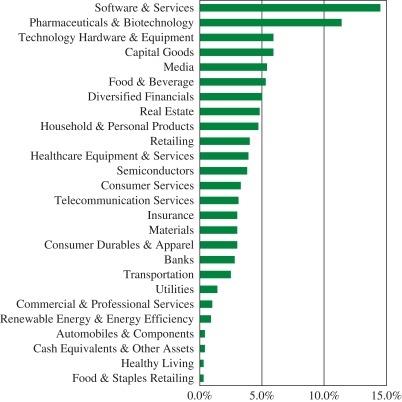
9
governance and ethics. Green Century believes that certain industries impose unique and onerous risks and/or costs on society. Companies involved in these industries are evaluated based on their level of involvement as well as the impact of that involvement on society. Therefore, companies that derive significant revenues from the manufacture of tobacco products or alcoholic beverages; derive significant revenues from the operation of gambling enterprises; or have a significant direct ownership share in, operate or design nuclear power plants are not eligible for the Index. Major military contractors and firearms manufacturers are also ineligible. The Index excludes all companies that explore for, extract, process, or refine coal, oil or gas.
Investment Strategy and Performance Green Century believes that companies that minimize their negative social and environmental impact and follow governance standards could enjoy competitive advantages and be less likely to incur certain legal liabilities that may be assessed when a product or service is determined to be harmful. Green Century also believes that such investments may, over the long term, provide investors with a return that is competitive with enterprises that do not exhibit such social and environmental awareness.
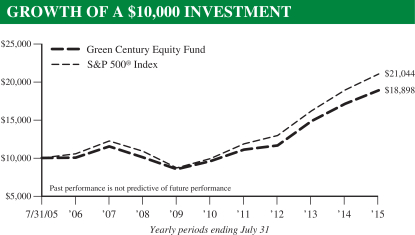
The Equity Fund’s total return for its fiscal year ended July 31, 2015 was 10.54%, while the S&P 500® Index2 returned 11.21% for the same period. Additional results for various time periods are below:*
| | | | | | | | | | | | | | | | | | |
Green Century Equity Fund Total expense ratio: 1.48% | | AVERAGE ANNUAL RETURN* | |
| | One Year | | | Three Years | | | Five Years | | | Ten Years | |
June 30, 2015 | | Green Century Equity Fund | | | 6.77% | | | | 16.78% | | | | 15.37% | | | | 6.79% | |
| | | S&P 500® Index | | | 7.42% | | | | 17.31% | | | | 17.34% | | | | 7.89% | |
July 31, 2015 | | Green Century Equity Fund | | | 10.54% | | | | 17.51% | | | | 14.58% | | | | 6.57% | |
| | | S&P 500® Index | | | 11.21% | | | | 17.58% | | | | 16.24% | | | | 7.72% | |
* The performance data quoted represents past performance and is not a guarantee of future results. Investment return and principal value of an investment will fluctuate so that an investor’s shares, when redeemed, may be worth more or less than their original cost. Current performance may be lower or higher than the performance information quoted. To obtain Fund prices and performance information as of the most recent month-end, call 1-800-93-GREEN/1-800-934-7336. Performance includes the reinvestment of income dividends and capital gains distributions. Performance shown does not reflect the deduction of taxes that a shareholder might pay on Fund distributions or the redemption of Fund shares. A redemption fee of 2.00% may be imposed on redemptions or exchanges of shares you have owned for 60 days or less. Please see the prospectus for more information.
For the year ended July 31, 2015, the Equity Fund performed below the S&P 500® Index, underperforming by less than one percent. Since the MSCI KLD 400 Social ex Fossil Fuels Index does not include all of the stocks in the S&P 500® Index and includes some stocks not included in the S&P 500® Index, the performance of the Fund can be expected to differ from the performance of the broader benchmark.
The performance of the Fund, relative to the S&P 500® Index, was boosted by excluding the Energy sector and stock selection within the Materials, and Consumer Discretionary sectors. The relative performance of the Fund was negatively impacted by stock selection in the Information Technology, Financials, and Consumer Staples sectors.
The strongest performing sectors in the Equity Fund were Health Care, Consumer Discretionary, and Consumer Staples, which returned 26.44%, 22.20%, and 13.13%, respectively. The worst performing sectors
10
in the Equity Fund were Telecommunication Services, Information Technology and Industrials, which returned –5.01%, 2.93% and 3.41%, respectively.
Within the S&P 500® Index, Health Care, Consumer Discretionary and Consumer Staples were the strongest performing sectors, gaining 29.15%, 22.11%, and 19.33%, respectively. The worst performing sectors were Energy, Materials and Telecommunication Services, returning –26.76%, –3.85% and –0.85%, respectively.
The S&P 500® Index is an unmanaged index of 500 stocks. Similar to the Equity Fund, the S&P 500® Index’s performance reflects reinvestment of dividends and distributions. Unlike the Fund, however, the S&P 500® Index’s performance does not include management and other operating expenses.
1 As of July 31, 2015, the following companies comprised the listed percentages of each of the Green Century Funds:
| | | | | | | | |
| Portfolio Holdings | | GREEN CENTURY
BALANCED FUND | | | GREEN CENTURY
EQUITY FUND | |
Johnson Controls, Inc. | | | 1.15 | % | | | 0.40 | % |
Tesla Motors, Inc. | | | 0.00 | % | | | 0.34 | % |
Archer Daniels Midland Company | | | 0.00 | % | | | 0.00 | % |
Kellogg Company | | | 0.00 | % | | | 0.24 | % |
Starbucks Corporation | | | 0.02 | % | | | 1.17 | % |
Pepsico, Inc. | | | 0.00 | % | | | 1.92 | % |
Avon Products, Inc. | | | 0.00 | % | | | 0.03 | % |
Dell, Inc. | | | 0.28 | % | | | 0.00 | % |
EnerNOC, Inc. | | | 0.22 | % | | | 0.00 | % |
Gilead Sciences, Inc. | | | 1.45 | % | | | 2.35 | % |
African Development Bank | | | 0.56 | % | | | 0.00 | % |
Export-Import Bank of Korea | | | 0.56 | % | | | 0.00 | % |
International Finance Corporation | | | 0.56 | % | | | 0.00 | % |
International Bank for Reconstruction and Development | | | 1.80 | % | | | 0.00 | % |
| | | | | | | | |
| Portfolio Holdings | | GREEN CENTURY
BALANCED FUND | | | GREEN CENTURY
EQUITY FUND | |
Regency Centers LP | | | 0.84 | % | | | 0.00 | % |
Vornado Realty LP | | | 0.56 | % | | | 0.00 | % |
Overseas Private Investment Corporation | | | 0.74 | % | | | 0.00 | % |
Palo Alto Networks, Inc. | | | 1.56 | % | | | 0.00 | % |
Sealed Air Corporation | | | 1.45 | % | | | 0.15 | % |
NXP Semiconductors NV | | | 1.27 | % | | | 0.00 | % |
Cigna Corporation | | | 2.13 | % | | | 0.50 | % |
Interface, Inc. | | | 0.91 | % | | | 0.02 | % |
Valmont Industries, Inc. | | | 0.56 | % | | | 0.00 | % |
BorgWarner Inc. | | | 0.84 | % | | | 0.15 | % |
United Natural Foods, Inc. | | | 0.68 | % | | | 0.03 | % |
Deckers Outdoor Corporation | | | 0.94 | % | | | 0.03 | % |
Biogen Inc. | | | 0.98 | % | | | 1.00 | % |
Portfolio composition will change due to ongoing management of the Funds. Please refer to the Green Century Funds website for current information regarding the Funds’ portfolio holdings. Note that some of the holdings discussed above may not have been held by either Fund during the fiscal year ended July 31, 2015, or may have been held by a Fund for a portion of the fiscal year or may have been held by a Fund for the entire fiscal year. These holdings are subject to risk as described in the Funds’ prospectus. References to specific investments should not be construed as a recommendation of the securities by the Funds, their administrator, or their distributor.
2 The S&P 500® Index is an unmanaged index of 500 selected common stocks, most of which are listed on the New York Stock Exchange. The S&P 500® Index is heavily weighted toward stocks with large market capitalization and represents approximately
11
two-thirds of the total market value of all domestic stocks. The S&P Supercomposite 1500 Index is an unmanaged broad-based capitalization-weighted index comprising 1500 stocks of large-cap, mid-cap, and small-cap U.S. companies. The Custom Balanced Index is comprised of a 60% weighting in the S&P 1500 Index and a 40% weighting in the BofA Merrill Lynch 1-10 Year US Corporate & Government Index (the BofA Merrill Lynch Index). The BofA Merrill Lynch Index tracks the performance of U.S. dollar-denominated investment grade government and corporate public debt issued in the U.S. domestic bond market with at least 1 year and less than 10 years remaining maturity, including U.S. treasury, U.S. agency, foreign government, supranational and corporate securities. It is not possible to invest directly in the S&P 500® Index, the S&P Supercomposite 1500 Index or the Custom Balanced Index or the BofA Merrill Lynch Index. Lipper Analytical Services, Inc. (“Lipper”) is a respected mutual fund reporting service. The Lipper Balanced Fund Index includes the 30 largest funds whose primary objective is to conserve principal by maintaining at all times a balanced portfolio of both stocks and bonds. Typically the stock/bond ratio ranges around 60%/40%. The Lipper Intermediate Investment Grade Bond Index includes the 30 largest funds whose primary objective is to invest in investment-grade debt (rated in the top four classifications) with dollar weighted average maturities of five to ten years.
This material must be preceded or accompanied by a current prospectus.
Distributor: UMB Distribution Services, LLC 9/15
The Green Century Equity Fund (the “Fund”) is not sponsored, endorsed, or promoted by MSCI, its affiliates, information providers or any other third party involved in, or related to, compiling, computing or creating the MSCI indices (the “MSCI Parties”), and the MSCI Parties bear no liability with respect to the Fund or any index on which the Fund is based. The MSCI Parties are not sponsors of the Fund and are not affiliated with the Fund in any way. The Statement of Additional Information contains a more detailed description of the limited relationship the MSCI Parties have with Green Century Capital Management and the Fund.
12
GREEN CENTURY FUNDS EXPENSE EXAMPLE
For the six months ended July 31, 2015 (unaudited)
As a shareholder of the Green Century Funds (the “Funds”), you incur two types of costs: (1) transaction costs, including redemption fees on certain redemptions; and (2) ongoing costs, including management fees and other Fund expenses. This example is intended to help you understand your ongoing costs (in dollars) of investing in the Funds and to compare these costs with the ongoing costs of investing in other mutual funds.
The example is based on an investment of $1,000 invested at the beginning of the period and held for the entire period from February 1, 2015 to July 31, 2015 (the “period”).
Actual Expenses The first line of the table below provides information about actual account values and actual expenses. You may use the information in this line, together with the amount you invested, to estimate the expenses you paid over the period. Simply divide your account value by $1,000 (for example, an $8,600 account value divided by $1,000 equals 8.6), then multiply the result by the number in the first line under the heading entitled “Expenses Paid During the Period” to estimate the expenses you paid on your account during the period.
Hypothetical Example for Comparison Purposes The second line of the table below provides information about hypothetical account values and hypothetical expenses based on the Funds’ actual expense ratios and an assumed rate of return of 5% per year before expenses, which is not the actual return of either of the Funds. The hypothetical account values and expenses may not be used to estimate the actual ending account balance or expenses you paid for the period. You may use this information to compare the ongoing costs of investing in the Funds and other funds. To do so, compare this 5% hypothetical example with the 5% hypothetical examples that appear in the shareholder reports of other funds.
Please note that the expenses shown in the table are meant to highlight your ongoing costs only and do not reflect any transactional costs, such as redemption fees on shares held for 60 days or less. Therefore, the second line of the table is useful in comparing the ongoing costs only, and will not help you determine the relative total costs of owning different funds. In addition, if these transactional costs were included, your costs could have been higher.
| | | | | | | | | | | | |
| | | BEGINNING
ACCOUNT VALUE
FEBRUARY 1, 2015 | | | ENDING
ACCOUNT VALUE
JULY 31, 2015 | | | EXPENSES
PAID DURING
THE PERIOD1 | |
Balanced Fund | | | | | | | | | | | | |
Actual Expenses | | $ | 1,000.00 | | | $ | 1,067.30 | | | $ | 7.59 | |
Hypothetical Example, assuming a 5% return before expenses | | | 1,000.00 | | | | 1,017.66 | | | | 7.40 | |
| | | |
Equity Fund | | | | | | | | | | | | |
Actual Expenses | | | 1,000.00 | | | | 1,055.20 | | | | 6.37 | |
Hypothetical Example, assuming a 5% return before expenses | | | 1,000.00 | | | | 1,018.80 | | | | 6.26 | |
1 Expenses are equal to the Funds’ annualized expense ratios (1.48% for the Balanced Fund and 1.25% for the Equity Fund), multiplied by the average account value over the period, multiplied by 181/365 (to reflect the one-half year period).
13
| | |
GREEN CENTURY BALANCED FUND PORTFOLIO OF INVESTMENTS July 31, 2015 | | |
| | | | | | | | |
COMMON STOCKS — 63.9% | |
| | | SHARES | | | VALUE | |
Technology Hardware & Equipment — 7.4% | |
Apple, Inc. | | | 28,238 | | | $ | 3,425,269 | |
Cisco Systems, Inc. | | | 69,115 | | | | 1,964,248 | |
F5 Networks, Inc. (a) | | | 21,846 | | | | 2,930,423 | |
Palo Alto Networks, Inc. (a) | | | 15,111 | | | | 2,808,077 | |
QUALCOMM, Inc. | | | 24,699 | | | | 1,590,369 | |
SanDisk Corporation | | | 10,147 | | | | 611,763 | |
| | | | | | | | |
| | | | | | | 13,330,149 | |
| | | | | | | | |
Pharmaceuticals & Biotechnology — 5.8% | |
Amgen, Inc. | | | 6,709 | | | | 1,184,742 | |
Biogen, Inc. (a) | | | 5,551 | | | | 1,769,548 | |
Gilead Sciences, Inc. | | | 22,048 | | | | 2,598,577 | |
Novartis A.G. American Depositary
Receipt (b) | | | 13,937 | | | | 1,445,964 | |
Shire PLC American Depositary Receipt (b) | | | 12,735 | | | | 3,397,826 | |
| | | | | | | | |
| | | | | | | 10,396,657 | |
| | | | | | | | |
Banks — 5.2% | |
East West Bancorp, Inc. | | | 23,205 | | | | 1,038,656 | |
Fifth Third Bancorp | | | 59,794 | | | | 1,259,860 | |
First Republic Bank | | | 12,079 | | | | 770,519 | |
PNC Financial Services Group, Inc. (The) | | | 17,774 | | | | 1,745,051 | |
SVB Financial Group (a) | | | 12,259 | | | | 1,754,263 | |
Umpqua Holdings Corporation | | | 74,742 | | | | 1,325,923 | |
Wells Fargo & Company | | | 26,213 | | | | 1,516,946 | |
| | | | | | | | |
| | | | | | | 9,411,218 | |
| | | | | | | | |
Healthcare Equipment & Services — 4.7% | |
Cigna Corporation | | | 26,565 | | | | 3,826,954 | |
Hologic, Inc. (a) | | | 27,988 | | | | 1,165,980 | |
Medtronic PLC | | | 15,184 | | | | 1,190,273 | |
Omnicell, Inc. (a) | | | 34,317 | | | | 1,253,257 | |
Zimmer Biomet Holdings, Inc. | | | 10,084 | | | | 1,049,442 | |
| | | | | | | | |
| | | | | | | 8,485,906 | |
| | | | | | | | |
Capital Goods — 4.1% | |
Cummins, Inc. | | | 6,059 | | | | 784,822 | |
Hexcel Corporation | | | 29,452 | | | | 1,528,264 | |
Lincoln Electric Holdings, Inc. | | | 24,209 | | | | 1,465,855 | |
Middleby Corporation (The) (a) | | | 6,045 | | | | 741,722 | |
Pentair PLC | | | 8,937 | | | | 543,459 | |
Valmont Industries, Inc. | | | 9,052 | | | | 1,006,854 | |
Wabtec Corporation | | | 12,298 | | | | 1,244,435 | |
| | | | | | | | |
| | | | | | | 7,315,411 | |
| | | | | | | | |
| | | | | | | | |
| | | SHARES | | | VALUE | |
Renewable Energy & Energy Efficiency — 3.7% | |
Acuity Brands, Inc. | | | 9,538 | | | $ | 1,918,950 | |
EnerNOC, Inc. (a) | | | 48,289 | | | | 397,418 | |
First Solar, Inc. (a) | | | 14,364 | | | | 636,325 | |
Johnson Controls, Inc. | | | 34,178 | | | | 1,557,150 | |
Ormat Technologies, Inc. | | | 35,670 | | | | 1,451,056 | |
SolarCity Corporation (a) | | | 12,216 | | | | 708,528 | |
| | | | | | | | |
| | | | | | | 6,669,427 | |
| | | | | | | | |
Retailing — 3.6% | |
Home Depot, Inc. (The) | | | 14,029 | | | | 1,641,814 | |
Men’s Wearhouse, Inc. (The) | | | 23,239 | | | | 1,383,185 | |
Priceline Group, Inc. (The) (a) | | | 656 | | | | 815,782 | |
Target Corporation | | | 12,899 | | | | 1,055,783 | |
TJX Companies, Inc. (The) | | | 23,348 | | | | 1,630,158 | |
| | | | | | | | |
| | | | | | | 6,526,722 | |
| | | | | | | | |
Software & Services — 3.4% | |
eBay, Inc. (a) | | | 10,068 | | | | 283,112 | |
Google, Inc., Class A (a) | | | 4,940 | | | | 3,248,050 | |
MasterCard, Inc., Class A | | | 10,709 | | | | 1,043,056 | |
Microsoft Corporation | | | 25,877 | | | | 1,208,456 | |
PayPal Holdings, Inc. (a) | | | 10,068 | | | | 389,632 | |
| | | | | | | | |
| | | | | | | 6,172,306 | |
| | | | | | | | |
Semiconductors — 3.4% | |
Analog Devices, Inc. | | | 17,124 | | | | 998,843 | |
ARM Holdings PLC American Depositary Receipt (b) | | | 18,970 | | | | 892,349 | |
ASML Holding NV | | | 10,584 | | | | 1,049,615 | |
NXP Semiconductors NV (a)(b) | | | 23,571 | | | | 2,286,151 | |
Xilinx, Inc. | | | 19,926 | | | | 831,911 | |
| | | | | | | | |
| | | | | | | 6,058,869 | |
| | | | | | | | |
Insurance — 3.0% | |
Aflac, Inc. | | | 29,409 | | | | 1,883,647 | |
Lincoln National Corporation | | | 28,123 | | | | 1,583,887 | |
Reinsurance Group of America, Inc. | | | 19,460 | | | | 1,878,279 | |
| | | | | | | | |
| | | | | | | 5,345,813 | |
| | | | | | | | |
Materials — 2.8% | |
Minerals Technologies, Inc. | | | 27,153 | | | | 1,758,157 | |
Owens-Illinois, Inc. (a) | | | 35,318 | | | | 754,039 | |
Sealed Air Corporation | | | 48,847 | | | | 2,597,195 | |
| | | | | | | | |
| | | | | | | 5,109,391 | |
| | | | | | | | |
14
| | |
GREEN CENTURY BALANCED FUND PORTFOLIO OF INVESTMENTS July 31, 2015 | | continued |
| | | | | | | | |
| | | SHARES | | | VALUE | |
Consumer Durables & Apparel — 2.4% | |
Deckers Outdoor Corporation (a) | | | 23,260 | | | $ | 1,695,189 | |
Jarden Corporation (a) | | | 20,524 | | | | 1,128,820 | |
lululemon athletica, Inc. (a) | | | 9,899 | | | | 622,251 | |
NIKE, Inc., Class B | | | 7,873 | | | | 907,127 | |
| | | | | | | | |
| | | | | | | 4,353,387 | |
| | | | | | | | |
Diversified Financials — 2.0% | |
Charles Schwab Corporation (The) | | | 29,124 | | | | 1,015,845 | |
Stifel Financial Corporation (a) | | | 45,527 | | | | 2,501,709 | |
| | | | | | | | |
| | | | | | | 3,517,554 | |
| | | | | | | | |
Healthy Living — 1.9% | |
United Natural Foods, Inc. (a) | | | 26,885 | | | | 1,224,074 | |
WhiteWave Foods Company (The) (a) | | | 19,934 | | | | 1,028,993 | |
Whole Foods Market, Inc. | | | 29,412 | | | | 1,070,597 | |
| | | | | | | | |
| | | | | | | 3,323,664 | |
| | | | | | | | |
Real Estate — 1.7% | |
CBRE Group, Inc., Class A (a) | | | 55,564 | | | | 2,109,765 | |
Forest City Enterprises, Inc., Class A (a) | | | 43,881 | | | | 1,024,621 | |
| | | | | | | | |
| | | | | | | 3,134,386 | |
| | | | | | | | |
Food & Beverage — 1.4% | |
Diamond Foods, Inc. (a) | | | 397 | | | | 12,827 | |
General Mills, Inc. | | | 300 | | | | 17,463 | |
Keurig Green Mountain, Inc. | | | 7,991 | | | | 599,645 | |
Unilever NV American Depositary Receipt (b) | | | 41,260 | | | | 1,849,686 | |
| | | | | | | | |
| | | | | | | 2,479,621 | |
| | | | | | | | |
Transportation — 1.4% | |
J.B. Hunt Transport Services, Inc. | | | 11,215 | | | | 943,406 | |
United Parcel Service, Inc., Class B | | | 14,699 | | | | 1,504,589 | |
| | | | | | | | |
| | | | | | | 2,447,995 | |
| | | | | | | | |
Telecommunication Services — 1.2% | | | | | |
BT Group PLC American Depositary Receipt (b) | | | 13,254 | | | | 957,734 | |
SBA Communications Corporation, Class A (a) | | | 10,189 | | | | 1,230,016 | |
| | | | | | | | |
| | | | | | | 2,187,750 | |
| | | | | | | | |
| | | | | | | | |
| | | SHARES | | | VALUE | |
Media — 1.1% | | | | | |
Discovery Communications, Inc., Class A (a) | | | 24,137 | | | $ | 797,004 | |
IMAX Corporation (a) | | | 31,470 | | | | 1,177,292 | |
| | | | | | | | |
| | | | | | | 1,974,296 | |
| | | | | | | | |
Consumer Services — 1.0% | | | | | |
Panera Bread Company, Class A (a) | | | 8,722 | | | | 1,780,335 | |
Starbucks Corporation | | | 550 | | | | 31,861 | |
| | | | | | | | |
| | | | | | | 1,812,196 | |
| | | | | | | | |
Commercial & Professional Services — 0.9% | |
Interface, Inc. | | | 62,721 | | | | 1,628,864 | |
| | | | | | | | |
Automobiles & Components — 0.8% | | | | | |
BorgWarner, Inc. | | | 30,369 | | | | 1,509,643 | |
| | | | | | | | |
Household & Personal Products — 0.5% | |
Church & Dwight Company, Inc. | | | 10,361 | | | | 894,465 | |
| | | | | | | | |
Food & Staples Retailing — 0.5% | | | | | |
Costco Wholesale Corporation | | | 5,952 | | | | 864,826 | |
| | | | | | | | |
Total Common Stocks
(Cost $88,698,723) | | | | | | | 114,950,516 | |
| | | | | | | | |
| | | PRINCIPAL
AMOUNT | | | | |
BONDS & NOTES — 25.9% | | | | | |
Green Bonds, Renewable Energy & Energy Efficiency — 10.9% | |
African Development Bank
0.75%, due 10/18/16 (b) | | $ | 1,000,000 | | | | 1,002,372 | |
Asian Development Bank
2.125%, due 3/19/25 (b) | | | 1,000,000 | | | | 980,699 | |
Bank of America Corporation
1.35%, due 11/21/16 | | | 1,500,000 | | | | 1,498,776 | |
European Investment Bank
2.50%, due 10/15/24 | | | 1,000,000 | | | | 1,014,793 | |
Export-Import Bank of Korea
1.75%, due 2/27/18 (b) | | | 1,000,000 | | | | 998,571 | |
International Bank for Reconstruction & Development 0.375%, due 8/24/15 | | | 1,000,000 | | | | 1,000,136 | |
International Bank for Reconstruction & Development 2.00%, due 10/20/16 | | | 500,000 | | | | 508,824 | |
15
| | |
GREEN CENTURY BALANCED FUND PORTFOLIO OF INVESTMENTS July 31, 2015 | | continued |
| | | | | | | | |
| | | PRINCIPAL
AMOUNT | | | VALUE | |
Green Bonds, Renewable Energy & Energy Efficiency — (continued) | |
International Bank for Reconstruction & Development
2.25%, due 9/30/24 (c) | | $ | 750,000 | | | $ | 752,611 | |
International Bank for Reconstruction & Development
2.125%, due 3/3/25 | | | 1,000,000 | | | | 981,900 | |
International Finance Corporation
0.625%, due 11/15/16 | | | 1,000,000 | | | | 999,688 | |
Johnson Controls, Inc.
5.50%, due 1/15/16 | | | 500,000 | | | | 511,061 | |
KFW
1.75%, due 10/15/19 | | | 1,500,000 | | | | 1,513,482 | |
Morgan Stanley
2.20%, due 12/7/18 | | | 1,000,000 | | | | 1,011,038 | |
Nordic Investment Bank
2.25%, due 9/30/21 | | | 1,500,000 | | | | 1,527,157 | |
Overseas Private Investment Corporation
3.28%, due 9/15/29 | | | 800,000 | | | | 817,756 | |
Overseas Private Investment Corporation
3.33%, due 5/15/33 | | | 249,212 | | | | 254,668 | |
Overseas Private Investment Corporation
3.43%, due 6/1/33 | | | 250,000 | | | | 257,943 | |
Regency Centers LP
3.75%, due 6/15/24 | | | 1,500,000 | | | | 1,502,259 | |
Svensk Exportkredit AB
1.875%, due 6/23/20 | | | 1,500,000 | | | | 1,505,246 | |
Vornado Realty LP
2.50%, due 6/30/19 | | | 1,000,000 | | | | 1,000,654 | |
| | | | | | | | |
| | | | | | | 19,639,634 | |
| | | | | | | | |
Software & Services — 2.7% | |
International Business Machines Corporation
2.00%, due 1/5/16 | | | 500,000 | | | | 503,474 | |
International Business Machines Corporation
8.375%, due 11/1/19 | | | 500,000 | | | | 628,857 | |
Microsoft Corporation
1.625%, due 9/25/15 | | | 500,000 | | | | 500,964 | |
Oracle Corporation
1.20%, due 10/15/17 | | | 500,000 | | | | 499,611 | |
| | | | | | | | |
| | | PRINCIPAL
AMOUNT | | | VALUE | |
Software & Services — (continued) | |
Oracle Corporation
5.00%, due 7/8/19 | | $ | 1,000,000 | | | $ | 1,114,280 | |
Oracle Corporation
2.50%, due 5/15/22 | | | 500,000 | | | | 486,344 | |
Symantec Corporation
4.20%, due 9/15/20 | | | 1,000,000 | | | | 1,043,084 | |
| | | | | | | | |
| | | | | | | 4,776,614 | |
| | | | | | | | |
U.S. Government Agencies — 2.6% | | | | | |
Federal Farm Credit Bank
5.125%, due 8/25/16 | | | 500,000 | | | | 524,769 | |
Federal Farm Credit Bank
2.26%, due 11/13/24 | | | 1,000,000 | | | | 981,603 | |
Federal Home Loan Bank
5.625%, due 6/13/16 | | | 1,000,000 | | | | 1,044,668 | |
Federal Home Loan Bank
3.875%, due 12/14/18 | | | 550,000 | | | | 596,581 | |
Federal Home Loan Bank
2.00%, due 6/25/27 (c) | | | 1,000,000 | | | | 992,414 | |
Federal Home Loan Mortgage Corporation
3.75%, due 3/27/19 | | | 500,000 | | | | 543,492 | |
| | | | | | | | |
| | | | | | | 4,683,527 | |
| | | | | | | | |
Banks — 1.8% | | | | | | | | |
HSBC Bank USA N.A.
6.00%, due 8/9/17 | | | 500,000 | | | | 542,447 | |
HSBC Holdings PLC
5.10%, due 4/5/21 | | | 1,500,000 | | | | 1,671,319 | |
JPMorgan Chase & Company
4.40%, due 7/22/20 | | | 1,000,000 | | | | 1,079,491 | |
| | | | | | | | |
| | | | | | | 3,293,257 | |
| | | | | | | | |
Diversified Financials — 1.4% | |
Bank of New York Mellon Corporation (The)
3.55%, due 9/23/21 | | | 1,000,000 | | | | 1,047,990 | |
Citigroup, Inc.
3.953%, due 6/15/16 | | | 500,000 | | | | 512,799 | |
Deutsche Bank A.G.
3.25%, due 1/11/16 (b) | | | 500,000 | | | | 505,228 | |
Morgan Stanley
3.80%, due 4/29/16 | | | 500,000 | | | | 510,850 | |
| | | | | | | | |
| | | | | | | 2,576,867 | |
| | | | | | | | |
16
| | |
GREEN CENTURY BALANCED FUND PORTFOLIO OF INVESTMENTS July 31, 2015 | | concluded |
| | | | | | | | |
| | | PRINCIPAL
AMOUNT | | | VALUE | |
Real Estate — 1.4% | | | | | | | | |
Digital Realty Trust LP
3.95%, due 7/1/22 | | $ | 1,500,000 | | | $ | 1,506,968 | |
HCP, Inc.
3.875%, due 8/15/24 | | | 1,000,000 | | | | 989,342 | |
| | | | | | | | |
| | | | | | | 2,496,310 | |
| | | | | | | | |
Pharmaceuticals & Biotechnology — 1.1% | |
Amgen, Inc.
5.70%, due 2/1/19 | | | 1,250,000 | | | | 1,406,251 | |
Thermo Fisher Scientific, Inc.
2.40%, due 2/1/19 | | | 500,000 | | | | 501,348 | |
| | | | | | | | |
| | | | | | | 1,907,599 | |
| | | | | | | | |
Telecommunication Services — 1.0% | | | | | |
America Movil SAB de C.V.
5.00%, due 10/16/19 (b) | | | 750,000 | | | | 824,805 | |
AT&T, Inc.
2.50%, due 8/15/15 | | | 333,000 | | | | 333,173 | |
Verizon Communications, Inc.
6.35%, due 4/1/19 | | | 500,000 | | | | 571,740 | |
| | | | | | | | |
| | | | | | | 1,729,718 | |
| | | | | | | | |
Capital Goods — 0.9% | | | | | |
Koninklijke Philips NV
5.75%, due 3/11/18 | | | 1,500,000 | | | | 1,635,386 | |
| | | | | | | | |
Technology Hardware & Equipment — 0.7% | |
Dell, Inc.
2.30%, due 9/10/15 | | | 500,000 | | | | 500,940 | |
EMC Corporation
1.875%, due 6/1/18 | | | 700,000 | | | | 700,939 | |
| | | | | | | | |
| | | | | | | 1,201,879 | |
| | | | | | | | |
Media — 0.6% | | | | | |
Discovery Communications LLC
5.625%, due 8/15/19 | | | 1,000,000 | | | | 1,114,475 | |
| | | | | | | | |
Healthcare Equipment & Services — 0.5% | |
Baxter International, Inc.
1.85%, due 6/15/18 | | | 500,000 | | | | 498,469 | |
Stryker Corporation
1.30%, due 4/1/18 | | | 500,000 | | | | 497,051 | |
| | | | | | | | |
| | | | | | | 995,520 | |
| | | | | | | | |
| | | | | | | | |
| | | PRINCIPAL
AMOUNT | | | VALUE | |
Food & Staples Retailing — 0.3% | | | | | |
CVS Health Corporation
2.25%, due 12/5/18 | | $ | 500,000 | | | $ | 505,595 | |
| | | | | | | | |
Total Bonds & Notes
(Cost $46,164,222) | | | | | | | 46,556,381 | |
| | | | | | | | |
CERTIFICATES OF DEPOSIT — 0.1% | |
Self Help Credit Union Environmental Certificate of Deposit
1.01%, due 8/10/16 | | | 95,000 | | | | 95,000 | |
| | | | | | | | |
Total Certificates Of Deposit
(Cost $95,000) | | | | | | | 95,000 | |
| | | | | | | | |
SHORT-TERM INVESTMENT — 9.8% | |
UMB Money Market Fiduciary Account,
0.01% (d) | | | | | | | 17,612,625 | |
| | | | | | | | |
Total Short-term Investment
(Cost $17,612,625) | | | | | | | 17,612,625 | |
| | | | | | | | |
TOTAL INVESTMENTS (e) — 99.7% | |
(Cost $152,570,570) | | | | | | | 179,214,522 | |
Other Assets Less
Liabilities — 0.3% | | | | | | | 499,862 | |
| | | | | | | | |
NET ASSETS — 100.0% | | | | | | $ | 179,714,384 | |
| | | | | | | | |
| (a) | Non-income producing security. |
| (b) | Securities whose values are determined or significantly influenced by trading in markets other than the United States or Canada. |
| (c) | Step rate bond. Rate shown is currently in effect at July 31, 2015. |
| (d) | The rate quoted is the annualized seven-day yield of the Fund at the period end. |
| (e) | The cost of investments for federal income tax purposes is $152,575,314 resulting in gross unrealized appreciation and depreciation of $29,534,821 and $2,895,613 respectively, or net unrealized appreciation of $26,639,208. |
See Notes to Financial Statements
17
| | |
GREEN CENTURY EQUITY FUND PORTFOLIO OF INVESTMENTS July 31, 2015 | | |
| | | | | | | | |
COMMON STOCKS — 99.6% | |
| | | SHARES | | | VALUE | |
Software & Services — 14.5% | |
Accenture PLC, Class A | | | 11,662 | | | $ | 1,202,469 | |
Adobe Systems, Inc. (a) | | | 9,299 | | | | 762,425 | |
ANSYS, Inc. (a) | | | 1,678 | | | | 157,984 | |
Autodesk, Inc. (a) | | | 4,198 | | | | 212,335 | |
Automatic Data Processing, Inc. | | | 8,830 | | | | 704,369 | |
CA, Inc. | | | 6,180 | | | | 180,054 | |
Citrix Systems, Inc. (a) | | | 2,956 | | | | 223,503 | |
Cognizant Technology Solutions Corporation, Class A (a) | | | 11,336 | | | | 715,302 | |
Convergys Corporation | | | 1,757 | | | | 44,118 | |
FactSet Research Systems, Inc. | | | 718 | | | | 118,944 | |
FleetCor Technologies, Inc. (a) | | | 1,436 | | | | 222,321 | |
Google, Inc., Class A (a) | | | 5,328 | | | | 3,503,160 | |
Google, Inc., Class C (a) | | | 5,708 | | | | 3,570,982 | |
International Business Machines Corporation | | | 17,437 | | | | 2,824,620 | |
Intuit, Inc. | | | 4,881 | | | | 516,263 | |
NetSuite, Inc. (a) | | | 692 | | | | 68,397 | |
Oracle Corporation | | | 65,237 | | | | 2,605,566 | |
Rackspace Hosting, Inc. (a) | | | 2,193 | | | | 74,628 | |
salesforce.com, Inc. (a) | | | 11,120 | | | | 815,096 | |
Symantec Corporation | | | 12,724 | | | | 289,344 | |
Teradata Corporation (a) | | | 2,695 | | | | 100,011 | |
Western Union Company (The) | | | 9,768 | | | | 197,704 | |
Workday, Inc., Class A (a) | | | 1,908 | | | | 160,902 | |
Xerox Corporation | | | 19,729 | | | | 217,414 | |
Yahoo!, Inc. (a) | | | 16,515 | | | | 605,605 | |
| | | | | | | | |
| | | | | | | 20,093,516 | |
| | | | | | | | |
Pharmaceuticals & Biotechnology — 11.4% | |
Affymetrix, Inc. (a) | | | 1,246 | | | | 13,656 | |
Agilent Technologies, Inc. | | | 6,255 | | | | 256,142 | |
Amgen, Inc. | | | 14,087 | | | | 2,487,623 | |
Bio-Techne Corporation | | | 712 | | | | 77,879 | |
Biogen, Inc. (a) | | | 4,356 | | | | 1,388,606 | |
BioMarin Pharmaceutical, Inc. (a) | | | 2,962 | | | | 433,252 | |
Bristol-Myers Squibb Company | | | 30,851 | | | | 2,025,060 | |
Cepheid (a) | | | 1,301 | | | | 72,323 | |
Fluidigm Corporation (a) | | | 492 | | | | 9,855 | |
Gilead Sciences, Inc. | | | 27,651 | | | | 3,258,947 | |
Merck & Company, Inc. | | | 52,679 | | | | 3,105,954 | |
Mettler-Toledo International, Inc. (a) | | | 524 | | | | 176,902 | |
PAREXEL International Corporation (a) | | | 990 | | | | 68,270 | |
| | | | | | | | |
| | | SHARES | | | VALUE | |
Pharmaceuticals & Biotechnology — (continued) | |
Quintiles Transnational Holdings, Inc. (a) | | | 1,491 | | | $ | 114,389 | |
Thermo Fisher Scientific, Inc. | | | 7,366 | | | | 1,027,778 | |
Vertex Pharmaceuticals, Inc. (a) | | | 4,495 | | | | 606,825 | |
VIVUS, Inc. (a) | | | 1,906 | | | | 2,878 | |
Waters Corporation (a) | | | 1,535 | | | | 204,907 | |
Zoetis, Inc. | | | 8,857 | | | | 433,816 | |
| | | | | | | | |
| | | | | | | 15,765,062 | |
| | | | | | | | |
Technology Hardware & Equipment — 5.9% | |
Black Box Corporation | | | 220 | | | | 3,445 | |
Calix, Inc. (a) | | | 639 | | | | 5,387 | |
Cisco Systems, Inc. | | | 94,768 | | | | 2,693,306 | |
Corning, Inc. | | | 23,660 | | | | 441,969 | |
EMC Corporation | | | 36,920 | | | | 992,779 | |
Flextronics International Ltd. (a) | | | 10,598 | | | | 116,684 | |
Hewlett-Packard Company | | | 33,890 | | | | 1,034,323 | |
Lexmark International, Inc. | | | 1,104 | | | | 37,525 | |
Motorola Solutions, Inc. | | | 3,880 | | | | 233,421 | |
Plantronics, Inc. | | | 772 | | | | 44,838 | |
QUALCOMM, Inc. | | | 30,626 | | | | 1,972,008 | |
Silicon Graphics International Corporation (a) | | | 443 | | | | 2,264 | |
Super Micro Computer, Inc. (a) | | | 647 | | | | 17,255 | |
TE Connectivity Ltd. | | | 7,556 | | | | 460,311 | |
Trimble Navigation Ltd. (a) | | | 4,879 | | | | 112,705 | |
| | | | | | | | |
| | | | | | | 8,168,220 | |
| | | | | | | | |
Capital Goods — 5.9% | |
3M Company | | | 11,782 | | | | 1,783,088 | |
A.O. Smith Corporation | | | 1,388 | | | | 99,686 | |
AGCO Corporation | | | 1,438 | | | | 79,104 | |
Air Lease Corporation | | | 1,785 | | | | 63,100 | |
American Science & Engineering, Inc. | | | 117 | | | | 5,229 | |
Applied Industrial Technologies, Inc. | | | 691 | | | | 26,693 | |
Builders FirstSource, Inc. (a) | | | 977 | | | | 14,694 | |
Caterpillar, Inc. | | | 10,717 | | | | 842,678 | |
CLARCOR, Inc. | | | 949 | | | | 57,101 | |
Cummins, Inc. | | | 3,205 | | | | 415,144 | |
Deere & Company | | | 5,981 | | | | 565,623 | |
Dover Corporation | | | 3,029 | | | | 194,068 | |
EMCOR Group, Inc. | | | 1,104 | | | | 52,804 | |
Fastenal Company | | | 5,215 | | | | 218,300 | |
Flowserve Corp. | | | 2,551 | | | | 119,871 | |
18
| | |
GREEN CENTURY EQUITY FUND PORTFOLIO OF INVESTMENTS July 31, 2015 | | continued |
| | | | | | | | |
| | | SHARES | | | VALUE | |
Capital Goods — (continued) | |
Graco, Inc. | | | 1,071 | | | $ | 76,566 | |
Granite Construction, Inc. | | | 656 | | | | 22,317 | |
H&E Equipment Services, Inc. | | | 568 | | | | 10,190 | |
Illinois Tool Works, Inc. | | | 6,350 | | | | 568,134 | |
Ingersoll-Rand PLC | | | 4,920 | | | | 302,088 | |
Lincoln Electric Holdings, Inc. | | | 1,260 | | | | 76,293 | |
Masco Corporation | | | 6,474 | | | | 170,849 | |
Meritor, Inc. (a) | | | 1,653 | | | | 23,274 | |
Middleby Corporation (The) (a) | | | 1,093 | | | | 134,111 | |
Nordson Corporation | | | 1,062 | | | | 78,705 | |
Owens Corning | | | 2,151 | | | | 96,472 | |
Pall Corporation | | | 1,986 | | | | 251,130 | |
Parker Hannifin Corporation | | | 2,622 | | | | 295,631 | |
Quanta Services, Inc. (a) | | | 3,951 | | | | 109,127 | |
Rockwell Automation, Inc. | | | 2,517 | | | | 293,935 | |
Snap-on, Inc. | | | 1,074 | | | | 176,995 | |
Tennant Company | | | 276 | | | | 16,508 | |
Timken Company (The) | | | 1,353 | | | | 45,163 | |
United Rentals, Inc. (a) | | | 1,811 | | | | 121,319 | |
W.W. Grainger, Inc. | | | 1,143 | | | | 261,416 | |
WABCO Holdings, Inc. (a) | | | 1,037 | | | | 128,038 | |
Wabtec Corporation | | | 1,793 | | | | 181,434 | |
Xylem, Inc. | | | 3,313 | | | | 114,398 | |
| | | | | | | | |
| | | | | | | 8,091,276 | |
| | | | | | | | |
Media — 5.4% | |
Charter Communications, Inc., Class A (a) | | | 1,558 | | | | 289,570 | |
Discovery Communications, Inc., Class A (a) | | | 2,793 | | | | 92,225 | |
Discovery Communications, Inc., Class C (a) | | | 5,292 | | | | 160,348 | |
DreamWorks Animation SKG, Inc., Class A (a) | | | 1,322 | | | | 31,873 | |
John Wiley & Sons, Inc., Class A | | | 877 | | | | 46,490 | |
Liberty Global PLC, Class A (a) | | | 4,694 | | | | 246,247 | |
Liberty Global PLC, Series C (a) | | | 11,640 | | | | 571,990 | |
New York Times Company (The), Class A | | | 2,340 | | | | 30,935 | |
Scholastic Corporation | | | 424 | | | | 18,270 | |
Scripps Networks Interactive, Inc., Class A | | | 1,451 | | | | 90,803 | |
Time Warner Cable, Inc. | | | 5,213 | | | | 990,522 | |
Time Warner, Inc. | | | 15,422 | | | | 1,357,753 | |
Walt Disney Company (The) | | | 29,965 | | | | 3,595,800 | |
| | | | | | | | |
| | | | | | | 7,522,826 | |
| | | | | | | | |
| | | | | | | | |
| | | SHARES | | | VALUE | |
Food & Beverage — 5.3% | |
Bunge Ltd. | | | 2,675 | | | $ | 213,599 | |
Campbell Soup Company | | | 3,537 | | | | 174,410 | |
Coca-Cola Enterprises, Inc. | | | 4,123 | | | | 210,603 | |
Darling Ingredients, Inc. (a) | | | 3,071 | | | | 39,462 | |
Dr. Pepper Snapple Group, Inc. | | | 3,542 | | | | 284,139 | |
General Mills, Inc. | | | 11,241 | | | | 654,339 | |
JM Smucker Company (The) | | | 1,880 | | | | 209,977 | |
Kellogg Company | | | 4,917 | | | | 325,358 | |
Keurig Green Mountain, Inc. | | | 2,232 | | | | 167,489 | |
Kraft Heinz Company (The) | | | 11,073 | | | | 879,971 | |
McCormick & Company, Inc. | | | 2,192 | | | | 179,766 | |
Mondelez International, Inc., Class A | | | 30,581 | | | | 1,380,121 | |
PepsiCo, Inc. | | | 27,512 | | | | 2,650,781 | |
| | | | | | | | |
| | | | | | | 7,370,015 | |
| | | | | | | | |
Diversified Financials — 5.0% | |
American Express Company | | | 17,036 | | | | 1,295,758 | |
Ameriprise Financial, Inc. | | | 3,396 | | | | 426,775 | |
Bank of New York Mellon Corporation (The) | | | 20,681 | | | | 897,555 | |
BlackRock, Inc. | | | 2,306 | | | | 775,554 | |
Charles Schwab Corporation (The) | | | 21,909 | | | | 764,186 | |
CME Group, Inc. | | | 5,961 | | | | 572,494 | |
Franklin Resources, Inc. | | | 7,539 | | | | 343,402 | |
Invesco Ltd. | | | 7,978 | | | | 307,951 | |
Legg Mason, Inc. | | | 1,911 | | | | 94,289 | |
Northern Trust Corporation | | | 4,118 | | | | 314,986 | |
PHH Corporation (a) | | | 920 | | | | 22,963 | |
State Street Corporation | | | 7,682 | | | | 588,134 | |
T. Rowe Price Group, Inc. | | | 4,839 | | | | 373,232 | |
TD Ameritrade Holding Corporation | | | 5,067 | | | | 186,111 | |
| | | | | | | | |
| | | | | | | 6,963,390 | |
| | | | | | | | |
Real Estate — 4.8% | |
American Tower Corporation | | | 7,782 | | | | 740,146 | |
AvalonBay Communities, Inc. | | | 2,441 | | | | 420,682 | |
Boston Properties, Inc. | | | 2,818 | | | | 347,403 | |
CBRE Group, Inc., Class A (a) | | | 5,546 | | | | 210,582 | |
Corporate Office Properties Trust | | | 1,587 | | | | 36,707 | |
Digital Realty Trust, Inc. | | | 2,554 | | | | 164,145 | |
Duke Realty Corporation | | | 6,428 | | | | 129,653 | |
Equinix, Inc. | | | 1,045 | | | | 291,461 | |
Equity Residential | | | 6,726 | | | | 503,172 | |
Federal Realty Investment Trust | | | 1,314 | | | | 179,742 | |
19
| | |
GREEN CENTURY EQUITY FUND PORTFOLIO OF INVESTMENTS July 31, 2015 | | continued |
| | | | | | | | |
| | | SHARES | | | VALUE | |
Real Estate — (continued) | |
Forest City Enterprises, Inc., Class A (a) | | | 4,197 | | | $ | 98,000 | |
HCP, Inc. | | | 8,516 | | | | 329,058 | |
Host Hotels & Resorts, Inc. | | | 14,014 | | | | 271,591 | |
Iron Mountain, Inc. | | | 3,720 | | | | 111,786 | |
Jones Lang LaSalle, Inc. | | | 830 | | | | 147,773 | |
Liberty Property Trust | | | 2,762 | | | | 93,991 | |
Macerich Company (The) | | | 2,508 | | | | 198,533 | |
Plum Creek Timber Company, Inc. | | | 3,326 | | | | 136,366 | |
Potlatch Corporation | | | 664 | | | | 23,247 | |
Prologis, Inc. | | | 9,478 | | | | 384,901 | |
Simon Property Group, Inc. | | | 5,813 | | | | 1,088,310 | |
UDR, Inc. | | | 4,928 | | | | 166,616 | |
Vornado Realty Trust | | | 3,125 | | | | 304,844 | |
Weyerhaeuser Company | | | 9,685 | | | | 297,233 | |
| | | | | | | | |
| | | | | | | 6,675,942 | |
| | | | | | | | |
Household & Personal Products — 4.7% | |
Avon Products, Inc. | | | 8,184 | | | | 46,403 | |
Clorox Company (The) | | | 2,493 | | | | 279,066 | |
Colgate-Palmolive Company | | | 15,963 | | | | 1,085,803 | |
Edgewell Personal Care Company | | | 1,158 | | | | 110,832 | |
Estee Lauder Companies, Inc. (The), Class A | | | 4,279 | | | | 381,302 | |
Kimberly-Clark Corporation | | | 6,752 | | | | 776,278 | |
Procter & Gamble Company (The) | | | 50,106 | | | | 3,843,130 | |
| | | | | | | | |
| | | | | | | 6,522,814 | |
| | | | | | | | |
Retailing — 4.0% | |
ANN, Inc. (a) | | | 793 | | | | 36,280 | |
Bed Bath & Beyond, Inc. (a) | | | 3,482 | | | | 227,131 | |
Best Buy Company, Inc. | | | 5,975 | | | | 192,933 | |
Blue Nile, Inc. (a) | | | 189 | | | | 5,995 | |
Buckle, Inc. (The) | | | 529 | | | | 23,398 | |
Caleres Inc | | | 721 | | | | 23,822 | |
CarMax, Inc. (a) | | | 3,917 | | | | 252,686 | |
Foot Locker, Inc. | | | 2,634 | | | | 185,829 | |
GameStop Corporation, Class A | | | 2,084 | | | | 95,551 | |
Gap, Inc. (The) | | | 4,629 | | | | 168,866 | |
Genuine Parts Company | | | 2,808 | | | | 249,771 | |
HSN, Inc. | | | 630 | | | | 46,311 | |
Kohl’s Corporation | | | 3,721 | | | | 228,172 | |
LKQ Corporation (a) | | | 5,684 | | | | 178,818 | |
Lowe’s Companies, Inc. | | | 18,027 | | | | 1,250,353 | |
Men’s Wearhouse, Inc. (The) | | | 747 | | | | 44,461 | |
Netflix, Inc. (a) | | | 7,470 | | | | 853,896 | |
| | | | | | | | |
| | | SHARES | | | VALUE | |
Retailing — (continued) | |
Nordstrom, Inc. | | | 2,697 | | | $ | 205,808 | |
Nutrisystem, Inc. | | | 535 | | | | 16,077 | |
Office Depot, Inc. (a) | | | 9,172 | | | | 73,376 | |
Pier 1 Imports, Inc. | | | 1,662 | | | | 19,628 | |
Pool Corporation | | | 792 | | | | 55,773 | |
Shutterfly, Inc. (a) | | | 743 | | | | 32,135 | |
Signet Jewelers Ltd. | | | 1,408 | | | | 170,678 | |
Staples, Inc. | | | 11,824 | | | | 173,931 | |
Tiffany & Company | | | 2,434 | | | | 232,934 | |
Tractor Supply Company | | | 2,501 | | | | 231,392 | |
Ulta Salon, Cosmetics & Fragrance, Inc. (a) | | | 1,146 | | | | 190,270 | |
Weyco Group, Inc. | | | 120 | | | | 3,463 | |
| | | | | | | | |
| | | | | | | 5,469,738 | |
| | | | | | | | |
Healthcare Equipment & Services — 3.9% | |
AmerisourceBergen Corporation | | | 3,882 | | | | 410,521 | |
Becton, Dickinson and Company | | | 3,887 | | | | 591,407 | |
Cardinal Health, Inc. | | | 6,111 | | | | 519,313 | |
Centene Corp. (a) | | | 2,114 | | | | 148,255 | |
Cerner Corporation (a) | | | 5,740 | | | | 411,673 | |
Cigna Corporation | | | 4,797 | | | | 691,056 | |
Cooper Companies, Inc. (The) | | | 901 | | | | 159,477 | |
DENTSPLY International, Inc. | | | 2,570 | | | | 146,259 | |
Edwards Lifesciences Corporation (a) | | | 2,000 | | | | 304,320 | |
Envision Healthcare Holdings, Inc. (a) | | | 3,447 | | | | 154,426 | |
Henry Schein, Inc. (a) | | | 1,532 | | | | 226,705 | |
Hologic, Inc. (a) | | | 4,439 | | | | 184,929 | |
Humana, Inc. | | | 2,785 | | | | 507,121 | |
IDEXX Laboratories, Inc. (a) | | | 1,737 | | | | 126,332 | |
Laboratory Corporation of America Holdings (a) | | | 1,874 | | | | 238,541 | |
Molina Healthcare, Inc. (a) | | | 757 | | | | 57,101 | |
Patterson Companies, Inc. | | | 1,653 | | | | 82,914 | |
ResMed, Inc. | | | 2,614 | | | | 151,481 | |
Select Medical Holdings Corporation | | | 1,670 | | | | 24,098 | |
Team Health Holdings, Inc. (a) | | | 1,335 | | | | 89,992 | |
Varian Medical Systems, Inc. (a) | | | 1,894 | | | | 163,017 | |
| | | | | | | | |
| | | | | | | 5,388,938 | |
| | | | | | | | |
Semiconductors — 3.8% | |
Advanced Micro Devices, Inc. (a) | | | 12,277 | | | | 23,695 | |
Analog Devices, Inc. | | | 5,808 | | | | 338,781 | |
20
| | |
GREEN CENTURY EQUITY FUND PORTFOLIO OF INVESTMENTS July 31, 2015 | | continued |
| | | | | | | | |
| | | SHARES | | | VALUE | |
Semiconductors — (continued) | |
Applied Materials, Inc. | | | 22,755 | | | $ | 395,027 | |
Intel Corporation | | | 87,929 | | | | 2,545,545 | |
Lam Research Corporation | | | 2,945 | | | | 226,382 | |
Microchip Technology, Inc. | | | 3,837 | | | | 164,377 | |
NVIDIA Corporation | | | 10,155 | | | | 202,592 | |
Skyworks Solutions, Inc. | | | 3,542 | | | | 338,863 | |
Texas Instruments, Inc. | | | 19,431 | | | | 971,161 | |
| | | | | | | | |
| | | | | | | 5,206,423 | |
| | | | | | | | |
Consumer Services — 3.3% | |
Choice Hotels International, Inc. | | | 642 | | | | 32,524 | |
Darden Restaurants, Inc. | | | 2,111 | | | | 155,707 | |
DeVry Education Group, Inc. | | | 1,114 | | | | 33,843 | |
Hilton Worldwide Holdings, Inc. (a) | | | 9,108 | | | | 244,550 | |
Jack in the Box, Inc. | | | 684 | | | | 64,980 | |
Marriott International, Inc., Class A | | | 4,116 | | | | 298,863 | |
McDonald’s Corporation | | | 17,843 | | | | 1,781,802 | |
Royal Caribbean Cruises Ltd. | | | 3,246 | | | | 291,653 | |
Starbucks Corporation | | | 27,837 | | | | 1,612,597 | |
Vail Resorts, Inc. | | | 685 | | | | 75,138 | |
| | | | | | | | |
| | | | | | | 4,591,657 | |
| | | | | | | | |
Telecommunication Services — 3.1% | |
CenturyLink, Inc. | | | 10,557 | | | | 301,930 | |
Cincinnati Bell, Inc. (a) | | | 3,478 | | | | 13,599 | |
Level 3 Communications, Inc. (a) | | | 5,496 | | | | 277,548 | |
Sprint Corporation (a) | | | 15,507 | | | | 52,259 | |
Verizon Communications, Inc. | | | 77,069 | | | | 3,606,058 | |
| | | | | | | | |
| | | | | | | 4,251,394 | |
| | | | | | | | |
Insurance — 3.0% | |
ACE Ltd. | | | 6,073 | | | | 660,560 | |
Aflac, Inc. | | | 8,149 | | | | 521,943 | |
Chubb Corporation (The) | | | 4,295 | | | | 533,997 | |
Hartford Financial Services Group, Inc. | | | 7,784 | | | | 370,129 | |
Marsh & McLennan Companies, Inc. | | | 9,965 | | | | 577,372 | |
PartnerRe Ltd. | | | 877 | | | | 119,237 | |
Principal Financial Group, Inc. | | | 5,476 | | | | 303,973 | |
Progressive Corporation (The) | | | 10,929 | | | | 333,335 | |
Travelers Companies, Inc. (The) | | | 5,965 | | | | 633,006 | |
Willis Group Holdings PLC | | | 2,953 | | | | 137,285 | |
| | | | | | | | |
| | | | | | | 4,190,837 | |
| | | | | | | | |
| | | | | | | | |
| | | SHARES | | | VALUE | |
Materials — 3.0% | |
Air Products & Chemicals, Inc. | | | 3,782 | | | $ | 538,973 | |
Albemarle Corporation | | | 2,141 | | | | 116,042 | |
Avery Dennison Corporation | | | 1,701 | | | | 103,506 | |
Ball Corporation | | | 2,434 | | | | 165,123 | |
Compass Minerals International, Inc. | | | 647 | | | | 51,760 | |
Domtar Corporation | | | 1,154 | | | | 46,922 | |
Ecolab, Inc. | | | 4,998 | | | | 578,818 | |
H.B. Fuller Company | | | 867 | | | | 34,732 | |
International Flavors & Fragrances, Inc. | | | 1,489 | | | | 172,113 | |
Minerals Technologies, Inc. | | | 663 | | | | 42,929 | |
Mosaic Company (The) | | | 6,162 | | | | 264,596 | |
Praxair, Inc. | | | 5,368 | | | | 612,703 | |
Schnitzer Steel Industries, Inc., Class A | | | 531 | | | | 8,342 | |
Sealed Air Corporation | | | 3,886 | | | | 206,619 | |
Sherwin-Williams Company (The) | | | 1,502 | | | | 417,196 | |
Sigma-Aldrich Corporation | | | 2,206 | | | | 307,980 | |
Sonoco Products Company | | | 1,761 | | | | 72,694 | |
Valspar Corporation (The) | | | 1,447 | | | | 120,506 | |
Wausau Paper Corporation | | | 607 | | | | 5,366 | |
WestRock Company (a) | | | 4,862 | | | | 306,598 | |
| | | | | | | | |
| | | | | | | 4,173,518 | |
| | | | | | | | |
Consumer Durables & Apparel — 3.0% | |
Callaway Golf Company | | | 1,289 | | | | 11,807 | |
Columbia Sportswear Company | | | 513 | | | | 36,700 | |
CSS Industries, Inc. | | | 55 | | | | 1,561 | |
Deckers Outdoor Corporation (a) | | | 611 | | | | 44,530 | |
Ethan Allen Interiors, Inc. | | | 528 | | | | 15,940 | |
Hanesbrands, Inc. | | | 7,426 | | | | 230,429 | |
Hasbro, Inc. | | | 2,086 | | | | 164,252 | |
Jarden Corporation (a) | | | 3,709 | | | | 203,995 | |
La-Z-Boy, Inc. | | | 868 | | | | 22,047 | |
Mattel, Inc. | | | 6,215 | | | | 144,250 | |
Meritage Homes Corporation (a) | | | 653 | | | | 29,450 | |
Michael Kors Holdings Ltd. (a) | | | 3,725 | | | | 156,413 | |
Mohawk Industries, Inc. (a) | | | 1,168 | | | | 235,457 | |
Newell Rubbermaid, Inc. | | | 5,044 | | | | 218,304 | |
NIKE, Inc., Class B | | | 12,734 | | | | 1,467,212 | |
Oxford Industries, Inc. | | | 276 | | | | 23,165 | |
PVH Corporation | | | 1,529 | | | | 177,425 | |
Tupperware Brands Corporation | | | 942 | | | | 55,079 | |
Under Armour, Inc., Class A (a) | | | 3,275 | | | | 325,306 | |
VF Corporation | | | 6,406 | | | | 493,839 | |
21
| | |
GREEN CENTURY EQUITY FUND PORTFOLIO OF INVESTMENTS July 31, 2015 | | continued |
| | | | | | | | |
| | | SHARES | | | VALUE | |
Consumer Durables & Apparel — (continued) | |
Wolverine World Wide, Inc. | | | 1,973 | | | $ | 57,848 | |
| | | | | | | | |
| | | | | | | 4,115,009 | |
| | | | | | | | |
Banks — 2.8% | |
Bank of Hawaii Corporation | | | 783 | | | | 52,829 | |
Cathay General Bancorp | | | 1,398 | | | | 44,890 | |
CIT Group, Inc. | | | 3,237 | | | | 152,268 | |
Comerica, Inc. | | | 3,354 | | | | 159,080 | |
Heartland Financial USA, Inc. | | | 292 | | | | 11,003 | |
International Bancshares Corporation | | | 1,025 | | | | 27,603 | |
KeyCorp | | | 15,912 | | | | 236,134 | |
M&T Bank Corporation | | | 2,226 | | | | 291,940 | |
New York Community Bancorp, Inc. | | | 7,994 | | | | 152,126 | |
Old National Bancorp | | | 2,149 | | | | 30,924 | |
People’s United Financial, Inc. | | | 6,132 | | | | 99,768 | |
PNC Financial Services Group, Inc. (The) | | | 9,664 | | | | 948,811 | |
Popular, Inc. (a) | | | 1,877 | | | | 57,474 | |
U.S. Bancorp | | | 33,096 | | | | 1,496,270 | |
Umpqua Holdings Corporation | | | 4,022 | | | | 71,350 | |
| | | | | | | | |
| | | | | | | 3,832,470 | |
| | | | | | | | |
Transportation — 2.5% | |
ArcBest Corporation | | | 399 | | | | 13,187 | |
Avis Budget Group, Inc. (a) | | | 1,991 | | | | 86,469 | |
C.H. Robinson Worldwide, Inc. | | | 2,691 | | | | 188,774 | |
CSX Corporation | | | 18,408 | | | | 575,802 | |
Echo Global Logistics, Inc. (a) | | | 441 | | | | 14,244 | |
Expeditors International of Washington, Inc. | | | 3,512 | | | | 164,607 | |
Genesee & Wyoming, Inc., Class A (a) | | | 992 | | | | 70,650 | |
Hertz Global Holdings, Inc. (a) | | | 7,288 | | | | 123,823 | |
Kansas City Southern | | | 2,040 | | | | 202,348 | |
Norfolk Southern Corporation | | | 5,697 | | | | 480,428 | |
Ryder System, Inc. | | | 1,015 | | | | 91,878 | |
Southwest Airlines Company | | | 3,096 | | | | 112,075 | |
United Parcel Service, Inc., Class B | | | 13,046 | | | | 1,335,389 | |
Wesco Aircraft Holdings, Inc. (a) | | | 1,317 | | | | 18,952 | |
| | | | | | | | |
| | | | | | | 3,478,626 | |
| | | | | | | | |
| | | | | | | | |
| | | SHARES | | | VALUE | |
Utilities — 1.4% | |
American Water Works Company, Inc. | | | 3,555 | | | $ | 184,540 | |
Avista Corporation | | | 1,504 | | | | 49,662 | |
CenterPoint Energy, Inc. | | | 7,159 | | | | 138,455 | |
CMS Energy Corporation | | | 4,827 | | | | 165,373 | |
Consolidated Edison, Inc. | | | 5,229 | | | | 332,512 | |
Eversource Energy | | | 6,079 | | | | 302,248 | |
MGE Energy, Inc. | | | 962 | | | | 38,172 | |
New Jersey Resources Corporation | | | 1,416 | | | | 40,922 | |
Pepco Holdings, Inc. | | | 5,023 | | | | 134,014 | |
Piedmont Natural Gas Company, Inc. | | | 1,771 | | | | 67,316 | |
Sempra Energy | | | 4,255 | | | | 433,074 | |
WGL Holdings, Inc. | | | 859 | | | | 48,018 | |
| | | | | | | | |
| | | | | | | 1,934,306 | |
| | | | | | | | |
Commercial & Professional Services — 1.0% | |
ACCO Brands Corporation (a) | | | 1,919 | | | | 15,697 | |
CEB, Inc. | | | 634 | | | | 48,514 | |
Copart, Inc. (a) | | | 2,259 | | | | 81,392 | |
Deluxe Corporation | | | 909 | | | | 58,567 | |
Dun & Bradstreet Corporation (The) | | | 653 | | | | 81,475 | |
Essendant, Inc. | | | 640 | | | | 23,565 | |
Exponent, Inc. | | | 485 | | | | 21,578 | |
Heidrick & Struggles International, Inc. | | | 327 | | | | 7,151 | |
HNI Corporation | | | 872 | | | | 43,242 | |
ICF International, Inc. (a) | | | 342 | | | | 12,538 | |
IHS, Inc., Class A (a) | | | 1,277 | | | | 159,663 | |
Interface, Inc. | | | 1,229 | | | | 31,917 | |
Kelly Services, Inc. | | | 413 | | | | 6,170 | |
Knoll, Inc. | | | 925 | | | | 22,385 | |
ManpowerGroup, Inc. | | | 1,449 | | | | 131,105 | |
Navigant Consulting, Inc. (a) | | | 784 | | | | 12,324 | |
On Assignment, Inc. (a) | | | 865 | | | | 33,147 | |
R.R. Donnelley & Sons Company | | | 3,906 | | | | 68,550 | |
Resources Connection, Inc. | | | 655 | | | | 10,369 | |
Robert Half International, Inc. | | | 2,522 | | | | 138,786 | |
RPX Corporation (a) | | | 998 | | | | 15,449 | |
Steelcase, Inc. | | | 1,789 | | | | 31,934 | |
Team, Inc. (a) | | | 364 | | | | 15,798 | |
Tetra Tech, Inc. | | | 1,059 | | | | 28,212 | |
TrueBlue, Inc. (a) | | | 796 | | | | 20,505 | |
Tyco International PLC | | | 7,775 | | | | 295,372 | |
| | | | | | | | |
| | | | | | | 1,415,405 | |
| | | | | | | | |
22
| | |
GREEN CENTURY EQUITY FUND PORTFOLIO OF INVESTMENTS July 31, 2015 | | concluded |
| | | | | | | | |
| | | SHARES | | | VALUE | |
Renewable Energy & Energy Efficiency — 0.9% | |
ITC Holdings Corporation | | | 3,249 | | | $ | 109,751 | |
Itron, Inc. (a) | | | 636 | | | | 20,498 | |
Johnson Controls, Inc. | | | 12,219 | | | | 556,698 | |
Ormat Technologies, Inc. | | | 718 | | | | 29,208 | |
SunPower Corporation (a) | | | 933 | | | | 25,219 | |
Tesla Motors, Inc. (a) | | | 1,746 | | | | 464,698 | |
| | | | | | | | |
| | | | | | | 1,206,072 | |
| | | | | | | | |
Automobiles & Components — 0.4% | |
Autoliv, Inc. | | | 1,660 | | | | 174,632 | |
BorgWarner, Inc. | | | 4,181 | | | | 207,838 | |
Harley-Davidson, Inc. | | | 3,937 | | | | 229,527 | |
| | | | | | | | |
| | | | | | | 611,997 | |
| | | | | | | | |
Healthy Living — 0.3% | |
Hain Celestial Group, Inc. (The) (a) | | | 1,920 | | | | 130,521 | |
United Natural Foods, Inc. (a) | | | 917 | | | | 41,751 | |
Whole Foods Market, Inc. | | | 6,747 | | | | 245,591 | |
| | | | | | | | |
| | | | | | | 417,863 | |
| | | | | | | | |
| | | | | | | | |
| | | SHARES | | | VALUE | |
Food & Staples Retailing — 0.3% | |
Sysco Corporation | | | 10,913 | | | $ | 396,251 | |
| | | | | | | | |
Total Common Stocks
(Cost $104,128,218) | | | | | | | 137,853,565 | |
| | | | | | | | |
SHORT-TERM INVESTMENT — 0.8% | |
UMB Money Market Fiduciary Account,
0.01% (b)
(Cost $1,074,972) | | | | | | | 1,074,972 | |
| | | | | | | | |
TOTAL INVESTMENTS (c) — 100.4% | | | | | |
(Cost $105,203,190) | | | | | | | 138,928,537 | |
Liabilities Less Other
Assets — (0.4)% | | | | | | | (525,861 | ) |
| | | | | | | | |
NET ASSETS — 100.0% | | | $ | 138,402,676 | |
| | | | | | | | |
| (a) | Non-income producing security. |
| (b) | The rate quoted is the annualized seven-day yield of the Fund at the period end. |
| (c) | The cost of investments for federal income tax purposes is $106,680,806 resulting in gross unrealized appreciation and depreciation of $35,901,575 and $3,653,844 respectively, or net unrealized appreciation of $32,247,731. |
See Notes to Financial Statements
23
GREEN CENTURY FUNDS STATEMENTS OF ASSETS AND LIABILITIES
July 31, 2015
| | | | | | | | |
| | | BALANCED FUND | | | EQUITY FUND | |
ASSETS: | | | | | | | | |
Investments, at value (cost $152,570,570 and $105,203,190, respectively) | | $ | 179,214,522 | | | $ | 138,928,537 | |
| Receivables for: | | | | | | | | |
Capital stock sold | | | 305,670 | | | | 130,038 | |
Interest | | | 393,130 | | | | 5 | |
Dividends | | | 35,432 | | | | 154,557 | |
| | | | | | | | |
Total assets | | | 179,948,754 | | | | 139,213,137 | |
| | | | | | | | |
LIABILITIES: | | | | | | | | |
Payable for securities purchased | | | — | | | | 635,938 | |
Payable for capital stock repurchased | | | 15,530 | | | | 30,036 | |
Accrued expenses | | | 218,840 | | | | 144,487 | |
| | | | | | | | |
Total liabilities | | | 234,370 | | | | 810,461 | |
| | | | | | | | |
NET ASSETS | | $ | 179,714,384 | | | $ | 138,402,676 | |
| | | | | | | | |
NET ASSETS CONSIST OF: | | | | | | | | |
Paid-in capital | | $ | 147,962,699 | | | $ | 104,711,673 | |
Undistributed net investment income/accumulated net investment loss | | | (79,218 | ) | | | 78,485 | |
Accumulated net realized gains/(losses) on investments | | | 5,186,951 | | | | (112,829 | ) |
Net unrealized appreciation on investments | | | 26,643,952 | | | | 33,725,347 | |
| | | | | | | | |
NET ASSETS | | $ | 179,714,384 | | | $ | 138,402,676 | |
| | | | | | | | |
SHARES OUTSTANDING (UNLIMITED NUMBER OF SHARES AUTHORIZED @ $0.01 PAR VALUE) | | | 7,169,583 | | | | 4,228,816 | |
| | | | | | | | |
NET ASSET VALUE, REDEMPTION PRICE AND OFFERING PRICE PER SHARE | | $ | 25.07 | | | $ | 32.73 | |
| | | | | | | | |
GREEN CENTURY FUNDS STATEMENTS OF OPERATIONS
For the year ended July 31, 2015
| | | | | | | | |
| | | BALANCED FUND | | | EQUITY FUND | |
INVESTMENT INCOME: | | | | | | | | |
Interest income | | $ | 962,367 | | | $ | 30 | |
Dividend and other income (net of $12,279 and $18 foreign withholding taxes, respectively) | | | 1,207,143 | | | | 2,315,740 | |
| | | | | | | | |
Total investment income | | | 2,169,510 | | | | 2,315,770 | |
| | | | | | | | |
EXPENSES: | | | | | | | | |
Administrative services fee | | | 1,194,305 | | | | 1,202,697 | |
Investment advisory fee | | | 935,337 | | | | 293,301 | |
| | | | | | | | |
Total expenses | | | 2,129,642 | | | | 1,495,998 | |
| | | | | | | | |
NET INVESTMENT INCOME | | | 39,868 | | | | 819,772 | |
| | | | | | | | |
NET REALIZED AND UNREALIZED GAIN: | | | | | | | | |
Net realized gain on investments | | | 5,338,868 | | | | 1,232,879 | |
Change in net unrealized appreciation on investments | | | 8,672,667 | | | | 9,208,142 | |
| | | | | | | | |
NET REALIZED AND UNREALIZED GAIN ON INVESTMENTS | | | 14,011,535 | | | | 10,441,021 | |
| | | | | | | | |
NET INCREASE IN NET ASSETS RESULTING FROM OPERATIONS | | $ | 14,051,403 | | | $ | 11,260,793 | |
| | | | | | | | |
See Notes to Financial Statements
24
GREEN CENTURY FUNDS STATEMENTS OF CHANGES IN NET ASSETS
| | | | | | | | | | | | | | | | |
| | | BALANCED FUND | | | EQUITY FUND | |
| | | FOR THE
YEAR ENDED
JULY 31, 2015 | | | FOR THE
YEAR ENDED
JULY 31, 2014 | | | FOR THE
YEAR ENDED
JULY 31, 2015 | | | FOR THE
YEAR ENDED
JULY 31, 2014 | |
INCREASE (DECREASE) IN NET ASSETS: | | | | | | | | | | | | | | | | |
| From operations: | | | | | | | | | | | | | | | | |
Net investment income | | $ | 39,868 | | | $ | 455,631 | | | $ | 819,772 | | | $ | 568,220 | |
Net realized gain on investments | | | 5,338,868 | | | | 8,602,576 | | | | 1,232,879 | | | | 5,398,934 | |
Change in net unrealized appreciation on investments | | | 8,672,667 | | | | 1,362,675 | | | | 9,208,142 | | | | 4,878,712 | |
| | | | | | | | | | | | | | | | |
Net increase in net assets resulting from operations | | | 14,051,403 | | | | 10,420,882 | | | | 11,260,793 | | | | 10,845,866 | |
| | | | | | | | | | | | | | | | |
| Dividends and distributions to shareholders: | | | | | | | | | | | | | | | | |
From net investment income | | | (128,866 | ) | | | (440,410 | ) | | | (751,235 | ) | | | (486,355 | ) |
From net realized gains | | | (6,321,658 | ) | | | — | | | | (1,274,236 | ) | | | — | |
| | | | | | | | | | | | | | | | |
| | | (6,450,524 | ) | | | (440,410 | ) | | | (2,025,471 | ) | | | (486,355 | ) |
| | | | | | | | | | | | | | | | |
| Capital share transactions: | | | | | | | | | | | | | | | | |
Proceeds from sales of shares | | | 58,560,918 | | | | 36,540,154 | | | | 46,622,245 | | | | 26,577,277 | |
Reinvestment of dividends and distributions | | | 6,310,894 | | | | 428,141 | | | | 1,981,663 | | | | 476,684 | |
Payments for shares redeemed | | | (14,665,190 | ) | | | (10,692,351 | ) | | | (14,794,680 | ) | | | (8,864,143 | ) |
| | | | | | | | | | | | | | | | |
Net increase in net assets resulting from capital share transactions | | | 50,206,622 | | | | 26,275,944 | | | | 33,809,228 | | | | 18,189,818 | |
| | | | | | | | | | | | | | | | |
Total increase in net assets | | | 57,807,501 | | | | 36,256,416 | | | | 43,044,550 | | | | 28,549,329 | |
NET ASSETS: | | | | | | | | | | | | | | | | |
Beginning of year | | | 121,906,883 | | | | 85,650,467 | | | | 95,358,126 | | | | 66,808,797 | |
| | | | | | | | | | | | | | | | |
End of year | | $ | 179,714,384 | | | $ | 121,906,883 | | | $ | 138,402,676 | | | $ | 95,358,126 | |
| | | | | | | | | | | | | | | | |
Undistributed net investment income/accumulated net investment loss at end of year | | | (79,218 | ) | | | 17,982 | | | | 78,485 | | | | 67,509 | |
See Notes to Financial Statements
25
GREEN CENTURY BALANCED FUND FINANCIAL HIGHLIGHTS
| | | | | | | | | | | | | | | | | | | | |
| | | FOR THE YEARS ENDED JULY 31, | |
| | | 2015 | | | 2014 | | | 2013 | | | 2012 | | | 2011 | |
Net Asset Value, beginning of year | | $ | 23.74 | | | $ | 21.43 | | | $ | 18.06 | | | $ | 17.50 | | | $ | 15.76 | |
| | | | | | | | | | | | | | | | | | | | |
| Income from investment operations: | | | | | | | | | | | | | | | | | | | | |
Net investment income | | | 0.01 | | | | 0.09 | | | | 0.13 | | | | 0.10 | | | | 0.13 | |
Net realized and unrealized gain on investments | | | 2.51 | | | | 2.31 | | | | 3.37 | | | | 0.56 | | | | 1.75 | |
| | | | | | | | | | | | | | | | | | | | |
Total increase from investment operations | | | 2.52 | | | | 2.40 | | | | 3.50 | | | | 0.66 | | | | 1.88 | |
| | | | | | | | | | | | | | | | | | | | |
| Less dividends: | | | | | | | | | | | | | | | | | | | | |
Dividends from net investment income | | | (0.02 | ) | | | (0.09 | ) | | | (0.13 | ) | | | (0.10 | ) | | | (0.14 | ) |
Distributions from net realized gains | | | (1.17 | ) | | | — | | | | — | | | | — | | | | — | |
| | | | | | | | | | | | | | | | | | | | |
Total decrease from dividends | | | (1.19 | ) | | | (0.09 | ) | | | (0.13 | ) | | | (0.10 | ) | | | (0.14 | ) |
| | | | | | | | | | | | | | | | | | | | |
Net Asset Value, end of year | | $ | 25.07 | | | $ | 23.74 | | | $ | 21.43 | | | $ | 18.06 | | | $ | 17.50 | |
| | | | | | | | | | | | | | | | | | | | |
Total return | | | 10.84 | % | | | 11.20 | % | | | 19.44 | % | | | 3.81 | % | | | 11.92 | % |
| Ratios/Supplemental data: | | | | | | | | | | | | | | | | | | | | |
Net assets, end of year (in 000’s) | | $ | 179,714 | | | $ | 121,907 | | | $ | 85,650 | | | $ | 58,798 | | | $ | 58,410 | |
Ratio of expenses to average net assets | | | 1.48 | % | | | 1.48 | % | | | 1.48 | % | | | 1.45 | % | | | 1.38 | % |
Ratio of net investment income to average net assets | | | 0.03 | % | | | 0.44 | % | | | 0.66 | % | | | 0.58 | % | | | 0.72 | % |
Portfolio turnover | | | 30 | % | | | 42 | % | | | 31 | % | | | 58 | % | | | 70 | % |
GREEN CENTURY EQUITY FUND FINANCIAL HIGHLIGHTS
| | | | | | | | | | | | | | | | | | | | |
| | | FOR THE YEARS ENDED JULY 31, | |
| | | 2015 | | | 2014 | | | 2013 | | | 2012 | | | 2011 | |
Net Asset Value, beginning of year | | $ | 30.11 | | | $ | 26.30 | | | $ | 20.81 | | | $ | 19.99 | | | $ | 17.44 | |
| | | | | | | | | | | | | | | | | | | | |
| Income from investment operations: | | | | | | | | | | | | | | | | | | | | |
Net investment income | | | 0.20 | | | | 0.19 | | | | 0.21 | | | | 0.19 | | | | 0.18 | |
Net realized and unrealized gain on investments | | | 2.96 | | | | 3.79 | | | | 5.48 | | | | 0.83 | | | | 2.57 | |
| | | | | | | | | | | | | | | | | | | | |
Total increase from investment operations | | | 3.16 | | | | 3.98 | | | | 5.69 | | | | 1.02 | | | | 2.75 | |
| | | | | | | | | | | | | | | | | | | | |
| Less dividends: | | | | | | | | | | | | | | | | | | | | |
Dividends from net investment income | | | (0.19 | ) | | | (0.17 | ) | | | (0.20 | ) | | | (0.20 | ) | | | (0.20 | ) |
Distributions from net realized gains | | | (0.35 | ) | | | — | | | | — | | | | — | | | | — | |
| | | | | | | | | | | | | | | | | | | | |
Total decrease from dividends | | | (0.54 | ) | | | (0.17 | ) | | | (0.20 | ) | | | (0.20 | ) | | | (0.20 | ) |
| | | | | | | | | | | | | | | | | | | | |
Net Asset Value, end of year | | $ | 32.73 | | | $ | 30.11 | | | $ | 26.30 | | | $ | 20.81 | | | $ | 19.99 | |
| | | | | | | | | | | | | | | | | | | | |
Total return | | | 10.54 | % | | | 15.16 | % | | | 27.49 | % | | | 5.14 | % | | | 15.77 | % |
| Ratios/Supplemental data: | | | | | | | | | | | | | | | | | | | | |
Net assets, end of year (in 000’s) | | $ | 138,403 | | | $ | 95,358 | | | $ | 66,809 | | | $ | 50,972 | | | $ | 53,363 | |
Ratio of expenses to average net assets | | | 1.25 | % | | | 1.25 | % | | | 1.25 | % | | | 1.16 | % | | | 0.95 | % |
Ratio of net investment income to average net assets | | | 0.68 | % | | | 0.72 | % | | | 0.92 | % | | | 0.97 | % | | | 0.92 | % |
Portfolio turnover | | | 13 | % | | | 32 | % | | | 17 | % | | | 14 | % | | | 13 | % |
See Notes to Financial Statements
26
| | |
GREEN CENTURY FUNDS NOTES TO FINANCIAL STATEMENTS | | |
NOTE 1 — Organization and Significant Accounting Policies
Green Century Funds (the “Trust”) is a Massachusetts business trust which offers two separate series, the Green Century Balanced Fund (the “Balanced Fund”) and the Green Century Equity Fund (the “Equity Fund”), each a “Fund” and collectively, the “Funds”. The Trust is registered under the Investment Company Act of 1940, as amended (the “Act”), as an open-end, diversified management investment company. The Trust accounts separately for the assets, liabilities and operations of each series. The Balanced Fund commenced operations on March 18, 1992 and the Equity Fund commenced operations on September 13, 1995.
The preparation of financial statements in conformity with U.S. generally accepted accounting principles (“U.S. GAAP”) requires management to make estimates and assumptions that affect the reported amounts of assets and liabilities and disclosure of contingent assets and liabilities at the date of the financial statements and the reported amounts of revenues and expenses during the reporting period. Actual results could differ from those estimates.
Each Fund is an investment company and accordingly follows the investment company accounting and reporting guidance of the Financial Accounting Standards Board (the “FASB”) Accounting Standard Codification Topic 946 “Financial Services—Investment Companies”.
The following is a summary of the Funds’ significant accounting policies:
| | (A) | Investment Valuation: Equity securities listed on national securities exchanges other than NASDAQ are valued at last sale price. If a last sale price is not available, securities listed on national exchanges other than NASDAQ are valued at the mean between the closing bid and closing ask prices. NASDAQ National Market® and SmallCapSM securities are valued at the NASDAQ Official Closing Price (“NOCP”). The NOCP is based on the last traded price if it falls within the concurrent best bid and ask prices and is normalized pursuant to NASDAQ’s published procedures if it falls outside this range. If a NOCP is not available for any such security, the security is valued at the last sale price, or, if there have been no sales that day, at the mean between the closing bid and closing ask prices. Unlisted equity securities are valued at last sale price, or when last sale prices are not available, at the last quoted bid price. Debt securities (other than certificates of deposit and short-term obligations maturing in sixty days or less) are valued on the basis of valuations furnished by a pricing service which takes into account appropriate factors such as institution-size trading in similar groups of securities, yield, quality, coupon rate, maturity, type of issue, and other market data, without exclusive reliance on quoted prices or exchange or over-the-counter prices, since such valuations are believed to reflect more accurately the fair value of the securities. Securities, if any, for which there are no such valuations or quotations available, or for which the market quotation or valuation provided by a pricing service is deemed not reliable, are valued at fair value by management as determined in good faith under guidelines established by the Trustees. Certificates of deposit are valued at cost plus accrued interest, and short-term obligations maturing in sixty days or less are valued at amortized cost, both of which approximate market value. |
Various inputs are used in determining the value of the Fund’s investments. These inputs are summarized in the three broad levels listed below:
Level 1 — quoted prices for active markets for identical securities. An active market for the security is a market in which transactions occur with sufficient frequency and volume to provide pricing information on an ongoing basis. A quoted price in an active market provides the most reliable evidence of fair value.
Level 2 — other significant observable inputs (including quoted prices for similar securities, interest rates, prepayment speeds, credit risk, etc.). Quoted prices for identical or similar assets in markets that are not active.
27
| | |
GREEN CENTURY FUNDS NOTES TO FINANCIAL STATEMENTS | | continued |
Investments valued at amortized cost. Inputs that are derived principally from or corroborated by observable market data. An adjustment to any observable input that is significant to the fair value may render the measurement a Level 3 measurement.
Level 3 — significant unobservable inputs, including the Fund’s own assumptions in determining the fair value of investments.
The inputs or methodology used for valuing securities are not necessarily an indication of the risk associated with investing in those securities.
The following is a summary of the inputs used to value the Balanced Fund’s net assets as of July 31, 2015:
| | | | | | | | | | | | | | | | |
| | | LEVEL 1 | | | LEVEL 2 | | | LEVEL 3 | | | TOTAL | |
COMMON STOCKS | | $ | 114,950,516 | | | $ | — | | | $ | — | | | $ | 114,950,516 | |
BONDS & NOTES | | | — | | | | 46,556,381 | | | | — | | | | 46,556,381 | |
CERTIFICATES OF DEPOSIT | | | — | | | | 95,000 | | | | — | | | | 95,000 | |
SHORT-TERM OBLIGATIONS | | | — | | | | 17,612,625 | | | | — | | | | 17,612,625 | |
| | | | | | | | | | | | | | | | |
TOTAL | | $ | 114,950,516 | | | $ | 64,264,006 | | | $ | — | | | $ | 179,214,522 | |
| | | | | | | | | | | | | | | | |
The following is a summary of the inputs used to value the Equity Fund’s net assets as of July 31, 2015:
| | | | | | | | | | | | | | | | |
| | | LEVEL 1 | | | LEVEL 2 | | | LEVEL 3 | | | TOTAL | |
COMMON STOCKS | | $ | 137,853,565 | | | $ | — | | | $ | — | | | $ | 137,853,565 | |
SHORT-TERM OBLIGATIONS | | | — | | | | 1,074,972 | | | | — | | | | 1,074,972 | |
| | | | | | | | | | | | | | | | |
TOTAL | | $ | 137,853,565 | | | $ | 1,074,972 | | | $ | — | | | $ | 138,928,537 | |
| | | | | | | | | | | | | | | | |
The Funds adopted the FASB amendments to authoritative guidance which require the Funds to disclose details of transfers in and out of Level 1 and Level 2 measurements and Level 2 and Level 3 measurements and the reasons for the transfers. For the year ended July 31, 2015, there were no transfers in and out of Level 1, Level 2 and Level 3. Neither of the Funds held any Level 3 securities during the year ended July 31, 2015. It is the Funds’ policy to recognize transfers into and out of all Levels at the end of the reporting period.
| | (B) | Securities Transactions and Investment Income: Securities transactions are recorded on a trade date basis. Realized gains and losses from securities transactions are determined using the identified cost basis. Interest income, including amortization of premiums and accretion of discounts on bonds, is recognized on the accrual basis and dividend income is recorded on ex-dividend date. |
| | (C) | Options Transactions: The Balanced Fund may utilize options to hedge or protect from adverse movements in the market values of its portfolio securities and to enhance return. The Equity Fund is authorized to utilize options to hedge against possible increases in the value of securities which are expected to be purchased by the Equity Fund or possible declines in the value of securities which are expected to be sold by the Equity Fund. The use of options involves risk such as the possibility of illiquid markets or imperfect correlation between the value of the option and the underlying securities. The Funds are also authorized to write put and call options. Premiums received upon writing put or call options are recorded as an asset with a corresponding liability which is subsequently adjusted to the current market value of the option. Changes between the initial premiums received and the current market value of the options are recorded as unrealized gains or losses. When an option is closed, expired or exercised, a gain or loss is realized and the liability is eliminated. The |
28
| | |
GREEN CENTURY FUNDS NOTES TO FINANCIAL STATEMENTS | | continued |
| | Funds continue to bear the risk of adverse movements in the price of the underlying assets during the period of the option, although any potential loss during the period would be reduced by the amount of the option premium received. As required by the Act, liquid securities are designated as collateral in an amount equal to the market value of open options contracts. In the year ended July 31, 2015, neither the Balanced Fund nor the Equity Fund utilized options or wrote put or call options. |
| | (D) | Repurchase Agreements: The Funds enter into repurchase agreements with selected banks or broker-dealers that are deemed by the Funds’ adviser to be creditworthy pursuant to guidelines established by the Board of Trustees. Each repurchase agreement is recorded at cost, which approximates fair value. The Funds require that the market value of collateral, represented by securities (primarily U.S. Government securities), be sufficient to cover payments of interest and principal and that the collateral be maintained in a segregated account with a custodian bank in a manner sufficient to enable the Funds to obtain those securities in the event of a default of the counterparty. In the event of default or bankruptcy by the counterparty to the repurchase agreement, retention of the collateral may be subject to legal proceedings. As of July 31, 2015, neither the Balanced Fund nor the Equity Fund held repurchase agreements. |
| | (E) | Distributions: Distributions to shareholders are recorded on the ex-dividend date. The Funds declare and pay dividends of net investment income, if any, semi-annually and distribute net realized capital gains, if any, annually. The amount and character of income and net realized gains to be distributed are determined in accordance with Federal income tax rules and regulations, which may differ from U.S. GAAP. To the extent that these differences are attributable to permanent book and tax accounting differences, the components of net assets have been adjusted. |
| | (F) | Federal Taxes: Each series of the Trust is treated as a separate entity for Federal income tax purposes. Each Fund’s policy is to comply with the provisions of the Internal Revenue Code applicable to regulated investment companies (“RICs”). Accordingly, no provisions for Federal income or excise tax are necessary. |
In July 2006, the FASB issued Accounting for Uncertainty in Income Taxes. This interpretation addresses the accounting for uncertainty in income taxes and establishes for all entities, including pass-through entities such as the Funds, a minimum threshold for financial statement recognition of the benefit of positions taken in filing tax returns (including whether an entity is taxable in a particular jurisdiction). The Funds recognize tax benefits only if it is more likely than not that a tax position (including the Funds’ assertion that their income is exempt from tax) will be sustained upon examination. The Funds adopted Accounting for Uncertainty in Income Taxes in fiscal year 2008. The Funds had no material uncertain tax positions and have not recorded a liability for unrecognized tax benefits as of July 31, 2015. Also, the Funds had recognized no interest and penalties related to uncertain tax benefits through July 31, 2015. At July 31, 2015, the tax years 2012 through 2015 remain open to examination by the Internal Revenue Service.
The Regulated Investment Company Modernization Act of 2010 (“RIC MOD”) was signed into law on December 22, 2010. RIC MOD makes changes to a number of the federal income and excise tax provisions impacting RICs, including simplification provisions on asset diversification and qualifying income tests, provisions aimed at preserving the character of the distributions made by the RIC and coordination of the income and excise tax distribution requirements, and provisions for allowing unlimited years carryforward for capital losses.
| | (G) | Redemption Fee: A 2.00% redemption fee is retained by the Funds to offset the effect of transaction costs and other expenses associated with short-term investing. The fee is imposed on redemptions or exchanges of shares |
29
| | |
GREEN CENTURY FUNDS NOTES TO FINANCIAL STATEMENTS | | continued |
| | held 60 days or less from their purchase date. For the year ended July 31, 2015, the Balanced Fund and Equity Fund received $4,413 and $4,447, respectively, in redemption fees. Redemption fees are recorded as an adjustment to paid-in capital. |
| | (H) | Indemnification: The Fund’s organizational documents provide that trustees and officers are indemnified against certain liabilities arising out of the performance of their duties to the Funds. In the normal course of business, the Funds may also enter into contracts that provide general indemnifications. The Funds’ maximum exposure under these arrangements is unknown as this would be dependent on future claims that may be made against the Funds. The risk of material loss from such claims is considered remote. As of the year ended July 31, 2015, no liability has been accrued. |
| | (I) | Offsetting of Assets and Liabilities: As of July 31, 2015, there are no master netting arrangements related to the Funds. The Funds’ Statements of Assets and Liabilities present derivative instruments on a gross basis, if applicable. As of July 31, 2015, no derivative instruments were held by the Funds. |
NOTE 2 — Transactions With Affiliates
| | (A) | Investment Adviser: Green Century Capital Management, Inc. (“Green Century”) is the adviser (“the Adviser”) for the Funds. Green Century is owned by Paradigm Partners. Green Century oversees the portfolio management of the Funds on a day-to-day basis. The Balanced Fund pays Green Century a fee, accrued daily and paid monthly, at an annual rate equal to 0.65% of the Balanced Fund’s average daily net assets. The Equity Fund pays Green Century a fee, accrued daily and paid monthly, at an annual rate of 0.25% of the Equity Fund’s average daily net assets up to but not including $100 million, 0.22% of average daily net assets including $100 million up to but not including $500 million, 0.17% of average daily net assets including $500 million up to but not including $1 billion and 0.12% of average daily net assets equal to or in excess of $1 billion. |
| | (B) | Subadvisers: Trillium Asset Management, LLC (“Trillium”) is the subadviser for the Balanced Fund. Trillium is paid a fee by the Adviser at an annual rate of 0.40% on the first $30 million of average daily net assets and 0.35% on average daily net assets in excess of $30 million for its services. For the year ended July 31, 2015, Green Century accrued fees of $518,643 to Trillium. Northern Trust Investments, Inc. (“Northern Trust”) is the subadviser for the Equity Fund. Northern Trust is paid a fee by the Adviser based on Northern Trust’s fee schedule of the greater of $75,000 or 0.10% of the value of the average daily net assets of the Fund up to but not including $50 million, 0.05% of the average daily net assets of the Fund from and including $50 million up to but not including $100 million and 0.03% of the average daily net assets of the Fund equal to or in excess of $100 million for its services. For the year ended July 31, 2015 Green Century accrued fees of $80,905 to Northern Trust. |
| | (C) | Administrator: Green Century is the administrator (“the Administrator”) of the Green Century Funds. Pursuant to the Administrative Services Agreement, Green Century pays all the expenses of each Fund other than the investment advisory fees; interest; taxes; brokerage costs and other capital expenses; expenses of non-interested trustees (including counsel fees) and any extraordinary expenses. The Balanced Fund pays Green Century a fee at a rate such that immediately following any payment to the Administrator, the total operating expenses of the Fund, on an annual basis, do not exceed 1.48% of the Fund’s average daily net assets. The Equity Fund pays Green Century a fee at a rate such that immediately following any payment to the Administrator, the total operating expenses of the Fund, on an annual basis, do not exceed 1.25% of the Fund’s average daily net assets. |
| | (D) | Subadministrator: Pursuant to a Subadministrative and Fund Accounting Services Agreement with the Administrator, UMB Fund Services, Inc. (“UMBFS”) as Subadministrator and Fund Accountant, is responsible for conducting fund accounting and certain day-to-day administration of the Trust subject to the supervision |
30
| | |
GREEN CENTURY FUNDS NOTES TO FINANCIAL STATEMENTS | | continued |
| | and direction of the Administrator. For the year ended July 31, 2015, Green Century accrued fees of $107,612 and $96,712 to UMBFS related to services performed on behalf of the Balanced Fund and the Equity Fund, respectively. |
| | (E) | Index Agreement: The Equity Fund invests in the securities of the companies included in the MSCI KLD 400 Social ex Fossil Fuels Index (the “Index”). The Index is owned and maintained by MSCI ESG Research (“MSCI”). For the use of the Index, MSCI is paid by the Adviser an annual license fee of $26,000, plus the greater of $26,000 or at an annual rate of 0.05% on the first $100 million of average daily net assets, 0.04% on the next $100 million of average daily net assets, and 0.03% on average daily net assets in excess of $200 million. For the year ended July 31, 2015, Green Century accrued fees of $83,873 to MSCI. |
NOTE 3 — Investment Transactions
The Balanced Fund’s cost of purchases and proceeds from sales of securities, other than short-term securities, aggregated $77,049,190 and $41,052,630, respectively, for the year ended July 31, 2015. The Equity Fund’s cost of purchases and proceeds from sales of securities, other than short-term securities, aggregated $48,443,355 and $15,460,328, respectively.
NOTE 4 — Federal Income Tax Information
The tax basis of the components of distributable net earnings (deficit) at July 31, 2015 were as follows:
| | | | | | | | |
| | | BALANCED FUND | | | EQUITY FUND | |
Undistributed ordinary income | | $ | 385,167 | | | $ | 284,018 | |
Undistributed long-term capital gains | | | 4,806,528 | | | | 1,159,254 | |
| | | | | | | | |
Tax accumulated earnings | | | 5,191,695 | | | | 1,443,272 | |
| | | | | | | | |
Accumulated capital and other losses | | | (79,218 | ) | | | — | |
Unrealized appreciation (depreciation) | | | 26,639,208 | | | | 32,247,731 | |
| | | | | | | | |
Distributable net earnings (deficit) | | $ | 31,751,685 | | | $ | 33,691,003 | |
| | | | | | | | |
As of July 31, 2015, the Balanced Fund had $79,218 of qualified late-year ordinary losses, which are deferred until fiscal year 2016 for tax purposes. Net late-year losses incurred after December 31, and within the taxable year are deemed to arise on the first day of the Fund’s next taxable year.
The tax character of distributions paid during the fiscal years ended July 31, 2015 and July 31, 2014 were as follows:
| | | | | | | | | | | | | | | | |
| | | BALANCED FUND | | | EQUITY FUND | |
| | | YEAR ENDED
JULY 31, 2015 | | | YEAR ENDED
JULY 31, 2014 | | | YEAR ENDED
JULY 31, 2015 | | | YEAR ENDED
JULY 31, 2014 | |
Ordinary income | | $ | 128,866 | | | $ | 440,410 | | | $ | 775,118 | | | $ | 486,355 | |
Long-term capital gains | | | 6,321,658 | | | | — | | | | 1,250,368 | | | | — | |
31
| | |
GREEN CENTURY FUNDS NOTES TO FINANCIAL STATEMENTS | | concluded |
NOTE 5 — Capital Share Transactions
Capital Share transactions for the Balanced Fund and the Equity Fund were as follows:
| | | | | | | | | | | | | | | | |
| | | BALANCED FUND | | | EQUITY FUND | |
| | | YEAR ENDED
JULY 31, 2015 | | | YEAR ENDED
JULY 31, 2014 | | | YEAR ENDED
JULY 31, 2015 | | | YEAR ENDED
JULY 31, 2014 | |
Shares sold | | | 2,371,758 | | | | 1,581,678 | | | | 1,461,082 | | | | 922,022 | |
Reinvestment of dividends | | | 262,516 | | | | 17,927 | | | | 61,392 | | | | 16,188 | |
Shares redeemed | | | (598,899 | ) | | | (462,258 | ) | | | (460,638 | ) | | | (311,923 | ) |
| | | | | | | | | | | | | | | | |
| | | 2,035,375 | | | | 1,137,347 | | | | 1,061,836 | | | | 626,287 | |
| | | | | | | | | | | | | | | | |
NOTE 6 — Recent Accounting Pronouncements
In June 2014, the FASB issued Accounting Standards Update (“ASU”) No. 2014-11 Repurchase-to-Maturity Transactions, Repurchase Financings, and Disclosures. The amendments in this ASU require an entity to modify accounting for repurchase-to-maturity transactions and repurchase financing arrangements, as well as modify required disclosures for repurchase agreements, securities lending transactions, and repurchase-to-maturity transactions that are accounted for as secured borrowings. The guidance is effective for fiscal years beginning on or after December 15, 2014, and for interim periods within those fiscal years. Management is currently evaluating the impact these changes will have on the Funds’ financial statement disclosures.
NOTE 7 — Subsequent Events
Subsequent to July 31, 2015 and through the date on which the financial statements were available for issuance, management has evaluated subsequent events and concluded there were no subsequent events requiring accrual or disclosure.
32
REPORT OF INDEPENDENT REGISTERED PUBLIC ACCOUNTING FIRM

Board of Trustees and Shareholders of
Green Century Funds:
We have audited the accompanying statements of assets and liabilities, including the portfolio of investments, of the Green Century Balanced Fund and the Green Century Equity Fund (collectively, the “Funds”), each a series of Green Century Funds, as of July 31, 2015, and the related statements of operations for the year then ended, the statements of changes in net assets for each of the years in the two-year period then ended, and the financial highlights for each of the years in the five-year period then ended. These financial statements and financial highlights are the responsibility of the Funds’ management. Our responsibility is to express an opinion on these financial statements and financial highlights based on our audits.
We conducted our audits in accordance with the auditing standards of the Public Company Accounting Oversight Board (United States). Those standards require that we plan and perform the audit to obtain reasonable assurance about whether the financial statements and financial highlights are free from material misstatement. An audit includes examining, on a test basis, evidence supporting the amounts and disclosures in the financial statements. Our procedures included confirmation of securities owned as of July 31, 2015, by correspondence with custodian and brokers, or by other appropriate auditing procedures. An audit also includes assessing the accounting principles used and significant estimates made by management, as well as evaluating the overall financial statements presentation. We believe that our audits provide a reasonable basis for our opinion.
In our opinion, the financial statements and financial highlights referred to above present fairly, in all material respects, the financial position of the aforementioned Funds as of July 31, 2015, and the results of their operations for the year then ended, the changes in their net assets for each of the years in the two-year period then ended, and the financial highlights for each of the years in the five-year period then ended, in accordance with U.S. generally accepted accounting principles.

Boston, Massachusetts
September 29, 2015
33
TAX INFORMATION (unaudited)
For the year ended July 31, 2015, the Balanced and Equity Fund had 100% and 100%, respectively, of dividends paid from net investment income qualified for the 70% dividends received deduction available to corporate shareholders.
For the year ended July 31, 2015, the Balanced and Equity Fund had 100% and 100%, respectively, of dividends paid from net investment income, designated as qualified dividend income.
GREEN CENTURY FUNDS TRUSTEES AND OFFICERS
The following table presents information about each Trustee and each Officer of the Trust as of July 31, 2015. Each Trustee and each Officer of the Trust noted as an “interested person” (as defined in the 1940 Act), and noted with an asterisk, is interested by virtue of his or her position with Green Century as described below, with the exception of Mr. Comerford. Mr. Comerford is an “interested person” by virtue of his employment with Instinet, LLC, which may have provided brokerage services to Northern Trust Investments, Inc., the subadviser to the Equity Fund. The Trust does not hold annual shareholder meetings for the purpose of electing Trustees, and Trustees are not elected for fixed terms. This means that each Trustee will be elected to hold office until his or her successor is elected or until he or she retires, resigns, dies, or is removed from office.
The Trust’s Registration Statement includes additional information about the Trustees and is available, without charge, upon request by calling the following toll-free number: 1-800-93-GREEN.
| | | | | | |
| NAME, ADDRESS AND AGE | | POSITION(S) HELD WITH THE TRUST AND LENGTH OF TIME SERVED | | PRINCIPAL OCCUPATION(S) DURING PAST 5 YEARS AND OTHER DIRECTORSHIPS HELD | | NUMBER OF PORTFOLIOS OVERSEEN BY TRUSTEE |
| Independent Trustees: | | | | |
Jonathan Darnell 114 State Street Suite 200 Boston, MA 02109 Age: 55 | | Trustee since 2014 | | Managing Director, Pickwick Capital Partners (since 2014); President/Founder, Patolan Partners (since 2011); Vice President, Morgan Stanley, Private Wealth Management Group (2004 to 2011); Advisory Board member, CardioReady LLC; Board member, Voices for Progress. | | 2 |
| | | |
Laurie Moskowitz 114 State Street Suite 200 Boston, MA 02109 Age: 50 | | Trustee since 2014 | | Senior Director, Campaigns — North America, The ONE Campaign (since 2011); Founder and Principal Partner, FieldWorks (1999 to 2011). | | 2 |
| | | |
Bancroft R. Poor 114 State Street Suite 200 Boston, MA 02109 Age: 59 | | Trustee since 2014 | | Vice President for Operations/Chief Financial Officer/Assistant Treasurer, Massachusetts Audubon Society (since 1994); Trustee and Chair of Finance and Administration Committee, the Quebec Labrador Foundation (since 2007); Director and Treasurer of US Offshore Wind Collaborative (2010 to 2013). | | 2 |
34
| | | | | | |
| NAME, ADDRESS AND AGE | | POSITION(S) HELD WITH THE TRUST AND LENGTH OF TIME SERVED | | PRINCIPAL OCCUPATION(S) DURING PAST 5 YEARS AND OTHER DIRECTORSHIPS HELD | | NUMBER OF PORTFOLIOS OVERSEEN BY TRUSTEE |
Mary Raftery 114 State Street Suite 200 Boston, MA 02109 Age: 50 | | Trustee since 2009 | | Senior Advisor, Funder Collaborations, ClimateWorks Foundation (since 2014); Organizational Development Consultant, Self-employed (since 2007); Director of Major Donor Development and Special Projects, BlueGreen Alliance (2011 to 2012); Chief Operating Officer, Apollo Alliance (2007 to 2011). | | 2 |
| | | |
James H. Starr 114 State Street Suite 200 Boston, MA 02109 Age: 67 | | Chairperson since 2009; Trustee since 1991 | | Consultant, Danielson Rainville Attorneys, PLLC (since 2015); Director and President, Gunnison Valley Housing Foundation (since 2011); Director and Vice President, Coal Creek Watershed Coalition (since 2011); Director and Chairperson, Gunnison Valley Transportation Authority (2004 to 2010); President, Peanut Mine, Inc. (2002 to 2012); Senior Attorney, Starr and Associates, PC (1982-2014); County Commissioner, Gunnison County, CO (1999 to 2010). | | 2 |
| | | |
| Interested Trustees: | | | | | | |
John Comerford* 114 State Street Suite 200 Boston, MA 02109 Age: 46 | | Trustee since 2005 | | Member, Board of Directors, BATS Global Markets (since 2011); Executive Managing Director, Instinet, LLC (since 2007). | | 2 |
| | | |
Douglas H. Phelps* 114 State Street Suite 200 Boston, MA 02109 Age: 68 | | Trustee since 1997 | | President (1996 to 2003) and Director (since 1996), Green Century Capital Management, Inc.; President and Executive Director, The Public Interest Network (since 1982); President, U.S. PIRG (since 1983); President, Environment America (since 2007); President, Telefund, Inc. (since 1988); President, Grassroots Campaigns, Inc. (since 2003). | | 2 |
| | | |
Wendy Wendlandt* 114 State Street Suite 200 Boston, MA 02109 Age: 53 | | Trustee since 1991 | | Acting Director, Fair Share (since 2012); President (2006 to 2013) and Director (since 2006), Green Century Capital Management, Inc.; Political Director, The Public Interest Network (since 1989); Senior Staff, Center for Public Interest Research (since 1989); President, Environment America Research and Policy Center (since 2007). | | 2 |
| | | |
| Officers: | | | | | | |
Kristina A. Curtis* 114 State Street Suite 200 Boston, MA 02109 Age: 62 | | President since 2005; Treasurer since 2008 and from 1991-2005 | | Senior Vice President of Finance and Operations (since 2002), Treasurer and Director (since 1991), Senior Vice President (since 1991), Green Century Capital Management, Inc. | | Not
applicable |
| | | |
Amy Puffer* 114 State Street Suite 200 Boston, MA 02109 Age: 56 | | Chief Compliance Officer since 2004; Secretary and Assistant Treasurer since 2006 | | Chief Compliance Officer (since 2004), Clerk and Director (since 2006), Green Century Capital Management, Inc. | | Not
applicable |
35
Annual Report
INVESTMENT ADVISER AND ADMINISTRATOR
Green Century Capital Management, Inc.
114 State Street
Boston, MA 02109
1-800-93-GREEN
www.greencentury.com
e-mail: info@greencentury.com
INVESTMENT SUBADVISER (Balanced Fund)
Trillium Asset Management, LLC
Two Financial Center
60 South Street, Suite 1100
Boston, MA 02111
INVESTMENT SUBADVISER (Equity Fund)
Northern Trust Investments, Inc.
50 South LaSalle Street
Chicago, IL 60603
COUNSEL TO INDEPENDENT TRUSTEES OF THE FUNDS
Ropes & Gray LLP
The Prudential Tower
800 Boylston Street
Boston, MA 02199
SUBADMINISTRATOR and DISTRIBUTOR
UMB Fund Services, Inc. (Subadministrator)
UMB Distribution Services, LLC (Distributor)
235 West Galena Street
Milwaukee, WI 53212
CUSTODIAN
UMB Bank, n.a.
928 Grand Blvd
Kansas City, MO 64106
TRANSFER AGENT
Huntington Asset Services, Inc.
2960 North Meridian Street, Suite 300
Indianapolis, IN 46208
INDEPENDENT REGISTERED PUBLIC ACCOUNTING FIRM
KPMG LLP
Two Financial Center
60 South Street
Boston, MA 02111
July 31, 2015
Balanced
Fund
| | | | |
An investment for your future. Printed on recycled paper with soy-based ink. | |
| Equity
Fund |
|
Item 2. Code of Ethics
| | (a) | The registrant has adopted a Code of Ethics applicable to the registrant’s principal executive officer, principal financial officer and principal accounting officer or controller. |
| | (c) | During the period covered by this report, there were no amendments to the provisions of the Code of Ethics referred to in Item 2(a) above. |
| | (d) | During the period covered by this report, there were no implicit or explicit waivers to the provisions of the Code of Ethics referred to in Item 2(a) above. |
| | (f) | The Code of Ethics is incorporated by reference to the Registrant’s Form N-CSR filed on October 7, 2013. |
Item 3. Audit Committee Financial Expert
The Board of Trustees of the registrant has determined that Bancroft R. Poor, a member of the Board’s audit committee, qualifies as an “audit committee financial expert” as that term is defined in the instructions to Item 3 of Form N-CSR. Mr. Poor is “independent” as that term is defined in the instructions to Item 3 of Form N-CSR.
Item 4. Principal Accountant Fees and Services
| | (a) | Audit Fees. The aggregate fees billed for each of the last two fiscal years for professional services rendered by the principal accountant for the audit of the registrant’s annual financial statements or services that are normally provided by the accountant in connection with statutory and regulatory filings or engagements for those fiscal years are as follows. |
For the fiscal year ended 7/31/15: $39,200.00
For the fiscal year ended 7/31/14: $37,400.00
| | (b) | Audit-Related Fees. No fees were billed in either of the last two fiscal years for assurance and related services by the principal accountant that are reasonably related to the performance of the audit of the registrant’s financial statements and are not reported under paragraph (a) of this item. |
| | (c) | Tax Fees. The aggregate fees billed for each of the last two fiscal years for professional services rendered by the principal accountant for tax compliance, tax advice and tax planning are as follows. The services comprising the fees disclosed under this category are tax compliance monitoring and tax filing preparation. |
For the fiscal year ended 7/31/15: $11,200.00
For the fiscal year ended 7/31/14: $10,800.00
| | (d) | All Other Fees. No fees were billed in each of the last two fiscal years for products and services provided by the principal accountant, other than the services reported in paragraphs (a) through (c) of this item. |
| | (e)(1) | The Charter of the Audit Committee of the Board requires that the Committee approve (a) all audit and permissible non-audit services to be provided to the Funds and (b) all permissible non-audit services to be provided by the Funds’ independent auditors to the Funds’ investment adviser or administrator or any entity controlling, controlled by, or under common control with the investment adviser or administrator that provides ongoing services to the Funds, if the engagement relates directly to the operations and financial reporting of the Funds. The Audit Committee has the duty to consider whether the non-audit services provided by the Funds’ auditor to the Funds’ investment adviser, administrator, or any adviser affiliate that provides ongoing services to the Funds, which services were not pre-approved by the Audit Committee, are compatible with maintaining the auditor’s independence and to review and approve the fees proposed to be charged to the Funds by the auditors for each audit and non-audit service. |
| | (e)(2) | Zero percent of the services described in each of paragraphs (b) through (d) of this Item were approved by the Audit Committee pursuant to paragraph (c)(7)(i)(C) of Rule 2-01 of Regulation S-X. |
| | (g) | The aggregate non-audit fees billed by the registrant’s accountant for services rendered to the registrant were the tax compliance, tax advice and tax planning fees listed in paragraph (c) of this Item and are as follows. No non-audit fees were billed by the registrant’s accountant for services rendered to the registrant’s investment adviser or any entity controlling, controlled by, or under common control with the adviser that provides ongoing services to the registrant for each of the last two fiscal years of the registrant. |
For the fiscal year ended 7/31/15: $11,200.00
For the fiscal year ended 7/31/14: $10,800.00
Item 5. Audit Committee of Listed Registrants
Not applicable.
Item 6. Schedule of Investments
Included as part of the report to shareholders filed under Item 1 of this Form N-CSR.
Item 7. Disclosure of Proxy Voting Policies and Procedures for Closed-End Management Investment Companies
Not applicable.
Item 8. Portfolio Managers of Closed-End Management Investment Companies
Not applicable.
Item 9. Purchases of Equity Securities by Closed-End Management Investment Company and Affiliated Purchasers
Not applicable.
Item 10. Submission of Matters to a Vote of Security Holders
There were no material changes to the procedures by which shareholders may recommend nominees to the registrant’s Board of Trustees.
Item 11. Controls and Procedures
| (a) | Based on an evaluation of the disclosure controls and procedures (as defined in Rule 30a-3(c) under the Investment Company Act of 1940, as amended, the “Disclosure Controls”) as of a date within 90 days of the filing date (the “Filing Date”) of this Form N-CSR (the “Report”), the registrant’s principal executive officer and principal financial officer have concluded that the Disclosure Controls are effectively designed to ensure that information that is required to be disclosed by the registrant in the Report is recorded, processed, summarized and reported within the time periods specified in the Securities and Exchange Commission’s rules and forms, including ensuring that information required to be disclosed in the Report is accumulated and communicated to the registrant’s management, including the registrant’s principal executive officer and principal financial officer, as appropriate to allow timely decisions regarding required disclosures. |
| (b) | There were no changes in the registrant’s internal controls over financial reporting (as defined in Rule 30a-3(d) under the Investment Company Act of 1940) that occurred during the fiscal period covered by this report that have materially affected, or are reasonably likely to materially affect, the registrant’s internal control over financial reporting. |
Item 12. Exhibits
| (a)(1) | Code of Ethics: Incorporated by reference to the Registrant’s Form N-CSR filed on October 7, 2013. |
| | (2) | Certifications for each principal executive and principal financial officer as required by Rule 30a-2(a) under the Investment Company Act of 1940, as amended, (17 CFR 270.30a-2(a)) are filed herewith. |
| (b) | Certifications required by Rule 30a-2(b) under the Investment Company Act of 1940, as amended, (17 CFR 270.30a-2(b)) are filed herewith. |
SIGNATURES
Pursuant to the requirements of the Securities Exchange Act of 1934 and the Investment Company Act of 1940, the registrant has duly caused this report to be signed on its behalf by the undersigned, thereunto duly authorized.
|
| Green Century Funds |
|
/s/ Kristina A. Curtis |
| Kristina A. Curtis |
| President and Principal Executive Officer |
| October 7, 2015 |
Pursuant to the requirements of the Securities Exchange Act of 1934 and the Investment Company Act of 1940, this report has been signed below by the following persons on behalf of the registrant and in the capacities and on the dates indicated.
|
/s/ Kristina A. Curtis |
| Kristina A. Curtis |
| President and Principal Executive Officer |
| October 7, 2015 |
|
/s/ Kristina A. Curtis |
| Kristina A. Curtis |
| Treasurer and Principal Financial Officer |
| October 7, 2015 |