UNITED STATES
SECURITIES AND EXCHANGE COMMISSION
Washington, D.C. 20549
FORM N-CSR
CERTIFIED SHAREHOLDER REPORT OF REGISTERED
MANAGEMENT INVESTMENT COMPANIES
Investment Company Act file number 811-06351
Green Century Funds
114 State Street
Suite 200
Boston, MA 02109
(Address of principal executive offices)
Green Century Capital Management, Inc.
114 State Street
Suite 200
Boston, MA 02109
(Name and address of agent for service)
Registrant’s telephone number, including area code: (617) 482-0800
Date of fiscal year end: July 31
Date of reporting period: January 31, 2023
Item 1. Reports to Stockholders.
| (a) | The following is a copy of the report transmitted to shareholders pursuant to Rule 30e-1 under the Investment Company Act of 1940 (17 CFR 270.30e-1). |
| | |
 | | SEMI-ANNUAL REPORT Green Century Balanced Fund Green Century Equity Fund Green Century MSCI International Index Fund January 31, 2023 |
| |
| An investment for your future.® | | 114 State Street, Boston, Massachusetts 02109 |
For information on the Green Century Funds®, call 1-800-93-GREEN. For information on how to open an account and account services, call 1-800-221-5519 8:00 am to 6:00 pm Eastern Time, Monday through Friday. For daily share price information twenty-four hours a day, visit www.greencentury.com.
Dear Green Century Funds Shareholder:
Thank you for putting your trust in the Green Century Funds°. Every day our team works to provide opportunities for you to invest in alignment with your environmental values and make an impact through the dollars you are saving for the future. I’m excited to share some of our highlights in this letter.
But first I want to acknowledge that 2022 was a challenging year for investors in both equities and bonds. Faced with rising inflation, interest rate hikes and recessionary fears, the S&P 500® recorded its worst year since 2008. In moments like this, some investors may abandon the market and move to cash holdings. While there might be good reasons for changing an investment strategy, acting on emotion may compromise a portfolio’s long-term return potential and I encourage you to consult with a financial advisor before you make any substantial changes.
In addition to our investment strategy, a key way that the Green Century Funds helps you make a difference is through our shareholder advocacy program. Our team of dedicated advocates worked with 80 companies last year to achieve new environmental policies with 20 major corporations. I’m pleased to share some highlights.
Negotiated a commitment with Lowe’s1 that resulted in four new industry-leading commitments to protect forests around the world, including the Canadian boreal.
Persuaded Jack in the Box1 to only purchase pork raised without the use of cruel gestation crates, which improves animal welfare and helps reduce the harmful effects of factory farming.
Won majority shareholder votes at Sysco1 (92%) and General Mills1 (55%) requesting that the companies measure their plastic use as the first step toward reducing it to protect ocean wildlife and public health.
I am proud of Green Century’s achievements in an unprecedented and challenging year, and I am eager to see what we are able to accomplish as we move forward. Our work to protect the environment and protect public health is far from finished—and none of it would be possible without investors like you.
If you have enjoyed this update and are not yet part of our enews community, I invite you to send your email address to info@greencentury.com or sign up on our website www.greencentury.com.
Thank you for choosing Green Century to help save for your future.
Sincerely,
Leslie Samuelrich, President
Green Century Funds
° Green Century Capital Management, Inc. (Green Century) is the investment advisor to the Green Century Funds (The Funds).
Green Century on the Web
E-News. For more regular updates on the Green Century Funds and on our advocacy efforts, please consider signing up for our e-newsletter. Call 1-800-934-7336, visit www.greencentury.com, or email info@greencentury.com.
Online Access. Information on your account is available on our website at www.greencentury.com. From the home page, click on Access My Account. Shareholders may also perform online transactions on the site. While there, please consider registering for e-delivery of your statements and other Fund documents.
Website. Visit www.greencentury.com to get quarterly performance, our impact stories, and more.
The Green Century Funds’ proxy voting guidelines and a record of the Funds’ proxy votes for the year ended June 30, 2022 are available without charge, upon request, (i) at www.greencentury.com, (ii) by calling 1-800-934-7336, (iii) by sending an e-mail to info@greencentury.com, and (iv) on the Securities and Exchange Commission’s website at www.sec.gov.
The Green Century Funds file their complete schedule of portfolio holdings with the SEC for the first and third quarters of the year on Form N-PORT, Part F. The Green Century Funds’ Forms N-PORT, Part F are available on the EDGAR database on the SEC’s website at www.sec.gov. Copies may be obtained upon payment of a duplicating fee, by writing the SEC’s Public Reference Section, Washington DC 20549-0102 or by electronic request at the following e-mail address: publicinfo@sec.gov. The information on Form N-PORT, Part F may also be obtained by calling us at 1-800-934-7336, or by e-mailing a request to info@greencentury.com
2
THE GREEN CENTURY BALANCED FUND
The Green Century Balanced Fund seeks capital growth and income from a portfolio of stocks and bonds that meet Green Century’s standards for environmentally responsible and sustainable investing. The portfolio managers of the Balanced Fund avoid fossil fuel companies and other environmentally harmful industries and consider environmental, social, and governance data in their decision making.
| | | | | | | | | | | | | | | | | | | | | | |
| | | | | CUMULATIVE
RETURNS* | | | AVERAGE ANNUAL RETURNS* | |
| | | | | Six Months | | | One Year | | | Three Years | | | Five Years | | | Ten Years | |
| December 31, 2022 | | Green Century Balanced Fund — Individual Investor Share Class | | | 1.84% | | | | –16.21% | | | | 4.19% | | | | 6.00% | | | | 7.60% | |
| | | Green Century Balanced Fund — Institutional Share Class** | | | 2.03% | | | | –15.93% | | | | 4.42% | | | | 6.14% | | | | 7.67% | |
| | | Custom Balanced Fund Index2 | | | 1.19% | | | | –13.70% | | | | 4.44% | | | | 6.12% | | | | 8.04% | |
| January 31, 2023 | | Green Century Balanced Fund — Individual Investor Share Class | | | 0.05% | | | | –7.35% | | | | 6.10% | | | | 6.51% | | | | 7.76% | |
| | | Green Century Balanced Fund — Institutional Share Class** | | | 0.21% | | | | –7.08% | | | | 6.33% | | | | 6.65% | | | | 7.83% | |
| | | Custom Balanced Fund Index2 | | | –0.27% | | | | –6.15% | | | | 5.90% | | | | 6.48% | | | | 8.20% | |
The Individual Investor Share Class total expense ratio of the Fund is 1.46% and the Institutional Share Class total expense ratio of the Fund is 1.16% as of the most recent prospectus.
* The performance data quoted represents past performance and is not a guarantee of future results. Investment return and principal value of an investment will fluctuate so that an investor’s shares, when redeemed, may be worth more or less than their original cost. Current performance may be lower or higher than the performance information quoted. To obtain performance information as of the most recent month-end, call 1-800-93-GREEN. Performance includes the reinvestment of income dividends and capital gain distributions. Performance shown does not reflect the deduction of taxes that a shareholder might pay on Fund distributions or the redemption of Fund shares. A redemption fee of 2.00% may be imposed on redemptions or exchanges of shares you have owned for 60 days or less. Please see the Prospectus for more information.
** Institutional Shares were offered as of November 28, 2020. The Institutional Share Class performance prior to November 28, 2020 reflects the performance of the Fund’s Individual Investor Share Class.
During the six month period ended January 31, 2023, the Balanced Fund outperformed the Custom Balanced Index, with the Balanced Fund returning 0.21% and the Custom Balanced index returning –0.27%. For the one year period ending January 31, 2023, the Balanced Fund returned –7.08%, while the Custom Balanced Index returned –6.15%. The Fund’s equity holdings that most positively contributed to relative performance during the twelve months ended January 31, 2023 included: First Solar1, SolarEdge Technologies1, LPL Financial Holdings1, Travelers Companies1 and TJX Companies1. Holdings detracting from performance included Alphabet1, SVB Financial1, Paypal Holdings1, Baxter International1 and Bright Horizons1.
Equity markets saw heightened volatility over the last six months as markets reacted to increasing inflation numbers and expectations for corresponding faster tightening by the Federal Reserve (“Fed”) and other global central banks. Inflation numbers in certain areas such as housing and lumber have started to cool, but the economy continues to post strong labor and wage numbers that may prompt the Fed to stay higher for longer. Federal Reserve Chair Powell and the members of the Federal Reserve Board of Governors continue to assert that they will do “whatever it takes” to tame inflation. Instead, after Core Consumer Price Inflation readings showed signs of moderating in September, investors opted to use their rose-colored glasses to view
3
indicators of both stronger and weaker economic trends as good news, bidding up share prices for value stocks and for the highly cyclical companies in the Energy, Industrials, Materials, and Financials sectors. Yields on longer-dated Treasuries declined through early December, as investors chose to believe that the Fed’s announced intention to slow the pace of rate increases meant that the Fed was reversing course and would reduce the terminal rate and quickly cut rates thereafter. This despite the Fed publicly indicating the contrary. The portfolio managers do not believe that the Fed has lowered its terminal rate or decreased the length of time it intends to hold the Funds rate at that higher terminal rate level. The Fed’s increases in the Funds rate this cycle have been breathtakingly aggressive; furthermore, the Fed’s rate increases have been accompanied by significant quantitative tightening. The Fed has repeatedly expressed its concern that a too-hasty return to normal will allow inflation to rekindle. Other Central Banks have also instituted record amounts of monetary restraint, the most significant since 1980. This synchronized monetary tightening has initiated the predictable chain of events.
The frequently articulated concern of worldwide Central Banks, including the Fed, with breaking any established embedded inflationary pattern, seems very likely to lengthen the period of monetary restriction, which will lengthen the duration of decreasing employment and make an extended recession ever more likely. Indeed, the Federal Reserve noted in December that “it would take substantially more evidence of progress to be confident that inflation was on a sustained downward path” and “No participants anticipated that it would be appropriate to begin reducing the federal funds rate target in 2023.” While the bond market continues to predict that Fed Fund rates will begin to drop in July, 2023, the portfolio managers disagree. Federal Reserve Chair Jerome Powell has repeatedly referenced the 1979 to 1982 experience, when the Fed believes that it prematurely eased monetary policy after slightly softer inflation readings, only to have to quickly raise rates again when inflation persisted at unacceptably high levels. The portfolio managers
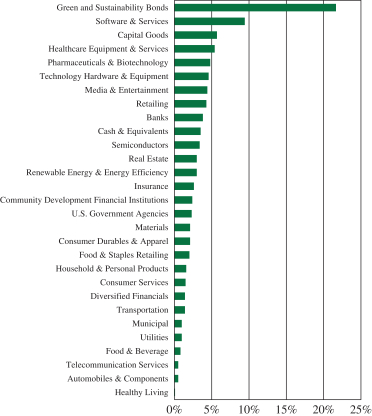
GREEN CENTURY BALANCED FUND
INVESTMENT BY INDUTRY (unaudited)
4
expect the interest rate hikes to continue until the Fed is persuaded by several consecutive readings of much softer core inflation, much softer growth in unit labor costs and average hourly earnings, and a substantial rise in unemployment. They also expect that the Fed will be quite reluctant to cut rates until both the employment cost index and the broad personal consumption expenditure deflator measure of inflation are clearly headed back to acceptable levels. The country has now entered the time where every aspect of the economy will begin to feel the effects of the prior tightening; it will show up in wage growth, unemployment, falling housing prices, discretionary income, and spending.
In the near term, declining business confidence and consumer confidence will likely translate into reduced corporate earnings, which may well initiate another down leg for equity markets. While the portfolio managers anticipate a recession and some earnings declines, they expect that the decline in earnings will be fairly modest. Even with the price-to-earnings compression that we have already experienced, they judge that further market downside is possible. In addition, consumer confidence tracks inversely with inflation; as inflation eases, this should support consumer confidence. Consumer confidence, housing starts, and equity market bottoms are all closely associated, so improving consumer confidence may limit the downside. Recovery from bear markets is usually sudden and sharp, so that attempts to time the market are usually unsuccessful. Overall, the portfolio managers conclude that the Fund is appropriately positioned for a modestly more risk-off equity market. In either a slowing growth or a recessionary environment, they expect that the focus on quality, lower-leverage, profitable companies with steadier earnings and revenues will be protective.
The growing environmental, social, and policy challenges facing the world make it increasingly imperative that shareholders demand that companies create the transition to a lower-carbon economy and recognize the human rights and dignity of their workers. The portfolio managers expect companies held within the portfolio to act with integrity and purpose, and to take leading roles in creating alternative mechanisms, through legislation or internal policies, to protect the needs and concerns of their employees, communities, and planet.
The Green Century Balanced Fund invests in the stocks and bonds of environmentally responsible corporations of various sizes, including small, medium, and large companies. The Green Century Balanced Fund does not invest in fossil fuels though most other diversified mutual funds do.
The value of the stocks held in the Balanced Fund will fluctuate in response to factors that may affect a single issuer, industry, or sector of the economy or may affect the market as a whole. Bonds are subject to a variety of risks including interest rate, credit, and inflation risk.
5
THE GREEN CENTURY EQUITY FUND
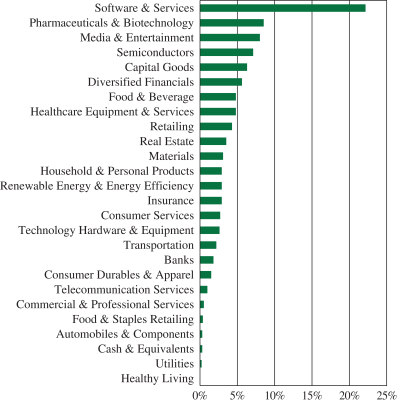
The Green Century Equity Fund invests essentially all of its assets in the stocks which make up the MSCI KLD 400 Social ex Fossil Fuels Index (the KLD 400 Index or the Index),3 comprised primarily of large capitalization U.S. companies selected based on comprehensive environmental, social and governance sustainability criteria. The Equity Fund seeks to provide shareholders with a long-term total return that matches that of the Index.
| | | | | | | | | | | | | | | | | | | | | | |
| | | | | CUMULATIVE
RETURNS* | | | AVERAGE ANNUAL RETURNS* | |
| | | | | Six Months | | | One Year | | | Three Years | | | Five Years | | | Ten Years | |
| December 31, 2022 | | Green Century Equity Fund — Individual Investor Share Class | | | –0.12% | | | | –23.04% | | | | 6.85% | | | | 8.89% | | | | 12.00% | |
| | | Green Century Equity Fund — Institutional Share Class | | | 0.02% | | | | –22.81% | | | | 7.17% | | | | 9.20% | | | | 12.15% | |
| | | S&P 500 Index4 | | | 2.31% | | | | –18.11% | | | | 7.66% | | | | 9.42% | | | | 12.56% | |
| January 31, 2023 | | Green Century Equity Fund — Individual Investor Share Class | | | –1.58% | | | | –11.87% | | | | 9.02% | | | | 9.05% | | | | 12.07% | |
| | | Green Century Equity Fund — Institutional Share Class | | | –1.41% | | | | –11.59% | | | | 9.35% | | | | 9.36% | | | | 12.24% | |
| | | S&P 500 Index4 | | | –0.44% | | | | –8.22% | | | | 9.88% | | | | 9.54% | | | | 12.68% | |
The Individual Investor Share Class total expense ratio of the Fund is 1.25% and the Institutional Share Class total expense ratio of the Fund is 0.95% as of the most recent prospectus.
* The performance data quoted represents past performance and is not a guarantee of future results. Investment return and principal value of an investment will fluctuate so that an investor’s shares, when redeemed, may be worth more or less than their original cost. Current performance may be lower or higher than the performance information quoted. To obtain performance information as of the most recent month-end, call 1-800-93-GREEN. Performance includes the reinvestment of income dividends and capital gain distributions. Performance shown does not reflect the deduction of taxes that a shareholder might pay on Fund distributions or the redemption of Fund shares. A redemption fee of 2.00% may be imposed on redemptions or exchanges of shares you have owned for 60 days or less. Please see the Prospectus for more information.
As of April 1, 2014, the Equity Fund invests in the common stocks which make up the MSCI KLD 400 Social ex Fossil Fuel Index; prior to April 1, 2014, the Fund invested in the common stocks which made up the MSCI KLD 400 Social Index.
For the six month period ended January 31, 2023, the Green Century Equity Fund, which closely tracks the KLD 400 Index, underperformed the S&P 500® Index (“benchmark”) by 114 basis points in the Individual Investor Share Class and by 97 basis points in the Institutional Share Class. The Equity Fund returned –1.58% in the Individual Investor Share Class and –1.41% in the Institutional Share Class for the six month period ended January 31, 2023, while the benchmark returned –0.44% during the same period.
As the MSCI KLD 400 Social ex Fossil Fuels Index does not include all of the stocks in the benchmark and includes some stocks not included in the benchmark, the performance of the Equity Fund can be expected to differ from the performance of the broader benchmark. The difference in performance of the Equity Fund relative to the benchmark was influenced by differences in sector allocation and stock selection criteria between the Fund and the benchmark.
6
The Energy sector was the best performing sector of the benchmark, returning 17.78%. The Equity Fund does not have an allocation to this sector, while the sector has a 5.08% weight in the benchmark. The performance of the Fund, relative to the benchmark, was positively impacted by stock selection within the Consumer Discretionary, Health Care and Industrials sectors. The relative performance of the Fund was negatively impacted by stock selection within the Communication Services, Financials and Materials sectors.
According to an analysis by the Fund’s portfolio managers, the strongest performing sectors in the Equity Fund were Financials, Industrials and Health Care, which returned 8.79%, 8.46%, and 7.94%, respectively. The worst performing sectors were Communication Services and Consumer Discretionary, which returned –11.43% and –7.83%, respectively, for the six month period.
Within the benchmark, Energy and Materials were the strongest performing sectors, gaining 17.78% and 9.71%, respectively. The worst performing sectors were Consumer Discretionary and Real Estate, which returned –9.35% and –6.34%, respectively, for the six month period.
The Equity Fund, like other mutual funds invested primarily in stocks, carries the risk of investing in the stock market. The large companies in which the Equity Fund is invested may perform worse than the stock market as a whole. The Equity Fund will not shift concentration from one industry to another or from stocks to bonds or cash, in order to defend against a falling stock market.
GREEN CENTURY EQUITY FUND
INVESTMENT BY INDUSTRY (unaudited)
7
THE GREEN CENTURY MSCI INTERNATIONAL INDEX FUND
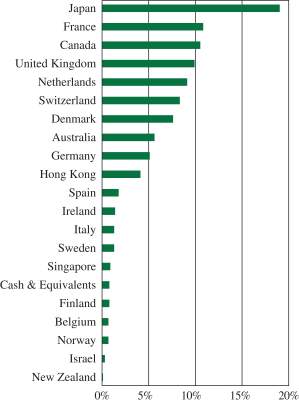
The Green Century MSCI International Index Fund (the International Fund) invests in the stocks which make up the MSCI World ex USA SRI ex Fossil Fuels Index (the Index),5 comprised primarily of foreign companies selected based on comprehensive environmental, social and governance (ESG) sustainability criteria. The International Fund seeks to provide shareholders with a long-term total return that matches that of the Index.
| | | | | | | | | | | | | | | | | | | | | | |
| | | | | CUMULATIVE
RETURNS* | | | AVERAGE ANNUAL RETURNS* | |
| | Six Months | | | One Year | | | Three Years | | | Five Years | | | Since
Inception | |
| December 31, 2022 | | Green Century International Index Fund — Individual Investor Share Class | | | 3.95% | | | | –21.35% | | | | –0.24% | | | | 1.24% | | | | 3.99% | |
| | | Green Century International Index Fund — Institutional Share Class | | | 4.18% | | | | –21.11% | | | | 0.05% | | | | 1.55% | | | | 4.29% | |
| | | MSCI World ex USA Index6 | | | 5.50% | | | | –14.29% | | | | 1.27% | | | | 1.79% | | | | 4.95% | |
| January 31, 2023 | | Green Century International Index Fund — Individual Investor Share Class | | | 6.97% | | | | –8.50% | | | | 3.17% | | | | 2.17% | | | | 5.31% | |
| | | Green Century International Index Fund — Institutional Share Class | | | 7.12% | | | | –8.25% | | | | 3.50% | | | | 2.48% | | | | 5.62% | |
| | | MSCI World ex USA Index6 | | | 8.74% | | | | –2.98% | | | | 4.64% | | | | 2.47% | | | | 6.19% | |
The Individual Investor Share Class total expense ratio of the Fund is 1.28% and the Institutional Share Class total expense ratio of the Fund is 0.98% as of the most recent prospectus.
* The performance data quoted represents past performance and is not a guarantee of future results. Investment return and principal value of an investment will fluctuate so that an investor’s shares, when redeemed, may be worth more or less than their original cost. Current performance may be lower or higher than the performance information quoted. To obtain performance information as of the most recent month-end, call 1-800-93-GREEN. Performance includes the reinvestment of income dividends and capital gain distributions. Performance shown does not reflect the deduction of taxes that a shareholder might pay on Fund distributions or the redemption of Fund shares. A redemption fee of 2.00% may be imposed on redemptions or exchanges of shares you have owned for 60 days or less. Please see the Prospectus for more information.
The Green Century MSCI International Index Fund closely tracks the MSCI World ex USA SRI ex Fossil Fuels Index. The International Fund’s Individual Investor Share Class returned 6.97% and the International Fund’s Institutional Share Class returned 7.12% for the six month period ended January 31, 2023, underperforming the MSCI World ex USA Index (“Benchmark”), the Fund’s benchmark, which returned 8.74% during the same period.
The MSCI World ex USA Index is not a values-based or SRI screened index and may invest in fossil fuels, nuclear weapons, and producers of genetically modified organisms. The difference in performance of the International Fund relative to the benchmark was largely due to differences in sector allocation and stock selection criteria between the Fund and the benchmark.
According to an analysis by the Fund’s portfolio managers, the strongest performing sectors in the International Fund were Financials, Information Technology and Consumer Discretionary, which returned 14.76%, 14.17% and 10.84%, respectively. The worst performing sectors were Real Estate and Communication Services, which returned –0.65% and –0.46%, respectively, for the six month period.
8
Within the benchmark, Materials and Financials were the strongest performing sectors, gaining 19.12% and 16.84%, respectively. The worst performing sectors were Real Estate and Utilities, which returned –2.16% and 0.89%, respectively, for the six month period.
The International Fund, like other mutual funds invested primarily in stocks, carries the risk of investing in the stock market. The developed ex-U.S. equities in which the International Fund is invested may perform worse than the stock market as a whole. The International Fund will not shift concentration from one industry to another or from stocks to bonds or cash, in order to defend against a falling stock market.
GREEN CENTURY MSCI INTERNATIONAL INDEX FUND
INVESTMENT BY COUNTRY (unaudited)
9
1 As of January 31, 2023, the following companies comprised the listed percentages of each of the Green Century Funds:
| | | | | | | | | | | | |
| Portfolio Holdings | | GREEN
CENTURY
BALANCED
FUND | | | GREEN
CENTURY
EQUITY
FUND | | | GREEN
CENTURY
INTERNATIONAL
INDEX FUND | |
Lowe’s Companies Inc. | | | 0.00 | % | | | 0.71 | % | | | 0.00 | % |
Jack in the Box Inc. | | | 0.00 | % | | | 0.01 | % | | | 0.00 | % |
Sysco Corporation | | | 0.61 | % | | | 0.22 | % | | | 0.00 | % |
General Mills Inc. | | | 0.00 | % | | | 0.26 | % | | | 0.00 | % |
First Solar Inc. | | | 0.87 | % | | | 0.00 | % | | | 0.00 | % |
SolarEdge Technologies Inc. | | | 0.94 | % | | | 0.00 | % | | | 0.00 | % |
LPL Financial Holdings, Inc. | | | 0.92 | % | | | 0.00 | % | | | 0.00 | % |
| | | | | | | | | | | | |
| Portfolio Holdings | | GREEN
CENTURY
BALANCED
FUND | | | GREEN
CENTURY
EQUITY
FUND | | | GREEN
CENTURY
INTERNATIONAL
INDEX FUND | |
Travelers Companies Inc. | | | 1.51 | % | | | 0.25 | % | | | 0.00 | % |
TJX Companies Inc. | | | 1.34 | % | | | 0.01 | % | | | 0.00 | % |
Alphabet Inc. | | | 3.50 | % | | | 6.33 | % | | | 0.00 | % |
SVB Financial Group | | | 0.52 | % | | | 0.10 | % | | | 0.00 | % |
Paypal Holdings, Inc. | | | 0.53 | % | | | 0.49 | % | | | 0.00 | % |
Baxter International, Inc. | | | 0.34 | % | | | 0.00 | % | | | 0.00 | % |
Bright Horizons Family Solutions, Inc. | | | 0.50 | % | | | 0.00 | % | | | 0.00 | % |
Portfolio composition will change due to ongoing management of the Funds. Please refer to the Green Century Funds website for current information regarding the Funds’ portfolio holdings. Note that some of the holdings discussed above may not have been held by any Fund during the six-month period ended January 31, 2023, or may have been held by a Fund for a portion of the period, or may have been held by a Fund for the entire period. These holdings are subject to risk as described in the Funds’ prospectus. References to specific investments should not be construed as a recommendation of the securities by the Funds, their administrator, or their distributor.
2 The Custom Balanced Index is comprised of a 60% weighting in the S&P 1500 Index and a 40% weighting in the BofA Merrill Lynch 1-10 Year US Corporate & Government Index (the BofA Merrill Lynch Index). The S&P Supercomposite 1500 Index is an unmanaged broad-based capitalization-weighted index comprising 1500 stocks of large-cap, mid-cap, and small-cap U.S. companies. The BofA Merrill Lynch Index tracks the performance of U.S. dollar-denominated investment grade government and corporate public debt issued in the U.S. domestic bond market with at least 1 year and less than 10 years remaining maturity, including U.S. treasury, U.S. agency, foreign government, supranational and corporate securities. It is not possible to invest directly in the Custom Balanced Index, the S&P Supercomposite 1500 Index, or the BofA Merrill Lynch Index.
3 The MSCI KLD 400 Social ex Fossil Fuels Index (the KLD400 ex Fossil Fuels Index) is a custom index calculated by MSCI Inc. and is comprised of the common stocks of the approximately 400 companies in the MSCI KLD 400 Social Index (the KLD400 Index), minus the stocks of the companies that explore for, extract, produce, manufacture or refine coal, oil or gas or produce or transmit electricity derived from fossil fuels or transmit natural gas or have carbon reserves included in the KLD400 Index. The KLD400 Index is a free float-adjusted market capitalization index designed to provide exposure to U.S. companies that have positive Environmental, Social and Governance (ESG) characteristics and consists of approximately 400 companies selected from the MSCI USA Investable Market Index. It is not possible to invest directly in an index.
4 The S&P 500 Index is an unmanaged index of 500 selected common stocks, most of which are listed on the New York Stock Exchange. The S&P 500 Index is heavily weighted toward stocks with large market capitalization and represents approximately two-thirds of the total market value of all domestic stocks. It is not possible to invest directly in the S&P 500 Index.
5 The World ex USA SRI ex Fossil Fuels Index is a custom index calculated by MSCI Inc. The World ex USA SRI ex Fossil Fuels Index is comprised of the common stocks of the companies in the MSCI World ex USA SRI Index (the World ex USA SRI Index), minus the stocks of the companies that explore for, extract, produce, manufacture or refine coal, oil or gas or produce or transmit electricity derived from fossil fuels or transmit natural gas or have carbon reserves included in the World ex USA SRI (Socially Responsible Investment) Index. The World ex USA SRI Index includes large and mid-cap stocks from approximately 22 developed market countries (excluding the U.S.). The World ex USA SRI Index is a capitalization weighted index that provides exposure to companies with what MSCI calculates to have outstanding ESG ratings and excludes companies whose products have negative social or environmental impacts. It is not possible to invest directly in an index.
6 The MSCI World ex USA Index is a custom index calculated by MSCI Inc. The MSCI World ex USA Index includes large and mid-cap stocks across 22 of 23 Developed Markets countries and excludes the United States. With 1,023 constituents, the index covers approximately 85% of the free float-adjusted market capitalization in each country. The MSCI World ex USA Index is a free float-adjusted market capitalization index. It is not possible to invest directly in the MSCI World ex USA Index.
10
The Funds’ environmental criteria limit the investments available to the Funds compared to mutual funds that do not use environmental criteria.
This information has been prepared from sources believed reliable. The views expressed are as of the date of publication and are those of the Advisor to the Funds.
This material must be preceded or accompanied by a current Prospectus.
Distributor: UMB Distribution Services, LLC 2/23
The Green Century Equity Fund and the Green Century MSCI International Index Fund (the “Funds”) are not sponsored, endorsed, or promoted by MSCI, its affiliates, information providers or any other third party involved in, or related to, compiling, computing or creating the MSCI indices (the “MSCI Parties”), and the MSCI Parties bear no liability with respect to the Funds or any index on which a Fund is based. The MSCI Parties are not sponsors of the Funds and are not affiliated with the Funds in any way. The Statement of Additional Information contains a more detailed description of the limited relationship the MSCI Parties have with Green Century Capital Management and the Funds.
11
GREEN CENTURY FUNDS EXPENCE EXAMPLE
For the six months ended January 31, 2023 (unaudited)
As a shareholder of the Green Century Funds (the “Funds”), you incur two types of costs: (1) transaction costs, including redemption fees on certain redemptions; and (2) ongoing costs, including management fees and other Fund expenses. This example is intended to help you understand your ongoing costs (in dollars) of investing in the Funds and to compare these costs with the ongoing costs of investing in other mutual funds.
The example is based on an investment of $1,000 invested at the beginning of the period and held for the entire period from August 1, 2022 to January 31, 2023 (the “period”).
Actual Expenses The first line of the table below provides information about actual account values and actual expenses. You may use the information in this line, together with the amount you invested, to estimate the expenses you paid over the period. Simply divide your account value by $1,000 (for example, an $8,600 account value divided by $1,000 equals 8.6), then multiply the result by the number in the first line under the heading entitled “Expenses Paid During the Period” to estimate the expenses you paid on your account during the period.
Hypothetical Example for Comparison Purposes The second line of the table below provides information about hypothetical account values and hypothetical expenses based on the Funds’ actual expense ratios and an assumed rate of return of 5% per year before expenses, which is not the actual return of either of the Funds. The hypothetical account values and expenses may not be used to estimate the actual ending account balance or expenses you paid for the period. You may use this information to compare the ongoing costs of investing in the Funds and other funds. To do so, compare this 5% hypothetical example with the 5%hypothetical examples that appear in the shareholder reports of other funds.
Please note that the expenses shown in the table are meant to highlight your ongoing costs only and do not reflect any transactional costs, such as redemption fees on shares held for 60 days or less. Therefore, the second line of the table is useful in comparing the ongoing costs only, and will not help you determine the relative total costs of owning different funds. In addition, if these transactional costs were included, your costs could have been higher.
| | | | | | | | | | | | |
| | | BEGINNING
ACCOUNT VALUE
AUGUST 1, 2022 | | | ENDING
ACCOUNT VALUE
JANUARY 31, 2023 | | | EXPENSES
PAID DURING
THE PERIOD1 | |
| | | |
Balanced Fund | | | | | | | | | | | | |
Actual Expenses — Individual Investor Class | | $ | 1,000.00 | | | $ | 1,000.50 | | | $ | 7.37 | |
Actual Expenses — Institutional Class | | | 1,000.00 | | | | 1,002.10 | | | | 5.87 | |
Hypothetical Example, assuming a 5% return before expenses — Individual Investor Class | | | 1,000.00 | | | | 1,017.63 | | | | 7.44 | |
Hypothetical Example, assuming a 5% return before expenses — Institutional Class | | | 1,000.00 | | | | 1,019.14 | | | | 5.92 | |
12
| | | | | | | | | | | | |
| | | BEGINNING
ACCOUNT VALUE
AUGUST 1, 2022 | | | ENDING
ACCOUNT VALUE
JANUARY 31, 2023 | | | EXPENSES
PAID DURING
THE PERIOD1 | |
| | | |
Equity Fund | | | | | | | | | | | | |
Actual Expenses — Individual Investor Class | | $ | 1,000.00 | | | $ | 984.20 | | | $ | 6.25 | |
Actual Expenses — Institutional Class | | | 1,000.00 | | | | 985.90 | | | | 4.75 | |
Hypothetical Example, assuming a 5% return before expenses — Individual Investor Class | | | 1,000.00 | | | | 1,018.70 | | | | 6.36 | |
Hypothetical Example, assuming a 5% return before expenses — Institutional Class | | | 1,000.00 | | | | 1,020.21 | | | | 4.84 | |
| | | |
| | | BEGINNING
ACCOUNT VALUE
AUGUST 1, 2022 | | | ENDING
ACCOUNT VALUE
JANUARY 31, 2023 | | | EXPENSES
PAID DURING
THE PERIOD1 | |
| | | |
MSCI International Index Fund | | | | | | | | | | | | |
Actual Expenses — Individual Investor Class | | $ | 1,000.00 | | | $ | 1,069.70 | | | $ | 6.68 | |
Actual Expenses — Institutional Class | | | 1,000.00 | | | | 1,071.20 | | | | 5.12 | |
Hypothetical Example, assuming a 5% return before expenses — Individual Investor Class | | | 1,000.00 | | | | 1,018.55 | | | | 6.51 | |
Hypothetical Example, assuming a 5% return before expenses — Institutional Class | | | 1,000.00 | | | | 1,020.06 | | | | 4.99 | |
1 Expenses are equal to the Funds’ annualized expense ratios (1.46% for the Balanced Fund Individual Investor Class, 1.16% for the Balanced Fund Institutional Class, 1.25% for the Equity Fund Individual Investor Class, 0.95% for the Equity Fund Institutional Class, 1.28% for the International Index Fund Individual Investor Class and 0.98% for the International Index Fund Institutional Class), multiplied by the average account value over the period, multiplied by 184/365 (to reflect the one-half year period).
13
| | |
GREEN CENTURY BALANCED FUND PORTFOLIO OF INVESTMENTS January 31, 2023 (unaudited) | | |
| | | | | | | | |
COMMON STOCKS — 64.2% | |
| | | SHARES | | | VALUE | |
Software & Services — 7.7% | |
Adobe, Inc. (a) | | | 9,207 | | | $ | 3,409,720 | |
Autodesk, Inc. (a) | | | 11,965 | | | | 2,574,389 | |
Mastercard, Inc., Class A | | | 18,404 | | | | 6,820,523 | |
Microsoft Corporation | | | 53,091 | | | | 13,156,481 | |
Paycom Software, Inc. (a) | | | 7,024 | | | | 2,275,355 | |
PayPal Holdings, Inc. (a) | | | 25,725 | | | | 2,096,330 | |
| | | | | | | | |
| | | | | | | 30,332,798 | |
| | | | | | | | |
Healthcare Equipment & Services — 5.3% | |
Alcon, Inc. (b) | | | 35,019 | | | | 2,633,779 | |
Baxter International, Inc. | | | 28,987 | | | | 1,324,416 | |
CVS Health Corp. | | | 31,621 | | | | 2,789,605 | |
Elevance Health, Inc. | | | 14,251 | | | | 7,125,357 | |
Medtronic PLC | | | 22,868 | | | | 1,913,823 | |
Stryker Corporation | | | 12,760 | | | | 3,238,616 | |
West Pharmaceutical Services, Inc. | | | 7,437 | | | | 1,975,267 | |
| | | | | | | | |
| | | | | | | 21,000,863 | |
| | | | | | | | |
Capital Goods — 4.9% | |
Deere & Company | | | 7,381 | | | | 3,120,982 | |
Eaton Corporation PLC | | | 21,989 | | | | 3,566,835 | |
Illinois Tool Works, Inc. | | | 11,220 | | | | 2,648,369 | |
Rockwell Automation, Inc. | | | 8,926 | | | | 2,517,400 | |
Trane Technologies PLC | | | 15,557 | | | | 2,786,570 | |
Westinghouse Air Brake Technologies Corporation | | | 27,643 | | | | 2,869,620 | |
Xylem, Inc. | | | 15,837 | | | | 1,647,206 | |
| | | | | | | | |
| | | | | | | 19,156,982 | |
| | | | | | | | |
Pharmaceuticals & Biotechnology — 4.8% | |
AstraZeneca PLC ADR (b) | | | 80,933 | | | | 5,290,590 | |
IQVIA Holdings, Inc. (a) | | | 15,895 | | | | 3,646,472 | |
Merck & Company, Inc. | | | 27,300 | | | | 2,932,293 | |
Roche Holding AG ADR | | | 92,577 | | | | 3,624,390 | |
Thermo Fisher Scientific, Inc. | | | 5,889 | | | | 3,358,673 | |
| | | | | | | | |
| | | | | | | 18,852,418 | |
| | | | | | | | |
Technology Hardware & Equipment — 4.6% | |
Apple, Inc. | | | 108,052 | | | | 15,590,823 | |
Palo Alto Networks, Inc. (a) | | | 15,612 | | | | 2,476,688 | |
| | | | | | | | |
| | | | | | | 18,067,511 | |
| | | | | | | | |
Retailing — 4.3% | |
Home Depot, Inc. (The) | | | 11,443 | | | | 3,709,478 | |
| | | | | | | | |
| | | SHARES | | | VALUE | |
Retailing — (continued) | |
Target Corporation | | | 26,209 | | | $ | 4,511,617 | |
TJX Companies, Inc. (The) | | | 63,991 | | | | 5,238,303 | |
Tractor Supply Company | | | 14,712 | | | | 3,354,189 | |
| | | | | | | | |
| | | | | | | 16,813,587 | |
| | | | | | | | |
Banks — 3.8% | |
East West Bancorp, Inc. | | | 43,189 | | | | 3,391,200 | |
First Republic Bank | | | 23,150 | | | | 3,261,372 | |
KeyCorp. | | | 161,925 | | | | 3,107,341 | |
PNC Financial Services Group, Inc. (The) | | | 19,684 | | | | 3,256,324 | |
SVB Financial Group (a) | | | 6,707 | | | | 2,028,465 | |
| | | | | | | | |
| | | | | | | 15,044,702 | |
| | | | | | | | |
Media & Entertainment — 3.6% | |
Alphabet, Inc., Class A (a) | | | 105,940 | | | | 10,471,110 | |
Walt Disney Company (The) (a) | | | 32,150 | | | | 3,487,953 | |
| | | | | | | | |
| | | | | | | 13,959,063 | |
| | | | | | | | |
Semiconductors — 3.4% | |
Analog Devices, Inc. | | | 19,593 | | | | 3,359,612 | |
ASML Holding NV (b) | | | 5,655 | | | | 3,737,050 | |
NVIDIA Corporation | | | 20,293 | | | | 3,964,643 | |
Wolfspeed, Inc. (a) . | | | 29,189 | | | | 2,247,845 | |
| | | | | | | | |
| | | | | | | 13,309,150 | |
| | | | | | | | |
Renewable Energy & Energy Efficiency — 3.0% | |
First Solar, Inc. (a) | | | 19,182 | | | | 3,406,723 | |
Hannon Armstrong Sustainable Infrastructure Capital, Inc. REIT | | | 41,772 | | | | 1,541,805 | |
Ormat Technologies, Inc. | | | 19,664 | | | | 1,819,903 | |
SolarEdge Technologies, Inc. (a) | | | 11,498 | | | | 3,669,357 | |
Sunrun, Inc. (a) | | | 47,155 | | | | 1,239,233 | |
| | | | | | | | |
| | | | | | | 11,677,021 | |
| | | | | | | | |
Insurance — 2.3% | |
Aflac, Inc. | | | 56,782 | | | | 4,173,477 | |
Travelers Companies, Inc. (The) | | | 25,349 | | | | 4,844,701 | |
| | | | | | | | |
| | | | | | | 9,018,178 | |
| | | | | | | | |
Real Estate — 2.1% | |
American Tower Corporation REIT | | | 14,574 | | | | 3,255,686 | |
AvalonBay Communities, Inc. REIT | | | 10,785 | | | | 1,913,690 | |
14
| | |
GREEN CENTURY BALANCED FUND PORTFOLIO OF INVESTMENTS January 31, 2023 (unaudited) | | continued |
| | | | | | | | |
| | | SHARES | | | VALUE | |
Real Estate — (continued) | |
Jones Lang LaSalle, Inc. (a) | | | 9,787 | | | $ | 1,809,323 | |
Prologis, Inc. REIT | | | 10,930 | | | | 1,413,030 | |
| | | | | | | | |
| | | | | | | 8,391,729 | |
| | | | | | | | |
Materials — 2.1% | |
Ball Corporation | | | 58,571 | | | | 3,411,175 | |
Ingevity Corporation (a) | | | 30,562 | | | | 2,519,531 | |
International Flavors & Fragrances, Inc. | | | 20,248 | | | | 2,277,090 | |
| | | | | | | | |
| | | | | | | 8,207,796 | |
| | | | | | | | |
Consumer Durables & Apparel — 2.1% | |
Levi Strauss & Company, Class A | | | 129,446 | | | | 2,381,806 | |
Lululemon Athletica, Inc. (a) | | | 7,754 | | | | 2,379,548 | |
NIKE, Inc., Class B | | | 26,195 | | | | 3,335,409 | |
| | | | | | | | |
| | | | | | | 8,096,763 | |
| | | | | | | | |
Food & Staples Retailing — 2.0% | |
Costco Wholesale Corporation | | | 10,528 | | | | 5,381,282 | |
Sysco Corporation | | | 30,845 | | | | 2,389,254 | |
| | | | | | | | |
| | | | | | | 7,770,536 | |
| | | | | | | | |
Household & Personal Products — 1.6% | |
Procter & Gamble Company (The) | | | 17,374 | | | | 2,473,710 | |
Unilever PLC ADR (b) | | | 74,953 | | | | 3,830,099 | |
| | | | | | | | |
| | | | | | | 6,303,809 | |
| | | | | | | | |
Consumer Services — 1.5% | |
Bright Horizons Family Solutions, Inc. (a) | | | 25,343 | | | | 1,945,836 | |
Starbucks Corporation | | | 35,086 | | | | 3,829,286 | |
| | | | | | | | |
| | | | | | | 5,775,122 | |
| | | | | | | | |
Transportation — 1.4% | |
J.B. Hunt Transport Services, Inc. . | | | 15,948 | | | | 3,014,969 | |
United Parcel Service, Inc., Class B | | | 14,085 | | | | 2,608,965 | |
| | | | | | | | |
| | | | | | | 5,623,934 | |
| | | | | | | | |
Utilities — 1.0% | |
American Water Works Company, Inc. | | | 24,572 | | | | 3,845,272 | |
| | | | | | | | |
Diversified Financials — 0.9% | |
LPL Financial Holdings, Inc. | | | 15,259 | | | | 3,618,214 | |
| | | | | | | | |
| | | | | | | | |
| | | SHARES | | | VALUE | |
Food & Beverage — 0.8% | |
McCormick & Company, Inc. | | | 39,734 | | | $ | 2,984,818 | |
| | | | | | | | |
Telecommunication Services — 0.5% | |
Verizon Communications, Inc. | | | 49,228 | | | | 2,046,408 | |
| | | | | | | | |
Automobiles & Components — 0.5% | |
Aptiv PLC (a) | | | 15,823 | | | | 1,789,423 | |
| | | | | | | | |
Total Common Stocks
(Cost $146,346,586) | | | | | | | 251,686,097 | |
| | | | | | | | |
| | | PRINCIPAL
AMOUNT | | | | |
|
BONDS & NOTES — 32.3% | |
Green and Sustainability Bonds — 21.6% | |
Apple, Inc.
2.85%, due 2/23/23 (c) | | $ | 3,000,000 | | | | 2,997,210 | |
Apple, Inc.
3.00%, due 6/20/27 (c) | | | 2,000,000 | | | | 1,913,356 | |
Asian Development Bank
2.125%, due 3/19/25 (b) | | | 1,000,000 | | | | 957,083 | |
Asian Development Bank
3.125%, due 9/26/28 (b) | | | 4,000,000 | | | | 3,854,312 | |
Bank of America Corporation
2.456% (3-Month USD Libor+87 basis points), due 10/22/25 (c) | | | 4,000,000 | | | | 3,824,068 | |
BlueHub Loan Fund, Inc.
2.89%, due 1/1/27 (d) | | | 2,000,000 | | | | 1,781,720 | |
Boston Properties LP
4.50%, due 12/1/28 (c) | | | 5,000,000 | | | | 4,793,275 | |
Bridge Housing Corporation
3.25%, due 7/15/30 (c) | | | 4,500,000 | | | | 4,054,365 | |
Century Housing Corporation
0.60%, due 2/15/24 | | | 2,500,000 | | | | 2,389,395 | |
Citigroup, Inc.
1.678% (SOFR Rate+166.7 basis points), due 5/15/24 (c) | | | 5,000,000 | | | | 4,950,590 | |
City & County of San Francisco CA Community Facilities District No. 2014-1
2.75%, due 9/1/23 | | | 650,000 | | | | 643,152 | |
City of San Francisco CA Public Utilities Commission Water Revenue
2.806%, due 11/1/23 | | | 2,000,000 | | | | 1,977,012 | |
15
| | |
GREEN CENTURY BALANCED FUND PORTFOLIO OF INVESTMENTS January 31, 2023 (unaudited) | | continued |
| | | | | | | | |
| | | PRINCIPAL
AMOUNT | | | VALUE | |
Green and Sustainability Bonds — (continued) | |
European Investment Bank
2.50%, due 10/15/24 (b) | | $ | 2,000,000 | | | $ | 1,939,198 | |
European Investment Bank
2.125%, due 4/13/26 (b) | | | 500,000 | | | | 472,107 | |
International Bank for Reconstruction & Development
2.125%, due 3/3/25 (b) | | | 2,000,000 | | | | 1,915,454 | |
International Finance Corporation
2.125%, due 4/7/26 (b) | | | 500,000 | | | | 472,837 | |
Johnson Controls International plc / Tyco Fire & Security Finance SCA
1.75%, due 9/15/30 (b)(c) | | | 2,000,000 | | | | 1,653,864 | |
National Australia Bank Ltd.
3.625%, due 6/20/23 (b) | | | 2,000,000 | | | | 1,991,840 | |
Nederlandse Waterschapsbank NV
2.375%, due 3/24/26 (b)(e) | | | 1,000,000 | | | | 947,714 | |
New Jersey Infrastructure Bank
3.00%, due 9/1/31 | | | 2,500,000 | | | | 2,226,393 | |
NXP BV / NXP Funding LLC / NXP USA, Inc.
5.00%, due 1/15/33 (b)(c) | | | 4,500,000 | | | | 4,403,961 | |
PNC Financial Services Group, Inc. (The)
2.20%, due 11/1/24 (c) | | | 5,000,000 | | | | 4,811,530 | |
Preservation Of Affordable Housing, Inc.
4.479%, due 12/1/32 (c) | | | 3,000,000 | | | | 2,812,491 | |
Prologis LP
1.25%, due 10/15/30 (c) | | | 4,500,000 | | | | 3,549,123 | |
Regency Centers LP
3.75%, due 6/15/24 (c) | | | 2,000,000 | | | | 1,947,076 | |
San Francisco Bay Area Rapid Transit District
2.622%, due 8/1/29 | | | 2,000,000 | | | | 1,812,122 | |
Starbucks Corporation
2.45%, due 6/15/26 (c) | | | 4,500,000 | | | | 4,223,124 | |
United States International Development Finance Corporation
3.43%, due 6/1/33 | | | 195,198 | | | | 185,916 | |
United States International Development Finance Corporation
3.05%, due 6/15/35 | | | 1,233,900 | | | | 1,145,440 | |
| | | | | | | | |
| | | PRINCIPAL
AMOUNT | | | VALUE | |
Green and Sustainability Bonds — (continued) | |
United States International Development Finance Corporation
2.58%, due 7/15/38 | | $ | 2,851,082 | | | $ | 2,513,828 | |
Verizon Communications, Inc.
3.875%, due 2/8/29 (c) | | | 3,500,000 | | | | 3,365,533 | |
Visa, Inc.
0.75%, due 8/15/27 (c) | | | 5,000,000 | | | | 4,360,230 | |
Xylem, Inc.
2.25%, due 1/30/31 (c) | | | 4,500,000 | | | | 3,770,640 | |
| | | | | | | | |
| | | | | | | 84,655,959 | |
| | | | | | | | |
Community Development Financial Institutions — 2.4% | |
Capital Impact Partners
1.00%, due 9/15/25 (c) | | | 1,500,000 | | | | 1,340,055 | |
Enterprise Community Loan Fund, Inc.
4.152%, due 11/1/28 (c) | | | 3,000,000 | | | | 2,884,122 | |
Local Initiatives Support Corporation
1.00%, due 11/15/25 | | | 2,000,000 | | | | 1,753,734 | |
Local Initiatives Support Corporation
3.782%, due 3/1/27 (c) | | | 2,000,000 | | | | 1,919,720 | |
Reinvestment Fund, Inc. (The)
3.78%, due 2/15/26 | | | 1,400,000 | | | | 1,339,265 | |
| | | | | | | | |
| | | | | | | 9,236,896 | |
| | | | | | | | |
U.S. Government Agencies — 2.3% | |
Federal Farm Credit Banks Funding Corporation
2.26%, due 11/13/24 | | | 500,000 | | | | 482,685 | |
Federal Farm Credit Banks Funding Corporation
1.82%, due 12/18/25 | | | 3,000,000 | | | | 2,826,633 | |
Federal Farm Credit Banks Funding Corporation
2.80%, due 11/12/27 | | | 3,000,000 | | | | 2,868,363 | |
Federal Home Loan Banks
0.75%, due 12/14/23 (c) | | | 3,000,000 | | | | 2,894,931 | |
| | | | | | | | |
| | | | | | | 9,072,612 | |
| | | | | | | | |
Software & Services — 1.6% | |
Adobe, Inc.
3.25%, due 2/1/25 (c) | | | 3,500,000 | | | | 3,416,819 | |
16
| | |
GREEN CENTURY BALANCED FUND PORTFOLIO OF INVESTMENTS January 31, 2023 (unaudited) | | concluded |
| | | | | | | | |
| | | PRINCIPAL
AMOUNT | | | VALUE | |
Software & Services — (continued) | |
Salesforce, Inc.
3.70%, due 4/11/28 (c) | | $ | 3,000,000 | | | $ | 2,932,557 | |
| | | | | | | | |
| | | | | | | 6,349,376 | |
| | | | | | | | |
Municipal — 1.0% | |
Commonwealth of Massachusetts
4.11%, due 7/15/31 (c) | | | 4,000,000 | | | | 3,954,760 | |
| | | | | | | | |
Real Estate — 0.9% | |
National Community Renaissance of California
3.27%, due 12/1/32 (c) | | | 4,000,000 | | | | 3,406,820 | |
| | | | | | | | |
Capital Goods — 0.8% | |
Trane Technologies Luxembourg Finance SA
3.80%, due 3/21/29 (c) | | | 3,500,000 | | | | 3,327,142 | |
| | | | | | | | |
Media & Entertainment — 0.8% | |
Alphabet, Inc.
1.998%, due 8/15/26 (c) | | | 3,500,000 | | | | 3,255,098 | |
| | | | | | | | |
Diversified Financials — 0.5% | |
State Street Corporation
3.10%, due 5/15/23 | | | 2,000,000 | | | | 1,989,770 | |
| | | | | | | | |
Insurance — 0.3% | |
Travelers Property Casualty Corporation
7.75%, due 4/15/26 | | | 1,000,000 | | | | 1,095,369 | |
| | | | | | | | |
Healthy Living — 0.1% | |
Whole Foods Market, Inc.
5.20%, due 12/3/25 (c)(e) | | | 500,000 | | | | 505,827 | |
| | | | | | | | |
Total Bonds & Notes
(Cost $137,196,773) | | | | | | | 126,849,629 | |
| | | | | | | | |
| | | | | | | | |
SHORT-TERM INVESTMENTS — 3.3% | |
| | | PRINCIPAL
AMOUNT | | | VALUE | |
UMB Money Market Fiduciary Account, 0.01% (f)
(Cost $12,979,209) | | | | | | $ | 12,979,209 | |
| | | | | | | | |
Total Short-term Investments
(Cost $12,979,209) | | | | | | | 12,979,209 | |
| | | | | | | | |
TOTAL INVESTMENTS (g) — 99.8% | |
(Cost $296,522,568) | | | | | | | 391,514,935 | |
Other Assets Less
Liabilities — 0.2% | | | | | | | 714,303 | |
| | | | | | | | |
NET ASSETS — 100.0% | | | | | | $ | 392,229,238 | |
| | | | | | | | |
| PLC | – Public Limited Company |
| ADR | – American Depository Receipt |
| REIT | – Real Estate Investment Trusts |
| LLC | – Limited Liability Company |
| (a) | Non-income producing security. |
| (b) | Securities whose value are determined or significantly influenced by trading in markets other than the United States or Canada. |
| (d) | Level 3 securities fair valued under procedures established by the Board of Trustees, represents 0.5% of Net Assets. The total value of these securities is $1,781,720. |
| (e) | Security exempt from registration under Rule 144A of the Securities Act of 1933. These securities may be resold in transactions exempt from registration to qualified institutional buyers. The total value of these securities is $1,453,541. |
| (f) | The rate quoted is the annualized seven-day yield of the fund at the period end. |
| (g) | The cost of investments for federal income tax purposes is $296,229,352 resulting in gross unrealized appreciation and depreciation of $112,396,258 and $17,110,675 respectively, or net unrealized appreciation of $95,285,583. |
See Notes to Financial Statements
17
| | |
GREEN CENTURY EQUITY FUND PORTFOLIO OF INVESTMENTS January 31, 2023 (unaudited) | | |
| | | | | | | | |
COMMON STOCKS — 99.7% | | | | | | | | |
| | | SHARES | | | VALUE | |
Software & Services — 22.1% | | | | | | | | |
Accenture PLC, Class A (a) | | | 17,580 | | | $ | 4,905,699 | |
Adobe, Inc. (b) | | | 13,010 | | | | 4,818,123 | |
ANSYS, Inc. (b) | | | 2,437 | | | | 649,119 | |
Autodesk, Inc. (b) | | | 6,035 | | | | 1,298,491 | |
Automatic Data Processing, Inc. | | | 11,550 | | | | 2,608,106 | |
Cadence Design Systems, Inc. (b). | | | 7,610 | | | | 1,391,336 | |
Cognizant Technology Solutions Corporation, Class A | | | 14,393 | | | | 960,733 | |
Fidelity National Information Services, Inc. | | | 16,875 | | | | 1,266,300 | |
Fortinet, Inc. (b) | | | 18,567 | | | | 971,797 | |
Gen Digital, Inc | | | 16,649 | | | | 383,094 | |
International Business Machines Corporation. | | | 25,093 | | | | 3,380,780 | |
Intuit, Inc. | | | 7,443 | | | | 3,145,933 | |
Mastercard, Inc., Class A | | | 24,000 | | | | 8,894,400 | |
Microsoft Corporation. | | | 197,131 | | | | 48,851,033 | |
Okta, Inc., Class A (b) | | | 4,237 | | | | 311,886 | |
Oracle Corporation | | | 44,502 | | | | 3,936,647 | |
Paycom Software, Inc. (b) | | | 1,428 | | | | 462,586 | |
PayPal Holdings, Inc. (b) | | | 30,599 | | | | 2,493,513 | |
PTC, Inc. (b) | | | 3,122 | | | | 421,095 | |
salesforce, Inc. (b) | | | 27,788 | | | | 4,667,550 | |
ServiceNow, Inc. (b) | | | 5,609 | | | | 2,552,824 | |
Splunk, Inc. (b) | | | 4,515 | | | | 432,402 | |
Teradata Corporation (b) | | | 2,946 | | | | 102,756 | |
Visa, Inc., Class A | | | 45,485 | | | | 10,471,102 | |
VMware, Inc., Class A (b) | | | 5,911 | | | | 723,920 | |
Western Union Company (The) | | | 10,613 | | | | 150,386 | |
Workday, Inc., Class A (b) | | | 5,594 | | | | 1,014,919 | |
ZoomInfo Technologies, Inc. (b) | | | 7,367 | | | | 207,970 | |
| | | | | | | | |
| | | | | | | 111,474,500 | |
| | | | | | | | |
Pharmaceuticals & Biotechnology — 8.5% | |
AbbVie, Inc. | | | 49,215 | | | | 7,271,516 | |
Agilent Technologies, Inc. | | | 8,218 | | | | 1,249,793 | |
Amgen, Inc | | | 14,889 | | | | 3,757,984 | |
Biogen, Inc. (b) | | | 4,029 | | | | 1,172,036 | |
BioMarin Pharmaceutical, Inc. (b) | | | 5,176 | | | | 597,052 | |
Bio-Techne Corporation | | | 4,416 | | | | 351,779 | |
Bristol-Myers Squibb Company | | | 59,370 | | | | 4,313,231 | |
Danaher Corporation | | | 19,209 | | | | 5,078,475 | |
Gilead Sciences, Inc. | | | 34,818 | | | | 2,922,623 | |
Illumina, Inc. (b) | | | 4,352 | | | | 932,198 | |
| | | | | | | | |
| | | SHARES | | | VALUE | |
Pharmaceuticals & Biotechnology — (continued) | |
IQVIA Holdings, Inc. (b) | | | 5,190 | | | $ | 1,190,638 | |
Jazz Pharmaceuticals PLC (a)(b) | | | 1,735 | | | | 271,805 | |
Merck & Company, Inc. | | | 70,486 | | | | 7,570,901 | |
Mettler-Toledo International, Inc. (b) | | | 623 | | | | 955,009 | |
Vertex Pharmaceuticals, Inc. (b) | | | 7,145 | | | | 2,308,550 | |
Waters Corporation (b) | | | 1,676 | | | | 550,700 | |
Zoetis, Inc. | | | 13,033 | | | | 2,156,831 | |
| | | | | | | | |
| | | | | | | 42,651,121 | |
| | | | | | | | |
Media & Entertainment — 8.0% | |
Alphabet, Inc., Class A (b) | | | 166,767 | | | | 16,483,250 | |
Alphabet, Inc., Class C (b) | | | 154,263 | | | | 15,406,246 | |
Electronic Arts, Inc. | | | 7,708 | | | | 991,865 | |
John Wiley & Sons, Inc., Class A | | | 1,277 | | | | 58,487 | |
Liberty Global PLC, Series A (a)(b) | | | 4,718 | | | | 102,333 | |
Liberty Global PLC, Series C (a)(b) | | | 7,830 | | | | 175,001 | |
New York Times Company (The), Class A | | | 4,670 | | | | 162,703 | |
Omnicom Group, Inc. | | | 5,726 | | | | 492,379 | |
Scholastic Corporation | | | 806 | | | | 35,657 | |
Walt Disney Company (The) (b) | | | 50,671 | | | | 5,497,297 | |
Warner Bros Discovery, Inc. (b) | | | 64,515 | | | | 956,112 | |
| | | | | | | | |
| | | | | | | 40,361,330 | |
| | | | | | | | |
Semiconductors — 7.1% | |
Advanced Micro Devices, Inc. (b) | | | 44,841 | | | | 3,369,801 | |
Analog Devices, Inc. | | | 14,325 | | | | 2,456,308 | |
Applied Materials, Inc. | | | 23,961 | | | | 2,671,412 | |
Intel Corporation | | | 114,064 | | | | 3,223,449 | |
Lam Research Corporation | | | 3,808 | | | | 1,904,381 | |
Microchip Technology, Inc. | | | 15,304 | | | | 1,187,896 | |
NVIDIA Corporation | | | 69,245 | | | | 13,528,396 | |
NXP Semiconductors NV (a) | | | 7,314 | | | | 1,348,043 | |
ON Semiconductor Corporation (b) | | | 12,119 | | | | 890,140 | |
Skyworks Solutions, Inc. | | | 4,465 | | | | 489,677 | |
Texas Instruments, Inc. | | | 25,414 | | | | 4,503,615 | |
| | | | | | | | |
| | | | | | | 35,573,118 | |
| | | | | | | | |
Capital Goods — 6.3% | |
3M Company . | | | 15,412 | | | | 1,773,613 | |
A.O. Smith Corporation | | | 3,506 | | | | 237,356 | |
AGCO Corporation | | | 1,756 | | | | 242,556 | |
Air Lease Corporation, Class A | | | 2,900 | | | | 130,413 | |
18
| | |
GREEN CENTURY EQUITY FUND PORTFOLIO OF INVESTMENTS January 31, 2023 (unaudited) | | continued |
| | | | | | | | |
| | | SHARES | | | VALUE | |
Capital Goods — (continued) | | | | | | | | |
Allegion PLC (a) . | | | 2,423 | | | $ | 284,824 | |
Applied Industrial Technologies, Inc. | | | 1,062 | | | | 152,089 | |
Builders FirstSource, Inc. (b) | | | 4,366 | | | | 347,970 | |
Carrier Global Corporation | | | 23,430 | | | | 1,066,768 | |
Caterpillar, Inc. | | | 14,667 | | | | 3,700,337 | |
Cummins, Inc. . | | | 3,902 | | | | 973,705 | |
Deere & Company . | | | 8,066 | | | | 3,410,627 | |
Dover Corporation | | | 4,018 | | | | 610,053 | |
Eaton Corporation PLC | | | 11,073 | | | | 1,796,151 | |
EMCOR Group, Inc. | | | 1,379 | | | | 204,437 | |
Fastenal Company | | | 16,075 | | | | 812,591 | |
Ferguson PLC (a) | | | 5,828 | | | | 829,558 | |
Flowserve Corporation | | | 3,598 | | | | 123,843 | |
Fortive Corporation | | | 9,452 | | | | 643,020 | |
Fortune Brands Innovations, Inc. . | | | 3,624 | | | | 233,784 | |
Graco, Inc. | | | 4,675 | | | | 319,396 | |
Granite Construction, Inc. | | | 1,169 | | | | 49,776 | |
IDEX Corporation . | | | 2,113 | | | | 506,444 | |
Illinois Tool Works, Inc. | | | 8,619 | | | | 2,034,429 | |
Lennox International, Inc. | | | 886 | | | | 230,909 | |
Lincoln Electric Holdings, Inc. | | | 1,548 | | | | 258,315 | |
Masco Corporation | | | 6,312 | | | | 335,798 | |
MDU Resources Group, Inc. | | | 5,639 | | | | 174,302 | |
Middleby Corporation (The) (b) | | | 1,417 | | | | 220,273 | |
Owens Corning . | | | 2,694 | | | | 260,375 | |
PACCAR, Inc. | | | 9,625 | | | | 1,052,109 | |
Parker-Hannifin Corporation | | | 3,571 | | | | 1,164,146 | |
Quanta Services, Inc | | | 4,000 | | | | 608,760 | |
Rockwell Automation, Inc | | | 3,193 | | | | 900,522 | |
Roper Technologies, Inc | | | 2,954 | | | | 1,260,620 | |
Sensata Technologies Holding NV | | | 4,217 | | | | 214,435 | |
Snap-on, Inc. | | | 1,491 | | | | 370,856 | |
Stanley Black & Decker, Inc. | | | 4,138 | | | | 369,565 | |
Tennant Company | | | 469 | | | | 32,891 | |
Timken Company (The) | | | 1,836 | | | | 151,195 | |
Trane Technologies PLC (a) | | | 6,453 | | | | 1,155,861 | |
United Rentals, Inc. (b) | | | 1,958 | | | | 863,380 | |
W.W. Grainger, Inc. | | | 1,280 | | | | 754,534 | |
Westinghouse Air Brake Technologies Corporation | | | 4,833 | | | | 501,714 | |
Xylem, Inc. | | | 5,038 | | | | 524,002 | |
| | | | | | | | |
| | | | | | | 31,888,302 | |
| | | | | | | | |
| | | | | | | | |
| | | SHARES | | | VALUE | |
Diversified Financials — 5.5% | |
Ally Financial, Inc | | | 8,641 | | | $ | 280,746 | |
American Express Company | | | 17,753 | | | | 3,105,532 | |
Ameriprise Financial, Inc. | | | 3,001 | | | | 1,050,710 | |
Bank of New York Mellon Corporation (The) | | | 21,260 | | | | 1,075,118 | |
BlackRock, Inc. | | | 4,188 | | | | 3,179,572 | |
Charles Schwab Corporation (The) | | | 40,395 | | | | 3,127,381 | |
CME Group, Inc. | | | 9,995 | | | | 1,765,717 | |
Equitable Holdings, Inc. | | | 10,511 | | | | 337,088 | |
FactSet Research Systems, Inc. | | | 1,059 | | | | 447,893 | |
Franklin Resources, Inc. | | | 8,275 | | | | 258,180 | |
Intercontinental Exchange, Inc. | | | 15,527 | | | | 1,669,929 | |
Invesco Ltd. | | | 9,662 | | | | 178,844 | |
Moody’s Corporation | | | 4,587 | | | | 1,480,454 | |
Morgan Stanley . | | | 35,772 | | | | 3,481,689 | |
Nasdaq, Inc. | | | 9,612 | | | | 578,546 | |
Northern Trust Corporation. | | | 5,555 | | | | 538,668 | |
S&P Global, Inc. | | | 9,465 | | | | 3,548,807 | |
State Street Corporation . | | | 10,168 | | | | 928,643 | |
T. Rowe Price Group, Inc. | | | 6,316 | | | | 735,625 | |
Voya Financial, Inc. | | | 2,740 | | | | 191,170 | |
| | | | | | | | |
| | | | | | | 27,960,312 | |
| | | | | | | | |
Food & Beverage — 4.8% | |
Archer-Daniels-Midland Company | | | 15,579 | | | | 1,290,720 | |
Bunge Ltd | | | 4,263 | | | | 422,463 | |
Campbell Soup Company . | | | 5,891 | | | | 305,920 | |
Coca-Cola Company (The) | | | 114,219 | | | | 7,003,909 | |
Conagra Brands, Inc | | | 13,358 | | | | 496,784 | |
Darling Ingredients, Inc. (b) | | | 4,475 | | | | 296,648 | |
General Mills, Inc. | | | 16,545 | | | | 1,296,466 | |
Hormel Foods Corporation | | | 8,326 | | | | 377,251 | |
Ingredion, Inc. | | | 1,861 | | | | 191,311 | |
JM Smucker Company (The) | | | 2,982 | | | | 455,650 | |
Kellogg Company . | | | 7,026 | | | | 481,843 | |
Keurig Dr Pepper, Inc. | | | 21,636 | | | | 763,318 | |
Kraft Heinz Company (The) | | | 20,573 | | | | 833,824 | |
Lamb Weston Holdings, Inc. | | | 4,019 | | | | 401,458 | |
McCormick & Company, Inc. | | | 7,025 | | | | 527,718 | |
Mondelez International, Inc., Class A | | | 38,178 | | | | 2,498,368 | |
PepsiCo, Inc. | | | 38,380 | | | | 6,563,747 | |
| | | | | | | | |
| | | | | | | 24,207,398 | |
| | | | | | | | |
19
| | |
GREEN CENTURY EQUITY FUND PORTFOLIO OF INVESTMENTS January 31, 2023 (unaudited) | | continued |
| | | | | | | | |
| | | SHARES | | | VALUE | |
Healthcare Equipment & Services — 4.7% | |
Align Technology, Inc. (b) | | | 2,077 | | | $ | 560,229 | |
AmerisourceBergen Corporation . | | | 4,349 | | | | 734,807 | |
Becton, Dickinson and Company . | | | 7,916 | | | | 1,996,574 | |
Cardinal Health, Inc | | | 7,623 | | | | 588,877 | |
Centene Corporation (b) | | | 15,875 | | | | 1,210,310 | |
Cigna Corporation | | | 8,473 | | | | 2,683,145 | |
Cooper Cos., Inc. (The) | | | 1,373 | | | | 479,081 | |
DaVita, Inc. (b) | | | 1,534 | | | | 126,386 | |
DENTSPLY SIRONA, Inc. | | | 6,103 | | | | 224,773 | |
DexCom, Inc. (b) | | | 10,916 | | | | 1,168,994 | |
Edwards Lifesciences | | | | | | | | |
Corporation (b) | | | 17,219 | | | | 1,320,697 | |
Elevance Health, Inc | | | 6,675 | | | | 3,337,433 | |
HCA Healthcare, Inc. | | | 6,382 | | | | 1,627,857 | |
Henry Schein, Inc. (b) | | | 3,810 | | | | 328,232 | |
Hologic, Inc. (b) | | | 6,929 | | | | 563,813 | |
Humana, Inc. | | | 3,527 | | | | 1,804,766 | |
IDEXX Laboratories, Inc. (b) | | | 2,306 | | | | 1,108,033 | |
Insulet Corporation (b) | | | 1,939 | | | | 557,113 | |
Laboratory Corporation of America Holdings | | | 2,530 | | | | 637,864 | |
Patterson Companies, Inc. | | | 2,363 | | | | 71,339 | |
Pediatrix Medical Group, Inc. (b) . | | | 2,345 | | | | 35,996 | |
Quest Diagnostics, Inc. | | | 3,264 | | | | 484,639 | |
ResMed, Inc. | | | 4,060 | | | | 927,182 | |
Select Medical Holdings Corporation | | | 2,929 | | | | 85,146 | |
STERIS PLC | | | 2,791 | | | | 576,369 | |
Teladoc Health, Inc. (b) | | | 4,537 | | | | 133,388 | |
West Pharmaceutical Services, Inc. | | | 2,072 | | | | 550,323 | |
| | | | | | | | |
| | | | | | | 23,923,366 | |
| | | | | | | | |
Retailing — 4.3% | |
AutoNation, Inc. (b) . | | | 1,017 | | | | 128,874 | |
Best Buy Company, Inc. | | | 5,647 | | | | 501,002 | |
Booking Holdings, Inc. (b) | | | 1,105 | | | | 2,689,680 | |
Buckle, Inc. (The) | | | 773 | | | | 34,012 | |
CarMax, Inc. (b) | | | 4,437 | | | | 312,587 | |
Foot Locker, Inc | | | 2,366 | | | | 102,945 | |
GameStop Corporation, Class A (b) | | | 7,256 | | | | 158,689 | |
Gap, Inc. (The) | | | 5,660 | | | | 76,806 | |
Home Depot, Inc. (The) | | | 28,466 | | | | 9,227,823 | |
Kohl’s Corporation | | | 3,615 | | | | 117,018 | |
LKQ Corporation | | | 7,286 | | | | 429,583 | |
| | | | | | | | |
| | | SHARES | | | VALUE | |
Retailing — (continued) | | | | | | | | |
Lowe’s Companies, Inc. | | | 17,245 | | | $ | 3,591,271 | |
Nordstrom, Inc. | | | 3,112 | | | | 60,808 | |
ODP Corporation (The) (b) | | | 1,210 | | | | 62,436 | |
Pool Corporation | | | 1,107 | | | | 426,870 | |
Signet Jewelers Ltd | | | 1,332 | | | | 102,311 | |
Target Corporation | | | 12,814 | | | | 2,205,802 | |
Tractor Supply Company | | | 3,104 | | | | 707,681 | |
Ulta Beauty, Inc. (b) | | | 1,432 | | | | 735,991 | |
| | | | | | | | |
| | | | | | | 21,672,189 | |
| | | | | | | | |
Real Estate — 3.5% | |
American Tower Corporation REIT | | | 12,932 | | | | 2,888,879 | |
Anywhere Real Estate, Inc. (b) | | | 3,345 | | | | 28,366 | |
AvalonBay Communities, Inc. REIT | | | 3,884 | | | | 689,177 | |
Boston Properties, Inc. REIT | | | 4,135 | | | | 308,223 | |
CBRE Group, Inc., Class A (b) | | | 8,990 | | | | 768,735 | |
Corporate Office Properties Trust REIT | | | 3,020 | | | | 84,771 | |
Digital Realty Trust, Inc. REIT | | | 8,018 | | | | 919,023 | |
Equinix, Inc. REIT | | | 2,532 | | | | 1,868,945 | |
Equity Residential REIT | | | 9,921 | | | | 631,472 | |
Federal Realty Investment Trust REIT | | | 2,054 | | | | 229,083 | |
Healthpeak Properties, Inc. REIT . | | | 15,017 | | | | 412,667 | |
Host Hotels & Resorts, Inc. REIT . | | | 19,655 | | | | 370,497 | |
Iron Mountain, Inc. REIT | | | 8,096 | | | | 441,880 | |
Jones Lang LaSalle, Inc. (b) | | | 1,342 | | | | 248,095 | |
Macerich Company (The) REIT | | | 5,952 | | | | 81,780 | |
PotlatchDeltic Corporation REIT . | | | 2,268 | | | | 111,019 | |
Prologis, Inc. REIT | | | 25,639 | | | | 3,314,610 | |
SBA Communications Corporation, Class A REIT | | | 2,985 | | | | 888,127 | |
Simon Property Group, Inc. REIT | | | 9,110 | | | | 1,170,271 | |
UDR, Inc. REIT. | | | 9,139 | | | | 389,230 | |
Ventas, Inc. REIT . | | | 11,193 | | | | 579,909 | |
Welltower, Inc. REIT | | | 12,825 | | | | 962,388 | |
| | | | | | | | |
| | | | | | | 17,387,147 | |
| | | | | | | | |
Materials — 3.1% | |
Air Products & Chemicals, Inc | | | 6,167 | | | | 1,976,585 | |
Albemarle Corporation . | | | 3,277 | | | | 922,312 | |
Amcor PLC (a) | | | 41,645 | | | | 502,239 | |
Avery Dennison Corporation | | | 2,271 | | | | 430,218 | |
20
| | |
GREEN CENTURY EQUITY FUND PORTFOLIO OF INVESTMENTS January 31, 2023 (unaudited) | | continued |
| | | | | | | | |
| | | SHARES | | | VALUE | |
Materials — (continued) | | | | | | | | |
Axalta Coating Systems Ltd. (b) | | | 6,060 | | | $ | 182,406 | |
Ball Corporation. | | | 8,792 | | | | 512,046 | |
Compass Minerals International, Inc. | | | 974 | | | | 45,447 | |
Ecolab, Inc. | | | 7,104 | | | | 1,099,912 | |
H.B. Fuller Company | | | 1,443 | | | | 99,711 | |
International Flavors & Fragrances, Inc. . | | | 7,135 | | | | 802,402 | |
Linde PLC (a) | | | 13,850 | | | | 4,583,519 | |
Minerals Technologies, Inc. | | | 847 | | | | 58,824 | |
Mosaic Company (The) | | | 9,658 | | | | 478,457 | |
Newmont Corporation . | | | 22,010 | | | | 1,164,989 | |
PPG Industries, Inc | | | 6,575 | | | | 856,986 | |
Schnitzer Steel Industries, Inc., Class A | | | 743 | | | | 25,143 | |
Sealed Air Corporation | | | 4,092 | | | | 224,078 | |
Sherwin-Williams Company (The) | | | 6,844 | | | | 1,619,222 | |
Sonoco Products Company | | | 2,725 | | | | 166,525 | |
| | | | | | | | |
| | | | | | | 15,751,021 | |
| | | | | | | | |
Household & Personal Products — 2.9% | |
Clorox Company (The) | | | 3,440 | | | | 497,734 | |
Colgate-Palmolive Company | | | 22,097 | | | | 1,646,889 | |
Estee Lauder Companies, Inc. (The), Class A | | | 6,444 | | | | 1,785,504 | |
Kimberly-Clark Corporation | | | 9,407 | | | | 1,223,004 | |
Procter & Gamble Company (The) | | | 66,346 | | | | 9,446,343 | |
| | | | | | | | |
| | | | | | | 14,599,474 | |
| | | | | | | | |
Renewable Energy & Energy Efficiency — 2.9% | |
Acuity Brands, Inc. | | | 915 | | | | 172,496 | |
Itron, Inc. (b) | | | 1,270 | | | | 72,987 | |
Johnson Controls International, PLC | | | 19,183 | | | | 1,334,561 | |
Ormat Technologies, Inc. | | | 1,232 | | | | 114,021 | |
Tesla, Inc. (b) | | | 74,062 | | | | 12,829,020 | |
| | | | | | | | |
| | | | | | | 14,523,085 | |
| | | | | | | | |
Insurance — 2.9% | |
Allstate Corporation (The) . | | | 7,482 | | | | 961,213 | |
Arthur J. Gallagher & Company . | | | 5,857 | | | | 1,146,332 | |
Chubb Ltd. (a) | | | 11,634 | | | | 2,646,619 | |
Hartford Financial Services Group, Inc. (The) . | | | 9,046 | | | | 702,060 | |
Lincoln National Corporation | | | 4,513 | | | | 159,896 | |
| | | | | | | | |
| | | SHARES | | | VALUE | |
Insurance — (continued) | | | | | | | | |
Loews Corporation | | | 5,737 | | | $ | 352,711 | |
Marsh & McLennan Companies, Inc. | | | 13,855 | | | | 2,423,378 | |
Principal Financial Group, Inc. | | | 6,970 | | | | 645,073 | |
Progressive Corporation (The) | | | 16,295 | | | | 2,221,823 | |
Prudential Financial, Inc. | | | 10,331 | | | | 1,084,135 | |
Travelers Companies, Inc. (The) | | | 6,604 | | | | 1,262,156 | |
Willis Towers Watson PLC (a) | | | 3,077 | | | | 782,143 | |
| | | | | | | | |
| | | | | | | 14,387,539 | |
| | | | | | | | |
Consumer Services — 2.7% | |
Aramark | | | 6,406 | | | | 285,259 | |
Choice Hotels International, Inc. | | | 1,023 | | | | 125,716 | |
Darden Restaurants, Inc. | | | 3,433 | | | | 507,981 | |
Domino’s Pizza, Inc. | | | 1,003 | | | | 354,059 | |
Hilton Worldwide Holdings, Inc. | | | 7,630 | | | | 1,107,037 | |
Jack in the Box, Inc | | | 583 | | | | 44,296 | |
Marriott International, Inc., Class A | | | 7,683 | | | | 1,338,225 | |
McDonald’s Corporation | | | 20,450 | | | | 5,468,330 | |
Royal Caribbean Cruises Ltd. (b) . | | | 6,412 | | | | 416,395 | |
Starbucks Corporation | | | 31,876 | | | | 3,478,947 | |
Vail Resorts, Inc. | | | 1,126 | | | | 295,395 | |
| | | | | | | | |
| | | | | | | 13,421,640 | |
| | | | | | | | |
Technology Hardware & Equipment — 2.6% | |
Cisco Systems, Inc. | | | 115,102 | | | | 5,602,014 | |
Cognex Corporation | | | 4,899 | | | | 268,171 | |
CommScope Holding Company, Inc. (b) | | | 5,878 | | | | 49,375 | |
Corning, Inc. | | | 22,469 | | | | 777,652 | |
Dell Technologies, Inc., Class C | | | 7,431 | | | | 301,847 | |
F5, Inc. (b) | | | 1,665 | | | | 245,854 | |
Flex Ltd. (b) | | | 12,749 | | | | 297,689 | |
Hewlett Packard Enterprise Company | | | 36,025 | | | | 581,083 | |
HP, Inc. | | | 28,932 | | | | 843,079 | |
Keysight Technologies, Inc. (b) | | | 5,013 | | | | 899,082 | |
Motorola Solutions, Inc. | | | 4,638 | | | | 1,192,012 | |
TE Connectivity Ltd. (a) | | | 8,880 | | | | 1,129,092 | |
Trimble, Inc. (b) | | | 6,927 | | | | 402,182 | |
Xerox Holdings Corporation | | | 3,252 | | | | 53,268 | |
Zebra Technologies Corporation, Class A (b) | | | 1,449 | | | | 458,145 | |
| | | | | | | | |
| | | | | | | 13,100,545 | |
| | | | | | | | |
21
| | |
GREEN CENTURY EQUITY FUND PORTFOLIO OF INVESTMENTS January 31, 2023 (unaudited) | | continued |
| | | | | | | | |
| | | SHARES | | | VALUE | |
Transportation — 2.1% | |
ArcBest Corporation . | | | 682 | | | $ | 56,913 | |
Avis Budget Group, Inc. (b) | | | 872 | | | | 174,435 | |
C.H. Robinson Worldwide, Inc. | | | 3,466 | | | | 347,189 | |
CSX Corporation | | | 59,536 | | | | 1,840,853 | |
Delta Air Lines, Inc. (b) | | | 4,419 | | | | 172,783 | |
Expeditors International of Washington, Inc | | | 4,575 | | | | 494,786 | |
Ryder System, Inc. | | | 1,433 | | | | 135,290 | |
Southwest Airlines Company | | | 4,118 | | | | 147,301 | |
U-Haul Holding Company | | | 2,430 | | | | 150,150 | |
Union Pacific Corporation | | | 17,350 | | | | 3,542,696 | |
United Parcel Service, Inc., Class B | | | 20,334 | | | | 3,766,467 | |
| | | | | | | | |
| | | | | | | 10,828,863 | |
| | | | | | | | |
Banks — 1.8% | |
Bank of Hawaii Corporation | | | 1,083 | | | | 82,839 | |
Cathay General Bancorp | | | 1,913 | | | | 84,095 | |
Citizens Financial Group, Inc. | | | 13,872 | | | | 600,935 | |
Comerica, Inc | | | 3,662 | | | | 268,461 | |
First Republic Bank | | | 5,118 | | | | 721,024 | |
Heartland Financial USA, Inc | | | 1,213 | | | | 60,007 | |
Huntington Bancshares, Inc. | | | 40,229 | | | | 610,274 | |
International Bancshares Corporation. | | | 1,580 | | | | 74,055 | |
KeyCorp | | | 26,010 | | | | 499,132 | |
M&T Bank Corporation | | | 4,916 | | | | 766,896 | |
New York Community Bancorp, Inc. | | | 19,014 | | | | 189,950 | |
Old National Bancorp. | | | 8,040 | | | | 140,700 | |
PNC Financial Services Group, Inc. (The) | | | 11,418 | | | | 1,888,880 | |
Regions Financial Corporation | | | 26,168 | | | | 615,995 | |
SVB Financial Group (b) | | | 1,658 | | | | 501,446 | |
Truist Financial Corporation | | | 36,909 | | | | 1,822,935 | |
Umpqua Holdings Corporation | | | 5,772 | | | | 105,050 | |
Zions Bancorp NA | | | 4,145 | | | | 220,348 | |
| | | | | | | | |
| | | | | | | 9,253,022 | |
| | | | | | | | |
Consumer Durables & Apparel — 1.5% | |
Capri Holdings Ltd. (a)(b) | | | 3,853 | | | | 256,186 | |
Columbia Sportswear Company | | | 976 | | | | 93,598 | |
Deckers Outdoor Corporation (b) | | | 746 | | | | 318,900 | |
Ethan Allen Interiors, Inc. | | | 671 | | | | 19,285 | |
Garmin Ltd. (a) | | | 4,306 | | | | 425,777 | |
Hanesbrands, Inc. | | | 9,732 | | | | 82,138 | |
| | | | | | | | |
| | | SHARES | | | VALUE | |
Consumer Durables & Apparel — (continued) | |
Hasbro, Inc | | | 3,620 | | | $ | 214,196 | |
La-Z-Boy, Inc. | | | 1,082 | | | | 30,761 | |
Mattel, Inc. (b) | | | 9,824 | | | | 200,999 | |
Meritage Homes Corporation (b) . | | | 1,000 | | | | 107,690 | |
Mohawk Industries, Inc. (b) | | | 1,428 | | | | 171,446 | |
Newell Brands, Inc. | | | 10,893 | | | | 173,852 | |
NIKE, Inc., Class B | | | 35,117 | | | | 4,471,448 | |
PVH Corporation | | | 1,838 | | | | 165,236 | |
Topgolf Callaway Brands Corporation (b) | | | 3,876 | | | | 94,923 | |
Under Armour, Inc., Class A (b) | | | 5,256 | | | | 65,122 | |
Under Armour, Inc., Class C (b) | | | 5,022 | | | | 54,740 | |
VF Corporation | | | 9,129 | | | | 282,451 | |
Whirlpool Corporation | | | 1,522 | | | | 236,808 | |
Wolverine World Wide, Inc | | | 2,254 | | | | 36,357 | |
| | | | | | | | |
| | | | | | | 7,501,913 | |
| | | | | | | | |
Telecommunication Services — 1.0% | |
Lumen Technologies Inc. | | | 26,155 | | | | 137,314 | |
Verizon Communications, Inc. | | | 116,720 | | | | 4,852,050 | |
| | | | | | | | |
| | | | | | | 4,989,364 | |
| | | | | | | | |
Commercial & Professional Services — 0.5% | |
ACCO Brands Corporation | | | 2,536 | | | | 16,104 | |
ASGN, Inc. (b) | | | 1,433 | | | | 130,331 | |
Copart, Inc. (b) | | | 11,968 | | | | 797,189 | |
Deluxe Corporation | | | 1,288 | | | | 25,747 | |
Exponent, Inc | | | 1,400 | | | | 143,556 | |
Heidrick & Struggles International, Inc | | | 461 | | | | 14,180 | |
HNI Corporation | | | 1,060 | | | | 33,676 | |
ICF International, Inc. | | | 549 | | | | 56,102 | |
Interface, Inc. | | | 1,507 | | | | 17,150 | |
Kelly Services, Inc., Class A. | | | 951 | | | | 17,213 | |
ManpowerGroup, Inc | | | 1,426 | | | | 124,290 | |
Resources Connection, Inc. | | | 987 | | | | 17,046 | |
Robert Half International, Inc. | | | 3,043 | | | | 255,490 | |
Steelcase, Inc., Class A | | | 2,304 | | | | 17,971 | |
Tetra Tech, Inc. | | | 1,472 | | | | 228,925 | |
TransUnion | | | 5,350 | | | | 383,863 | |
TrueBlue, Inc. (b) | | | 927 | | | | 18,197 | |
| | | | | | | | |
| | | | | | | 2,297,030 | |
| | | | | | | | |
Food & Staples Retailing — 0.4% | |
Kroger Co. (The) | | | 18,804 | | | | 839,223 | |
22
| | |
GREEN CENTURY EQUITY FUND PORTFOLIO OF INVESTMENTS January 31, 2023 (unaudited) | | concluded |
| | | | | | | | |
| | | SHARES | | | VALUE | |
Food & Staples Retailing — (continued) | |
Sysco Corporation . | | | 14,075 | | | $ | 1,090,249 | |
| | | | | | | | |
| | | | | | | 1,929,472 | |
| | | | | | | | |
Automobiles & Components — 0.3% | |
Aptiv PLC (a)(b) | | | 7,581 | | | | 857,335 | |
Autoliv, Inc. (a) | | | 2,296 | | | | 211,508 | |
BorgWarner, Inc. | | | 6,635 | | | | 313,703 | |
Harley-Davidson, Inc | | | 3,861 | | | | 177,722 | |
Rivian Automotive, Inc., Class A (b) | | | 8,923 | | | | 173,106 | |
| | | | | | | | |
| | | | | | | 1,733,374 | |
| | | | | | | | |
Utilities — 0.2% | |
American Water Works Company, Inc | | | 5,088 | | | | 796,221 | |
Essential Utilities, Inc | | | 6,920 | | | | 323,372 | |
| | | | | | | | |
| | | | | | | 1,119,593 | |
| | | | | | | | |
Healthy Living — 0.0% | |
Hain Celestial Group, Inc. (The) (b) | | | 2,434 | | | | 49,946 | |
United Natural Foods, Inc. (b) | | | 1,633 | | | | 67,965 | |
| | | | | | | | |
| | | | | | | 117,911 | |
| | | | | | | | |
Total Common Stocks
(Cost $271,036,261) | | | | | | | 502,652,629 | |
| | | | | | | | |
|
SHORT-TERM INVESTMENTS — 0.2% | |
UMB Money Market Fiduciary Account, 0.01% (c)
(Cost $846,167) | | | | | | | 846,167 | |
| | | | | | | | |
Total Short-term Investments
(Cost $846,167) | | | | | | | 846,167 | |
| | | | | | | | |
TOTAL INVESTMENTS (d) — 99.9% | |
(Cost $271,882,428) | | | | | | | 503,498,796 | |
Other Assets Less
Liabilities — 0.1% | | | | | | | 420,452 | |
| | | | | | | | |
NET ASSETS — 100.0% | | | | | | $ | 503,919,248 | |
| | | | | | | | |
| PLC | – Public Limited Company |
| REIT | – Real Estate Investment Trusts |
| (a) | Securities whose value are determined or significantly influenced by trading in markets other than the United States or Canada. |
| (b) | Non-income producing security. |
| (c) | The rate quoted is the annualized seven-day yield of the fund at the period end. |
| (d) | The cost of investments for federal income tax purposes is $278,453,868 resulting in gross unrealized appreciation and depreciation of $243,413,526 and $18,368,598 respectively, or net unrealized appreciation of $225,044,928. |
See Notes to Financial Statements
23
| | |
GREEN CENTURY MSCI INTERNATIONAL INDEX FUND PORTFOLIO OF INVESTMENTS January 31, 2023 (unaudited) | | |
| | | | | | | | |
COMMON STOCKS — 99.2% | | | | | | | | |
| | | SHARES | | | VALUE | |
Japan — 19.0% | | | | | | | | |
Aeon Company, Ltd. | | | 27,500 | | | $ | 563,796 | |
Ajinomoto Company, Inc. | | | 19,200 | | | | 632,997 | |
Asahi Kasei Corporation | | | 52,500 | | | | 397,826 | |
Astellas Pharma, Inc. | | | 76,800 | | | | 1,130,506 | |
Azbil Corporation | | | 4,900 | | | | 138,173 | |
Daifuku Co., Ltd | | | 4,300 | | | | 236,774 | |
Dai-ichi Life Holdings, Inc. | | | 41,300 | | | | 969,013 | |
Daiichi Sankyo Company Ltd. | | | 73,600 | | | | 2,311,550 | |
Daikin Industries Ltd | | | 10,400 | | | | 1,806,425 | |
FANUC Corporation | | | 8,100 | | | | 1,431,187 | |
Fast Retailing Company Ltd | | | 2,500 | | | | 1,518,399 | |
Fujitsu Ltd. | | | 8,200 | | | | 1,167,511 | |
Hankyu Hanshin Holdings, Inc . | | | 9,700 | | | | 288,308 | |
Hitachi Construction Machinery Company Ltd. | | | 4,600 | | | | 108,483 | |
Hulic Company Ltd. | | | 16,300 | | | | 133,983 | |
Ibiden Company Ltd. | | | 4,600 | | | | 179,533 | |
JFE Holdings, Inc. | | | 20,500 | | | | 270,306 | |
Kao Corp. | | | 19,900 | | | | 804,395 | |
KDDI Corp | | | 67,600 | | | | 2,112,057 | |
Kikkoman Corporation | | | 6,100 | | | | 322,642 | |
Kubota Corporation | | | 43,000 | | | | 646,217 | |
Kurita Water Industries Ltd. | | | 4,400 | | | | 198,960 | |
Mitsubishi Chemical Group Corporation. | | | 53,400 | | | | 299,651 | |
Nitto Denko Corporation | | | 6,000 | | | | 387,825 | |
Nomura Research Institute Ltd. | | | 16,800 | | | | 403,328 | |
Omron Corporation | | | 7,800 | | | | 451,313 | |
Panasonic Holdings Corporation . | | | 92,600 | | | | 858,714 | |
Recruit Holdings Company Ltd. . | | | 60,300 | | | | 1,939,264 | |
Sekisui House Ltd. | | | 25,200 | | | | 476,261 | |
SG Holdings Company Ltd. | | | 11,900 | | | | 183,633 | |
SoftBank Corporation | | | 120,600 | | | | 1,379,917 | |
Sompo Holdings, Inc. | | | 13,200 | | | | 568,245 | |
Sony Group Corporation | | | 52,900 | | | | 4,726,699 | |
Sumitomo Chemical Company, Ltd. | | | 63,500 | | | | 243,753 | |
Suntory Beverage & Food Ltd. | | | 5,900 | | | | 199,230 | |
Sysmex Corporation | | | 7,000 | | | | 464,696 | |
Terumo Corporation | | | 27,400 | | | | 797,624 | |
Tokyo Electron Ltd. | | | 6,300 | | | | 2,202,003 | |
Tokyu Corp. | | | 21,400 | | | | 275,191 | |
Toray Industries, Inc. | | | 56,600 | | | | 347,753 | |
Yamaha Corporation | | | 5,800 | | | | 225,528 | |
| | | | | | | | |
| | | SHARES | | | VALUE | |
Japan — (continued) | | | | | | | | |
Yamaha Motor Company Ltd | | | 12,400 | | | $ | 305,421 | |
Z Holdings Corporation | | | 107,100 | | | | 311,631 | |
| | | | | | | | |
| | | | | | | 34,416,721 | |
| | | | | | | | |
France — 10.8% | | | | | | | | |
AXA SA | | | 78,473 | | | | 2,448,378 | |
BioMerieux | | | 1,752 | | | | 178,616 | |
Bureau Veritas SA | | | 12,361 | | | | 353,433 | |
Cie Generale des Etablissements Michelin SCA | | | 28,528 | | | | 902,087 | |
Covivio REIT | | | 1,937 | | | | 132,969 | |
Danone SA | | | 26,939 | | | | 1,477,375 | |
EssilorLuxottica SA | | | 12,203 | | | | 2,239,086 | |
Hermes International | | | 1,328 | | | | 2,485,462 | |
Klepierre SA REIT (a) | | | 8,898 | | | | 225,844 | |
L’Oreal SA | | | 10,127 | | | | 4,181,721 | |
Publicis Groupe SA | | | 9,554 | | | | 673,962 | |
Schneider Electric SE. | | | 22,754 | | | | 3,691,200 | |
Valeo SA | | | 8,686 | | | | 189,838 | |
Vivendi SA | | | 30,718 | | | | 329,916 | |
| | | | | | | | |
| | | | | | | 19,509,887 | |
| | | | | | | | |
Canada — 10.5% | | | | | | | | |
Agnico Eagle Mines Ltd. | | | 19,028 | | | | 1,074,526 | |
Bank of Nova Scotia (The) | | | 50,210 | | | | 2,718,042 | |
FirstService Corporation. | | | 1,663 | | | | 237,652 | |
Gildan Activewear, Inc. | | | 7,702 | | | | 241,491 | |
Intact Financial Corporation | | | 7,348 | | | | 1,065,973 | |
Magna International, Inc. | | | 11,518 | | | | 747,726 | |
Metro, Inc. | | | 9,957 | | | | 540,429 | |
National Bank of Canada | | | 14,042 | | | | 1,054,786 | |
Nutrien Ltd. . | | | 22,628 | | | | 1,873,025 | |
Ritchie Bros Auctioneers, Inc. | | | 4,671 | | | | 282,450 | |
Rogers Communications, Inc., Class B | | | 14,908 | | | | 724,785 | |
Shopify, Inc. (a) | | | 49,823 | | | | 2,455,204 | |
TELUS Corporation | | | 19,578 | | | | 421,841 | |
Toromont Industries Ltd. | | | 3,471 | | | | 277,268 | |
Toronto-Dominion Bank (The) | | | 76,499 | | | | 5,292,723 | |
| | | | | | | | |
| | | | | | | 19,007,921 | |
| | | | | | | | |
United Kingdom — 9.9% | | | | | | | | |
abrdn plc | | | 90,688 | | | | 238,868 | |
Ashtead Group PLC | | | 18,519 | | | | 1,219,868 | |
Barratt Developments PLC | | | 43,949 | | | | 249,801 | |
24
| | |
GREEN CENTURY MSCI INTERNATIONAL INDEX FUND PORTFOLIO OF INVESTMENTS January 31, 2023 (unaudited) | | continued |
| | | | | | | | |
| | | SHARES | | | VALUE | |
United Kingdom — (continued) | | | | | | | | |
Berkeley Group Holdings PLC | | | 4,590 | | | $ | 235,051 | |
British Land Company PLC (The) REIT | | | 36,671 | | | | 200,703 | |
BT Group PLC | | | 288,344 | | | | 444,265 | |
Bunzl PLC | | | 14,086 | | | | 517,132 | |
Burberry Group PLC | | | 16,468 | | | | 501,648 | |
Coca-Cola Europacific Partners | | | | | | | | |
PLC | | | 8,628 | | | | 485,066 | |
Croda International PLC | | | 5,861 | | | | 499,590 | |
Informa PLC | | | 60,846 | | | | 503,257 | |
InterContinental Hotels Group PLC | | | 7,752 | | | | 538,191 | |
Intertek Group PLC | | | 6,763 | | | | 363,504 | |
J Sainsbury PLC | | | 73,347 | | | | 237,883 | |
Johnson Matthey PLC | | | 7,677 | | | | 214,448 | |
Kingfisher PLC | | | 82,751 | | | | 285,492 | |
Legal & General Group PLC | | | 249,537 | | | | 785,314 | |
Mondi PLC | | | 20,518 | | | | 386,938 | |
Pearson PLC | | | 27,576 | | | | 314,494 | |
RELX PLC | | | 80,903 | | | | 2,403,630 | |
Schroders PLC | | | 31,081 | | | | 183,811 | |
Segro PLC REIT | | | 50,422 | | | | 519,040 | |
Severn Trent PLC | | | 10,839 | | | | 377,220 | |
St. James’s Place PLC | | | 22,972 | | | | 348,353 | |
Taylor Wimpey PLC | | | 129,191 | | | | 187,455 | |
Unilever PLC | | | 107,046 | | | | 5,448,735 | |
Whitbread PLC | | | 8,360 | | | | 314,867 | |
| | | | | | | | |
| | | | | | | 18,004,624 | |
| | | | | | | | |
Netherlands — 9.1% | | | | | | | | |
Akzo Nobel NV | | | 7,601 | | | | 566,183 | |
ASML Holding NV . | | | 13,825 | | | | 9,147,638 | |
CNH Industrial NV | | | 42,875 | | | | 758,545 | |
IMCD NV | | | 2,386 | | | | 378,272 | |
Just Eat Takeaway.com NV (a)(b). | | | 7,732 | | | | 198,361 | |
Koninklijke DSM NV . | | | 7,330 | | | | 942,690 | |
NN Group NV . | | | 11,748 | | | | 510,448 | |
Prosus NV (a) | | | 34,811 | | | | 2,810,933 | |
Wolters Kluwer NV | | | 10,970 | | | | 1,196,029 | |
| | | | | | | | |
| | | | | | | 16,509,099 | |
| | | | | | | | |
Switzerland — 8.3% | | | | | | | | |
Coca-Cola HBC AG (a) | | | 8,438 | | | | 205,063 | |
Givaudan SA | | | 386 | | | | 1,251,501 | |
Kuehne + Nagel International AG | | | 2,277 | | | | 542,966 | |
| | | | | | | | |
| | | SHARES | | | VALUE | |
Switzerland — (continued) | | | | | | | | |
Lonza Group AG | | | 3,135 | | | $ | 1,788,335 | |
Roche Holding AG | | | 25,255 | | | | 7,883,863 | |
SGS SA. | | | 269 | | | | 655,993 | |
Sonova Holding AG | | | 2,248 | | | | 562,161 | |
Swiss Life Holding AG . | | | 1,291 | | | | 764,075 | |
Swiss Re AG | | | 12,658 | | | | 1,325,432 | |
| | | | | | | | |
| | | | | | | 14,979,389 | |
| | | | | | | | |
Denmark — 7.6% | | | | | | | | |
AP Moller — Maersk A/S, Class A | | | 133 | | | | 283,416 | |
AP Moller — Maersk A/S, Class B | | | 210 | | | | 456,812 | |
Coloplast A/S, Class B | | | 4,979 | | | | 601,137 | |
Demant A/S (a) | | | 3,886 | | | | 110,000 | |
Genmab A/S (a) | | | 2,759 | | | | 1,081,243 | |
Novo Nordisk A/S, Class B | | | 69,468 | | | | 9,613,668 | |
Pandora A/S. | | | 3,788 | | | | 315,430 | |
Vestas Wind Systems A/S | | | 42,288 | | | | 1,237,414 | |
| | | | | | | | |
| | | | | | | 13,699,120 | |
| | | | | | | | |
Australia — 5.6% | | | | | | | | |
ASX Ltd. | | | 8,091 | | | | 395,943 | |
BlueScope Steel Ltd. | | | 19,516 | | | | 266,136 | |
Brambles Ltd. | | | 57,982 | | | | 493,066 | |
Cochlear Ltd. | | | 2,710 | | | | 409,427 | |
Coles Group Ltd. | | | 56,182 | | | | 706,651 | |
Computershare Ltd. | | | 22,740 | | | | 382,993 | |
Dexus REIT | | | 45,797 | | | | 265,540 | |
Fortescue Metals Group Ltd | | | 71,078 | | | | 1,122,744 | |
Goodman Group | | | 70,979 | | | | 1,012,439 | |
GPT Group (The) REIT | | | 80,074 | | | | 259,569 | |
Lendlease Corporation Ltd. | | | 29,429 | | | | 179,707 | |
Mineral Resources Ltd | | | 7,120 | | | | 450,778 | |
Mirvac Group REIT | | | 169,166 | | | | 273,314 | |
Newcrest Mining Ltd | | | 37,447 | | | | 595,013 | |
Orica Ltd. | | | 18,651 | | | | 195,720 | |
QBE Insurance Group Ltd. | | | 62,025 | | | | 605,185 | |
REA Group Ltd. | | | 2,203 | | | | 197,551 | |
Stockland REIT. | | | 101,127 | | | | 282,580 | |
Suncorp Group Ltd. | | | 53,537 | | | | 475,919 | |
Transurban Group | | | 129,304 | | | | 1,267,740 | |
Vicinity Ltd. REIT | | | 162,123 | | | | 237,194 | |
| | | | | | | | |
| | | | | | | 10,075,209 | |
| | | | | | | | |
Germany — 5.1% | | | | | | | | |
adidas AG | | | 7,252 | | | | 1,167,736 | |
Allianz SE | | | 17,127 | | | | 4,095,465 | |
25
| | |
GREEN CENTURY MSCI INTERNATIONAL INDEX FUND PORTFOLIO OF INVESTMENTS January 31, 2023 (unaudited) | | continued |
| | | | | | | | |
| | | SHARES | | | VALUE | |
Germany — (continued) | | | | | | | | |
Carl Zeiss Meditec AG | | | 1,685 | | | $ | 243,186 | |
Deutsche Boerse AG | | | 8,016 | | | | 1,434,458 | |
GEA Group AG | | | 6,294 | | | | 283,996 | |
Merck KGaA | | | 5,450 | | | | 1,137,614 | |
Puma SE | | | 4,438 | | | | 303,076 | |
Telefonica Deutschland Holding AG | | | 45,063 | | | | 132,734 | |
Zalando SE (a)(b) | | | 9,415 | | | | 439,086 | |
| | | | | | | | |
| | | | | | | 9,237,351 | |
| | | | | | | | |
Hong Kong — 4.1% | | | | | | | | |
AIA Group Ltd. | | | 502,400 | | | | 5,680,928 | |
BOC Hong Kong Holdings Ltd. | | | 155,000 | | | | 541,703 | |
Hang Seng Bank Ltd. . | | | 32,017 | | | | 533,183 | |
MTR Corporation Ltd. | | | 63,167 | | | | 338,037 | |
Swire Pacific Ltd. A Shares | | | 20,000 | | | | 183,277 | |
Swire Properties Ltd | | | 49,800 | | | | 139,965 | |
| | | | | | | | |
| | | | | | | 7,417,093 | |
| | | | | | | | |
Spain — 1.8% | | | | | | | | |
Banco Bilbao Vizcaya Argentaria SA | | | 255,063 | | | | 1,801,774 | |
Industria de Diseno Textil SA | | | 45,724 | | | | 1,427,595 | |
| | | | | | | | |
| | | | | | | 3,229,369 | |
| | | | | | | | |
Ireland — 1.4% | | | | | | | | |
CRH PLC. | | | 31,735 | | | | 1,482,799 | |
James Hardie Industries PLC | | | 18,704 | | | | 419,700 | |
Kerry Group PLC, Class A | | | 6,686 | | | | 626,503 | |
| | | | | | | | |
| | | | | | | 2,529,002 | |
| | | | | | | | |
Italy — 1.3% | | | | | | | | |
Amplifon SpA | | | 5,064 | | | | 139,839 | |
Intesa Sanpaolo SpA | | | 698,932 | | | | 1,837,755 | |
Prysmian SpA. | | | 10,671 | | | | 435,796 | |
| | | | | | | | |
| | | | | | | 2,413,390 | |
| | | | | | | | |
Sweden — 1.3% | | | | | | | | |
Boliden AB | | | 11,619 | | | | 521,426 | |
Electrolux AB . | | | 9,249 | | | | 131,001 | |
Essity AB, Class B | | | 25,686 | | | | 671,025 | |
Husqvarna AB B Shares | | | 17,356 | | | | 147,663 | |
Svenska Cellulosa AB SCA, | | | | | | | | |
Class B | | | 25,371 | | | | 352,311 | |
Tele2 AB B Shares | | | 23,624 | | | | 204,029 | |
Telia Company AB | | | 110,758 | | | | 286,048 | |
| | | | | | | | |
| | | | | | | 2,313,503 | |
| | | | | | | | |
| | | | | | | | |
| | | SHARES | | | VALUE | |
Singapore — 0.9% | | | | | | | | |
Capitaland Investment Ltd. | | | 107,511 | | | $ | 325,716 | |
City Developments Ltd. | | | 17,800 | | | | 112,974 | |
United Overseas Bank Ltd. | | | 49,500 | | | | 1,125,166 | |
| | | | | | | | |
| | | | | | | 1,563,856 | |
| | | | | | | | |
Finland — 0.7% | | | | | | | | |
Elisa Oyj | | | 5,965 | | | | 339,858 | |
Kesko Oyj B Shares | | | 11,353 | | | | 264,462 | |
Orion Oyj, Class B . | | | 4,472 | | | | 239,595 | |
Stora Enso Oyj R Shares . | | | 23,360 | | | | 333,953 | |
Wartsila OYJ Abp. | | | 20,038 | | | | 190,590 | |
| | | | | | | | |
| | | | | | | 1,368,458 | |
| | | | | | | | |
Belgium — 0.7% | | | | | | | | |
D’ieteren Group | | | 1,046 | | | | 199,915 | |
KBC Group NV | | | 10,553 | | | | 781,663 | |
Umicore SA | | | 8,725 | | | | 329,857 | |
| | | | | | | | |
| | | | | | | 1,311,435 | |
| | | | | | | | |
Norway — 0.7% | | | | | | | | |
DNB Bank ASA | | | 38,971 | | | | 728,741 | |
Orkla ASA | | | 31,484 | | | | 235,050 | |
Telenor ASA | | | 29,933 | | | | 313,357 | |
| | | | | | | | |
| | | | | | | 1,277,148 | |
| | | | | | | | |
Israel — 0.3% | | | | | | | | |
Bank Leumi Le-Israel BM | | | 64,365 | | | | 568,811 | |
| | | | | | | | |
New Zealand — 0.1% | | | | | | | | |
Meridian Energy Ltd. . | | | 53,497 | | | | 184,902 | |
| | | | | | | | |
Total Common Stocks
(Cost $163,650,961) | | | | | | | 179,616,288 | |
| | | | | | | | |
|
SHORT-TERM INVESTMENTS — 0.3% | |
UMB Money Market Fiduciary Account, 0.01% (c)
(Cost $507,201) | | | | | | | 507,201 | |
| | | | | | | | |
Total Short-term Investments
(Cost $507,201) | | | | | | | 507,201 | |
| | | | | | | | |
TOTAL INVESTMENTS (d) — 99.5% | |
(Cost $164,158,162) | | | | | | | 180,123,489 | |
Other Assets Less
Liabilities — 0.5% | | | | | | | 991,467 | |
| | | | | | | | |
NET ASSETS — 100.0% | | | | | | $ | 181,114,956 | |
| | | | | | | | |
26
| | |
GREEN CENTURY MSCI INTERNATIONAL INDEX FUND PORTFOLIO OF INVESTMENTS January 31, 2023 (unaudited) | | concluded |
| REIT | – Real Estate Investment Trusts |
| PLC | – Public Limited Company |
| (a) | Non-income producing security. |
| (b) | Security exempt from registration under Rule 144A of the Securities Act of 1933. These securities may be resold in transactions exempt from registration to qualified institutional buyers. The total value of these securities is $637,447. |
| (c) | The rate quoted is the annualized seven-day yield of the fund at the period end. |
| (d) | The cost of investments for federal income tax purposes is $169,563,238 resulting in gross unrealized appreciation and depreciation of $27,729,272 and $17,169,021 respectively, or net unrealized appreciation of $10,560,251. |
See Notes to Financial Statements
27
GREEN CENTURY FUNDS STATEMENTS OF ASSETS AND LIABILITIES
January 31, 2023
(unaudited)
| | | | | | | | | | | | |
| | | BALANCED FUND | | | EQUITY FUND | | | MSCI INTERNATIONAL
INDEX FUND | |
ASSETS: | | | | | | | | | | | | |
Investments, at value (cost $296,522,568, $271,882,428 and $164,158,162, respectively) | | $ | 391,514,935 | | | $ | 503,498,796 | | | $ | 180,123,489 | |
Foreign cash, at value (cost $213,298) | | | — | | | | — | | | | 213,760 | |
| Receivables for: | | | | | | | | | | | | |
Capital stock sold | | | 208,480 | | | | 546,414 | | | | 272,044 | |
Interest | | | 895,790 | | | | 4 | | | | 4 | |
Dividends | | | 146,392 | | | | 527,150 | | | | 726,745 | |
| | | | | | | | | | | | |
Total assets | | | 392,765,597 | | | | 504,572,364 | | | | 181,336,042 | |
| | | | | | | | | | | | |
LIABILITIES: | | | | | | | | | | | | |
Payable for capital stock repurchased | | | 86,903 | | | | 189,251 | | | | 61,606 | |
Accrued expenses | | | 449,456 | | | | 463,865 | | | | 159,480 | |
| | | | | | | | | | | | |
Total liabilities | | | 536,359 | | | | 653,116 | | | | 221,086 | |
| | | | | | | | | | | | |
NET ASSETS | | $ | 392,229,238 | | | $ | 503,919,248 | | | $ | 181,114,956 | |
| | | | | | | | | | | | |
NET ASSETS CONSIST OF: | | | | | | | | | | | | |
Paid-in capital (par value of $0.01 per share with unlimited number of shares authorized) | | $ | 294,391,986 | | | $ | 280,100,354 | | | $ | 174,007,558 | |
Net distributable earnings | | | 97,837,252 | | | | 223,818,894 | | | | 7,107,398 | |
| | | | | | | | | | | | |
NET ASSETS | | $ | 392,229,238 | | | $ | 503,919,248 | | | $ | 181,114,956 | |
| | | | | | | | | | | | |
NET ASSET VALUE PER SHARE PER CLASS: | | | | | | | | | | | | |
| Individual Investor Class Shares: | | | | | | | | | | | | |
Net assets applicable to shares outstanding | | $ | 288,118,776 | | | $ | 285,091,285 | | | $ | 51,248,885 | |
Shares of beneficial interest issued and outstanding | | | 8,909,989 | | | | 4,513,498 | | | | 4,059,693 | |
Net asset value per share | | $ | 32.34 | | | $ | 63.16 | | | $ | 12.62 | |
| | | | | | | | | | | | |
| Institutional Class Shares: | | | | | | | | | | | | |
Net assets applicable to shares outstanding | | $ | 104,110,462 | | | $ | 218,827,963 | | | $ | 129,866,071 | |
Shares of beneficial interest issued and outstanding | | | 3,205,617 | | | | 3,481,170 | | | | 10,322,051 | |
Net asset value per share | | $ | 32.48 | | | $ | 62.86 | | | $ | 12.58 | |
| | | | | | | | | | | | |
See Notes to Financial Statements
28
GREEN CENTURY FUNDS STATEMENTS OF OPERATIONS
For the six months ended January 31, 2023
(unaudited)
| | | | | | | | | | | | |
| | | BALANCED FUND | | | EQUITY FUND | | | MSCI INTERNATIONAL
INDEX FUND | |
INVESTMENT INCOME: | | | | | | | | | | | | |
Interest income | | $ | 1,653,859 | | | $ | 32 | | | $ | 28 | |
Dividend and other income (net of $2,321, $1,867 and $117,021 foreign withholding taxes, respectively) | | | 1,511,742 | | | | 4,028,825 | | | | 1,316,649 | |
| | | | | | | | | | | | |
Total investment income | | | 3,165,601 | | | | 4,028,857 | | | | 1,316,677 | |
| | | | | | | | | | | | |
EXPENSES: | | | | | | | | | | | | |
Administrative services fee | | | 1,447,034 | | | | 2,190,159 | | | | 640,866 | |
Investment advisory fee | | | 1,218,061 | | | | 552,484 | | | | 228,595 | |
| | | | | | | | | | | | |
Total expenses | | | 2,665,095 | | | | 2,742,643 | | | | 869,461 | |
| | | | | | | | | | | | |
NET INVESTMENT INCOME | | | 500,506 | | | | 1,286,214 | | | | 447,216 | |
| | | | | | | | | | | | |
NET REALIZED AND UNREALIZED GAIN (LOSS): | | | | | | | | | | | | |
| Net realized gain (loss) on: | | | | | | | | | | | | |
Investments | | | 3,323,452 | | | | (2,240,354 | ) | | | (3,323,321 | ) |
Foreign currency transactions | | | — | | | | — | | | | (14,692 | ) |
| Change in net unrealized appreciation (depreciation) on: | | | | | | | | | | | | |
Investments | | | (3,734,400 | ) | | | (7,080,645 | ) | | | 15,216,499 | |
Foreign currency translations | | | — | | | | — | | | | 24,888 | |
| | | | | | | | | | | | |
NET REALIZED AND UNREALIZED GAIN (LOSS) ON INVESTMENTS | | | (410,948 | ) | | | (9,320,999 | ) | | | 11,903,374 | |
| | | | | | | | | | | | |
NET INCREASE (DECREASE) IN NET ASSETS RESULTING FROM OPERATIONS . | | $ | 89,558 | | | $ | (8,034,785 | ) | | $ | 12,350,590 | |
| | | | | | | | | | | | |
See Notes to Financial Statements
29
GREEN CENTURY FUNDS STATEMENTS OF CHANGES IN NET ASSETS
| | | | | | | | | | | | | | | | | | | | | | | | |
| | | BALANCED FUND | | | EQUITY FUND | | | MSCI INTERNATIONAL INDEX FUND | |
| | | FOR THE
SIX MONTHS
ENDED
JANUARY 31,
2023
(UNAUDITED) | | | FOR THE
YEAR ENDED
JULY 31, 2022 | | | FOR THE
SIX MONTHS
ENDED
JANUARY 31,
2023
(UNAUDITED) | | | FOR THE
YEAR ENDED
JULY 31, 2022 | | | FOR THE
SIX MONTHS
ENDED
JANUARY 31,
2023
(UNAUDITED) | | | FOR THE
YEAR ENDED
JULY 31, 2022 | |
INCREASE (DECREASE) IN NET ASSETS: | | | | | | | | | | | | | | | | | | | | | |
| From operations: | | | | | | | | | | | | | | | | | | | | | | | | |
Net investment income | | $ | 500,506 | | | $ | 156,675 | | | $ | 1,286,214 | | | $ | 1,215,412 | | | $ | 447,216 | | | $ | 2,890,573 | |
Net realized gain (loss) on investments and foreign currency transactions | | | 3,323,452 | | | | 9,290,056 | | | | (2,240,354 | ) | | | 443,916 | | | | (3,338,013 | ) | | | (2,455,570 | ) |
Change in net unrealized appreciation (depreciation) on investments and foreign currency translations | | | (3,734,400 | ) | | | (43,567,306 | ) | | | (7,080,645 | ) | | | (49,526,394 | ) | | | 15,241,387 | | | | (33,433,605 | ) |
| | | | | | | | | | | | | | | | | | | | | | | | |
Net increase (decrease) in net assets resulting from operations | | | 89,558 | | | | (34,120,575 | ) | | | (8,034,785 | ) | | | (47,867,066 | ) | | | 12,350,590 | | | | (32,998,602 | ) |
| | | | | | | | | | | | | | | | | | | | | | | | |
| Dividends and distributions to shareholders: | | | | | | | | | | | | | | | | | | | | | |
Distributions | | | | | | | | | | | | | | | | | | | | | | | | |
Individual Investor Class | | | (5,094,244 | ) | | | (12,975,872 | ) | | | (1,221,339 | ) | | | (4,047,069 | ) | | | (88,291 | ) | | | (1,563,064 | ) |
Institutional Class | | | (1,929,901 | ) | | | (3,990,285 | ) | | | (1,171,767 | ) | | | (3,269,110 | ) | | | (370,320 | ) | | | (4,167,887 | ) |
| | | | | | | | | | | | | | | | | | | | | | | | |
Total dividends and distributions | | | (7,024,145 | ) | | | (16,966,157 | ) | | | (2,393,106 | ) | | | (7,316,179 | ) | | | (458,611 | ) | | | (5,730,951 | ) |
| | | | | | | | | | | | | | | | | | | | | | | | |
| Capital share transactions: | | | | | | | | | | | | | | | | | | | | | | | | |
Proceeds from sales of shares | | | | | | | | | | | | | | | | | | | | | | | | |
Individual Investor Class | | | 10,257,380 | | | | 44,688,812 | | | | 11,494,619 | | | | 37,859,054 | | | | 4,507,224 | | | | 17,714,015 | |
Institutional Class | | | 9,896,455 | | | | 30,572,580 | | | | 23,987,999 | | | | 87,698,497 | | | | 17,243,961 | | | | 45,355,351 | |
Reinvestment of dividends and distributions | | | | | | | | | | | | | | | | | | | | | | | | |
Individual Investor Class | | | 4,923,981 | | | | 12,593,808 | | | | 1,186,708 | | | | 3,952,832 | | | | 87,446 | | | | 1,547,300 | |
Institutional Class | | | 1,904,137 | | | | 3,935,619 | | | | 1,057,944 | | | | 2,995,483 | | | | 370,212 | | | | 4,167,068 | |
Payments for shares redeemed | | | | | | | | | | | | | | | | | | | | | | | | |
Individual Investor Class1 | | | (18,386,133 | ) | | | (45,973,093 | ) | | | (23,145,926 | ) | | | (45,915,443 | ) | | | (4,003,516 | ) | | | (6,831,449 | ) |
Institutional Class2 | | | (7,354,210 | ) | | | (7,146,977 | ) | | | (15,606,427 | ) | | | (32,166,633 | ) | | | (12,037,317 | ) | | | (18,677,941 | ) |
| | | | | | | | | | | | | | | | | | | | | | | | |
Net increase (decrease) in net assets resulting from capital share transactions | | | 1,241,610 | | | | 38,670,749 | | | | (1,025,083 | ) | | | 54,423,790 | | | | 6,168,010 | | | | 43,274,344 | |
| | | | | | | | | | | | | | | | | | | | | | | | |
Total increase (decrease) in net assets | | | (5,692,977 | ) | | | (12,415,983 | ) | | | (11,452,974 | ) | | | (759,455 | ) | | | 18,059,989 | | | | 4,544,791 | |
NET ASSETS: | | | | | | | | | | | | | | | | | | | | | | | | |
Beginning of period | | | 397,922,215 | | | | 410,338,198 | | | | 515,372,222 | | | | 516,131,677 | | | | 163,054,967 | | | | 158,510,176 | |
| | | | | | | | | | | | | | | | | | | | | | | | |
End of period | | $ | 392,229,238 | | | $ | 397,922,215 | | | $ | 503,919,248 | | | $ | 515,372,222 | | | $ | 181,114,956 | | | $ | 163,054,967 | |
| | | | | | | | | | | | | | | | | | | | | | | | |
| 1 | Net of redemption fee received of $1,887, $9,068, $1,795, $11,556, $349 and $5,503, respectively. |
| 2 | Net of redemption fee received of $775, $127, $382, $3,488, $6,543 and $3,704, respectively. |
See Notes to Financial Statements
30
GREEN CENTURY BALANCED FUND INDIVIDUAL INVESTOR CLASS FINANCIAL HIGHLIGHTS
| | | | | | | | | | | | | | | | | | | | | | | | |
| | | FOR THE
SIX MONTHS ENDED
JANUARY 31, 2023 | | | FOR THE YEARS ENDED JULY 31, | |
| | (UNAUDITED) | | | 2022 | | | 2021 | | | 2020 | | | 2019 | | | 2018 | |
Net Asset Value, beginning of period | | $ | 32.93 | | | $ | 37.21 | | | $ | 30.83 | | | $ | 29.05 | | | $ | 27.05 | | | $ | 25.55 | |
| | | | | | | | | | | | | | | | | | | | | | | | |
| Income (loss) from investment operations: | | | | | | | | | | | | | | | | | | | | | | | | |
Net investment income (loss) | | | 0.03 | | | | (0.01 | ) | | | 0.02 | | | | 0.11 | | | | 0.12 | | | | 0.07 | |
Net realized and unrealized gain (loss) on investments | | | (0.04 | ) | | | (2.78 | ) | | | 7.51 | | | | 2.25 | | | | 2.50 | | | | 1.79 | |
| | | | | | | | | | | | | | | | | | | | | | | | |
Total increase (decrease) from investment operations | | | (0.01 | ) | | | (2.79 | ) | | | 7.53 | | | | 2.36 | | | | 2.62 | | | | 1.86 | |
| | | | | | | | | | | | | | | | | | | | | | | | |
| Less dividends: | | | | | | | | | | | | | | | | | | | | | | | | |
Dividends from net investment income | | | (0.04 | ) | | | — | | | | (0.02 | ) | | | (0.11 | ) | | | (0.11 | ) | | | (0.05 | ) |
Distributions from net realized gains | | | (0.54 | ) | | | (1.49 | ) | | | (1.13 | ) | | | (0.47 | ) | | | (0.51 | ) | | | (0.31 | ) |
| | | | | | | | | | | | | | | | | | | | | | | | |
Total decrease from dividends | | | (0.58 | ) | | | (1.49 | ) | | | (1.15 | ) | | | (0.58 | ) | | | (0.62 | ) | | | (0.36 | ) |
| | | | | | | | | | | | | | | | | | | | | | | | |
Net Asset Value, end of period | | $ | 32.34 | | | $ | 32.93 | | | $ | 37.21 | | | $ | 30.83 | | | $ | 29.05 | | | $ | 27.05 | |
| | | | | | | | | | | | | | | | | | | | | | | | |
Total return | | | 0.05 | %(a) | | | (7.97 | )% | | | 24.86 | % | | | 8.19 | % | | | 10.04 | % | | | 7.32 | % |
| Ratios/Supplemental data: | | | | | | | | | | | | | | | | | | | | | | | | |
Net assets, end of period (in 000’s) | | $ | 288,119 | | | $ | 296,605 | | | $ | 323,991 | | | $ | 309,871 | | | $ | 276,487 | | | $ | 247,066 | |
Ratio of expenses to average net assets | | | 1.46 | %(b) | | | 1.46 | % | | | 1.46 | % | | | 1.47 | % | | | 1.48 | % | | | 1.48 | % |
Ratio of net investment income to average net assets | | | 0.18 | %(b) | | | (0.03 | )% | | | 0.07 | % | | | 0.37 | % | | | 0.44 | % | | | 0.25 | % |
Portfolio turnover(c) | | | 4 | %(a) | | | 9 | % | | | 17 | % | | | 25 | % | | | 19 | % | | | 18 | % |
| (c) | Calculated at Fund level. |
GREEN CENTURY BALANCED FUND INSTITUTIONAL CLASS FINANCIAL HIGHLIGHTS
| | | | | | | | | | | | |
| | | FOR THE
SIX MONTHS ENDED
JANUARY 31, 2023 | | | FOR THE
YEARS ENDED
JULY 31, | | | FOR THE PERIOD
NOVEMBER 30 , 2020
(COMMENCEMENT
OF OPERATIONS) TO
JULY 31, | |
| | | (UNAUDITED) | | | 2022 | | | 2021 | |
Net Asset Value, beginning of period | | $ | 33.06 | | | $ | 37.27 | | | $ | 33.58 | |
| | | | | | | | | | | | |
| Income (loss) from investment operations: | | | | | | | | | | | | |
Net investment income | | | 0.07 | | | | 0.08 | | | | 0.08 | |
Net realized and unrealized gain (loss) on investments | | | (0.03 | ) | | | (2.78 | ) | | | 4.78 | |
| | | | | | | | | | | | |
Total increase (decrease) from investment operations | | | 0.04 | | | | (2.70 | ) | | | 4.86 | |
| | | | | | | | | | | | |
| Less dividends: | | | | | | | | | | | | |
Dividends from net investment income | | | (0.08 | ) | | | (0.02 | ) | | | (0.04 | ) |
Distributions from net realized gains | | | (0.54 | ) | | | (1.49 | ) | | | (1.13 | ) |
| | | | | | | | | | | | |
Total decrease from dividends | | | (0.62 | ) | | | (1.51 | ) | | | (1.17 | ) |
| | | | | | | | | | | | |
Net Asset Value, end of period | | $ | 32.48 | | | $ | 33.06 | | | $ | 37.27 | |
| | | | | | | | | | | | |
Total return | | | 0.21 | %(a) | | | (7.72 | )% | | | 14.89 | %(a) |
| Ratios/Supplemental data: | | | | | | | | | | | | |
Net assets, end of period (in 000’s) | | $ | 104,110 | | | $ | 101,317 | | | $ | 86,347 | |
Ratio of expenses to average net assets | | | 1.16 | %(b) | | | 1.16 | % | | | 1.16 | %(b) |
Ratio of net investment income to average net assets . | | | 0.48 | %(b) | | | 0.27 | % | | | 0.33 | %(b) |
Portfolio turnover(c) | | | 4 | %(a) | | | 9 | % | | | 17 | %(a) |
| (c) | Calculated at Fund level. |
See Notes to Financial Statements
31
GREEN CENTURY EQUITY FUND INDIVIDUAL INVESTOR CLASS FINANCIAL HIGHLIGHTS
| | | | | | | | | | | | | | | | | | | | | | | | |
| | | FOR THE
SIX MONTHS ENDED
JANUARY 31, 2023 | | | FOR THE YEARS ENDED JULY 31, | |
| | (UNAUDITED) | | | 2022 | | | 2021 | | | 2020 | | | 2019 | | | 2018 | |
Net Asset Value, beginning of period | | $ | 64.46 | | | $ | 71.35 | | | $ | 52.23 | | | $ | 46.17 | | | $ | 43.16 | | | $ | 38.05 | |
| | | | | | | | | | | | | | | | | | | | | | | | |
| Income from investment operations: | | | | | | | | | | | | | | | | | | | | | | | | |
Net investment income | | | 0.13 | | | | 0.09 | | | | 0.09 | | | | 0.25 | | | | 0.25 | | | | 0.22 | |
Net realized and unrealized gain (loss) on investments | | | (1.16 | ) | | | (6.11 | ) | | | 19.60 | | | | 6.16 | | | | 3.61 | | | | 5.28 | |
| | | | | | | | | | | | | | | | | | | | | | | | |
Total increase (decrease) from investment operations | | | (1.03 | ) | | | (6.02 | ) | | | 19.69 | | | | 6.41 | | | | 3.86 | | | | 5.50 | |
| | | | | | | | | | | | | | | | | | | | | | | | |
| Less dividends: | | | | | | | | | | | | | | | | | | | | | | | | |
Dividends from net investment income | | | (0.11 | ) | | | (0.02 | ) | | | (0.06 | ) | | | (0.22 | ) | | | (0.21 | ) | | | (0.20 | ) |
Distributions from net realized gains | | | (0.16 | ) | | | (0.85 | ) | | | (0.51 | ) | | | (0.13 | ) | | | (0.64 | ) | | | (0.19 | ) |
| | | | | | | | | | | | | | | | | | | | | | | | |
Total decrease from dividends | | | (0.27 | ) | | | (0.87 | ) | | | (0.57 | ) | | | (0.35 | ) | | | (0.85 | ) | | | (0.39 | ) |
| | | | | | | | | | | | | | | | | | | | | | | | |
Net Asset Value, end of period | | $ | 63.16 | | | $ | 64.46 | | | $ | 71.35 | | | $ | 52.23 | | | $ | 46.17 | | | $ | 43.16 | |
| | | | | | | | | | | | | | | | | | | | | | | | |
Total return | | | (1.58 | )%(a) | | | (8.64 | )% | | | 37.90 | % | | | 13.95 | % | | | 9.33 | % | | | 14.52 | % |
| Ratios/Supplemental data: | | | | | | | | | | | | | | | | | | | | | | | | |
Net assets, end of period (in 000’s) | | $ | 285,091 | | | $ | 301,668 | | | $ | 338,094 | | | $ | 265,946 | | | $ | 244,706 | | | $ | 232,609 | |
Ratio of expenses to average net assets | | | 1.25 | %(b) | | | 1.25 | % | | | 1.25 | % | | | 1.25 | % | | | 1.25 | % | | | 1.25 | % |
Ratio of net investment income to average net assets | | | 0.40 | %(b) | | | 0.11 | % | | | 0.14 | % | | | 0.52 | % | | | 0.58 | % | | | 0.53 | % |
Portfolio turnover(c) | | | 3 | %(a) | | | 5 | % | | | 9 | % | �� | | 10 | % | | | 14 | % | | | 18 | % |
| (c) | Calculated at Fund level. |
GREEN CENTURY EQUITY FUND INSTITUTIONAL CLASS FINANCIAL HIGHLIGHTS
| | | | | | | | | | | | | | | | | | | | | | | | |
| | | FOR THE
SIX MONTHS ENDED
JANUARY 31, 2023 | | | FOR THE YEARS ENDED JULY 31, | | | FOR THE PERIOD
APRIL 30 , 2018
(COMMENCEMENT OF
OPERATIONS) TO
JULY 31, | |
| | | (UNAUDITED) | | | 2022 | | | 2021 | | | 2020 | | | 2019 | | | 2018 | |
Net Asset Value, beginning of period | | $ | 64.13 | | | $ | 71.12 | | | $ | 52.10 | | | $ | 46.11 | | | $ | 43.16 | | | $ | 40.86 | |
| | | | | | | | | | | | | | | | | | | | | | | | |
| Income from investment operations: | | | | | | | | | | | | | | | | | | | | | | | | |
Net investment income | | | 0.22 | | | | 0.31 | | | | 0.30 | | | | 0.39 | | | | 0.39 | | | | 0.09 | |
Net realized and unrealized gain (loss) on investments | | | (1.15 | ) | | | (6.13 | ) | | | 19.54 | | | | 6.16 | | | | 3.59 | | | | 2.35 | |
| | | | | | | | | | | | | | | | | | | | | | | | |
Total increase (decrease) from investment operations | | | (0.93 | ) | | | (5.82 | ) | | | 19.84 | | | | 6.55 | | | | 3.98 | | | | 2.44 | |
| | | | | | | | | | | | | | | | | | | | | | | | |
| Less dividends: | | | | | | | | | | | | | | | | | | | | | | | | |
Dividends from net investment income | | | (0.18 | ) | | | (0.32 | ) | | | (0.31 | ) | | | (0.43 | ) | | | (0.39 | ) | | | (0.14 | ) |
Distributions from net realized gains | | | (0.16 | ) | | | (0.85 | ) | | | (0.51 | ) | | | (0.13 | ) | | | (0.64 | ) | | | — | |
| | | | | | | | | | | | | | | | | | | | | | | | |
Total decrease from dividends | | | (0.34 | ) | | | (1.17 | ) | | | (0.82 | ) | | | (0.56 | ) | | | (1.03 | ) | | | (0.14 | ) |
| | | | | | | | | | | | | | | | | | | | | | | | |
Net Asset Value, end of period | | $ | 62.86 | | | $ | 64.13 | | | $ | 71.12 | | | $ | 52.10 | | | $ | 46.11 | | | $ | 43.16 | |
| | | | | | | | | | | | | | | | | | | | | | | | |
Total return | | | (1.41 | )%(a) | | | (8.38 | )% | | | 38.33 | % | | | 14.28 | % | | | 9.65 | % | | | 6.50 | %(a) |
| Ratios/Supplemental data: | | | | | | | | | | | | | | | | | | | | | | | | |
Net assets, end of period (in 000’s) | | $ | 218,828 | | | $ | 213,705 | | | $ | 178,038 | | | $ | 94,039 | | | $ | 54,850 | | | $ | 29,978 | |
Ratio of expenses to average net assets | | | 0.95 | %(b) | | | 0.95 | % | | | 0.95 | % | | | 0.95 | % | | | 0.95 | % | | | 0.95 | %(b) |
Ratio of net investment income to average net assets | | | 0.70 | %(b) | | | 0.41 | % | | | 0.44 | % | | | 0.82 | % | | | 0.88 | % | | | 0.83 | %(b) |
Portfolio turnover(c) | | | 3 | %(a) | | | 5 | % | | | 9 | % | | | 10 | % | | | 14 | % | | | 18 | %(a) |
| (c) | Calculated at Fund level. |
See Notes to Financial Statements
32
GREEN CENTURY MSCI INTERNATIONAL INDEX FUND INDIVIDUAL INVESTOR CLASS FINANCIAL HIGHLIGHTS
| | | | | | | | | | | | | | | | | | | | | | | | |
| | | FOR THE
SIX MONTHS ENDED
JANUARY 31, 2023 | | | FOR THE YEARS ENDED JULY 31, | |
| | (UNAUDITED) | | | 2022 | | | 2021 | | | 2020 | | | 2019 | | | 2018 | |
Net Asset Value, beginning of period | | $ | 11.82 | | | $ | 14.94 | | | $ | 11.68 | | | $ | 11.07 | | | $ | 11.50 | | | $ | 11.31 | |
| | | | | | | | | | | | | | | | | | | | | | | | |
| Income (loss) from investment operations: | | | | | | | | | | | | | | | | | | | | | | | | |
Net investment income | | | 0.02 | | | | 0.19 | | | | 0.09 | | | | 0.10 | | | | 0.18 | | | | 0.17 | |
Net realized and unrealized gain (loss) on investments | | | 0.80 | | | | (2.87 | ) | | | 3.27 | | | | 0.59 | | | | (0.40 | ) | | | 0.24 | |
| | | | | | | | | | | | | | | | | | | | | | | | |
Total increase (decrease) from investment operations | | | 0.82 | | | | (2.68 | ) | | | 3.36 | | | | 0.69 | | | | (0.22 | ) | | | 0.41 | |
| | | | | | | | | | | | | | | | | | | | | | | | |
| Less dividends: | | | | | | | | | | | | | | | | | | | | | | | | |
Dividends from net investment income | | | (0.02 | ) | | | (0.18 | ) | | | (0.10 | ) | | | (0.08 | ) | | | (0.16 | ) | | | (0.19 | ) |
Distributions from net realized gains | | | — | | | | (0.26 | ) | | | — | | | | — | | | | (0.05 | ) | | | (0.03 | ) |
| | | | | | | | | | | | | | | | | | | | | | | | |
Total decrease from dividends | | | (0.02 | ) | | | (0.44 | ) | | | (0.10 | ) | | | (0.08 | ) | | | (0.21 | ) | | | (0.22 | ) |
| | | | | | | | | | | | | | | | | | | | | | | | |
Net Asset Value, end of period | | $ | 12.62 | | | $ | 11.82 | | | $ | 14.94 | | | $ | 11.68 | | | $ | 11.07 | | | $ | 11.50 | |
| | | | | | | | | | | | | | | | | | | | | | | | |
Total return | | | 6.97 | %(a) | | | (18.36 | )% | | | 28.76 | % | | | 6.28 | % | | | (1.82 | )% | | | 3.62 | % |
| Ratios/Supplemental data: | | | | | | | | | | | | | | | | | | | | | | | | |
Net assets, end of period (in 000’s) | | $ | 51,249 | | | $ | 47,435 | | | $ | 46,508 | | | $ | 29,073 | | | $ | 22,110 | | | $ | 18,744 | |
Ratio of expenses to average net assets | | | 1.28 | %(b) | | | 1.28 | % | | | 1.28 | % | | | 1.28 | % | | | 1.28 | % | | | 1.28 | % |
Ratio of net investment income to average net assets | | | 0.33 | %(b) | | | 1.55 | % | | | 0.77 | % | | | 0.98 | % | | | 1.79 | % | | | 1.71 | % |
Portfolio turnover(c) | | | 8 | %(a) | | | 29 | % | | | 31 | % | | | 20 | % | | | 23 | % | | | 28 | % |
| (c) | Calculated at Fund level. |
GREEN CENTURY MSCI INTERNATIONAL INDEX FUND INSTITUTIONAL CLASS FINANCIAL HIGHLIGHTS
| | | | | | | | | | | | | | | | | | | | | | | | |
| | | FOR THE
SIX MONTHS ENDED
JANUARY 31, 2023 | | | FOR THE YEARS ENDED JULY 31, | |
| | (UNAUDITED) | | | 2022 | | | 2021 | | | 2020 | | | 2019 | | | 2018 | |
Net Asset Value, beginning of period | | $ | 11.78 | | | $ | 14.90 | | | $ | 11.66 | | | $ | 11.07 | | | $ | 11.50 | | | $ | 11.31 | |
| | | | | | | | | | | | | | | | | | | | | | | | |
| Income (loss) from investment operations: | | | | | | | | | | | | | | | | | | | | | | | | |
Net investment income | | | 0.04 | | | | 0.24 | | | | 0.13 | | | | 0.13 | | | | 0.21 | | | | 0.21 | |
Net realized and unrealized gain (loss) on investments | | | 0.80 | | | | (2.86 | ) | | | 3.26 | | | | 0.59 | | | | (0.38 | ) | | | 0.23 | |
| | | | | | | | | | | | | | | | | | | | | | | | |
Total increase (decrease) from investment operations | | | 0.84 | | | | (2.62 | ) | | | 3.39 | | | | 0.72 | | | | (0.17 | ) | | | 0.44 | |
| | | | | | | | | | | | | | | | | | | | | | | | |
| Less dividends: | | | | | | | | | | | | | | | | | | | | | | | | |
Dividends from net investment income | | | (0.04 | ) | | | (0.24 | ) | | | (0.15 | ) | | | (0.13 | ) | | | (0.21 | ) | | | (0.22 | ) |
Distributions from net realized gains | | | — | | | | (0.26 | ) | | | — | | | | — | | | | (0.05 | ) | | | (0.03 | ) |
| | | | | | | | | | | | | | | | | | | | | | | | |
Total decrease from dividends | | | (0.04 | ) | | | (0.50 | ) | | | (0.15 | ) | | | (0.13 | ) | | | (0.26 | ) | | | (0.25 | ) |
| | | | | | | | | | | | | | | | | | | | | | | | |
Net Asset Value, end of period | | $ | 12.58 | | | $ | 11.78 | | | $ | 14.90 | | | $ | 11.66 | | | $ | 11.07 | | | $ | 11.50 | |
| | | | | | | | | | | | | | | | | | | | | | | | |
Total return | | | 7.12 | %(a) | | | (18.05 | )% | | | 29.09 | % | | | 6.51 | % | | | (1.43 | )% | | | 3.90 | % |
| Ratios/Supplemental data: | | | | | | | | | | | | | | | | | | | | | | | | |
Net assets, end of period (in 000’s) | | $ | 129,866 | | | $ | 115,620 | | | $ | 112,002 | | | $ | 61,608 | | | $ | 42,012 | | | $ | 31,808 | |
Ratio of expenses to average net assets | | | 0.98 | %(b) | | | 0.98 | % | | | 0.98 | % | | | 0.98 | % | | | 0.98 | % | | | 0.98 | % |
Ratio of net investment income to average net assets | | | 0.63 | %(b) | | | 1.85 | % | | | 1.07 | % | | | 1.28 | % | | | 2.09 | % | | | 2.01 | % |
Portfolio turnover(c) | | | 8 | %(a) | | | 29 | % | | | 31 | % | | | 20 | % | | | 23 | % | | | 28 | % |
| (c) | Calculated at Fund level |
See Notes to Financial Statements
33
| | |
GREEN CENTURY FUNDS NOTES TO FINANCIAL STATEMENTS (unaudited) | | |
NOTE 1 — Organization and Significant Accounting Policies
Green Century Funds (the “Trust”) is a Massachusetts business trust which offers three separate series, the Green Century Balanced Fund (the “Balanced Fund”), the Green Century Equity Fund (the “Equity Fund”) and the Green Century MSCI International Index Fund (the “MSCI International Index Fund”), each a “Fund” and collectively, the “Funds”. The Trust is registered under the Investment Company Act of 1940, as amended (the “Act”), as an open-end, diversified management investment company. The Trust accounts separately for the assets, liabilities and operations of each series. The Balanced Fund Investor Share Class commenced operations on March 18, 1992, the Balanced Fund Institutional Share Class commenced operations on November 30, 2020, the Equity Fund Individual Investor Share Class commenced operations on September 13, 1995, the Equity Fund Institutional Share Class commenced operations on April 30, 2018, and the Individual Investor Share Class and Institutional Share Class of the MSCI International Index Fund commenced operations on September 30, 2016.
The preparation of financial statements in conformity with U.S. generally accepted accounting principles (“U.S. GAAP”) requires management to make estimates and assumptions that affect the reported amounts of assets and liabilities and disclosure of contingent assets and liabilities at the date of the financial statements and the reported amounts of revenues and expenses during the reporting period. Actual results could differ from those estimates.
Each Fund is an investment company and accordingly follows the investment company accounting and reporting guidance of the Financial Accounting Standards Board (the “FASB”) Accounting Standard Codification Topic 946 “Financial Services—Investment Companies”.
The following is a summary of the Funds’ significant accounting policies:
| | (A) | Investment Valuation: Equity securities listed on U.S. national securities exchanges other than NASDAQ are valued at last sale price. If a last sale price is not available, securities listed on U.S. national exchanges other than NASDAQ are valued at the mean between the closing bid and closing ask prices. NASDAQ National Market® and SmallCapSM securities are valued at the NASDAQ Official Closing Price (“NOCP”). The NOCP is based on the last traded price if it falls within the concurrent best bid and ask prices and is normalized pursuant to NASDAQ’s published procedures if it falls outside this range. If a NOCP is not available for any such security, the security is valued at the last sale price, or, if there have been no sales that day, at the mean between the closing bid and closing ask prices. Unlisted U.S. equity securities are valued at last sale price, or when last sale prices are not available, at the last quoted bid price. Debt securities (other than certificates of deposit and short-term obligations maturing in sixty days or less) are valued on the basis of valuations furnished by an independent pricing service which takes into account appropriate factors such as institution-size trading in similar groups of securities, yield, quality, coupon rate, maturity, type of issue, and other market data, without exclusive reliance on quoted prices or exchange or over-the-counter prices. Certificates of deposit are valued at cost plus accrued interest, and short-term obligations maturing in sixty days or less are valued at amortized cost, both of which approximate market value. Securities, if any, for which there are no such valuations or quotations available, or for which the market quotation or valuation provided by a pricing service is deemed not reliable, are valued at fair value by management as determined in good faith under guidelines established by the Trustees. Effective September 8, 2022, pursuant to Rule 2a-5 under the 1940 Act, the Board of Trustees has designated Green Century Capital Management, Inc. (“GCCM”) as a valuation designee (the “Valuation Designee”) to determine the fair value, in good faith, of securities and other instruments for which no readily available market quotation exists. As Valuation Designee, GCCM is |
34
| | |
GREEN CENTURY FUNDS NOTES TO FINANCIAL STATEMENTS (unaudited) | | continued |
| | responsible for the supervision and implementation of the valuation process with respect to the Funds. GCCM will, among other things, (1) assess and manage material risks associated with fair value determinations; (2) select, apply and test fair value methodologies; and (3) oversee and evaluate pricing services used. |
For non-U.S. securities traded in foreign markets, the MSCI International Index Fund uses a fair value model developed by an independent pricing service to assist in valuing those securities. If an event occurs after the time at which the market for foreign securities held by the Fund closes but before the time that the Fund’s next NAV is calculated, such event may cause the closing price on the foreign exchange to not represent the readily available reliable market value quotation for such securities at the time the Fund determines its NAV. In such a case, the Fund will use the fair value of such securities as determined under the Fund’s valuation procedures. Events after the close of trading on a foreign market that could require a Fund to fair value some or all of its foreign securities include, among others, securities trading in the U.S. and other markets, corporate announcements, natural and other disasters, and political and other events. Among other elements of analysis in the determination of a security’s fair value, the Board has authorized the use of one or more independent research services to assist with such determinations. An independent research service may use statistical analyses and quantitative models to help determine fair value as of the time the Fund calculates its NAV. There can be no assurance that such models accurately reflect the behavior of the applicable markets or the effect of the behavior of such markets on the fair value of securities, or that such markets will continue to behave in a fashion that is consistent with such models. Unlike the closing price of a security on an exchange, fair value determinations employ elements of judgment. Consequently, the fair value assigned to a security may not represent the actual value that the Fund could obtain if it were to sell the security at the time of the close of the NYSE. Pursuant to procedures adopted by the Board, the Fund is not obligated to use the fair valuations suggested by any research service, and valuation recommendations provided by such research services may be overridden if other events have occurred or if other fair valuations are determined in good faith to be more accurate. Unless an event is such that it causes the Fund to determine that the closing prices for one or more securities do not represent readily available reliable market value quotations at the time the Fund determines its NAV, events that occur between the time of the close of the foreign market on which they are traded and the close of regular trading on the NYSE will not be reflected in the Fund’s NAV.
Various inputs are used in determining the value of the Fund’s investments. These inputs are summarized in the three broad levels listed below:
Level 1 — quoted prices for active markets for identical securities. An active market for the security is a market in which transactions occur with sufficient frequency and volume to provide pricing information on an ongoing basis. A quoted price in an active market provides the most reliable evidence of fair value.
Level 2 — other significant observable inputs (including quoted prices for similar securities, interest rates, prepayment speeds, credit risk, etc.). Examples of level 2 inputs include 1) quoted prices for identical or similar assets in markets that are not active 2) investments valued at amortized cost and 3) investments valued with inputs that are derived principally from or corroborated by observable market data. An adjustment to any observable input that is significant to the fair value may render the measurement a Level 3 measurement.
Level 3 — significant unobservable inputs, including the Funds’ own assumptions in determining the fair value of investments.
In some cases, the inputs used to measure the fair value of an asset or a liability might be categorized within different levels of the fair value hierarchy. In those cases, the fair value measurement is categorized in its entirety in the same level of the fair value hierarchy as the lowest level input that is significant to the entire
35
| | |
GREEN CENTURY FUNDS NOTES TO FINANCIAL STATEMENTS (unaudited) | | continued |
measurement. The inputs or methodology used for valuing securities are not necessarily an indication of the risk associated with investing in those securities.
The following is a summary of the inputs used to value the Balanced Fund’s net assets as of January 31, 2023:
| | | | | | | | | | | | | | | | |
| | | LEVEL 1 | | | LEVEL 2 | | | LEVEL 3 | | | TOTAL | |
COMMON STOCKS | | | $251,686,097 | | | | $ — | | | | $ — | | | | $251,686,097 | |
| BONDS & NOTES | | | | | | | | | | | | | | | | |
GREEN & SUSTAINABILITY BONDS | | | — | | | | 82,874,239 | | | | 1,781,720 | | | | 84,655,959 | |
COMMUNITY DEVELOPMENT FINANCIAL INSTITUTIONS | | | — | | | | 9,236,896 | | | | — | | | | 9,236,896 | |
U.S. GOVERNMENT AGENCIES | | | — | | | | 9,072,612 | | | | — | | | | 9,072,612 | |
SOFTWARE & SERVICES | | | — | | | | 6,349,376 | | | | — | | | | 6,349,376 | |
MUNICIPAL | | | — | | | | 3,954,760 | | | | — | | | | 3,954,760 | |
REAL ESTATE | | | — | | | | 3,406,820 | | | | — | | | | 3,406,820 | |
CAPITAL GOODS | | | — | | | | 3,327,142 | | | | — | | | | 3,327,142 | |
MEDIA & ENTERTAINMENT | | | — | | | | 3,255,098 | | | | — | | | | 3,255,098 | |
DIVERSIFIED FINANCIALS | | | — | | | | 1,989,770 | | | | — | | | | 1,989,770 | |
INSURANCE | | | — | | | | 1,095,369 | | | | — | | | | 1,095,369 | |
HEALTHY LIVING | | | — | | | | 505,827 | | | | — | | | | 505,827 | |
| | | | | | | | | | | | | | | | |
TOTAL BONDS & NOTES | | | — | | | | 125,067,909 | | | | 1,781,720 | | | | 126,849,629 | |
| | | | | | | | | | | | | | | | |
SHORT-TERM OBLIGATIONS | | | 12,979,209 | | | | — | | | | — | | | | 12,979,209 | |
| | | | | | | | | | | | | | | | |
TOTAL | | | $264,665,306 | | | | $125,067,909 | | | | $1,781,720 | | | | $391,514,935 | |
| | | | | | | | | | | | | | | | |
The following is a summary of the inputs used to value the Equity Fund’s net assets as of January 31, 2023:
| | | | | | | | | | | | | | | | |
| | | LEVEL 1 | | | LEVEL 2 | | | LEVEL 3 | | | TOTAL | |
COMMON STOCKS | | | $502,652,629 | | | | $ — | | | | $ — | | | | $502,652,629 | |
SHORT-TERM OBLIGATIONS | | | 846,167 | | | | — | | | | — | | | | 846,167 | |
| | | | | | | | | | | | | | | | |
TOTAL | | | $503,498,796 | | | | $ — | | | | $ — | | | | $503,498,796 | |
| | | | | | | | | | | | | | | | |
36
| | |
GREEN CENTURY FUNDS NOTES TO FINANCIAL STATEMENTS (unaudited) | | continued |
The following is a summary of the inputs used to value the MSCI International Index Fund’s net assets as of January 31, 2023:
| | | | | | | | | | | | | | | | |
| | | LEVEL 1 | | | LEVEL 2 | | | LEVEL 3 | | | TOTAL | |
| COMMON STOCKS | | | | | | | | | | | | | | | | |
JAPAN | | | $ — | | | | $34,416,721 | | | | $ — | | | | $34,416,721 | |
FRANCE | | | — | | | | 19,509,887 | | | | — | | | | 19,509,887 | |
CANADA | | | 19,007,921 | | | | — | | | | — | | | | 19,007,921 | |
UNITED KINGDOM | | | 485,066 | | | | 17,519,558 | | | | — | | | | 18,004,624 | |
NETHERLANDS | | | — | | | | 16,509,099 | | | | — | | | | 16,509,099 | |
SWITZERLAND | | | — | | | | 14,979,389 | | | | — | | | | 14,979,389 | |
DENMARK | | | — | | | | 13,699,120 | | | | — | | | | 13,699,120 | |
AUSTRALIA | | | — | | | | 10,075,209 | | | | — | | | | 10,075,209 | |
GERMANY | | | — | | | | 9,237,351 | | | | — | | | | 9,237,351 | |
HONG KONG | | | — | | | | 7,417,093 | | | | — | | | | 7,417,093 | |
SPAIN | | | — | | | | 3,229,369 | | | | — | | | | 3,229,369 | |
IRELAND | | | — | | | | 2,529,002 | | | | — | | | | 2,529,002 | |
ITALY | | | — | | | | 2,413,390 | | | | — | | | | 2,413,390 | |
SWEDEN | | | — | | | | 2,313,503 | | | | — | | | | 2,313,503 | |
SINGAPORE | | | — | | | | 1,563,856 | | | | — | | | | 1,563,856 | |
FINLAND | | | — | | | | 1,368,458 | | | | — | | | | 1,368,458 | |
BELGIUM | | | — | | | | 1,311,435 | | | | — | | | | 1,311,435 | |
NORWAY | | | — | | | | 1,277,148 | | | | — | | | | 1,277,148 | |
ISRAEL | | | — | | | | 568,811 | | | | — | | | | 568,811 | |
NEW ZEALAND | | | — | | | | 184,902 | | | | — | | | | 184,902 | |
| | | | | | | | | | | | | | | | |
TOTAL COMMON STOCKS | | | 19,492,987 | | | | 160,123,301 | | | | — | | | | 179,616,288 | |
| | | | | | | | | | | | | | | | |
SHORT-TERM OBLIGATIONS | | | 507,201 | | | | — | | | | — | | | | 507,201 | |
| | | | | | | | | | | | | | | | |
TOTAL | | | $20,000,188 | | | | $160,123,301 | | | | $ — | | | | $180,123,489 | |
| | | | | | | | | | | | | | | | |
There were no transfers into or out of Level 3 during the reporting period for the Equity Fund and the MSCI International Index Fund.
37
| | |
GREEN CENTURY FUNDS NOTES TO FINANCIAL STATEMENTS (unaudited) | | continued |
The following is a reconciliation of assets for the Balanced Fund in which significant unobservable inputs (Level 3) were used in determining value:
| | | | |
| | | BALANCED FUND
BONDS & NOTES | |
Balance as of July 31, 2022 | | $ | — | |
Transfers into Level 3(1) | | | 1,795,510 | |
Transfers out of Level 3 | | | — | |
Total gains or losses for the period | | | | |
Included in earnings (or changes in net assets) | | | — | |
Included in other comprehensive income | | | — | |
Net purchases | | | — | |
Net sales | | | — | |
| | | | |
Balance as of January 31, 2023 | | $ | 1,781,720 | |
| | | | |
Change in unrealized gains or losses for the period included in earnings (or changes in net assets) for assets held at the end of the reporting period | | $ | (13,790 | ) |
| | | | |
(1) Transferred from Level 2 to Level 3 because of a lack of observable market data, resulting from a decrease in market activity for the security.
The following table presents additional quantitative information about valuation methodologies and inputs used for investments that are measured at fair value and categorized within Level 3 as of January 31, 2023:
| | | | | | | | | | | | | | | | | | |
ASSET CLASS | | FAIR VALUE AT
1/31/2023 | | | VALUATION
TECHNIQUE(S) | | | UNOBSERVABLE INPUT | | RANGE OF
INPUT | | | IMPACT TO
VALUATION FROM
AN INCREASE IN
INPUT(1) | |
Bonds & Notes | | | $1,781,720 | | | | Fair Value | | | Price of Comparable
Bond/Discount for
Liquidity/Marketability | | | 88.54-89.60 | | | | Increase | |
(1) This column represents the directional change in the fair value of the Level 3 investments that would result from an increase to the corresponding unobservable input. A decrease to the unobservable input would have the opposite effect.
| | (B) | Securities Transactions and Investment Income: Securities transactions are recorded on a trade date basis. Realized gains and losses from securities transactions are determined using the identified cost basis. Interest income, including amortization of premiums and accretion of discounts on bonds, is recognized on the accrual basis and dividend income is recorded on ex-dividend date. Income, expenses and realized and unrealized gains and losses on investments are allocated to each class of shares in proportion to their relative shares outstanding. |
| | (C) | Currency Translation and Contracts: Securities and other assets and liabilities denominated in foreign currencies are translated into U.S. dollar amounts on the date of valuation. Purchases and sales of securities, and income and expense items denominated in foreign currencies, are translated into U.S. dollar amounts on the respective dates of such transactions. Occasionally, events impact the availability or reliability of foreign |
38
| | |
GREEN CENTURY FUNDS NOTES TO FINANCIAL STATEMENTS (unaudited) | | continued |
| | exchange rates used to convert the U.S. dollar equivalent value. If such an event occurs, the foreign exchange rate will be valued at fair value using procedures established and approved by the Board of Trustees. The Funds do not separately report the effect of fluctuations in foreign exchange rates from changes in market prices on securities held. Such fluctuations are included with the net realized and unrealized gain or loss from investments. Realized foreign exchange gains or losses arise from sales of foreign currencies, currency gains or losses realized between the trade and settlement dates on securities transactions, and the difference between the recorded amounts of dividends, interest, and foreign withholding taxes and the U.S. dollar equivalent of the amounts actually received or paid. Net unrealized foreign exchange gains and losses arise from changes in fair value of assets and liabilities other than investments in securities held at the end of the reporting period, resulting from changes in exchange rates. When a Fund purchases or sells foreign securities, it enters into foreign exchange contracts to minimize foreign exchange risk from the trade date to the settlement date of the transactions. A foreign exchange contract is an agreement between two parties to exchange different currencies at an agreed-upon exchange rate on a specified date. The MSCI International Index Fund had no open foreign currency spot contracts outstanding as of January 31, 2023. |
Cash, including cash denominated in foreign currencies, represents cash on hand held at major financial institutions and is subject to credit risk to the extent the balance exceeds applicable Federal Deposit Insurance Corporation (FDIC) or Securities Investor Protection Corporation (SIPC) limitations.
| | (D) | Distributions: Distributions to shareholders are recorded on the ex-dividend date. The Funds declare and pay dividends of net investment income, if any, semi-annually and distribute net realized capital gains, if any, annually. The amount and character of income and net realized gains to be distributed are determined in accordance with Federal income tax rules and regulations, which may differ from U.S. GAAP. To the extent that these differences are attributable to permanent book and tax accounting differences, the components of net assets have been adjusted. |
| | (E) | Federal Taxes: Each series of the Trust is treated as a separate entity for Federal income tax purposes. Each Fund’s policy is to comply with the provisions of the Internal Revenue Code applicable to regulated investment companies (“RICs”). Accordingly, no provisions for Federal income or excise tax are necessary. |
U.S. GAAP requires that all entities, including pass-through entities such as the Funds, establish a minimum threshold for financial statement recognition of the benefit of positions taken in filing tax returns (including whether an entity is taxable in a particular jurisdiction). The Funds recognize tax benefits only if it is more likely than not that a tax position (including the Funds’ assertion that their income is exempt from tax) will be sustained upon examination. The Funds had no material uncertain tax positions and have not recorded a liability for unrecognized tax benefits as of January 31, 2023. Also, the Funds had recognized no interest and penalties related to uncertain tax benefits through January 31, 2023. At January 31, 2023, the tax years 2019 through 2022 remain open to examination by the Internal Revenue Service.
| | (F) | Redemption Fee: A 2.00% redemption fee is retained by the Funds to offset the effect of transaction costs and other expenses associated with short-term investing. The fee is imposed on redemptions or exchanges of shares held 60 days or less from their purchase date. For the six months ended January 31, 2023, the Balanced Fund, Equity Fund and MSCI International Index Fund received $2,662, $2,177, and $6,892 respectively, in redemption fees. Redemption fees are recorded as an adjustment to paid-in capital. |
| | (G) | Indemnification: The Funds’ organizational documents provide that trustees and officers are indemnified against certain liabilities arising out of the performance of their duties to the Funds. In the normal course of business, the Funds may also enter into contracts that provide general indemnifications. The Funds’ maximum exposure under these arrangements is unknown as this would be dependent on future claims that may be |
39
| | |
GREEN CENTURY FUNDS NOTES TO FINANCIAL STATEMENTS (unaudited) | | continued |
| | made against the Funds. The risk of material loss from such claims is considered remote. As of January 31, 2023, no liability has been accrued. |
| | (H) | Offsetting of Assets and Liabilities: As of January 31, 2023, there are no master netting arrangements related to the Funds. The Funds’ Statements of Assets and Liabilities present derivative instruments on a gross basis, if applicable. As of January 31, 2023, no derivative instruments were held by the Funds. |
NOTE 2 — Transactions With Affiliates
| | (A) | Investment Adviser: Green Century Capital Management, Inc. (“Green Century”) is the adviser (“the Adviser”) for the Funds. Green Century is owned by Paradigm Partners. Green Century oversees the portfolio management of the Funds on a day-to-day basis. Green Century’s investment advisory fee with respect to the Fund shall be equal on an annual basis to 0.65% of the average daily net assets of the Fund up to $250 million and 0.60% of the value of the average daily net assets of the Fund in excess of $250 million, accrued daily and paid monthly. The Equity Fund pays Green Century a fee, accrued daily and paid monthly, at an annual rate of 0.25% of the Equity Fund’s average daily net assets up to but not including $100 million, 0.22% of average daily net assets including $100 million up to but not including $500 million, 0.17% of average daily net assets including $500 million up to but not including $1 billion and 0.12% of average daily net assets equal to or in excess of $1 billion. The MSCI International Index Fund pays Green Century a fee, accrued daily and paid monthly, at an annual rate of 0.28% of the MSCI International Index Fund’s average daily net assets. |
| | (B) | Subadvisers: Trillium Asset Management, LLC (“Trillium”) is the subadviser for the Balanced Fund. Trillium’s investment subadvisory fee with respect to the Fund shall be equal on an annual basis to 0.40% of the value of the average daily net assets of the Fund up to $30 million, 0.35% of the value of the average daily net assets of the Fund in excess of $30 million up to $250 million, and 0.30% of the value of the average daily net assets of the Fund in excess of $250 million. For the six months ended January 31, 2023, Green Century accrued fees of $648,136 to Trillium. Northern Trust Investments, Inc. (“Northern Trust”) is the subadviser for the Equity Fund and MSCI International Index Fund. For the Equity Fund, Northern Trust is paid a fee by the Adviser based on Northern Trust’s fee schedule of the greater of $75,000 or 0.10% of the value of the average daily net assets of the Fund up to but not including $50 million, 0.05% of the average daily net assets of the Fund from and including $50 million up to but not including $100 million and 0.03% of the average daily net assets of the Fund equal to or in excess of $100 million for its services. For the MSCI International Index Fund, Northern Trust is paid a fee by the Adviser based on Northern Trust’s fee schedule of the greater of $100,000 or 0.17% of the value of the average daily net assets of the Fund up to but not including $50 million, 0.12% of the average daily net assets of the Fund from and including $50 million up to but not including $100 million and 0.08% of the average daily net assets of the Fund equal to or in excess of $100 million for its services. For the six months ended January 31, 2023, Green Century accrued fees of $95,969 and $98,083 to Northern Trust for the Equity Fund and the MSCI International Index Fund, respectively. |
| | (C) | Administrator: Green Century is the administrator (“the Administrator”) of the Green Century Funds. Pursuant to the Administrative Services Agreement, Green Century pays all the expenses of each Fund other than the investment advisory fees; interest; taxes; brokerage costs and other capital expenses; expenses of non-interested trustees (including counsel fees) and any extraordinary expenses. The Balanced Fund pays Green Century a fee at a rate such that immediately following any payment to the Administrator, the total operating expenses of the Fund, on an annual basis, do not exceed 1.48% of the Fund’s Individual Investor Class average daily net assets up to and including $250 million and 1.43% of the Fund’s Individual Investor Class average daily net assets in excess of $250 million, and 1.18% of the Fund’s Institutional Class average |
40
| | |
GREEN CENTURY FUNDS NOTES TO FINANCIAL STATEMENTS (unaudited) | | continued |
| | daily net assets up to and including $250 million and 1.13% of the Fund’s Institutional Class average daily net assets in excess of $250 million. The Equity Fund pays Green Century a fee at a rate such that immediately following any payment to the Administrator, the total operating expenses of the Fund, on an annual basis, do not exceed 1.25% of the Fund’s Individual Investor Class average daily net assets, and 0.95% of the Fund’s Institutional Class average daily net assets. The MSCI International Index Fund pays Green Century a fee at a rate such that immediately following any payment to the Administrator, the total operating expenses of the Fund, on an annual basis, do not exceed 1.28% of the Fund’s Individual Investor Class average daily net assets, and 0.98% of the Fund’s Institutional Class average daily net assets. |
| | (D) | Subadministrator: Pursuant to a Subadministrative and Fund Accounting Services Agreement with the Administrator, UMB Fund Services, Inc. (“UMBFS”) as Subadministrator and Fund Accountant, is responsible for conducting fund accounting and certain day-to-day administration of the Trust subject to the supervision and direction of the Administrator. For the six months ended January 31, 2023, Green Century accrued fees of $126,649, $152,528, and $67,869 to UMBFS related to services performed on behalf of the Balanced Fund, the Equity Fund, and the MSCI International Index Fund, respectively. |
| | (E) | Index Agreements: The Equity Fund invests in the securities of the companies included in the MSCI KLD 400 Social ex Fossil Fuels Index (the “KLD Index”). The Index is owned and maintained by MSCI ESG Research (“MSCI”). For the use of the KLD Index for the Equity Fund, MSCI is paid by the Adviser an annual license fee of $27,370, plus the greater of $26,000 or at an annual rate of 0.05% on the first $100 million of average daily net assets, 0.04% on the next $100 million of average daily net assets, and 0.03% on average daily net assets in excess of $200 million. The MSCI International Index Fund invests in the securities included in the MSCI World ex USA SRI ex Fossil Fuels Index (the “World Index”). The Index is owned and maintained by MSCI. For the use of the World Index for the MSCI International Index Fund, MSCI is paid by the Adviser an annual license fee of $27,820, plus the greater of $25,000 or at an annual rate of 0.05% on the first $100 million of average daily net assets, 0.04% on the next $100 million of average daily net assets, and 0.03% on average daily net assets in excess of $200 million. For the six months ended January 31, 2023, Green Century accrued fees of $102,204 and $51,723 to MSCI for the Equity Fund and MSCI International Index Fund, respectively. |
NOTE 3 — Investment Transactions
For the six months ended January 31, 2023, the Balanced Fund’s cost of purchases and proceeds from sales of securities, other than short-term securities, aggregated $16,503,285 and $27,873,152 respectively. The Equity Fund’s cost of purchases and proceeds from sales of securities, other than short-term securities, aggregated $15,300,475 and $16,154,395, respectively. The MSCI International Index Fund’s cost of purchases and proceeds from sales of securities, other than short-term securities, aggregated $18,398,256 and $12,145,203, respectively.
41
| | |
GREEN CENTURY FUNDS NOTES TO FINANCIAL STATEMENTS (unaudited) | | continued |
NOTE 4 — Federal Income Tax Information
The tax basis of the components of distributable net earnings (deficit) at July 31, 2022 were as follows:
| | | | | | | | | | | | |
| | | BALANCED FUND | | | EQUITY FUND | | | MSCI INTERNATIONAL
INDEX FUND | |
Undistributed ordinary income | | $ | — | | | $ | 38,797 | | | $ | — | |
Undistributed long-term capital gains | | | 5,708,503 | | | | 1,290,374 | | | | — | |
| | | | | | | | | | | | |
Tax accumulated earnings | | | 5,708,503 | | | | 1,329,171 | | | | — | |
| | | | | | | | | | | | |
Accumulated capital and other losses | | | — | | | | — | | | | (2,799,944 | ) |
Unrealized appreciation (depreciation) | | | 99,063,336 | | | | 232,917,614 | | | | (1,956,491 | ) |
Foreign currency translations | | | — | | | | — | | | | (28,146 | ) |
| | | | | | | | | | | | |
Distributable net earnings (deficit) | | $ | 104,771,839 | | | $ | 234,246,785 | | | $ | (4,784,581 | ) |
| | | | | | | | | | | | |
Losses incurred after October 31 (“post-October” losses) within the taxable year are deemed to arise on the first day of the Fund’s next taxable year. As of July 31, 2022, the MSCI International Index had $2,799,944 of post-October capital losses which are deferred until August 1, 2022 for tax purposes.
The tax character of distributions paid during the fiscal year ended July 31, 2022 and the year ended July 31, 2021 were as follows:
| | | | | | | | | | | | | | | | |
| | | BALANCED FUND | | | EQUITY FUND | |
| | | YEAR ENDED
JULY 31, 2022 | | | YEAR ENDED
JULY 31, 2021 | | | YEAR ENDED
JULY 31, 2022 | | | YEAR ENDED
JULY 31, 2021 | |
Ordinary income | | $ | 2,224,717 | | | $ | 670,021 | | | $ | 1,971,818 | | | $ | 1,620,123 | |
Long-term capital gains | | | 14,741,440 | | | | 11,202,683 | | | | 5,344,361 | | | | 2,863,736 | |
| | | |
| | | MSCI INTERNATIONAL INDEX FUND | | | | | | | |
| | | YEAR ENDED
JULY 31, 2022 | | | YEAR ENDED
JULY 31, 2021 | | | | | | | |
Ordinary income | | $ | 3,753,140 | | | $ | 1,385,789 | | | | | | | | | |
Long-term capital gains | | | 1,977,811 | | | | — | | | | | | | | | |
42
| | |
GREEN CENTURY FUNDS NOTES TO FINANCIAL STATEMENTS (unaudited) | | continued |
NOTE 5 — Capital Share Transactions
Capital Share transactions for the Balanced Fund, the Equity Fund and the MSCI International Index Fund were as follows:
| | | | | | | | |
| | | BALANCED FUND
INDIVIDUAL INVESTOR CLASS | | | BALANCED FUND
INDIVIDUAL INVESTOR CLASS | |
| | | SIX MONTHS ENDED
JANUARY 31, 2023 | | | YEAR ENDED
JULY 31, 2022 | |
Shares sold | | | 324,619 | | | | 1,261,887 | |
Reinvestment of dividends | | | 159,817 | | | | 336,823 | |
Shares redeemed | | | (582,139 | ) | | | (1,297,432 | ) |
| | | | | | | | |
| | | (97,703 | ) | | | 301,278 | |
| | | | | | | | |
| | |
| | | BALANCED FUND
INSTITUTIONAL CLASS | | | BALANCED FUND
INSTITUTIONAL CLASS | |
| | | SIX MONTHS ENDED
JANUARY 31, 2023 | | | YEAR ENDED
JULY 31, 2022 | |
Shares sold | | | 311,453 | | | | 848,497 | |
Reinvestment of dividends | | | 61,543 | | | | 105,258 | |
Shares redeemed | | | (231,894 | ) | | | (206,135 | ) |
| | | | | | | | |
| | | 141,102 | | | | 747,620 | |
| | | | | | | | |
| | |
| | | EQUITY FUND
INDIVIDUAL INVESTOR CLASS | | | EQUITY FUND
INDIVIDUAL INVESTOR CLASS | |
| | | SIX MONTHS ENDED
JANUARY 31, 2023 | | | YEAR ENDED
JULY 31, 2022 | |
Shares sold | | | 190,043 | | | | 538,236 | |
Reinvestment of dividends | | | 20,019 | | | | 51,303 | |
Shares redeemed | | | (376,795 | ) | | | (647,575 | ) |
| | | | | | | | |
| | | (166,733 | ) | | | (58,036 | ) |
| | | | | | | | |
| | |
| | | EQUITY FUND
INSTITUTIONAL CLASS | | | EQUITY FUND
INSTITUTIONAL CLASS | |
| | | SIX MONTHS ENDED
JANUARY 31, 2023 | | | YEAR ENDED
JULY 31, 2022 | |
Shares sold | | | 392,016 | | | | 1,249,076 | |
Reinvestment of dividends | | | 17,937 | | | | 41,391 | |
Shares redeemed | | | (260,955 | ) | | | (461,512 | ) |
| | | | | | | | |
| | | (148,998 | ) | | | 828,955 | |
| | | | | | | | |
43
| | |
GREEN CENTURY FUNDS NOTES TO FINANCIAL STATEMENTS (unaudited) | | continued |
| | | | | | | | |
| | | MSCI INTERNATIONAL INDEX
INDIVIDUAL INVESTOR CLASS | | | MSCI INTERNATIONAL INDEX
INDIVIDUAL INVESTOR CLASS | |
| | | SIX MONTHS ENDED
JANUARY 31, 2023 | | | YEAR ENDED
JULY 31, 2022 | |
Shares sold | | | 393,878 | | | | 1,282,266 | |
Reinvestment of dividends | | | 7,468 | | | | 112,334 | |
Shares redeemed | | | (353,215 | ) | | | (496,937 | ) |
| | | | | | | | |
| | | 48,131 | | | | 897,663 | |
| | | | | | | | |
| | |
| | | MSCI INTERNATIONAL INDEX
INSTITUTIONAL CLASS | | | MSCI INTERNATIONAL INDEX
INSTITUTIONAL CLASS | |
| | | SIX MONTHS ENDED
JANUARY 31, 2023 | | | YEAR ENDED
JULY 31, 2022 | |
Shares sold | | | 1,548,700 | | | | 3,386,081 | |
Reinvestment of dividends | | | 31,751 | | | | 309,058 | |
Shares redeemed | | | (1,073,007 | ) | | | (1,395,350 | ) |
| | | | | | | | |
| �� | | 507,444 | | | | 2,299,789 | |
| | | | | | | | |
NOTE 6 — Market Risks and Geopolitical Risks
Certain local, regional or global events such as war, acts of terrorism, the spread of infectious illness or other public health issues, or other events could have a significant impact on a security or instrument. In March 2020, a pandemic related to COVID-19 was declared. The pandemic represents a market risk factor including uncertainty in the financial markets. Following Russia’s large-scale invasion of Ukraine, the President of the United States signed an Executive Order in February 2022 prohibiting U.S. persons from entering transactions with the Central Bank of Russia and Executive Orders in March 2022 prohibiting U.S. persons from importing oil and gas from Russia as well as other popular Russian exports, such as diamonds, seafood and vodka. There may also be restrictions on investments in Chinese companies. For example, the President of the United States of America signed an Executive Order in June 2021 affirming and expanding the U.S. policy prohibiting U.S. persons from purchasing or investing in publicly-traded securities of companies identified by the U.S. Government as “Chinese Military-Industrial Complex Companies.” The list of such companies can change from time to time, and as a result of forced selling or an inability to participate in an investment the Adviser otherwise believes is attractive, the Funds may incur losses. The duration of the coronavirus outbreak and the Russian-Ukraine conflict could adversely affect the Funds’ performance, the performance of the securities in which the Fund invests and may lead to losses on your investment. The ultimate impact of COVID-19 and Russia Invasion on the financial performance of the Funds’ investments is not reasonably estimable at this time. Green Century will continue to monitor market conditions as information is available and evaluate the potential impacts, if any, on the value of its investments.
NOTE 7 — New Accounting Pronouncements
In October 2020, the SEC adopted new regulations governing the use of derivatives by registered investment companies (“Rule 18f-4”). Rule 18f-4 will impose limits on the amount of derivatives a Fund can enter into, eliminate the asset segregation framework currently used by funds to comply with Section 18 of the 1940 Act, and require funds whose use of derivatives is greater than a limited specified amount to establish and maintain a comprehensive derivatives risk
44
| | |
GREEN CENTURY FUNDS NOTES TO FINANCIAL STATEMENTS (unaudited) | | concluded |
management program and appoint a derivatives risk manager. The Funds have adopted procedures in accordance with Rule 18f-4.
In December 2020, the SEC adopted a new rule providing a framework for fund valuation practices (“Rule 2a-5”). Rule 2a-5 establishes requirements for determining fair value in good faith for purposes of the 1940 Act. Rule 2a-5 permits fund boards to designate certain parties to perform fair value determinations, subject to board oversight and certain other conditions. Rule 2a-5 also defines when market quotations are “readily available” for purposes of the 1940 Act and the threshold for determining whether a fund must fair value a security. In connection with Rule 2a-5, the SEC also adopted related recordkeeping requirements and is rescinding previously issued guidance, including with respect to the role of a board in determining fair value and the accounting and auditing of fund investments. The Funds have adopted procedures in accordance with Rule 2a-5.
In March 2020, FASB issued ASU 2020-04, Reference Rate Reform: Facilitation of the Effects of Reference Rate Reform on Financial Reporting. The main objective of the new guidance is to provide relief to companies that will be impacted by the expected change in benchmark interest rates at the end of 2021, when participating banks will no longer be required to submit London Interbank Offered Rate (“LIBOR”) quotes by the UK Financial Conduct Authority. The new guidance allows companies to, provided the only change to existing contracts are a change to an approved benchmark interest rate, account for modifications as a continuance of the existing contract without additional analysis. In addition, derivative contracts that qualified for hedge accounting prior to modification, will be allowed to continue to receive such treatment, even if critical terms change due to a change in the benchmark interest rate. In December 2022, the Financial Accounting Standards Board (FASB) issued Accounting Standards Update (ASU) No. 2022-06 “Reference Rate Reform (Topic 848)”. ASU No. 2022-06 updates and clarifies ASU No. 2020-04, which provides optional, temporary relief with respect to the financial reporting of contracts subject to certain types of modifications due to the planned discontinuation of LIBOR and other interbank-offered reference rates. The temporary relief provided by ASU No. 2022-06 is effective immediately for certain reference rate-related contract modifications that occur through December 31, 2024. Management does not expect ASU No. 2022-06 to have a material impact on the financial statements.
NOTE 8 — Subsequent Events
Subsequent to January 31, 2023 and through the date on which the financial statements were available for issuance, management has evaluated subsequent events requiring disclosure.
On March 10, 2023, Silicon Valley Bank (SVB), a subsidiary of SVB Financial Group, was taken control by the Federal Deposit Insurance Corp., and on March 17, 2023, SVB had filed for bankruptcy protection. As of January 31, 2023, Green Century Balanced Fund and Green Century Equity Fund held 6,707 and 1,658 shares of SVB Financial Group, valued at $2,028,465 and $501,446, respectively. The bankruptcy adversely impacted the value of such investments, and the value of its assets is not guaranteed. As a result, shares of SVB Financial Group were valued at zero in both Green Century Funds as of the date of issuance of this report.
45
REPORT OF TRUSTEES REGARDING 2022 CONTRACT APPROVAL
The Board of Trustees of the Green Century Funds (the “Board” or the “Trustees”) considered and approved the continuation of the Funds’ advisory and subadvisory agreements.
INVESTMENT ADVISORY AGREEMENTS
The Trustees, including the Trustees who are not “interested persons” (as defined in Section 2(a)(19) of the Investment Company Act of 1940, as amended) (the “Independent Trustees”), voted to approve the continuance of the Investment Advisory Agreements, as amended (the “Advisory Agreements”) between the Trust, on behalf of each of the Balanced Fund, the Equity Fund, and the International Fund and Green Century Capital Management (“Green Century” or the “Adviser”) at the October 27-28, 2022 meeting. The Trustees considered, among other things, information provided by Green Century regarding the investment performance of each Fund; the expenses of each Fund and the advisory fee paid to Green Century by each Fund; and the profitability to Green Century of its advisory relationship with each Fund. The Independent Trustees were assisted by independent counsel in considering these materials and the approval and continuance of the Advisory Agreements. The Trustees considered all of the information provided to them by Green Century, including information provided at Board meetings throughout the year and in connection with other communications and discussions with Green Century. The Independent Trustees also received a memorandum from independent legal counsel advising them of their duties and responsibilities in connection with the review of the Advisory Agreements. The Trustees met with representatives of Green Century at the Trustees’ October 27-28 2022 meeting to discuss matters related to the continuation of the Advisory Agreements. Prior to voting, the Independent Trustees met with their independent counsel in private sessions at which no representatives of management were present. In approving the Advisory Agreements the Independent Trustees did not identify any single factor as determinative. Matters considered in connection with their approval of the Advisory Agreements included the following.
Nature, Quality, and Extent of Services Performed. The Trustees considered the scope and quality of the services performed for each of the Funds by the Adviser, including the resources dedicated by the Adviser.
With respect to the Balanced Fund, the services performed include the oversight and monitoring of the portfolio management and performance of the Balanced Fund; monitoring the implementation of the Balanced Fund’s environmental screens; implementing the environmental and other policies of the Trust by voting the Balanced Fund’s shareholder proxies independently and without reliance on third-party proxy advisory firms; and overall compliance oversight provided by the Adviser. The Trustees also considered the Adviser’s supervision of Trillium Asset Management, LLC (“Trillium”), the subadviser of the Balanced Fund, which performs the day-to-day portfolio management for the Fund.
With respect to the Equity Fund and the International Fund, these services include monitoring the Equity Fund’s performance and tracking error relative to the MSCI KLD 400 Social ex Fossil Fuels Index (the “MSCI KLD Index”); monitoring the International Fund’s performance and tracking error relative to the MSCI World ex USA SRI ex Fossil Fuels Index (the “MSCI World Index”); implementing the environmental and other policies of the Trust by voting the Equity Fund’s and the International Fund’s shareholder proxies independently and without reliance on third-party proxy advisory firms; and overall compliance oversight provided by the Adviser. The Trustees also considered the Adviser’s supervision of Northern Trust Investments, Inc. (“Northern Trust”), the subadviser of the Equity Fund and the International Fund, which performs day-to-day portfolio management for those two Funds.
In addition, the Trustees considered the Adviser’s mission to promote corporate environmental responsibility and to foster a sustainable economy, implemented in part by its commitment with respect to shareholder advocacy for more environmentally responsible policies and practices at major corporations. They took into account the not-for-profit ownership of the Adviser’s business, including its grant to a nonprofit organization out of its own resources and the fact
46
that any distribution of profits by the Adviser are paid to its 100% owner, Paradigm Partners, which is comprised entirely of nonprofit environmental and public interest advocacy organizations so that no individuals or for-profit corporations directly benefit from the distributed earned profits of the Adviser. The Trustees noted that the organizations under Paradigm Partners advocate for critical public health and environmental campaigns. The Trustees considered the Adviser’s distribution of profits in recent years and acknowledged the long-term commitment from Paradigm Partners over the life of the Funds. They also evaluated the administrative services provided by Green Century to the Funds under a separate agreement, including the coordination of the activities of the Funds’ other service providers. The Trustees took into account Green Century’s ongoing adaptation to remote working following the coronavirus (COVID-19) pandemic. Based on its review of all of the services provided, the Trustees concluded that the nature, quality, and extent of services provided by the Adviser supported the continuance of the Advisory Agreements with respect to each Fund.
Investment Performance. With respect to the Balanced Fund, the Trustees reviewed and considered information regarding the investment performance of the Balanced Fund and comparative data with respect to the performance of other funds designated by Morningstar to have similar investment objectives as well as the Balanced Fund’s performance measured against the Lipper Balanced Fund Index (“Lipper Index”), which is a broad-based balanced fund market index, and against a custom balanced index (“Custom Index”) comprised of a 60% weighting in the S&P 1500 Index and a 40% weighting in the BofA Merrill Lynch 1-10 Year US Corporate and Government Index. In addition, the Trustees took into account the performance information they had been provided throughout the year. After weighing all the factors deemed appropriate, including the environmental screens applied to the Fund’s investment process, the Trustees concluded that the performance of the Balanced Fund supported the continuance of the Advisory Agreement with respect to the Balanced Fund.
With respect to the Equity Fund and the International Fund, the Trustees considered that due to each Fund’s passive investment strategy, the principal concern with regard to investment performance was the extent to which the Fund tracked its respective index. After considering all the factors deemed appropriate, the Trustees concluded that the performance of the Equity Fund and the International Fund supported the continuance of the Advisory Agreement with respect to the Equity Fund and the International Fund, respectively.
The Costs of Services Provided and Profitability. The Trustees considered the costs of the services provided to the Funds and the profitability to the Adviser from its arrangements with the Funds.
The Trustees reviewed and considered an analysis of the advisory fees and total expenses ratios of each Fund and comparative data for multiple categories of mutual funds included in and as defined by Morningstar’s mutual fund database of thousands of mutual funds. In addition, the Trustees considered comparative advisory fee and expense ratio information provided by Green Century relating to a smaller set of peer funds identified by Green Century. The Trustees took into account, among other things, the distinct nature of the Funds as compared with the peer funds, particularly with respect to the Funds’ social investing, the non-profit ownership of the Adviser, and the Adviser’s advocacy efforts and how those characteristics distinguished the Funds from their peers. The Trustees considered the size of Green Century and that Green Century was not at the same operational scale as its competitors, The Trustees also noted that, based on information provided by Green Century, competitors to the Equity Fund include actively managed funds in addition to index funds.
With respect to the Morningstar peer groups, for the Balanced Fund, the Trustees noted that, based on the information provided, the Fund’s advisory fee for the Individual Investor Class was higher than the average advisory fee for sustainable investment funds (by 7 basis points), sustainable investment balanced Funds (by 17 basis points), all balanced funds (by 16 basis points) and was lower than the average of balanced funds with assets between $400 million and $500 million (by 3 basis points). The Trustees also noted that the total expense ratio for the Individual Investor Class of the Balanced Fund was effectively capped at 1.46% through the application of a “unitary administrative fee”
47
paid to Green Century, and that the total expense ratio was higher than that of the average of sustainable investment funds (by 44 basis points), sustainable investment balanced funds (by 36 basis points), all balanced funds (by 52 basis points), and balanced funds with assets between $400 million and $500 million (by 25 basis points).
For the Equity Fund, the Trustees noted that, based on the information provided, the Fund’s advisory fee for the Individual Investor Class was lower than the average advisory fee for sustainable investment funds (by 34 basis points), sustainable investment large growth funds (by 39 basis points), all large growth funds (by 45 basis points), large growth funds with assets between $500 million and $600 million (by 46 basis points) and large growth index funds (by 31 basis points). The Trustees also noted that the total expense ratio of Individual Investor Class of the Equity Fund was effectively capped at 1.25% through the application of a “unitary administrative fee” paid to Green Century, and that the total expense ratio was higher than the average of sustainable investment funds (by 23 basis points), sustainable investment large growth funds (by 16 basis points), the average of all large growth funds (by 6 basis points), large growth funds with assets between $500 million and $600 million (by 3 basis points) and was lower than the average of large growth index funds (by 1 basis point).
For the International Fund, the Trustees noted that, based on the information provided, the Fund’s advisory fee for the Individual Investor Class was lower than that of the average advisory fee for sustainable investment funds (by 28 basis points), sustainable investment foreign large blend funds (by 37 basis points), all foreign large blend funds (by 36 basis points) and foreign large blend funds with assets between $100 million and $200 million (by 45 basis points) and was higher than the average advisory fee for foreign large blend index funds (by 8 basis points). The Trustees also noted that the total expense ratio of Individual Investor Class shares of the International Fund was effectively capped at 1.28% through the application of a “unitary administrative fee” paid to Green Century, and that the total expense ratio was higher than that of the average of sustainable investment funds (by 26 basis points), sustainable investment foreign large blend funds (by 22 basis points), all foreign large blend funds (by 21 basis points), foreign large blend index funds (by 85 basis points) and was lower than the average of foreign large blend funds with assets between $100 million and $200 million (by 1 basis point).
Green Century provided the Trustees with information relating to the profitability to Green Century of its advisory relationships to the Funds. The Trustees noted that based on information provided by Green Century, the relationships to the Funds had not been profitable for several years, though recent growth in Fund assets resulted in a profit for the Adviser’s fiscal year ended June 30, 2015 and increasing levels of profit for subsequent periods through the Adviser’s fiscal year ended June 30, 2022. The Trustees considered an analysis of the estimated Fund-by-Fund profitability for Green Century from the investment management and administrative service it provides to the Trust, which showed that the Adviser had made a profit from managing each Fund. In this regard, the Independent Trustees considered the subadvisory fees and the other expenses incurred by the Adviser in providing advisory services to the Funds and the amount retained by Green Century out of the advisory fees. The Trustees also considered the fees received by Green Century for providing administrative services to the Funds and the expenses incurred in providing those services. In considering the cost allocation methodology used by Green Century, the Trustees took into consideration that the Adviser derives all of its revenues from the Funds and does not provide advisory or administrative services to other mutual funds or non-mutual fund clients. The Trustees considered the costs and entrepreneurial risks assumed by the Adviser in connection with launching, branding and maintaining publicly-offered mutual funds and that the Adviser had been unprofitable for ten of the last twenty-two fiscal years. The Trustees took into account the operational enhancements that Green Century had indicated it would need to undertake in connection with the growth of Fund assets, the addition of new share classes, and the expansion into different types of assets. The Trustees also considered Green Century’s non-profit ownership structure, its cost structure and personnel needs, and its investment in shareholder advocacy that aligns with the Funds’ stated intention to promote greater corporate environmental accountability. After reviewing the information described above, the Trustees concluded that the fees specified in the Advisory Agreements, taking into
48
account the costs of the services provided by the Adviser and the profitability to the Adviser of its relationships with the Funds, supported the continuance of the Advisory Agreements with respect to the Funds.
Other Benefits. With respect to fall-out benefits from the Adviser’s arrangements with the Funds, the Trustees considered that neither Green Century nor any affiliate of Green Century receives any brokerage fees, soft dollar benefits, liquidity rebates from electronic communications networks or payments for order flow from the trades executed for each Fund. The Trustees noted that Green Century does potentially benefit from its relationship with the Funds due to the Funds’ reputation as the first family of no-load environmentally responsible mutual funds and, more recently, as a pioneer in responsible and diversified fossil fuel free mutual funds. The Trustees considered that the association with the Funds supports Green Century’s own stated mission of advocating for corporate environmental responsibility. Further, pursuant to the Advisory Agreements, Green Century has reserved for itself the rights to the names “Green Century Funds” and any similar names; thus, Green Century may benefit in the future from developing other funds or investment products with the Green Century brand. The Trustees concluded that the fall-out benefits to be realized by Green Century were appropriate.
Economies of Scale. The Trustees also considered whether economies of scale could be realized by the Adviser as the Funds grow in asset size and the extent to which such economies of scale were reflected in the level of fees charged. They noted the relatively small size of each Fund and the resultant difficulty of achieving meaningful economies of scale, though they took into account the effects of significant increases in Fund and Trust assets over the past few years relative to a very small base. They considered that if the assets were to increase, the Funds could have the opportunity to experience economies of scale as fixed costs would become a smaller percentage of the Funds’ assets and some of the Funds’ service providers’ fees, as a percentage of the Funds’ assets, could decrease. The Trustees noted that the advisory fee structure for each of the Equity Fund and the Balanced Fund includes breakpoints that would cause the advisory fee to decrease as a percentage of net assets as the Fund increased in size, though under certain circumstances the structure of the Equity Fund’s unitary administrative fee arrangement with the Adviser offsets the effects of any advisory fee reduction on the total expense ratio. The Trustees also considered information provided by Green Century regarding how it seeks to reinvest its higher fee revenues from economies of scale into augmenting the quality and sophistication of its business in support of the Funds. The Trustees concluded that, in light of all of the facts and circumstances, breakpoints were not warranted at this time, and that if assets increased significantly the Trustees would have opportunities to negotiate further breakpoints or other decreases in fees with the Adviser.
Based on a review of all factors deemed relevant the Trustees, including the Independent Trustees, concluded that the Advisory Agreements with respect to all of the Funds should be continued for an additional one-year period.
INVESTMENT SUBADVISORY AGREEMENTS
The Trustees, including the Independent Trustees, voted to approve the continuance of the subadvisory agreement between the Trust, on behalf of the Balanced Fund, Green Century, and Trillium, as amended (the “Balanced Fund Subadvisory Agreement”), the continuance of the subadvisory agreement between the Trust, on behalf of the Equity Fund, Green Century, and Northern Trust (the “Equity Fund Subadvisory Agreement”) and the continuance of the subadvisory agreement between the Trust, on behalf of the International Fund, Green Century, and Northern Trust (the “International Fund Subadvisory Agreement” and together with the Balanced Fund Subadvisory Agreement and the Equity Fund Subadvisory Agreement, the “Subadvisory Agreements”) at the October 27-28, 2022 meeting. In connection with their deliberations at the meetings, the Trustees considered, among other things, information provided by Trillium regarding the investment performance of the Balanced Fund, and information provided by Northern Trust regarding the investment performance of the Equity Fund (including the success with which the Equity Fund tracked the MSCI KLD Index) and the International Fund (including the success with which
49
the International Fund tracked the MSCI World Index), the subadvisory fees paid to Trillium and Northern Trust, the profitability to Trillium of its subadvisory relationship to the Balanced Fund and financial information about Northern Trust. The Independent Trustees were assisted by independent counsel in considering these materials and the continuance of the Subadvisory Agreements. The Trustees considered all of the information provided to them by Trillium and Northern Trust, including information provided throughout the year. The Independent Trustees also received a memorandum from independent legal counsel advising them of their duties and responsibilities in connection with the contract review. The Trustees met with representatives of Trillium and Northern Trust at the Trustees’ October 27-28, 2022 meeting to discuss matters related to the continuation of the Subadvisory Agreements. Prior to voting, the Independent Trustees met with their independent counsel in private sessions at which no representatives of management were present. In approving the continuance of the Subadvisory Agreements the Trustees did not identify any single factor as determinative. Matters considered in connection with their approval of the Subadvisory Agreements included the following.
Nature, Quality, and Extent of Services Performed. The Trustees noted that under the terms of the Balanced Fund Subadvisory Agreement, Trillium provided the day-to-day portfolio management of the Balanced Fund, including determining asset and sector allocation; conducting securities selection and discovery; researching and analyzing environmental policies and practices of companies and implementing the Balanced Fund’s environmental screening criteria; managing the volatility, liquidity, risk, and turnover of the portfolio; and investing the portfolio consistent with the Balanced Fund’s investment objective and policies. The Trustees considered the professional expertise, tenure, and qualifications of the portfolio management team and noted that Trillium was devoted exclusively to environmentally and socially responsible investing and managed over $4 billion in assets. The Trustees also considered Trillium’s compliance record as well as the professional experience and responsiveness of Trillium’s compliance staff, as reported to them by the Trust’s chief compliance officer. The Trustees also considered Trillium’s leadership in social and environmental responsibility, including its shareholder advocacy efforts.
The Trustees noted that under the terms of the Equity Fund Subadvisory Agreement and the International Fund Subadvisory Agreement, Northern Trust provided the day-to-day portfolio management of each of the Equity Fund and the International Fund, making purchases and sales of portfolio securities consistent with each such Fund’s investment objective and policies and with changes to the applicable index. The Trustees considered the professional expertise, tenure, and qualifications of the portfolio management team as well as the team’s experience in passive management. The Trustees also considered Northern Trust’s handling of daily inflows and outflows, transaction costs, tracking error, and the portfolio turnover rates for each of the Equity Fund and the International Fund. The Trustees also considered Northern Trust’s compliance record as well as the professional experience and responsiveness of Northern Trust’s compliance staff, as reported to them by the Trust’s chief compliance officer.
Based on its review of all of the services provided and to be provided, the Trustees concluded that the nature, quality, and extent of services provided by Trillium and Northern Trust, respectively, supported the continuance of the Subadvisory Agreements.
Investment Performance. The Trustees reviewed and considered information regarding the investment performance of the Individual Investor Class of the Balanced Fund and comparative data with respect to the performance of mutual funds with similar investment objectives as well as other broad-based market indexes. The Trustees noted that as of periods ended August 31, 2022, the Balanced Fund’s three-, five- and ten-year average annual returns outperformed the Lipper Index and its one-year average annual returns underperformed the Lipper Index. The Trustees also noted that as of periods ended August 31, 2022, the Balanced Fund’s one-, three-, five- and ten-year average annual returns underperformed the Custom Index. After considering all the factors deemed appropriate, the Trustees concluded that
50
the performance of the Balanced Fund together with Trillium’s investment process, philosophies and experience in environmental and sustainable investing, supported the continuance of the Balanced Fund Subadvisory Agreement.
With respect to the Equity Fund and the International Fund, the Trustees considered that due to each Fund’s passive investment strategy, the principal concern with regard to investment performance was the extent to which the Fund tracked its respective index. The Trustees reviewed the performance of the Individual Investor Class shares of the Equity Fund as compared to that of the MSCI KLD Index for the twelve-month period ended July 31, 2022, and noted that the Equity Fund’s performance slightly underperformed that of the MSCI KLD Index. In particular, they observed that, after taking into consideration the fees and expenses of the Individual Investor Class shares, for the one-year period the Equity Fund’s performance was in line with that of the MSCI KLD Index. After considering all the factors deemed appropriate, the Trustees concluded that the performance of the Equity Fund together with Northern Trust’s investment process and experience in passive portfolio management supported the continuance of the Equity Fund Subadvisory Agreement. The Trustees reviewed the performance of the Individual Investor Class shares of the International Fund, exclusive of the expenses of the class, as compared to that of the MSCI World Index for the twelve-month period ended July 31, 2022, and noted that the Fund’s performance closely followed that of the MSCI World Index. The Trustees took into account that the non-U.S. nature of the securities in which the International Fund invests and the fees and expenses of the Individual Investor Class shares have an impact on the Fund’s tracking error. After considering all the factors they deemed appropriate, the Trustees concluded that the performance of the International Fund together with Northern Trust’s investment process and experience in passive portfolio management supported the continuance of the International Fund Subadvisory Agreement.
Costs of Services Provided and Profitability. The Trustees considered that the subadvisory fees paid by Green Century to Trillium under the Balanced Fund Subadvisory Agreement were 0.40% of the value of the average daily net assets of the Balanced Fund up to $30 million, 0.35% of the value of the average daily net assets of the Balanced Fund in excess of $30 million up to $250 million, and 0.30% of the value of the average daily net assets of the Balanced Fund in excess of $250 million.
In evaluating the profitability of the Subadvisory Agreement to Trillium, the Trustees noted that based on information provided by Trillium, the relationship was profitable. The Trustees noted that Trillium stated that recent increases in the assets of the Balanced Fund have allowed Trillium to realize what it considers to be a fair entrepreneurial profit on the subadvisory services it provides. The Trustees considered the financial resources Trillium dedicated and the other expenses Trillium incurred in providing subadvisory services to the Balanced Fund, including startup costs relating to the relationship, and additional personnel, legal, trading analysis and compliance costs required in the context of providing subadvisory services to a mutual fund. The Trustees took into account that Trillium is the investment adviser or sub-adviser to other mutual funds. The Trustees also considered Trillium’s fee structure and noted, based on the information provided, that the subadvisory fees were lower than the fees Trillium would receive from an institutional client with separate accounts of similar size as the Balanced Fund.
The Trustees considered that the subadvisory fees paid by Green Century to Northern Trust under the Equity Fund Subadvisory Agreement were an annual fee equal to the greater of (a) $75,000 or (b) 0.10% of the value of the average daily net assets of the Equity Fund up to but not including $50 million, 0.05% of the value of the average daily net assets of the Equity Fund from and including $50 million up to but not including $100 million, and 0.03% of the value of the average daily net assets of the Equity Fund equal to or in excess of $100 million.
The Trustees considered that that the subadvisory fees paid by Green Century to Northern Trust under the International Fund Subadvisory Agreement were an annual fee equal to the greater of (a) $100,000 or (b) 0.17% of the value of the average daily net assets of the Fund up to but not including $50 million, 0.12% of the average daily net assets of the Fund from and including $50 million up to but not including $100 million, and 0.08% of the average daily net assets of the Fund equal to or in excess of $100 million.
51
The Trustees reviewed and considered an analysis of the subadvisory fees for the Equity Fund and the International Fund against comparative data for mutual funds subadvised by Northern Trust with a similar investment strategy and asset size. The Trustees noted that each Fund paid subadvisory fees at effective rates comparable to those paid to Northern Trust by other subadvised index funds with similar levels of net assets. In evaluating the profitability of each of the Equity Fund Subadvisory Agreement and International Fund Subadvisory Agreement to Northern Trust, the Trustees noted that Northern Trust does not calculate earnings at the subadvisory client level.
The Trustees also considered that the subadvisory fees are paid by Green Century, and are not in addition to the advisory fees paid to Green Century by the Funds.
After reviewing the information described above, the Trustees concluded that the fees specified in the Subadvisory Agreements, taking into account the nature and quality of services provided and the costs of the services provided by Trillium and Northern Trust as applicable, supported the continuance of the Subadvisory Agreements.
Other Benefits. The Trustees evaluated potential other benefits that each of Trillium and Northern Trust may realize from its relationship with the applicable Fund(s). The Trustees considered the brokerage practices of Trillium, including the soft dollar commissions that were generated with respect to the Balanced Fund’s portfolio transactions. The Trustees considered that Trillium was not affiliated with a broker/dealer and therefore no benefit would be realized by Trillium through transactions with affiliated brokers. The Trustees also considered the brokerage practices of Northern Trust, including that Northern Trust does not trade for the Equity Fund or the International Fund through its affiliated broker. The Trustees also considered that no soft dollars have been paid in connection with Northern Trust’s management of the Equity Fund and the International Fund.
The Trustees further considered the reputational and other advantages that each of Trillium and Northern Trust may gain from its relationship with the applicable Fund(s), including that Northern Trust’s management of the Equity Fund and the International Fund will broaden its exposure to the socially responsible mutual fund market, which may assist in its marketing efforts. The Trustees concluded that the benefits received by each of Trillium and Northern Trust were reasonable in the context of its relationship with the applicable Fund(s).
Economies of Scale. The Trustees also considered whether economies of scale would be realized by each of Trillium and Northern Trust as the Funds grow in asset size and the extent to which such economies of scale might be reflected in the subadvisory fees. They noted the relatively small size of each Fund (compared with similar funds in the industry) and the resultant difficulty of achieving meaningful economies of scale, though they took into account the effects of significant increases in Fund and Trust assets over the past few years. They considered that if the assets were to increase, Trillium and Northern Trust could have the opportunity to experience economies of scale. They also noted that pursuant to the Balanced Fund Subadvisory Agreement, the overall subadvisory fees paid to Trillium by Green Century (out of the advisory fee that Green Century receives from the Fund, which is subject to a breakpoint) include breakpoints at $30 million and $250 million, so that fees as a percentage of net assets decrease modestly (from 40 basis points towards 30 basis points) as assets in the Balanced Fund increase. They also noted that pursuant to the Equity Fund Subadvisory Agreement and the International Fund Subadvisory Agreement, the overall subadvisory fees paid to Northern Trust by Green Century (out of the advisory fee that Green Century receives from the applicable Fund, which, for the Equity Fund, is subject to breakpoints) include breakpoints at $50 million and $100 million (subject to a minimum annual fee of $75,000 for the Equity Fund and $100,000 for the International Fund), so that fees as a percentage of net assets decrease as assets in the Equity Fund and the International Fund increase. The Trustees concluded that economies of scale could be realized as the Funds grow, and that the fee schedules as specified were appropriate, and supported the continuance of the Subadvisory Agreements.
Based on a review of all factors deemed relevant, the Trustees, including the Independent Trustees, concluded that all of the Subadvisory Agreements should be continued for an additional one-year period.
52
STATEMENT REGARDING LIQUIDITY RISK MANAGEMENT PROGRAM
As required by law, each Fund has adopted and implemented a liquidity risk management program (the “Program”) that is designed to assess and manage liquidity risk. Liquidity risk is the risk that a Fund could not meet requests to redeem its shares without significant dilution of remaining investors’ interests in the Fund. Green Century Capital Management, Inc. (the “Adviser”), the fund’s investment adviser, is the administrator of the Program. The Adviser has established a liquidity risk management committee (the “Committee”) to administer the Program on a day-to-day basis.
The Committee provided the Board of Trustees with a report that addressed the operation of the Program, assessed its adequacy and effectiveness of implementation, including, if applicable, the operation of any Highly Liquid Investment Minimum, and described any material changes that had been made to the Program or were recommended (the “Report”). The Report covered the period from November 1, 2021 through October 31, 2022 (the “Reporting Period”).
The Report confirmed that there were no material changes to the Program during the Reporting Period and that no changes were recommended.
The Report also confirmed that, throughout the Reporting Period, the Committee had monitored each Fund’s portfolio liquidity and liquidity risk on an ongoing basis, as described in the Program and in Board reporting throughout the Reporting Period.
The Report discussed the Committee’s annual review of the Program, which addressed, among other things, the following elements of the Program:
Assessment, Management, and Periodic Review of Liquidity Risk. The Committee reviewed each Fund’s investment strategy and liquidity of portfolio investments during both normal and reasonably foreseeable stressed conditions. The Committee noted that each Fund’s investment strategy continues to be appropriate for an open-end fund, taking into account, among other things, whether and to what extent the Fund held less liquid and illiquid assets and the extent to which any such investments affected the Fund’s ability to meet redemption requests. In managing and reviewing each Fund’s liquidity risk, the Committee also considered the extent to which the Fund’s investment strategy involves a relatively concentrated portfolio or large positions in particular issuers, the extent to which the Fund uses borrowing for investment purposes, and the extent to which the Fund uses derivatives (including for hedging purposes). The Committee also reviewed each Fund’s short-term and long-term cash flow projections during both normal and reasonably foreseeable stressed conditions. In assessing each Fund’s cash flow projections, the Committee considered, among other factors, historical net redemption activity, redemption policies, ownership concentration, distribution channels, and the degree of certainty associated with the Fund’s short-term and long-term cash flow projections. The Committee also considered each Fund’s holdings of cash and cash equivalents, as well as borrowing arrangements and other funding sources as components of the Fund’s ability to meet redemption requests.
Liquidity Classification. The Committee reviewed the Program’s liquidity classification methodology for categorizing each Fund’s investments into one of four liquidity buckets. In reviewing each Fund’s investments, the Committee considered, among other factors, whether trading varying portions of a position in a particular portfolio investment or asset class in sizes the Fund would reasonably anticipate trading, would be reasonably expected to significantly affect liquidity.
Highly Liquid Investment Minimum. For each Fund, the Committee performed an analysis to determine whether the Fund is required to maintain a Highly Liquid Investment Minimum, and determined that no such minimum is required because each Fund primarily holds highly liquid investments.
53
Compliance with Limitation on Illiquid Investments. The Committee confirmed that during the Reporting Period, no Fund acquired any illiquid investment such that, after the acquisition, the Fund would have invested more than 15% of its assets in illiquid investments that are assets, in accordance with the Program and applicable SEC rules.
Redemptions in Kind. The Committee confirmed that no redemptions in-kind were effected by a Fund during the Reporting Period.
The Report stated that the Committee concluded the Program operates adequately and effectively, in all material respects, to assess and manage each Fund’s liquidity risk throughout the Reporting Period.
54
THIS PAGE INTENTIONALLY LEFT BLANK
YOUR NOTES
INVESTMENT ADVISER AND ADMINISTRATOR
Green Century Capital Management, Inc.
114 State Street
Boston, MA 02109
1-800-93-GREEN
www.greencentury.com
info@greencentury.com
INVESTMENT SUBADVISER (Balanced Fund)
Trillium Asset Management, LLC
Two Financial Center
60 South Street, Suite 1100
Boston, MA 02111
INVESTMENT SUBADVISER (Equity Fund and International Fund)
Northern Trust Investments, Inc.
50 South LaSalle Street
Chicago, IL 60603
SUBADMINISTRATOR and DISTRIBUTOR
UMB Fund Services, Inc. (Subadministrator)
UMB Distribution Services, LLC (Distributor)
235 West Galena Street
Milwaukee, WI 53212
CUSTODIAN
UMB Bank, n.a.
928 Grand Blvd
Kansas City, MO 64106
TRANSFER AGENT
Atlantic Shareholder Services, LLC
Three Canal Plaza
Portland, ME 04101
INDEPENDENT REGISTERED PUBLIC ACCOUNTING FIRM
KPMG LLP
Two Financial Center
60 South Street
Boston, MA 02111
January 31, 2023
Balanced
Fund
Equity Fund
International Fund
|
An investment for your future. Printed on recycled paper with soy-based ink. |
Item 2. Code of Ethics.
Not applicable to semi-annual reports.
Item 3. Audit Committee Financial Expert.
Not applicable to semi-annual reports.
Item 4. Principal Accountant Fees and Services.
Not applicable to semi-annual reports.
Item 5. Audit Committee of Listed Registrants
Not applicable.
Item 6. Investments.
| (a) | Schedule of Investments is included as part of the report to shareholders filed under Item 1 of this Form N-CSR. |
Item 7. Disclosure of Proxy Voting Policies and Procedures for Closed-End Management Investment Companies.
Not applicable.
Item 8. Portfolio Managers of Closed-End Management Investment Companies.
Not applicable.
Item 9. Purchases of Equity Securities by Closed-End Management Investment Company and Affiliated Purchasers.
Not applicable.
Item 10. Submission of Matters to a Vote of Security Holders.
There were no material changes to the procedures by which shareholders may recommend nominees to the registrant’s Board of Trustees.
Item 11. Controls and Procedures.
| (a) | Based on an evaluation of the disclosure controls and procedures (as defined in Rule 30a-3(c) under the Investment Company Act of 1940, as amended, the “Disclosure Controls”) as of a date within 90 days of the filing date (the “Filing Date”) of this Form N-CSR (the “Report”), the registrant’s principal executive officer and principal financial officer have concluded that the Disclosure Controls are effectively designed to ensure that information that is required to be disclosed |
| | by the registrant in the Report is recorded, processed, summarized and reported within the time periods specified in the Securities and Exchange Commission’s rules and forms, including ensuring that information required to be disclosed in the Report is accumulated and communicated to the registrant’s management, including the registrant’s principal executive officer and principal financial officer, as appropriate to allow timely decisions regarding required disclosures. |
| (b) | There were no changes in the registrant’s internal controls over financial reporting (as defined in Rule 30a-3(d) under the Investment Company Act of 1940) that occurred during the fiscal period covered by this report that have materially affected, or are reasonably likely to materially affect, the registrant’s internal control over financial reporting. |
Item 12. Disclosure of Securities Lending Activities for Closed-End Management Investment Companies.
Not applicable.
Item 13. Exhibits.
SIGNATURES
Pursuant to the requirements of the Securities Exchange Act of 1934 and the Investment Company Act of 1940, the registrant has duly caused this report to be signed on its behalf by the undersigned, thereunto duly authorized.
|
Green Century Funds |
|
/s/ Leslie Samuelrich |
Leslie Samuelrich |
President and Principal Executive Officer |
April 05, 2023 |
Pursuant to the requirements of the Securities Exchange Act of 1934 and the Investment Company Act of 1940, this report has been signed below by the following persons on behalf of the registrant and in the capacities and on the dates indicated.
|
/s/ Leslie Samuelrich |
Leslie Samuelrich |
President and Principal Executive Officer |
April 05, 2023 |
|
/s/ Matthew Dunlap |
Matthew Dunlap |
Treasurer and Principal Financial Officer |
April 05, 2023 |