UNITED STATES
SECURITIES AND EXCHANGE COMMISSION
Washington, D.C. 20549
FORM N-CSR
CERTIFIED SHAREHOLDER REPORT OF REGISTERED MANAGEMENT
INVESTMENT COMPANIES
Investment Company Act File Number 811-06351
Green Century Funds
114 State Street
Suite 200
Boston, MA 02109_______
(Address of principal executive offices)
Green Century Capital Management, Inc.
114 State Street
Suite 200
________Boston, MA 02109________
(Name and address of agent for service)
Registrant's telephone number, including area code: (617) 482-0800
Date of fiscal year end: July 31
Date of reporting period: January 31, 2020
Item 1. Reports to Stockholders
 | SEMI-ANNUAL REPORT Green Century Balanced Fund Green Century Equity Fund Green Century MSCI International Index Fund January 31, 2020 | |
| An investment for your future.® | 114 State Street, Boston, Massachusetts 02109 | |
For information on the Green Century Funds®, call 1-800-93-GREEN. For information on how to open an account and account services, call 1-800-221-5519 8:00 am to 6:00 pm Eastern Time, Monday through Friday. For daily share price information twenty-four hours a day, visit www.greencentury.com.
Dear Green Century Funds Shareholder:
Green Century had another banner year in 2019. All three of Green Century’s Funds performed strongly during the one-year period that ended December 31, 2019; and our assets under management (AUM) reached an all-time high. We ended the year with an AUM of $699 million, which represents an increase of more than 275% in just five years—thanks to investors such as you.
This growth occurred in an increasingly congested field of sustainable, responsible, and impact investing options. As large firms that historically have cared very little about sustainability expand the marketing of their versions of “sustainable” funds, it’s getting harder and harder for authentically-responsible funds to stand out in the greenwashed crowd.
Despite this competition, Green Century continues to distinguish itself as the gold standard in responsible investing. No firm can match our unique three-pronged approach. I believe you and other shareholders continue to choose Green Century because we offer an unparalleled opportunity to make an impact with one’s investments.
Here are just a few examples of how your investments made an impact last year in each of our three sustainable investing prongs:
Sustainable companies—Green Century invests in sustainable, solution-oriented companies and green bonds, such as:
| • | Adidas,1 a holding in the Green Century International Index Fund, which is turning ocean plastic into high-performance sportswear. In 2019, Adidas produced 11 million pairs of shoes made of recycled ocean plastic. Each pair of Adidas Ultraboost shoes diverts about 11 plastic bottles from polluting our oceans. |
| • | Tesla,1 a holding in the Green Century Equity Fund, which is building all-electric vehicles and scalable clean energy generation and storage products to fulfill its mission to “accelerate the world’s transition to sustainable energy.” |
| • | A U.S. International Development Finance Corporation1 bond, a holding in the Green Century Balanced Fund and formally named the Overseas Private Investment Corporation (OPIC), which is helping finance the ownership and operation of what will be the second largest wind farm in Kenya. Once operational, the Kipeto wind farm will supply 100 megawatts of renewable energy to Kenya’s national grid, which is the equivalent of providing power to approximately 40,000 homes in the |
region. The Kipeto wind farm also will help the Kenyan government achieve its goal of providing access to electricity to 100% of its citizens by 2022. |
Shareholder advocacy—Green Century is home to an in-depth, internal shareholder, and award-winning advocacy program. Green Century Shareholder Advocate Jessye Waxman was the recipient of our most recent award. She was named to the inaugural SRI Conference 30 Under 30 award list this year. Our team of shareholder advocates continues to actively press dozens of companies each year to improve their corporate environmental practices, including:
| • | Kroger,1 the largest grocery chain in the U.S., which agreed to develop and implement a no-deforestation policy that will cover the 10,000 items it produces through its Our Brands label, following a Green Century engagement. |
| • | Darden Restaurants,1 the largest casual dining operator in the U.S. and the owner of Olive Garden and LongHorn Steakhouse, which announced that it would phase out the use of medically important antibiotics in its chicken supply chain by 2023, following a multi-year engagement with Green Century. This is the first time-bound antibiotics commitment from a casual, sit-down restaurant chain. |
Nonprofit ownership—Green Century remains the only mutual fund company in the U.S. wholly owned by environmental and public health nonprofit organizations. In 2019, we provided direct support to several of their campaigns to protect the environment and public health, including:
| • | Environment America’s Renewable Energy campaign, which helped push six states to adopt 100% zero-carbon electricity legislation: Maine, New York, Washington State, New Mexico, California, and Hawaii. (Puerto Rico and Washington, D.C., have made similar commitments.) The campaign continues in Massachusetts, New Jersey, Pennsylvania, North Carolina, Florida, Michigan, Illinois, and Minnesota. |
For a more detailed look at what your investments helped us achieve last year, please take a moment to read through our Best of 2019 post: https://www.greencentury.com/green-centurys-top-10-highlights-from-2019/
While 2019 was a successful year, we cannot and will not rest on our laurels. In 2020, we will continue our work to protect the environment, promote clean energy, protect tropical forests, curb the misuse of antibiotics, and more—work that would be impossible with investors, like you.
Thank you for choosing Green Century to help save for your future.
Sincerely,
Leslie Samuelrich, President
Green Century Capital Management
P.S. If you don’t already receive to our enewletter, I would encourage you to subscribe: https://www.greencentury.com/email-signup/
2
THE GREEN CENTURY BALANCED FUND
The Green Century Balanced Fund seeks capital growth and income from a diversified portfolio of stocks and bonds that meet Green Century’s standards for corporate environmental performance. The portfolio managers of the Balanced Fund avoid fossil fuel companies and aim to invest in companies that are in the business of solving environmental problems or that are committed to reducing their environmental impact.
CUMULATIVE RETURNS* | AVERAGE ANNUAL RETURNS* | |||||||||||||||||
| Total expense ratio: 1.48% | Six Months | One Year | Five Years | Ten Years | ||||||||||||||
| December 31, 2019 | Green Century Balanced Fund | 5.61% | 20.91% | 6.77% | 8.51% | |||||||||||||
| Custom Balanced Fund Index2 | 7.05% | 21.03% | 8.06% | 9.49% | ||||||||||||||
| January 31, 2020 | Green Century Balanced Fund | 4.13% | 14.40% | 7.06% | 8.74% | |||||||||||||
| Custom Balanced Fund Index2 | 6.55% | 15.39% | 8.37% | 9.70% | ||||||||||||||
* The performance data quoted represents past performance and is not a guarantee of future results. Investment return and principal value of an investment will fluctuate so that an investor’s shares, when redeemed, may be worth more or less than their original cost. Current performance may be lower or higher than the performance information quoted. To obtain performance information as of the most recent month-end, call 1-800-93-GREEN. Performance includes the reinvestment of income dividends and capital gain distributions. Performance shown does not reflect the deduction of taxes that a shareholder might pay on Fund distributions or the redemption of Fund shares. A redemption fee of 2.00% may be imposed on redemptions or exchanges of shares you have owned for 60 days or less. Please see the Prospectus for more information.
During the six month period ended January 31, 2020, the Balanced Fund underperformed the Custom Balanced Index, with the Balanced Fund returning 4.13% and the Custom Balanced index returning 6.55%. For the one year period ending January 31, 2020, the Balanced Fund slightly underperformed the Custom Balanced Index. The Balanced Fund returned 14.40%, while the Custom Balanced Index returned 15.39%.
The Fund’s equity holdings that most positively contributed to relative performance during the twelve months ended January 31, 2020 included: Mastercard,1 ASML,1 Target,1 Costco, and American Water.1 Being underweight to Apple1 was the Balanced Fund’s greatest detractor from performance relative to the benchmark. Poor performers included Cigna,1 Gilead,1 Lincoln National,1 International Flavors and Fragrances,1 and Xilinx.1
Equity markets rose significantly over the 12-month period ended January 31, 2020, fueled by strong consumer demand, lower unemployment, improving industrial production, and solid corporate earnings. The Federal Reserve also expressed confidence that interest rates are appropriate for current conditions and indicated that it is unlikely to change the Federal Funds Rate for at least the first half of 2020. Interest rates remain historically quite low, offering a slight economic tailwind that the portfolio managers believe may balance the planned tapering of the fiscal stimulus implemented by Congress in 2017. Responding to the prospect of continued positive corporate earnings growth and easing trade tensions, equity valuations marched higher, lowering the likelihood of a repeat standout performance for the market in 2020.
Recent economic data is consistent with continued positive economic growth in the near future, especially if trade tensions ease, and the portfolio managers believe year-over-year earnings comparisons will also be favorable this year, with new earnings no longer being compared to 2018 numbers inflated by tax cuts. Still, corporate profit margins are already elevated, and the labor market remains tight by most measures, which the portfolio managers believe may make growth expectations difficult to beat. With valuations more likely to gravitate towards their historic averages than to increase further, the portfolio managers believe the
3
market’s dramatic 2019 returns are unlikely to repeat in 2020 without the emergence of an unexpected tailwind for earnings growth. All in all, the portfolio managers consider the risk-reward ratio reasonably balanced at this point. The Balanced Fund’s portfolio managers continue to maintain a neutral style for the Fund, while increasing attention to more cyclical sectors as they look for economic conditions to improve. Taking all of this into account, tame market forecasts are not surprising despite differing so sharply from the media’s focus on negative environmental and geopolitical events.
Dramatic recent headlines describing the historic ongoing Australian wildfires vividly remind us of the dangers of climate change, as did similar alarm about the burning of the Amazon rainforest earlier in 2019. Each case represents the worst regional fires in decades, and together renew our urgent concerns about global environmental risks. However, as we reflect on 2019 and the entirety of the past decade, we also reflect on the progress that has been made to address these risks. The cost of wind and solar energy has
plummeted in recent years, becoming increasingly competitive with fossil fuels. In many cases, installing new clean energy projects has become cheaper than operating existing coal plants, and entire cities and states including New York City, Washington D.C., Oregon, California, and Hawaii have established timelines for decarbonization. The market for Green Bonds funding environmental initiatives by corporations and governments, first articulated only a decade ago, is rapidly approaching one trillion dollars in size. Following these trends, even in the context of ongoing environmental deregulation by the Trump administration, the fossil fuel dominated Energy sector dramatically underperformed every other component of the S&P 500 for 2019.
Similarly, the past decade brought concerns of inequality and gender bias in the workplace sharply to the forefront, supporting progress alongside the painful recognition of these widespread problems. As we continue to enthusiastically advocate
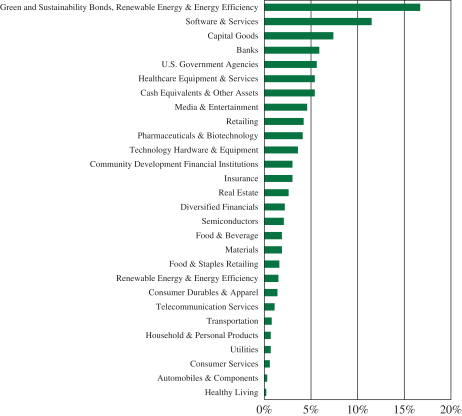
GREEN CENTURY BALANCED FUND
INVESTMENT BY INDUSTRY (unaudited)
4
for corporate and government policies to confront domestic inequality, we celebrate the recent reduction of global poverty levels as supported by more transparent and responsible corporate supply chains. There is a lot at stake in 2020, across a range of urgent social and environmental matters, but there is also a lot to celebrate as we reflect on the past quarter, year, and decade. With so many social and environmental issues actively vying for attention, we also maintain a deep conviction that sustainable, responsible, and engaging investment practices will continue to provide critical value to clients, to society, and to the planet.
The Green Century Balanced Fund invests in the stocks and bonds of environmentally responsible corporations of various sizes, including small, medium, and large companies. The Green Century Balanced Fund does not invest in fossil fuels though most other diversified mutual funds do.
The value of the stocks held in the Balanced Fund will fluctuate in response to factors that may affect a single issuer, industry, or sector of the economy or may affect the market as a whole. Bonds are subject to a variety of risks including interest rate, credit, and inflation risk.
THE GREEN CENTURY EQUITY FUND
The Green Century Equity Fund invests essentially all of its assets in the stocks which make up the MSCI KLD 400 Social ex Fossil Fuels Index (the KLD 400 Index or the Index),3 comprised primarily of large capitalization U.S. companies selected based on comprehensive environmental, social and governance sustainability criteria. The Equity Fund seeks to provide shareholders with a long-term total return that matches that of the Index.
| CUMULATIVE RETURNS* | AVERAGE ANNUAL RETURNS* | |||||||||||||||||
| Six Months | One Year | Five Years | Ten Years | |||||||||||||||
| December 31, 2019 | Green Century Equity Fund — Individual Investor Share Class | 10.50% | 30.72% | 10.92% | 12.24% | |||||||||||||
| Green Century Equity Fund — Institutional Share Class | 10.67% | 31.11% | 11.04% | 12.30% | ||||||||||||||
| S&P 500® Index4 | 10.92% | 31.49% | 11.70% | 13.56% | ||||||||||||||
| January 31, 2020 | Green Century Equity Fund — Individual Investor Share Class | 9.03% | 22.10% | 11.75% | 8.81% | |||||||||||||
| Green Century Equity Fund — Institutional Share Class | 9.22% | 22.50% | 11.87% | 8.83% | ||||||||||||||
| S&P 500® Index4 | 9.31% | 21.68% | 12.37% | 9.89% | ||||||||||||||
The Individual Investor Share Class total expense ratio of the Fund is 1.25% and the Institutional Share Class total expense ratio of the Fund is 0.95% as of the most recent prospectus.
* The performance data quoted represents past performance and is not a guarantee of future results. Investment return and principal value of an investment will fluctuate so that an investor’s shares, when redeemed, may be worth more or less than their original cost. Current performance may be lower or higher than the performance information quoted. To obtain performance information as of the most recent month-end, call 1-800-93-GREEN. Performance includes the reinvestment of income dividends and capital gain distributions. Performance shown does not reflect the deduction of taxes that a shareholder might pay on Fund distributions or the redemption of Fund shares. A redemption fee of 2.00% may be imposed on redemptions or exchanges of shares you have owned for 60 days or less. Please see the Prospectus for more information.
As of April 1, 2014, the Equity Fund invests in the common stocks which make up the MSCI KLD 400 Social ex Fossil Fuel Index; prior to April 1, 2014, the Fund invested in the common stocks which made up the MSCI KLD 400 Social Index.
5
During the six month period ended January 31, 2020, the Green Century Equity Fund, which closely tracks the KLD 400 Index, underperformed the S&P 500® Index (the S&P 500) by 28 basis points in the Individual Investor Share Class and by 9 basis points in the Institutional Share Class. The Equity Fund returned 9.03% in the Individual Investor Share Class and 9.22% in the Institutional Share Class for this six month period ended January 31, 2020, while the S&P 500 returned 9.31% during the same period.
As the KLD 400 Index does not include all of the stocks in the S&P 500 and includes some stocks not in the S&P 500 Index, the performance of the Equity Fund can be expected to differ from the performance of the broader benchmark. The difference in performance of the Equity Fund relative to the S&P 500 was influenced by differences in sector allocation and stock selection criteria between the Fund and the Index.
According to an analysis by the Fund’s portfolio managers, the strongest performing sectors in the Equity Fund were Utilities, Information Technology and Health Care, which returned 21.91%, 14.22%, and 12.76%, respectively. The worst performing sectors were Industrials and Materials, which returned 3.36% and 4.67%, respectively, for the six month period.
Within the S&P 500® Index, Information Technology and Utilities were the strongest performing sectors, gaining 18.95% and 17.82%, respectively. The worst performing sectors were Energy and Materials, which returned –10.51% and 0.06%, respectively, for the six month period.
The Equity Fund benefitted by not owning any securities in the Energy sector, which was the worst performing sector of the S&P 500 during the six month period, returning –10.51%. The performance of the Fund, relative to the S&P 500® Index, was positively impacted by stock selection within the Consumer Discretionary, Materials and Utilities sectors. The
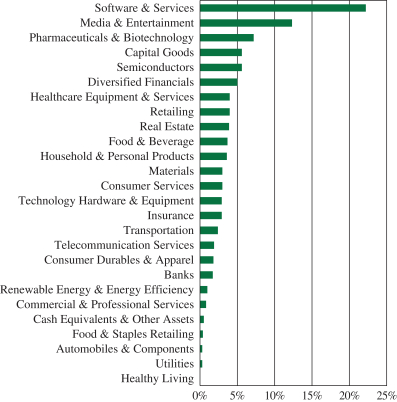
GREEN CENTURY EQUITY FUND
INVESTMENT BY INDUSTRY (unaudited)
6
relative performance of the Fund was negatively impacted by stock selection within the Information Technology, Financials, and Industrials sectors.
The Equity Fund, like other mutual funds invested primarily in stocks, carries the risk of investing in the stock market. The large companies in which the Equity Fund is invested may perform worse than the stock market as a whole. The Equity Fund will not shift concentration from one industry to another or from stocks to bonds or cash, in order to defend against a falling stock market.
THE GREEN CENTURY MSCI INTERNATIONAL INDEX FUND
The Green Century MSCI International Index Fund (the International Fund) invests in the stocks which make up the MSCI World ex USA SRI ex Fossil Fuels Index (the Index),5 comprised primarily of foreign companies selected based on comprehensive environmental, social and governance (ESG) sustainability criteria. The International Fund seeks to provide shareholders with a long-term total return that matches that of the Index.
| CUMULATIVE RETURNS* | AVERAGE ANNUAL RETURNS* | |||||||||||||
| Inception Date: September 30, 2016 | Six Months | One Year | Since Inception | |||||||||||
| December 31, 2019 | Green Century International Fund — Individual Investor Share Class | 8.56% | 25.02% | 8.05% | ||||||||||
| Green Century International Fund — Institutional Share Class | 8.79% | 25.50% | 8.36% | |||||||||||
| MSCI World ex USA Index6 | 6.85% | 22.49% | 8.46% | |||||||||||
| January 31, 2020 | Green Century International Fund — Individual Investor Share Class | 8.82% | 15.43% | 7.28% | ||||||||||
| Green Century International Fund — Institutional Share Class | 8.86% | 15.78% | 7.55% | |||||||||||
| MSCI World ex USA Index6 | 6.06% | 12.12% | 7.60% | |||||||||||
The Individual Investor Share Class total expense ratio of the Fund is 1.28% and the Institutional Share Class total expense ratio of the Fund is 0.98% as of the most recent prospectus.
* The performance data quoted represents past performance and is not a guarantee of future results. Investment return and principal value of an investment will fluctuate so that an investor’s shares, when redeemed, may be worth more or less than their original cost. Current performance may be lower or higher than the performance information quoted. To obtain performance information as of the most recent month-end, call 1-800-93-GREEN. Performance includes the reinvestment of income dividends and capital gain distributions. Performance shown does not reflect the deduction of taxes that a shareholder might pay on Fund distributions or the redemption of Fund shares. A redemption fee of 2.00% may be imposed on redemptions or exchanges of shares you have owned for 60 days or less. Please see the Prospectus for more information.
The Green Century MSCI International Index Fund closely tracks the MSCI World ex USA SRI ex Fossil Fuels Index. The International Fund’s Individual Investor Share Class returned 8.82% and the International Fund’s Institutional Share Class returned 8.86% for the six-month period ended January 31, 2020, outperforming the MSCI World ex USA Index, the Fund’s benchmark, which returned 6.06% during the same period.
7
The MSCI World ex USA Index is not a values-based or SRI screened index and may invest in fossil fuels, nuclear weapons, and producers of genetically modified organisms. The difference in performance of the International Fund relative to this Index was largely due to differences in sector allocation and stock selection criteria between the Fund and the Index.
According to an analysis by the Fund’s portfolio managers, the Energy sector was the worst-performing sector of the Index during the period, returning –10.78%. The International Fund does not hold any securities in the Energy sector, contributing to a slight outperformance versus the Index. The International Fund’s performance relative to the Index was hindered by stock selection in Financials sector, but boosted by stock selection in sectoral sectors, including Consumer Services, Consumer Discretionary, Health Care, Information Technology, and Materials.
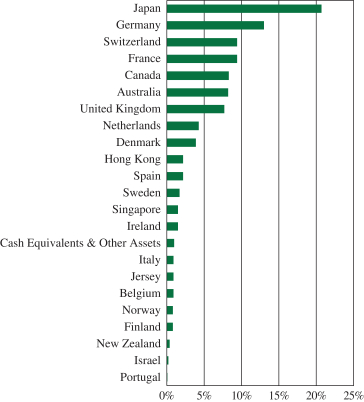
The International Fund, like other mutual funds invested primarily in stocks, carries the risk of investing in the stock market. The developed ex-U.S. equities in which the International Fund is invested may perform worse than the stock market as a whole. The International Fund will not shift concentration from one industry to another or from stocks to bonds or cash, in order to defend against a falling stock market.
GREEN CENTURY MSCI INTERNATIONAL INDEX FUND
INVESTMENT BY COUNTRY (unaudited)
8
The Green Century Funds’ proxy voting guidelines and a record of the Funds’ proxy votes for the year ended June 30, 2019 are available without charge, upon request, (i) at www.greencentury.com, (ii) by calling 1-800-93-GREEN, (iii) sending an e-mail to info@greencentury.com, and (iv) on the Securities and Exchange Commission’s website at www.sec.gov.
The Green Century Funds file their complete schedule of portfolio holdings with the SEC for the first and third quarters of the year on Form N-Q. The Green Century Funds’ Forms N-Q are available on the EDGAR database on the SEC’s website at www.sec.gov. Copies may be obtained upon payment of a duplicating fee, by writing the SEC’s Public Reference Section, Washington DC 2049-0102 or by electronic request at the following e-mail address: publicinfo@sec.gov. The information on Form N-Q may also be obtained by calling 1-800-93-GREEN, or by e-mailing a request to info@greencentury.com.
1 As of January 31, 2020, the following companies comprised the listed percentages of each of the Green Century Funds:
| Portfolio Holdings | GREEN CENTURY BALANCED FUND | GREEN CENTURY EQUITY FUND | GREEN CENTURY INTERNATIONAL INDEX FUND | |||||||||
adidas AG | 0.00 | % | 0.00 | % | 1.43 | % | ||||||
Tesla, Inc. | 0.00 | % | 0.65 | % | 0.00 | % | ||||||
U.S. International Development Finance Corporation | 2.04 | % | 0.00 | % | 0.00 | % | ||||||
The Kroger Co. | 0.00 | % | 0.16 | % | 0.00 | % | ||||||
Darden Restaurants, Inc. | 0.00 | % | 0.11 | % | 0.00 | % | ||||||
Mastercard, Inc. Class A | 2.57 | % | 2.10 | % | 0.00 | % | ||||||
ASML Holding NV | 0.78 | % | 0.00 | % | 2.99 | % | ||||||
Target Corporation | 0.84 | % | 0.00 | % | 0.00 | % | ||||||
| Portfolio Holdings | GREEN CENTURY BALANCED FUND | GREEN CENTURY EQUITY FUND | GREEN CENTURY INTERNATIONAL INDEX FUND | |||||||||
Costco Wholes Corporation | 1.09 | % | 0.00 | % | 0.00 | % | ||||||
American Water Works Company, Inc. | 0.72 | % | 0.18 | % | 0.00 | % | ||||||
Apple, Inc. | 4.06 | % | 0.00 | % | 0.00 | % | ||||||
Cigna Corporation | 1.44 | % | 0.54 | % | 0.00 | % | ||||||
Gilead Sciences, Inc. | 0.84 | % | 0.59 | % | 0.00 | % | ||||||
Lincoln National Corporation | 0.86 | % | 0.08 | % | 0.00 | % | ||||||
International Flavors & Fragrances, Inc. | 0.74 | % | 0.10 | % | 0.00 | % | ||||||
Xilinx, Inc. | 0.40 | % | 0.00 | % | 0.00 | % | ||||||
Portfolio composition will change due to ongoing management of the Funds. Please refer to the Green Century Funds website for current information regarding the Funds’ portfolio holdings. Note that some of the holdings discussed above may not have been held by any Fund during the six-month period ended January 31, 2020, or may have been held by a Fund for a portion of the period, or may have been held by a Fund for the entire period. These holdings are subject to risk as described in the Funds’ prospectus. References to specific investments should not be construed as a recommendation of the securities by the Funds, their administrator, or their distributor.
2 The Custom Balanced Index is comprised of a 60% weighting in the S&P 1500 Index and a 40% weighting in the BofA Merrill Lynch 1-10 Year US Corporate & Government Index (the BofA Merrill Lynch Index). The S&P Supercomposite 1500 Index is an unmanaged broad-based capitalization-weighted index comprising 1500 stocks of large-cap, mid-cap, and small-cap U.S. companies. The BofA Merrill Lynch Index tracks the performance of U.S. dollar-denominated investment grade government and corporate public debt issued in the U.S. domestic bond market with at least 1 year and less than 10 years remaining maturity, including U.S. treasury, U.S. agency, foreign government, supranational and corporate securities. It is not possible to invest directly in the Custom Balanced Index, the S&P Supercomposite 1500 Index, or the BofA Merrill Lynch Index.
3 The MSCI KLD 400 Social ex Fossil Fuels Index (the KLD400 ex Fossil Fuels Index) is a custom index calculated by MSCI Inc. and is comprised of the common stocks of the approximately 400 companies in the MSCI KLD 400 Social Index (the KLD400 Index), minus the stocks of the companies that explore for, extract, produce, manufacture or refine coal, oil or gas or produce or transmit electricity derived from fossil fuels or transmit natural gas or have carbon reserves included in the KLD400 Index. The KLD400 Index is a free float-adjusted market capitalization index designed to provide exposure to U.S. companies that have positive Environmental, Social and Governance (ESG) characteristics and consists of approximately 400 companies selected from the MSCI USA Investable Market Index. It is not possible to invest directly in an index.
9
4 The S&P 500® Index is an unmanaged index of 500 selected common stocks, most of which are listed on the New York Stock Exchange. The S&P 500® Index is heavily weighted toward stocks with large market capitalization and represents approximately two-thirds of the total market value of all domestic stocks. It is not possible to invest directly in the S&P 500® Index.
5 The World ex USA SRI ex Fossil Fuels Index is a custom index calculated by MSCI Inc. The World ex USA SRI ex Fossil Fuels Index is comprised of the common stocks of the companies in the MSCI World ex USA SRI Index (the World ex USA SRI Index), minus the stocks of the companies that explore for, extract, produce, manufacture or refine coal, oil or gas or produce or transmit electricity derived from fossil fuels or transmit natural gas or have carbon reserves included in the World ex USA SRI (Socially Responsible Investment) Index. The World ex USA SRI Index includes large and mid-cap stocks from approximately 22 developed market countries (excluding the U.S.). The World ex USA SRI Index is a capitalization weighted index that provides exposure to companies with what MSCI calculates to have outstanding ESG ratings and excludes companies whose products have negative social or environmental impacts. It is not possible to invest directly in an index.
6 The MSCI World ex USA Index is a custom index calculated by MSCI Inc. The MSCI World ex USA Index includes large and mid-cap stocks across 22 of 23 Developed Markets countries and excludes the United States. With 1,023 constituents, the index covers approximately 85% of the free float-adjusted market capitalization in each country. The MSCI World ex USA Index is a free float-adjusted market capitalization index. It is not possible to invest directly in the MSCI World ex USA Index.
The Funds’ environmental criteria limit the investments available to the Funds compared to mutual funds that do not use environmental criteria.
This information has been prepared from sources believed reliable. The views expressed are as of the date of publication and are those of the Advisor to the Funds.
This material must be preceded or accompanied by a current Prospectus.
Distributor: UMB Distribution Services, LLC 2/20
The Green Century Equity Fund and the Green Century MSCI International Index Fund (the “Funds”) are not sponsored, endorsed, or promoted by MSCI, its affiliates, information providers or any other third party involved in, or related to, compiling, computing or creating the MSCI indices (the “MSCI Parties”), and the MSCI Parties bear no liability with respect to the Funds or any index on which a Fund is based. The MSCI Parties are not sponsors of the Funds and are not affiliated with the Funds in any way. The Statement of Additional Information contains a more detailed description of the limited relationship the MSCI Parties have with Green Century Capital Management and the Funds.
10
GREEN CENTURY FUNDS EXPENSE EXAMPLE
For the six months ended January 31, 2020 (unaudited)
As a shareholder of the Green Century Funds (the “Funds”), you incur two types of costs: (1) transaction costs, including redemption fees on certain redemptions; and (2) ongoing costs, including management fees and other Fund expenses. This example is intended to help you understand your ongoing costs (in dollars) of investing in the Funds and to compare these costs with the ongoing costs of investing in other mutual funds.
The example is based on an investment of $1,000 invested at the beginning of the period and held for the entire period from August 1, 2019 to January 31, 2020 (the “period”).
Actual Expenses The first line of the table below provides information about actual account values and actual expenses. You may use the information in this line, together with the amount you invested, to estimate the expenses you paid over the period. Simply divide your account value by $1,000 (for example, an $8,600 account value divided by $1,000 equals 8.6), then multiply the result by the number in the first line under the heading entitled “Expenses Paid During the Period” to estimate the expenses you paid on your account during the period.
Hypothetical Example for Comparison Purposes The second line of the table below provides information about hypothetical account values and hypothetical expenses based on the Funds’ actual expense ratios and an assumed rate of return of 5% per year before expenses, which is not the actual return of either of the Funds. The hypothetical account values and expenses may not be used to estimate the actual ending account balance or expenses you paid for the period. You may use this information to compare the ongoing costs of investing in the Funds and other funds. To do so, compare this 5% hypothetical example with the 5% hypothetical examples that appear in the shareholder reports of other funds.
Please note that the expenses shown in the table are meant to highlight your ongoing costs only and do not reflect any transactional costs, such as redemption fees on shares held for 60 days or less. Therefore, the second line of the table is useful in comparing the ongoing costs only, and will not help you determine the relative total costs of owning different funds. In addition, if these transactional costs were included, your costs could have been higher.
| BEGINNING ACCOUNT VALUE AUGUST 1, 2019 | ENDING ACCOUNT VALUE JANUARY 31, 2020 | EXPENSES PAID DURING THE PERIOD1 | ||||||||||
Balanced Fund | ||||||||||||
Actual Expenses | $ | 1,000.00 | $ | 1,041.30 | $ | 7.56 | ||||||
Hypothetical Example, assuming a 5% return before expenses | 1,000.00 | 1,017.59 | 7.48 | |||||||||
11
| BEGINNING ACCOUNT VALUE AUGUST 1, 2019 | ENDING ACCOUNT VALUE JANUARY 31, 2020 | EXPENSES PAID DURING THE PERIOD | ||||||||||
Equity Fund | ||||||||||||
Actual Expenses — Individual Investor Class1 | $ | 1,000.00 | $ | 1,090.30 | $ | 6.57 | ||||||
Actual Expenses — Institutional Class1 | 1,000.00 | 1,092.20 | 5.00 | |||||||||
Hypothetical Example, assuming a 5% return before expenses | 1,000.00 | 1,018.72 | 6.34 | |||||||||
Hypothetical Example, assuming a 5% return before expenses | 1,000.00 | 1,020.22 | 4.82 | |||||||||
| BEGINNING ACCOUNT VALUE AUGUST 1, 2019 | ENDING ACCOUNT VALUE JANUARY 31, 2020 | EXPENSES PAID DURING THE PERIOD1 | ||||||||||
International Index Fund | ||||||||||||
Actual Expenses — Individual Investor Class | $ | 1,000.00 | $ | 1,088.20 | $ | 6.72 | ||||||
Actual Expenses — Institutional Class | 1,000.00 | 1,088.60 | 5.15 | |||||||||
Hypothetical Example, assuming a 5% return before expenses | 1,000.00 | 1,018.56 | 6.50 | |||||||||
Hypothetical Example, assuming a 5% return before expenses | 1,000.00 | 1,020.07 | 4.98 | |||||||||
1 Expenses are equal to the Funds’ annualized expense ratios (1.47% for the Balanced Fund, 1.25% for the Equity Fund Individual Investor Class, 0.95% for the Equity Fund Institutional Class, 1.28% for the International Index Fund Individual Investor Class and 0.98% for the International Index Fund Institutional Class), multiplied by the average account value over the period, multiplied by 184/366 (to reflect the one-half year period).
12
GREEN CENTURY BALANCED FUND PORTFOLIO OF INVESTMENTS January 31, 2020 (unaudited) |
COMMON STOCKS — 63.4% |
| |||||||
| SHARES | VALUE | |||||||
Software & Services — 9.3% |
| |||||||
Adobe, Inc. (a) | 6,573 | $ | 2,308,043 | |||||
Autodesk, Inc. (a) | 11,965 | 2,355,310 | ||||||
Blackbaud, Inc. | 20,007 | 1,567,148 | ||||||
Mastercard, Inc., Class A | 23,949 | 7,566,447 | ||||||
Microsoft Corporation | 57,484 | 9,785,501 | ||||||
PayPal Holdings, Inc. (a) | 35,015 | 3,987,859 | ||||||
|
| |||||||
| 27,570,308 | ||||||||
|
| |||||||
Capital Goods — 6.7% |
| |||||||
A.O. Smith Corporation | 36,108 | 1,541,451 | ||||||
Deere & Company | 8,712 | 1,381,549 | ||||||
Eaton Corporation PLC | 30,012 | 2,835,234 | ||||||
Hexcel Corporation | 37,314 | 2,769,445 | ||||||
Illinois Tool Works, Inc. | 11,220 | 1,963,276 | ||||||
Ingersoll-Rand PLC | 26,748 | 3,563,636 | ||||||
Middleby Corporation (The) (a) | 10,569 | 1,185,419 | ||||||
Rockwell Automation, Inc. | 4,605 | 882,594 | ||||||
Westinghouse Air Brake Technologies Corporation | 25,178 | 1,859,647 | ||||||
Xylem, Inc. | 21,084 | 1,721,719 | ||||||
|
| |||||||
| 19,703,970 | ||||||||
|
| |||||||
Healthcare Equipment & Services — 5.4% |
| |||||||
Baxter International, Inc. | 28,987 | 2,586,220 | ||||||
Cigna Corporation | 22,049 | 4,241,787 | ||||||
CVS Health Corp. | 31,621 | 2,144,536 | ||||||
Medtronic PLC | 22,868 | 2,639,882 | ||||||
Quest Diagnostics, Inc. | 13,466 | 1,490,282 | ||||||
Stryker Corporation | 12,760 | 2,688,532 | ||||||
|
| |||||||
| 15,791,239 | ||||||||
|
| |||||||
Banks — 4.9% |
| |||||||
East West Bancorp, Inc. | 48,545 | 2,225,303 | ||||||
First Republic Bank | 32,474 | 3,600,717 | ||||||
KeyCorp | 234,010 | 4,378,327 | ||||||
PNC Financial Services Group, Inc. (The) | 29,597 | 4,396,634 | ||||||
|
| |||||||
| 14,600,981 | ||||||||
|
| |||||||
Media & Entertainment — 4.3% |
| |||||||
Alphabet, Inc., Class A (a) | 6,261 | 8,970,635 | ||||||
Facebook, Inc., Class A (a) | 13,120 | 2,649,059 | ||||||
| SHARES | VALUE | |||||||
Media & Entertainment —(continued) |
| |||||||
New York Times Company (The), Class A | 32,464 | $ | 1,039,173 | |||||
|
| |||||||
| 12,658,867 | ||||||||
|
| |||||||
Retailing — 4.2% | ||||||||
Booking Holdings, Inc. (a) | 968 | 1,771,972 | ||||||
Home Depot, Inc. (The) | 13,443 | 3,066,348 | ||||||
Target Corporation | 22,417 | 2,482,459 | ||||||
TJX Companies, Inc. (The) | 47,508 | 2,804,872 | ||||||
Tractor Supply Company | 25,106 | 2,333,603 | ||||||
|
| |||||||
| 12,459,254 | ||||||||
|
| |||||||
Pharmaceuticals & Biotechnology — 4.1% |
| |||||||
Gilead Sciences, Inc. | 39,389 | 2,489,385 | ||||||
Illumina, Inc. (a) | 7,858 | 2,279,370 | ||||||
IQVIA Holdings, Inc. (a) | 15,895 | 2,467,699 | ||||||
Merck & Company, Inc | 55,816 | 4,768,919 | ||||||
|
| |||||||
| 12,005,373 | ||||||||
|
| |||||||
Technology Hardware & Equipment — 3.6% |
| |||||||
Apple, Inc. | 25,155 | 7,785,724 | ||||||
Palo Alto Networks, Inc. (a) | 11,443 | 2,686,588 | ||||||
|
| |||||||
| 10,472,312 | ||||||||
|
| |||||||
Insurance — 3.0% |
| |||||||
Aflac, Inc. | 56,782 | 2,928,248 | ||||||
Lincoln National Corporation | 46,732 | 2,545,959 | ||||||
Travelers Companies, Inc. (The) | 25,349 | 3,336,435 | ||||||
|
| |||||||
| 8,810,642 | ||||||||
|
| |||||||
Real Estate — 2.2% | ||||||||
American Tower Corporation | 10,311 | 2,389,471 | ||||||
AvalonBay Communities, Inc. | 10,785 | 2,337,002 | ||||||
Boston Properties, Inc. | 12,467 | 1,787,144 | ||||||
|
| |||||||
| 6,513,617 | ||||||||
|
| |||||||
Semiconductors — 2.1% | ||||||||
Analog Devices, Inc. | 24,092 | 2,644,097 | ||||||
ASML Holding NV (b) | 8,209 | 2,303,938 | ||||||
Xilinx, Inc. | 13,861 | 1,170,977 | ||||||
|
| |||||||
| 6,119,012 | ||||||||
|
| |||||||
Food & Beverage — 1.9% | ||||||||
McCormick & Company, Inc. | 14,991 | 2,449,080 | ||||||
13
GREEN CENTURY BALANCED FUND PORTFOLIO OF INVESTMENTS January 31, 2020 (unaudited) | continued |
| SHARES | VALUE | |||||||
Food & Beverage — (continued) |
| |||||||
Unilever NV (b) | 56,418 | $ | 3,288,041 | |||||
|
| |||||||
| 5,737,121 | ||||||||
|
| |||||||
Materials — 1.9% |
| |||||||
Ball Corporation | 38,017 | 2,744,067 | ||||||
Ingevity Corporation (a) | 9,403 | 613,264 | ||||||
International Flavors & Fragrances, Inc. | 16,689 | 2,188,095 | ||||||
|
| |||||||
| 5,545,426 | ||||||||
|
| |||||||
Food & Staples Retailing — 1.6% | ||||||||
Costco Wholesale Corporation | 10,528 | 3,216,515 | ||||||
Sysco Corporation | 18,023 | 1,480,409 | ||||||
|
| |||||||
| 4,696,924 | ||||||||
|
| |||||||
Renewable Energy & Energy Efficiency — 1.5% |
| |||||||
First Solar, Inc. (a) | 30,177 | 1,496,176 | ||||||
Hannon Armstrong Sustainable Infrastructure Capital, Inc. | 33,225 | 1,132,640 | ||||||
Ormat Technologies, Inc. | 24,340 | 1,929,188 | ||||||
|
| |||||||
| 4,558,004 | ||||||||
|
| |||||||
Consumer Durables & Apparel — 1.4% |
| |||||||
NIKE, Inc., Class B | 24,970 | 2,404,611 | ||||||
VF Corporation | 19,571 | 1,623,806 | ||||||
|
| |||||||
| 4,028,417 | ||||||||
|
| |||||||
Telecommunication Services — 1.1% |
| |||||||
Verizon Communications, Inc. | 55,645 | 3,307,539 | ||||||
|
| |||||||
Diversified Financials — 1.1% |
| |||||||
Bank of New York Mellon | ||||||||
Corporation (The) | 29,888 | 1,338,385 | ||||||
Charles Schwab Corporation (The) | 38,304 | 1,744,747 | ||||||
|
| |||||||
| 3,083,132 | ||||||||
|
| |||||||
Transportation — 0.8% |
| |||||||
J.B. Hunt Transport Services, Inc. | 9,336 | 1,007,635 | ||||||
United Parcel Service, Inc., Class B | 14,085 | 1,458,079 | ||||||
|
| |||||||
| 2,465,714 | ||||||||
|
| |||||||
Household & Personal Products — 0.7% |
| |||||||
Procter & Gamble Company (The) | 17,374 | 2,165,148 | ||||||
|
| |||||||
Utilities — 0.7% |
| |||||||
American Water Works Company, Inc. | 15,570 | 2,120,634 | ||||||
|
| |||||||
| SHARES | VALUE | |||||||
Consumer Services — 0.6% |
| |||||||
Starbucks Corporation | 21,537 | $ | 1,826,984 | |||||
|
| |||||||
Automobiles & Components — 0.3% |
| |||||||
BorgWarner, Inc. | 29,100 | 997,839 | ||||||
|
| |||||||
Total Common Stocks | 187,238,457 | |||||||
|
| |||||||
| PRINCIPAL AMOUNT | ||||||||
BONDS & NOTES — 31.1% |
| |||||||
Green and Sustainability Bonds, Renewable Energy & Energy Efficiency — 16.7% |
| |||||||
Apple, Inc. | $ | 3,000,000 | 3,109,209 | |||||
Apple, Inc. | 1,000,000 | 1,069,416 | ||||||
Asian Development Bank | 1,000,000 | 1,035,762 | ||||||
BlueHub Loan Fund, Inc. | 2,000,000 | 2,027,148 | ||||||
Boston Properties LP | 3,000,000 | 3,496,032 | ||||||
City & County of San Francisco CA Community Facilities District No. 2014-1 | 650,000 | 671,515 | ||||||
City of San Francisco CA Public Utilities Commission Water Revenue | 2,000,000 | 2,088,700 | ||||||
Digital Realty Trust LP | 2,000,000 | 2,094,670 | ||||||
European Investment Bank | 2,000,000 | 2,101,190 | ||||||
European Investment Bank | 500,000 | 520,494 | ||||||
International Bank for Reconstruction & Development 2.125%, due 3/3/25 (b) | 2,000,000 | 2,069,508 | ||||||
International Finance Corporation | 500,000 | 519,548 | ||||||
Kommunalbanken AS 1.375%, due 10/26/20 (b)(d) | 2,000,000 | 1,998,074 | ||||||
14
GREEN CENTURY BALANCED FUND PORTFOLIO OF INVESTMENTS January 31, 2020 (unaudited) | continued |
| PRINCIPAL AMOUNT | VALUE | |||||||
Green and Sustainability Bonds, Renewable Energy & Energy Efficiency — (continued) |
| |||||||
Korea Development Bank (The) 2.625% (LIBOR 3 Month +72.50000 basis points), due 7/6/22 (b)(e) | $ | 1,250,000 | $ | 1,260,029 | ||||
Kreditanstalt fuer Wiederaufbau | 1,000,000 | 1,010,612 | ||||||
National Australia Bank Ltd. | 2,000,000 | 2,114,594 | ||||||
Nederlandse Waterschapsbank NV | 1,000,000 | 1,047,635 | ||||||
Nordic Investment Bank | 1,500,000 | 1,519,624 | ||||||
Regency Centers LP | 2,000,000 | 2,129,886 | ||||||
San Francisco Bay Area Rapid Transit District | 2,000,000 | 2,094,140 | ||||||
Starbucks Corporation | 3,000,000 | 3,092,304 | ||||||
Sumitomo Mitsui Banking Corporation | 2,000,000 | 2,010,722 | ||||||
Svensk Exportkredit AB | 1,500,000 | 1,501,528 | ||||||
United States International Development Finance Corporation | 744,986 | 796,457 | ||||||
United States International Development Finance Corporation | 1,460,400 | 1,574,129 | ||||||
United States International Development Finance Corporation | 3,000,000 | 3,137,535 | ||||||
Verizon Communications, Inc. | 3,000,000 | 3,382,551 | ||||||
|
| |||||||
| 49,473,012 | ||||||||
|
| |||||||
| PRINCIPAL AMOUNT | VALUE | |||||||
U.S. Government Agencies — 5.6% |
| |||||||
Federal Farm Credit Banks Funding Corporation | $ | 200,000 | $ | 200,196 | ||||
Federal Farm Credit Banks Funding Corporation | 3,000,000 | 3,012,990 | ||||||
Federal Farm Credit Banks Funding Corporation | 500,000 | 518,157 | ||||||
Federal Farm Credit Banks Funding Corporation | 3,000,000 | 3,052,167 | ||||||
Federal Farm Credit Banks Funding Corporation | 3,000,000 | 3,254,082 | ||||||
Federal Farm Credit Banks Funding Corporation | 3,000,000 | 3,000,051 | ||||||
Federal Home Loan Banks | 3,000,000 | 3,043,029 | ||||||
United States International Development Finance Corporation | 230,260 | 248,726 | ||||||
United States International Development Finance Corporation | 219,869 | 242,525 | ||||||
|
| |||||||
| 16,571,923 | ||||||||
|
| |||||||
Community Development Financial Institutions — 3.0% |
| |||||||
Capital Impact Partners | 2,000,000 | 2,001,760 | ||||||
Enterprise Community Loan Fund, Inc. | 3,000,000 | 3,218,922 | ||||||
Local Initiatives Support Corporation | 2,000,000 | 2,120,112 | ||||||
Reinvestment Fund, Inc. (The) | 1,400,000 | 1,472,625 | ||||||
|
| |||||||
| 8,813,419 | ||||||||
|
| |||||||
15
GREEN CENTURY BALANCED FUND PORTFOLIO OF INVESTMENTS January 31, 2020 (unaudited) | concluded |
| PRINCIPAL AMOUNT | VALUE | |||||||
Software & Services — 2.2% |
| |||||||
Adobe, Inc. | $ | 3,000,000 | $ | 3,209,610 | ||||
salesforce.com, Inc. | 3,000,000 | 3,356,889 | ||||||
|
| |||||||
| 6,566,499 | ||||||||
|
| |||||||
Diversified Financials — 1.1% |
| |||||||
Bank of New York Mellon Corporation (The) | 1,000,000 | 1,030,187 | ||||||
State Street Corporation | 2,000,000 | 2,085,866 | ||||||
|
| |||||||
| 3,116,053 | ||||||||
|
| |||||||
Banks — 0.9% |
| |||||||
HSBC Holdings PLC | 1,500,000 | 1,557,640 | ||||||
JPMorgan Chase & Company | 1,000,000 | 1,012,633 | ||||||
|
| |||||||
| 2,570,273 | ||||||||
|
| |||||||
Capital Goods — 0.7% |
| |||||||
Ingersoll-Rand Luxembourg Finance SA | 2,000,000 | 2,204,738 | ||||||
|
| |||||||
Real Estate — 0.4% |
| |||||||
Healthpeak Properties Inc | 1,000,000 | 1,077,736 | ||||||
|
| |||||||
Media & Entertainment — 0.3% |
| |||||||
Oracle Corporation | 1,000,000 | 1,018,355 | ||||||
|
| |||||||
Healthy Living — 0.2% |
| |||||||
Whole Foods Market, Inc. | 500,000 | 573,685 | ||||||
|
| |||||||
Total Bonds & Notes | 91,985,693 | |||||||
|
| |||||||
CERTIFICATES OF DEPOSIT — 0.1% |
| |||||||
| PRINCIPAL AMOUNT | VALUE | |||||||
Self-Help Federal Credit Union | $ | 240,000 | $ | 239,971 | ||||
|
| |||||||
Total Certificates Of Deposit | 239,971 | |||||||
|
| |||||||
SHORT-TERM INVESTMENTS — 5.2% |
| |||||||
UMB Money Market Fiduciary Account, 0.25% (f) | 15,222,926 | |||||||
|
| |||||||
Total Short-term Investments | 15,222,926 | |||||||
|
| |||||||
TOTAL INVESTMENTS (g) — 99.8% |
| |||||||
(Cost $223,680,422) | 294,687,047 | |||||||
Other Assets Less | 667,368 | |||||||
|
| |||||||
NET ASSETS — 100.0% |
| $ | 295,354,415 | |||||
|
| |||||||
| (a) | Non-income producing security. |
| (b) | Securities whose value are determined or significantly influenced by trading in markets other than the United States or Canada. |
| (c) | Callable |
| (d) | Security exempt from registration under Rule 144A of the Securities Act of 1933. These securities are restricted and may be resold in transactions exempt from registration normally to qualified institutional buyers. The total value of these securities is $3,619,394. |
| (e) | Floating rate bond. Rate shown is currently in effect at January 31, 2020. |
| (f) | The rate quoted is the annualized seven-day yield of the fund at the period end. |
| (g) | The cost of investments for federal income tax purposes is $223,531,744 resulting in gross unrealized appreciation and depreciation of $73,713,146 and $2,557,843 respectively, or net unrealized appreciation of $71,155,303. |
See Notes to Financial Statements
16
GREEN CENTURY EQUITY FUND PORTFOLIO OF INVESTMENTS January 31, 2020 (unaudited) |
COMMON STOCKS — 99.5% | ||||||||
| SHARES | VALUE | |||||||
Software & Services — 22.2% |
| |||||||
Accenture PLC, Class A (a) | 15,740 | $ | 3,230,005 | |||||
Adobe, Inc. (b) | 12,000 | 4,213,680 | ||||||
ANSYS, Inc. (b) | 2,065 | 566,491 | ||||||
Autodesk, Inc. (b) | 5,416 | 1,066,140 | ||||||
Automatic Data Processing, Inc. | 10,742 | 1,841,071 | ||||||
Cadence Design Systems, Inc. (b). | 6,886 | 496,549 | ||||||
Citrix Systems, Inc. | 3,242 | 392,995 | ||||||
Cognizant Technology Solutions Corporation, Class A | 13,632 | 836,732 | ||||||
Fortinet, Inc. (b) | 3,567 | 411,489 | ||||||
International Business Machines Corporation | 21,896 | 3,147,112 | ||||||
Intuit, Inc. | 6,439 | 1,805,367 | ||||||
Mastercard, Inc., Class A | 22,305 | 7,047,042 | ||||||
Microsoft Corporation | 179,202 | 30,505,556 | ||||||
NortonLifeLock, Inc. | 15,254 | 433,519 | ||||||
Oracle Corporation | 57,698 | 3,026,260 | ||||||
salesforce.com, Inc. (b) | 20,592 | 3,754,128 | ||||||
Teradata Corporation (b) | 2,856 | 69,515 | ||||||
Truist Financial Corporation | 33,138 | 1,708,927 | ||||||
Visa, Inc., Class A | 42,656 | 8,487,264 | ||||||
VMware, Inc., Class A (b) | 2,008 | 297,305 | ||||||
Western Union Company (The) | 10,435 | 280,702 | ||||||
Workday, Inc., Class A (b) | 4,047 | 747,198 | ||||||
|
| |||||||
| 74,365,047 | ||||||||
|
| |||||||
Media & Entertainment — 12.3% |
| |||||||
Alphabet, Inc., Class A (b) | 7,400 | 10,602,572 | ||||||
Alphabet, Inc., Class C (b) | 7,723 | 11,076,558 | ||||||
Discovery, Inc., Class A (b) | 3,940 | 115,284 | ||||||
Discovery, Inc., Class C (b) | 9,158 | 254,318 | ||||||
Facebook, Inc., Class A (b) | 59,439 | 12,001,328 | ||||||
John Wiley & Sons, Inc., Class A . | 1,061 | 46,281 | ||||||
Liberty Global PLC, Class A (a)(b) | 4,132 | 84,789 | ||||||
Liberty Global PLC, Series C (a)(b) | 10,185 | 198,404 | ||||||
New York Times Company (The), Class A | 3,696 | 118,309 | ||||||
Omnicom Group, Inc. | 5,443 | 409,912 | ||||||
Scholastic Corporation | 689 | 22,703 | ||||||
Walt Disney Company (The) | 44,507 | 6,155,763 | ||||||
|
| |||||||
| 41,086,221 | ||||||||
|
| |||||||
| SHARES | VALUE | |||||||
Pharmaceuticals & Biotechnology — 7.2% |
| |||||||
AbbVie, Inc. | 36,558 | $ | 2,961,929 | |||||
Agilent Technologies, Inc. | 7,690 | 634,886 | ||||||
Amgen, Inc. | 14,824 | 3,202,725 | ||||||
Biogen, Inc. (b) | 4,547 | 1,222,461 | ||||||
BioMarin Pharmaceutical, Inc. (b) | 4,409 | 368,152 | ||||||
Bio-Techne Corporation | 942 | 197,792 | ||||||
Bristol-Myers Squibb Company | 57,952 | 3,648,078 | ||||||
Gilead Sciences, Inc. | 31,346 | 1,981,067 | ||||||
IQVIA Holdings, Inc. (b) | 4,155 | 645,064 | ||||||
Jazz Pharmaceuticals PLC (a)(b) | 1,392 | 199,543 | ||||||
Merck & Company, Inc. | 63,277 | 5,406,387 | ||||||
Mettler-Toledo International, Inc. (b) | 609 | 461,123 | ||||||
Vertex Pharmaceuticals, Inc. (b) | 6,335 | 1,438,362 | ||||||
Waters Corporation (b) | 1,636 | 366,120 | ||||||
Zoetis, Inc. | 11,769 | 1,579,518 | ||||||
|
| |||||||
| 24,313,207 | ||||||||
|
| |||||||
Capital Goods — 5.6% |
| |||||||
3M Company | 14,225 | 2,256,938 | ||||||
A.O. Smith Corporation | 3,403 | 145,274 | ||||||
AGCO Corporation | 1,597 | 112,014 | ||||||
Air Lease Corporation | 2,626 | 112,760 | ||||||
Allegion PLC (a) | 2,289 | 296,013 | ||||||
Applied Industrial Technologies, Inc. | 978 | 63,149 | ||||||
Builders FirstSource, Inc. (b) | 2,906 | 72,054 | ||||||
Caterpillar, Inc. | 13,907 | 1,826,684 | ||||||
Cummins, Inc. | 3,702 | 592,209 | ||||||
Deere & Company | 7,418 | 1,176,346 | ||||||
Dover Corporation | 3,567 | 406,103 | ||||||
Eaton Corporation PLC | 10,359 | 978,615 | ||||||
EMCOR Group, Inc. | 1,381 | 113,477 | ||||||
Fastenal Company | 14,152 | 493,622 | ||||||
Flowserve Corporation | 3,223 | 150,450 | ||||||
Fortive Corporation | 7,519 | 563,399 | ||||||
Fortune Brands Home & Security, Inc. | 3,435 | 236,019 | ||||||
Graco, Inc. | 4,150 | 220,573 | ||||||
Granite Construction, Inc. | 1,102 | 29,897 | ||||||
H&E Equipment Services, Inc. | 741 | 20,089 | ||||||
HD Supply Holdings, Inc. (b) | 4,234 | 172,493 | ||||||
Illinois Tool Works, Inc. | 7,994 | 1,398,790 | ||||||
Ingersoll-Rand PLC | 5,987 | 797,648 | ||||||
Lennox International, Inc. | 853 | 198,732 | ||||||
17
GREEN CENTURY EQUITY FUND PORTFOLIO OF INVESTMENTS January 31, 2020 (unaudited) | continued |
| SHARES | VALUE | |||||||
Capital Goods — (continued) |
| |||||||
Lincoln Electric Holdings, Inc. | 1,468 | $ | 130,916 | |||||
Masco Corporation | 7,110 | 337,867 | ||||||
Meritor, Inc. (b) | 1,748 | 38,299 | ||||||
Middleby Corporation (The) (b) | 1,383 | 155,117 | ||||||
Owens Corning | 2,693 | 162,900 | ||||||
PACCAR, Inc. | 8,543 | 633,976 | ||||||
Parker-Hannifin Corporation | 3,175 | 621,316 | ||||||
Quanta Services, Inc. | 3,479 | 136,203 | ||||||
Rockwell Automation, Inc. | 2,888 | 553,514 | ||||||
Roper Technologies, Inc. | 2,566 | 979,340 | ||||||
Sensata Technologies Holding NV (b) | 3,931 | 185,818 | ||||||
Snap-on, Inc. | 1,354 | 216,139 | ||||||
Spirit AeroSystems Holdings, Inc. | 2,566 | 167,611 | ||||||
Stanley Black & Decker, Inc. | 3,773 | 601,152 | ||||||
Tennant Company | 454 | 35,058 | ||||||
Timken Company (The) | 1,723 | 90,509 | ||||||
United Rentals, Inc. (b) | 1,924 | 261,068 | ||||||
W.W. Grainger, Inc. | 1,161 | 351,400 | ||||||
WABCO Holdings, Inc. (b) | 1,238 | 167,935 | ||||||
Westinghouse Air Brake Technologies Corporation | 4,473 | 330,376 | ||||||
Xylem, Inc. | 4,417 | 360,692 | ||||||
|
| |||||||
| 18,950,554 | ||||||||
|
| |||||||
Semiconductors — 5.6% |
| |||||||
Advanced Micro Devices, Inc. (b) | 25,405 | 1,194,035 | ||||||
Analog Devices, Inc. | 9,111 | 999,932 | ||||||
Applied Materials, Inc. | 22,889 | 1,327,333 | ||||||
Intel Corporation | 109,455 | 6,997,458 | ||||||
Lam Research Corporation | 3,561 | 1,061,926 | ||||||
Microchip Technology, Inc. | 5,916 | 576,692 | ||||||
NVIDIA Corporation | 14,301 | 3,381,185 | ||||||
Skyworks Solutions, Inc. | 4,239 | 479,643 | ||||||
Texas Instruments, Inc. | 23,080 | 2,784,602 | ||||||
|
| |||||||
| 18,802,806 | ||||||||
|
| |||||||
Diversified Financials — 5.0% |
| |||||||
Ally Financial, Inc. | 9,580 | 306,847 | ||||||
American Express Company | 17,428 | 2,263,374 | ||||||
Ameriprise Financial, Inc. | 3,251 | 537,748 | ||||||
Bank of New York Mellon Corporation (The) | 21,062 | 943,156 | ||||||
BlackRock, Inc. | 2,869 | 1,512,967 | ||||||
Charles Schwab Corporation (The) | 29,152 | 1,327,874 | ||||||
| SHARES | VALUE | |||||||
Diversified Financials — (continued) |
| |||||||
CME Group, Inc. | 8,858 | $ | 1,923,160 | |||||
E*TRADE Financial Corporation . | 5,898 | 251,373 | ||||||
Equitable Holdings, Inc. | 10,316 | 247,790 | ||||||
FactSet Research Systems, Inc. | 959 | 274,380 | ||||||
Franklin Resources, Inc. | 7,398 | 187,169 | ||||||
Intercontinental Exchange, Inc. | 13,879 | 1,384,291 | ||||||
Invesco Ltd. | 9,763 | 168,900 | ||||||
Legg Mason, Inc. | 2,175 | 85,151 | ||||||
Moody’s Corporation | 4,221 | 1,083,911 | ||||||
Northern Trust Corporation | 5,069 | 495,799 | ||||||
S&P Global, Inc. | 6,087 | 1,787,935 | ||||||
State Street Corporation | 9,185 | 694,662 | ||||||
T. Rowe Price Group, Inc. | 5,801 | 774,608 | ||||||
TD Ameritrade Holding Corporation | 6,846 | 325,048 | ||||||
Voya Financial, Inc. | 3,470 | 207,263 | ||||||
|
| |||||||
| 16,783,406 | ||||||||
|
| |||||||
Healthcare Equipment & Services — 4.0% |
| |||||||
ABIOMED, Inc. (b) | 1,127 | 209,949 | ||||||
Align Technology, Inc. (b) | 1,862 | 478,720 | ||||||
AmerisourceBergen Corporation . | 3,840 | 328,551 | ||||||
Becton, Dickinson and Company . | 6,685 | 1,839,578 | ||||||
Cardinal Health, Inc. | 7,320 | 374,857 | ||||||
Centene Corporation (b) | 14,409 | 905,029 | ||||||
Cerner Corporation | 7,932 | 569,756 | ||||||
Cigna Corporation | 9,352 | 1,799,138 | ||||||
Cooper Cos., Inc. (The) | 1,227 | 425,634 | ||||||
DENTSPLY SIRONA, Inc. | 5,492 | 307,552 | ||||||
Edwards Lifesciences Corporation (b) | 5,128 | 1,127,442 | ||||||
HCA Healthcare, Inc. | 6,729 | 933,985 | ||||||
Henry Schein, Inc. (b) | 3,622 | 249,701 | ||||||
Hologic, Inc. (b) | 6,570 | 351,627 | ||||||
Humana, Inc. | 3,330 | 1,119,679 | ||||||
IDEXX Laboratories, Inc. (b) | 2,141 | 580,233 | ||||||
Laboratory Corporation of America Holdings (b) | 2,415 | 423,591 | ||||||
MEDNAX, Inc. (b) | 2,055 | 47,409 | ||||||
Patterson Companies, Inc. | 2,040 | 44,900 | ||||||
Quest Diagnostics, Inc. | 3,302 | 365,432 | ||||||
ResMed, Inc. | 3,523 | 560,051 | ||||||
Select Medical Holdings Corporation (b) | 2,930 | 66,921 | ||||||
18
GREEN CENTURY EQUITY FUND PORTFOLIO OF INVESTMENTS January 31, 2020 (unaudited) | continued |
| SHARES | VALUE | |||||||
Healthcare Equipment & Services — (continued) |
| |||||||
Varian Medical Systems, Inc. (b) | 2,255 | $ | 316,985 | |||||
|
| |||||||
| 13,426,720 | ||||||||
|
| |||||||
Retailing — 4.0% |
| |||||||
AutoNation, Inc. (b) | 1,309 | 55,554 | ||||||
Best Buy Company, Inc. | 5,991 | 507,378 | ||||||
Booking Holdings, Inc. (b) | 1,051 | 1,923,908 | ||||||
Buckle, Inc. (The) | 624 | 15,232 | ||||||
Caleres, Inc. | 934 | 16,392 | ||||||
CarMax, Inc. (b) | 4,106 | 398,446 | ||||||
Foot Locker, Inc. | 2,723 | 103,392 | ||||||
GameStop Corporation, Class A | 2,386 | 9,162 | ||||||
Gap, Inc. (The) | 5,453 | 94,937 | ||||||
Home Depot, Inc. (The) | 27,065 | 6,173,527 | ||||||
Kohl’s Corporation | 4,005 | 171,214 | ||||||
LKQ Corporation (b) | 7,729 | 252,622 | ||||||
Lowe’s Companies, Inc. | 19,188 | 2,230,413 | ||||||
Nordstrom, Inc. | 2,621 | 96,610 | ||||||
Office Depot, Inc. | 14,532 | 32,261 | ||||||
Pool Corporation | 980 | 214,914 | ||||||
Signet Jewelers Ltd. | 1,194 | 29,026 | ||||||
Tiffany & Company | 2,669 | 357,699 | ||||||
Tractor Supply Company | 2,961 | 275,225 | ||||||
Ulta Beauty, Inc. (b) | 1,373 | 367,841 | ||||||
|
| |||||||
| 13,325,753 | ||||||||
|
| |||||||
Real Estate — 3.9% |
| |||||||
American Tower Corporation | 10,936 | 2,534,309 | ||||||
AvalonBay Communities, Inc. | 3,457 | 749,097 | ||||||
Boston Properties, Inc. | 3,854 | 552,471 | ||||||
CBRE Group, Inc., Class A (b) | 7,980 | 487,179 | ||||||
Corporate Office Properties Trust . | 2,732 | 81,332 | ||||||
Digital Realty Trust, Inc. | 5,147 | 633,030 | ||||||
Duke Realty Corporation | 8,860 | 321,707 | ||||||
Equinix, Inc. | 2,090 | 1,232,536 | ||||||
Equity Residential | 9,177 | 762,425 | ||||||
Federal Realty Investment Trust | 1,848 | 231,037 | ||||||
Healthpeak Properties, Inc. | 12,284 | 442,101 | ||||||
Host Hotels & Resorts, Inc. | 18,012 | 294,316 | ||||||
Iron Mountain, Inc. | 7,118 | 225,000 | ||||||
Jones Lang LaSalle, Inc. | 1,265 | 214,822 | ||||||
Liberty Property Trust | 3,830 | 239,949 | ||||||
Macerich Company (The) | 2,698 | 60,192 | ||||||
PotlatchDeltic Corporation | 1,694 | 72,842 | ||||||
Prologis, Inc. | 15,620 | 1,450,786 | ||||||
| SHARES | VALUE | |||||||
Real Estate — (continued) |
| |||||||
Realogy Holdings Corporation | 2,621 | $ | 27,756 | |||||
SBA Communications Corporation, Class A | 2,790 | 696,272 | ||||||
Simon Property Group, Inc. | 7,626 | 1,015,402 | ||||||
UDR, Inc. | 7,177 | 343,850 | ||||||
Vornado Realty Trust | 4,271 | 280,904 | ||||||
|
| |||||||
| 12,949,315 | ||||||||
|
| |||||||
Food & Beverage — 3.7% |
| |||||||
Archer-Daniels-Midland Company | 13,772 | 616,435 | ||||||
Bunge Ltd. | 3,475 | 182,194 | ||||||
Campbell Soup Company | 4,045 | 195,738 | ||||||
Coca-Cola Company (The) | 100,346 | 5,860,206 | ||||||
Darling Ingredients, Inc. (b) | 4,034 | 109,442 | ||||||
General Mills, Inc. | 14,911 | 778,653 | ||||||
Hormel Foods Corporation | 7,216 | 341,028 | ||||||
Ingredion, Inc. | 1,647 | 144,936 | ||||||
JM Smucker Company (The) | 2,800 | 290,108 | ||||||
Kellogg Company | 6,392 | 435,998 | ||||||
Kraft Heinz Company (The) | 16,607 | 484,924 | ||||||
Lamb Weston Holdings, Inc. | 3,577 | 326,616 | ||||||
McCormick & Company, Inc. | 3,070 | 501,546 | ||||||
Mondelez International, Inc., Class A | 35,658 | 2,046,056 | ||||||
|
| |||||||
| 12,313,880 | ||||||||
|
| |||||||
Household & Personal Products — 3.6% |
| |||||||
Clorox Company (The) | 3,091 | 486,245 | ||||||
Colgate-Palmolive Company | 20,186 | 1,489,323 | ||||||
Estee Lauder Cos., Inc. (The), Class A | 5,447 | 1,063,037 | ||||||
Kimberly-Clark Corporation | 8,489 | 1,215,964 | ||||||
Procter & Gamble Company (The) | 61,818 | 7,703,759 | ||||||
|
| |||||||
| 11,958,328 | ||||||||
|
| |||||||
Materials — 3.0% |
| |||||||
Air Products & Chemicals, Inc. | 5,431 | 1,296,434 | ||||||
Albemarle Corporation | 2,691 | 216,033 | ||||||
Avery Dennison Corporation | 2,072 | 271,929 | ||||||
Axalta Coating Systems Ltd. (b) | 5,124 | 147,622 | ||||||
Ball Corporation | 7,796 | 562,715 | ||||||
Compass Minerals International, Inc. | 794 | 45,965 | ||||||
Domtar Corporation | 1,594 | 55,503 | ||||||
19
GREEN CENTURY EQUITY FUND PORTFOLIO OF INVESTMENTS January 31, 2020 (unaudited) | continued |
| SHARES | VALUE | |||||||
Materials — (continued) | ||||||||
Ecolab, Inc. | 6,385 | $ | 1,252,162 | |||||
H.B. Fuller Company | 1,275 | 58,918 | ||||||
International Flavors & Fragrances, Inc. | 2,492 | 326,726 | ||||||
Linde PLC (a) | 13,368 | 2,715,442 | ||||||
Minerals Technologies, Inc. | 819 | 44,332 | ||||||
Mosaic Company (The) | 9,014 | 178,838 | ||||||
Newmont Corporation | 20,202 | 910,302 | ||||||
PPG Industries, Inc. | 5,834 | 699,147 | ||||||
Schnitzer Steel Industries, Inc., Class A | 746 | 11,996 | ||||||
Sealed Air Corporation | 3,852 | 136,746 | ||||||
Sherwin-Williams Company (The) | 2,046 | 1,139,602 | ||||||
Sonoco Products Company | 2,457 | 140,393 | ||||||
|
| |||||||
| 10,210,805 | ||||||||
|
| |||||||
Consumer Services — 3.0% |
| |||||||
Aramark | 6,183 | 272,918 | ||||||
Choice Hotels International, Inc. | 893 | 89,479 | ||||||
Darden Restaurants, Inc. | 3,066 | 356,974 | ||||||
Domino’s Pizza, Inc. | 968 | 272,734 | ||||||
Hilton Worldwide Holdings, Inc. | 6,720 | 724,416 | ||||||
Jack in the Box, Inc. | 589 | 48,151 | ||||||
Marriott International, Inc., Class A | 6,903 | 966,834 | ||||||
McDonald’s Corporation | 18,758 | 4,013,649 | ||||||
Royal Caribbean Cruises Ltd. | 4,399 | 515,035 | ||||||
Starbucks Corporation | 29,577 | 2,509,017 | ||||||
Vail Resorts, Inc. | 987 | 231,461 | ||||||
|
| |||||||
| 10,000,668 | ||||||||
|
| |||||||
Technology Hardware & Equipment — 2.9% |
| |||||||
Cisco Systems, Inc. | 105,772 | 4,862,339 | ||||||
Cognex Corporation | 4,301 | 219,222 | ||||||
CommScope Holding Company, Inc. (b) | 4,685 | 57,087 | ||||||
Corning, Inc. | 19,322 | 515,704 | ||||||
Dell Technologies, Inc., Class C (b) | 3,875 | 188,984 | ||||||
F5 Networks, Inc. (b) | 1,520 | 185,622 | ||||||
Flex Ltd. (b) | 12,567 | 165,256 | ||||||
Hewlett Packard Enterprise Company | 32,250 | 449,243 | ||||||
HP, Inc. | 36,513 | 778,457 | ||||||
Keysight Technologies, Inc. (b) | 4,611 | 428,777 | ||||||
Motorola Solutions, Inc. | �� | 4,087 | 723,399 | |||||
Plantronics, Inc. | 821 | 23,579 | ||||||
| SHARES | VALUE | |||||||
Technology Hardware & Equipment — (continued) |
| |||||||
TE Connectivity Ltd. (a) | 8,294 | $ | 764,541 | |||||
Trimble, Inc. (b) | 6,183 | 262,901 | ||||||
Xerox Corporation | 4,911 | 174,684 | ||||||
|
| |||||||
| 9,799,795 | ||||||||
|
| |||||||
Insurance — 2.9% |
| |||||||
Allstate Corporation (The) | 8,112 | 961,597 | ||||||
Arthur J. Gallagher & Company . | 4,568 | 468,540 | ||||||
Chubb Ltd. (a) | 11,256 | 1,710,800 | ||||||
Hartford Financial Services Group, Inc. (The) | 8,993 | 533,105 | ||||||
Lincoln National Corporation | 4,917 | 267,878 | ||||||
Loews Corporation | 6,663 | 342,811 | ||||||
Marsh & McLennan Companies, Inc. | 12,540 | 1,402,724 | ||||||
Principal Financial Group, Inc. | 6,847 | 362,549 | ||||||
Progressive Corporation (The) | 14,415 | 1,163,146 | ||||||
Prudential Financial, Inc. | 9,924 | 903,679 | ||||||
Travelers Companies, Inc. (The) | 6,426 | 845,790 | ||||||
Willis Towers Watson PLC (a) | 3,183 | 672,536 | ||||||
|
| |||||||
| 9,635,155 | ||||||||
|
| |||||||
Transportation — 2.4% |
| |||||||
AMERCO. | 222 | 82,422 | ||||||
ArcBest Corporation | 542 | 12,092 | ||||||
Avis Budget Group, Inc. (b) | 1,577 | 51,726 | ||||||
C.H. Robinson Worldwide, Inc. | 3,349 | 241,865 | ||||||
CSX Corporation | 18,811 | 1,436,032 | ||||||
Delta Air Lines, Inc. | 4,039 | 225,134 | ||||||
Echo Global Logistics, Inc. (b) | 579 | 11,221 | ||||||
Expeditors International of Washington, Inc. | 4,172 | 304,723 | ||||||
Hertz Global Holdings, Inc. (b) | 2,184 | 34,422 | ||||||
Kansas City Southern | 2,454 | 413,965 | ||||||
Ryder System, Inc. | 1,311 | 62,561 | ||||||
Southwest Airlines Company | 3,324 | 182,753 | ||||||
Union Pacific Corporation | 17,413 | 3,124,240 | ||||||
United Parcel Service, Inc., Class B | 17,270 | 1,787,790 | ||||||
|
| |||||||
| 7,970,946 | ||||||||
|
| |||||||
Telecommunication Services — 1.9% |
| |||||||
CenturyLink, Inc. | 24,123 | 329,520 | ||||||
Sprint Corporation (b) | 20,498 | 89,576 | ||||||
Verizon Communications, Inc. | 102,185 | 6,073,877 | ||||||
|
| |||||||
| 6,492,973 | ||||||||
|
| |||||||
20
GREEN CENTURY EQUITY FUND PORTFOLIO OF INVESTMENTS January 31, 2020 (unaudited) | continued |
| SHARES | VALUE | |||||||
Consumer Durables & Apparel — 1.8% |
| |||||||
Callaway Golf Company | 2,170 | $ | 46,481 | |||||
Capri Holdings Ltd. (a)(b) | 3,709 | 111,122 | ||||||
Columbia Sportswear Company | 761 | 71,473 | ||||||
Deckers Outdoor Corporation (b) | 740 | 141,274 | ||||||
Ethan Allen Interiors, Inc. | 540 | 8,721 | ||||||
Garmin Ltd. (a) | 3,270 | 317,027 | ||||||
Hanesbrands, Inc. | 8,891 | 122,340 | ||||||
Hasbro, Inc. | 3,162 | 322,113 | ||||||
La-Z-Boy, Inc. | 1,083 | 33,183 | ||||||
Mattel, Inc. (b) | 8,399 | 122,877 | ||||||
Meritage Homes Corporation (b) . | 916 | 64,999 | ||||||
Mohawk Industries, Inc. (b) | 1,556 | 204,894 | ||||||
Newell Brands, Inc. | 9,906 | 193,464 | ||||||
NIKE, Inc., Class B | 30,928 | 2,978,367 | ||||||
PVH Corporation | 1,860 | 162,136 | ||||||
Tupperware Brands Corporation . | 1,119 | 7,005 | ||||||
Under Armour, Inc., Class A (b) | 4,721 | 95,270 | ||||||
Under Armour, Inc., Class C (b) | 4,934 | 88,615 | ||||||
VF Corporation | 8,358 | 693,463 | ||||||
Whirlpool Corporation | 1,571 | 229,633 | ||||||
Wolverine World Wide, Inc. | 2,023 | 63,866 | ||||||
|
| |||||||
| 6,078,323 | ||||||||
|
| |||||||
Banks — 1.7% |
| |||||||
Bank of Hawaii Corporation | 987 | 88,435 | ||||||
Cathay General Bancorp | 1,905 | 68,694 | ||||||
CIT Group, Inc. | 2,278 | 104,127 | ||||||
Citizens Financial Group, Inc. | 10,972 | 409,036 | ||||||
Comerica, Inc. | 3,672 | 224,580 | ||||||
First Republic Bank | 4,183 | 463,811 | ||||||
Heartland Financial USA, Inc. | 854 | 41,769 | ||||||
International Bancshares Corporation | 1,312 | 51,693 | ||||||
KeyCorp | 24,852 | 464,981 | ||||||
M&T Bank Corporation | 3,158 | 532,186 | ||||||
New York Community Bancorp, Inc. | 11,611 | 128,418 | ||||||
Old National Bancorp | 3,900 | 69,849 | ||||||
People’s United Financial, Inc. | 10,876 | 167,708 | ||||||
PNC Financial Services Group, Inc. (The) | 11,012 | 1,635,833 | ||||||
Regions Financial Corporation | 24,808 | 386,261 | ||||||
Signature Bank | 1,370 | 194,389 | ||||||
SVB Financial Group (b) | 1,289 | 309,785 | ||||||
Umpqua Holdings Corporation | 5,349 | 90,398 | ||||||
| SHARES | VALUE | |||||||
Banks — (continued) |
| |||||||
Zions Bancorp NA. | 4,307 | $ | 195,926 | |||||
|
| |||||||
| 5,627,879 | ||||||||
|
| |||||||
Renewable Energy & Energy Efficiency — 1.0% |
| |||||||
Acuity Brands, Inc. | 998 | 117,634 | ||||||
Itron, Inc. (b) | 880 | 71,940 | ||||||
Johnson Controls International, PLC | 19,650 | 775,193 | ||||||
Ormat Technologies, Inc. | 940 | 74,504 | ||||||
Tesla, Inc. (b) | 3,326 | 2,163,796 | ||||||
|
| |||||||
| 3,203,067 | ||||||||
|
| |||||||
Commercial & Professional Services — 0.8% |
| |||||||
ACCO Brands Corporation | 2,208 | 19,077 | ||||||
ASGN, Inc. (b) | 1,334 | 90,298 | ||||||
Copart, Inc. (b) | 5,091 | 516,533 | ||||||
Deluxe Corporation | 1,015 | 48,923 | ||||||
Exponent, Inc. | 1,266 | 92,127 | ||||||
Heidrick & Struggles International, Inc. | 502 | 14,267 | ||||||
HNI Corporation | 1,054 | 37,912 | ||||||
ICF International, Inc. | 492 | 43,094 | ||||||
IHS Markit, Ltd. (a)(b) | 9,385 | 740,101 | ||||||
Interface, Inc. | 1,437 | 23,107 | ||||||
Kelly Services, Inc., Class A | 787 | 13,977 | ||||||
Knoll, Inc. | 1,273 | 31,519 | ||||||
ManpowerGroup, Inc. | 1,479 | 135,314 | ||||||
R.R. Donnelley & Sons Company. | 1,494 | 3,586 | ||||||
Resources Connection, Inc. | 605 | 9,211 | ||||||
Robert Half International, Inc. | 2,874 | 167,181 | ||||||
Steelcase, Inc., Class A | 2,219 | 41,296 | ||||||
Team, Inc. (b) | 585 | 7,956 | ||||||
Tetra Tech, Inc. | 1,315 | 112,564 | ||||||
TransUnion | 4,612 | 422,920 | ||||||
TrueBlue, Inc. (b) | 978 | 21,428 | ||||||
|
| |||||||
| 2,592,391 | ||||||||
|
| |||||||
Food & Staples Retailing — 0.4% |
| |||||||
Kroger Co. (The) | 19,863 | 533,520 | ||||||
Sysco Corporation | 12,040 | 988,966 | ||||||
|
| |||||||
| 1,522,486 | ||||||||
|
| |||||||
Automobiles & Components — 0.3% |
| |||||||
Aptiv PLC (a) | 6,329 | 536,636 | ||||||
Autoliv, Inc. (a) | 2,024 | 155,099 | ||||||
21
GREEN CENTURY EQUITY FUND PORTFOLIO OF INVESTMENTS January 31, 2020 (unaudited) | concluded |
| SHARES | VALUE | |||||||
Automobiles & Components — (continued) |
| |||||||
BorgWarner, Inc. | 5,049 | $ | 173,130 | |||||
Harley-Davidson, Inc. | 3,870 | 129,258 | ||||||
|
| |||||||
| 994,123 | ||||||||
|
| |||||||
Utilities — 0.3% | ||||||||
American Water Works Company, Inc. | 4,495 | 612,219 | ||||||
Aqua America, Inc. | 5,284 | 274,451 | ||||||
|
| |||||||
| 886,670 | ||||||||
|
| |||||||
Healthy Living — 0.0% | ||||||||
Hain Celestial Group, Inc. (The) (b) | 2,251 | 54,496 | ||||||
United Natural Foods, Inc. (b) | 1,194 | 8,597 | ||||||
|
| |||||||
| 63,093 | ||||||||
|
| |||||||
Total Common Stocks | 333,353,611 | |||||||
|
| |||||||
SHORT-TERM INVESTMENTS — 0.5% |
| |||||||
UMB Money Market Fiduciary Account, 0.25% (c) | 1,691,328 | |||||||
|
| |||||||
Total Short-term Investments | 1,691,328 | |||||||
|
| |||||||
TOTAL INVESTMENTS (d) — 100.0% |
| |||||||
(Cost $194,593,861) | 335,044,939 | |||||||
Other Assets | 57,768 | |||||||
|
| |||||||
NET ASSETS — 100.0% | $ | 335,102,707 | ||||||
|
| |||||||
| (a) | Securities whose value are determined or significantly influenced by trading in markets other than the United States or Canada. |
| (b) | Non-income producing security. |
| (c) | The rate quoted is the annualized seven-day yield of the fund at the period end. |
| (d) | The cost of investments for federal income tax purposes is $198,761,862 resulting in gross unrealized appreciation and depreciation of $142,606,373 and $6,323,296 respectively, or net unrealized appreciation of $136,283,077. |
See Notes to Financial Statements
22
GREEN CENTURY MSCI INTERNATIONAL INDEX FUND PORTFOLIO OF INVESTMENTS January 31, 2020 (unaudited) |
COMMON STOCKS — 99.0% |
| |||||||
| SHARES | VALUE | |||||||
Japan — 20.7% |
| |||||||
Aeon Company, Ltd | 12,500 | $ | 255,669 | |||||
Ajinomoto Company, Inc | 8,500 | 139,994 | ||||||
Asahi Kasei Corporation | 24,200 | 247,526 | ||||||
Astellas Pharma, Inc | 36,600 | 646,727 | ||||||
Benesse Holdings, Inc | 1,400 | 38,458 | ||||||
Daifuku Co., Ltd | 1,900 | 114,401 | ||||||
Daikin Industries Ltd | 4,800 | 676,355 | ||||||
Daiwa House Industry Company, Ltd | 11,100 | 349,455 | ||||||
Denso Corporation | 8,300 | 340,484 | ||||||
Eisai Company, Ltd | 4,800 | 361,736 | ||||||
Fujitsu Ltd | 3,800 | 401,784 | ||||||
Hankyu Hanshin Holdings, Inc . | 4,400 | 178,517 | ||||||
Hirose Electric Company Ltd | 600 | 74,418 | ||||||
Hitachi Chemical Company Ltd | 2,100 | 87,913 | ||||||
Hitachi Metals Ltd | 4,000 | 61,478 | ||||||
Honda Motor Company, Ltd | 31,500 | 805,625 | ||||||
Kansai Paint Company Ltd | 3,500 | 83,783 | ||||||
Kao Corp | 9,300 | 741,742 | ||||||
KDDI Corp | 34,100 | 1,030,471 | ||||||
Keio Corporation | 2,000 | 114,400 | ||||||
Kikkoman Corporation | 2,900 | 140,527 | ||||||
Komatsu Ltd | 17,800 | 393,576 | ||||||
Konica Minolta, Inc | 8,300 | 50,664 | ||||||
Kubota Corporation | 20,500 | 321,022 | ||||||
Kyushu Railway Company | 3,100 | 101,430 | ||||||
Murata Manufacturing Company, Ltd | 11,200 | 634,086 | ||||||
Nabtesco Corporation | 2,100 | 60,175 | ||||||
NGK Insulators Ltd | 5,200 | 87,187 | ||||||
Nikon Corporation | 6,400 | 77,280 | ||||||
Nintendo Company, Ltd | 2,200 | 809,282 | ||||||
Nippon Express Company, Ltd | 1,500 | 78,164 | ||||||
Nissin Foods Holdings Company Ltd | 1,200 | 90,070 | ||||||
Nitto Denko Corporation | 3,000 | 166,764 | ||||||
NTT DOCOMO, Inc | 26,000 | 738,722 | ||||||
Obayashi Corporation | 12,600 | 138,184 | ||||||
Omron Corporation | 3,700 | 211,880 | ||||||
Panasonic Corporation | 43,000 | 427,335 | ||||||
Rakuten, Inc | 16,800 | 129,603 | ||||||
Sekisui Chemical Company, Ltd | 6,800 | 113,257 | ||||||
Sekisui House Ltd | 12,000 | 258,026 | ||||||
Shimizu Corporation | 11,300 | 115,902 | ||||||
| SHARES | VALUE | |||||||
Japan — (continued) |
| |||||||
Sohgo Security Services Company Ltd | 1,300 | $ | 67,471 | |||||
Sompo Holdings, Inc | 6,400 | 239,128 | ||||||
Sony Corporation | 24,600 | 1,720,202 | ||||||
Stanley Electric Company Ltd | 2,400 | 61,812 | ||||||
Sumitomo Chemical Company, Ltd | 29,700 | 126,201 | ||||||
Sumitomo Metal Mining Company, Ltd | 4,600 | 130,780 | ||||||
Sumitomo Mitsui Trust Holdings, Inc | 6,300 | 232,281 | ||||||
Suntory Beverage & Food Ltd | 2,600 | 110,080 | ||||||
Teijin Ltd | 3,300 | 59,000 | ||||||
Tokyo Electron Ltd | 3,000 | 659,838 | ||||||
Tokyu Corp | 9,600 | 169,174 | ||||||
Toray Industries, Inc | 26,600 | 174,052 | ||||||
Toyo Suisan Kaisha Ltd | 1,600 | 67,033 | ||||||
Yamaha Corporation | 2,700 | 137,935 | ||||||
Yaskawa Electric Corporation | 4,700 | 160,889 | ||||||
Yokogawa Electric Corporation | 4,300 | 74,820 | ||||||
|
| |||||||
| 16,084,768 | ||||||||
|
| |||||||
Germany — 13.0% |
| |||||||
adidas AG | 3,493 | 1,104,154 | ||||||
Allianz SE | 8,238 | 1,966,711 | ||||||
Beiersdorf AG | 1,992 | 226,218 | ||||||
Deutsche Boerse AG | 3,684 | 597,982 | ||||||
Henkel AG & Company KGaA | 2,013 | 185,463 | ||||||
Henkel AG & Company | ||||||||
KGaA (a) | 3,464 | 352,287 | ||||||
Merck KGaA | 2,514 | 322,359 | ||||||
METRO AG | 3,338 | 46,444 | ||||||
Muenchener | ||||||||
Rueckversicherungs-Gesellschaft | 2,812 | 829,066 | ||||||
SAP SE | 18,996 | 2,473,799 | ||||||
Sartorius AG (a) | 694 | 161,499 | ||||||
Siemens AG | 14,811 | 1,826,707 | ||||||
|
| |||||||
| 10,092,689 | ||||||||
|
| |||||||
Switzerland — 9.4% |
| |||||||
Alcon, Inc. (b) | 7,988 | 471,914 | ||||||
Coca-Cola HBC AG (b) | 3,892 | 142,960 | ||||||
Givaudan SA | 177 | 584,006 | ||||||
Kuehne + Nagel International AG | 1,054 | 170,349 | ||||||
Lonza Group AG | 1,429 | 586,876 | ||||||
23
GREEN CENTURY MSCI INTERNATIONAL INDEX FUND PORTFOLIO OF INVESTMENTS January 31, 2020 (unaudited) | continued |
| SHARES | VALUE | |||||||
Switzerland — (continued) |
| |||||||
Roche Holding AG | 12,706 | $ | 4,262,465 | |||||
Swiss Re AG | 5,687 | 642,170 | ||||||
Swisscom AG | 496 | 272,137 | ||||||
Vifor Pharma AG | 875 | 161,242 | ||||||
|
| |||||||
| 7,294,119 | ||||||||
|
| |||||||
France — 9.4% |
| |||||||
AXA SA | 37,450 | 995,824 | ||||||
Casino Guichard Perrachon SA | 1,018 | 41,388 | ||||||
Cie Generale des Etablissements Michelin SCA | 3,297 | 382,517 | ||||||
CNP Assurances | 3,136 | 56,447 | ||||||
Danone SA | 11,984 | 958,985 | ||||||
EssilorLuxottica SA | 5,466 | 809,264 | ||||||
Gecina SA | 861 | 162,709 | ||||||
JCDecaux SA | 1,566 | 41,854 | ||||||
L’Oreal SA | 4,890 | 1,360,092 | ||||||
Natixis SA | 18,850 | 79,600 | ||||||
Orange SA. | 38,707 | 547,144 | ||||||
Schneider Electric SE | 10,763 | 1,073,324 | ||||||
Teleperformance | 1,114 | 279,492 | ||||||
Unibail-Rodamco-Westfield | 2,675 | 363,707 | ||||||
Valeo SA | 4,657 | 138,314 | ||||||
|
| |||||||
| 7,290,661 | ||||||||
|
| |||||||
Canada — 8.3% |
| |||||||
Agnico Eagle Mines Ltd | 4,560 | 281,856 | ||||||
Bank of Montreal | 12,438 | 948,592 | ||||||
Bank of Nova Scotia (The) | 23,681 | 1,293,383 | ||||||
Canadian Imperial Bank of Commerce | 8,585 | 700,086 | ||||||
Canadian National Railway Company | 13,907 | 1,299,591 | ||||||
Canadian Tire Corp. Ltd., Class A | 1,087 | 116,577 | ||||||
CGI, Inc. (b) | 4,659 | 356,730 | ||||||
Cronos Group, Inc. (b) | 3,067 | 22,086 | ||||||
First Capital Real Estate Investment Trust | 3,215 | 52,644 | ||||||
Gildan Activewear, Inc | 4,008 | 111,057 | ||||||
Magna International, Inc | 5,777 | 292,866 | ||||||
Metro, Inc | 4,888 | 199,265 | ||||||
Open Text Corporation | 5,140 | 231,327 | ||||||
Rogers Communications, Inc., Class B | 7,026 | 351,778 | ||||||
| SHARES | VALUE | |||||||
Canada — (continued) |
| |||||||
WSP Global, Inc | 2,031 | $ | 144,337 | |||||
|
| |||||||
| 6,402,175 | ||||||||
|
| |||||||
Australia — 8.2% |
| |||||||
ASX Ltd | 3,751 | 212,212 | ||||||
BlueScope Steel Ltd | 10,191 | 95,376 | ||||||
Boral Ltd | 22,406 | 73,838 | ||||||
Brambles Ltd | 30,311 | 253,167 | ||||||
Coca-Cola Amatil Ltd | 9,204 | 73,133 | ||||||
Coles Group Ltd | 21,955 | 240,910 | ||||||
CSL Ltd | 8,773 | 1,804,301 | ||||||
Dexus | 21,215 | 179,012 | ||||||
Goodman Group | 31,617 | 313,000 | ||||||
GPT Group (The) | 37,597 | 150,013 | ||||||
Insurance Australia Group Ltd | 44,376 | 208,658 | ||||||
LendLease Group | 11,026 | 132,423 | ||||||
Mirvac Group | 73,108 | 164,925 | ||||||
Newcrest Mining Ltd | 14,991 | 300,115 | ||||||
Orica Ltd | 7,523 | 113,657 | ||||||
SEEK Ltd | 6,265 | 93,926 | ||||||
Stockland | 46,055 | 150,564 | ||||||
Sydney Airport | 21,548 | 119,850 | ||||||
Transurban Group | 52,771 | 550,063 | ||||||
Westpac Banking Corporation | 67,721 | 1,131,696 | ||||||
|
| |||||||
| 6,360,839 | ||||||||
|
| |||||||
United Kingdom — 7.7% |
| |||||||
Barratt Developments PLC | 19,574 | 207,237 | ||||||
Berkeley Group Holdings PLC | 2,242 | 155,131 | ||||||
Burberry Group PLC | 7,971 | 204,377 | ||||||
Coca-Cola European Partners PLC | 4,571 | 240,480 | ||||||
Croda International PLC | 2,498 | 164,038 | ||||||
easyJet PLC | 3,059 | 56,152 | ||||||
InterContinental Hotels Group PLC | 3,315 | 204,188 | ||||||
Intertek Group PLC | 3,080 | 233,701 | ||||||
ITV PLC. | 67,660 | 120,543 | ||||||
J Sainsbury PLC | 33,278 | 88,760 | ||||||
Johnson Matthey PLC | 3,642 | 124,868 | ||||||
Kingfisher PLC | 40,941 | 109,913 | ||||||
London Stock Exchange Group PLC | 6,103 | 630,679 | ||||||
Marks & Spencer Group PLC | 36,657 | 85,004 | ||||||
Mondi PLC | 9,289 | 188,999 | ||||||
RELX PLC | 37,858 | 1,004,429 | ||||||
24
GREEN CENTURY MSCI INTERNATIONAL INDEX FUND PORTFOLIO OF INVESTMENTS January 31, 2020 (unaudited) | continued |
| SHARES | VALUE | |||||||
United Kingdom — (continued) |
| |||||||
Schroders PLC | 2,340 | $ | 99,073 | |||||
Segro PLC | 21,469 | 257,795 | ||||||
Standard Chartered PLC | 53,283 | 443,066 | ||||||
Unilever PLC | 21,418 | 1,277,594 | ||||||
Wm Morrison Supermarkets PLC | 46,649 | 111,852 | ||||||
|
| |||||||
| 6,007,879 | ||||||||
|
| |||||||
Netherlands — 4.3% |
| |||||||
Akzo Nobel NV | 4,378 | 413,128 | ||||||
ASML Holding NV | 8,229 | 2,309,296 | ||||||
CNH Industrial NV | 19,365 | 184,445 | ||||||
Koninklijke DSM NV | 3,506 | 426,687 | ||||||
|
| |||||||
| 3,333,556 | ||||||||
|
| |||||||
Denmark — 3.9% |
| |||||||
Coloplast A/S, Class B | 2,279 | 287,339 | ||||||
Novo Nordisk A/S, Class B | 34,241 | 2,084,308 | ||||||
Novozymes A/S | 4,095 | 213,508 | ||||||
Pandora A/S | 1,967 | 102,001 | ||||||
Vestas Wind Systems A/S | 3,680 | 365,305 | ||||||
|
| |||||||
| 3,052,461 | ||||||||
|
| |||||||
Hong Kong — 2.2% |
| |||||||
ASM Pacific Technology Ltd | 6,100 | 82,196 | ||||||
BOC Hong Kong Holdings Ltd | 72,000 | 238,003 | ||||||
Hang Seng Bank Ltd | 14,617 | 295,458 | ||||||
Hong Kong Exchanges & Clearing Ltd | 23,120 | 759,664 | ||||||
MTR Corporation Ltd | 30,167 | 169,196 | ||||||
Swire Pacific Ltd. A Shares | 10,000 | 87,808 | ||||||
Swire Properties Ltd | 23,400 | 72,643 | ||||||
|
| |||||||
| 1,704,968 | ||||||||
|
| |||||||
Spain — 2.2% |
| |||||||
Banco Bilbao Vizcaya Argentaria SA | 127,871 | 661,917 | ||||||
Ferrovial SA | 9,426 | 299,412 | ||||||
Industria de Diseno Textil SA | 21,002 | 706,214 | ||||||
|
| |||||||
| 1,667,543 | ||||||||
|
| |||||||
Sweden — 1.7% |
| |||||||
Boliden AB | 5,162 | 122,547 | ||||||
Electrolux AB | 4,180 | 99,302 | ||||||
Essity AB, Class B | 11,748 | 372,951 | ||||||
ICA Gruppen AB | 1,800 | 79,145 | ||||||
| SHARES | VALUE | |||||||
Sweden — (continued) |
| |||||||
Skandinaviska Enskilda Banken AB, Class A | 31,555 | $ | 311,824 | |||||
Tele2 AB B Shares | 9,373 | 141,411 | ||||||
Telia Company AB | 52,559 | 224,766 | ||||||
|
| |||||||
| 1,351,946 | ||||||||
|
| |||||||
Singapore — 1.5% |
| |||||||
Ascendas Real Estate Investment Trust | 56,300 | 129,631 | ||||||
CapitaLand Ltd | 50,000 | 131,760 | ||||||
City Developments Ltd | 8,300 | 63,971 | ||||||
DBS Group Holdings Ltd | 35,049 | 645,640 | ||||||
Singapore Airlines Ltd | 9,700 | 60,471 | ||||||
Singapore Exchange Ltd | 15,000 | 95,165 | ||||||
|
| |||||||
| 1,126,638 | ||||||||
|
| |||||||
Ireland — 1.5% | ||||||||
CRH PLC (c) | 51 | 1,920 | ||||||
CRH PLC (d) | 15,421 | 578,993 | ||||||
DCC PLC. | 1,907 | 153,973 | ||||||
Kerry Group PLC, Class A | 3,060 | 391,281 | ||||||
|
| |||||||
| 1,126,167 | ||||||||
|
| |||||||
Italy — 0.9% |
| |||||||
Intesa Sanpaolo SpA | 288,047 | 715,342 | ||||||
|
| |||||||
Jersey — 0.9% | ||||||||
Ferguson PLC | 4,411 | 396,110 | ||||||
WPP PLC. | 24,107 | 299,732 | ||||||
|
| |||||||
| 695,842 | ||||||||
|
| |||||||
Belgium — 0.9% |
| |||||||
KBC Group NV | 4,841 | 355,199 | ||||||
Solvay SA | 1,445 | 149,756 | ||||||
Umicore SA. | 3,803 | 175,098 | ||||||
|
| |||||||
| 680,053 | ||||||||
|
| |||||||
Norway — 0.8% |
| |||||||
Mowi ASA. | 8,433 | 201,141 | ||||||
Orkla ASA | 14,716 | 142,064 | ||||||
Schibsted ASA B Shares | 1,823 | 51,493 | ||||||
Telenor ASA | 13,743 | 248,349 | ||||||
|
| |||||||
| 643,047 | ||||||||
|
| |||||||
Finland — 0.8% |
| |||||||
Metso OYJ | 2,088 | 74,090 | ||||||
25
GREEN CENTURY MSCI INTERNATIONAL INDEX FUND PORTFOLIO OF INVESTMENTS January 31, 2020 (unaudited) | concluded |
| SHARES | VALUE | |||||||
Finland — (continued) |
| |||||||
Orion Oyj, Class B | 2,060 | $ | 97,326 | |||||
UPM-Kymmene OYJ | 10,382 | 327,111 | ||||||
Wartsila OYJ Abp | 8,510 | 104,523 | ||||||
|
| |||||||
| 603,050 | ||||||||
|
| |||||||
New Zealand — 0.4% | ||||||||
Auckland International Airport Ltd | 18,156 | 101,061 | ||||||
Fletcher Building Ltd | 15,822 | 56,473 | ||||||
Meridian Energy Ltd | 25,363 | 87,161 | ||||||
Ryman Healthcare Ltd | 7,918 | 83,946 | ||||||
|
| |||||||
| 328,641 | ||||||||
|
| |||||||
Israel — 0.2% |
| |||||||
Bank Hapoalim BM | 21,836 | 187,476 | ||||||
|
| |||||||
Portugal — 0.1% |
| |||||||
Jeronimo Martins SGPS SA | 4,948 | 85,142 | ||||||
|
| |||||||
Total Common Stocks (Cost $69,098,500) | 76,835,002 | |||||||
|
| |||||||
SHORT-TERM INVESTMENTS — 0.4% |
| |||||||
UMB Money Market Fiduciary Account, 0.25% (e) | 279,274 | |||||||
|
| |||||||
Total Short-term Investments | 279,274 | |||||||
|
| |||||||
TOTAL INVESTMENTS (f) — 99.4% |
| |||||||
(Cost $69,377,774) | 77,114,276 | |||||||
Other Assets | 482,430 | |||||||
|
| |||||||
NET ASSETS — 100.0% | $ | 77,596,706 | ||||||
|
| |||||||
| (a) | Preference shares. |
| (b) | Non-income producing security. |
| (c) | Shares of this security are traded on the London Stock Exchange. |
| (d) | Shares of this security are traded on the Irish Stock Exchange. |
| (e) | The rate quoted is the annualized seven-day yield of the fund at the period end. |
| (f) | The cost of investments for federal income tax purposes is $69,999,599 resulting in gross unrealized appreciation and depreciation of $10,855,844 and $3,741,167 respectively, or net unrealized appreciation of $7,114,677. |
See Notes to Financial Statements
26
GREEN CENTURY FUNDS STATEMENTS OF ASSETS AND LIABILITIES
January 31, 2020
(unaudited)
| BALANCED FUND | EQUITY FUND | MSCI INTERNATIONAL INDEX FUND | ||||||||||
ASSETS: | ||||||||||||
Investments, at value (cost $223,680,422, $194,593,861 and $69,377,774, respectively) | $ | 294,687,047 | $ | 335,044,939 | $ | 77,114,276 | ||||||
Foreign cash, at value (cost $382,929) | — | — | 385,594 | |||||||||
| Receivables for: | ||||||||||||
Capital stock sold | 326,337 | 562,993 | 94,746 | |||||||||
Interest | 679,037 | 317 | 121 | |||||||||
Dividends | 169,373 | 156,222 | 196,619 | |||||||||
|
|
|
|
|
| |||||||
Total assets | 295,861,794 | 335,764,471 | 77,791,356 | |||||||||
|
|
|
|
|
| |||||||
LIABILITIES: | ||||||||||||
Payable for capital stock repurchased | 137,332 | 138,117 | 122,546 | |||||||||
Payable for cash due to custodian | — | 183,048 | — | |||||||||
Accrued expenses | 370,047 | 340,599 | 72,104 | |||||||||
|
|
|
|
|
| |||||||
Total liabilities | 507,379 | 661,764 | 194,650 | |||||||||
|
|
|
|
|
| |||||||
NET ASSETS | $ | 295,354,415 | $ | 335,102,707 | $ | 77,596,706 | ||||||
|
|
|
|
|
| |||||||
NET ASSETS CONSIST OF: | ||||||||||||
Paid-in capital (par value of $0.01 per share with unlimited number of shares authorized) | $ | 218,147,932 | $ | 196,140,447 | $ | 70,998,855 | ||||||
Net distributable earnings | 77,206,483 | 138,962,260 | 6,597,851 | |||||||||
|
|
|
|
|
| |||||||
NET ASSETS | $ | 295,354,415 | $ | 335,102,707 | $ | 77,596,706 | ||||||
|
|
|
|
|
| |||||||
NET ASSET VALUE PER SHARE PER CLASS: | ||||||||||||
| Individual Investor Class Shares: | ||||||||||||
Net assets applicable to shares outstanding | $ | 295,354,415 | $ | 263,924,116 | $ | 26,004,379 | ||||||
Shares of beneficial interest issued and outstanding | 9,932,995 | 5,267,935 | 2,160,163 | |||||||||
Net asset value per share | $ | 29.73 | $ | 50.10 | $ | 12.04 | ||||||
|
|
|
|
|
| |||||||
| Institutional Class Shares: | ||||||||||||
Net assets applicable to shares outstanding | $ | — | $ | 71,178,591 | $ | 51,592,327 | ||||||
Shares of beneficial interest issued and outstanding | — | 1,421,986 | 4,286,917 | |||||||||
Net asset value per share | $ | — | $ | 50.06 | $ | 12.03 | ||||||
|
|
|
|
|
| |||||||
See Notes to Financial Statements
27
GREEN CENTURY FUNDS STATEMENTS OF OPERATIONS
January 31, 2020
(unaudited)
| BALANCED FUND | EQUITY FUND | MSCI INTERNATIONAL INDEX FUND | ||||||||||
INVESTMENT INCOME: | ||||||||||||
Interest income | $ | 1,167,959 | $ | 1,147 | $ | 472 | ||||||
Dividend and other income (net of $9,142, $0 and $52,713 foreign withholding taxes, respectively) | 1,411,857 | 2,689,242 | 559,694 | |||||||||
|
|
|
|
|
| |||||||
Total investment income | 2,579,816 | 2,690,389 | 560,166 | |||||||||
|
|
|
|
|
| |||||||
EXPENSES: | ||||||||||||
Administrative services fee | 1,181,682 | 1,512,470 | 285,884 | |||||||||
Investment advisory fee | 917,073 | 361,337 | 99,811 | |||||||||
|
|
|
|
|
| |||||||
Total expenses | 2,098,755 | 1,873,807 | 385,695 | |||||||||
|
|
|
|
|
| |||||||
NET INVESTMENT INCOME | 481,061 | 816,582 | 174,471 | |||||||||
|
|
|
|
|
| |||||||
NET REALIZED AND UNREALIZED GAIN (LOSS): | ||||||||||||
| Net realized gain (loss) on: | ||||||||||||
Investments | 6,017,517 | 2,961,149 | (152,599 | ) | ||||||||
Foreign currency transactions | — | — | (9,377 | ) | ||||||||
| Change in net unrealized appreciation (depreciation) on: | ||||||||||||
Investments | 4,955,452 | 23,888,080 | 5,844,224 | |||||||||
Foreign currency translations | — | — | 5,456 | |||||||||
|
|
|
|
|
| |||||||
NET REALIZED AND UNREALIZED GAIN ON INVESTMENTS | 10,972,969 | 26,849,229 | 5,687,704 | |||||||||
|
|
|
|
|
| |||||||
NET INCREASE IN NET ASSETS RESULTING FROM OPERATIONS | $ | 11,454,030 | $ | 27,665,811 | $ | 5,862,175 | ||||||
|
|
|
|
|
| |||||||
See Notes to Financial Statements
28
GREEN CENTURY FUNDS STATEMENTS OF CHANGES IN NET ASSETS
| BALANCED FUND | EQUITY FUND | MSCI INTERNATIONAL INDEX FUND | ||||||||||||||||||||||
| FOR THE SIX MONTHS ENDED JANUARY 31, 2020 (UNAUDITED) | FOR THE YEAR ENDED JULY 31, 2019 | FOR THE SIX MONTHS ENDED JANUARY 31, 2020 (UNAUDITED) | FOR THE YEAR ENDED JULY 31, 2019 | FOR THE SIX MONTHS ENDED JANUARY 31, 2020 (UNAUDITED) | FOR THE YEAR ENDED JULY 31, 2019 | |||||||||||||||||||
INCREASE (DECREASE) IN NET ASSETS: | ||||||||||||||||||||||||
| From operations: | ||||||||||||||||||||||||
Net investment income | $ | 481,061 | $ | 1,118,296 | $ | 816,582 | $ | 1,702,282 | $ | 174,471 | $ | 1,076,165 | ||||||||||||
Net realized gain (loss) on investments and foreign currency transactions | 6,017,517 | 4,497,578 | 2,961,149 | 1,315,712 | (161,976 | ) | (903,952 | ) | ||||||||||||||||
Change in net unrealized appreciation (depreciation) on investments and foreign currency translations | 4,955,452 | 19,024,803 | 23,888,080 | 22,554,250 | 5,849,680 | (155,721 | ) | |||||||||||||||||
|
|
|
|
|
|
|
|
|
|
|
| |||||||||||||
Net increase in net assets resulting from operations | 11,454,030 | 24,640,677 | 27,665,811 | 25,572,244 | 5,862,175 | 16,492 | ||||||||||||||||||
|
|
|
|
|
|
|
|
|
|
|
| |||||||||||||
| Dividends and distributions to shareholders: |
| |||||||||||||||||||||||
Distributions | ||||||||||||||||||||||||
Individual Investor Class | (5,004,745 | ) | (5,652,357 | ) | (1,248,015 | ) | (4,420,544 | ) | (14,239 | ) | (395,899 | ) | ||||||||||||
Institutional Class | — | — | (409,210 | ) | (981,555 | ) | (89,920 | ) | (879,437 | ) | ||||||||||||||
|
|
|
|
|
|
|
|
|
|
|
| |||||||||||||
Total dividends and distributions | (5,004,745 | ) | (5,652,357 | ) | (1,657,225 | ) | (5,402,099 | ) | (104,159 | ) | (1,275,336 | ) | ||||||||||||
|
|
|
|
|
|
|
|
|
|
|
| |||||||||||||
| Capital share transactions: | ||||||||||||||||||||||||
Proceeds from sales of shares | ||||||||||||||||||||||||
Individual Investor Class | 23,780,702 | 38,908,506 | 18,414,031 | 35,144,497 | 5,173,053 | 7,421,273 | ||||||||||||||||||
Institutional Class | — | — | 13,907,319 | 28,005,275 | 9,011,809 | 18,903,257 | ||||||||||||||||||
Reinvestment of dividends and distributions | ||||||||||||||||||||||||
Individual Investor Class | 4,831,527 | 5,465,985 | 1,207,995 | 4,288,487 | 13,671 | 381,573 | ||||||||||||||||||
Institutional Class | — | — | 339,540 | 773,029 | 88,837 | 869,648 | ||||||||||||||||||
Payments for shares redeemed | ||||||||||||||||||||||||
Individual Investor Class1 | (16,194,072 | ) | (33,941,631 | ) | (21,151,494 | ) | (43,934,103 | ) | (3,262,728 | ) | (3,802,352 | ) | ||||||||||||
Institutional Class2 | — | — | (3,179,645 | ) | (7,478,084 | ) | (3,308,455 | ) | (8,943,606 | ) | ||||||||||||||
|
|
|
|
|
|
|
|
|
|
|
| |||||||||||||
Net increase in net assets resulting from capital share transactions | 12,418,157 | 10,432,860 | 9,537,746 | 16,799,101 | 7,716,187 | 14,829,793 | ||||||||||||||||||
|
|
|
|
|
|
|
|
|
|
|
| |||||||||||||
Total increase in net assets | 18,867,442 | 29,421,180 | 35,546,332 | 36,969,246 | 13,474,203 | 13,570,949 | ||||||||||||||||||
NET ASSETS: | ||||||||||||||||||||||||
Beginning of period | 276,486,973 | 247,065,793 | 299,556,375 | 262,587,129 | 64,122,503 | 50,551,554 | ||||||||||||||||||
|
|
|
|
|
|
|
|
|
|
|
| |||||||||||||
End of period | $ | 295,354,415 | $ | 276,486,973 | $ | 335,102,707 | $ | 299,556,375 | $ | 77,596,706 | $ | 64,122,503 | ||||||||||||
|
|
|
|
|
|
|
|
|
|
|
| |||||||||||||
| 1 | Net of redemption fee received of $3,834, $1,106, $5,198, $4,013, $465 and $1,396, respectively. |
| 2 | Net of redemption fee received of $0, $0 $0, $0, $59 and $1,064, respectively. |
See Notes to Financial Statements
29
GREEN CENTURY BALANCED FUND FINANCIAL HIGHLIGHTS
| FOR THE SIX MONTHS ENDED JANUARY 31, 2020 | FOR THE YEARS ENDED JULY 31, | |||||||||||||||||||||||
| (UNAUDITED) | 2019 | 2018 | 2017 | 2016 | 2015 | |||||||||||||||||||
Net Assets Value, beginning of period | $ | 29.05 | $ | 27.05 | $ | 25.55 | $ | 23.93 | $ | 25.07 | $ | 23.74 | ||||||||||||
|
|
|
|
|
|
|
|
|
|
|
| |||||||||||||
| Income (loss) from investment operations: | ||||||||||||||||||||||||
Net investment income | 0.05 | 0.12 | 0.07 | 0.08 | 0.02 | 0.01 | ||||||||||||||||||
Net realized and unrealized gain (loss) on investments | 1.15 | 2.50 | 1.79 | 2.05 | (0.48 | ) | 2.51 | |||||||||||||||||
|
|
|
|
|
|
|
|
|
|
|
| |||||||||||||
Total increase (decrease) from investment operations | 1.20 | 2.62 | 1.86 | 2.13 | (0.46 | ) | 2.52 | |||||||||||||||||
|
|
|
|
|
|
|
|
|
|
|
| |||||||||||||
| Less dividends: | ||||||||||||||||||||||||
Dividends from net investment income | (0.05 | ) | (0.11 | ) | (0.05 | ) | (0.03 | ) | — | (0.02 | ) | |||||||||||||
Distributions from net realized gains | (0.47 | ) | (0.51 | ) | (0.31 | ) | (0.48 | ) | (0.68 | ) | (1.17 | ) | ||||||||||||
|
|
|
|
|
|
|
|
|
|
|
| |||||||||||||
Total decrease from dividends | (0.52 | ) | (0.62 | ) | (0.36 | ) | (0.51 | ) | (0.68 | ) | (1.19 | ) | ||||||||||||
|
|
|
|
|
|
|
|
|
|
|
| |||||||||||||
Net Assets Value, end of period | $ | 29.73 | $ | 29.05 | $ | 27.05 | $ | 25.55 | $ | 23.93 | $ | 25.07 | ||||||||||||
|
|
|
|
|
|
|
|
|
|
|
| |||||||||||||
Total return | 4.13 | %(a) | 10.04 | % | 7.32 | % | 9.07 | % | (1.73 | )% | 10.84 | % | ||||||||||||
| Ratios/Supplemental data: | ||||||||||||||||||||||||
Net assets, end of period (in 000’s) | 295,354 | 276,487 | 247,066 | 225,670 | 193,805 | 179,714 | ||||||||||||||||||
Ratio of expenses to average net assets | 1.47 | %(b) | 1.48 | % | 1.48 | % | 1.48 | % | 1.48 | % | 1.48 | % | ||||||||||||
Ratio of net investment income to average net assets | 0.34 | %(b) | 0.44 | % | 0.25 | % | 0.31 | % | 0.10 | % | 0.03 | % | ||||||||||||
Portfolio turnover | 14 | %(a) | 19 | % | 18 | % | 26 | % | 24 | % | 30 | % | ||||||||||||
| (a) | Not annualized. |
| (b) | Annualized. |
See Notes to Financial Statements
30
GREEN CENTURY EQUITY FUND INDIVIDUAL INVESTOR CLASS FINANCIAL HIGHLIGHTS
| FOR THE SIX MONTHS ENDED JANUARY 31, 2020 | FOR THE YEARS ENDED JULY 31, | |||||||||||||||||||||||
| (UNAUDITED) | 2019 | 2018 | 2017 | 2016 | 2015 | |||||||||||||||||||
Net Assets Value, beginning of period | $ | 46.17 | $ | 43.16 | $ | 38.05 | $ | 33.65 | $ | 32.73 | $ | 30.11 | ||||||||||||
|
|
|
|
|
|
|
|
|
|
|
| |||||||||||||
| Income from investment operations: | ||||||||||||||||||||||||
Net investment income | 0.12 | 0.25 | 0.22 | 0.27 | 0.27 | 0.20 | ||||||||||||||||||
Net realized and unrealized gain on investments | 4.05 | 3.61 | 5.28 | 4.84 | 1.27 | 2.96 | ||||||||||||||||||
|
|
|
|
|
|
|
|
|
|
|
| |||||||||||||
Total increase from investment operations | 4.17 | 3.86 | 5.50 | 5.11 | 1.54 | 3.16 | ||||||||||||||||||
|
|
|
|
|
|
|
|
|
|
|
| |||||||||||||
| Less dividends: | ||||||||||||||||||||||||
Dividends from net investment income | (0.11 | ) | (0.21 | ) | (0.20 | ) | (0.22 | ) | (0.25 | ) | (0.19 | ) | ||||||||||||
Distributions from net realized gains | (0.13 | ) | (0.64 | ) | (0.19 | ) | (0.49 | ) | (0.37 | ) | (0.35 | ) | ||||||||||||
|
|
|
|
|
|
|
|
|
|
|
| |||||||||||||
Total decrease from dividends | (0.24 | ) | (0.85 | ) | (0.39 | ) | (0.71 | ) | (0.62 | ) | (0.54 | ) | ||||||||||||
|
|
|
|
|
|
|
|
|
|
|
| |||||||||||||
Net Assets Value, end of period | $ | 50.10 | $ | 46.17 | $ | 43.16 | $ | 38.05 | $ | 33.65 | $ | 32.73 | ||||||||||||
|
|
|
|
|
|
|
|
|
|
|
| |||||||||||||
Total return | 9.03 | %(a) | 9.33 | % | 14.52 | % | 15.42 | % | 4.83 | % | 10.54 | % | ||||||||||||
| Ratios/Supplemental data: | ||||||||||||||||||||||||
Net assets, end of period (in 000’s) | 263,924 | 244,706 | 232,609 | 207,282 | 173,485 | 138,403 | ||||||||||||||||||
Ratio of expenses to average net assets | 1.25 | %(b) | 1.25 | % | 1.25 | % | 1.25 | % | 1.25 | % | 1.25 | % | ||||||||||||
Ratio of net investment income to average net assets | 0.46 | %(b) | 0.58 | % | 0.53 | % | 0.76 | % | 0.89 | % | 0.68 | % | ||||||||||||
Portfolio turnover | 4 | %(a) | 14 | % | 18 | % | 17 | % | 19 | % | 13 | % | ||||||||||||
| (a) | Not annualized. |
| (b) | Annualized. |
GREEN CENTURY EQUITY FUND INSTITUTIONAL CLASS FINANCIAL HIGHLIGHTS
| FOR THE SIX MONTHS ENDED JANUARY 31, 2020 | FOR THE YEAR ENDED JULY 31, 2019 | FOR THE PERIOD APRIL 30 , 2018 (COMMENCEMENT OF OPERATIONS) TO JULY 31, 2018 | ||||||||||
| (UNAUDITED) | ||||||||||||
Net Assets Value, beginning of period | $ | 46.11 | $ | 43.16 | $ | 40.86 | ||||||
|
|
|
|
|
| |||||||
| Income from investment operations: | ||||||||||||
Net investment income | 0.18 | 0.39 | 0.09 | |||||||||
Net realized and unrealized gain on investments | 4.06 | 3.59 | 2.35 | |||||||||
|
|
|
|
|
| |||||||
Total increase from investment operations | 4.24 | 3.98 | 2.44 | |||||||||
|
|
|
|
|
| |||||||
| Less dividends: | ||||||||||||
Dividends from net investment income | (0.16 | ) | (0.39 | ) | (0.14 | ) | ||||||
Distributions from net realized gains | (0.13 | ) | (0.64 | ) | — | |||||||
|
|
|
|
|
| |||||||
Total decrease from dividends | (0.29 | ) | (1.03 | ) | (0.14 | ) | ||||||
|
|
|
|
|
| |||||||
Net Assets Value, end of period | $ | 50.06 | $ | 46.11 | $ | 43.16 | ||||||
|
|
|
|
|
| |||||||
Total return | 9.22 | %(a) | 9.65 | % | 6.50 | %(a) | ||||||
| Ratios/Supplemental data: | ||||||||||||
Net assets, end of period (in 000’s) | 71,179 | 54,850 | 29,978 | |||||||||
Ratio of expenses to average net assets | 0.95 | %(b) | 0.95 | % | 0.95 | %(b) | ||||||
Ratio of net investment income to average net assets . | 0.76 | %(b) | 0.88 | % | 0.83 | %(b) | ||||||
Portfolio turnover | 4 | %(a) | 14 | % | 18 | %(a) | ||||||
| (a) | Not annualized. |
| (b) | Annualized. |
See Notes to Financial Statements
31
GREEN CENTURY MSCI INTERNATIONAL INDEX FUND INDIVIDUAL INVESTOR CLASS FINANCIAL HIGHLIGHTS
| FOR THE SIX MONTHS ENDED JANUARY 31, 2020 | FOR THE YEARS ENDED JULY 31, | FOR THE PERIOD SEPTEMBER 30, 2016 (COMMENCEMENT OF OPERATIONS) TO JULY 31, 2017 | ||||||||||||||
| (UNAUDITED) | 2019 | 2018 | ||||||||||||||
Net Assets Value, beginning of period | $ | 11.07 | $ | 11.50 | $ | 11.31 | $ | 10.00 | ||||||||
|
|
|
|
|
|
|
| |||||||||
| Income (loss) from investment operations: | ||||||||||||||||
Net investment income | 0.02 | 0.18 | 0.17 | 0.10 | ||||||||||||
Net realized and unrealized gain (loss) on investments | 0.96 | (0.40 | ) | 0.24 | 1.31 | |||||||||||
|
|
|
|
|
|
|
| |||||||||
Total increase (decrease) from investment operations | 0.98 | (0.22 | ) | 0.41 | 1.41 | |||||||||||
|
|
|
|
|
|
|
| |||||||||
| Less dividends: | ||||||||||||||||
Dividends from net investment income | (0.01 | ) | (0.16 | ) | (0.19 | ) | (0.10 | ) | ||||||||
Distributions from net realized gains | — | (0.05 | ) | (0.03 | ) | — | ||||||||||
|
|
|
|
|
|
|
| |||||||||
Total decrease from dividends | (0.01 | ) | (0.21 | ) | (0.22 | ) | (0.10 | ) | ||||||||
|
|
|
|
|
|
|
| |||||||||
Net Assets Value, end of period | $ | 12.04 | $ | 11.07 | $ | 11.50 | $ | 11.31 | ||||||||
|
|
|
|
|
|
|
| |||||||||
Total return | 8.82 | %(a) | (1.82 | )% | 3.62 | % | 14.18 | %(a) | ||||||||
| Ratios/Supplemental data: | ||||||||||||||||
Net assets, end of period (in 000’s) | 26,004 | 22,110 | 18,744 | 8,087 | ||||||||||||
Ratio of expenses to average net assets | 1.28 | %(b) | 1.28 | % | 1.28 | % | 1.28 | %(b) | ||||||||
Ratio of net investment income to average net assets . | 0.29 | %(b) | 1.79 | % | 1.71 | % | 1.79 | %(b) | ||||||||
Portfolio turnover | 2 | %(a) | 23 | % | 28 | % | 13 | %(a) | ||||||||
| (a) | Not annualized. |
| (b) | Annualized. |
GREEN CENTURY MSCI INTERNATIONAL INDEX FUND INSTITUTIONAL CLASS FINANCIAL HIGHLIGHTS
| FOR THE SIX MONTHS ENDED JANUARY 31, 2020 | FOR THE YEARS ENDED JULY 31, | FOR THE PERIOD SEPTEMBER 30, 2016 (COMMENCEMENT OF OPERATIONS) TO JULY 31, 2017 | ||||||||||||||
| (UNAUDITED) | 2019 | 2018 | ||||||||||||||
Net Assets Value, beginning of period | $ | 11.07 | $ | 11.50 | $ | 11.31 | $ | 10.00 | ||||||||
|
|
|
|
|
|
|
| |||||||||
| Income from investment operations: | ||||||||||||||||
Net investment income | 0.03 | 0.21 | 0.21 | 0.12 | ||||||||||||
Net realized and unrealized gain (loss) on investments | 0.95 | (0.38 | ) | 0.23 | 1.31 | |||||||||||
|
|
|
|
|
|
|
| |||||||||
Total increase (decrease) from investment operations | 0.98 | (0.17 | ) | 0.44 | 1.43 | |||||||||||
|
|
|
|
|
|
|
| |||||||||
| Less dividends: | ||||||||||||||||
Dividends from net investment income | (0.02 | ) | (0.21 | ) | (0.22 | ) | (0.12 | ) | ||||||||
Distributions from net realized gains | — | (0.05 | ) | (0.03 | ) | — | ||||||||||
|
|
|
|
|
|
|
| |||||||||
Total decrease from dividends | (0.02 | ) | (0.26 | ) | (0.25 | ) | (0.12 | ) | ||||||||
|
|
|
|
|
|
|
| |||||||||
Net Assets Value, end of period | $ | 12.03 | $ | 11.07 | $ | 11.50 | $ | 11.31 | ||||||||
|
|
|
|
|
|
|
| |||||||||
Total return | 8.86 | %(a) | (1.43 | )% | 3.90 | % | 14.36 | %(a) | ||||||||
| Ratios/Supplemental data: | ||||||||||||||||
Net assets, end of period (in 000’s) | 51,592 | 42,012 | 31,808 | 15,574 | ||||||||||||
Ratio of expenses to average net assets | 0.98 | %(b) | 0.98 | % | 0.98 | % | 0.98 | %(b) | ||||||||
Ratio of net investment income to average net assets . | 0.59 | %(b) | 2.09 | % | 2.01 | % | 2.09 | %(b) | ||||||||
Portfolio turnover | 2 | %(a) | 23 | % | 28 | % | 13 | %(a) | ||||||||
| (a) | Not annualized. |
| (b) | Annualized. |
See Notes to Financial Statements
32
GREEN CENTURY FUNDS NOTES TO FINANCIAL STATEMENTS (unaudited) |
NOTE 1 — Organization and Significant Accounting Policies
Green Century Funds (the “Trust”) is a Massachusetts business trust which offers three separate series, the Green Century Balanced Fund (the “Balanced Fund”), the Green Century Equity Fund (the “Equity Fund”) and the Green Century MSCI International Index Fund (the “International Index Fund”), each a “Fund” and collectively, the “Funds”. The Trust is registered under the Investment Company Act of 1940, as amended (the “Act”), as an open-end, diversified management investment company. The Trust accounts separately for the assets, liabilities and operations of each series. The Balanced Fund commenced operations on March 18, 1992, the Equity Fund Individual Investor Share Class commenced operations on September 13, 1995, the Equity Fund Institutional Share Class commenced operations on April 30, 2018, and the Individual Investor Share Class and Institutional Share Class of the International Index Fund commenced operations on September 30, 2016.
The preparation of financial statements in conformity with U.S. generally accepted accounting principles (“U.S. GAAP”) requires management to make estimates and assumptions that affect the reported amounts of assets and liabilities and disclosure of contingent assets and liabilities at the date of the financial statements and the reported amounts of revenues and expenses during the reporting period. Actual results could differ from those estimates.
Each Fund is an investment company and accordingly follows the investment company accounting and reporting guidance of the Financial Accounting Standards Board (the “FASB”) Accounting Standard Codification Topic 946 “Financial Services—Investment Companies”.
The following is a summary of the Funds’ significant accounting policies:
| (A) | Investment Valuation: Equity securities listed on U.S. national securities exchanges other than NASDAQ are valued at last sale price. If a last sale price is not available, securities listed on U.S. national exchanges other than NASDAQ are valued at the mean between the closing bid and closing ask prices. NASDAQ National Market® and SmallCapSM securities are valued at the NASDAQ Official Closing Price (“NOCP”). The NOCP is based on the last traded price if it falls within the concurrent best bid and ask prices and is normalized pursuant to NASDAQ’s published procedures if it falls outside this range. If a NOCP is not available for any such security, the security is valued at the last sale price, or, if there have been no sales that day, at the mean between the closing bid and closing ask prices. Unlisted U.S. equity securities are valued at last sale price, or when last sale prices are not available, at the last quoted bid price. Debt securities (other than certificates of deposit and short-term obligations maturing in sixty days or less) are valued on the basis of valuations furnished by a pricing service which takes into account appropriate factors such as institution-size trading in similar groups of securities, yield, quality, coupon rate, maturity, type of issue, and other market data, without exclusive reliance on quoted prices or exchange or over-the-counter prices. Securities, if any, for which there are no such valuations or quotations available, or for which the market quotation or valuation provided by a pricing service is deemed not reliable, are valued at fair value by management as determined in good faith under guidelines established by the Trustees. Certificates of deposit are valued at cost plus accrued interest, and short-term obligations maturing in sixty days or less are valued at amortized cost, both of which approximate market value. |
33
GREEN CENTURY FUNDS NOTES TO FINANCIAL STATEMENTS (unaudited) | continued |
For non-U.S. securities traded in foreign markets, the International Index Fund uses a fair value model developed by an independent pricing service to assist in valuing those securities. If an event occurs after the time at which the market for foreign securities held by the Fund closes but before the time that the Fund’s next NAV is calculated, such event may cause the closing price on the foreign exchange to not represent the readily available reliable market value quotation for such securities at the time the Fund determines its NAV. In such a case, the Fund will use the fair value of such securities as determined under the Fund’s valuation procedures. Events after the close of trading on a foreign market that could require a Fund to fair value some or all of its foreign securities include, among others, securities trading in the U.S. and other markets, corporate announcements, natural and other disasters, and political and other events. Among other elements of analysis in the determination of a security’s fair value, the Board has authorized the use of one or more independent research services to assist with such determinations. An independent research service may use statistical analyses and quantitative models to help determine fair value as of the time the Fund calculates its NAV. There can be no assurance that such models accurately reflect the behavior of the applicable markets or the effect of the behavior of such markets on the fair value of securities, or that such markets will continue to behave in a fashion that is consistent with such models. Unlike the closing price of a security on an exchange, fair value determinations employ elements of judgment. Consequently, the fair value assigned to a security may not represent the actual value that the Fund could obtain if it were to sell the security at the time of the close of the NYSE. Pursuant to procedures adopted by the Board, the Fund is not obligated to use the fair valuations suggested by any research service, and valuation recommendations provided by such research services may be overridden if other events have occurred or if other fair valuations are determined in good faith to be more accurate. Unless an event is such that it causes the Fund to determine that the closing prices for one or more securities do not represent readily available reliable market value quotations at the time the Fund determines its NAV, events that occur between the time of the close of the foreign market on which they are traded and the close of regular trading on the NYSE will not be reflected in the Fund’s NAV.
Various inputs are used in determining the value of the Fund’s investments. These inputs are summarized in the three broad levels listed below:
Level 1 — quoted prices for active markets for identical securities. An active market for the security is a market in which transactions occur with sufficient frequency and volume to provide pricing information on an ongoing basis. A quoted price in an active market provides the most reliable evidence of fair value.
Level 2 — other significant observable inputs (including quoted prices for similar securities, interest rates, prepayment speeds, credit risk, etc.). Examples of level 2 inputs include 1) quoted prices for identical or similar assets in markets that are not active 2) investments valued at amortized cost and 3) investments valued with inputs that are derived principally from or corroborated by observable market data. An adjustment to any observable input that is significant to the fair value may render the measurement a Level 3 measurement.
Level 3 — significant unobservable inputs, including the Funds’ own assumptions in determining the fair value of investments.
In some cases, the inputs used to measure the fair value of an asset or a liability might be categorized within different levels of the fair value hierarchy. In those cases, the fair value measurement is categorized in its entirety in the same level of the fair value hierarchy as the lowest level input that is significant to the entire measurement. The inputs or methodology used for valuing securities are not necessarily an indication of the risk associated with investing in those securities.
34
GREEN CENTURY FUNDS NOTES TO FINANCIAL STATEMENTS (unaudited) | continued |
The following is a summary of the inputs used to value the Balanced Fund’s net assets as of January 31, 2020:
| LEVEL 1 | LEVEL 2 | LEVEL 3 | TOTAL | |||||||||||||
COMMON STOCKS | $187,238,457 | $ — | $ — | $187,238,457 | ||||||||||||
BONDS & NOTES | — | 91,985,693 | — | 91,985,693 | ||||||||||||
CERTIFICATES OF DEPOSIT | — | 239,971 | — | 239,971 | ||||||||||||
SHORT-TERM OBLIGATIONS | — | 15,222,926 | — | 15,222,926 | ||||||||||||
|
|
|
|
|
|
|
| |||||||||
TOTAL | $187,238,457 | $107,448,590 | $ — | $294,687,047 | ||||||||||||
|
|
|
|
|
|
|
| |||||||||
The following is a summary of the inputs used to value the Equity Fund’s net assets as of January 31, 2020:
| LEVEL 1 | LEVEL 2 | LEVEL 3 | TOTAL | |||||||||||||
COMMON STOCKS | $333,353,611 | $ — | $ — | $333,353,611 | ||||||||||||
SHORT-TERM OBLIGATIONS | — | 1,691,328 | — | 1,691,328 | ||||||||||||
|
|
|
|
|
|
|
| |||||||||
TOTAL | $333,353,611 | $1,961,328 | $ — | $335,044,939 | ||||||||||||
|
|
|
|
|
|
|
| |||||||||
The following is a summary of the inputs used to value the International Index Fund’s net assets as of January 31, 2020:
| LEVEL 1 | LEVEL 2 | LEVEL 3 | TOTAL | |||||||||||||
| COMMON STOCKS | ||||||||||||||||
JAPAN | $ — | $16,084,768 | $ — | $16,084,768 | ||||||||||||
GERMANY | 226,218 | 9,866,471 | — | 10,092,689 | ||||||||||||
SWITZERLAND | — | 7,294,119 | — | 7,294,119 | ||||||||||||
FRANCE | 567,804 | 6,722,857 | — | 7,290,661 | ||||||||||||
CANADA | 6,402,175 | — | — | 6,402,175 | ||||||||||||
AUSTRALIA | — | 6,360,839 | — | 6,360,839 | ||||||||||||
UNITED KINGDOM | 395,611 | 5,612,268 | — | 6,007,879 | ||||||||||||
NETHERLANDS | — | 3,333,556 | — | 3,333,556 | ||||||||||||
DENMARK | 102,001 | 2,950,460 | — | 3,052,461 | ||||||||||||
HONG KONG | — | 1,704,968 | — | 1,704,968 | ||||||||||||
SPAIN | — | 1,667,543 | — | 1,667,543 | ||||||||||||
SWEDEN | 99,302 | 1,252,644 | — | 1,351,946 | ||||||||||||
SINGAPORE | — | 1,126,638 | — | 1,126,638 | ||||||||||||
IRELAND | 391,281 | 734,886 | — | 1,126,167 | ||||||||||||
ITALY | — | 715,342 | — | 715,342 | ||||||||||||
JERSEY | — | 695,842 | — | 695,842 | ||||||||||||
BELGIUM | — | 680,053 | — | 680,053 | ||||||||||||
NORWAY | — | 643,047 | — | 643,047 | ||||||||||||
FINLAND | 104,523 | 498,527 | — | 603,050 | ||||||||||||
NEW ZEALAND | — | 328,641 | — | 328,641 | ||||||||||||
ISRAEL | — | 187,476 | — | 187,476 | ||||||||||||
PORTUGAL | — | 85,142 | — | 85,142 | ||||||||||||
|
|
|
|
|
|
|
| |||||||||
TOTAL COMMONS STOCKS | 8,288,915 | 68,546,087 | — | 76,835,002 | ||||||||||||
|
|
|
|
|
|
|
| |||||||||
SHORT-TERM OBLIGATIONS | 279,274 | — | — | 279,274 | ||||||||||||
|
|
|
|
|
|
|
| |||||||||
TOTAL | $8,568,189 | $68,546,087 | $ — | $77,114,276 | ||||||||||||
|
|
|
|
|
|
|
| |||||||||
35
GREEN CENTURY FUNDS NOTES TO FINANCIAL STATEMENTS (unaudited) | continued |
There were no transfers into or out of Level 3 during the reporting period.
| (B) | Securities Transactions and Investment Income: Securities transactions are recorded on a trade date basis. Realized gains and losses from securities transactions are determined using the identified cost basis. Interest income, including amortization of premiums and accretion of discounts on bonds, is recognized on the accrual basis and dividend income is recorded on ex-dividend date. Income, expenses and realized and unrealized gains and losses on investments are allocated to each class of shares in proportion to their relative shares outstanding. |
| (C) | Currency Translation and Contracts: Securities and other assets and liabilities denominated in foreign currencies are translated into U.S. dollar amounts on the date of valuation. Purchases and sales of securities, and income and expense items denominated in foreign currencies, are translated into U.S. dollar amounts on the respective dates of such transactions. Occasionally, events impact the availability or reliability of foreign exchange rates used to convert the U.S. dollar equivalent value. If such an event occurs, the foreign exchange rate will be valued at fair value using procedures established and approved by the Board of Trustees. The Funds do not separately report the effect of fluctuations in foreign exchange rates from changes in market prices on securities held. Such fluctuations are included with the net realized and unrealized gain or loss from investments. Realized foreign exchange gains or losses arise from sales of foreign currencies, currency gains or losses realized between the trade and settlement dates on securities transactions, and the difference between the recorded amounts of dividends, interest, and foreign withholding taxes and the U.S. dollar equivalent of the amounts actually received or paid. Net unrealized foreign exchange gains and losses arise from changes in fair value of assets and liabilities other than investments in securities held at the end of the reporting period, resulting from changes in exchange rates. When a Fund purchases or sells foreign securities, it enters into foreign exchange contracts to minimize foreign exchange risk from the trade date to the settlement date of the transactions. A foreign exchange contract is an agreement between two parties to exchange different currencies at an agreed-upon exchange rate on a specified date. The International Index Fund had no open foreign currency spot contracts outstanding as of January 31, 2020. |
| (D) | Distributions: Distributions to shareholders are recorded on the ex-dividend date. The Funds declare and pay dividends of net investment income, if any, semi-annually and distribute net realized capital gains, if any, annually. The amount and character of income and net realized gains to be distributed are determined in accordance with Federal income tax rules and regulations, which may differ from U.S. GAAP. To the extent that these differences are attributable to permanent book and tax accounting differences, the components of net assets have been adjusted. |
| (E) | Federal Taxes: Each series of the Trust is treated as a separate entity for Federal income tax purposes. Each Fund’s policy is to comply with the provisions of the Internal Revenue Code applicable to regulated investment companies (“RICs”). Accordingly, no provisions for Federal income or excise tax are necessary. |
US GAAP requires that all entities, including pass-through entities such as the Funds, establish a minimum threshold for financial statement recognition of the benefit of positions taken in filing tax returns (including whether an entity is taxable in a particular jurisdiction). The Funds recognize tax benefits only if it is more likely than not that a tax position (including the Funds’ assertion that their income is exempt from tax) will be sustained upon examination. The Funds had no material uncertain tax positions and have not recorded a liability for unrecognized tax benefits as of January 31, 2020. Also, the Funds had recognized no interest and penalties related to uncertain tax benefits through January 31, 2020. At January 31, 2020, the tax years 2016 through 2019 remain open to examination by the Internal Revenue Service.
36
GREEN CENTURY FUNDS NOTES TO FINANCIAL STATEMENTS (unaudited) | continued |
| (F) | Redemption Fee: A 2.00% redemption fee is retained by the Funds to offset the effect of transaction costs and other expenses associated with short-term investing. The fee is imposed on redemptions or exchanges of shares held 60 days or less from their purchase date. For the six months ended January 31, 2020, the Balanced Fund, Equity Fund and International Index Fund received $3,834, $5,198 and $524 respectively, in redemption fees. Redemption fees are recorded as an adjustment to paid-in capital. |
| (G) | Indemnification: The Funds’ organizational documents provide that trustees and officers are indemnified against certain liabilities arising out of the performance of their duties to the Funds. In the normal course of business, the Funds may also enter into contracts that provide general indemnifications. The Funds’ maximum exposure under these arrangements is unknown as this would be dependent on future claims that may be made against the Funds. The risk of material loss from such claims is considered remote. As of July 31, 2019, no liability has been accrued. |
| (H) | Offsetting of Assets and Liabilities: As of January 31, 2020, there are no master netting arrangements related to the Funds. The Funds’ Statements of Assets and Liabilities present derivative instruments on a gross basis, if applicable. As of January 31, 2020, no derivative instruments were held by the Funds. |
NOTE 2 — Transactions With Affiliates
| (A) | Investment Adviser: Green Century Capital Management, Inc. (“Green Century”) is the adviser (“the Adviser”) for the Funds. Green Century is owned by Paradigm Partners. Green Century oversees the portfolio management of the Funds on a day-to-day basis. Effective February 1, 2018, Green Century and the Funds on behalf of the Balanced Fund entered into a contractual investment advisory fee waiver agreement pursuant to which Green Century agreed to waive that portion of the fee to which it is otherwise entitled under the Advisory Agreement between Green Century and the Funds with respect to the Balanced Fund, so that Green Century’s investment advisory fee with respect to the Fund shall be equal on an annual basis to 0.65% of the average daily net assets of the Fund up to $250 million and 0.60% of the value of the average daily net assets of the Fund in excess of $250 million, accrued daily and paid monthly. Effective November 28, 2018, the Balanced Fund’s Advisory Agreement was amended to reflect the same reduction in the advisory fee that was stipulated in the fee waiver agreement. Prior to February 1, 2018, the Balanced Fund paid Green Century a fee, accrued daily and paid monthly, at an annual rate of 0.65% of the average daily net assets of the Fund. The Equity Fund pays Green Century a fee, accrued daily and paid monthly, at an annual rate of 0.25% of the Equity Fund’s average daily net assets up to but not including $100 million, 0.22% of average daily net assets including $100 million up to but not including $500 million, 0.17% of average daily net assets including $500 million up to but not including $1 billion and 0.12% of average daily net assets equal to or in excess of $1 billion. The International Index Fund pays Green Century a fee, accrued daily and paid monthly, at an annual rate of 0.28% of the International Index Fund’s average daily net assets. |
| (B) | Subadvisers: Trillium Asset Management, LLC (“Trillium”) is the subadviser for the Balanced Fund. Effective February 1, 2018, Green Century, Trillium, and the Funds on behalf of the Balanced Fund entered into a contractual investment subadvisory fee waiver agreement pursuant to which Trillium agreed to waive that portion of the fee to which it is otherwise entitled under the Subadvisory Agreement between Green Century, Trillium and the Funds with respect to the Balanced Fund, so that Trillium’s investment subadvisory fee with respect to the Fund shall be equal on an annual basis to 0.40% of the value of the average daily net assets of the Fund up to $30 million, 0.35% of the value of the average daily net assets of the Fund in excess of $30 million up to $250 million, and 0.30% of the value of the average daily net assets of the Fund in excess of $250 million. Effective November 28, 2018, the Balanced Fund’s Subadvisory Agreement was amended to reflect the same reduction in the subadvisory fee that was stipulated in the fee waiver agreement. Prior to February 1, 2018, |
37
GREEN CENTURY FUNDS NOTES TO FINANCIAL STATEMENTS (unaudited) | continued |
| Trillium was paid a fee by the Adviser at an annual rate of 0.40% on the first $30 million of average daily net assets and 0.35% on average daily net assets in excess of $30 million for its services. For the six months ended January 31, 2020, Green Century accrued fees of $497,469 to Trillium. Northern Trust Investments, Inc. (“Northern Trust”) is the subadviser for the Equity Fund and International Index Fund. For the Equity Fund, Northern Trust is paid a fee by the Adviser based on Northern Trust’s fee schedule of the greater of $75,000 or 0.10% of the value of the average daily net assets of the Fund up to but not including $50 million, 0.05% of the average daily net assets of the Fund from and including $50 million up to but not including $100 million and 0.03% of the average daily net assets of the Fund equal to or in excess of $100 million for its services. For the International Index Fund, Northern Trust is paid a fee by the Adviser based on Northern Trust’s fee schedule of the greater of $100,000 or 0.17% of the value of the average daily net assets of the Fund up to but not including $50 million, 0.12% of the average daily net assets of the Fund from and including $50 million up to but not including $100 million and 0.08% of the average daily net assets of the Fund equal to or in excess of $100 million for its services. For the six months ended January 31, 2020, Green Century accrued fees of $69,834 and $55,340 to Northern Trust for the Equity Fund and the International Index Fund, respectively. |
| (C) | Administrator: Green Century is the administrator (“the Administrator”) of the Green Century Funds. Pursuant to the Administrative Services Agreement, Green Century pays all the expenses of each Fund other than the investment advisory fees; interest; taxes; brokerage costs and other capital expenses; expenses of non-interested trustees (including counsel fees) and any extraordinary expenses. The Balanced Fund pays Green Century a fee at a rate such that immediately following any payment to the Administrator, the total operating expenses of the Fund, on an annual basis, do not exceed 1.48% of the Fund’s average daily net assets up to but not including $250 million and 1.43% of the Fund’s average daily net assets equal to and in excess of $250 million. The Equity Fund pays Green Century a fee at a rate such that immediately following any payment to the Administrator, the total operating expenses of the Fund, on an annual basis, do not exceed 1.25% of the Fund’s Individual Investor Class average daily net assets, and 0.95% of the Fund’s Institutional Class average daily net assets. The International Index Fund pays Green Century a fee at a rate such that immediately following any payment to the Administrator, the total operating expenses of the Fund, on an annual basis, do not exceed 1.28% of the Fund’s Individual Investor Class average daily net assets, and 0.98% of the Fund’s Institutional Class average daily net assets. |
| (D) | Subadministrator: Pursuant to a Subadministrative and Fund Accounting Services Agreement with the Administrator, UMB Fund Services, Inc. (“UMBFS”) as Subadministrator and Fund Accountant, is responsible for conducting fund accounting and certain day-to-day administration of the Trust subject to the supervision and direction of the Administrator. For the six months ended January 31, 2020, Green Century accrued fees of $84,259, $106,955, and $48,272 to UMBFS related to services performed on behalf of the Balanced Fund, the Equity Fund, and the International Index Fund, respectively. |
| (E) | Index Agreements: The Equity Fund invests in the securities of the companies included in the MSCI KLD 400 Social ex Fossil Fuels Index (the “KLD Index”). The Index is owned and maintained by MSCI ESG Research (“MSCI”). For the use of the KLD Index for the Equity Fund, MSCI is paid by the Adviser an annual license fee of $26,000, plus the greater of $26,000 or at an annual rate of 0.05% on the first $100 million of average daily net assets, 0.04% on the next $100 million of average daily net assets, and 0.03% on average daily net assets in excess of $200 million. The International Index Fund invests in the securities included in the MSCI World ex USA SRI ex Fossil Fuels Index (the “World Index”). The Index is owned and maintained by MSCI. For the use of the World Index for the International Index Fund, MSCI is paid by the Adviser an annual license fee of $16,000, plus the greater of $25,000 or at an annual rate of 0.05% on the first $100 million of average daily net |
38
GREEN CENTURY FUNDS NOTES TO FINANCIAL STATEMENTS (unaudited) | continued |
| assets, 0.04% on the next $100 million of average daily net assets, and 0.03% on average daily net assets in excess of $200 million. For the six months ended January 31, 2020, Green Century accrued fees of $75,364 and $25,865 to MSCI for the Equity Fund and International Index Fund, respectively. |
NOTE 3 — Investment Transactions
For the six months ended January 31, 2020, the Balanced Fund’s cost of purchases and proceeds from sales of securities, other than short-term securities, aggregated $38,795,148 and $37,981,723 respectively. The Equity Fund’s cost of purchases and proceeds from sales of securities, other than short-term securities, aggregated $18,586,540 and $11,078,399, respectively. The International Index Fund’s cost of purchases and proceeds from sales of securities, other than short-term securities, aggregated $9,008,285 and $1,458,738, respectively.
NOTE 4 — Federal Income Tax Information
The tax basis of the components of distributable net earnings (deficit) at July 31, 2019 were as follows:
| BALANCED FUND | EQUITY FUND | INTERNATIONAL INDEX FUND | ||||||||||
Undistributed ordinary income | $ | 384,798 | $ | 291,902 | $ | 190,044 | ||||||
Undistributed long-term capital gains | 4,185,055 | 372,381 | — | |||||||||
|
|
|
|
|
| |||||||
Tax accumulated earnings | 4,569,853 | 664,283 | 190,044 | |||||||||
|
|
|
|
|
| |||||||
Accumulated capital and other losses | — | — | (602,975 | ) | ||||||||
Unrealized appreciation (depreciation) | 66,187,345 | 112,289,391 | 1,258,706 | |||||||||
Foreign currency translations | — | — | (5,940 | ) | ||||||||
|
|
|
|
|
| |||||||
Distributable net earnings (deficit) | $ | 70,757,198 | $ | 112,953,674 | $ | 839,835 | ||||||
|
|
|
|
|
| |||||||
The tax character of distributions paid during the fiscal year ended July 31, 2019 and the year ended July 31, 2018 were as follows:
| BALANCED FUND | EQUITY FUND | |||||||||||||||
| YEAR ENDED JULY 31, 2019 | YEAR ENDED JULY 31, 2018 | YEAR ENDED JULY 31, 2019 | YEAR ENDED JULY 31, 2018 | |||||||||||||
Ordinary income | $ | 1,539,357 | $ | 1,805,215 | $ | 2,668,893 | $ | 1,490,368 | ||||||||
Long-term capital gains | 4,113,000 | 1,468,286 | 2,733,206 | 875,447 | ||||||||||||
| INTERNATIONAL INDEX FUND | ||||||||||||||||
| YEAR ENDED JULY 31, 2019 | YEAR ENDED JULY 31, 2018 | |||||||||||||||
Ordinary income | $ | 1,049,319 | $ | 916,281 | ||||||||||||
Long-term capital gains | 226,017 | — | ||||||||||||||
39
GREEN CENTURY FUNDS NOTES TO FINANCIAL STATEMENTS (unaudited) | continued |
NOTE 5 — Capital Share Transactions
Capital Share transactions for the Balanced Fund, the Equity Fund and the International Index Fund were as follows:
| BALANCED FUND | BALANCED FUND | |||||||
| SIX MONTHS ENDED JANUARY 31, 2020 | YEAR ENDED JULY 31, 2019 | |||||||
Shares sold | 802,548 | 1,427,521 | ||||||
Reinvestment of dividends | 162,241 | 216,309 | ||||||
Shares redeemed | (550,235 | ) | (1,257,843 | ) | ||||
|
|
|
| |||||
| 414,554 | 385,987 | |||||||
|
|
|
| |||||
| EQUITY FUND INDIVIDUAL INVESTOR CLASS | EQUITY FUND INDIVIDUAL INVESTOR CLASS | |||||||
| SIX MONTHS ENDED JANUARY 31, 2020 | YEAR ENDED JULY 31, 2019 | |||||||
Shares sold | 386,476 | 824,614 | ||||||
Reinvestment of dividends | 24,350 | 110,775 | ||||||
Shares redeemed | (443,454 | ) | (1,024,527 | ) | ||||
|
|
|
| |||||
| (32,628 | ) | (89,138 | ) | |||||
|
|
|
| |||||
| EQUITY FUND INSTITUTIONAL CLASS | EQUITY FUND INSTITUTIONAL CLASS | |||||||
| SIX MONTHS ENDED JANUARY 31, 2020 | YEAR ENDED JULY 31, 2019 | |||||||
Shares sold | 292,056 | 653,982 | ||||||
Reinvestment of dividends | 6,851 | 19,493 | ||||||
Shares redeemed | (66,421 | ) | (178,554 | ) | ||||
|
|
|
| |||||
| 232,486 | 494,921 | |||||||
|
|
|
| |||||
| INTERNATIONAL INDEX INDIVIDUAL INVESTOR CLASS | INTERNATIONAL INDEX INDIVIDUAL INVESTOR CLASS | |||||||
| SIX MONTHS ENDED JANUARY 31, 2020 | YEAR ENDED JULY 31, 2019 | |||||||
Shares sold | 440,466 | 687,102 | ||||||
Reinvestment of dividends | 1,119 | 35,596 | ||||||
Shares redeemed | (278,465 | ) | (356,006 | ) | ||||
|
|
|
| |||||
| 163,120 | 366,692 | |||||||
|
|
|
| |||||
40
GREEN CENTURY FUNDS NOTES TO FINANCIAL STATEMENTS (unaudited) | concluded |
| INTERNATIONAL INDEX INSTITUTIONAL CLASS | INTERNATIONAL INDEX INSTITUTIONAL CLASS | |||||||
| SIX MONTHS ENDED JANUARY 31, 2020 | YEAR ENDED JULY 31, 2019 | |||||||
Shares sold | 767,027 | 1,775,836 | ||||||
Reinvestment of dividends | 7,276 | 80,885 | ||||||
Shares redeemed | (284,178 | ) | (825,444 | ) | ||||
|
|
|
| |||||
| 490,125 | 1,031,277 | |||||||
|
|
|
| |||||
NOTE 6 — Subsequent Events
Subsequent to January 31, 2020 and through the date on which the financial statements were available for issuance, management has evaluated subsequent events requiring disclosure.
There were no events requiring accrual or disclosure.
41
BOARD OF TRUSTEES’ CONSIDERATION OF ADVISORY AND SUBADVISORY AGREEMENTS
The Board of Trustees of the Green Century Funds considered and approved the continuance of three advisory and subadvisory agreements.
INVESTMENT ADVISORY AGREEMENTS WITH GREEN CENTURY CAPITAL MANAGEMENT, INC.
The Board, including the Independent Trustees, voted to approve the continuance of the Investment Advisory Agreements, (the “Advisory Agreements”) between the Trust, on behalf of each of the Balanced Fund, the Equity Fund, and the International Fund and Green Century Capital Management (“Green Century” or the “Adviser”) at a meeting on October 4, 2019. The Trustees considered, among other things, information provided by Green Century regarding the investment performance of each Fund; the expenses of each Fund and the advisory fee paid to Green Century by each Fund; and the profitability to Green Century of its advisory relationship with each Fund. The Independent Trustees were assisted by independent counsel in considering these materials and the approval and continuance of the Advisory Agreements. The Trustees considered all of the information provided to them by Green Century, including information provided throughout the year. The Trustees also received a memorandum from independent legal counsel advising them of their duties and responsibilities in connection with the review of the Advisory Agreements. In approving the Advisory Agreements, the Board, including the Independent Trustees did not identify any single factor as determinative. Matters considered in connection with their approval of the Advisory Agreements included the following.
Nature, Quality, and Extent of Services Performed. The Trustees considered the scope and quality of the services performed for each of the Funds by the Adviser, including the resources dedicated by the Adviser.
With respect to the Balanced Fund, the services performed include the oversight and monitoring of the portfolio management and performance of the Balanced Fund; monitoring the implementation of the Balanced Fund’s environmental screens; implementing the environmental and other policies of the Trust by voting the Balanced Fund’s shareholder proxies independently and without reliance on third-party proxy advisory firms; and overall compliance oversight provided by the Adviser. The Trustees also considered the Adviser’s supervision of Trillium Asset Management, LLC (“Trillium”), the subadviser of the Balanced Fund, which performs the day-to-day portfolio management for the Fund.
With respect to the Equity Fund and the International Fund, these services include monitoring the Equity Fund’s performance and tracking error relative to the MSCI KLD 400 Social ex Fossil Fuels Index (the “MSCI KLD Index”); monitoring the International Fund’s performance and tracking error relative to the MSCI World ex USA SRI ex Fossil Fuels Index (the “MSCI World Index”); implementing the environmental and other policies of the Trust by voting the Equity Fund’s and the International Fund’s shareholder proxies independently and without reliance on third-party proxy advisory firms; and overall compliance oversight provided by the Adviser. The Trustees also considered the Adviser’s supervision of Northern Trust Investments, Inc. (“Northern Trust”), the subadviser of the Equity Fund and the International Fund, which performs day-to-day portfolio management for those two Funds.
In addition, the Trustees considered the Adviser’s ongoing efforts and commitment with respect to shareholder advocacy and corporate environmental responsibility. They took into account the not-for-profit ownership of the Adviser’s business, including its grant to a non profit organization out of its own resources and the fact that any distribution of profits by the Adviser are paid to its 100% owner, Paradigm Partners, which is comprised entirely of nonprofit advocacy organizations so that no individuals directly benefit from the distributed earned profits of the Adviser. They also considered the administrative services provided by Green Century to the Funds under a separate agreement, including the coordination of the activities of the Funds’ other service providers. Based on its review of all of
42
the services provided, the Trustees concluded that the nature, quality, and extent of services provided by the Adviser supported the continuance of the Advisory Agreements with respect to each Fund.
Investment Performance. With respect to the Balanced Fund, the Trustees reviewed and considered information regarding the investment performance of the Balanced Fund and comparative data with respect to the performance of other funds designated by Morningstar to have similar investment objectives as well as the Balanced Fund’s performance measured against the Lipper Balanced Fund Index (“Lipper Index”), which is a broad-based balanced fund market index, and against a custom balanced index (“Custom Index”) comprised of a 60% weighting in the S&P 1500 Index and a 40% weighting in the BofA Merrill Lynch 1-10 Year US Corporate and Government Index. In addition, the Trustees took into account the performance information they had been provided throughout the year. After weighing all the factors deemed appropriate, including the environmental screens applied to the Fund’s investment process, the Trustees, including the Independent Trustees concluded that the performance of the Balanced Fund supported the continuance of the Advisory Agreement with respect to the Balanced Fund.
With respect to the Equity Fund and the International Fund, the Trustees considered that due to each Fund’s passive investment strategy, the principal concern with regard to investment performance was the extent to which the Fund tracked its respective index. After considering all the factors deemed appropriate, the Trustees, including the Independent Trustees concluded that the performance of the Equity Fund and the International Fund supported the continuance of the Advisory Agreement with respect to the Equity Fund and the International Fund, respectively.
The Costs of Services Provided and Profitability. The Trustees considered the costs of the services provided to the Funds and the profitability to the Adviser from its arrangements with the Funds.
The Trustees reviewed and considered an analysis of the advisory fees and total expenses ratios of each Fund and comparative data for multiple categories of mutual funds included in and as defined by Morningstar’s mutual fund database of thousands of mutual funds. For the Balanced Fund, the Trustees noted that, based on the information provided, the Fund’s advisory fee was higher than the average advisory fee for socially conscious funds (by 1 basis point), socially conscious balanced Funds (by 10 basis points), all balanced funds (by 16 basis points), and balanced funds with assets between $200 million and $300 million (by 8 basis points). The Trustees also noted that the total expense ratio of the Balanced Fund was capped at 1.48% and that the total expense ratio was higher than that of the average of socially conscious funds (by 42 basis points), socially conscious balanced funds (by 52 basis points), all balanced funds (by 55 basis points), and balanced funds with assets between $200 million and $300 million (by 61 basis points).
For the Equity Fund, the Trustees noted that, based on the information provided, the Fund’s advisory fee for the Individual Investor Class was lower than the average advisory fee for socially conscious funds (by 42 basis points), socially conscious large growth funds (by 42 basis points), all large growth funds (by 47 basis points), large growth funds with assets between $200 million and $300 million (by 39 basis points) and large growth index funds (by 29 basis points). The Trustees also noted that the total expense ratio of Individual Investor Class of the Equity Fund was capped at 1.25%, and that the total expense ratio was higher than the average of socially conscious funds (by 6 basis points), socially conscious large growth funds (by 3 basis points) and large growth funds with assets between $200 million and $300 million (by 25 basis points); lower than the average of all large growth funds (by 4 basis points); and equal to the average of large growth index funds.
For the International Fund, the Trustees noted that, based on the information provided, the Fund’s advisory fee for the Individual Investor Class was lower than that of the average advisory fee for socially conscious funds (by 37 basis points), socially conscious foreign large blend funds (by 38 basis points), all foreign large blend funds (by 36 basis points) and foreign large blend funds with assets up to $100 million (by 39 basis points), and higher than the average
43
advisory fee for foreign large blend index funds (by 8 basis points). The Trustees also noted that the total expense ratio of Individual Investor Class shares of the International Fund was capped at 1.28% and that the total expense ratio was higher than that of the average of socially conscious funds (by 9 basis points), socially conscious foreign large blend funds (by 4 basis points), all foreign large blend funds (by 16 basis points), foreign large blend funds with assets up to $100 million (by 1 basis point) and foreign large blend index funds (by 81 basis points).
Green Century provided the Trustees with information relating to the profitability to Green Century of its advisory relationships to the Funds. The Trustees noted that based on information provided by Green Century, the relationships to the Funds had not been profitable for several years, though recent growth in Fund assets resulted in a profit for the Adviser’s fiscal year ended June 30, 2015 and increasing levels of profit for subsequent periods through the Adviser’s fiscal year ended June 30, 2019. The Trustees considered an analysis of the estimated Fund-by-Fund profitability for Green Century from the investment management and administrative service it provides to the Trust, which showed that the Adviser had made a profit from managing the Balanced Fund and the Equity Fund, while its management of the International Fund remained unprofitable for the fiscal year ended June 30, 2019. In this regard, the Trustees considered the subadvisory fees and the other expenses incurred by the Adviser in providing advisory services to the Funds and the amount retained by Green Century out of the advisory fees. The Trustees also considered the fees received by Green Century for providing administrative services to the Funds and the expenses incurred in providing those services. In considering the cost allocation methodology used by Green Century, the Trustees took into consideration that the Adviser does not provide advisory or administrative services to other mutual funds or non-mutual fund clients. The Trustees considered the costs and entrepreneurial risks assumed by the Adviser in connection with launching, branding and maintaining publicly-offered mutual funds and that the Adviser had been unprofitable for nine of the last nineteen fiscal years. The Trustees took into account the operational enhancements that Green Century had indicated it would need to undertake in connection with the growth of Fund assets, the addition of new share classes, and the expansion into different types of assets. The Trustees also considered Green Century’s non-profit ownership structure, its cost structure and personnel needs, and its investment in shareholder advocacy that aligns with the Funds’ stated intention to promote greater corporate environmental accountability. After reviewing the information described above, the Trustees concluded that the fees specified in the Advisory Agreements, taking into account the costs of the services provided by the Adviser and the profitability to the Adviser of its relationships with the Funds, supported the continuance of the Advisory Agreements with respect to the Funds.
Other Benefits. With respect to fall-out benefits from the Adviser’s arrangements with the Funds, the Trustees considered that neither Green Century nor any affiliate of Green Century receives any brokerage fees, soft dollar benefits, liquidity rebates from electronic communications networks or payments for order flow from the trades executed for each Fund. The Trustees noted that Green Century does potentially benefit from its relationship with the Funds due to the Funds’ reputation as the first family of no-load environmentally responsible mutual funds and, more recently, as a pioneer in responsible and diversified fossil fuel free mutual funds. The Trustees considered that the association with the Funds supports Green Century’s own stated mission of advocating for corporate environmental responsibility. Further, pursuant to the Advisory Agreements, Green Century has reserved for itself the rights to the names “Green Century Funds” and any similar names; thus, Green Century may benefit in the future from developing other funds or investment products with the Green Century brand. The Trustees concluded that the fall-out benefits to be realized by Green Century were appropriate.
Economies of Scale. The Trustees also considered whether economies of scale could be realized by the Adviser as the Funds grow in asset size and the extent to which such economies of scale were reflected in the level of fees charged. They noted the relatively small size of each Fund and the resultant difficulty of achieving meaningful economies of scale, though they took into account the effects of significant increases in Fund and Trust assets over the past few years relative to a very small base. They considered that if the assets were to increase, the Funds could have the opportunity to experience economies of scale as fixed costs would become a smaller percentage of the Funds’ assets and some of the
44
Funds’ service providers’ fees, as a percentage of the Funds’ assets, could decrease. The Trustees noted that the advisory fee structure for each of the Equity Fund and the Balanced Fund includes breakpoints that would cause the advisory fee to decrease as a percentage of net assets as the Fund increased in size, though under certain circumstances the structure of the Equity Fund’s unitary administrative fee arrangement with the Adviser offsets the effects of any advisory fee reduction on the total expense ratio. The Trustees concluded that there was no current need to seek additional breakpoints, that economies of scale could be realized as the Funds grow, and that if assets increased significantly the Trustees would have opportunities to negotiate further breakpoints or other decreases in fees with the Adviser.
Based on a review of all factors deemed relevant the Trustees concluded that the Advisory Agreements with respect to all of the Funds should be continued for an additional oneyear period.
INVESTMENT SUBADVISORY AGREEMENTS
The Trustees voted to approve the continuance of the subadvisory agreement between the Trust, on behalf of the Balanced Fund, Green Century, and Trillium, as amended (the “Balanced Fund Subadvisory Agreement”), the continuance of the subadvisory agreement between the Trust, on behalf of the Equity Fund, Green Century, and Northern Trust (the “Equity Fund Subadvisory Agreement”) and the continuance of the subadvisory agreement between the Trust, on behalf of the International Fund, Green Century, and Northern Trust (the “International Fund Subadvisory Agreement” and together with the Balanced Fund Subadvisory Agreement and the Equity Fund Subadvisory Agreement, the “Subadvisory Agreements”) at the October 4, 2019 meeting. In connection with their deliberations at the meetings, and in a separate executive session of the Independent Trustees, the Trustees considered, among other things, information provided by Trillium regarding the investment performance of the Balanced Fund, and information provided by Northern Trust regarding the investment performance of the Equity Fund (including the success with which the Equity Fund tracked the MSCI KLD Index) and the International Fund (including the success with which the International Fund tracked the MSCI World Index), the subadvisory fees paid to Trillium and Northern Trust, the profitability to Trillium of its subadvisory relationship to the Balanced Fund and financial information about Northern Trust. The Independent Trustees were assisted by independent counsel in considering these materials and the continuance of the Subadvisory Agreements. The Trustees considered all of the information provided to them by Trillium and Northern Trust, including information provided throughout the year. The Trustees also received a memorandum from independent legal counsel advising them of their duties and responsibilities in connection with the contract review. In approving the continuance of the Subadvisory Agreements, the Board, including the Independent Trustees, did not identify any single factor as determinative. Matters considered in connection with their approval of the Subadvisory. Agreements included the following.
Nature, Quality, and Extent of Services Performed. The Trustees noted that under the terms of the Balanced Fund Subadvisory Agreement, Trillium provided the day-to-day portfolio management of the Balanced Fund, including determining asset and sector allocation; conducting securities selection and discovery; researching and analyzing environmental policies and practices of companies and implementing the Balanced Fund’s environmental screening criteria; managing the volatility, liquidity, risk, and turnover of the portfolio; and investing the portfolio consistent with the Balanced Fund’s investment objective and policies. The Trustees considered the professional expertise, tenure, and qualifications of the portfolio management team and noted that Trillium was devoted exclusively to environmentally and socially responsible investing and managed over $2 billion in assets. The Trustees also considered Trillium’s compliance record as well as the professional experience and responsiveness of Trillium’s compliance staff, as reported to them by the Trust’s chief compliance officer. The Trustees also considered Trillium’s leadership in social and environmental responsibility, including its shareholder advocacy efforts.
The Trustees noted that under the terms of the Equity Fund Subadvisory Agreement and the International Fund Subadvisory Agreement, Northern Trust provided the day-to-day portfolio management of each of the Equity Fund and the International Fund, making purchases and sales of portfolio securities consistent with each such Fund’s investment
45
objective and policies and with changes to the applicable index. The Trustees considered the professional expertise, tenure, and qualifications of the portfolio management team as well as the team’s experience in passive management. The Trustees also considered Northern Trust’s handling of daily inflows and outflows, transaction costs, tracking error, and the portfolio turnover rates for each of the Equity Fund and the International Fund. The Trustees also considered Northern Trust’s compliance record as well as the professional experience and responsiveness of Northern Trust’s compliance staff, as reported to them by the Trust’s chief compliance officer.
Based on its review of all of the services provided and to be provided, the Trustees concluded that the nature, quality, and extent of services provided by Trillium and Northern Trust, respectively, supported the continuance of the Subadvisory Agreements.
Investment Performance. The Trustees reviewed and considered information regarding the investment performance of the Balanced Fund and comparative data with respect to the performance of mutual funds with similar investment objectives as well as other broad-based market indexes. The Trustees noted that as of periods ended July 31, 2019, the Balanced Fund’s one-, three-, five- and ten-year average annual returns outperformed the Lipper Index. The Trustees also noted that as of periods ended July 31, 2019, the Balanced Fund’s one- and three-year average annual returns outperformed the Custom Index and its five- and ten-year average annual returns underperformed the Custom Index. After considering all the factors deemed appropriate, the Trustees concluded that the performance of the Balanced Fund together with Trillium’s investment process, philosophies and experience in environmentally and socially responsible investing, supported the continuance of the Balanced Fund Subadvisory Agreement.
With respect to the Equity Fund and the International Fund, the Trustees considered that due to each Fund’s passive investment strategy, the principal concern with regard to investment performance was the extent to which the Fund tracked its respective index. The Trustees reviewed the performance of the Individual Investor Class shares of the Equity Fund as compared to that of the MSCI KLD Index for the twelve-month period ended July 31, 2019, and noted that the Equity Fund’s performance closely followed that of the MSCI KLD Index. In particular, they observed that, after taking into consideration the fees and expenses of the Individual Investor Class shares, for the one-year period the Equity Fund’s performance was in line with that of the MSCI KLD Index. After considering all the factors deemed appropriate, the Trustees concluded that the performance of the Equity Fund together with Northern Trust’s investment process and experience in passive portfolio management supported the continuance of the Equity Fund Subadvisory Agreement. The Trustees reviewed the performance of the Individual Investor Class shares of the International Fund, exclusive of the expenses of the class, as compared to that of the MSCI World Index for the twelve-month period ended July 31, 2019, and noted that while the Fund’s performance followed that of the MSCI World Index, the Fund slightly underperformed the average annual returns of the MSCI World Index. After considering all the factors they deemed appropriate, the Trustees concluded that the performance of the International Fund together with Northern Trust’s investment process and experience in passive portfolio management supported the continuance of the International Fund Subadvisory Agreement.
Costs of Services Provided and Profitability. The Trustees considered that the subadvisory fees paid by Green Century to Trillium under the Balanced Fund Subadvisory Agreement were 0.40% of the value of the average daily net assets of the Balanced Fund up to $30 million, 0.35% of the value of the average daily net assets of the Balanced Fund in excess of $30 million up to $250 million, and 0.30% of the value of the average daily net assets of the Balanced Fund in excess of $250 million.
In evaluating the profitability of the Subadvisory Agreement to Trillium, the Trustees noted that based on information provided by Trillium, the relationship was profitable. The Trustees noted that Trillium stated that recent increases in the assets of the Balanced Fund have allowed Trillium to realize what it considers to be a fair entrepreneurial profit on the subadvisory services it provides. The Trustees considered the financial resources Trillium dedicated and the other
46
expenses Trillium incurred in providing subadvisory services to the Balanced Fund, including startup costs relating to the relationship, and additional personnel, legal, trading analysis and compliance costs required in the context of providing subadvisory services to a mutual fund. The Trustees took into account that Trillium is the investment adviser or sub-adviser to other mutual funds. The Trustees also considered Trillium’s fee structure and noted, based on the information provided, that the subadvisory fees were lower than the fees Trillium would receive from an institutional client with separate accounts of similar size as the Balanced Fund.
The Trustees considered that the subadvisory fees paid by Green Century to Northern Trust under the Equity Fund Subadvisory Agreement were an annual fee equal to the greater of (a) $75,000 or (b) 0.10% of the value of the average daily net assets of the Equity Fund up to but not including $50 million, 0.05% of the value of the average daily net assets of the Equity Fund from and including $50 million up to but not including $100 million, and 0.03% of the value of the average daily net assets of the Equity Fund equal to or in excess of $100 million.
The Trustees considered that that the subadvisory fees paid by Green Century to Northern Trust under the International Fund Subadvisory Agreement were an annual fee equal to the greater of (a) $100,000 or (b) 0.17% of the value of the average daily net assets of the Fund up to but not including $50 million, 0.12% of the average daily net assets of the Fund from and including $50 million up to but not including $100 million, and 0.08% of the average daily net assets of the Fund equal to or in excess of $100 million.
The Trustees reviewed and considered an analysis of the subadvisory fees for the Equity Fund and the International Fund against comparative data for mutual funds subadvised by Northern Trust with a similar investment strategy and asset size. The Trustees noted that each Fund paid subadvisory fees at effective rates comparable to those paid to Northern Trust by other subadvised index funds with similar levels of net assets. In evaluating the profitability of each of the Equity Fund Subadvisory Agreement and International Fund Subadvisory Agreement to Northern Trust, the Trustees noted that Northern Trust does not calculate earnings at the subadvisory client level.
The Trustees also considered that the subadvisory fees are paid by Green Century, and are not in addition to the advisory fees paid to Green Century by the Funds.
After reviewing the information described above, the Trustees concluded that the fees specified in the Subadvisory Agreements, taking into account the nature and quality of services provided and the costs of the services provided by Trillium and Northern Trust as applicable, supported the continuance of the Subadvisory Agreements.
Other Benefits. The Trustees evaluated potential other benefits that each of Trillium and Northern Trust may realize from its relationship with the applicable Fund(s). The Trustees considered the brokerage practices of Trillium, including the soft dollar commissions that were generated with respect to the Balanced Fund’s portfolio transactions. The Trustees considered that Trillium was not affiliated with a broker/dealer and therefore no benefit would be realized by Trillium through transactions with affiliated brokers. The Trustees also considered the brokerage practices of Northern Trust, including that Northern Trust does not trade for the Equity Fund or the International Fund through its affiliated broker. The Trustees also considered that no soft dollars have been paid in connection with Northern Trust’s management of the Equity Fund and the International Fund.
The Trustees further considered the reputational and other advantages that each of Trillium and Northern Trust may gain from its relationship with the applicable Fund(s), including that Northern Trust’s management of the Equity Fund and the International Fund will broaden its exposure to the socially responsible mutual fund market, which may assist in its marketing efforts. The Trustees concluded that the benefits received by each of Trillium and Northern Trust were reasonable in the context of its relationship with the applicable Fund(s).
47
Economies of Scale. The Trustees also considered whether economies of scale would be realized by each of Trillium and Northern Trust as the Funds grow in asset size and the extent to which such economies of scale might be reflected in the subadvisory fees. They noted the relatively small size of each Fund (compared with similar funds in the industry) and the resultant difficulty of achieving meaningful economies of scale, though they took into account the effects of significant increases in Fund and Trust assets over the past few years. They considered that if the assets were to increase, Trillium and Northern Trust could have the opportunity to experience economies of scale. They also noted that pursuant to the Balanced Fund Subadvisory Agreement, the overall subadvisory fees paid to Trillium by Green Century (out of the advisory fee that Green Century receives from the Fund, which is subject to a breakpoint) include breakpoints at $30 million and $250 million, so that fees as a percentage of net assets decrease modestly (from 40 basis points towards 30 basis points) as assets in the Balanced Fund increase. They also noted that pursuant to the Equity Fund Subadvisory Agreement and the International Fund Subadvisory Agreement, the overall subadvisory fees paid to Northern Trust by Green Century (out of the advisory fee that Green Century receives from the applicable Fund, which, for the Equity Fund, is subject to breakpoints) include breakpoints at $50 million and $100 million (subject to a minimum annual fee of $75,000 for the Equity Fund and $100,000 for the International Fund), so that fees as a percentage of net assets decrease as assets in the Equity Fund and the International Fund increase. The Trustees concluded that economies of scale could be realized as the Funds grow, and that the fee schedules as specified were appropriate, and supported the continuance of the Subadvisory Agreements.
Based on a review of all factors deemed relevant, the Trustees, including the Independent Trustees, concluded that all of the Subadvisory Agreements should be continued for an additional one-year period.
INVESTMENT ADVISER AND ADMINISTRATOR
Green Century Capital Management, Inc.
114 State Street
Boston, MA 02109
1-800-93-GREEN
www.greencentury.com
info@greencentury.com
INVESTMENT SUBADVISER (Balanced Fund)
Trillium Asset Management, LLC
Two Financial Center
60 South Street, Suite 1100
Boston, MA 02111
INVESTMENT SUBADVISER (Equity Fund and International Fund)
Northern Trust Investments, Inc.
50 South LaSalle Street
Chicago, IL 60603
SUBADMINISTRATOR and DISTRIBUTOR
UMB Fund Services, Inc. (Subadministrator)
UMB Distribution Services, LLC (Distributor)
235 West Galena Street
Milwaukee, WI 53212
CUSTODIAN
UMB Bank, n.a.
928 Grand Blvd
Kansas City, MO 64106
TRANSFER AGENT
Atlantic Shareholder Services, LLC
Three Canal Plaza
Portland, ME 04101
INDEPENDENT REGISTERED PUBLIC ACCOUNTING FIRM
KPMG LLP
Two Financial Center
60 South Street
Boston, MA 02111
Printed on recycled paper with soy-based ink.
48
THIS PAGE INTENTIONALLY LEFT BLANK
YOUR NOTES
THIS PAGE INTENTIONALLY LEFT BLANK
YOUR NOTES
THIS PAGE INTENTIONALLY LEFT BLANK
YOUR NOTES
Semi-Annual Report
Beginning in March 2021, as permitted by regulations adopted by the Securities and Exchange Commission, paper copies of the Green Century Funds’ shareholder reports like this one will no longer be sent by mail, unless you specifically request paper copies of the reports from Green Century or from your financial intermediary, such as a broker-dealer or bank. Instead, the reports will be made available on the Funds’ website, and you will be notified by mail each time a report is posted and provided with a website link to access the report.
If you already elected to receive shareholder reports electronically, you will not be affected by this change and you need not take any action. You may elect to receive shareholder reports and other communications from the Green Century Funds electronically by contacting your financial intermediary or, if you invest directly with the Funds, by contacting Shareholder Services at 1-800-221-5519 or by visiting https://www.greencentury.com/access-my-account/.
You may elect to receive all future reports in paper free of charge. If you invest directly with the Funds, you can inform Green Century that you wish to continue receiving paper copies of your shareholder reports by contacting Green Century at 1-800-221-5519 or via email at info@greencentury.com. If you invest through a financial intermediary, you can contact your financial intermediary to request that you continue to receive paper copies of your shareholder reports. Your election to receive reports in paper will apply to all funds held in your account if you invest through your financial intermediary or all accounts held in the Green Century Funds.
January 31, 2020
Balanced
Fund
Equity Fund
International Fund
Item 2. Code of Ethics
Not applicable to semi-annual reports.
Item 3. Audit Committee Financial Expert
Not applicable to semi-annual reports.
Item 4. Principal Accountant Fees and Services
Not applicable to semi-annual reports.
Item 5. Audit Committee of Listed Registrants
Not applicable.
Item 6. Schedule of Investments
Included as part of the report to shareholders filed under Item 1 of this Form N-CSR.
Item 7. Disclosure of Proxy Voting Policies and Procedures for Closed-End Management Investment Companies
Not applicable.
Item 8. Portfolio Managers of Closed-End Management Investment Companies
Not applicable.
Item 9. Purchases of Equity Securities by Closed-End Management Investment Company and Affiliated Purchasers
Not applicable.
Item 10. Submission of Matters to a Vote of Security Holders
There were no material changes to the procedures by which shareholders may recommend nominees to the registrant's Board of Trustees.
Item 11. Controls and Procedures
(a)Based on an evaluation of the disclosure controls and procedures (as defined in Rule 30a-3(c) under the Investment Company Act of 1940, as amended, the "Disclosure Controls") as of a date within 90 days of the filing date (the "Filing Date") of this Form N-CSR (the "Report"), the registrant's principal executive officer and principal financial officer have concluded that the Disclosure Controls are effectively designed to ensure that information that is required to be disclosed by the registrant in the Report is recorded, processed, summarized and reported within the time periods specified in the Securities and Exchange Commission's rules and forms, including ensuring that information required to be disclosed in the Report is accumulated and communicated to the registrant's management, including the registrant's
principal executive officer and principal financial officer, as appropriate to allow timely decisions regarding required disclosures.
(b)There were no changes in the registrant's internal controls over financial reporting (as defined in Rule 30a-3(d) under the Investment Company Act of 1940) that occurred during the fiscal period covered by this report that have materially affected, or are reasonably likely to materially affect, the registrant's internal control over financial reporting.
Item 12. Disclosure of securities lending activities for closed-end management investment companies.
Not applicable.
Item 13. Exhibits
(a)(1) Not applicable.
(3)Not applicable.
(4)There was no change in the registrant's independent public accountant for the period covered by this report.

SIGNATURES
Pursuant to the requirements of the Securities Exchange Act of 1934 and the Investment Company Act of 1940, the registrant has duly caused this report to be signed on its behalf by the undersigned, thereunto duly authorized.
Green Century Funds
/s/ John R. Nolan___ ___
John R. Nolan
President and Principal Executive Officer
April 3, 2020
Pursuant to the requirements of the Securities Exchange Act of 1934 and the Investment Company Act of 1940, this report has been signed below by the following persons on behalf of the registrant and in the capacities and on the dates indicated.
/s/ John R. Nolan_____
John R. Nolan
President and Principal Executive Officer
April 03, 2020
/s/ John R. Nolan____
John R. Nolan
Treasurer and Principal Financial Officer
April 03, 2020