UNITED STATES
SECURITIES AND EXCHANGE COMMISSION
Washington, D.C. 20549
FORM N-CSR
CERTIFIED SHAREHOLDER REPORT OF REGISTERED
MANAGEMENT INVESTMENT COMPANIES
Investment Company Act File Number 811-06351
Green Century Funds
114 State Street
Suite 200
Boston, MA 02109
(Address of principal executive offices)
Green Century Capital Management, Inc.
114 State Street
Suite 200
Boston, MA 02109
(Name and address of agent for service)
Registrant’s telephone number, including area code: (617) 482-0800
Date of fiscal year end: July 31
Date of reporting period: July 31, 2023
Item 1. Reports to Stockholders
| | (a) | The following is a copy of the report transmitted to shareholders pursuant to Rule 30e-1 under the Investment Company Act of 1940 (17 CFR 270.30e-1). |
| | |
 | | ANNUAL REPORT Green Century Balanced Fund Green Century Equity Fund Green Century MSCI International Index Fund July 31, 2023 |
| |
| An investment for your future.® | | 114 State Street, Boston, Massachusetts 02109 |
For information on the Green Century Funds®, call 1-800-93-GREEN. For information on how to open an account and account services, call 1-800-221-5519 8:00 am to 6:00 pm Eastern Time, Monday through Friday. For share price and account information, visit www.greencentury.com.
Dear Green Century Funds Shareholder:
Thank you for putting your trust in the Green Century Funds°. We’re honored to provide opportunities for you to invest in alignment with your environmental values and help make an impact as you save for the future.
The last year has seen sustainable investing come into the mainstream in new ways. Families have taken steps to invest with their values in unprecedented numbers. Institutions and businesses have added sustainable investing options to their retirement plans. The media, including the Wall Street Journal, which rarely reported on sustainable investing a decade ago, now publishes articles on the topic weekly.
This increased interest grew the Green Century Funds to over $1B and has sparked mainstream investment firms to launch products to meet this increased demand.
The wildfires, extreme heat, and flooding of the summer brought the reality of climate risk home to investment advisors, and more are starting to consider it in their decisions. This positive step means that the financial sector is elevating climate change as a key factor in their investment decisions, which can help companies address this challenge.
The call to move money out of fossil fuel companies has been a significant force in helping to grow and shape this field. Starting just over 10 years ago, the fossil fuel divestment movement has convinced institutions, ranging from Harvard University to the New York Pension Fund, to change their investments. So far, nearly 1,500 organizations with assets of more than $39.2 trillion have committed to divest from fossil fuels and this adoption has helped elevate the attention on fossil fuel companies, raised the cost of capital needed for new fossil fuel projects, and signaled interest to investors to support clean energy projects.
This success has sparked a pushback by the fossil fuel industry. We believe the recent attack on sustainable investing, being called ESG (Environmental, Social and Governance) in the media, is a thinly veiled attempt by the fossil fuel industry and its supporters to weaken the move away from the oil and gas industry. A 2022 investigative report by InfluenceMap suggests fossil fuel companies have been the major driver in the fight against sustainable finance. While the campaign has not resonated with many Americans, it could potentially restrict some investment options for government entities in Texas and Florida and how they invest. Green Century is collaborating with other investors to oppose these limitations.
In conversations with our current and prospective investors, I have observed that the fossil fuel industry’s efforts have strengthened people’s determination to choose a cleaner future. Green Century is proud to support tens of thousands of individuals from across the country who want clean air, clean water, wildlife, open spaces, and a livable climate.
In the last year, Green Century worked with 60 companies and helped persuade 20 of them to adopt new environmental policies. We scored a significant victory when we successfully helped persuade Costco1, the third largest retailer in the world, to shrink its greenhouse gas emissions. The company will set targets to reduce carbon pollution from growing or producing the products they sell, which account for 98% of the company’s emissions. To help protect wildlife from plastic waste, we also got ODP Corporation1, which operates Office Depot and OfficeMax, to adopt a policy to reduce the total amount of packaging of its private label products and e-commerce shipping. Apple1 announced it will allow consumers to repair their iPhone 14, MacBook Pro, and other products, keeping electronic waste out of our landfills. Green Century started a campaign with Apple in 2021 to adopt this policy.
Green Century supported our non-profit owners with financial resources to lead programs to source 100% renewable energy in states, aid in protecting wildlife from plastic pollution, and help keep life-saving medicines effective. Green Century’s ownership provides a unique way for investors to make an impact. There is no other mutual fund company that is exclusively owned by environmental and public health organizations.
To learn more about Green Century’s work, I encourage you to join our Enews list orSign up on our website at www.greencentury.com.
* An investment strategy that incorporates environmental, social and governance criteria may result in lower or higher returns than an investment strategy that does not include such criteria.
Thank you for saving for your future with Green Century. Together, we are building a greener future.
Sincerely,
Leslie Samuelrich
President, Green Century Funds
° Green Century Capital Management, Inc. (Green Century) is the investment advisor to the Green Century Funds (the Funds).
The Green Century Funds are a family of fossil fuel-free, environmentally responsible mutual funds. Green Century Capital Management hosts an award-winning and in-house shareholder advocacy program and is the only mutual fund company in the U.S. wholly owned by environmental and public health nonprofit organizations.
You should carefully consider the Fund’s investment objectives, risks, charges, and expenses before investing. To obtain a Prospectus that contains this and other information about the Funds please visit www.greencentury.com, email info@greencentury.com, or call 1-800-934-7336. Please read the Prospectus carefully before investing.
2
Stocks will fluctuate in response to factors that may affect a single company, industry, sector, country, region or the market as a whole and may perform worse than the market. Foreign securities are subject to additional risks such as currency fluctuations, regional economic and political conditions, differences in accounting methods, and other unique risks compared to investing in securities of U.S. issuers. Bonds are subject to a variety of risks including interest rate, credit, and inflation risk. A sustainable investment strategy which incorporates environmental, social and governance criteria may result in lower or higher returns than an investment strategy that does not include such criteria.
This information has been prepared from sources believed reliable. The views expressed are as the date of this writing and are those of the Advisor to the Funds.
The Green Century Funds are distributed by UMB Distribution Services, LLC. 235 W Galena Street, Milwaukee, WI 53212. 8/23. UMB and Green Century are not affiliated.
Green Century on the Web
E-News. For more regular updates on the Green Century Funds and on our advocacy efforts, please consider signing up for our e-newsletter. Call 1-800-934-7336, visit www.greencentury.com, or email info@greencentury.com.
Online Access. Information on your account is available on our website at www.greencentury.com. From the home page, click on Access My Account. Shareholders may also perform online transactions on the site. While there, please consider registering for e-delivery of your statements and other Fund documents.
Twitter. Green Century is on Twitter. Follow us at Twitter.com/Green_Century for a sustainable investor’s perspective on critical issues.
The Green Century Funds’ proxy voting guidelines and a record of the Funds’ proxy votes for the year ended June 30, 2023 are available without charge, upon request, (i) at www.greencentury.com, (ii) by calling 1-800-934-7336, (iii) by sending an e-mail to info@greencentury.com, and (iv) on the Securities and Exchange Commission’s website at www.sec.gov.
The Green Century Funds file their complete schedule of portfolio holdings with the SEC for the first and third quarters of the year on Form N-PORT, Part F. The Green Century Funds’ Forms N-PORT, Part F are available on the EDGAR database on the SEC’s website at www.sec.gov. Copies may be obtained upon payment of a duplicating fee, by writing the SEC’s Public Reference Section, Washington DC 20549-0102 or by electronic request at the following e-mail address: publicinfo@sec.gov. The information on Form N-PORT, Part F may also be obtained by calling us at 1-800-934-7336, or by e-mailing a request to info@greencentury.com
3
MANAGEMENT’S DISCUSSION OF FUND PERFORMANCE
GREEN CENTURY BALANCED FUND
Investment Objective The Green Century Balanced Fund seeks capital growth and income from a diversified portfolio of stocks and bonds that meet Green Century’s standards for corporate environmental responsibility.
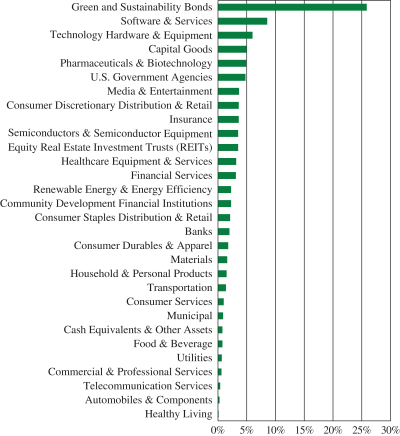
Portfolio Orientation As of the fiscal year ended July 31, the Green Century Balanced Fund (the Balanced Fund or the Fund) was diversified in a number of ways. Equity holdings represented 61.6% and bonds
constituted 37.6% of the Fund’s net asset value. The Fund had 0.8% invested in cash, cash equivalents, and other assets, less liabilities. The portfolio managers view equities as the primary source of potential long-term growth, while emphasizing the importance of diversification in seeking to lower volatility. The Fund’s equity holdings were diversified across 72 equity holdings at fiscal year-end, none of which represented more than 5.10% of total net assets. Generally, larger, more established companies constitute larger positions in the Fund’s portfolio than smaller companies. The portfolio managers seek to mitigate risk by investing primarily in companies they believe have demonstrated records of profitability, above-average growth prospects, and reasonable valuations.
As of July 31, the stocks held by the Balanced Fund were also diversified by sector, with (as a percent of total net assets) Technology (18%), Health Care (9.7%), and Financial Services (7.2%) as the largest sectors.
In line with its environmental mandate, the Fund had exposure to what Green Century considers environmental leaders in a number of
GREEN CENTURY BALANCED FUND
INVESTMENT BY INDUSTRY (unaudited)
4
industries including Healthy Living, Capital Goods, and Transportation. Green Century’s environmental screens prohibit traditional energy and utility companies from being owned, while the Fund has broad exposure to information technology, health care, financial, consumer, and industrial companies.
In addition to its equity exposure to environmental leaders, the Fund invests in designated Green Bonds and designated Social Impact Bonds. The issuers of Green Bonds have indicated that the proceeds from the bonds will be used for environmentally positive goals such as greenhouse gas reduction, climate adaptation, and climate change mitigation. Issuers of designated Social Impact Bonds have indicated that the proceeds from the bonds will be used for projects supporting such issues as poverty alleviation, low-income housing, fair trade, and community development. As of July 31st, 29.9% of the total portfolio and 79.5% of the market value of the bonds held in the Fund were designated Green / Sustainable or Social Impact Bonds.
Higher quality, intermediate maturity bonds can typically lower volatility and provide a stable source of income. At fiscal year end, the Balanced Fund held 52 bonds diversified across corporate and government agency issuers. In an effort to dampen volatility, the weighted average maturity (5.02 years) and modified duration (4.30 years) remain in the intermediate range. The weighted average yield to maturity was 4.99%. All fixed income holdings were investment grade at time of purchase and remain investment grade at July 31, 2023.
Economic Environment.
Equity markets witnessed considerable volatility over the last 12-months, hitting a low in October and then bouncing back sharply during the first half of 2023. While the U.S. economy has thus far been resilient, the portfolio managers note that icebergs lurk mostly underwater. They continue to see many risks, with a wide dispersion of potential outcomes. They anticipate deteriorating profits, rising unemployment, more volatile asset markets, and recession risks rising across the developed world as already tightened monetary policy takes hold. Company managements are guiding earnings outlooks lower, while also indicating that lower income consumers are showing signs of stress. Unemployment remains at very low levels, but both new unemployment claims and continuing unemployment claims have begun to rise, and the Job Openings and Labor Turnover Survey (JOLTS) shows job openings are down 18% since March of 2022, a signal that typically precedes a recession. Once recessions begin, the unemployment rate typically jumps sharply. The Institute for Supply Management (ISM) Purchasing Managers Index Manufacturing series show that Manufacturing Employment, New Orders, and Prices Paid are all in contractionary territory. The ISM Services Indexes are still in expansionary territory indicating that spending on services is supporting the economy. Commercial real estate, particularly for downtown office buildings, will likely come under increasing stress as office leases negotiated before the start of Covid come up for renewal in the next few years; companies have been negotiating for better amenities and smaller space, leaving even Class A space vulnerable if it is of an older vintage.
Further support for the portfolio manager’s view that recession is near comes from The Conference Board’s surveys of year-over-year leading and coincident economic indicators, which are now at or below the levels consistent with every U.S. recession since 1970. Recent U.S. equity returns were generated by a very narrow market, focused on mega capitalization Information Technology, Consumer Discretionary, and Communications Services companies that arguably would benefit from enhanced generative Artificial Intelligence (AI). The portfolio managers continue to favor stocks over bonds as a strategic allocation. They
5
acknowledge that bonds can provide a diversification benefit to portfolio construction. They also recognize that stocks may have considerable additional risk over the immediate horizon. Nonetheless, the rapid recoveries of equity markets at the end of bear markets suggests caution in reducing equity holdings, and the earnings growth capabilities of stocks are expected to ultimately support their valuation in both inflationary and deflationary environments. They prefer to position for equity market downside by adjusting portfolio composition to reflect our cautious stance rather than moving below an appropriate strategic allocation.
Overall, the portfolio managers believe that the fund’s domestically oriented equity strategies have been making active portfolio construction decisions to be appropriately positioned for a more risk-off equity market. In these strategies, for either a slowing growth or a recessionary environment, they expect that a focus on quality, lower-leverage, profitable companies with steadier earnings and revenues will be protective of portfolio value. They continue to avoid positioning for extremes and acknowledge that a likely recession, combined with high uncertainty about the exact course of that recession, means an increased likelihood of rapid rotation, particularly as investors lean heavily on small changes in weekly and monthly data releases. In such an environment, thoughtful analysis of company management, strategies, and prospects assumes added importance. The portfolio managers remain committed to our long-term focus and investment in high-quality and sustainability-centered companies seeking to meet the challenges of this year of recovery and transition, and beyond. They continue to seek out companies that acknowledge the ongoing climate crisis and which are setting their own targets for greenhouse reduction. This is becoming ever more important; June 2023 was the hottest June on record, with average temperatures more than 2.5 degrees Fahrenheit over June temperatures in the late 1800s.
Investment Strategy and Performance. The portfolio managers believe that strong environmental, social, and governance practices may enhance corporate profitability and reduce certain types of risks. The Fund specifically avoids risks associated with exposure to fossil fuels. Companies with strong balance sheets, strategic leadership in their products and markets, and strong environmental, social, and governance policies will have the financial flexibility and leadership wisdom to navigate choppy and volatile economic conditions.
The Balanced Fund holds a number of stocks that the portfolio managers believe have attractive environmental, social, and financial characteristics. New holdings over the reporting period include Verisk Analytics Inc.1, Gilead Sciences Inc.1, Progressive Corp. Ohio1, ServiceNow, Inc.1 and Equinix Inc.1
On July 31, 2023, the Fund held over $118.0 million in Green / Sustainability or Social Impact Bonds and Notes. Some holdings include notes issued by Euro Invt. Bank1, IBRD1, Mastercard1 and SalesForce1.
For the year ending July 31, 2023, the Balanced Fund’s returns were 4.01%, versus 7.19% return for its Custom Balanced Index,2 an index comprised of the S&P 1500 Index3 (60% weighting) and of the BofA Merrill Lynch 1-10 Year US Corporate and Government Index4 (40% weighting).* The Lipper Balanced Index5 returned 5.37% for the same twelve-month period.
Stock selection and a smaller cap bias were the primary reasons for underperformance in the period, as a narrow market propelled a handful of larger cap names to lofty valuations.
6
The Fund’s high-quality fixed income exposure performed relatively in-line with the benchmark as intentioned, with slight underperformance in the period. The Fund’s portfolio managers do not anticipate any significant changes in investment strategy for the Fund, believing that the investment environment may be favorable to the Fund’s core holdings in what the portfolio managers consider high-quality, environmentally responsible companies with strong growth prospects and reasonable valuations.
| | | | | | | | | | | | | | | | | | |
Green Century Balanced Fund Total expense ratio: 1.46% for Individual Share Class and 1.16% for
Institutional Share Class | | CUMULATIVE
RETURN* | | | AVERAGE ANNUAL RETURN* | |
| | Latest
Quarter | | | One Year | | | Five Years | | | Ten Years | |
| June 30, 2023 | | Green Century Balanced Fund — Individual Share Class | | | 2.87% | | | | 9.07% | | | | 7.35% | | | | 7.48% | |
| | Green Century Balanced Fund — Institutional Share Class** | | | 2.95% | | | | 9.43% | | | | 7.52% | | | | 7.56% | |
| | | Custom Balanced Index | | | 4.70% | | | | 11.47% | | | | 7.89% | | | | 8.30% | |
| July 31, 2023 | | Green Century Balanced Fund — Individual Share Class | | | 4.10% | | | | 3.67% | | | | 7.24% | | | | 7.23% | |
| | Green Century Balanced Fund — Institutional Share Class** | | | 4.18% | | | | 4.01% | | | | 7.41% | | | | 7.32% | |
| | | Custom Balanced Index | | | 5.80% | | | | 7.19% | | | | 7.88% | | | | 8.18% | |
* The performance data quoted represents past performance and is not a guarantee of future results. Investment return and principal value of an investment will fluctuate so that an investor’s shares, when redeemed, may be worth more or less than their original cost. Current performance may be lower or higher than the performance information quoted. To obtain Fund prices and performance information as of the most recent month-end, call 1-800-93-GREEN/1-800-934-7336. Performance includes the reinvestment of income dividends and capital gain distributions. Performance shown does not reflect the deduction of taxes that a shareholder might pay on Fund distributions or the redemption of Fund shares. A redemption fee of 2.00% may be imposed on redemptions or exchanges of shares you have owned for 60 days or less. Please see the prospectus for more information.
**Institutional Shares were offered as of November 28, 2020. The Institutional Share Class performance prior to November 28, 2020 reflects the performance of the Fund’s Individual Investor Class.
7
The Lipper Balanced Fund Index includes the 30 largest funds whose primary objective is to conserve principal by maintaining at all times a balanced portfolio of both stocks and bonds. Typically the stock/bond ratio ranges around 60%/40%.
The Balanced Fund consistently includes stocks and bonds of what Green Century believes to be environmentally responsible corporations of various sizes, including small, medium, and large companies. The value of the stocks held in the Balanced Fund will fluctuate in response to factors that may affect the single issuer, industry, or sector of the economy or may affect the market as a whole. Bonds are subject to a variety of risks including interest rate, credit, and inflation risk. The Funds’ environmental criteria limit the investments available to the Funds compared to mutual funds that do not use environmental criteria.
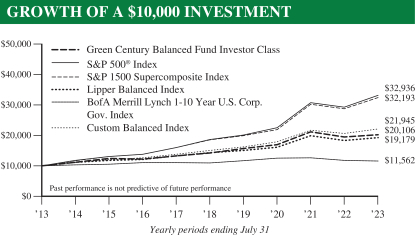
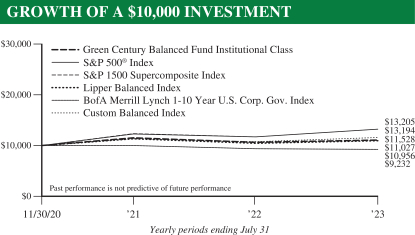
The S&P 500® Index6 and the S&P Supercomposite 1500 Index (the S&P 1500 Index) are unmanaged indexes of 500 and 1500 stocks, respectively. The Custom Balanced Index is comprised of a 60% weighting in the S&P 1500 Index and a 40% weighting in the BofA Merrill Lynch 1-10 Year US Corporate & Government Index (the BofA Merrill Lynch Index). The BofA Merrill Lynch Index tracks the performance of U.S. dollar-denominated investment grade government and corporate public debt issued in the U.S. domestic bond market with at least 1 year and less than 10 years remaining maturity, including U.S. Treasury, U.S. Agency, foreign government, supranational and corporate securities. Similar to the Balanced Fund, the performance of the S&P 500® Index, the S&P 1500 Index, the Custom Balanced Index and the BofA Merrill Lynch Index reflect reinvestment of dividends and distributions. Unlike the Fund, however, the performance of the S&P 500® Index, the S&P 1500 Index, the Custom Balanced Index and the BofA Merrill Lynch Index does not include management and other operating expenses. It is not possible to invest directly in an index.
8
MANAGEMENT’S DISCUSSION OF FUND PERFORMANCE
GREEN CENTURY EQUITY FUND
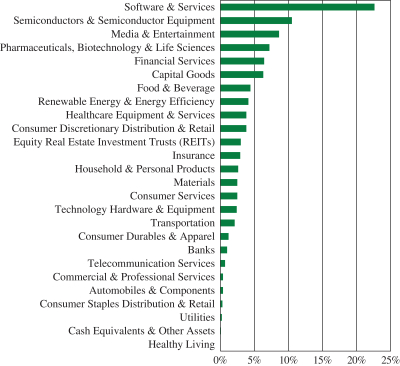
Investment Objective The Green Century Equity Fund (the Equity Fund or the Fund) seeks to achieve long-term total return that matches the performance of an index comprised of the stocks of companies selected based on environmental, social and governance criteria.
Portfolio Orientation The Fund seeks to achieve its objective by investing in the stocks which make up the MSCI KLD 400 Social ex Fossil Fuels Index7 (the KLD400 ex Fossil Fuels Index or the Index), a custom index calculated by MSCI, Inc. The KLD400 ex Fossil Fuels Index is comprised of the common stocks of the approximately 400 companies in the MSCI KLD 400 Social Index (the KLD400 Index)7, minus the stocks of the companies that explore for, extract, produce, manufacture, or refine coal, oil or gas that are included in the KLD400 Index. The Index also does not include companies that produce or transmit electricity derived from fossil fuels, transmit natural gas, or own carbon reserves.
The KLD400 Index, formerly named the Domini 400 Social Index, is the longest-running socially responsible index. Like other index funds, the Equity Fund is not actively managed in the traditional investment sense, but rather seeks to be nearly fully invested at all times in a broad and diverse portfolio of stocks which meet certain environmental, social and governance (ESG) criteria. The Equity Fund, like many other mutual funds invested primarily in stocks, carries the risk of investing in the stock market. The large companies in which the Equity Fund is invested may perform worse than the stock market as a whole. The Fund’s environmental criteria limit the investments available to the Fund compared to mutual funds that do not use environmental criteria.
The Fund invests in the stocks of companies selected for inclusion in the Index based on a thorough review of environmental, social, and governance factors and includes
GREEN CENTURY EQUITY FUND
INVESTMENT BY INDUSTRY (unaudited)
9
those companies believed to have the best overall sustainability records. Green Century believes that certain industries impose unique and onerous risks and/or costs on society. Companies involved in these industries are evaluated based on their level of involvement as well as the impact of that involvement on society. Therefore, companies that derive significant revenues from the manufacture of tobacco products, alcoholic beverages, genetically modified organisms (GMOs), or the operation of gambling enterprises; or have a significant direct ownership share in, operate or design nuclear power plants are not eligible for the Index. Major military contractors and firearms manufacturers are also ineligible. The Index excludes all companies that explore for, extract, produce, manufacture, or refine coal, oil or gas. The Index also does not include companies that produce or transmit electricity derived from fossil fuels, transmit natural gas, or own carbon reserves.
Investment Strategy and Performance Green Century believes that companies that minimize their negative social and environmental impact and follow governance standards could enjoy competitive advantages and be less likely to incur certain legal liabilities that may be assessed when a product or service is determined to be harmful. Green Century also believes that such investments may, over the long term, provide investors with a return that is competitive with enterprises that do not exhibit such social and environmental awareness.
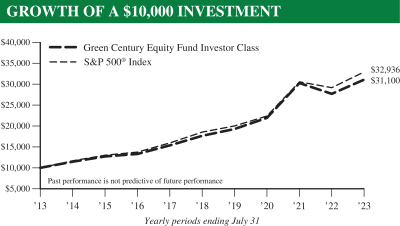
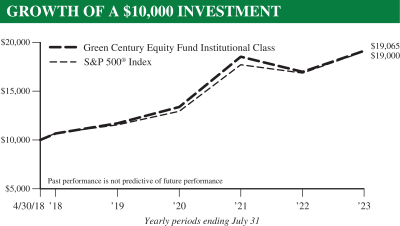
The Equity Fund’s total return for the latest quarter ended July 31, 2023 was 11.47% for the individual share class and 11.55% for the institutional share class, outperforming the S&P 500® Index that returned 10.51% for the same period. Additional results for various time periods are below:*
| | | | | | | | | | | | | | | | | | |
Green Century Equity Fund Total expense ratio: 1.25% for Individual Share Class and 0.95% for
Institutional Share Class | | CUMULATIVE
RETURN* | | | AVERAGE ANNUAL RETURN* | |
| | Latest
Quarter | | | One Year | | | Five Years | | | Ten Years | |
| June 30, 2023 | | Green Century Equity Index Fund – Individual Share Class | | | 8.25% | | | | 17.95% | | | | 12.00% | | | | 12.10% | |
| | Green Century Equity Fund – Institutional Share Class | | | 8.33% | | | | 18.29% | | | | 12.33% | | | | 12.27% | |
| | | S&P 500® Index | | | 8.74% | | | | 19.59% | | | | 12.31% | | | | 12.86% | |
| July 31, 2023 | | Green Century Equity Index Fund – Individual Share Class | | | 11.47% | | | | 12.37% | | | | 12.01% | | | | 12.02% | |
| | Green Century Equity Fund – Institutional Share Class | | | 11.55% | | | | 12.72% | | | | 12.35% | | | | 12.19% | |
| | | S&P 500® Index | | | 10.51% | | | | 13.02% | | | | 12.20% | | | | 12.66% | |
* The performance data quoted represents past performance and is not a guarantee of future results. Investment return and principal value of an investment will fluctuate so that an investor’s shares, when redeemed, may be worth more or less than their original cost. Current performance may be lower or higher than the performance information quoted. To obtain Fund prices and performance information as of the most recent month-end, call 1-800-93-GREEN/1-800-934-7336. Performance includes the reinvestment of income dividends and capital gains distributions. Performance shown does not reflect the deduction of taxes that a shareholder might pay on Fund distributions or the redemption of Fund shares. A redemption fee of 2.00% may be imposed on redemptions or exchanges of shares you have owned for 60 days or less. Please see the prospectus for more information. As of April 1, 2014, the Equity Fund invests in the common stocks which make up the MSCI KLD 400 Social ex Fossil Fuels Index; prior to April 1, 2014, the Fund invested in the common stocks which made up the MSCI KLD 400 Social Index. Institutional shares were offered as of April 30, 2018. The Institutional Share Class performance for periods prior to April 30, 2018 reflects the performance of the Fund’s Individual Investor Class.
10
For the year ended July 31, 2023, the Equity Fund Institutional and Investor share classes returned 12.72% and 12.37%, respectively, compared to the S&P 500 Index which returned 13.02%. As the MSCI KLD 400 Social ex Fossil Fuels Index does not include all of the stocks in the S&P 500® Index and includes some stocks not included in the S&P 500® Index, the performance of the Fund can be expected to differ from the performance of the broader benchmark.
The strongest performing sectors in the Equity Fund were Information Technology, Industrials, and Materials which returned 32.44%, 20.06% and 10.02%, respectively. The worst performing sectors were Utilities and Real Estate, which returned -7.36% and -6.27%, respectively, for the year. Within the S&P 500
Index, Information Technology, Industrials, and Energy were the strongest performing sectors, gaining 28.09%, 16.63%, and 16.25%, respectively. The worst performing sectors were Real Estate and Utilities, which returned -9.81% and -6.44%, respectively, for the year.
US equities underperformed non-US developed equities for the reporting period, as measured by the S&P 500 and MSCI World Ex US indices8, with 1 year returns of 13.02% and 15.47% respectively. U.S. Equities declined during a volatile third quarter of 2022. After stocks rallied to start the quarter, investor risk appetite turned sharply lower following higher than expected inflation data. The U.S. Federal Reserve continued to aggressively hike short term interest rates. Global markets finished the 4th quarter higher, with investor sentiment buoyed by easing inflationary pressures. Declining inflation levels allowed the U.S. Federal Reserve and European Central Bank to slow the pace of interest rate increases. Despite additional central bank tightening and a string of bank
The S&P 500® Index is an unmanaged index of 500 stocks. Similar to the Equity Fund, the S&P 500® Index’s performance reflects reinvestment of dividends and distributions. Unlike the Fund, however, the S&P 500® Index’s performance does not include management and other operating expenses. It is not possible to invest directly in an index.
11
failures, global equity markets posted mid-single-digit gains in the first quarter of 2023. As the quarter progressed, investors’ focus gradually drifted from a more optimistic view on the path of inflation in January to concerns about further monetary tightening in February through early March. Financial markets performed well in the second quarter with the U.S. helping propel global equities to a mid-single-digit gain. Declining inflation and a resilient economic growth backdrop bolstered U.S. equity markets in addition to robust returns in a narrow set of mega cap tech stocks helped by optimism with respect to artificial intelligence.
12
MANAGEMENT’S DISCUSSION OF FUND PERFORMANCE
GREEN CENTURY MSCI INTERNATIONAL INDEX FUND
Investment Objective The Green Century MSCI International Index Fund (the International Fund or the Fund) seeks to achieve long-term total return that matches the performance of an index comprised of the stocks of foreign companies selected based on environmental, social and governance criteria.
Portfolio Orientation The Fund seeks to achieve its objective by investing in the stocks included in the MSCI World ex USA SRI ex Fossil Fuels Index9 (the Index), a custom index calculated by MSCI, Inc. The Index is comprised of the common stocks of the approximately 240 companies in the MSCI World ex USA SRI Index, minus the stocks of the companies that explore for, extract, process, refine or distribute coal, oil or gas. The Index also does not include companies that produce or transmit electricity derived from fossil fuels, transmit natural gas, or own carbon reserves.
The International Fund is the only responsible, diversified fossil fuel free international index fund available in the U.S. The Fund is also broadly diversified and responsibly screened. Like other index funds, the International Fund is not actively managed in the traditional investment sense, but rather seeks to be nearly fully invested at all times in a broad and diverse portfolio of stocks which meet certain environmental, social and governance (ESG) criteria.
The Fund invests in the stocks of companies selected for inclusion in the Index based on a thorough review of environmental, social, and governance factors and includes those companies believed to have the best overall sustainability records. Green Century believes that certain industries impose unique and onerous risks and/or costs on society. Companies involved in these industries are evaluated based on their level of involvement as well as the impact of that involvement on
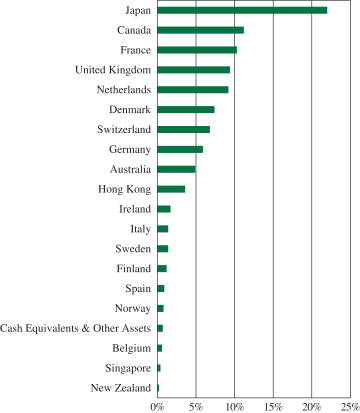
GREEN CENTURY MSCI INTERNATIONAL INDEX FUND
INVESTMENT BY COUNTRY (unaudited)
13
society. Therefore, companies that derive significant revenues from the manufacture of tobacco products, alcoholic beverages, genetically modified organisms (GMOs), or the operation of gambling enterprises; or have a significant direct ownership share in, operate or design nuclear power plants are not eligible for the Index. Major military contractors and firearms manufacturers are also ineligible. The Index excludes all companies that explore for, extract, produce, manufacture, or refine coal, oil or gas. The Index also does not include companies that produce or transmit electricity derived from fossil fuels, transmit natural gas, or own carbon reserves.
Investment Strategy and Performance Green Century believes that companies that minimize their negative social and environmental impact and follow governance standards could enjoy competitive advantages and be less likely to incur certain legal liabilities that may be assessed when a product or service is determined to be harmful. Green Century also believes that such investments may, over the long term, provide investors with a return that is competitive with enterprises that do not exhibit such social and environmental awareness.
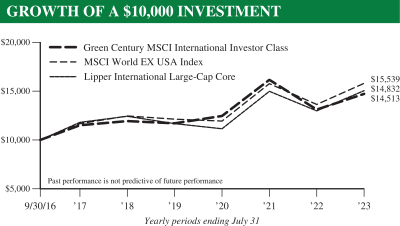
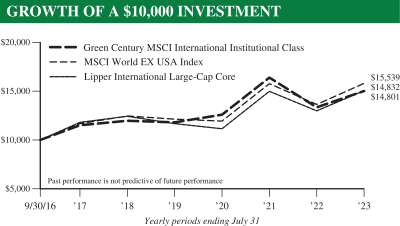
Both share classes of the International Fund underperformed its benchmark for the latest quarter ended July 31, 2023. The Fund’s total return was 1.73% for the individual share class and 1.86% for the institutional share class for this period, while the MSCI World ex USA Index returned 3.43% for the same period. Additional results for various time periods are below:*
| | | | | | | | | | | | | | | | | | |
Green Century MSCI International Fund Total expense ratio: 1.28% for Individual Share Class and 0.98% for
Institutional Share Class | | CUMULATIVE
RETURN* | | | AVERAGE ANNUAL RETURN* | |
| | Inception Date: September 30, 2016 | |
| | Latest
Quarter | | | One Year | | | Five Years | | | Since
Inception | |
| June 30, 2023 | | Green Century MSCI International Index Fund — Individual Share Class | | | 2.55% | | | | 15.87% | | | | 4.32% | | | | 5.37% | |
| | Green Century MSCI International Index Fund — Institutional Share Class | | | 2.61% | | | | 16.23% | | | | 4.62% | | | | 5.67% | |
| | MSCI World ex USA Index | | | 3.03% | | | | 17.41% | | | | 4.58% | | | | 6.25% | |
| July 31, 2023 | | Green Century MSCI International Index Fund — Individual Share Class | | | 1.73% | | | | 11.83% | | | | 4.17% | | | | 5.60% | |
| | Green Century MSCI International Index Fund — Institutional Share Class | | | 1.86% | | | | 12.15% | | | | 4.49% | | | | 5.91% | |
| | MSCI World ex USA Index | | | 3.43% | | | | 15.47% | | | | 4.74% | | | | 6.66% | |
* The performance data quoted represents past performance and is not a guarantee of future results. Investment return and principal value of an investment will fluctuate so that an investor’s shares, when redeemed, may be worth more or less than their original cost. Current performance may be lower or higher than the performance information quoted. To obtain Fund prices and performance information as of the most recent month-end, call 1-800-93-GREEN/1-800-934-7336. Performance includes the reinvestment of income dividends and capital gains distributions. Performance shown does not reflect the deduction of taxes that a shareholder might pay on Fund distributions or the redemption of Fund shares. A redemption fee of 2.00% may be imposed on redemptions or exchanges of shares you have owned for 60 days or less. Please see the prospectus for more information.
14
The Institutional and Investor share classes of the Green Century MSCI International Index Fund (International Fund), which closely tracks the MSCI World ex USA SRI ex Fossil Fuels Index, returned 12.15% and 11.83%, respectively, for the one year period ended July 31, 2023, while the MSCI World ex USA Index (Index), returned 15.47% during the same period. The difference in performance of the International Fund relative to the Index was largely due to differences in sector allocation and stock selection criteria between the International Fund and the Index.
The strongest performing sectors in the International Fund were Information Technology, Consumer Discretionary and Financials which returned 35.88%, 20.22% and 15.50%, respectively. The worst performing sectors were Real Estate and Communication Services, which returned -0.85% and 0.77%, respectively, for the year. Within the MSCI World ex USA Index, Consumer Discretionary, Information Technology, and Industrials were the strongest performing sectors, gaining 25.12%, 24.87%, and 21.45%, respectively. The worst performing sectors were Real Estate and Communication Services which returned -6.49% and 3.34%, respectively, for the year.
US equities underperformed non-US developed equities for the reporting period, as measured by the S&P 500 and MSCI World Ex US indices, with 1 year returns of 13.02% and 15.47% respectively. U.S. Equities declined during a volatile third quarter of 2022. After stocks rallied to start the quarter, investor risk appetite turned sharply lower following higher than expected inflation data. The U.S. Federal Reserve continued to aggressively hike short term interest rates. Global markets finished the 4th quarter higher, with investor
The MSCI World ex USA Index is a custom index calculated by MSCI Inc. The MSCI World ex USA Index includes large and mid-cap stocks across 22 of 23 Developed Markets (DM) countries and excludes the United States. With 1,023 constituents, the index covers approximately 85% of the free float-adjusted market capitalization in each country. The MSCI World ex USA Index is a free float-adjusted market capitalization index. Unlike the Fund, the MSCI World ex USA Index’s performance does not include management and other operating expenses. It is not possible to invest directly in an index.
15
sentiment buoyed by easing inflationary pressures. Declining inflation levels allowed the U.S. Federal Reserve and European Central Bank to slow the pace of interest rate increases. Despite additional central bank tightening and a string of bank failures, global equity markets posted mid-single-digit gains in the first quarter of 2023. As the quarter progressed, investors’ focus gradually drifted from a more optimistic view on the path of inflation in January to concerns about further monetary tightening in February through early March. Financial markets performed well in the second quarter with the U.S. helping propel global equities to a mid-single-digit gain. Declining inflation and a resilient economic growth backdrop bolstered U.S. equity markets in addition to robust returns in a narrow set of mega cap tech stocks helped by optimism with respect to artificial intelligence.
1 As of July 31, 2023, the following companies comprised the listed percentages of each of the Green Century Funds:
| | | | | | | | | | | | |
| Portfolio Holdings | | Green
Century
Balanced
Fund | | | Green
Century
Equity
Fund | | | Green
Century
International
Index Fund | |
Costco | | | 1.50 | % | | | 0.00 | % | | | 0.00 | % |
ODP Corporation | | | 0.00 | % | | | 0.01 | % | | | 0.00 | % |
Apple | | | 6.25 | % | | | 0.00 | % | | | 0.00 | % |
Verisk Analytics Inc. | | | 0.63 | % | | | 0.00 | % | | | 0.00 | % |
Gilead Sciences Inc. | | | 0.55 | % | | | 0.46 | % | | | 0.00 | % |
Progressive Corp. | | | 0.48 | % | | | 0.36 | % | | | 0.00 | % |
ServicesNow Inc. | | | 0.76 | % | | | 0.58 | % | | | 0.00 | % |
| | | | | | | | | | | | |
| Portfolio Holdings | | Green
Century
Balanced
Fund | | | Green
Century
Equity
Fund | | | Green
Century
International
Index Fund | |
Equinix Inc. | | | 0.53 | % | | | 0.37 | % | | | 0.00 | % |
Euro Invt. Bank | | | 1.84 | % | | | 0.00 | % | | | 0.00 | % |
IBRD | | | 1.48 | % | | | 0.00 | % | | | 0.00 | % |
Mastercard | | | 3.02 | % | | | 1.63 | % | | | 0.00 | % |
SalesForce | | | 1.31 | % | | | 1.10 | % | | | 0.00 | % |
Portfolio composition will change due to ongoing management of the Funds. Please refer to the Green Century Funds website for current information regarding the Funds’ portfolio holdings. Note that some of the holdings discussed above may not have been held by any Fund during the fiscal year ended July 31, 2023, or may have been held by a Fund for a portion of the fiscal year, or may have been held by a Fund for the entire fiscal year. These holdings are subject to risk as described in the Funds’ prospectus. References to specific investments should not be construed as a recommendation of the securities by the Funds, their administrator, or their distributor.
2 The Custom Balanced Index is comprised of a 60% weighting in the S&P 1500 Index and a 40% weighting in the BofA Merrill Lynch 1-10 Year US Corporate & Government Index (the BofA Merrill Lynch Index). It is not possible to invest directly in the Custom Balanced Index.
3 The S&P Supercomposite 1500 Index is an unmanaged broad-based capitalization-weighted index comprising 1500 stocks of large-cap, mid-cap, and small-cap U.S. companies. It is not possible to invest directly in the S&P Supercomposite 1500 Index.
4 The BofA Merrill Lynch Index tracks the performance of U.S. dollar-denominated investment grade government and corporate public debt issued in the U.S. domestic bond market with at least 1 year and less than 10 years remaining maturity, including U.S. treasury, U.S. agency, foreign government, supranational and corporate securities. It is not possible to invest directly in the BofA Merrill Lynch Index.
5 The Lipper Balanced Fund Index includes the 30 largest funds whose primary objective is to conserve principal by maintaining at all times a balanced portfolio of both stocks and bonds. Typically the stock/bond ratio ranges around 60%/40%. It is not possible to invest directly in the Lipper Balanced Fund Index.
6 The S&P 500® Index is an unmanaged index of 500 selected common stocks, most of which are listed on the New York Stock Exchange. The S&P 500® Index is heavily weighted toward stocks with large market capitalization and represents approximately two-thirds of the total market value of all domestic stocks. It is not possible to invest directly in the S&P 500® Index.
7 The MSCI KLD 400 Social ex Fossil Fuels Index (the KLD400 ex Fossil Fuels Index) is a custom index calculated by MSCI Inc. The KLD400 ex Fossil Fuels Index is comprised of the common stocks of the approximately 400 companies in the MSCI KLD 400 Social Index (the KLD400 Index), minus the stocks of the companies that explore for, extract, produce, manufacture, or refine coal, oil or gas or produce or transmit electricity derived from fossil fuels or transmit natural gas or have carbon reserves that are included in the KLD400 Index. The KLD400 Index is a free float-adjusted market capitalization index designed to provide exposure to U.S. companies that have positive ESG characteristics and consists of approximately 400 companies selected from the MSCI USA Investable Market Index. It is not possible to invest directly in an index.
16
8 The MSCI World ex USA Index is a custom index calculated by MSCI Inc. The MSCI World ex USA Index includes large and mid-cap stocks across 22 of 23 Developed Markets countries and excludes the United States. With 1,023 constituents, the index covers approximately 85% of the free float-adjusted market capitalization in each country. The MSCI World ex USA Index is a free float-adjusted market capitalization index. It is not possible to invest directly in the MSCI World ex USA Index.
9 The World ex USA SRI ex Fossil Fuels Index is a custom index calculated by MSCI Inc. The World ex USA SRI ex Fossil Fuels Index is comprised of the common stocks of the companies in the MSCI World ex USA SRI Index (the World ex USA SRI Index), minus the stocks of the companies that explore for, extract, produce, manufacture or refine coal, oil or gas or produce or transmit electricity derived from fossil fuels or transmit natural gas or have carbon reserves that are included in the World ex USA SRI (Socially Responsible Investment) Index. The World ex USA SRI Index includes large and mid-cap stocks from approximately 22 Developed Markets countries (excluding the U.S.). The World ex USA SRI Index is a capitalization weighted index that provides exposure to companies with what MSCI calculates to have outstanding ESG ratings and excludes companies whose products have negative social or environmental impacts. It is not possible to invest directly in an index.
Stocks will fluctuate in response to factors that may affect a single company, industry, sector, country, region or the market as a whole and may perform worse than the market. Foreign securities are subject to additional risks such as currency fluctuations, regional economic and political conditions, differences in accounting methods, and other unique risks compared to investing in securities of U.S. issuers. Bonds are subject to a variety of risks including interest rate, credit, and inflation risk. A sustainable investment strategy which incorporates environmental, social and governance criteria may result in lower or higher returns than an investment strategy that does not include such criteria.
This material must be preceded or accompanied by a current prospectus.
Distributor: UMB Distribution Services, LLC 9/23
Neither the Green Century Equity Fund nor the Green Century MSCI International Index Fund (each a “Fund” and together the “Funds”) is sponsored, endorsed, or promoted by MSCI, its affiliates, information providers or any other third party involved in, or related to, compiling, computing or creating the MSCI indices (the “MSCI Parties”), and the MSCI Parties bear no liability with respect to a Fund or any index on which a Fund is based. The MSCI Parties are not sponsors of either of the Funds and are not affiliated with the Funds in any way. The Statement of Additional Information contains a more detailed description of the limited relationship the MSCI Parties have with Green Century Capital Management and the Funds.
17
GREEN CENTURY FUNDS EXPENSE EXAMPLE
For the six months ended July 31, 2023 (unaudited)
As a shareholder of the Green Century Funds (the “Funds”), you incur two types of costs: (1) transaction costs, including redemption fees on certain redemptions; and (2) ongoing costs, including management fees and other Fund expenses. This example is intended to help you understand your ongoing costs (in dollars) of investing in the Funds and to compare these costs with the ongoing costs of investing in other mutual funds.
The example is based on an investment of $1,000 invested at the beginning of the period and held for the entire period from February 1, 2023 to July 31, 2023 (the “period”).
Actual Expenses The first line of the table below provides information about actual account values and actual expenses. You may use the information in this line, together with the amount you invested, to estimate the expenses you paid over the period. Simply divide your account value by $1,000 (for example, an $8,600 account value divided by $1,000 equals 8.6), then multiply the result by the number in the first line under the heading entitled “Expenses Paid During the Period” to estimate the expenses you paid on your account during the period.
Hypothetical Example for Comparison Purposes The second line of the table below provides information about hypothetical account values and hypothetical expenses based on the Funds’ actual expense ratios and an assumed rate of return of 5% per year before expenses, which is not the actual return of either of the Funds. The hypothetical account values and expenses may not be used to estimate the actual ending account balance or expenses you paid for the period. You may use this information to compare the ongoing costs of investing in the Funds and other funds. To do so, compare this 5% hypothetical example with the 5% hypothetical examples that appear in the shareholder reports of other funds.
Please note that the expenses shown in the table are meant to highlight your ongoing costs only and do not reflect any transactional costs, such as redemption fees on shares held for 60 days or less. Therefore, the second line of the table is useful in comparing the ongoing costs only, and will not help you determine the relative total costs of owning different funds. In addition, if these transactional costs were included, your costs could have been higher.
| | | | | | | | | | | | |
| | | BEGINNING
ACCOUNT VALUE
FEBRUARY 1, 2023 | | | ENDING
ACCOUNT VALUE
JULY 31, 2023 | | | EXPENSES
PAID DURING
THE PERIOD1 | |
Balanced Fund | | | | | | | | | | | | |
Actual Expenses — Individual Investor Class | | $ | 1,000.00 | | | $ | 1,036.20 | | | $ | 7.38 | |
Actual Expenses — Institutional Class | | | 1,000.00 | | | | 1,037.90 | | | | 5.87 | |
Hypothetical Example, assuming a 5% return before expenses —Individual Investor Class | | | 1,000.00 | | | | 1,017.75 | | | | 7.32 | |
Hypothetical Example, assuming a 5% return before expenses —Institutional Class | | | 1,000.00 | | | | 1,019.24 | | | | 5.82 | |
18
| | | | | | | | | | | | |
| | | BEGINNING
ACCOUNT VALUE
FEBRUARY 1, 2023 | | | ENDING
ACCOUNT VALUE
JULY 31, 2023 | | | EXPENSES
PAID DURING
THE PERIOD1 | |
Equity Fund | | | | | | | | | | | | |
Actual Expenses — Individual Investor Class | | $ | 1,000.00 | | | $ | 1,141.70 | | | $ | 6.64 | |
Actual Expenses — Institutional Class | | | 1,000.00 | | | | 1,143.30 | | | | 5.05 | |
Hypothetical Example, assuming a 5% return before expenses —Individual Investor Class | | | 1,000.00 | | | | 1,018.80 | | | | 6.26 | |
Hypothetical Example, assuming a 5% return before expenses —Institutional Class | | | 1,000.00 | | | | 1,020.29 | | | | 4.76 | |
| | | |
| | | BEGINNING
ACCOUNT VALUE
FEBRUARY 1, 2023 | | | ENDING
ACCOUNT VALUE
JULY 31, 2023 | | | EXPENSES
PAID DURING
THE PERIOD1 | |
MSCI International Index Fund | | | | | | | | | | | | |
Actual Expenses — Individual Investor Class | | $ | 1,000.00 | | | $ | 1,045.50 | | | $ | 6.49 | |
Actual Expenses — Institutional Class | | | 1,000.00 | | | | 1,047.00 | | | | 4.97 | |
Hypothetical Example, assuming a 5% return before expenses —Individual Investor Class | | | 1,000.00 | | | | 1,018.65 | | | | 6.41 | |
Hypothetical Example, assuming a 5% return before expenses —Institutional Class | | | 1,000.00 | | | | 1,020.14 | | | | 4.91 | |
1 Expenses are equal to the Funds’ annualized expense ratios (1.46% for the Balanced Fund Individual Investor Class, 1.16% for the Balanced Fund Institutional Class, 1.25% for the Equity Fund Individual Investor Class, 0.95% for the Equity Fund Institutional Class, 1.28% for the MSCI International Index Fund Individual Investor Class and 0.98% for the MSCI International Index Fund Institutional Class), multiplied by the average account value over the period, multiplied by 181/365 (to reflect the one-half year period).
19
| | |
GREEN CENTURY BALANCED FUND PORTFOLIO OF INVESTMENTS July 31, 2023 | | |
| | | | | | | | |
COMMON STOCKS — 61.6% | |
| | | SHARES | | | VALUE | |
Software & Services — 7.7% | | | | | | | | |
Adobe, Inc. (a) | | | 6,586 | | | $ | 3,597,076 | |
Autodesk, Inc. (a) | | | 8,896 | | | | 1,885,863 | |
Microsoft Corporation | | | 52,010 | | | | 17,471,199 | |
Paycom Software, Inc. | | | 7,024 | | | | 2,590,170 | |
PayPal Holdings, Inc. (a) | | | 25,725 | | | | 1,950,470 | |
ServiceNow, Inc. (a) | | | 5,144 | | | | 2,998,952 | |
| | | | | | | | |
| | | | | | | 30,493,730 | |
| | | | | | | | |
Technology Hardware & Equipment — 6.0% | |
Apple, Inc. | | | 101,484 | | | | 19,936,532 | |
Palo Alto Networks, Inc. (a) | | | 14,273 | | | | 3,567,679 | |
| | | | | | | | |
| | | | | | | 23,504,211 | |
| | | | | | | | |
Pharmaceuticals & Biotechnology — 4.9% | | | | | |
AstraZeneca PLC ADR (b) | | | 73,287 | | | | 5,254,678 | |
Gilead Sciences, Inc. | | | 28,375 | | | | 2,160,473 | |
IQVIA Holdings, Inc. (a) | | | 13,140 | | | | 2,940,206 | |
Merck & Company, Inc. | | | 27,300 | | | | 2,911,545 | |
Roche Holding AG ADR | | | 67,859 | | | | 2,626,143 | |
Thermo Fisher Scientific, Inc. | | | 5,889 | | | | 3,231,059 | |
| | | | | | | | |
| | | | | | | 19,124,104 | |
| | | | | | | | |
Capital Goods — 4.2% | | | | | | | | |
Deere & Company | | | 5,649 | | | | 2,426,811 | |
Eaton Corporation PLC | | | 15,151 | | | | 3,110,803 | |
Illinois Tool Works, Inc. | | | 7,095 | | | | 1,868,255 | |
Rockwell Automation, Inc. | | | 4,908 | | | | 1,650,511 | |
Trane Technologies PLC | | | 15,557 | | | | 3,102,688 | |
Westinghouse Air Brake Technologies Corporation | | | 21,955 | | | | 2,600,350 | |
Xylem, Inc. | | | 15,837 | | | | 1,785,622 | |
| | | | | | | | |
| | | | | | | 16,545,040 | |
| | | | | | | | |
Consumer Discretionary Distribution & Retail — 3.6% | |
Home Depot, Inc. (The) | | | 11,443 | | | | 3,820,131 | |
Target Corporation | | | 21,254 | | | | 2,900,534 | |
TJX Companies, Inc. (The) | | | 49,595 | | | | 4,291,455 | |
Tractor Supply Company | | | 14,712 | | | | 3,295,341 | |
| | | | | | | | |
| | | | | | | 14,307,461 | |
| | | | | | | | |
Semiconductors & Semiconductor Equipment — 3.5% | |
Analog Devices, Inc. | | | 15,676 | | | | 3,127,832 | |
ASML Holding NV (b) | | | 4,954 | | | | 3,549,095 | |
NVIDIA Corporation | | | 11,327 | | | | 5,292,994 | |
Wolfspeed, Inc. (a) | | | 29,189 | | | | 1,923,555 | |
| | | | | | | | |
| | | | | | | 13,893,476 | |
| | | | | | | | |
| | | | | | | | |
| | | SHARES | | | VALUE | |
Insurance — 3.3% | | | | | | | | |
Aflac, Inc. | | | 28,265 | | | $ | 2,044,690 | |
Elevance Health, Inc. | | | 14,251 | | | | 6,721,199 | |
Progressive Corporation (The) | | | 15,121 | | | | 1,904,944 | |
Travelers Companies, Inc. (The) | | | 13,908 | | | | 2,400,660 | |
| | | | | | | | |
| | | | | | | 13,071,493 | |
| | | | | | | | |
Healthcare Equipment & Services — 3.2% | | | | | |
Alcon, Inc. (b) | | | 35,019 | | | | 2,973,813 | |
CVS Health Corp. | | | 31,621 | | | | 2,361,773 | |
Medtronic PLC | | | 22,868 | | | | 2,006,896 | |
Stryker Corporation | | | 10,759 | | | | 3,049,208 | |
West Pharmaceutical Services, Inc. | | | 5,832 | | | | 2,146,409 | |
| | | | | | | | |
| | | | | | | 12,538,099 | |
| | | | | | | | |
Financial Services — 3.1% | | | | | | | | |
LPL Financial Holdings, Inc. | | | 19,667 | | | | 4,510,823 | |
Mastercard, Inc., Class A | | | 19,728 | | | | 7,778,356 | |
| | | | | | | | |
| | | | | | | 12,289,179 | |
| | | | | | | | |
Media & Entertainment — 2.9% | | | | | | | | |
Alphabet, Inc., Class A (a) | | | 73,686 | | | | 9,779,606 | |
Walt Disney Company (The) (a) | | | 19,009 | | | | 1,689,710 | |
| | | | | | | | |
| | | | | | | 11,469,316 | |
| | | | | | | | |
Equity Real Estate Investment Trusts (REITs) — 2.7% | |
American Tower Corporation REIT | | | 19,574 | | | | 3,725,128 | |
AvalonBay Communities, Inc. REIT | | | 8,963 | | | | 1,690,870 | |
Equinix, Inc. REIT | | | 2,596 | | | | 2,102,552 | |
Jones Lang LaSalle, Inc. (a) | | | 9,787 | | | | 1,630,025 | |
Prologis, Inc. REIT | | | 10,930 | | | | 1,363,517 | |
| | | | | | | | |
| | | | | | | 10,512,092 | |
| | | | | | | | |
Renewable Energy & Energy Efficiency — 2.3% | |
First Solar, Inc. (a) | | | 12,413 | | | | 2,574,456 | |
Ormat Technologies, Inc. | | | 35,154 | | | | 2,858,020 | |
SolarEdge Technologies, Inc. (a) | | | 10,004 | | | | 2,415,566 | |
Sunrun, Inc. (a) | | | 70,485 | | | | 1,337,805 | |
| | | | | | | | |
| | | | | | | 9,185,847 | |
| | | | | | | | |
Consumer Staples Distribution & Retail — 2.1% | |
Costco Wholesale Corporation | | | 10,528 | | | | 5,902,734 | |
Sysco Corporation | | | 30,845 | | | | 2,353,782 | |
| | | | | | | | |
| | | | | | | 8,256,516 | |
| | | | | | | | |
20
| | |
GREEN CENTURY BALANCED FUND PORTFOLIO OF INVESTMENTS July 31, 2023 | | continued |
| | | | | | | | |
| | | SHARES | | | VALUE | |
Banks — 2.0% | | | | | | | | |
East West Bancorp, Inc. | | | 63,372 | | | $ | 3,942,372 | |
PNC Financial Services Group, Inc. (The) | | | 28,515 | | | | 3,903,418 | |
| | | | | | | | |
| | | | | | | 7,845,790 | |
| | | | | | | | |
Consumer Durables & Apparel — 1.8% | |
Levi Strauss & Company, Class A | | | 129,446 | | | | 1,950,751 | |
Lululemon Athletica, Inc. (a) | | | 7,754 | | | | 2,935,122 | |
NIKE, Inc., Class B | | | 21,523 | | | | 2,375,924 | |
| | | | | | | | |
| | | | | | | 7,261,797 | |
| | | | | | | | |
Materials — 1.6% | | | | | | | | |
Ball Corporation | | | 58,571 | | | | 3,437,532 | |
Ingevity Corporation (a) | | | 19,719 | | | | 1,262,411 | |
International Flavors & Fragrances, Inc. | | | 20,248 | | | | 1,713,183 | |
| | | | | | | | |
| | | | | | | 6,413,126 | |
| | | | | | | | |
Household & Personal Products — 1.5% | |
Procter & Gamble Company (The) | | | 17,374 | | | | 2,715,556 | |
Unilever PLC ADR (b) | | | 61,768 | | | | 3,318,795 | |
| | | | | | | | |
| | | | | | | 6,034,351 | |
| | | | | | | | |
Transportation — 1.4% | | | | | | | | |
J.B. Hunt Transport Services, Inc. | | | 13,020 | | | | 2,655,299 | |
United Parcel Service, Inc., Class B | | | 14,085 | | | | 2,635,726 | |
| | | | | | | | |
| | | | | | | 5,291,025 | |
| | | | | | | | |
Consumer Services — 1.0% | | | | | | | | |
Bright Horizons Family Solutions, Inc. (a) | | | 15,357 | | | | 1,490,090 | |
Starbucks Corporation | | | 22,323 | | | | 2,267,347 | |
| | | | | | | | |
| | | | | | | 3,757,437 | |
| | | | | | | | |
Food & Beverage — 0.8% | | | | | | | | |
McCormick & Company, Inc. | | | 33,631 | | | | 3,009,302 | |
| | | | | | | | |
Utilities — 0.7% | | | | | | | | |
American Water Works Company, Inc. | | | 19,443 | | | | 2,866,481 | |
| | | | | | | | |
Commercial & Professional Services — 0.6% | |
Verisk Analytics, Inc. | | | 10,870 | | | | 2,488,578 | |
| | | | | | | | |
Telecommunication Services — 0.4% | |
Verizon Communications, Inc. | | | 49,228 | | | | 1,677,690 | |
| | | | | | | | |
Automobiles & Components — 0.3% | |
Aptiv PLC (a) | | | 10,287 | | | | 1,126,324 | |
| | | | | | | | |
Total Common Stocks
(Cost $130,346,148) | | | | | | | 242,962,465 | |
| | | | | | | | |
| | | | | | | | |
| | | PRINCIPAL
AMOUNT | | | VALUE | |
| | |
BONDS & NOTES — 37.6% | | | | | | | | |
Green and Sustainability Bonds — 25.9% | | | | | |
Apple, Inc.
3.00%, due 6/20/27 (c) | | $ | 5,000,000 | | | $ | 4,739,395 | |
Asian Development Bank
2.125%, due 3/19/25 (b) | | | 1,000,000 | | | | 952,665 | |
Asian Development Bank
3.125%, due 9/26/28 (b) | | | 4,000,000 | | | | 3,781,528 | |
AvalonBay Communities, Inc.
2.05%, due 1/15/32 (c) | | | 6,000,000 | | | | 4,833,600 | |
Bank of America Corporation
2.456% (3-Month Term SOFR+113.161 basis points), due 10/22/25 (c) | | | 4,000,000 | | | | 3,844,820 | |
Boston Properties LP
4.50%, due 12/1/28 (c) | | | 5,000,000 | | | | 4,636,215 | |
Bridge Housing Corporation
3.25%, due 7/15/30 (c) | | | 4,500,000 | | | | 3,962,209 | |
Century Housing Corporation
0.60%, due 2/15/24 | | | 2,500,000 | | | | 2,435,298 | |
City & County of San Francisco CA Community Facilities District No. 2014-1
2.75%, due 9/1/23 | | | 650,000 | | | | 648,320 | |
City of San Francisco CA Public Utilities Commission Water Revenue
2.806%, due 11/1/23 | | | 2,000,000 | | | | 1,985,904 | |
European Investment Bank
2.50%, due 10/15/24 (b) | | | 2,000,000 | | | | 1,933,780 | |
European Investment Bank
2.125%, due 4/13/26 (b) | | | 500,000 | | | | 468,726 | |
European Investment Bank
3.75%, due 2/14/33 (b) | | | 5,000,000 | | | | 4,867,375 | |
International Bank for Reconstruction & Development
2.125%, due 3/3/25 (b) | | | 2,000,000 | | | | 1,908,372 | |
International Bank for Reconstruction & Development
4.00%, due 7/25/30 (b) | | | 4,000,000 | | | | 3,944,524 | |
International Finance Corporation
2.125%, due 4/7/26 (b) | | | 500,000 | | | | 468,265 | |
Johnson Controls International plc / Tyco Fire & Security Finance SCA
1.75%, due 9/15/30 (b)(c) | | | 5,000,000 | | | | 4,040,725 | |
21
| | |
GREEN CENTURY BALANCED FUND PORTFOLIO OF INVESTMENTS July 31, 2023 | | continued |
| | | | | | | | |
| | | PRINCIPAL
AMOUNT | | | VALUE | |
Green and Sustainability Bonds — (continued) | |
Mastercard, Inc.
1.90%, due 3/15/31 (c) | | $ | 5,000,000 | | | $ | 4,136,995 | |
Nederlandse Waterschapsbank NV
2.375%, due 3/24/26 (b)(d) | | | 3,500,000 | | | | 3,293,101 | |
New Jersey Infrastructure Bank
3.00%, due 9/1/31 | | | 2,500,000 | | | | 2,196,903 | |
NXP BV / NXP Funding LLC / NXP USA, Inc.
5.00%, due 1/15/33 (b)(c) | | | 4,500,000 | | | | 4,325,557 | |
PNC Financial Services Group, Inc. (The)
2.20%, due 11/1/24 (c) | | | 5,000,000 | | | | 4,788,145 | |
Prologis LP
1.25%, due 10/15/30 (c) | | | 4,500,000 | | | | 3,491,239 | |
Regency Centers LP
3.75%, due 6/15/24 (c) | | | 2,000,000 | | | | 1,946,710 | |
Salesforce, Inc.
1.50%, due 7/15/28 (c) | | | 6,000,000 | | | | 5,174,634 | |
San Francisco Bay Area Rapid Transit District
2.622%, due 8/1/29 | | | 2,000,000 | | | | 1,758,274 | |
Starbucks Corporation
2.45%, due 6/15/26 (c) | | | 4,500,000 | | | | 4,209,039 | |
United States International Development Finance Corporation
3.43%, due 6/1/33 | | | 188,332 | | | | 173,948 | |
United States International Development Finance Corporation
3.05%, due 6/15/35 | | | 1,191,300 | | | | 1,061,158 | |
United States International Development Finance Corporation
2.58%, due 7/15/38 | | | 2,772,316 | | | | 2,346,926 | |
Verizon Communications, Inc.
3.875%, due 2/8/29 (c) | | | 5,000,000 | | | | 4,703,460 | |
Visa, Inc.
0.75%, due 8/15/27 (c) | | | 6,000,000 | | | | 5,213,010 | |
Xylem, Inc.
2.25%, due 1/30/31 (c) | | | 4,500,000 | | | | 3,741,385 | |
| | | | | | | | |
| | | | | | | 102,012,205 | |
| | | | | | | | |
| | | | | | | | |
| | | PRINCIPAL
AMOUNT | | | VALUE | |
U.S. Government Agencies — 4.8% | | | | | |
Federal Farm Credit Banks Funding Corporation
2.26%, due 11/13/24 | | $ | 500,000 | | | $ | 481,610 | |
Federal Farm Credit Banks Funding Corporation
1.82%, due 12/18/25 | | | 3,000,000 | | | | 2,792,025 | |
Federal Farm Credit Banks Funding Corporation
2.80%, due 11/12/27 | | | 3,000,000 | | | | 2,804,913 | |
Federal Farm Credit Banks Funding Corporation
3.875%, due 8/15/28 | | | 4,000,000 | | | | 3,922,300 | |
Federal Farm Credit Banks Funding Corporation
1.23%, due 7/29/30 (c) | | | 5,000,000 | | | | 3,959,845 | |
Federal Home Loan Banks
0.75%, due 12/14/23 (c) | | | 3,000,000 | | | | 2,946,468 | |
Federal National Mortgage Association
0.25%, due 11/27/23 | | | 2,000,000 | | | | 1,967,328 | |
| | | | | | | | |
| | | | | | | 18,874,489 | |
| | | | | | | | |
Community Development Financial Institutions — 2.3% | |
Capital Impact Partners
1.00%, due 9/15/25 (c) | | | 1,500,000 | | | | 1,287,025 | |
Enterprise Community Loan Fund, Inc.
4.152%, due 11/1/28 (c) | | | 3,000,000 | | | | 2,764,017 | |
Local Initiatives Support Corporation
1.00%, due 11/15/25 | | | 2,000,000 | | | | 1,742,384 | |
Local Initiatives Support Corporation
3.782%, due 3/1/27 (c) | | | 2,000,000 | | | | 1,913,246 | |
Reinvestment Fund, Inc. (The)
3.78%, due 2/15/26 | | | 1,400,000 | | | | 1,298,584 | |
| | | | | | | | |
| | | | | | | 9,005,256 | |
| | | | | | | | |
Municipal — 0.9% | | | | | | | | |
Commonwealth of Massachusetts
4.11%, due 7/15/31 (c) | | | 3,766,920 | | | | 3,627,868 | |
| | | | | | | | |
Software & Services — 0.9% | | | | | | | | |
Adobe, Inc.
3.25%, due 2/1/25 (c) | | | 3,500,000 | | | | 3,404,866 | |
| | | | | | | | |
22
| | |
GREEN CENTURY BALANCED FUND PORTFOLIO OF INVESTMENTS July 31, 2023 | | concluded |
| | | | | | | | |
| | | PRINCIPAL
AMOUNT | | | VALUE | |
Equity Real Estate Investment Trusts (REITs) — 0.8% | |
National Community Renaissance of California
3.27%, due 12/1/32 (c) | | $ | 4,000,000 | | | $ | 3,315,504 | |
| | | | | | | | |
Capital Goods — 0.8% | | | | | | | | |
Trane Technologies Luxembourg Finance SA
3.80%, due 3/21/29 (c) | | | 3,500,000 | | | | 3,309,884 | |
| | | | | | | | |
Media & Entertainment — 0.8% | |
Alphabet, Inc.
1.998%, due 8/15/26 (c) | | | 3,500,000 | | | | 3,243,849 | |
| | | | | | | | |
Insurance — 0.3% | | | | | | | | |
Travelers Property Casualty Corporation
7.75%, due 4/15/26 | | | 1,000,000 | | | | 1,062,009 | |
| | | | | | | | |
Healthy Living — 0.1% | | | | | | | | |
Whole Foods Market, Inc.
5.20%, due 12/3/25 (c)(d) | | | 500,000 | | | | 498,207 | |
| | | | | | | | |
Total Bonds & Notes
(Cost $159,572,760) | | | | | | | 148,354,137 | |
| | | | | | | | |
| | | | |
|
SHORT-TERM INVESTMENTS — 0.6% |
| | | | | | | | |
| | | | | | VALUE | |
UMB Money Market Fiduciary Account, 0.01% (e)
(Cost $2,359,202) | | | | | | $ | 2,359,202 | |
| | | | | | | | |
Total Short-term Investments
(Cost $2,359,202) | | | | | | | 2,359,202 | |
| | | | | | | | |
TOTAL INVESTMENTS (f) — 99.8% | |
(Cost $292,278,110) | | | | | | | 393,675,804 | |
Other Assets Less Liabilities — 0.2% | | | | | | | 913,515 | |
| | | | | | | | |
NET ASSETS — 100.0% | | | | | | $ | 394,589,319 | |
| | | | | | | | |
ADR – American Depository Receipt
PLC – Public Limited Company
REIT – Real Estate Investment Trusts
LP – Limited Partnership
LLC – Limited Liability Company
| (a) | Non-income producing security. |
| (b) | Securities whose value are determined or significantly influenced by trading in markets other than the United States or Canada. |
| (d) | Security exempt from registration under Rule 144A of the Securities Act of 1933. These securities may be resold in transactions exempt from registration to qualified institutional buyers. The total value of these securities is $3,791,308. |
| (e) | The rate quoted is the annualized seven-day yield of the fund at the period end. |
| (f) | The cost of investments for federal income tax purposes is $292,262,573 resulting in gross unrealized appreciation and depreciation of $117,720,139 and $16,306,908 respectively, or net unrealized appreciation of $101,413,231. |
See Notes to Financial Statements
23
| | |
GREEN CENTURY EQUITY FUND PORTFOLIO OF INVESTMENTS July 31, 2023 | | |
| | | | | | | | |
COMMON STOCKS — 99.9% | | | | | | | | |
| | | SHARES | | | VALUE | |
Software & Services — 22.6% | | | | | | | | |
Accenture PLC, Class A (a) | | | 17,152 | | | $ | 5,426,035 | |
Adobe, Inc. (b) | | | 12,460 | | | | 6,805,278 | |
ANSYS, Inc. (b) | | | 2,363 | | | | 808,382 | |
Autodesk, Inc. (b) | | | 5,816 | | | | 1,232,934 | |
Automatic Data Processing, Inc. | | | 11,245 | | | | 2,780,439 | |
Cadence Design Systems, Inc. (b) | | | 7,418 | | | | 1,735,886 | |
Cognizant Technology Solutions Corporation, Class A | | | 13,871 | | | | 915,902 | |
Fidelity National Information Services, Inc. | | | 16,020 | | | | 967,288 | |
Fortinet, Inc. (b) | | | 18,075 | | | | 1,404,789 | |
Gen Digital, Inc. | | | 15,838 | | | | 308,049 | |
International Business Machines Corporation | | | 24,611 | | | | 3,548,414 | |
Intuit, Inc. | | | 7,613 | | | | 3,895,572 | |
Microsoft Corporation | | | 192,088 | | | | 64,526,201 | |
Okta, Inc., Class A (b) | | | 4,237 | | | | 325,656 | |
Oracle Corporation | | | 44,012 | | | | 5,159,527 | |
Paycom Software, Inc. | | | 1,462 | | | | 539,127 | |
PayPal Holdings, Inc. (b) | | | 28,941 | | | | 2,194,307 | |
PTC, Inc. (b) | | | 3,082 | | | | 449,386 | |
Salesforce, Inc. (b) | | | 27,155 | | | | 6,110,147 | |
ServiceNow, Inc. (b) | | | 5,530 | | | | 3,223,990 | |
Splunk, Inc. (b) | | | 4,234 | | | | 458,669 | |
Teradata Corporation (b) | | | 2,826 | | | | 160,658 | |
Visa, Inc., Class A | | | 44,150 | | | | 10,495,780 | |
VMware, Inc., Class A (b) | | | 6,405 | | | | 1,009,620 | |
Western Union Company (The) | | | 10,613 | | | | 129,266 | |
Workday, Inc., Class A (b) | | | 5,534 | | | | 1,312,277 | |
ZoomInfo Technologies, Inc. (b) | | | 7,810 | | | | 199,702 | |
| | | | | | | | |
| | | | | | | 126,123,281 | |
| | | | | | | | |
Semiconductors & Semiconductor Equipment — 10.5% | |
Advanced Micro Devices, Inc. (b) | | | 43,693 | | | | 4,998,479 | |
Analog Devices, Inc. | | | 13,743 | | | | 2,742,141 | |
Applied Materials, Inc. | | | 22,944 | | | | 3,478,081 | |
Intel Corporation | | | 113,244 | | | | 4,050,738 | |
Lam Research Corporation | | | 3,661 | | | | 2,630,392 | |
Microchip Technology, Inc. | | | 14,879 | | | | 1,397,733 | |
NVIDIA Corporation | | | 67,087 | | | | 31,349,084 | |
NXP Semiconductors NV (a) | | | 7,060 | | | | 1,574,239 | |
ON Semiconductor Corporation (b) | | | 11,697 | | | | 1,260,352 | |
Skyworks Solutions, Inc. | | | 4,275 | | | | 488,932 | |
Texas Instruments, Inc. | | | 24,669 | | | | 4,440,420 | |
| | | | | | | | |
| | | | | | | 58,410,591 | |
| | | | | | | | |
| | | | | | | | |
| | | SHARES | | | VALUE | |
Media & Entertainment — 8.6% | | | | | | | | |
Alphabet, Inc., Class A (b) | | | 161,724 | | | $ | 21,464,009 | |
Alphabet, Inc., Class C (b) | | | 145,929 | | | | 19,424,609 | |
Electronic Arts, Inc. | | | 7,451 | | | | 1,015,944 | |
John Wiley & Sons, Inc., Class A . | | | 1,277 | | | | 43,712 | |
Liberty Global PLC, Series A (a)(b) | | | 4,370 | | | | 81,151 | |
Liberty Global PLC, Series C (a)(b) | | | 7,122 | | | | 140,731 | |
New York Times Company (The), Class A | | | 4,076 | | | | 166,138 | |
Omnicom Group, Inc. | | | 5,413 | | | | 458,048 | |
Scholastic Corporation | | | 769 | | | | 33,213 | |
Walt Disney Company (The) (b) | | | 49,557 | | | | 4,405,122 | |
Warner Bros Discovery, Inc. (b) | | | 63,018 | | | | 823,645 | |
| | | | | | | | |
| | | | | | | 48,056,322 | |
| | | | | | | | |
Pharmaceuticals, Biotechnology & Life Sciences — 7.2% | |
AbbVie, Inc. | | | 47,916 | | | | 7,167,275 | |
Agilent Technologies, Inc. | | | 8,011 | | | | 975,499 | |
Amgen, Inc. | | | 14,516 | | | | 3,398,921 | |
Biogen, Inc. (b) | | | 3,918 | | | | 1,058,604 | |
BioMarin Pharmaceutical, Inc. (b) | | | 5,066 | | | | 445,453 | |
Bio-Techne Corporation | | | 4,235 | | | | 353,199 | |
Bristol-Myers Squibb Company | | | 57,078 | | | | 3,549,681 | |
Danaher Corporation | | | 18,814 | | | | 4,798,699 | |
Gilead Sciences, Inc. | | | 33,905 | | | | 2,581,527 | |
Illumina, Inc. (b) | | | 4,310 | | | | 828,167 | |
IQVIA Holdings, Inc. (b) | | | 5,075 | | | | 1,135,582 | |
Jazz Pharmaceuticals PLC (a)(b) | | | 1,733 | | | | 226,018 | |
Merck & Company, Inc. | | | 68,975 | | | | 7,356,184 | |
Mettler-Toledo International, Inc. (b) | | | 597 | | | | 750,710 | |
Vertex Pharmaceuticals, Inc. (b) | | | 7,007 | | | | 2,468,846 | |
Waters Corporation (b) | | | 1,585 | | | | 437,793 | |
Zoetis, Inc. | | | 12,551 | | | | 2,360,718 | |
| | | | | | | | |
| | | | | | | 39,892,876 | |
| | | | | | | | |
Financial Services — 6.4% | | | | | | | | |
Ally Financial, Inc. | | | 7,468 | | | | 228,073 | |
American Express Company | | | 17,178 | | | | 2,901,021 | |
Ameriprise Financial, Inc. | | | 2,857 | | | | 995,522 | |
Bank of New York Mellon Corporation (The) | | | 21,913 | | | | 993,974 | |
BlackRock, Inc. | | | 4,070 | | | | 3,007,119 | |
Charles Schwab Corporation (The) | | | 40,792 | | | | 2,696,351 | |
CME Group, Inc. | | | 9,769 | | | | 1,943,640 | |
Equitable Holdings, Inc. | | | 9,898 | | | | 283,974 | |
FactSet Research Systems, Inc. | | | 1,035 | | | | 450,266 | |
24
| | |
GREEN CENTURY EQUITY FUND PORTFOLIO OF INVESTMENTS July 31, 2023 | | continued |
| | | | | | | | |
| | | SHARES | | | VALUE | |
Financial Services — (continued) | | | | | | | | |
Franklin Resources, Inc. | | | 8,275 | | | $ | 241,961 | |
Intercontinental Exchange, Inc. | | | 15,216 | | | | 1,746,797 | |
Invesco Ltd | | | 9,349 | | | | 157,063 | |
Mastercard, Inc., Class A | | | 23,122 | | | | 9,116,542 | |
Moody’s Corporation | | | 4,482 | | | | 1,581,025 | |
Morgan Stanley | | | 34,014 | | | | 3,114,322 | |
Nasdaq, Inc. | | | 9,391 | | | | 474,152 | |
Northern Trust Corporation | | | 5,582 | | | | 447,230 | |
S&P Global, Inc. | | | 8,917 | | | | 3,517,846 | |
State Street Corporation | | | 9,067 | | | | 656,813 | |
Synchrony Financial | | | 11,480 | | | | 396,519 | |
T. Rowe Price Group, Inc. | | | 6,052 | | | | 745,970 | |
Voya Financial, Inc. | | | 2,739 | | | | 203,398 | |
| | | | | | | | |
| | | | | | | 35,899,578 | |
| | | | | | | | |
Capital Goods — 6.3% | | | | | | | | |
3M Company | | | 14,923 | | | | 1,663,915 | |
A.O. Smith Corporation | | | 3,437 | | | | 249,629 | |
AGCO Corporation | | | 1,763 | | | | 234,655 | |
Air Lease Corporation, Class A | | | 2,900 | | | | 122,786 | |
Allegion PLC (a) | | | 2,423 | | | | 283,152 | |
Applied Industrial Technologies, Inc. | | | 1,062 | | | | 153,979 | |
Builders FirstSource, Inc. (b) | | | 3,734 | | | | 539,302 | |
Carrier Global Corporation | | | 22,651 | | | | 1,348,867 | |
Caterpillar, Inc. | | | 14,019 | | | | 3,717,418 | |
Cummins, Inc. | | | 3,832 | | | | 999,386 | |
Deere & Company | | | 7,644 | | | | 3,283,862 | |
Dover Corporation | | | 3,828 | | | | 558,773 | |
Eaton Corporation PLC | | | 10,800 | | | | 2,217,456 | |
EMCOR Group, Inc. | | | 1,322 | | | | 284,283 | |
Fastenal Company | | | 15,459 | | | | 906,052 | |
Ferguson PLC (a) | | | 5,586 | | | | 902,809 | |
Flowserve Corporation | | | 3,593 | | | | 135,672 | |
Fortive Corporation | | | 9,549 | | | | 748,164 | |
Fortune Brands Innovations, Inc. | | | 3,373 | | | | 239,719 | |
Graco, Inc. | | | 4,610 | | | | 365,711 | |
Granite Construction, Inc. | | | 1,169 | | | | 47,847 | |
IDEX Corporation | | | 2,028 | | | | 457,943 | |
Illinois Tool Works, Inc. | | | 8,287 | | | | 2,182,133 | |
Lennox International, Inc. | | | 859 | | | | 315,631 | |
Lincoln Electric Holdings, Inc. | | | 1,549 | | | | 310,900 | |
Masco Corporation | | | 6,086 | | | | 369,298 | |
Middleby Corporation (The) (b) | | | 1,405 | | | | 213,349 | |
Owens Corning | | | 2,429 | | | | 340,036 | |
PACCAR, Inc. | | | 14,250 | | | | 1,227,353 | |
| | | | | | | | |
| | | SHARES | | | VALUE | |
Capital Goods — (continued) | | | | | | | | |
Parker-Hannifin Corporation | | | 3,475 | | | $ | 1,424,785 | |
Pentair PLC (a) | | | 4,516 | | | | 313,862 | |
Quanta Services, Inc. | | | 3,937 | | | | 793,778 | |
Rockwell Automation, Inc. | | | 3,108 | | | | 1,045,189 | |
Roper Technologies, Inc. | | | 2,890 | | | | 1,424,915 | |
Sensata Technologies Holding NV | | | 4,217 | | | | 178,168 | |
Snap-on, Inc. | | | 1,451 | | | | 395,310 | |
Stanley Black & Decker, Inc. | | | 4,107 | | | | 407,702 | |
Tennant Company | | | 470 | | | | 37,713 | |
Timken Company (The) | | | 1,770 | | | | 164,362 | |
Trane Technologies PLC (a) | | | 6,246 | | | | 1,245,702 | |
United Rentals, Inc. | | | 1,877 | | | | 872,204 | |
W.W. Grainger, Inc. | | | 1,232 | | | | 909,820 | |
Westinghouse Air Brake Technologies Corporation | | | 4,841 | | | | 573,368 | |
Xylem, Inc. | | | 6,509 | | | | 733,890 | |
| | | | | | | | |
| | | | | | | 34,940,848 | |
| | | | | | | | |
Food & Beverage — 4.4% | | | | | | | | |
Archer-Daniels-Midland Company | | | 14,900 | | | | 1,265,904 | |
Bunge Ltd. | | | 4,035 | | | | 438,483 | |
Campbell Soup Company | | | 5,380 | | | | 246,512 | |
Coca-Cola Company (The) | | | 111,692 | | | | 6,917,086 | |
Conagra Brands, Inc. | | | 12,791 | | | | 419,673 | |
Darling Ingredients, Inc. (b) | | | 4,303 | | | | 297,983 | |
General Mills, Inc. | | | 15,925 | | | | 1,190,234 | |
Hormel Foods Corporation | | | 8,096 | | | | 330,964 | |
Ingredion, Inc. | | | 1,811 | | | | 201,492 | |
JM Smucker Company (The) | | | 2,888 | | | | 435,077 | |
Kellogg Company | | | 7,477 | | | | 500,137 | |
Keurig Dr Pepper, Inc. | | | 24,879 | | | | 846,135 | |
Kraft Heinz Company (The) | | | 21,707 | | | | 785,359 | |
Lamb Weston Holdings, Inc. | | | 3,924 | | | | 406,644 | |
McCormick & Company, Inc. | | | 6,798 | | | | 608,285 | |
Mondelez International, Inc., Class A | | | 37,066 | | | | 2,747,703 | |
PepsiCo, Inc. | | | 37,438 | | | | 7,018,127 | |
| | | | | | | | |
| | | | | | | 24,655,798 | |
| | | | | | | | |
Renewable Energy & Energy Efficiency — 4.1% | |
Acuity Brands, Inc. | | | 882 | | | | 145,742 | |
First Solar, Inc. (b) | | | 2,751 | | | | 570,557 | |
Itron, Inc. (b) | | | 1,270 | | | | 99,911 | |
Johnson Controls International, PLC | | | 18,635 | | | | 1,296,064 | |
25
| | |
GREEN CENTURY EQUITY FUND PORTFOLIO OF INVESTMENTS July 31, 2023 | | continued |
| | | | | | | | |
| | | SHARES | | | VALUE | |
Renewable Energy & Energy Efficiency — (continued) | |
Ormat Technologies, Inc. | | | 1,475 | | | $ | 119,917 | |
Tesla, Inc. (b) | | | 77,464 | | | | 20,716,198 | |
| | | | | | | | |
| | | | | | | 22,948,389 | |
| | | | | | | | |
Healthcare Equipment & Services — 3.8% | |
Align Technology, Inc. (b) | | | 1,976 | | | | 746,711 | |
AmerisourceBergen Corporation | | | 4,693 | | | | 877,122 | |
Becton, Dickinson & Company | | | 7,723 | | | | 2,151,782 | |
Cardinal Health, Inc. | | | 6,998 | | | | 640,107 | |
Centene Corporation (b) | | | 15,012 | | | | 1,022,167 | |
Cigna Group (The) | | | 8,070 | | | | 2,381,457 | |
Cooper Cos., Inc. (The) | | | 1,336 | | | | 522,723 | |
DaVita, Inc. (b) | | | 1,463 | | | | 149,211 | |
DENTSPLY SIRONA, Inc. | | | 5,851 | | | | 242,934 | |
DexCom, Inc. (b) | | | 10,518 | | | | 1,310,122 | |
Edwards Lifesciences Corporation (b) | | | 16,451 | | | | 1,350,134 | |
HCA Healthcare, Inc. | | | 5,651 | | | | 1,541,649 | |
Henry Schein, Inc. (b) | | | 3,604 | | | | 283,959 | |
Hologic, Inc. (b) | | | 6,656 | | | | 528,620 | |
Humana, Inc. | | | 3,388 | | | | 1,547,740 | |
IDEXX Laboratories, Inc. (b) | | | 2,251 | | | | 1,248,697 | |
Insulet Corporation (b) | | | 1,911 | | | | 528,869 | |
Laboratory Corporation of America Holdings | | | 2,401 | | | | 513,646 | |
Patterson Companies, Inc. | | | 2,363 | | | | 77,719 | |
Pediatrix Medical Group, Inc. (b) | | | 2,034 | | | | 27,927 | |
Quest Diagnostics, Inc. | | | 3,036 | | | | 410,498 | |
ResMed, Inc. | | | 3,981 | | | | 885,175 | |
Select Medical Holdings Corporation | | | 2,929 | | | | 87,899 | |
STERIS PLC | | | 2,692 | | | | 607,181 | |
Teladoc Health, Inc. (b) | | | 4,537 | | | | 135,066 | |
West Pharmaceutical Services, Inc. | | | 2,017 | | | | 742,337 | |
Zimmer Biomet Holdings, Inc. | | | 5,695 | | | | 786,764 | |
| | | | | | | | |
| | | | | | | 21,348,216 | |
| | | | | | | | |
Consumer Discretionary Distribution & Retail — 3.8% | |
AutoNation, Inc. (b) | | | 902 | | | | 145,204 | |
Best Buy Company, Inc. | | | 5,267 | | | | 437,424 | |
Booking Holdings, Inc. (b) | | | 1,021 | | | | 3,033,187 | |
Buckle, Inc. (The) | | | 896 | | | | 32,758 | |
CarMax, Inc. (b) | | | 4,239 | | | | 350,184 | |
Foot Locker, Inc. | | | 2,249 | | | | 60,431 | |
GameStop Corporation, Class A (b) | | | 7,256 | | | | 161,083 | |
| | | | | | | | |
| | | SHARES | | | VALUE | |
Consumer Discretionary Distribution & Retail — (continued) | |
Gap, Inc. (The) | | | 5,660 | | | $ | 58,298 | |
Home Depot, Inc. (The) | | | 27,504 | | | | 9,181,935 | |
Kohl’s Corporation | | | 3,019 | | | | 85,891 | |
LKQ Corporation | | | 7,167 | | | | 392,680 | |
Lowe’s Companies, Inc. | | | 16,190 | | | | 3,792,831 | |
Nordstrom, Inc. | | | 2,838 | | | | 65,586 | |
ODP Corporation (The) (b) | | | 995 | | | | 49,631 | |
Pool Corporation | | | 1,055 | | | | 405,901 | |
Signet Jewelers Ltd. | | | 1,184 | | | | 95,300 | |
Target Corporation | | | 12,479 | | | | 1,703,009 | |
Tractor Supply Company | | | 2,971 | | | | 665,474 | |
Ulta Beauty, Inc. (b) | | | 1,361 | | | | 605,373 | |
| | | | | | | | |
| | | | | | | 21,322,180 | |
| | | | | | | | |
Equity Real Estate Investment Trusts (REITs) — 3.0% | |
American Tower Corporation REIT | | | 12,630 | | | | 2,403,615 | |
Anywhere Real Estate, Inc. (b) | | | 3,345 | | | | 28,031 | |
AvalonBay Communities, Inc. REIT | | | 3,775 | | | | 712,154 | |
Boston Properties, Inc. REIT | | | 4,135 | | | | 275,515 | |
CBRE Group, Inc., Class A (b) | | | 8,391 | | | | 699,054 | |
Corporate Office Properties Trust REIT | | | 3,017 | | | | 78,442 | |
Digital Realty Trust, Inc. REIT | | | 7,931 | | | | 988,361 | |
Equinix, Inc. REIT | | | 2,535 | | | | 2,053,147 | |
Equity Residential REIT | | | 9,782 | | | | 645,025 | |
Federal Realty Investment Trust REIT | | | 1,997 | | | | 202,736 | |
Healthpeak Properties, Inc. REIT | | | 15,017 | | | | 327,821 | |
Host Hotels & Resorts, Inc. REIT | | | 19,078 | | | | 351,035 | |
Iron Mountain, Inc. REIT | | | 8,003 | | | | 491,384 | |
Jones Lang LaSalle, Inc. (b) | | | 1,313 | | | | 218,680 | |
Macerich Company (The) REIT | | | 5,877 | | | | 74,932 | |
PotlatchDeltic Corporation REIT | | | 2,160 | | | | 115,841 | |
Prologis, Inc. REIT | | | 25,038 | | | | 3,123,491 | |
SBA Communications Corporation, Class A REIT | | | 2,923 | | | | 639,991 | |
Simon Property Group, Inc. REIT | | | 8,904 | | | | 1,109,438 | |
UDR, Inc. REIT | | | 8,368 | | | | 342,084 | |
Ventas, Inc. REIT | | | 10,968 | | | | 532,167 | |
Welltower, Inc. REIT | | | 13,533 | | | | 1,111,736 | |
| | | | | | | | |
| | | | | | | 16,524,680 | |
| | | | | | | | |
Insurance — 2.9% | | | | | | | | |
Allstate Corporation (The) | | | 7,163 | | | | 807,127 | |
Arthur J. Gallagher & Company | | | 5,839 | | | | 1,254,217 | |
26
| | |
GREEN CENTURY EQUITY FUND PORTFOLIO OF INVESTMENTS July 31, 2023 | | continued |
| | | | | | | | |
| | | SHARES | | | VALUE | |
Insurance — (continued) | | | | | | | | |
Chubb Ltd. (a) | | | 11,227 | | | $ | 2,294,911 | |
Elevance Health, Inc. | | | 6,436 | | | | 3,035,411 | |
Hartford Financial Services | | | | | | | | |
Group, Inc. (The) | | | 8,411 | | | | 604,583 | |
Lincoln National Corporation | | | 4,724 | | | | 132,461 | |
Loews Corporation | | | 5,240 | | | | 328,286 | |
Marsh & McLennan Companies, Inc. | | | 13,475 | | | | 2,538,959 | |
Principal Financial Group, Inc. | | | 6,530 | | | | 521,551 | |
Progressive Corporation (The) | | | 15,921 | | | | 2,005,727 | |
Prudential Financial, Inc. | | | 9,908 | | | | 956,023 | |
Travelers Companies, Inc. (The) | | | 6,298 | | | | 1,087,098 | |
Willis Towers Watson PLC (a) | | | 2,890 | | | | 610,744 | |
| | | | | | | | |
| | | | | | | 16,177,098 | |
| | | | | | | | |
Household & Personal Products — 2.6% | | | | | |
Clorox Company (The) | | | 3,346 | | | | 506,852 | |
Colgate-Palmolive Company | | | 21,524 | | | | 1,641,420 | |
Estee Lauder Companies, Inc. (The), Class A | | | 6,287 | | | | 1,131,660 | |
Kimberly-Clark Corporation | | | 9,170 | | | | 1,183,847 | |
Procter & Gamble Company (The) | | | 64,112 | | | | 10,020,706 | |
| | | | | | | | |
| | | | | | | 14,484,485 | |
| | | | | | | | |
Materials — 2.5% | | | | | | | | |
Albemarle Corporation | | | 3,177 | | | | 674,414 | |
Amcor PLC (a) | | | 39,805 | | | | 408,399 | |
Avery Dennison Corporation | | | 2,189 | | | | 402,798 | |
Axalta Coating Systems Ltd. (b) | | | 6,060 | | | | 193,920 | |
Ball Corporation | | | 8,488 | | | | 498,161 | |
Compass Minerals International, Inc. | | | 974 | | | | 36,885 | |
Ecolab, Inc. | | | 6,947 | | | | 1,272,274 | |
H.B. Fuller Company | | | 1,445 | | | | 106,973 | |
International Flavors & Fragrances, Inc. | | | 6,860 | | | | 580,425 | |
Linde PLC (a) | | | 13,312 | | | | 5,200,599 | |
Minerals Technologies, Inc. | | | 928 | | | | 56,933 | |
Mosaic Company (The) | | | 9,143 | | | | 372,669 | |
Newmont Corporation | | | 21,693 | | | | 931,064 | |
PPG Industries, Inc. | | | 6,411 | | | | 922,543 | |
Schnitzer Steel Industries, Inc., Class A | | | 743 | | | | 26,904 | |
Sealed Air Corporation | | | 3,991 | | | | 182,069 | |
Sherwin-Williams Company (The) | | | 6,665 | | | | 1,842,872 | |
Sonoco Products Company | | | 2,649 | | | | 155,337 | |
| | | | | | | | |
| | | | | | | 13,865,239 | |
| | | | | | | | |
| | | | | | | | |
| | | SHARES | | | VALUE | |
Consumer Services — 2.5% | | | | | | | | |
Aramark | | | 6,242 | | | $ | 251,990 | |
Choice Hotels International, Inc. | | | 918 | | | | 120,028 | |
Darden Restaurants, Inc. | | | 3,252 | | | | 549,328 | |
Domino’s Pizza, Inc. | | | 970 | | | | 384,838 | |
Hilton Worldwide Holdings, Inc. | | | 7,246 | | | | 1,126,681 | |
Jack in the Box, Inc. | | | 576 | | | | 57,260 | |
Marriott International, Inc., Class A | | | 7,103 | | | | 1,433,456 | |
McDonald’s Corporation | | | 19,844 | | | | 5,818,261 | |
Royal Caribbean Cruises Ltd. (b) | | | 6,240 | | | | 680,846 | |
Starbucks Corporation | | | 31,181 | | | | 3,167,054 | |
Vail Resorts, Inc. | | | 1,104 | | | | 259,981 | |
| | | | | | | | |
| | | | | | | 13,849,723 | |
| | | | | | | | |
Technology Hardware & Equipment — 2.4% | |
Cisco Systems, Inc. | | | 111,271 | | | | 5,790,543 | |
Cognex Corporation | | | 4,774 | | | | 260,756 | |
CommScope Holding Company, Inc. (b) | | | 5,878 | | | | 26,451 | |
Corning, Inc. | | | 21,720 | | | | 737,177 | |
Dell Technologies, Inc., Class C | | | 6,970 | | | | 368,852 | |
F5, Inc. (b) | | | 1,665 | | | | 263,470 | |
Flex Ltd. (b) | | | 12,362 | | | | 338,224 | |
Hewlett Packard Enterprise Company | | | 34,906 | | | | 606,666 | |
HP, Inc. | | | 24,117 | | | | 791,761 | |
Keysight Technologies, Inc. (b) | | | 4,816 | | | | 775,761 | |
Motorola Solutions, Inc. | | | 4,543 | | | | 1,302,160 | |
TE Connectivity Ltd. (a) | | | 8,630 | | | | 1,238,319 | |
Trimble, Inc. (b) | | | 6,606 | | | | 355,403 | |
Xerox Holdings Corporation | | | 3,132 | | | | 50,049 | |
Zebra Technologies Corporation, Class A (b) | | | 1,412 | | | | 434,840 | |
| | | | | | | | |
| | | | | | | 13,340,432 | |
| | | | | | | | |
Transportation — 2.1% | | | | | | | | |
ArcBest Corporation | | | 682 | | | | 79,330 | |
Avis Budget Group, Inc. (b) | | | 604 | | | | 133,055 | |
C.H. Robinson Worldwide, Inc. | | | 3,217 | | | | 322,279 | |
CSX Corporation | | | 55,597 | | | | 1,852,492 | |
Delta Air Lines, Inc. | | | 4,374 | | | | 202,341 | |
Expeditors International of Washington, Inc. | | | 4,181 | | | | 532,241 | |
J.B. Hunt Transport Services, Inc. | | | 2,232 | | | | 455,194 | |
Ryder System, Inc. | | | 1,284 | | | | 131,161 | |
Southwest Airlines Company | | | 4,118 | | | | 140,671 | |
27
| | |
GREEN CENTURY EQUITY FUND PORTFOLIO OF INVESTMENTS July 31, 2023 | | continued |
| | | | | | | | |
| | | SHARES | | | VALUE | |
Transportation — (continued) | | | | | | | | |
U-Haul Holding Company | | | 2,684 | | | $ | 153,552 | |
Union Pacific Corporation | | | 16,566 | | | | 3,843,643 | |
United Parcel Service, Inc., Class B | | | 19,645 | | | | 3,676,169 | |
| | | | | | | | |
| | | | | | | 11,522,128 | |
| | | | | | | | |
Consumer Durables & Apparel — 1.2% | | | | | |
Capri Holdings Ltd. (a)(b) | | | 3,460 | | | | 127,709 | |
Columbia Sportswear Company | | | 1,043 | | | | 81,990 | |
Deckers Outdoor Corporation (b) | | | 724 | | | | 393,632 | |
Ethan Allen Interiors, Inc. | | | 675 | | | | 21,242 | |
Garmin Ltd. (a) | | | 4,201 | | | | 444,844 | |
Hanesbrands, Inc. | | | 9,572 | | | | 50,444 | |
Hasbro, Inc. | | | 3,638 | | | | 234,869 | |
La-Z-Boy, Inc. | | | 1,082 | | | | 33,942 | |
Mattel, Inc. (b) | | | 9,799 | | | | 208,719 | |
Meritage Homes Corporation | | | 1,003 | | | | 149,397 | |
Mohawk Industries, Inc. (b) | | | 1,492 | | | | 158,659 | |
Newell Brands, Inc. | | | 10,859 | | | | 121,186 | |
NIKE, Inc., Class B | | | 33,414 | | | | 3,688,572 | |
PVH Corporation | | | 1,720 | | | | 154,181 | |
Topgolf Callaway Brands Corporation (b) | | | 3,876 | | | | 77,404 | |
Under Armour, Inc., Class A (b) | | | 5,256 | | | | 42,363 | |
Under Armour, Inc., Class C (b) | | | 5,022 | | | | 37,263 | |
VF Corporation | | | 9,129 | | | | 180,846 | |
Whirlpool Corporation | | | 1,446 | | | | 208,600 | |
Wolverine World Wide, Inc. | | | 2,254 | | | | 28,558 | |
| | | | | | | | |
| | | | | | | 6,444,420 | |
| | | | | | | | |
Banks — 1.0% | | | | | | | | |
Bank of Hawaii Corporation | | | 1,083 | | | | 61,872 | |
Cathay General Bancorp | | | 1,866 | | | | 70,983 | |
Citizens Financial Group, Inc. | | | 13,337 | | | | 430,252 | |
Comerica, Inc. | | | 3,662 | | | | 197,601 | |
Huntington Bancshares, Inc. | | | 39,666 | | | | 485,512 | |
International Bancshares Corporation | | | 1,478 | | | | 73,368 | |
KeyCorp | | | 24,557 | | | | 302,297 | |
M&T Bank Corporation | | | 4,523 | | | | 632,587 | |
Old National Bancorp | | | 7,810 | | | | 133,004 | |
PNC Financial Services Group, Inc. (The) | | | 10,795 | | | | 1,477,727 | |
Regions Financial Corporation | | | 25,094 | | | | 511,165 | |
Truist Financial Corporation | | | 36,224 | | | | 1,203,361 | |
Zions Bancorp NA | | | 4,072 | | | | 155,754 | |
| | | | | | | | |
| | | | | | | 5,735,483 | |
| | | | | | | | |
| | | | | | | | |
| | | SHARES | | | VALUE | |
Telecommunication Services — 0.7% | | | | | |
Lumen Technologies Inc. | | | 26,155 | | | $ | 46,817 | |
Verizon Communications, Inc. | | | 113,987 | | | | 3,884,677 | |
| | | | | | | | |
| | | | | | | 3,931,494 | |
| | | | | | | | |
Commercial & Professional Services — 0.4% | |
ACCO Brands Corporation | | | 2,536 | | | | 15,444 | |
ASGN, Inc. (b) | | | 1,359 | | | | 103,719 | |
Copart, Inc. (b) | | | 11,692 | | | | 1,033,456 | |
Deluxe Corporation | | | 1,336 | | | | 25,371 | |
Exponent, Inc. | | | 1,400 | | | | 125,412 | |
Heidrick & Struggles International, Inc. | | | 461 | | | | 12,571 | |
HNI Corporation | | | 1,309 | | | | 38,079 | |
ICF International, Inc. | | | 504 | | | | 59,265 | |
Interface, Inc. | | | 1,373 | | | | 13,414 | |
Kelly Services, Inc., Class A | | | 951 | | | | 17,422 | |
ManpowerGroup, Inc. | | | 1,367 | | | | 107,829 | |
Resources Connection, Inc. | | | 1,022 | | | | 16,332 | |
Robert Half International, Inc. | | | 2,969 | | | | 220,151 | |
Steelcase, Inc., Class A | | | 2,253 | | | | 19,308 | |
Tetra Tech, Inc. | | | 1,472 | | | | 249,077 | |
TransUnion | | | 5,191 | | | | 413,671 | |
TrueBlue, Inc. (b) | | | 927 | | | | 13,859 | |
| | | | | | | | |
| | | | | | | 2,484,380 | |
| | | | | | | | |
Automobiles & Components — 0.4% | | | | | |
Aptiv PLC (a)(b) | | | 7,374 | | | | 807,379 | |
Autoliv, Inc. (a) | | | 2,237 | | | | 225,781 | |
BorgWarner, Inc. | | | 6,429 | | | | 298,949 | |
Harley-Davidson, Inc. | | | 3,861 | | | | 149,073 | |
Phinia, Inc. (b) | | | 1 | | | | 23 | |
Rivian Automotive, Inc., Class A (b) | | | 17,385 | | | | 480,521 | |
| | | | | | | | |
| | | | | | | 1,961,726 | |
| | | | | | | | |
Consumer Staples Distribution & Retail — 0.3% | |
Kroger Co. (The) | | | 18,524 | | | | 901,007 | |
Sysco Corporation | | | 13,715 | | | | 1,046,592 | |
| | | | | | | | |
| | | | | | | 1,947,599 | |
| | | | | | | | |
Utilities — 0.2% | | | | | | | | |
American Water Works Company, Inc. | | | 5,277 | | | | 777,988 | |
Essential Utilities, Inc. | | | 6,920 | | | | 292,647 | |
| | | | | | | | |
| | | | | | | 1,070,635 | |
| | | | | | | | |
28
| | |
GREEN CENTURY EQUITY FUND PORTFOLIO OF INVESTMENTS July 31, 2023 | | concluded |
| | | | | | | | |
| | | SHARES | | | VALUE | |
Healthy Living — 0.0% | | | | | | | | |
Hain Celestial Group, Inc. (The) (b) | | | 2,434 | | | $ | 30,839 | |
United Natural Foods, Inc. (b) | | | 1,633 | | | | 33,966 | |
| | | | | | | | |
| | | | | | | 64,805 | |
| | | | | | | | |
Total Common Stocks
(Cost $256,131,431) | | | | | | | 557,002,406 | |
| | | | | | | | |
SHORT-TERM INVESTMENTS — 0.1% | | | | | |
UMB Money Market Fiduciary Account, 0.01% (c)
(Cost $780,494) | | | | | | | 780,494 | |
| | | | | | | | |
Total Short-term Investments
(Cost $780,494) | | | | | | | 780,494 | |
| | | | | | | | |
TOTAL INVESTMENTS (d) — 100.0% | |
(Cost $256,911,925) | | | | | | | 557,782,900 | |
Other Assets Less Liabilities — 0.0% | | | | | | | 105,240 | |
| | | | | | | | |
NET ASSETS — 100.0% | | | | | | $ | 557,888,140 | |
| | | | | | | | |
PLC – Public Limited Company
REIT – Real Estate Investment Trusts
| (a) | Securities whose value are determined or significantly influenced by trading in markets other than the United States or Canada. |
| (b) | Non-income producing security. |
| (c) | The rate quoted is the annualized seven-day yield of the fund at the period end. |
| (d) | The cost of investments for federal income tax purposes is $263,262,797 resulting in gross unrealized appreciation and depreciation of $312,096,779 and $17,576,676 respectively, or net unrealized appreciation of $294,520,103. |
See Notes to Financial Statements
29
| | |
GREEN CENTURY MSCI INTERNATIONAL INDEX FUND PORTFOLIO OF INVESTMENTS July 31, 2023 | | |
| | | | | | | | |
COMMON STOCKS — 99.3% | | | | | | | | |
| | | SHARES | | | VALUE | |
Japan — 22.0% | | | | | | | | |
Advantest Corporation | | | 8,100 | | | $ | 1,120,310 | |
Aeon Company, Ltd. | | | 27,900 | | | | 604,277 | |
Ajinomoto Company, Inc. | | | 19,200 | | | | 748,126 | |
ANA Holdings, Inc. (a) | | | 6,600 | | | | 158,229 | |
Asahi Kasei Corporation | | | 54,000 | | | | 367,997 | |
Astellas Pharma, Inc. | | | 77,500 | | | | 1,133,232 | |
Azbil Corporation | | | 4,700 | | | | 148,310 | |
Brother Industries Ltd. | | | 9,600 | | | | 149,644 | |
Daikin Industries Ltd. | | | 11,300 | | | | 2,284,846 | |
Daiwa Securities Group, Inc. | | | 56,900 | | | | 308,450 | |
FANUC Corporation | | | 41,000 | | | | 1,254,290 | |
Fuji Electric Company Ltd. | | | 5,400 | | | | 244,132 | |
Fujitsu Ltd. | | | 7,500 | | | | 971,174 | |
Hankyu Hanshin Holdings, Inc. | | | 9,600 | | | | 318,940 | |
Hitachi Ltd. | | | 39,900 | | | | 2,612,034 | |
Hoya Corporation | | | 15,200 | | | | 1,770,183 | |
Ibiden Company Ltd. | | | 4,700 | | | | 285,663 | |
Itochu Techno-Solutions Corporation | | | 4,200 | | | | 106,445 | |
KDDI Corp. | | | 64,000 | | | | 1,883,629 | |
Kikkoman Corporation | | | 5,800 | | | | 334,259 | |
Kubota Corporation | | | 43,200 | | | | 652,578 | |
Kyowa Kirin Company Ltd. | | | 11,300 | | | | 215,781 | |
Lixil Corporation | | | 11,900 | | | | 152,080 | |
MatsukiyoCocokara & Company | | | 4,800 | | | | 280,904 | |
Mitsubishi Chemical Group Corporation | | | 54,800 | | | | 327,804 | |
Mitsui Chemicals, Inc. | | | 7,200 | | | | 207,029 | |
NEC Corporation | | | 10,400 | | | | 526,192 | |
Nitto Denko Corporation | | | 6,400 | | | | 455,111 | |
Nomura Research Institute Ltd. | | | 16,300 | | | | 463,163 | |
Omron Corporation | | | 7,500 | | | | 402,572 | |
Ono Pharmaceutical Company Ltd. | | | 16,500 | | | | 302,368 | |
Oriental Land Company Ltd./Japan | | | 46,300 | | | | 1,775,769 | |
Rakuten, Inc. | | | 62,900 | | | | 246,364 | |
Renesas Electronics Corporation (a) | | | 54,400 | | | | 1,049,585 | |
Secom Company Ltd. | | | 9,000 | | | | 603,944 | |
Seiko Epson Corporation | | | 12,100 | | | | 198,703 | |
SG Holdings Company Ltd. | | | 13,500 | | | | 197,012 | |
SoftBank Corporation | | | 122,100 | | | | 1,355,860 | |
Sompo Holdings, Inc. | | | 13,200 | | | | 583,582 | |
Sony Group Corporation | | | 53,700 | | | | 5,029,877 | |
Sumitomo Chemical Company, Ltd. | | | 60,400 | | | | 186,283 | |
Sumitomo Metal Mining Company, Ltd. | | | 10,600 | | | | 366,073 | |
| | | | | | | | |
| | | SHARES | | | VALUE | |
Japan — (continued) | | | | | | | | |
Sumitomo Mitsui Financial Group, Inc. | | | 55,800 | | | $ | 2,614,324 | |
Sysmex Corporation | | | 7,100 | | | | 480,777 | |
T&D Holdings, Inc. | | | 21,400 | | | | 347,939 | |
TDK Corporation | | | 16,500 | | | | 632,087 | |
TIS, Inc. | | | 9,300 | | | | 235,883 | |
Tobu Railway Company Ltd. | | | 8,000 | | | | 211,696 | |
Tokio Marine Holdings, Inc. | | | 77,000 | | | | 1,770,614 | |
Toray Industries, Inc. | | | 59,800 | | | | 334,845 | |
Unicharm Corporation | | | 17,300 | | | | 640,077 | |
Yamaha Corporation | | | 5,900 | | | | 228,614 | |
Yamaha Motor Company Ltd. | | | 12,700 | | | | 372,477 | |
Yamato Holdings Company Ltd. | | | 12,000 | | | | 224,736 | |
Yaskawa Electric Corporation | | | 10,300 | | | | 447,744 | |
Z Holdings Corporation | | | 112,300 | | | | 313,094 | |
| | | | | | | | |
| | | | | | | 41,237,711 | |
| | | | | | | | |
Canada — 11.2% | | | | | | | | |
Agnico Eagle Mines Ltd. | | | 20,789 | | | | 1,089,818 | |
Bank of Nova Scotia (The) | | | 50,743 | | | | 2,555,043 | |
Brookfield Renewable Corporation, Class A | | | 5,687 | | | | 177,247 | |
Canadian Apartment Properties REIT REIT | | | 3,687 | | | | 143,739 | |
Dollarama, Inc. | | | 12,100 | | | | 797,002 | |
Gildan Activewear, Inc. | | | 7,702 | | | | 239,523 | |
Intact Financial Corporation | | | 7,476 | | | | 1,104,421 | |
Metro, Inc. | | | 10,122 | | | | 544,747 | |
National Bank of Canada | | | 14,473 | | | | 1,133,519 | |
Nutrien Ltd. | | | 21,283 | | | | 1,466,586 | |
Open Text Corporation | | | 11,714 | | | | 503,133 | |
RB Global, Inc. | | | 7,825 | | | | 505,329 | |
RioCan Real Estate Investment Trust REIT | | | 6,531 | | | | 99,300 | |
Saputo, Inc. | | | 10,361 | | | | 218,738 | |
Shopify, Inc. (a) | | | 51,051 | | | | 3,448,565 | |
Sun Life Financial, Inc. | | | 24,789 | | | | 1,304,585 | |
TELUS Corporation | | | 19,219 | | | | 342,202 | |
Toronto-Dominion Bank (The) | | | 77,627 | | | | 5,119,014 | |
West Fraser Timber Company Ltd. | | | 2,501 | | | | 210,708 | |
| | | | | | | | |
| | | | | | | 21,003,219 | |
| | | | | | | | |
France — 10.3% | | | | | | | | |
Aeroports de Paris | | | 1,252 | | | | 172,892 | |
AXA SA | | | 78,186 | | | | 2,403,358 | |
BioMerieux | | | 1,749 | | | | 187,755 | |
30
| | |
GREEN CENTURY MSCI INTERNATIONAL INDEX FUND PORTFOLIO OF INVESTMENTS July 31, 2023 | | continued |
| | | | | | | | |
| | | SHARES | | | VALUE | |
France — (continued) | | | | | | | | |
Cie Generale des Etablissements Michelin SCA | | | 28,721 | | | $ | 940,533 | |
Credit Agricole SA | | | 51,170 | | | | 635,296 | |
Danone SA | | | 27,351 | | | | 1,670,245 | |
Dassault Systemes SE | | | 28,394 | | | | 1,213,527 | |
Hermes International | | | 1,348 | | | | 2,983,494 | |
L’Oreal SA | | | 10,239 | | | | 4,762,278 | |
Schneider Electric SE | | | 23,124 | | | | 4,124,696 | |
Valeo SA | | | 9,110 | | | | 205,925 | |
| | | | | | | | |
| | | | | | | 19,299,999 | |
| | | | | | | | |
United Kingdom — 9.4% | | | | | | | | |
3i Group PLC | | | 41,860 | | | | 1,062,053 | |
abrdn plc | | | 83,493 | | | | 248,475 | |
Admiral Group PLC | | | 9,090 | | | | 248,188 | |
Auto Trader Group PLC (b) | | | 38,609 | | | | 320,209 | |
Barratt Developments PLC | | | 40,899 | | | | 239,410 | |
Berkeley Group Holdings PLC | | | 4,590 | | | | 255,931 | |
BT Group PLC | | | 294,248 | | | | 461,084 | |
Burberry Group PLC | | | 16,452 | | | | 469,634 | |
Croda International PLC | | | 6,059 | | | | 458,752 | |
Informa PLC | | | 58,594 | | | | 570,118 | |
InterContinental Hotels Group PLC | | | 7,488 | | | | 553,425 | |
Intertek Group PLC | | | 6,913 | | | | 387,261 | |
Johnson Matthey PLC | | | 8,003 | | | | 185,091 | |
Kingfisher PLC | | | 82,751 | | | | 260,944 | |
Legal & General Group PLC | | | 256,466 | | | | 768,608 | |
Mondi PLC | | | 20,156 | | | | 353,553 | |
Pearson PLC | | | 27,576 | | | | 305,038 | |
Phoenix Group Holdings PLC | | | 32,241 | | | | 227,789 | |
RELX PLC | | | 81,103 | | | | 2,729,701 | |
Sage Group PLC (The) | | | 42,649 | | | | 513,014 | |
Schroders PLC | | | 35,513 | | | | 209,523 | |
Segro PLC REIT | | | 50,321 | | | | 493,129 | |
St. James’s Place PLC | | | 23,347 | | | | 281,830 | |
Taylor Wimpey PLC | | | 145,229 | | | | 213,184 | |
Unilever PLC | | | 107,695 | | | | 5,786,851 | |
| | | | | | | | |
| | | | | | | 17,602,795 | |
| | | | | | | | |
Netherlands — 9.2% | | | | | | | | |
Akzo Nobel NV | | | 7,214 | | | | 617,146 | |
ASML Holding NV | | | 13,078 | | | | 9,367,408 | |
CNH Industrial NV | | | 43,348 | | | | 626,075 | |
Just Eat Takeaway.com NV (a)(b) | | | 9,205 | | | | 165,139 | |
Prosus NV (a) | | | 34,168 | | | | 2,702,954 | |
STMicroelectronics NV | | | 29,132 | | | | 1,558,173 | |
| | | | | | | | |
| | | SHARES | | | VALUE | |
Netherlands — (continued) | | | | | | | | |
Universal Music Group NV | | | 34,806 | | | $ | 892,775 | |
Wolters Kluwer NV | | | 10,982 | | | | 1,379,083 | |
| | | | | | | | |
| | | | | | | 17,308,753 | |
| | | | | | | | |
Denmark — 7.4% | | | | | | | | |
Coloplast A/S, Class B | | | 5,036 | | | | 626,007 | |
Demant A/S (a) | | | 3,886 | | | | 154,643 | |
DSV A/S | | | 7,925 | | | | 1,586,110 | |
Genmab A/S (a) | | | 2,808 | | | | 1,157,457 | |
Novo Nordisk A/S, Class B | | | 54,498 | | | | 8,787,924 | |
Pandora A/S | | | 3,814 | | | | 381,522 | |
ROCKWOOL A/S B Shares | | | 403 | | | | 108,391 | |
Vestas Wind Systems A/S (a) | | | 42,831 | | | | 1,145,578 | |
| | | | | | | | |
| | | | | | | 13,947,632 | |
| | | | | | | | |
Switzerland — 6.8% | | | | | | | | |
Banque Cantonale Vaudoise | | | 1,323 | | | | 148,487 | |
DSM-Firmenich AG | | | 7,436 | | | | 821,680 | |
Givaudan SA | | | 392 | | | | 1,323,109 | |
Julius Baer Group Ltd. | | | 9,237 | | | | 654,197 | |
Kuehne + Nagel International AG | | | 2,359 | | | | 738,080 | |
Logitech International SA | | | 7,101 | | | | 502,004 | |
Lonza Group AG | | | 3,171 | | | | 1,842,360 | |
SGS SA | | | 6,333 | | | | 614,867 | |
SIG Group AG (a) | | | 12,841 | | | | 343,267 | |
Sonova Holding AG | | | 2,200 | | | | 613,204 | |
Swiss Re AG | | | 12,846 | | | | 1,340,268 | |
Temenos AG | | | 2,806 | | | | 241,310 | |
VAT Group AG (b) | | | 1,144 | | | | 486,226 | |
Zurich Insurance Group AG | | | 6,388 | | | | 3,088,412 | |
| | | | | | | | |
| | | | | | | 12,757,471 | |
| | | | | | | | |
Germany — 5.9% | | | | | | | | |
adidas AG | | | 6,891 | | | | 1,391,196 | |
Deutsche Boerse AG | | | 8,094 | | | | 1,550,830 | |
DHL Group | | | 42,915 | | | | 2,206,836 | |
GEA Group AG | | | 6,477 | | | | 274,897 | |
Henkel AG & Company KGaA | | | 4,508 | | | | 315,031 | |
Henkel AG & Company KGaA (c) | | | 7,107 | | | | 548,424 | |
LEG Immobilien SE (a) | | | 3,122 | | | | 220,734 | |
Merck KGaA | | | 5,502 | | | | 966,843 | |
Muenchener Rueckversicherungs-Gesellschaft AG in Muenchen | | | 5,981 | | | | 2,251,533 | |
Puma SE | | | 4,435 | | | | 299,724 | |
Telefonica Deutschland Holding AG | | | 39,494 | | | | 106,415 | |
31
| | |
GREEN CENTURY MSCI INTERNATIONAL INDEX FUND PORTFOLIO OF INVESTMENTS July 31, 2023 | | continued |
| | | | | | | | |
| | | SHARES | | | VALUE | |
Germany — (continued) | | | | | | | | |
Vonovia SE | | | 30,344 | | | $ | 707,017 | |
Zalando SE (a)(b) | | | 9,449 | | | | 326,225 | |
| | | | | | | | |
| | | | | | | 11,165,705 | |
| | | | | | | | |
Australia — 4.9% | | | | | | | | |
ASX Ltd. | | | 8,379 | | | | 350,054 | |
Brambles Ltd. | | | 58,463 | | | | 553,089 | |
Cochlear Ltd. | | | 2,852 | | | | 458,796 | |
Coles Group Ltd. | | | 56,002 | | | | 684,809 | |
Computershare Ltd. | | | 24,706 | | | | 416,661 | |
Dexus REIT | | | 45,797 | | | | 253,471 | |
GPT Group (The) REIT | | | 82,602 | | | | 241,426 | |
IGO Ltd. | | | 30,019 | | | | 280,499 | |
Lendlease Corporation Ltd. | | | 29,429 | | | | 171,083 | |
Mineral Resources Ltd. | | | 7,311 | | | | 353,235 | |
Mirvac Group REIT | | | 170,615 | | | | 268,929 | |
Newcrest Mining Ltd. | | | 38,904 | | | | 697,800 | |
Northern Star Resources Ltd. | | | 48,705 | | | | 380,192 | |
Orica Ltd. | | | 19,389 | | | | 205,727 | |
Pilbara Minerals Ltd. | | | 116,102 | | | | 379,819 | |
QBE Insurance Group Ltd. | | | 63,040 | | | | 669,271 | |
Scentre Group REIT | | | 211,694 | | | | 400,581 | |
Sonic Healthcare Ltd. | | | 19,369 | | | | 457,634 | |
Stockland REIT | | | 99,961 | | | | 284,084 | |
Suncorp Group Ltd. | | | 52,850 | | | | 506,395 | |
Transurban Group | | | 130,044 | | | | 1,255,543 | |
| | | | | | | | |
| | | | | | | 9,269,098 | |
| | | | | | | | |
Hong Kong — 3.6% | | | | | | | | |
AIA Group Ltd. | | | 496,200 | | | | 4,964,354 | |
BOC Hong Kong Holdings Ltd. | | | 157,000 | | | | 479,171 | |
Hang Seng Bank Ltd. | | | 32,517 | | | | 497,041 | |
MTR Corporation Ltd. | | | 65,667 | | | | 302,613 | |
Sino Land Company Ltd. | | | 154,000 | | | | 189,038 | |
Swire Pacific Ltd. A Shares | | | 18,500 | | | | 154,646 | |
Swire Properties Ltd. | | | 49,000 | | | | 122,957 | |
| | | | | | | | |
| | | | | | | 6,709,820 | |
| | | | | | | | |
Ireland — 1.7% | | | | | | | | |
CRH PLC | | | 31,501 | | | | 1,876,552 | |
James Hardie Industries PLC (a) | | | 19,057 | | | | 558,488 | |
Kerry Group PLC, Class A | | | 6,753 | | | | 670,919 | |
| | | | | | | | |
| | | | | | | 3,105,959 | |
| | | | | | | | |
| | | | | | | | |
| | | SHARES | | | VALUE | |
Italy — 1.4% | | | | | | | | |
Amplifon SpA | | | 5,339 | | | $ | 180,630 | |
Assicurazioni Generali SpA | | | 43,177 | | | | 919,696 | |
FinecoBank Banca Fineco SpA | | | 25,705 | | | | 399,130 | |
Mediobanca Banca di Credito Finanziario SpA | | | 23,033 | | | | 306,953 | |
Moncler SpA | | | 8,908 | | | | 642,925 | |
Poste Italiane SpA (b) | | | 23,034 | | | | 263,130 | |
| | | | | | | | |
| | | | | | | 2,712,464 | |
| | | | | | | | |
Sweden — 1.4% | | | | | | | | |
Beijer Ref AB | | | 16,766 | | | | 227,993 | |
Boliden AB | | | 11,394 | | | | 335,089 | |
Essity AB, Class B | | | 25,654 | | | | 636,124 | |
Kinnevik AB, Class B (a) | | | 10,665 | | | | 145,564 | |
Svenska Cellulosa AB SCA, Class B | | | 26,068 | | | | 346,378 | |
Svenska Handelsbanken AB A Shares | | | 61,436 | | | | 539,406 | |
Tele2 AB B Shares | | | 23,338 | | | | 175,608 | |
Telia Company AB | | | 107,912 | | | | 231,900 | |
| | | | | | | | |
| | | | | | | 2,638,062 | |
| | | | | | | | |
Finland — 1.2% | | | | | | | | |
Elisa Oyj | | | 6,138 | | | | 320,193 | |
Kesko Oyj B Shares | | | 11,719 | | | | 234,483 | |
Metso OYJ | | | 27,829 | | | | 316,253 | |
Nokia Oyj | | | 229,856 | | | | 903,553 | |
Stora Enso Oyj R Shares | | | 25,120 | | | | 307,953 | |
Wartsila OYJ Abp | | | 20,038 | | | | 251,736 | |
| | | | | | | | |
| | | | | | | 2,334,171 | |
| | | | | | | | |
Spain — 0.9% | | | | | | | | |
ACS Actividades de Construccion y Servicios SA | | | 9,456 | | | | 330,761 | |
Amadeus IT Group SA | | | 19,168 | | | | 1,375,044 | |
| | | | | | | | |
| | | | | | | 1,705,805 | |
| | | | | | | | |
Norway — 0.8% | | | | | | | | |
DNB Bank ASA | | | 39,094 | | | | 805,625 | |
Gjensidige Forsikring ASA | | | 8,956 | | | | 141,383 | |
Orkla ASA | | | 31,396 | | | | 247,739 | |
Telenor ASA | | | 29,933 | | | | 320,429 | |
| | | | | | | | |
| | | | | | | 1,515,176 | |
| | | | | | | | |
Belgium — 0.6% | | | | | | | | |
KBC Group NV | | | 10,629 | | | | 799,994 | |
Umicore SA. | | | 8,965 | | | | 265,501 | |
| | | | | | | | |
| | | | | | | 1,065,495 | |
| | | | | | | | |
32
| | |
GREEN CENTURY MSCI INTERNATIONAL INDEX FUND PORTFOLIO OF INVESTMENTS July 31, 2023 | | concluded |
| | | | | | | | |
| | | SHARES | | | VALUE | |
Singapore — 0.4% | | | | | | | | |
CapitaLand Integrated Commercial Trust REIT | | | 227,500 | | | $ | 349,256 | |
CapitaLand Investment Ltd. | | | 112,211 | | | | 287,194 | |
City Developments Ltd. | | | 20,300 | | | | 112,951 | |
| | | | | | | | |
| | | | | | | 749,401 | |
| | | | | | | | |
New Zealand — 0.2% | | | | | | | | |
EBOS Group Ltd. | | | 6,476 | | | | 155,188 | |
Meridian Energy Ltd. | | | 55,922 | | | | 196,274 | |
| | | | | | | | |
| | | | | | | 351,462 | |
| | | | | | | | |
Total Common Stocks
(Cost $ 164,268,646) | | | | | | | 186,480,198 | |
| | | | | | | | |
TOTAL INVESTMENTS (d) — 99.3% | | | | | |
(Cost $ 164,268,646) | | | | | | | 186,480,198 | |
Other Assets Less Liabilities — 0.7% | | | | | | | 1,308,766 | |
| | | | | | | | |
NET ASSETS — 100.0% | | | | | | $ | 187,788,964 | |
| | | | | | | | |
REIT – Real Estate Investment Trusts
PLC – Public Limited Company
| (a) | Non-income producing security. |
| (b) | Security exempt from registration under Rule 144A of the Securities Act of 1933. These securities may be resold in transactions exempt from registration to qualified institutional buyers. The total value of these securities is $1,560,929. |
| (d) | The cost of investments for federal income tax purposes is $168,709,036 resulting in gross unrealized appreciation and depreciation of $30,265,197 and $12,494,035 respectively, or net unrealized appreciation of $17,771,162. |
See Notes to Financial Statements
33
GREEN CENTURY FUNDS STATEMENTS OF ASSETS AND LIABILITIES
July 31, 2023
| | | | | | | | | | | | |
| | | BALANCED FUND | | | EQUITY FUND | | | MSCI INTERNATIONAL
INDEX FUND | |
ASSETS: | | | | | | | | | | | | |
Investments, at value (cost $292,278,110, $256,911,925 and $164,268,646, respectively) | | $ | 393,675,804 | | | $ | 557,782,900 | | | $ | 186,480,198 | |
Foreign cash, at value (cost $0, $0 and $501,224, respectively) | | | — | | | | — | | | | 496,894 | |
| Receivables for: | | | | | | | | | | | | |
Capital stock sold | | | 197,141 | | | | 354,141 | | | | 342,539 | |
Interest | | | 1,047,441 | | | | 5 | | | | 2 | |
Dividends | | | 186,969 | | | | 491,124 | | | | 901,404 | |
| | | | | | | | | | | | |
Total assets | | | 395,107,355 | | | | 558,628,170 | | | | 188,221,037 | |
| | | | | | | | | | | | |
LIABILITIES: | | | | | | | | | | | | |
Payable for capital stock repurchased | | | 62,163 | | | | 218,580 | | | | 173,470 | |
Payable for cash due to custodian | | | — | | | | — | | | | 90,081 | |
Accrued expenses | | | 455,873 | | | | 521,450 | | | | 168,522 | |
| | | | | | | | | | | | |
Total liabilities | | | 518,036 | | | | 740,030 | | | | 432,073 | |
| | | | | | | | | | | | |
NET ASSETS | | $ | 394,589,319 | | | $ | 557,888,140 | | | $ | 187,788,964 | |
| | | | | | | | | | | | |
NET ASSETS CONSIST OF: | | | | | | | | | | | | |
Paid-in capital (par value of $0.01 per share with unlimited number of shares authorized) | | $ | 283,659,523 | | | $ | 265,043,628 | | | $ | 174,441,568 | |
Net distributable earnings | | | 110,929,796 | | | | 292,844,512 | | | | 13,347,396 | |
| | | | | | | | | | | | |
NET ASSETS | | $ | 394,589,319 | | | $ | 557,888,140 | | | $ | 187,788,964 | |
| | | | | | | | | | | | |
NET ASSET VALUE PER SHARE PER CLASS: | | | | | | | | | | | | |
| Individual Investor Class Shares: | | | | | | | | | | | | |
Net assets applicable to shares outstanding | | $ | 279,639,651 | | | $ | 314,349,448 | | | $ | 52,275,325 | |
Shares of beneficial interest issued and outstanding | | | 8,357,153 | | | | 4,364,295 | | | | 4,000,312 | |
Net asset value per share | | $ | 33.46 | | | $ | 72.03 | | | $ | 13.07 | |
| | | | | | | | | | | | |
| Institutional Class Shares: | | | | | | | | | | | | |
Net assets applicable to shares outstanding | | $ | 114,949,668 | | | $ | 243,538,692 | | | $ | 135,513,639 | |
Shares of beneficial interest issued and outstanding | | | 3,425,678 | | | | 3,402,044 | | | | 10,419,167 | |
Net asset value per share | | $ | 33.56 | | | $ | 71.59 | | | $ | 13.01 | |
| | | | | | | | | | | | |
See Notes to Financial Statements
34
GREEN CENTURY FUNDS STATEMENTS OF OPERATIONS
For the year ended July 31, 2023
| | | | | | | | | | | | |
| | | BALANCED FUND | | | EQUITY FUND | | | MSCI INTERNATIONAL
INDEX FUND | |
INVESTMENT INCOME: | | | | | | | | | | | | |
Interest income | | $ | 3,721,008 | | | $ | 56 | | | $ | 49 | |
Dividend and other income (net of $23,957, $4,055 and $540,356 foreign withholding taxes, respectively) | | | 3,238,394 | | | | 8,009,068 | | | | 4,530,224 | |
| | | | | | | | | | | | |
Total investment income | | | 6,959,402 | | | | 8,009,124 | | | | 4,530,273 | |
| | | | | | | | | | | | |
EXPENSES: | | | | | | | | | | | | |
Administrative services fee. | | | 2,876,233 | | | | 4,482,006 | | | | 1,355,892 | |
Investment advisory fee | | | 2,427,975 | | | | 1,131,048 | | | | 483,680 | |
| | | | | | | | | | | | |
Total expenses | | | 5,304,208 | | | | 5,613,054 | | | | 1,839,572 | |
| | | | | | | | | | | | |
NET INVESTMENT INCOME | | | 1,655,194 | | | | 2,396,070 | | | | 2,690,701 | |
| | | | | | | | | | | | |
| NET REALIZED AND UNREALIZED GAIN (LOSS): | | | | | | | | | | | | |
| Net realized gain (loss) on: | | | | | | | | | | | | |
Investments | | | 9,771,494 | | | | (2,345,657 | ) | | | (3,384,064 | ) |
Foreign currency transactions | | | — | | | | — | | | | (85,822 | ) |
| Change in net unrealized appreciation on: | | | | | | | | | | | | |
Investments | | | 2,670,927 | | | | 62,173,962 | | | | 21,462,724 | |
Foreign currency translations | | | — | | | | — | | | | 31,596 | |
| | | | | | | | | | | | |
NET REALIZED AND UNREALIZED GAIN ON INVESTMENTS | | | 12,442,421 | | | | 59,828,305 | | | | 18,024,434 | |
| | | | | | | | | | | | |
NET INCREASE IN NET ASSETS RESULTING FROM OPERATIONS | | $ | 14,097,615 | | | $ | 62,224,375 | | | $ | 20,715,135 | |
| | | | | | | | | | | | |
See Notes to Financial Statements
35
GREEN CENTURY FUNDS STATEMENTS OF CHANGES IN NET ASSETS
| | | | | | | | | | | | | | | | | | | | | | | | |
| | | BALANCED FUND | | | EQUITY FUND | | | MSCI INTERNATIONAL
INDEX FUND | |
| | | FOR THE
YEAR ENDED
JULY 31, 2023 | | | FOR THE YEAR ENDED
JULY 31, 2022 | | | FOR THE
YEAR ENDED
JULY 31, 2023 | | | FOR THE YEAR ENDED
JULY 31, 2022 | | | FOR THE
YEAR ENDED
JULY 31, 2023 | | | FOR THE YEAR ENDED
JULY 31, 2022 | |
INCREASE (DECREASE) IN NET ASSETS: | | | | | | | | | | | | | | | | | | | | | | | | |
| From operations: | | | | | | | | | | | | | | | | | | | | | | | | |
Net investment income | | $ | 1,655,194 | | | $ | 156,675 | | | $ | 2,396,070 | | | $ | 1,215,412 | | | $ | 2,690,701 | | | $ | 2,890,573 | |
Net realized gain (loss) on investments and foreign currency transactions | | | 9,771,494 | | | | 9,290,056 | | | | (2,345,657 | ) | | | 443,916 | | | | (3,469,886 | ) | | | (2,455,570 | ) |
Change in net unrealized appreciation (depreciation) on investments and foreign currency translations | | | 2,670,927 | | | | (43,567,306 | ) | | | 62,173,962 | | | | (49,526,394 | ) | | | 21,494,320 | | | | (33,433,605 | ) |
| | | | | | | | | | | | | | | | | | | | | | | | |
Net increase (decrease) in net assets resulting from operations. | | | 14,097,615 | | | | (34,120,575 | ) | | | 62,224,375 | | | | (47,867,066 | ) | | | 20,715,135 | | | | (32,998,602 | ) |
| | | | | | | | | | | | | | | | | | | | | | | | |
| Dividends and distributions to shareholders: | | | | | | | | | | | | | | | | | | | | | | | | |
Distributions | | | | | | | | | | | | | | | | | | | | | | | | |
Individual Investor Class | | | (5,507,040 | ) | | | (12,975,872 | ) | | | (1,548,959 | ) | | | (4,047,069 | ) | | | (578,822 | ) | | | (1,563,064 | ) |
Institutional Class | | | (2,432,618 | ) | | | (3,990,285 | ) | | | (2,077,689 | ) | | | (3,269,110 | ) | | | (2,004,336 | ) | | | (4,167,887 | ) |
| | | | | | | | | | | | | | | | | | | | | | | | |
Total dividends and distributions | | | (7,939,658 | ) | | | (16,966,157 | ) | | | (3,626,648 | ) | | | (7,316,179 | ) | | | (2,583,158 | ) | | | (5,730,951 | ) |
| Capital share transactions: | | | | | | | | | | | | | | | | | | | | | | | | |
Proceeds from sales of shares | | | | | | | | | | | | | | | | | | | | | | | | |
Individual Investor Class | | | 21,024,153 | | | | 44,688,812 | | | | 23,168,559 | | | | 37,859,054 | | | | 9,049,805 | | | | 17,714,015 | |
Institutional Class | | | 22,610,444 | | | | 30,572,580 | | | | 37,989,362 | | | | 87,698,497 | | | | 28,221,800 | | | | 45,355,351 | |
Reinvestment of dividends and distributions | | | | | | | | | | | | | | | | | | | | | | | | |
Individual Investor Class | | | 5,322,059 | | | | 12,593,808 | | | | 1,505,339 | | | | 3,952,832 | | | | 573,660 | | | | 1,547,300 | |
Institutional Class | | | 2,398,249 | | | | 3,935,619 | | | | 1,871,313 | | | | 2,995,483 | | | | 2,002,627 | | | | 4,167,068 | |
Payments for shares redeemed | | | | | | | | | | | | | | | | | | | | | | | | |
Individual Investor Class1 | | | (47,345,115 | ) | | | (45,973,093 | ) | | | (45,012,458 | ) | | | (45,915,443 | ) | | | (9,825,458 | ) | | | (6,831,449 | ) |
Institutional Class2 | | | (13,500,643 | ) | | | (7,146,977 | ) | | | (35,603,924 | ) | | | (32,166,633 | ) | | | (23,420,414 | ) | | | (18,677,941 | ) |
| | | | | | | | | | | | | | | | | | | | | | | | |
Net increase (decrease) in net assets resulting from capital share transactions | | | (9,490,853 | ) | | | 38,670,749 | | | | (16,081,809 | ) | | | 54,423,790 | | | | 6,602,020 | | | | 43,274,344 | |
| | | | | | | | | | | | | | | | | | | | | | | | |
Total increase (decrease) in net assets | | | (3,332,896 | ) | | | (12,415,983 | ) | | | 42,515,918 | | | | (759,455 | ) | | | 24,733,997 | | | | 4,544,791 | |
NET ASSETS: | | | | | | | | | | | | | | | | | | | | | | | | |
Beginning of period | | | 397,922,215 | | | | 410,338,198 | | | | 515,372,222 | | | | 516,131,677 | | | | 163,054,967 | | | | 158,510,176 | |
| | | | | | | | | | | | | | | | | | | | | | | | |
End of period | | $ | 394,589,319 | | | $ | 397,922,215 | | | $ | 557,888,140 | | | $ | 515,372,222 | | | $ | 187,788,964 | | | $ | 163,054,967 | |
| | | | | | | | | | | | | | | | | | | | | | | | |
| 1 | Net of redemption fee received of $1,992, $9,068, $2,231, $11,556, $458 and $5,503, respectively. |
| 2 | Net of redemption fee received of $786, $127, $2,015, $3,488, $10,456 and $3,704, respectively. |
See Notes to Financial Statements
36
GREEN CENTURY BALANCED FUND INDIVIDUAL INVESTOR CLASS FINANCIAL HIGHLIGHTS
| | | | | | | | | | | | | | | | | | | | |
| | | FOR THE YEARS ENDED JULY 31, | |
| | | 2023 | | | 2022 | | | 2021 | | | 2020 | | | 2019 | |
Net Asset Value, beginning of year. | | $ | 32.93 | | | $ | 37.21 | | | $ | 30.83 | | | $ | 29.05 | | | $ | 27.05 | |
| | | | | | | | | | | | | | | | | | | | |
| Income (loss) from investment operations: | | | | | | | | | | | | | | | | | | | | |
Net investment income (loss) | | | 0.11 | | | | (0.01 | ) | | | 0.02 | | | | 0.11 | | | | 0.12 | |
Net realized and unrealized gain (loss) on investments | | | 1.05 | | | | (2.78 | ) | | | 7.51 | | | | 2.25 | | | | 2.50 | |
| | | | | | | | | | | | | | | | | | | | |
Total increase (decrease) from investment operations | | | 1.16 | | | | (2.79 | ) | | | 7.53 | | | | 2.36 | | | | 2.62 | |
| | | | | | | | | | | | | | | | | | | | |
| Less dividends: | | | | | | | | | | | | | | | | | | | | |
Dividends from net investment income | | | (0.09 | ) | | | — | | | | (0.02 | ) | | | (0.11 | ) | | | (0.11 | ) |
Distributions from net realized gains | | | (0.54 | ) | | | (1.49 | ) | | | (1.13 | ) | | | (0.47 | ) | | | (0.51 | ) |
| | | | | | | | | | | | | | | | | | | | |
Total decrease from dividends | | | (0.63 | ) | | | (1.49 | ) | | | (1.15 | ) | | | (0.58 | ) | | | (0.62 | ) |
| | | | | | | | | | | | | | | | | | | | |
Net Asset Value, end of year | | $ | 33.46 | | | $ | 32.93 | | | $ | 37.21 | | | $ | 30.83 | | | $ | 29.05 | |
| | | | | | | | | | | | | | | | | | | | |
Total return | | | 3.67 | % | | | (7.97 | )% | | | 24.86 | % | | | 8.19 | % | | | 10.04 | % |
| Ratios/Supplemental data: | | | | | | | | | | | | | | | | | | | | |
Net assets, end of year (in 000’s) | | $ | 279,640 | | | $ | 296,605 | | | $ | 323,991 | | | $ | 309,871 | | | $ | 276,487 | |
Ratio of expenses to average net assets | | | 1.46 | % | | | 1.46 | % | | | 1.46 | % | | | 1.47 | % | | | 1.48 | % |
Ratio of net investment income to average net assets | | | 0.35 | % | | | (0.03 | )% | | | 0.07 | % | | | 0.37 | % | | | 0.44 | % |
Portfolio turnover(a) | | | 21 | % | | | 9 | % | | | 17 | % | | | 25 | % | | | 19 | % |
| (a) | Calculated at Fund level. |
GREEN CENTURY BALANCED FUND INSTITUTIONAL CLASS FINANCIAL HIGHLIGHTS
| | | | | | | | | | | | |
| | | FOR THE YEARS
ENDED
JULY 31, | | | FOR THE PERIOD
NOVEMBER 30 , 2020
(COMMENCEMENT OF
OPERATIONS) TO
JULY 31, | |
| | | 2023 | | | 2022 | | | 2021 | |
Net Asset Value, beginning of period | | $ | 33.06 | | | $ | 37.27 | | | $ | 33.58 | |
| | | | | | | | | | | | |
Income (loss) from investment operations: | | | | | | | | | | | | |
Net investment income | | | 0.20 | | | | 0.08 | | | | 0.08 | |
Net realized and unrealized gain (loss) on investments | | | 1.07 | | | | (2.78 | ) | | | 4.78 | |
| | | | | | | | | | | | |
Total increase (decrease) from investment operations | | | 1.27 | | | | (2.70 | ) | | | 4.86 | |
| | | | | | | | | | | | |
Less dividends: | | | | | | | | | | | | |
Dividends from net investment income | | | (0.23 | ) | | | (0.02 | ) | | | (0.04 | ) |
Distributions from net realized gains | | | (0.54 | ) | | | (1.49 | ) | | | (1.13 | ) |
| | | | | | | | | | | | �� |
Total decrease from dividends. | | | (0.77 | ) | | | (1.51 | ) | | | (1.17 | ) |
| | | | | | | | | | | | |
Net Asset Value, end of period | | $ | 33.56 | | | $ | 33.06 | | | $ | 37.27 | |
| | | | | | | | | | | | |
Total return | | | 4.01 | % | | | (7.72 | )% | | | 14.89 | %(a) |
Ratios/Supplemental data: | | | | | | | | | | | | |
Net assets, end of period (in 000’s) | | $ | 114,950 | | | $ | 101,317 | | | $ | 86,347 | |
Ratio of expenses to average net assets | | | 1.16 | % | | | 1.16 | % | | | 1.16 | %(b) |
Ratio of net investment income to average net assets | | | 0.65 | % | | | 0.27 | % | | | 0.33 | %(b) |
Portfolio turnover(c) | | | 21 | % | | | 9 | % | | | 17 | %(a) |
| (c) | Calculated at Fund level. |
See Notes to Financial Statements
37
GREEN CENTURY EQUITY FUND INDIVIDUAL INVESTOR CLASS FINANCIAL HIGHLIGHTS
| | | | | | | | | | | | | | | | | | | | |
| | | FOR THE YEARS ENDED JULY 31, | |
| | | 2023 | | | 2022 | | | 2021 | | | 2020 | | | 2019 | |
Net Asset Value, beginning of year. | | $ | 64.46 | | | $ | 71.35 | | | $ | 52.23 | | | $ | 46.17 | | | $ | 43.16 | |
| | | | | | | | | | | | | | | | | | | | |
Income from investment operations: | | | | | | | | | | | | | | | | | | | | |
Net investment income | | | 0.23 | | | | 0.09 | | | | 0.09 | | | | 0.25 | | | | 0.25 | |
Net realized and unrealized gain (loss) on investments | | | 7.68 | | | | (6.11 | ) | | | 19.60 | | | | 6.16 | | | | 3.61 | |
| | | | | | | | | | | | | | | | | | | | |
Total increase (decrease) from investment operations | | | 7.91 | | | | (6.02 | ) | | | 19.69 | | | | 6.41 | | | | 3.86 | |
| | | | | | | | | | | | | | | | | | | | |
Less dividends: | | | | | | | | | | | | | | | | | | | | |
Dividends from net investment income | | | (0.18 | ) | | | (0.02 | ) | | | (0.06 | ) | | | (0.22 | ) | | | (0.21 | ) |
Distributions from net realized gains | | | (0.16 | ) | | | (0.85 | ) | | | (0.51 | ) | | | (0.13 | ) | | | (0.64 | ) |
| | | | | | | | | | | | | | | | | | | | |
Total decrease from dividends | | | (0.34 | ) | | | (0.87 | ) | | | (0.57 | ) | | | (0.35 | ) | | | (0.85 | ) |
| | | | | | | | | | | | | | | | | | | | |
Net Asset Value, end of year | | $ | 72.03 | | | $ | 64.46 | | | $ | 71.35 | | | $ | 52.23 | | | $ | 46.17 | |
| | | | | | | | | | | | | | | | | | | | |
Total return | | | 12.37 | % | | | (8.64 | )% | | | 37.90 | % | | | 13.95 | % | | | 9.33 | % |
Ratios/Supplemental data: | | | | | | | | | | | | | | | | | | | | |
Net assets, end of year (in 000’s) | | $ | 314,349 | | | $ | 301,668 | | | $ | 338,094 | | | $ | 265,946 | | | $ | 244,706 | |
Ratio of expenses to average net assets | | | 1.25 | % | | | 1.25 | % | | | 1.25 | % | | | 1.25 | % | | | 1.25 | % |
Ratio of net investment income to average net assets | | | 0.35 | % | | | 0.11 | % | | | 0.14 | % | | | 0.52 | % | | | 0.58 | % |
Portfolio turnover(a) | | | 4 | % | | | 5 | % | | | 9 | % | | | 10 | % | | | 14 | % |
| (a) | Calculated at Fund level. |
GREEN CENTURY EQUITY FUND INSTITUTIONAL CLASS FINANCIAL HIGHLIGHTS
| | | | | | | | | | | | | | | | | | | | |
| | | FOR THE YEARS ENDED JULY 31, | |
| | | 2023 | | | 2022 | | | 2021 | | | 2020 | | | 2019 | |
Net Asset Value, beginning of period | | $ | 64.13 | | | $ | 71.12 | | | $ | 52.10 | | | $ | 46.11 | | | $ | 43.16 | |
| | | | | | | | | | | | | | | | | | | | |
Income from investment operations: | | | | | | | | | | | | | | | | | | | | |
Net investment income | | | 0.42 | | | | 0.31 | | | | 0.30 | | | | 0.39 | | | | 0.39 | |
Net realized and unrealized gain (loss) on investments | | | 7.65 | | | | (6.13 | ) | | | 19.54 | | | | 6.16 | | | | 3.59 | |
| | | | | | | | | | | | | | | | | | | | |
Total increase (decrease) from investment operations | | | 8.07 | | | | (5.82 | ) | | | 19.84 | | | | 6.55 | | | | 3.98 | |
| | | | | | | | | | | | | | | | | | | | |
Less dividends: | | | | | | | | | | | | | | | | | | | | |
Dividends from net investment income | | | (0.45 | ) | | | (0.32 | ) | | | (0.31 | ) | | | (0.43 | ) | | | (0.39 | ) |
Distributions from net realized gains | | | (0.16 | ) | | | (0.85 | ) | | | (0.51 | ) | | | (0.13 | ) | | | (0.64 | ) |
| | | | | | | | | | | | | | | | | | | | |
Total decrease from dividends | | | (0.61 | ) | | | (1.17 | ) | | | (0.82 | ) | | | (0.56 | ) | | | (1.03 | ) |
| | | | | | | | | | | | | | | | | | | | |
Net Asset Value, end of period | | $ | 71.59 | | | $ | 64.13 | | | $ | 71.12 | | | $ | 52.10 | | | $ | 46.11 | |
| | | | | | | | | | | | | | | | | | | | |
Total return | | | 12.72 | % | | | (8.38 | )% | | | 38.33 | % | | | 14.28 | % | | | 9.65 | % |
Ratios/Supplemental data: | | | | | | | | | | | | | | | | | | | | |
Net assets, end of period (in 000’s) | | $ | 243,539 | | | $ | 213,705 | | | $ | 178,038 | | | $ | 94,039 | | | $ | 54,850 | |
Ratio of expenses to average net assets | | | 0.95 | % | | | 0.95 | % | | | 0.95 | % | | | 0.95 | % | | | 0.95 | % |
Ratio of net investment income to average net assets | | | 0.65 | % | | | 0.41 | % | | | 0.44 | % | | | 0.82 | % | | | 0.88 | % |
Portfolio turnover(a) | | | 4 | % | | | 5 | % | | | 9 | % | | | 10 | % | | | 14 | % |
| (a) | Calculated at Fund level. |
See Notes to Financial Statements
38
GREEN CENTURY MSCI INTERNATIONAL INDEX FUND INDIVIDUAL INVESTOR CLASS FINANCIAL HIGHLIGHTS
| | | | | | | | | | | | | | | | | | | | |
| | | FOR THE YEARS ENDED JULY 31, | |
| | | 2023 | | | 2022 | | | 2021 | | | 2020 | | | 2019 | |
Net Asset Value, beginning of period | | $ | 11.82 | | | $ | 14.94 | | | $ | 11.68 | | | $ | 11.07 | | | $ | 11.50 | |
| | | | | | | | | | | | | | | | | | | | |
Income (loss) from investment operations: | | | | | | | | | | | | | | | | | | | | |
Net investment income | | | 0.16 | | | | 0.19 | | | | 0.09 | | | | 0.10 | | | | 0.18 | |
Net realized and unrealized gain (loss) on investments | | | 1.23 | | | | (2.87 | ) | | | 3.27 | | | | 0.59 | | | | (0.40 | ) |
| | | | | | | | | | | | | | | | | | | | |
Total increase (decrease) from investment operations | | | 1.39 | | | | (2.68 | ) | | | 3.36 | | | | 0.69 | | | | (0.22 | ) |
| | | | | | | | | | | | | | | | | | | | |
Less dividends: | | | | | | | | | | | | | | | | | | | | |
Dividends from net investment income | | | (0.14 | ) | | | (0.18 | ) | | | (0.10 | ) | | | (0.08 | ) | | | (0.16 | ) |
Distributions from net realized gains | | | — | | | | (0.26 | ) | | | — | | | | — | | | | (0.05 | ) |
| | | | | | | | | | | | | | | | | | | | |
Total decrease from dividends | | | (0.14 | ) | | | (0.44 | ) | | | (0.10 | ) | | | (0.08 | ) | | | (0.21 | ) |
| | | | | | | | | | | | | | | | | | | | |
Net Asset Value, end of period | | $ | 13.07 | | | $ | 11.82 | | | $ | 14.94 | | | $ | 11.68 | | | $ | 11.07 | |
| | | | | | | | | | | | | | | | | | | | |
Total return | | | 11.83 | % | | | (18.36 | )% | | | 28.76 | % | | | 6.28 | % | | | (1.82 | )% |
Ratios/Supplemental data: | | | | | | | | | | | | | | | | | | | | |
Net assets, end of period (in 000’s) | | $ | 52,275 | | | $ | 47,435 | | | $ | 46,508 | | | $ | 29,073 | | | $ | 22,110 | |
Ratio of expenses to average net assets | | | 1.28 | % | | | 1.28 | % | | | 1.28 | % | | | 1.28 | % | | | 1.28 | % |
Ratio of net investment income to average net assets | | | 1.34 | % | | | 1.55 | % | | | 0.77 | % | | | 0.98 | % | | | 1.79 | % |
Portfolio turnover(a) | | | 42 | % | | | 29 | % | | | 31 | % | | | 20 | % | | | 23 | % |
| (a) | Calculated at Fund level. |
GREEN CENTURY MSCI INTERNATIONAL INDEX FUND INSTITUTIONAL CLASS
FINANCIAL HIGHLIGHTS
| | | | | | | | | | | | | | | | | | | | |
| | | FOR THE YEARS ENDED JULY 31, | |
| | | 2023 | | | 2022 | | | 2021 | | | 2020 | | | 2019 | |
Net Asset Value, beginning of period | | $ | 11.78 | | | $ | 14.90 | | | $ | 11.66 | | | $ | 11.07 | | | $ | 11.50 | |
| | | | | | | | | | | | | | | | | | | | |
Income (loss) from investment operations: | | | | | | | | | | | | | | | | | | | | |
Net investment income | | | 0.19 | | | | 0.24 | | | | 0.13 | | | | 0.13 | | | | 0.21 | |
Net realized and unrealized gain (loss) on investments | | | 1.23 | | | | (2.86 | ) | | | 3.26 | | | | 0.59 | | | | (0.38 | ) |
| | | | | | | | | | | | | | | | | | | | |
Total increase (decrease) from investment operations | | | 1.42 | | | | (2.62 | ) | | | 3.39 | | | | 0.72 | | | | (0.17 | ) |
| | | | | | | | | | | | | | | | | | | | |
Less dividends: | | | | | | | | | | | | | | | | | | | | |
Dividends from net investment income | | | (0.19 | ) | | | (0.24 | ) | | | (0.15 | ) | | | (0.13 | ) | | | (0.21 | ) |
Distributions from net realized gains | | | — | | | | (0.26 | ) | | | — | | | | — | | | | (0.05 | ) |
| | | | | | | | | | | | | | | | | | | | |
Total decrease from dividends | | | (0.19 | ) | | | (0.50 | ) | | | (0.15 | ) | | | (0.13 | ) | | | (0.26 | ) |
| | | | | | | | | | | | | | | | | | | | |
Net Asset Value, end of period | | $ | 13.01 | | | $ | 11.78 | | | $ | 14.90 | | | $ | 11.66 | | | $ | 11.07 | |
| | | | | | | | | | | | | | | | | | | | |
Total return | | | 12.15 | % | | | (18.05 | )% | | | 29.09 | % | | | 6.51 | % | | | (1.43 | )% |
Ratios/Supplemental data: | | | | | | | | | | | | | | | | | | | | |
Net assets, end of period (in 000’s) | | $ | 135,514 | | | $ | 115,620 | | | $ | 112,002 | | | $ | 61,608 | | | $ | 42,012 | |
Ratio of expenses to average net assets | | | 0.98 | % | | | 0.98 | % | | | 0.98 | % | | | 0.98 | % | | | 0.98 | % |
Ratio of net investment income to average net assets | | | 1.64 | % | | | 1.85 | % | | | 1.07 | % | | | 1.28 | % | | | 2.09 | % |
Portfolio turnover(a) | | | 42 | % | | | 29 | % | | | 31 | % | | | 20 | % | | | 23 | % |
| (a) | Calculated at Fund level. |
See Notes to Financial Statements
39
| | |
GREEN CENTURY FUNDS NOTES TO FINANCIAL STATEMENTS | | |
NOTE 1 — Organization and Significant Accounting Policies
Green Century Funds (the “Trust”) is a Massachusetts business trust which offers three separate series, the Green Century Balanced Fund (the “Balanced Fund”), the Green Century Equity Fund (the “Equity Fund”) and the Green Century MSCI International Index Fund (the “MSCI International Index Fund”), each a “Fund” and collectively, the “Funds”. The Trust is registered under the Investment Company Act of 1940, as amended (the “Act”), as an open-end, diversified management investment company. The Trust accounts separately for the assets, liabilities and operations of each series. The Balanced Fund Investor Share Class commenced operations on March 18, 1992, the Balanced Fund Institutional Share Class commenced operations on November 30, 2020, the Equity Fund Individual Investor Share Class commenced operations on September 13, 1995, the Equity Fund Institutional Share Class commenced operations on April 30, 2018, and the Individual Investor Share Class and Institutional Share Class of the MSCI International Index Fund commenced operations on September 30, 2016.
The preparation of financial statements in conformity with U.S. generally accepted accounting principles (“U.S. GAAP”) requires management to make estimates and assumptions that affect the reported amounts of assets and liabilities and disclosure of contingent assets and liabilities at the date of the financial statements and the reported amounts of revenues and expenses during the reporting period. Actual results could differ from those estimates.
Each Fund is an investment company and accordingly follows the investment company accounting and reporting guidance of the Financial Accounting Standards Board (the “FASB”) Accounting Standard Codification Topic 946 “Financial Services—Investment Companies”.
The following is a summary of the Funds’ significant accounting policies:
| | (A) | Investment Valuation: Equity securities listed on U.S. national securities exchanges other than NASDAQ are valued at last sale price. If a last sale price is not available, securities listed on U.S. national exchanges other than NASDAQ are valued at the mean between the closing bid and closing ask prices. NASDAQ National Market® and SmallCapSM securities are valued at the NASDAQ Official Closing Price (“NOCP”). The NOCP is based on the last traded price if it falls within the concurrent best bid and ask prices and is normalized pursuant to NASDAQ’s published procedures if it falls outside this range. If a NOCP is not available for any such security, the security is valued at the last sale price, or, if there have been no sales that day, at the mean between the closing bid and closing ask prices. Unlisted U.S. equity securities are valued at last sale price, or when last sale prices are not available, at the last quoted bid price. Debt securities (other than certificates of deposit and short-term obligations maturing in sixty days or less) are valued on the basis of valuations furnished by an independent pricing service which takes into account appropriate factors such as institution-size trading in similar groups of securities, yield, quality, coupon rate, maturity, type of issue, and other market data, without exclusive reliance on quoted prices or exchange or over-the-counter prices. Certificates of deposit are valued at cost plus accrued interest, and short-term obligations maturing in sixty days or less are valued at amortized cost, both of which approximate market value. Securities, if any, for which there are no such valuations or quotations available, or for which the market quotation or valuation provided by a pricing service is deemed not reliable, are valued at fair value by management as determined in good faith under guidelines established by the Trustees. Effective September 8, 2022, pursuant to Rule 2a-5 under the 1940 Act, the Board of Trustees has designated Green Century Capital Management, Inc. (“GCCM”) as a valuation designee (the “Valuation Designee”) to determine the fair value, in good faith, of securities and other instruments for which no readily available market quotation exists. As Valuation Designee, GCCM is responsible for the supervision and implementation of the valuation process with respect to the Funds. GCCM |
40
| | |
GREEN CENTURY FUNDS NOTES TO FINANCIAL STATEMENTS | | continued |
| | will, among other things, (1) assess and manage material risks associated with fair value determinations; (2) select, apply and test fair value methodologies; and (3) oversee and evaluate pricing services used. |
For non-U.S. securities traded in foreign markets, the MSCI International Index Fund uses a fair value model developed by an independent pricing service to assist in valuing those securities. If an event occurs after the time at which the market for foreign securities held by the Fund closes but before the time that the Fund’s next NAV is calculated, such event may cause the closing price on the foreign exchange to not represent the readily available reliable market value quotation for such securities at the time the Fund determines its NAV. In such a case, the Fund will use the fair value of such securities as determined under the Fund’s valuation procedures. Events after the close of trading on a foreign market that could require a Fund to fair value some or all of its foreign securities include, among others, securities trading in the U.S. and other markets, corporate announcements, natural and other disasters, and political and other events. Among other elements of analysis in the determination of a security’s fair value, the Board has authorized the use of one or more independent research services to assist with such determinations. An independent research service may use statistical analyses and quantitative models to help determine fair value as of the time the Fund calculates its NAV. There can be no assurance that such models accurately reflect the behavior of the applicable markets or the effect of the behavior of such markets on the fair value of securities, or that such markets will continue to behave in a fashion that is consistent with such models. Unlike the closing price of a security on an exchange, fair value determinations employ elements of judgment. Consequently, the fair value assigned to a security may not represent the actual value that the Fund could obtain if it were to sell the security at the time of the close of the NYSE. Pursuant to procedures adopted by the Board, the Fund is not obligated to use the fair valuations suggested by any research service, and valuation recommendations provided by such research services may be overridden if other events have occurred or if other fair valuations are determined in good faith to be more accurate. Unless an event is such that it causes the Fund to determine that the closing prices for one or more securities do not represent readily available reliable market value quotations at the time the Fund determines its NAV, events that occur between the time of the close of the foreign market on which they are traded and the close of regular trading on the NYSE will not be reflected in the Fund’s NAV.
Various inputs are used in determining the value of the Fund’s investments. These inputs are summarized in the three broad levels listed below:
Level 1 — quoted prices for active markets for identical securities. An active market for the security is a market in which transactions occur with sufficient frequency and volume to provide pricing information on an ongoing basis. A quoted price in an active market provides the most reliable evidence of fair value.
Level 2 — other significant observable inputs (including quoted prices for similar securities, interest rates, prepayment speeds, credit risk, etc.). Examples of level 2 inputs include 1) quoted prices for identical or similar assets in markets that are not active 2) investments valued at amortized cost and 3) investments valued with inputs that are derived principally from or corroborated by observable market data. An adjustment to any observable input that is significant to the fair value may render the measurement a Level 3 measurement.
Level 3 — significant unobservable inputs, including the Funds’ own assumptions in determining the fair value of investments.
In some cases, the inputs used to measure the fair value of an asset or a liability might be categorized within different levels of the fair value hierarchy. In those cases, the fair value measurement is categorized in its entirety in the same level of the fair value hierarchy as the lowest level input that is significant to the entire measurement. The inputs or methodology used for valuing securities are not necessarily an indication of the risk associated with investing in those securities.
41
| | |
GREEN CENTURY FUNDS NOTES TO FINANCIAL STATEMENTS | | continued |
The following is a summary of the inputs used to value the Balanced Fund’s net assets as of July 31, 2023:
| | | | | | | | | | | | | | | | |
| | | LEVEL 1 | | | LEVEL 2 | | | LEVEL 3 | | | TOTAL | |
COMMON STOCKS | | $ | 242,962,465 | | | $ | — | | | $ | — | | | $ | 242,962,465 | |
BONDS & NOTES | | | — | | | | 148,354,137 | | | | — | | | | 148,354,137 | |
SHORT-TERM OBLIGATIONS | | | 2,359,202 | | | | — | | | | — | | | | 2,359,202 | |
| | | | | | | | | | | | | | | | |
TOTAL | | $ | 245,321,667 | | | $ | 148,354,137 | | | $ | — | | | $ | 393,675,804 | |
| | | | | | | | | | | | | | | | |
The following is a summary of the inputs used to value the Equity Fund’s net assets as of July 31, 2023:
| | | | | | | | | | | | | | | | |
| | | LEVEL 1 | | | LEVEL 2 | | | LEVEL 3 | | | TOTAL | |
COMMON STOCKS | | $ | 557,002,406 | | | $ | — | | | $ | — | | | $ | 557,002,406 | |
SHORT-TERM OBLIGATIONS | | | 780,494 | | | | — | | | | — | | | | 780,494 | |
| | | | | | | | | | | | | | | | |
TOTAL | | $ | 557,782,900 | | | $ | — | | | $ | — | | | $ | 557,782,900 | |
| | | | | | | | | | | | | | | | |
The following is a summary of the inputs used to value the MSCI International Index Fund’s net assets as of July 31, 2023:
| | | | | | | | | | | | | | | | |
| | | LEVEL 1 | | | LEVEL 2 | | | LEVEL 3 | | | TOTAL | |
JAPAN | | $ | — | | | $ | 41,237,711 | | | $ | — | | | $ | 41,237,711 | |
CANADA | | | 21,003,219 | | | | — | | | | — | | | | 21,003,219 | |
FRANCE | | | — | | | | 19,299,999 | | | | — | | | | 19,299,999 | |
UNITED KINGDOM | | | — | | | | 17,602,795 | | | | — | | | | 17,602,795 | |
NETHERLANDS | | | — | | | | 17,308,753 | | | | — | | | | 17,308,753 | |
DENMARK | | | — | | | | 13,947,632 | | | | — | | | | 13,947,632 | |
SWITZERLAND | | | 821,680 | | | | 11,935,791 | | | | — | | | | 12,757,471 | |
GERMANY | | | — | | | | 11,165,705 | | | | — | | | | 11,165,705 | |
AUSTRALIA | | | — | | | | 9,269,098 | | | | — | | | | 9,269,098 | |
HONG KONG | | | — | | | | 6,709,820 | | | | — | | | | 6,709,820 | |
IRELAND | | | 2,547,471 | | | | 558,488 | | | | — | | | | 3,105,959 | |
ITALY | | | — | | | | 2,712,464 | | | | — | | | | 2,712,464 | |
SWEDEN | | | — | | | | 2,638,062 | | | | — | | | | 2,638,062 | |
FINLAND | | | — | | | | 2,334,171 | | | | — | | | | 2,334,171 | |
SPAIN | | | — | | | | 1,705,805 | | | | — | | | | 1,705,805 | |
NORWAY | | | — | | | | 1,515,176 | | | | — | | | | 1,515,176 | |
BELGIUM | | | — | | | | 1,065,495 | | | | — | | | | 1,065,495 | |
SINGAPORE | | | — | | | | 749,401 | | | | — | | | | 749,401 | |
NEW ZEALAND | | | — | | | | 351,462 | | | | — | | | | 351,462 | |
| | | | | | | | | | | | | | | | |
TOTAL | | $ | 24,372,370 | | | $ | 162,107,828 | | | $ | — | | | $ | 186,480,198 | |
| | | | | | | | | | | | | | | | |
There were no transfers into or out of Level 3 during the reporting period.
| | (B) | Securities Transactions and Investment Income: Securities transactions are recorded on a trade date basis. Realized gains and losses from securities transactions are determined using the identified cost basis. Interest income, including amortization of premiums and accretion of discounts on bonds, is recognized on the accrual |
42
| | |
GREEN CENTURY FUNDS NOTES TO FINANCIAL STATEMENTS | | continued |
| | basis and dividend income is recorded on ex-dividend date. Income, expenses and realized and unrealized gains and losses on investments are allocated to each class of shares in proportion to their relative shares outstanding. |
| | (C) | Currency Translation and Contracts: Securities and other assets and liabilities denominated in foreign currencies are translated into U.S. dollar amounts on the date of valuation. Purchases and sales of securities, and income and expense items denominated in foreign currencies, are translated into U.S. dollar amounts on the respective dates of such transactions. Occasionally, events impact the availability or reliability of foreign exchange rates used to convert the U.S. dollar equivalent value. If such an event occurs, the foreign exchange rate will be valued at fair value using procedures established and approved by the Board of Trustees. The Funds do not separately report the effect of fluctuations in foreign exchange rates from changes in market prices on securities held. Such fluctuations are included with the net realized and unrealized gain or loss from investments. Realized foreign exchange gains or losses arise from sales of foreign currencies, currency gains or losses realized between the trade and settlement dates on securities transactions, and the difference between the recorded amounts of dividends, interest, and foreign withholding taxes and the U.S. dollar equivalent of the amounts actually received or paid. Net unrealized foreign exchange gains and losses arise from changes in fair value of assets and liabilities other than investments in securities held at the end of the reporting period, resulting from changes in exchange rates. When a Fund purchases or sells foreign securities, it enters into foreign exchange contracts to minimize foreign exchange risk from the trade date to the settlement date of the transactions. A foreign exchange contract is an agreement between two parties to exchange different currencies at an agreed-upon exchange rate on a specified date. No Funds had open foreign currency spot contracts outstanding as of July 31, 2023. |
| | | Cash, including cash denominated in foreign currencies, represents cash on hand held at major financial institutions and is subject to credit risk to the extent the balance exceeds applicable Federal Deposit Insurance Corporation (FDIC) or Securities Investor Protection Corporation (SIPC) limitations. |
| | (D) | Distributions: Distributions to shareholders are recorded on the ex-dividend date. The Funds declare and pay dividends of net investment income, if any, semi-annually and distribute net realized capital gains, if any, annually. The amount and character of income and net realized gains to be distributed are determined in accordance with Federal income tax rules and regulations, which may differ from U.S. GAAP. To the extent that these differences are attributable to permanent book and tax accounting differences, the components of net assets have been adjusted. |
| | (E) | Federal Taxes: Each series of the Trust is treated as a separate entity for Federal income tax purposes. Each Fund’s policy is to comply with the provisions of the Internal Revenue Code applicable to regulated investment companies (“RICs”). Accordingly, no provisions for Federal income or excise tax are necessary. |
| | | U.S. GAAP requires that all entities, including pass-through entities such as the Funds, establish a minimum threshold for financial statement recognition of the benefit of positions taken in filing tax returns (including whether an entity is taxable in a particular jurisdiction). The Funds recognize tax benefits only if it is more likely than not that a tax position (including the Funds’ assertion that their income is exempt from tax) will be sustained upon examination. The Funds had no material uncertain tax positions and have not recorded a liability for unrecognized tax benefits as of July 31, 2023. Also, the Funds had recognized no interest and penalties related to uncertain tax benefits through July 31, 2023. At July 31, 2023, the tax years 2020 through 2023 remain open to examination by the Internal Revenue Service. |
| | (F) | Redemption Fee: A 2.00% redemption fee is retained by the Funds to offset the effect of transaction costs and other expenses associated with short-term investing. The fee is imposed on redemptions or exchanges of shares held 60 days or less from their purchase date. For the year ended July 31, 2023, the Balanced Fund, Equity Fund and MSCI International Index Fund received $2,778, $4,246, and $10,914 respectively, in redemption fees. Redemption fees are recorded as an adjustment to paid-in capital. |
43
| | |
GREEN CENTURY FUNDS NOTES TO FINANCIAL STATEMENTS | | continued |
| | (G) | Indemnification: The Funds’ organizational documents provide that trustees and officers are indemnified against certain liabilities arising out of the performance of their duties to the Funds. In the normal course of business, the Funds may also enter into contracts that provide general indemnifications. The Funds’ maximum exposure under these arrangements is unknown as this would be dependent on future claims that may be made against the Funds. The risk of material loss from such claims is considered remote. As of July 31, 2023, no liability has been accrued. |
| | (H) | Offsetting of Assets and Liabilities: As of July 31, 2023, there are no master netting arrangements related to the Funds. The Funds’ Statements of Assets and Liabilities present derivative instruments on a gross basis, if applicable. As of July 31, 2023, no derivative instruments were held by the Funds. |
NOTE 2 — Transactions With Affiliates
| | (A) | Investment Adviser: GCCM is the adviser (“the Adviser”) for the Funds. Green Century is owned by Paradigm Partners. Green Century oversees the portfolio management of the Funds on a day-to-day basis. Green Century’s investment advisory fee paid by the Balanced Fund shall be equal on an annual basis to 0.65% of the average daily net assets of the Fund up to $250 million and 0.60% of the value of the average daily net assets of the Fund in excess of $250 million, accrued daily and paid monthly. The Equity Fund pays Green Century a fee, accrued daily and paid monthly, at an annual rate of 0.25% of the Equity Fund’s average daily net assets up to but not including $100 million, 0.22% of average daily net assets including $100 million up to but not including $500 million, 0.17% of average daily net assets including $500 million up to but not including $1 billion and 0.12% of average daily net assets equal to or in excess of $1 billion. The MSCI International Index Fund pays Green Century a fee, accrued daily and paid monthly, at an annual rate of 0.28% of the MSCI International Index Fund’s average daily net assets. |
| | (B) | Subadvisers: Trillium Asset Management, LLC (“Trillium”) is the subadviser for the Balanced Fund. Trillium’s investment subadvisory fee with respect to the Fund shall be equal on an annual basis to 0.40% of the value of the average daily net assets of the Fund up to $30 million, 0.35% of the value of the average daily net assets of the Fund in excess of $30 million up to $250 million, and 0.30% of the value of the average daily net assets of the Fund in excess of $250 million. For the year ended July 31, 2023, Green Century accrued fees of $1,291,494 to Trillium. Northern Trust Investments, Inc. (“Northern Trust”) is the subadviser for the Equity Fund and MSCI International Index Fund. For the Equity Fund, Northern Trust is paid a fee by the Adviser based on Northern Trust’s fee schedule of the greater of $75,000 or 0.10% of the value of the average daily net assets of the Fund up to but not including $50 million, 0.05% of the average daily net assets of the Fund from and including $50 million up to but not including $100 million and 0.03% of the average daily net assets of the Fund equal to or in excess of $100 million for its services. For the MSCI International Index Fund, Northern Trust is paid a fee by the Adviser based on Northern Trust’s fee schedule of the greater of $100,000 or 0.17% of the value of the average daily net assets of the Fund up to but not including $50 million, 0.12% of the average daily net assets of the Fund from and including $50 million up to but not including $100 million and 0.08% of the average daily net assets of the Fund equal to or in excess of $100 million for its services. For the year ended July 31, 2023, Green Century accrued fees of $195,185 and $203,192 to Northern Trust for the Equity Fund and the MSCI International Index Fund, respectively. |
| | (C) | Administrator: Green Century is the administrator (“the Administrator”) of the Green Century Funds. Pursuant to the Administrative Services Agreement, Green Century pays all the expenses of each Fund other than the investment advisory fees; interest; taxes; brokerage costs and other capital expenses; expenses of non-interested trustees (including counsel fees) and any extraordinary expenses. The Balanced Fund pays Green Century a fee at a rate such that immediately following any payment to the Administrator, the total operating expenses of the Fund, on an annual basis, do not exceed 1.48% of the Fund’s Individual Investor |
44
| | |
GREEN CENTURY FUNDS NOTES TO FINANCIAL STATEMENTS | | continued |
| | Class average daily net assets up to and including $250 million and 1.43% of the Fund’s Individual Investor Class average daily net assets in excess of $250 million, and 1.18% of the Fund’s Institutional Class average daily net assets up to and including $250 million and 1.13% of the Fund’s Institutional Class average daily net assets in excess of $250 million. The Equity Fund pays Green Century a fee at a rate such that immediately following any payment to the Administrator, the total operating expenses of the Fund, on an annual basis, do not exceed 1.25% of the Fund’s Individual Investor Class average daily net assets, and 0.95% of the Fund’s Institutional Class average daily net assets. The MSCI International Index Fund pays Green Century a fee at a rate such that immediately following any payment to the Administrator, the total operating expenses of the Fund, on an annual basis, do not exceed 1.28% of the Fund’s Individual Investor Class average daily net assets, and 0.98% of the Fund’s Institutional Class average daily net assets. |
| | (D) | Subadministrator: Pursuant to a Subadministrative and Fund Accounting Services Agreement with the Administrator, UMB Fund Services, Inc. (“UMBFS”) as Subadministrator and Fund Accountant, is responsible for conducting fund accounting and certain day-to-day administration of the Trust subject to the supervision and direction of the Administrator. For the year ended July 31, 2023, Green Century accrued fees of $253,337, $311,730, and $141,903 to UMBFS related to services performed on behalf of the Balanced Fund, the Equity Fund, and the MSCI International Index Fund, respectively. |
| | (E) | Index Agreements: The Equity Fund invests in the securities of the companies included in the MSCI KLD 400 Social ex Fossil Fuels Index (the “KLD Index”). The Index is owned and maintained by MSCI ESG Research (“MSCI”). For the use of the KLD Index for the Equity Fund, MSCI is paid by the Adviser an annual license fee of $27,370, plus the greater of $26,000 or at an annual rate of 0.05% on the first $100 million of average daily net assets, 0.04% on the next $100 million of average daily net assets, and 0.03% on average daily net assets in excess of $200 million. The MSCI International Index Fund invests in the securities included in the MSCI World ex USA SRI ex Fossil Fuels Index (the “World Index”). The Index is owned and maintained by MSCI. For the use of the World Index for the MSCI International Index Fund, MSCI is paid by the Adviser an annual license fee of $27,820, plus the greater of $25,000 or at an annual rate of 0.05% on the first $100 million of average daily net assets, 0.04% on the next $100 million of average daily net assets, and 0.03% on average daily net assets in excess of $200 million. For the year ended July 31, 2023, Green Century accrued fees of $207,555 and $106,916 to MSCI for the Equity Fund and MSCI International Index Fund, respectively. |
NOTE 3 — Investment Transactions
For the year ended July 31, 2023, the Balanced Fund’s cost of purchases and proceeds from sales of securities, other than short-term securities, aggregated $78,859,759 and $92,198,363 respectively. The Equity Fund’s cost of purchases and proceeds from sales of securities, other than short-term securities, aggregated $21,816,565 and $37,468,620, respectively. The MSCI International Index Fund’s cost of purchases and proceeds from sales of securities, other than short-term securities, aggregated $78,700,999 and $71,769,518, respectively.
45
| | |
GREEN CENTURY FUNDS NOTES TO FINANCIAL STATEMENTS | | continued |
NOTE 4 — Federal Income Tax Information
The tax basis of the components of distributable net earnings (deficit) at July 31, 2023 were as follows:
| | | | | | | | | | | | |
| | | BALANCED FUND | | | EQUITY FUND | | | MSCI INTERNATIONAL
INDEX FUND | |
Undistributed Ordinary Income | | $ | 862,052 | | | $ | 44,604 | | | $ | 88,514 | |
Undistributed Long-Term Capital Gains | | | 8,654,513 | | | | — | | | | — | |
| | | | | | | | | | | | |
Tax accumulated earnings | | | 9,516,565 | | | | 44,604 | | | | 88,514 | |
| | | | | | | | | | | | |
Accumulated Capital and Other Losses | | | — | | | | (1,720,195 | ) | | | (4,515,730 | ) |
Unrealized Appreciation (Depreciation) | | | 101,413,231 | | | | 294,520,103 | | | | 17,771,162 | |
Foreign currency translations | | | — | | | | — | | | | 3,450 | |
| | | | | | | | | | | | |
Distributable net earnings (deficit) | | $ | 110,929,796 | | | $ | 292,844,512 | | | $ | 13,347,396 | |
| | | | | | | | | | | | |
As of July 31, 2023, the Funds had net capital loss carryovers as follows:
| | | | | | | | | | | | |
| | | BALANCED FUND | | | EQUITY FUND | | | MSCI INTERNATIONAL
INDEX FUND | |
Not subject to expiration: | | | | | | | | | | | | |
Short Term | | $ | — | | | $ | 1,097,362 | | | $ | 1,178,307 | |
Long Term | | | — | | | | 622,833 | | | | 3,337,423 | |
| | | | | | | | | | | | |
| | $ | — | | | $ | 1,720,195 | | | $ | 4,515,730 | |
| | | | | | | | | | | | |
To the extent that the Fund realizes future net capital gains, those gains will be offset by any unused capital loss carryforwards.
The tax character of distributions paid during the fiscal year ended July 31, 2023 and the year ended July 31, 2022 were as follows:
| | | | | | | | | | | | | | | | |
| | | BALANCED FUND | | | EQUITY FUND | |
| | | YEAR ENDED
JULY 31, 2023 | | | YEAR ENDED
JULY 31, 2022 | | | YEAR ENDED
JULY 31, 2023 | | | YEAR ENDED
JULY 31, 2022 | |
Ordinary income | | $ | 1,829,536 | | | $ | 2,224,717 | | | $ | 2,391,471 | | | $ | 1,971,818 | |
Long-term capital gains | | | 6,110,122 | | | | 14,741,440 | | | | 1,235,177 | | | | 5,344,361 | |
| | | |
| | | MSCI INTERNATIONAL
INDEX FUND | | | | | | | |
| | | YEAR ENDED
JULY 31, 2023 | | | YEAR ENDED
JULY 31, 2022 | | | | | | | |
Ordinary income | | $ | 2,583,158 | | | $ | 3,753,140 | | | | | | | | | |
Long-term capital gains | | | — | | | | 1,977,811 | | | | | | | | | |
46
| | |
GREEN CENTURY FUNDS NOTES TO FINANCIAL STATEMENTS | | continued |
NOTE 5 — Capital Share Transactions
Capital Share transactions for the Balanced Fund, the Equity Fund and the MSCI International Index Fund were as follows:
| | | | | | | | |
| | | BALANCED FUND
INDIVIDUAL INVESTOR CLASS | | | BALANCED FUND
INDIVIDUAL INVESTOR CLASS | |
| | | YEAR ENDED JULY 31, 2023 | | | YEAR ENDED JULY 31, 2022 | |
Shares sold | | | 659,838 | | | | 1,261,887 | |
Reinvestment of dividends | | | 172,036 | | | | 336,823 | |
Shares redeemed | | | (1,482,413 | ) | | | (1,297,432 | ) |
| | | | | | | | |
| | | (650,539 | ) | | | 301,278 | |
| | | | | | | | |
| | |
| | | BALANCED FUND
INSTITUTIONAL CLASS | | | BALANCED FUND
INSTITUTIONAL CLASS | |
| | | YEAR ENDED JULY 31, 2023 | | | YEAR ENDED JULY 31, 2022 | |
Shares sold | | | 706,910 | | | | 848,497 | |
Reinvestment of dividends | | | 76,667 | | | | 105,258 | |
Shares redeemed | | | (422,414 | ) | | | (206,135 | ) |
| | | | | | | | |
| | | 361,163 | | | | 747,620 | |
| | | | | | | | |
| | |
| | | EQUITY FUND
INDIVIDUAL INVESTOR CLASS | | | EQUITY FUND
INDIVIDUAL INVESTOR CLASS | |
| | | YEAR ENDED
JULY 31, 2023 | | | YEAR ENDED
JULY 31, 2022 | |
Shares sold | | | 368,022 | | | | 538,236 | |
Reinvestment of dividends | | | 24,647 | | | | 51,303 | |
Shares redeemed | | | (708,605 | ) | | | (647,575 | ) |
| | | | | | | | |
| | | (315,936 | ) | | | (58,036 | ) |
| | | | | | | | |
| | |
| | | EQUITY FUND
INSTITUTIONAL CLASS | | | EQUITY FUND
INSTITUTIONAL CLASS | |
| | | YEAR ENDED JULY 31, 2023 | | | YEAR ENDED JULY 31, 2022 | |
Shares sold | | | 608,167 | | | | 1,249,076 | |
Reinvestment of dividends | | | 29,829 | | | | 41,391 | |
Shares redeemed | | | (568,124 | ) | | | (461,512 | ) |
| | | | | | | | |
| | | 69,872 | | | | 828,955 | |
| | | | | | | | |
47
| | |
GREEN CENTURY FUNDS NOTES TO FINANCIAL STATEMENTS | | concluded |
| | | | | | | | |
| | | MSCI INTERNATIONAL INDEX
INDIVIDUAL INVESTOR
CLASS | | | MSCI INTERNATIONAL INDEX
INDIVIDUAL INVESTOR
CLASS | |
| | | YEAR ENDED JULY 31, 2023 | | | YEAR ENDED JULY 31, 2022 | |
Shares sold | | | 752,806 | | | | 1,282,266 | |
Reinvestment of dividends | | | 45,903 | | | | 112,334 | |
Shares redeemed | | | (809,959 | ) | | | (496,937 | ) |
| | | | | | | | |
| | | (11,250 | ) | | | 897,663 | |
| | | | | | | | |
| | |
| | | MSCI INTERNATIONAL
INDEX INSTITUTIONAL
CLASS | | | MSCI INTERNATIONAL
INDEX INSTITUTIONAL
CLASS | |
| | | YEAR ENDED JULY 31, 2023 | | | YEAR ENDED JULY 31, 2022 | |
Shares sold | | | 2,414,096 | | | | 3,386,081 | |
Reinvestment of dividends | | | 161,410 | | | | 309,058 | |
Shares redeemed | | | (1,970,946 | ) | | | (1,395,350 | ) |
| | | | | | | | |
| | | 604,560 | | | | 2,299,789 | |
| | | | | | | | |
NOTE 6 — Market Risks and Geopolitical Risks
Certain local, regional or global events such as war, acts of terrorism, the spread of infectious illness or other public health issues, or other events could have a significant impact on a security or instrument. In March 2020, a pandemic related to COVID-19 was declared. The pandemic represents a market risk factor including uncertainty in the financial markets. Following Russia’s large-scale invasion of Ukraine, the President of the United States signed an Executive Order in February 2022 prohibiting U.S. persons from entering transactions with the Central Bank of Russia and Executive Orders in March 2022 prohibiting U.S. persons from importing oil and gas from Russia as well as other popular Russian exports, such as diamonds, seafood and vodka. There may also be restrictions on investments in Chinese companies. For example, the President of the United States of America signed an Executive Order in June 2021 affirming and expanding the U.S. policy prohibiting U.S. persons from purchasing or investing in publicly-traded securities of companies identified by the U.S. Government as “Chinese Military-Industrial Complex Companies.” The list of such companies can change from time to time, and as a result of forced selling or an inability to participate in an investment the Adviser otherwise believes is attractive, the Funds may incur losses. The duration of the coronavirus outbreak and the Russian-Ukraine conflict could adversely affect the Funds’ performance, the performance of the securities in which the Fund invests and may lead to losses on your investment. The ultimate impact of COVID-19 and Russia Invasion on the financial performance of the Funds’ investments is not reasonably estimable at this time. Green Century will continue to monitor market conditions as information is available and evaluate the potential impacts, if any, on the value of its investments.
NOTE 7 — Subsequent Events
Subsequent to July 31, 2023 and through the date on which the financial statements were available for issuance, management has evaluated subsequent events requiring disclosure.
There were no events requiring accrual or disclosure.
48
REPORT OF INDEPENDENT REGISTERED PUBLIC ACCOUNTING FIRM
| | |
 | | KPMG LLP Two Financial Center 60 South Street Boston, MA 02111 |
To the Shareholders and Board of Trustees
Green Century Funds:
Opinion on the Financial Statements
We have audited the accompanying statements of assets and liabilities of Green Century Balanced Fund, Green Century Equity Fund, and Green Century MSCI International Index Fund, each a series of Green Century Funds (the Funds), including the portfolios of investments, as of July 31, 2023, the related statements of operations for the year then ended, the statements of changes in net assets for each of the years in the two-year period then ended, and the related notes (collectively, the financial statements) and the financial highlights for each of the years or periods in the five-year period then ended. In our opinion, the financial statements and financial highlights present fairly, in all material respects, the financial position of the Funds as of July 31, 2023, the results of their operations for the year then ended, the changes in their net assets for each of the years in the two-year period then ended, and the financial highlights for each of the years or periods in the five-year period then ended, in conformity with U.S. generally accepted accounting principles.
Basis for Opinion
These financial statements and financial highlights are the responsibility of the Funds’ management. Our responsibility is to express an opinion on these financial statements and financial highlights based on our audits. We are a public accounting firm registered with the Public Company Accounting Oversight Board (United States) (PCAOB) and are required to be independent with respect to the Funds in accordance with the U.S. federal securities laws and the applicable rules and regulations of the Securities and Exchange Commission and the PCAOB.
We conducted our audits in accordance with the standards of the PCAOB. Those standards require that we plan and perform the audit to obtain reasonable assurance about whether the financial statements and financial highlights are free of material misstatement, whether due to error or fraud. Our audits included performing procedures to assess the risks of material misstatement of the financial statements and financial highlights, whether due to error or fraud, and performing procedures that respond to those risks. Such procedures included examining, on a test basis, evidence regarding the amounts and disclosures in the financial statements and financial highlights. Such procedures also included confirmation of securities owned as of July 31, 2023, by correspondence with custodians and brokers; when replies were not received from brokers, we performed other auditing procedures. Our audits also included evaluating the accounting principles used and significant estimates made by management, as well as evaluating the overall presentation of the financial statements and financial highlights. We believe that our audits provide a reasonable basis for our opinion.
We have served as the auditor of one or more Green Century investment companies since 1995.
Boston, Massachusetts
September 15, 2023
KPMG LLP, a Delaware limited liability partnership and a member firm of
the KPMG global organization of independent member firms affiliated with
KPMG International Limited, a private English company limited by guarantee.
49
TAX INFORMATION
For the year ended July 31, 2023, the Balanced Fund, Equity Fund and MSCI International Fund, respectively, had 100%, 100% and 0.00% of dividends paid from net investment income qualified for the 70% dividends received deduction available to corporate shareholders.
For the year ended July 31, 2023, the Balanced Fund, Equity Fund and MSCI International Fund, respectively, had 100%, 100% and 100% of dividends paid from net investment income, designated as qualified dividend income.
GREEN CENTURY FUNDS TRUSTEES AND OFFICERS
The following table presents information about each Trustee and each Officer of the Trust as of July 31, 2023. Each Trustee and each Officer of the Trust noted as an “interested person” (as defined in the 1940 Act), and noted with an asterisk, is interested by virtue of his or her position with Green Century as described below. The Trust does not hold annual shareholder meetings for the purpose of electing Trustees, and Trustees are not elected for fixed terms. This means that each Trustee will be elected to hold office until his or her successor is elected or until he or she retires, resigns, dies, or is removed from office.
The Trust’s Registration Statement includes additional information about the Trustees and is available, without charge, upon request by calling the following toll-free number: 1-800-93-GREEN.
| | | | | | | | |
| NAME, ADDRESS AND AGE | | POSITION(S) HELD WITH THE TRUST AND LENGTH OF TIME SERVED | | PRINCIPAL OCCUPATION(S) DURING PAST 5 YEARS AND OTHER DIRECTORSHIPS HELD | | NUMBER OF PORTFOLIOS OVERSEEN BY TRUSTEE | |
| Independent Trustees: | | | | | | |
Jonathan Darnell 114 State Street Suite 200 Boston, MA 02109 Age: 63 | | Trustee since 2014 | | Chief Financial Officer, AltEnergy Acquisition Corp. (since 2021); Member, AltEnergy Acquisition Sponsor (since 2021); Managing Director, AltEnergy, LLC, an investment firm, (since 2016); Managing Director, Pickwick Capital Partners (since 2014); President/Founder, Patolan Partners, an advisory and investment firm (since 2011). | | | 3 | |
| | | |
Daniel S. Kern 114 State Street Suite 200 Boston, MA 02109 Age: 62 | | Trustee since 2015 | | Chief Investment Officer, Nixon Peabody LLC (Since 2023); Chief Investment Officer, TFC Financial Management (2015-2023); President and Chief Investment Officer, Advisor Partners LLC (2011 to 2015); Board member, Wealthramp (since 2015). | | | 3 | |
| | | |
Sanford Pooler 114 State Street Suite 200 Boston, MA 02109 Age: 66 | | Trustee since 2021 | | Deputy Town Manager/Finance Director, Town of Arlington, MA (since 2016); Finance Director, Town of Amherst, MA (2011-2016). | | | 3 | |
50
| | | | | | | | |
| NAME, ADDRESS AND AGE | | POSITION(S) HELD WITH THE TRUST AND LENGTH OF TIME SERVED | | PRINCIPAL OCCUPATION(S) DURING PAST 5 YEARS AND OTHER DIRECTORSHIPS HELD | | NUMBER OF PORTFOLIOS OVERSEEN BY TRUSTEE | |
Mary Raftery 114 State Street Suite 200 Boston, MA 02109 Age: 58 | | Trustee since 2009 | | Senior Advisor, Funder Collaborations, ClimateWorks Foundation (since 2014); Organizational Development Consultant, Self-employed (since 2007). | | | 3 | |
| | | |
James H. Starr 114 State Street Suite 200 Boston, MA 02109 Age: 75 | | Chairperson since 2009; Trustee since 1991 | | Retired (since 2018); Consultant, Rainville Petito, PLLC (2016 to 2018); Consultant, Danielson Rainville Attorneys, PLLC (2015); Director and President, Gunnison Valley Housing Foundation (since 2010); Director (since 2011) and President (2015-2018), Coal Creek Watershed Coalition. | | | 3 | |
| | | |
Thomas Subak 114 State Street Suite 200 Boston, MA 02109 Age: 59 | | Trustee since 2021 | | Independent Consultant, Tom Subak LLC (since 2020); Independent Consultant and Chief Partnership Officer, Catchafire, a nonprofit organization (2019-2020); Chief Strategy Officer and Assistant to the President, Planned Parenthood Federation of America (2016-2018). | | | 3 | |
| Interested Trustees: | | | | | | | | |
Douglas H. Phelps* 114 State Street Suite 200 Boston, MA 02109 Age: 76 | | Trustee since 1997 | | President and Chief Executive Officer, The Public Interest Network (since 1982); Director, Green Century Capital Management, Inc. (since 1996). | | | 3 | |
| | | |
Wendy Wendlandt* 114 State Street Suite 200 Boston, MA 02109 Age: 61 | | Trustee since 1991 | | Director, Green Century Capital Management, Inc. (since 2006); Senior Vice President and Political Director, The Public Interest Network (since 1989); Senior Staff, Fund for Public Interest (since 1989); Acting President, Environment America (since 2020). | | | 3 | |
51
| | | | | | | | |
| NAME, ADDRESS AND AGE | | POSITION(S) HELD WITH THE TRUST AND LENGTH OF TIME SERVED | | PRINCIPAL OCCUPATION(S) DURING PAST 5 YEARS AND OTHER DIRECTORSHIPS HELD | | NUMBER OF PORTFOLIOS OVERSEEN BY TRUSTEE | |
| Officers: | | | | | | | | |
Leslie Samuelrich* 114 State Street Suite 200 Boston, MA 02109 Age 59 | | President since 2021 | | President (since 2015), Green Century Capital Management, Inc. | |
| Not
applicable |
|
| | | |
Matthew Dunlap* 114 State Street Suite 200 Boston, MA 02109 Age: 50 | | Treasurer since 2021 | | Senior Finance Manager (since 2020) and Treasurer (since 2021), Green Century Capital Management, Inc.; Assistant Vice President, State Street Corporation (2005-2019). | |
| Not
applicable |
|
| | | |
Jessica Rubinstein* 114 State Street Suite 200 Boston, MA02109 Age: 47 | | Chief Compliance Officer since 2022; Secretary and Assistant Treasurer since 2022 | | Chief Compliance Officer and Clerk (since 2022), Green Century Capital Management, Inc., Compliance Officer (since 2021), Green Century Capital Management Inc.; Senior Associate (since 2017) Mercer Investments (2017-2020) | |
| Not
applicable |
|
52
THIS PAGE INTENTIONALLY LEFT BLANK
YOUR NOTES
INVESTMENT ADVISER AND ADMINISTRATOR
Green Century Capital Management, Inc.
114 State Street
Boston, MA 02109
1-800-93-GREEN
www.greencentury.com
info@greencentury.com
INVESTMENT SUBADVISER (Balanced Fund)
Trillium Asset Management, LLC
Two Financial Center
60 South Street, Suite 1100
Boston, MA 02111
INVESTMENT SUBADVISER (Equity Fund and International Fund)
Northern Trust Investments, Inc.
50 South LaSalle Street
Chicago, IL 60603
SUBADMINISTRATOR and DISTRIBUTOR
UMB Fund Services, Inc. (Subadministrator)
UMB Distribution Services, LLC (Distributor)
235 West Galena Street
Milwaukee, WI 53212
CUSTODIAN
UMB Bank, n.a.
928 Grand Blvd
Kansas City, MO 64106
TRANSFER AGENT
Atlantic Shareholder Services, LLC
Three Canal Plaza
Portland, ME 04101
INDEPENDENT REGISTERED PUBLIC ACCOUNTING FIRM
KPMG LLP
Two Financial Center
60 South Street
Boston, MA 02111
July 31, 2023
Balanced
Fund
Equity
Fund
International
Fund
An investment for your future.
Printed on recycled paper with soy-based ink.
Item 2. Code of Ethics
| | (a) | The registrant has adopted a Code of Ethics applicable to the registrant’s principal executive officer, principal financial officer and principal accounting officer or controller. |
| | (c) | During the period covered by this report, there were no amendments to the provisions of the Code of Ethics referred to in Item 2(a) above. |
| | (d) | During the period covered by this report, there were no implicit or explicit waivers to the provisions of the Code of Ethics referred to in Item 2(a) above. |
| | (f) | The Code of Ethics is filed as an exhibit to this Form N-CSR. |
Item 3. Audit Committee Financial Expert
The Board of Trustees of the registrant has determined that Sanford Pooler, a member of the Board’s audit committee, qualifies as an “audit committee financial expert” as that term is defined in the instructions to Item 3 of Form N-CSR. Mr. Pooler is “independent” as that term is defined in the instructions to Item 3 of Form N-CSR.
Item 4. Principal Accountant Fees and Services
| | (a) | Audit Fees. The aggregate fees billed for each of the last two fiscal years for professional services rendered by the principal accountant for the audit of the registrant’s annual financial statements or services that are normally provided by the accountant in connection with statutory and regulatory filings or engagements for those fiscal years are as follows. |
For the fiscal year ended 7/31/23: $100,100
For the fiscal year ended 7/31/22: $91,850
| | (b) | Audit-Related Fees. No fees were billed in either of the last two fiscal years for assurance and related services by the principal accountant that are reasonably related to the performance of the audit of the registrant’s financial statements and are not reported under paragraph (a) of this item. |
| | (c) | Tax Fees. The aggregate fees billed for each of the last two fiscal years for professional services rendered by the principal accountant for tax compliance, tax advice and tax planning are as follows. The services comprising the fees disclosed under this category are tax compliance monitoring and tax filing preparation. |
For the fiscal year ended 7/31/23: $22,275
For the fiscal year ended 7/31/22: $20,445
| | (d) | All Other Fees. No fees were billed in each of the last two fiscal years for products and services provided by the principal accountant, other than the services reported in paragraphs (a) through (c) of this item. |
| | (e)(1) | The Charter of the Audit Committee of the Board requires that the Committee approve (a) all audit and permissible non-audit services to be provided to the Funds and (b) all permissible non-audit services to be provided by the Funds’ independent auditors to the Funds’ investment adviser or administrator or any entity controlling, controlled by, or under common control with the investment adviser or administrator that provides ongoing services to the Funds, if the engagement relates directly to the operations and financial reporting of the Funds. The Audit Committee has the duty to consider whether the non-audit services provided by the Funds’ auditor to the Funds’ investment adviser, administrator, or any adviser affiliate that provides ongoing services to the Funds, which services were not pre-approved by the Audit Committee, are compatible with maintaining the auditor’s independence and to review and approve the fees proposed to be charged to the Funds by the auditors for each audit and non-audit service. |
| | (e)(2) | Zero percent of the services described in each of paragraphs (b) through (d) of this Item were approved by the Audit Committee pursuant to paragraph (c)(7)(i)(C) of Rule 2-01 of Regulation S-X. |
| | (g) | The aggregate non-audit fees billed by the registrant’s accountant for services rendered to the registrant were the tax compliance, tax advice and tax planning fees listed in paragraph (c) of this Item and are as follows. No non-audit fees were billed by the registrant’s accountant for services rendered to the registrant’s investment adviser or any entity controlling, controlled by, or under common control with the adviser that provides ongoing services to the registrant for each of the last two fiscal years of the registrant. |
For the fiscal year ended 7/31/23: $22,275
For the fiscal year ended 7/31/22: $20,445
Item 5. Audit Committee of Listed Registrants
Not applicable.
Item 6. Schedule of Investments
| | (a) | Included as part of the report to shareholders filed under Item 1(a) of this Form N-CSR. |
Item 7. Disclosure of Proxy Voting Policies and Procedures for Closed-End Management Investment Companies
Not applicable.
Item 8. Portfolio Managers of Closed-End Management Investment Companies
Not applicable.
Item 9. Purchases of Equity Securities by Closed-End Management Investment Company and Affiliated Purchasers
Not applicable.
Item 10. Submission of Matters to a Vote of Security Holders
There were no material changes to the procedures by which shareholders may recommend nominees to the registrant’s Board of Trustees.
Item 11. Controls and Procedures
| (a) | Based on an evaluation of the disclosure controls and procedures (as defined in Rule 30a-3(c) under the Investment Company Act of 1940, as amended, the “Disclosure Controls”) as of a date within 90 days of the filing date (the “Filing Date”) of this Form N-CSR (the “Report”), the registrant’s principal executive officer and principal financial officer have concluded that the Disclosure Controls are effectively designed to ensure that information that is required to be disclosed by the registrant in the Report is recorded, processed, summarized and reported within the time periods specified in the Securities and Exchange Commission’s rules and forms, including ensuring that information required to be disclosed in the Report is accumulated and communicated to the registrant’s management, including the registrant’s principal executive officer and principal financial officer, as appropriate to allow timely decisions regarding required disclosures. |
| (b) | There were no changes in the registrant’s internal controls over financial reporting (as defined in Rule 30a-3(d) under the Investment Company Act of 1940) that occurred during the fiscal period covered by this report that have materially affected, or are reasonably likely to materially affect, the registrant’s internal control over financial reporting. |
Item 12. Disclosure of securities lending activities for closed-end management investment companies.
Not applicable.
Item 13. Exhibits
| | (4) | There was no change in the registrant’s independent public accountant for the period covered by this report. |
SIGNATURES
Pursuant to the requirements of the Securities Exchange Act of 1934 and the Investment Company Act of 1940, the registrant has duly caused this report to be signed on its behalf by the undersigned, thereunto duly authorized.
Green Century Funds
|
/s/ Leslie Samuelrich |
Leslie Samuelrich |
President and Principal Executive Officer |
October 5, 2023 |
Pursuant to the requirements of the Securities Exchange Act of 1934 and the Investment Company Act of 1940, this report has been signed below by the following persons on behalf of the registrant and in the capacities and on the dates indicated.
|
/s/ Leslie Samuelrich |
Leslie Samuelrich |
President and Principal Executive Officer |
October 5, 2023 |
|
/s/ Matthew Dunlap |
Matthew Dunlap |
Treasurer and Principal Financial Officer |
October 5, 2023 |