UNITED STATES
SECURITIES AND EXCHANGE COMMISSION
Washington, D.C. 20549
FORM N-CSR
CERTIFIED SHAREHOLDER REPORT OF REGISTERED
MANAGEMENT INVESTMENT COMPANIES
Investment Company Act file number: 811-03342
Sit Mid Cap Growth Fund, Inc.
(Exact name of registrant as specified in charter)
3300 IDS Center
80 South Eighth Street
Minneapolis, MN 55402
(Address of principal executive offices)
Paul E. Rasmussen, VP Treasurer
Sit Mutual Funds, Inc.
3300 IDS Center
80 South Eighth Street
Minneapolis, MN 55402
(Name and address of agent for service)
Copy to:
Mike Radmer, Esq.
Dorsey & Whitney
Suite 1500
50 South Sixth Street
Minneapolis, MN 55402-1498
Registrant’s telephone number, including area code:
(612) 334-5888
Date of fiscal year end: | June 30, 2010 |
| |
Date of reporting period: | June 30, 2010 |
Item 1: Reports to Stockholders
UNITED STATES
SECURITIES AND EXCHANGE COMMISSION
Washington, D.C. 20549
FORM N-CSR
CERTIFIED SHAREHOLDER REPORT OF REGISTERED
MANAGEMENT INVESTMENT COMPANIES
Investment Company Act file number: 811-03343
Sit Large Cap Growth Fund, Inc.
(Exact name of registrant as specified in charter)
3300 IDS Center
80 South Eighth Street
Minneapolis, MN 55402
(Address of principal executive offices)
Paul E. Rasmussen, VP Treasurer
Sit Mutual Funds, Inc.
3300 IDS Center
80 South Eighth Street
Minneapolis, MN 55402
(Name and address of agent for service)
Copy to:
Mike Radmer, Esq.
Dorsey & Whitney
Suite 1500
50 South Sixth Street
Minneapolis, MN 55402-1498
Registrant’s telephone number, including area code:
(612) 334-5888
Date of fiscal year end: | June 30, 2010 |
| |
Date of reporting period: | June 30, 2010 |
Item 1: Reports to Stockholders
UNITED STATES
SECURITIES AND EXCHANGE COMMISSION
Washington, D.C. 20549
FORM N-CSR
CERTIFIED SHAREHOLDER REPORT OF REGISTERED
MANAGEMENT INVESTMENT COMPANIES
Investment Company Act file number: 811-06373
Sit Mutual Funds, Inc.
(Exact name of registrant as specified in charter)
3300 IDS Center
80 South Eighth Street
Minneapolis, MN 55402
(Address of principal executive offices)
Paul E. Rasmussen, VP Treasurer
Sit Mutual Funds, Inc.
3300 IDS Center
80 South Eighth Street
Minneapolis, MN 55402
(Name and address of agent for service)
Copy to:
Mike Radmer, Esq.
Dorsey & Whitney
Suite 1500
50 South Sixth Street
Minneapolis, MN 55402-1498
Registrant’s telephone number, including area code:
(612) 334-5888
Date of fiscal year end: | June 30, 2010 |
| |
Date of reporting period: | June 30, 2010 |
Item 1: Reports to Stockholders
Sit Mutual Funds
Stock Funds
Annual Report
One Year Ended June 30, 2010
A FAMILY OF NO-LOAD FUNDS
Balanced Fund
Dividend Growth Fund
Global Dividend Growth Fund
Large Cap Growth Fund
Mid Cap Growth Fund
International Growth Fund
Small Cap Growth Fund
Developing Markets Growth Fund
|
Sit Mutual Funds |
STOCK FUNDS ANNUAL REPORT |
TABLE OF CONTENTS |
| |

|
|
|
|
Sit Mutual Funds |
One Year Ended June 30, 2010 |
|
Chairman’s Letter |
|
|
Dear Fellow Shareholders:
Equity markets climbed higher over the past year, as economic prospects improved, driven by stimulative fiscal and monetary actions taken by policy makers throughout the world. Although higher stock valuations and further economic challenges may limit significant upside potential, we believe stock prices can climb higher as corporate profits increase.
Following a severe contraction, the U.S. economy (as measured by Gross Domestic Product, or GDP) has now expanded for four consecutive quarters, and further growth is expected over the second half of 2010. Despite revived concerns, on the part of some investors, that the U.S. economy is headed for renewed weakness, we expect the recovery to persist at the same subpar pace we have been forecasting. Consumers continue to reduce debt levels from the highs of 2007, and personal savings rates have moved higher. This retrenchment, combined with the stubbornly slow recovery of labor markets, will likely restrain consumer spending growth to relatively low levels. While job growth has been tepid, wages and work hours have increased since the beginning of the year. This will boost consumer spending over the near-term, but a sustained recovery in the economy will require employers to gain enough confidence to hire additional workers. Our projection for modest consumer spending, which accounts for 70% of GDP, along with a steady uptick in business spending, are key factors underlying our +2.8% GDP forecast for 2010. This represents a below average rebound in growth, compared to other economic recoveries. On a positive note, however, inflation has also remained at very low levels. The core inflation rate, which excludes food and energy sectors, increased just +0.9 percent (year-over-year) in the most recent month. Despite highly accommodative monetary policy, the subdued rate of change in all of these factors – employment, economic growth and inflation – is likely to keep Federal Reserve interest rate increases on hold for quite some time.
Events outside the U.S. weighed on global stock
markets during the most recent quarter. First, concerns over the sustainability of China’s economic recovery emerged as the government stepped up tightening efforts to rein in growth amid rising inflation pressures and a potential “bubble” in real estate. The government’s actions will have an impact on growth during the second half of the year, but we do not expect a “hard landing,” as many segments of the economy (outside of property) will continue to grow. The other major recent events occurred in Europe, as concerns grew over mounting government debt levels in several countries, particularly Greece. Despite initial delays, the European Central Bank resumed its quantitative easing program, including a 750 billion euro program that pledges to buy debt securities in various classes within the region. While sovereign credit concerns are likely to persist for years to come, we believe the risk of a credit/liquidity seizure in the European banking system is no longer a worry for now. However, the impact of austerity measures and decreased confidence will negatively impact already low growth expectations for the region. It is critical, however, that the governments in the region rein in spending at a gradual pace. Given tepid economic growth and fragility of the banking system, severe austerity measures could tip the region into a more severe decline, which could impact the global economy.
Equity Strategy
Although stock prices have responded to better economic conditions over the past year, the correction during the most recent quarter served as a reminder of the many challenges preventing a “new bull market” from emerging in the near term. However, we believe equities are by no means priced for an economic “boom” and patient equity investors will be rewarded over the longer term.
Given the events of recent years, the risks and headwinds facing the equity market are readily apparent to most investors. Debt levels remain too high (for both the government and consumers), higher unemployment appears to
2
| | | | |
| | | 
| |
| | |
| | |
|
| |
| | | | |
be structural in nature, real estate markets are weak, and government policy (i.e., taxes, regulations) are adding uncertainty in many sectors of the economy. With these issues constantly dominating the headlines in recent months, investor pessimism towards stocks is understandable. However, while we remain cognizant of the risks, we believe investors must recognize positive factors, as well. First, inflation remains virtually non-existent and interest rates are extraordinarily low. This should motivate investors to take some risk in equities. Second, valuations for stocks are very reasonable, particularly after the recent correction. The P/E ratio for the S&P 500 Index (on projected next 12 month earnings) currently stands at 13, well below the average of 19 experienced over the last 20 years. Third, Corporate America has done a remarkable job boosting productivity and profitability. This should allow for solid earnings increases, even if sales growth is muted this cycle. And finally, corporate debt levels are very low, cash positions are high, and free cash flow is being produced at record levels. Most companies have plenty of capital to invest for growth, make acquisitions, or return capital to shareholders (through either dividends or share repurchases).
Our investment strategy has not changed materially since this time last year, largely because our economic view of a “subpar” economic recovery has remained intact. In this regard, we believe it is still prudent to remain diversified among sectors, focus on companies that can grow earnings in a slow growth environment, and maintain a “high quality” bias within each Fund. Technology remains a key focus, as cyclical improvements in key segments (e.g., PCs, semiconductors) are converging with secular trends (e.g., wireless communications, smart phones) to create numerous growth opportunities in the sector. We have also recently added to the capital goods sector, as several key end markets, such as commercial aerospace, appear to be in a sustained uptrend. Conversely, health care weightings have been reduced, due to uncertainties related to the impact of
U.S. health care reform as well as the impact of austerity measures, particularly in Europe, which will pressure product pricing. In general, the Funds remain well-diversified, as we expect volatility to increase in the months ahead. Regardless of the sector, we continue to emphasize “quality,” favoring companies with strong balance sheets, predictable earnings growth, and consistent cash flow generation.
Equity markets outside the U.S. have also corrected in recent months, due to European sovereign debt concerns and the risks of an economic slowdown during the second half of the year, particularly in China. While volatility may remain quite high, we continue to see attractive investment opportunities in emerging markets, particularly in Asia (including China), as long-term economic growth prospects remain bright. In Asia, we continue to underweight Japan, however, due to weak domestic consumption trends and structural issues within the economy. While we continue to see select opportunities in Europe (particularly exporters that can benefit from a weak euro), as valuations are generally attractive, corporate earnings growth will be challenged amid tepid economic growth in the region.
Despite the recent correction, this past year was rewarding for investors, as stocks rebounded from their lows of early 2009. And, while the current investment environment remains very complex and challenging, we continue to believe there are attractive investment opportunities that will serve our shareholders well over the long term.
With best wishes,

Roger J. Sit
Chairman, President, Chief Executive Officer and
Global Chief Investment Officer
3
| | | | |
| Sit Mutual Funds | | | |
| One Year Ended June 30, 2010 | | | |
| | | | |
| Performance Summary and Stock Funds Market Review
| | | |
| | | | |
Global equities rallied over the past year, with almost all of the U.S. indices that we monitor posting +13% or greater gains. Domestic small- and mid- cap stocks outperformed larger issues by a wide margin, as the S&P 500 Index gained +14.43%, the Russell 2000® Index rose +21.48%, and the S&P Mid Cap 400 Index returned +24.93%. Growth stocks underperformed value stocks largely due to the outperforming finance sector that tends to be more heavily weighted within value indices. The growth-value return differential was greatest among smaller stocks. The Russell 2000® Growth Index’s gain of +17.96% over the period compared to the Russell 2000® Value Index’s gain of +25.07%, which represents over a 700 basis point differential. The Russell 1000® Growth Index’s +13.62% gain versus the Russell 1000® Value Index’s +16.92% exhibited a more modest differential.
All sectors that we monitor within the S&P 500 Index posted positive returns over the past year, but there was a wide gap among groups. There was generally a rotation to more “cyclical” sectors within the market, as investors gained confidence that the economy was emerging from recession. Within the S&P 500 Index, sectors that outperformed the overall Index included consumer durables, producer manufacturing, transportation, consumer services and electronic technology. The sectors that underperformed the broader market over the period included energy minerals, technology services, communications, health technology and utilities. These sectors were disproportionately influenced by some very large, “defensive” companies that lagged the overall market during the period, including Exxon Mobil, Exelon, Verizon Communications, Pfizer, AT&T and Wal-Mart.
Improving sentiment that drove domestic stocks higher also helped markets outside the U.S., as the MSCI World Index gained +9.32% on a local currency basis over the past twelve months. Currency movements, however, had an unusually large impact on returns for U.S. investors within the regional components. For example, the MSCI Europe Index gained just +2.70% in U.S dollar terms, which was far below the local return (+13.27%), due to the weak euro. Conversely, while the MSCI Japan Index fell -9.08% on a local currency basis, it represented only -0.98% in U.S. dollar terms due to the relative strength of the yen to the dollar. The MSCI Emerging Market Index, not materially impacted by currency, was the best regional component within the broad index and gained +20.58% in U.S. dollar terms.
| | | | |
SIT EQUITY FUNDS | | 3-Month
Return* | |
Balanced SIBAX | | -7.07 | % | |
S&P 500 Index | | -11.42 | | |
Barclays Capital Aggregate Bond Index | | 3.49 | | |
Dividend Growth Class I SDVGX | | -9.91 | | |
S&P 500 Index | | -11.42 | | |
Dividend Growth Class S SDVSX | | -9.99 | | |
S&P 500 Index | | -11.42 | | |
Global Dividend Growth(1) Class I GDGIX | | -12.73 | | |
Global Dividend Growth(1) Class S GDGSX | | -12.79 | | |
Composite Index(2) | | -12.40 | | |
S&P 500 Index | | -11.42 | | |
MSCI EAFE Index | | -13.97 | | |
Large Cap Growth SNIGX | | -12.64 | | |
Russell 1000® Growth Index(3) | | -11.75 | | |
Mid Cap Growth(4) NBNGX | | -9.68 | | |
Russell Midcap® Growth Index(5) | | -10.20 | | |
International Growth(1) SNGRX | | -14.32 | | |
MSCI EAFE Growth Index(6) | | -12.44 | | |
Small Cap Growth(4) SSMGX | | -7.34 | | |
Russell 2000® Growth Index(7) | | -9.22 | | |
Developing Markets Growth(1) SDMGX | | -12.08 | | |
MSCI Emerging Markets Index(7) | | -9.14 | | |
|
*3- and 6-month returns not annualized.
Performance figures are historical and do not guarantee future results. Investment returns and principal value will vary, and you may have a gain or loss when you sell shares. Average annual total returns include changes in share price as well as reinvestment of all dividends and capital gains.
| |
(1) | International investing has special risks, such as currency exchange fluctuations, high volatility, illiquidity and the possibility of political instability. |
(2) | Composite Index comprised of 60% S&P 500 Index and 40% MSCI EAFE Index. |
(3) | Figures assume an inception date of 9/2/82. |
4
| | |
| AVERAGE ANNUAL RETURNS FOR PERIODS ENDED JUNE 30, 2010 | |
| | | | | | | | | | | | | | | | | | | |
6-Month
Return* | | 1-Year | | 3-Year | | 5-Year | | 10-Year | | Since
Inception | | Inception
Date |
-3.22 | % | | 12.33 | % | | -3.20 | % | | 1.90 | % | | -0.47 | % | | 5.75 | % | | 12/31/93 | |
-6.65 | | | 14.43 | | | -9.81 | | | -0.79 | | | -1.59 | | | 6.92 | | | | |
5.33 | | | 9.50 | | | 7.55 | | | 5.54 | | | 6.47 | | | 6.30 | | | | |
-6.19 | | | 12.71 | | | -5.02 | | | 3.33 | | | — | | | 4.65 | | | 12/31/03 | |
-6.65 | | | 14.43 | | | -9.81 | | | -0.79 | | | — | | | 0.85 | | | | |
-6.35 | | | 12.37 | | | -5.27 | | | — | | | — | | | 0.73 | | | 3/31/06 | |
-6.65 | | | 14.43 | | | -9.81 | | | — | | | — | | | -3.18 | | | | |
-9.79 | | | 8.79 | | | �� | | | — | | | — | | | 3.69 | | | 9/30/08 | |
-9.93 | | | 8.47 | | | — | | | — | | | — | | | 3.45 | | | 9/30/08 | |
-9.28 | | | 11.06 | | | — | | | — | | | — | | | -4.60 | | | | |
-6.65 | | | 14.43 | | | — | | | — | | | — | | | -4.57 | | | | |
-13.23 | | | 5.92 | | | — | | | — | | | — | | | -4.94 | | | | |
-9.36 | | | 7.80 | | | -7.07 | | | 0.77 | | | -4.65 | | | 9.07 | | | 9/2/82 | |
-7.64 | | | 13.62 | | | -6.91 | | | 0.38 | | | -5.14 | | | 9.82 | | | | |
-2.03 | | | 16.87 | | | -8.42 | | | 1.36 | | | -4.28 | | | 11.25 | | | 9/2/82 | |
-3.31 | | | 21.30 | | | -7.53 | | | 1.37 | | | -1.99 | | | N/A | | | | |
-11.92 | | | 8.10 | | | -13.48 | | | -0.05 | | | -5.98 | | | 2.87 | | | 11/1/91 | |
-10.73 | | | 8.60 | | | -11.70 | | | 1.68 | | | -1.61 | | | 2.82 | | | | |
0.16 | | | 20.97 | | | -7.94 | | | 2.46 | | | -2.57 | | | 9.44 | | | 7/1/94 | |
-2.31 | | | 17.96 | | | -7.54 | | | 1.14 | | | -1.72 | | | 5.06 | | | | |
-10.80 | | | 18.05 | | | -6.27 | | | 9.75 | | | 4.47 | | | 4.73 | | | 7/1/94 | |
-7.22 | | | 20.58 | | | -4.67 | | | 10.19 | | | 7.50 | | | 4.14 | | | | |
| |
(4) | Stocks of small- and mid-sized companies may be subject to more abrupt or erratic market movements than stocks of larger, more established companies. |
(5) | Russell Midcap® Growth Index inception 12/31/85. |
(6) | Figures assume an inception date of 10/31/91. |
(7) | Figures assume an inception date of 6/30/94. |
5
| | | | |
| Sit Mutual Funds | | | |
| Total Returns by Calendar Year
| | | |
| | | | |
| |
| SIT EQUITY FUNDS TOTAL RETURN BY CALENDAR YEAR |
| | | | | | | | | | | | | | |
| | | 1999 | | 2000 | | 2001 | | 2002 | |
| Balanced | | 20.15 | % | | -4.80 | % | | -12.99 | % | | -18.59 | % | |
| S&P 500 Index | | 21.04 | | | -9.11 | | | -11.88 | | | -22.10 | | |
| Barclays Capital Aggregate Bond Index | | -0.82 | | | 11.63 | | | 8.44 | | | 10.25 | | |
| | | | | | | | | | | | | | |
| Dividend Growth Class I | | — | | | — | | | — | | | — | | |
| S&P 500 Index | | — | | | — | | | — | | | — | | |
| | | | | | | | | | | | | | |
| Dividend Growth Class S | | — | | | — | | | — | | | — | | |
| S&P 500 Index | | — | | | — | | | — | | | — | | |
| | | | | | | | | | | | | | |
| Global Dividend Growth Class I(1) | | — | | | — | | | — | | | — | | |
| Global Dividend Growth Class S(1) | | — | | | — | | | — | | | — | | |
| Composite Index(3) | | — | | | — | | | — | | | — | | |
| S&P 500 Index | | — | | | — | | | — | | | — | | |
| MSCI EAFE Index | | — | | | — | | | — | | | — | | |
| | | | | | | | | | | | | | |
| Large Cap Growth(4) | | 33.41 | | | -13.84 | | | -27.70 | | | -30.58 | | |
| Russell 1000® Growth Index | | 33.16 | | | -22.43 | | | -20.42 | | | -27.89 | | |
| | | | | | | | | | | | | | |
| Mid Cap Growth(5) (6) | | 70.65 | | | -4.35 | | | -33.39 | | | -34.64 | | |
| Russell Midcap® Growth Index | | 51.29 | | | -11.75 | | | -20.15 | | | -27.41 | | |
| | | | | | | | | | | | | | |
| International Growth(1) | | 50.77 | | | -26.66 | | | -33.26 | | | -29.84 | | |
| MSCI EAFE Growth Index | | 29.46 | | | -24.51 | | | -24.58 | | | -16.02 | | |
| | | | | | | | | | | | | | |
| Small Cap Growth(5) | | 108.63 | | | 6.25 | | | -28.19 | | | -26.22 | | |
| Russell 2000® Growth Index | | 43.10 | | | -22.44 | | | -9.24 | | | -30.27 | | |
| | | | | | | | | | | | | | |
| Developing Markets Growth(1) | | 82.50 | | | -30.18 | | | -12.01 | | | -18.37 | | |
| MSCI Emerging Markets Index | | 63.70 | | | -31.80 | | | -4.91 | | | -7.97 | | |
| |
Performance figures are historical and do not guarantee future results. Investment returns and principal value will vary, and you may have a gain or loss when you sell shares. Average annual returns include reinvestment of all dividends and capital gains. For any returns less than one year, the returns are cumulative. |
(1) | International investing has special risks, such as currency exchange fluctuations, high volatility, illiquidity and the possibility of political instability. |
(2) | Due to the Fund’s inception date of 9/30/08, the 2008 calendar year returns for the Sit Global Dividend Growth Fund and its benchmarks reflect performance since 9/30/08. |
(3) | Composite Index comprised of 60% S&P 500 Index and 40% MSCI EAFE Index. |
6
| | | | | | | | | | | | | | | | | | | | | | | |
|
| 2003 | | | 2004 | | | 2005 | | | 2006 | | | 2007 | | | 2008 | | | 2009 | | YTD 2010 | |
| 19.20 | % | | 9.22 | % | | 7.51 | % | | 7.88 | % | | 10.52 | % | | -26.88 | % | | 23.12 | % | | -3.22 | % |
| 28.68 | | | 10.88 | | | 4.91 | | | 15.80 | | | 5.50 | | | -37.00 | | | 26.47 | | | -6.65 | |
| 4.10 | | | 4.34 | | | 2.43 | | | 4.33 | | | 6.97 | | | 5.24 | | | 5.93 | | | 5.33 | |
| | | | | | | | | | | | | | | | | | | | | | | |
| — | | | 10.91 | | | 9.41 | | | 18.29 | | | 12.89 | | | -29.60 | | | 25.59 | | | -6.19 | |
| — | | | 10.88 | | | 4.91 | | | 15.80 | | | 5.50 | | | -37.00 | | | 26.47 | | | -6.65 | |
| | | | | | | | | | | | | | | | | | | | | | | |
| — | | | — | | | — | | | 11.25 | | | 12.56 | | | -29.77 | | | 25.25 | | | -6.35 | |
| — | | | — | | | — | | | 11.11 | | | 5.50 | | | -37.00 | | | 26.47 | | | -6.65 | |
| | | | | | | | | | | | | | | | | | | | | | | |
| — | | | — | | | — | | | — | | | — | | | -5.25 | (2) | | 24.65 | | | -9.79 | |
| — | | | — | | | — | | | — | | | — | | | -5.31 | (2) | | 24.40 | | | -9.93 | |
| — | | | — | | | — | | | — | | | — | | | -21.11 | (2) | | 28.67 | | | -9.28 | |
| — | | | — | | | — | | | — | | | — | | | -21.94 | (2) | | 26.47 | | | -6.65 | |
| — | | | — | | | — | | | — | | | — | | | -19.95 | (2) | | 31.78 | | | -13.23 | |
| | | | | | | | | | | | | | | | | | | | | | | |
| 26.34 | | | 12.79 | | | 9.59 | | | 9.54 | | | 14.14 | | | -34.10 | | | 28.14 | | | -9.36 | |
| 29.76 | | | 6.30 | | | 5.27 | | | 9.08 | | | 11.81 | | | -38.44 | | | 37.21 | | | -7.64 | |
| | | | | | | | | | | | | | | | | | | | | | | |
| 38.51 | | | 17.02 | | | 15.27 | | | 9.56 | | | 18.87 | | | -45.34 | | | 35.59 | | | -2.03 | |
| 42.71 | | | 15.48 | | | 12.10 | | | 10.65 | | | 11.44 | | | -44.32 | | | 46.29 | | | -3.31 | |
| | | | | | | | | | | | | | | | | | | | | | | |
| 28.70 | | | 12.97 | | | 14.67 | | | 18.19 | | | 16.08 | | | -44.99 | | | 27.65 | | | -11.92 | |
| 31.99 | | | 16.12 | | | 13.28 | | | 22.33 | | | 16.45 | | | -42.70 | | | 29.36 | | | -10.73 | |
| | | | | | | | | | | | | | | | | | | | | | | |
| 34.57 | | | 6.79 | | | 18.52 | | | 7.99 | | | 20.43 | | | -42.96 | | | 33.06 | | | 0.16 | |
| 48.53 | | | 14.31 | | | 4.15 | | | 13.34 | | | 7.05 | | | -38.54 | | | 34.47 | | | -2.31 | |
| | | | | | | | | | | | | | | | | | | | | | | |
| 45.96 | | | 16.54 | | | 33.77 | | | 31.59 | | | 40.72 | | | -55.26 | | | 73.97 | | | -10.80 | |
| 51.59 | | | 22.45 | | | 30.31 | | | 29.18 | | | 36.48 | | | -54.48 | | | 74.50 | | | -7.22 | |
| |
(4) | Pursuant to a Plan of Reorganization on 7/14/00, the Large Cap Growth Fund acquired all of the assets of Regional Growth Fund in exchange for shares of common stock of the Large Cap Growth Fund. |
(5) | Stocks of small- and mid-sized companies may be subject to more abrupt or erratic market movements than stocks of larger, more established companies. |
(6) | Pursuant to a Plan of Reorganization on 10/26/07, the Mid Cap Growth Fund acquired all of the assets of the Science and Technology Growth Fund in exchange for shares of common stock of the Mid Cap Growth Fund. |
7
| | | | |
| Sit Mutual Funds | | | |
| Average Annual Total Returns for Periods Ended December 31, 2009
| | | |
| | | | |
|
The tables on this page and the next page show the Funds’ average annual total returns (before and after taxes) and the change in value of a broad-based market index over various periods ended December 31, 2009. The index information is intended to permit you to compare each Fund’s performance to a broad measure of market performance. The after-tax returns are intended to show the impact of federal income taxes on an investment in a Fund. The highest individual federal marginal income tax rate in effect during the specified period are assumed, and the state and local tax impact is not reflected. |
|
A Fund’s “Return After Taxes on Distributions” shows the effect of taxable distributions (dividends and capital gain distributions), but assumes that you still hold the fund shares at the end of the period and so do not have any taxable gain or loss on your investment in the Fund. |
|
A Fund’s “Return After Taxes on Distributions and Sale of Fund Shares” shows the effect of both taxable distributions and any taxable gain or loss that would be realized if the Fund shares were purchased at the beginning and sold at the end of the specified period. |
|
The Funds’ past performance, before and after taxes, is not an indication of how the Funds will perform in the future. Your actual after-tax returns depend on your own tax situation and may differ from those shown. After-tax returns reflect past tax effects and are not predictive of future tax effects. After-tax returns are not relevant to investors who hold their Fund shares in a tax-deferred account (including a 401(k) or IRA account). Indices reflect no deduction for fees, expenses, or taxes. |
| | | | | | | | |
Sit Balanced Fund | | 1 Year | 5 Years | 10 Years |
| Return Before Taxes | | 23.1 | % | 2.9 | % | 0.1 | % |
| Return After Taxes on Distributions | | 22.2 | % | 2.3 | % | -0.6 | % |
| Return After Taxes on Distributions and Sale of Fund Shares | | 19.2 | % | 2.2 | % | -0.3 | % |
| Barclays Capital Aggregate Bond Index | | 5.9 | % | 5.0 | % | 6.3 | % |
| S&P 500 Index | | 26.5 | % | 0.4 | % | -1.0 | % |
| | | | | | | | |
Sit Dividend Growth Fund - Class I | | 1 Year | 5 Years | Since Inception* |
| Return Before Taxes | | 25.6 | % | 5.3 | % | 6.2 | % |
| Return After Taxes on Distributions | | 25.2 | % | 4.5 | % | 5.5 | % |
| Return After Taxes on Distributions and Sale of Fund Shares | | 21.7 | % | 4.4 | % | 5.2 | % |
| S&P 500 Index | | 26.5 | % | 0.4 | % | 2.1 | % |
*Inception date 12/31/03 | | | | | | | |
| | | | | | | | |
Sit Global Dividend Growth Fund - Class I | | 1 Year | 5 Years | Since Inception* |
| Return Before Taxes | | 24.7 | % | n/a | | 14.2 | % |
| Return After Taxes on Distributions | | 24.3 | % | n/a | | 13.9 | % |
| Return After Taxes on Distributions and Sale of Fund Shares | | 20.9 | % | n/a | | 12.1 | % |
| Composite Index (60% S&P 500 Index, 40% MSCI EAFE Growth Index) | | 28.7 | % | n/a | | 1.2 | % |
| S&P 500 Index | | 26.5 | % | n/a | | -1.0 | % |
| MSCI EAFE Growth Index | | 31.8 | % | n/a | | 4.4 | % |
*Inception date 9/30/08 | | | | | | | |
8
| | | | |
| | |
| |
| | |
| | |
|
| |
| | | | |
| | | | | | | | |
Sit Large Cap Growth Fund | | 1 Year | 5 Years | 10 Years |
| Return Before Taxes | | 28.1 | % | 3.0 | % | -3.3 | % |
| Return After Taxes on Distributions | | 28.0 | % | 2.9 | % | -3.6 | % |
| Return After Taxes on Distributions and Sale of Fund Shares | | 23.9 | % | 2.5 | % | -2.8 | % |
| Russell 1000® Growth Index | | 37.2 | % | 1.6 | % | -4.0 | % |
| | | | | | | | |
Sit Mid Cap Growth Fund | | 1 Year | 5 Years | 10 Years |
| Return Before Taxes | | 35.6 | % | 2.2 | % | -2.8 | % |
| Return After Taxes on Distributions | | 35.6 | % | 2.0 | % | -3.3 | % |
| Return After Taxes on Distributions and Sale of Fund Shares | | 30.3 | % | 1.9 | % | -2.4 | % |
| Russell Mid Cap® Growth Index | | 46.3 | % | 2.4 | % | -0.5 | % |
| | | | | | | | |
Sit International Growth Fund | | 1 Year | 5 Years | 10 Years |
| Return Before Taxes | | 27.7 | % | 2.0 | % | -5.8 | % |
| Return After Taxes on Distributions | | 27.5 | % | 1.9 | % | -5.9 | % |
| Return After Taxes on Distributions and Sale of Fund Shares | | 23.5 | % | 1.7 | % | -4.7 | % |
| MSCI EAFE Growth Index | | 29.4 | % | 3.6 | % | -1.3 | % |
| | | | | | | | |
Sit Small Cap Growth Fund | | 1 Year | 5 Years | 10 Years |
| Return Before Taxes | | 33.1 | % | 3.2 | % | -0.5 | % |
| Return After Taxes on Distributions | | 33.1 | % | 3.2 | % | -0.6 | % |
| Return After Taxes on Distributions and Sale of Fund Shares | | 28.1 | % | 2.7 | % | -0.5 | % |
| Russell 2000® Growth Index | | 34.5 | % | 0.9 | % | -1.4 | % |
| | | | | | | | |
Sit Developing Markets Growth Fund | | 1 Year | 5 Years | 10 Years |
| Return Before Taxes | | 74.0 | % | 14.0 | % | 5.1 | % |
| Return After Taxes on Distributions | | 73.9 | % | 13.8 | % | 5.0 | % |
| Return After Taxes on Distributions and Sale of Fund Shares | | 62.9 | % | 12.3 | % | 4.4 | % |
| MSCI Emerging Markets Index | | 74.5 | % | 12.8 | % | 7.3 | % |
9
| | | | |
| Sit Balanced Fund | | | |
| One Year Ended June 30, 2010 | | | |
| | | | |
| Portfolio Managers: Roger J. Sit, Bryce A. Doty, and John M. Bernstein
| | | |
| | | | |
The Sit Balanced Fund’s one-year return was +12.33%. By comparison, the S&P 500 Index return was +14.43% over the period, while the Barclay’s Capital Aggregate Bond Index gained +9.50%. The Lipper Balanced Fund Index returned +13.33% over the period.
Relatively stable interest rates, a contraction in credit spreads and a rebound in economic growth allowed both bonds and stocks to post solid returns over the past twelve months. Equities moved higher as corporate earnings generally surprised on the upside. But the equity portion of the Fund lagged the S&P 500 Index over the past twelve months, at least partially due to our focus on high quality, less cyclical stocks, which hampered performance in an environment where investors favored high beta, low quality and more cyclical companies. However, we believe we are entering another phase of the recovery, as the sluggish economic environment (and continued low interest rates) will lead investors back to high quality growth stocks that can generate sustained earnings growth. Moreover, the valuations (e.g., P/E ratios) for large cap growth stocks, such as 3M, Intel and Medtronic, are well below historical averages, and we believe solid dividend yields provide further support at current prices. In short, we continue to find many opportunities for long-term equity investors, and our research staff remains highly focused on identifying companies that can deliver consistently strong results over time.
Despite a strengthening economy, interest rates remained relatively low over the past year and virtually all segments of the bond market posted above-average returns. While U.S. Treasuries have recently rallied, once again, on fears that another economic/ credit crisis may be emerging, we believe concerns are overdone. Yields on U.S. Treasuries remain exceptionally low and, therefore, we remain underweighted in the sector. Conversely, we believe high quality corporate bonds, closed end funds and mortgages continue to provide investors with attractive risk-adjusted return potential.
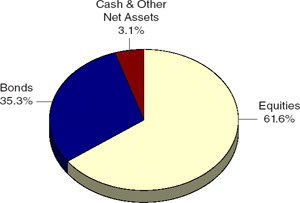
As of June 30th, the asset allocation of the Fund was 62% equities, 35% fixed income, and 3% cash and equivalents. We continue to emphasize high quality securities in each asset class within the Fund, and we appreciate shareholders’ continued interest.
INVESTMENT OBJECTIVE AND STRATEGY |
The Sit Balanced Fund’s dual objectives are to seek long-term growth of capital consistent with the preservation of principal and to provide regular income. It pursues its objectives by investing in a diversified portfolio of stocks and bonds. The Fund may emphasize either equity securities or fixed-income securities, or hold equal amounts of each, dependent upon the Adviser’s analysis of market, financial and economic conditions.
The Fund’s permissible investment allocation is: 35-65% in equity securities and 35-65% in fixed-income securities. At all times at least 25% of the fixed-income assets will be invested in fixed-income senior securities.
| | | |
Net Asset Value 6/30/10: | | $ | 14.18 Per Share |
6/30/09: | | $ | 12.96 Per Share |
| | | |
Total Net Assets: | | $ | 10.5 Million |
PORTFOLIO STRUCTURE
(% OF TOTAL NET ASSETS) |
10
| | | | |
| | |
| |
| | |
| | |
|
| |
| | | | |
| | | | | | | | | | | |
AVERAGE ANNUAL TOTAL RETURNS* | |
| | | | | | | | | | |
| | Sit Balanced
Fund | | S&P 500
Index(1) | | Barclays
Capital
Aggregate
Bond Index(2) | |
| | | | | | | | | | |
3 Month** | | -7.07 | % | | -11.42 | % | | 3.49 | % | |
6 Month** | | -3.22 | | | -6.65 | | | 5.33 | | |
1 Year | | 12.33 | | | 14.43 | | | 9.50 | | |
5 Year | | 1.90 | | | -0.79 | | | 5.54 | | |
10 Year | | -0.47 | | | -1.59 | | | 6.47 | | |
Inception | | 5.75 | | | 6.92 | | | 6.30 | | |
(12/31/93) | | | | | | | | | | |
| | | | | | | | | | |
CUMULATIVE TOTAL RETURNS* | |
| | | | | | | | | | |
| | Sit Balanced
Fund | | S&P 500
Index(1) | | Barclays
Capital
Aggregate
Bond Index(2) | |
| | | | | | | | | | |
1 Year | | 12.33 | % | | 14.43 | % | | 9.50 | % | |
5 Year | | 9.86 | | | -3.91 | | | 30.94 | | |
10 Year | | -4.62 | | | -14.79 | | | 87.14 | | |
Inception | | 151.79 | | | 201.83 | | | 174.17 | | |
(12/31/93) | | | | | | | | | | |
*As of 6/30/10.
|
**Not annualized.
| |
| | | | | | | | | | | |
|
Performance figures are historical and do not guarantee future results. Investment returns and principal value will vary, and you may have a gain or loss when you sell shares. Average annual total returns include changes in share price as well as reinvestment of all dividends and capital gains. Management fees and administrative expenses are included in the Fund’s performance.
| |
|
(1) | An unmanaged index which measures the performance of 500 widely held common stocks of large-cap companies. |
(2) | An unmanaged index which measures the performance of approximately 6,000 publicly traded bonds with an approximate average maturity of 10 years. |

The sum of $10,000 invested on 6/30/00 and held until 6/30/10 would have declined to $9,538 in the Fund, $8,521 in the S&P 500 Index or grown to $18,714 in the Barclays Capital Aggregate Bond Index assuming reinvestment of all dividends and capital gains.
| | |
Stocks | 1. | IBM Corp. |
| 2. | Google, Inc. |
| 3. | Mc Donald’s Corp. |
| 4. | Occidental Petroleum Corp. |
| 5. | PepsiCo, Inc. |
Bonds | 1. | U.S. Treasury Strip, 11/15/21 |
| 2. | GNR Series 2005-74 HA, 7.50%, 9/16/35 |
| 3. | American Strategic, Inc. Portfolio II |
| 4. | Wachovia Bank, 6.00%, 11/15/17 |
| 5. | Procter & Gamble ESOP, 9.36%, 1/1/21 |
Total Number of Holdings: 162 |
11
| | | | |
| Sit Balanced Fund | | | |
| | | | |
| Portfolio of Investments - June 30, 2010
| | | |
| | | | |
|
| | | | | |
Quantity/Par($) Name of Issuer | | Fair Value ($)(1) | |
| | | |
Common Stocks (61.6%) (2) | | | |
Communications (1.8%) | | | |
2,300 | | Rogers Communications, Inc. | | 75,348 | |
4,000 | | Verizon Communications, Inc. | | 112,080 | |
| | | | 187,428 | |
Consumer Non-Durables (6.3%) | | | |
2,700 | | Coca-Cola Company | | 135,324 | |
1,300 | | Colgate-Palmolive Co. | | 102,388 | |
1,100 | | General Mills, Inc. | | 39,072 | |
2,400 | | PepsiCo, Inc. | | 146,280 | |
2,750 | | Philip Morris International, Inc. | | 126,060 | |
2,000 | | The Procter & Gamble Co. | | 119,960 | |
| | | | 669,084 | |
Consumer Services (2.4%) | | | |
2,350 | | McDonald’s Corp. | | 154,795 | |
1,400 | | Visa, Inc. | | 99,050 | |
| | | | 253,845 | |
Electronic Technology (11.1%) | | | |
1,400 | | Analog Devices, Inc. | | 39,004 | |
550 | | Apple, Inc. (3) | | 138,342 | |
7,200 | | Applied Materials, Inc. | | 86,544 | |
2,300 | | Broadcom Corp. | | 75,831 | |
3,000 | | Ciena Corp. (3) | | 38,040 | |
6,700 | | Cisco Systems, Inc. (3) | | 142,777 | |
1,800 | | EMC Corp. (3) | | 32,940 | |
6,700 | | Intel Corp. | | 130,315 | |
1,525 | | IBM Corp. | | 188,307 | |
1,100 | | Linear Technology Corp. | | 30,591 | |
2,000 | | Marvell Technology Group (3) | | 31,520 | |
3,700 | | Qualcomm, Inc. | | 121,508 | |
1,100 | | Research In Motion, Ltd. (3) | | 54,186 | |
2,200 | | Seagate Technology (3) | | 28,688 | |
900 | | Veeco Instruments, Inc. (3) | | 30,852 | |
| | | | 1,169,445 | |
Energy Minerals (5.4%) | | | |
400 | | Apache Corp. | | 33,676 | |
1,400 | | EQT Corp. | | 50,596 | |
800 | | Murphy Oil Corp. | | 39,640 | |
1,900 | | Occidental Petroleum Corp. | | 146,585 | |
3,500 | | Southwestern Energy Co. (3) | | 135,240 | |
2,400 | | Suncor Energy, Inc. | | 70,656 | |
2,200 | | Ultra Petroleum Corp. (3) | | 97,350 | |
| | | | 573,743 | |
Finance (7.5%) | | | |
1,200 | | Aflac, Inc. | | 51,204 | |
5,200 | | Bank of America Corp. | | 74,724 | |
2,100 | | Bank of New York Mellon Financial Corp. | | 51,849 | |
225 | | CME Group, Inc. | | 63,349 | |
| | | | | |
Quantity/Par($) Name of Issuer | | Fair Value ($)(1) | |
| | | | | |
700 | | Franklin Resources, Inc. | | 60,333 | |
700 | | Goldman Sachs Group, Inc. | | 91,889 | |
3,000 | | JPMorgan Chase & Co. | | 109,830 | |
200 | | M&T Bank Corp. | | 16,990 | |
300 | | Northern Trust Corp. | | 14,010 | |
500 | | PartnerRe, Ltd. | | 35,070 | |
800 | | Prudential Financial, Inc. | | 42,928 | |
1,000 | | The Travelers Companies, Inc. | | 49,250 | |
1,500 | | U.S. Bancorp | | 33,525 | |
3,900 | | Wells Fargo & Co. | | 99,840 | |
| | | | 794,791 | |
Health Services (0.9%) | | | |
600 | | McKesson Corp. | | 40,296 | |
900 | | Medco Health Solutions, Inc. (3) | | 49,572 | |
| | | | 89,868 | |
Health Technology (6.6%) | | | |
700 | | Abbott Laboratories | | 32,746 | |
600 | | Allergan, Inc. | | 34,956 | |
650 | | Baxter International, Inc. | | 26,416 | |
2,500 | | Celgene Corp. (3) | | 127,050 | |
1,500 | | Genzyme Corp. (3) | | 76,155 | |
2,500 | | Gilead Sciences, Inc. (3) | | 85,700 | |
200 | | Intuitive Surgical, Inc. (3) | | 63,124 | |
1,000 | | Johnson & Johnson | | 59,060 | |
1,100 | | Medtronic, Inc. | | 39,897 | |
700 | | St. Jude Medical, Inc. (3) | | 25,263 | |
1,700 | | Thermo Fisher Scientific, Inc. (3) | | 83,385 | |
750 | | Varian Medical Systems, Inc. (3) | | 39,210 | |
| | | | 692,962 | |
Industrial Services (0.8%) | | | |
1,550 | | Schlumberger, Ltd. | | 85,777 | |
Non-Energy Minerals (0.6%) | | | |
650 | | Allegheny Technologies, Inc. | | 28,724 | |
500 | | Freeport-McMoran, Inc. | | 29,565 | |
| | | | 58,289 | |
Process Industries (1.1%) | | | |
1,500 | | Ecolab, Inc. | | 67,365 | |
700 | | Praxair, Inc. | | 53,193 | |
| | | | 120,558 | |
Producer Manufacturing (5.1%) | | | |
725 | | 3M Co. | | 57,268 | |
2,900 | | ABB, Ltd., A.D.R. | | 50,112 | |
1,300 | | Danaher Corp. | | 48,256 | |
1,400 | | Deere & Co. | | 77,952 | |
1,300 | | Emerson Electric Co. | | 56,797 | |
4,200 | | General Electric Co. | | 60,564 | |
500 | | Goodrich Corp. | | 33,125 | |
500 | | Lockheed Martin Corp. | | 37,250 | |
12
| | | | |
| | |
| |
| | |
| | |
|
| |
| | | | |
|
| | | | | |
Quantity/Par($) Name of Issuer | | Fair Value ($)(1) | |
| | | | | |
400 | | Precision Castparts Corp. | | 41,168 | |
1,100 | | United Technologies Corp. | | 71,401 | |
| | | | 533,893 | |
Retail Trade (4.5%) | | | |
1,450 | | Best Buy Co., Inc. | | 49,097 | |
800 | | Costco Wholesale Corp. | | 43,864 | |
2,550 | | CVS/Caremark Corp. | | 74,766 | |
1,400 | | Home Depot, Inc. | | 39,298 | |
1,400 | | Kohl’s Corp. (3) | | 66,500 | |
2,100 | | Target Corp. | | 103,257 | |
1,975 | | Wal-Mart Stores, Inc. | | 94,938 | |
| | | | 471,720 | |
Technology Services (5.4%) | | | |
2,600 | | Accenture Ltd. | | 100,490 | |
2,000 | | Adobe Systems, Inc. (3) | | 52,860 | |
375 | | Google, Inc. (3) | | 166,856 | |
5,000 | | Microsoft Corp. | | 115,050 | |
6,300 | | Oracle Corp. | | 135,198 | |
| | | | 570,454 | |
Transportation (1.5%) | | | |
1,400 | | Expeditors Intl. of Washington, Inc. | | 48,314 | |
1,100 | | Union Pacific Corp. | | 76,461 | |
625 | | United Parcel Service, Inc. | | 35,556 | |
| | | | 160,331 | |
Utilities (0.6%) | | | |
1,350 | | Calpine Corp. (3) | | 17,172 | |
900 | | Wisconsin Energy Corp. | | 45,666 | |
| | | | 62,838 | |
Total common stocks | | 6,495,026 | |
(cost: $6,169,101) | | | |
| | | | | |
Bonds (32.1%) (2) | | | |
Asset-Backed Securities (3.2%) | | |
100,000 | | Centex Home Equity 2004-D AF4, | | | |
| | 4.68%, 6/25/32 | | 97,435 | |
63,158 | | Chase Funding 2003-6 1A4, | | | |
| | 4.49%, 11/25/34 | | 61,173 | |
| | Countrywide Home Equity: | | | |
44,272 | | 2003-5 AF6, 4.81%, 1/25/34 | | 41,294 | |
46,315 | | 2004-10 AF5B, 5.11%, 2/25/35 | | 43,000 | |
| | Green Tree Financial Corp: | | | |
17,007 | | 1997-1 A6, 7.29%, 3/15/28 | | 18,045 | |
20,173 | | 1997-6 A10, 6.87%, 1/15/29 | | 21,452 | |
| | Origen Mfg. Housing: | | | |
12,398 | | 2001-A A5, 7.08%, 3/15/32 | | 12,506 | |
11,057 | | 2002-A A3, 6.17%, 5/15/23 | | 11,292 | |
31,445 | | Residential Funding 2003-HI2 A6, | | | |
| | 4.76%, 7/25/28 | | 30,591 | |
| | | | 336,788 | |
| | | | | |
Quantity/Par($) Name of Issuer | | Fair Value ($)(1) | |
| | | | | |
Collateralized Mortgage Obligations (4.0%) | | | |
19,520 | | Bank of America Funding Corp. | | | |
| | 2003-2 1A1, 6.50%, 6/25/32 | | 20,355 | |
29,789 | | Federal National Mtg. Association, | | | |
| | 7.00%, 2/25/44 | | 33,498 | |
138,646 | | GNR Series 2005-74 HA, 7.50%, 9/16/35 | | 157,866 | |
218 | | GSR Mortgage Loan Trust 2005-4F 5A2, 6.00%, 5/25/35 | | 208 | |
21,956 | | Master Asset Securitization Trust | | | |
| | 2003-4 CA1, 8.00%, 5/25/18 | | 22,624 | |
41,658 | | Residential Funding Mtg. Securities | | | |
| | 2005-S6 A2, 5.25%, 8/25/35 | | 40,876 | |
44,250 | | Specialty Underwriting & Residential Fin. 2004-AA1 2A2, 5.50%, 10/25/34 | | 42,578 | |
75,270 | | Vendee Mtg. Tr., 2008-1 B, 8.21%, 3/15/25 | | 84,114 | |
17,481 | | Washington Mutual Mtg. Pass-Through 2002-S8, 5.25%, 1/25/18 | | 17,866 | |
| | | | 419,985 | |
Corporate Bonds (6.7%) | | | |
50,000 | | Bank of America Corp, 5.63%, 7/1/20 | | 50,397 | |
25,000 | | Comerica Bank, 8.38%, 7/15/24 | | 27,131 | |
97,979 | | Continental Airlines, 9.00%, 7/8/16 | | 105,327 | |
50,000 | | Delta Air Lines, 6.20%, 7/2/18 | | 50,000 | |
75,000 | | JPM Chase Capital, 6.80%, 10/1/37 | | 74,128 | |
45,000 | | NTC Capital, variable rate, 1/15/27 | | 36,515 | |
25,000 | | PartnerRe Finance, 5.50%, 6/1/20 | | 24,160 | |
85,381 | | Procter & Gamble ESOP, 9.36%, 1/1/21 | | 108,016 | |
50,000 | | Renre NA Hldgs., 5.75%, 3/15/20 | | 49,837 | |
68,920 | | SW Airlines 07-1 Trust, 6.65%, 8/1/22 (5) | | 69,954 | |
100,000 | | Wachovia Bank, 6.00%, 11/15/17 | | 109,130 | |
| | | | 704,595 | |
Federal Home Loan Mortgage Corporation (2.9%) | | | |
62,451 | | 7.00%, 7/1/32 | | 69,474 | |
46,190 | | 7.00%, 5/1/34 | | 51,384 | |
80,195 | | 7.00%, 11/1/37 | | 89,301 | |
42,038 | | 7.50%, 11/1/36 | | 48,037 | |
24,585 | | 8.00%, 9/1/15 | | 26,958 | |
22,206 | | 8.38%, 5/17/20 | | 24,954 | |
| | | | 310,108 | |
Federal National Mortgage Association (5.7%) | | | |
65,881 | | 6.63%, 11/1/30 | | 74,461 | |
51,921 | | 6.63%, 1/1/31 | | 58,683 | |
43,705 | | 7.00%, 12/1/32 | | 49,515 | |
57,981 | | 7.23%, 12/1/30 | | 66,062 | |
12,477 | | 7.50%, 6/1/32 | | 14,251 | |
39,965 | | 7.50%, 4/1/33 | | 44,396 | |
48,071 | | 8.00%, 2/1/31 | | 55,675 | |
14,503 | | 8.47%, 4/15/26 | | 16,831 | |
10,101 | | 9.50%, 5/1/27 | | 11,811 | |
See accompanying notes to portfolios of investments on page 48.
13
| | | | |
| Sit Balanced Fund | | | |
| | | | |
| Portfolio of Investments - June 30, 2010
| | | |
| | | | |
|
| | | | | |
Quantity/Par($) Name of Issuer | | Fair Value ($)(1) | |
| | | | | |
3,031 | | 9.75%, 1/1/13 | | 3,285 | |
2,440 | | 10.25%, 6/15/13 | | 2,647 | |
56,223 | | 7.00%, 12/1/36 | | 63,367 | |
19,562 | | 7.50%, 4/1/38 | | 21,730 | |
41,764 | | 7.50%, 11/1/33 | | 46,394 | |
63,437 | | 7.50%, 1/1/34 | | 70,470 | |
4,769 | | 11.00%, 12/1/12 | | 5,204 | |
| | | | 604,782 | |
Government National Mortgage Association (4.2%) | | | |
93,764 | | 6.20%, 9/15/40 | | 100,005 | |
52,751 | | 6.63%, 4/20/31 | | 58,722 | |
36,913 | | 7.00%, 12/15/24 | | 41,940 | |
57,752 | | 7.23%, 12/20/30 | | 65,047 | |
67,232 | | 8.00%, 7/15/24 | | 73,391 | |
76,396 | | 8.375%, 3/15/31 | | 89,411 | |
404 | | 9.00%, 6/15/11 | | 429 | |
5,386 | | 9.00%, 11/15/16 | | 5,962 | |
753 | | 9.50%, 5/20/16 | | 837 | |
1,269 | | 9.50%, 9/20/18 | | 1,454 | |
167 | | 11.25%, 10/15/11 | | 179 | |
| | | | 437,377 | |
| | | | | |
Taxable Municipal Securities (0.7%) | | | |
100,000 | | Academica School, 8.00%, 8/15/24 | | 72,086 | |
| | | | | |
U.S. Government / Federal Agency Securities (4.7%) | | | |
| | U.S. Treasury Strips, Zero Coupon: | | | |
675,000 | | 4.22% effective yield, 11/15/21 | | 451,176 | |
125,000 | | 4.21% effective yield, 2/15/36 | | 44,431 | |
| | | | 495,607 | |
| | | | | |
Total bonds | | 3,381,328 | |
(cost: $3,282,067) | | | |
| | | | | |
Closed-End Mutual Funds (3.2%) (2) | | | |
6,309 | | American Select Portfolio | | 77,664 | |
5,603 | | American Strategic, Inc. Portfolio | | 74,520 | |
10,600 | | American Strategic, Inc. Portfolio II | | 110,028 | |
8,700 | | American Strategic, Inc. Portfolio III | | 78,735 | |
Total closed-end mutual funds | | 340,947 | |
(cost: $337,663) | | | |
| | | | | |
| | | | | |
Short-Term Securities (3.0%) (2) | | | |
317,961 | | Wells Fargo Adv. Govt. Fund, 0.04% | | 317,961 | |
(cost: $317,961) | | | |
| | | | | |
Total investments in securities | | $ 10,535,262 | |
(cost: $10,106,792) (4) | | | |
See accompanying notes to portfolios of investments on page 48.
14
This page has been left blank intentionally.
15
| | | | |
| Sit Dividend Growth Fund - Class I and Class S | | | |
| One Year Ended June 30, 2010 | | | |
| | | | |
| Portfolio Managers: Roger J. Sit, Kent L. Johnson, and Michael J. Stellmacher
| | | |
| | | | |
The Sit Dividend Growth Fund Class I posted a +12.71% return over the last twelve months, compared to the +14.43% return for the S&P 500 Index.
Stock prices responded to the improvement in economic conditions over the past twelve months. Our analysis has concluded that market gains were fueled, in particular, by a strong rally in lower quality stocks, which tend to have characteristics such as high debt levels, low stock prices and more volatile earnings. While this is a “typical” rally at the beginning of an economic cycle, we continue to caution investors that a classic, strong recovery is not likely given the headwinds of high debt levels, weak real estate markets and a fading impact from stimulus. The good news, however, is that stock valuations are attractive, balance sheets are solid, and corporate earnings have been exceptional. We continue to believe that high quality, dividend-paying companies are attractive in an environment of modest economic growth and low inflation. It is encouraging to note that dividend increases, once again, are on the rise. Over the past twelve months, 58 companies within the Fund (out of 94 current holdings, or 62%) have increased their dividends, with an average increase of +12%.
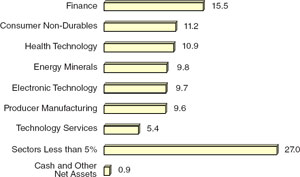
The finance sector remains the heaviest weighting in the Fund, followed by consumer non-durables and health technology. In addition, the Fund’s financial characteristics related to “stability” (e.g., earnings consistency, balance sheet strength) and “quality” (e.g., high return on capital, cash flow generation) are superior to the S&P 500 Index average. We believe these metrics will carry particular importance in an environment of slow corporate earnings growth and somewhat higher market volatility, which we foresee in the months ahead.
The Fund’s twelve-month underperformance was driven by negative stock selection in the electronic technology sector, which was largely driven by the absence of non-dividend paying Apple in the Fund. This is significant because the shares of Apple carry a large weight within the S&P 500 Index and rose over +76% during the period. On the positive side, stock selection was strong in energy minerals, retail trade and consumer durables. The Fund’s most significant contributors to performance included Atlas Energy, Lufkin Industries and Apollo Investment, while the most negative contributors were Total, Qualcomm and Baxter International.
INVESTMENT OBJECTIVE AND STRATEGY |
The objective of the Dividend Growth Fund is to provide current income that exceeds the dividend yield of the S&P 500 Index and that grows over a period of years. Secondarily, the Fund seeks long-term capital appreciation.
The Fund seeks to achieve its objectives by investing, under normal market conditions, at least 80% of its net assets in dividend-paying common stocks. The Fund may invest the balance of its assets in preferred stocks, convertible bonds, and U.S. Treasury securities.
| | | | |
| | Class I | | Class S |
| | | | |
Net Asset Value | | | | |
| | | | |
6/30/10: | | $10.64 Per Share | | $10.61 Per Share |
| | | | |
6/30/09: | | $9.60 Per Share | | $9.58 Per Share |
| | | | |
Total Net Assets | | $39.4 Million | | $24.9 Million |
| | | | |
Weighted Average Market Cap: | | $58.1 Billion |
PORTFOLIO STRUCTURE - BY SECTOR
(% OF TOTAL NET ASSETS) |
16
| | | | |
| | |
| |
| | |
| | |
|
| |
| | | | |
| | | | | | | | | | | | | | | |
| | | | | | | | | | | | | | | |
| AVERAGE ANNUAL TOTAL RETURNS* | |
| | | | | | | | | | | | | | | |
| | | Class
I | | S&P 500
Index(1) | | Class
S | | S&P 500
Index(1) | | |
| | | | | | | | | | | | | | | |
| 3 Month** | | -9.91 | % | | -11.42 | % | | -9.99 | % | | -11.42 | % | | |
| 6 Month** | | -6.19 | | | -6.65 | | | -6.35 | | | -6.65 | | | |
| 1 Year | | 12.71 | | | 14.43 | | | 12.37 | | | 14.43 | | | |
| 3 Year | | -5.02 | | | -9.81 | | | -5.27 | | | -9.81 | | | |
| 5 Year | | 3.33 | | | -0.79 | | | n/a | | | n/a | | | |
| Inception*** | | 4.65 | | | 0.85 | | | 0.73 | | | -3.18 | | | |
| | | | | | | | | | | | | | | |
| CUMULATIVE TOTAL RETURNS* | |
| | | | | | | | | | | | | | | |
| | | Class | | S&P 500 | | Class | | S&P 500 | | |
| | | I | | Index(1) | | S | | Index(1) | | |
| | | | | | | | | | | | | | | |
| 1 Year | | 12.71 | % | | 14.43 | % | | 12.37 | % | | 14.43 | % | | |
| 3 Year | | -14.33 | | | -26.65 | | | -14.99 | | | -26.65 | | | |
| 5 Year | | 17.81 | | | -3.91 | | | n/a | | | n/a | | | |
| Inception*** | | 34.40 | | | 5.68 | | | 3.16 | | | -12.82 | | | |
| | | | | | | | | | | | | | | |
| *As of 6/30/10 | | | | | | | | | | | |
| | | | | | | | | | | | | | | |
| **Not annualized. | | | | | | | | | | | |
| | | | | | | | | | | | | | | |
| ***Dividend Growth Fund Class I Inception was 12/31/03; Dividend Growth Fund Class S Inception was 3/31/06.
| |
| | |
Performance figures are historical and do not guarantee future results. Investment returns and principal value will vary, and you may have a gain or loss when you sell shares. Average annual total returns include changes in share price as well as reinvestment of all dividends and capital gains. Management fees and administrative expenses are included in the Fund’s performance.
| |
(1) | An unmanaged index which measures the performance of 500 widely held common stocks of large-cap companies. |
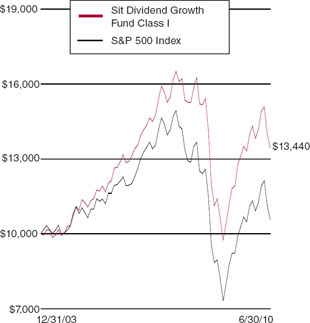
The sum of $10,000 invested at inception (12/31/03) and held until 6/30/10 would have grown to $13,440 in the Fund or $10,568 in the S&P 500 Index assuming reinvestment of all dividends and capital gains.
| | |
| 1. | IBM Corp. |
| 2. | Johnson & Johnson |
| 3. | Chevron Corp. |
| 4. | Verizon Communications, Inc. |
| 5. | J.P. Morgan Chase & Co. |
| 6. | PepsiCo, Inc. |
| 7. | Procter & Gamble Co. |
| 8. | 3M Co. |
| 9. | Intel Corp. |
| 10. | Philip Morris International, Inc. |
| | Total Number of Holdings: 94 |
17
| | | | |
| Sit Dividend Growth Fund | | | |
| | | | |
| Portfolio of Investments - June 30, 2010
| | | |
| | | | |
|
| | | | | |
Quantity | | Name of Issuer | Fair Value ($)(1) | |
| | | | | |
Common Stocks (97.4%) (2) |
Communications (3.7%) |
5,000 | | Millicom Intl. Cellular S.A. | | 405,350 | |
14,800 | | Rogers Communications, Inc. | | 484,848 | |
53,000 | | Verizon Communications, Inc. | | 1,485,060 | |
| | | | 2,375,258 | |
| | | | | |
Consumer Durables (2.1%) |
6,500 | | Polaris Industries, Inc. | | 355,030 | |
17,000 | | Snap-on, Inc. | | 695,470 | |
8,000 | | Tupperware Brands Corp. | | 318,800 | |
| | | | 1,369,300 | |
| | | | | |
Consumer Non-Durables (11.2%) |
10,700 | | Colgate-Palmolive Co. | | 842,732 | |
11,900 | | Diageo p.l.c. | | 746,606 | |
27,100 | | General Mills, Inc. | | 962,592 | |
8,300 | | Lancaster Colony Corp. | | 442,888 | |
5,700 | | NIKE, Inc. | | 385,035 | |
23,000 | | PepsiCo, Inc. | | 1,401,850 | |
23,000 | | Philip Morris International, Inc. | | 1,054,320 | |
22,900 | | Procter & Gamble Co. | | 1,373,542 | |
| | | | 7,209,565 | |
| | | | | |
Consumer Services (2.2%) |
14,700 | | McDonald’s Corp. | | 968,289 | |
33,700 | | Pearson, A.D.R. | | 443,155 | |
| | | | 1,411,444 | |
| | | | | |
Electronic Technology (9.7%) |
53,600 | | Applied Materials, Inc. | | 644,272 | |
11,400 | | Broadcom Corp. | | 375,858 | |
54,800 | | Intel Corp. | | 1,065,860 | |
16,900 | | IBM Corp. | | 2,086,812 | |
21,900 | | Linear Technology Corp. | | 609,039 | |
28,300 | | Qualcomm, Inc. | | 929,372 | |
20,300 | | Tyco Electronics, Ltd. | | 515,214 | |
| | | | 6,226,427 | |
| | | | | |
Quantity | | Name of Issuer | Fair Value ($)(1) | |
| | | | | |
Energy Minerals (9.8%) |
6,000 | | Apache Corp. | | 505,140 | |
23,900 | | Chevron Corp. | | 1,621,854 | |
18,500 | | EQT Corp. | | 668,590 | |
22,800 | | Marathon Oil Corp. | | 708,852 | |
11,300 | | Murphy Oil Corp. | | 559,915 | |
13,100 | | Occidental Petroleum Corp. | | 1,010,665 | |
9,000 | | Sasol, A.D.R. | | 317,430 | |
20,400 | | Total, A.D.R. | | 910,656 | |
| | | | 6,303,102 | |
|
Finance (15.5%) |
12,000 | | ACE, Ltd. | | 617,760 | |
13,100 | | Allied World Assurance Co. Hldgs. | | 594,478 | |
18,000 | | Ameriprise Financial, Inc. | | 650,340 | |
31,500 | | Apollo Investment Corp. | | 293,895 | |
17,300 | | Bank of New York Mellon Corp. | | 427,137 | |
7,360 | | Franklin Resources, Inc. | | 634,358 | |
39,350 | | J.P. Morgan Chase & Co. | | 1,440,603 | |
44,100 | | Northwest Bancshares, Inc. | | 505,827 | |
8,800 | | PartnerRe, Ltd. | | 617,232 | |
35,700 | | PennantPark Investment Corp. | | 340,935 | |
10,200 | | Prudential Financial, Inc. | | 547,332 | |
13,500 | | Royal Bank of Canada | | 645,165 | |
17,900 | | The Travelers Companies, Inc. | | 881,575 | |
34,700 | | U.S. Bancorp | | 775,545 | |
39,800 | | Wells Fargo & Co. | | 1,018,880 | |
| | | | 9,991,062 | |
|
Health Services (2.0%) |
8,400 | | McKesson Corp. | | 564,144 | |
16,150 | | Owens & Minor, Inc. | | 458,337 | |
11,600 | | Pharmaceutical Product Dev., Inc. | | 294,756 | |
| | | | 1,317,237 | |
|
Health Technology (10.9%) |
20,100 | | Abbott Laboratories | | 940,278 | |
19,600 | | Baxter International, Inc. | | 796,544 | |
11,200 | | Becton, Dickinson & Co. | | 757,344 | |
10,350 | | Eli Lilly and Co. | | 346,725 | |
28,600 | | Johnson & Johnson | | 1,689,116 | |
22,400 | | Medtronic, Inc. | | 812,448 | |
26,192 | | Meridian Bioscience, Inc. | | 445,264 | |
12,600 | | Teva Pharmaceutical, A.D.R. | | 655,074 | |
12,000 | | Thermo Fisher Scientific, Inc. (3) | | 588,600 | |
| | | | 7,031,393 | |
18
| | | | |
| | |
| |
| | |
| | |
|
| |
| | | | |
|
| | | | | |
Quantity/Par ($) Name of Issuer | Fair Value ($)(1) | |
| | | | | |
Industrial Services (1.9%) |
18,800 | | Halliburton Co. | | 461,540 | |
13,500 | | National-Oilwell Varco, Inc. | | 446,445 | |
15,400 | | Seadrill, Ltd. | | 281,512 | |
| | | | 1,189,497 | |
|
Non-Energy Minerals (1.4%) |
7,900 | | BHP Billiton, Ltd. | | 489,721 | |
12,520 | | Haynes International, Inc. | | 385,992 | |
| | | | 875,713 | |
| | | | | |
Process Industries (1.9%) |
22,900 | | E. I. du Pont de Nemours and Co. | | 792,111 | |
23,600 | | RPM International, Inc. | | 421,024 | |
| | | | 1,213,135 | |
|
Producer Manufacturing (9.6%) |
15,500 | | 3M Co. | | 1,224,345 | |
29,600 | | ABB, Ltd., A.D.R. | | 511,488 | |
11,100 | | Cooper Industries | | 488,400 | |
15,500 | | Deere & Co. | | 863,040 | |
13,700 | | Emerson Electric Co. | | 598,553 | |
45,300 | | General Electric Co. | | 653,226 | |
10,800 | | Goodrich Corp. | | 715,500 | |
4,100 | | Lockheed Martin Corp. | | 305,450 | |
12,900 | | United Technologies Corp. | | 837,339 | |
| | | | 6,197,341 | |
Retail Trade (4.6%) |
20,047 | | Cato Corp. | | 441,435 | |
17,300 | | Home Depot, Inc. | | 485,611 | |
15,500 | | Target Corp. | | 762,135 | |
7,800 | | TJX Co | | 327,210 | |
19,700 | | Wal-Mart Stores, Inc. | | 946,979 | |
| | | | 2,963,370 | |
Technology Services (5.4%) |
20,000 | | Accenture, Ltd. | | 773,000 | |
11,600 | | Automatic Data Processing, Inc. | | 467,016 | |
42,200 | | Microsoft Corp. | | 971,022 | |
39,700 | | Oracle Corp. | | 851,962 | |
12,222 | | Syntel, Inc. | | 414,937 | |
| | | | 3,477,937 | |
Transportation (2.4%) |
7,000 | | Expeditors Intl. of Washington, Inc. | | 241,570 | |
9,600 | | Union Pacific Corp. | | 667,296 | |
11,050 | | United Parcel Service, Inc. | | 628,634 | |
| | | | 1,537,500 | |
| | | | | |
Quantity | | Name of Issuer | Fair Value ($)(1) | |
| | | | | |
Utilities (3.1%) | |
8,900 | | Enbridge, Inc. | | 414,740 | |
13,700 | | NextEra Energy, Inc. | | 668,012 | |
16,200 | | UGI Corp. | | 412,128 | |
9,700 | | Wisconsin Energy Corp. | | 492,178 | |
| | | | 1,987,058 | |
| | | | | |
Total common stocks | | 62,676,339 | |
(cost: $63,386,354) | | | |
| | | | | |
Closed-End Mutual Funds (1.7%) (2) |
18,950 | | Kayne Anderson MLP Invest. Co. | | 495,922 | |
25,400 | | Tortoise Energy Capital Corp. | | 581,914 | |
| | | | | |
Total closed-end mutual funds | | 1,077,836 | |
(cost: $894,050) | | | |
| | | | | |
Short-Term Securities (0.4%) (2) |
229,863 | | Wells Fargo Adv. Govt. Fund, 0.04% | | 229,863 | |
(cost: $229,863) | | | |
| | | | | |
Total investments in securities | | | |
(cost: $64,510,267) (4) | | $ 63,984,038 | |
See accompanying notes to portfolios of investments on page 48.
19
| | | | |
| Sit Global Dividend Growth Fund - Class I and Class S | | | |
| One Year Ended June 30, 2010 | | | |
| | | | |
| Portfolio Managers: Roger J. Sit, Kent L. Johnson, Raymond E. Sit, Michael J. Stellmacher, Tasha M. Murdoff
| | | |
| | | | |
The Sit Global Dividend Growth Fund Class I posted a +8.79% return over the last twelve months, compared to +11.06% return for the Composite Index (60% S&P 500 Index and 40% MSCI EAFE Index).
On an industry basis, the Fund’s twelve-month underperformance was largely due to negative stock selection in the technology hardware and semiconductor industries, which was largely driven by the absence of Apple in the Fund. This is significant because the shares of Apple carry a large weight within the Composite Index and rose approximately +76% during the period. Additionally, the Fund’s large weight in the underperforming Qualcomm detracted from performance. Stock selection was positive in the energy, capital goods, and diversified financial industries.
On a geographical basis, North America was the largest relative detractor due to both stock selection and allocation. On the positive side, Japan and the UK contributed the most to performance, a result of positive stock selection and allocation effect. In Japan, Aflac was the top contributor, while in the UK it was Pearson and Burberry.
Over the past twelve months, global stock prices responded to improved economic conditions. The market gains were fueled mostly by a strong rally in lower quality stocks, which tend to have characteristics such as high debt levels, low stock prices, and more volatile earnings. While this is a “typical” rally at the beginning of an economic cycle, we continue to caution investors that a classic, strong recovery is not likely given the headwinds of high debt levels, weak real estate markets, austerity measures, and a fading impact from stimulus. However, global stock valuations are attractive, balance sheets are strong, and corporate earnings have been good, although a slowdown in profit growth is likely the remainder of this year. We continue to believe that global, high quality, dividend-paying companies are attractive in an environment of modest economic growth and low inflation. It is encouraging to note that dividend increases are on the rise. Over the past twelve months, 56 companies within the Fund (out of 98 current holdings, or 57%) have increased their dividends.
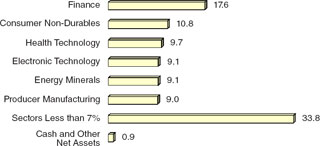
The finance sector remains the heaviest weighting in the Fund (with an emphasis on insurance and bank stocks), followed by consumer non-durables and health technology. Our research effort remains highly focused on companies with strong, experienced management teams, sound balance sheets, and sustainable earnings, and global dividend growth potential.
INVESTMENT OBJECTIVE AND STRATEGY |
The objective of the Global Dividend Growth Fund is to provide current income that exceeds the dividend yield of a composite index (comprised of 60% S&P 500 Index and 40% MSCI EAFE Index) and that grows over a period of years. Secondarily, the Fund seeks long-term capital appreciation.
The Fund seeks to achieve its objectives by investing, under normal market conditions, at least 80% of its net assets in dividend-paying common stocks issued by U.S. and foreign companies. The Fund may invest the balance of its assets in preferred stocks, convertible bonds, and U.S. Treasury securities.
| | | | |
| | Class I | | Class S |
| | | | |
Net Asset Value | | | | |
| | | | |
6/30/10: | | $10.41 Per Share | | $10.40 Per Share |
| | | | |
6/30/09: | | $9.70 Per Share | | $9.70 Per Share |
| | | | |
Total Net Assets | | $2.8 Million | | $0.9 Million |
| | | | |
Weighted Average Market Cap: $64.1 Billion |
PORTFOLIO STRUCTURE - BY SECTOR
(% OF TOTAL NET ASSETS) |
20
| | | | |
| | |
| |
| | |
| | |
|
| |
| | | | |
| | | | | | | | | | | | | |
| |
AVERAGE ANNUAL TOTAL RETURNS* | |
|
| | | | | | | | | | | | | |
| | | 3 Month** | | 6 Month** | | 1 Year | | Since
Inception
(9/30/08) | |
| | | | | | | | | | | | | |
| Class I | | -12.73 | % | | -9.79 | % | | 8.79 | % | 3.69 | % | |
| Class S | | -12.79 | | | -9.93 | | | 8.47 | | 3.45 | | |
| Composite Index(1) | | -12.40 | | | -9.28 | | | 11.06 | | -4.60 | | |
| S&P 500
Index(2) | | -11.42 | | | -6.65 | | | 14.43 | | -4.57 | | |
| MSCI EAFE Index(3) | | -13.97 | | | -13.23 | | | 5.92 | | -4.94 | | |
| | | | | | | | | | | | | |
CUMULATIVE TOTAL RETURNS* | |
| | | | | | | | | | | | | |
| | | 3 Month | | 6 Month | | 1 Year | | Since
Inception
(9/30/08) | |
| | | | | | | | | | | | | |
| Class I | | -12.73 | % | | -9.79 | % | | 8.79 | % | 6.55 | % | |
| Class S | | -12.79 | | | -9.93 | | | 8.47 | | 6.10 | | |
| Composite Index(1) | | -12.40 | | | -9.28 | | | 11.06 | | -7.91 | | |
| S&P 500
Index(2) | | -11.42 | | | -6.65 | | | 14.43 | | -7.85 | | |
| MSCI EAFE Index(3) | | -13.97 | | | -13.23 | | | 5.92 | | -8.47 | | |
| | | | | | | | | | | | | |
| *As of 6/30/10 | | | | | | | | | | |
| | | | | | | | | | | | | |
| **Not annualized. | | | | | | | | | | |
| | | | | | | | | | | | | |
| | |
Performance figures are historical and do not guarantee future results. Investment returns and principal value will vary, and you may have a gain or loss when you sell shares. Average annual total returns include changes in share price as well as reinvestment of all dividends and capital gains. Management fees and administrative expenses are included in the Fund’s performance.
| |
| | |
| |
(1) | (Hypothetical) Composite Index comprised of 60% S&P 500 Index and 40% MSCI EAFE Index. |
(2) | An unmanaged index which measures the performance of 500 widely held common stocks of large-cap companies. |
(3) | A free float-adjusted market capitalization index that is designed to measure the equity market performance of developed markets, excluding the U.S. & Canada. The Index currently comprises 21 developed market country indices. |

The sum of $10,000 invested at inception (9/30/08) and held until 6/30/10 would have grown to $10,655 in the Fund or declined to $9,209 in the Composite Index, $9,215 in the S&P 500 Index, or $9,153 in the MSCI EAFE Index assuming reinvestment of all dividends and capital gains.
| | |
| 1. | IBM Corp. |
| 2. | BHP Billiton, A.D.R. |
| 3. | Rio Tinto, A.D.R. |
| 4. | McDonald’s Corp. |
| 5. | Procter & Gamble Co. |
| 6. | Johnson & Johnson |
| 7. | Philip Morris International, Inc. |
| 8. | PepsiCo, Inc. |
| 9. | Verizon Communications, Inc. |
| 10. | Chevron Corp. |
| | Total Number of Holdings: 98
|
21
| | | | |
| Sit Global Dividend Growth Fund | | | |
| | | | |
| Portfolio of Investments - June 30, 2010
| | | |
| | | | |
|
| | | | | |
Quantity | | Name of Issuer | | Fair Value ($)(1) | |
| | | | | |
Common Stocks (96.5%) (2) | | | |
Asia (9.7%) | | | |
Australia (5.3%) | | | |
1,500 | | BHP Billiton, A.D.R. (Non-Energy Minerals) | | 92,985 | |
2,000 | | Rio Tinto, A.D.R. (Non-Energy Minerals) | | 87,200 | |
200 | | Westpac Banking, A.D.R. (Finance) | | 17,716 | |
| | | | 197,901 | |
Hong Kong / China (2.1%) | | | |
1,014 | | HSBC Holdings, p.l.c. (Finance) | | 46,228 | |
5,000 | | Hutchison Whampoa, Ltd. (Producer Manufacturing) | | 30,770 | |
| | | | 76,998 | |
Japan * (2.3%) | | | |
700 | | AFLAC, Inc., A.D.R. (Finance) | | 29,869 | |
1,000 | | Canon, Inc., A.D.R. (Electronic Tech.) | | 37,310 | |
400 | | Oracle Corp. Japan (Tech. Services) | | 19,656 | |
| | | | 86,835 | |
Europe (26.7%) | | | |
France (3.3%) | | | |
925 | | Schlumberger, A.D.R. (Industrial Svcs.) | | 51,190 | |
1,050 | | Total, A.D.R. (Energy Minerals) | | 46,872 | |
1,075 | | Veolia Environment, A.D.R. (Utilities) | | 25,123 | |
| | | | 123,185 | |
Germany (1.8%) | | | |
210 | | Muenchener Rueckver (Finance) | | 26,368 | |
450 | | Siemens AG, A.D.R. (Producer Mfg.) | | 40,289 | |
| | | | 66,657 | |
Ireland (1.1%) | | | |
1,075 | | Accenture (Technology Services) | | 41,549 | |
| | | | | |
Israel (1.0%) | | | |
700 | | Teva Pharmaceutical, A.D.R. (Health Technology) | | 36,393 | |
Italy (1.4%) | | | |
8,800 | | Enel S.P.A. (Utilities) | | 37,261 | |
450 | | Tenaris, A.D.R. (Industrial Services) | | 15,575 | |
| | | | 52,836 | |
Luxembourg (0.4%) | | | |
200 | | Millicom International Cellular S.A. (Communications) | | 16,214 | |
| | | | | |
Netherlands (1.6%) | | | |
1,100 | | Philips Electronics, A.D.R. (Consumer Durables) | | 32,824 | |
1,100 | | TNT NV (Transportation) | | 27,706 | |
| | | | 60,530 | |
| | | | | |
Quantity | | Name of Issuer | | Fair Value ($)(1) | |
| | | | | |
Spain (2.1%) | | | |
1,700 | | Banco Santander, A.D.R. (Finance) | | 17,850 | |
580 | | Inditex (Consumer Durables) | | 33,072 | |
500 | | Telefonica, A.D.R. (Communications) | | 27,765 | |
| | | | 78,687 | |
Sweden (0.8%) | | | |
2,500 | | Ericsson, A.D.R. (Electronic Tech.) | | 27,550 | |
| | | | | |
Switzerland (6.1%) | | | |
2,200 | | ABB, Ltd., A.D.R. (Producer Mfg.) | | 38,016 | |
650 | | ACE, Ltd., A.D.R. (Finance) | | 33,462 | |
1,200 | | Credit Suisse Group, A.D.R. (Finance) | | 44,916 | |
400 | | Kuehne & Nagel Intl. A.G. (Transport.) | | 41,176 | |
1,060 | | Nestle, S.A. (Consumer Non-Durables) | | 51,112 | |
125 | | Roche Holdings, A.G. (Health Tech.) | | 17,205 | |
| | | | 225,887 | |
United Kingdom (7.1%) | | | |
655 | | British American Tobacco p.l.c. (Consumer Non-Durables) | | 20,787 | |
1,700 | | Burberry Group, p.l.c. (Retail Trade) | | 19,199 | |
800 | | Diageo, A.D.R. (Cons. Non-Durables) | | 50,192 | |
1,100 | | GlaxoSmithkline, A.D.R. (Health Tech.) | | 37,411 | |
3,800 | | Pearson, A.D.R. (Consumer Services) | | 49,970 | |
975 | | Royal Dutch Shell, A.D.R. (Energy Minerals) | | 47,073 | |
6,650 | | Tesco, p.l.c. (Retail Trade) | | 37,515 | |
| | | | 262,147 | |
North America (60.1%) | | | |
Bermuda (1.2%) | | | |
525 | | PartnerRe, Ltd. (Finance) | | 36,824 | |
500 | | Seadrill, Ltd. (Industrial Services) | | 9,140 | |
| | | | 45,964 | |
Canada (2.2%) | | | |
1,350 | | Rogers Communications, Inc. (Communications) | | 44,226 | |
775 | | Royal Bank of Canada (Finance) | | 37,037 | |
| | | | 81,263 | |
United States (56.7%) | | | |
|
Communications (1.5%) | | | |
2,050 | | Verizon Communications, Inc. | | 57,441 | |
| | | | | |
Consumer Durables (1.0%) | | | |
900 | | Snap-on, Inc. | | 36,819 | |
22
| | | | |
| | |
| |
| | |
| | |
|
| |
| | | | |
|
| | | | | |
Quantity | | Name of Issuer | | Fair Value ($)(1) | |
| | | | | |
Consumer Non-Durables (7.6%) | | | |
525 | | Colgate-Palmolive Co. | | 41,349 | |
1,400 | | General Mills, Inc. | | 49,728 | |
950 | | PepsiCo, Inc. | | 57,903 | |
1,350 | | Philip Morris International, Inc. | | 61,884 | |
1,150 | | Procter & Gamble Co. | | 68,977 | |
| | | | 279,841 | |
Consumer Services (1.9%) | | | |
1,050 | | McDonald’s Corp. | | 69,164 | |
| | | | | |
Electronic Technology (7.3%) | | | |
2,000 | | Applied Materials, Inc. | | 24,040 | |
2,800 | | Intel Corp. | | 54,460 | |
800 | | IBM Corp. | | 98,784 | |
1,400 | | Linear Technology Corp. | | 38,934 | |
1,700 | | Qualcomm, Inc. | | 55,828 | |
| | | | 272,046 | |
Energy Minerals (6.6%) | | | |
300 | | Apache Corp. | | 25,257 | |
825 | | Chevron Corp. | | 55,984 | |
1,025 | | EQT Corp. | | 37,043 | |
1,400 | | Marathon Oil Corp. | | 43,526 | |
600 | | Murphy Oil Corp. | | 29,730 | |
700 | | Occidental Petroleum Corp. | | 54,005 | |
| | | | 245,545 | |
Finance (7.1%) | | | |
425 | | Franklin Resources, Inc. | | 36,631 | |
200 | | Goldman Sachs Group, Inc. | | 26,254 | |
1,525 | | J.P. Morgan Chase & Co. | | 55,830 | |
475 | | Prudential Financial, Inc. | | 25,489 | |
550 | | The Travelers Companies, Inc. | | 27,088 | |
1,600 | | U.S. Bancorp | | 35,760 | |
2,150 | | Wells Fargo & Co. | | 55,040 | |
| | | | 262,092 | |
Health Services (0.9%) | | | |
500 | | McKesson Corp. | | 33,580 | |
| | | | | |
Health Technology (7.2%) | | | |
800 | | Abbott Laboratories | | 37,424 | |
1,125 | | Baxter International, Inc. | | 45,720 | |
725 | | Becton, Dickinson & Co. | | 49,024 | |
550 | | Eli Lilly and Co. | | 18,425 | |
1,075 | | Johnson & Johnson | | 63,489 | |
| | | | | |
Quantity | | Name of Issuer | | Fair Value ($)(1) | |
| | | | | |
1,000 | | Medtronic, Inc. | | 36,270 | |
325 | | Teleflex, Inc. | | 17,641 | |
| | | | 267,993 | |
Process Industries (0.8%) | | | |
800 | | E. I. du Pont De Nemours and Co. | | 27,672 | |
| | | | | |
Producer Manufacturing (5.2%) | | | |
625 | | 3M Co. | | 49,369 | |
450 | | Caterpillar, Inc. | | 27,031 | |
650 | | Deere & Co. | | 36,192 | |
1,175 | | General Electric Co. | | 16,943 | |
250 | | Lockheed Martin Corp. | | 18,625 | |
700 | | United Technologies Corp. | | 45,437 | |
| | | | 193,597 | |
Retail Trade (4.9%) | | | |
450 | | Best Buy Co., Inc. | | 15,237 | |
600 | | CVS Caremark Corp. | | 17,592 | |
1,200 | | Home Depot, Inc. | | 33,684 | |
925 | | Target Corp. | | 45,482 | |
650 | | TJX Co. | | 27,268 | |
900 | | Wal-Mart Stores, Inc. | | 43,263 | |
| | | | 182,526 | |
Technology Services (3.2%) | | | |
450 | | Automatic Data Processing, Inc. | | 18,117 | |
35 | | Google, Inc. (3) | | 15,573 | |
2,100 | | Microsoft Corp. | | 48,321 | |
1,800 | | Oracle Corp. | | 38,628 | |
| | | | 120,639 | |
Transportation (0.9%) | | | |
450 | | Union Pacific Corp. | | 31,280 | |
| | | | | |
Utilities (0.6%) | | | |
625 | | Exelon Corp. | | 23,731 | |
| | | | | |
Total common stocks for United States | | 2,103,966 | |
| | | | | |
Total common stocks | | 3,584,562 | |
(cost: $3,400,484) | | | |
| | | | | |
| | | | | |
Exchange Traded Funds (1.0%) (2) | | | |
4,000 | | iShares MSCI Japan * | | 36,800 | |
(cost: $36,590) | | | |
See accompanying notes to portfolios of investments on page 48.
23
| | | | |
| Sit Global Dividend Growth Fund | | | |
| | | | |
| Portfolio of Investments - June 30, 2010
| | | |
| | | | |
|
| | | | | | |
Quantity | | Name of Issuer | | Fair Value ($)(1) | |
| | | | | |
Closed-End Mutual Funds (1.6%) (2) | | | |
1,300 | | Tortoise Energy Capital Corp. | | 29,783 | |
1,200 | | Kayne Anderson MLP Invest. Co. | | 31,404 | |
Total closed-end mutual funds | | 61,187 | |
(cost: $45,430) | | | |
| | | | | |
Short Term Securities (0.7%) (2) | | | |
24,615 | | Wells Fargo Adv. Govt. Fund, 0.04% | | 24,615 | |
(cost: $24,615) | | | |
| | | | | |
Total investments in securities | | | |
(cost: $3,507,119) (4) | | $ | 3,707,164 | |
| |
* | The Fund’s total investment in Japan including the iShares comprises 3.3% of the Fund’s net assets. |
See accompanying notes to portfolios of investments on page 48.
24
This page has been left blank intentionally.
25
| | | | |
| Sit Large Cap Growth Fund | | | |
| One Year Ended June 30, 2010 | | | |
| | | | |
| Portfolio Managers: Roger J. Sit, Ronald D. Sit, and Michael J. Stellmacher
| | | |
| | | | |
The Sit Large Cap Growth Fund’s one-year return was +7.80%, compared to the +13.62% return for the Russell 1000® Growth Index. The S&P 500 Index return for the period was +14.43%.
U.S. equities posted solid gains over the past twelve months, as corporate profits responded to the improvement in economic conditions. Market sentiment fluctuated significantly over the past year as investors embraced risk (i.e., seeking low quality, high beta stocks), reversing the much more defensive positioning evident in prior quarters. While this change in risk posture can be largely tied to expectations for a “typical,” strong economic recovery, it has been our longstanding view that a more muted rebound is more likely for U.S. growth. To this point, the most recent economic data (e.g., employment and housing reports) have supported this view. Importantly, however, we believe there are many high quality growth stocks across a wide variety of sectors that are attractively valued. While we continue to emphasize the electronic technology sector within the Fund, we also see opportunities in other heavily weighted sectors, including finance, consumer non-durables and health technology. Across all sectors, we continue to emphasize “quality,” favoring companies with strong balance sheets, predictable earnings growth and consistent cash flow generation.
Relative to the Russell 1000 Growth Index, performance over the past year was negatively impacted by stock selection in the electronic technology, retail trade and communications sectors. In addition, the overweighting of the underperforming energy sector and the Fund’s cash position hurt relative performance. Conversely, stock selection in the utilities and energy minerals sectors helped results. In terms of individual stocks, Research in Motion (-31% total return over the past twelve months), Qualcomm (-26%) and Activision Blizzard (-16%) were the most significant laggards over the period. Key positive contributors included Intuitive Surgical (+93%), Deere (+42%) and Broadcom (+34%).
Our research effort is highly focused on companies with strong, experienced management teams, sound balance sheets and sustainable earnings growth potential. We continue to believe that this focus will reward our shareholders over the long term.
INVESTMENT OBJECTIVE AND STRATEGY |
The objective of the Large Cap Growth Fund is to maximize long-term capital appreciation. The Fund pursues this objective by investing at least 80% of its net assets in the common stocks of domestic growth companies with capitalizations of $5 billion or more at the time of purchase.
| | |
Net Asset Value 6/30/10: | | $34.75 Per Share |
6/30/09: | | $32.42 Per Share |
| | |
Total Net Assets: | | $407.4 Million |
| | |
Weighted Average Market Cap: | | $67.0 Billion |
PORTFOLIO STRUCTURE - BY SECTOR
(% OF TOTAL NET ASSETS) |
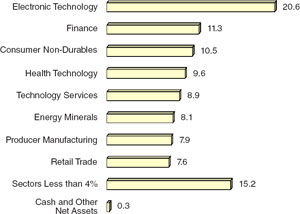
26
| | | | |
| | |
| |
| | |
| | |
|
| |
| | | | |
| | | | | | | | | | |
AVERAGE ANNUAL TOTAL RETURNS* | |
| | | | | | | |
| | Sit Large
Cap Growth
Fund | | Russell
1000® Growth
Index(1) | | Russell
1000®
Index(2) | |
| | | | | | | | | | |
3 Month** | | -12.64 | % | | -11.75 | % | | -11.44 | % | |
6 Month** | | -9.36 | | | -7.64 | | | -6.40 | | |
1 Year | | 7.80 | | | 13.62 | | | 15.24 | | |
5 Year | | 0.77 | | | 0.38 | | | -0.56 | | |
10 Year | | -4.65 | | | -5.14 | | | -1.22 | | |
Inception*** | | 9.07 | | | 9.82 | | | 10.87 | | |
(9/2/82) | | | | | | | | | | |
| | | | | | | | | | |
CUMULATIVE TOTAL RETURNS* | |
| | | | | | | | | | |
| | Sit Large
Cap Growth
Fund | | Russell
1000® Growth
Index(1) | | Russell
1000®
Index(2) | |
| | | | | | | | | | |
1 Year | | 7.80 | % | | 13.62 | % | | 15.24 | % | |
5 Year | | 3.91 | | | 1.91 | | | -2.75 | | |
10 Year | | -37.87 | | | -41.00 | | | -11.58 | | |
Inception*** | | 1022.40 | | | 1258.90 | | | 1667.85 | | |
(9/2/82) | | | | | | | | | | |
| | | | | | | | | | |
*As of 6/30/10 | | **Not annualized. | |
| | | |
Performance figures are historical and do not guarantee future results. Investment returns and principal value will vary, and you may have a gain or loss when you sell shares. Average annual total returns include changes in share price as well as reinvestment of all dividends and capital gains. Management fees and administrative expenses are included in the Fund’s performance. ***On 6/6/93, the Fund’s investment objective changed to allow for a portfolio of 100% stocks. Prior to that time, the portfolio was required to contain no more than 80% stocks.
| |
| |
(1) | An unmanaged index that measures the performance of those Russell 1000 companies (the largest 1,000 U.S. companies by capitalization) with higher price-to-book ratios and higher forecasted growth values. |
(2) | An unmanaged index that measures the performance of the 1,000 largest companies in the Russell 3000® Index (the largest 3,000 U.S. companies based on total market capitalization). |
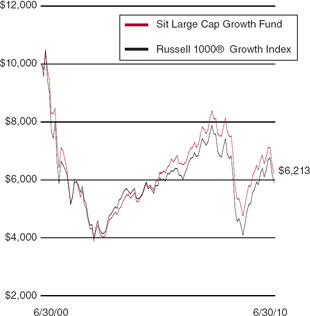
The sum of $10,000 invested on 6/30/00 and held until 6/30/10 would have declined to $6,213 in the Fund or $5,900 in the Russell 1000® Growth Index assuming reinvestment of all dividends and capital gains.
| | |
1. | | Apple, Inc. |
2. | | IBM Corp. |
3. | | McDonald’s Corp. |
4. | | Cisco Systems, Inc. |
5. | | Google, Inc. |
6. | | Intel Corp. |
7. | | PepsiCo, Inc. |
8. | | Procter & Gamble Co. |
9. | | Occidental Petroleum Corp. |
10. | | Qualcomm, Inc. |
| | Total Number of Holdings: 96 |
27
| | | | |
| Sit Large Cap Growth Fund | | | |
| | | | |
| Portfolio of Investments - June 30, 2010
| | | |
| | | | |
|
| | | | | |
Quantity | | Name of Issuer | Fair Value ($)(1) | |
| | | | | |
Common Stocks (99.7%) (2) | | | |
Communications (2.4%) | | | |
116,500 | | Rogers Communications, Inc. | | 3,816,540 | |
206,500 | | Verizon Communications, Inc. | | 5,786,130 | |
| | | | 9,602,670 | |
Consumer Durables (0.5%) | | | |
208,900 | | Activision Blizzard, Inc. | | 2,191,361 | |
| | | | | |
Consumer Non-Durables (10.5%) | | | |
161,900 | | Coca-Cola Co. | | 8,114,428 | |
64,900 | | Colgate-Palmolive Co. | | 5,111,524 | |
131,000 | | General Mills, Inc. | | 4,653,120 | |
149,000 | | PepsiCo, Inc. | | 9,081,550 | |
156,900 | | Philip Morris International, Inc. | | 7,192,296 | |
143,700 | | Procter & Gamble Co. | | 8,619,126 | |
| | | | 42,772,044 | |
Consumer Services (3.9%) | | | |
148,500 | | McDonald’s Corp. | | 9,781,695 | |
87,100 | | Visa, Inc. | | 6,162,325 | |
| | | | 15,944,020 | |
Electronic Technology (20.6%) | | | |
92,700 | | Analog Devices, Inc. | | 2,582,622 | |
51,400 | | Apple, Inc. (3) | | 12,928,642 | |
433,600 | | Applied Materials, Inc. | | 5,211,872 | |
185,500 | | Broadcom Corp. | | 6,115,935 | |
244,700 | | Ciena Corp. (3) | | 3,102,796 | |
445,500 | | Cisco Systems, Inc. (3) | | 9,493,605 | |
100,100 | | EMC Corp. (3) | | 1,831,830 | |
474,200 | | Intel Corp. | | 9,223,190 | |
103,200 | | IBM Corp. | | 12,743,136 | |
65,200 | | Linear Technology Corp. | | 1,813,212 | |
111,200 | | Marvell Tech. Group, Ltd. (3) | | 1,752,512 | |
261,000 | | Qualcomm, Inc. | | 8,571,240 | |
93,400 | | Research In Motion, Ltd. (3) | | 4,600,884 | |
159,500 | | Seagate Technology (3) | | 2,079,880 | |
50,600 | | Veeco Instruments, Inc. (3) | | 1,734,568 | |
| | | | 83,785,924 | |
Energy Minerals (8.1%) | | | |
24,700 | | Apache Corp. | | 2,079,493 | |
79,200 | | EQT Corp. | | 2,862,288 | |
40,800 | | Murphy Oil Corp. | | 2,021,640 | |
111,200 | | Occidental Petroleum Corp. | | 8,579,080 | |
| | | | | |
Quantity | | Name of Issuer | Fair Value ($)(1) | |
| | | | | |
182,300 | | Southwestern Energy Co. (3) | | 7,044,072 | |
148,900 | | Suncor Energy, Inc. | | 4,383,616 | |
133,100 | | Ultra Petroleum Corp. (3) | | 5,889,675 | |
| | | | 32,859,864 | |
Finance (11.3%) | | | |
73,000 | | Aflac, Inc. | | 3,114,910 | |
324,660 | | Bank of America Corp. | | 4,665,364 | |
79,100 | | Bank of New York Mellon Corp. | | 1,952,979 | |
11,900 | | CME Group, Inc. | | 3,350,445 | |
39,900 | | Franklin Resources, Inc. | | 3,438,981 | |
47,700 | | Goldman Sachs Group, Inc. | | 6,261,579 | |
169,400 | | J.P. Morgan Chase & Co. | | 6,201,734 | |
13,200 | | M&T Bank Corp. | | 1,121,340 | |
21,100 | | Northern Trust Corp. | | 985,370 | |
38,700 | | PartnerRe, Ltd. | | 2,714,418 | |
43,900 | | Prudential Financial, Inc. | | 2,355,674 | |
55,000 | | The Travelers Companies, Inc. | | 2,708,750 | |
92,600 | | U.S. Bancorp | | 2,069,610 | |
203,535 | | Wells Fargo & Co. | | 5,210,496 | |
| | | | 46,151,650 | |
Health Services (1.2%) | | | |
28,000 | | McKesson Corp. | | 1,880,480 | |
54,300 | | Medco Health Solutions, Inc. (3) | | 2,990,844 | |
| | | | 4,871,324 | |
Health Technology (9.6%) | | | |
40,200 | | Abbott Laboratories | | 1,880,556 | |
28,800 | | Allergan, Inc. | | 1,677,888 | |
52,800 | | Baxter International, Inc. | | 2,145,792 | |
124,700 | | Celgene Corp. (3) | | 6,337,254 | |
76,500 | | Genzyme Corp. (3) | | 3,883,905 | |
128,800 | | Gilead Sciences, Inc. (3) | | 4,415,264 | |
8,100 | | Intuitive Surgical, Inc. (3) | | 2,556,522 | |
83,150 | | Johnson & Johnson | | 4,910,839 | |
42,300 | | Medtronic, Inc. | | 1,534,221 | |
58,800 | | St. Jude Medical, Inc. (3) | | 2,122,092 | |
106,700 | | Thermo Fisher Scientific, Inc. (3) | | 5,233,635 | |
45,740 | | Varian Medical Systems, Inc. (3) | | 2,391,287 | |
| | | | 39,089,255 | |
Industrial Services (1.4%) | | | |
52,200 | | McDermott International, Inc. (3) | | 1,130,652 | |
85,900 | | Schlumberger, Ltd. | | 4,753,706 | |
| | | | 5,884,358 | |
28
| | | | |
| | |
| |
| | |
| | |
|
| |
| | | | |
|
| | | | | |
Quantity | | Name of Issuer | Fair Value ($)(1) | |
| | | | | |
Non-Energy Minerals (0.7%) | | | |
19,600 | | Allegheny Technologies, Inc. | | 866,124 | |
35,200 | | Freeport-McMoran, Inc. | | 2,081,376 | |
| | | | 2,947,500 | |
Process Industries (2.0%) | | | |
95,200 | | Ecolab, Inc. | | 4,275,432 | |
48,900 | | Praxair, Inc. | | 3,715,911 | |
| | | | 7,991,343 | |
Producer Manufacturing (7.9%) | | | |
41,200 | | 3M Co. | | 3,254,388 | |
221,500 | | ABB, Ltd., A.D.R. | | 3,827,520 | |
81,600 | | Danaher Corp. | | 3,028,992 | |
75,800 | | Deere & Co. | | 4,220,544 | |
78,000 | | Emerson Electronic Co. | | 3,407,820 | |
236,800 | | General Electric Co. | | 3,414,656 | |
31,600 | | Goodrich Corp. | | 2,093,500 | |
28,000 | | Lockheed Martin Corp. | | 2,086,000 | |
20,900 | | Precision Castparts Corp. | | 2,151,028 | |
70,300 | | United Technologies Corp. | | 4,563,173 | |
| | | | 32,047,621 | |
Retail Trade (7.6%) | | | |
105,700 | | Best Buy Co., Inc. | | 3,579,002 | |
70,561 | | Costco Wholesale Corp. | | 3,868,860 | |
172,400 | | CVS/Caremark Corp. | | 5,054,768 | |
114,800 | | Home Depot, Inc. | | 3,222,436 | |
86,600 | | Kohl’s Corp. (3) | | 4,113,500 | |
117,500 | | Target Corp. | | 5,777,475 | |
109,400 | | Wal-Mart Stores, Inc. | | 5,258,858 | |
| | | | 30,874,899 | |
Technology Services (8.9%) | | | |
166,600 | | Accenture, Ltd. | | 6,439,090 | |
127,700 | | Adobe Systems, Inc. (3) | | 3,375,111 | |
26,100 | | Dolby Laboratories, Inc. (3) | | 1,636,209 | |
20,900 | | Google, Inc. (3) | | 9,299,455 | |
311,900 | | Microsoft Corp. | | 7,176,819 | |
391,100 | | Oracle Corp. | | 8,393,006 | |
| | | | 36,319,690 | |
Transportation (2.2%) | | | |
73,400 | | Expeditors Intl. of Washington, Inc. | | 2,533,034 | |
68,600 | | Union Pacific Corp. | | 4,768,386 | |
28,100 | | United Parcel Service, Inc. | | 1,598,609 | |
| | | | 8,900,029 | |
| | | | | |
Quantity | | Name of Issuer | Fair Value ($)(1) | |
| | | | | |
Utilities (0.9%) | | | |
86,000 | | Calpine Corp. (3) | | 1,093,920 | |
51,400 | | Wisconsin Energy Corp. | | 2,608,036 | |
| | | | 3,701,956 | |
| | | | | |
Total common stocks | | 405,935,508 | |
(cost: $407,232,510) | | | |
| | | | | |
Short-Term Securities (0.4%) (2) | | | |
1,695,876 | | Wells Fargo Adv. Govt. Fund, 0.04% | | 1,695,876 | |
(cost: $1,695,876) | | | |
| | | | | |
Total investments in securities | | | |
(cost: $408,928,386) (4) | | $ 407,631,384 | |
See accompanying notes to portfolios of investments on page 48.
29
| | | | |
| Sit Mid Cap Growth Fund | | | |
| One Year Ended June 30, 2010 | | | |
| | | | |
| Portfolio Managers: Roger J. Sit, Kent L. Johnson, Matthew T. Loucks, and Robert W. Sit
| | | |
| | | | |
The Sit Mid Cap Growth Fund’s twelve-month return was +16.87%, compared to +21.30% for the Russell Midcap® Growth Index. The Russell Midcap® Index gained +25.13% during the period.
Despite a setback in the most recent quarter, stocks posted above-average returns over the past year. Economic conditions have improved and corporate profits are on the rebound, as profitability has surged on the heels of both higher sales volumes and cost reductions made during the downturn. While we believe further gains for stocks are quite possible, it is worth noting that valuations and earnings expectations are clearly higher than at this time last year. In this regard, it is our view that we are entering a somewhat more challenging environment, with stock selection playing a particularly important role in driving investment results. Our research team remains highly focused on identifying opportunities, generally emphasizing companies with strong financial characteristics and an ability to deliver consistent earnings growth, even in a slow growth economic environment.
The weightings within the electronic technology and technology services sectors increased over the last twelve months, and these sectors are the most heavily-weighted within the Fund. We continue to see multiple growth drivers for technology, including cyclical recoveries in the personal computer and semiconductor segments and secular demand in areas, such as wireless communications (e.g., smart phones). We have also modestly increased the retail trade weight over the past twelve months, particularly favoring value-based retailers, such as TJX Companies. The most significant decrease in sector exposure occurred in health technology. The decision was at least partially driven by our concern about the long-term impact that healthcare reform may have on the sector.
Compared to the Russell Midcap Growth Index, the Fund’s relative performance was negatively impacted by stock selection in health technology, consumer durables, electronic technology and retail trade sectors. Lagging stocks in these sectors included Activision Blizzard, Gilead Sciences, NuVasive, Synaptics and GameStop. Strong stock selection in the technology services sector added the most to relative returns over the period, driven by strong performance in several holdings, including Cognizant Technology Solutions, Sybase, Dolby Laboratories and Salesforce.com.
We appreciate shareholders’ continued interest in the Fund.
INVESTMENT OBJECTIVE AND STRATEGY |
The objective of the Sit Mid Cap Growth Fund is to maximize long-term capital appreciation. The Fund pursues this objective by investing at least 80% of its net assets in the common stocks of growth companies with capitalizations of $2 billion to $15 billion at the time of purchase.
| | | | | |
Net Asset Value 6/30/10: | | $11.57 Per Share | | |
6/30/09: | | $9.90 Per Share | | |
| | | | | |
Total Net Assets: | | $130.3 Million | | |
|
Weighted Average Market Cap: | | $9.9 Billion | | |
PORTFOLIO STRUCTURE - BY SECTOR
(% OF TOTAL NET ASSETS) |
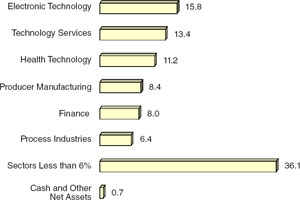
30
| | | | |
| | |
| |
| | |
| | |
|
| |
| | | | |
| | | | | | | | | | | |
| |
AVERAGE ANNUAL TOTAL RETURNS* | |
|
| | | | | | | | | | | |
| | | Sit Mid Cap
Growth
Fund | | Russell Midcap®
Growth Index(1) | | Russell
Midcap®
Index(2) |
| | | | | | | | | |
3 Month** | | -9.68 | % | | -10.20 | % | | -9.88 | % |
6 Month** | | -2.03 | | | -3.31 | | | -2.06 | |
1 Year | | 16.87 | | | 21.30 | | | 25.13 | |
5 Year | | 1.36 | | | 1.37 | | | 1.22 | |
10 Year | | -4.28 | | | -1.99 | | | 4.24 | |
Inception | | 11.25 | | | n/a | | | n/a | |
| (9/2/82) | | | | | | | | | |
| | | | | | | | | | | |
CUMULATIVE TOTAL RETURNS* |
| | | | | | | | | | |
| | | Sit Mid Cap
Growth
Fund | | Russell Midcap®
Growth Index(1) | | Russell
Midcap®
Index(2) |
| | | | | | | | | | |
1 Year | | 16.87 | % | | 21.30 | % | | 25.13 | % |
5 Year | | 6.96 | | | 7.02 | | | 6.27 | |
10 Year | | -35.42 | | | -18.18 | | | 51.46 | |
Inception | | 1843.71 | | | n/a | | | n/a | |
(9/2/82) | | | | | | | | | |
| | | | | | | | | | | |
*As of 6/30/10 | | | **Not annualized. | |
| | | | | | | | | | | |
Performance figures are historical and do not guarantee future results. Investment returns and principal value will vary, and you may have a gain or loss when you sell shares. Average annual total returns include changes in share price as well as reinvestment of all dividends and capital gains. Management fees and administrative expenses are included in the Fund’s performance.
| | |
(1) | An unmanaged index that measures the performance of those Russell Midcap companies with higher price-to-book ratios and higher forecasted growth values. |
(2) | An unmanaged index that measures the performance of the 800 smallest companies in The Russell 1000® Index. |
|
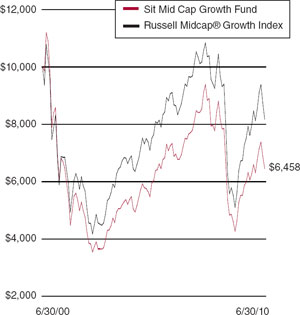
The sum of $10,000 invested on 6/30/00 and held until 6/30/10 would have declined to $6,458 in the Fund or to $8,182 in the Russell Midcap® Growth Index assuming reinvestment of all dividends and capital gains.
| | |
| 1. | Cognizant Tech. Solutions Corp. |
| 2. | Sybase, Inc. |
| 3. | Celgene Corp. |
| 4. | Southwestern Energy Co. |
| 5. | Broadcom Corp. |
| 6. | TCF Financial Corp. |
| 7. | F5 Networks, Inc. |
| 8. | Ecolab, Inc. |
| 9. | Cummins, Inc. |
| 10. | Citrix Systems, Inc. |
Total Number of Holdings: 106 |
31
| | | | |
| Sit Mid Cap Growth Fund | | | |
| | | | |
| Portfolio of Investments - June 30, 2010
| | | |
| | | | |
|
| | | | | |
Quantity | | Name of Issuer | | Fair Value ($)(1) | |
| | | | | |
Common Stocks (99.3%) (2) | | | |
Communications (1.5%) | | | |
23,650 | | Akamai Technologies, Inc. (3) | | 959,480 | |
22,200 | | American Tower Corp. (3) | | 987,900 | |
| | | | 1,947,380 | |
Consumer Durables (2.8%) | | | |
69,200 | | Activision Blizzard, Inc. | | 725,908 | |
24,300 | | Fossil, Inc. (3) | | 843,210 | |
34,300 | | Snap-on, Inc. | | 1,403,213 | |
16,200 | | Tupperware Brands Corp. | | 645,570 | |
| | | | 3,617,901 | |
Consumer Non-Durables (5.2%) | | | |
51,900 | | Alberto-Culver Co. | | 1,405,971 | |
23,500 | | Avon Products, Inc. | | 622,750 | |
33,400 | | Central European Distribution (3) | | 714,092 | |
44,100 | | Coach, Inc. | | 1,611,855 | |
48,100 | | Coca-Cola Enterprises, Inc. | | 1,243,866 | |
17,500 | | Guess?, Inc. | | 546,700 | |
18,000 | | Hansen Natural Corp. (3) | | 703,980 | |
| | | | 6,849,214 | |
Consumer Services (3.2%) | | | |
25,700 | | Devry, Inc. | | 1,348,993 | |
60,600 | | International Game Technology | | 951,420 | |
39,532 | | Marriott International, Inc. | | 1,183,588 | |
3,400 | | Strayer Education, Inc. | | 706,826 | |
| | | | 4,190,827 | |
Electronic Technology (15.8%) | | | |
50,450 | | Analog Devices, Inc. | | 1,405,537 | |
1,500 | | Apple, Inc. (3) | | 377,295 | |
78,375 | | Broadcom Corp. | | 2,584,024 | |
76,000 | | Ciena Corp. (3) | | 963,680 | |
33,100 | | F5 Networks, Inc. (3) | | 2,269,667 | |
49,900 | | Juniper Networks, Inc. (3) | | 1,138,718 | |
33,400 | | KLA-Tencor Corp. | | 931,192 | |
46,700 | | Linear Technology Corp. | | 1,298,727 | |
92,600 | | Marvell Tech. Group, Ltd. (3) | | 1,459,376 | |
35,500 | | NetApp, Inc. (3) | | 1,324,505 | |
21,600 | | Research In Motion, Ltd. (3) | | 1,064,016 | |
91,000 | | Seagate Technology (3) | | 1,186,640 | |
12,700 | | Silicon Laboratories, Inc. (3) | | 515,112 | |
56,800 | | Synaptics, Inc. (3) | | 1,562,000 | |
40,500 | | Veeco Instruments, Inc. (3) | | 1,388,340 | |
| | | | | |
Quantity | | Name of Issuer | | Fair Value ($)(1) | |
| | | | | |
41,900 | | Xilinx, Inc. | | 1,058,394 | |
| | | | 20,527,223 | |
Energy Minerals (5.6%) | | | |
11,000 | | Apache Corp. | | 926,090 | |
20,200 | | EQT Corp. | | 730,028 | |
22,400 | | Murphy Oil Corp. | | 1,109,920 | |
67,600 | | Southwestern Energy Co. (3) | | 2,612,064 | |
28,800 | | Ultra Petroleum Corp. (3) | | 1,274,400 | |
9,900 | | Walter Energy, Inc. | | 602,415 | |
| | | | 7,254,917 | |
Finance (8.0%) | | | |
24,950 | | Ace, Ltd. | | 1,284,426 | |
26,700 | | Affiliated Managers Group, Inc. (3) | | 1,622,559 | |
25,200 | | Aflac, Inc. | | 1,075,284 | |
16,500 | | Ameriprise Financial, Inc. | | 596,145 | |
15,300 | | IntercontinentalExchange, Inc. (3) | | 1,729,359 | |
9,300 | | PartnerRe, Ltd. | | 652,302 | |
27,100 | | T. Rowe Price Group, Inc. | | 1,202,969 | |
137,800 | | TCF Financial Corp. | | 2,288,858 | |
| | | | 10,451,902 | |
Health Services (4.6%) | | | |
43,500 | | Allscripts-Misys Healthcare, Inc. (3) | | 700,350 | |
13,200 | | Covance, Inc. (3) | | 677,424 | |
37,800 | | Express Scripts, Inc. (3) | | 1,777,356 | |
25,300 | | Laboratory Corp. (3) | | 1,906,355 | |
13,400 | | Stericycle, Inc. (3) | | 878,772 | |
| | | | 5,940,257 | |
Health Technology (11.2%) | | | |
7,100 | | Alcon, Inc. | | 1,052,149 | |
23,400 | | Allergan, Inc. | | 1,363,284 | |
43,200 | | Amylin Pharmaceuticals, Inc. (3) | | 812,160 | |
52,500 | | Celgene Corp. (3) | | 2,668,050 | |
13,800 | | Edwards Lifesciences Corp. (3) | | 773,076 | |
42,500 | | Gilead Sciences, Inc. (3) | | 1,456,900 | |
13,400 | | Idexx Laboratories, Inc. (3) | | 816,060 | |
3,946 | | Intuitive Surgical, Inc. (3) | | 1,245,437 | |
6,400 | | Millipore Corp. (3) | | 682,560 | |
44,088 | | NuVasive, Inc. (3) | | 1,563,360 | |
35,950 | | Thermo Fisher Scientific, Inc. (3) | | 1,763,348 | |
6,700 | | Varian Medical Systems, Inc. (3) | | 350,276 | |
| | | | 14,546,660 | |
32
| | | | |
| | |
| |
| | |
| | |
|
| |
| | | | |
|
| | | | | |
Quantity | | Name of Issuer | | Fair Value ($)(1) | |
| | | | | |
Industrial Services (3.6%) | | | |
42,600 | | Aecom Technology Corp. (3) | | 982,356 | |
38,800 | | Jacobs Engineering Group (3) | | 1,413,872 | |
36,900 | | McDermott International, Inc. (3) | | 799,254 | |
17,100 | | National-Oilwell Varco, Inc. | | 565,497 | |
26,200 | | Smith International, Inc. | | 986,430 | |
| | | | 4,747,409 | |
Non-Energy Minerals (0.7%) | | | |
10,550 | | Allegheny Technologies, Inc. | | 466,204 | |
15,500 | | Haynes International, Inc. | | 477,865 | |
| | | | 944,069 | |
Process Industries (6.4%) | | | |
32,800 | | Airgas, Inc. | | 2,040,160 | |
43,300 | | Albemarle Corp. | | 1,719,443 | |
11,500 | | CF Industries Holdings, Inc. | | 729,675 | |
49,500 | | Ecolab, Inc. | | 2,223,045 | |
36,700 | | Scotts Miracle-Gro Co. | | 1,629,847 | |
| | | | 8,342,170 | |
Producer Manufacturing (8.4%) | | | |
31,600 | | AGCO Corp. (3) | | 852,252 | |
26,750 | | AMETEK, Inc. | | 1,074,012 | |
33,800 | | Cummins, Inc. | | 2,201,394 | |
9,500 | | Flowserve Corp. | | 805,600 | |
18,600 | | Precision Castparts Corp. | | 1,914,312 | |
24,700 | | Rockwell Collins, Inc. | | 1,312,311 | |
29,000 | | SPX Corp. | | 1,531,490 | |
45,000 | | Trimble Navigation, Ltd. (3) | | 1,260,000 | |
| | | | 10,951,371 | |
Retail Trade (5.6%) | | | |
26,100 | | Best Buy Co., Inc. | | 883,746 | |
20,500 | | BJ’s Wholesale Club, Inc. (3) | | 758,705 | |
48,100 | | Dick’s Sporting Goods, Inc. (3) | | 1,197,209 | |
64,900 | | GameStop Corp. (3) | | 1,219,471 | |
38,700 | | Nordstrom, Inc. | | 1,245,753 | |
47,300 | | TJX Companies, Inc. | | 1,984,235 | |
| | | | 7,289,119 | |
Technology Services (13.4%) | | | |
54,190 | | Adobe Systems, Inc. (3) | | 1,432,242 | |
29,400 | | Amdocs, Ltd. (3) | | 789,390 | |
47,100 | | ANSYS, Inc. (3) | | 1,910,847 | |
52,800 | | Autodesk, Inc. (3) | | 1,286,208 | |
17,200 | | BMC Software, Inc. (3) | | 595,636 | |
48,700 | | Citrix Systems, Inc. (3) | | 2,056,601 | |
| | | | | | |
Quantity | | Name of Issuer | | Fair Value ($)(1) | |
| | | | | | |
73,800 | | Cognizant Tech. Solutions Corp. (3) | | | 3,694,428 | |
18,100 | | Dolby Laboratories, Inc. (3) | | | 1,134,689 | |
17,700 | | Salesforce.com, Inc. (3) | | | 1,519,014 | |
47,100 | | Sybase, Inc. (3) | | 3,045,486 | |
| | | | 17,464,541 | |
Transportation (2.0%) | | | | |
19,700 | | C.H. Robinson Worldwide, Inc. | | | 1,096,502 | |
45,800 | | Expeditors Intl. of Washington, Inc. | | 1,580,558 | |
| | | | 2,677,060 | |
Utilities (1.3%) | | | | |
51,500 | | Calpine Corp. (3) | | | 655,080 | |
13,100 | | UGI Corp. | | | 333,264 | |
12,800 | | Wisconsin Energy Corp. | | 649,472 | |
| | | | 1,637,816 | |
| | | | | | |
Total common stocks | | 129,379,836 | |
(cost: $117,646,798) | | | | |
| | | | | | |
Short-Term Securities (0.8%) (2) | | | | |
992,439 | | Wells Fargo Adv. Govt. Fund, 0.04% | | 992,439 | |
(cost: $992,439) | | | | |
| | | | | | |
Total investments in securities | | | | |
(cost: $118,639,237) (4) | | $ | 130,372,275 | |
See accompanying notes to portfolios of investments on page 48.
33
| | | | |
| Sit International Growth Fund | | | |
| One Year Ended June 30, 2010 | | | |
| | | | |
| Portfolio Managers: Roger J. Sit, Janet K. Kinzler, and Tasha M. Murdoff
| | | |
| | | | |
The Sit International Growth Fund’s return was +8.10% over the past twelve months. compared to +8.60% for the MSCI EAFE Growth Index and +5.92% or the MSCI EAFE Index.
While the Fund had positive absolute performance, it did underperform, a result of poor stock selection in the energy and consumer staples sectors. The Japanese energy and consumer-related stocks proved to be poor performers given pending equity offerings, merger and acquisition rhetoric, and less than stellar results. The finance sector had the best stock selection, while the decision to overweight the sector partly took away from total relative performance.
Regionally, Japan was the top contributor due to the Fund’s underweight stance and stellar stock selection in export-oriented stocks. Asia ex-Japan also had good stock selection, led by consumer and technology stocks. The Non-Euroland region was the weakest link due primarily to the holdings of Central European Media, Vestas Wind Systems, and Nobel Biocare.
International equities posted solid gains over the past twelve months, as stocks positively responded to improved economic conditions. Market sentiment fluctuated significantly over the past year as investors embraced risk (looking for low quality, high beta stocks), reduced defensive holdings, and then rotated back and forth throughout the year. It has been our longstanding view that a more muted rebound is more likely for international growth outside of Asia ex-Japan. Thus far, recent economic data has supported this view. Importantly, however, we believe there are many high-quality growth stocks across a wide variety of sectors that are attractively valued. While we continue to emphasize the information technology sector within the Fund, we also see opportunities in other heavily weighted sectors, including finance, consumer, energy, and materials. Across all sectors, we continue to emphasize “quality,” favoring companies with strong balance sheets, predictable earnings growth, and consistent cash flow generation. Regionally, the Fund is tilted more to Asia ex-Japan as the growth prospects in that region are far superior. Europe is in the midst of a debt crisis in which various austerity measures are taking hold. Japan is the perennial laggard given weak consumption, high debt levels, and an overall stagnant market.
We continue to focus on companies with strong, experienced management teams, sound balance sheets, and sustainable earnings growth potential with regionally or dominant products and/or services. We continue to believe that this focus will reward our shareholders over the long term.
INVESTMENT OBJECTIVE AND STRATEGY |
The objective of the International Growth Fund is long-term growth. The Fund seeks to achieve its objective by investing at least 90% of its net assets in common stocks of growth companies domiciled outside the United States.
In selecting investments for the Fund, the Adviser begins by selecting countries or regions in which to invest by considering several factors affecting the economy and equity market of foreign countries and regions. After the country and regional allocations are determined, the Adviser seeks industries and sectors that it believes have earnings growth prospects that are greater than the average. Within the selected industries and sectors, the Adviser invests in foreign growth-oriented companies it believes exhibit the potential for superior growth.
| | |
Net Asset Value 6/30/10: | | $11.67 Per Share |
6/30/09: | | $10.90 Per Share |
| | |
Total Net Assets: | | $20.6 Million |
| | |
Weighted Average Market Cap: | | $44.6 Billion |
PORTFOLIO STRUCTURE - BY REGION
(% OF TOTAL NET ASSETS) |
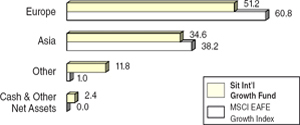
34
| | | | |
| | |
| |
| | |
| | |
|
| |
| | | | |
| | | | | | | | | | | |
| |
AVERAGE ANNUAL TOTAL RETURNS* | |
| | | | | | | | | | | |
| | | Sit
International
Growth Fund | | MSCI
EAFE
Growth Index(1) | | MSCI
EAFE
Index(2) |
| | | | | | | | | |
3 Month** | | -14.32 | % | | -12.44 | % | | -13.97 | % |
6 Month** | | -11.92 | | | -10.73 | | | -13.23 | |
1 Year | | 8.10 | | | 8.60 | | | 5.92 | |
5 Year | | -0.05 | | | 1.68 | | | 0.88 | |
10 Year | | -5.98 | | | -1.61 | | | 0.16 | |
Inception | | 2.87 | | | 2.82 | | | 4.42 | |
| (11/1/91) | | | | | | | | | |
| | | | | | | | | | | |
CUMULATIVE TOTAL RETURNS* |
| | | | | | | | | | |
| | | Sit
International
Growth Fund | | MSCI
EAFE
Growth Index(1) | | MSCI
EAFE
Index(2) |
| | | | | | | | | | |
1 Year | | 8.10 | % | | 8.60 | % | | 5.92 | % |
5 Year | | -0.25 | | | 8.66 | | | 4.46 | |
10 Year | | -46.02 | | | -15.01 | | | 1.64 | |
Inception | | 69.50 | | | 68.06 | | | 124.33 | |
(11/1/91) | | | | | | | | | |
| | | | | | | | | | | |
*As of 6/30/10. | | | | | **Not annualized. | |
| | | | | | | | | | | |
Performance figures are historical and do not guarantee future results. Investment returns and principal value will vary, and you may have a gain or loss when you sell shares. Average annual total returns include changes in share price as well as reinvestment of all dividends and capital gains. Management fees and administrative expenses are included in the Fund’s performance.
| |
(1) | MSCI uses a two dimensional framework for style segmentation in which value and growth securities are categorized using a multi-factor approach. The objective of the Index design is to divide constituents of an underlying MSCI Equity Index into respective value and growth indices, each targeting 50% of the free float adjusted market capitalization of the underlying market index. |
(2) | The MSCI EAFE Index (Europe, Australasia, Far East) is a free float-adjusted market capitalization index that is designed to measure the equity market performance of developed markets, excluding the US and Canada. |
The sum of $10,000 invested on 6/30/00 and held until 6/30/10 would have declined to $5,398 in the Fund or $8,499 in the MSCI EAFE Growth Index assuming reinvestment of all dividends and capital gains.
PORTFOLIO STRUCTURE - BY SECTOR
(% OF TOTAL NET ASSETS) |
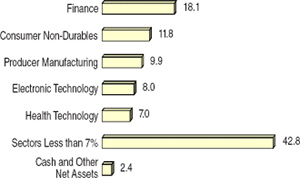
35
| | | | |
| Sit International Growth Fund | | | |
| | | | |
| | | | |
| Portfolio of Investments - June 30, 2010
| | | |
| | | | |
| | | | |
| | |
| 1. | BHP Billiton, Ltd. |
| 2. | Nestle, S.A. |
| 3. | Reckitt Benckiser, p.l.c |
| 4. | Rio Tinto, A.D.R. |
| 5. | Telefonica, S.A. |
| 6. | Total, S.A. |
| 7. | Royal Dutch Shell, A.D.R. |
| 8. | Pearson. A.D.R. |
| 9. | Syngenta AG |
| 10. | Synthes, Inc. |
| | Total Number of Holdings: 100 |
| | | | | |
Quantity | | Name of Issuer | Fair Value ($)(1) | |
| | | | | |
Common Stocks (96.5%) (2) |
Africa/ Middle East (1.8%) |
Israel (1.3%) |
5,200 | | Teva Pharmaceutical Industries, A.D.R. (Health Technology) | | 270,348 | |
South Africa (0.5%) | | | |
3,100 | | Sasol, A.D.R. (Energy Minerals) | | 109,337 | |
Asia (33.5%) | | | |
Australia (8.1%) | | | |
11,514 | | Australia and New Zealand Banking | | | |
| | Group (Finance) | | 206,808 | |
28,975 | | BHP Billiton, Ltd. (Non-Energy Minerals) | | 901,400 | |
8,600 | | Rio Tinto, A.D.R. (Non-Energy Minerals) | | 374,960 | |
2,000 | | Westpac Banking Corp., A.D.R. (Finance) | | 177,160 | |
| | | | 1,660,328 | |
Hong Kong / China (9.0%) |
5,000 | | AsiaInfo Holdings, Inc. | | | |
| | (Technology Services) (3) | | 109,300 | |
13,600 | | China Unicom (Hong Kong), Ltd., A.D.R. (Communications) | | 180,880 | |
6,800 | | Hong Kong Exchanges & Clearing, Ltd. (Finance) | | 106,056 | |
24,070 | | HSBC Holdings, p.l.c. (Finance) | | 219,896 | |
30,350 | | HSBC Holdings, p.l.c. (Finance) | | 278,259 | |
25,000 | | Hutchison Whampoa (Producer Mfg.) | | 153,852 | |
38,000 | | Li & Fung, Ltd. (Consumer Durables) | | 170,011 | |
1,300 | | New Oriental Education & Technology Group, A.D.R.(Consumer Svcs.) (3) | | 121,147 | |
2,400 | | Standard Chartered (Finance) | | 58,441 | |
16,600 | | Sun Hung Kai Properties, Ltd. (Finance) | | 227,021 | |
| | | | | |
Quantity | | Name of Issuer | Fair Value ($)(1) | |
| | | | | |
50,000 | | Tsingtao Brewery Co. | | | |
| | (Consumer Non-Durables) | | 233,574 | |
| | | | 1,858,437 | |
Japan (14.7%) | | |
6,100 | | AFLAC, Inc., A.D.R. (Finance) | | 260,287 | |
13,000 | | Asahi Glass Co. (Electronic Tech.) | | 122,068 | |
5,600 | | Canon, Inc. (Electronic Tech.) | | 208,709 | |
6,300 | | Elpida Memory, Inc. (Electronic Tech.) (3) | 96,790 | |
1,300 | | Fanuc, Ltd. (Producer Mfg.) | | 146,799 | |
9,600 | | Honda Motor Co., Ltd. (Producer Mfg.) | | 281,979 | |
7,000 | | Kao Corp. (Consumer Non-Durables) | | 164,702 | |
13,000 | | Kirin Holdings Company, Ltd. | | | |
| | (Consumer Non-Durables) | | 163,665 | |
6,800 | | Komatsu, Ltd. (Producer Mfg.) | | 122,442 | |
21,000 | | Kubota Corp. (Producer Mfg.) | | 161,076 | |
24,000 | | Mitsui O.S.K. Lines, Ltd. (Transportation) | | 158,680 | |
4,400 | | Oracle Corp. Japan (Tech. Services) | | 216,218 | |
1,500 | | SMC Corp. (Producer Mfg.) | | 200,658 | |
3,800 | | Sony Corp., A.D.R. (Consumer Durables) | | 101,384 | |
9,400 | | Sugi Holdings Co., Ltd. (Retail Trade) | | 190,988 | |
9,000 | | Toyo Suisan Kaisha, Ltd. | | | |
| | (Consumer Non-Durables) | | 214,808 | |
3,400 | | Yamada Denki Co. (Retail Trade) | | 222,155 | |
| | | | 3,033,408 | |
South Korea (1.0%) |
650 | | Samsung Electronics Co., G.D.R. | | | |
| | (Electronic Tech.) | | 205,857 | |
Taiwan (0.7%) |
10,000 | | HTC Corp. (Electronic Technology) | | 132,801 | |
Europe (51.2%) | | |
Denmark (0.7%) | | |
3,500 | | Vestas Wind Systems A/S | | | |
| | (Process Industries) (3) | | 145,656 | |
France (6.8%) |
3,260 | | Alstom, S.A. (Producer Mfg.) | | 147,604 | |
6,925 | | AXA (Finance) | | 105,794 | |
3,896 | | BNP Paribas (Finance) | | 209,608 | |
4,000 | | Schlumberger, Ltd., A.D.R. (Indus. Svcs.) | | 221,360 | |
7,900 | | Total, S.A. (Energy Minerals) | | 352,647 | |
2,200 | | Total, A.D.R. (Energy Minerals) | | 98,208 | |
11,030 | | Veolia Environment (Utilities) | | 259,128 | |
| | | | 1,394,349 | |
36
| | | | |
| | |
| |
| | |
| | |
|
| |
| | | | |
| | | | |
| | | | | |
Quantity | | Name of Issuer | Fair Value ($)(1) | |
|
Germany (6.1%) |
5,420 | | Adidas AG (Consumer Durables) | | 262,409 | |
6,800 | | Aixtron, A.D.R. (Electronic Tech.) | | 162,044 | |
2,200 | | Allianz SE (Finance) | | 217,742 | |
1,575 | | Muenchener Rueckver (Finance) | | 197,762 | |
1,080 | | Rational AG (Producer Mfg.) | | 166,622 | |
2,800 | | Siemens AG (Producer Mfg.) | | 250,432 | |
| | | | 1,257,011 | |
Ireland (0.8%) |
5,900 | | Icon, A.D.R. (Health Tech.) (3) | | 170,451 | |
Italy (1.9%) |
44,428 | | Enel S.P.A. (Utilities) | | 188,116 | |
5,750 | | Tenaris S.A., A.D.R. (Industrial Svcs.) | | 199,008 | |
| | | | 387,124 | |
Luxembourg (1.0%) |
2,600 | | Millicom International Cellular S.A. (Communications) (3) | | 210,782 | |
Netherlands (3.0%) |
7,200 | | ASML Holding N.V. (Electronic Tech.) | | 197,784 | |
19,988 | | ING Groep N.V. (Finance) | | 147,922 | |
3,800 | | Philips Electronics (Consumer Durables) | | 113,476 | |
6,600 | | TNT NV (Transportation) | | 166,235 | |
| | | | 625,417 | |
Poland (1.2%) |
11,400 | | Central European Distribution Corp. (Consumer Non-Durables) (3) | | 243,732 | |
Spain (4.8%) |
21,859 | | Banco Bilbao Vizcaya, S.A., A.D.R. (Finance) | | 224,929 | |
14,700 | | Banco Santander, A.D.R. (Finance) | | 154,350 | |
4,130 | | Inditex (Consumer Durables) | | 235,499 | |
19,850 | | Telefonica, S.A. (Communications) | | 367,716 | |
| | | | 982,494 | |
Sweden (1.3%) |
23,600 | | Ericsson, A.D.R. (Electronic Tech.) | | 260,072 | |
Switzerland (11.1%) |
11,500 | | ABB, Ltd., A.D.R. (Producer Mfg.) | | 198,720 | |
6,850 | | Credit Suisse Group (Finance) | | 257,541 | |
2,000 | | Kuehne & Nagel Intl. (Transportation) | | 205,878 | |
10,800 | | Nestle, S.A. (Consumer Non-Durables) | | 520,763 | |
4,100 | | Nobel Biocare Hldg. (Health Tech.) | | 70,579 | |
3,759 | | Novartis AG (Health Tech.) | | 182,173 | |
1,100 | | Roche Holdings AG (Health Tech.) | | 151,406 | |
| | | | | |
Quantity | | Name of Issuer | Fair Value ($)(1) | |
|
485 | | Straumann Holding AG (Health Tech.) | | 104,893 | |
1,300 | | Syngenta AG (Process Industries) | | 300,321 | |
2,525 | | Synthes, Inc. (Health Tech.) | | 290,325 | |
| | | | 2,282,599 | |
United Kingdom (12.5%) |
3,703 | | Anglo American, p.l.c. | | | |
| | (Non-Energy Minerals) (3) | | 129,032 | |
6,725 | | Autonomy Corp., p.l.c. | | | |
| | (Technology Services) (3) | | 183,312 | |
6,950 | | British American Tobacco, p.l.c | | | |
| | (Consumer Non-Durables) | | 220,564 | |
13,450 | | Burberry Group p.l.c. (Retail Trade) | | 151,899 | |
4,600 | | Diageo, A.D.R. (Consumer Non-Durables) | | 288,604 | |
6,000 | | GlaxoSmithkline, A.D.R. (Health Tech.) | | 204,060 | |
23,100 | | Pearson, A.D.R. (Consumer Services) | | 303,765 | |
8,225 | | Reckitt Benckiser, p.l.c. (Consumer | | | |
| | Non-Durables) | | 382,580 | |
7,100 | | Royal Dutch Shell, A.D.R. | | | |
| | (Energy Minerals) | | 342,788 | |
47,240 | | Tesco, p.l.c. (Retail Trade) | | 266,500 | |
54,000 | | Vodafone Group (Communications) | | 111,266 | |
| | | | 2,584,370 | |
Latin America (3.1%) |
Brazil (1.7%) |
7,400 | | AGCO Corp. (Producer Mfg.) (3) | | 199,578 | |
4,500 | | Petrobras, A.D..R. (Energy Minerals) | | 154,440 | |
| | | | 354,018 | |
Chile (0.6%) |
1,800 | | Banco Santander Chile, A.D.R. | | | |
| | (Finance) | | 120,762 | |
Mexico (0.8%) |
73,520 | | Wal-Mart de Mexico (Retail Trade) | | 162,865 | |
North America (6.9%) |
Bermuda (0.9%) |
1,900 | | PartnerRe, Ltd. (Finance) | | 133,266 | |
2,800 | | Seadrill, Ltd. (Industrial Services) | | 51,184 | |
| | | | 184,450 | |
Canada (5.8%) |
3,800 | | Canadian National Railway Co. | | | |
| | (Transportation) | | 218,044 | |
2,125 | | Potash Corp. of Saskatchewan, Inc. | | | |
| | (Process Industries) | | 183,260 | |
4,650 | | Research In Motion, Ltd. | | | |
| | (Electronic Technology) (3) | | 229,059 | |
See accompanying notes to portfolios of investments on page 48.
37
| | | | |
| Sit International Growth Fund | | | |
| | | | |
| | | | |
| Portfolio of Investments - June 30, 2010
| | | |
| | | | |
| | | | |
| | | | | | |
Quantity | Name of Issuer | | Fair Value ($)(1) | |
| | | | | |
8,000 | | Rogers Communications, Inc. | | | |
| | (Communications) | | 262,080 | |
3,700 | | Royal Bank of Canada (Finance) | | 176,823 | |
4,200 | | Suncor Energy, Inc. (Energy Minerals) | | 123,648 | |
| | | | 1,192,914 | |
United States (0.2%) | | | |
1,300 | | Veeco Instruments, Inc. (3) | | | |
| | (Electronic Technology) | | 44,564 | |
| | | | | |
Total common stocks | | | |
(cost: $18,669,005) | | 19,874,146 | |
| | | | | |
Exchange Traded Funds (1.1%) (2) |
33,700 | | iShares MSCI India (3) | | 233,541 | |
(cost: $116,551) | | | |
| | | | | |
Short Term Securities (0.9%) (2) | | | |
176,741 | | Wells Fargo Adv. Govt. Fund, 0.04% | | 176,741 | |
(cost: $176,741) | | | |
| | | | | |
Total investments in securities | | | |
(cost: $18,962,297) (4) | | $ | 20,284,428 | |
See accompanying notes to portfolios of investments on page 48.
38
This page has been left blank intentionally.
39
| | | | |
| Sit Small Cap Growth Fund | | | |
| One Year Ended June 30, 2010 | | | |
| | | | |
| Portfolio Managers: Roger J. Sit, Kent L. Johnson, Robert W. Sit, Matthew T. Loucks, and Michael J. Stellmacher
| | | |
| | | | |
The Sit Small Cap Growth Fund return was +20.97% over the past twelve months. This compares to the return of +17.96% for the Russell 2000® Growth Index and the +21.48% gain for the Russell 2000® Index.
Small cap stocks fared particularly well over the past year as investors became less risk-averse amid signs of improvement in the economy. While valuations for smaller stocks are not as compelling compared to this time last year, earnings have rebounded and should continue to trend higher even if the current economic momentum decelerates. In this regard, we believe investors will increasingly gravitate towards companies that can deliver above-average earnings growth in a slower growth economic backdrop. Fortunately, there are many small- to mid-sized companies that do not rely on a robust economy to deliver earnings growth, and we continue to find attractive opportunities in virtually all economic sectors. While the Fund remains well-diversified, we maintain that health care and technology will continue to outgrow other sectors, so these groups are still heavily weighted within the Fund. In addition, we have used the recent market volatility to “upgrade” holdings where possible, with a particular focus on companies with strong balance sheets, cash flow and consistent earnings generation. In terms of sector changes, we have added to technology services and retail trade over the past year, while weightings have been reduced in health technology and energy minerals.
The Fund’s strong twelve-month relative performance compared to the Russell 2000® Growth Index was driven by good stock selection in technology services, industrial services, communications and consumer durables. The strongest individual performers included Sybase (+106% 12-month return), F5 Networks (+98%), Lufkin Industries (+89%) and Core Laboratories (+72%). The consumer non-durables and retail trade sectors detracted from performance over the period. Individual stocks that lagged over the period included NuVasive, Synaptics and URS.
Our research effort is highly focused on companies with strong, experienced management teams, sound balance sheets and sustainable earnings growth potential. We strongly believe that this focus will reward our shareholders over time.
INVESTMENT OBJECTIVE AND STRATEGY |
The objective of the Sit Small Cap Growth Fund is to maximize long-term capital appreciation. The Fund seeks to achieve its objective by investing, under normal market conditions, at least 80% of its net assets in common stocks of companies with capitalizations at the time of purchase of up to $3.0 billion, or up to the market capitalization of the largest company included in the Russell 2000 Index measured at the end of the previous twelve months.
The Adviser invests in a diversified group of growing small companies it believes exhibit the potential for superior growth. The Adviser believes that a company’s earnings growth is the primary determinant of its potential long-term return and evaluates a company’s potential for above average long-term earnings and revenue growth.
| | |
Net Asset Value 6/30/10: | | $31.32 Per Share |
6/30/09: | | $25.89 Per Share |
| | |
Total Net Assets: | | $59.8 Million |
| | |
Weighted Average Market Cap: | | $3.0 Billion |
PORTFOLIO STRUCTURE - BY SECTOR
(% OF TOTAL NET ASSETS) |
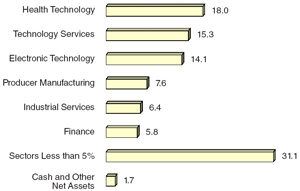
40
| | | | |
| | |
| |
| | |
| | |
|
| |
| | | | |
| | | | |
| | | | | | | | | | |
AVERAGE ANNUAL TOTAL RETURNS* | |
| | | | | | | |
| | Sit Small
Cap Growth
Fund | | Russell
2000® Growth
Index(1) | | Russell
2000®
Index(2) | |
| | | | | | | | | | |
3 Month** | | -7.34 | % | | -9.22 | % | | -9.92 | % | |
6 Month** | | 0.16 | | | -2.31 | | | -1.95 | | |
1 Year | | 20.97 | | | 17.96 | | | 21.48 | | |
5 Year | | 2.46 | | | 1.14 | | | 0.37 | | |
10 Year | | -2.57 | | | -1.72 | | | 3.00 | | |
Inception | | 9.44 | | | 5.06 | | | 7.40 | | |
(7/1/94) | | | | | | | | | | |
| | | | | | | | | | |
CUMULATIVE TOTAL RETURNS* | |
| | | | | | | | | | |
| | Sit Small
Cap Growth
Fund | | Russell
2000® Growth
Index(1) | | Russell
2000®
Index(2) | |
| | | | | | | | | | |
1 Year | | 20.97 | % | | 17.96 | % | | 21.48 | % | |
5 Year | | 12.91 | | | 5.82 | | | 1.85 | | |
10 Year | | -22.95 | | | -15.96 | | | 34.42 | | |
Inception | | 323.65 | | | 120.28 | | | 213.49 | | |
(7/1/94) | | | | | | | | | | |
*As of 6/30/10.
| | | | | |
**Not annualized.
| |
| | | |
Performance figures are historical and do not guarantee future results. Investment returns and principal value will vary, and you may have a gain or loss when you sell shares. Average annual total returns include changes in share price as well as reinvestment of all dividends and capital gains. Management fees and administrative expenses are included in the Fund’s performance.
| |
| |
|
(1) | An unmanaged index that measures the performance of those Russell 2000 companies with higher price-to-book ratios and higher forecasted growth values. |
(2) | An unmanaged index which measures the performance of the 2,000 smallest companies in the Russell 3000® Index (an index of the 3,000 largest U.S. companies based on total market capitalization). |
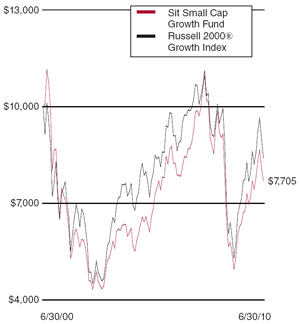
The sum of $10,000 invested on 6/30/00 and held until 6/30/10 would have declined to $7,705 in the Fund or $8,404 in the Russell 2000® Growth Index assuming reinvestment of all dividends and capital gains.
| | | |
1. | | Sybase, Inc. | |
2. | | Core Laboratories | |
3. | | Informatica Corp. | |
4. | | F5 Networks, Inc. | |
5. | | Skyworks Solutions, Inc. | |
6. | | ANSYS, Inc. | |
7. | | Alexion Pharmaceuticals Inc. | |
8. | | Lufkin Industries, Inc. | |
9. | | Thoratec Corp. | |
10. | | Concur Technologies, Inc. | |
| | Total Number of Holdings: 100 | |
41
| | | | |
| Sit Small Cap Growth Fund | | | |
| | | | |
| Portfolio of Investments - June 30, 2010
| | | |
| | | | |
|
| | | | | |
Quantity | | Name of Issuer | Fair Value ($)(1) | |
| | | | | |
Common Stocks (98.3%) (2) | | | |
| | | | | |
Commercial Services (1.1%) | | | |
10,100 | | FactSet Research Systems, Inc. | | 676,599 | |
| | | | | |
Communications (2.4%) | | | |
21,250 | | SBA Communications Corp. (3) | | 722,712 | |
42,300 | | TW Telecom, Inc. (3) | | 705,564 | |
| | | | 1,428,276 | |
Consumer Durables (4.0%) | | | |
5,800 | | Fossil, Inc. (3) | | 201,260 | |
10,700 | | Polaris Industries, Inc. | | 584,434 | |
14,900 | | Snap On, Inc. | | 609,559 | |
25,400 | | Tupperware Brands Corp. | | 1,012,190 | |
| | | | 2,407,443 | |
Consumer Non-Durables (3.4%) | | | |
14,500 | | Central European Distribution
Corp. (3) | | 310,010 | |
7,700 | | Guess?, Inc. | | 240,548 | |
18,500 | | Hansen Natural Corp. (3) | | 723,535 | |
34,600 | | True Religion Apparel, Inc. (3) | | 763,622 | |
| | | | 2,037,715 | |
Consumer Services (3.6%) | | | |
17,300 | | Buffalo Wild Wings, Inc. (3) | | 632,834 | |
7,975 | | Capella Education Co. (3) | | 648,766 | |
10,900 | | DeVry, Inc. | | 572,141 | |
17,300 | | Red Robin Gourmet Burgers, Inc. (3) | | 296,868 | |
| | | | 2,150,609 | |
Electronic Technology (14.1%) | | | |
36,400 | | Arris Group, Inc. (3) | | 370,916 | |
72,400 | | Ciena Corp. (3) | | 918,032 | |
18,900 | | F5 Networks, Inc. (3) | | 1,295,973 | |
45,800 | | Intersil Corp. | | 554,638 | |
17,300 | | Meru Networks, Inc. (3) | | 205,178 | |
20,000 | | Microsemi Corp. (3) | | 292,600 | |
20,800 | | MICROS Systems, Inc. (3) | | 662,896 | |
10,700 | | Silicon Laboratories, Inc. (3) | | 433,992 | |
70,900 | | Skyworks Solutions, Inc. (3) | | 1,190,411 | |
33,200 | | Synaptics, Inc. (3) | | 913,000 | |
17,900 | | Varian Semiconductor Equip., Inc. (3) | | 513,014 | |
17,800 | | Veeco Instruments, Inc. (3) | | 610,184 | |
19,500 | | Volterra Semiconductor Corp. (3) | | 449,670 | |
| | | | 8,410,504 | |
Energy Minerals (4.0%) | | | |
13,200 | | Arena Resources, Inc. (3) | | 421,080 | |
11,700 | | Atlas Energy, Inc. (3) | | 316,719 | |
| | | | | |
Quantity | | Name of Issuer | Fair Value ($)(1) | |
| | | | | |
18,700 | | EQT Corp. | | 675,818 | |
15,900 | | Frontier Oil Corp. | | 213,855 | |
19,300 | | Southwestern Energy Co. (3) | | 745,752 | |
| | | | 2,373,224 | |
Finance (5.8%) | | | |
13,175 | | Affiliated Managers Group, Inc. (3) | | 800,645 | |
10,000 | | Allied World Assurance Company Hldgs. | | 453,800 | |
16,800 | | Hanover Insurance Group, Inc. | | 730,800 | |
12,600 | | Stifel Financial Corp. (3) | | 546,714 | |
55,100 | | TCF Financial Corp. | | 915,211 | |
| | | | 3,447,170 | |
Health Services (3.2%) | | | |
39,300 | | Allscripts-Misys Healthcare, Inc. (3) | | 632,730 | |
10,100 | | Amedisys, Inc. (3) | | 444,097 | |
9,400 | | Covance, Inc. (3) | | 482,408 | |
5,800 | | Stericycle, Inc. (3) | | 380,364 | |
| | | | 1,939,599 | |
Health Technology (18.0%) | | | |
21,400 | | Alexion Pharmaceuticals, Inc. (3) | | 1,095,466 | |
51,400 | | Alphatec Holdings, Inc. (3) | | 238,496 | |
44,100 | | Amylin Pharmaceuticals, Inc. (3) | | 829,080 | |
16,400 | | Celgene Corp. (3) | | 833,448 | |
37,900 | | ev3, Inc. (3) | | 849,339 | |
10,900 | | Gen-Probe, Inc. (3) | | 495,078 | |
9,300 | | Haemonetics Corp. (3) | | 497,736 | |
21,900 | | ICON, A.D.R. (3) | | 632,691 | |
2,400 | | Intuitive Surgical, Inc. (3) | | 757,488 | |
15,700 | | Meridian Bioscience, Inc. | | 266,900 | |
22,900 | | NuVasive, Inc. (3) | | 812,034 | |
19,400 | | PerkinElmer, Inc. | | 400,998 | |
9,600 | | Techne Corp. | | 551,520 | |
6,000 | | Teleflex, Inc. | | 325,680 | |
25,200 | | Thoratec Corp. (3) | | 1,076,796 | |
12,300 | | United Therapeutics Corp. (3) | | 600,363 | |
23,300 | | Volcano Corp. (3) | | 508,406 | |
| | | | 10,771,519 | |
Industrial Services (6.4%) | | | |
11,000 | | Atwood Oceanics, Inc. (3) | | 280,720 | |
4,700 | | CARBO Ceramics, Inc. | | 339,293 | |
9,400 | | Core Laboratories | | 1,387,534 | |
28,000 | | Lufkin Industries, Inc. | | 1,091,720 | |
19,300 | | URS Corp. (3) | | 759,455 | |
| | | | 3,858,722 | |
42
| | | | |
| | |
| |
| | |
| | |
|
| |
| | | | |
|
| | | | | |
Quantity | | Name of Issuer | Fair Value ($)(1) | |
| | | | | |
Non-Energy Minerals (0.9%) | | | |
7,150 | | Allegheny Technologies, Inc. | | 315,958 | |
7,700 | | Haynes International, Inc. | | 237,391 | |
| | | | 553,349 | |
Process Industries (1.8%) | | | |
5,200 | | CF Industries Holdings, Inc. | | 329,940 | |
4,300 | | Dionex Corp. (3) | | 320,178 | |
9,200 | | Scotts Miracle-Gro Co. | | 408,572 | |
| | | | 1,058,690 | |
Producer Manufacturing (7.6%) | | | |
17,000 | | AMETEK, Inc. | | 682,550 | |
10,500 | | Anixter International, Inc. (3) | | 447,300 | |
6,700 | | Esterline Technologies Corp. (3) | | 317,915 | |
19,700 | | Harsco Corp. | | 462,950 | |
16,400 | | IDEX Corp. | | 468,548 | |
12,200 | | MTS Systems Corp. | | 353,800 | |
23,886 | | Rofin-Sinar Technologies, Inc. (3) | | 497,307 | |
27,400 | | Trimble Navigation, Ltd. (3) | | 767,200 | |
13,300 | | Wabtec Corp. | | 530,537 | |
| | | | 4,528,107 | |
Retail Trade (4.7%) | | | |
4,300 | | BJ’s Wholesale Club, Inc. (3) | | 159,143 | |
10,900 | | Casey’s General Stores, Inc. | | 380,410 | |
30,900 | | Cato Corp. | | 680,418 | |
11,100 | | Dicks Sporting Goods, Inc. (3) | | 276,279 | |
27,700 | | GameStop Corp. (3) | | 520,483 | |
32,500 | | Ulta Salon, Cosmetics & Fragrance (3) | | 768,950 | |
| | | | 2,785,683 | |
Technology Services (15.3%) | | | |
27,800 | | ANSYS, Inc. (3) | | 1,127,846 | |
12,700 | | AsiaInfo Holdings, Inc. (3) | | 277,622 | |
13,300 | | Citrix Systems, Inc. (3) | | 561,659 | |
24,800 | | Concur Technologies, Inc. (3) | | 1,058,464 | |
7,900 | | Dolby Laboratories, Inc. (3) | | 495,251 | |
56,300 | | Informatica Corp. (3) | | 1,344,444 | |
35,100 | | Quest Software, Inc. (3) | | 633,204 | |
23,500 | | Solera Holdings, Inc | | 850,700 | |
21,700 | | Sybase, Inc. (3) | | 1,403,122 | |
15,800 | | Syntel, Inc. | | 536,410 | |
27,300 | | The Ultimate Software Group,
Inc. (3) | | 897,078 | |
| | | | 9,185,800 | |
Transportation (1.2%) | | | |
8,400 | | Con-way, Inc. | | 252,168 | |
16,200 | | Hub Group, Inc. (3) | | 486,162 | |
| | | | 738,330 | |
| | | | | |
Quantity | | Name of Issuer | Fair Value ($)(1) | |
| | | | | |
Utilities (0.8%) | | | |
6,600 | | ITC Holdings Corp. | | 349,206 | |
5,900 | | UGI Corp. | | 150,096 | |
| | | | 499,302 | |
Total common stocks | | | |
(cost: $51,047,272) | | 58,850,641 | |
| | | | | |
Short-Term Securities (1.8%) (2) | | | |
1,051,494 | | Wells Fargo Adv. Govt. Fund, 0.04% | | 1,051,494 | |
(cost: $1,051,494) | | | |
| | | | | |
Total investments in securities | | | |
(cost: $52,098,766) (4) | | $ 59,902,135 | |
See accompanying notes to portfolios of investments on page 48.
43
| | | | |
| Sit Developing Markets Growth Fund | | | |
| One Year Ended June 30, 2010 | | | |
| | | | |
| Portfolio Managers: Roger J. Sit and Raymond E. Sit
| | | |
| | | | |
The Sit Developing Markets Growth Fund return was +18.05% over the past twelve months compared to +20.58% for the MSCI Emerging Markets Index and a +20.30% for the MSCI Emerging Markets Growth Index.
While the Fund had positive absolute performance over the past year, the relative underperformance was due to stock selection in the technology and energy sectors. In Brazil, Petrobas, negatively impacted the portfolio as it suffered from a technical overhang in anticipation of what should be Brazil’s largest-ever equity offering in late September. However, given the company’s robust outlook and attractive valuation, we believe, this stock is poised to rebound. The top contributing sector was telecommunications (Mobile TeleSystems and Millicom International Cellular).
On a regional basis, Eastern Europe was the laggard. Poor stock selection came primarily from Central European Distribution, Gazprom, and Cez. Asia ex-Japan led the charge with stellar stock selection from Astra International, Tsingtao Brewery, and Li & Fung.
Emerging market stocks did quite well over the past year as investors became less risk-averse amid signs of improvement in the global economy. Valuations for emerging market stocks are not as compelling compared to last year at this time, but earnings have rebounded and should continue to trend higher even if the current economic momentum decelerates, thanks to various cost-cutting and restructuring measures. We believe investors will continue to invest in companies with exposure to the higher-growth regions of the world, particularly Asia ex-Japan and Latin America. We continue to find attractive opportunities in virtually all sectors in emerging market countries. While the Fund remains well diversified across sectors, there is a tilt to overweight Asia-ex Japan and Latin America at the expense of Emerging Europe, the Middle East and South Africa as the growth prospects in those regions is much better. That said, we have used the recent market volatility to “upgrade” holdings where possible, with a particular focus on companies with strong balance sheets, cash flow, and consistent earnings generation. The research effort continues to be focused on companies with strong, experienced management teams, sound balance sheets, cash flow generation, and sustainable earnings and revenue growth.
INVESTMENT OBJECTIVE AND STRATEGY |
The Fund seeks to maximize long-term capital appreciation. The Fund seeks to achieve its objective by investing at least 80% of its net assets in common stocks of companies domiciled or operating in a developing market. In selecting investments for the Fund, the Adviser begins by selecting countries or regions in which to invest by considering several factors affecting the economy and equity market of foreign countries and regions. After the country and regional allocations are determined, the Adviser seeks industries and sectors that appear to have strong earnings growth prospects. Within the selected industries and sectors, the Adviser invests in foreign growth-oriented companies it believes exhibit the potential for superior growth.
| | |
Net Asset Value 6/30/10: | | $19.00 Per Share |
6/30/09: | | $16.13 Per Share |
| | |
Total Net Assets: | | $14.0 Million |
| | |
Weighted Average Market Cap: | | $31.5 Billion |
PORTFOLIO STRUCTURE - BY REGION
(% OF TOTAL NET ASSETS) |
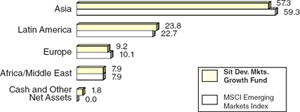
44
| | | | |
| | |
| |
| | |
| | |
|
| |
| | | | |
| | | | | | | | | | | |
| | | | | | | | | | | |
AVERAGE ANNUAL TOTAL RETURNS* | |
| | | | | | | | | | |
| | | Sit
Developing
Markets
Growth Fund | | MSCI
Emerging
Markets
Index(1) | | MSCI
Emerging
Markets
Growth
Index(2) | |
| | | | | | | | | | | |
| 3 Month** | | -12.08 | % | | -9.14 | % | | -9.51 | % | |
| 6 Month** | | -10.80 | | | -7.22 | | | -7.50 | | |
| 1 Year | | 18.05 | | | 20.58 | | | 20.30 | | |
| 5 Year | | 9.75 | | | 10.19 | | | 8.97 | | |
| 10 Year | | 4.47 | | | 7.50 | | | 5.11 | | |
| Inception | | 4.73 | | | 4.14 | | | n/a | | |
| (7/1/94) | | | | | | | | | | |
| | | | | | | | | | | |
CUMULATIVE TOTAL RETURNS* | |
| | | | | | | | | | | |
| | | Sit
Developing
Markets
Growth Fund | | MSCI
Emerging
Markets
Index(1) | | MSCI
Emerging
Markets
Growth
Index(2) | |
| | | | | | | | | | | |
| 1 Year | | 18.05 | % | | 20.58 | % | | 20.30 | % | |
| 5 Year | | 59.25 | | | 62.43 | | | 53.65 | | |
| 10 Year | | 54.90 | | | 106.05 | | | 64.64 | | |
| Inception | | 109.56 | | | 91.58 | | | n/a | | |
| (7/1/94) | | | | | | | | | | |
| | | | | | | | | | | |
| *As of 6/30/10 | | | | | | **Not annualized. | |
| | |
| | |
Performance figures are historical and do not guarantee future results. Investment returns and principal value will vary, and you may have a gain or loss when you sell shares. Average annual total returns include changes in share price as well as reinvestment of all dividends and capital gains. Management fees and administrative expenses are included in the Fund’s performance.
| |
(1) | MSCI Emerging Markets Index is a free float-adjusted market capitalization index that is designed to measure equity market performance of emerging markets. |
(2) | MSCI uses a two-dimensional framework for style segmentation in which value and growth securities are categorized using a multi-factor approach. The objective of the index design is to divide constituents of an underlying MSCI Equity Index into respective value and growth indices, each targeting 50% of the free float-adjusted market capitalization of the underlying market index. |
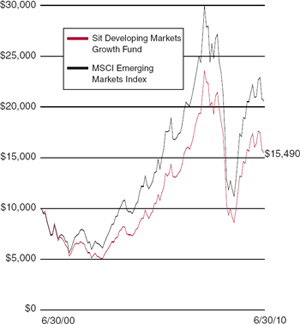
The sum of $10,000 invested on 6/30/00 and held until 6/30/10 would have increased to $15,490 in the Fund, or $20,605 in the MSCI Emerging Markets Index assuming reinvestment of all dividends and capital gains.
PORTFOLIO STRUCTURE - BY SECTOR
(% OF TOTAL NET ASSETS) |
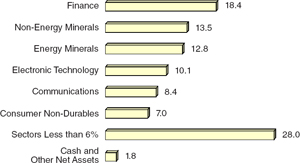
45
| | | | |
| | | | |
| Sit Developing Markets Growth Fund | |
| | |
| Portfolio of Investments - June 30, 2010
| |
| | | | |
|
| | |
| | |
1. | | Petrobras |
2. | | Vale, A.D.R. |
3. | | BHP Billiton, A.D.R. |
4. | | Samsung Electronics |
5. | | Rio Tinto |
6. | | Banco Bradesco S.A. |
7. | | Teva Pharmaceutical, A.D.R. |
8. | | CNOOC, Ltd., A.D.R. |
9. | | China Life Insurance Co., A.D.R. |
10. | | Reliance Industries, G.D.R. |
| | Total Number of Holdings: 83 |
| | | | | |
Quantity | | Name of Issuer Fair Value ($)(1) | |
|
Common Stocks (97.0%) (2) | | | |
Africa/ Middle East (7.9%) | | | |
Israel (3.4%) | | | |
2,900 | | Amdocs, Ltd. (Technology Svcs.) (3) | | 77,865 | |
3,600 | | NICE Systems Ltd., A.D.R.
(Electronic Tech.) (3) | | 91,764 | |
5,800 | | Teva Pharmaceutical, A.D.R. (Health Tech.) | | 301,542 | |
| | | | 471,171 | |
South Africa (4.5%) | | | |
8,330 | | Bidvest Group, Ltd. (Consumer Services) | | 131,826 | |
13,000 | | MTN Group, Ltd. (Communications) | | 170,367 | |
4,600 | | Naspers, Ltd. (Consumer Services) | | 154,907 | |
5,100 | | Sasol, A.D.R. (Energy Minerals) | | 179,877 | |
| | | | 636,977 | |
Asia (56.1%) | | | |
Australia (6.1%) | | | |
6,900 | | BHP Billiton, A.D.R. (Non-Energy Minerals) | | 427,731 | |
6,405 | | Rio Tinto (Non-Energy Minerals) | | 352,240 | |
1,600 | | Rio Tinto, A.D.R, (Non-Energy Minerals) | | 69,760 | |
| | | | 849,731 | |
China / Hong Kong (23.3%) | | | |
5,800 | | AsiaInfo Holdings, Inc. (Tech. Services) (3) | | 126,788 | |
4,400 | | China Life Insurance Co., A.D.R. (Finance) | | 286,880 | |
78,000 | | China Oilfield Services, Ltd. (Industrial Svcs.) | | 90,769 | |
62,500 | | China Railway Construction Corp.
(Producer Manufacturing) | | 78,519 | |
42,000 | | China Shenhua Energy Co. (Energy Minerals) | | 151,524 | |
14,000 | | China Unicom (Hong Kong), Ltd., A.D.R.
(Communications) | | 186,200 | |
1,700 | | CNOOC, Ltd., A.D.R. (Energy Minerals) | | 289,289 | |
3,600 | | Harbin Electric, Inc. (Producer Mfg.) (3) | | 59,940 | |
15,000 | | Hengan International Group, Ltd.
(Consumer Non-Durables) | | 121,462 | |
| | | | | |
Quantity | | Name of Issuer Fair Value ($)(1) | |
| | | | | |
4,600 | | Hong Kong Exchanges & Clearing
(Finance) | | 71,744 | |
3,600 | | HSBC Holdings, A.D.R. (Finance) | | 164,124 | |
131,000 | | Huabao International Holdings, Ltd.
(Consumer Non-Durables) | | 167,447 | |
7,700 | | Jinpan International, Ltd. (Producer Mfg.) | | 116,732 | |
2,100 | | New Oriental Education & Technology Group, A.D.R. (Consumer Svcs.) (3) | | 195,699 | |
102,000 | | PetroChina Co. (Energy Minerals) | | 112,819 | |
40,000 | | Li & Fung, Ltd. (Consumer Durables) | | 178,959 | |
540,000 | | Renhe Commercial Holdings (Finance) | | 111,739 | |
1,600 | | Standard Chartered (Finance) | | 38,961 | |
11,000 | | Sun Hung Kai Properties, Ltd. (Finance) | | 150,436 | |
4,200 | | Tencent Holdings, Ltd (Tech. Services) | | 69,582 | |
158,000 | | Travelsky Technology, Ltd. (Consumer Svcs.) | | 130,434 | |
50,000 | | Tsingtao Brewery (Consumer Non-Durables) | | 233,574 | |
62,000 | | Xinao Gas Holdings, Ltd. (Utlities) | | 137,220 | |
| | | | 3,270,841 | |
India * (4.3%) | | | |
5,900 | | ICICI Bank, A.D.R. (Finance) | | 213,226 | |
1,900 | | Infosys Technologies, Ltd., A.D.R.
(Technology Svcs.) | | 113,829 | |
5,900 | | Reliance Industries, G.D.R.
(Energy Minerals) | | 276,892 | |
| | | | 603,947 | |
Indonesia (1.9%) | | | |
41,500 | | Astra International (Producer Mfg.) | | 219,265 | |
1,400 | | PT Telekom., A.D.R. (Communications) | | 47,922 | |
| | | | 267,187 | |
Phillipines (1.7%) | | | |
451,500 | | Manila Water Co. (Utilities) | | 158,077 | |
366,200 | | SM Prime Holdings, Inc. (Retail Trade) | | 84,834 | |
| | | | 242,911 | |
Singapore (0.5%) | | | |
7,000 | | DBS Group Holdings, Ltd. (Finance) | | 67,934 | |
South Korea (9.9%) | | | |
14,375 | | Cheil Worldwide, Inc. (Commercial Svcs.) | | 150,364 | |
9,007 | | Industrial Bank of Korea (Finance) | | 106,878 | |
2,371 | | KB Financial Group (Finance) | | 90,879 | |
2,375 | | KB Financial Group, A.D.R. (Finance) | | 89,989 | |
2,000 | | POSCO, A.D.R. (Non-Energy Minerals) | | 188,640 | |
660 | | Samsung Electronics (Electronic Tech.) | | 413,961 | |
5,100 | | Shinhan Financial Group (Finance) | | 187,727 | |
370 | | Shinsegae Co., Ltd. (Retail Trade) | | 159,867 | |
| | | | 1,388,305 | |
46
| | | | |
| | |
| |
| | |
| | |
|
| |
| | | | |
| | | | |
| | | | | |
Quantity | | Name of Issuer Fair Value ($)(1) | |
| | | | | |
Taiwan (7.3%) | | | |
83,766 | | Cathay Financial Holding Co. (Finance) | | 123,923 | |
10,975 | | HTC Corp. (Electronic Technology) | | 145,749 | |
35,990 | | Hon Hai Precision Industry Co., G.D.R.
(Electronic Technology) | | 258,945 | |
10,000 | | MediaTek, Inc. (Electronic Technology) | | 139,578 | |
112,482 | | Taiwan Semiconductor Co. (Electronic Tech.) | | 210,233 | |
7,899 | | Taiwan Semi., A.D.R. (Electronic Tech.) | | 77,097 | |
10,000 | | Young Fast Optoelectronics Co.
(Electronic Technology) | | 75,524 | |
| | | | 1,031,049 | |
Thailand (1.1%) | | | |
40,000 | | Bangkok Bank Public Co., Ltd. (Finance) | | 156,404 | |
Europe (9.2%) | | | |
Austria (0.6%) | | | |
2,290 | | Raiffeisen Intl. Bank Holding AG (Finance) | | 86,976 | |
Czech Republic (0.9%) | | | |
2,900 | | CEZ (Utilities) | | 118,036 | |
Luxembourg (1.3%) | | | |
2,300 | | Millicom International Cellular
(Communications) | | 186,461 | |
Poland (1.6%) | | | |
10,400 | | Central European Distribution Corp.
(Consumer Non-Durables) (3) | | 222,352 | |
Russia (3.9%) | | | |
11,700 | | Gazprom, A.D.R. (Energy Minerals) | | 220,077 | |
10,750 | | Mobile Telesystems, A.D.R.
(Communications) | | 205,970 | |
3,800 | | X5 Retail Group N.V. (Retail Trade) (3) | | 127,525 | |
| | | | 553,572 | |
United Kingdom (0.9%) | | | |
3,448 | | Anglo American (Non-Energy Minerals) | | 120,146 | |
Latin America (23.8%) | | | |
Brazil (16.3%) | | | |
11,700 | | AES Tiete S.A. (Utilities) | | 133,788 | |
6,300 | | AGCO Corp. (Producer Mfg.) (3) | | 169,911 | |
19,525 | | Banco Bradesco S.A. (Finance) | | 307,208 | |
2,400 | | Companhia Brasileira de Distribuicao Grupo Pao de Acucar, A.D.R. (Retail Trade) | | 166,848 | |
2,400 | | Companhia de Bebidas das Americas (Consumer Non-Durables) | | 242,424 | |
3,883 | | Embraer de Aeronautica, A.D.R.
(Producer Mfg.) | | 81,349 | |
| | | | | |
Quantity | | Name of Issuer Fair Value ($)(1) | |
| | | | | |
34,680 | | Petrobras (Energy Minerals) | | 517,990 | |
1,600 | | Petrobras, A.D.R. (Energy Minerals) | | 54,912 | |
19,800 | | Vale, A.D.R. (Non-Energy Minerals) | | 482,130 | |
5,200 | | Vivo Participacoes S.A., A.D.R.
(Communications) | | 134,784 | |
| | | | 2,291,344 | |
Chile (1.1%) | | | |
2,400 | | Banco Santander Chile, A.D.R. (Finance) | | 161,016 | |
| | | |
Mexico (4.6%) | | | |
5,400 | | America Movil, A.D.R. (Communications) | | 256,500 | |
3,800 | | Grupo Televisa, A.D.R. (Consumer Svcs.) | | 66,158 | |
4,200 | | Homex, A.D.R. (Consumer Durables) (3) | | 106,008 | |
98,080 | | Wal-Mart de Mexico (Retail Trade) | | 217,272 | |
| | | | 645,938 | |
Peru (1.8%) | | | |
9,400 | | Southern Copper Corp.
(Non-Energy Minerals) | | 249,476 | |
| | | |
Total common stocks | | 13,621,774 | |
(cost: $10,136,355) | | | |
| | | | | |
Exchange Traded Funds (1.2%) (2) | | | |
25,000 | | iShares MSCI India* (3) | | 173,250 | |
(cost: $101,319) | | | |
| | | | | |
Short-Term Securities (1.5%) (2) | | | |
206,450 | | Wells Fargo Adv. Govt. Fund, 0.04% | | 206,450 | |
(cost: $206,450) | | | |
| | | | | |
Total investments in securities
(cost: $10,444,124) (4) | | $ 14,001,474 | |
| |
* | The Fund’s total investment in India including the iShares comprises 5.5% of the Fund’s net assets. |
See accompanying notes to portfolios of investments on page 48.
47
| | | | |
| | | | |
| Sit Mutual Funds | |
| | |
| Notes to Portfolios of Investments
| |
| | | | |
|
| |
(1) | Securities are valued by procedures described in note 1 to the financial statements. |
| |
(2) | Percentage figures indicate percentage of total net assets. |
| |
(3) | Presently non-income producing securities. |
| |
(4) | At June 30, 2010, the cost of securities for federal income tax purposes and the aggregate gross unrealized appreciation and depreciation based on that cost were as follows: |
| | | | | | | | | | | | | |
| | Balanced
Fund | | Dividend
Growth
Fund | | Global
Dividend
Growth
Fund | | Large Cap
Growth
Fund | |
Cost for federal income tax purposes | | $ | 10,111,623 | | $ | 64,928,121 | | $ | 3,507,119 | | $ | 411,483,952 | |
| | | | | | | | | | | | | |
Unrealized appreciation (depreciation) on investments: | | | | | | | | | | | | | |
Gross unrealized appreciation | | $ | 1,000,229 | | $ | 3,328,164 | | $ | 347,659 | | $ | 26,358,554 | |
Gross unrealized depreciation | | | (576,590 | ) | | (4,272,247 | ) | | (147,614 | ) | | (30,211,122 | ) |
| | | | | | | | | | | | | |
Net unrealized appreciation (depreciation) | | $ | 423,639 | | ($ | 944,083 | ) | $ | 200,045 | | ($ | 3,852,568 | ) |
| | | | | | | | | | | | | |
| | Mid Cap
Growth
Fund | | International
Growth
Fund | | Small Cap
Growth
Fund | | Developing
Markets
Growth
Fund | |
Cost for federal income tax purposes | | $ | 118,641,199 | | $ | 19,003,875 | | $ | 52,133,018 | | $ | 10,481,708 | |
| | | | | | | | | | | | | |
Unrealized appreciation (depreciation) on investments: | | | | | | | | | | | | | |
Gross unrealized appreciation | | $ | 26,141,360 | | $ | 3,308,900 | | $ | 13,404,028 | | $ | 4,495,909 | |
Gross unrealized depreciation | | | (14,410,284 | ) | | (2,028,347 | ) | | (5,634,911 | ) | | (976,143 | ) |
| | | | | | | | | | | | | |
Net unrealized appreciation (depreciation) | | $ | 11,731,076 | | $ | 1,280,553 | | $ | 7,769,117 | | $ | 3,519,766 | |
| |
(5) | This secuitry is being fair-valued according to procedures approved by the Board of Directors. |
48
This page has been left blank intentionally.
49
| | | | |
| Sit Mutual Funds | | | |
| June 30, 2010 | | | |
| | | | |
| Statements of Assets and Liabilities
| | | |
| | | | |
| | | | | | | | | | | | | |
| | Balanced
Fund | | Dividend
Growth
Fund | | Global
Dividend
Growth
Fund | | Large Cap
Growth
Fund | |
ASSETS | | | | | | | | | | | | | |
Investments in securities, at identified cost | | $ | 10,106,792 | | $ | 64,510,267 | | $ | 3,507,119 | | $ | 408,928,386 | |
|
Investments in securities, at fair value | | $ | 10,535,262 | | $ | 63,984,038 | | $ | 3,707,164 | | $ | 407,631,384 | |
Cash in bank on demand deposit | | | — | | | — | | | — | | | — | |
Accrued interest and dividends receivable | | | 35,168 | | | 80,189 | | | 7,158 | | | 388,861 | |
Receivable for investment securities sold | | | 41,607 | | | 670,019 | | | 13,246 | | | — | |
Other receivables (note 4) | | | 3,033 | | | 2,786 | | | 161 | | | 20,866 | |
Receivable for Fund shares sold | | | — | | | 309,052 | | | — | | | 102,177 | |
Total assets | | | 10,615,070 | | | 65,046,084 | | | 3,727,729 | | | 408,143,288 | |
|
LIABILITIES | | | | | | | | | | | | | |
Payable for investment securities purchased | | | 50,000 | | | 657,901 | | | 9,613 | | | — | |
Payable for Fund shares redeemed | | | — | | | 4,000 | | | — | | | 419,432 | |
Other payables | | | 6,144 | | | 5,344 | | | 342 | | | — | |
Accrued investment management fees | | | 9,100 | | | 54,870 | | | 3,884 | | | 364,368 | |
Total liabilities | | | 65,244 | | | 722,115 | | | 13,839 | | | 783,800 | |
Net assets applicable to outstanding capital stock | | $ | 10,549,826 | | $ | 64,323,969 | | $ | 3,713,890 | | $ | 407,359,488 | |
|
Net assets consist of: | | | | | | | | | | | | | |
Capital (par value and paid-in surplus) | | $ | 14,898,522 | | $ | 68,242,159 | | $ | 3,478,140 | | $ | 453,797,561 | |
Undistributed (distributions in excess of) net investment income | | | 54,913 | | | 292,944 | | | 24,203 | | | 1,230,257 | |
Accumulated net realized gain (loss) from security transactions and foreign currency transactions | | | (4,832,079 | ) | | (3,684,905 | ) | | 11,489 | | | (46,371,328 | ) |
Unrealized appreciation (depreciation) on investments and foreign currency transactions | | | 428,470 | | | (526,229 | ) | | 200,058 | | | (1,297,002 | ) |
| | $ | 10,549,826 | | $ | 64,323,969 | | $ | 3,713,890 | | $ | 407,359,488 | |
Outstanding shares: | | | | | | | | | | | | | |
Common Shares (Class I) * | | | 744,174 | | | 3,707,369 | | | 271,995 | | | 11,723,700 | |
Common Shares (Class S) * | | | — | | | 2,347,013 | | | 84,807 | | | — | |
|
Net assets applicable to outstanding shares: | | | | | | | | | | | | | |
Common Shares (Class I) * | | $ | 10,549,826 | | $ | 39,430,162 | | $ | 2,831,722 | | $ | 407,359,488 | |
Common Shares (Class S) * | | | — | | | 24,893,807 | | | 882,168 | | | — | |
|
Net asset value per share of outstanding capital stock: | | | | | | | | | | | | | |
Common Shares (Class I) * | | $ | 14.18 | | $ | 10.64 | | $ | 10.41 | | $ | 34.75 | |
Common Shares (Class S) * | | | — | | $ | 10.61 | | $ | 10.40 | | | — | |
* Dividend Growth and Global Dividend Growth Funds offer multiple share classes (I and S). All other Funds offer a single share class.
50
| | | | |
| | |
| |
| | |
| | |
|
| |
| | | | |
| | | | | | | | | | | | | |
| | Mid Cap
Growth
Fund | | International
Growth
Fund | | Small Cap
Growth
Fund | | Developing
Markets
Growth
Fund | |
ASSETS | | | | | | | | | | | | | |
Investments in securities, at identified cost | | $ | 118,639,237 | | $ | 18,962,297 | | $ | 52,098,766 | | $ | 10,444,124 | |
|
Investments in securities, at fair value | | $ | 130,372,275 | | $ | 20,284,428 | | $ | 59,902,135 | | $ | 14,001,474 | |
Cash in bank on demand deposit | | | — | | | — | | | — | | | 2,490 | |
Accrued interest and dividends receivable | | | 60,910 | | | 126,552 | | | 11,726 | | | 56,048 | |
Receivable for investment securities sold | | | 918,994 | | | 59,031 | | | 133,893 | | | — | |
Other receivables (note 4) | | | — | | | 229,242 | | | 51,661 | | | 6,960 | |
Receivable for Fund shares sold | | | — | | | — | | | 10 | | | — | |
Total assets | | | 131,352,179 | | | 20,699,253 | | | 60,099,425 | | | 14,066,972 | |
|
LIABILITIES | | | | | | | | | | | | | |
Payable for investment securities purchased | | | 796,852 | | | 53,832 | | | 174,352 | | | — | |
Payable for Fund shares redeemed | | | 7,733 | | | — | | | — | | | — | |
Other payables | | | 151,416 | | | 28,219 | | | — | | | — | |
Accrued investment management fees | | | 138,568 | | | 31,051 | | | 77,298 | | | 24,280 | |
Total liabilities | | | 1,094,569 | | | 113,102 | | | 251,650 | | | 24,280 | |
Net assets applicable to outstanding capital stock | | $ | 130,257,610 | | $ | 20,586,151 | | $ | 59,847,775 | | $ | 14,042,692 | |
|
Net assets consist of: | | | | | | | | | | | | | |
Capital (par value and paid-in surplus) | | $ | 131,885,525 | | $ | 43,716,118 | | $ | 88,952,276 | | $ | 10,145,956 | |
Undistributed (distributions in excess of) net investment income | | | — | | | 187,073 | | | — | | | 10,903 | |
Accumulated net realized gain (loss) from security transactions and foreign currency transactions | | | (13,360,953 | ) | | (24,639,840 | ) | | (36,907,870 | ) | | 328,501 | |
Unrealized appreciation (depreciation) on investments and foreign currency transactions | | | 11,733,038 | | | 1,322,800 | | | 7,803,369 | | | 3,557,332 | |
| | $ | 130,257,610 | | $ | 20,586,151 | | $ | 59,847,775 | | $ | 14,042,692 | |
Outstanding shares: | | | | | | | | | | | | | |
Common Shares (Class I) * | | | 11,255,858 | | | 1,764,180 | | | 1,911,144 | | | 738,922 | |
Common Shares (Class S) * | | | — | | | — | | | — | | | — | |
|
Net assets applicable to outstanding shares: | | | | | | | | | | | | | |
Common Shares (Class I) * | | $ | 130,257,610 | | $ | 20,586,151 | | $ | 59,847,775 | | $ | 14,042,692 | |
Common Shares (Class S) * | | | — | | | — | | | — | | | — | |
|
Net asset value per share of outstanding capital stock: | | | | | | | | | | | | | |
Common Shares (Class I) * | | $ | 11.57 | | $ | 11.67 | | $ | 31.32 | | $ | 19.00 | |
Common Shares (Class S) * | | | — | | | — | | | — | | | — | |
See accompanying notes to financial statements on page 58.
51
| | | | |
| Sit Mutual Funds | | | |
| One Year Ended June 30, 2010 | | | |
| | | | |
| Statements of Operations | | | |
| | | | |
| | | | | | | | | | |
| | Balanced
Fund | | Dividend
Growth
Fund | | Global
Dividend
Growth
Fund | |
Investment income: | | | | | | | | | | |
Income: | | | | | | | | | | |
Dividends * | | $ | 157,680 | | $ | 1,607,208 | | $ | 102,258 | |
Interest | | | 231,584 | | | 7,871 | | | 19 | |
Total income | | | 389,264 | | | 1,615,079 | | | 102,277 | |
|
Expenses (note 3): | | | | | | | | | | |
Investment management and advisory service fee | | | 113,061 | | | 600,101 | | | 46,865 | |
12b-1 Fee - Class S | | | — | | | 61,616 | | | 2,269 | |
|
Total expenses | | | 113,061 | | | 661,717 | | | 49,134 | |
|
Less fees and expenses absorbed by investment adviser | | | — | | | — | | | — | |
|
Total net expenses | | | 113,061 | | | 661,717 | | | 49,134 | |
|
Net investment income (loss) | | | 276,203 | | | 953,362 | | | 53,143 | |
|
Realized and unrealized gain (loss) on investments: | | | | | | | | | | |
Net realized gain (loss) | | | (434,743 | ) | | 1,675,499 | | | 52,628 | |
Net change in unrealized appreciation (depreciation) on | | | | | | | | | | |
investments and foreign currency transactions | | | 1,476,636 | | | 2,901,091 | | | 126,766 | |
Realized gain (loss) on foreign currency transactions | | | — | | | — | | | (94 | ) |
|
Net gain (loss) on investments | | | 1,041,893 | | | 4,576,590 | | | 179,300 | |
|
Net increase (decrease) in net assets resulting from operations | | $ | 1,318,096 | | $ | 5,529,952 | | $ | 232,443 | |
|
| | |
|
* Foreign taxes withheld on dividends received | | $ | 494 | | $ | 25,817 | | $ | 5,015 | |
52
| | | | |
| | |
| |
| | |
| | |
|
| |
| | | | |
| | | | | | | | | | | | | | | | |
| | Large Cap
Growth
Fund | | Mid Cap
Growth
Fund | | International
Growth
Fund | | Small Cap
Growth
Fund | | Developing
Markets
Growth
Fund | |
Investment income: | | | | | | | | | | | | | | | | |
Income: | | | | | | | | | | | | | | | | |
Dividends * | | $ | 6,732,412 | | $ | 1,019,073 | | $ | 548,327 | | $ | 441,020 | | $ | 317,816 | |
Interest | | | 2,990 | | | 293 | | | 106 | | | 223 | | | 925 | |
Total income | | | 6,735,402 | | | 1,019,366 | | | 548,433 | | | 441,243 | | | 318,741 | |
|
Expenses (note 3): | | | | | | | | | | | | | | | | |
Investment management and advisory service fee | | | 4,263,476 | | | 1,749,778 | | | 432,521 | | | 946,143 | | | 310,105 | |
12b-1 Fee - Class S | | | — | | | — | | | — | | | — | | | — | |
|
Total expenses | | | 4,263,476 | | | 1,749,778 | | | 432,521 | | | 946,143 | | | 310,105 | |
|
Less fees and expenses absorbed by investment adviser | | | — | | | (139,982 | ) | | (81,828 | ) | | — | | | — | |
|
Total net expenses | | | 4,263,476 | | | 1,609,796 | | | 350,693 | | | 946,143 | | | 310,105 | |
|
Net investment income (loss) | | | 2,471,926 | | | (590,430 | ) | | 197,740 | | | (504,900 | ) | | 8,636 | |
|
Realized and unrealized gain (loss) on investments: | | | | | | | | | | | | | | | | |
Net realized gain (loss) | | | (6,406,205 | ) | | 5,885,385 | | | 413,622 | | | 2,158,857 | | | 1,307,563 | |
Net change in unrealized appreciation (depreciation) on | | | | | | | | | | | | | | | | |
investments and foreign currency transactions | | | 28,265,518 | | | 16,424,075 | | | 1,060,153 | | | 10,263,345 | | | 999,287 | |
Realized gain (loss) on foreign currency transactions | | | — | | | — | | | (1,749 | ) | | — | | | 2,267 | |
|
Net gain (loss) on investments | | | 21,859,313 | | | 22,309,460 | | | 1,472,026 | | | 12,422,202 | | | 2,309,117 | |
|
Net increase (decrease) in net assets resulting from operations | | $ | 24,331,239 | | $ | 21,719,030 | | $ | 1,669,766 | | $ | 11,917,302 | | $ | 2,317,753 | |
|
| | |
|
* Foreign taxes withheld on dividends received | | $ | 25,033 | | $ | 11,545 | | $ | 45,186 | | $ | 2,074 | | $ | 36,127 | |
See accompanying notes to financial statements on page 58.
53
| | | | |
| Sit Mutual Funds | | | |
| Statements of Changes in Net Assets
| | | |
| | | | |
| | | | | | | | | | | | | |
| | Balanced Fund | | Dividend Growth Fund | |
| | Year ended
June 30, 2010 | | Year ended
June 30, 2009 | | Year ended
June 30, 2010 | | Year ended
June 30, 2009 | |
Operations: | | | | | | | | | | | | | |
Net investment income (loss) | | $ | 276,203 | | $ | 325,445 | | $ | 953,362 | | $ | 933,863 | |
Net realized gain (loss) on investments | | | (434,743 | ) | | (337,911 | ) | | 1,675,499 | | | (5,295,631 | ) |
Net change in unrealized appreciation (depreciation) on investments and foreign currency transactions | | | 1,476,636 | | | (2,232,666 | ) | | 2,901,091 | | | (5,111,905 | ) |
Net realized gain (loss) on foreign currency transactions | | | — | | | — | | | — | | | — | |
Net increase (decrease) in net assets resulting from operations | | | 1,318,096 | | | (2,245,132 | ) | | 5,529,952 | | | (9,473,673 | ) |
Distributions to shareholders from (note 1): | | | | | | | | | | | | | |
Net investment income | | | | | | | | | | | | | |
Common shares (Class I) | | | (293,000 | ) | | (351,000 | ) | | (548,746 | ) | | (775,366 | ) |
Common shares (Class S) | | | — | | | — | | | (330,254 | ) | | (205,634 | ) |
Net realized gains on investments | | | | | | | | | | | | | |
Common shares (Class I) | | | — | | | — | | | — | | | (1,171,782 | ) |
Common shares (Class S) | | | — | | | — | | | — | | | (242,236 | ) |
Total distributions | | | (293,000 | ) | | (351,000 | ) | | (879,000 | ) | | (2,395,018 | ) |
Capital share transactions (note 1): | | | | | | | | | | | | | |
Proceeds from shares sold | | | | | | | | | | | | | |
Common shares (Class I) | | | 714,605 | | | 657,834 | | | 11,452,027 | | | 3,213,315 | |
Common shares (Class S) | | | — | | | — | | | 16,562,200 | | | 13,891,609 | |
Capital share proceeds (note 4) | | | — | | | — | | | — | | | — | |
Reinvested distributions | | | | | | | | | | | | | |
Common shares (Class I) | | | 291,180 | | | 349,158 | | | 522,134 | | | 1,891,925 | |
Common shares (Class S) | | | — | | | — | | | 328,928 | | | 446,313 | |
Payments for shares redeemed | | | | | | | | | | | | | |
Common shares (Class I) | | | (1,829,957 | ) | | (1,001,363 | ) | | (3,637,969 | ) | | (7,053,472 | ) |
Common shares (Class S) | | | — | | | — | | | (9,589,022 | ) | | (12,025,836 | ) |
|
Increase (decrease) in net assets from capital share transactions | | | (824,172 | ) | | 5,629 | | | 15,638,298 | | | 363,854 | |
|
Total increase (decrease) in net assets | | | 200,924 | | | (2,590,503 | ) | | 20,289,250 | | | (11,504,837 | ) |
Net assets | | | | | | | | | | | | | |
Beginning of period | | | 10,348,902 | | | 12,939,405 | | | 44,034,719 | | | 55,539,556 | |
End of period * | | $ | 10,549,826 | | $ | 10,348,902 | | $ | 64,323,969 | | $ | 44,034,719 | |
Capital transactions in shares (note 1): | | | | | | | | | | | | | |
Sold | | | | | | | | | | | | | |
Common shares (Class I) | | | 49,409 | | | 51,967 | | | 1,042,818 | | | 336,678 | |
Common shares (Class S) | | | — | | | — | | | 1,530,590 | | | 1,516,957 | |
Reinvested distributions | | | | | | | | | | | | | |
Common shares (Class I) | | | 20,558 | | | 26,689 | | | 48,739 | | | 204,162 | |
Common shares (Class S) | | | — | | | — | | | 30,536 | | | 47,947 | |
Redeemed | | | | | | | | | | | | | |
Common shares (Class I) | | | (124,370 | ) | | (73,150 | ) | | (332,759 | ) | | (737,714 | ) |
Common shares (Class S) | | | — | | | — | | | (856,775 | ) | | (1,015,342 | ) |
| | | | | | | | | | | | | |
Net increase (decrease) | | | (54,403 | ) | | 5,506 | | | 1,463,149 | | | 352,688 | |
| | | | | | | | | | | | | |
* includes undistributed net investment income | | $ | 54,913 | | $ | 71,710 | | $ | 292,944 | | $ | 218,582 | |
54
| | | | |
| | |
| |
| | |
| | |
|
| |
| | | | |
| | | | | | | | | | | | | | | | | | | |
| | Global Dividend Growth Fund | | Large Cap Growth Fund | | Mid Cap Growth Fund | |
| | Year ended
June 30, 2010 | | Nine months ended
June 30, 2009 | | Year ended
June 30, 2010 | | Year ended
June 30, 2009 | | Year ended
June 30, 2010 | | Year ended
June 30, 2009 | |
Operations: | | | | | | | | | | | | | | | | | | | |
Net investment income (loss) | | $ | 53,143 | | | 36,154 | | $ | 2,471,926 | | $ | 2,210,806 | | ($ | 590,430 | ) | ($ | 412,308 | ) |
Net realized gain (loss) on investments | | | 52,628 | | | (41,176 | ) | | (6,406,205 | ) | | (26,329,574 | ) | | 5,885,385 | | | (13,765,942 | ) |
Net change in unrealized appreciation (depreciation) on investments and foreign currency transactions | | | 126,766 | | | 73,292 | | | 28,265,518 | | | (49,550,297 | ) | | 16,424,075 | | | (55,121,433 | ) |
|
Net realized gain (loss) on foreign currency transactions | | | (94 | ) | | 37 | | | — | | | — | | | — | | | — | |
Net increase (decrease) in net assets resulting from operations | | | 232,443 | | | 68,307 | | | 24,331,239 | | | (73,669,065 | ) | | 21,719,030 | | | (69,299,683 | ) |
|
Distributions to shareholders from (note 1): | | | | | | | | | | | | | | | | | | | |
Net investment income | | | | | | | | | | | | | | | | | | | |
Common shares (Class I) | | | (35,594 | ) | | (14,403 | ) | | (2,475,000 | ) | | (1,549,999 | ) | | — | | | — | |
Common shares (Class S) | | | (9,406 | ) | | (5,597 | ) | | — | | | — | | | — | | | — | |
Net realized gains on investments | | | | | | | | | | | | | | | | | | | |
Common shares (Class I) | | | — | | | — | | | — | | | — | | | — | | | (1,273,427 | ) |
Common shares (Class S) | | | — | | | — | | | — | | | — | | | — | | | — | |
Total distributions | | | (45,000 | ) | | (20,000 | ) | | (2,475,000 | ) | | (1,549,999 | ) | | — | | | (1,273,427 | ) |
Capital share transactions (note 1): | | | | | | | | | | | | | | | | | | | |
Proceeds from shares sold | | | | | | | | | | | | | | | | | | | |
Common shares (Class I) | | | 800,548 | | | 2,391,949 | | | 168,575,536 | | | 239,937,366 | | | 3,455,887 | | | 4,659,494 | |
Common shares (Class S) | | | 87,287 | | | 761,161 | | | — | | | — | | | — | | | — | |
Capital share proceeds (note 4) | | | — | | | — | | | — | | | — | | | — | | | — | |
Reinvested distributions | | | | | | | | | | | | | | | | | | | |
Common shares (Class I) | | | 38,856 | | | 14,403 | | | 2,388,780 | | | 1,534,522 | | | — | | | 1,236,478 | |
Common shares (Class S) | | | 9,406 | | | 5,597 | | | — | | | — | | | — | | | — | |
Payments for shares redeemed | | | | | | | | | | | | | | | | | | | |
Common shares (Class I) | | | (438,850 | ) | | (187,353 | ) | | (109,531,746 | ) | | (129,877,604 | ) | | (22,394,021 | ) | | (18,725,733 | ) |
Common shares (Class S) | | | — | | | (4,864 | ) | | — | | | — | | | — | | | — | |
|
Increase (decrease) in net assets from capital share transactions | | | 497,247 | | | 2,980,893 | | | 61,432,570 | | | 111,594,284 | | | (18,938,134 | ) | | (12,829,761 | ) |
|
Total increase (decrease) in net assets | | | 684,690 | | | 3,029,200 | | | 83,288,809 | | | 36,375,220 | | | 2,780,896 | | | (83,402,871 | ) |
Net assets | | | | | | | | | | | | | | | | | | | |
Beginning of period | | | 3,029,200 | | | — | | | 324,070,679 | | | 287,695,459 | | | 127,476,714 | | | 210,879,585 | |
End of period * | | $ | 3,713,890 | | $ | 3,029,200 | | $ | 407,359,488 | | $ | 324,070,679 | | $ | 130,257,610 | | $ | 127,476,714 | |
Capital transactions in shares (note 1): | | | | | | | | | | | | | | | | | | | |
Sold | | | | | | | | | | | | | | | | | | | |
Common shares (Class I) | | | 71,957 | | | 254,371 | | | 4,598,800 | | | 7,466,350 | | | 295,669 | | | 469,384 | |
Common shares (Class S) | | | 7,643 | | | 76,160 | | | — | | | — | | | — | | | — | |
Reinvested distributions | | | | | | | | | | | | | | | | | | | |
Common shares (Class I) | | | 3,662 | | | 1,649 | | | 63,112 | | | 51,719 | | | — | | | 144,280 | |
Common shares (Class S) | | | 889 | | | 636 | | | — | | | — | | | — | | | — | |
Redeemed | | | | | | | | | | | | | | | | | | | |
Common shares (Class I) | | | (39,538 | ) | | (20,106 | ) | | (2,934,489 | ) | | (4,148,556 | ) | | (1,919,160 | ) | | (1,949,894 | ) |
Common shares (Class S) | | | — | | | (521 | ) | | — | | | — | | | — | | | — | |
|
Net increase (decrease) | | | 44,613 | | | 312,189 | | | 1,727,423 | | | 3,369,513 | | | (1,623,491 | ) | | (1,336,230 | ) |
|
|
* includes undistributed net investment income | | $ | 24,203 | | $ | 16,154 | | $ | 1,230,257 | | $ | 1,233,331 | | | — | | | — | |
See accompanying notes to financial statements on page 58.
55
| | | | |
| Sit Mutual Funds | | | |
| | | | |
| | | | |
| Statements of Changes in Net Assets (continued)
| | | |
| | | | |
| | | | | | | | | | | | | |
| | International Growth Fund | | Small Cap Growth Fund | |
| | Year ended
June 30, 2010 | | Year ended
June 30, 2009 | | Year ended
June 30, 2010 | | Year ended
June 30, 2009 | |
Operations: | | | | | | | | | | | | | |
Net investment income (loss) | | $ | 197,740 | | $ | 255,275 | | | ($504,900 | ) | | ($387,794 | ) |
Net realized gain (loss) on investments | | | 413,622 | | | (4,060,944 | ) | | 2,158,857 | | | (10,097,980 | ) |
Net change in unrealized appreciation (depreciation) on investments and foreign currency transactions | | | 1,060,153 | | | (10,726,201 | ) | | 10,263,345 | | | (18,542,232 | ) |
Net realized gain (loss) on foreign currency transactions | | | (1,749 | ) | | 925 | | | — | | | — | |
Net increase (decrease) in net assets resulting from operations | | | 1,669,766 | | | (14,530,945 | ) | | 11,917,302 | | | (29,028,006 | ) |
Distributions to shareholders from (note 1): | | | | | | | | | | | | | |
Net investment income | | | | | | | | | | | | | |
Common shares (Class I) | | | (228,000 | ) | | (350,000 | ) | | — | | | — | |
Common shares (Class S) | | | — | | | — | | | — | | | — | |
Net realized gains on investments | | | | | | | | | | | | | |
Common shares (Class I) | | | — | | | — | | | — | | | — | |
Common shares (Class S) | | | — | | | — | | | — | | | — | |
Total distributions | | | (228,000 | ) | | (350,000 | ) | | — | | | — | |
Capital share transactions (note 1): | | | | | | | | | | | | | |
Proceeds from shares sold | | | | | | | | | | | | | |
Common shares (Class I) | | | 701,521 | | | 1,017,171 | | | 4,964,717 | | | 5,188,722 | |
Common shares (Class S) | | | — | | | — | | | — | | | — | |
Capital share proceeds (note 4) | | | 229,242 | | | 201,098 | | | — | | | — | |
Reinvested distributions | | | | | | | | | | | | | |
Common shares (Class I) | | | 225,692 | | | 345,271 | | | — | | | — | |
Common shares (Class S) | | | — | | | — | | | — | | | — | |
Payments for shares redeemed | | | | | | | | | | | | | |
Common shares (Class I) | | | (3,021,002 | ) | | (3,387,765 | ) | | (15,386,598 | ) | | (11,335,025 | ) |
Common shares (Class S) | | | — | | | — | | | — | | | — | |
|
Increase (decrease) in net assets from capital share transactions | | | (1,864,547 | ) | | (1,824,225 | ) | | (10,421,881 | ) | | (6,146,303 | ) |
|
Total increase (decrease) in net assets | | | (422,781 | ) | | (16,705,170 | ) | | 1,495,421 | | | (35,174,309 | ) |
Net assets | | | | | | | | | | | | | |
Beginning of period | | | 21,008,932 | | | 37,714,102 | | | 58,352,354 | | | 93,526,663 | |
End of period * | | $ | 20,586,151 | | $ | 21,008,932 | | $ | 59,847,775 | | $ | 58,352,354 | |
Capital transactions in shares (note 1): | | | | | | | | | | | | | |
Sold | | | | | | | | | | | | | |
Common shares (Class I) | | | 55,740 | | | 87,795 | | | 164,198 | | | 203,373 | |
Common shares (Class S) | | | — | | | — | | | — | | | — | |
Reinvested distributions | | | | | | | | | | | | | |
Common shares (Class I) | | | 17,496 | | | 34,118 | | | — | | | — | |
Common shares (Class S) | | | — | | | — | | | — | | | — | |
Redeemed | | | | | | | | | | | | | |
Common shares (Class I) | | | (236,170 | ) | | (313,402 | ) | | (507,131 | ) | | (447,245 | ) |
Common shares (Class S) | | | — | | | — | | | — | | | — | |
| | | | | | | | | | | | | |
Net increase (decrease) | | | (162,934 | ) | | (191,489 | ) | | (342,933 | ) | | (243,872 | ) |
| | | | | | | | | | | | | |
* includes undistributed net investment income | | $ | 187,073 | | $ | 219,082 | | | — | | | — | |
56
| | | | |
| | |
| |
| | |
| | |
|
| |
| | | | |
| | | | | | | |
| | Developing Markets Growth Fund | |
| | Year ended
June 30, 2010 | | Year ended
June 30, 2009 | |
Operations: | | | | | | | |
Net investment income (loss) | | $ | 8,636 | | $ | 30,739 | |
Net realized gain (loss) on investments | | | 1,307,563 | | | (976,513 | ) |
Net change in unrealized appreciation (depreciation) on investments and foreign currency transactions | | | 999,287 | | | (7,050,767 | ) |
Net realized gain (loss) on foreign currency transactions | | | 2,267 | | | 1,492 | |
Net increase (decrease) in net assets resulting from operations | | | 2,317,753 | | | (7,995,049 | ) |
Distributions to shareholders from (note 1): | | | | | | | |
Net investment income | | | | | | | |
Common shares (Class I) | | | (34,186 | ) | | — | |
Common shares (Class S) | | | — | | | — | |
Net realized gains on investments | | | | | | | |
Common shares (Class I) | | | — | | | (602,947 | ) |
Common shares (Class S) | | | — | | | — | |
Total distributions | | | (34,186 | ) | | (602,947 | ) |
Capital share transactions (note 1): | | | | | | | |
Proceeds from shares sold | | | | | | | |
Common shares (Class I) | | | 2,723,237 | | | 3,132,165 | |
Common shares (Class S) | | | — | | | — | |
Capital share proceeds (note 4) | | | — | | | 77,735 | |
Reinvested distributions | | | | | | | |
Common shares (Class I) | | | 33,593 | | | 591,613 | |
Common shares (Class S) | | | — | | | — | |
Payments for shares redeemed | | | | | | | |
Common shares (Class I) | | | (4,200,831 | ) | | (5,195,466 | ) |
Common shares (Class S) | | | — | | | — | |
|
Increase (decrease) in net assets from capital share transactions | | | (1,444,001 | ) | | (1,393,953 | ) |
|
Total increase (decrease) in net assets | | | 839,566 | | | (9,991,949 | ) |
Net assets | | | | | | | |
Beginning of period | | | 13,203,126 | | | 23,195,075 | |
End of period * | | $ | 14,042,692 | | $ | 13,203,126 | |
Capital transactions in shares (note 1): | | | | | | | |
Sold | | | | | | | |
Common shares (Class I) | | | 136,017 | | | 203,053 | |
Common shares (Class S) | | | — | | | — | |
Reinvested distributions | | | | | | | |
Common shares (Class I) | | | 1,635 | | | 48,099 | |
Common shares (Class S) | | | — | | | — | |
Redeemed | | | | | | | |
Common shares (Class I) | | | (217,329 | ) | | (325,827 | ) |
Common shares (Class S) | | | — | | | — | |
| | | | | | | |
Net increase (decrease) | | | (79,677 | ) | | (74,675 | ) |
| | | | | | | |
* includes undistributed net investment income | | $ | 10,903 | | $ | 34,186 | |
See accompanying notes to financial statements on page 58.
57
| | | | |
| Sit Mutual Funds | | | |
| | | | |
| | | | |
| Notes to Financial Statements
| | | |
| | | | |
| |
(1) | Summary of Significant Accounting Policies |
| |
| Sit Mutual Funds are no-load funds, and are registered under the Investment Company Act of 1940 (as amended) as diversified, open-end management investment companies, or series thereof. The Sit Developing Markets Growth, Sit Small Cap Growth, Sit Dividend Growth, Sit Global Dividend Growth, Sit International Growth, and Sit Balanced, are series funds of Sit Mutual Funds, Inc. |
| |
| This report covers the equity funds of the Sit Mutual Funds (the Funds). Each fund has 10 billion authorized shares of capital stock with a par value of $0.001. The investment objective for each Fund is as follows: |
| | |
Fund | | Investment Objective
|
Balanced | | Long-term growth consistent with the preservation of principal and to provide regular income. |
Dividend Growth | | Provide current income that exceeds the dividend yield of the S&P 500 Index and that grows over a period of years. Secondarily, maximize long-term capital appreciation. |
Global Dividend Growth | | Provide current income that exceeds the dividend yield of a composite index (60% S&P 500 Index & 40% MSCI EAFE Index) and that grows over a period of years. Secondarily, maximize long-term capital appreciation. |
Large Cap Growth Fund, Inc. | | Maximize long-term capital appreciation. |
Mid Cap Growth Fund, Inc. | | Maximize long-term capital appreciation. |
International Growth | | Maximize long-term growth. |
Small Cap Growth | | Maximize long-term capital appreciation. |
Developing Markets Growth | | Maximize long-term capital appreciation. |
| |
| The Dividend Growth and Global Dividend Growth Funds offer Class I and Class S shares. Both classes of shares have identical voting, dividend, and liquidation rights. The distribution fee differs among classes, the Class S shares have a 0.25% distribution fee, whereas Class I has no distribution fee. Income, expenses (other than class specific expenses) and realized and unrealized gains or losses on investments are allocated to each class of shares based upon its relative net assets. |
| |
| Significant accounting policies followed by the Funds are summarized below: |
| |
| Short-Term Trading (Redemption) Fees |
| The Funds (except Balanced) charge a redemption fee equal to 2.00% of the proceeds on shares held for less than 30 calendar days. The fee is retained by the Fund for the benefit of its long-term shareholders and accounted for as an addition to paid in capital. |
58
| | | | |
| | |
| |
| | |
| | |
|
| |
| | | | |
| | |
| Investments in Securities |
| Investments in securities traded on national or international securities exchanges are valued at the last reported sales price prior to the time when assets are valued. Securities traded on the over-the-counter market are valued at the last reported sales price or if the last sales price is not available at the last reported bid price. The sale and bid prices or prices deemed best to reflect fair value quoted by dealers who make markets in these securities are obtained from independent pricing services. Debt securities maturing in more than 60 days are priced by an independent pricing service. The pricing service may use models that price securities based on current yields and relative security characteristics, such as coupon rate, maturity date, issuer credit quality, and prepayment speeds as applicable. When market quotations are not readily available, or when the Advisor becomes aware that a significant event impacting the value of a security or group of securities has occurred after the closing of the exchange on which the security or securities principally trade, but before the calculation of the daily net asset value, securities are valued at fair value as determined in good faith using procedures established by the Board of Directors. The procedures consider, among others, the following factors to determine a security’s fair value: the nature and pricing history (if any) of the security; whether any dealer quotations for the security are available; and possible valuation methodologies that could be used to determine the fair value of the security. Debt securities maturing in less than 60 days when acquired, or which subsequently are within 60 days of maturity, are valued at amortized cost. |
| |
| Security transactions are accounted for on the date the securities are purchased or sold. Securities gains and losses are calculated on the identified-cost basis. Dividend income is recorded on the ex-dividend date or upon the receipt of ex-dividend notification in the case of certain foreign securities. Interest, including level-yield amortization of long-term bond premium and discount, is recorded on the accrual basis. |
| |
| Fair Value Measurements |
| Various inputs are used in determining the value of the Funds’ investments, primarily inputs using the market approach. These inputs are summarized into three levels and described below: |
| |
| • | Level 1 — quoted prices for active markets for identical securities. An active market for the security is a market in which transactions occur with sufficient frequency and volume to provide pricing information on an ongoing basis. A quoted price in an active market provides the most reliable evidence of fair value. |
|
| • | Level 2 — other significant observable inputs including quoted prices for similar securities, interest rates, prepayment speeds, credit risk, etc. or quoted prices for identical or similar assets in markets that are not active. These are primarily inputs that are derived principally from or corroborated by observable market data. An adjustment to any observable input that is significant to the fair value may render the measurement a Level 3 measurement. |
|
| • | Level 3 — significant unobservable inputs, including the Fund’s own assumptions in determining the fair value of investments. |
59
| | | | |
| Sit Mutual Funds | | | |
| | | | |
| Notes to Financial Statements (continued)
| | | |
| | | | |
| |
| The inputs or methodology used for valuing securities are not necessarily an indication of the risk associated with investing in those securities. The following is a summary of the inputs used in valuing the Funds’ assets carried at fair value on June 30, 2010: |
| | | | | | | | | | | | | |
| | Investment in securities (**) | |
| | Level 1 | | Level 2 | | Level 3 | | | |
| | | | | | | | | |
Fund | | Quoted Prices | | Other significant
observable inputs | | Significant
unobservable inputs | | Total | |
Balanced | | | | | | | | | | | | | |
Equity Securities | | $ | 6,812,987 | | | — | | — | | | $ | 6,812,987 | |
Closed-End Mutual Funds | | | 340,947 | | | — | | — | | | | 340,047 | |
Taxable Municipal Securities | | | — | | | 72,086 | | — | | | | 72,086 | |
Asset-Backed Securities | | | — | | | 336,788 | | — | | | | 336,788 | |
Collateralized Mortgage Obligations | | | — | | | 419,985 | | — | | | | 419,985 | |
Mortgage Pass-Through Securities | | | — | | | 1,352,267 | | — | | | | 1,352,267 | |
U.S. Treasury/Federal Agency Securities | | | — | | | 495,607 | | — | | | | 495,607 | |
Corporate Bonds | | | — | | | 704,595 | | — | | | | 704,595 | |
| | | 7,153,934 | | | 3,381,328 | | — | | | | 10,535,262 | |
Dividend Growth | | | | | | | | | | | | | |
Equity Securities | | | 62,906,202 | | | — | | — | | | | 62,906,202 | |
Closed-End Mutual Funds | | | 1,077,836 | | | — | | — | | | | 1,077,836 | |
| | | 63,984,038 | | | — | | — | | | | 63,984,038 | |
| | | | | | | | | | | | | |
Global Dividend Growth (*) | | | | | | | | | | | | | |
Equity Securities | | | 3,284,149 | | | 361,828 | | — | | | | 3,645,977 | |
Closed-End Mutual Funds | | | 61,187 | | | — | | — | | | | 61,187 | |
| | | 3,345,336 | | | 361,828 | | — | | | | 3,707,164 | |
| | | | | | | | | | | | | |
Large Cap Growth (*) | | | 407,631,384 | | | — | | — | | | | 407,631,384 | |
Mid Cap Growth (*) | | | 130,372,275 | | | — | | — | | | | 130,372,275 | |
International Growth (*) | | | 8,143,151 | | | 12,141,277 | | — | | | | 20,284,428 | |
Small Cap Growth (*) | | | 59,902,135 | | | — | | — | | | | 59,902,135 | |
Developing Markets Growth (*) | | | 8,250,998 | | | 5,750,476 | | — | | | | 14,001,474 | |
| |
* | For these Funds, 100% of the investment value is comprised of equity securities. Level 2 equity securities are primarily foreign securities where the closing price has been adjusted by application of a systematic process for events occurring after the close of the foreign exchange. |
| |
** | Equity securities include short-term money market instruments and exchange-traded funds. At June 30, 2010, the Funds held no other financial instruments. See the respective Fund’s Portfolio of Investments for industry and/or geographical classification. For the year ended June 30, 2010, the Funds held no assets in which significant unobservable inputs (Level 3) were used in determining fair value. |
60
| | | | |
| | |
| |
| | |
| | |
|
| |
| | | | |
| |
| In January 2010, the Financial Accounting Standards Board (“FASB”) issued Accounting Standards Update (“ASU”) No. 2010-06 “Improving Disclosures about Fair Value Measurements”. ASU 2010-06 amends FASB Accounting Standards Codification Topic 820, Fair Value Measurements and Disclosures, to require additional disclosures regarding fair value measurements. Certain disclosures required by ASU No. 2010-06 are effective for interim and annual reporting periods beginning after December 15, 2009, and other required disclosures are effective for fiscal years beginning after December 15, 2010, and for interim periods within those fiscal years. Management is currently evaluating the impact ASU No. 2010-06 will have on its financial statement disclosures. |
| |
| Foreign Currency Translations and Forward Foreign Currency Contracts |
| The fair value of securities and other assets and liabilities denominated in foreign currencies for Global Dividend Growth, Developing Markets Growth and International Growth Funds are translated daily into U.S. dollars at the closing rate of exchange (approximately 4:00 p.m. E.S.T). Purchases and sales of securities, income and expenses are translated at the exchange rate on the transaction date. Dividend and interest income includes currency exchange gains (losses) realized between the accrual and payment dates on such income. Exchange gains (losses) may also be realized between the trade and settlement dates on security and forward contract transactions. For securities denominated in foreign currencies, the effect of changes in foreign exchange rates on realized and unrealized gains or losses is reflected as a component of such gains or losses. |
| |
| The Global Dividend Growth, Developing Markets Growth and International Growth Funds may enter into forward foreign currency exchange contracts generally for operational purposes, but the Adviser may occasionally utilize contracts to protect against adverse exchange rate fluctuation. Any gains (losses) generated by these contracts are disclosed separately on the statement of operations. The net U.S. dollar value of foreign currency underlying all contractual commitments held by the Funds and the resulting unrealized appreciation or depreciation is determined using foreign currency exchange rates from an independent pricing service. The Funds are subject to the credit risk that the other party will not complete the obligations of the contract. |
| |
| Federal Taxes |
| The Funds’ policy is to comply with the requirements of the Internal Revenue Code applicable to regulated investment companies and to distribute all of their taxable income to shareholders. Therefore, no income tax provision is required. Also, in order to avoid the payment of any federal excise taxes, the Funds will distribute substantially all of their net investment income and net realized gains on a calendar year basis. |
| |
| Management has analyzed the Funds’ tax positions taken in federal tax returns for all open tax years and has concluded that as of June 30, 2010, no provision for income would be required in the Funds’ financial statements. The Funds’ federal and state income and federal excise returns for the 2007, 2008, and 2009 tax years for which the applicable statutes of limitations have not expired remain subject to examination by the Internal Revenue Service and state departments of revenue. |
| |
| Net investment income and net realized gains differ for financial statement and tax purposes because of losses deferred due to “wash sale” transactions. A “wash sale” occurs when a Fund sells a security that it has acquired within a period beginning thirty days before and ending thirty days after the date of sale (a sixty one day period). The character of distributions made during the year from net investment income or net realized gains may also differ from its ultimate characterization for tax purposes. Also, due to the timing of dividend distributions, the fiscal year |
61
| | | | |
| Sit Mutual Funds | | | |
| | | | |
| Notes to Financial Statements (continued)
| | | |
| | | | |
| |
| in which amounts are distributed may differ from the year that the income or realized gains (losses) were recorded by the Funds. The tax character of distributions paid during the fiscal years ended June 30, 2010 and 2009 were as follows: |
| | | | | | | | | | |
Year Ended June 30, 2010: | | | | | | | | | | |
| | | | | | | | | | |
| Ordinary Income | Long Term
Capital Gain | | Total | |
Balanced | | $ | 293,000 | | | — | | $ | 293,000 | |
Dividend Growth (Class I) | | | 548,746 | | | — | | | 548,746 | |
Dividend Growth (Class S) | | | 330,254 | | | — | | | 330,254 | |
Global Dividend Growth (Class I) | | | 35,594 | | | — | | | 35,594 | |
Global Dividend Growth (Class S) | | | 9,406 | | | — | | | 9,406 | |
Large Cap Growth | | | 2,475,000 | | | — | | | 2,475,000 | |
Mid Cap Growth | | | — | | | — | | | — | |
International Growth | | | 228,000 | | | — | | | 228,000 | |
Small Cap Growth | | | — | | | — | | | — | |
Developing Markets Growth | | | 34,186 | | | — | | | 34,186 | |
| | | | | | | | | | |
Year Ended June 30, 2009: | | | | | | | | | | |
| | | | | | | | | | |
| Ordinary Income | Long Term
Capital Gain | | Total | |
Balanced | | $ | 351,000 | | | — | | $ | 351,000 | |
Dividend Growth (Class I) | | | 775,366 | | $ | 1,171,782 | | | 775,366 | |
Dividend Growth (Class S) | | | 205,634 | | | 242,236 | | | 205,634 | |
Global Dividend Growth (Class I) | | | 14,403 | | | — | | | 14,403 | |
Global Dividend Growth (Class S) | | | 5,597 | | | — | | | 5,597 | |
Large Cap Growth | | | 1,549,999 | | | — | | | 1,549,999 | |
Mid Cap Growth | | | — | | | 1,273,427 | | | 1,273,427 | |
International Growth | | | 350,000 | | | — | | | 350,000 | |
Small Cap Growth | | | — | | | — | | | — | |
Developing Markets Growth | | | — | | | 602,947 | | | 602,947 | |
62
As of June 30, 2010, the components of distributable earnings on a tax basis were as follows:
| | | | | | | | | | | | | | | | |
| | Undistributed
Ordinary Income | | Accumulated
Capital/Currency
Gain (Loss) | | Unrealized
Appreciation (Depreciation) | |
Balanced | | | $ | 54,913 | | | | | ($4,827,248 | ) | | | $ | 423,639 | | |
Dividend Growth | | | | 292,944 | | | | | (3,267,051 | ) | | | | (944,083 | ) | |
Global Dividend Growth | | | | 24,203 | | | | | 11,489 | | | | | 200,058 | | |
Large Cap Growth | | | | 1,230,257 | | | | | (43,815,761 | ) | | | | (3,852,568 | ) | |
Mid Cap Growth | | | | — | | | | | (13,358,991 | ) | | | | 11,731,076 | | |
International Growth | | | | 190,375 | | | | | (24,601,563 | ) | | | | 1,281,222 | | |
Small Cap Growth | | | | — | | | | | (36,873,618 | ) | | | | 7,769,117 | | |
Developing Markets Growth | | | | 10,903 | | | | | 366,086 | | | | | 3,519,748 | | |
Undistributed net investment income and accumulated net realized gains (losses) from the Statements of Assets and Liabilities have been increased (decreased) by current permanent book-to-tax differences resulting in reclassifications as follows:
| | | | | | | | | | | | | | | | |
| | Undistributed
Net Investment Income | | Accumulated
Net Realized Gains (Losses) | | Additional
Paid-in Capital | |
Global Dividend Growth | | | | ($94 | ) | | | $ | 94 | | | | | — | | |
Mid Cap Growth | | | | 590,430 | | | | | — | | | | | ($590,430 | ) | |
International Growth | | | | (1,749 | ) | | | | 8,478,698 | * | | | | (8,476,949 | )* | |
Small Cap Growth | | | | 504,900 | | | | | — | | | | | (504,900 | ) | |
Developing Markets Growth | | | | 2,267 | | | | | (2,267 | ) | | | | — | | |
*includes adjustment for the expiration of capital loss carryover.
As of June 30, 2010, for federal income tax purposes, some Funds have capital loss carryovers which, if not offset by subsequent capital gains, will begin to expire as follows:
| | | | | | | | | | | | | | | | | | | | | |
| | 2011 | | 2012 | | 2013 - 2019 | | Total | |
Balanced | | | $ | 2,910,534 | | | | $ | 1,023,296 | | | | $ | 893,418 | | | | $ | 4,827,248 | | |
Dividend Growth | | | | — | | | | | — | | | | | 3,267,051 | | | | | 3,267,051 | | |
Large Cap Growth | | | | 8,969,766 | | | | | 4,615,151 | | | | | 30,230,844 | | | | | 43,815,761 | | |
Mid Cap Growth | | | | 1,264,618 | | | | | 250,465 | | | | | 11,843,908 | | | | | 13,358,991 | | |
International Growth | | | | 14,933,645 | | | | | 5,988,227 | | | | | 3,676,389 | | | | | 24,598,261 | | |
Small Cap Growth | | | | 24,655,520 | | | | | 3,736,397 | | | | | 8,481,701 | | | | | 36,873,618 | | |
63
| | | | |
| Sit Mutual Funds | | | |
| | | | |
| Notes to Financial Statements (continued)
| | | |
| | | | |
| | | | |
| |
| Distributions |
| Distributions to shareholders are recorded as of the close of business on the record date. Such distributions are payable in cash or reinvested in additional shares of the Funds’ capital stock. Distributions from net investment income, if any, are declared and paid quarterly for the Balanced, Dividend Growth and Global Dividend Growth Funds and declared and paid annually for Developing Markets Growth, Small Cap Growth, International Growth, Mid Cap Growth, and Large Cap Growth Funds. Distributions from net realized gains, if any, will be made annually for each of the Funds. |
| |
| Concentration of Investments |
| The Developing Markets Growth Fund may concentrate investments in countries with limited or developing capital markets which may involve greater risks than investments in more developed markets and the prices of such investments may be volatile. The consequences of political, social or economic changes in these markets may have disruptive effects on the market prices of the Fund’s investments and the income it generates, as well as the Fund’s ability to repatriate such amounts. |
| |
| Use of Estimates |
| The preparation of financial statements in conformity with U.S. generally accepted accounting principles requires management to make certain estimates and assumptions that affect the reported amounts of assets and liabilities and disclosure of contingent assets and liabilities at the date of the financial statements and the reported results. Actual results could differ from those estimates. |
| |
| Guarantees and Indemnifications |
| Under each Fund’s organizational documents, its officers and directors are indemnified against certain liability arising out of the performance of their duties to each Fund. In addition, certain of each Fund’s contracts with its service providers contain general indemnification clauses. Each Fund’s maximum exposure under these arrangements is unknown since the amount of any future claims that may be made against each Fund cannot be determined and each Fund has no historical basis for predicting the likelihood of any such claims. |
64
| |
(2) | Investment Security Transactions |
| |
| The cost of purchases and proceeds from sales and maturities of investment securities, other than short-term securities, for the year ended June 30, 2010, were as follow: |
| | | | | | | |
| | Purchases ($) | | Proceeds ($) | |
Balanced | | 5,057,416 | | | 5,260,878 | | |
Dividend Growth | | 34,849,302 | | | 18,474,295 | | |
Global Dividend Growth | | 1,357,104 | | | 778,487 | | |
Large Cap Growth | | 138,428,178 | | | 64,795,089 | | |
Mid Cap Growth | | 27,856,614 | | | 46,957,868 | | |
International Growth | | 5,302,342 | | | 7,367,974 | | |
Small Cap Growth | | 13,805,996 | | | 25,331,098 | | |
Developing Markets Growth | | 2,983,101 | | | 4,468,118 | | |
| |
(3) | Expenses |
| |
| Investment Adviser |
| The Funds each have entered into an investment management agreement with Sit Investment Associates, Inc. (SIA), under which SIA manages the Funds’ assets and provides research, statistical and advisory services, and pays related office rental, executive expenses and executive salaries. The current fee for investment management and advisory services is based on the average daily net assets of the Funds at the annual rate of: |
| | | | | | | |
| | Management Fee | | Net of Adviser’s
Voluntary Fee Waiver | |
Balanced | | 1.00 | % | | 1.00 | % | |
Dividend Growth Fund Class I and Class S | | 1.00 | % | | 1.00 | % | |
Global Dividend Growth Fund Class I and Class S | | 1.25 | % | | 1.25 | % | |
Large Cap Growth | | 1.00 | % | | 1.00 | % | |
Mid Cap Growth | | 1.25 | % | | 1.15 | % | |
International Growth | | 1.85 | % | | 1.50 | % | |
Small Cap Growth | | 1.50 | % | | 1.50 | % | |
Developing Markets Growth | | 2.00 | % | | 2.00 | % | |
SIA is obligated to pay all of the Funds’ expenses (excluding extraordinary expenses, stock transfer taxes, interest, brokerage commissions, 12b-1 fees and other transaction charges relating to investing activities).
65
| | | | |
| Sit Mutual Funds | | | |
| | | | |
| Notes to Financial Statements (continued)
| | | |
| | | | |
| | | | |
| |
| In addition to the annual management fees, the Class S shares of Global Dividend Growth and Dividend Growth Funds also have a 0.25% annual distribution (12b-1) fee, which is used to pay for distribution fees related to the sale and distribution of its shares. |
| |
| For the periods through December 31, 2010, the Adviser has agreed to limit the management fee of the Mid Cap Growth Fund and International Growth Fund to 1.15% and 1.50% of the Fund’s average daily net assets, respectively. |
| |
| Transactions with affiliates |
| The investment adviser, affiliates of the investment adviser, directors and officers of the Funds as a whole owned the following shares as of June 30, 2010: |
| | | | | | | |
| | | Shares | | % Shares
Outstanding | |
Balanced | | | 204,098 | | 27.4 | | |
Dividend Growth | | | 670,610 | | 11.1 | | |
Global Dividend Growth | | | 247,780 | | 69.4 | | |
Large Cap Growth | | | 338,242 | | 2.9 | | |
Mid Cap Growth | | | 2,320,300 | | 20.6 | | |
International Growth | | | 547,127 | | 31.0 | | |
Small Cap Growth | | | 629,608 | | 32.9 | | |
Developing Markets Growth | | | 186,217 | | 25.2 | | |
| |
(4) | Capital Share Proceeds |
| |
| The International Growth and Developing Markets Growth Funds received proceeds of $201,098 and $77,735, respectively from market timing settlements paid to the Funds during the year ended June 30, 2009. As of June 30, 2010, the International Growth Fund expected to receive an additional settlement for approximately $229,242. These amounts are separately reflected on the statements of changes in net assets and in the financial highlights. |
| |
(5) | Subsequent Events |
| |
| The Funds have evaluated the need for disclosures and/or adjustments resulting from subsequent events through the date the financial statements were issued. This evaluation did not result in any subsequent events that necessitated disclosures and/or adjustments. |
66
This page has been left blank intentionally.
67
| | | | |
| Sit Balanced Fund | | | |
| | | | |
| Financial Highlights
| | | |
| | | | |
| | | | |
| | | | | | | | | | | | | | | | |
| | Years Ended June 30, | |
| | 2010 | | 2009 | | 2008 | | 2007 | | 2006 | |
Net Asset Value: | | | | | | | | | | | | | | | | |
Beginning of period | | $ | 12.96 | | $ | 16.32 | | $ | 16.93 | | $ | 15.14 | | $ | 14.53 | |
Operations: | | | | | | | | | | | | | | | | |
Net investment income (1) | | | .35 | | | .41 | | | .38 | | | .34 | | | .28 | |
Net realized and unrealized gains (losses) on investments | | | 1.24 | | | (3.32 | ) | | (.66 | ) | | 1.78 | | | .59 | |
Total from operations | | | 1.59 | | | (2.91 | ) | | (.28 | ) | | 2.12 | | | .87 | |
Distributions to Shareholders: | | | | | | | | | | | | | | | | |
From net investment income | | | (.37 | ) | | (.45 | ) | | (.33 | ) | | (.33 | ) | | (.26 | ) |
From net realized gains | | | — | | | — | | | — | | | — | | | — | |
Total distributions | | | (.37 | ) | | (.45 | ) | | (.33 | ) | | (.33 | ) | | (.26 | ) |
Net Asset Value: | | | | | | | | | | | | | | | | |
End of period | | $ | 14.18 | | $ | 12.96 | | $ | 16.32 | | $ | 16.93 | | $ | 15.14 | |
Total investment return (2) | | | 12.33 | % | | (17.84 | %) | | (1.72 | %) | | 14.24 | % | | 6.03 | % |
Net assets at end of period (000’s omitted) | | $ | 10,550 | | $ | 10,349 | | $ | 12,939 | | $ | 12,529 | | $ | 11,617 | |
| | | | | | | | | | | | | | | | |
Ratios: | | | | | | | | | | | | | | | | |
Expenses to average daily net assets (3) | | | 1.00 | % | | 1.00 | % | | 1.00 | % | | 1.00 | % | | 1.00 | % |
Net investment income to average daily net assets | | | 2.44 | % | | 3.12 | % | | 2.22 | % | | 2.13 | % | | 1.84 | % |
| | | | | | | | | | | | | | | | |
Portfolio turnover rate (excluding short-term securities) | | | 46.79 | % | | 30.26 | % | | 54.96 | % | | 41.63 | % | | 50.00 | % |
| | |
| |
(1) | The net investment income (loss) per share is based on average shares outstanding for the period. |
| |
(2) | Total investment return is based on the change in net asset value of a share during the period and assumes reinvestment of distributions at net asset value. |
| |
(3) | In addition to fees and expenses which the Fund bears directly, the Fund indirectly bears a pro rata share of the fees and expenses of the acquired funds in which it invests. Such indirect expenses are not included in the above reported expense ratios. |
68
| | | | |
| Sit Dividend Growth Fund Class I | |
| |
| | | |
| Financial Highlights | | |
| | | |
| | | | |
| | | | | | | | | | | | | | | | |
| | Years Ended June 30, | |
| | 2010 | | 2009 | | 2008 | | 2007 | | 2006 | |
Net Asset Value: | | | | | | | | | | | | | | | | |
Beginning of period | | $ | 9.60 | | $ | 13.11 | | $ | 14.42 | | $ | 12.26 | | $ | 11.18 | |
Operations: | | | | | | | | | | | | | | | | |
Net investment income (loss) (1) | | | .19 | | | .23 | | | .23 | | | .24 | | | .25 | |
Net realized and unrealized gains (losses) on investments | | | 1.03 | | | (3.09 | ) | | (.63 | ) | | 2.35 | | | 1.20 | |
Total from operations | | | 1.22 | | | (2.86 | ) | | (.40 | ) | | 2.59 | | | 1.45 | |
Distributions to Shareholders: | | | | | | | | | | | | | | | | |
From net investment income | | | (.18 | ) | | (.26 | ) | | (.22 | ) | | (.23 | ) | | (.23 | ) |
From net realized gains | | | — | | | (.39 | ) | | (.69 | ) | | (.20 | ) | | (.14 | ) |
Total distributions | | | (.18 | ) | | (.65 | ) | | (.91 | ) | | (.43 | ) | | (.37 | ) |
Net Asset Value: | | | | | | | | | | | | | | | | |
End of period | | $ | 10.64 | | $ | 9.60 | | $ | 13.11 | | $ | 14.42 | | $ | 12.26 | |
Total investment return (2) | | | 12.71 | % | | (21.59 | %) | | (3.06 | %) | | 21.48 | % | | 13.20 | % |
Net assets at end of period (000’s omitted) | | $ | 39,430 | | $ | 28,305 | | $ | 41,239 | | $ | 37,674 | | $ | 24,137 | |
| | | | | | | | | | | | | | | | |
Ratios: | | | | | | | | | | | | | | | | |
Expenses to average daily net assets (3) | | | 1.00 | % | | 1.00 | % | | 1.00 | % | | 1.00 | % | | 1.00 | % |
Net investment income (loss) to average daily net assets | | | 1.70 | % | | 2.35 | % | | 1.68 | % | | 1.81 | % | | 2.09 | % |
| | | | | | | | | | | | | | | | |
Portfolio turnover rate (excluding short-term securities) | | | 31.84 | % (4) | | 69.10 | % (4) | | 38.86 | % (4) | | 34.02 | % (4) | | 41.28 | % (4) |
| | |
| |
| | |
(1) | The net investment income (loss) per share is based on average shares outstanding for the period. |
| | |
(2) | Total investment return is based on the change in net asset value of a share during the period and assumes reinvestment of distributions at net asset value. |
| | |
(3) | In addition to fees and expenses which the Fund bears directly, the Fund indirectly bears a pro rata share of the fees and expenses of the acquired funds in which it invests. Such indirect expenses are not included in the above reported expense ratios. |
| | |
(4) | The portfolio turnover rate presented is for the entire Fund. |
See accompanying notes to financial statements on page 58.
69
| | | | |
| Sit Dividend Growth Fund Class S | | | |
| Financial Highlights
| | | |
| | | | |
| | | | |
| | | | | | | | | | | | | | | | |
| | Year
Ended
June 30,
2010 | | Year
Ended
June 30,
2009 | | Year
Ended
June 30,
2008 | | Year
Ended
June 30,
2007 | | Three months
Ended
June 30,
2006 |
Net Asset Value: | | | | | | | | | | | | | | | | |
Beginning of period | | $ | 9.58 | | $ | 13.08 | | $ | 14.39 | | $ | 12.26 | | $ | 12.28 | |
Operations: | | | | | | | | | | | | | | | | |
Net investment income (loss) (1) | | | .16 | | | .21 | | | .20 | | | .21 | | | .05 | |
Net realized and unrealized gains (losses) on investments | | | 1.02 | | | (3.09 | ) | | (.63 | ) | | 2.33 | | | (.02 | ) |
Total from operations | | | 1.18 | | | (2.88 | ) | | (.43 | ) | | 2.54 | | | .03 | |
Distributions to Shareholders: | | | | | | | | | | | | | | | | |
From net investment income | | | (.15 | ) | | (.23 | ) | | (.19 | ) | | (.21 | ) | | (.05 | ) |
From net realized gains | | | — | | | (.39 | ) | | (.69 | ) | | (.20 | ) | | — | |
Total distributions | | | (.15 | ) | | (.62 | ) | | (.88 | ) | | (.41 | ) | | (.05 | ) |
Net Asset Value: | | | | | | | | | | | | | | | | |
End of period | | $ | 10.61 | | $ | 9.58 | | $ | 13.08 | | $ | 14.39 | | $ | 12.26 | |
Total investment return (2) | | | 12.37 | % | | (21.79 | %) | | (3.27 | %) | | 21.02 | % | | 0.27 | % |
Net assets at end of period (000’s omitted) | | $ | 24,894 | | $ | 15,730 | | $ | 14,300 | | $ | 2,823 | | $ | 48 | |
| | | | | | | | | | | | | | | | |
Ratios: | | | | | | | | | | | | | | | | |
Expenses to average daily net assets (3) | | | 1.25 | % | | 1.25 | % | | 1.25 | % | | 1.25 | % | | 1.25 | % (5) |
Net investment income (loss) to average daily net assets | | | 1.45 | % | | 2.10 | % | | 1.43 | % | | 1.56 | % | | 1.84 | % (5) |
| | | | | | | | | | | | | | | | |
Portfolio turnover rate (excluding short-term securities) | | | 31.84 | % (4) | | 69.10 | % (4) | | 38.86 | % (4) | | 34.02 | % (4) | | 41.28 | % (4) |
| | |
| |
| | |
(1) | The net investment income (loss) per share is based on average shares outstanding for the period. |
| | |
(2) | Total investment return is based on the change in net asset value of a share during the period and assumes reinvestment of distributions at net asset value. |
| | |
(3) | In addition to fees and expenses which the Fund bears directly, the Fund indirectly bears a pro rata share of the fees and expenses of the acquired funds in which it invests. Such indirect expenses are not included in the above reported expense ratios. |
| | |
(4) | The portfolio turnover rate presented is for the entire Fund. |
| | |
(5) | Percentages are adjusted to an annual rate. |
70
| | | | |
| Sit Global Dividend Growth Fund Class I | |
| |
| | | |
| Financial Highlights | | |
| | | |
| | | | |
| | | | | | | |
| | Year
Ended
June 30,
2010 | | Nine months
Ended
June 30,
2009 |
Net Asset Value: | | | | | | | |
Beginning of period | | $ | 9.70 | | $ | 10.00 | |
Operations: | | | | | | | |
Net investment income (loss) (1) | | | .17 | | | .15 | |
Net realized and unrealized gains (losses) on investments | | | .68 | | | (.36 | ) |
Total from operations | | | .85 | | | (.21 | ) |
Distributions to Shareholders: | | | | | | | |
From net investment income | | | (.14 | ) | | (.09 | ) |
From net realized gains | | | — | | | — | |
Total distributions | | | (.14 | ) | | (.09 | ) |
Net Asset Value: | | | | | | | |
End of period | | $ | 10.41 | | $ | 9.70 | |
Total investment return (2) | | | 8.79 | % | | (2.06 | %) |
Net assets at end of period (000’s omitted) | | $ | 2,832 | | $ | 2,290 | |
| | | | | | | |
Ratios: | | | | | | | |
Expenses to average daily net assets (3) | | | 1.25 | % | | 1.25 | % (5) |
Net investment income (loss) to average daily net assets | | | 1.48 | % | | 2.30 | % (5) |
| | | | | | | | | | | | | | | | |
Portfolio turnover rate (excluding short-term securities) | | | 21.60 | % (4) | | 17.69 | % (4) |
| | |
| |
| | |
(1) | The net investment income (loss) per share is based on average shares outstanding for the period. |
| | |
(2) | Total investment return is based on the change in net asset value of a share during the period and assumes reinvestment of distributions at net asset value. |
| | |
(3) | In addition to fees and expenses which the Fund bears directly, the Fund indirectly bears a pro rata share of the fees and expenses of the acquired funds in which it invests. Such indirect expenses are not included in the above reported expense ratios. |
| | |
(4) | The portfolio turnover rate presented is for the entire Fund. |
| | |
(5) | Percentages are adjusted to an annual rate. |
71
| | | | |
| Sit Global Dividend Growth Fund Class S | | | |
| Financial Highlights
| | | |
| | | | |
| | | | |
| | | | | | | |
| | Year
Ended
June 30,
2010 | | Nine months
Ended
June 30,
2009 |
Net Asset Value: | | | | | | | |
Beginning of period | | $ | 9.70 | | $ | 10.00 | |
Operations: | | | | | | | |
Net investment income (loss) (1) | | | .14 | | | .13 | |
Net realized and unrealized gains (losses) on investments | | | .68 | | | (.36 | ) |
Total from operations | | | .82 | | | (.23 | ) |
Distributions to Shareholders: | | | | | | | |
From net investment income | | | (.12 | ) | | (.07 | ) |
From net realized gains | | | — | | | — | |
Total distributions | | | (.12 | ) | | (.07 | ) |
Net Asset Value: | | | | | | | |
End of period | | $ | 10.40 | | $ | 9.70 | |
Total investment return (2) | | | 8.47 | % | | (2.18 | %) |
Net assets at end of period (000’s omitted) | | $ | 882 | | $ | 740 | |
| | | | | | | |
Ratios: | | | | | | | |
Expenses to average daily net assets (3) | | | 1.50 | % | | 1.50 | % (5) |
Net investment income (loss) to average daily net assets | | | 1.23 | % | | 2.05 | % (5) |
| | | | | | | |
Portfolio turnover rate (excluding short-term securities) | | | 21.60 | % (4) | | 17.69 | % (4) |
| | |
| |
| | |
(1) | The net investment income (loss) per share is based on average shares outstanding for the period. |
| |
(2) | Total investment return is based on the change in net asset value of a share during the period and assumes reinvestment of distributions at net asset value. |
| |
(3) | In addition to fees and expenses which the Fund bears directly, the Fund indirectly bears a pro rata share of the fees and expenses of the acquired funds in which it invests. Such indirect expenses are not included in the above reported expense ratios. |
| |
(4) | The portfolio turnover rate presented is for the entire Fund. |
| |
(5) | Percentages are adjusted to an annual rate. |
72
| | | | |
| Sit Large Cap Growth Fund | |
| |
| | | |
| Financial Highlights | | |
| | | |
| | | | |
| | | | | | | | | | | | | | | | |
| | Years Ended June 30, | |
| | 2010 | | 2009 | | 2008 | | 2007 | | 2006 | |
Net Asset Value: | | | | | | | | | | | | | | | | |
Beginning of period | | $ | 32.42 | | $ | 43.41 | | $ | 43.99 | | $ | 37.60 | | $ | 34.27 | |
Operations: | | | | | | | | | | | | | | | | |
Net investment income (loss) (1) | | | .22 | | | .28 | | | .20 | | | .24 | | | .17 | |
Net realized and unrealized gains (losses) on investments | | | 2.33 | | | (11.05 | ) | | (.65 | ) | | 6.43 | | | 3.23 | |
Total from operations | | | 2.55 | | | (10.77 | ) | | (.45 | ) | | 6.67 | | | 3.40 | |
Distributions to Shareholders: | | | | | | | | | | | | | | | | |
From net investment income | | | (.22 | ) | | (.22 | ) | | (.13 | ) | | (.28 | ) | | (.07 | ) |
From net realized gains | | | — | | | — | | | — | | | — | | | — | |
Total distributions | | | (.22 | ) | | (.22 | ) | | (.13 | ) | | (.28 | ) | | (.07 | ) |
Net Asset Value: | | | | | | | | | | | | | | | | |
End of period | | $ | 34.75 | | $ | 32.42 | | $ | 43.41 | | $ | 43.99 | | $ | 37.60 | |
Total investment return (2) | | | 7.80 | % | | (24.77 | %) | | (1.03 | %) | | 17.79 | % | | 9.91 | % |
Net assets at end of period (000’s omitted) | | $ | 407,359 | | $ | 324,071 | | $ | 287,695 | | $ | 125,741 | | $ | 101,873 | |
| | | | | | | | | | | | | | | | |
Ratios: | | | | | | | | | | | | | | | | |
Expenses to average daily net assets (3) | | | 1.00 | % | | 1.00 | % | | 1.00 | % | | 1.00 | % | | 1.00 | % |
Net investment income (loss) to average daily net assets | | | 0.58 | % | | 0.85 | % | | 0.46 | % | | 0.59 | % | | 0.46 | % |
| | | | | | | | | | | | | | | | |
Portfolio turnover rate (excluding short-term securities) | | | 15.93 | % | | 27.98 | % | | 21.97 | % | | 27.80 | % | | 23.71 | % |
| | |
| |
| |
(1) | The net investment income (loss) per share is based on average shares outstanding for the period. |
| |
(2) | Total investment return is based on the change in net asset value of a share during the period and assumes reinvestment of distributions at net asset value. |
| |
(3) | In addition to fees and expenses which the Fund bears directly, the Fund indirectly bears a pro rata share of the fees and expenses of the acquired funds in which it invests. Such indirect expenses are not included in the above reported expense ratios. |
See accompanying notes to financial statements on page 58.
73
| | | | |
| Sit Mid Cap Growth Fund | | | |
| | | | |
| Financial Highlights
| | | |
| | | | |
| | | | |
| | | | | | | | | | | | | | | | |
| | Years Ended June 30, | |
| | 2010 | | 2009 | | 2008 | | 2007 | | 2006 | |
Net Asset Value: | | | | | | | | | | | | | | | | |
Beginning of period | | $ | 9.90 | | $ | 14.83 | | $ | 15.71 | | $ | 13.01 | | $ | 11.28 | |
Operations: | | | | | | | | | | | | | | | | |
Net investment income (loss) (1) | | | (.05 | ) | | (.03 | ) | | (.07 | ) | | (.04 | ) | | — | |
Net realized and unrealized gains (losses) on investments | | | 1.72 | | | (4.81 | ) | | (.31 | ) | | 2.74 | | | 1.73 | |
Total from operations | | | 1.67 | | | (4.84 | ) | | (.38 | ) | | 2.70 | | | 1.73 | |
Distributions to Shareholders: | | | | | | | | | | | | | | | | |
From net investment income | | | — | | | — | | | — | | | — | | | — | |
From net realized gains | | | — | | | (.09 | ) | | (.50 | ) | | — | | | — | |
Total distributions | | | — | | | (.09 | ) | | (.50 | ) | | — | | | — | |
Net Asset Value: | | | | | | | | | | | | | | | | |
End of period | | $ | 11.57 | | $ | 9.90 | | $ | 14.83 | | $ | 15.71 | | $ | 13.01 | |
Total investment return (2) | | | 16.87 | % | | (32.51 | %) | | (2.63 | %) | | 20.75 | % | | 15.34 | % |
Net assets at end of period (000’s omitted) | | $ | 130,258 | | $ | 127,477 | | $ | 210,880 | | $ | 205,256 | | $ | 191,541 | |
| | | | | | | | | | | | | | | | |
Ratios (3): | | | | | | | | | | | | | | | | |
Expenses (without waiver) (4) | | | 1.25 | % | | 1.25 | % | | 1.25 | % | | 1.25 | % | | 1.25 | % |
Expenses (with waiver) (4) | | | 1.15 | % | | 1.15 | % | | 1.15 | % | | 1.15 | % | | 1.15 | % |
Net investment income (loss) (without waiver) | | | (0.52 | %) | | (0.40 | %) | | (0.52 | %) | | (0.41 | %) | | (0.13 | %) |
Net investment income (loss) (with waiver) | | | (0.42 | %) | | (0.30 | %) | | (0.42 | %) | | (0.31 | %) | | (0.03 | %) |
| | | | | | | | | | | | | | | | |
Portfolio turnover rate (excluding short-term securities) | | | 20.39 | % | | 18.07 | % | | 34.61 | % | | 40.08 | % | | 32.48 | % |
| | |
| |
(1) | The net investment income (loss) per share is based on average shares outstanding for the period. |
| |
(2) | Total investment return is based on the change in net asset value of a share during the period and assumes reinvestment of distributions at net asset value. |
| |
(3) | The ratio information is calculated based on average daily net assets.
Total Fund expenses are limited to 1.25% of average daily net assets.
However, during the periods above, the investment adviser voluntarily absorbed expenses that were otherwise payable by the Fund. |
| |
(4) | In addition to fees and expenses which the Fund bears directly, the Fund indirectly bears a pro rata share of the fees and expenses of the acquired funds in which it invests. Such indirect expenses are not included in the above reported expense ratios. |
74
| | | | |
| Sit International Growth Fund | |
| |
| | | |
| Financial Highlights | | |
| | | |
| | | | |
| | | | | | | | | | | | | | | | |
| | Years Ended June 30, | |
| | 2010 | | 2009 | | 2008 | | 2007 | | 2006 | |
Net Asset Value: | | | | | | | | | | | | | | | | |
Beginning of period | | $ | 10.90 | | $ | 17.80 | | $ | 18.70 | | $ | 15.48 | | $ | 12.31 | |
Operations: | | | | | | | | | | | | | | | | |
Net investment income (loss) (1) | | | .11 | | | .13 | | | .15 | | | .20 | | | .14 | |
Net realized and unrealized gains (losses) on investments | | | .65 | | | (6.95 | ) | | (.85 | ) | | 3.17 | | | 3.10 | |
Total from operations | | | .76 | | | (6.82 | ) | | (.70 | ) | | 3.37 | | | 3.24 | |
Capital share proceeds (5) | | | .13 | | | .10 | | | — | | | — | | | — | |
Distributions to Shareholders: | | | | | | | | | | | | | | | | |
From net investment income | | | (.12 | ) | | (.18 | ) | | (.20 | ) | | (.15 | ) | | (.07 | ) |
From net realized gains | | | — | | | — | | | — | | | — | | | — | |
Total distributions | | | (.12 | ) | | (.18 | ) | | (.20 | ) | | (.15 | ) | | (.07 | ) |
Net Asset Value: | | | | | | | | | | | | | | | | |
End of period | | $ | 11.67 | | $ | 10.90 | | $ | 17.80 | | $ | 18.70 | | $ | 15.48 | |
Total investment return (2) | | | 8.10 | % | | (37.71 | %) | | (3.82 | %) | | 21.87 | % | | 26.37 | % |
Net assets at end of period (000’s omitted) | | $ | 20,586 | | $ | 21,009 | | $ | 37,714 | | $ | 39,511 | | $ | 34,700 | |
| | | | | | | | | | | | | | | | |
Ratios (3): | | | | | | | | | | | | | | | | |
Expenses (without waiver) (4) | | | 1.85 | % | | 1.85 | % | | 1.85 | % | | 1.85 | % | | 1.85 | % |
Expenses (with waiver) (4) | | | 1.50 | % | | 1.50 | % | | 1.50 | % | | 1.50 | % | | 1.50 | % |
Net investment income (loss) (without waiver) | | | 0.50 | % | | 0.74 | % | | 0.43 | % | | 0.84 | % | | 0.60 | % |
Net investment income (loss) (with waiver) | | | 0.85 | % | | 1.09 | % | | 0.78 | % | | 1.19 | % | | 0.95 | % |
| | | | | | | | | | | | | | | | |
Portfolio turnover rate (excluding short-term securities) | | | 25.09 | % | | 33.12 | % | | 16.83 | % | | 17.25 | % | | 20.21 | % |
| | |
| |
(1) | The net investment income (loss) per share is based on average shares outstanding for the period. |
| |
(2) | Total investment return is based on the change in net asset value of a share during the period and assumes reinvestment of distributions at net asset value. |
| |
(3) | The ratio information is calculated based on average daily net assets.
Total Fund expenses are limited to 1.85% of average daily net assets.
However, during the periods above, the investment adviser voluntarily absorbed expenses that were otherwise payable by the Fund. |
| |
(4) | In addition to fees and expenses which the Fund bears directly, the Fund indirectly bears a pro rata share of the fees and expenses of the acquired funds in which it invests. Such indirect expenses are not included in the above reported expense ratios. |
| |
(5) | The Fund accounted for proceeds during the year from market timing settlements as described in footnote 4 to the financial statements. |
See accompanying notes to financial statements on page 58.
75
| | | | |
| Sit Small Cap Growth Fund | | | |
| Financial Highlights
| | | |
| | | | |
| | | | |
| | | | | | | | | | | | | | | | |
| | Years Ended June 30, | |
| | 2010 | | 2009 | | 2008 | | 2007 | | 2006 | |
Net Asset Value: | | | | | | | | | | | | | | | | |
Beginning of period | | $ | 25.89 | | $ | 37.44 | | $ | 40.14 | | $ | 33.46 | | $ | 27.74 | |
Operations: | | | | | | | | | | | | | | | | |
Net investment income (loss) (1) | | | (.24 | ) | | (.16 | ) | | (.37 | ) | | (.27 | ) | | (.23 | ) |
Net realized and unrealized gains (losses) on investments | | | 5.67 | | | (11.39 | ) | | (2.33 | ) | | 6.95 | | | 5.95 | |
Total from operations | | | 5.43 | | | (11.55 | ) | | (2.70 | ) | | 6.68 | | | 5.72 | |
Distributions to Shareholders: | | | | | | | | | | | | | | | | |
From net investment income | | | — | | | — | | | — | | | — | | | — | |
From net realized gains | | | — | | | — | | | — | | | — | | | — | |
Total distributions | | | — | | | — | | | — | | | — | | | — | |
Net Asset Value: | | | | | | | | | | | | | | | | |
End of period | | $ | 31.32 | | $ | 25.89 | | $ | 37.44 | | $ | 40.14 | | $ | 33.46 | |
Total investment return (2) | | | 20.97 | % | | (30.85 | %) | | (6.73 | %) | | 19.96 | % | | 20.62 | % |
Net assets at end of period (000’s omitted) | | $ | 59,848 | | $ | 58,352 | | $ | 93,527 | | $ | 105,800 | | $ | 106,977 | |
| | | | | | | | | | | | | | | | |
Ratios: | | | | | | | | | | | | | | | | |
Expenses to average daily net assets (3) | | | 1.50 | % | | 1.50 | % | | 1.50 | % | | 1.50 | % | | 1.50 | % |
Net investment income (loss) to average daily net assets | | | (0.80 | %) | | (0.61 | %) | | (0.93 | %) | | (0.79 | %) | | (0.67 | %) |
|
Portfolio turnover rate (excluding short-term securities) | | | 22.41 | % | | 26.19 | % | | 37.20 | % | | 38.79 | % | | 54.73 | % |
| | |
| |
| | |
(1) | The net investment income (loss) per share is based on average shares outstanding for the period. |
| | |
(2) | Total investment return is based on the change in net asset value of a share during the period and assumes reinvestment of distributions at net asset value. |
| | |
(3) | In addition to fees and expenses which the Fund bears directly, the Fund indirectly bears a pro rata share of the fees and expenses of the acquired funds in which it invests. Such indirect expenses are not included in the above reported expense ratios. |
76
| | | | |
| Sit Developing Markets Growth Fund | |
| |
| | | |
| Financial Highlights | | |
| | | |
| | | | |
| | | | | | | | | | | | | | | | |
| | Years Ended June 30, | |
| | 2010 | | 2009 | | 2008 | | 2007 | | 2006 | |
Net Asset Value: | | | | | | | | | | | | | | | | |
Beginning of period | | $ | 16.13 | | $ | 25.97 | | $ | 24.94 | | $ | 17.38 | | $ | 12.97 | |
Operations: | | | | | | | | | | | | | | | | |
Net investment income (loss) (1) | | | .01 | | | .04 | | | (.07 | ) | | .05 | | | .04 | |
Net realized and unrealized gains (losses) on investments | | | 2.90 | | | (9.15 | ) | | 1.41 | | | 7.56 | | | 4.43 | |
Total from operations | | | 2.91 | | | (9.11 | ) | | 1.34 | | | 7.61 | | | 4.47 | |
Capital share proceeds (4) | | | — | | | .09 | | | — | | | — | | | — | |
Distributions to Shareholders: | | | | | | | | | | | | | | | | |
From net investment income | | | (.04 | ) | | — | | | (.04 | ) | | (.05 | ) | | (.06 | ) |
From net realized gains | | | — | | | (.82 | ) | | (.27 | ) | | — | | | — | |
Total distributions | | | (.04 | ) | | (.82 | ) | | (.31 | ) | | (.05 | ) | | (.06 | ) |
Net Asset Value: | | | | | | | | | | | | | | | | |
End of period | | $ | 19.00 | | $ | 16.13 | | $ | 25.97 | | $ | 24.94 | | $ | 17.38 | |
Total investment return (2) | | | 18.05 | % | | (33.73 | %) | | 5.26 | % | | 43.82 | % | | 34.47 | % |
Net assets at end of period (000’s omitted) | | $ | 14,043 | | $ | 13,203 | | $ | 23,195 | | $ | 18,430 | | $ | 13,057 | |
| | | | | | | | | | | | | | | | |
Ratios: | | | | | | | | | | | | | | | | |
Expenses to average daily net assets (3) | | | 2.00 | % | | 2.00 | % | | 2.00 | % | | 2.00 | % | | 2.00 | % |
Net investment income (loss) to average daily net assets | | | 0.06 | % | | 0.24 | % | | (0.27 | %) | | 0.25 | % | | 0.24 | % |
|
Portfolio turnover rate (excluding short-term securities) | | | 19.90 | % | | 13.56 | % | | 9.40 | % | | 16.25 | % | | 27.38 | % |
| | |
| |
| | |
(1) | The net investment income (loss) per share is based on average shares outstanding for the period. |
| | |
(2) | Total investment return is based on the change in net asset value of a share during the period and assumes reinvestment of distributions at net asset value. |
| | |
(3) | In addition to fees and expenses which the Fund bears directly, the Fund indirectly bears a pro rata share of the fees and expenses of the acquired funds in which it invests. Such indirect expenses are not included in the above reported expense ratios. |
| | |
(4) | The Fund received proceeds during the year ended June 30, 2009 from market timing settlements. |
See accompanying notes to financial statements on page 58.
77
| | | | |
| | | | |
| Report of Independent Registered Public Accounting Firm | | |
| | | | |
| | | | |
|
The Board of Directors and Shareholders: |
Sit Mutual Funds, Inc.
Sit Large Cap Growth Fund, Inc.
Sit Mid Cap Growth Fund, Inc. |
We have audited the accompanying statements of assets and liabilities, including the portfolios of investments, of Sit Balanced Fund, Sit Dividend Growth Fund, Sit Global Dividend Growth Fund, Sit International Growth Fund, Sit Small Cap Growth Fund, Sit Developing Markets Growth Fund (each a series of Sit Mutual Funds, Inc.), Sit Large Cap Growth Fund, Inc., and Sit Mid Cap Growth Fund, Inc., as of June 30, 2010, and the related statements of operations for the year then ended, the statements of changes in net assets for each of the years or periods in the two-year period then ended, and the financial highlights for each of the years or periods in the five-year period then ended. These financial statements and the financial highlights are the responsibility of fund management. Our responsibility is to express an opinion on these financial statements and the financial highlights based on our audits.
We conducted our audits in accordance with auditing standards of the Public Company Accounting Oversight Board (United States). Those standards require that we plan and perform the audit to obtain reasonable assurance about whether the financial statements and financial highlights are free of material misstatement. An audit includes examining, on a test basis, evidence supporting the amounts and disclosures in the financial statements. Our procedures included confirmation of securities owned as of June 30, 2010, by correspondence with the custodian and brokers or by other appropriate auditing procedures when replies from brokers were not received. An audit also includes assessing the accounting principles used and significant estimates made by management, as well as evaluating the overall financial statement presentation. We believe that our audits provide a reasonable basis for our opinion.
In our opinion, the financial statements and financial highlights referred to above present fairly, in all material respects, the financial position of Sit Balanced Fund, Sit Dividend Growth Fund, Sit Global Dividend Growth Fund, Sit International Growth Fund, Sit Small Cap Growth Fund, Sit Developing Markets Growth Fund, Sit Large Cap Growth Fund, and Sit Mid Cap Growth Fund, as of June 30, 2010 and the results of their operations for the year then ended, the changes in their net assets for each of the years or periods in the two-year period then ended, and the financial highlights for each of the years or periods in the five-year period then ended, in conformity with U.S. generally accepted accounting principles.
KPMG LLP
Minneapolis, Minnesota
August 23, 2010
78
This page has been left blank intentionally.
79
| | | | |
| | | | |
| Expense Example (Unaudited) | | | |
| | | | |
|
| | | |
| | | | |
As a shareholder of the Funds, you incur two types of costs: (1) transaction costs, including redemption fees and (2) ongoing costs, including management fees; and other Fund expenses. This Example is intended to help you understand your ongoing costs (in dollars) of investing in the Funds and to compare these costs with the ongoing costs of investing in other mutual funds.
The Example is based on an investment of $1,000 invested at the beginning of the period and held for the entire period January 1, 2010 to June 30, 2010.
Actual Expenses
The first line of the table below provides information about actual account values and actual expenses. You may use the information in this line, together with the amount you invested, to estimate the expenses that you paid over the period. Simply divide your account value by $1,000 (for example, an $8,600 account value divided by $1,000 = 8.6), then multiply the result by the number in the first line under the heading entitled “Expenses Paid During Period” to estimate the expenses you paid on your account during this period.
Hypothetical Example for Comparison Purposes
The second line of the table below provides information about hypothetical account values and hypothetical expenses based on the Fund’s actual expense ratio and an assumed rate of return of 5% per year before expenses, which is not the Fund’s actual return. The hypothetical account values and expenses may not be used to estimate the actual ending account balance or expenses you paid for the period. You may use this information to compare the ongoing costs of investing in the Fund and other funds. To do so, compare this 5% hypothetical example with the 5% hypothetical examples that appear in the shareholder reports of the other funds.
Please note that the expenses shown in the table are meant to highlight your ongoing costs only and do not reflect any transactional costs, such as redemption fees. Therefore, the second line of the table is useful in comparing ongoing costs only, and will not help you determine the relative total costs of owning different funds. In addition, if these transactional costs (redemption fees) were included, your costs would have been higher.
| | | |
Balanced Fund | Beginning
Account Value
(1/1/10) | Ending
Account Value
(6/30/10) | Expenses Paid
During Period*
(1/1/10 - 6/30/10) |
Actual | $1,000.00 | $ 967.80 | $4.85 |
Hypothetical (5% return before expenses) | $1,000.00 | $1,020.00 | $4.98 |
*Expenses are equal to the Fund’s annualized expense ratio of 1.00%, multiplied by the average account value over the period, multiplied by 180/365 (to reflect the one-half year period.)
| | | |
Dividend Growth Fund Class I | Beginning
Account Value
(1/1/10) | Ending
Account Value
(6/30/10) | Expenses Paid
During Period*
(1/1/10 - 6/30/10) |
Actual | $1,000.00 | $ 938.10 | $4.78 |
Hypothetical (5% return before expenses) | $1,000.00 | $1,020.00 | $4.98 |
*Expenses are equal to the Fund’s annualized expense ratio of 1.00%, multiplied by the average account value over the period, multiplied by 180/365 (to reflect the one-half year period.)
80
| | | |
Dividend Growth Fund Class S | Beginning
Account Value
(1/1/10) | Ending
Account Value
(6/30/10) | Expenses Paid
During Period*
(1/1/10 - 6/30/10) |
Actual | $1,000.00 | $ 936.50 | $5.97 |
Hypothetical (5% return before expenses) | $1,000.00 | $1,018.75 | $6.22 |
*Expenses are equal to the Fund’s annualized expense ratio of 1.25%, multiplied by the average account value over the period, multiplied by 180/365 (to reflect the one-half year period.)
| | | |
Global Dividend Growth Fund Class I | Beginning
Account Value
(1/1/10) | Ending
Account Value
(6/30/10) | Expenses Paid
During Period*
(1/1/10 - 6/30/10) |
Actual | $1,000.00 | $ 902.10 | $5.86 |
Hypothetical (5% return before expenses) | $1,000.00 | $1,018.75 | $6.22 |
*Expenses are equal to the Fund’s annualized expense ratio of 1.25%, multiplied by the average account value over the period, multiplied by 180/365 (to reflect the one-half year period.)
| | | |
Global Dividend Growth Fund Class S | Beginning
Account Value
(1/1/10) | Ending
Account Value
(6/30/10) | Expenses Paid
During Period*
(1/1/10 - 6/30/10) |
Actual | $1,000.00 | $ 900.70 | $7.03 |
Hypothetical (5% return before expenses) | $1,000.00 | $1,017.50 | $7.46 |
*Expenses are equal to the Fund’s annualized expense ratio of 1.50%, multiplied by the average account value over the period, multiplied by 180/365 (to reflect the one-half year period.)
| | | |
Large Cap Growth Fund | Beginning
Account Value
(1/1/10) | Ending
Account Value
(6/30/10) | Expenses Paid
During Period*
(1/1/10 - 6/30/10) |
Actual | $1,000.00 | $ 906.40 | $4.70 |
Hypothetical (5% return before expenses) | $1,000.00 | $1,020.00 | $4.98 |
*Expenses are equal to the Fund’s annualized expense ratio of 1.00%, multiplied by the average account value over the period, multiplied by 180/365 (to reflect the one-half year period.)
| | | |
Mid Cap Growth Fund | Beginning
Account Value
(1/1/10) | Ending
Account Value
(6/30/10) | Expenses Paid
During Period*
(1/1/10 - 6/30/10) |
Actual | $1,000.00 | $ 979.70 | $5.61 |
Hypothetical (5% return before expenses) | $1,000.00 | $1,019.25 | $5.73 |
*Expenses are equal to the Fund’s annualized expense ratio of 1.15%, multiplied by the average account value over the period, multiplied by 180/365 (to reflect the one-half year period.)
81
| | | | |
| | | | |
| Expense Example (Continued) | | | |
| | | | |
|
| | | |
| | | | |
| | | |
International Growth Fund | Beginning
Account Value
(1/1/10) | Ending
Account Value
(6/30/10) | Expenses Paid
During Period*
(1/1/10 - 6/30/10) |
Actual | $1,000.00 | $ 880.80 | $6.96 |
Hypothetical (5% return before expenses) | $1,000.00 | $1,017.50 | $7.46 |
*Expenses are equal to the Fund’s annualized expense ratio of 1.50%, multiplied by the average account value over the period, multiplied by 180/365 (to reflect the one-half year period.)
| | | |
Small Cap Growth Fund | Beginning
Account Value
(1/1/10) | Ending
Account Value
(6/30/10) | Expenses Paid
During Period*
(1/1/10 - 6/30/10) |
Actual | $1,000.00 | $1,101.60 | $7.40 |
Hypothetical (5% return before expenses) | $1,000.00 | $1,017.50 | $7.46 |
*Expenses are equal to the Fund’s annualized expense ratio of 1.50%, multiplied by the average account value over the period, multiplied by 180/365 (to reflect the one-half year period.)
| | | |
Developing Markets Growth Fund | Beginning
Account Value
(1/1/10) | Ending
Account Value
(6/30/10) | Expenses Paid
During Period*
(1/1/10 - 6/30/10) |
Actual | $1,000.00 | $ 892.00 | $9.33 |
Hypothetical (5% return before expenses) | $1,000.00 | $1,015.00 | $9.94 |
*Expenses are equal to the Fund’s annualized expense ratio of 2.00%, multiplied by the average account value over the period, multiplied by 180/365 (to reflect the one-half year period.)
82
| | | | |
| Information about Directors and Officers (Unaudited) | |
| |
| | |
| | | |
| | | |
| | | | |
The Sit Mutual Funds are a family of 12 no-load mutual funds. The eight Stock Funds described in this Stock Funds Annual Report are the Sit Mid Cap Growth Fund, Sit Large Cap Growth Fund, Sit International Growth Fund, Sit Balanced Fund, Sit Developing Markets Growth Fund, Sit Small Cap Growth Fund, Sit Dividend Growth Fund and the Sit Global Dividend Growth Fund (the “Funds” or individually, a “Fund”). The four bond funds within the Sit Mutual Fund family are described in separate Annual Reports. The Sit Mid Cap Growth Fund and Sit Large Cap Growth Fund, and the corporate issuer of the Sit International Growth Fund, Sit Balanced Fund, Sit Developing Markets Growth Fund, Sit Small Cap Growth Fund, Sit Dividend Growth Fund, and Sit Global Dividend Growth Fund have a Board of Directors and officers. Pursuant to Minnesota law, the Boards of Directors are responsible for the management of the Funds and the establishment of the Funds’ policies. The officers of the Funds manage the day-to-day operation of the Funds. Information pertaining to the directors and officers of the Funds is set forth below. The business address, unless otherwise noted below, is that of the Funds’ investment adviser – 3300 IDS Center, 80 South Eighth Street, Minneapolis, Minnesota 55402. The Boards have a separate Audit Committee. The Stock Funds’ SAI has additional information about the fund’s directors and is available without charge upon request by calling the Sit Funds at 800-332-5580.
| | | | | |
Name,
Address and
Age | Position Held
with the Funds | Term of Office(1) and
length of Time Served | Principal Occupations
During Past Five Years | Number of
Funds in Fund
Complex
Overseen by
Director | Other Directorships
Held by Director(3) |
Interested Director: | | | | |
Roger J. Sit (2)
Age: 48 | Chairman and President | Chairman since 10/08; Officer since 1998. | Chairman, President, CEO and Global CIO of Sit Investment Associates, Inc. (the “Adviser”); Chairman and CEO of Sit Investment Fixed Income Advisors, Inc. (“SF”); Chairman of SIA Securities Corp. (the “Distributor”). | 12 | None. |
William E. Frenzel (2)
Age: 81 | Director | Director since 1991 or the Fund’s inception if later. | Guest Scholar at The Brookings Institution and member of several government policy committees, foundations and organizations; Director of the Adviser; Director of SF. | 12 | None. |
Independent Directors: | | | | |
Melvin C. Bahle
Age: 91 | Director | Director since 2005 or the Fund’s inception if later; Director Emeritus 1995 to 2005, and Director from 1984 to 1995. | Director and/or officer of several foundations and charitable organizations. | 12 | None. |
John P. Fagan
Age: 80 | Director | Director since 2006 or the Fund’s inception, if later. | Honorary member on Board of St. Joseph’s College in Rensselar, Indiana. | 12 | None. |
Sidney L. Jones
Age: 76 | Director | Director from 1988 to 1989 and since 1993 or the Fund’s inception if later. | Lecturer, Washington Campus Consortium of 17 Universities. | 12 | None. |
83
| | | | |
| | | | |
| Information about Directors and Officers (Continued) | | | |
| | | | |
|
| | | |
| | | | |
| | | | | |
Name,
Address and
Age | Position Held
with the Funds | Term of Office(1) and
length of Time Served | Principal Occupations
During Past Five Years | Number of
Funds in Fund
Complex
Overseen by
Director | Other Directorships
Held by Director(3) |
Independent Directors (continued) | | | | |
Bruce C. Lueck
Age: 69 | Director | Director since 2004 or the Fund’s inception, if later. | Consultant for Zephyr Management, L.P. (investment management) and committee member of several investment funds and foundations. | 12 | None. |
Donald W. Phillips
Age: 62 | Director | Director of the International Fund since 1993, and since 1990 or the Fund’s inception if later for all other Funds. | Chairman and CEO of WP Global Partners Inc., 7/05 to present; CEO and CIO of WestLB Asset Management (USA) LLC, 4/00 to 4/05. | 12 | None. |
Barry N. Winslow
Age: 62 | Director | Director since 2010. | Vice-Chairman of TCF Financial Corporation July 2008 to present, COO 2006 to 2007; President of the national charter, 2001 to 2006. | 12 | TCF Financial Corporation. |
Officers: | | | | | |
Kent L. Johnson
Age: 44 | Vice President –Investments | Re-Elected by the Boards annually; Officer since 2003 | Vice President – Research and Investment Management of the Adviser. | N/A | N/A |
Ronald D. Sit
Age: 50 | Vice President – Investments | Re-Elected by the Boards annually; Officer since 1985 | Vice President – Research and Investment Management of the Adviser. | N/A | N/A |
Robert W. Sit
Age: 41 | Vice President - Investments | Re-Elected by the Boards annually; Officer since 1997 | Vice President – Research and Investment Management of the Adviser. | N/A | N/A |
Bryce A. Doty
Age: 43 | Vice President – Investments | Re-Elected by the Boards annually; Officer since 1996. | Vice President and Portfolio Manager
of SF. | N/A | N/A |
Paul E. Rasmussen
Age: 49 | Vice President & Treasurer | Re-Elected by the Boards annually; Officer since 1994. | Vice President, Secretary, Controller and Chief Compliance Officer of the Adviser; Vice President, Secretary, and Chief Compliance Officer of Sit/Kim and SF; President & Treasurer of the Distributor. | N/A | N/A |
Michael J. Radmer
50 S. 6th Street
Minneapolis, MN
55401
Age: 65 | Secretary | Re-Elected by the Boards annually; Officer since 1984. | Partner of the Funds’ general counsel, Dorsey & Whitney, LLP | N/A | N/A |
84
| | | | | |
Name,
Address and
Age | Position Held
with the Funds | Term of Office(1) and
length of Time Served | Principal Occupations
During Past Five Years | Number of
Funds in Fund
Complex
Overseen by
Director | Other Directorships
Held by Director(3) |
Officers (Continued) | | | | |
Carla J. Rose
Age: 44 | Vice President, Assistant Secretary & Assistant Treasurer | Re-Elected by the Boards annually; Officer since 2000. | Vice President, Administration & Deputy Controller of the Adviser; Vice President, Administration and Controller of Sit/Kim; Controller and Treasurer of SF. | N/A | N/A |
Kelly K. Boston
Age: 41 | Assistant Secretary & Assistant Treasurer | Re-Elected by the Boards annually; Officer since 2000. | Staff Attorney of the Adviser; Secretary of the Distributor. | N/A | N/A |
| |
(1) | Each Director serves until their resignation, removal or the next meeting of the shareholders at which election of directors is an agenda item and until his successor is duly elected and shall qualify. |
| |
(2) | Directors who are deemed to be “interested persons” of the Funds as that term is defined by the Investment Company Act of 1940. Mr. Sit is considered an “interested person” because he is an officer of Sit Investment Associates, Inc., the Fund’s investment adviser. Mr. Frenzel is deemed to be an interested person because he is a director and shareholder of the Fund’s investment adviser. |
| |
(3) | Includes only directorships of companies required to report under the Securities Exchange Act of 1934 (i.e. public companies) or other investment companies registered under the 1940 Act. |
85
| | | | |
| | | | |
| Federal Tax Information (Unaudited) | | | |
| | | | |
|
| | | |
| | | | |
We are required by Federal tax regulations to provide shareholders with certain information regarding dividend distributions on an annual fiscal year basis. The figures are for informational purposes only and should not be used for reporting to federal or state revenue agencies. All necessary tax information will be mailed in January each year.
| | | | | | | |
Fund and Payable Date | | Ordinary
Income (a) | | Long-Term
Capital Gain (g) | |
Balanced Fund | | | | | | | |
October 8, 2009 | | $ | 0.09191 | | $ | 0.00000 | |
December 18, 2009 | | | 0.09741 | | | 0.00000 | |
April 9, 2010 | | | 0.09232 | | | 0.00000 | |
July 9, 2010 | | | 0.07658 | | | 0.00000 | |
| | $ | 0.35822 | (b) | $ | 0.00000 | |
| | | | | | | |
Dividend Growth Fund (Class I) | | | | | | | |
October 8, 2009 | | $ | 0.04211 | | $ | 0.00000 | |
December 18, 2009 | | | 0.04864 | | | 0.00000 | |
April 9, 2010 | | | 0.04004 | | | 0.00000 | |
July 9, 2010 | | | 0.04972 | | | 0.00000 | |
| | $ | 0.18051 | (c) | $ | 0.00000 | |
| | | | | | | |
Dividend Growth Fund (Class S) | | | | | | | |
October 8, 2009 | | $ | 0.03667 | | $ | 0.00000 | |
December 18, 2009 | | | 0.04204 | | | 0.00000 | |
April 9, 2010 | | | 0.03295 | | | 0.00000 | |
July 9, 2010 | | | 0.04237 | | | 0.00000 | |
| | $ | 0.15403 | (c) | $ | 0.00000 | |
| | | | | | | |
Global Dividend Growth Fund (Class I) | | | | | | | |
October 8, 2009 | | $ | 0.02670 | | $ | 0.00000 | |
December 18, 2009 | | | 0.03294 | | | 0.00000 | |
April 9, 2010 | | | 0.03250 | | | 0.00000 | |
July 9, 2010 | | | 0.06888 | | | 0.00000 | |
| | $ | 0.16102 | (d) | $ | 0.00000 | |
| | | | | | | |
Global Dividend Growth Fund (Class S) | | | | | | | |
October 8, 2009 | | $ | 0.02022 | | $ | 0.00000 | |
December 18, 2009 | | | 0.02618 | | | 0.00000 | |
April 9, 2010 | | | 0.02523 | | | 0.00000 | |
July 9, 2010 | | | 0.06182 | | | 0.00000 | |
| | $ | 0.13345 | (d) | $ | 0.00000 | |
86
| | | | | | | |
Fund and Payable Date | | Ordinary
Income (a) | | Long-Term
Capital Gain (g) | |
Large Cap Growth Fund | | | | | | | |
December 18, 2009 | | $ | 0.21501 | (e) | $ | 0.00000 | |
| | | | | | | |
Developing Markets Growth Fund | | | | | | | |
December 18, 2009 | | $ | 0.04413 | (f) | $ | 0.00000 | |
| | | | | | | |
International Growth Fund | | | | | | | |
December 18, 2009 | | $ | 0.12449 | (f) | $ | 0.00000 | |
| |
(a) | Includes distributions of short-term gains, if any, which are taxable as ordinary income. |
| |
(b) | Taxable as ordinary income, 39.4% qualifying for reduced dividend income tax rate for individuals.
Taxable as ordinary income, 50.4% qualifying for dividends-received deduction by corporations. |
| |
(c) | Taxable as ordinary income, 100.0% qualifying for reduced dividend income tax rate for individuals.
Taxable as ordinary income, 100.0% qualifying for dividends-received deduction by corporations. |
| |
(d) | Taxable as ordinary income, 100.0% qualifying for reduced dividend income tax rate for individuals.
Taxable as ordinary income, 95.4% qualifying for dividends-received deduction by corporations. |
| |
(e) | Taxable as ordinary income, 100.0% qualifying for reduced dividend income tax rate for individuals.
Taxable as ordinary income, 100.0% qualifying for dividends-received deduction by corporations. |
| |
(f) | Taxable as ordinary income, 100.0% qualifying for reduced dividend income tax rate for individuals. |
| |
(g) | Taxable as long-term gain. |
87
| | | | |
| Additional Information (Unaudited) | | | |
| | | | |
| | | | |
PROXY VOTING
Each Fund follows certain policies and procedures for voting proxies for securities held in each portfolio. A description of the Funds’ proxy voting polices and procedures is available without charge upon request by calling the Funds at 1-800-332-5580.
Information regarding how each Fund voted proxies relating to its portfolio securities during the most recent twelve-month period ended June 30 is available 1) without charge upon request by calling the Funds at 1-800-332-5580; and 2) on the U.S. Securities and Exchange Commission’s website at http://www.sec.gov.
AVAILABILITY OF QUARTERLY PORTFOLIO SCHEDULES
The Funds’ annual and semi-annual reports include complete lists of each portfolio’s holdings. For the first and third quarters of each fiscal year, the Funds file their complete schedules of portfolio holdings with the U.S. Securities and Exchange Commission (SEC) on Forms N-Q. The Funds’ Forms N-Q are available on the SEC’s website at http://www.sec.gov. The Funds’ Forms N-Q may be reviewed and copied at the SEC’s Public Reference Room in Washington, DC. Information on the operation of the Public Reference Room may be obtained by calling 1-800-SEC-0330. Information on the Funds’ Forms N-Q is also available without charge upon request by calling the Funds at 1-800-332-5580.
88
A Look at Sit Mutual Funds
Sit Mutual Funds are managed by Sit Investment Associates, Inc. Sit Investment Associates was founded by Eugene C. Sit in July 1981 and is dedicated to a single purpose, to be one of the premier investment management firms in the United States. Sit Investment Associates currently manages approximately $9.1 billion for some of America’s largest corporations, foundations and endowments.
Sit Mutual Funds are comprised of no-load Funds. The Stock Funds, excluding the Balanced Fund, charge a 2% redemption fee on shares held less than 30 days.
| | |
Sit Mutual Funds offer: |
| • | Free telephone exchange |
| • | Dollar-cost averaging through an automatic investment plan |
| • | Electronic transfer for purchases and redemptions |
| • | Free checkwriting privileges on Bond Funds |
| • | Retirement accounts including IRAs and 401(k) plans |
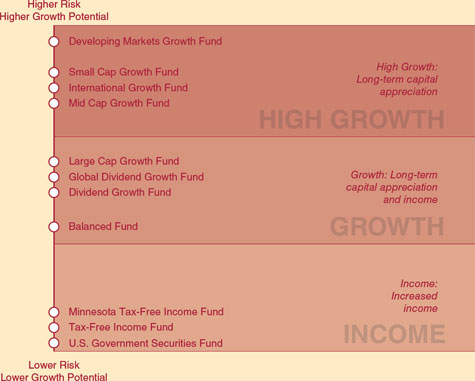
A N N U A L R E P O R T S T O C K F U N D S
One Year Ended June 30, 2010
| |
INVESTMENT ADVISER
Sit Investment Associates, Inc.
3300 IDS Center
80 South Eighth Street
Minneapolis, MN 55402
612-334-5888 (Metro Area)
800-332-5580
DISTRIBUTOR
SIA Securities Corp.
3300 IDS Center
80 South Eighth Street
Minneapolis, MN 55402
612-334-5888 (Metro Area)
800-332-5580
CUSTODIAN
PFPC Trust Company
P.O. Box 9763
Providence, RI 02940
TRANSFER AGENT AND
DISBURSING AGENT
BNY Mellon Asset Servicing
P.O. Box 9763
Providence, RI 02940 | INDEPENDENT REGISTERED PUBLIC
ACCOUNTING FIRM
KPMGLLP
90 South Seventh Street
Suite 4200
Minneapolis, MN 55402
LEGAL COUNSEL
Dorsey & WhitneyLLP
50 South Sixth Street
Suite 1500
Minneapolis, MN 55402 |

www.sitfunds.com
Item 2: Code of Ethics.
The registrant has adopted a code of ethics that applies to the registrant’s principal executive officer, principal financial officer, principal accounting officer, and persons performing similar functions. The registrant has not made any amendment to its code of ethics during the period covered by this report which must be described herein pursuant to Item 2. The registrant has not granted any waivers from any provisions of the code of ethics during the period covered by this report.
A copy of the registrant’s code of ethics is available without charge upon request by calling the registrant at 612-334-5888 or 1-800-332-5580, or by mail at Sit Mutual Funds, 3300 IDS Center, 80 South Eighth Street, Minneapolis, MN 55402.
Item 3: Audit Committee Financial Expert.
The registrant’s Board of Directors has determined that Mr. Melvin C. Bahle, Mr. John P. Fagan, Mr. Sidney L. Jones, Mr. Bruce C. Lueck, Mr. Donald W. Phillips and Mr. Barry N. Winslow are audit committee financial experts serving on its audit committee. Mr. Bahle, Mr. Fagan, Mr. Jones, Mr. Lueck, Mr. Phillips and Mr. Winslow are independent for purposes of this item.
Item 4: Principal Accountant Fees and Services.
(a) – (d) Aggregate fees billed to the registrant for the last two fiscal years for professional services rendered by the registrant’s principal accountant were as follows:
| | Audit
Fees (a) | | Audit
Related
Fees (b) | | Tax
Fees (c) | | Other
Fees (d) | |
Fiscal year ended June 30, 2010 | | 25,000 | | 0 | | 5,200 | | 0 | |
Fiscal year ended June 30, 2009 | | 24,600 | | 0 | | 5,100 | | 0 | |
Audit fees include amounts related to the audit of the registrant’s annual financial statements and services normally provided by the accountant in connection with statutory and regulatory filings. Audit-related fees include amounts reasonably related to the performance of the audit of the registrant’s financial statements, and/or are traditionally performed by the auditor. Tax fees include amounts related to tax compliance, tax planning, and tax advice. Other Fees include services provided to review the Fund’s order processing and trading procedures.
(e) (1) The Audit Committee is required to pre-approve audit and non-audit services performed for the registrant by the independent auditor in order to assure that the provision of such services does not impair the auditor’s independence. The audit committee also is required to pre-approve certain non-audit services performed by the registrant’s independent auditor for the registrant’s investment adviser and certain of the adviser’s affiliates if the services relate directly to the operations and financial reporting of the registrant. Services to be provided by the auditor must receive general pre-approval or specific pre-approval by the audit committee. Any proposed services exceeding pre-approved cost levels will require separate pre-approval by the audit committee.
The audit committee may delegate pre-approval authority to the audit committee chairman. The chairman shall report any pre-approval decisions to the audit committee at its next scheduled meeting. The audit committee does not delegate its responsibility to pre-approve services performed by the independent auditor to management.
(2) No services included in (b) – (d) were approved pursuant to paragraph (c)(7)(i)(C) of Rule 2-01 of Regulation S-X.
(f) Not applicable.
(g) The aggregate fees billed for the most recent fiscal year and the preceding fiscal year by the registrant’s principal accountant for non-audit services rendered to the registrant, its investment adviser, and any entity controlling, controlled by, or under common control with the investment adviser that provides ongoing services to the registrant were $4,000 and $4,000, respectively.
(h) The registrant’s audit committee has determined that the provision of non-audit services rendered to the registrant’s investment adviser, and any entity controlling, controlled by, or under common control with the investment adviser that provides ongoing services to the registrant, that were not pre-approved pursuant to paragraph (c)(7)(ii) of Rule 2-01 of Regulation S-X is considered compatible with maintaining the principal accountant’s independence.
Item 5: Audit Committee of Listed Registrants.
Not applicable to open-end investment companies.
Item 6: Schedule of Investments.
The schedule of investments is included as part of the report to shareholders filed under Item 1 of this Form.
Item 7: Disclosure of Proxy Voting Policies and Procedures for Closed-End Management Investment Companies.
Not applicable to open-end investment companies.
Item 8: Portfolio Managers of Closed-End Management Investments Companies.
Not applicable to open-end investment companies.
Item 9: Purchases of Equity Securities by Closed-End Management Investment Company and Affiliated Purchasers.
Not applicable to open-end investment companies.
Item 10. Submission of Matters to a vote of Security Holders.
There have been no material changes to the procedures by which shareholders may recommend nominees to the registrant’s board of directors.
Item 11: Controls and Procedures -
(a) Based on their evaluation of the Registrant’s Disclosure Controls and Procedures as of a date within 90 days of the Filing Date, the Registrant’s Chairman and Treasurer have determined that the Disclosure Controls and Procedures (as defined in Rule 30a-2(c) under the Act) are designed to ensure that information required to be disclosed by the Registrant is recorded, processed, summarized and reported by the filing Date, and that information required to be disclosed in the report is communicated to the Registrant’s management, as appropriate, to allow timely decisions regarding required disclosure.
(b) There were no significant changes in the Registrant’s internal controls or in other factors that could significantly affect these controls subsequent to the date of their evaluation, and there were no corrective actions with regard to significant deficiencies and material weaknesses.
Item 12: Exhibits:
(a) The following exhibits are attached to this Form N-CSR:
(2) A separate certification for each principal executive and principal financial officer of the registrant as required by Rule 30a-2(a) under the Act (17 CFR 270.30a-2) (certification required by Section 302 of the Sarbanes-Oxley Act of 2002).
(b) Certification required by Rule 30a-2(b) under the Act (certification required by Section 906 of the Sarbanes-Oxley Act of 2002).
SIGNATURES
Pursuant to the requirements of the Securities Exchange Act of 1934 and the Investment Company Act of 1940, the registrant has duly caused this report to be signed on its behalf by the undersigned, thereunto duly authorized.
Sit Mid Cap Growth Fund, Inc.
By (Signature and Title)* | /s/ Paul E. Rasmussen |
| Paul E. Rasmussen
Vice President, Treasurer |
Date August 26, 2010
Pursuant to the requirements of the Securities Exchange Act of 1934 and the Investment Company Act of 1940, this report has been signed below by the following persons on behalf of the registrant and in the capacities and on the dates indicated.
By (Signature and Title) | /s/ Paul E. Rasmussen |
| Paul E. Rasmussen
Vice President, Treasurer |
Date August 26, 2010
By (Signature and Title) | /s/ Roger J. Sit |
| Roger J. Sit
Chairman |
Date August 26, 2010
Item 2: Code of Ethics.
The registrant has adopted a code of ethics that applies to the registrant’s principal executive officer, principal financial officer, principal accounting officer, and persons performing similar functions. The registrant has not made any amendment to its code of ethics during the period covered by this report which must be described herein pursuant to Item 2. The registrant has not granted any waivers from any provisions of the code of ethics during the period covered by this report.
A copy of the registrant’s code of ethics is available without charge upon request by calling the registrant at 612-334-5888 or 1-800-332-5580, or by mail at Sit Mutual Funds, 3300 IDS Center, 80 South Eighth Street, Minneapolis, MN 55402.
Item 3: Audit Committee Financial Expert.
The registrant’s Board of Directors has determined that Mr. Melvin C. Bahle, Mr. John P. Fagan, Mr. Sidney L. Jones, Mr. Bruce C. Lueck,,Mr. Donald W. Phillips, and Mr. Barry N. Winslow are audit committee financial experts serving on its audit committee. Mr. Bahle, Mr. Fagan, Mr. Jones, Mr. Lueck, Mr. Phillips, and Mr. Winslow are independent for purposes of this item.
Item 4: Principal Accountant Fees and Services.
(a) – (d) Aggregate fees billed to the registrant for the last two fiscal years for professional services rendered by the registrant’s principal accountant were as follows:
| | Audit
Fees (a) | | Audit
Related
Fees (b) | | Tax
Fees (c) | | Other
Fees (d) | |
Fiscal year ended June 30, 2010 | | 20,400 | | 0 | | 5,200 | | 0 | |
Fiscal year ended June 30, 2009 | | 20,000 | | 0 | | 5,100 | | 0 | |
Audit fees include amounts related to the audit of the registrant’s annual financial statements and services normally provided by the accountant in connection with statutory and regulatory filings. Audit-related fees include amounts reasonably related to the performance of the audit of the registrant’s financial statements, and/or are traditionally performed by the auditor. Tax fees include amounts related to tax compliance, tax planning, and tax advice. Other Fees include services provided to review the Fund’s order processing and trading procedures.
(e) (1) The Audit Committee is required to pre-approve audit and non-audit services performed for the registrant by the independent auditor in order to assure that the provision of such services does not impair the auditor’s independence. The audit committee also is required to pre-approve certain non-audit services performed by the registrant’s independent auditor for the registrant’s investment adviser and certain of the adviser’s affiliates if the services relate directly to the operations and financial reporting of the registrant. Services to be provided by the auditor must receive general pre-approval or specific pre-approval by the audit committee. Any proposed services exceeding pre-approved cost levels will require separate pre-approval by the audit committee.
The audit committee may delegate pre-approval authority to the audit committee chairman. The chairman shall report any pre-approval decisions to the audit committee at its next scheduled meeting. The audit committee does not delegate its responsibility to pre-approve services performed by the independent auditor to management.
(2) No services included in (b) – (d) were approved pursuant to paragraph (c)(7)(i)(C) of Rule 2-01 of Regulation S-X.
(f) Not applicable.
(g) The aggregate fees billed for the most recent fiscal year and the preceding fiscal year by the registrant’s principal accountant for non-audit services rendered to the registrant, its investment adviser, and any entity controlling, controlled by, or under common control with the investment adviser that provides ongoing services to the registrant were $4,000 and $4,000, respectively.
(h) The registrant’s audit committee has determined that the provision of non-audit services rendered to the registrant’s investment adviser, and any entity controlling, controlled by, or under common control with the investment adviser that provides ongoing services to the registrant, that were not pre-approved pursuant to paragraph (c)(7)(ii) of Rule 2-01 of Regulation S-X is considered compatible with maintaining the principal accountant’s independence.
Item 5: Audit Committee of Listed Registrants.
Not applicable to open-end investment companies.
Item 6: Schedule of Investments.
The schedule of investments is included as part of the report to shareholders filed under Item 1 of this Form.
Item 7: Disclosure of Proxy Voting Policies and Procedures for Closed-End Management Investment Companies.
Not applicable to open-end investment companies.
Item 8: Portfolio Managers of Closed-End Management Investments Companies.
Not applicable to open-end investment companies.
Item 9: Purchases of Equity Securities by Closed-End Management Investment Company and Affiliated Purchasers.
Not applicable to open-end investment companies.
Item 10. Submission of Matters to a vote of Security Holders.
There have been no material changes to the procedures by which shareholders may recommend nominees to the registrant’s board of directors.
Item 11: Controls and Procedures -
(a) Based on their evaluation of the Registrant’s Disclosure Controls and Procedures as of a date within 90 days of the Filing Date, the Registrant’s Chairman and Treasurer have determined that the Disclosure Controls and Procedures (as defined in Rule 30a-2(c) under the Act) are designed to ensure that information required to be disclosed by the Registrant is recorded, processed, summarized and reported by the filing Date, and that information required to be disclosed in the report is communicated to the Registrant’s management, as appropriate, to allow timely decisions regarding required disclosure.
(b) There were no significant changes in the Registrant’s internal controls or in other factors that could significantly affect these controls subsequent to the date of their evaluation, and there were no corrective actions with regard to significant deficiencies and material weaknesses.
Item 12: Exhibits:
(a) The following exhibits are attached to this Form N-CSR:
(2) A separate certification for each principal executive and principal financial officer of the registrant as required by Rule 30a-2(a) under the Act (17 CFR 270.30a-2) (certification required by Section 302 of the Sarbanes-Oxley Act of 2002).
(b) Certification required by Rule 30a-2(b) under the Act (certification required by Section 906 of the Sarbanes-Oxley Act of 2002).
SIGNATURES
Pursuant to the requirements of the Securities Exchange Act of 1934 and the Investment Company Act of 1940, the registrant has duly caused this report to be signed on its behalf by the undersigned, thereunto duly authorized.
Sit Large Cap Growth Fund, Inc.
By (Signature and Title)* | /s/ Paul E. Rasmussen |
| Paul E. Rasmussen
Vice President, Treasurer |
Date August 26, 2010
Pursuant to the requirements of the Securities Exchange Act of 1934 and the Investment Company Act of 1940, this report has been signed below by the following persons on behalf of the registrant and in the capacities and on the dates indicated.
By (Signature and Title) | /s/ Paul E. Rasmussen |
| Paul E. Rasmussen
Vice President, Treasurer |
Date August 26, 2010
By (Signature and Title) | /s/ Roger J. Sit |
| Roger J. Sit
Chairman |
Date August 26, 2010
Item 2: Code of Ethics.
The registrant has adopted a code of ethics that applies to the registrant’s principal executive officer, principal financial officer, principal accounting officer, and persons performing similar functions. The registrant has not made any amendment to its code of ethics during the period covered by this report which must be described herein pursuant to Item 2. The registrant has not granted any waivers from any provisions of the code of ethics during the period covered by this report.
A copy of the registrant’s code of ethics is available without charge upon request by calling the registrant at 612-334-5888 or 1-800-332-5580, or by mail at Sit Mutual Funds, 3300 IDS Center, 80 South Eighth Street, Minneapolis, MN 55402.
Item 3: Audit Committee Financial Expert.
The registrant’s Board of Directors has determined that Mr. Melvin C. Bahle, Mr. John P. Fagan, Mr. Sidney L. Jones, Mr. Bruce C. Lueck, Mr. Donald W. Phillips and Mr. Barry N. Winslow are audit committee financial experts serving on its audit committee. Mr. Bahle, Mr. Fagan, Mr. Jones, Mr. Lueck, Mr. Phillips and Mr. Winslow are independent for purposes of this item.
Item 4: Principal Accountant Fees and Services.
(a) – (d) Aggregate fees billed to the registrant for the last two fiscal years for professional services rendered by the registrant’s principal accountant were as follows:
| | 2010 | | 2009 | |
| | Audit
Fees | | Audit
Related | | Tax
Fees | | Other
Fees | | Audit
Fees | | Audit
Related | | Tax
Fees | | Other
Fees | |
Fiscal year ended June 30 | | | | | | | | | | | | | | | | | |
Sit Mutual Funds, Inc. | | | | | | | | | | | | | | | | | |
Sit International Growth Fund (series A) | | 22,700 | | 0 | | 5,200 | | 0 | | 22,300 | | 0 | | 5,100 | | 0 | |
Sit Balanced Fund (series B) | | 15,500 | | 0 | | 5,200 | | 0 | | 15,200 | | 0 | | 5,100 | | 0 | |
Sit Developing Markets Growth Fund (series C) | | 14,800 | | 0 | | 5,200 | | 0 | | 14,500 | | 0 | | 5,100 | | 0 | |
Sit Small Cap Growth Fund (series D) | | 18,300 | | 0 | | 5,200 | | 0 | | 17,900 | | 0 | | 5,100 | | 0 | |
Sit Dividend Growth Fund (series G) | | 14,900 | | 0 | | 5,200 | | 0 | | 14,600 | | 0 | | 5,100 | | 0 | |
Sit Global Dividend Growth Fund (series H) | | 14,900 | | 0 | | 5,200 | | 0 | | 14,600 | | 0 | | 5,100 | | 0 | |
| | | | | | | | | | | | | | | | | |
Total Mutual Funds, Inc. | | 101,100 | | 0 | | 31,200 | | 0 | | 99,100 | | 0 | | 30,600 | | 0 | |
Audit fees include amounts related to the audit of the registrant’s annual financial statements and services normally provided by the accountant in connection with statutory and regulatory filings. Audit-related fees include amounts reasonably related to the performance of the audit of the registrant’s financial statements, and/or are traditionally performed by the auditor. Tax fees include amounts related to tax compliance, tax planning, and tax advice. Other Fees include services provided to review the Fund’s order processing and trading procedures.
(e) (1) The Audit Committee is required to pre-approve audit and non-audit services performed for the registrant by the independent auditor in order to assure that the provision of such services does not impair the auditor’s independence. The audit committee also is required to pre-approve certain non-audit services performed by the registrant’s independent auditor for the registrant’s investment adviser and certain of the adviser’s affiliates if the services relate directly to the operations and financial reporting of the registrant. Services to be provided by the auditor must receive general pre-approval or specific pre-approval by the audit committee. Any proposed services exceeding pre-approved cost levels will require separate pre-approval by the audit committee.
The audit committee may delegate pre-approval authority to the audit committee chairman. The chairman shall report any pre-approval decisions to the audit committee at its next scheduled meeting. The audit committee does not delegate its responsibility to pre-approve services performed by the independent auditor to management.
(2) No services included in (b) – (d) were approved pursuant to paragraph (c)(7)(i)(C) of Rule 2-01 of Regulation S-X.
(f) Not applicable.
(g) The aggregate fees billed for the most recent fiscal year and the preceding fiscal year by the registrant’s principal accountant for non-audit services rendered to the registrant, its investment adviser, and any entity controlling, controlled by, or under common control with the investment adviser that provides ongoing services to the registrant were $4,000 and $4,000, respectively.
(h) The registrant’s audit committee has determined that the provision of non-audit services rendered to the registrant’s investment adviser, and any entity controlling, controlled by, or under common control with the investment adviser that provides ongoing services to the registrant, that were not pre-approved pursuant to paragraph (c)(7)(ii) of Rule 2-01 of Regulation S-X is considered compatible with maintaining the principal accountant’s independence.
Item 5: Audit Committee of Listed Registrants.
Not applicable to open-end investment companies.
Item 6: Schedule of Investments.
The schedule of investments is included as part of the report to shareholders filed under Item 1 of this Form.
Item 7: Disclosure of Proxy Voting Policies and Procedures for Closed-End Management Investment Companies.
Not applicable to open-end investment companies.
Item 8: Portfolio Managers of Closed-End Management Investments Companies.
Not applicable to open-end investment companies.
Item 9: Purchases of Equity Securities by Closed-End Management Investment Company and Affiliated Purchasers.
Not applicable to open-end investment companies.
Item 10. Submission of Matters to a vote of Security Holders.
There have been no material changes to the procedures by which shareholders may recommend nominees to the registrant’s board of directors.
Item 11: Controls and Procedures -
(a) Based on their evaluation of the Registrant’s Disclosure Controls and Procedures as of a date within 90 days of the Filing Date, the Registrant’s Chairman and Treasurer have determined that the Disclosure Controls and Procedures (as defined in Rule 30a-2(c) under the Act) are designed to ensure that information required to be disclosed by the Registrant is recorded, processed, summarized and reported by the filing Date, and that information required to be disclosed in the report is communicated to the Registrant’s management, as appropriate, to allow timely decisions regarding required disclosure.
(b) There were no significant changes in the Registrant’s internal controls or in other factors that could significantly affect these controls subsequent to the date of their evaluation, and there were no corrective actions with regard to significant deficiencies and material weaknesses.
Item 12: Exhibits:
(a) The following exhibits are attached to this Form N-CSR:
(2) A separate certification for each principal executive and principal financial officer of the registrant as required by Rule 30a-2(a) under the Act (17 CFR 270.30a-2) (certification required by Section 302 of the Sarbanes-Oxley Act of 2002).
(b) Certification required by Rule 30a-2(b) under the Act (certification required by Section 906 of the Sarbanes-Oxley Act of 2002).
SIGNATURES
Pursuant to the requirements of the Securities Exchange Act of 1934 and the Investment Company Act of 1940, the registrant has duly caused this report to be signed on its behalf by the undersigned, thereunto duly authorized.
Sit Mutual Funds, Inc.
By (Signature and Title)* | /s/ Paul E. Rasmussen |
| Paul E. Rasmussen
Vice President, Treasurer |
Date August 26, 2010
Pursuant to the requirements of the Securities Exchange Act of 1934 and the Investment Company Act of 1940, this report has been signed below by the following persons on behalf of the registrant and in the capacities and on the dates indicated.
By (Signature and Title) | /s/ Paul E. Rasmussen |
| Paul E. Rasmussen
Vice President, Treasurer |
Date August 26, 2010
By (Signature and Title) | /s/ Roger J. Sit |
| Roger J. Sit
Chairman |
Date August 26, 2010