UNITED STATES
SECURITIES AND EXCHANGE COMMISSION
Washington, D.C. 20549
FORM N-CSR
CERTIFIED SHAREHOLDER REPORT OF REGISTERED
MANAGEMENT INVESTMENT COMPANIES
Investment Company Act file number: 811-06373
Sit Mutual Funds, Inc.
(Exact name of registrant as specified in charter)
80 South Eighth Street
3300 IDS Center
Minneapolis, MN 55402
(Address of principal executive offices)
Paul E. Rasmussen, VP Treasurer
Sit Mutual Funds, Inc.
80 South Eighth Street
3300 IDS Center
Minneapolis, MN 55402
(Name and address of agent for service)
Copy to:
Mike Radmer, Esq.
Dorsey & Whitney
Suite 1500
50 South Sixth Street
Minneapolis, MN 55402-1498
Registrant’s telephone number, including area code: (612) 332-3223
Date of fiscal year end: June 30, 2017
Date of reporting period: December 31, 2017
Item 1: Reports to Stockholders
Semi-Annual Report
December 31, 2017
Balanced Fund
Dividend Growth Fund
Global Dividend Growth Fund
Large Cap Growth Fund
ESG Growth Fund
Mid Cap Growth Fund
Small Cap Dividend Growth Fund
Small Cap Growth Fund
International Growth Fund
Developing Markets Growth Fund

STOCK FUNDS SEMI-ANNUAL REPORT TABLE OF CONTENTS |
| Page | ||
| 2 | ||
Fund Reviews and Schedules of Investments | ||
| 4 | ||
| 12 | ||
| 16 | ||
| 22 | ||
| 26 | ||
| 30 | ||
| 34 | ||
| 38 | ||
| 42 | ||
| 48 | ||
| 54 | ||
| 56 | ||
| 58 | ||
| 62 | ||
| 76 | ||
| 83 | ||
| 85 | ||
This document must be preceded or accompanied by a Prospectus.
February 1, 2018
Dear Fellow Shareholders:
Global economic momentum has improved over the last several quarters, and we believe 2018 will provide another year of slow but steady growth, representing the tenth year of expansion since the 2008 crisis. While equity markets have surged ahead over the last several quarters, we believe underlying fundamentals are in place to drive further gains in the year ahead.
Economic Overview
Economic growth in the U.S. picked up steam over the course of 2017, primarily driven by an uptick in consumer spending and improved business investment. As we enter the new year, we expect a further (but modest) growth acceleration as the Tax Cuts and Jobs Act (TCGA) is poised to kick-start a virtuous cycle of strong economic growth that could elongate the current expansion should “animal spirts” endure. The degree to which tax reductions will accelerate economic growth is contingent on how much of the tax savings and repatriated cash is allocated to domestic investment and higher wages relative to incremental corporate share repurchases and dividends. Additionally, small business formations, which have lagged this cycle, may also improve in a more stimulative regulatory and tax backdrop. One of the intriguing aspects of the tax package simply relates to when it is occurring. Unemployment is exceptionally low, both businesses and consumer confidence are at cycle highs, and the economic expansion is well advanced. While overhauls of the tax code are rare events, it is worth noting that prior reductions generally occurred when the economy was cyclically weak. According to Evercore ISI, the average U.S. unemployment rate when the past seven tax cuts occurred was 7.0%, compared to the most recent (December) reported rate of 4.1%. This unprecedented late cycle stimulus could prove inflationary and push interest rates higher, serving to offset the growth benefits.
The potential for an increasingly “hawkish” Federal Reserve represents a key risk factor for the economy and financial markets in the year ahead. A further tightening of labor markets should finally spark accelerating wage gains, in our view. In addition, “base” effects from wireless phone services and dollar weakness should diminish as the year progresses, and higher commodity prices (particularly oil) are likely to push inflation higher. We do, however, anticipate that the U.S. Federal Reserve will remain data dependent / market sensitive as it seeks to “normalize” the fed funds rate and its balance sheet concurrently. The Fed recently increased the fed funds rate by 25 basis points to a range of 125-150 basis points (its fifth increase since 2015) and is in the initial stages of gradually reducing the size of the balance sheet, which has swelled over 400% to nearly $4.5 trillion since mid-2007. We anticipate three 25 basis point rate increases in 2018, but we believe there is greater risk for more rather than less. Our base case is that this will result in continuation of the flattening yield curve, but we do not think a flatter curve is sending recessionary signals
because economic circumstances and technical factors, such as the reduction in the Fed balance sheet, are causing a typical distortions.
Outside the U.S., economic growth has shown broad-based improvement over the last several quarters. The improvement in Europe over the past year has been particularly impressive, with a healthier banking system critical in supporting both business and consumer spending. Still, as exports represent over 45% of GDP, the Euro area is sensitive to global trade conditions and moderating economic growth in China. Ongoing strength of the euro, which appreciated nearly +14% against the dollar over the past year, could begin to take a toll on exports. We believe growth in China likely peaked in early 2017, as tightening measures begin to impact industrial and consumption growth and, in particular, frothy property markets. China’s unprecedented growing debt levels remain a key risk to the global economy, but we believe there is still enough policy flexibility to avoid a major slowdown, at least for the time being. Finally, while the Japanese economy grew ahead of modest expectations over the past year, we believe structural challenges (i.e., aging population) continue to outweigh President Abe’s pro-growth fiscal policies.
Equity Strategy
Synchronized global growth, improving corporate earnings, and continued low interest rates have buoyed markets over the last several quarters. With interest rates and valuations incrementally less supportive, however, we believe corporate earnings growth will be the key determinant of market gains going forward.
After a long bull market — seemingly uninterrupted for nine years — investors are appropriately wondering how much upside remains. With U.S. market valuations hovering at historically high levels, the rebound in corporate earnings has been an essential driver of returns. Importantly, the improvement in the near-to intermediate-term outlook is broad-based, driven by a weaker U.S. dollar, easier comparisons in the beleaguered energy sector, improved capital spending (supporting manufacturing and technology, in particular), and higher bank earnings (aided by higher interest rates). The earnings rebound, which has been underway for several quarters, has now been augmented by tax reform. While a tax cut amounting to a relatively small amount of Gross Domestic Product (GDP) may not seem like much (perhaps approximating 0.50-0.60% of GDP over 10 years), we anticipate that the impact on businesses and financial markets will be quite significant.
Key beneficiaries from the legislation include consumers, domestically oriented businesses that currently have high effective tax rates, and multinational corporations with large offshore cash balances that can be repatriated. Our judgement is the benefits from tax reform are only partially priced into equity
2 |
|
SIT MUTUAL FUNDS SEMI-ANNUAL REPORT |
|
markets as upward revisions in earnings estimates will serve as an additional catalyst for stocks in the months ahead. Furthermore, we expect merger and acquisition activity to accelerate in many sectors as clarity around tax reform (and to a lesser extent, regulatory reform) emerges. This will likely incentivize acquirers to pursue U.S.-based assets. In our view, the vast majority of U.S. companies will benefit from aspects of U.S. tax reform, but to greatly varying degrees. This reinforces our view that we are in a “stock pickers“ market as policy beneficiaries reward investors with improved earnings and dividend growth over the near-to intermediate-term.
In terms of investment strategy, we continue to believe that a “barbell” approach is still appropriate at this stage of the market cycle. This calls for maintaining positions in less cyclical/ secular growth stocks balanced against stocks/sectors levered to policy changes, particularly related to tax reductions and higher capital spending. As tax reform gained momentum in recent months, we have added to several groups that are attractively valued and stand to benefit from policy change across a number of different industries. Financial stocks, particularly banks and life insurers, are increasingly attractive, given their high (current) tax rates and leverage to an uptick in economic growth, including our view that interest rates will gradually move higher in 2018. In addition to financial groups, other industries with improving fundamentals (via policy change) include manufacturing, defense, food/beverage, managed care, media, retail, airlines, railroads, and telecommunications. While investors have not recently focused on the health care and technology sectors, largely because many firms are global enterprises with very low tax rates, these groups have the most to gain from repatriation (we estimate that Apple alone has over $250B in cash overseas, based on recent filings). We expect this to drive incremental merger and acquisition activity and capital returns for these sectors.
Outside the U.S., we are particularly positive on European equities as macroeconomic conditions and valuations remain favorable, although we are mindful of the risk a strengthening currency may present down the road. We are less enthusiastic on UK equities as Brexit uncertainties constrain economic growth in the near-to intermediate term. We remain underweight Japan due to our concerns over the sustainability of growth, but we see opportunities in exporters levered to stronger growth outside the country. While the valuations of Chinese stocks are generally attractive on a relative basis, we favor secular growers (i.e., the Internet sector) relative to cyclical firms, given the potential for a slowdown in economic growth against a backdrop of high debt levels and tightening monetary policy. In other emerging markets, we see attractive risk/reward opportunities in India and South Korea, largely based on improving economic growth in both countries.
While we expect an uptick in volatility in the year ahead from unusually subdued levels experienced in 2017, we are optimistic that the current backdrop supports further gains in equity markets. Our research staff remains committed to identifying investment opportunities that will serve our shareholders well over the long-term.
With best wishes,

Roger J. Sit
Chairman, President, CEO and Global CIO
DECEMBER 31, 2017 |
3 |
|
OBJECTIVE & STRATEGY
The dual objectives of the Sit Balanced Fund are to seek long-term growth of capital consistent with the preservation of principal and to provide regular income. It pursues its objectives by investing in a diversified portfolio of stocks and bonds. The Fund may emphasize either equity securities or fixed-income securities, or hold equal amounts of each, dependent upon the Adviser’s analysis of market, financial and economic conditions.
The Fund’s permissible investment allocation is: 35-65% in equity securities and 35-65% in fixed-income securities. At all times at least 25% of the fixed-income assets will be invested in fixed-income senior securities.
The Sit Balanced Fund’s six-month return was +8.13% while the S&P 500® Index return gained +11.42% and the Bloomberg Barclays Capital Aggregate Bond Index increased +1.24% over the period.
An improving economic and corporate earnings backdrop led to out performance of stocks relative to bonds over the past six months. In short, we expect this to continue into 2018 based on our outlook for solid economic growth, the incremental impact from the passage of the Tax Cuts and Jobs Act, and the likelihood for a slow, but steady, rise in interest rates. The tax bill is a sweeping piece of legislation that will likely have both cyclical and structural impacts on the economy and financial markets. Importantly, benefits from tax reform are only partially priced in to equity markets as upward revisions in earnings estimates will serve as an additional catalyst for stocks in the months ahead. Within the equity portion of the Fund, we have recently added to several sectors that stand to benefit from faster growth and policy change (particularly lower corporate tax rates), including the finance and producer manufacturing sectors. The equity portion of the Fund outperformed the S&P 500® Index over the past six months, driven by strong stock selection in the energy minerals and consumer non-durables sectors, combined with an overweight position in the technology services sector. The most significant drag on performance during the period was our stock selection within health technology, as Incyte and Allergan posted negative returns over the period.
The bond market generated a modest but positive return during the last six months of 2017, as income earned offset principal losses that resulted from rising interest rates. The yield curve flattened dramatically during the period, with two-year maturity U.S. treasury yields rising by 0.5% while 30-year maturity treasuries had a yield decline of 0.1%. Looking forward, we expect three additional increases to the Fed Funds rate target during 2018, which in conjunction with the ramping up of the Fed’s balance sheet tapering program, is expected to continue to put upward pressure on interest rates. This will particularly impact 2–5-year maturity securities, which we expect to drive additional flattening of the yield curve. We estimate that the fixed income portion of the fund generated a return during the period of +2.7%, compared to +1.2% for the Bloomberg/Barclays Aggregate Bond Index. The funds bond investments continue to maintain a significant yield advantage relative to the benchmark, which was the primary driver of relative out-performance. Returns also benefitted from underweights to 5–10-year maturity securities paired with overweights to 2 and 30 year maturities (commonly referred to as a “barbell” yield curve positioning), as the combination of short and long maturities provided better performance than the benchmark
HYPOTHETICAL GROWTH OF $10,000
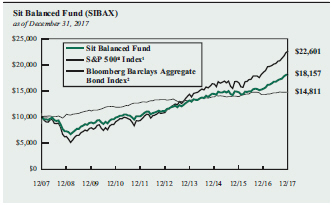
The chart above illustrates the total value of a hypothetical $10,000 investment in the Fund over the past 10 years as compared to the performance of the S&P 500® Index and the Bloomberg Barclays Aggregate Bond Index. Past performance does not guarantee future results. Returns include the reinvestment of distributions. The chart does not reflect the deduction of taxes that a shareholder would pay on Fund distributions or the redemption of Fund shares.
1 S&P 500® Index is an unmanaged capitalization-weighted index that measures the performance of 500 widely held common stocks of large-cap companies. It is not possible to invest directly in an index. This is the primary index for the equity portion of the Fund.
2 Bloomberg Barclays Aggregate Bond Index is an unmanaged market value-weighted index which measures the performance of investment grade debt securities with maturities of at least one year. This is the primary index for the fixed income portion of the Fund.
while simultaneously allowing us to maintain a shorter than benchmark portfolio duration. As part of this barbell strategy, price gains from investments in long duration U.S. Government Bonds were a key driver of returns during the period.
The stock/fixed income allocation is currently 63.0% equities, 31.9% fixed income, and 5.1% cash and equivalents. We expect to continue an above average allocation to equities based our view that stocks, as a whole, are more attractive than bonds given our positive view on tax reform and our expectation that economic growth will accelerate in the year ahead.
Roger J. Sit
Bryce A. Doty
Portfolio Managers
4 |
|
SIT MUTUAL FUNDS SEMI-ANNUAL REPORT |
|
COMPARATIVE RATES OF RETURNS
as of December 31, 2017 | ||||||
| Sit Balanced Fund | S&P 500® Index 1 | Bloomberg Barclays Aggregate Bond Index 2 | ||||
Six Month |
8.13% |
11.42% |
1.24% | |||
One Year | 17.74 | 21.83 | 3.54 | |||
Five Year | 10.22 | 15.79 | 2.10 | |||
Ten Year | 6.15 | 8.50 | 4.01 | |||
Since Inception (12/31/93) | 7.15 | 9.67 | 5.30 | |||
Performance figures are historical and do not guarantee future results. Investment returns and principal value will vary, and you may have a gain or loss when you sell shares. Current performance may be lower or higher than the performance data quoted. Contact the Fund for performance data current to the most recent month-end. Returns include changes in share price as well as reinvestment of all dividends and capital gains. Returns do not reflect the deduction of taxes that a shareholder would pay on Fund distributions or the redemption of Fund shares. Management fees and administrative expenses are included in the Fund’s performance. Returns for periods greater than one year are compounded average annual rates of return.
1 S&P 500® Index is an unmanaged capitalization-weighted index that measures the performance of 500 widely held common stocks of large-cap companies. It is not possible to invest directly in an index.
2 Bloomberg Barclays Aggregate Bond Index is an unmanaged market value-weighted index which measures the performance of investment grade debt securities with maturities of at least one year.
PORTFOLIO SUMMARY
Net Asset Value 12/31/17: | $23.39 Per Share | |
Net Asset Value 6/30/17: | $22.71 Per Share | |
Total Net Assets: | $27.6 Million |
TOP HOLDINGS
Top Equity Holdings:
1. Apple, Inc.
2. Alphabet, Inc.
3. Microsoft Corp.
4. Visa, Inc.
5. Facebook, Inc.
Top Fixed Income Holdings:
1. Security Benefit Life Insurance Co., 7.45%, 10/1/33
2. BlackRock Income Trust
3. MFS Intermediate Income Trust
4. FHLMC, 5.00%, 10/1/43
5. National Rural Utilities Cooperative, 8.00%, 3/1/32
Based on total net assets as of December 31, 2017. Subject to change.
FUND DIVERSIFICATION
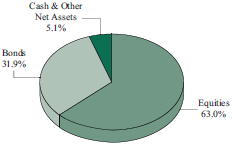
Based on total net assets as of December 31, 2017. Subject to change.
DECEMBER 31, 2017 |
5 |
SCHEDULE OF INVESTMENTS (Unaudited)
December 31, 2017
Sit Balanced Fund
| Name of Issuer | Quantity | Fair Value ($) | ||||||
Common Stocks - 63.0% | ||||||||
Communications - 1.2% | ||||||||
SBA Communications Corp. * | 650 | 106,184 | ||||||
Verizon Communications, Inc. | 4,150 | 219,660 | ||||||
|
| |||||||
| 325,844 | ||||||||
|
| |||||||
Consumer Durables - 0.6% | ||||||||
Electronic Arts, Inc. * | 1,600 | 168,096 | ||||||
|
| |||||||
Consumer Non-Durables - 3.8% | ||||||||
Estee Lauder Cos., Inc. - Class A | 2,625 | 334,005 | ||||||
NIKE, Inc. | 1,125 | 70,369 | ||||||
PepsiCo, Inc. | 2,700 | 323,784 | ||||||
Philip Morris International, Inc. | 1,450 | 153,192 | ||||||
Procter & Gamble Co. | 1,800 | 165,384 | ||||||
|
| |||||||
| 1,046,734 | ||||||||
|
| |||||||
Consumer Services - 5.4% | ||||||||
CBS Corp. | 2,125 | 125,375 | ||||||
Marriott International, Inc. | 1,900 | 257,887 | ||||||
Starbucks Corp. | 5,350 | 307,250 | ||||||
Visa, Inc. | 5,650 | 644,213 | ||||||
Walt Disney Co. | 1,400 | 150,514 | ||||||
|
| |||||||
| 1,485,239 | ||||||||
|
| |||||||
Electronic Technology - 7.3% | ||||||||
Apple, Inc. | 4,350 | 736,151 | ||||||
Applied Materials, Inc. | 7,100 | 362,952 | ||||||
Arista Networks, Inc. * | 150 | 35,337 | ||||||
Broadcom, Ltd. | 1,710 | 439,299 | ||||||
Ciena Corp. * | 4,000 | 83,720 | ||||||
Intel Corp. | 4,450 | 205,412 | ||||||
NVIDIA Corp. | 325 | 62,888 | ||||||
Skyworks Solutions, Inc. | 1,025 | 97,324 | ||||||
|
| |||||||
| 2,023,083 | ||||||||
|
| |||||||
Energy Minerals - 2.6% | ||||||||
Chevron Corp. | 650 | 81,374 | ||||||
Continental Resources, Inc. * | 2,250 | 119,183 | ||||||
EOG Resources, Inc. | 850 | 91,724 | ||||||
Marathon Petroleum Corp. | 3,800 | 250,724 | ||||||
Occidental Petroleum Corp. | 2,375 | 174,942 | ||||||
|
| |||||||
| 717,947 | ||||||||
|
| |||||||
Finance - 7.9% | ||||||||
Ameriprise Financial, Inc. | 850 | 144,050 | ||||||
Bank of America Corp. | 6,000 | 177,120 | ||||||
Chubb, Ltd. | 1,250 | 182,662 | ||||||
Goldman Sachs Group, Inc. | 1,175 | 299,343 | ||||||
Invesco, Ltd. | 3,250 | 118,755 | ||||||
JPMorgan Chase & Co. | 4,575 | 489,250 | ||||||
KeyCorp | 6,700 | 135,139 | ||||||
Prudential Financial, Inc. | 1,575 | 181,094 | ||||||
T Rowe Price Group, Inc. | 1,050 | 110,176 | ||||||
| Name of Issuer | Quantity | Fair Value ($) | ||||||
US Bancorp | 3,150 | 168,777 | ||||||
Wells Fargo & Co. | 2,800 | 169,876 | ||||||
|
| |||||||
| 2,176,242 | ||||||||
|
| |||||||
Health Services - 1.6% | ||||||||
Centene Corp. * | 1,400 | 141,232 | ||||||
UnitedHealth Group, Inc. | 1,400 | 308,644 | ||||||
|
| |||||||
| 449,876 | ||||||||
|
| |||||||
Health Technology - 5.2% | ||||||||
AbbVie, Inc. | 2,250 | 217,598 | ||||||
Alexion Pharmaceuticals, Inc. * | 550 | 65,775 | ||||||
Allergan, PLC | 625 | 102,238 | ||||||
Boston Scientific Corp. * | 3,300 | 81,807 | ||||||
Celgene Corp. * | 1,200 | 125,232 | ||||||
Gilead Sciences, Inc. | 1,000 | 71,640 | ||||||
Incyte Corp. * | 1,500 | 142,065 | ||||||
Johnson & Johnson | 2,100 | 293,412 | ||||||
Pfizer, Inc. | 4,000 | 144,880 | ||||||
Thermo Fisher Scientific, Inc. | 1,000 | 189,880 | ||||||
|
| |||||||
| 1,434,527 | ||||||||
|
| |||||||
Process Industries - 2.5% | ||||||||
DowDuPont, Inc. | 2,900 | 206,538 | ||||||
Ecolab, Inc. | 2,225 | 298,550 | ||||||
Sherwin-Williams Co. | 485 | 198,869 | ||||||
|
| |||||||
| 703,957 | ||||||||
|
| |||||||
Producer Manufacturing - 5.2% | ||||||||
3M Co. | 825 | 194,180 | ||||||
Honeywell International, Inc. | 1,850 | 283,716 | ||||||
Ingersoll-Rand, PLC | 1,850 | 165,002 | ||||||
Parker-Hannifin Corp. | 700 | 139,706 | ||||||
Raytheon Co. | 1,800 | 338,130 | ||||||
Rockwell Automation, Inc. | 700 | 137,445 | ||||||
United Technologies Corp. | 1,400 | 178,598 | ||||||
|
| |||||||
| 1,436,777 | ||||||||
|
| |||||||
Retail Trade - 3.5% | ||||||||
Amazon.com, Inc. * | 275 | 321,604 | ||||||
Home Depot, Inc. | 1,975 | 374,322 | ||||||
TJX Cos., Inc. | 1,850 | 141,451 | ||||||
Ulta Beauty, Inc. * | 555 | 124,131 | ||||||
|
| |||||||
| 961,508 | ||||||||
|
| |||||||
Technology Services - 13.2% | ||||||||
Accenture, PLC | 1,400 | 214,326 | ||||||
Adobe Systems, Inc. * | 2,100 | 368,004 | ||||||
Alphabet, Inc. - Class A * | 400 | 421,360 | ||||||
Alphabet, Inc. - Class C * | 255 | 266,832 | ||||||
ANSYS, Inc. * | 850 | 125,452 | ||||||
Autodesk, Inc. * | 950 | 99,589 | ||||||
See accompanying notes to financial statements. | ||||
6 |
|
SIT MUTUAL FUNDS SEMI-ANNUAL REPORT |
|
| Name of Issuer | Quantity /Principal Amount ($) | Fair Value ($) | ||||||
Cognizant Technology Solutions Corp. | 2,725 | 193,530 | ||||||
Facebook, Inc. * | 2,875 | 507,322 | ||||||
Microsoft Corp. | 7,575 | 647,966 | ||||||
Oracle Corp. | 4,400 | 208,032 | ||||||
PayPal Holdings, Inc. * | 2,750 | 202,455 | ||||||
priceline.com, Inc. * | 130 | 225,906 | ||||||
Red Hat, Inc. * | 450 | 54,045 | ||||||
salesforce.com, Inc. * | 1,050 | 107,342 | ||||||
|
| |||||||
| 3,642,161 | ||||||||
|
| |||||||
Transportation - 2.5% | ||||||||
Delta Air Lines, Inc. | 4,075 | 228,200 | ||||||
FedEx Corp. | 925 | 230,824 | ||||||
Union Pacific Corp. | 1,450 | 194,445 | ||||||
United Parcel Service, Inc. | 400 | 47,660 | ||||||
|
| |||||||
| 701,129 | ||||||||
|
| |||||||
Utilities - 0.5% | ||||||||
NextEra Energy, Inc. | 975 | 152,285 | ||||||
|
| |||||||
Total Common Stocks | 17,425,405 | |||||||
|
| |||||||
Bonds - 30.0% | ||||||||
Asset-Backed Securities - 1.4% | ||||||||
Bayview Opportunity Master Fund, | 86,502 | 89,064 | ||||||
Credit Suisse First Boston Mortgage Corp., 2005-AGE1 M3, 1 Mo. Libor + 0.65, 2.20%, 2/25/321 | 74,989 | 74,426 | ||||||
Element Rail Leasing II, LLC, | 75,000 | 79,241 | ||||||
Irwin Home Equity Corp., | 4,847 | 4,891 | ||||||
New Century Home Equity Loan Trust, 2005-A A4W, 4.51%, 8/25/3514 | 14,157 | 14,687 | ||||||
OSCAR US Funding Trust VII, LLC, 2017-2A A4, 2.76%, 12/10/244 | 100,000 | 98,714 | ||||||
Park Place Securities, Inc., | 4,793 | 4,794 | ||||||
Residential Funding Mortgage | 2,656 | 2,657 | ||||||
|
| |||||||
| 368,474 | ||||||||
|
| |||||||
Collateralized Mortgage Obligations - 4.6% |
| |||||||
Fannie Mae: | ||||||||
2004-T1 1A1, 6.00%, 1/25/44 | 39,284 | 43,846 | ||||||
1999-17 C, 6.35%, 4/25/29 | 21,836 | 23,687 | ||||||
2001-82 ZA, 6.50%, 1/25/32 | 29,116 | 32,136 | ||||||
2009-30 AG, 6.50%, 5/25/39 | 78,570 | 86,045 | ||||||
2013-28 WD, 6.50%, 5/25/42 | 8,475 | 9,464 | ||||||
2004-W9 2A1, 6.50%, 2/25/44 | 25,440 | 28,818 | ||||||
2015-88 CJ, 6.50%, 7/25/44 | 60,678 | 67,898 | ||||||
| Name of Issuer |
Principal | Fair Value ($) | ||||||
2010-108 AP, 7.00%, 9/25/40 | 3,567 | 4,048 | ||||||
2004-T3, 1A3, 7.00%, 2/25/44 | 10,966 | 12,650 | ||||||
1993-21 KA, 7.70%, 3/25/23 | 53,535 | 58,147 | ||||||
Freddie Mac: | ||||||||
4293 BA, 5.29%, 10/15/471 | 26,620 | 28,054 | ||||||
2102 Z, 6.00%, 12/15/28 | 31,472 | 34,576 | ||||||
2122 ZE, 6.00%, 2/15/29 | 34,551 | 38,511 | ||||||
2480 Z, 6.00%, 8/15/32 | 54,937 | 62,414 | ||||||
2980 QA, 6.00%, 5/15/35 | 36,199 | 40,571 | ||||||
2283 K, 6.50%, 12/15/23 | 15,107 | 16,186 | ||||||
2357 ZJ, 6.50%, 9/15/31 | 32,251 | 35,923 | ||||||
T-59 1A1, 6.50%, 10/25/43 | 29,830 | 32,646 | ||||||
4520 HM, 6.50%, 8/15/45 | 59,381 | 70,223 | ||||||
1142 IA, 7.00%, 10/15/21 | 73,338 | 77,505 | ||||||
3946 KW, 7.00%, 11/15/29 | 5,991 | 6,284 | ||||||
3704 CT, 7.00%, 12/15/36 | 28,932 | 33,267 | ||||||
2238 PZ, 7.50%, 6/15/30 | 24,331 | 28,171 | ||||||
Government National Mortgage Association: | ||||||||
2015-80 BA, 6.98%, 6/20/451 | 49,342 | 56,471 | ||||||
2014-69 W, 7.27%, 11/20/341 | 48,845 | 56,199 | ||||||
2013-133 KQ, 7.29%, 8/20/381 | 43,939 | 51,005 | ||||||
2005-74 HA, 7.50%, 9/16/35 | 26,230 | 28,742 | ||||||
New Residential Mortgage Loan Trust, | 46,994 | 50,852 | ||||||
Sequoia Mortgage Trust: | ||||||||
2013-3 A2, 2.50%, 3/25/431 | 26,760 | 26,026 | ||||||
2012-4 A2, 3.00%, 9/25/421 | 11,432 | 11,337 | ||||||
2012-1 B1, 4.25%, 1/25/421 | 72,804 | 74,034 | ||||||
Vendee Mortgage Trust: | ||||||||
2008-1 B, 7.02%, 3/15/251 | 20,954 | 23,898 | ||||||
1994-2 2, 8.63%, 5/15/241 | 17,804 | 18,853 | ||||||
|
| |||||||
| 1,268,487 | ||||||||
|
| |||||||
Corporate Bonds - 14.7% | ||||||||
Adobe Systems, Inc., 3.25%, 2/1/25 | 75,000 | 77,024 | ||||||
Affiliated Managers Group, Inc.: | ||||||||
3.50%, 8/1/25 | 50,000 | 50,560 | ||||||
4.25%, 2/15/24 | 25,000 | 26,360 | ||||||
Alphabet, Inc., 3.63%, 5/19/21 | 50,000 | 52,342 | ||||||
Amazon.com, Inc., 3.80%, 12/5/24 | 50,000 | 52,808 | ||||||
American Airlines 2015-2 Trust, 4.00%, 9/22/27 | 106,833 | 110,369 | ||||||
American Express Credit, 3.30%, 5/3/27 | 100,000 | 101,477 | ||||||
Anheuser-Busch InBev Finance, Inc., 4.90%, 2/1/46 | 100,000 | 115,899 | ||||||
Apollo Mgmt. Hldgs. LP, 4.40%, 5/27/264 | 25,000 | 26,112 | ||||||
Archer-Daniels-Midland Co., 2.50%, 8/11/26 | 25,000 | 23,846 | ||||||
Arrow Electronics, Inc., 3.88%, 1/12/28 | 50,000 | 49,850 | ||||||
Bank of New York Mellon Corp. | ||||||||
(Subordinated), 3.30%, 8/23/29 | 100,000 | 99,684 | ||||||
See accompanying notes to financial statements. | ||||
DECEMBER 31, 2017 |
|
7 |
|
SCHEDULE OF INVESTMENTS (Unaudited)
December 31, 2017
Sit Balanced Fund (Continued)
| Name of Issuer |
Principal | Fair Value ($) | ||||||
Bank One Corp. (Subordinated), 7.63%, 10/15/26 | 50,000 | 64,523 | ||||||
Bank One Michigan (Subordinated), 8.25%, 11/1/24 | 50,000 | 64,198 | ||||||
Berkshire Hathaway Energy, 3.50%, 2/1/25 | 25,000 | 25,776 | ||||||
Berkshire Hathaway, Inc., 3.13%, 3/15/26 | 50,000 | 50,566 | ||||||
Chubb INA Holdings, Inc., 8.88%, 8/15/29 | 50,000 | 72,954 | ||||||
Comcast Corp., 3.38%, 8/15/25 | 100,000 | 102,628 | ||||||
Conoco Funding Co., 7.25%, 10/15/31 | 50,000 | 68,952 | ||||||
ConocoPhillips Co., 4.95%, 3/15/26 | 50,000 | 56,754 | ||||||
Doric Nimrod Air Alpha 2013-1 Trust, 5.25%, 5/30/234 | 59,693 | 62,848 | ||||||
Doric Nimrod Air Finance Alpha 2012-1 Trust, 5.13%, 11/30/224 | 47,096 | 49,146 | ||||||
Exxon Mobil Corp., 4.11%, 3/1/46 | 25,000 | 27,981 | ||||||
First Maryland Capital II, 3 Mo. Libor + 0.85, 2.23%, 2/1/271 | 100,000 | 94,000 | ||||||
Georgia-Pacific, LLC, 7.25%, 6/1/28 | 85,000 | 113,108 | ||||||
Gilead Sciences, Inc.: | ||||||||
3.50%, 2/1/25 | 100,000 | 103,421 | ||||||
3.65%, 3/1/26 | 100,000 | 103,740 | ||||||
Hawaiian Airlines 2013-1, 3.90%, 1/15/26 | 80,383 | 82,392 | ||||||
Home Depot, Inc., 5.95%, 4/1/41 | 50,000 | 67,711 | ||||||
Ingersoll-Rand Co., 7.20%, 6/1/25 | 47,000 | 52,493 | ||||||
Intel Corp., 3.70%, 7/29/25 | 100,000 | 105,574 | ||||||
ITT, LLC, 7.40%, 11/15/25 | 25,000 | 32,693 | ||||||
JPMorgan Chase & Co., 2.95%, 10/1/26 | 50,000 | 49,112 | ||||||
Louisville Gas & Electric, 3.30%, 10/1/25 | 50,000 | 51,265 | ||||||
Manufacturers & Traders Trust Co. (Subordinated), 3 Mo. Libor + 0.64, 2.12%, 12/1/211 | 75,000 | 74,441 | ||||||
MetLife, Inc., 3.60%, 4/10/24 | 50,000 | 52,309 | ||||||
MUFG Americas Holdings Corp.: | ||||||||
3.00%, 2/10/25 | 50,000 | 49,366 | ||||||
3.50%, 6/18/22 | 50,000 | 51,253 | ||||||
National Rural Utilities Cooperative Finance Corp., 8.00%, 3/1/32 | 100,000 | 145,970 | ||||||
NIKE, Inc., 2.38%, 11/1/26 | 50,000 | 47,636 | ||||||
PepsiCo, Inc., 3.00%, 10/15/27 | 100,000 | 99,647 | ||||||
Pfizer, Inc., 2.75%, 6/3/26 | 100,000 | 98,711 | ||||||
PNC Bank NA, 3.10%, 10/25/27 | 100,000 | 99,851 | ||||||
Polar Tankers, Inc., 5.95%, 5/10/374 | 25,000 | 28,729 | ||||||
Provident Co, Inc., 7.25%, 3/15/28 | 100,000 | 125,552 | ||||||
Security Benefit Life Insurance Co. (Subordinated), 7.45%, 10/1/334 | 150,000 | 180,640 | ||||||
Spirit Airlines 2015-1A Trust, 4.10%, 4/1/28 | 58,295 | 60,504 | ||||||
Spirit Airlines 2015-1B Trust, 4.45%, 4/1/24 | 38,014 | 39,251 | ||||||
TJX Cos, Inc., 2.25%, 9/15/26 | 75,000 | 70,383 | ||||||
United Insurance Holdings Corp., 6.25%, 12/15/27 | 100,000 | 101,563 | ||||||
United Parcel Service, Inc., 3 Mo. Libor + 0.45, 1.86%, 4/1/231 | 100,000 | 100,251 | ||||||
| Name of Issuer |
Principal | Fair Value ($) | ||||||
US Bancorp, 3.15%, 4/27/27 | 100,000 | 100,183 | ||||||
USF&G Capital (Subordinated), 8.31%, 7/1/464 | 60,000 | 90,250 | ||||||
Verizon Communications, 5.90%, 2/15/54 | 2,000 | 52,760 | ||||||
Westar Energy, Inc., 3.25%, 12/1/25 | 75,000 | 75,705 | ||||||
Wyeth, LLC, 5.95%, 4/1/37 | 25,000 | 33,516 | ||||||
|
| |||||||
| 4,066,637 | ||||||||
|
| |||||||
Federal Home Loan Mortgage Corporation - 0.9% |
| |||||||
5.00%, 10/1/43 | 134,118 | 147,608 | ||||||
6.50%, 2/1/22 | 40,870 | 42,857 | ||||||
7.50%, 7/1/29 | 32,517 | 37,458 | ||||||
8.00%, 2/1/34 | 20,808 | 24,243 | ||||||
8.38%, 5/17/20 | 1,346 | 1,360 | ||||||
|
| |||||||
| 253,526 | ||||||||
|
| |||||||
Federal National Mortgage Association - 2.3% |
| |||||||
5.00%, 2/1/33 | 31,605 | 32,114 | ||||||
5.50%, 10/1/33 | 110,364 | 122,040 | ||||||
6.00%, 2/1/38 | 76,825 | 87,237 | ||||||
6.10%, 11/1/43 | 43,644 | 48,615 | ||||||
6.50%, 9/1/27 | 48,051 | 53,262 | ||||||
7.00%, 1/1/32 | 11,949 | 12,675 | ||||||
7.00%, 3/1/33 | 41,997 | 47,952 | ||||||
7.00%, 12/1/38 | 78,936 | 88,955 | ||||||
8.00%, 6/1/24 | 20,120 | 21,669 | ||||||
8.00%, 1/1/31 | 33,349 | 35,347 | ||||||
8.00%, 2/1/31 | 26,811 | 32,551 | ||||||
8.47%, 7/15/26 | 5,003 | 5,490 | ||||||
8.50%, 10/1/30 | 34,324 | 39,579 | ||||||
|
| |||||||
| 627,486 | ||||||||
|
| |||||||
Government National Mortgage Association - 1.6% |
| |||||||
5.75%, 12/15/22 | 59,293 | 63,158 | ||||||
6.00%, 4/15/29 | 54,849 | 61,886 | ||||||
6.00%, 7/15/38 | 82,251 | 92,011 | ||||||
6.50%, 11/20/38 | 41,968 | 48,224 | ||||||
7.00%, 12/15/24 | 14,977 | 15,959 | ||||||
7.00%, 11/20/27 | 19,857 | 22,800 | ||||||
7.00%, 9/20/29 | 51,617 | 59,135 | ||||||
7.00%, 9/20/38 | 16,954 | 19,671 | ||||||
7.50%, 4/20/32 | 42,457 | 47,787 | ||||||
8.00%, 7/15/24 | 17,625 | 18,866 | ||||||
|
| |||||||
| 449,497 | ||||||||
|
| |||||||
Taxable Municipal Securities - 4.2% |
| |||||||
Alaska Muni Bond Bank, 5.99%, 9/1/25 | 50,000 | 53,540 | ||||||
Geary County Unified School Dist. No. 475, 3.77%, 9/1/37 | 50,000 | 50,392 | ||||||
Hawaii Airports Sys. Rev., 3.89%, 7/1/37 | 75,000 | 77,264 | ||||||
Kentucky Housing Corp., 3.50%, 1/1/40 | 40,000 | 40,500 | ||||||
Louisiana Housing Corp., 3.05%, 12/1/38 | 33,202 | 33,075 | ||||||
Massachusetts Edu. Auth., 4.00%, 1/1/32 | 30,000 | 30,911 | ||||||
Mercy Health, 3.56%, 8/1/27 | 100,000 | 100,416 | ||||||
See accompanying notes to financial statements. | ||||
8 |
|
SIT MUTUAL FUNDS SEMI-ANNUAL REPORT |
|
| Name of Issuer |
Principal | Fair Value ($) | ||||||
Multistate Liquidating Trust No. 1, 3.11%, 12/15/284, 17 | 42,000 | 40,043 | ||||||
Oklahoma Dev. Fin. Auth., 4.10%, 6/1/37 | 100,000 | 103,265 | ||||||
Partners Healthcare Sys., 3.77%, 7/1/48 | 100,000 | 99,314 | ||||||
Public Finance Authority, 5.08%, 10/1/324 | 100,000 | 107,017 | ||||||
San Francisco Comm. Facs., 3.75%, 9/1/37 | 100,000 | 100,479 | ||||||
San Jose Intl. Airport, 6.60%, 3/1/41 | 110,000 | 121,999 | ||||||
San Jose Red. Agency, 3.38%, 8/1/34 | 100,000 | 98,520 | ||||||
So. Dakota Hsg. Dev. Auth., 3.89%, 5/1/32 | 45,000 | 46,112 | ||||||
Texas St. Pub. Fin. Auth. Charter Sch. Fin., 8.75%, 8/15/27 | 60,000 | 63,282 | ||||||
|
| |||||||
| 1,166,129 | ||||||||
|
| |||||||
U.S. Treasury / Federal Agency Securities - 0.3% |
| |||||||
U.S. Treasury Strip, 1.46%, 11/15/456 | 175,000 | 80,571 | ||||||
|
| |||||||
Total Bonds | 8,280,807 | |||||||
|
| |||||||
Investment Companies - 1.9% | ||||||||
BlackRock Enhanced Government Fund | 8,281 | 110,965 | ||||||
BlackRock Income Trust | 27,500 | 169,675 | ||||||
Duff & Phelps Utility and Corp. Bond Trust | 8,700 | 76,995 | ||||||
MFS Intermediate Income Trust | 39,300 | 163,095 | ||||||
Nuveen Multi-Market Income Fund, Inc. | 2,153 | 16,406 | ||||||
|
| |||||||
Total Investment Companies | 537,136 | |||||||
|
| |||||||
| Name of Issuer |
Quantity | Fair Value ($) | ||||||
Short-Term Securities - 4.9% | ||||||||
Fidelity Inst. Money Mkt. Gvt. Fund, 1.14% | 1,347,232 | 1,347,232 | ||||||
|
| |||||||
(cost: $1,347,232) | ||||||||
Total Investments in Securities - 99.8% | 27,590,580 | |||||||
Other Assets and Liabilities, net - 0.2% | 57,083 | |||||||
|
| |||||||
Total Net Assets - 100.0% | $ | 27,647,663 | ||||||
|
| |||||||
| * | Non-income producing security. |
| 1 | Variable rate security. Rate disclosed is as of December 31, 2017. Certain variable rate securities are not based on a published reference rate and spread but are determined by the issuer or agent and are based on current market conditions, or, for mortgage-backed securities, are impacted by the individual mortgages which are paying off over time. These securities do not indicate a reference rate and spread in their descriptions. |
| 4 | 144A Restricted Security. The total value of such securities as of December 31, 2017 was $902,656 and represented 3.3% of net assets. These securities have been determined to be liquid by the Adviser in accordance with guidelines established by the Board of Directors. |
| 6 | Zero coupon or convertible capital appreciation bond, for which the rate disclosed is either the effective yield on purchase date or the coupon rate to be paid upon conversion to coupon paying, respectively. |
| 14 | Step Coupon: A bond that pays an initial coupon rate for the first period and then a higher coupon rate for the following periods. Rate disclosed is as of December 31, 2017. |
| 17 | Security that is either an absolute and unconditional obligation of the United States Government or is collateralized by securities, loans, or leases guaranteed by the U.S. Government or its agencies or instrumentalities. |
Numeric footnotes not disclosed are not applicable to this Schedule of Investments.
LLC — Limited Liability Company
PLC — Public Limited Company
See accompanying notes to financial statements. | ||||
DECEMBER 31, 2017 |
|
9 |
|
|
SCHEDULE OF INVESTMENTS (Unaudited)
December 31, 2017
Sit Balanced Fund (Continued)
A summary of the levels for the Fund’s investments as of December 31, 2017 is as follows (see Note 2 - significant accounting policies in the notes to financial statements):
| Investment in Securities | ||||||||||||||
Level 1 |
Level 2 Other significant |
Level 3 Significant unobservable inputs ($) | Total ($) | |||||||||||
Common Stocks ** | 17,425,405 | — | — | 17,425,405 | ||||||||||
Asset-Backed Securities | — | 368,474 | — | 368,474 | ||||||||||
Collateralized Mortgage Obligations | — | 1,268,487 | — | 1,268,487 | ||||||||||
Corporate Bonds | — | 4,066,637 | — | 4,066,637 | ||||||||||
Federal Home Loan Mortgage Corporation | — | 253,526 | — | 253,526 | ||||||||||
Federal National Mortgage Association | — | 627,486 | — | 627,486 | ||||||||||
Government National Mortgage Association | — | 449,497 | — | 449,497 | ||||||||||
Taxable Municipal Securities | — | 1,166,129 | — | 1,166,129 | ||||||||||
U.S. Treasury / Federal Agency Securities | — | 80,571 | — | 80,571 | ||||||||||
Investment Companies | 537,136 | — | — | 537,136 | ||||||||||
Short-Term Securities | 1,347,232 | — | — | 1,347,232 | ||||||||||
|
| |||||||||||||
Total: | 19,309,773 | 8,280,807 | — | 27,590,580 | ||||||||||
|
| |||||||||||||
| ** | For equity securities categorized in a single level, refer to the Schedule of Investments for further breakdown. |
For the reporting period, there were no transfers between levels 1, 2 and 3.
See accompanying notes to financial statements. | ||||
10 |
|
SIT MUTUAL FUNDS SEMI-ANNUAL REPORT |
|
[This page intentionally left blank.]
DECEMBER 31, 2017 |
11 |
|
OBJECTIVE & STRATEGY
The objective of the Sit Dividend Growth Fund is to provide current income that exceeds the dividend yield of the S&P 500® Index and that grows over a period of years. Secondarily, the Fund seeks long-term capital appreciation.
The Fund seeks to achieve its objectives by investing, under normal market conditions, at least 80% of its net assets in dividend-paying common stocks. The Fund may invest the balance of its assets in preferred stocks, convertible bonds, and U.S. Treasury securities.
The Sit Dividend Growth Fund Class I posted a +10.71% return for the last six months of 2017, compared to the +11.42% return for the S&P 500® Index. The Fund’s gross yield (before deducting Fund expenses) was 2.28%, compared to 1.87% for the S&P 500® Index.
U.S. stocks posted exceptional returns during the second half of 2017, fueled by a combination of strong corporate earnings, continued low interest rates, and the prospect of lower corporate tax rates in the U.S. Importantly, this momentum is continuing into 2018 as global economic indicators remain on the upswing, with the pro-growth impact of tax reform likely resulting in stronger growth in the U.S in the near- to intermediate term. In terms of strategy, we have tilted the portfolio in recent months to companies levered to both policy change and improving economic growth. In particular, we have added to the finance sector, especially banks and life insurers. These two groups are increasingly attractive given their high (current) tax rates and leverage to an uptick in economic growth, including our view that interest rates will gradually move higher in 2018. Other industries with improving fundamentals (via policy change) include manufacturing, defense, food/beverage, managed care, media, retail, airlines, railroads, and telecommunications. We have reduced positions in low growth sectors that tend to underperform when interest rates increase, including REITs, utilities, pharmaceuticals, and tobacco stocks.
While we are optimistic on the outlook for equities in the year ahead, we recognize there are risks that could dampen investor sentiment, particularly later in 2018. First and foremost, inflation could emerge rather quickly as fiscal stimulus (i.e., tax cuts) is being applied to an economy that is already near the full employment zone. In addition, commodity prices, particularly oil, have generally been on the upswing over the past several months. This could bring about a more “hawkish” Federal Reserve, clearly a potential negative for stocks. With equities at historically high valuations, we believe the Fund’s diversification among high quality dividend paying stocks offers attractive risk/reward at this point in the economic and market cycle. Regardless of sector, we remain focused on companies that have strong balance sheets, generate consistent growth in earnings and cash flow, and maintain a commitment to consistently increasing dividends to shareholders.
HYPOTHETICAL GROWTH OF $10,000
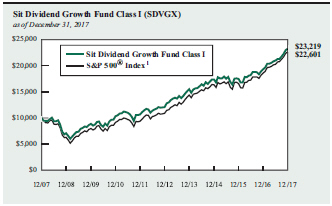
The chart above illustrates the total value of a hypothetical $10,000 investment in the Fund over the past 10 years as compared to the performance of the S&P 500® Index. Past performance does not guarantee future results. Returns include the reinvestment of distributions. The chart does not reflect the deduction of taxes that a shareholder would pay on Fund distributions or the redemption of Fund shares.
1 S&P 500® Index is an unmanaged capitalization-weighted index that measures the performance of 500 widely held common stocks of large-cap companies. It is not possible to invest directly in an index. This is the Fund’s primary index.
The Fund posted solid returns over the second half of 2017, but modestly trailed the S&P 500® index over the period. Underperformance in the finance sector was a key reason for lagging the overall index, as defensive positions (Physicians Realty Trust, Macquarie Infrastructure, and Validus) significantly trailed the benchmark sector, which was led by banks and life insurers during the period. In addition, media positions (CBS and Walt Disney) detracted from performance. Conversely, the Fund benefited from strong stock selection in the producer manufacturing, energy minerals, and process industries sectors. In terms of individual stocks, the most significant contributors during second half of the year included Abbvie, Suncor Energy, Parker-Hannifan, Verizon Communications, and Home Depot.
We appreciate investors’ continued interest in the Fund.
Roger J. Sit
Kent L. Johnson
Michael J. Stellmacher
Portfolio Managers
12 | SIT MUTUAL FUNDS ANNUAL REPORT | |
COMPARATIVE RATES OF RETURNS
as of December 31, 2017 | ||||||
| Sit Dividend Growth Fund | ||||||
| Class I | Class S | S&P 500® Index 1 | ||||
Six Month |
10.71% |
10.55% |
11.42% | |||
One Year | 20.24 | 19.88 | 21.83 | |||
Five Year | 13.97 | 13.69 | 15.79 | |||
Ten Year | 8.79 | 8.51 | 8.50 | |||
Since Inception - Class I | 9.92 | n/a | 8.68 | |||
(12/31/03) | ||||||
Since Inception - Class S | n/a | 9.26 | 8.64 | |||
(3/31/06) | ||||||
Performance figures are historical and do not guarantee future results. Investment returns and principal value will vary, and you may have a gain or loss when you sell shares. Current performance may be lower or higher than the performance data quoted. Contact the Fund for performance data current to the most recent month-end. Returns include changes in share price as well as reinvestment of all dividends and capital gains. Returns do not reflect the deduction of the 2% redemption fee imposed if shares are redeemed or exchanged within 30 calendar days from their date of purchase. If imposed, the fee would reduce the performance quoted. Returns do not reflect the deduction of taxes that a shareholder would pay on Fund distributions or the redemption of Fund shares. Management fees and administrative expenses are included in the Fund’s performance. Returns for periods greater than one year are compounded average annual rates of return.
1 S&P 500® Index is an unmanaged capitalization-weighted index that measures the performance of 500 widely held common stocks of large-cap companies. It is not possible to invest directly in an index.
PORTFOLIO SUMMARY
Class I: | ||||
Net Asset Value 12/31/17: | $16.80 Per Share | |||
Net Asset Value 6/30/17: | $16.88 Per Share | |||
Total Net Assets: | $939.7 Million | |||
Class S: | ||||
Net Asset Value 12/31/17: | $16.73 Per Share | |||
Net Asset Value 6/30/17: | $16.81 Per Share | |||
Total Net Assets: | $60.2 Million | |||
Weighted Average Market Cap: | $148.9 Billion | |||
TOP 10 HOLDINGS
1. Verizon Communications, Inc.
2. Microsoft Corp.
3. Johnson & Johnson
4. Apple, Inc.
5. JPMorgan Chase & Co.
6. Home Depot, Inc.
7. Bank of America Corp.
8. Broadcom, Ltd.
9. Morgan Stanley
10. Abbott Laboratories
Based on total net assets as of December 31, 2017. Subject to change.
FUND DIVERSIFICATION
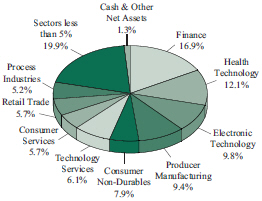
Based on total net assets as of December 31, 2017. Subject to change.
DECEMBER 31, 2017 |
13 |
SCHEDULE OF INVESTMENTS (Unaudited)
December 31, 2017
Sit Dividend Growth Fund
| Name of Issuer |
Quantity | Fair Value ($) | ||||||
Common Stocks - 98.7% | ||||||||
Communications - 3.6% | ||||||||
CenturyLink, Inc. | 277,650 | 4,631,202 | ||||||
Verizon Communications, Inc. | 596,175 | 31,555,543 | ||||||
|
| |||||||
| 36,186,745 | ||||||||
|
| |||||||
Consumer Durables - 1.2% | ||||||||
Snap-On, Inc. | 22,175 | 3,865,102 | ||||||
Stanley Black & Decker, Inc. | 50,275 | 8,531,165 | ||||||
|
| |||||||
| 12,396,267 | ||||||||
|
| |||||||
Consumer Non-Durables - 7.9% | ||||||||
Conagra Brands, Inc. | 366,600 | 13,809,822 | ||||||
Dr Pepper Snapple Group, Inc. | 102,975 | 9,994,753 | ||||||
Kimberly-Clark Corp. | 41,000 | 4,947,060 | ||||||
Kraft Heinz Co. | 177,300 | 13,786,848 | ||||||
PepsiCo, Inc. | 150,100 | 17,999,992 | ||||||
Philip Morris International, Inc. | 88,800 | 9,381,720 | ||||||
Pinnacle Foods, Inc. | 147,825 | 8,791,153 | ||||||
|
| |||||||
| 78,711,348 | ||||||||
|
| |||||||
Consumer Services - 5.7% | ||||||||
Carnival Corp. | 124,575 | 8,268,043 | ||||||
CBS Corp. | 146,625 | 8,650,875 | ||||||
Comcast Corp. | 251,750 | 10,082,587 | ||||||
Starbucks Corp. | 156,025 | 8,960,516 | ||||||
Visa, Inc. | 107,300 | 12,234,346 | ||||||
Walt Disney Co. | 83,125 | 8,936,769 | ||||||
|
| |||||||
| 57,133,136 | ||||||||
|
| |||||||
Electronic Technology - 9.8% | ||||||||
Apple, Inc. | 158,875 | 26,886,416 | ||||||
Applied Materials, Inc. | 217,975 | 11,142,882 | ||||||
Broadcom, Ltd. | 78,975 | 20,288,678 | ||||||
Intel Corp. | 371,900 | 17,166,904 | ||||||
Skyworks Solutions, Inc. | 103,425 | 9,820,204 | ||||||
TE Connectivity, Ltd. | 83,200 | 7,907,328 | ||||||
Xilinx, Inc. | 74,025 | 4,990,766 | ||||||
|
| |||||||
| 98,203,178 | ||||||||
|
| |||||||
Energy Minerals - 4.0% | ||||||||
Marathon Petroleum Corp. | 119,800 | 7,904,404 | ||||||
Occidental Petroleum Corp. | 215,425 | 15,868,206 | ||||||
Suncor Energy, Inc. | 432,750 | 15,890,580 | ||||||
|
| |||||||
| 39,663,190 | ||||||||
|
| |||||||
Finance - 16.9% | ||||||||
Allstate Corp. | 93,625 | 9,803,474 | ||||||
American Financial Group, Inc. | 37,425 | 4,062,109 | ||||||
Bank of America Corp. | 803,375 | 23,715,630 | ||||||
CME Group, Inc. | 50,675 | 7,401,084 | ||||||
East West Bancorp, Inc. | 146,225 | 8,894,867 | ||||||
Everest Re Group, Ltd. | 31,375 | 6,942,032 | ||||||
JPMorgan Chase & Co. | 249,500 | 26,681,530 | ||||||
| Name of Issuer |
Quantity | Fair Value ($) | ||||||
KeyCorp | 555,500 | 11,204,435 | ||||||
Legg Mason, Inc. | 228,625 | 9,597,678 | ||||||
Lincoln National Corp. | 128,250 | 9,858,578 | ||||||
Macquarie Infrastructure Corp. | 90,925 | 5,837,385 | ||||||
Morgan Stanley | 361,850 | 18,986,270 | ||||||
Physicians Realty Trust | 615,650 | 11,075,544 | ||||||
T Rowe Price Group, Inc. | 76,225 | 7,998,289 | ||||||
Validus Holdings, Ltd. | 147,100 | 6,901,932 | ||||||
|
| |||||||
| 168,960,837 | ||||||||
|
| |||||||
Health Services - 3.6% | ||||||||
Aetna, Inc. | 39,550 | 7,134,424 | ||||||
Quest Diagnostics, Inc. | 116,475 | 11,471,623 | ||||||
UnitedHealth Group, Inc. | 78,475 | 17,300,598 | ||||||
|
| |||||||
| 35,906,645 | ||||||||
|
| |||||||
Health Technology - 12.1% | ||||||||
Abbott Laboratories | 324,000 | 18,490,680 | ||||||
AbbVie, Inc. | 191,000 | 18,471,610 | ||||||
Allergan, PLC | 44,025 | 7,201,610 | ||||||
Becton Dickinson and Co. | 83,000 | 17,766,980 | ||||||
Gilead Sciences, Inc. | 131,450 | 9,417,078 | ||||||
Johnson & Johnson | 202,425 | 28,282,821 | ||||||
Merck & Co., Inc. | 97,300 | 5,475,071 | ||||||
Pfizer, Inc. | 437,700 | 15,853,494 | ||||||
|
| |||||||
| 120,959,344 | ||||||||
|
| |||||||
Industrial Services - 1.1% | ||||||||
TransCanada Corp. | 235,025 | 11,431,616 | ||||||
|
| |||||||
Process Industries - 5.2% | ||||||||
DowDuPont, Inc. | 255,900 | 18,225,198 | ||||||
International Paper Co. | 170,775 | 9,894,703 | ||||||
LyondellBasell Industries NV | 61,600 | 6,795,712 | ||||||
Scotts Miracle-Gro Co. | 75,475 | 8,075,070 | ||||||
Sherwin-Williams Co. | 21,950 | 9,000,378 | ||||||
|
| |||||||
| 51,991,061 | ||||||||
|
| |||||||
Producer Manufacturing - 9.4% | ||||||||
3M Co. | 37,775 | 8,891,102 | ||||||
Boeing Co. | 32,650 | 9,628,811 | ||||||
Honeywell International, Inc. | 108,500 | 16,639,560 | ||||||
Ingersoll-Rand, PLC | 99,025 | 8,832,040 | ||||||
Lockheed Martin Corp. | 30,930 | 9,930,076 | ||||||
Parker-Hannifin Corp. | 74,675 | 14,903,636 | ||||||
Raytheon Co. | 89,750 | 16,859,538 | ||||||
Rockwell Automation, Inc. | 40,675 | 7,986,536 | ||||||
|
| |||||||
| 93,671,299 | ||||||||
|
| |||||||
Retail Trade - 5.7% | ||||||||
Best Buy Co., Inc. | 110,250 | 7,548,817 | ||||||
Costco Wholesale Corp. | 41,600 | 7,742,592 | ||||||
See accompanying notes to financial statements. | ||||
14 |
|
SIT MUTUAL FUNDS SEMI-ANNUAL REPORT |
|
| Name of Issuer |
Quantity | Fair Value ($) | ||||||
Home Depot, Inc. | 132,350 | 25,084,295 | ||||||
TJX Cos., Inc. | 215,075 | 16,444,634 | ||||||
|
| |||||||
| 56,820,338 | ||||||||
|
| |||||||
Technology Services - 6.1% | ||||||||
Accenture, PLC | 52,525 | 8,041,052 | ||||||
Alphabet, Inc. - Class A * | 6,465 | 6,810,231 | ||||||
Intuit, Inc. | 52,100 | 8,220,338 | ||||||
Microsoft Corp. | 341,550 | 29,216,187 | ||||||
Oracle Corp. | 193,800 | 9,162,864 | ||||||
|
| |||||||
| 61,450,672 | ||||||||
|
| |||||||
Transportation - 3.4% | ||||||||
Delta Air Lines, Inc. | 194,350 | 10,883,600 | ||||||
FedEx Corp. | 48,000 | 11,977,920 | ||||||
Union Pacific Corp. | 80,925 | 10,852,042 | ||||||
|
| |||||||
| 33,713,562 | ||||||||
|
| |||||||
| Name of Issuer |
Quantity | Fair Value ($) | ||||||
Utilities - 3.0% | ||||||||
DTE Energy Co. | 104,500 | 11,438,570 | ||||||
NextEra Energy, Inc. | 89,450 | 13,971,196 | ||||||
Southern Co. | 84,150 | 4,046,774 | ||||||
|
| |||||||
| 29,456,540 | ||||||||
|
| |||||||
Total Common Stocks | ||||||||
(cost: $797,628,515) | 986,655,778 | |||||||
|
| |||||||
Short-Term Securities - 0.3% | ||||||||
Fidelity Inst. Money Mkt. Gvt. Fund, 1.14% | 3,558,992 | 3,558,992 | ||||||
|
| |||||||
(cost: $3,558,992) | ||||||||
Total Investments in Securities - 99.0% | ||||||||
(cost: $801,187,507) | 990,214,770 | |||||||
Other Assets and Liabilities, net - 1.0% | 9,733,985 | |||||||
|
| |||||||
Total Net Assets - 100.0% | $999,948,755 | |||||||
|
| |||||||
| * | Non-income producing security. |
Numeric footnotes not disclosed are not applicable to this Schedule of Investments.
PLC — Public Limited Company
A summary of the levels for the Fund’s investments as of December 31, 2017 is as follows (see Note 2 - significant accounting policies in the notes to financial statements):
| Investment in Securities | ||||||||||||
| Level 1 Quoted Price ($) | Level 2 Other significant | Level 3 Significant unobservable inputs ($) | Total ($) | |||||||||
Common Stocks ** | 986,655,778 | — | — | 986,655,778 | ||||||||
Short-Term Securities | 3,558,992 | — | — | 3,558,992 | ||||||||
Total: | 990,214,770 | — | — | 990,214,770 | ||||||||
| ** | For equity securities categorized in a single level, refer to the Schedule of Investments for further breakdown. |
For the reporting period, there were no transfers between levels 1, 2 and 3.
See accompanying notes to financial statements. | ||||
DECEMBER 31, 2017 |
|
15 |
|
Sit Global Dividend Growth Fund - Class I and Class S
|
OBJECTIVE & STRATEGY
The objective of the Sit Global Dividend Growth Fund is to provide current income that exceeds the dividend yield of the MSCI World Index and that grows over a period of years. Secondarily, the Fund seeks long-term capital appreciation.
The Fund seeks to achieve its objectives by investing, under normal market conditions, at least 80% of its net assets in dividend-paying common stocks issued by U.S. and foreign companies. The Fund may invest the balance of its assets in preferred stocks, convertible bonds, and U.S. Treasury securities.
The Global Dividend Growth Fund Class I generated a return of +10.80% for the six-month period ending December 31, 2017 slightly outperforming the +10.61% return for the MSCI World Index. Encouraging global economic growth prospects and passage of the Tax Cuts and Jobs Act helped push the U.S. and international stock markets higher in the last six months of 2017. As one might expect, stocks of domestic-centric companies that are beneficiaries of tax reform and/or reflation generally outperformed, particularly in December.
Contributing favorably to the absolute and relative outperformance for the six-month period was the Fund’s strong stock selection in the pharmaceutical, software and energy industries. Partially offsetting this was the underweight exposure and negative stock selection in consumer oriented stocks. Regionally, the United States was the top contributing country in the Fund due to strong stock selection and the overweight position relative to the Index.
Key beneficiaries of the Tax Cuts and Jobs Act include consumers, domestic-centric firms with a high effective tax rate currently, and multinational corporations that can repatriate large offshore cash balances. Our judgment is that equity markets have only partially priced in the benefits of tax reform and that upward earnings revisions will be an additional catalyst for stocks in the months ahead. Furthermore, we expect merger and acquisition activity to accelerate in many sectors as clarity around tax reform (and to a lesser extent, regulatory reform) emerge.
As tax reform gained momentum in recent months, we have added to and are looking to add to several groups that are attractively valued and stand to benefit from policy change across a number of different industries. Financial stocks, particularly banks and life insurers, are increasingly attractive given their high (current) tax rates and leverage to an uptick in economic growth, including the likelihood that interest rates will gradually move higher in 2018. In addition to financial groups, other industries with improving fundamentals (via policy change) include manufacturing, defense, food/ beverage, managed care, media, retail, airlines, railroads, and telecommunications. While the introduction of tax reform adds intricacy to the current market environment, we strongly believe it also represents opportunity for active investors.
HYPOTHETICAL GROWTH OF $10,000
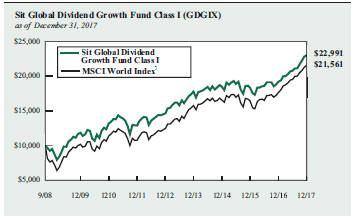
The chart above illustrates the total value of a hypothetical $10,000 investment in the Fund over the past 10 years (or for the life of the Fund if shorter) as compared to the performance of the MSCI World Index. Past performance does not guarantee future results. Returns include the reinvestment of distributions. The chart does not reflect the deduction of taxes that a shareholder would pay on Fund distributions or the redemption of Fund shares.
1 The MSCI World Index is a free float-adjusted market capitalization weighted index that is designed to measure the equity market performance of developed markets. It is not possible to invest directly in an index. This is the Fund’s primary index.
The portfolio emphasizes high quality, dividend paying growth stocks and continues to be well diversified. The Fund’s gross dividend yield is 2.9% and is approximately +60 basis points higher than the 2.3% yield of the Index. In periods of low absolute returns, the dividend component of the return becomes more significant and this should benefit the dividend paying companies that are the focus of this strategy. Dividends rose throughout 2017 and the bulk of the companies (88%) in the Fund increased their dividends.
Roger J. Sit Raymond E. Sit Tasha M. Murdoff Kent L. Johnson Michael J. Stellmacher
Portfolio Managers
16 | SIT MUTUAL FUNDS SEMI-ANNUAL REPORT |
COMPARATIVE RATES OF RETURNS
as of December 31, 2017 | ||||||||||||
| Sit Global Dividend Growth Fund | MSCI World Index 1 | |||||||||||
| Class I | Class S | |||||||||||
Six Months | 10.80 | % | 10.67 | % | 10.61% | |||||||
One Year | 19.75 | 19.54 | 22.40 | |||||||||
Five Year | 9.53 | 9.27 | 11.64 | |||||||||
Since Inception (9/30/08) | 9.41 | 9.14 | 8.65 | |||||||||
Performance figures are historical and do not guarantee future results. Investment returns and principal value will vary, and you may have a gain or loss when you sell shares. Current performance may be lower or higher than the performance data quoted. Contact the Fund for performance data current to the most recent month-end. Returns include changes in share price as well as reinvestment of all dividends and capital gains. Returns do not reflect the deduction of the 2% redemption fee imposed if shares are redeemed or exchanged within 30 calendar days from their date of purchase. If imposed, the fee would reduce the performance quoted. Returns do not reflect the deduction of taxes that a shareholder would pay on Fund distributions or the redemption of Fund shares. Management fees and administrative expenses are included in the Fund’s performance. Returns for periods greater than one year are compounded average annual rates of return.
1 The MSCI World Index is a free float-adjusted market capitalization weighted index that is designed to measure the equity market performance of developed markets. It is not possible to invest directly in an index.
PORTFOLIO SUMMARY
Class I: | ||||
Net Asset Value 12/31/17: | $15.92 Per Share | |||
Net Asset Value 6/30/17: | $14.54 Per Share | |||
Total Net Assets: | $29.3 Million | |||
Class S: | ||||
Net Asset Value 12/31/17: | $15.92 Per Share | |||
Net Asset Value 6/30/17: | $14.53 Per Share | |||
Total Net Assets: | $3.5 Million | |||
Weighted Average Market Cap: | $146.6 Billion | |||
TOP 10 HOLDINGS
1. Microsoft Corp.
2. Johnson & Johnson
3. Verizon Communications, Inc.
4. JPMorgan Chase & Co.
5. Pfizer, Inc.
6. AbbVie, Inc.
7. PepsiCo, Inc.
8. Apple, Inc.
9. Diageo, PLC, ADR
10. Nestle SA
Based on total net assets as of December 31, 2017. Subject to change.
FUND DIVERSIFICATION
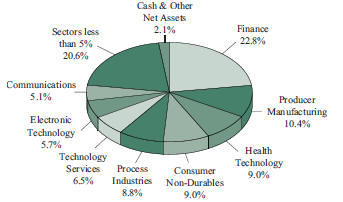
Based on total net assets as of December 31, 2017. Subject to change.
DECEMBER 31, 2017 |
|
17 |
|
SCHEDULE OF INVESTMENTS (Unaudited)
December 31, 2017
Sit Global Dividend Growth Fund
| Name of Issuer |
Quantity |
Fair Value ($) | ||||||
Common Stocks - 97.9% | ||||||||
Asia - 4.2% | ||||||||
Australia - 0.9% | ||||||||
Amcor, Ltd. | 24,700 | 295,963 | ||||||
|
| |||||||
China/Hong Kong - 1.0% | ||||||||
HSBC Holdings, PLC, ADR | 6,475 | 334,369 | ||||||
|
| |||||||
Japan - 1.1% | ||||||||
Mitsubishi UFJ Financial Group, Inc., ADR | 51,300 | 372,951 | ||||||
|
| |||||||
Singapore - 1.2% | ||||||||
Broadcom, Ltd. | 1,500 | 385,350 | ||||||
|
| |||||||
Europe - 25.4% | ||||||||
Belgium - 1.3% | ||||||||
Anheuser-Busch InBev NV, ADR | 3,675 | 409,983 | ||||||
|
| |||||||
France - 1.5% | ||||||||
Unibail-Rodamco SE | 2,000 | 503,303 | ||||||
|
| |||||||
Germany - 3.8% | ||||||||
Allianz SE, ADR | 16,400 | 376,626 | ||||||
Aurelius SE & Co. | 5,500 | 375,067 | ||||||
Siemens AG | 3,675 | 508,831 | ||||||
|
| |||||||
| 1,260,524 | ||||||||
|
| |||||||
Ireland - 2.2% | ||||||||
Accenture, PLC | 2,750 | 420,998 | ||||||
Ingersoll-Rand, PLC | 3,275 | 292,097 | ||||||
|
| |||||||
| 713,095 | ||||||||
|
| |||||||
Netherlands - 4.8% | ||||||||
ING Groep NV, ADR | 34,900 | 644,254 | ||||||
LyondellBasell Industries NV | 3,225 | 355,782 | ||||||
RELX NV | 25,400 | 583,803 | ||||||
|
| |||||||
| 1,583,839 | ||||||||
|
| |||||||
Spain - 2.2% | ||||||||
Iberdrola SA | 60,400 | 467,573 | ||||||
Industria de Diseno Textil SA | 7,525 | 261,657 | ||||||
|
| |||||||
| 729,230 | ||||||||
|
| |||||||
Switzerland - 4.0% | ||||||||
Chubb, Ltd. | 1,950 | 284,954 | ||||||
Nestle SA | 7,825 | 672,764 | ||||||
Zurich Insurance Group AG | 1,140 | 346,610 | ||||||
|
| |||||||
| 1,304,328 | ||||||||
|
| |||||||
United Kingdom - 5.6% | ||||||||
British American Tobacco, PLC, ADR | 2,300 | 154,077 | ||||||
Diageo, PLC, ADR | 4,625 | 675,389 | ||||||
DS Smith, PLC | 95,025 | 662,369 | ||||||
WPP, PLC | 20,000 | 361,314 | ||||||
|
| |||||||
| 1,853,149 | ||||||||
|
| |||||||
| Name of Issuer |
Quantity |
Fair Value ($) | ||||||
North America - 68.3% | ||||||||
Bermuda - 0.7% | ||||||||
XL Group, Ltd. | 6,000 | 210,960 | ||||||
|
| |||||||
Canada - 4.3% | ||||||||
BCE, Inc. | 10,925 | 524,509 | ||||||
Suncor Energy, Inc. | 10,275 | 377,298 | ||||||
TransCanada Corp. | 6,600 | 321,024 | ||||||
Vermilion Energy, Inc. | 5,400 | 196,128 | ||||||
|
| |||||||
| 1,418,959 | ||||||||
|
| |||||||
United States - 63.3% | ||||||||
3M Co. | 2,225 | 523,698 | ||||||
Abbott Laboratories | 9,150 | 522,190 | ||||||
AbbVie, Inc. | 7,300 | 705,983 | ||||||
Alphabet, Inc. - Class A * | 450 | 474,030 | ||||||
Apple, Inc. | 4,000 | 676,920 | ||||||
Applied Materials, Inc. | 8,175 | 417,906 | ||||||
Arthur J Gallagher & Co. | 4,875 | 308,490 | ||||||
CenterPoint Energy, Inc. | 7,400 | 209,864 | ||||||
CenturyLink, Inc. | 11,625 | 193,905 | ||||||
CubeSmart | 8,900 | 257,388 | ||||||
Delta Air Lines, Inc. | 9,450 | 529,200 | ||||||
Domtar Corp. | 5,400 | 267,408 | ||||||
DowDuPont, Inc. | 8,825 | 628,516 | ||||||
Home Depot, Inc. | 3,000 | 568,590 | ||||||
Honeywell International, Inc. | 3,875 | 594,270 | ||||||
Intel Corp. | 8,625 | 398,130 | ||||||
International Paper Co. | 5,900 | 341,846 | ||||||
Johnson & Johnson | 6,925 | 967,561 | ||||||
JPMorgan Chase & Co. | 8,750 | 935,725 | ||||||
KeyCorp | 24,100 | 486,097 | ||||||
Kraft Heinz Co. | 4,350 | 338,256 | ||||||
Lockheed Martin Corp. | 1,365 | 438,233 | ||||||
Macquarie Infrastructure Corp. | 5,275 | 338,655 | ||||||
Marathon Petroleum Corp. | 6,650 | 438,767 | ||||||
Microsoft Corp. | 14,400 | 1,231,776 | ||||||
Occidental Petroleum Corp. | 5,975 | 440,118 | ||||||
Parker-Hannifin Corp. | 1,875 | 374,212 | ||||||
PepsiCo, Inc. | 5,775 | 692,538 | ||||||
Pfizer, Inc. | 20,600 | 746,132 | ||||||
Physicians Realty Trust | 23,600 | 424,564 | ||||||
Prudential Financial, Inc. | 3,025 | 347,814 | ||||||
Rockwell Automation, Inc. | 1,825 | 358,339 | ||||||
Scotts Miracle-Gro Co. | 3,225 | 345,043 | ||||||
Starbucks Corp. | 11,050 | 634,602 | ||||||
T Rowe Price Group, Inc. | 4,800 | 503,664 | ||||||
Union Pacific Corp. | 4,600 | 616,860 | ||||||
United Parcel Service, Inc. | 2,700 | 321,705 | ||||||
United Technologies Corp. | 2,675 | 341,250 | ||||||
US Bancorp | 8,475 | 454,090 | ||||||
See accompanying notes to financial statements. | ||||
18 |
|
SIT MUTUAL FUNDS SEMI-ANNUAL REPORT |
|
| Name of Issuer |
Quantity |
Fair Value ($) | ||||||
Verizon Communications, Inc. | 18,000 | 952,740 | ||||||
WEC Energy Group, Inc. | 6,775 | 450,063 | ||||||
|
| |||||||
| 20,797,138 | ||||||||
|
| |||||||
Total Common Stocks | 32,173,141 | |||||||
|
| |||||||
Short-Term Securities - 1.9% | ||||||||
Fidelity Inst. Money Mkt. Gvt. Fund, 1.14% | 630,507 | 630,507 | ||||||
|
| |||||||
(cost: $630,507) | ||||||||
Total Investments in Securities - 99.8% | 32,803,648 | |||||||
Other Assets and Liabilities, net - 0.2% | 60,371 | |||||||
|
| |||||||
Total Net Assets - 100.0% | $32,864,019 | |||||||
|
| |||||||
| * | Non-income producing security. |
Numeric footnotes not disclosed are not applicable to this Schedule of Investments
ADR — American Depositary Receipt
PLC — Public Limited Company
See accompanying notes to financial statements. | ||||
DECEMBER 31, 2017 |
|
19 |
|
SCHEDULE OF INVESTMENTS (Unaudited)
December 31, 2017
Sit Global Dividend Growth Fund (Continued)
A summary of the levels for the Fund’s investments as of December 31, 2017 is as follows (see Note 2 - significant accounting policies in the notes to financial statements):
| Investment in Securities | ||||||||||||||||||||
| Level 1 Quoted Price ($) | Level 2 Other significant | Level 3 Significant | Total ($) | |||||||||||||||||
Common Stocks | ||||||||||||||||||||
Australia | — | 295,963 | — | 295,963 | ||||||||||||||||
Belgium | 409,983 | — | — | 409,983 | ||||||||||||||||
Bermuda | 210,960 | — | — | 210,960 | ||||||||||||||||
Canada | 1,418,959 | — | — | 1,418,959 | ||||||||||||||||
China/Hong Kong | 334,369 | — | — | 334,369 | ||||||||||||||||
France | — | 503,303 | — | 503,303 | ||||||||||||||||
Germany | 376,626 | 883,898 | — | 1,260,524 | ||||||||||||||||
Ireland | 713,095 | — | — | 713,095 | ||||||||||||||||
Japan | 372,951 | — | — | 372,951 | ||||||||||||||||
Netherlands | 1,000,036 | 583,803 | — | 1,583,839 | ||||||||||||||||
Singapore | 385,350 | — | — | 385,350 | ||||||||||||||||
Spain | — | 729,230 | — | 729,230 | ||||||||||||||||
Switzerland | 284,954 | 1,019,374 | — | 1,304,328 | ||||||||||||||||
United Kingdom | 829,466 | 1,023,683 | — | 1,853,149 | ||||||||||||||||
United States | 20,797,138 | — | — | 20,797,138 | ||||||||||||||||
Short-Term Securities | 630,507 | — | — | 630,507 | ||||||||||||||||
Total: | 27,764,394 | 5,039,254 | — | 32,803,648 | ||||||||||||||||
The Fund adjusts the closing price of foreign equity securities by applying a systematic process for events occurring after the close of the foreign exchanges. At each reporting period, this process is applied for all foreign securities and therefore all foreign securities are classified as level 2. There are no transfers between level 1 and level 2 between reporting periods as a result of applying this process. Level 1 securities of foreign issuers are primarily American Depositary Receipts (ADRs), Public Limited Companies (PLCs) or Global Depositary Receipts (GDRs). There were no transfers into or out of level 3 during the reporting period.
See accompanying notes to financial statements. | ||||
20 |
|
SIT MUTUAL FUNDS SEMI-ANNUAL REPORT |
|
[This page intentionally left blank.]
DECEMBER 31, 2017 |
21 |
|
OBJECTIVE & STRATEGY
The objective of the Sit Large Cap Growth Fund is to maximize long-term capital appreciation. The Fund pursues this objective by investing at least 80% of its net assets in the common stocks of domestic growth companies with capitalizations of $5 billion or more at the time of purchase.
The Sit Large Cap Growth Fund’s six-month return was +11.86%, compared to the +14.23% return for the Russell 1000® Growth index. The S&P 500® Index return for the period was +11.42%.
U.S. stocks posted strong returns over the second half of 2017, propelled by a combination of a favorable global earnings backdrop, muted inflation, and optimism over the stimulative impact of tax reform. Despite recent gains, we believe the environment remains supportive for stocks in the year ahead. However, with interest rates and valuations somewhat less supportive, we believe corporate earnings growth will be the key determinant of market gains going forward. Tax reform has clearly added some complexity to the environment, but we believe it is a clear positive for equity investors. Firms with a large proportion of domestic revenues (i.e., banks, retailers) stand to gain the most from lower corporate tax rates, while many large technology and health care firms will significantly benefit from repatriating overseas cash. In our view, these benefits have yet to be fully priced into many stocks.
From a strategy perspective, we continue to favor a “barbell” strategy within the portfolio and have recently increased exposure to sectors (i.e., financials) most levered to policy change while maintaining a high-quality bias in secular/ non-cyclical growth companies (technology, health care). We believe this strategy provides upside should policy-driven economic growth continue to gain traction, while offering some downside support if conditions change. The heaviest weighted sectors within the Fund are technology services, electronic technology, and health technology. We believe these sectors are attractively valued relative to growth prospects. Conversely, the Fund has limited exposure to slow growth groups including utilities, industrial services, and consumer durables. Regardless of sector, our research emphasis remains focused on building a diversified portfolio of attractively valued, high quality companies that compound earnings growth on a consistent basis.
The Fund underperformed the Russell 1000® Growth Index over the past six months, largely due to stock selection in health technology, retail trade, and producer manufacturing. Stocks that lagged
HYPOTHETICAL GROWTH OF $10,000
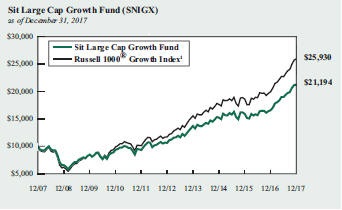
The chart above illustrates the total value of a hypothetical $10,000 investment in the Fund over the past 10 years as compared to the performance of the Russell 1000® Growth Index. Past performance does not guarantee future results. Returns include the reinvestment of distributions. The chart does not reflect the deduction of taxes that a shareholder would pay on Fund distributions or the redemption of Fund shares.
1 Russell 1000® Growth Index is an unmanaged index that measures the performance of those Russell 1000 Index companies with higher price-to-book ratios and higher forecasted growth values. It is not possible to invest directly in an index. This is the Fund’s primary index.
within these sectors included Allergan, Incyte, Zimmer Biomet, Ulta Beauty, CVS Health, and Ingersoll Rand. Relative performance was positively impacted by stock selection in consumer non-durables and finance. Individual standouts within these sectors included Estee Lauder, T. Rowe Price, and JP Morgan Chase.
We remain enthusiastic about the near- and long-term outlook for companies held in the Fund, and we appreciate shareholders’ continued interest.
Roger J. Sit
Ronald D. Sit
Michael J. Stellmacher
Portfolio Managers
22 | SIT MUTUAL FUNDS SEMI-ANNUAL REPORT | |
COMPARATIVE RATES OF RETURNS
as of December 31, 2017
| Sit Large Cap Growth Fund | Russell 1000® Growth Index 1 | Russell 1000® Index 2 | |||||||||||||
Six Month | 11.86 | % | 14.23 | % | 11.36% | ||||||||||
One Year | 27.83 | 30.21 | 21.69 | ||||||||||||
Five Year | 14.85 | 17.33 | 15.71 | ||||||||||||
Ten Year | 7.80 | 10.00 | 8.59 | ||||||||||||
Since Inception 3 (9/2/82) | 10.21 | 11.38 | 11.93 | ||||||||||||
Performance figures are historical and do not guarantee future results. Investment returns and principal value will vary, and you may have a gain or loss when you sell shares. Current performance may be lower or higher than the performance data quoted. Contact the Fund for performance data current to the most recent month-end. Returns include changes in share price as well as reinvestment of all dividends and capital gains. Returns do not reflect the deduction of the 2% redemption fee imposed if shares are redeemed or exchanged within 30 calendar days from their date of purchase. If imposed, the fee would reduce the performance quoted. Returns do not reflect the deduction of taxes that a shareholder would pay on Fund distributions or the redemption of Fund shares. Management fees and administrative expenses are included in the Fund’s performance. Returns for periods greater than one year are compounded average annual rates of return.
1 Russell 1000® Growth Index is an unmanaged index that measures the performance of those Russell 1000 Index companies with higher price-to-book ratios and higher forecasted growth values. It is not possible to invest directly in an index.
2 Russell 1000® Index is an unmanaged index that measures the performance of approximately 1,000 of the largest U.S. companies by market capitalization.
3 On 6/6/93, the Fund’s investment objective changed to allow for a portfolio of 100% stocks. Prior to that time, the portfolio was required to contain no more than 80% stocks.
PORTFOLIO SUMMARY
Net Asset Value 12/31/17: | $40.56 Per Share | |
Net Asset Value 6/30/17: | $40.56 Per Share | |
Total Net Assets: | $118.3 Million | |
Weighted Average Market Cap: | $225.8 Billion |
TOP 10 HOLDINGS
1. Alphabet, Inc.
2. Apple, Inc.
3. Microsoft Corp.
4. Facebook, Inc.
5. Visa, Inc.
6. Broadcom, Ltd.
7. Adobe Systems, Inc.
8. Home Depot, Inc.
9. PepsiCo, Inc.
10. Amazon.com, Inc.
Based on total net assets as of December 31, 2017. Subject to change.
FUND DIVERSIFICATION
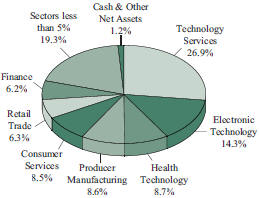
Based on total net assets as of December 31, 2017. Subject to change.
DECEMBER 31, 2017 |
23 |
SCHEDULE OF INVESTMENTS (Unaudited)
December 31, 2017
Sit Large Cap Growth Fund
Name of Issuer | Quantity | Fair Value ($) | ||||||
Common Stocks - 98.8% |
| |||||||
Communications - 0.9% |
| |||||||
Verizon Communications, Inc. | 20,925 | 1,107,560 | ||||||
|
| |||||||
Consumer Durables - 1.0% | ||||||||
Electronic Arts, Inc. * | 11,200 | 1,176,672 | ||||||
|
| |||||||
Consumer Non-Durables - 4.8% | ||||||||
Estee Lauder Cos., Inc. - Class A | 16,075 | 2,045,383 | ||||||
PepsiCo, Inc. | 21,600 | 2,590,272 | ||||||
Philip Morris International, Inc. | 2,600 | 274,690 | ||||||
Procter & Gamble Co. | 8,800 | 808,544 | ||||||
|
| |||||||
| 5,718,889 | ||||||||
|
| |||||||
Consumer Services - 8.5% |
| |||||||
CBS Corp. | 15,000 | 885,000 | ||||||
Marriott International, Inc. | 11,700 | 1,588,041 | ||||||
Starbucks Corp. | 35,000 | 2,010,050 | ||||||
Visa, Inc. | 35,000 | 3,990,700 | ||||||
Walt Disney Co. | 14,600 | 1,569,646 | ||||||
|
| |||||||
| 10,043,437 | ||||||||
|
| |||||||
Electronic Technology - 14.3% |
| |||||||
Apple, Inc. | 45,100 | 7,632,273 | ||||||
Applied Materials, Inc. | 49,700 | 2,540,664 | ||||||
Arista Networks, Inc. * | 975 | 229,691 | ||||||
Broadcom, Ltd. | 12,400 | 3,185,560 | ||||||
Ciena Corp. * | 37,000 | 774,410 | ||||||
Intel Corp. | 16,800 | 775,488 | ||||||
NVIDIA Corp. | 6,825 | 1,320,638 | ||||||
Skyworks Solutions, Inc. | 4,700 | 446,265 | ||||||
|
| |||||||
| 16,904,989 | ||||||||
|
| |||||||
Energy Minerals - 1.2% |
| |||||||
Marathon Petroleum Corp. | 15,300 | 1,009,494 | ||||||
Pioneer Natural Resources Co. | 2,300 | 397,555 | ||||||
|
| |||||||
| 1,407,049 | ||||||||
|
| |||||||
Finance - 6.2% |
| |||||||
Bank of America Corp. | 26,000 | 767,520 | ||||||
Chubb, Ltd. | 4,450 | 650,278 | ||||||
Goldman Sachs Group, Inc. | 4,800 | 1,222,848 | ||||||
JPMorgan Chase & Co. | 20,600 | 2,202,964 | ||||||
Legg Mason, Inc. | 18,300 | 768,234 | ||||||
Prudential Financial, Inc. | 5,700 | 655,386 | ||||||
T Rowe Price Group, Inc. | 10,500 | 1,101,765 | ||||||
|
| |||||||
| 7,368,995 | ||||||||
|
| |||||||
Name of Issuer | Quantity | Fair Value ($) | ||||||
Health Services - 2.7% | ||||||||
Centene Corp. * | 9,700 | 978,536 | ||||||
UnitedHealth Group, Inc. | 10,025 | 2,210,112 | ||||||
|
| |||||||
| 3,188,648 | ||||||||
|
| |||||||
Health Technology - 8.7% | ||||||||
AbbVie, Inc. | 15,900 | 1,537,689 | ||||||
Alexion Pharmaceuticals, Inc. * | 4,700 | 562,073 | ||||||
Allergan, PLC | 4,200 | 687,036 | ||||||
Boston Scientific Corp. * | 42,400 | 1,051,096 | ||||||
Celgene Corp. * | 8,975 | 936,631 | ||||||
Gilead Sciences, Inc. | 8,400 | 601,776 | ||||||
Incyte Corp. * | 10,850 | 1,027,604 | ||||||
Johnson & Johnson | 13,700 | 1,914,164 | ||||||
Pfizer, Inc. | 22,600 | 818,572 | ||||||
Thermo Fisher Scientific, Inc. | 5,850 | 1,110,798 | ||||||
|
| |||||||
| 10,247,439 | ||||||||
|
| |||||||
Process Industries - 4.0% | ||||||||
DowDuPont, Inc. | 20,200 | 1,438,644 | ||||||
Ecolab, Inc. | 14,500 | 1,945,610 | ||||||
Sherwin-Williams Co. | 3,400 | 1,394,136 | ||||||
|
| |||||||
| 4,778,390 | ||||||||
|
| |||||||
Producer Manufacturing - 8.6% | ||||||||
3M Co. | 7,450 | 1,753,506 | ||||||
Honeywell International, Inc. | 12,425 | 1,905,498 | ||||||
Ingersoll-Rand, PLC | 12,500 | 1,114,875 | ||||||
Parker-Hannifin Corp. | 5,000 | 997,900 | ||||||
Raytheon Co. | 12,225 | 2,296,466 | ||||||
Rockwell Automation, Inc. | 4,925 | 967,024 | ||||||
United Technologies Corp. | 9,000 | 1,148,130 | ||||||
|
| |||||||
| 10,183,399 | ||||||||
|
| |||||||
Retail Trade - 6.3% | ||||||||
Amazon.com, Inc. * | 2,175 | 2,543,597 | ||||||
Home Depot, Inc. | 14,200 | 2,691,326 | ||||||
TJX Cos., Inc. | 16,600 | 1,269,236 | ||||||
Ulta Beauty, Inc. * | 3,975 | 889,048 | ||||||
|
| |||||||
| 7,393,207 | ||||||||
|
| |||||||
Technology Services - 26.9% | ||||||||
Accenture, PLC | 10,975 | 1,680,163 | ||||||
Adobe Systems, Inc. * | 15,700 | 2,751,268 | ||||||
Alphabet, Inc. - Class A * | 1,400 | 1,474,760 | ||||||
Alphabet, Inc. - Class C * | 5,966 | 6,242,822 | ||||||
ANSYS, Inc. * | 6,200 | 915,058 | ||||||
Autodesk, Inc. * | 6,700 | 702,361 | ||||||
Cognizant Technology Solutions Corp. | 21,800 | 1,548,236 | ||||||
Facebook, Inc. * | 25,800 | 4,552,668 | ||||||
Microsoft Corp. | 71,400 | 6,107,556 | ||||||
Oracle Corp. | 27,400 | 1,295,472 | ||||||
PayPal Holdings, Inc. * | 21,500 | 1,582,830 | ||||||
See accompanying notes to financial statements. | ||||
24 |
|
SIT MUTUAL FUNDS SEMI-ANNUAL REPORT |
|
Name of Issuer | Quantity | Fair Value ($) | ||||||
priceline.com, Inc. * | 1,085 | 1,885,448 | ||||||
Red Hat, Inc. * | 3,000 | 360,300 | ||||||
salesforce.com, Inc. * | 7,400 | 756,502 | ||||||
|
| |||||||
| 31,855,444 | ||||||||
|
| |||||||
Transportation - 4.0% | ||||||||
Alaska Air Group, Inc. | 11,900 | 874,769 | ||||||
Delta Air Lines, Inc. | 21,615 | 1,210,440 | ||||||
FedEx Corp. | 6,000 | 1,497,240 | ||||||
Union Pacific Corp. | 8,800 | 1,180,080 | ||||||
|
| |||||||
| 4,762,529 | ||||||||
|
| |||||||
Utilities - 0.7% | ||||||||
NextEra Energy, Inc. | 5,000 | 780,950 | ||||||
|
| |||||||
Total Common Stocks |
| 116,917,597 | ||||||
|
| |||||||
Name of Issuer | Quantity | Fair Value ($) | ||||||
Short-Term Securities - 1.3% | ||||||||
Fidelity Inst. Money Mkt. Gvt. Fund, 1.14% | 1,467,365 | 1,467,365 | ||||||
|
| |||||||
Total Investments in Securities - 100.1% |
| 118,384,962 | ||||||
Other Assets and Liabilities, net - (0.1%) |
| (67,961 | ) | |||||
|
| |||||||
Total Net Assets - 100.0% |
| $118,317,001 | ||||||
|
| |||||||
| * | Non-income producing security. |
Numeric footnotes not disclosed are not applicable to this Schedule of Investments.
PLC — Public Limited Company
A summary of the levels for the Fund’s investments as of December 31, 2017 is as follows (see Note 2 - significant accounting policies in the notes to financial statements):
| Investment in Securities | ||||||||||||
| Level 1 Quoted Price ($) | Level 2 Other significant | Level 3 Significant unobservable inputs ($) | Total ($) | |||||||||
Common Stocks ** | 116,917,597 | — | — | 116,917,597 | ||||||||
Short-Term Securities | 1,467,365 | — | — | 1,467,365 | ||||||||
Total: | 118,384,962 | — | — | 118,384,962 | ||||||||
| ** | For equity securities categorized in a single level, refer to the Schedule of Investments for further breakdown. |
For the reporting period, there were no transfers between levels 1, 2 and 3.
See accompanying notes to financial statements.
DECEMBER 31, 2017 |
25 |
Sit ESG Growth Fund – Class I and Class S
|
OBJECTIVE & STRATEGY
The objective of the Sit ESG Growth Fund is to maximize long-term capital appreciation. The Fund seeks to achieve its objectives by investing, under normal market conditions, at least 80% of its net assets in companies that the Adviser believes have strong environmental, social and corporate governance (ESG) practices at the time of purchase. The Fund invests in common stocks of U.S. and foreign companies, primarily of large to medium capitalizations (companies with market capitalization in excess of $2 billion).
The Sit ESG Growth Fund Class I generated a return of +11.55% in the second half of calendar year 2017 outperforming the MSCI World Index return of +10.61%. Synchronized global growth, improving corporate earnings, benign inflation, supportive financial conditions, the passage of the Tax Cuts and Jobs Act and a healthy dose of “animal spirits” helped propel equity markets worldwide appreciably higher in the last six months of 2017.
The pharmaceutical, telecommunication, diversified financial and consumer service industries were the top contributing industries thanks to positive stock selection. Conversely, the holdings in the retailing industries detracted due to negative stock selection. The materials industry also detracted from relative performance given the underweight position and the outperformance of the Index securities.
From a geographic perspective, the U.S. was the top contributing country in the Fund relative to the Index due to strong stock selection and the overweight position. The Fund’s holdings in Spain and Japan only partially offset the positive U.S. contribution due to negative stock selection and the allocation effect (overweight Spain and underweight Japan).
We are generally constructive on U.S. equities in 2018 given the supportive global macroeconomic backdrop, outlook for improved corporate earnings, and stimulative fiscal policies. Moreover, we anticipate that earnings growth, rather than price-to-earnings (P/E) multiple expansion, will be the primary determinant of stock appreciation as equity markets continue to shift from a monetary policy-driven market (rising tide lifts all boats) to one driven by company fundamentals.
Internationally, we are also positive on European equities as macroeconomic conditions and valuation remain favorable, particularly for the Euro Area. We are less enthusiastic on UK equities as Brexit continues to cap economic growth in the intermediate term. Political risk associated with the 2018 Italian elections is likely minimal, but the ongoing Brexit negotiations remain a headwind. In general, we favor equities with continental Europe exposure, along with companies that will benefit from tax reform and other pro-growth policies in the United States. We are cautious on securities with emerging
HYPOTHETICAL GROWTH OF $10,000
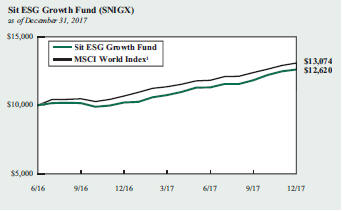
The chart above illustrates the total value of a hypothetical $10,000 investment in the Fund over the past 10 years (or for the life of the Fund if shorter) as compared to the performance of the MSCI World Index. Past performance does not guarantee future results. Returns include the reinvestment of distributions. The chart does not reflect the deduction of taxes that a shareholder would pay on Fund distributions or the redemption of Fund shares.
1 The MSCI World Index is a free float-adjusted market capitalization weighted index that is designed to measure the equity market performance of developed markets. It is not possible to invest directly in an index. This is the Fund’s primary index.
markets exposure, given less robust conditions, particularly if we see U.S. dollar strength in 2018 relative to the euro, a reversal from 2017. In Japan we expect a more mixed environment for equities moving into 2018 and continue to prefer exporters and multinationals levered to higher growth regions, such as the U.S. or Continental Europe, and resilient defensive consumption names.
The focus of the Sit ESG Fund is to invest at least 80% of the assets in companies that have strong ESG (environmental, social and corporate governance) practices. We remain positive about the long-term outlook for companies held in the Fund based on attractive valuations and sustainable earnings growth potential.
Roger J. Sit
Ronald D. Sit
Michael J. Stellmacher
Portfolio Managers
26 | SIT MUTUAL FUNDS SEMI-ANNUAL REPORT | |
|
COMPARATIVE RATES OF RETURNS
as of December 31, 2017
| Sit ESG Growth Fund | MSCI World Index 1 | ||||||||||||||
Class I | Class S | ||||||||||||||
Six Month | 11.55 | % | 11.53 | % | 10.61 | % | |||||||||
One Year | 23.72 | 23.47 | 22.40 | ||||||||||||
Since Inception (6/30/16) | 16.73 | 16.49 | 19.51 | ||||||||||||
Performance figures are historical and do not guarantee future results. Investment returns and principal value will vary, and you may have a gain or loss when you sell shares. Current performance may be lower or higher than the performance data quoted. Contact the Fund for performance data current to the most recent month-end. Returns include changes in share price as well as reinvestment of all dividends and capital gains. Returns do not reflect the deduction of the 2% redemption fee imposed if shares are redeemed or exchanged within 30 calendar days from their date of purchase. If imposed, the fee would reduce the performance quoted. Returns do not reflect the deduction of taxes that a shareholder would pay on Fund distributions or the redemption of Fund shares. Management fees and administrative expenses are included in the Fund’s performance. Returns for periods greater than one year are compounded average annual rates of return.
1 The MSCI World Index is a free float-adjusted market capitalization weighted index that is designed to measure the equity market performance of developed markets. It is not possible to invest directly in an index.
PORTFOLIO SUMMARY
Class I: | ||||
Net Asset Value 12/31/17: | $12.48 Per Share | |||
Net Asset Value 6/30/17: | $11.29 Per Share | |||
Total Net Assets: | $3.1 Million | |||
Class S: | ||||
Net Asset Value 12/31/17: | $12.47 Per Share | |||
Net Asset Value 6/30/17: | $11.28 Per Share | |||
Total Net Assets: | $2.7 Million | |||
Weighted Average Market Cap: | $152.2 Billion | |||
TOP 10 HOLDINGS
1. Verizon Communications, Inc.
2. Microsoft Corp.
3. Starbucks Corp.
4. Suncor Energy, Inc.
5. Marriott International, Inc.
6. Ingersoll-Rand,PLC
7. 3M Co.
8. Home Depot, Inc.
9. Intel Corp.
10. ING Groep NV, ADR
Based on total net assets as of December 31, 2017. Subject to change.
FUND DIVERSIFICATION
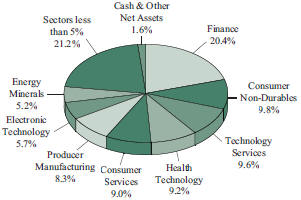
Based on total net assets as of December 31, 2017. Subject to change.
DECEMBER 31, 2017 |
27 |
SCHEDULE OF INVESTMENTS (Unaudited)
December 31, 2017
Sit ESG Growth Fund
Name of Issuer | Quantity | Fair Value ($) | ||||||
Common Stocks - 98.4% | ||||||||
Asia - 2.9% | ||||||||
China/Hong Kong - 1.2% | ||||||||
HSBC Holdings, PLC, ADR | 1,300 | 67,132 | ||||||
|
| |||||||
Japan - 1.7% | ||||||||
Asics Corp. | 2,400 | 38,148 | ||||||
Mitsubishi UFJ Financial Group, Inc., ADR | 8,325 | 60,523 | ||||||
|
| |||||||
| 98,671 | ||||||||
|
| |||||||
Europe - 28.2% | ||||||||
Belgium - 1.4% | ||||||||
Anheuser-Busch InBev NV, ADR | 700 | 78,092 | ||||||
|
| |||||||
France - 3.5% | ||||||||
Ingenico Group SA | 685 | 73,157 | ||||||
Unibail-Rodamco SE, ADR | 5,100 | 128,188 | ||||||
|
| |||||||
| 201,345 | ||||||||
|
| |||||||
Germany - 4.1% | ||||||||
Allianz SE, ADR | 5,100 | 117,122 | ||||||
Siemens AG, ADR | 1,725 | 119,491 | ||||||
|
| |||||||
| 236,613 | ||||||||
|
| |||||||
Ireland - 3.9% | ||||||||
Accenture, PLC | 510 | 78,076 | ||||||
Ingersoll-Rand, PLC | 1,625 | 144,934 | ||||||
|
| |||||||
| 223,010 | ||||||||
|
| |||||||
Netherlands - 4.3% | ||||||||
ING Groep NV, ADR | 7,475 | 137,988 | ||||||
RELX NV,ADR | 4,700 | 108,429 | ||||||
|
| |||||||
| 246,417 | ||||||||
|
| |||||||
Spain - 3.4% | ||||||||
Iberdrola SA, ADR | 2,950 | 91,258 | ||||||
Industria de Diseno Textil SA | 3,075 | 106,923 | ||||||
|
| |||||||
| 198,181 | ||||||||
|
| |||||||
Switzerland - 3.6% | ||||||||
Nestle SA, ADR | 1,200 | 103,164 | ||||||
Zurich Insurance Group AG, ADR | 3,500 | 106,435 | ||||||
|
| |||||||
| 209,599 | ||||||||
|
| |||||||
United Kingdom - 4.0% | ||||||||
Coca-Cola European Partners, PLC | 2,100 | 83,685 | ||||||
Diageo, PLC, ADR | 600 | 87,618 | ||||||
Royal Dutch Shell, PLC, ADR - Class B | 875 | 59,754 | ||||||
|
| |||||||
| 231,057 | ||||||||
|
| |||||||
North America - 67.3% | ||||||||
Canada - 4.2% | ||||||||
BCE, Inc. | 1,825 | 87,618 | ||||||
Suncor Energy, Inc. | 4,100 | 150,552 | ||||||
|
| |||||||
| 238,170 | ||||||||
|
| |||||||
Name of Issuer | Quantity | Fair Value ($) | ||||||
United States - 63.1% | ||||||||
3M Co. | 600 | 141,222 | ||||||
AbbVie, Inc. | 1,225 | 118,470 | ||||||
Adobe Systems, Inc. * | 500 | 87,620 | ||||||
Allstate Corp. | 525 | 54,973 | ||||||
Alphabet, Inc. - Class A * | 100 | 105,340 | ||||||
Apple, Inc. | 675 | 114,230 | ||||||
Baxter International, Inc. | 850 | 54,944 | ||||||
Boston Scientific Corp. * | 4,025 | 99,780 | ||||||
Cognizant Technology Solutions Corp. | 750 | 53,265 | ||||||
Delta Air Lines, Inc. | 1,500 | 84,000 | ||||||
DowDuPont, Inc. | 1,925 | 137,099 | ||||||
Ecolab, Inc. | 925 | 124,116 | ||||||
Facebook, Inc. * | 320 | 56,467 | ||||||
FedEx Corp. | 535 | 133,504 | ||||||
Goldman Sachs Group, Inc. | 375 | 95,535 | ||||||
Home Depot, Inc. | 745 | 141,200 | ||||||
Intel Corp. | 3,050 | 140,788 | ||||||
Johnson & Johnson | 975 | 136,227 | ||||||
JPMorgan Chase & Co. | 1,200 | 128,328 | ||||||
KeyCorp | 2,500 | 50,425 | ||||||
Legg Mason, Inc. | 1,600 | 67,168 | ||||||
Marriott International, Inc. | 1,100 | 149,303 | ||||||
Microsoft Corp. | 2,000 | 171,080 | ||||||
NIKE, Inc. | 1,100 | 68,805 | ||||||
Occidental Petroleum Corp. | 1,200 | 88,392 | ||||||
PepsiCo, Inc. | 875 | 104,930 | ||||||
Pfizer, Inc. | 3,375 | 122,242 | ||||||
Prudential Financial, Inc. | 560 | 64,389 | ||||||
Rockwell Automation, Inc. | 350 | 68,722 | ||||||
Starbucks Corp. | 2,750 | 157,932 | ||||||
T Rowe Price Group, Inc. | 925 | 97,060 | ||||||
TJX Cos., Inc. | 690 | 52,757 | ||||||
UnitedHealth Group, Inc. | 375 | 82,672 | ||||||
Verizon Communications, Inc. | 3,300 | 174,669 | ||||||
Visa, Inc. | 875 | 99,768 | ||||||
|
| |||||||
| 3,627,422 | ||||||||
|
| |||||||
Total Common Stocks |
| 5,655,709 | ||||||
|
| |||||||
28 |
|
SIT MUTUAL FUNDS SEMI-ANNUAL REPORT |
|
Name of Issuer | Quantity | Fair Value ($) | ||||||
Short-Term Securities - 1.6% |
| |||||||
Fidelity Inst. Money Mkt. Gvt. Fund, 1.14% | 89,218 | 89,218 | ||||||
|
| |||||||
Total Investments in Securities - 100.0% |
| 5,744,927 | ||||||
Other Assets and Liabilities, net - 0.0% |
| 1,363 | ||||||
|
| |||||||
Total Net Assets - 100.0% |
| $5,746,290 | ||||||
|
| |||||||
| * | Non-income producing security. |
Numeric footnotes not disclosed are not applicable to this Schedule of Investments
ADR — American Depositary Receipt
PLC — Public Limited Company
A summary of the levels for the Fund’s investments as of December 31, 2017 is as follows (see Note 2 - significant accounting policies in the notes to financial statements):
| Investment in Securities | ||||||||||||||||
| Level 1 Quoted Price ($) | Level 2 Other significant observable inputs ($) | Level 3 Significant | Total ($) | |||||||||||||
Common Stocks | ||||||||||||||||
Belgium | 78,092 | — | — | 78,092 | ||||||||||||
Canada | 238,170 | — | — | 238,170 | ||||||||||||
China/Hong Kong | 67,132 | — | — | 67,132 | ||||||||||||
France | 128,188 | 73,157 | — | 201,345 | ||||||||||||
Germany | 236,613 | — | — | 236,613 | ||||||||||||
Ireland | 223,010 | — | — | 223,010 | ||||||||||||
Japan | 60,523 | 38,148 | — | 98,671 | ||||||||||||
Netherlands | 246,417 | — | — | 246,417 | ||||||||||||
Spain | 91,258 | 106,923 | — | 198,181 | ||||||||||||
Switzerland | 209,599 | — | — | 209,599 | ||||||||||||
United Kingdom | 231,057 | — | — | 231,057 | ||||||||||||
United States | 3,627,422 | — | — | 3,627,422 | ||||||||||||
Short-Term Securities | 89,218 | — | — | 89,218 | ||||||||||||
Total: | 5,526,699 | 218,228 | — | 5,744,927 | ||||||||||||
The Fund adjusts the closing price of foreign equity securities by applying a systematic process for events occurring after the close of the foreign exchanges. At each reporting period, this process is applied for all foreign securities and therefore all foreign securities are classified as level 2. There are no transfers between level 1 and level 2 between reporting periods as a result of applying this process. Level 1 securities of foreign issuers are primarily American Depositary Receipts (ADRs), Public Limited Companies (PLCs) or Global Depositary Receipts (GDRs). There were no transfers into or out of level 3 during the reporting period.
See accompanying notes to financial statements. | ||||
DECEMBER 31, 2017 |
|
29 |
|
|
OBJECTIVE & STRATEGY
The objective of the Sit Midcap® Growth Fund is to maximize long-term capital appreciation. The Fund pursues this objective by investing at least 80% of its net assets in common stocks that, at the time of purchase, have market capitalizations that fall within the range of companies included in the Russell Midcap® Growth Index during the most recent 12-month period. The Russell Midcap® Growth Index ranged from approximately $50 million to $86 billion during the 12-month period ended December 31, 2017.
The Sit Mid Cap Growth Fund’s return for the second half of 2017 was +5.96%, compared to +12.45% for the Russell Midcap® Growth Index and +9.75% for the Russell Midcap® Index.
Mid cap stocks posted solid gains over the second half of 2017, as the “Goldilocks” environment of solid economic growth and moderate inflation bolstered investor sentiment. While higher interest rates may pose a risk to equity valuations at some point, we believe the backdrop for corporate earnings will remain supportive of further gains for stocks in the year ahead. This backdrop has been augmented by the passage of the Tax Cuts and Jobs Act, which we believe represents an additional catalyst for equities over the near- to intermediate term. This bill is significant enough to alter the investment landscape as investors sort through relative winners and losers from the key provisions. We believe the finance sector (particularly banks and life insurers) stands to gain the most, as many companies currently pay high tax rates and have leverage to an uptick in economic growth and higher interest rates. Producer manufacturing firms should see improved growth from lower tax rates, repatriated cash, and significant investment incentives contained in the bill. Accordingly, we have opportunistically added to both of these sectors over the past several months. We continue to emphasize technology within the Fund, as we believe many companies within the sector will continue to benefit from strong cyclical (e.g., improving business spending) and secular (e.g., e-commerce, wireless communications) growth.
Over the past six-months, the Fund significantly lagged the return for the Russell Midcap® Growth Index. Stock selection was the primary factor. Retail Trade was the most significant underperforming sector, as our positions in Ulta Beauty and TJX Companies significantly lagged the index sector return. While we are disappointed with the near-term performance, we are strong believers in both companies in light of their strong business models, proven management teams, and leverage to corporate tax reform. Other sectors that lagged over the period included health technology and technology services, as positions in Allergan PLC, DexCom, Celgene, Priceline, Euronet Worldwide, and Ultimate Software trailed the benchmark. On a posi-
HYPOTHETICAL GROWTH OF $10,000
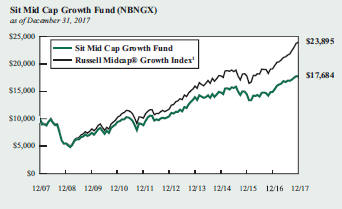
The chart above illustrates the total value of a hypothetical $10,000 investment in the Fund over the past 10 years as compared to the performance of the Russell Midcap® Growth Index. Past performance does not guarantee future results. Returns include the reinvestment of distributions. The chart does not reflect the deduction of taxes that a shareholder would pay on Fund distributions or the redemption of Fund shares.
1 Russell Midcap® Growth Index is an unmanaged index that measures the performance of those Russell Midcap Index companies with higher price-to-book ratios and higher forecasted growth values. It is not possible to invest directly in an index. This is the Fund’s primary index.
tive note, sectors that added to relative performance were consumer services, energy minerals, and consumer non-durables. In terms of individual stocks, the top six-month performers included Arista Networks, Marriott International, Applied Materials, Orbital ATK, and Align technology.
Our research staff remains highly focused on improving performance, and we continue to focus on attractive long-term growth companies in the mid-cap universe. We continue to appreciate shareholders’ interest in the Fund.
Roger J. Sit
Kent L. Johnson
Robert W. Sit
Portfolio Managers
30 | SIT MUTUAL FUNDS SEMI-ANNUAL REPORT | |
COMPARATIVE RATES OF RETURNS
as of December 31, 2017
Sit Mid Cap | Russell Midcap® Growth Index 1 | Russell Midcap® Index 2 | |||||||||||||
Six Month | 5.96 | % | 12.45 | % | 9.75 | % | |||||||||
One Year | 19.01 | 25.27 | 18.52 | ||||||||||||
Five Year | 11.16 | 15.30 | 14.96 | ||||||||||||
Ten Year | 5.87 | 9.10 | 9.11 | ||||||||||||
Since Inception (9/2/82) | 11.53 | n/a | n/a | ||||||||||||
Performance figures are historical and do not guarantee future results. Investment returns and principal value will vary, and you may have a gain or loss when you sell shares. Current performance may be lower or higher than the performance data quoted. Contact the Fund for performance data current to the most recent month-end. Returns include changes in share price as well as reinvestment of all dividends and capital gains and all fee waivers. Without the fee waivers total return and yield figures would have been lower. Returns do not reflect the deduction of the 2% redemption fee imposed if shares are redeemed or exchanged within 30 calendar days from their date of purchase. If imposed, the fee would reduce the performance quoted. Returns do not reflect the deduction of taxes that a shareholder would pay on Fund distributions or the redemption of Fund shares. Management fees and administrative expenses are included in the Fund’s performance. Returns for periods greater than one year are compounded average annual rates of return.
1 Russell Midcap® Growth Index is an unmanaged index that measures the performance of those Russell Midcap Index companies with higher price-to-book ratios and higher forecasted growth values. It is not possible to invest directly in an index.
2 Russell Midcap® Index is an unmanaged index that measures the performance of approximately 800 of the smallest companies in the Russell 1000® Index.
PORTFOLIO SUMMARY
Net Asset Value 12/31/17: | $18.36 Per Share | |
Net Asset Value 6/30/17: | $18.06 Per Share | |
Total Net Assets: | $159.5 Million | |
Weighted Average Market Cap: | $24.5 Billion | |
TOP 10 HOLDINGS
1. Broadcom, Ltd.
2. Arista Networks, Inc.
3. TJX Cos., Inc.
4. Applied Materials, Inc.
5. Waste Connections, Inc.
6. Ecolab, Inc.
7. Marriott International, Inc.
8. priceline.com, Inc.
9. Skyworks Solutions, Inc.
10. Ulta Beauty, Inc.
Based on total net assets as of December 31, 2017. Subject to change.
FUND DIVERSIFICATION
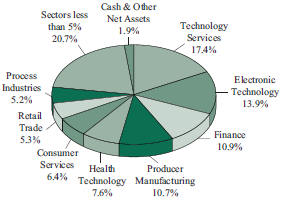
Based on total net assets as of December 31, 2017. Subject to change.
DECEMBER 31, 2017 |
|
31 |
|
SCHEDULE OF INVESTMENTS (Unaudited)
December 31, 2017
Sit Mid Cap Growth Fund
Name of Issuer | Quantity | Fair Value ($) | ||||||
Common Stocks - 98.1% |
| |||||||
Commercial Services - 1.7% |
| |||||||
Booz Allen Hamilton Holding Corp. | 37,900 | 1,445,127 | ||||||
Brink’s Co. | 16,500 | 1,298,550 | ||||||
|
| |||||||
| 2,743,677 | ||||||||
|
| |||||||
Communications - 1.3% | ||||||||
CenturyLink, Inc. | 56,400 | 940,752 | ||||||
SBA Communications Corp. * | 7,100 | 1,159,856 | ||||||
|
| |||||||
| 2,100,608 | ||||||||
|
| |||||||
Consumer Durables - 3.7% | ||||||||
Electronic Arts, Inc. * | 20,000 | 2,101,200 | ||||||
Snap-On, Inc. | 10,400 | 1,812,720 | ||||||
Thor Industries, Inc. | 13,400 | 2,019,648 | ||||||
|
| |||||||
| 5,933,568 | ||||||||
|
| |||||||
Consumer Non-Durables - 2.1% | ||||||||
Coca-Cola European Partners, PLC | 40,700 | 1,621,895 | ||||||
Pinnacle Foods, Inc. | 28,100 | 1,671,107 | ||||||
|
| |||||||
| 3,293,002 | ||||||||
|
| |||||||
Consumer Services - 6.4% | ||||||||
Cinemark Holdings, Inc. | 43,500 | 1,514,670 | ||||||
Dunkin’ Brands Group, Inc. | 49,400 | 3,184,818 | ||||||
Marriott International, Inc. | 27,532 | 3,736,919 | ||||||
Service Corp. International | 48,900 | 1,824,948 | ||||||
|
| |||||||
| 10,261,355 | ||||||||
|
| |||||||
Electronic Technology - 13.9% | ||||||||
Advanced Micro Devices, Inc. * | 120,000 | 1,233,600 | ||||||
Applied Materials, Inc. | 79,600 | 4,069,152 | ||||||
Arista Networks, Inc. * | 20,000 | 4,711,600 | ||||||
Broadcom, Ltd. | 19,400 | 4,983,860 | ||||||
Ciena Corp. * | 37,900 | 793,247 | ||||||
Cognex Corp. | 14,300 | 874,588 | ||||||
MACOM Tech Solutions Holdings, Inc. * | 27,200 | 885,088 | ||||||
NVIDIA Corp. | 5,100 | 986,850 | ||||||
Skyworks Solutions, Inc. | 38,300 | 3,636,585 | ||||||
|
| |||||||
| 22,174,570 | ||||||||
|
| |||||||
Energy Minerals - 1.6% | ||||||||
Marathon Petroleum Corp. | 39,010 | 2,573,880 | ||||||
|
| |||||||
Finance - 10.9% | ||||||||
Affiliated Managers Group, Inc. | 11,400 | 2,339,850 | ||||||
Ameriprise Financial, Inc. | 7,800 | 1,321,866 | ||||||
Arthur J Gallagher & Co. | 18,900 | 1,195,992 | ||||||
First Republic Bank | 23,600 | 2,044,704 | ||||||
Intercontinental Exchange, Inc. | 28,500 | 2,010,960 | ||||||
Legg Mason, Inc. | 53,000 | 2,224,940 | ||||||
Lincoln National Corp. | 15,700 | 1,206,859 | ||||||
Physicians Realty Trust | 76,400 | 1,374,436 | ||||||
SVB Financial Group * | 8,800 | 2,057,176 | ||||||
Name of Issuer | Quantity | Fair Value ($) | ||||||
T Rowe Price Group, Inc. | 7,800 | 818,454 | ||||||
Western Alliance Bancorp * | 13,400 | 758,708 | ||||||
|
| |||||||
| 17,353,945 | ||||||||
|
| |||||||
Health Services - 3.6% | ||||||||
Centene Corp. * | 23,000 | 2,320,240 | ||||||
Envision Healthcare Corp. * | 20,200 | 698,112 | ||||||
HealthSouth Corp. * | 30,100 | 1,487,241 | ||||||
Patterson Cos, Inc. | 32,600 | 1,177,838 | ||||||
|
| |||||||
| 5,683,431 | ||||||||
|
| |||||||
Health Technology - 7.6% | ||||||||
Alexion Pharmaceuticals, Inc. * | 7,900 | 944,761 | ||||||
Align Technology, Inc. * | 10,800 | 2,399,652 | ||||||
Allergan, PLC | 8,100 | 1,324,998 | ||||||
Celgene Corp. * | 10,600 | 1,106,216 | ||||||
Incyte Corp. * | 15,500 | 1,468,005 | ||||||
Jazz Pharmaceuticals, PLC * | 5,700 | 767,505 | ||||||
Thermo Fisher Scientific, Inc. | 17,250 | 3,275,430 | ||||||
West Pharmaceutical Services, Inc. | 8,300 | 818,961 | ||||||
|
| |||||||
| 12,105,528 | ||||||||
|
| |||||||
Industrial Services - 2.5% | ||||||||
Waste Connections, Inc. | 57,150 | 4,054,221 | ||||||
|
| |||||||
Process Industries - 5.2% | ||||||||
Ecolab, Inc. | 28,700 | 3,850,966 | ||||||
International Paper Co. | 25,100 | 1,454,294 | ||||||
Scotts Miracle-Gro Co. | 27,600 | 2,952,924 | ||||||
|
| |||||||
| 8,258,184 | ||||||||
|
| |||||||
Producer Manufacturing - 10.7% | ||||||||
Adient, PLC | 9,889 | 778,264 | ||||||
AMETEK, Inc. | 24,000 | 1,739,280 | ||||||
Anixter International, Inc. * | 25,586 | 1,944,536 | ||||||
Carlisle Cos., Inc. | 17,700 | 2,011,605 | ||||||
Hubbell, Inc. | 9,300 | 1,258,662 | ||||||
Ingersoll-Rand, PLC | 31,700 | 2,827,323 | ||||||
Orbital ATK, Inc. | 12,100 | 1,591,150 | ||||||
Oshkosh Corp. | 8,800 | 799,832 | ||||||
Parker-Hannifin Corp. | 10,400 | 2,075,632 | ||||||
Rockwell Automation, Inc. | 8,000 | 1,570,800 | ||||||
Watsco, Inc. | 2,325 | 395,343 | ||||||
|
| |||||||
| 16,992,427 | ||||||||
|
| |||||||
Retail Trade - 5.3% | ||||||||
Casey’s General Stores, Inc. | 7,300 | 817,162 | ||||||
TJX Cos., Inc. | 55,300 | 4,228,238 | ||||||
Ulta Beauty, Inc. * | 15,600 | 3,489,096 | ||||||
|
| |||||||
| 8,534,496 | ||||||||
|
| |||||||
Technology Services - 17.4% | ||||||||
ANSYS, Inc. * | 15,700 | 2,317,163 | ||||||
Aspen Technology, Inc. * | 33,000 | 2,184,600 | ||||||
Autodesk, Inc. * | 17,900 | 1,876,457 | ||||||
See accompanying notes to financial statements. | ||||
32 |
|
SIT MUTUAL FUNDS SEMI-ANNUAL REPORT |
|
Name of Issuer | Quantity | Fair Value ($) | ||||||
Cognizant Technology Solutions Corp. | 32,800 | 2,329,456 | ||||||
DST Systems, Inc. | 26,700 | 1,657,269 | ||||||
Euronet Worldwide, Inc. * | 31,275 | 2,635,544 | ||||||
Genpact, Ltd. | 30,300 | 961,722 | ||||||
Guidewire Software, Inc. * | 16,300 | 1,210,438 | ||||||
LogMeIn, Inc. | 16,400 | 1,877,800 | ||||||
priceline.com, Inc. * | 2,150 | 3,736,141 | ||||||
PTC, Inc. * | 39,600 | 2,406,492 | ||||||
Splunk, Inc. * | 25,200 | 2,087,568 | ||||||
Ultimate Software Group, Inc. * | 11,200 | 2,444,176 | ||||||
|
| |||||||
| 27,724,826 | ||||||||
|
| |||||||
Transportation - 3.0% | ||||||||
Alaska Air Group, Inc. | 40,100 | 2,947,751 | ||||||
XPO Logistics, Inc. * | 20,900 | 1,914,231 | ||||||
|
| |||||||
| 4,861,982 | ||||||||
|
| |||||||
Name of Issuer | Quantity | Fair Value ($) | ||||||
Utilities - 1.2% | ||||||||
WEC Energy Group, Inc. | 27,800 | 1,846,754 | ||||||
|
| |||||||
Total Common Stocks | 156,496,454 | |||||||
|
| |||||||
Short-Term Securities - 1.6% | ||||||||
Fidelity Inst. Money Mkt. Gvt. Fund, 1.14% | 2,512,867 | 2,512,867 | ||||||
|
| |||||||
(cost: $2,512,867) | ||||||||
Total Investments in Securities - 99.7% | 159,009,321 | |||||||
Other Assets and Liabilities, net - 0.3% | 479,335 | |||||||
|
| |||||||
Total Net Assets - 100.0% | $159,488,656 | |||||||
|
| |||||||
| * | Non-income producing security. |
Numeric footnotes not disclosed are not applicable to this Schedule of Investments.
PLC — Public Limited Company |
A summary of the levels for the Fund’s investments as of December 31, 2017 is as follows (see Note 2 - significant accounting policies in the notes to financial statements):
Investment in Securities | ||||||||||||
| Level 1 Quoted Price ($) | Level 2 Other significant | Level 3 Significant unobservable inputs ($) | Total ($) | |||||||||
Common Stocks ** | 156,496,454 | — | — | 156,496,454 | ||||||||
Short-Term Securities | 2,512,867 | — | — | 2,512,867 | ||||||||
Total: | 159,009,321 | — | — | 159,009,321 | ||||||||
| ** | For equity securities categorized in a single level, refer to the Schedule of Investments for further breakdown. |
For the reporting period, there were no transfers between levels 1, 2 and 3.
See accompanying notes to financial statements. | ||||
DECEMBER 31, 2017 |
|
33 |
|
Sit Small Cap Dividend Growth Fund Class I and Class S
|
OBJECTIVE & STRATEGY
The objective of the Sit Small Cap Dividend Growth Fund is to provide current income that exceeds the Fund’s benchmark index and that grows over a period of years. Secondarily the Fund seeks long-term capital appreciation. The Fund seeks to achieve its objectives by investing, under normal market conditions, at least 80% of its net assets in small cap dividend-paying common stocks that have market capitalizations at the time of purchase of up to $3.0 billion, or up to the market capitalization of the largest company included in the Russell 2000® Index measured at the end of the previous twelve months ($16.0 billion as of December 31, 2017). The Fund may invest the balance of its assets in preferred stocks, convertible bonds, U.S. Treasury securities (including Treasury bills, notes and bonds), closed-end investment companies, and master limited partnerships.
The Sit Small Cap Dividend Growth Fund Class I posted a +9.23% return over the past six months, compared to the +9.20% return for the Russell 2000® Index. The Fund’s gross yield (before deducting Fund expenses) was 1.91%, compared to 1.25% for the Russell 2000® Index.
Investor sentiment toward small capitalization stocks improved over the second half of 2017, aided by an uptick in economic growth and the passage of tax reform late in the year. While small cap stocks generally lagged their larger cap brethren over past year, it is important to note that small cap stocks stand to benefit disproportionately (relative to larger cap stocks) from tax reform and other policy initiatives, including deregulation and increased infrastructure spending. These initiatives will clearly favor U.S. focused companies that tend to fall within the small cap universe. Accordingly, we have shifted portfolio sector weightings towards stocks and sectors most levered to a combination of improving growth and leverage to tax reform. Within the finance sector, for example, we have reduced positions in REITs (which tend to lag when interest rates rise) and added to bank positions. We believe banks are the greatest beneficiary of policy changes (e.g., tax reform, deregulation) and are levered to an improving economic backdrop, including higher interest rates. In addition, we have added to the producer manufacturing sector, as many companies within the sector will benefit from lower taxes, higher commodity prices, and a sharp acceleration in capital spending, which will be aided by investment incentives (i.e., accelerated depreciation) within the new tax code. While we are hopeful that pro-growth policies will catalyze economic growth (and corporate earnings growth) for many companies held in the Fund, we recognize the risks, particularly higher interest rates, could derail this positive backdrop as the year progresses. We believe downside risks can be mitigated with a focus on quality firms that pay consistent dividends to shareholders.
The Fund outperformed the Russell 2000® Index over the past six months. Strong stock selection in the electronic technology sector was a key factor, led by a +41% gain in MKS Instruments. In addition, the Fund’s finance sector significantly outperformed the benchmark sector, led by strong gains in Piper Jaffrey, Kingstone, Evercore, and Janus Henderson. Underweighting REITs, which lagged
HYPOTHETICAL GROWTH OF $10,000
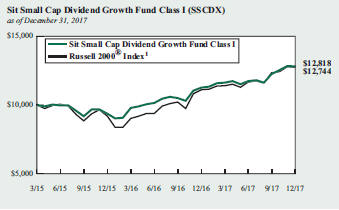
The chart above illustrates the total value of a hypothetical $10,000 investment in the Fund over the past 10 years as compared to the performance of the Russell 2000® Index. Past performance does not guarantee future results. Returns include the reinvestment of distributions. The chart does not reflect the deduction of taxes that a shareholder would pay on Fund distributions or the redemption of Fund shares.
1 Russell 2000® Index is an unmanaged index that measures the performance of the 2,000 smallest companies in the Russell 3000® Index, an index consisting of the 3,000 largest U.S. companies based on market capitalization. It is not possible to invest directly in an index. This is the Fund’s primary index.
during the period, also aided relative returns. Sectors that lagged the Russell 2000® over the period included health technology, consumer services, and consumer non-durables. Within the health technology sector, a key reason for underperformance was the Fund’s lack of exposure to the biotechnology industry, which turned in very strong performance over the past six months.
We strongly believe in the merits of the Sit Small Cap Dividend Growth strategy, as we focus on high quality, well managed firms with strong financial characteristics and management teams committed to returning capital to shareholders. We appreciate our investors’ interest in the Fund.
Roger J. Sit Michael T. Manns
Kent L. Johnson Robert W. Sit
Portfolio Managers
34 | SIT MUTUAL FUNDS SEMI-ANNUAL REPORT | |
COMPARATIVE RATES OF RETURNS
as of December 31, 2017
| Sit Small Cap Dividend Growth Fund | |||||||||||||||
Russell 2000® | |||||||||||||||
| Class I | Class S | ||||||||||||||
Six Month | 9.23 | % | 9.13 | % | 9.20 | % | |||||||||
One Year | 13.69 | 13.42 | 14.65 | ||||||||||||
Since Inception | 9.42 | 9.16 | 9.20 | ||||||||||||
Performance figures are historical and do not guarantee future results. Investment returns and principal value will vary, and you may have a gain or loss when you sell shares. Current performance may be lower or higher than the performance data quoted. Contact the Fund for performance data current to the most recent month-end. Returns include changes in share price as well as reinvestment of all dividends and capital gains. Returns do not reflect the deduction of the 2% redemption fee imposed if shares are redeemed or exchanged within 30 calendar days from their date of purchase. If imposed, the fee would reduce the performance quoted. Returns do not reflect the deduction of taxes that a shareholder would pay on Fund distributions or the redemption of Fund shares. Management fees and administrative expenses are included in the Fund’s performance. Returns for periods greater than one year are compounded average annual rates of return.
1 Russell 2000® Index is an unmanaged index that measures the performance of the 2,000 smallest companies in the Russell 3000® Index, an index consisting of the 3,000 largest U.S. companies based on market capitalization. It is not possible to directly invest in an index.
PORTFOLIO SUMMARY
Class I: | ||||
Net Asset Value 12/31/17: | $12.44 Per Share | |||
Net Asset Value 6/30/17: | $11.47 Per Share | |||
Total Net Assets: | $14.9 Million | |||
Class S: | ||||
Net Asset Value 12/31/17: | $12.44 Per Share | |||
Net Asset Value 6/30/17: | $11.46 Per Share | |||
Total Net Assets: | $4.0 Million | |||
Weighted Average Market Cap: | $4.3 Billion | |||
TOP 10 HOLDINGS
1. MKS Instruments, Inc.
2. East West Bancorp, Inc.
3. Provident Financial Services, Inc.
4. Thor Industries, Inc.
5. Scotts Miracle-Gro Co.
6. Legg Mason, Inc.
7. Dunkin’ Brands Group, Inc.
8.Wintrust Financial Corp.
9. Camping World Holdings, Inc.
10. Oshkosh Corp.
Based on total net assets as of December 31, 2017. Subject to change.
FUND DIVERSIFICATION
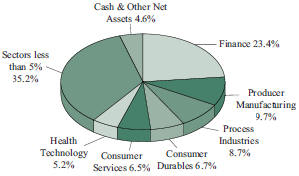
Based on total net assets as of December 31, 2017. Subject to change.
DECEMBER 31, 2017 | 35 |
SCHEDULE OF INVESTMENTS (Unaudited)
December 31, 2017
Sit Small Cap Dividend Growth Fund
Name of Issuer | Quantity | Fair Value ($) | ||||||
Common Stocks - 94.7% |
| |||||||
Commercial Services - 4.6% |
| |||||||
Booz Allen Hamilton Holding Corp. | 6,575 | 250,705 | ||||||
Brink’s Co. | 1,850 | 145,595 | ||||||
Deluxe Corp. | 3,350 | 257,414 | ||||||
Herman Miller, Inc. | 5,325 | 213,266 | ||||||
|
| |||||||
| 866,980 | ||||||||
|
| |||||||
Communications - 1.4% |
| |||||||
Shenandoah Telecommunications Co. | 7,900 | 267,020 | ||||||
|
| |||||||
Consumer Durables - 6.7% |
| |||||||
Ethan Allen Interiors, Inc. | 6,600 | 188,760 | ||||||
National Presto Industries, Inc. | 1,875 | 186,469 | ||||||
Snap-On, Inc. | 800 | 139,440 | ||||||
Tenneco, Inc. | 2,250 | 131,715 | ||||||
Thor Industries, Inc. | 2,300 | 346,656 | ||||||
Toro Co. | 1,925 | 125,568 | ||||||
Tupperware Brands Corp. | 2,350 | 147,345 | ||||||
|
| |||||||
| �� | 1,265,953 | |||||||
|
| |||||||
Consumer Non-Durables - 4.3% |
| |||||||
B&G Foods, Inc. | 4,350 | 152,902 | ||||||
Carter’s, Inc. | 900 | 105,741 | ||||||
Fresh Del Monte Produce, Inc. | 2,800 | 133,476 | ||||||
Pinnacle Foods, Inc. | 3,650 | 217,066 | ||||||
Sensient Technologies Corp. | 2,800 | 204,820 | ||||||
|
| |||||||
| 814,005 | ||||||||
|
| |||||||
Consumer Services - 6.5% |
| |||||||
Capella Education Co. | 3,075 | 238,005 | ||||||
Cinemark Holdings, Inc. | 4,925 | 171,488 | ||||||
Dunkin’ Brands Group, Inc. | 4,825 | 311,068 | ||||||
Nexstar Media Group, Inc. | 725 | 56,695 | ||||||
Service Corp. International | 6,250 | 233,250 | ||||||
Vail Resorts, Inc. | 1,025 | 217,782 | ||||||
|
| |||||||
| 1,228,288 | ||||||||
|
| |||||||
Electronic Technology - 4.9% |
| |||||||
MKS Instruments, Inc. | 4,600 | 434,700 | ||||||
Monolithic Power Systems, Inc. | 2,425 | 272,473 | ||||||
Power Integrations, Inc. | 3,150 | 231,682 | ||||||
|
| |||||||
| 938,855 | ||||||||
|
| |||||||
Energy Minerals - 0.7% |
| |||||||
Vermilion Energy, Inc. | 3,650 | 132,568 | ||||||
|
| |||||||
Finance - 23.4% |
| |||||||
CoBiz Financial, Inc. | 7,375 | 147,426 | ||||||
Columbia Banking System, Inc. | 3,850 | 167,244 | ||||||
CubeSmart | 3,325 | 96,159 | ||||||
Donegal Group, Inc. | 6,200 | 107,260 | ||||||
East West Bancorp, Inc. | 6,900 | 419,727 | ||||||
Evercore Partners, Inc. | 2,375 | 213,750 | ||||||
Farmland Partners, Inc. | 7,275 | 63,147 | ||||||
Name of Issuer | Quantity | Fair Value ($) | ||||||
Great Western Bancorp, Inc. | 4,400 | 175,120 | ||||||
Hanover Insurance Group, Inc. | 825 | 89,166 | ||||||
Hercules Capital, Inc. | 7,250 | 95,120 | ||||||
Janus Henderson Group,PLC | 3,678 | 140,720 | ||||||
Kingstone Cos, Inc. | 9,800 | 184,240 | ||||||
Legg Mason, Inc. | 7,600 | 319,048 | ||||||
Macquarie Infrastructure Corp. | 2,050 | 131,610 | ||||||
Mercury General Corp. | 1,400 | 74,816 | ||||||
Old National Bancorp | 4,750 | 82,888 | ||||||
PacWest Bancorp | 5,325 | 268,380 | ||||||
Physicians Realty Trust | 15,300 | 275,247 | ||||||
Piper Jaffray Cos | 2,875 | 247,969 | ||||||
Provident Financial Services, Inc. | 15,000 | 404,550 | ||||||
QTS Realty Trust, Inc. | 2,600 | 140,816 | ||||||
STORE Capital Corp. | 5,200 | 135,408 | ||||||
Validus Holdings, Ltd. | 3,500 | 164,220 | ||||||
Wintrust Financial Corp. | 3,500 | 288,295 | ||||||
|
| |||||||
| 4,432,326 | ||||||||
|
| |||||||
Health Services - 3.5% |
| |||||||
Healthcare Services Group, Inc. | 3,625 | 191,110 | ||||||
HealthSouth Corp. * | 5,550 | 274,225 | ||||||
Patterson Cos, Inc. | 5,300 | 191,489 | ||||||
|
| |||||||
| 656,824 | ||||||||
|
| |||||||
Health Technology - 5.2% |
| |||||||
Mesa Laboratories, Inc. | 1,350 | 167,805 | ||||||
PerkinElmer, Inc. | 1,675 | 122,476 | ||||||
Phibro Animal Health Corp. | 7,400 | 247,900 | ||||||
STERIS, PLC | 2,500 | 218,675 | ||||||
Teleflex, Inc. | 525 | 130,630 | ||||||
West Pharmaceutical Services, Inc. | 950 | 93,736 | ||||||
|
| |||||||
| 981,222 | ||||||||
|
| |||||||
Industrial Services - 1.2% |
| |||||||
EMCOR Group, Inc. | 1,900 | 155,325 | ||||||
KBR, Inc. | 3,375 | 66,926 | ||||||
|
| |||||||
| 222,251 | ||||||||
|
| |||||||
Non-Energy Minerals - 1.0% |
| |||||||
Commercial Metals Co. | 3,950 | 84,214 | ||||||
Potlatch Corp. | 2,000 | 99,800 | ||||||
|
| |||||||
| 184,014 | ||||||||
|
| |||||||
Process Industries - 8.7% |
| |||||||
Apogee Enterprises, Inc. | 4,325 | 197,782 | ||||||
Avery Dennison Corp. | 1,900 | 218,234 | ||||||
Domtar Corp. | 3,575 | 177,034 | ||||||
Huntsman Corp. | 4,650 | 154,798 | ||||||
Ingredion, Inc. | 1,375 | 192,225 | ||||||
Neenah, Inc. | 1,550 | 140,508 | ||||||
See accompanying notes to financial statements. | ||||
36 |
|
SIT MUTUAL FUNDS SEMI-ANNUAL REPORT |
|
Name of Issuer | Quantity | Fair Value ($) | ||||||
Orion Engineered Carbons SA | 9,475 | 242,560 | ||||||
Scotts Miracle-Gro Co. | 3,025 | 323,645 | ||||||
|
| |||||||
| 1,646,786 | ||||||||
|
| |||||||
Producer Manufacturing - 9.7% |
| |||||||
Anixter International, Inc. * | 1,900 | 144,400 | ||||||
Applied Industrial Technologies, Inc. | 3,250 | 221,325 | ||||||
Carlisle Cos, Inc. | 1,700 | 193,205 | ||||||
Crane Co. | 2,100 | 187,362 | ||||||
Hubbell, Inc. | 1,375 | 186,092 | ||||||
Lincoln Electric Holdings, Inc. | 1,250 | 114,475 | ||||||
MSA Safety, Inc. | 2,400 | 186,048 | ||||||
MTS Systems Corp. | 2,625 | 140,962 | ||||||
Oshkosh Corp. | 3,100 | 281,759 | ||||||
Watsco, Inc. | 1,075 | 182,793 | ||||||
|
| |||||||
| 1,838,421 | ||||||||
|
| |||||||
Retail Trade - 3.3% |
| |||||||
Big Lots, Inc. | 3,325 | 186,699 | ||||||
Camping World Holdings, Inc. | 6,400 | 286,272 | ||||||
Casey’s General Stores, Inc. | 1,350 | 151,119 | ||||||
|
| |||||||
| 624,090 | ||||||||
|
| |||||||
Technology Services - 4.2% |
| |||||||
Blackbaud, Inc. | 2,150 | 203,154 | ||||||
DST Systems, Inc. | 3,900 | 242,073 | ||||||
LogMeIn, Inc. | 1,900 | 217,550 | ||||||
ManTech International Corp. | 2,700 | 135,513 | ||||||
|
| |||||||
| 798,290 | ||||||||
|
| |||||||
Name of Issuer | Quantity | Fair Value ($) | ||||||
Transportation - 2.4% |
| |||||||
Alaska Air Group, Inc. | 2,650 | 194,802 | ||||||
Golar LNG, Ltd. | 4,725 | 140,852 | ||||||
Ryder System, Inc. | 1,350 | 113,630 | ||||||
|
| |||||||
| 449,284 | ||||||||
|
| |||||||
Utilities - 3.0% |
| |||||||
Black Hills Corp. | 2,000 | 120,220 | ||||||
Connecticut Water Service, Inc. | 1,550 | 88,986 | ||||||
Covanta Holding Corp. | 6,300 | 106,470 | ||||||
New Jersey Resources Corp. | 3,775 | 151,755 | ||||||
Spire, Inc. | 1,375 | 103,331 | ||||||
|
| |||||||
| 570,762 | ||||||||
|
| |||||||
Total Common Stocks | 17,917,939 | |||||||
|
| |||||||
Investment Companies - 0.7% |
| |||||||
Tortoise Energy Infrastructure Corp. | 4,800 | 139,584 | ||||||
|
| |||||||
(cost: $157,933) | ||||||||
Short-Term Securities - 5.7% |
| |||||||
Fidelity Inst. Money Mkt. Gvt. Fund, 1.14% | 1,070,115 | 1,070,115 | ||||||
|
| |||||||
(cost: $1,070,115) | ||||||||
Total Investments in Securities - 101.1% |
| 19,127,638 | ||||||
Other Assets and Liabilities, net - (1.1%) |
| (214,467 | ) | |||||
|
| |||||||
Total Net Assets - 100.0% | $ | 18,913,171 | ||||||
|
| |||||||
| * | Non-income producing security. |
Numeric footnotes not disclosed are not applicable to this Schedule of Investments.
PLC — Public Limited Company
A summary of the levels for the Fund’s investments as of December 31, 2017 is as follows (see Note 2 - significant accounting policies in the notes to financial statements):
| Investment in Securities | ||||||||||||
| Level 1 Quoted Price ($) | Level 2 Other significant observable inputs ($) | Level 3 Significant unobservable inputs ($) | Total ($) | |||||||||
Common Stocks ** | 17,917,939 | — | — | 17,917,939 | ||||||||
Investment Companies | 139,584 | — | — | 139,584 | ||||||||
Short-Term Securities | 1,070,115 | — | — | 1,070,115 | ||||||||
Total: | 19,127,638 | — | — | 19,127,638 | ||||||||
| ** | For equity securities categorized in a single level, refer to the Schedule of Investments for further breakdown. |
For the reporting period, there were no transfers between levels 1, 2 and 3.
See accompanying notes to financial statements. | ||||
DECEMBER 31, 2017 |
|
37 |
|
|
OBJECTIVE & STRATEGY
The objective of the Sit Small Cap Growth Fund is to maximize long-term capital appreciation. The Fund seeks to achieve its objective by investing, under normal market conditions, at least 80% of its net assets in common stocks of companies with market capitalizations at the time of purchase of up to $3.0 billion, or up to the market capitalization of the largest company included in the Russell 2000® Index measured at the end of the previous twelve months ($16.0 billion as of December 31, 2017).
The Adviser invests in a diversified group of growing small companies it believes exhibit the potential for superior growth. The Adviser believes that a company’s earnings growth is the primary determinant of its potential long-term return and evaluates a company’s potential for above average long-term earnings and revenue growth.
The Sit Small Cap Growth Fund returned +7.64% over the past six months. This compares to the return of +11.09% for the Russell 2000® Growth Index and the +9.20% return for the Russell 2000® Index.
Small capitalization stocks rallied sharply over the past six months, fueled by a combination of strong corporate earnings, moderate inflation trends, and the prospect of tax reform. As valuations for smaller companies are elevated compared to historical levels, we believe earnings growth must be the main driver of returns going forward. The passage of the Tax Cuts and Jobs Act in December will have a significant impact, on small companies, in particular, given their domestic orientation. A roll back in taxes and regulation could allow for a significantly improved growth outlook for many companies. Our investment staff is focusing on which companies/sectors appear to be best positioned for these changes. We have increased exposure to banks and producer manufacturing sectors, for example, as these are cyclical groups that are strongly levered to a lower tax rate, reduced regulations, and investment spending incentives. In addition to these cyclical groups, the Fund continues to have significant exposure to secular growth sectors, including technology services and health technology, which remain the heaviest sector weightings within the Fund. The Fund holds only small weightings in utilities, communications, and energy minerals, as we believe these sectors will not generate above-average growth over the near-term.
The Fund underperformed the Russell 2000® Growth Index during the second half of 2017, largely due to stock selection in several sectors. Relative performance was negatively impacted by stock selection in the producer manufacturing, retail trade, health services, consumer services, and health technology sectors. Ulta Beauty, K2M Group, First Republic Bank, MACOM Technology, and Acadia Healthcare were among the individual stocks that lagged during the second half of 2017. On the positive side, the Fund benefited from strong stock selection in the consumer durables and electronic technology sectors. In terms of individual stocks, the top contributors to
HYPOTHETICAL GROWTH OF $10,000

The chart above illustrates the total value of a hypothetical $10,000 investment in the Fund over the past 10 years as compared to the performance of the Russell 2000® Growth Index. Past performance does not guarantee future results. Returns include the reinvestment of distributions. The chart does not reflect the deduction of taxes that a shareholder would pay on Fund distributions or the redemption of Fund shares.
1 Russell 2000® Growth Index is an unmanaged index that measures the performance of those Russell 2000 Index companies with higher price-to-book ratios and higher forecasted growth values. It is not possible to invest directly in an index. This is the Fund’s primary index.
the Fund return during the period included Arista Networks, Take-Two Interactive, Thor Industries, Align Technology, and Camping Worldwide Holdings.
Our research team remains highly focused on improving relative performance. We strongly believe in the long-term outlook for companies held in the Fund, and we believe our focus on tax reform beneficiaries has potential to add value as it is not adequately reflected in share prices of many small cap companies.
| Roger J. Sit | Michael J. Stellmacher | |
| Kent L. Johnson | Robert W. Sit | |
| Portfolio Managers |
38 | SIT MUTUAL FUNDS SEMI-ANNUAL REPORT | |
COMPARATIVE RATES OF RETURNS
as of December 31, 2017
Sit Small Cap Growth | Russell 2000® | Russell 2000® Index 2 | |||||||||||||
Six Month | 7.64 | % | 11.09 | % | 9.20 | % | |||||||||
One Year | 15.71 | 22.17 | 14.65 | ||||||||||||
Five Year | 9.93 | 15.21 | 14.12 | ||||||||||||
Ten Year | 5.88 | 9.19 | 8.71 | ||||||||||||
Since Inception | 10.22 | 8.33 | 9.66 | ||||||||||||
(7/1/94) | |||||||||||||||
Performance figures are historical and do not guarantee future results. Investment returns and principal value will vary, and you may have a gain or loss when you sell shares. Current performance may be lower or higher than the performance data quoted. Contact the Fund for performance data current to the most recent month-end. Returns include changes in share price as well as reinvestment of all dividends and capital gains. Returns do not reflect the deduction of the 2% redemption fee imposed if shares are redeemed or exchanged within 30 calendar days from their date of purchase. If imposed, the fee would reduce the performance quoted. Returns do not reflect the deduction of taxes that a shareholder would pay on Fund distributions or the redemption of Fund shares. Management fees and administrative expenses are included in the Fund’s performance. Returns for periods greater than one year are compounded average annual rates of return.
1 Russell 2000® Growth Index is an unmanaged index that measures the performance of those Russell 2000 Index companies with higher price-to-book ratios and higher forecasted growth values. It is not possible to invest directly in an index.
2 Russell 2000® Index is an unmanaged index that measures the performance of the 2,000 smallest companies in the Russell 3000® Index, an index consisting of the 3,000 largest U.S. companies based on market capitalization.
PORTFOLIO SUMMARY
Net Asset Value 12/31/17: | $54.62 Per Share | |
Net Asset Value 6/30/17: | $54.18 Per Share | |
Total Net Assets: | $95.6 Million | |
Weighted Average Market Cap: | $7.3 Billion |
TOP 10 HOLDINGS
1. Arista Networks, Inc.
2. Take-Two Interactive Software, Inc.
3. Skyworks Solutions, Inc.
4. Waste Connections, Inc.
5. Scotts Miracle-Gro Co.
6. Dunkin’ Brands Group, Inc.
7. Thor Industries, Inc.
8. Euronet Worldwide, Inc.
9. On Assignment, Inc.
10. Booz Allen Hamilton Holding Corp.
Based on total net assets as of December 31, 2017. Subject to change.
FUND DIVERSIFICATION

Based on total net assets as of December 31, 2017. Subject to change.
DECEMBER 31, 2017 |
39 |
SCHEDULE OF INVESTMENTS (Unaudited)
December 31, 2017
Sit Small Cap Growth Fund
| Name of Issuer |
Quantity | Fair Value ($) | ||||||
Common Stocks - 97.7% |
| |||||||
Commercial Services - 4.7% |
| |||||||
Booz Allen Hamilton Holding Corp. | 40,100 | 1,529,013 | ||||||
Brink’s Co. | 9,900 | 779,130 | ||||||
Deluxe Corp. | 8,800 | 676,192 | ||||||
On Assignment, Inc. * | 23,800 | 1,529,626 | ||||||
|
| |||||||
| 4,513,961 | ||||||||
|
| |||||||
Communications - 1.2% |
| |||||||
SBA Communications Corp. * | 2,700 | 441,072 | ||||||
Shenandoah Telecommunications Co. | 22,300 | 753,740 | ||||||
|
| |||||||
| 1,194,812 | ||||||||
|
| |||||||
Consumer Durables - 7.7% |
| |||||||
Century Communities, Inc. * | 23,500 | 730,850 | ||||||
Ethan Allen Interiors, Inc. | 22,600 | 646,360 | ||||||
Snap-On, Inc. | 6,850 | 1,193,955 | ||||||
Take-Two Interactive Software, Inc. * | 20,300 | 2,228,534 | ||||||
Tenneco, Inc. | 14,800 | 866,392 | ||||||
Thor Industries, Inc. | 11,200 | 1,688,064 | ||||||
|
| |||||||
| 7,354,155 | ||||||||
|
| |||||||
Consumer Non-Durables - 1.9% |
| |||||||
B&G Foods, Inc. | 16,900 | 594,035 | ||||||
Pinnacle Foods, Inc. | 21,200 | 1,260,764 | ||||||
|
| |||||||
| 1,854,799 | ||||||||
|
| |||||||
Consumer Services - 6.8% |
| |||||||
Capella Education Co. | 6,575 | 508,905 | ||||||
Cinemark Holdings, Inc. | 25,200 | 877,464 | ||||||
Dunkin’ Brands Group, Inc. | 26,600 | 1,714,902 | ||||||
Grand Canyon Education, Inc. * | 7,500 | 671,475 | ||||||
Nexstar Media Group, Inc. | 3,800 | 297,160 | ||||||
Service Corp. International | 28,600 | 1,067,352 | ||||||
Vail Resorts, Inc. | 6,600 | 1,402,302 | ||||||
|
| |||||||
| 6,539,560 | ||||||||
|
| |||||||
Electronic Technology - 8.8% |
| |||||||
Ambarella, Inc. * | 5,600 | 329,000 | ||||||
Arista Networks, Inc. * | 9,600 | 2,261,568 | ||||||
Ciena Corp. * | 27,000 | 565,110 | ||||||
MACOM Tech Solutions Holdings, Inc. * | 19,000 | 618,260 | ||||||
MKS Instruments, Inc. | 15,750 | 1,488,375 | ||||||
Monolithic Power Systems, Inc. | 9,200 | 1,033,712 | ||||||
Skyworks Solutions, Inc. | 21,900 | 2,079,405 | ||||||
|
| |||||||
| 8,375,430 | ||||||||
|
| |||||||
Energy Minerals - 0.9% |
| |||||||
Andeavor | 7,331 | 838,227 | ||||||
|
| |||||||
Finance - 10.3% | ||||||||
Affiliated Managers Group, Inc. | 6,100 | 1,252,025 | ||||||
East West Bancorp, Inc. | 10,100 | 614,383 | ||||||
First Republic Bank/CA | 16,600 | 1,438,224 | ||||||
| Name of Issuer |
Quantity | Fair Value ($) | ||||||
Legg Mason, Inc. | 31,800 | 1,334,964 | ||||||
PacWest Bancorp | 23,600 | 1,189,440 | ||||||
Physicians Realty Trust | 55,400 | 996,646 | ||||||
QTS Realty Trust, Inc. | 13,200 | 714,912 | ||||||
SVB Financial Group * | 6,400 | 1,496,128 | ||||||
Validus Holdings, Ltd. | 18,400 | 863,328 | ||||||
|
| |||||||
| 9,900,050 | ||||||||
|
| |||||||
Health Services - 3.4% |
| |||||||
Envision Healthcare Corp. * | 11,800 | 407,808 | ||||||
Healthcare Services Group, Inc. | 21,690 | 1,143,497 | ||||||
HealthSouth Corp. * | 16,450 | 812,794 | ||||||
Patterson Cos, Inc. | 23,300 | 841,829 | ||||||
|
| |||||||
| 3,205,928 | ||||||||
|
| |||||||
Health Technology - 12.4% |
| |||||||
Alexion Pharmaceuticals, Inc. * | 4,500 | 538,155 | ||||||
Align Technology, Inc. * | 5,600 | 1,244,264 | ||||||
Bio-Techne Corp. | 5,400 | 699,570 | ||||||
Celgene Corp. * | 5,450 | 568,762 | ||||||
Corcept Therapeutics, Inc. * | 68,100 | 1,229,886 | ||||||
DBV Technologies SA * | 13,400 | 329,640 | ||||||
Exact Sciences Corp. * | 16,800 | 882,672 | ||||||
Ionis Pharmaceuticals, Inc. * | 17,900 | 900,370 | ||||||
K2M Group Holdings, Inc. * | 55,900 | 1,006,200 | ||||||
PerkinElmer, Inc. | 8,400 | 614,208 | ||||||
Phibro Animal Health Corp. | 31,200 | 1,045,200 | ||||||
Sarepta Therapeutics, Inc. * | 19,500 | 1,084,980 | ||||||
STERIS, PLC | 13,800 | 1,207,086 | ||||||
West Pharmaceutical Services, Inc. | 5,000 | 493,350 | ||||||
|
| |||||||
| 11,844,343 | ||||||||
|
| |||||||
Industrial Services - 4.6% |
| |||||||
Advanced Disposal Services, Inc. * | 40,200 | 962,388 | ||||||
EMCOR Group, Inc. | 18,700 | 1,528,725 | ||||||
Waste Connections, Inc. | 27,400 | 1,943,756 | ||||||
|
| |||||||
| 4,434,869 | ||||||||
|
| |||||||
Process Industries - 3.8% |
| |||||||
Apogee Enterprises, Inc. | 22,100 | 1,010,633 | ||||||
Domtar Corp. | 15,800 | 782,416 | ||||||
Scotts Miracle-Gro Co. | 16,800 | 1,797,432 | ||||||
|
| |||||||
| 3,590,481 | ||||||||
|
| |||||||
Producer Manufacturing - 9.9% |
| |||||||
Anixter International, Inc. * | 15,300 | 1,162,800 | ||||||
Applied Industrial Technologies, Inc. | 8,915 | 607,111 | ||||||
Crane Co. | 13,600 | 1,213,392 | ||||||
Hubbell, Inc. | 7,000 | 947,380 | ||||||
IDEX Corp. | 8,100 | 1,068,957 | ||||||
Lincoln Electric Holdings, Inc. | 9,600 | 879,168 | ||||||
MSA Safety, Inc. | 11,000 | 852,720 | ||||||
MTS Systems Corp. | 3,400 | 182,580 | ||||||
Orbital ATK, Inc. | 7,300 | 959,950 | ||||||
See accompanying notes to financial statements. | ||
40 |
SIT MUTUAL FUNDS SEMI-ANNUAL REPORT |
Name of Issuer | Quantity | Fair Value ($) | ||||||
Oshkosh Corp. | 9,900 | 899,811 | ||||||
Watsco, Inc. | 4,000 | 680,160 | ||||||
|
| |||||||
| 9,454,029 | ||||||||
|
| |||||||
Retail Trade - 3.7% |
| |||||||
Big Lots, Inc. | 3,400 | 190,910 | ||||||
Camping World Holdings, Inc. | 33,550 | 1,500,692 | ||||||
Casey’s General Stores, Inc. | 4,300 | 481,342 | ||||||
Ulta Beauty, Inc. * | 5,950 | 1,330,777 | ||||||
|
| |||||||
| 3,503,721 | ||||||||
|
| |||||||
Technology Services - 13.9% |
| |||||||
ANSYS, Inc. * | 5,800 | 856,022 | ||||||
Aspen Technology, Inc. * | 18,900 | 1,251,180 | ||||||
Blackbaud, Inc. | 12,000 | 1,133,880 | ||||||
DST Systems, Inc. | 21,800 | 1,353,126 | ||||||
Euronet Worldwide, Inc. * | 18,300 | 1,542,141 | ||||||
GoDaddy, Inc. * | 12,550 | 631,014 | ||||||
Guidewire Software, Inc. * | 9,700 | 720,322 | ||||||
HubSpot, Inc. * | 6,500 | 574,600 | ||||||
LogMeIn, Inc. | 9,900 | 1,133,550 | ||||||
Paycom Software, Inc. * | 18,300 | 1,470,039 | ||||||
PTC, Inc. * | 19,300 | 1,172,861 | ||||||
Ultimate Software Group, Inc. * | 6,675 | 1,456,685 | ||||||
|
| |||||||
| 13,295,420 | ||||||||
|
| |||||||
| Name of Issuer |
Quantity | Fair Value ($) | ||||||
Transportation - 2.6% |
| |||||||
Alaska Air Group, Inc. | 16,200 | 1,190,862 | ||||||
Atlas Air Worldwide Holdings, Inc. * | 9,600 | 563,040 | ||||||
Marten Transport, Ltd. | 36,333 | 737,560 | ||||||
|
| |||||||
| 2,491,462 | ||||||||
|
| |||||||
Utilities - 1.1% |
| |||||||
Fortis, Inc. | 12,107 | 443,964 | ||||||
Spire, Inc. | 7,525 | 565,504 | ||||||
|
| |||||||
| 1,009,468 | ||||||||
|
| |||||||
Total Common Stocks |
| 93,400,715 | ||||||
|
| |||||||
Short-Term Securities - 2.3% |
| |||||||
Fidelity Inst. Money Mkt. Gvt. Fund, 1.14% | 2,257,288 | 2,257,288 | ||||||
|
| |||||||
(cost: $2,257,288) | ||||||||
Total Investments in Securities - 100.0% |
| 95,658,003 | ||||||
Other Assets and Liabilities, net - 0.0% |
| (23,123 | ) | |||||
|
| |||||||
Total Net Assets - 100.0% |
| $ | 95,634,880 | |||||
|
| |||||||
| * | Non-income producing security. |
Numeric footnotes not disclosed are not applicable to this Schedule of Investments.
PLC — Public Limited Company
A summary of the levels for the Fund’s investments as of December 31, 2017 is as follows (see Note 2 - significant accounting policies in the notes to financial statements):
| Investment in Securities | ||||||||||||
| Level 1 Quoted Price ($) | Level 2 Other significant observable inputs ($) | Level 3 Significant | Total ($) | |||||||||
Common Stocks ** | 93,400,715 |
— |
— | 93,400,715 | ||||||||
Short-Term Securities | 2,257,288 |
— |
— | 2,257,288 | ||||||||
Total: | 95,658,003 |
— |
— | 95,658,003 | ||||||||
| ** | For equity securities categorized in a single level, refer to the Schedule of Investments for further breakdown. |
For the reporting period, there were no transfers between levels 1, 2 and 3. |
See accompanying notes to financial statements. | ||||
DECEMBER 31, 2017 |
|
41 |
|
|
OBJECTIVE STRATEGY
The objective of the Sit International Growth Fund is long-term growth. The Fund seeks to achieve its objective by investing at least 90% of its net assets in common stocks of growth companies domiciled outside the United States. In selecting investments for the Fund, the Adviser begins by selecting countries or regions in which to invest by considering several factors affecting the economy and equity market of foreign countries and regions. After the country and regional allocations are determined, the Adviser seeks industries and sectors that it believes have earnings growth prospects that are greater than the average. Within the selected industries and sectors, the Adviser invests in foreign growth-oriented companies it believes exhibit the potential for superior growth.
For the six-month period ended December 31 2017, the Sit International Growth Fund generated a return of +7.67% versus the MSCI EAFE Index return of +9.86%. Stock selection and an underweight position in Japan contributed to the modest relative underperformance during the second half of calendar 2017. Policy clarity following Prime Minister Abe’s election win in October 2017, upbeat corporate earnings, and cheap valuations spurred a rally in Japanese stocks in the fourth calendar quarter. However, moderating growth and continued structural challenges points to a muted outlook for Japan equities in calendar 2018.
In terms of the EAFE economies, GDP growth in the Euro Area has been resilient and broad-based, with signs that a virtuous cycle driven by domestic investment is taking hold. Still, as exports represent over 45% of GDP, the Euro Area is sensitive to global trade conditions and moderating economic growth in China. Ongoing strength in the euro, appreciating +13.8 percent against the U.S. dollar in calendar 2017, could also begin to affect exports negatively. We currently forecast Euro Area real GDP will increase +2.0% to +2.5% in 2018 versus an estimated pace of +2.3% in 2017. Brexit-related uncertainty has weighed on confidence, business activity and household spending in the UK, likely capping GDP growth at roughly +1.5% in 2017 and 2018. Within Asia, Japan continues to grow ahead of modest expectations as improving activity globally lifts its export-driven economy. However, ongoing structural challenges and moderating growth overseas dampen the outlook. Therefore, we expect Japan’s GDP growth to moderate to 0.5% in 2018 from +1.5% in 2017 as exports slow and the boost from fiscal stimulus fades. Finally, we remain cautiously optimistic that China can balance growth and structural reform. We currently expect China’s GDP growth to decelerate only slightly to +6.5% in 2018 from +6.8% in 2017. Nevertheless, we expect policymakers to reverse or moderate tightening measures if there are signs that economic growth is slowing too much.
As for investment strategy, we are positive on European equities as macroeconomic conditions and valuation remain favorable, particularly for the Euro Area. We are less enthusiastic on UK equities as Brexit continues to cap economic growth in the intermediate term. In general, we favor equities with continental Europe exposure, along with companies that will benefit from tax reform and other pro-growth policies in the United States. The portfolio remains under-
HYPOTHETICAL GROWTH OF $10,000
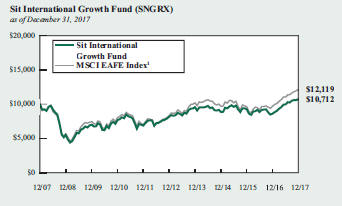
The chart above illustrates the total value of a hypothetical $10,000 investment in the Fund over the past 10 years as compared to the performance of the MSCI EAFE Index and MSCI EAFE Growth Index. The primary index used to compare the Fund’s performance was changed to the MSCI EAFE Index from the MSCI EAFE Growth Index because the Investment Adviser believes that the MSCI EAFE Index more accurately reflects the Fund’s investment objectives and strategies. Past performance does not guarantee future results. Returns include the reinvestment of distributions. The chart does not reflect the deduction of taxes that a shareholder would pay on Fund distributions or the redemption of Fund shares.
1 MSCI EAFE Index (Europe, Australasia, Far East) is an unmanaged free float-adjusted market capitalization index that measures the equity market performance of developed markets, excluding the US & Canada. This is the Fund’s primary index.
weight Japan as we expect a more mixed environment for equities in calendar 2018 and continue to prefer exporters and multinationals levered to higher growth regions, such as the U.S. or continental Europe, and resilient defensive consumption names. While “New China” remains our key long-term investment strategy, there may be some profit-taking pressures in Chinese stocks in the near term given their strong performance in calendar 2017. Looking beyond near-term stock volatility, we prefer Chinese companies with solid earnings growth/balance sheets, attractive valuation, and improving fundamentals.
Roger J. Sit Tasha M. Murdoff
Portfolio Managers
42 | SIT MUTUAL FUNDS SEMI-ANNUAL REPORT | |
COMPARATIVE RATES OF RETURNS
as of December 31, 2017
| Sit International Growth Fund | MSCI EAFE Index 1 | MSCI EAFE Growth Index 2 | |||||||||||||
Six Month | 7.67 | % | 9.86 | % | 10.44 | % | |||||||||
One Year | 24.02 | 25.03 | 28.86 | ||||||||||||
Five Year | 5.62 | 7.90 | 8.78 | ||||||||||||
Ten Year | 0.69 | 1.94 | 2.67 | ||||||||||||
Since Inception | 4.20 | 5.63 | 4.67 | ||||||||||||
(11/1/91) | |||||||||||||||
Performance figures are historical and do not guarantee future results. Investment returns and principal value will vary, and you may have a gain or loss when you sell shares. Current performance may be lower or higher than the performance data quoted. Contact the Fund for performance data current to the most recent month-end. Returns include changes in share price as well as reinvestment of all dividends and capital gains and all fee waivers. Without the fee waivers total return and yield figures would have been lower. Returns do not reflect the deduction of the 2% redemption fee imposed if shares are redeemed or exchanged within 30 calendar days from their date of purchase. If imposed, the fee would reduce the performance quoted. Returns do not reflect the deduction of taxes that a shareholder would pay on Fund distributions or the redemption of Fund shares. Management fees and administrative expenses are included in the Fund’s performance. Returns for periods greater than one year are compounded average annual rates of return.
1 MSCI EAFE Index (Europe, Australasia, Far East) is an unmanaged free float-adjusted market capitalization index that measures the equity market performance of developed markets, excluding the US & Canada.
2 MSCI EAFE Growth Index (Europe, Australasia, Far East) is an unmanaged free float-adjusted market capitalization index that measures the equity market performance of growth oriented stocks of developed markets excluding the US & Canada.
| FUND DIVERSIFICATION - BY REGION | ||||||||||
| Sit Int’l Growth Fund | MSCI EAFE Index | |||||||||
Europe | 67.2 | % | 61.3 | % | ||||||
Asia | 23.4 | 38.3 | ||||||||
North America | 7.2 | — | ||||||||
Africa/Middle East | — | 0.4 | ||||||||
Cash & Other Net Assets | 2.2 | — | ||||||||
Based on total net assets as of December 31, 2017. Subject to change.
PORTFOLIO SUMMARY
Net Asset Value 12/31/17: | $17.33 Per Share | |
Net Asset Value 6/30/17: | $16.23 Per Share | |
Total Net Assets: | $24.0 Million | |
Weighted Average Market Cap: | $87.5 Billion | |
TOP 10 HOLDINGS
1. Nestle SA
2. ING Groep NV
3. Tencent Holdings, Ltd.
4. Royal Dutch Shell, PLC, ADR
5. Reckitt Benckiser Group, PLC
6. Siemens AG
7. DS Smith, PLC
8. RELX NV
9. Diageo, PLC, ADR
10. British American Tobacco, PLC
Based on total net assets as of December 31, 2017. Subject to change.
FUND DIVERSIFICATION
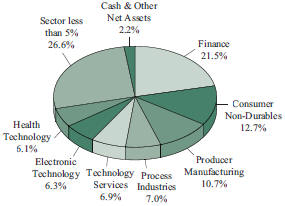
Based on total net assets as of December 31, 2017. Subject to change.
DECEMBER 31, 2017 |
43 |
SCHEDULE OF INVESTMENTS (Unaudited)
December 31, 2017
Sit International Growth Fund
Name of Issuer | Quantity | Fair Value ($) | ||||||
Common Stocks - 96.5% |
| |||||||
Asia - 22.1% | ||||||||
Australia - 2.6% | ||||||||
Amcor, Ltd. | 23,400 | 280,386 | ||||||
Rio Tinto, PLC, ADR | 2,500 | 132,325 | ||||||
Westpac Banking Corp., ADR | 8,300 | 202,354 | ||||||
|
| |||||||
| 615,065 | ||||||||
|
| |||||||
China/Hong Kong - 6.7% |
| |||||||
AIA Group, Ltd. | 32,200 | 273,882 | ||||||
Alibaba Group Holding, Ltd., ADR * | 2,350 | 405,211 | ||||||
HSBC Holdings, PLC, ADR | 7,025 | 362,771 | ||||||
Tencent Holdings, Ltd. | 10,900 | 564,162 | ||||||
|
| |||||||
| 1,606,026 | ||||||||
|
| |||||||
Japan - 8.7% |
| |||||||
Asics Corp. | 12,900 | 205,043 | ||||||
Daicel Corp. | 13,400 | 152,067 | ||||||
Keyence Corp. | 600 | 335,179 | ||||||
Makita Corp. | 4,200 | 176,138 | ||||||
Mitsubishi UFJ Financial Group, Inc., ADR | 43,000 | 312,610 | ||||||
Nintendo Co., Ltd. | 700 | 252,068 | ||||||
Secom Co., Ltd. | 2,300 | 173,519 | ||||||
Suzuki Motor Corp. | 8,400 | 486,223 | ||||||
|
| |||||||
| 2,092,847 | ||||||||
|
| |||||||
Singapore - 2.7% |
| |||||||
Broadcom, Ltd. | 1,350 | 346,815 | ||||||
DBS Group Holdings, Ltd. | 15,600 | 288,542 | ||||||
|
| |||||||
| 635,357 | ||||||||
|
| |||||||
South Korea - 1.4% |
| |||||||
Samsung Electronics Co., Ltd., GDR | 285 | 337,498 | ||||||
|
| |||||||
Europe - 67.2% |
| |||||||
Belgium - 1.3% |
| |||||||
Anheuser-Busch InBev NV, ADR | 2,870 | 320,177 | ||||||
|
| |||||||
Denmark - 1.0% |
| |||||||
Danske Bank A/S | 5,900 | 229,640 | ||||||
|
| |||||||
France - 10.1% |
| |||||||
AXA SA | 8,250 | 244,474 | ||||||
BNP Paribas SA | 4,870 | 362,272 | ||||||
Dassault Systemes SA | 3,225 | 342,427 | ||||||
DBV Technologies SA * | 1,950 | 97,836 | ||||||
Ingenico Group SA | 1,700 | 181,557 | ||||||
Safran SA | 4,400 | 453,839 | ||||||
Schneider Electric SE | 5,000 | 423,901 | ||||||
Unibail-Rodamco SE | 1,265 | 318,339 | ||||||
|
| |||||||
| 2,424,645 | ||||||||
|
| |||||||
Name of Issuer | Quantity | Fair Value ($) | ||||||
Germany - 6.3% |
| |||||||
Allianz SE | 2,000 | 457,694 | ||||||
Aurelius SE & Co. | 4,160 | 283,687 | ||||||
Bayer AG | 1,900 | 236,099 | ||||||
Siemens AG | 3,900 | 539,984 | ||||||
|
| |||||||
| 1,517,464 | ||||||||
|
| |||||||
Ireland - 0.9% |
| |||||||
CRH, PLC, ADR | 5,800 | 209,322 | ||||||
|
| |||||||
Netherlands - 10.6% |
| |||||||
ASML Holding NV | 1,700 | 295,494 | ||||||
Galapagos NV * | 3,725 | 350,996 | ||||||
ING Groep NV | 34,900 | 640,648 | ||||||
Koninklijke Philips NV | 6,500 | 245,700 | ||||||
LyondellBasell Industries NV | 4,400 | 485,408 | ||||||
RELX NV | 22,800 | 524,043 | ||||||
|
| |||||||
| 2,542,289 | ||||||||
|
| |||||||
Spain - 3.4% |
| |||||||
Iberdrola SA | 54,200 | 419,577 | ||||||
Industria de Diseno Textil SA | 11,650 | 405,090 | ||||||
|
| |||||||
| 824,667 | ||||||||
|
| |||||||
Sweden - 2.0% |
| |||||||
Hexagon AB | 5,200 | 260,853 | ||||||
Nordea Bank AB | 17,000 | 205,835 | ||||||
|
| |||||||
| 466,688 | ||||||||
|
| |||||||
Switzerland - 7.9% |
| |||||||
Interroll Holding AG | 120 | 177,700 | ||||||
Nestle SA | 7,470 | 642,243 | ||||||
Novartis AG | 4,650 | 391,309 | ||||||
Roche Holding AG | 1,470 | 371,697 | ||||||
Zurich Insurance Group AG | 1,020 | 310,125 | ||||||
|
| |||||||
| 1,893,074 | ||||||||
|
| |||||||
United Kingdom - 23.7% |
| |||||||
Ashtead Group, PLC | 12,600 | 337,950 | ||||||
ASOS, PLC * | 4,275 | 385,674 | ||||||
Babcock International Group, PLC | 25,300 | 240,990 | ||||||
BAE Systems, PLC | 37,500 | 289,737 | ||||||
British American Tobacco, PLC | 7,330 | 495,498 | ||||||
BT Group, PLC, ADR | 5,800 | 105,676 | ||||||
Cineworld Group, PLC | 19,900 | 161,034 | ||||||
Coca-Cola European Partners, PLC | 5,400 | 215,190 | ||||||
Diageo, PLC, ADR | 3,475 | 507,454 | ||||||
DS Smith, PLC | 76,700 | 534,635 | ||||||
Greencore Group, PLC | 39,900 | 123,741 | ||||||
Just Eat, PLC * | 29,401 | 309,244 | ||||||
Prudential, PLC | 12,200 | 312,445 | ||||||
Reckitt Benckiser Group, PLC | 5,800 | 541,101 | ||||||
Royal Dutch Shell, PLC, ADR - Class A | 4,500 | 300,195 | ||||||
Royal Dutch Shell, PLC, ADR - Class B | 3,700 | 252,673 | ||||||
See accompanying notes to financial statements. | ||
44 | SIT MUTUAL FUNDS SEMI-ANNUAL REPORT |
Name of Issuer | Quantity | Fair Value ($) | ||||||
STERIS, PLC | 2,700 | 236,169 | ||||||
WPP, PLC | 18,800 | 339,635 | ||||||
|
| |||||||
| 5,689,041 | ||||||||
|
| |||||||
North America - 7.2% |
| |||||||
Canada - 5.3% |
| |||||||
BCE, Inc. | 3,700 | 177,637 | ||||||
Suncor Energy, Inc. | 13,100 | 481,032 | ||||||
TransCanada Corp. | 4,900 | 238,336 | ||||||
Waste Connections, Inc. | 5,450 | 386,623 | ||||||
|
| |||||||
| 1,283,628 | ||||||||
|
| |||||||
United States - 1.9% |
| |||||||
Euronet Worldwide, Inc. * | 3,250 | 273,878 | ||||||
priceline.com, Inc. * | 100 | 173,774 | ||||||
|
| |||||||
| 447,652 | ||||||||
|
| |||||||
Total Common Stocks (cost: $18,223,094) |
| 23,135,080 | ||||||
|
| |||||||
Investment Companies - 1.3% |
| |||||||
iShares MSCI India ETF | 8,700 | 313,809 | ||||||
|
| |||||||
(cost: $258,887) |
| |||||||
Short-Term Securities - 1.9% | ||||||||
Fidelity Inst. Money Mkt. Gvt. Fund, 1.14% | 460,850 | 460,850 | ||||||
|
| |||||||
(cost: $460,850) | ||||||||
Total Investments in Securities - 99.7% (cost: $18,942,831) |
| 23,909,739 | ||||||
Other Assets and Liabilities, net - 0.3% | 75,747 | |||||||
|
| |||||||
Total Net Assets - 100.0% | $23,985,486 | |||||||
|
| |||||||
| * | Non-income producing security. |
Numeric footnotes not disclosed are not applicable to this Schedule of Investments.
ADR — American Depositary Receipt
GDR — Global Depositary Receipt
PLC — Public Limited Company
See accompanying notes to financial statements. | ||||
DECEMBER 31, 2017 |
|
45 |
|
SCHEDULE OF INVESTMENTS (Unaudited)
December 31, 2017
Sit International Growth Fund (Continued)
A summary of the levels for the Fund’s investments as of December 31, 2017 is as follows (see Note 2 - significant accounting policies in the notes to financial statements):
| Investment in Securities | ||||||||||||||||
| Level 1 Quoted Price ($) | Level 2 Other significant observable inputs ($) | Level 3 Significant unobservable inputs ($) | Total ($) | |||||||||||||
Common Stocks | ||||||||||||||||
Australia | 334,679 | 280,386 | — | 615,065 | ||||||||||||
Belgium | 320,177 | — | — | 320,177 | ||||||||||||
Canada | 1,283,628 | — | — | 1,283,628 | ||||||||||||
China/Hong Kong | 767,982 | 838,044 | — | 1,606,026 | ||||||||||||
Denmark | — | 229,640 | — | 229,640 | ||||||||||||
France | — | 2,424,645 | — | 2,424,645 | ||||||||||||
Germany | — | 1,517,464 | — | 1,517,464 | ||||||||||||
Ireland | 209,322 | — | — | 209,322 | ||||||||||||
Japan | 312,610 | 1,780,237 | — | 2,092,847 | ||||||||||||
Netherlands | 1,026,602 | 1,515,687 | — | 2,542,289 | ||||||||||||
Singapore | 346,815 | 288,542 | — | 635,357 | ||||||||||||
South Korea | — | 337,498 | — | 337,498 | ||||||||||||
Spain | — | 824,667 | — | 824,667 | ||||||||||||
Sweden | — | 466,688 | — | 466,688 | ||||||||||||
Switzerland | — | 1,893,074 | — | 1,893,074 | ||||||||||||
United Kingdom | 1,982,088 | 3,706,953 | — | 5,689,041 | ||||||||||||
United States | 447,652 | — | — | 447,652 | ||||||||||||
Investment Companies | 313,809 | — | — | 313,809 | ||||||||||||
Short-Term Securities | 460,850 | — | — | 460,850 | ||||||||||||
Total: | 7,806,214 | 16,103,525 | — | 23,909,739 | ||||||||||||
The Fund adjusts the closing price of foreign equity securities by applying a systematic process for events occurring after the close of the foreign exchanges. At each reporting period, this process is applied for all foreign securities and therefore all foreign securities are classified as level 2. There are no transfers between level 1 and level 2 between reporting periods as a result of applying this process. Level 1 securities of foreign issuers are primarily American Depositary Receipts (ADRs), Public Limited Companies (PLCs) or Global Depositary Receipts (GDRs). There were no transfers into or out of level 3 during the reporting period.
See accompanying notes to financial statements. | ||||
46 | SIT MUTUAL FUNDS SEMI-ANNUAL REPORT |
[This page intentionally left blank.]
DECEMBER 31, 2017 |
47 |
Sit Developing Markets Growth Fund
|
OBJECTIVE & STRATEGY
The objective of the Sit Developing Markets Growth Fund is to maximize long-term capital appreciation. The Fund seeks to achieve its objective by investing at least 80% of its net assets in common stocks of companies domiciled or operating in a developing market. In selecting investments for the Fund, the Adviser begins by selecting countries or regions in which to invest by considering several factors affecting the economy and equity market of foreign countries and regions. After the country and regional allocations are determined, the Adviser seeks industries and sectors that appear to have strong earnings growth prospects. Within the selected industries and sectors, the Adviser invests in foreign growth-oriented companies it believes exhibit the potential for superior growth.
The Sit Developing Markets Growth Fund advanced +14.54% for the six-month period ended December 31, 2017, slightly underperforming the MSCI Emerging Markets Index’s +14.61%. The consumer services (TAL Education), capital goods (Bidvest Group), and food beverage & tobacco (China Mengniu Dairy) sectors helped contribute to relative outperformance. Conversely, the sectors of automobiles & components (PTAstra, Kordsa), cash, and insurance (China Life) hurt performance. Stock selection in South Africa, China, and Peru were positive to returns. However, stock selection was negative in the United States and South Korea.
We are cautiously optimistic that China can balance growth and structural reform. Policymakers have introduced supervisory tightening measures to include removing unqualified projects from the public-private partnership system, cracking down on online lending, and issuing new guidance on asset management products. Combined with rising government bond yields, these actions have led to concerns of a debt crisis. Yet the probability of a debt crisis in the near term is low given solid long-term growth prospects, heavy state involvement in the economy, limited external debt, and ample domestic savings. We expect the policy-induced growth moderation to continue, with 2018 GDP growth of +6.5%.
India’s economy will continue to recover post major reforms, with fiscal year 2019 GDP growth forecast at +7.3%, supported by buoyant consumption and industrial strength. The Indian government has since taken steps to integrate these reforms (currency demonetization, Goods & Services Tax) more successfully in order to lessen the impact on the economy. In South Korea, 2018 economic growth will be led by exports and consumption. We expect consumer spending to recover as the benefits of the government’s supplementary budget to create jobs and boost economic growth are realized.
Brazil’s economy is slowly recovering, led by investment and consumption. Brazil’s second quarter 2017 growth of +0.7% quarter-over-quarter was higher-than-expected, on stronger agriculture and private consumption. We forecast 2018 GDP growth of +2.5%. The central bank cut interest rates in December and signaled additional cuts are forthcoming given the low inflation environment.
We are positive on the equity markets of China, India, and South Korea. Our key long-term investment strategy in China remains in “New China” stocks. We prefer companies with solid earnings growth/
HYPOTHETICAL GROWTH OF $10,000
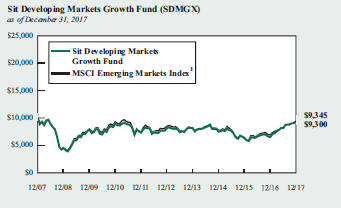
The chart above illustrates the total value of a hypothetical $10,000 investment in the Fund over the past 10 years as compared to the performance of the MSCI Emerging Markets Index. Past performance does not guarantee future results. Returns include the reinvestment of distributions. The chart does not reflect the deduction of taxes that a shareholder would pay on Fund distributions or the redemption of Fund shares.
1 MSCI Emerging Markets Index is an unmanaged free float-adjusted market capitalization index that measures equity market performance of emerging markets. It is not possible to invest directly in an index. This is the Fund’s primary index.
balance sheets, attractive valuations, and improving fundamentals. In India, economic growth will be led by consumer spending. We continue to like sectors related to a strong economy (e.g., consumer, financials, and information services). In South Korea, exports and the consumer should drive continued economic growth. We favor investments in the technology, financial, consumer, and utility sectors.
In Latin America, we are underweight Brazil and Mexico equity markets. However, we are more optimistic on Brazil given higher economic growth from the consumer. Consumption should benefit from low interest rates and improving employment. We own balanced holdings of financials and consumer staples. In Mexico, we are underweight the market because of uncertainty over the North American Free Trade Agreement negotiations on trade and economic growth and high inflation.
Roger J. Sit Raymond E. Sit
Portfolio Managers
48 | SIT MUTUAL FUNDS SEMI-ANNUAL REPORT | |
|
| COMPARATIVE RATES OF RETURN | |||||||||||||||
as of December 31, 2017 | |||||||||||||||
| Sit Developing Markets Growth Fund | MSCI Emerging Markets Index 1 | MSCI Emerging Markets Growth Index 2 | |||||||||||||
Six Month |
|
14.54 |
% |
|
14.61 |
% |
|
18.27 |
% | ||||||
One Year | 43.23 | 34.35 | 44.88 | ||||||||||||
Five Year | 2.97 | 1.88 | 5.08 | ||||||||||||
Ten Year | -0.68 | -0.72 | 0.49 | ||||||||||||
Since Inception (7/1/94)
| 4.51 | 3.82 | n/a | ||||||||||||
Performance figures are historical and do not guarantee future results. Investment returns and principal value will vary, and you may have a gain or loss when you sell shares. Current performance may be lower or higher than the performance data quoted. Contact the Fund for performance data current to the most recent month-end. Returns include changes in share price as well as reinvestment of all dividends and capital gains. Returns do not reflect the deduction of the 2% redemption fee imposed if shares are redeemed or exchanged within 30 calendar days from their date of purchase. If imposed, the fee would reduce the performance quoted. Returns do not reflect the deduction of taxes that a shareholder would pay on Fund distributions or the redemption of Fund shares. Management fees and administrative expenses are included in the Fund’s performance. Returns for periods greater than one year are compounded average annual rates of return.
1 MSCI Emerging Markets Index is an unmanaged free float-adjusted market capitalization index that measures equity market performance of emerging markets. It is not possible to invest directly in an index.
2 MSCI Emerging Markets Growth Index is an unmanaged free float-adjusted market capitalization index that measures equity market performance of growth oriented emerging market stocks.
| FUND DIVERSIFICATION – BY REGION | ||||
| Sit Developing Markets Growth Fund | MSCI Emerging Markets Index | |||
Asia | 72.6% | 73.2% | ||
Africa/Middle East | 11.9 | 8.3 | ||
Latin America | 9.8 | 11.8 | ||
North America | 3.2 | — | ||
Europe | 0.9 | 6.7 | ||
Cash & Other Net Assets | 1.6 | — | ||
Based on total net assets as of December 31, 2017. Subject to change.
| PORTFOLIO SUMMARY | ||
Net Asset Value 12/30/17: | $17.19 Per Share | |
Net Asset Value 6/30/17: | $15.23 Per Share | |
Total Net Assets: | $11.2 Million | |
Weighted Average Market Cap: | $107.3 Billion | |
| TOP 10 HOLDINGS |
1. Tencent Holdings, Ltd. |
2. Alibaba Group Holding, Ltd., ADR |
3. Samsung Electronics Co., Ltd. |
4. Naspers, Ltd. |
5. TAL Education Group, ADR |
6. iShares MSCI India ETF |
7. NICE Systems, Ltd., ADR |
8. CSPC Pharmaceutical Group, Ltd. |
9. Shinhan Financial Group Co., Ltd. |
10. China Construction Bank Corp.
|
Based on total net assets as of December 31, 2017. Subject to change.
FUND DIVERSIFICATION
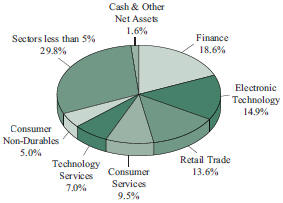
Based on total net assets as of December 31, 2017. Subject to change.
DECEMBER 31, 2017 |
|
49 |
|
SCHEDULE OF INVESTMENTS (Unaudited)
December 31, 2017
Sit Developing Markets Growth Fund
Name of Issuer | Quantity | Fair Value ($) | ||||||
Common Stocks - 94.8% |
| |||||||
Africa/Middle East - 11.9% |
| |||||||
Israel - 3.0% |
| |||||||
NICE Systems, Ltd., ADR | 3,700 | 340,067 | ||||||
|
| |||||||
South Africa - 8.9% | ||||||||
Bid Corp., Ltd. | 7,600 | 184,718 | ||||||
Bidvest Group, Ltd. | 9,775 | 171,548 | ||||||
Naspers, Ltd. | 1,675 | 464,064 | ||||||
Sasol, Ltd., ADR | 5,000 | 171,050 | ||||||
|
| |||||||
| 991,380 | ||||||||
|
| |||||||
Asia - 69.0% | ||||||||
Australia - 1.2% | ||||||||
Rio Tinto, PLC, ADR | 2,475 | 131,002 | ||||||
|
| |||||||
China/Hong Kong - 35.0% | ||||||||
AIA Group, Ltd. | 15,600 | 132,688 | ||||||
Alibaba Group Holding, Ltd., ADR * | 3,000 | 517,290 | ||||||
Baidu, Inc., ADR * | 800 | 187,368 | ||||||
China Construction Bank Corp. | 320,000 | 294,577 | ||||||
China Life Insurance Co., Ltd., ADR | 12,900 | 201,369 | ||||||
China Mengniu Dairy Co., Ltd. | 64,000 | 190,114 | ||||||
China Mobile, Ltd., ADR | 4,450 | 224,903 | ||||||
China Petroleum & Chemical Corp., ADR | 2,800 | 205,436 | ||||||
CSPC Pharmaceutical Group, Ltd. | 162,000 | 326,369 | ||||||
Ctrip.com International,Ltd., ADR * | 3,200 | 141,120 | ||||||
ENN Energy Holdings, Ltd. | 28,000 | 199,149 | ||||||
Hong Kong Exchanges & Clearing, Ltd. | 2,900 | 88,706 | ||||||
JD.com, Inc.,ADR * | 4,450 | 184,319 | ||||||
TAL Education Group, ADR | 14,400 | 427,824 | ||||||
Tencent Holdings, Ltd. | 11,400 | 590,041 | ||||||
|
| |||||||
| 3,911,273 | ||||||||
|
| |||||||
India - 4.3% | ||||||||
HDFC Bank, Ltd., ADR | 2,675 | 271,967 | ||||||
Tata Motors, Ltd., ADR * | 6,425 | 212,490 | ||||||
|
| |||||||
| 484,457 | ||||||||
|
| |||||||
Indonesia - 1.0% | ||||||||
Astra International Tbk PT | 177,000 | 108,117 | ||||||
|
| |||||||
Japan - 1.9% | ||||||||
Suzuki Motor Corp. | 3,600 | 208,381 | ||||||
|
| |||||||
Singapore - 4.0% | ||||||||
Broadcom, Ltd. | 775 | 199,097 | ||||||
DBS Group Holdings, Ltd. | 13,500 | 249,700 | ||||||
|
| |||||||
| 448,797 | ||||||||
|
| |||||||
South Korea - 12.1% | ||||||||
E-Mart Co., Inc. | 790 | 199,786 | ||||||
Korea Electric Power Corp. * | 4,200 | 149,295 | ||||||
Medy-Tox, Inc. | 400 | 181,178 | ||||||
Name of Issuer | Quantity | Fair Value ($) | ||||||
Samsung Electronics Co., Ltd. | 215 | 510,821 | ||||||
Shinhan Financial Group Co., Ltd. * | 6,700 | 309,253 | ||||||
|
| |||||||
| 1,350,333 | ||||||||
|
| |||||||
Taiwan - 7.4% | ||||||||
Cathay Financial Holding Co., Ltd. | 82,086 | 147,061 | ||||||
Hon Hai Precision Industry Co., Ltd., GDR | 21,148 | 132,824 | ||||||
President Chain Store Corp. | 16,000 | 152,379 | ||||||
Taiwan Semiconductor Co. | 37,482 | 287,002 | ||||||
Taiwan Semiconductor Co., ADR | 2,800 | 111,020 | ||||||
|
| |||||||
| 830,286 | ||||||||
|
| |||||||
Thailand - 1.0% | ||||||||
Bangkok Bank PCL | 16,600 | 111,550 | ||||||
|
| |||||||
Turkey - 1.1% | ||||||||
Kordsa Global Endustriyel Iplik A/S | 60,900 | 123,126 | ||||||
|
| |||||||
Europe - 0.9% | ||||||||
Belgium - 0.9% | ||||||||
Anheuser-Busch InBev NV, ADR | 950 | 105,982 | ||||||
|
| |||||||
Latin America - 9.8% | ||||||||
Brazil - 5.3% | ||||||||
Ambev SA, ADR | 40,425 | 261,145 | ||||||
Banco Bradesco SA | 15,176 | 154,866 | ||||||
Qualicorp SA | 19,000 | 177,565 | ||||||
|
| |||||||
| 593,576 | ||||||||
|
| |||||||
Chile - 2.6% | ||||||||
Banco Santander Chile, ADR | 3,900 | 121,961 | ||||||
Geopark, Ltd.* | 16,700 | 165,497 | ||||||
|
| |||||||
| 287,458 | ||||||||
|
| |||||||
Peru - 1.9% | ||||||||
Southern Copper Corp. | 4,600 | 218,274 | ||||||
|
| |||||||
North America - 3.2% | ||||||||
Mexico - 1.2% | ||||||||
Alsea SAB de CV | 41,100 | 134,488 | ||||||
|
| |||||||
United States - 2.0% | ||||||||
Laureate Education, Inc. * | 9,650 | 130,854 | ||||||
Skyworks Solutions, Inc. | 925 | 87,829 | ||||||
|
| |||||||
| 218,683 | ||||||||
|
| |||||||
Total Common Stocks | ||||||||
(cost: $7,481,498) | 10,597,230 | |||||||
|
| |||||||
Investment Companies - 3.6% | ||||||||
iShares MSCI India ETF | 11,100 | 400,377 | ||||||
|
| |||||||
(cost: $334,045) | ||||||||
See accompanying notes to financial statements. | ||||
50 |
|
SIT MUTUAL FUNDS SEMI-ANNUAL REPORT |
|
Name of Issuer | Quantity | Fair Value ($) | ||||||
Short-Term Securities - 1.4% |
| |||||||
Fidelity Inst. Money Mkt. Gvt. Fund, 1.14% | 158,153 | 158,153 | ||||||
|
| |||||||
(cost: $158,153) | ||||||||
Total Investments in Securities - 99.8% |
| 11,155,760 | ||||||
Other Assets and Liabilities, net - 0.2% |
| 17,087 | ||||||
|
| |||||||
Total Net Assets - 100.0% |
| $11,172,847 | ||||||
|
| |||||||
| * | Non-income producing security. |
ADR — American Depositary Receipt
GDR — Global Depositary Receipt
Numeric footnotes not disclosed are not applicable to this Schedule of Investments.
See accompanying notes to financial statements. | ||||
DECEMBER 31, 2017 |
|
51 |
|
SCHEDULE OF INVESTMENTS (Unaudited)
December 31, 2017
Sit Developing Markets Growth Fund (Continued)
A summary of the levels for the Fund’s investments as of December 31, 2017 is as follows (see Note 2 - significant accounting policies in the notes to financial statements):
| Investment in Securities | ||||||||||||||||||||
Level 1 Quoted | Level 2 Other significant | Level 3 Significant | Total ($) | |||||||||||||||||
Common Stocks | ||||||||||||||||||||
Australia | 131,002 | — | — | 131,002 | ||||||||||||||||
Belgium | 105,982 | — | — | 105,982 | ||||||||||||||||
Brazil | 593,576 | — | — | 593,576 | ||||||||||||||||
Chile | 287,458 | — | — | 287,458 | ||||||||||||||||
China/Hong Kong | 2,089,629 | 1,821,644 | — | 3,911,273 | ||||||||||||||||
India | 484,457 | — | — | 484,457 | ||||||||||||||||
Indonesia | — | 108,117 | — | 108,117 | ||||||||||||||||
Israel | 340,067 | — | — | 340,067 | ||||||||||||||||
Japan | — | 208,381 | — | 208,381 | ||||||||||||||||
Mexico | 134,488 | — | — | 134,488 | ||||||||||||||||
Peru | 218,274 | — | — | 218,274 | ||||||||||||||||
Singapore | 199,097 | 249,700 | — | 448,797 | ||||||||||||||||
South Africa | 171,050 | 820,330 | — | 991,380 | ||||||||||||||||
South Korea | — | 1,350,333 | — | 1,350,333 | ||||||||||||||||
Taiwan | 111,020 | 719,266 | — | 830,286 | ||||||||||||||||
Thailand | 111,550 | — | — | 111,550 | ||||||||||||||||
Turkey | — | 123,126 | — | 123,126 | ||||||||||||||||
United States | 218,683 | — | — | 218,683 | ||||||||||||||||
Investment Companies | 400,377 | — | — | 400,377 | ||||||||||||||||
Short-Term Securities | 158,153 | — | — | 158,153 | ||||||||||||||||
Total: | 5,754,863 | 5,400,897 | — | 11,155,760 | ||||||||||||||||
The Fund adjusts the closing price of foreign equity securities by applying a systematic process for events occurring after the close of the foreign exchanges. At each reporting period, this process is applied for all foreign securities and therefore all foreign securities are classified as level 2. There are no transfers between level 1 and level 2 between reporting periods as a result of applying this process. Level 1 securities of foreign issuers are primarily American Depositary Receipts (ADRs), Public Limited Companies (PLCs) or Global Depositary Receipts (GDRs). There were no transfers into or out of level 3 during the reporting period.
See accompanying notes to financial statements. | ||||
52 |
|
SIT MUTUAL FUNDS SEMI-ANNUAL REPORT |
|
[This page intentionally left blank.]
DECEMBER 31, 2017 |
53 |
STATEMENTS OF ASSETS AND LIABILITIES (Unaudited)
December 31, 2017
| Sit Balanced Fund | Sit Dividend Growth Fund | Sit Global Dividend Growth Fund | ||||||||||
ASSETS | ||||||||||||
Investments in securities, at identified cost | $20,918,168 | $801,187,507 | $25,889,794 | |||||||||
|
|
|
|
|
| |||||||
Investments in securities, at fair value - see accompanying schedule for detail | $27,590,580 | $990,214,770 | $32,803,648 | |||||||||
Cash in bank on demand deposit | — | — | — | |||||||||
Accrued interest and dividends receivable | 76,209 | 1,255,540 | 84,107 | |||||||||
Receivable for investment securities sold | — | 4,401,004 | — | |||||||||
Receivable for Fund shares sold | 6,396 | 9,375,012 | 2,974 | |||||||||
|
|
|
|
|
| |||||||
Total assets | 27,673,185 | 1,005,246,326 | 32,890,729 | |||||||||
|
|
|
|
|
| |||||||
LIABILITIES | ||||||||||||
Disbursements in excess of cash balances | — | 279 | — | |||||||||
Payable for investment securities purchased | — | 4,098,590 | — | |||||||||
Payable for Fund shares redeemed | 3,842 | 603,192 | — | |||||||||
Accrued investment management fees and advisory fees | 21,680 | 582,854 | 25,990 | |||||||||
Accrued 12b-1 fees (Class S) | — | 12,656 | 720 | |||||||||
|
|
|
|
|
| |||||||
Total liabilities | 25,522 | 5,297,571 | 26,710 | |||||||||
|
|
|
|
|
| |||||||
Net assets applicable to outstanding capital stock | $27,647,663 | $999,948,755 | $32,864,019 | |||||||||
|
|
|
|
|
| |||||||
Net assets consist of: | ||||||||||||
Capital (par value and paid-in surplus). | $20,992,816 | $784,359,048 | $26,657,519 | |||||||||
Undistributed (distributions in excess of) net investment income (loss) | (83,920 | ) | 13,315 | 4,773 | ||||||||
Accumulated net realized gain (loss) from security transactions and foreign currency transactions | 66,355 | 26,549,129 | (712,384 | ) | ||||||||
Unrealized appreciation (depreciation) on investments and foreign currency transactions | 6,672,412 | 189,027,263 | 6,914,111 | |||||||||
|
|
|
|
|
| |||||||
| $27,647,663 | $999,948,755 | $32,864,019 | ||||||||||
|
|
|
|
|
| |||||||
Outstanding shares: | ||||||||||||
Common Shares (Class I) * | 1,181,968 | 55,947,468 | 1,841,158 | |||||||||
|
|
|
|
|
| |||||||
Common Shares (Class S) * | — | 3,599,374 | 222,972 | |||||||||
|
|
|
|
|
| |||||||
Net assets applicable to outstanding shares: | ||||||||||||
Common Shares (Class I) * | $27,647,663 | $939,726,659 | $29,315,282 | |||||||||
|
|
|
|
|
| |||||||
Common Shares (Class S)* | — | 60,222,096 | 3,548,737 | |||||||||
|
|
|
|
|
| |||||||
Net asset value per share of outstanding capital stock: | ||||||||||||
Common Shares (Class I) * | $23.39 | $16.80 | $15.92 | |||||||||
|
|
|
|
|
| |||||||
Common Shares (Class S) * | — | $16.73 | $15.92 | |||||||||
|
|
|
|
|
| |||||||
| * | Dividend Growth, Global Dividend Growth, ESG Growth and Small Cap Dividend Growth Funds offer multiple share classes (I and S). All other Funds offer a single share class. |
See accompanying notes to financial statements. | ||||
54 |
|
SIT MUTUAL FUNDS SEMI-ANNUAL REPORT |
|
| Sit Large Cap Growth Fund | Sit ESG Growth Fund | Sit Mid Cap Growth Fund | Sit Small Cap Dividend Growth Fund | Sit Small Cap Growth Fund | Sit International Growth Fund | Sit Developing Markets Growth Fund | ||||||||||||||||||||
| $63,902,369 | $4,652,297 | $91,121,760 | $15,870,966 | $63,286,124 | $18,942,831 | $7,973,696 | ||||||||||||||||||||
|
|
|
|
|
|
|
|
|
|
|
|
|
| |||||||||||||
| $118,384,962 | $5,744,927 | $159,009,321 | $19,127,638 | $95,658,003 | $23,909,739 | $11,155,760 | ||||||||||||||||||||
| — | — | — | — | — | — | 754 | ||||||||||||||||||||
| 57,826 | 6,400 | 52,827 | 25,490 | 63,386 | 103,463 | 26,056 | ||||||||||||||||||||
| — | — | 1,235,196 | — | 178,258 | — | — | ||||||||||||||||||||
| 13,448 | — | 9,294 | 1,119 | 9,515 | 1,602 | 2,773 | ||||||||||||||||||||
|
|
|
|
|
|
|
|
|
|
|
|
|
| |||||||||||||
| 118,456,236 | 5,751,327 | 160,306,638 | 19,154,247 | 95,909,162 | 24,014,804 | 11,185,343 | ||||||||||||||||||||
|
|
|
|
|
|
|
|
|
|
|
|
|
| |||||||||||||
| — | — | — | — | — | — | — | ||||||||||||||||||||
| — | — | 655,984 | 225,591 | 154,956 | — | — | ||||||||||||||||||||
| 44,224 | — | 3,232 | — | 5,601 | 1,050 | 370 | ||||||||||||||||||||
| 95,011 | 4,509 | 158,766 | 14,693 | 113,725 | 28,268 | 12,126 | ||||||||||||||||||||
| — | 528 | — | 792 | — | — | — | ||||||||||||||||||||
|
|
|
|
|
|
|
|
|
|
|
|
|
| |||||||||||||
| 139,235 | 5,037 | 817,982 | 241,076 | 274,282 | 29,318 | 12,496 | ||||||||||||||||||||
|
|
|
|
|
|
|
|
|
|
|
|
|
| |||||||||||||
| $118,317,001 | $5,746,290 | $159,488,656 | $18,913,171 | $95,634,880 | $23,985,486 | $11,172,847 | ||||||||||||||||||||
|
|
|
|
|
|
|
|
|
|
|
|
|
| |||||||||||||
| $60,982,649 | $4,697,913 | $86,786,076 | $15,807,495 | $61,573,615 | $19,837,061 | $7,907,289 | ||||||||||||||||||||
| 7,440 | 216 | (162,226 | ) | 3,482 | (236,166 | ) | (8,083 | ) | (1,922 | ) | ||||||||||||||||
| | 2,844,319 | (44,485 | ) | 4,977,245 | (154,478 | ) | 1,925,552 | (809,982 | ) | 85,320 | ||||||||||||||||
| | 54,482,593 | 1,092,646 | 67,887,561 | 3,256,672 | 32,371,879 | 4,966,490 | 3,182,160 | |||||||||||||||||||
|
|
|
|
|
|
|
|
|
|
|
|
|
| |||||||||||||
| $118,317,001 | $5,746,290 | $159,488,656 | $18,913,171 | $95,634,880 | $23,985,486 | $11,172,847 | ||||||||||||||||||||
|
|
|
|
|
|
|
|
|
|
|
|
|
| |||||||||||||
| 2,916,806 | 245,544 | 8,684,902 | 1,196,471 | 1,751,011 | 1,383,703 | 649,774 | ||||||||||||||||||||
|
|
|
|
|
|
|
|
|
|
|
|
|
| |||||||||||||
| — | 215,052 | — | 323,666 | — | — | — | ||||||||||||||||||||
|
|
|
|
|
|
|
|
|
|
|
|
|
| |||||||||||||
| $118,317,001 | $3,065,352 | $159,488,656 | $14,886,831 | $95,634,880 | $23,985,486 | $11,172,847 | ||||||||||||||||||||
|
|
|
|
|
|
|
|
|
|
|
|
|
| |||||||||||||
| — | 2,680,938 | — | 4,026,340 | — | — | — | ||||||||||||||||||||
|
|
|
|
|
|
|
|
|
|
|
|
|
| |||||||||||||
| $40.56 | $12.48 | $18.36 | $12.44 | $54.62 | $17.33 | $17.19 | ||||||||||||||||||||
|
|
|
|
|
|
|
|
|
|
|
|
|
| |||||||||||||
| — | $12.47 | — | $12.44 | — | — | — | ||||||||||||||||||||
|
|
|
|
|
|
|
|
|
|
|
|
|
| |||||||||||||
DECEMBER 31, 2017 |
|
55 |
|
STATEMENTS OF OPERATIONS (Unaudited)
Six Months Ended December 31, 2017
| Sit Balanced Fund | Sit Dividend Growth Fund | Sit Global Dividend Growth Fund | ||||||||||
Investment income: | ||||||||||||
Income: | ||||||||||||
Dividends* | $139,606 | $12,536,948 | $393,679 | |||||||||
Interest | 131,819 | 57,195 | 3,833 | |||||||||
|
|
|
|
|
| |||||||
Total income. | 271,425 | 12,594,143 | 397,512 | |||||||||
|
|
|
|
|
| |||||||
Expenses (note 4): | ||||||||||||
Investment management and advisory service fee | 130,768 | 5,186,037 | 192,782 | |||||||||
12b-1 fees (Class S) | — | 80,360 | 4,401 | |||||||||
|
|
|
|
|
| |||||||
Total expenses | 130,768 | 5,266,397 | 197,183 | |||||||||
|
|
|
|
|
| |||||||
Less fees and expenses waived by investment adviser | — | (770,011 | ) | (19,855 | ) | |||||||
|
|
|
|
|
| |||||||
Total net expenses | 130,768 | 4,496,386 | 177,328 | |||||||||
|
|
|
|
|
| |||||||
Net investment income (loss) | 140,657 | 8,097,757 | 220,184 | |||||||||
|
|
|
|
|
| |||||||
Realized and unrealized gain (loss): | ||||||||||||
Net realized gain (loss) on investments | 468,747 | 74,963,338 | 214,416 | |||||||||
Net realized gain (loss) on foreign currency transactions | — | — | (470 | ) | ||||||||
Net change in unrealized appreciation (depreciation) on investments and foreign currency transactions | 1,438,419 | 23,192,009 | 2,770,308 | |||||||||
|
|
|
|
|
| |||||||
Net gain (loss) | 1,907,166 | 98,155,347 | 2,984,254 | |||||||||
|
|
|
|
|
| |||||||
Net increase (decrease) in net assets resulting from operations | $2,047,823 | $106,253,104 | $3,204,438 | |||||||||
|
|
|
|
|
| |||||||
| ||||||||||||
* Foreign taxes withheld on dividends received | — | $67,132 | $12,521 | |||||||||
See accompanying notes to financial statements. | ||||
56 |
|
SIT MUTUAL FUNDS SEMI-ANNUAL REPORT |
|
| Sit Large Cap Growth Fund | Sit ESG Growth Fund | Sit Mid Cap Growth Fund | Sit Small Cap Dividend Growth Fund | Sit Small Cap Growth Fund | Sit International Growth Fund | Sit Developing Markets Growth Fund | ||||||||||||||||||||
| $765,161 | $48,413 | $802,909 | $171,869 | $452,398 | $185,358 | $87,387 | ||||||||||||||||||||
| 6,333 | 806 | 20,410 | 3,772 | 10,879 | 2,377 | 2,110 | ||||||||||||||||||||
|
|
|
|
|
|
|
|
|
|
|
|
|
| |||||||||||||
| 771,494 | 49,219 | 823,319 | 175,641 | 463,277 | 187,735 | 89,497 | ||||||||||||||||||||
|
|
|
|
|
|
|
|
|
|
|
|
|
| |||||||||||||
| 584,495 | 32,416 | 985,545 | 107,010 | 699,443 | 176,039 | 107,791 | ||||||||||||||||||||
| — | 3,100 | — | 4,596 | — | — | — | ||||||||||||||||||||
|
|
|
|
|
|
|
|
|
|
|
|
|
| |||||||||||||
| 584,495 | 35,516 | 985,545 | 111,606 | 699,443 | 176,039 | 107,791 | ||||||||||||||||||||
|
|
|
|
|
|
|
|
|
|
|
|
|
| |||||||||||||
| — | (3,374 | ) | — | (11,081 | ) | — | — | (16,372 | ) | |||||||||||||||||
|
|
|
|
|
|
|
|
|
|
|
|
|
| |||||||||||||
| 584,495 | 32,142 | 985,545 | 100,525 | 699,443 | 176,039 | 91,419 | ||||||||||||||||||||
|
|
|
|
|
|
|
|
|
|
|
|
|
| |||||||||||||
| 186,999 | 17,077 | (162,226 | ) | 75,116 | (236,166 | ) | 11,696 | (1,922 | ) | |||||||||||||||||
|
|
|
|
|
|
|
|
|
|
|
|
|
| |||||||||||||
| 6,043,542 | 15,118 | 7,520,969 | 171,115 | 5,012,086 | 130,288 | 428,323 | ||||||||||||||||||||
| — | (19 | ) | (351 | ) | (7 | ) | — | 628 | (584 | ) | ||||||||||||||||
| | 6,945,369 |
| 539,341 | 1,891,411 | 1,292,085 | 2,123,126 | 1,588,933 | 996,260 | ||||||||||||||||||
|
|
|
|
|
|
|
|
|
|
|
|
|
| |||||||||||||
| 12,988,911 | 554,440 | 9,412,029 | 1,463,193 | 7,135,212 | 1,719,849 | 1,423,999 | ||||||||||||||||||||
|
|
|
|
|
|
|
|
|
|
|
|
|
| |||||||||||||
| $13,175,910 | $571,517 | $9,249,803 | $1,538,309 | $6,899,046 | $1,731,545 | $1,422,077 | ||||||||||||||||||||
|
|
|
|
|
|
|
|
|
|
|
|
|
| |||||||||||||
| — | $1,835 | $2,662 | $1,267 | $2,622 | $12,205 | $14,749 | ||||||||||||||||||||
DECEMBER 31, 2017 |
|
57 |
|
STATEMENTS OF CHANGES IN NET ASSETS
| Sit Balanced Fund | Sit Dividend Growth Fund | |||||||||||||||
| Six Months Ended December 31, 2017, (Unaudited) | Year Ended June 30, 2017 | Six Months Ended December 31, 2017, (Unaudited) | Year Ended June 30, 2017 | |||||||||||||
Operations: | ||||||||||||||||
Net investment income | $140,657 | $291,909 | $8,097,757 | $15,174,483 | ||||||||||||
Net realized gain (loss) on investments and foreign currency transactions | 468,747 | 681,151 | 74,963,338 | 72,506,740 | ||||||||||||
Net change in unrealized appreciation (depreciation) of investments and foreign currency transactions | 1,438,419 | 1,963,274 | 23,192,009 | 59,079,432 | ||||||||||||
|
|
|
|
|
|
|
| |||||||||
Net increase (decrease) in net assets resulting from operations | 2,047,823 | 2,936,334 | 106,253,104 | 146,760,655 | ||||||||||||
|
|
|
|
|
|
|
| |||||||||
Distributions from: | ||||||||||||||||
Net investment income | ||||||||||||||||
Common shares (Class I) | (307,000 | ) | (270,000 | ) | (11,310,056 | ) | (13,709,100 | ) | ||||||||
Common shares (Class S) | — | — | (620,944 | ) | (789,900 | ) | ||||||||||
Net realized gains on investments | ||||||||||||||||
Common shares (Class I) | (1,006,844 | ) | — | (90,926,168 | ) | (60,795,024 | ) | |||||||||
Common shares (Class S) | — | — | (5,944,642 | ) | (4,229,591 | ) | ||||||||||
|
|
|
|
|
|
|
| |||||||||
Total distributions | (1,313,844 | ) | (270,000 | ) | (108,801,810 | ) | (79,523,615 | ) | ||||||||
|
|
|
|
|
|
|
| |||||||||
Capital share transactions: | ||||||||||||||||
Proceeds from shares sold | ||||||||||||||||
Common shares (Class I) | 1,850,086 | 5,470,617 | 121,154,466 | 235,309,300 | ||||||||||||
Common shares (Class S) | — | — | 1,304,842 | 4,759,392 | ||||||||||||
Reinvested distributions | ||||||||||||||||
Common shares (Class I) | 1,299,020 | 268,772 | 39,667,521 | 21,753,300 | ||||||||||||
Common shares (Class S) | — | — | 6,530,714 | 4,974,693 | ||||||||||||
Payments for shares redeemed | ||||||||||||||||
Common shares (Class I) | (1,477,103 | ) | (6,675,093 | ) | (234,544,100 | ) | (246,146,918 | ) | ||||||||
Common shares (Class S) | — | — | (12,814,448 | ) | (16,552,919 | ) | ||||||||||
|
|
|
|
|
|
|
| |||||||||
Increase (decrease) in net assets from capital transactions. | 1,672,003 | (935,704 | ) | (78,701,005 | ) | 4,096,848 | ||||||||||
|
|
|
|
|
|
|
| |||||||||
Total increase (decrease) in net assets | 2,405,982 | 1,730,630 | (81,249,711 | ) | 71,333,888 | |||||||||||
Net assets: | ||||||||||||||||
Beginning of period | 25,241,681 | 23,511,051 | 1,081,198,466 | 1,009,864,578 | ||||||||||||
|
|
|
|
|
|
|
| |||||||||
End of period * | $27,647,663 | $25,241,681 | $999,948,755 | $1,081,198,466 | ||||||||||||
|
|
|
|
|
|
|
| |||||||||
Capital transactions in shares: | ||||||||||||||||
Sold | ||||||||||||||||
Common shares (Class I) | 77,586 | 251,315 | 6,994,100 | 14,366,496 | ||||||||||||
Common shares (Class S) | — | — | 75,004 | 296,303 | ||||||||||||
Reinvested distributions | ||||||||||||||||
Common shares (Class I) | 55,504 | 12,751 | 2,354,550 | 1,378,945 | ||||||||||||
Common shares (Class S) | — | — | 389,327 | 316,539 | ||||||||||||
Redeemed | ||||||||||||||||
Common shares (Class I) | (62,583 | ) | (305,161 | ) | (13,587,646 | ) | (15,130,992 | ) | ||||||||
Common shares (Class S) | — | — | (748,263 | ) | (1,021,341 | ) | ||||||||||
|
|
|
|
|
|
|
| |||||||||
Net increase (decrease) | 70,507 | (41,095 | ) | (4,522,928 | ) | 205,950 | ||||||||||
|
|
|
|
|
|
|
| |||||||||
* includes undistributed (distributions in excess of) net investment income (loss) | ($83,920 | ) | $82,423 | $13,315 | $3,846,558 | |||||||||||
1 The Fund commenced investment operations on June 30, 2016.
See accompanying notes to financial statements. | ||||
58 | SIT MUTUAL FUNDS SEMI-ANNUAL REPORT |
| Sit Global Dividend Growth Fund | Sit Large Cap Growth Fund | Sit ESG Growth Fund | ||||||||||||||||||||
| Six Months Ended December 31, 2017, (Unaudited) | Year Ended June 30, 2017 | Six Months Ended December 31, 2017, (Unaudited) | Year Ended June 30, 2017 | Six Months Ended December 31, 2017, (Unaudited) | Year Ended June 30, 2017 1 | |||||||||||||||||
| $220,184 | $426,320 | $186,999 | $633,963 | $17,077 | $37,896 | |||||||||||||||||
| | 213,946 |
| (233,749 | ) | 6,043,542 | 11,226,235 | 15,099 | (60,493 | ) | |||||||||||||
| | 2,770,308 |
| 2,814,059 | 6,945,369 | 10,499,569 | 539,341 | 553,305 | |||||||||||||||
|
|
|
|
|
|
|
|
|
|
|
| |||||||||||
| 3,204,438 |
| 3,006,630 | 13,175,910 | 22,359,767 | 571,517 | 530,708 | |||||||||||||||
|
|
|
|
|
|
|
|
|
|
|
| |||||||||||
| (323,505 | ) | (354,957 | ) | (460,000 | ) | (571,000 | ) | (27,776 | ) | (4,383 | ) | |||||||||||
| (34,495 | ) | (38,043 | ) | — | — | (21,224 | ) | (1,717 | ) | |||||||||||||
| — | — | (12,334,121 | ) | (7,612,702 | ) | — | — | |||||||||||||||
| — | — | — | — | — | — | |||||||||||||||||
|
|
|
|
|
|
|
|
|
|
|
| |||||||||||
| (358,000 | ) | (393,000 | ) | (12,794,121 | ) | (8,183,702 | ) | (49,000 | ) | (6,100 | ) | |||||||||||
|
|
|
|
|
|
|
|
|
|
|
| |||||||||||
| 1,938,518 | 2,665,400 | 1,846,768 | 2,592,948 | 417,304 | 2,077,200 | |||||||||||||||||
| 197,877 | 409,892 | — | — | 88,166 | 2,072,000 | |||||||||||||||||
| 317,120 | 354,297 | 12,508,440 | 8,064,947 | 27,776 | 4,383 | |||||||||||||||||
| 33,584 | 37,741 | — | — | 21,224 | 1,717 | |||||||||||||||||
| (1,083,555 | ) | (2,041,964 | ) | (10,040,006 | ) | (28,672,696 | ) | (406 | ) | — | ||||||||||||
| (283,225 | ) | (334,935 | ) | — | — | — | (10,199 | ) | ||||||||||||||
|
|
|
|
|
|
|
|
|
|
|
| |||||||||||
| 1,120,319 |
| 1,090,431 | 4,315,202 | (18,014,801 | ) | 554,064 | 4,145,101 | ||||||||||||||
|
|
|
|
|
|
|
|
|
|
|
| |||||||||||
| 3,966,757 | 3,704,061 | 4,696,991 | (3,838,736 | ) | 1,076,581 | 4,669,709 | ||||||||||||||||
| 28,897,262 | 25,193,201 | 113,620,010 | 117,458,746 | 4,669,709 | — | |||||||||||||||||
|
|
|
|
|
|
|
|
|
|
|
| |||||||||||
| $32,864,019 | $28,897,262 | $118,317,001 | $113,620,010 | $5,746,290 | $4,669,709 | |||||||||||||||||
|
|
|
|
|
|
|
|
|
|
|
| |||||||||||
| 128,273 | 194,406 | 43,444 | 66,462 | 35,297 | 207,625 | |||||||||||||||||
| 13,333 | 29,646 | — | — | 7,537 | 206,622 | |||||||||||||||||
| 20,896 | 26,168 | 305,905 | 224,089 | 2,227 | 428 | |||||||||||||||||
| 2,219 | 2,789 | — | — | 1,703 | 168 | |||||||||||||||||
| (69,993 | ) | (151,558 | ) | (234,146 | ) | (750,228 | ) | (33 | ) | — | ||||||||||||
| (17,969 | ) | (24,106 | ) | — | — | — | (978 | ) | ||||||||||||||
|
|
|
|
|
|
|
|
|
|
|
| |||||||||||
| 76,759 | 77,345 | 115,203 | (459,677 | ) | 46,731 | 413,865 | ||||||||||||||||
|
|
|
|
|
|
|
|
|
|
|
| |||||||||||
| | $4,773 |
| $142,589 | $7,440 | $280,441 | $216 | $32,139 | |||||||||||||||
DECEMBER 31, 2017 |
|
59 |
|
STATEMENTS OF CHANGES IN NET ASSETS (Continued)
| Sit Mid Cap Growth Fund | Sit Small Cap Dividend Growth Fund | |||||||||||||||
| Six Months Ended December 31, 2017, (Unaudited) | Year Ended June 30, 2017 | Six Months Ended December 31, 2017, (Unaudited) | Year Ended June 30, 2017 | |||||||||||||
Operations: | ||||||||||||||||
Net investment income (loss) | ($162,226 | ) | ($10,878 | ) | $75,116 | $128,102 | ||||||||||
Net realized gain (loss) on investments and foreign currency transactions | 7,520,618 | 4,151,414 | 171,108 | (155,013 | ) | |||||||||||
Net change in unrealized appreciation (depreciation) of investments and foreign currency transactions | 1,891,411 | 21,044,515 | 1,292,085 | 1,772,310 | ||||||||||||
|
|
|
|
|
|
|
| |||||||||
Net increase (decrease) in net assets resulting from operations | 9,249,803 | 25,185,051 | 1,538,309 | 1,745,399 | ||||||||||||
|
|
|
|
|
|
|
| |||||||||
Distributions from: | ||||||||||||||||
Net investment income | ||||||||||||||||
Common shares (Class I) | (4,961 | ) | — | (96,206 | ) | (87,515 | ) | |||||||||
Common shares (Class S) | — | — | (19,794 | ) | (21,485 | ) | ||||||||||
Net realized gains on investments | ||||||||||||||||
Common shares (Class I) | (6,517,375 | ) | (1,410,787 | ) | — | — | ||||||||||
|
|
|
|
|
|
|
| |||||||||
Total distributions | (6,522,336 | ) | (1,410,787 | ) | (116,000 | ) | (109,000 | ) | ||||||||
|
|
|
|
|
|
|
| |||||||||
Capital share transactions: | ||||||||||||||||
Proceeds from shares sold | ||||||||||||||||
Common shares (Class I) | 942,665 | 1,746,154 | 1,552,423 | 6,275,456 | ||||||||||||
Common shares (Class S) | — | — | 270,047 | 876,893 | ||||||||||||
Reinvested distributions | ||||||||||||||||
Common shares (Class I) | 6,256,872 | 1,364,194 | 93,230 | 83,800 | ||||||||||||
Common shares (Class S) | — | — | 18,850 | 21,044 | ||||||||||||
Payments for shares redeemed | ||||||||||||||||
Common shares (Class I) | (6,743,250 | ) | (10,102,829 | ) | (588,647 | ) | (656,383 | ) | ||||||||
Common shares (Class S) | — | — | (31,600 | ) | (424,301 | ) | ||||||||||
|
|
|
|
|
|
|
| |||||||||
Increase (decrease) in net assets from capital transactions | 456,287 | (6,992,481 | ) | 1,314,303 | 6,176,509 | |||||||||||
|
|
|
|
|
|
|
| |||||||||
Total increase (decrease) in net assets | 3,183,754 | 16,781,783 | 2,736,612 | 7,812,908 | ||||||||||||
Net assets: | ||||||||||||||||
Beginning of period | 156,304,902 | 139,523,119 | 16,176,559 | 8,363,651 | ||||||||||||
|
|
|
|
|
|
|
| |||||||||
End of period* | $159,488,656 | $156,304,902 | $18,913,171 | $16,176,559 | ||||||||||||
|
|
|
|
|
|
|
| |||||||||
Capital transactions in shares: | ||||||||||||||||
Sold | ||||||||||||||||
Common shares (Class I) | 51,102 | 102,473 | 130,283 | 582,458 | ||||||||||||
Common shares (Class S) | — | — | 22,769 | 79,594 | ||||||||||||
Reinvested distributions | ||||||||||||||||
Common shares (Class I) | 339,494 | 83,899 | 7,780 | 7,829 | ||||||||||||
Common shares (Class S) | — | — | 1,574 | 1,981 | ||||||||||||
Redeemed | ||||||||||||||||
Common shares (Class I) | (362,515 | ) | (613,095 | ) | (50,630 | ) | (58,652 | ) | ||||||||
Common shares (Class S) | — | — | (2,762 | ) | (38,205 | ) | ||||||||||
|
|
|
|
|
|
|
| |||||||||
Net increase (decrease) | 28,081 | (426,723 | ) | 109,014 | 575,005 | |||||||||||
|
|
|
|
|
|
|
| |||||||||
* includes undistributed (distributions in excess of) net investment income (loss) | ($162,226 | ) | $4,961 | $3,482 | $44,366 | |||||||||||
See accompanying notes to financial statements. |
60 | SIT MUTUAL FUNDS SEMI-ANNUAL REPORT |
| Sit Small Cap Growth Fund | Sit International Growth Fund | Sit Developing Markets Growth Fund | ||||||||||||||||||||
| Six Months Ended December 31, 2017, (Unaudited) | Year Ended June 30, 2017 | Six Months Ended December 31, 2017, (Unaudited) | Year Ended June 30, 2017 | Six Months Ended December 31, 2017, (Unaudited) | Year Ended June 30, 2017 | |||||||||||||||||
| ($236,166 | ) | ($411,812 | ) | $11,696 | $201,465 | ($1,922 | ) | ($13,702 | ) | |||||||||||||
| | 5,012,086 | 3,000,251 | 130,916 | (523,450 | ) | 427,739 | (16,828 | ) | ||||||||||||||
| | 2,123,126 | 12,418,238 | 1,588,933 | 2,819,488 | 996,260 | 1,716,216 | ||||||||||||||||
|
|
|
|
|
|
|
|
|
|
|
| |||||||||||
| | 6,899,046 | 15,006,677 | 1,731,545 | 2,497,503 | 1,422,077 | 1,685,686 | ||||||||||||||||
|
|
|
|
|
|
|
|
|
|
|
| |||||||||||
| — | — | (197,000 | ) | (97,000 | ) | — | (18,811 | ) | ||||||||||||||
| — | — | — | — | — | — | |||||||||||||||||
| (6,111,266 | ) | (144,732 | ) | — | — | (159,864 | ) | — | ||||||||||||||
|
|
|
|
|
|
|
|
|
|
|
| |||||||||||
| (6,111,266 | ) | (144,732 | ) | (197,000 | ) | (97,000 | ) | (159,864 | ) | (18,811 | ) | |||||||||||
|
|
|
|
|
|
|
|
|
|
|
| |||||||||||
| 952,755 | 1,705,891 | 834,158 | 739,301 | 2,001,641 | 1,191,396 | |||||||||||||||||
| — | — | — | — | — | ||||||||||||||||||
| 6,006,115 | 142,196 | 195,219 | 96,669 | 156,936 | 18,429 | |||||||||||||||||
| — | — | — | — | — | — | |||||||||||||||||
| (2,928,514 | ) | (7,102,157 | ) | (1,196,450 | ) | (1,058,121 | ) | (1,809,058 | ) | (612,094 | ) | |||||||||||
| — | — | — | — | — | — | |||||||||||||||||
|
|
|
|
|
|
|
|
|
|
|
| |||||||||||
| | 4,030,356 | (5,254,070 | ) | (167,073 | ) | (222,151 | ) | 349,519 | 597,731 | |||||||||||||
|
|
|
|
|
|
|
|
|
|
|
| |||||||||||
| 4,818,136 | 9,607,875 | 1,367,472 | 2,178,352 | 1,611,732 | 2,264,606 | |||||||||||||||||
| 90,816,744 | 81,208,869 | 22,618,014 | 20,439,662 | 9,561,115 | 7,296,509 | |||||||||||||||||
|
|
|
|
|
|
|
|
|
|
|
| |||||||||||
| $95,634,880 | $90,816,744 | $23,985,486 | $22,618,014 | $11,172,847 | $9,561,115 | |||||||||||||||||
|
|
|
|
|
|
|
|
|
|
|
| |||||||||||
| 17,116 | 33,242 | 49,262 | 47,796 | 121,258 | 79,312 | |||||||||||||||||
| — | — | — | — | — | — | |||||||||||||||||
| 109,661 | 2,793 | 11,343 | 6,875 | 9,352 | 1,517 | |||||||||||||||||
| — | — | — | — | — | — | |||||||||||||||||
| (51,821 | ) | (141,431 | ) | (70,556 | ) | (72,598 | ) | (108,563 | ) | (48,216 | ) | |||||||||||
| — | — | — | — | — | — | |||||||||||||||||
|
|
|
|
|
|
|
|
|
|
|
| |||||||||||
| 74,956 | (105,396 | ) | (9,951 | ) | (17,927 | ) | 22,047 | 32,613 | ||||||||||||||
|
|
|
|
|
|
|
|
|
|
|
| |||||||||||
| | ($236,166 | ) | — | ($8,083 | ) | $177,221 | ($1,922 | ) | — | |||||||||||||
DECEMBER 31, 2017 |
|
61 |
|
Per share income and capital changes for a share outstanding throughout the period. See accompanying notes to financial statements.
Sit Balanced Fund
| ||||||||||||||||||||||||
| Six Months Ended December 31, 2017 | Years Ended June 30, | |||||||||||||||||||||||
| (Unaudited) | 2017 | 2016 | 2015 | 2014 | 2013 | |||||||||||||||||||
| ||||||||||||||||||||||||
Net Asset Value: | ||||||||||||||||||||||||
Beginning of period | $22.71 | $20.40 | $21.54 | $21.01 | $18.42 | $16.97 | ||||||||||||||||||
|
| |||||||||||||||||||||||
Operations: | ||||||||||||||||||||||||
Net investment income 1 | 0.13 | 0.25 | 0.26 | 0.25 | 0.27 | 0.27 | ||||||||||||||||||
Net realized and unrealized gains | 1.71 | 2.29 | 0.04 | 1.16 | 2.58 | 1.46 | ||||||||||||||||||
|
| |||||||||||||||||||||||
Total from operations | 1.84 | 2.54 | 0.30 | 1.41 | 2.85 | 1.73 | ||||||||||||||||||
|
| |||||||||||||||||||||||
Distributions to Shareholders: | ||||||||||||||||||||||||
From net investment income | (0.27) | (0.23 | ) | (0.45 | ) | (0.24 | ) | (0.26 | ) | (0.28 | ) | |||||||||||||
From net realized gains | (0.89) | — | (0.99 | ) | (0.64 | ) | — | — | ||||||||||||||||
|
| |||||||||||||||||||||||
Total distributions | (1.16) | (0.23 | ) | (1.44 | ) | (0.88 | ) | (0.26 | ) | (0.28 | ) | |||||||||||||
|
| |||||||||||||||||||||||
Net Asset Value: | ||||||||||||||||||||||||
End of period | $23.39 | $22.71 | $20.40 | $21.54 | $21.01 | $18.42 | ||||||||||||||||||
|
| |||||||||||||||||||||||
Total investment return 2 | 8.13% | 12.56% | 1.47% | 6.86% | 15.58% | 10.26% | ||||||||||||||||||
|
| |||||||||||||||||||||||
Net assets at end of period (000’s omitted) | $27,648 | $25,242 | $23,511 | $22,970 | $15,645 | $13,492 | ||||||||||||||||||
Ratios: 3 | ||||||||||||||||||||||||
Expenses | 1.00% | 1.00% | 1.00% | 1.00% | 1.00% | 1.00% | ||||||||||||||||||
Net investment income | 1.08% | 1.18% | 1.25% | 1.17% | 1.36% | 1.52% | ||||||||||||||||||
Portfolio turnover rate (excluding short-term securities) | 21.98%4 | 50.31% | 54.46% | 47.49% | 54.52% | 30.86% | ||||||||||||||||||
| 1 | The net investment income per share is based on average shares outstanding for the period. |
| 2 | Total investment return is based on the change in net asset value of a share during the period (not annualized) and assumes reinvestment of distributions at net asset value. |
| 3 | Ratios are annualized for periods less than one year. In addition to fees and expenses which the Fund bears directly, the Fund indirectly bears a pro rata share of the fees and expenses of the acquired funds in which it invests. Such indirect expenses are not included in the above reported expense ratios. |
| 4 | Not annualized. |
62 |
|
SIT MUTUAL FUNDS SEMI-ANNUAL REPORT |
|
FINANCIAL HIGHLIGHTS
Per share income and capital changes for a share outstanding throughout the period. See accompanying notes to financial statements.
Sit Dividend Growth Fund
| ||||||||||||||||||||||||
| Six Months Ended | ||||||||||||||||||||||||
| Class I | December 31, 2017 | Years Ended June 30, | ||||||||||||||||||||||
| (Unaudited) | 2017 | 2016 | 2015 | 2014 | 2013 | |||||||||||||||||||
| ||||||||||||||||||||||||
Net Asset Value: | ||||||||||||||||||||||||
Beginning of period | $16.88 | $15.82 | $17.40 | $18.69 | $16.35 | $14.10 | ||||||||||||||||||
|
| |||||||||||||||||||||||
Operations: | ||||||||||||||||||||||||
Net investment income 1 | 0.14 | 0.24 | 0.26 | 0.25 | 0.26 | 0.27 | ||||||||||||||||||
Net realized and unrealized gains | 1.66 | 2.09 | 0.32 | 0.92 | 2.96 | 2.46 | ||||||||||||||||||
|
| |||||||||||||||||||||||
Total from operations | 1.80 | 2.33 | 0.58 | 1.17 | 3.22 | 2.73 | ||||||||||||||||||
|
| |||||||||||||||||||||||
Redemption fees 2 | — | — | — | — | — | — | ||||||||||||||||||
|
| |||||||||||||||||||||||
Distributions to Shareholders: | ||||||||||||||||||||||||
From net investment income | (0.20) | (0.23 | ) | (0.32 | ) | (0.25 | ) | (0.25 | ) | (0.26 | ) | |||||||||||||
From net realized gains | (1.68) | (1.04 | ) | (1.84 | ) | (2.21 | ) | (0.63 | ) | (0.22 | ) | |||||||||||||
|
| |||||||||||||||||||||||
Total distributions | (1.88) | (1.27 | ) | (2.16 | ) | (2.46 | ) | (0.88 | ) | (0.48 | ) | |||||||||||||
|
| |||||||||||||||||||||||
Net Asset Value: | ||||||||||||||||||||||||
End of period | $16.80 | $16.88 | $15.82 | $17.40 | $18.69 | $16.35 | ||||||||||||||||||
|
| |||||||||||||||||||||||
Total investment return 3 | 10.71% | 15.41% | 3.94% | 6.39% | 20.26% | 19.77% | ||||||||||||||||||
|
| |||||||||||||||||||||||
Net assets at end of period (000’s omitted) | $939,727 | $1,015,920 | $942,244 | $955,460 | $1,017,106 | $920,324 | ||||||||||||||||||
Ratios: 4 | ||||||||||||||||||||||||
Expenses (without waiver) | 1.00%5 | 1.00% | 1.00% | 1.00% | 1.00% | 1.00% | ||||||||||||||||||
Expenses (with waiver) | 0.85%5 | 1.00% | 1.00% | 1.00% | 1.00% | 1.00% | ||||||||||||||||||
Net investment income (without waiver) | 1.43% | 1.49% | 1.64% | 1.39% | 1.50% | 1.78% | ||||||||||||||||||
Net investment income (with waiver) | 1.58% | 1.49% | 1.64% | 1.39% | 1.50% | 1.78% | ||||||||||||||||||
Portfolio turnover rate (excluding short-term securities) | 32.33%6 | 61.33% | 75.94% | 57.69% | 44.36% | 26.58% | ||||||||||||||||||
| 1 | The net investment income per share is based on average shares outstanding for the period. |
| 2 | Amount represents less than $0.01 per share. |
| 3 | Total investment return is based on the change in net asset value of a share during the period (not annualized) and assumes reinvestment of distributions at net asset value. |
| 4 | Ratios are annualized for periods less than one year. In addition to fees and expenses which the Fund bears directly, the Fund indirectly bears a pro rata share of the fees and expenses of the acquired funds in which it invests. Such indirect expenses are not included in the above reported expense ratios. |
| 5 | Total Fund expenses are limited to 1.00% of average daily net assets. However, during the period above, the investment advisor voluntarily absorbed expenses that were otherwise payable by the Fund. |
| 6 | Not annualized. |
DECEMBER 31, 2017 |
63 |
FINANCIAL HIGHLIGHTS
Per share income and capital changes for a share outstanding throughout the period. See accompanying notes to financial statements. (Continued)
Sit Dividend Growth Fund
| ||||||||||||||||||||||||
| Six Months Ended | ||||||||||||||||||||||||
| Class S | December 31, 2017 | Years Ended June 30, | ||||||||||||||||||||||
| (Unaudited) | 2017 | 2016 | 2015 | 2014 | 2013 | |||||||||||||||||||
| ||||||||||||||||||||||||
Net Asset Value: | ||||||||||||||||||||||||
Beginning of period | $16.81 | $15.76 | $17.34 | $18.63 | $16.29 | $14.06 | ||||||||||||||||||
|
| |||||||||||||||||||||||
Operations: | ||||||||||||||||||||||||
Net investment income 1 | 0.11 | 0.20 | 0.22 | 0.21 | 0.22 | 0.23 | ||||||||||||||||||
Net realized and unrealized gains | 1.66 | 2.08 | 0.32 | 0.91 | 2.96 | 2.44 | ||||||||||||||||||
|
| |||||||||||||||||||||||
Total from operations | 1.77 | 2.28 | 0.54 | 1.12 | 3.18 | 2.67 | ||||||||||||||||||
|
| |||||||||||||||||||||||
Redemption fees | — | — | 2 | — | 2 | — | 2 | — | 2 | — | 2 | |||||||||||||
|
| |||||||||||||||||||||||
Distributions to Shareholders: | ||||||||||||||||||||||||
From net investment income | (0.17) | (0.19 | ) | (0.28 | ) | (0.20 | ) | (0.21 | ) | (0.22 | ) | |||||||||||||
From net realized gains | (1.68) | (1.04 | ) | (1.84 | ) | (2.21 | ) | (0.63 | ) | (0.22 | ) | |||||||||||||
|
| |||||||||||||||||||||||
Total distributions | (1.85) | (1.23 | ) | (2.12 | ) | (2.41 | ) | (0.84 | ) | (0.44 | ) | |||||||||||||
|
| |||||||||||||||||||||||
Net Asset Value: | ||||||||||||||||||||||||
End of period | $16.73 | $16.81 | $15.76 | $17.34 | $18.63 | $16.29 | ||||||||||||||||||
|
| |||||||||||||||||||||||
Total investment return 3 | 10.55% | 15.11% | 3.68% | 6.13% | 20.02% | 19.39% | ||||||||||||||||||
|
| |||||||||||||||||||||||
Net assets at end of period (000’s omitted) | $60,222 | $65,278 | $67,620 | $82,959 | $103,433 | $134,498 | ||||||||||||||||||
Ratios: 4 | ||||||||||||||||||||||||
Expenses (without waiver) | 1.25%5 | 1.25% | 1.25% | 1.25% | 1.25% | 1.25% | ||||||||||||||||||
Expenses (with waiver) | 1.10%5 | 1.25% | 1.25% | 1.25% | 1.25% | 1.25% | ||||||||||||||||||
Net investment income (without waiver) | 1.18% | 1.24% | 1.39% | 1.14% | 1.25% | 1.53% | ||||||||||||||||||
Net investment income (with waiver) | 1.33% | 1.24% | 1.39% | 1.14% | 1.25% | 1.53% | ||||||||||||||||||
Portfolio turnover rate (excluding short-term securities) | 32.33%6 | 61.33% | 75.94% | 57.69% | 44.36% | 26.58% | ||||||||||||||||||
| 1 | The net investment income per share is based on average shares outstanding for the period. |
| 2 | Amount represents less than $0.01 per share. |
| 3 | Total investment return is based on the change in net asset value of a share during the period (not annualized) and assumes reinvestment of distributions at net asset value. |
| 4 | Ratios are annualized for periods less than one year. In addition to fees and expenses which the Fund bears directly, the Fund indirectly bears a pro rata share of the fees and expenses of the acquired funds in which it invests. Such indirect expenses are not included in the above reported expense ratios. |
| 5 | Total Fund expenses are limited to 1.25% of average daily net assets. However, during the period above, the investment advisor voluntarily absorbed expenses that were otherwise payable by the Fund. |
| 6 | Not annualized. |
64 |
|
SIT MUTUAL FUNDS SEMI-ANNUAL REPORT |
|
FINANCIAL HIGHLIGHTS
Per share income and capital changes for a share outstanding throughout the period. See accompanying notes to financial statements.
Sit Global Dividend Growth Fund
| ||||||||||||||||||||||||
| Six Months Ended | ||||||||||||||||||||||||
| Class I | December 31, 2017 | Years Ended June 30, | ||||||||||||||||||||||
| (Unaudited) | 2017 | 2016 | 2015 | 2014 | 2013 | |||||||||||||||||||
| ||||||||||||||||||||||||
Net Asset Value: | ||||||||||||||||||||||||
Beginning of period | $14.54 | $13.19 | $14.80 | $15.74 | $14.27 | $12.55 | ||||||||||||||||||
|
| |||||||||||||||||||||||
Operations: | ||||||||||||||||||||||||
Net investment income 1 | 0.11 | 0.22 | 0.21 | 0.20 | 0.23 | 0.25 | ||||||||||||||||||
Net realized and unrealized gains (losses) | 1.45 | 1.34 | (0.48 | ) | 0.13 | 2.09 | 1.78 | |||||||||||||||||
|
| |||||||||||||||||||||||
Total from operations | 1.56 | 1.56 | (0.27 | ) | 0.33 | 2.32 | 2.03 | |||||||||||||||||
|
| |||||||||||||||||||||||
Redemption fees | — | — | 2 | — | — | — | 2 | — | 2 | |||||||||||||||
|
| |||||||||||||||||||||||
Distributions to Shareholders: | ||||||||||||||||||||||||
From net investment income | (0.18) | (0.21 | ) | (0.34 | ) | (0.20 | ) | (0.22 | ) | (0.23 | ) | |||||||||||||
From net realized gains | — | — | (1.00 | ) | (1.07 | ) | (0.63 | ) | (0.08 | ) | ||||||||||||||
|
| |||||||||||||||||||||||
Total distributions | (0.18) | (0.21 | ) | (1.34 | ) | (1.27 | ) | (0.85 | ) | (0.31 | ) | |||||||||||||
|
| |||||||||||||||||||||||
Net Asset Value: | ||||||||||||||||||||||||
End of period | $15.92 | $14.54 | $13.19 | $14.80 | $15.74 | $14.27 | ||||||||||||||||||
|
| |||||||||||||||||||||||
Total investment return 3 | 10.80% | 11.94% | (1.67% | ) | 2.19% | 16.76% | 16.36% | |||||||||||||||||
|
| |||||||||||||||||||||||
Net assets at end of period (000’s omitted) | $29,315 | $25,623 | $22,333 | $21,424 | $21,467 | $14,196 | ||||||||||||||||||
Ratios: 4 | ||||||||||||||||||||||||
Expenses (without waiver) | 1.25%5 | 1.25% | 1.25% | 1.25% | 1.25% | 1.25% | ||||||||||||||||||
Expenses (with waiver) | 1.12%5 | 1.25% | 1.25% | 1.25% | 1.25% | 1.25% | ||||||||||||||||||
Net investment income (without waiver) | 1.33% | 1.63% | 1.56% | 1.33% | 1.55% | 1.81% | ||||||||||||||||||
Net investment income (with waiver) | 1.45% | 1.63% | 1.56% | 1.33% | 1.55% | 1.81% | ||||||||||||||||||
Portfolio turnover rate (excluding short-term securities) | 8.02%6 | 32.04% | 48.30% | 75.06% | 48.68% | 26.15% | ||||||||||||||||||
| 1 | The net investment income per share is based on average shares outstanding for the period. |
| 2 | Amount represents less than $0.01 per share. |
| 3 | Total investment return is based on the change in net asset value of a share during the period (not annualized) and assumes reinvestment of distributions at net asset value. |
| 4 | Ratios are annualized for periods less than one year. In addition to fees and expenses which the Fund bears directly, the Fund indirectly bears a pro rata share of the fees and expenses of the acquired funds in which it invests. Such indirect expenses are not included in the above reported expense ratios. |
| 5 | Total Fund expenses are limited to 1.25% of average daily net assets. However, during the period above, the investment advisor voluntarily absorbed expenses that were otherwise payable by the Fund. |
| 6 | Not annualized. |
DECEMBER 31, 2017 |
65 |
FINANCIAL HIGHLIGHTS
Per share income and capital changes for a share outstanding throughout the period. See accompanying notes to financial statements. (Continued)
Sit Global Dividend Growth Fund
| ||||||||||||||||||||||||
| Six Months Ended | ||||||||||||||||||||||||
| Class S | December 31, 2017 | Years Ended June 30, | ||||||||||||||||||||||
| (Unaudited) | 2017 | 2016 | 2015 | 2014 | 2013 | |||||||||||||||||||
| ||||||||||||||||||||||||
Net Asset Value: | ||||||||||||||||||||||||
Beginning of period | $14.53 | $13.18 | $14.78 | $15.72 | $14.25 | $12.54 | ||||||||||||||||||
|
| |||||||||||||||||||||||
Operations: | ||||||||||||||||||||||||
Net investment income 1 | 0.09 | 0.19 | 0.18 | 0.16 | 0.20 | 0.21 | ||||||||||||||||||
Net realized and unrealized gains (losses) | 1.45 | 1.33 | (0.48 | ) | 0.13 | 2.09 | 1.78 | |||||||||||||||||
|
| |||||||||||||||||||||||
Total from operations | 1.54 | 1.52 | (0.30 | ) | 0.29 | 2.29 | 1.99 | |||||||||||||||||
|
| |||||||||||||||||||||||
Redemption fees | — | — | — | — | — | 2 | — | |||||||||||||||||
Distributions to Shareholders: |
|
| ||||||||||||||||||||||
From net investment income | (0.15) | (0.17 | ) | (0.30 | ) | (0.16 | ) | (0.19 | ) | (0.20 | ) | |||||||||||||
From net realized gains | — | — | (1.00 | ) | (1.07 | ) | (0.63 | ) | (0.08 | ) | ||||||||||||||
|
| |||||||||||||||||||||||
Total distributions. | (0.15) | (0.17 | ) | (1.30 | ) | (1.23 | ) | (0.82 | ) | (0.28 | ) | |||||||||||||
|
| |||||||||||||||||||||||
Net Asset Value: | ||||||||||||||||||||||||
End of period | $15.92 | $14.53 | $13.18 | $14.78 | $15.72 | $14.25 | ||||||||||||||||||
|
| |||||||||||||||||||||||
Total investment return 3 | 10.67% | 11.67% | (1.89% | ) | 2.00% | 16.49% | 16.01% | |||||||||||||||||
|
| |||||||||||||||||||||||
Net assets at end of period (000’s omitted) | $3,549 | $3,274 | $2,861 | $3,451 | $3,323 | $3,257 | ||||||||||||||||||
Ratios: 4 | ||||||||||||||||||||||||
Expenses (without waiver) | 1.50%5 | 1.50% | 1.50% | 1.50% | 1.50% | 1.50% | ||||||||||||||||||
Expenses (with waiver) | 1.37%5 | 1.50% | 1.50% | 1.50% | 1.50% | 1.50% | ||||||||||||||||||
Net investment income (without waiver) | 1.08% | 1.38% | 1.31% | 1.08% | 1.30% | 1.56% | ||||||||||||||||||
Net investment income (with waiver) | 1.20% | 1.38% | 1.31% | 1.08% | 1.30% | 1.56% | ||||||||||||||||||
Portfolio turnover rate (excluding short-term securities) | 8.02%6 | 32.04% | 48.30% | 75.06% | 48.68% | 26.15% | ||||||||||||||||||
| 1 | The net investment income per share is based on average shares outstanding for the period. |
| 2 | Amount represents less than $0.01 per share. |
| 3 | Total investment return is based on the change in net asset value of a share during the period (not annualized) and assumes reinvestment of distributions at net asset value. |
| 4 | Ratios are annualized for periods less than one year. In addition to fees and expenses which the Fund bears directly, the Fund indirectly bears a pro rata share of the fees and expenses of the acquired funds in which it invests. Such indirect expenses are not included in the above reported expense ratios. |
| 5 | Total Fund expenses are limited to 1.50% of average daily net assets. However, during the period above, the investment advisor voluntarily absorbed expenses that were otherwise payable by the Fund. |
| 6 | Not annualized. |
66 |
|
SIT MUTUAL FUNDS SEMI-ANNUAL REPORT |
|
FINANCIAL HIGHLIGHTS
Per share income and capital changes for a share outstanding throughout the period. See accompanying notes to financial statements.
Sit Large Cap Growth Fund
| ||||||||||||||||||||||||
| Six Months Ended December 31, 2017 | Years Ended June 30, | |||||||||||||||||||||||
| (Unaudited) | 2017 | 2016 | 2015 | 2014 | 2013 | |||||||||||||||||||
| ||||||||||||||||||||||||
Net Asset Value: | ||||||||||||||||||||||||
Beginning of period | $40.56 | $36.02 | $47.21 | $52.51 | $47.53 | $45.53 | ||||||||||||||||||
|
| |||||||||||||||||||||||
Operations: | ||||||||||||||||||||||||
Net investment income 1 | 0.07 | 0.21 | 0.18 | 0.20 | 0.29 | 0.43 | ||||||||||||||||||
Net realized and unrealized gains (losses) | 4.77 | 7.07 | (0.42 | ) | 5.04 | 10.23 | 5.69 | |||||||||||||||||
|
| |||||||||||||||||||||||
Total from operations | 4.84 | 7.28 | (0.24 | ) | 5.24 | 10.52 | 6.12 | |||||||||||||||||
|
| |||||||||||||||||||||||
Redemption fees 2 | — | — | — | — | — | — | ||||||||||||||||||
|
| |||||||||||||||||||||||
Distributions to Shareholders: | ||||||||||||||||||||||||
From net investment income | (0.17) | (0.19 | ) | (1.44 | ) | (0.24 | ) | (0.39 | ) | (0.46 | ) | |||||||||||||
From net realized gains | (4.67) | (2.55 | ) | (9.51 | ) | (10.30 | ) | (5.15 | ) | (3.66 | ) | |||||||||||||
|
| |||||||||||||||||||||||
Total distributions | (4.84) | (2.74 | ) | (10.95 | ) | (10.54 | ) | (5.54 | ) | (4.12 | ) | |||||||||||||
|
| |||||||||||||||||||||||
Net Asset Value: | ||||||||||||||||||||||||
End of period | $40.56 | $40.56 | $36.02 | $47.21 | $52.51 | $47.53 | ||||||||||||||||||
|
| |||||||||||||||||||||||
Total investment return 3 | 11.86% | 21.18% | (0.89%) | 10.62% | 22.92% | 14.18% | ||||||||||||||||||
|
| |||||||||||||||||||||||
Net assets at end of period (000’s omitted) | $118,317 | $113,620 | $117,459 | $144,807 | $188,574 | $196,285 | ||||||||||||||||||
Ratios: 4 | ||||||||||||||||||||||||
Expenses | 1.00% | 1.00% | 1.00% | 1.00% | 1.00% | 1.00% | ||||||||||||||||||
Net investment income | 0.32% | 0.54% | 0.44% | 0.41% | 0.57% | 0.92% | ||||||||||||||||||
Portfolio turnover rate (excluding short-term securities) | 5.84%5 | 17.69% | 20.05% | 24.04% | 27.34% | 13.42% | ||||||||||||||||||
| 1 | The net investment income per share is based on average shares outstanding for the period. |
| 2 | Amount represents less than $0.01 per share. |
| 3 | Total investment return is based on the change in net asset value of a share during the period (not annualized) and assumes reinvestment of distributions at net asset value. |
| 4 | Ratios are annualized for periods less than one year. In addition to fees and expenses which the Fund bears directly, the Fund indirectly bears a pro rata share of the fees and expenses of the acquired funds in which it invests. Such indirect expenses are not included in the above reported expense ratios. |
| 5 | Not annualized. |
DECEMBER 31, 2017 |
|
67 |
|
FINANCIAL HIGHLIGHTS
Per share income and capital changes for a share outstanding throughout the period. See accompanying notes to financial statements.
Sit ESG Growth Fund
| Class I | Six Months Ended December 31, 2017 (Unaudited) | Year Ended June 30, 2017 * | ||||||
Net Asset Value: | ||||||||
Beginning of period | $11.29 | $10.00 | ||||||
Operations: | ||||||||
Net investment income 1 | 0.05 | 0.11 | ||||||
Net realized and unrealized gains | 1.25 | 1.20 | ||||||
Total from operations | 1.30 | 1.31 | ||||||
Distributions to Shareholders: | ||||||||
From net investment income | (0.11) | (0.02) | ||||||
Net Asset Value: | ||||||||
End of period | $12.48 | $11.29 | ||||||
Total investment return 2 | 11.55% | 13.13% | ||||||
Net assets at end of period (000’s omitted) | $3,065 | $2,349 | ||||||
Ratios: 3 | ||||||||
Expenses (without waiver) | 1.25%4 | 1.25% | ||||||
Expenses (with waiver) | 1.12%4 | 1.25% | ||||||
Net investment income (without waiver) | 0.65% | 1.01% | ||||||
Net investment income (with waiver) | 0.78% | 1.01% | ||||||
Portfolio turnover rate (excluding short-term securities) | 3.44%5 | 27.60% | ||||||
| * | The Fund commenced investment operations on June 30, 2016. |
| 1 | The net investment income per share is based on average shares outstanding for the period. |
| 2 | Total investment return is based on the change in net asset value of a share during the period (not annualized) and assumes reinvestment of distributions at net asset value. |
| 3 | Ratios are annualized for periods less than one year. In addition to fees and expenses which the Fund bears directly, the Fund indirectly bears a pro rata share of the fees and expenses of the acquired funds in which it invests. Such indirect expenses are not included in the above reported expense ratios. |
| 4 | Total Fund expenses are limited to 1.25% of average daily net assets. However, during the period above, the investment advisor voluntarily absorbed expenses that were otherwise payable by the Fund. |
| 5 | Not annualized. |
68 |
|
SIT MUTUAL FUNDS SEMI-ANNUAL REPORT |
|
FINANCIAL HIGHLIGHTS
Per share income and capital changes for a share outstanding throughout the period. See accompanying notes to financial statements. (Continued)
Sit ESG Growth Fund
| Class S | Six Months Ended December 31, 2017 | Year Ended June 30, 2017 * | ||||||
Net Asset Value: | ||||||||
Beginning of period | $11.28 | $10.00 | ||||||
Operations: | ||||||||
Net investment income 1 | 0.03 | 0.08 | ||||||
Net realized and unrealized gains | 1.26 | 1.21 | ||||||
Total from operations | 1.29 | 1.29 | ||||||
Distributions to Shareholders: | ||||||||
From net investment income | (0.10) | (0.01) | ||||||
Net Asset Value: | ||||||||
End of period | $12.47 | $11.28 | ||||||
Total investment return 2 | 11.53% | 12.79% | ||||||
Net assets at end of period (000’s omitted) | $2,681 | $2,321 | ||||||
Ratios: 3 | ||||||||
Expenses (without waiver) | 1.50%4 | 1.50% | ||||||
Expenses (with waiver) | 1.37%4 | 1.50% | ||||||
Net investment income (without waiver) | 0.40% | 0.76% | ||||||
Net investment income (with waiver) | 0.53% | 0.76% | ||||||
Portfolio turnover rate (excluding short-term securities) | 3.44%5 | 27.60% | ||||||
| * | The Fund commenced investment operations on June 30, 2016. |
| 1 | The net investment income per share is based on average shares outstanding for the period. |
| 2 | Total investment return is based on the change in net asset value of a share during the period (not annualized) and assumes reinvestment of distributions at net asset value. |
| 3 | Ratios are annualized for periods less than one year. In addition to fees and expenses which the Fund bears directly, the Fund indirectly bears a pro rata share of the fees and expenses of the acquired funds in which it invests. Such indirect expenses are not included in the above reported expense ratios. |
| 4 | Total Fund expenses are limited to 1.50% of average daily net assets. However, during the period above, the investment advisor voluntarily absorbed expenses that were otherwise payable by the Fund. |
| 5 | Not annualized. |
DECEMBER 31, 2017 |
|
69 |
|
FINANCIAL HIGHLIGHTS
Per share income and capital changes for a share outstanding throughout the period. See accompanying notes to financial statements.
Sit Mid Cap Growth Fund
| ||||||||||||||||||||||||
| Six Months Ended December 31, 2017 | Years Ended June 30, | |||||||||||||||||||||||
| (Unaudited) | 2017 | 2016 | 2015 | 2014 | 2013 | |||||||||||||||||||
| ||||||||||||||||||||||||
Net Asset Value: | ||||||||||||||||||||||||
Beginning of period | $18.06 | $15.36 | $20.22 | $21.08 | $17.69 | $15.77 | ||||||||||||||||||
|
| |||||||||||||||||||||||
Operations: | ||||||||||||||||||||||||
Net investment loss 1 | (0.02) | — | 2 | (0.04 | ) | (0.06 | ) | (0.07 | ) | (0.03 | ) | |||||||||||||
Net realized and unrealized gains (losses) | 1.10 | 2.86 | (1.92 | ) | 1.91 | 4.54 | 2.32 | |||||||||||||||||
|
| |||||||||||||||||||||||
Total from operations | 1.08 | 2.86 | (1.96 | ) | 1.85 | 4.47 | 2.29 | |||||||||||||||||
|
| |||||||||||||||||||||||
Redemption fees 2 | — | — | — | — | — | — | ||||||||||||||||||
|
| |||||||||||||||||||||||
Distributions to Shareholders: | ||||||||||||||||||||||||
From net investment income | — 2 | — | — | — | — | — | ||||||||||||||||||
From net realized gains | (0.78) | (0.16 | ) | (2.90 | ) | (2.71 | ) | (1.08 | ) | (0.37 | ) | |||||||||||||
|
| |||||||||||||||||||||||
Total distributions | (0.78) | (0.16 | ) | (2.90 | ) | (2.71 | ) | (1.08 | ) | (0.37 | ) | |||||||||||||
|
| |||||||||||||||||||||||
Net Asset Value: | ||||||||||||||||||||||||
End of period | $18.36 | $18.06 | $15.36 | $20.22 | $21.08 | $17.69 | ||||||||||||||||||
|
| |||||||||||||||||||||||
Total investment return 3 | 5.96% | 18.74% | (9.97% | ) | 9.52% | 25.58% | 14.70% | |||||||||||||||||
|
| |||||||||||||||||||||||
Net assets at end of period (000’s omitted) | $159,489 | $156,305 | $139,523 | $171,854 | $180,276 | $152,129 | ||||||||||||||||||
Ratios: 4 | ||||||||||||||||||||||||
Expenses | 1.25% | 1.25% | 1.25% | 1.25% | 1.25% | 1.25% | ||||||||||||||||||
Net investment loss | (0.21%) | (0.01% | ) | (0.23% | ) | (0.30% | ) | (0.37% | ) | (0.17% | ) | |||||||||||||
Portfolio turnover rate (excluding short-term securities) | 14.52%5 | 23.02% | 21.57% | 23.39% | 27.65% | 16.91% | ||||||||||||||||||
| 1 | The net investment income (loss) per share is based on average shares outstanding for the period. |
| 2 | Amount represents less than $0.01 per share. |
| 3 | Total investment return is based on the change in net asset value of a share during the period (not annualized) and assumes reinvestment of distributions at net asset value. |
| 4 | Ratios are annualized for periods less than one year. In addition to fees and expenses which the Fund bears directly, the Fund indirectly bears a pro rata share of the fees and expenses of the acquired funds in which it invests. Such indirect expenses are not included in the above reported expense ratios. |
| 5 | Not annualized. |
70 |
|
SIT MUTUAL FUNDS SEMI-ANNUAL REPORT |
|
FINANCIAL HIGHLIGHTS
Per share income and capital changes for a share outstanding throughout the period. See accompanying notes to financial statements.
Sit Small Cap Dividend Growth Fund
| ||||||||||||||||
| Class I | Six Months Ended December 31, 2017 | Year Ended | Year Ended | Three Months Ended | ||||||||||||
| (Unaudited) | June 30, 2017 | June 30, 2016 | June 30, 2015 * | |||||||||||||
| ||||||||||||||||
Net Asset Value: | ||||||||||||||||
Beginning of period | $11.47 | $10.00 | $9.96 | $10.00 | ||||||||||||
|
| |||||||||||||||
Operations: | ||||||||||||||||
Net investment income 1 | 0.05 | 0.12 | 0.14 | 0.02 | ||||||||||||
Net realized and unrealized gains (losses) | 1.00 | 1.46 | 0.02 | (0.06) | ||||||||||||
|
| |||||||||||||||
Total from operations | 1.05 | 1.58 | 0.16 | (0.04) | ||||||||||||
|
| |||||||||||||||
Distributions to Shareholders: | ||||||||||||||||
From net investment income | (0.08) | (0.11 | ) | (0.12 | ) | — | ||||||||||
From net realized gains | — | — | — | 2 | — | |||||||||||
|
| |||||||||||||||
Total distributions | (0.08) | (0.11 | ) | (0.12 | ) | — | ||||||||||
|
| |||||||||||||||
Net Asset Value: | ||||||||||||||||
End of period | $12.44 | $11.47 | $10.00 | $9.96 | ||||||||||||
|
| |||||||||||||||
Total investment return 3 | 9.23% | 15.84% | 1.71% | (0.40%) | ||||||||||||
|
| |||||||||||||||
Net assets at end of period (000’s omitted) | $14,887 | $12,716 | $5,777 | $3,708 | ||||||||||||
Ratios: 4 | ||||||||||||||||
Expenses (without waiver) | 1.25%5 | 1.25% | 1.25% | 1.25% | ||||||||||||
Expenses (with waiver) | 1.12%5 | 1.25% | 1.25% | 1.25% | ||||||||||||
Net investment income (without waiver) | 0.80% | 1.06% | 1.46% | 0.98% | ||||||||||||
Net investment income (with waiver) | 0.93% | 1.06% | 1.46% | 0.98% | ||||||||||||
Portfolio turnover rate (excluding short-term securities) | 14.03%6 | 19.57% | 26.43% | 2.63%6 | ||||||||||||
| * | The Fund commenced investment operations on March 31, 2015. |
| 1 | The net investment income per share is based on average shares outstanding for the period. |
| 2 | Amount represents less than $0.01 per share. |
| 3 | Total investment return is based on the change in net asset value of a share during the period (not annualized) and assumes reinvestment of distributions at net asset value. |
| 4 | Ratios are annualized for periods less than one year. In addition to fees and expenses which the Fund bears directly, the Fund indirectly bears a pro rata share of the fees and expenses of the acquired funds in which it invests. Such indirect expenses are not included in the above reported expense ratios. |
| 5 | Total Fund expenses are limited to 1.25% of average daily net assets. However, during the period above, the investment advisor voluntarily absorbed expenses that were otherwise payable by the Fund. |
| 6 | Not annualized. |
DECEMBER 31, 2017 |
|
71 |
|
FINANCIAL HIGHLIGHTS
Per share income and capital changes for a share outstanding throughout the period. See accompanying notes to financial statements. (Continued)
Sit Small Cap Dividend Growth Fund
| ||||||||||||||
| Class S | Six Months Ended December 31, 2017 (Unaudited) | Year Ended June 30, 2017 | Year Ended June 30, 2016 | Three Months Ended June 30, 2015 * | ||||||||||
| ||||||||||||||
Net Asset Value: | ||||||||||||||
Beginning of period | $11.46 | $10.00 | $9.96 | $10.00 | ||||||||||
|
| |||||||||||||
Operations: | ||||||||||||||
Net investment income 1 | 0.04 | 0.09 | 0.11 | 0.02 | ||||||||||
Net realized and unrealized gains (losses) | 1.00 | 1.45 | 0.03 | (0.06) | ||||||||||
|
| |||||||||||||
Total from operations | 1.04 | 1.54 | 0.14 | (0.04) | ||||||||||
|
| |||||||||||||
Distributions to Shareholders: | ||||||||||||||
From net investment income | (0.06) | (0.08) | (0.10) | — | ||||||||||
From net realized gains | — | — | — 2 | — | ||||||||||
|
| |||||||||||||
Total distributions | (0.06) | (0.08) | (0.10) | — | ||||||||||
|
| |||||||||||||
Net Asset Value: | ||||||||||||||
End of period | $12.44 | $11.46 | $10.00 | $9.96 | ||||||||||
|
| |||||||||||||
Total investment return 3 | 9.13% | 15.46% | 1.46% | (0.40%) | ||||||||||
|
| |||||||||||||
Net assets at end of period (000’s omitted) | $4,026 | $3,461 | $2,587 | $2,230 | ||||||||||
Ratios: 4 | ||||||||||||||
Expenses (without waiver) | 1.50%5 | 1.50% | 1.50% | 1.50% | ||||||||||
Expenses (with waiver) | 1.37%5 | 1.50% | 1.50% | 1.50% | ||||||||||
Net investment income (without waiver) | 0.55% | 0.81% | 1.21% | 0.73% | ||||||||||
Net investment income (with waiver) | 0.68% | 0.81% | 1.21% | 0.73% | ||||||||||
Portfolio turnover rate (excluding short-term securities) | 14.03%6 | 19.57% | 26.43% | 2.63%6 | ||||||||||
| * | The Fund commenced investment operations on March 31, 2015. |
| 1 | The net investment income per share is based on average shares outstanding for the period. |
| 2 | Amount represents less than $0.01 per share. |
| 3 | Total investment return is based on the change in net asset value of a share during the period (not annualized) and assumes reinvestment of distributions at net asset value. |
| 4 | Ratios are annualized for periods less than one year. In addition to fees and expenses which the Fund bears directly, the Fund indirectly bears a pro rata share of the fees and expenses of the acquired funds in which it invests. Such indirect expenses are not included in the above reported expense ratios. |
| 5 | Total Fund expenses are limited to 1.50% of average daily net assets. However, during the period above, the investment advisor voluntarily absorbed expenses that were otherwise payable by the Fund. |
| 6 | Not annualized. |
72 |
|
SIT MUTUAL FUNDS SEMI-ANNUAL REPORT |
|
FINANCIAL HIGHLIGHTS
Per share income and capital changes for a share outstanding throughout the period. See accompanying notes to financial statements.
Sit Small Cap Growth Fund
| ||||||||||||||||||||||||||||||
| Six Months Ended | ||||||||||||||||||||||||||||||
| December 31, 2017 | Years Ended June 30, | |||||||||||||||||||||||||||||
| (Unaudited) | 2017 | 2016 | 2015 | 2014 | 2013 | |||||||||||||||||||||||||
| ||||||||||||||||||||||||||||||
Net Asset Value: | ||||||||||||||||||||||||||||||
Beginning of period | $54.18 | $45.59 | $60.10 | $61.38 | $50.08 | $43.90 | ||||||||||||||||||||||||
|
| |||||||||||||||||||||||||||||
Operations: | ||||||||||||||||||||||||||||||
Net investment loss 1 | (0.14 | ) | (0.24 | ) | (0.33 | ) | (0.48 | ) | (0.55 | ) | (0.30 | ) | ||||||||||||||||||
Net realized and unrealized gains (losses) | 4.30 | 8.91 | (8.97 | ) | 6.26 | 11.85 | 6.48 | |||||||||||||||||||||||
|
| |||||||||||||||||||||||||||||
Total from operations | 4.16 | 8.67 | (9.30 | ) | 5.78 | 11.30 | 6.18 | |||||||||||||||||||||||
|
| |||||||||||||||||||||||||||||
Redemption fees | — | — | 2 | — | 2 | — | 2 | — | 2 | — | 2 | |||||||||||||||||||
|
| |||||||||||||||||||||||||||||
Distributions to Shareholders: | ||||||||||||||||||||||||||||||
From net realized gains | (3.72 | ) | (0.08 | ) | (5.21 | ) | (7.06 | ) | — | — | ||||||||||||||||||||
|
| |||||||||||||||||||||||||||||
Net Asset Value: | ||||||||||||||||||||||||||||||
End of period | $54.62 | $54.18 | $45.59 | $60.10 | $61.38 | $50.08 | ||||||||||||||||||||||||
|
| |||||||||||||||||||||||||||||
Total investment return 3 | 7.64% | 19.06% | (16.00% | ) | 10.38% | 22.56% | 14.08% | |||||||||||||||||||||||
|
| |||||||||||||||||||||||||||||
Net assets at end of period (000’s omitted) | $95,635 | $90,817 | $81,209 | $103,816 | $99,510 | $84,793 | ||||||||||||||||||||||||
Ratios: 4 | ||||||||||||||||||||||||||||||
Expenses | 1.50% | 1.50% | 1.50% | 1.50% | 1.50% | 1.50% | ||||||||||||||||||||||||
Net investment loss | (0.51% | ) | (0.47% | ) | (0.65% | ) | (0.81% | ) | (0.94% | ) | (0.64% | ) | ||||||||||||||||||
Portfolio turnover rate (excluding short-term securities) | 17.10%5 | 29.08% | 27.37% | 31.07% | 33.38% | 28.36% | ||||||||||||||||||||||||
1 The net investment income (loss) per share is based on average shares outstanding for the period.
2 Amount represents less than $0.01 per share.
3 Total investment return is based on the change in net asset value of a share during the period (not annualized) and assumes reinvestment of distributions at net asset value.
4 Ratios are annualized for periods less than one year. In addition to fees and expenses which the Fund bears directly, the Fund indirectly bears a pro rata share of the fees and expenses of the acquired funds in which it invests. Such indirect expenses are not included in the above reported expense ratios.
5 Not annualized. |
DECEMBER 31, 2017 |
|
73 |
|
FINANCIAL HIGHLIGHTS
Per share income and capital changes for a share outstanding throughout the period. See accompanying notes to financial statements.
Sit International Growth Fund
| ||||||||||||||||||||||||||||||
| Six Months Ended | ||||||||||||||||||||||||||||||
| December 31, 2017 | Years Ended June 30, | |||||||||||||||||||||||||||||
| (Unaudited) | 2017 | 2016 | 2015 | 2014 | 2013 | |||||||||||||||||||||||||
| ||||||||||||||||||||||||||||||
Net Asset Value: | ||||||||||||||||||||||||||||||
Beginning of period. | $16.23 | $14.48 | $16.92 | $17.44 | $15.05 | $13.29 | ||||||||||||||||||||||||
|
| |||||||||||||||||||||||||||||
Operations: | ||||||||||||||||||||||||||||||
Net investment income 1 | 0.01 | 0.14 | 0.12 | 0.09 | 0.28 | 0.20 | ||||||||||||||||||||||||
Net realized and unrealized gains (losses) | 1.23 | 1.68 | (1.47 | ) | (0.34 | ) | 2.28 | 1.80 | ||||||||||||||||||||||
|
| |||||||||||||||||||||||||||||
Total from operations | 1.24 | 1.82 | (1.35 | ) | (0.25 | ) | 2.56 | 2.00 | ||||||||||||||||||||||
|
| |||||||||||||||||||||||||||||
Redemption fees | — | 2 | — | 2 | — | — | — | — | ||||||||||||||||||||||
|
| |||||||||||||||||||||||||||||
Distributions to Shareholders: | ||||||||||||||||||||||||||||||
From net investment income | (0.14 | ) | (0.07 | ) | (0.09 | ) | (0.27 | ) | (0.17 | ) | (0.24 | ) | ||||||||||||||||||
From net realized gains | — | — | (1.00 | ) | — | — | — | |||||||||||||||||||||||
|
| |||||||||||||||||||||||||||||
Total distributions | (0.14 | ) | (0.07 | ) | (1.09 | ) | (0.27 | ) | (0.17 | ) | (0.24 | ) | ||||||||||||||||||
|
| |||||||||||||||||||||||||||||
Net Asset Value: | ||||||||||||||||||||||||||||||
End of period. | $17.33 | $16.23 | $14.48 | $16.92 | $17.44 | $15.05 | ||||||||||||||||||||||||
|
| |||||||||||||||||||||||||||||
Total investment return 3 | 7.67% | 12.64% | (8.19% | ) | (1.35% | ) | 17.06% | 15.06% | ||||||||||||||||||||||
|
| |||||||||||||||||||||||||||||
Net assets at end of period (000’s omitted) | $23,985 | $22,618 | $20,440 | $22,485 | $24,127 | $20,890 | ||||||||||||||||||||||||
Ratios: 4 | ||||||||||||||||||||||||||||||
Expenses | 1.50% | 1.50% | 1.50% | 1.50% | 1.50% | 1.50% | ||||||||||||||||||||||||
Net investment income | 0.10% | 0.97% | 0.76% | 0.55% | 1.69% | 1.39% | ||||||||||||||||||||||||
Portfolio turnover rate (excluding short-term securities) | 6.04%5 | 39.23% | 37.94% | 56.97% | 46.91% | 27.93% | ||||||||||||||||||||||||
| 1 | The net investment income per share is based on average shares outstanding for the period. |
| 2 | Amount represents less than $0.01 per share. |
| 3 | Total investment return is based on the change in net asset value of a share during the period (not annualized) and assumes reinvestment of distributions at net asset value. |
| 4 | Ratios are annualized for periods less than one year. In addition to fees and expenses which the Fund bears directly, the Fund indirectly bears a pro rata share of the fees and expenses of the acquired funds in which it invests. Such indirect expenses are not included in the above reported expense ratios. |
| 5 | Not annualized. |
74 |
|
SIT MUTUAL FUNDS SEMI-ANNUAL REPORT |
|
FINANCIAL HIGHLIGHTS
Per share income and capital changes for a share outstanding throughout the period. See accompanying notes to financial statements.
Sit Developing Markets Growth Fund
| ||||||||||||||||||||||||||||||
| Six Months Ended | ||||||||||||||||||||||||||||||
| December 31, 2017 | Years Ended June 30, | |||||||||||||||||||||||||||||
| (Unaudited) | 2017 | 2016 | 2015 | 2014 | 2013 | |||||||||||||||||||||||||
| ||||||||||||||||||||||||||||||
Net Asset Value: | ||||||||||||||||||||||||||||||
Beginning of period | $15.23 | $12.26 | $14.77 | $17.48 | $16.40 | $17.70 | ||||||||||||||||||||||||
|
| |||||||||||||||||||||||||||||
Operations: | ||||||||||||||||||||||||||||||
Net investment income (loss) 1 | — | 2 | (0.02 | ) | 0.04 | 0.03 | (0.01 | ) | 0.04 | |||||||||||||||||||||
Net realized and unrealized gains (losses) | 2.21 | 3.02 | (2.18 | ) | (1.41 | ) | 2.07 | 0.14 | ||||||||||||||||||||||
|
| |||||||||||||||||||||||||||||
Total from operations | 2.21 | 3.00 | (2.14 | ) | (1.38 | ) | 2.06 | 0.18 | ||||||||||||||||||||||
|
| |||||||||||||||||||||||||||||
Redemption fees | — | 2 | — | — | 2 | — | — | — | ||||||||||||||||||||||
|
| |||||||||||||||||||||||||||||
Distributions to Shareholders: | ||||||||||||||||||||||||||||||
From net investment income | — | (0.03 | ) | (0.02 | ) | — | (0.03 | ) | (0.06 | ) | ||||||||||||||||||||
From net realized gains | (0.25 | ) | — | (0.35 | ) | (1.33 | ) | (0.95 | ) | (1.42 | ) | |||||||||||||||||||
|
| |||||||||||||||||||||||||||||
Total distributions | (0.25 | ) | (0.03 | ) | (0.37 | ) | (1.33 | ) | (0.98 | ) | (1.48 | ) | ||||||||||||||||||
|
| |||||||||||||||||||||||||||||
Net Asset Value: | ||||||||||||||||||||||||||||||
End of period | $17.19 | $15.23 | $12.26 | $14.77 | $17.48 | $16.40 | ||||||||||||||||||||||||
|
| |||||||||||||||||||||||||||||
Total investment return 3 | 14.54% | 24.56% | (14.42% | ) | (7.64% | ) | 12.79% | 0.36% | ||||||||||||||||||||||
|
| |||||||||||||||||||||||||||||
Net assets at end of period (000’s omitted) | $11,173 | $9,561 | $7,297 | $9,192 | $10,808 | $10,615 | ||||||||||||||||||||||||
Ratios: 4 | ||||||||||||||||||||||||||||||
Expenses (without waiver) | 2.00% | 5 | 2.00% | 2.00% | 2.00% | 2.00% | 2.00% | |||||||||||||||||||||||
Expenses (with waiver) | 1.70% | 5 | 2.00% | 2.00% | 2.00% | 2.00% | 2.00% | |||||||||||||||||||||||
Net investment income (loss) (without waiver) | (0.34% | ) | (0.18% | ) | 0.31% | 0.16% | (0.07% | ) | 0.24% | |||||||||||||||||||||
Net investment income (loss) (with waiver) | (0.04% | ) | (0.18% | ) | 0.31% | 0.16% | (0.07% | ) | 0.24% | |||||||||||||||||||||
Portfolio turnover rate (excluding short-term securities) | 11.78% | 6 | 19.67% | 28.14% | 21.51% | 21.45% | 15.48% | |||||||||||||||||||||||
| 1 | The net investment income (loss) per share is based on average shares outstanding for the period. |
| 2 | Amount represents less than $0.01 per share. |
| 3 | Total investment return is based on the change in net asset value of a share during the period (not annualized) and assumes reinvestment of distributions at net asset value. |
| 4 | Ratios are annualized for periods less than one year. In addition to fees and expenses which the Fund bears directly, the Fund indirectly bears a pro rata share of the fees and expenses of the acquired funds in which it invests. Such indirect expenses are not included in the above reported expense ratios. |
| 5 | Total Fund expenses are limited to 2.00% of average daily net assets. However, during the period above, the investment advisor voluntarily absorbed expenses that were otherwise payable by the Fund. |
| 6 | Not annualized. |
DECEMBER 31, 2017 |
|
75 |
|
Six Months Ended December 31, 2017
| (1) | Organization |
Sit Mutual Funds are no-load funds, and are registered under the Investment Company Act of 1940 (as amended) as diversified, open-end management investment companies, or series thereof. The Sit Balanced, Sit Dividend Growth, Sit Global Dividend Growth, Sit ESG Growth, Sit Small Cap Dividend Growth, Sit Small Cap Growth, Sit International Growth, and Sit Developing Markets Growth are series funds of Sit Mutual Funds, Inc.
This report covers the equity funds of the Sit Mutual Funds (the Funds). Each fund has 10 billion authorized shares of capital stock with a par value of $0.001. The investment objective for each Fund is as follows:
| Fund | Investment Objective | |
Balanced | Long-term growth consistent with the preservation of principal and to provide regular income. | |
Dividend Growth | Provide current income that exceeds the dividend yield of the S&P 500® Index and that grows over a period of years. Secondarily, maximize long-term capital appreciation. | |
Global Dividend Growth | Provide current income that exceeds the dividend yield of the MSCI World Index that grows over a period of years. Secondarily, maximize long-term capital appreciation. | |
Large Cap Growth | Maximize long-term capital appreciation. | |
ESG Growth | Maximize long-term capital appreciation. | |
Mid Cap Growth | Maximize long-term capital appreciation. | |
Small Cap Dividend Growth | Provide current income that exceeds the yield of the Russell 2000® Index and that grows over a period of years. Secondarily, maximize long-term capital appreciation. | |
Small Cap Growth | Maximize long-term capital appreciation. | |
International Growth | Maximize long-term growth. | |
Developing Markets Growth | Maximize long-term capital appreciation. |
The Dividend Growth, Global Dividend Growth, ESG Growth and Small Cap Dividend Growth Funds offer Class I and Class S shares. Both classes of shares have identical voting, dividend, and liquidation rights. The distribution fee differs among classes, the Class S shares have a 0.25% distribution fee, whereas Class I has no distribution fee. Income, expenses (other than class specific expenses) and realized and unrealized gains or losses on investments are allocated to each class of shares based upon its relative net assets.
| (2) | Significant Accounting Policies |
The Funds are investment companies and follow accounting and reporting guidance under Financial Accounting Standards Board (“FASB”) Accounting Standards Codification (“ASC”) Topic 946, “Financial Services-Investment Companies”. The following is a summary of significant accounting policies consistently followed by the Funds in the preparation of their financial statements in conformity with U.S. generally accepted accounting principles (“GAAP”).
Investments in Securities
Investments in securities traded on national or international securities exchanges are valued at the last reported sales price prior to the time when assets are valued. Securities traded on the over-the-counter market are valued at the last reported sales price or if the last sales price is not available at the last reported bid price. The sale and bid prices or prices deemed best to reflect fair value quoted by dealers who make markets in these securities are obtained from independent pricing services. Consistent with the Funds’ valuation policies and procedures, debt securities maturing in more than 60 days are priced by an independent pricing service. The pricing service may use models that price securities based on current yields and relative security characteristics, such as coupon rate, maturity date, issuer credit quality, and prepayment speeds as applicable. When market quotations are not readily available, or when the Adviser becomes aware that a significant event impacting the value of a security or group of securities has occurred after the closing of the exchange on which the security or securities principally trade, but before the calculation of the daily net asset value, securities are valued at fair value as determined in good faith using procedures established by the Board of Directors. The procedures consider, among
76 |
|
SIT MUTUAL FUNDS SEMI-ANNUAL REPORT |
|
others, the following factors to determine a security’s fair value: the nature and pricing history (if any) of the security; whether any dealer quotations for the security are available; and possible valuation methodologies that could be used to determine the fair value of the security. Debt securities of sufficient credit quality maturing in less than 60 days when acquired, or which subsequently are within 60 days of maturity, are valued at amortized cost, which approximates fair value.
Security transactions are accounted for on the date the securities are purchased or sold. Securities gains and losses are calculated on the identified-cost basis. Dividend income is recorded on the ex-dividend date or upon the receipt of ex-dividend notification in the case of certain foreign securities. Interest, including level-yield amortization of long-term bond premium and discount, is recorded on the accrual basis.
Fair Value Measurements
The inputs and valuation techniques used to measure fair value of the Funds’ net assets are summarized into three levels as described in the hierarchy below:
• Level 1 – quoted prices in active markets for identical securities. An active market for the security is a market in which transactions occur with sufficient frequency and volume to provide pricing information on an ongoing basis. A quoted price in an active market provides the most reliable evidence of fair value.
• Level 2 – debt securities are valued based on evaluated prices received from independent pricing services or from dealers who make markets in such securities. For corporate bonds, U.S. government and government agency obligations, and municipal securities the pricing services utilize matrix pricing which considers yield or price of bonds of comparable quality, coupon, maturity, and type as well as dealer supplied prices. For asset-backed securities and mortgage-backed securities, the pricing services utilize matrix pricing which considers prepayment speed assumptions, attributes of the collateral, yield or price of bonds of comparable quality, coupon, maturity, and type as well as dealer supplied prices. For foreign equities, the pricing services adjust closing prices by applying a systematic process for events occurring after the close of the foreign exchange by utilizing such inputs as Depositary Receipts, quoted prices for similar securities, exchange rates, and certain indexes. All of these inputs are derived principally from or corroborated by observable market data. An adjustment to any observable input that is significant to the fair value may render the measurement a Level 3 measurement.
• Level 3 – significant unobservable inputs, including the Adviser’s own assumptions in determining the fair value of investments.
The inputs or methodology used for valuing securities are not necessarily an indication of the risk associated with investing in those securities.
A summary of the levels for the Funds’ investments as of December 31, 2017 is included with the Funds’ schedule of investments.
Foreign Currency Translations and Forward Foreign Currency Contracts
The fair value of securities and other assets and liabilities denominated in foreign currencies for Global Dividend Growth, International Growth and Developing Markets Growth Funds are translated daily into U.S. dollars at the closing rate of exchange (approximately 4:00 p.m. Eastern Time). Purchases and sales of securities, income and expenses are translated at the exchange rate on the transaction date. Dividend and interest income includes currency exchange gains (losses) realized between the accrual and payment dates on such income. Exchange gains (losses) may also be realized between the trade and settlement dates on security and forward contract transactions. For securities denominated in foreign currencies, the effect of changes in foreign exchange rates on realized and unrealized gains or losses is reflected as a component of such gains or losses.
The Global Dividend Growth, International Growth and Developing Markets Growth Funds may enter into forward foreign currency exchange contracts generally for operational purposes, but the Adviser may occasionally utilize contracts to protect against adverse exchange rate fluctuation. Any gains (losses) generated by these contracts are disclosed separately on the statement of operations. The net U.S. dollar value of foreign currency underlying all contractual commitments held by the Funds and the resulting unrealized appreciation or depreciation is determined using foreign currency exchange rates from an independent pricing service. The Funds are subject to the credit risk that the other party will not complete the obligations of the contract.
DECEMBER 31, 2017 |
|
77 |
|
NOTES TO FINANCIAL STATEMENTS
Six Months Ended December 31, 2017 (Continued)
Federal Taxes
The Funds’ policy is to comply with the requirements of the Internal Revenue Code applicable to regulated investment companies and to distribute all of their taxable income to shareholders. Therefore, no income tax provision is required. Also, in order to avoid the payment of any federal excise taxes, the Funds will distribute substantially all of their net investment income and net realized gains on a calendar year basis.
Management has analyzed the Funds’ tax positions taken in federal tax returns for all open tax years and has concluded that as of December 31, 2017, no provision for income tax would be required in the Funds’ financial statements. The Funds’ federal and state income and federal excise tax returns remain subject to examination by the Internal Revenue Service and state departments of revenue until such time as the applicable statute of limitations for audit has expired. For example, U.S. tax returns are generally subject to audit for three years from the date they are filed.
At December 31, 2017, the gross unrealized appreciation (depreciation) on investments and cost of securities on a tax basis for federal income tax purposes were as follows:
| Unrealized Appreciation | Unrealized Depreciation | Net Unrealized Appreciation (Depreciation) | Cost of Securities on a Tax Basis | |||||||||||||
Balanced | $6,881,011 | ($208,599) | $6,672,412 | $20,918,168 | ||||||||||||
Dividend Growth | 197,360,490 | (8,333,227) | 189,027,263 | 801,187,507 | ||||||||||||
Global Dividend Growth | 7,257,422 | (343,568) | 6,913,854 | 25,889,794 | ||||||||||||
Large Cap Growth | 55,631,029 | (1,148,436) | 54,482,593 | 63,902,369 | ||||||||||||
ESG Growth | 1,110,235 | (17,605) | 1,092,630 | 4,652,297 | ||||||||||||
Mid Cap Growth | 70,278,762 | (2,391,201) | 67,887,561 | 91,121,760 | ||||||||||||
Small Cap Dividend Growth | 3,448,639 | (191,967) | 3,256,672 | 15,870,966 | ||||||||||||
Small Cap Growth | 33,100,259 | (728,380) | 32,371,879 | 63,286,124 | ||||||||||||
International Growth | 5,376,579 | (409,671) | 4,966,908 | 18,942,831 | ||||||||||||
Developing Markets Growth | 3,391,457 | (209,393) | 3,182,064 | 7,973,696 | ||||||||||||
Net investment income and net realized gains differ for financial statement and tax purposes because of corporate actions on shares held and/or losses deferred due to “wash sale” transactions. A “wash sale” occurs when a Fund sells a security that it has acquired within a period beginning thirty days before and ending thirty days after the date of sale (a sixty one day period). The character of distributions made during the year from net investment income or net realized gains may also differ from its ultimate characterization for tax purposes. Also, due to the timing of dividend distributions, the fiscal year in which amounts are distributed may differ from the year that the income or realized gains (losses) were recorded by the Funds. The tax character of distributions paid during the fiscal years ended June 30, 2017 and 2016 were as follows:
78 |
|
SIT MUTUAL FUNDS SEMI-ANNUAL REPORT |
|
Year Ended June 30, 2017:
| Long Term | |||||||||||||||
| Ordinary Income | Capital Gain | Total | |||||||||||||
Balanced | $270,000 | — | $270,000 | ||||||||||||
Dividend Growth (Class I) | 18,184,824 | $56,369,317 | 74,554,141 | ||||||||||||
Dividend Growth (Class S) | 1,047,785 | 3,921,689 | 4,969,474 | ||||||||||||
Global Dividend Growth (Class I) | 354,957 | — | 354,957 | ||||||||||||
Global Dividend Growth (Class S) | 38,043 | — | 38,043 | ||||||||||||
Large Cap Growth | 598,249 | 7,585,453 | 8,183,702 | ||||||||||||
ESG Growth | 6,100 | — | 6,100 | ||||||||||||
Mid Cap Growth | — | 1,410,787 | 1,410,787 | ||||||||||||
Small Cap Dividend Growth (Class I) | 87,515 | — | 87,515 | ||||||||||||
Small Cap Dividend Growth (Class S) | 21,485 | — | 21,485 | ||||||||||||
Small Cap Growth | — | 144,732 | 144,732 | ||||||||||||
International Growth | 97,000 | — | 97,000 | ||||||||||||
Developing Markets Growth | 18,811 | — | 18,811 | ||||||||||||
Year Ended June 30, 2016:
| Ordinary Income | Long Term Capital Gain | Total | |||||||||||||
Balanced | $508,889 | $1,028,080 | $1,536,969 | ||||||||||||
Dividend Growth (Class I) | 23,739,125 | 101,891,044 | 125,630,169 | ||||||||||||
Dividend Growth (Class S) | 1,582,606 | 7,415,541 | 8,998,147 | ||||||||||||
Global Dividend Growth (Class I) | 530,149 | 1,512,875 | 2,043,024 | ||||||||||||
Global Dividend Growth (Class S) | 62,954 | 201,098 | 264,052 | ||||||||||||
Large Cap Growth | 4,558,215 | 27,930,763 | 32,488,978 | ||||||||||||
Mid Cap Growth | — | 23,213,056 | 23,213,056 | ||||||||||||
Small Cap Dividend Growth (Class I) | 59,292 | 446 | 59,738 | ||||||||||||
Small Cap Dividend Growth (Class S) | 24,216 | 216 | 24,432 | ||||||||||||
Small Cap Growth | — | 8,910,218 | 8,910,218 | ||||||||||||
International Growth | 205,203 | 1,246,085 | 1,451,288 | ||||||||||||
Developing Markets Growth | 12,000 | 211,867 | 223,867 | ||||||||||||
As of June 30, 2017, the components of distributable earnings on a tax basis were as follows:
| Undistributed Ordinary Income | Accumulated Gain | Unrealized Appreciation (Depreciation) | |||||||||||||
Balanced | $82,423 | $605,591 | $5,232,854 | ||||||||||||
Dividend Growth | 17,604,115 | 37,535,605 | 162,998,693 | ||||||||||||
Global Dividend Growth | 142,589 | — | 4,122,607 | ||||||||||||
Large Cap Growth | 641,691 | 8,842,329 | 47,468,543 | ||||||||||||
ESG Growth | 32,139 | — | 553,305 | ||||||||||||
Mid Cap Growth | 4,961 | 4,062,233 | 65,907,919 | ||||||||||||
Small Cap Dividend Growth | 44,366 | — | 1,961,302 | ||||||||||||
Small Cap Growth | — | 3,000,150 | 30,273,335 | ||||||||||||
International Growth | 177,221 | — | 3,309,174 | ||||||||||||
Developing Markets Growth | — | — | 2,185,900 | ||||||||||||
DECEMBER 31, 2017 |
|
79 |
|
NOTES TO FINANCIAL STATEMENTS
Six Months Ended December 31, 2017 (Continued)
Net capital loss carryovers and late year losses, if any, as of June 30, 2017, are available to offset future realized capital gains and thereby reduce future capital gains distributions. The Funds’ are permitted to carry forward capital losses for an unlimited period. Capital losses that are carried forward retain their character as either short-term or long-term capital losses. The net capital loss carryovers and the late year losses deferred as of June 30, 2017, were as follows:
| Unlimited Period of Net | Late Year | Accumulated | ||||||||||||||||||
| Capital Loss Carryover | Losses | Capital and | ||||||||||||||||||
| Short-Term | Long-Term | Deferred | Other Losses | |||||||||||||||||
Global Dividend Growth | $718,740 | $186,394 | — | $905,134 | ||||||||||||||||
ESG Growth | 59,584 | — | — | 59,584 | ||||||||||||||||
Small Cap Dividend Growth | 234,504 | 87,797 | — | 322,301 | ||||||||||||||||
International Growth | 723,576 | 148,939 | — | 872,515 | ||||||||||||||||
Developing Markets Growth | 90,015 | 92,540 | — | 182,555 | ||||||||||||||||
Distributions
Distributions to shareholders are recorded as of the close of business on the record date. Such distributions are payable in cash or reinvested in additional shares of the Funds’ capital stock. Distributions from net investment income, if any, are declared and paid quarterly for the Balanced, Dividend Growth, Global Dividend Growth and Small Cap Dividend Growth Funds and declared and paid annually for Developing Markets Growth, Small Cap Growth, International Growth, Mid Cap Growth, Large Cap Growth and ESG Growth Funds. Distributions from net realized gains, if any, will be made annually for each of the Funds.
Concentration of Investments
The Developing Markets Growth Fund may concentrate investments in countries with limited or developing capital markets which may involve greater risks than investments in more developed markets and the prices of such investments may be volatile. The consequences of political, social or economic changes in these markets may have disruptive effects on the market prices of the Fund’s investments and the income it generates, as well as the Fund’s ability to repatriate such amounts.
Use of Estimates
The preparation of financial statements in conformity with U.S. generally accepted accounting principles requires management to make certain estimates and assumptions that affect the reported amounts of assets and liabilities and disclosure of contingent assets and liabilities at the date of the financial statements and the reported results for the respective periods. Actual results could differ from those estimates.
Guarantees and Indemnifications
Under each Fund’s organizational documents, its officers and directors are indemnified against certain liability arising out of the performance of their duties to each Fund. In addition, certain of each Fund’s contracts with its service providers contain general indemnification clauses. Each Fund’s maximum exposure under these arrangements is unknown since the amount of any future claims that may be made against each Fund cannot be determined and each Fund has no historical basis for predicting the likelihood of any such claims.
80 |
|
SIT MUTUAL FUNDS SEMI-ANNUAL REPORT |
|
| (3) | Investment Security Transactions |
The cost of purchases and proceeds from sales and maturities of investment securities, other than short-term securities, for the year ended December 31, 2017, were as follows:
| Purchases | Proceeds | |||||||||||
| U.S. Government | Other | U.S. Government | Other | |||||||||
Balanced | $323,581 | $5,239,701 | $817,788 | $5,050,006 | ||||||||
Dividend Growth | — | 332,617,542 | — | 507,682,531 | ||||||||
Global Dividend Growth | — | 3,299,184 | — | 2,420,140 | ||||||||
Large Cap Growth | — | 6,768,142 | — | 15,551,182 | ||||||||
ESG Growth | — | 767,771 | — | 174,491 | ||||||||
Mid Cap Growth | — | 22,437,265 | — | 25,062,358 | ||||||||
Small Cap Dividend Growth | — | 3,625,675 | — | 2,324,856 | ||||||||
Small Cap Growth | — | 15,702,395 | — | 17,243,960 | ||||||||
International Growth | — | 1,386,263 | — | 1,519,459 | ||||||||
Developing Markets Growth | — | 1,680,297 | — | 1,215,300 | ||||||||
| (4) | Affiliated Fees and Transactions |
Investment Adviser
The Funds each have entered into an investment management agreement with Sit Investment Associates, Inc. (SIA), under which SIA manages the Funds’ assets and provides research, statistical and advisory services, and pays related office rental, executive expenses and executive salaries. The current fee for investment management and advisory services is based on the average daily net assets of the Funds at the annual rate of:
| Management Fee | Net of Adviser’s Voluntary Fee Waiver | ||||||
Balanced | 1.00% | N/A | |||||
Dividend Growth Fund Class I and Class S | 1.00% | 0.70% | |||||
Global Dividend Growth Fund Class I and Class S | 1.25% | 1.00% | |||||
Large Cap Growth | 1.00% | N/A | |||||
ESG Growth Fund Class I and Class S | 1.25% | 1.00% | |||||
Mid Cap Growth | 1.25% | N/A | |||||
Small Cap Dividend Growth Fund Class I and Class S | 1.25% | 1.00% | |||||
Small Cap Growth | 1.50% | N/A | |||||
International Growth | 1.50% | N/A | |||||
Developing Markets Growth | 2.00% | 1.40% | |||||
SIA is obligated to pay all of the Funds’ expenses (excluding extraordinary expenses, stock transfer taxes, interest, brokerage commissions, 12b-1 fees and other transaction charges relating to investing activities).
In addition to the annual management fees, the Class S shares of Dividend Growth, Global Dividend Growth, ESG Growth and Small Cap Dividend Growth Funds also have a 0.25% annual distribution (12b-1) fee, which is used to pay for distribution fees related to the sale and distribution of its shares.
The Adviser has agreed to limit the management fee of the Dividend Growth Fund to 0.70%, the Global Dividend Growth Fund to 1.00%, the ESG Growth Fund to 1.00%, the Small Cap Dividend Growth Fund to 1.00% and the Developing Markets Growth Fund to 1.40% for the period through June 30, 2019 of the Fund’s daily average net assets, respectively.
DECEMBER 31, 2017 |
|
81 |
|
NOTES TO FINANCIAL STATEMENTS
Six Months Ended December 31, 2017 (Continued)
Transactions with affiliates
The investment adviser, affiliates of the investment adviser, directors and officers of the Funds as a whole owned the following shares as of December 31, 2017:
| Shares | % Shares Outstanding | |||||
Balanced | 264,138 | 22.4 | ||||
Dividend Growth | 1,313,115 | 2.2 | ||||
Global Dividend Growth | 751,292 | 36.4 | ||||
Large Cap Growth | 686,636 | 23.5 | ||||
ESG Growth | 433,662 | 94.2 | ||||
Mid Cap Growth | 3,979,711 | 45.8 | ||||
Small Cap Dividend Growth | 875,880 | 57.6 | ||||
Small Cap Growth | 968,198 | 55.3 | ||||
International Growth | 827,592 | 59.8 | ||||
Developing Markets Growth | 264,257 | 40.7 | ||||
| (5) | Capital Share Activity |
Short-Term Trading (Redemption) Fees
The Funds (except Balanced) charge a redemption fee equal to 2.00% of the proceeds on shares held for less than 30 calendar days. The fee is retained by the Fund for the benefit of its long-term shareholders and accounted for as an addition to paid in capital. For the six months ended December 31, 2017, the Funds received the following redemption fees:
| Class I | Class S | |||||||||
Dividend Growth | $295 | — | ||||||||
Large Cap Growth | 195 | — | ||||||||
Mid Cap Growth | 35 | — | ||||||||
International Growth | 208 | — | ||||||||
Developing Markets Growth | 28 | — | ||||||||
| (6) | Regulatory Updates |
In October 2016, the SEC amended existing rules intended to modernize reporting and disclosure information. These amendments relate to Regulation S-X which sets forth the form and content of financial statements. Management has evaluated the implications of adopting these amendments and has determined there is no material impact on the financial statements and accompanying notes. Effective August 1, 2017, the Funds have adopted these amendments.
| (7) | Subsequent Events |
Management has evaluated the impact of all subsequent events on the Funds through the date the financial statements were issued, and has determined that there were no subsequent events that would require disclosure in or adjustments to the financial statements.
82 |
|
SIT MUTUAL FUNDS SEMI-ANNUAL REPORT |
|
As a shareholder of the Funds, you incur two types of costs: (1) transaction costs, including redemption fees and (2) ongoing costs, including management fees; and other Fund expenses. This Example is intended to help you understand your ongoing costs (in dollars) of investing in the Funds and to compare these costs with the ongoing costs of investing in other mutual funds.
The Example is based on an investment of $1,000 invested at the beginning of the period and held for the entire period July 1, 2017 to December 31, 2017.
Actual Expenses
The first line of the following table provides information about actual account values and actual expenses. You may use the information in this line, together with the amount you invested, to estimate the expenses that you paid over the period. Simply divide your account value by $1,000 (for example, an $8,600 account value divided by $1,000 = 8.6), then multiply the result by the number in the first line under the heading entitled “Expenses Paid During Period” to estimate the expenses you paid on your account during this period.
Hypothetical Example for Comparison Purposes
The second line of the table provides information about hypothetical account values and hypothetical expenses based on the Fund’s actual expense ratio and an assumed rate of return of 5% per year before expenses, which is not the Fund’s actual return. The hypothetical account values and expenses may not be used to estimate the actual ending account balance or expenses you paid for the period. You may use this information to compare the ongoing costs of investing in the Fund and other funds. To do so, compare this 5% hypothetical example with the 5% hypothetical examples that appear in the shareholder reports of the other funds.
Please note that the expenses shown in the table are meant to highlight your ongoing costs only and do not reflect any transactional costs, such as redemption fees. Therefore, the second line of the table is useful in comparing ongoing costs only, and will not help you determine the relative total costs of owning different funds. In addition, if these transactional costs (redemption fees) were included, your costs would have been higher.
| Fund | Beginning Account Value (7/1/17) | Ending Account Value (12/31/17) | Expenses Paid During Period* (7/1/17- 12/31/17) | |||||||||
Balanced Fund |
| |||||||||||
Actual | $1,000 | $1,081.30 | $5.19 | |||||||||
Hypothetical | $1,000 | $1,019.95 | $5.04 | |||||||||
Dividend Growth Fund |
| |||||||||||
Actual | ||||||||||||
Class I | $1,000 | $1,107.10 | $5.25 | |||||||||
Class S | $1,000 | $1,105.50 | $6.56 | |||||||||
Hypothetical | ||||||||||||
Class I | $1,000 | $1,019.95 | $5.04 | |||||||||
Class S | $1,000 | $1,018.70 | $6.29 | |||||||||
Global Dividend Growth Fund |
| |||||||||||
Actual | ||||||||||||
Class I | $1,000 | $1,108.00 | $6.57 | |||||||||
Class S | $1,000 | $1,106.70 | $7.88 | |||||||||
Hypothetical | ||||||||||||
Class I | $1,000 | $1,018.70 | $6.29 | |||||||||
Class S | $1,000 | $1,017.45 | $7.54 | |||||||||
Large Cap Growth Fund |
| |||||||||||
Actual | $1,000 | $1,118.60 | $5.28 | |||||||||
Hypothetical | $1,000 | $1,019.95 | $5.04 | |||||||||
ESG Growth Fund |
| |||||||||||
Actual | ||||||||||||
Class I | $1,000 | $1,115.50 | $6.59 | |||||||||
Class S | $1,000 | $1,115.30 | $7.91 | |||||||||
Hypothetical | ||||||||||||
Class I | $1,000 | $1,018.70 | $6.29 | |||||||||
Class S | $1,000 | $1,017.45 | $7.54 | |||||||||
Mid Cap Growth Fund |
| |||||||||||
Actual | $1,000 | $1,059.60 | $6.42 | |||||||||
Hypothetical | $1,000 | $1,018.70 | $6.29 | |||||||||
Small Cap Dividend Growth Fund |
| |||||||||||
Actual | ||||||||||||
Class I | $1,000 | $1,092.30 | $6.52 | |||||||||
Class S | $1,000 | $1,091.30 | $7.82 | |||||||||
Hypothetical | ||||||||||||
Class I | $1,000 | $1,018.70 | $6.29 | |||||||||
Class S | $1,000 | $1,017.45 | $7.54 | |||||||||
DECEMBER 31, 2017 |
|
83 |
|
EXPENSE EXAMPLE (Unaudited) (Continued)
| Fund | Beginning Account Value (7/1/17) | Ending Account Value (12/31/17) | Expenses Paid During Period* (7/1/17- 12/31/17) | |||||||||
Small Cap Growth Fund |
| |||||||||||
Actual | $1,000 | $1,076.40 | $7.77 | |||||||||
Hypothetical | $1,000 | $1,017.45 | $7.54 | |||||||||
International Growth Fund |
| |||||||||||
Actual | $1,000 | $1,076.70 | $7.77 | |||||||||
Hypothetical | $1,000 | $1,017.45 | $7.54 | |||||||||
Developing Markets Growth Fund |
| |||||||||||
Actual | $1,000 | $1,145.40 | $10.70 | |||||||||
Hypothetical | $1,000 | $1,014.96 | $10.05 | |||||||||
*Expenses are equal to the Fund’s annualized expense ratio of 1.00%, for the Balanced, Dividend Growth, Class I and Large Cap Growth Funds; 1.25% for Dividend Growth, Class S, Global Dividend Growth, Class I, Small Cap Dividend Growth, Class I, Mid Cap Growth,and ESG Growth,Class I Funds; 1.50% for Global Dividend Growth,Class S, Small Cap Dividend Growth,Class S, Small Cap Growth, ESG Growth, Class S and International Growth Funds; and 2.00% for Developing Markets Growth Fund, multiplied by the average account value over the period, multiplied by 182/365 (to reflect the one-half year period.)
84 |
|
SIT MUTUAL FUNDS SEMI-ANNUAL REPORT |
|
ADDITIONAL INFORMATION (Unaudited)
PROXY VOTING
Each Fund follows certain policies and procedures for voting proxies for securities held in each portfolio. A description of the Funds’ proxy voting policies and procedures is available without charge upon request by calling the Funds at 1-800-332-5580.
Information regarding how each Fund voted proxies relating to its portfolio securities during the most recent twelve-month period ended June 30 is available without charge upon request by calling the Funds at 1-800-332-5580, and is available on the U.S. Securities and Exchange Commission’s website at www.sec.gov.
AVAILABILITY OF QUARTERLY PORTFOLIO SCHEDULES
The Funds’ file their complete schedules of portfolio holdings with the U.S. Securities and Exchange Commission (SEC) for the first and third quarters of each fiscal year on Form N-Q. The Funds’ Form N-Qs are available without charge upon request by calling the Funds at 1-800-332-5580 and are available on the SEC’s website at www.sec.gov. In addition, the Funds’ Form N-Qs may be reviewed and copied at the SEC’s Public Reference Room in Washington, DC. Information on the operation of the Public Reference Room may be obtained by calling 1-202-551-8090.
RE-APPROVAL OF INVESTMENT MANAGEMENT AGREEMENTS
At their joint meeting held on October 23, 2017 the Boards of Directors of the Sit Mutual Funds unanimously approved the continuation for another one year period the investment management agreements entered into by and between Sit Investment Associates, Inc. (“SIA”) and Sit Mid Cap Growth Fund, Inc. dated November 1, 1996; Sit Large Cap Growth Fund, Inc. dated November 1, 1996; and Sit Mutual Funds Inc., dated November 1, 1992 (the “Agreements””).
The Boards approved the Agreements after a lengthy discussion and consideration of various factors relating to the Boards’ selection of SIA as the investment adviser, and the Boards’ approval of the fees to be paid under the Agreements.
Investment Adviser Criteria. The Directors began their analysis by discussing their criteria for determining the quality of an investment adviser. The Directors’ noted that their analysis is similar to that used by institutional investors in evaluating and selecting investment advisers. The Directors discussed several factors used to determine the overall quality of an investment adviser and the nature, extent and quality of the services performed by SIA, including the following:
Investment Philosophy and Process. The Directors considered SIA’s philosophy of managing assets. With respect to equity securities, SIA identifies growth-oriented securities issued by companies with the potential for earnings growth at a faster rate than the general economy and market index. SIA believes that earnings growth is the primary determinant of superior long-term returns for equity securities, and invests in companies it believes exhibit above market and consistent growth as well as conservative and cyclical growth companies. SIA’s actively managed portfolios not only concentrate on the best growth opportunities but do so at reasonable valuation levels. The Directors determined that the Stock Funds’ investment objectives are consistent with SIA’s investment philosophy and growth style. The Directors reviewed the Stock Funds’ portfolio characteristics, and noted that SIA has consistently managed the Stock Funds in a growth style and the Directors found no indication of style drift away from growth stocks over market cycles. The Directors noted that in periods during which growth stocks have generally under-performed relative to value stocks, the Stock Funds may not rank favorably in comparisons with other funds investing in value stocks.
The Directors discussed SIA’s consistent and well-defined investment process. With respect to equity securities, SIA utilizes a team based top-down and bottom-up investment decision making process.
Investment Professionals. The Directors discussed the experience, knowledge and organizational stability of SIA and its investment professionals. The Directors noted that SIA’s senior professionals are actively involved in the investment process and have significant investment industry experience.
DECEMBER 31, 2017 |
|
85 |
|
ADDITIONAL INFORMATION (Unaudited) (Continued)
The Directors discussed the depth of SIA’s investment staff. The Directors noted that SIA has over 30 investment professionals. Given the investment products offered by SIA and the assets under management, the Directors determined that SIA’s investment staff is well positioned to meet the current needs of its clients, including the Funds, and to accommodate growth in the number of clients and assets under management for the near future. The Directors concluded that the depth of the investment staff, and in particular senior management and investment analysts, is actually greater than the Funds currently require at their present asset size. The Directors noted that SIA has the resources of a $13.8 billion investment firm working for the benefit of the Fund shareholders.
Investment Performance. The Directors reviewed and discussed the Funds’ investment performance on an absolute and comparable basis for various periods as discussed below. The Directors noted that the investment performance of the Funds has generally been competitive with indices and other funds with similar investment styles as the Funds, such as equity growth funds.
Corporate Culture. The Directors discussed SIA’s corporate values to operate under the highest ethical and professional standards. SIA’s culture is set and practiced by senior management who insist that all professionals exhibit honesty and integrity. The Board noted that the firm’s values are evident in all of the services provided to the Funds.
Review of Specific Factors. The Directors continued their analysis by reviewing specific information on SIA and the Funds and specific terms of the Agreements, including the following.
Investment Performance. The Directors reviewed investment performance of each Fund for 1 month, 3 months, 6 months, year-to-date, 1 year, 5 years (as applicable), 10 years (as applicable) and since inception, both on an absolute basis and on a comparative basis to indices and mutual funds within the same investment categories. As noted above, the Directors concluded that the investment performance of the Funds has been competitive in relation to their stated objectives and strategies on a comparable basis with funds with similar objectives and strategies.
Fees and Expenses. The Directors noted that the Funds pay SIA a monthly fee and SIA is responsible for all of the Funds’ expenses, except interest, brokerage commissions and transaction charges, certain extraordinary expenses, and fees paid under a distribution plan adopted pursuant to Rule 12b-1 under the Investment Company Act of 1940 for Class S shares of Sit Dividend Growth Fund, Sit Global Dividend Growth Fund, Sit Small Cap Dividend Growth Fund, and Sit ESG Growth Fund. The Directors reviewed fees paid in prior years and the current fees to be paid under the Agreements both before and after fee waivers with respect to Sit Developing Markets Growth Fund, Sit Dividend Growth Fund, Sit Global Dividend Growth Fund, and Sit ESG Growth Fund.
The Directors compared each Fund’s expense ratio to the average and median expense ratios of no-load mutual funds within the same Morningstar, Inc. investment category, the average expense ratios for load funds within the Morningstar category, and the average expense ratios for all funds within the Morningstar category. Certain of the Fund’s expense ratios were higher than the averages, and certain of the Fund’s expense ratios were lower than the averages. The Directors noted that the Morningstar no-load categories include funds of various asset sizes, some of which are significantly larger in assets than the Funds. The Directors found each Fund’s total expense ratio to be within an acceptable range compared to the total expense ratios of other no-load funds within the Fund’s Morningstar category. The Directors concluded that the fees paid by the Funds are reasonable and appropriate.
The Directors reviewed the extent to which the fees to be paid under the Agreements by each Fund may be affected by an increase in the Fund’s assets, which included reviewing each Fund’s current and historical assets and the likelihood and magnitude of future increases in the Fund’s assets. The Directors agreed that it is appropriate that the Funds benefit from improved economies of scale as the Funds’ assets increase. However, the Directors concluded that given the amount of the Funds’ current assets and the likelihood and magnitude of future increases in the Funds’ assets, negotiating a graduated fee structure for each Fund is unnecessary at this time since the fees to be paid under the current Agreements are reasonable and appropriate.
The Directors reviewed the expenses paid by SIA relating to the operations of the Funds, and SIA’s income with respect to the management of the Funds for the past two calendar years. The Directors concluded that the expenses paid were appropriate.
86 |
|
SIT MUTUAL FUNDS SEMI-ANNUAL REPORT |
|
ADDITIONAL INFORMATION (Unaudited) (Continued)
The Directors reviewed SIA’s investment advisory fee schedule for investment management services provided to other clients. The Directors compared the services provided to the Funds and other clients of SIA, and recognized that the Funds’ expenses are borne by SIA except as noted above. The Directors concluded that the fees paid by the Funds in relation to the fees paid by other SIA clients were appropriate and reasonable. The Directors also concluded that SIA’s profit margin with respect to the management of the Funds was appropriate.
The Directors discussed the extent to which SIA receives benefits from the relationship with the Funds such as soft dollar arrangements by which brokers provide research services to SIA as a result of brokerage generated by the Funds. The Board concluded that any benefits SIA receives from its relationship with the Funds are well within industry norms and are reflected in the amount of the fees paid by the Funds to SIA and are appropriate and reasonable.
Non-Advisory Services. The Directors considered the quality of non-advisory services which SIA provides to the Funds (and their shareholders) and the quality and depth of SIA’s non-investment personnel who provide such services. Directors concluded that the level of such services and the quality and depth of such personnel are consistent with industry standards.
Finally, the Directors considered the compliance staff and the regulatory history of SIA and the Funds, and concluded that both are consistent with industry standards.
Based on these conclusions, without any single conclusion being dispositive, the Directors determined that renewal of the Agreements was in the interest of each Fund and its shareholders.
DECEMBER 31, 2017 |
|
87 |
|
[This page intentionally left blank.]
88 |

Item 2: Code of Ethics. Not applicable to Semi-Annual Report.
Item 3: Audit Committee Financial Expert. Not applicable to Semi-Annual Report.
Item 4: Principal Accountant Fees and Services. Not applicable to Semi-Annual Report.
Item 5: Audit Committee of Listed Registrants.
Not applicable to open-end investment companies.
Item 6: Schedule of Investments.
The schedule of investments is included as part of the report to shareholders filed under Item 1 of this Form.
Item 7: Disclosure of Proxy Voting Policies and Procedures for Closed-End Management Investment Companies.
Not applicable to open-end investment companies.
Item 8: Portfolio Managers of Closed-End Management Companies.
Not applicable to open-end investment companies.
Item 9: Purchases of Equity Securities by Closed-End Management Investment Company and Affiliated Purchasers.
Not applicable to open-end investment companies.
Item 10. Submission of Matters to a vote of Security Holders.
There have been no material changes to the procedures by which shareholders may recommend nominees to the registrant’s board of directors.
Item 11: Controls and Procedures -
(a) Based on their evaluation of the Registrant’s Disclosure Controls and Procedures as of a date within 90 days of the Filing Date, the Registrant’s Chairman and Treasurer have determined that the Disclosure Controls and Procedures (as defined in Rule 30a-2(c) under the Act) are designed to ensure that information required to be disclosed by the Registrant is recorded, processed, summarized and reported by the filing Date, and that information required to be disclosed in the report is communicated to the Registrant’s management, as appropriate, to allow timely decisions regarding required disclosure.
b) There were no changes in the Registrant’s internal control over financial reporting as defined in Rule 30a-3(d) under the Act) that occurred during the Registrant’s last fiscal half-year that has materially affected, or is reasonably likely to materially affect, the Registrant’s internal control over financial reporting.
Item 12: Exhibits:
(a) The following exhibits are attached to this Form N-CSR:
(2) A separate certification for each principal executive and principal financial officer of the registrant as required by Rule 30a-2(a) under the Act (17 CFR 270.30a-2) (certification required by Section 302 of the Sarbanes-Oxley Act of 2002).
(b) Certification required by Rule 30a-2(b) under the Act (certification required by Section 906 of the Sarbanes-Oxley Act of 2002).
SIGNATURES
Pursuant to the requirements of the Securities Exchange Act of 1934 and the Investment Company Act of 1940, the registrant has duly caused this report to be signed on its behalf by the undersigned, thereunto duly authorized.
Sit Mutual Funds, Inc.
| By (Signature and Title) | /s/ Paul E. Rasmussen | |||
| Paul E. Rasmussen | ||||
| Vice President, Treasurer |
Date February 26, 2018
Pursuant to the requirements of the Securities Exchange Act of 1934 and the Investment Company Act of 1940, this report has been signed below by the following persons on behalf of the registrant and in the capacities and on the dates indicated.
| By (Signature and Title) | /s/ Paul E. Rasmussen | |||
| Paul E. Rasmussen | ||||
| Vice President, Treasurer |
Date February 26, 2018
| By (Signature and Title) | /s/ Roger J . Sit | |||
| Roger J . Sit | ||||
| Chairman |
Date February 26, 2018