UNITED STATES
SECURITIES AND EXCHANGE COMMISSION
Washington, D.C. 20549
FORMN-CSR
CERTIFIED SHAREHOLDER REPORT OF REGISTERED
MANAGEMENT INVESTMENT COMPANIES
Investment Company Act file number:811-06373
Sit Mutual Funds, Inc.
(Exact name of registrant as specified in charter)
80 South Eighth Street
3300 IDS Center
Minneapolis, MN 55402
(Address of principal executive offices)
Paul E. Rasmussen, VP Treasurer
Sit Mutual Funds, Inc.
80 South Eighth Street
3300 IDS Center
Minneapolis, MN 55402
(Name and address of agent for service)
Copy to:
Mike Radmer, Esq.
Dorsey & Whitney
Suite 1500
50 South Sixth Street
Minneapolis, MN 55402-1498
Registrant’s telephone number, including area code: (612)332-3223
Date of fiscal year end: June 30, 2018
Date of reporting period: December 31, 2018
| Item 1: | Reports to Stockholders |
Semi-Annual Report December 31, 2018 Balanced Fund Dividend Growth Fund Global Dividend Growth Fund Large Cap Growth Fund ESG Growth Fund Mid Cap Growth Fund Small Cap Dividend Growth Fund Small Cap Growth Fund International Growth Fund Developing Markets Growth Fund Sit Mutual Funds
STOCK FUNDS SEMI-ANNUAL REPORT TABLE OF CONTENTS |
| Page | ||
| 2 | ||
Fund Reviews and Schedules of Investments | ||
| 4 | ||
| 12 | ||
| 16 | ||
| 20 | ||
| 24 | ||
| 28 | ||
| 32 | ||
| 36 | ||
| 40 | ||
| 46 | ||
| 50 | ||
| 52 | ||
| 54 | ||
| 58 | ||
| 72 | ||
| 80 | ||
| 82 | ||
This document must be preceded or accompanied by a Prospectus.
January 31, 2019
Dear Fellow Shareholders:
Fears over a global economic slowdown intensified towards the end of 2018, resulting in a significant correction in equities. We believe concerns over an imminent recession are exaggerated, and catalysts are in place for solid investment returns in the year ahead.
Economic Overview
Unlike last year at this time, 2019 begins with a downward shift in economic momentum, largely driven by weakness outside the U.S. While recession fears have gripped financial markets of late, the preponderance of data points to merely a slowdown, not an imminent contraction. In the U.S., consumer and business confidence remain high, capital spending and manufacturing are growing, and there are no clear signs of “excesses” that tend to precede recessions. Importantly, the domestic labor market has shown no signs of slowing. Payrolls were up 312,000 in December, well ahead of expectations, and wages moved solidly higher. The 2.6 million increase in jobs for the full year made it the strongest year since 2015. We do, however, recognize that growth headwinds will cause GDP growth in the year ahead to decelerate from the above-trend nearly +3.0% rate in 2018. These headwinds include the diminishing impact of fiscal stimulus, the tightening of financial conditions, and intensifying partisan conflicts in Washington. In addition, there is some risk that recent equity market declines may dampen consumer outlays via the “wealth effect,” and rising interest rates are having a negative impact on demand for housing and otherbig-ticket items.
While a recession in 2019 is unlikely, we view the current backdrop of slowing global growth (particularly in China), falling commodity prices and a surging dollar as strikingly reminiscent of the late-2015/early-2016 period. In a sense, some slowing in the U.S. economy is welcome news, insofar as it should result in a more dovish Federal Reserve. This, in turn, should take some pressure off the surging U.S. dollar, which has negatively impacted emerging markets. The Fed has recently signaled a move away from regular quarter-point rate hikes, shifting to a “data dependent” stance. Encouragingly, inflation measures have decelerated modestly in recent months, but it remains to be seen if these are temporary in nature.
Without question, U.S.-China trade tensions have impacted global business sentiment. Importantly, there have been positive signs that the U.S. and China are finding common ground on trade. We believe macro market weakness has increased the sense of urgency for an agreement, even one that may be less than satisfactory for both countries. While the90-day timeline set forth to finalize an agreement will likely prove unrealistic, we are optimistic sufficient progress will be made to postpone further application of increased tariffs on Chinese imports beyond the current March 1st deadline.
Downward pressure on China’s GDP will likely continue, as the lagging effects of deleveraging efforts and trade
tensions increasingly impact the real economy. Looking ahead, fiscal policy should begin to take hold through further tax cuts and a meaningful increase in local government bond issuance. Chinese monetary policy will also remain accommodative, with cuts to the reserve requirement ratio aimed at supporting bank lending. While countercyclical policies may help stabilize near-term growth, only structural and market reform can bring sustainable long-term growth. In addition, a trade agreement is critical to boosting business and consumer sentiment, with a positive “second order” impact on global growth (particularly in emerging economies).
Decoupled global growth, increased trade tensions and a stronger euro have contributed to diminished prospects for the EuroArea’s trade-sensitive economy. Regional demand has been supported by a tightening labor market, improving wage growth and elevated consumer confidence. However, heightened policy uncertainty and weaker exports are dampening business optimism and capital spending. In the UK, the economy has recently downshifted, but we expect an eventual Brexit deal will provide much needed certainty and an improved economic outlook. Yet, the risks are clear, a“no-deal” Brexit would be disastrous for the UK economy. Despite recent setbacks, we are hopeful that the UK Parliament will ultimately approve a deal.
Equity Strategy
A sharp correction in stocks in recent months pushed all major market indices into negative territory for the year. A pullback in stocks was justified, but now there is too much investor pessimism, based on market and economic fundamentals.
A slowdown in economic growth (discussed above) will take a toll on corporate earnings growth in 2019, with U.S. year ago comparisons particularly difficult due to the tax reform-fueled gains in 2018. Economic and policy uncertainty naturally lead to bouts of “risk on” and “risk off” in markets; but extremes, like those witnessed in 2018, are unnerving for investors. Although difficult to measure precisely, changes in market structure could very well be exacerbating volatility. According to J.P. Morgan Chase, approximately 85% of trading volume is currently generated by passive funds, ETFs, risk-parity strategies, and high frequency and algorithmic traders. Momentum begets momentum, on the way up and down. For fundamental investors, changes in the market/ trading landscape are frustrating, as stock prices may be disconnected from “fair value” (i.e., reflecting discounted cash flows) for long periods of time. Of course, the greatest opportunity for fundamental active managers to add value is during bouts of volatility and dislocation. However, one may need to extend time horizons to capture excess returns.
2 |
|
SIT MUTUAL FUNDS SEMI-ANNUAL REPORT |
|
|
Equity valuations have fallen throughout 2018, with broad-based P/E multiple compression most evident in cyclical sectors. As of 12/31/18, the S&P 500® multiple of 14.7x (on forward earnings) is at its lowest point since 2013, falling from 18.4x at the beginning of the year. Global benchmarks paint a similar picture, with every major region trading at a sharp discount to the U.S. While bond yields may rise from their current depressed levels, slowing Fed rate hikes in a backdrop of subdued inflation should prevent a major upward move in yields. This will lend support to equity valuations, which we believe are simply too low. In addition, dividends are also becoming a source of support for stocks. As of year end, 38% of the stocks within the the S&P 500® Index have yields exceeding the10-year Treasury rate. This compares to 15% at the end of the previous quarter.
While investors are clearly concerned that earnings forecasts are too high (making P/Es lower than they should be), we believe the upcoming 4 th quarter earnings reports will be solid enough to allay investor concerns. Withbottom-up consensus EPS forecasts still implying low double-digit growth for 2019 (excluding energy), we expect estimates to come down modestly, but not materially enough to change our view that valuations are attractive. This “reset” is largely discounted in equity valuations, although we expect significant volatility during the January reporting season.
As for investment strategy, we believe that many procyclical groups have been deeply oversold and thus offer a compelling risk/reward opportunity for investors. These include a diverse group of industries, such as aerospace, semi-conductors, oil refiners, chemicals, airlines, life insurance and investment banks. Many stocks within these sectors are trading at single-digit P/E multiples, despite healthy dividends and solid earnings growth prospects. However, based on the likelihood that “end of cycle” fears will result in continued volatility, we
believe it is prudent to balance cyclicals against defensive, more stable growth stocks. Attractive groups in this category include pharma/biotech, medical devices, HMO’s, telecom, P&C insurance and select technology stocks. Within technology, we continue to believe that the outsized performance of “momentum” stocks (including the “FAANG” group) has largely run its course, and investors will be more discriminating and sensitive to valuations against a backdrop of moderating growth and increasing regulatory risks. Regardless of sector, we expect investors to focus on companies with healthy dividends to provide incremental return and a source of stability if market volatility persists, which we expect.
Internationally, the same catalysts that we expect for U.S. stocks should be even more supportive of depressed emerging markets. Valuations for Indian and South Korean stocks are particularly attractive. We continue to favor Asia (excluding Japan), but are incrementally more cautious on Europe, due to elevated political/policy risks.
“Markets hate uncertainty” is perhaps the most overused phrase in the investment business. There isalwaysuncertainty. However, we believe compelling investment opportunities occur when investors are overly focused on risk relative to reward. With catalysts in place, we expect a solid year for investors in 2019.
With best wishes,
Roger J. Sit
Chairman, President, CEO and Global CIO
DECEMBER 31, 2018 |
3 |
|
OBJECTIVE & STRATEGY
The dual objectives of the Sit Balanced Fund are to seek long-term growth of capital consistent with the preservation of principal and to provide regular income. It pursues its objectives by investing in a diversified portfolio of stocks and bonds. The Fund may emphasize either equity securities or fixed-income securities, or hold equal amounts of each, dependent upon the Adviser’s analysis of market, financial and economic conditions.
The Fund’s permissible investment allocation is:35-65% in equity securities and35-65% in fixed-income securities. At all times at least 25% of the fixed-income assets will be invested in fixed-income senior securities.
The Sit Balanced Fund’ssix-month return was-4.24%, while the S&P 500® Index declined-6.85% and the Bloomberg Barclays Aggregate Bond Index increased +1.66% over the period.
Fears of a deteriorating economic and corporate earnings backdrop led to outperformance of bonds relative to stocks over the past six months. Despite strong earnings growth in 2018, stock prices have declined due to a dramatic“re-rating” of equity valuations. Specifically, the S&P 500®price-to-earnings (P/E) ratio fell from over 18x to begin the year to under 15x by the end of 2018. Investors have become pessimistic that upward stock momentum can continue, given the“one-off” nature oftax-driven earnings gains in 2018 amid signs of slowing economic growth (particularly outside the U.S.), a stronger U.S. dollar and increasing trade concerns. A pullback in stocks was justified, but we believe there is simply too much investor pessimism given market and economic fundamentals. The sharp drop in interest rates offers support to equity valuations, which we believe are too low. Furthermore, we expect U.S.-China trade tensions to ease, which should boost business, consumer and investor confidence. In short, while bonds have outperformed stocks in recent months, we expect a reversal in the near to intermediate term.
The equity portion of the Fund modestly underperformed the S&P 500® Index over the past six month. Underweighting the health technology sector detracted from performance during the period, as well as negative stock selection within the finance, consumernon-durables and consumer durables sectors. Conversely, performance was positively impacted by strong stock selection within the technology services, consumer services and producer manufacturing sectors. Underweighting the industrial services sector, which lagged materially over the period, also aided relative returns.
Positive bond market returns during the final six months of 2018 were primarily derived from income. The yield curve flattened meaningfully during the period, as shorter maturity interest rates rose but rates in the belly of the yield curve (i.e.2- to10-year maturities) declined. Looking ahead, we are forecasting two additional increases to the fed funds rate target during 2019.
We estimate that the fixed income portion of the fund modestly underperformed the Bloomberg Barclays Aggregate Bond Index over the past six months. The bond positions in aggregate continued to provide an income advantage relative to the benchmark. However, this
HYPOTHETICAL GROWTH OF $10,000
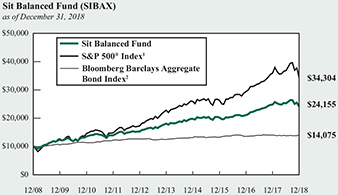
The chart above illustrates the total value of a hypothetical $10,000 investment in the Fund over the past 10 years as compared to the performance of the S&P 500® Index and the Bloomberg Barclays Aggregate Bond Index. Past performance does not guarantee future results. Returns include the reinvestment of distributions. The chart does not reflect the deduction of taxes that a shareholder would pay on Fund distributions or the redemption of Fund shares.
1 S&P 500® Index is an unmanaged capitalization-weighted index that measures the performance of 500 widely held common stocks oflarge-cap companies. It is not possible to invest directly in an index. This is the primary index for the equity portion of the Fund.
2 Bloomberg Barclays Aggregate Bond Index is an unmanaged market value-weighted index which measures the performance of investment grade debt securities with maturities of at least one year. This is the primary index for the fixed income portion of the Fund.
advantage was more than offset by price underperformance largely due to the flight to quality that occurred during December. Our sector allocation decision to underweight U.S. Treasury securities and our security selection within the corporate bond allocation both detracted from performance.
The stock/fixed income allocation is currently 56.1% equities, 40.5% fixed income, and 3.4% cash and equivalents. We expect to continue an above-average allocation to equities.
Roger J. Sit
Bryce A. Doty
Portfolio Managers
4 |
|
SIT MUTUAL FUNDS SEMI-ANNUAL REPORT |
|
COMPARATIVE RATES OF RETURNS
as of December 31, 2018 | ||||||
Sit Balanced Fund | S&P 500® Index 1 | Bloomberg Barclays Aggregate Bond Index 2 | ||||
Six Month |
-4.24% |
-6.85% |
1.66% | |||
One Year | -2.73 | -4.38 | 0.01 | |||
Five Year | 5.98 | 8.49 | 2.52 | |||
Ten Year | 9.22 | 13.12 | 3.48 | |||
Since Inception (12/31/93) | 6.73 | 9.07 | 5.09 | |||
Performance figures are historical and do not guarantee future results. Investment returns and principal value will vary, and you may have a gain or loss when you sell shares. Current performance may be lower or higher than the performance data quoted. Contact the Fund for performance data current to the most recentmonth-end. Returns include changes in share price as well as reinvestment of all dividends and capital gains. Returns do not reflect the deduction of taxes that a shareholder would pay on Fund distributions or the redemption of Fund shares. Management fees and administrative expenses are included in the Fund’s performance. Returns for periods greater than one year are compounded average annual rates of return.
1 S&P 500® Index is an unmanaged capitalization-weighted index that measures the performance of 500 widely held common stocks oflarge-cap companies. It is not possible to invest directly in an index.
2 Bloomberg Barclays Aggregate Bond Index is an unmanaged market value-weighted index which measures the performance of investment grade debt securities with maturities of at least one year.
PORTFOLIO SUMMARY
Net Asset Value 12/31/18: | $22.30 Per Share | |
Net Asset Value 6/30/18: | $23.76 Per Share | |
Total Net Assets: | $33.0 Million |
TOP HOLDINGS
Top Equity Holdings:
1. Visa, Inc.
2. Alphabet, Inc.
3. Microsoft Corp.
4. Apple, Inc.
5. Amazon.com, Inc.
Top Fixed Income Holdings:
1. U.S. Treasury Strip, 3.02%, 11/15/27
2. Fannie Mae,2017-M7 A2, 2.96%, 2/25/27
3. Johnson & Johnson, 5.95%, 8/15/37
4. Freddie Mac, 2102 Z, 6.00%, 12/15/28
5. Fannie Mae, 3.34%, 2/1/28
Based on total net assets as of December 31, 2018. Subject to change.
FUND DIVERSIFICATION
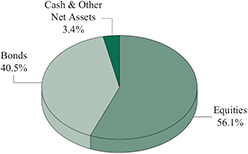
Based on total net assets as of December 31, 2018. Subject to change.
DECEMBER 31, 2018 |
5 |
|
SCHEDULE OF INVESTMENTS (Unaudited)
December 31, 2018
Sit Balanced Fund
| Name of Issuer | Quantity | Fair Value ($) | ||||||
Common Stocks - 56.1% | ||||||||
Communications - 1.0% | ||||||||
Verizon Communications, Inc. | 6,100 | 342,942 | ||||||
|
| |||||||
Consumer Durables - 0.5% | ||||||||
Electronic Arts, Inc.* | 2,225 | 175,575 | ||||||
|
| |||||||
ConsumerNon-Durables - 2.4% | ||||||||
Estee Lauder Cos., Inc. - Class A | 2,775 | 361,027 | ||||||
PepsiCo, Inc. | 2,525 | 278,962 | ||||||
VF Corp. | 1,925 | 137,330 | ||||||
|
| |||||||
| 777,319 | ||||||||
|
| |||||||
Consumer Services - 5.3% | ||||||||
Carnival Corp. | 2,050 | 101,065 | ||||||
Marriott International, Inc. | 2,000 | 217,120 | ||||||
McDonald’s Corp. | 1,225 | 217,523 | ||||||
Starbucks Corp. | 4,850 | 312,340 | ||||||
Visa, Inc. | 5,800 | 765,252 | ||||||
Walt Disney Co. | 1,200 | 131,580 | ||||||
|
| |||||||
| 1,744,880 | ||||||||
|
| |||||||
Electronic Technology - 6.0% | ||||||||
Apple, Inc. | 4,125 | 650,677 | ||||||
Applied Materials, Inc. | 7,575 | 248,005 | ||||||
Arista Networks, Inc.* | 525 | 110,617 | ||||||
Broadcom, Inc. | 1,460 | 371,249 | ||||||
Ciena Corp.* | 3,800 | 128,858 | ||||||
Intel Corp. | 6,100 | 286,273 | ||||||
NVIDIA Corp. | 825 | 110,138 | ||||||
Skyworks Solutions, Inc. | 875 | 58,642 | ||||||
|
| |||||||
| 1,964,459 | ||||||||
|
| |||||||
Energy Minerals - 2.5% | ||||||||
Chevron Corp. | 1,150 | 125,108 | ||||||
Continental Resources, Inc.* | 3,200 | 128,608 | ||||||
EOG Resources, Inc. | 1,025 | 89,390 | ||||||
Marathon Petroleum Corp. | 4,600 | 271,446 | ||||||
Occidental Petroleum Corp. | 2,400 | 147,312 | ||||||
Pioneer Natural Resources Co. | 550 | 72,336 | ||||||
|
| |||||||
| 834,200 | ||||||||
|
| |||||||
Finance - 6.3% | ||||||||
Ameriprise Financial, Inc. | 1,025 | 106,979 | ||||||
Bank of America Corp. | 10,525 | 259,336 | ||||||
Chubb,Ltd. | 2,375 | 306,802 | ||||||
First Republic Bank | 2,100 | 182,490 | ||||||
Goldman Sachs Group, Inc. | 1,375 | 229,694 | ||||||
JPMorgan Chase & Co. | 4,600 | 449,052 | ||||||
KeyCorp | 5,200 | 76,856 | ||||||
Prudential Financial, Inc. | 2,300 | 187,565 | ||||||
T Rowe Price Group, Inc. | 1,625 | 150,020 | ||||||
US Bancorp | 2,675 | 122,248 | ||||||
|
| |||||||
| 2,071,042 | ||||||||
|
| |||||||
| Name of Issuer | Quantity | Fair Value ($) | ||||||
Health Services - 2.2% | ||||||||
Centene Corp.* | 1,625 | 187,362 | ||||||
UnitedHealth Group, Inc. | 2,150 | 535,608 | ||||||
|
| |||||||
| 722,970 | ||||||||
|
| |||||||
Health Technology - 5.2% | ||||||||
AbbVie, Inc. | 3,625 | 334,189 | ||||||
Boston Scientific Corp.* | 6,725 | 237,661 | ||||||
Celgene Corp.* | 1,025 | 65,692 | ||||||
Edwards Lifesciences Corp.* | 675 | 103,390 | ||||||
Illumina, Inc.* | 325 | 97,477 | ||||||
Intuitive Surgical, Inc.* | 325 | 155,649 | ||||||
Johnson & Johnson | 2,300 | 296,815 | ||||||
Pfizer, Inc. | 3,500 | 152,775 | ||||||
Thermo Fisher Scientific, Inc. | 1,200 | 268,548 | ||||||
|
| |||||||
| 1,712,196 | ||||||||
|
| |||||||
Process Industries - 2.6% | ||||||||
DowDuPont, Inc. | 4,900 | 262,052 | ||||||
Ecolab, Inc. | 2,000 | 294,700 | ||||||
Sherwin-Williams Co. | 775 | 304,932 | ||||||
|
| |||||||
| 861,684 | ||||||||
|
| |||||||
Producer Manufacturing - 4.3% | ||||||||
3M Co. | 875 | 166,722 | ||||||
Deere &Co. | 775 | 115,607 | ||||||
General Dynamics Corp. | 600 | 94,326 | ||||||
Honeywell International, Inc. | 1,575 | 208,089 | ||||||
Ingersoll-Rand, PLC | 2,175 | 198,425 | ||||||
Parker-Hannifin Corp. | 1,325 | 197,610 | ||||||
Raytheon Co. | 1,925 | 295,199 | ||||||
Resideo Technologies, Inc.* | 258 | 5,302 | ||||||
United Technologies Corp. | 1,450 | 154,396 | ||||||
|
| |||||||
| 1,435,676 | ||||||||
|
| |||||||
Retail Trade - 3.8% | ||||||||
Amazon.com, Inc.* | 390 | 585,768 | ||||||
CVS Health Corp. | 1,375 | 90,090 | ||||||
Home Depot, Inc. | 1,875 | 322,162 | ||||||
TJX Cos., Inc. | 3,150 | 140,931 | ||||||
Ulta Beauty, Inc.* | 480 | 117,523 | ||||||
|
| |||||||
| 1,256,474 | ||||||||
|
| |||||||
Technology Services - 11.6% | ||||||||
Accenture, PLC | 1,800 | 253,818 | ||||||
Adobe, Inc.* | 1,525 | 345,016 | ||||||
Alphabet, Inc. - Class A* | 475 | 496,356 | ||||||
Alphabet, Inc. - Class C* | 205 | 212,300 | ||||||
Autodesk, Inc.* | 1,700 | 218,637 | ||||||
Booking Holdings, Inc.* | 135 | 232,527 | ||||||
Facebook, Inc.* | 1,375 | 180,249 | ||||||
Intuit, Inc. | 1,250 | 246,062 | ||||||
Microsoft Corp. | 6,975 | 708,451 | ||||||
PayPal Holdings, Inc.* | 3,750 | 315,338 | ||||||
See accompanying notes to financial statements. | ||||
6 |
|
SIT MUTUAL FUNDS SEMI-ANNUAL REPORT |
|
| Name of Issuer | Quantity /Principal Amount ($) | Fair Value ($) | ||||||
Red Hat, Inc.* | 1,450 | 254,678 | ||||||
salesforce.com, Inc.* | 2,550 | 349,274 | ||||||
|
| |||||||
| 3,812,706 | ||||||||
|
| |||||||
Transportation - 1.8% |
| |||||||
Delta Air Lines, Inc. | 4,600 | 229,540 | ||||||
FedEx Corp. | 1,150 | 185,529 | ||||||
Union Pacific Corp. | 1,225 | 169,332 | ||||||
|
| |||||||
| 584,401 | ||||||||
|
| |||||||
Utilities - 0.6% |
| |||||||
NextEra Energy, Inc. | 1,150 | 199,893 | ||||||
|
| |||||||
Total Common Stocks | 18,496,417 | |||||||
|
| |||||||
Bonds - 38.2% | ||||||||
Asset-Backed Securities - 2.6% |
| |||||||
Bayview Opportunity Master Fund, | 71,447 | 71,679 | ||||||
Credit Suisse First Boston Mortgage Corp., | 74,989 | 74,663 | ||||||
Element Rail Leasing II, LLC, | 75,000 | 77,558 | ||||||
Irwin Home Equity Corp., | 36,873 | 37,179 | ||||||
New Century Home Equity Loan Trust, | 10,308 | 10,466 | ||||||
Octagon Investment Partners 24, Ltd., | 125,000 | 124,123 | ||||||
OSCAR US Funding Trust VII, LLC: | ||||||||
2017-2A A3, 2.45%, 12/10/214 | 150,000 | 148,379 | ||||||
2017-2A A4, 2.76%, 12/10/244 | 100,000 | 98,544 | ||||||
Small Business Administration: | ||||||||
2008-20A 1, 5.17%, 1/1/28 | 51,708 | 54,364 | ||||||
2007-20H 1, 5.78%, 8/1/27 | 50,708 | 53,307 | ||||||
World Omni Auto Receivables Trust, | 100,000 | 99,886 | ||||||
|
| |||||||
| 850,148 | ||||||||
|
| |||||||
Collateralized Mortgage Obligations - 10.7% |
| |||||||
Fannie Mae: | ||||||||
2017-84 JP, 2.75%, 10/25/47 | 131,160 | 126,076 | ||||||
2017-M7 A2, 2.96%, 2/25/27 1 | 250,000 | 243,228 | ||||||
2018-M10 A2, 3.38%, 7/25/28 1 | 150,000 | 149,806 | ||||||
2004-10 ZB, 6.00%, 2/25/34 | 118,441 | 137,195 | ||||||
2003-34 A1, 6.00%, 4/25/43 | 41,797 | 46,377 | ||||||
2004-T1 1A1, 6.00%, 1/25/44 | 35,082 | 38,511 | ||||||
1999-17 C, 6.35%, 4/25/29 | 17,059 | 18,227 | ||||||
2001-82 ZA, 6.50%, 1/25/32 | 21,997 | 24,029 | ||||||
2009-30 AG, 6.50%, 5/25/39 | 62,377 | 67,656 | ||||||
2013-28 WD, 6.50%, 5/25/42 | 63,155 | 70,945 | ||||||
2004-T1 1A2, 6.50%, 1/25/44 | 120,147 | 134,439 | ||||||
| Name of Issuer |
Principal | Fair Value ($) | ||||||
2004-W9 2A1, 6.50%, 2/25/44 | 21,167 | 23,565 | ||||||
2015-88 CJ, 6.50%, 7/25/44 | 138,053 | 152,694 | ||||||
2010-108 AP, 7.00%, 9/25/40 | 3,039 | 3,627 | ||||||
2004-T3, 1A3, 7.00%, 2/25/44 | 9,792 | 11,100 | ||||||
1993-21 KA, 7.70%, 3/25/23 | 39,523 | 41,930 | ||||||
Freddie Mac: | ||||||||
4729 AG, 3.00%, 1/15/44 | 100,000 | 95,597 | ||||||
4784 BV, 3.50%, 12/15/32 | 100,000 | 100,089 | ||||||
4480 VY, 3.50%, 6/15/35 | 150,000 | 152,551 | ||||||
K078 A2, 3.85%, 6/25/28 | 150,000 | 155,972 | ||||||
4293 BA, 5.35%, 10/15/471 | 20,025 | 20,748 | ||||||
2102 Z, 6.00%, 12/15/28 | 170,980 | 184,814 | ||||||
2122 ZE, 6.00%, 2/15/29 | 81,717 | 89,644 | ||||||
2126 C, 6.00%, 2/15/29 | 54,003 | 58,535 | ||||||
2485 WG, 6.00%, 8/15/32 | 54,548 | 59,871 | ||||||
2480 Z, 6.00%, 8/15/32 | 46,878 | 52,181 | ||||||
2575 QE, 6.00%, 2/15/33 | 23,588 | 26,169 | ||||||
2771 NL, 6.00%, 3/15/34 | 123,010 | 138,338 | ||||||
2980 QA, 6.00%, 5/15/35 | 32,351 | 35,880 | ||||||
2283 K, 6.50%, 12/15/23 | 9,833 | 10,356 | ||||||
2357 ZJ, 6.50%, 9/15/31 | 25,744 | 28,086 | ||||||
T-59 1A1, 6.50%, 10/25/43 | 76,521 | 88,747 | ||||||
4520 HM, 6.50%, 8/15/45 | 50,894 | 59,388 | ||||||
1142 IA, 7.00%, 10/15/21 | 41,294 | 42,562 | ||||||
3946 KW, 7.00%, 11/15/29 | 3,653 | 3,766 | ||||||
3704 CT, 7.00%, 12/15/36 | 21,951 | 24,947 | ||||||
2238 PZ, 7.50%, 6/15/30 | 18,992 | 21,683 | ||||||
Government National Mortgage Association: | ||||||||
2009-35 NZ, 5.50%, 5/16/39 | 94,275 | 102,716 | ||||||
2002-57 BC, 6.00%, 8/20/32 | 29,570 | 29,997 | ||||||
2002-57 DC, 6.00%, 8/20/32 | 24,108 | 24,456 | ||||||
2015-80 BA, 6.98%, 6/20/451 | 39,653 | 44,746 | ||||||
2018-147 AM, 7.00%, 10/20/48 | 149,645 | 174,031 | ||||||
2018-160 DA, 7.00%, 11/20/48 | 124,851 | 150,147 | ||||||
2014-69 W, 7.25%, 11/20/341 | 39,450 | 44,237 | ||||||
2013-133 KQ, 7.30%, 8/20/381 | 36,084 | 40,631 | ||||||
2005-74 HA, 7.50%, 9/16/35 | 18,792 | 20,178 | ||||||
New Residential Mortgage Loan Trust, | 44,982 | 48,321 | ||||||
Sequoia Mortgage Trust, | 66,054 | 66,891 | ||||||
Vendee Mortgage Trust: | ||||||||
2008-1 B, 6.71%, 3/15/251 | 16,582 | 18,460 | ||||||
1994-2 2, 8.60%, 5/15/241 | 14,820 | 15,619 | ||||||
|
| |||||||
| 3,519,759 | ||||||||
|
| |||||||
Corporate Bonds - 9.6% |
| |||||||
Air Canada 2015-1 Trust, 3.60%, 3/15/27 4 | 172,749 | 166,048 | ||||||
Alphabet, Inc., 3.63%, 5/19/21 | 50,000 | 51,005 | ||||||
American Airlines2015-2 Trust, 4.00%, 9/22/27 | 101,385 | 98,638 | ||||||
See accompanying notes to financial statements. | ||||
DECEMBER 31, 2018 |
|
7 |
|
|
SCHEDULE OF INVESTMENTS (Unaudited)
December 31, 2018
Sit Balanced Fund (Continued)
| Name of Issuer |
Principal | Fair Value ($) | ||||||
American Airlines2016-2 Trust, 3.20%, 6/15/28 | 89,950 | 84,569 | ||||||
Anheuser-Busch InBev Finance, Inc., 4.90%, 2/1/46 | 50,000 | 46,369 | ||||||
Bank of America Corp., 3 Mo. Libor + 1.16, 3.63%, 1/20/231 | 100,000 | 99,914 | ||||||
Bank of New York Mellon Corp., 3 Mo. Libor + 1.05, 3.57%, 10/30/231 | 100,000 | 100,176 | ||||||
Barclays Bank, PLC, 3.28%, 3/16/231 | 50,000 | 48,575 | ||||||
Central Fidelity Capital Trust I (Subordinated), 3 Mo. Libor + 1.00, 3.44%, 4/15/271 | 175,000 | 157,500 | ||||||
Doric Nimrod Air Alpha2013-1 Trust, 5.25%, 5/30/234 | 49,869 | 49,501 | ||||||
Doric Nimrod Air Finance Alpha2012-1 Trust, 5.13%, 11/30/224 | 39,482 | 40,986 | ||||||
Duke Energy Florida, LLC, 2.54%, 9/1/29 | 50,000 | 46,585 | ||||||
Fifth Third Bank, 3 Mo. Libor + 0.44, 2.95%, 7/26/211 | 100,000 | 99,368 | ||||||
First Maryland Capital II, 3 Mo. Libor + 0.85, 3.39%, 2/1/271 | 100,000 | 88,000 | ||||||
General Mills, Inc., 3 Mo. Libor + 1.01, 3.46%, 10/17/231 | 100,000 | 97,677 | ||||||
Guardian Life Insurance Co. of America (Subordinated), 4.85%, 1/24/774 | 38,000 | 37,395 | ||||||
Hawaiian Airlines2013-1, 3.90%, 1/15/26 | 149,786 | 145,805 | ||||||
HSBC Holdings, PLC, 3 Mo. Libor + 1.00, 3.64%, 5/18/241 | 100,000 | 97,384 | ||||||
ITT, LLC, 7.40%, 11/15/25 | 25,000 | 29,495 | ||||||
Johnson & Johnson, 5.95%, 8/15/37 | 150,000 | 187,193 | ||||||
JPMorgan Chase & Co., 3 Mo. Libor + 0.73, 3.21%, 4/23/241 | 50,000 | 48,307 | ||||||
Manufacturers & Traders Trust Co. (Subordinated), 3 Mo. Libor + 0.64, 3.38%, 12/1/211 | 150,000 | 148,519 | ||||||
MetLife, Inc., 3.60%, 4/10/24 | 50,000 | 50,344 | ||||||
Northern Trust Corp. (Subordinated), 3 Mo. Libor + 1.13, 3.38%, 5/8/321 | 150,000 | 139,576 | ||||||
Sammons Financial, 7.00%, 10/15/434 | 75,000 | 88,698 | ||||||
Security Benefit Life Insurance Co. (Subordinated), 7.45%, 10/1/334 | 100,000 | 120,540 | ||||||
Spirit Airlines2015-1A Trust, 4.10%, 4/1/28 | 124,650 | 122,381 | ||||||
Tencent Holdings, Ltd., 3 Mo. Libor + 0.61, 3.05%, 1/19/231,4 | 100,000 | 99,095 | ||||||
United Airlines2014-1 Class A Pass Through Trust, 4.00%, 4/11/26 | 104,722 | 104,347 | ||||||
United Airlines2015-1 Trust, 3.70%, 12/1/22 | 100,000 | 97,730 | ||||||
United Parcel Service, Inc., 3 Mo. Libor + 0.45, 3.25%, 4/1/231 | 100,000 | 99,404 | ||||||
| Name of Issuer |
Principal | Fair Value ($) | ||||||
US Airways 2012-2 Trust, 4.63%, 6/3/25 | 130,672 | 135,359 | ||||||
USF&G Capital (Subordinated), 8.31%, 7/1/46 4 | 100,000 | 138,104 | ||||||
|
| |||||||
| 3,164,587 | ||||||||
|
| |||||||
Federal Home Loan Mortgage Corporation - 1.1% |
| |||||||
5.00%, 10/1/43 | 106,506 | 114,271 | ||||||
6.50%, 2/1/22 | 25,273 | 25,867 | ||||||
7.50%, 7/1/29 | 145,543 | 165,709 | ||||||
8.00%, 2/1/34 | 17,359 | 20,159 | ||||||
8.38%, 5/17/20 | 406 | 408 | ||||||
8.50%, 9/1/24 | 23,036 | 23,943 | ||||||
|
| |||||||
| 350,357 | ||||||||
|
| |||||||
Federal National Mortgage Association - 4.8% |
| |||||||
2.71%, 4/1/25 | 150,000 | 148,365 | ||||||
3.10%, 2/1/28 | 125,000 | 122,631 | ||||||
3.18%, 1/1/28 | 150,000 | 150,143 | ||||||
3.34%, 2/1/28 | 175,000 | 174,234 | ||||||
3.76%, 7/1/28 | 100,000 | 102,872 | ||||||
4.50%, 8/1/40 | 52,069 | 53,285 | ||||||
5.00%, 2/1/33 | 29,932 | 30,983 | ||||||
5.50%, 10/1/33 | 105,714 | 113,016 | ||||||
6.00%, 2/1/38 | 57,883 | 63,092 | ||||||
6.08%, 11/1/43 | 36,034 | 39,313 | ||||||
6.50%, 2/1/24 | 24,778 | 25,674 | ||||||
6.50%, 9/1/27 | 64,763 | 70,300 | ||||||
6.50%, 6/1/40 | 142,911 | 157,970 | ||||||
7.00%, 1/1/32 | 11,436 | 12,040 | ||||||
7.00%, 3/1/33 | 31,122 | 34,489 | ||||||
7.00%, 12/1/38 | 61,786 | 67,886 | ||||||
8.00%, 6/1/24 | 14,887 | 15,818 | ||||||
8.00%, 1/1/31 | 13,914 | 14,045 | ||||||
8.00%, 2/1/31 | 20,387 | 24,015 | ||||||
8.00%, 9/1/37 | 69,438 | 83,050 | ||||||
8.46%, 7/15/26 | 4,024 | 4,341 | ||||||
8.50%, 10/1/30 | 28,893 | 33,103 | ||||||
10.00%, 6/1/31 | 42,747 | 46,587 | ||||||
|
| |||||||
| 1,587,252 | ||||||||
|
| |||||||
Government National Mortgage Association - 2.3% |
| |||||||
5.00%, 5/20/48 | 148,797 | 156,756 | ||||||
5.75%, 12/15/22 | 43,755 | 44,872 | ||||||
6.00%, 4/15/29 | 46,139 | 50,195 | ||||||
6.00%, 2/15/36 | 114,021 | 123,929 | ||||||
6.00%, 7/15/38 | 67,574 | 72,536 | ||||||
6.50%, 2/20/32 | 112,908 | 129,060 | ||||||
6.50%, 11/20/38 | 30,626 | 34,825 | ||||||
7.00%, 12/15/24 | 13,027 | 13,614 | ||||||
7.00%, 11/20/27 | 16,203 | 18,249 | ||||||
7.00%, 9/20/29 | 43,376 | 48,890 | ||||||
7.00%, 9/20/38 | 13,822 | 16,054 | ||||||
See accompanying notes to financial statements. | ||||
8 |
|
SIT MUTUAL FUNDS SEMI-ANNUAL REPORT |
|
| Name of Issuer |
Principal | Fair Value ($) | ||||||
7.50%, 4/20/32 | 30,944 | 34,386 | ||||||
8.00%, 7/15/24 | 11,956 | 12,527 | ||||||
|
| |||||||
| 755,893 | ||||||||
|
| |||||||
Taxable Municipal Securities - 6.2% | ||||||||
Bucks Co. Industrial Dev. Auth., 4.00%, 10/1/21 | 95,000 | 95,350 | ||||||
City of New Haven CT, 4.33%, 8/1/27 | 155,000 | 162,079 | ||||||
CO Hsg. & Fin. Auth., 4.70%, 11/1/38 | 150,000 | 152,487 | ||||||
Idaho State Building Auth., 4.12%, 9/1/39 | 100,000 | 101,000 | ||||||
Illinois Hsg. Dev. Auth, 3.20%, 12/1/43 | 98,439 | 95,537 | ||||||
Iowa Student Loan Liq., 3.75%, 12/1/338 | 100,000 | 100,201 | ||||||
Kentucky Higher Edu. Student Loan Corp., 3.92%, 6/1/32 | 50,000 | 49,381 | ||||||
Kentucky Higher Edu. Student Loan Corp. (Subordinated), 5.27%, 6/1/36 | 100,000 | 100,076 | ||||||
Louisiana Housing Corp., 3.05%, 12/1/38 | 29,627 | 28,738 | ||||||
Massachusetts Edu. Auth.: | ||||||||
4.00%, 1/1/32 | 25,000 | 25,538 | ||||||
4.41%, 7/1/34 | 50,000 | 50,891 | ||||||
MN Hsg. Fin. Agy., 4.73%, 1/1/49 | 100,000 | 102,519 | ||||||
Mobile Co. Board of Sch. Comm., 2.07%, 12/15/25 | 100,000 | 90,455 | ||||||
Montana Fac. Fin. Auth., 4.37%, 8/15/38 | 100,000 | 105,113 | ||||||
Multistate Liquidating Trust No. 1, 3.11%, 12/15/284,17 | 14,000 | 13,219 | ||||||
NC Turnpike Auth., 6.70%, 1/1/39 | 75,000 | 75,247 | ||||||
Oklahoma Dev. Fin. Auth., 4.10%, 6/1/37 | 100,000 | 100,539 | ||||||
Public Finance Authority, 4.23%, 7/1/32 | 105,000 | 108,260 | ||||||
So. Dakota Hsg. Dev. Auth., 3.89%, 5/1/32 | 15,000 | 14,952 | ||||||
State of Colorado, 4.05%, 9/1/38 | 100,000 | 100,558 | ||||||
Summit Co. Dev. Fin. Auth., 5.13%, 11/1/48 | 100,000 | 102,717 | ||||||
Texas Children’s Hospital, 3.37%, 10/1/2917 | 115,000 | 114,056 | ||||||
Texas St. Pub.Fin. Auth.Charter Sch.Fin., 8.75%, 8/15/27 | 60,000 | 61,945 | ||||||
Tulane University, 2.92%, 2/15/361 | 100,000 | 95,130 | ||||||
|
| |||||||
| 2,045,988 | ||||||||
|
| |||||||
U.S. Treasury / Federal Agency Securities - 0.9% |
| |||||||
U.S. Treasury Strip, 3.02%, 11/15/276 | 400,000 | 315,470 | ||||||
|
| |||||||
Total Bonds | 12,589,454 | |||||||
|
| |||||||
Investment Companies - 2.3% | ||||||||
BlackRock Enhanced Government Fund | 7,197 | 93,417 | ||||||
BlackRock Income Trust | 16,500 | 93,060 | ||||||
Duff &Phelps Utility and Corp. Bond Trust | 8,700 | 71,514 | ||||||
Franklin, Ltd. Duration, Income Trust | 10,553 | 95,188 | ||||||
Nuveen Multi-Market Income Fund, Inc. | 3,953 | 27,276 | ||||||
Putnam Master Intermediate Income Trust | 25,502 | 108,384 | ||||||
Putnam Premier Income Trust | 29,300 | 137,417 | ||||||
| Name of Issuer |
Quantity | Fair Value ($) | ||||||
WA Inflation-Linked Opp. & Inc. Fund | 10,600 | 107,590 | ||||||
WA Inflation-Linked Sec. & Inc. Fund | 3,500 | 37,065 | ||||||
|
| |||||||
Total Investment Companies | 770,911 | |||||||
|
| |||||||
Short-Term Securities - 4.4% | ||||||||
Fidelity Inst. Money Mkt. Gvt. Fund, 2.25% | 1,444,089 | 1,444,089 | ||||||
|
| |||||||
(cost: $1,444,089) | ||||||||
Total Investments in Securities - 101.0% | 33,300,871 | |||||||
Other Assets and Liabilities, net - (1.0%) | (319,494 | ) | ||||||
|
| |||||||
Total Net Assets - 100.0% | $32,981,377 | |||||||
|
| |||||||
| * | Non-income producing security. |
| 1 | Variable rate security. Rate disclosed is as of December 31, 2018. Certain variable rate securities are not based on a published reference rate and spread but are determined by the issuer or agent and are based on current market conditions, or, for mortgage-backed securities, are impacted by the individual mortgages which are paying off over time. These securities do not indicate a reference rate and spread in their descriptions. |
| 4 | 144A Restricted Security. The total value of such securities as of December 31, 2018 was $1,322,190 and represented 4.0% of net assets. These securities have been determined to be liquid by the Adviser in accordance with guidelines established by the Board of Directors. |
| 6 | Zero coupon or convertible capital appreciation bond, for which the rate disclosed is either the effective yield on purchase date or the coupon rate to be paid upon conversion to coupon paying, respectively. |
| 8 | Securities the income from which is treated as a tax preference that is included in alternative minimum taxable income for purposes of computing federal alternative minimum tax (AMT). At December 31, 2018, 0.3% of net assets in the Fund was invested in such securities. |
| 14 | Step Coupon: A bond that pays an initial coupon rate for the first period and then a higher coupon rate for the following periods. Rate disclosed is as of December 31, 2018. |
| 17 | Security that is either an absolute and unconditional obligation of the United States Government or is collateralized by securities, loans, or leases guaranteed by the U.S. Government or its agencies or instrumentalities. |
Numeric footnotes not disclosed are not applicable to this Schedule of Investments.
LLC — Limited Liability Company
PLC — Public Limited Company
See accompanying notes to financial statements. | ||||
DECEMBER 31, 2018 |
|
9 |
|
|
SCHEDULE OF INVESTMENTS (Unaudited)
December 31, 2018
Sit Balanced Fund (Continued)
A summary of the levels for the Fund’s investments as of December 31, 2018 is as follows (see Note 2- significant accounting policies in the notes to financial statements):
| Investment in Securities | ||||||||||||
Level 1 | Level 2 Other significant observable inputs ($) | Level 3 Significant unobservable inputs ($) | Total ($) | |||||||||
Common Stocks** | 18,496,417 | — | — | 18,496,417 | ||||||||
Asset-Backed Securities | — | 850,148 | — | 850,148 | ||||||||
Collateralized Mortgage Obligations | — | 3,519,759 | — | 3,519,759 | ||||||||
Corporate Bonds | — | 3,164,587 | — | 3,164,587 | ||||||||
Federal Home Loan Mortgage Corporation | — | 350,357 | — | 350,357 | ||||||||
Federal National Mortgage Association | — | 1,587,252 | — | 1,587,252 | ||||||||
Government National Mortgage Association | — | 755,893 | — | 755,893 | ||||||||
Taxable Municipal Securities | — | 2,045,988 | — | 2,045,988 | ||||||||
U.S. Treasury / Federal Agency Securities | — | 315,470 | — | 315,470 | ||||||||
Investment Companies | 770,911 | — | — | 770,911 | ||||||||
Short-Term Securities | 1,444,089 | — | — | 1,444,089 | ||||||||
Total: | 20,711,417 | 12,589,454 | — | 33,300,871 | ||||||||
| ** | For equity securities categorized in a single level,refer to the Schedule of Investments for further breakdown. |
There were no transfers into or out of level 3 during the reporting period.
See accompanying notes to financial statements. | ||||
10 |
|
SIT MUTUAL FUNDS SEMI-ANNUAL REPORT |
|
[This page intentionally left blank.]
DECEMBER 31, 2018 |
11 |
|
Sit Dividend Growth Fund - Class I and Class S
|
OBJECTIVE & STRATEGY
The objective of the Sit Dividend Growth Fund is to provide current income that exceeds the dividend yield of the S&P 500® Index and that grows over a period of years. Secondarily, the Fund seeks long-term capital appreciation.
The Fund seeks to achieve its objectives by investing, under normal market conditions, at least 80% of its net assets in dividend-paying common stocks. The Fund may invest the balance of its assets in preferred stocks, convertible bonds, and U.S. Treasury securities.
The Sit Dividend Growth Fund Class I posted a-6.27% return for the last six months of 2018, compared to the-6.85% return for the S&P 500® Index. We estimate that the Fund’s gross dividend yield (before deducting Fund expenses) was 2.90%, compared to 2.25% for the S&P 500® Index.
The relatively calm, steady uptrend in the U.S. equity market gave way to volatility in late-2018, with the fourth quarter decline pushing all major market indices into negative territory for the year. Importantly, there are catalysts in place that have potential to change investor sentiment positively. U.S. economic data continue to be resilient (highlighted by a strong December employment report), the Federal Reserve has adopted a more dovish stance, trade tensions appear to be easing between the U.S. and China, and Chinese policymakers are providing stimulus to their ailing economy. We believe investor sentiment is set to improve, making stocks simply too cheap. As of 12/31/18, the S&P 500® multiple of 14.7x (on forward earnings) is at its lowest point since 2013, falling from 18.4x at the beginning of the year.
The broad-basedsell-off in recent months has resulted in compelling investment opportunities, particularly in manypro-cyclical groups. This includes a diverse group of industries, including aerospace, semiconductors, oil refiners, chemicals, airlines, life insurance and investment banks. Many stocks within these sectors are trading at single-digit P / E multiples, despite healthy dividends (i.e.,2%-4% yields) and good earnings growth prospects. However, based on the likelihood that “end of cycle” fears will result in continued volatility, we believe it is prudent to balance cyclicals against defensive, more stable areas. Attractive groups in this category include pharma/biotech, utilities, medical devices, HMO’s, telecom, P&C insurance and REITs. Regardless of sector, we expect investors to focus on companies with healthy dividends, which will provide incremental return and a source of stability if market volatility persists, as we expect. To this point, 71 out of 79 companies within the Fund raised dividend payments over the past twelve months, with an median increase of +11%.
HYPOTHETICAL GROWTH OF $10,000
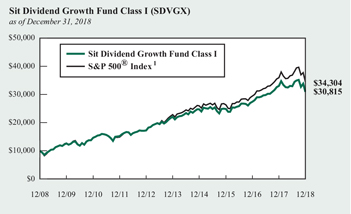
The chart above illustrates the total value of a hypothetical $10,000 investment in the Fund over the past 10 years as compared to the performance of the S&P 500® Index. Past performance does not guarantee future results. Returns include the reinvestment of distributions. The chart does not reflect the deduction of taxes that a shareholder would pay on Fund distributions or the redemption of Fund shares.
1 S&P 500® Index is an unmanaged capitalization-weighted index that measures the performance of 500 widely held common stocks oflarge-cap companies. It is not possible to invest directly in an index. This is the Fund’s primary index.
The Fund outperformed the S&P 500® Index over the past six months. Strong stock selection in the electronic technology, communications and technology services sector helped relative returns. Overweighting the health technology sector also aided returns. Despite the market pullback, many stocks within the Fund posted double-digit returns during the period, including Verizon Communications, Abbott Laboratories, Xilinx and Pfizer. Sectors that detracted from relative performance over the period included energy minerals, consumernon-durables, health services and process industries. Conagra Brands, Suncor, Devon Energy and Occidental Petroleum were the most significant laggards during the period.
We appreciate investors’ continued interest in the Fund.
Roger J. Sit
Kent L. Johnson
Michael J. Stellmacher
Portfolio Managers
12 | SIT MUTUAL FUNDS SEMI-ANNUAL REPORT | |
|
|
COMPARATIVE RATES OF RETURNS
as of December 31, 2018 | ||||||
Sit Dividend Growth Fund | ||||||
| Class I | Class S | S&P 500® Index 1 | ||||
Six Month |
-6.27% |
-6.37% |
-6.85% | |||
One Year | -6.57 | -6.79 | -4.38 | |||
Five Year | 6.99 | 6.71 | 8.49 | |||
Ten Year | 11.91 | 11.63 | 13.12 | |||
Since Inception - Class I | 8.74 | n/a | 7.76 | |||
(12/31/03) | ||||||
Since Inception - Class S | n/a | 7.91 | 7.56 | |||
(3/31/06)
| ||||||
Performance figures are historical and do not guarantee future results. Investment returns and principal value will vary, and you may have a gain or loss when you sell shares. Current performance may be lower or higher than the performance data quoted. Contact the Fund for performance data current to the most recentmonth-end. Returns include changes in share price as well as reinvestment of all dividends and capital gains. Returns do not reflect the deduction of the 2% redemption fee imposed if shares are redeemed or exchanged within 30 calendar days from their date of purchase. If imposed, the fee would reduce the performance quoted. Returns do not reflect the deduction of taxes that a shareholder would pay on Fund distributions or the redemption of Fund shares. Management fees and administrative expenses are included in the Fund’s performance. Returns for periods greater than one year are compounded average annual rates of return.
1 S&P 500® Index is an unmanaged capitalization-weighted index that measures the performance of 500 widely held common stocks oflarge-cap companies. It is not possible to invest directly in an index.
PORTFOLIO SUMMARY
Class I: | ||
Net Asset Value 12/31/18: | $12.55 Per Share | |
Net Asset Value 6/30/18: | $16.69 Per Share | |
Total Net Assets: | $421.5 Million | |
Class S: | ||
Net Asset Value 12/31/18: | $12.49 Per Share | |
Net Asset Value 6/30/18: | $16.61 Per Share | |
Total Net Assets: | $40.5 Million | |
Weighted Average Market Cap: | $152.3 Billion | |
TOP 10 HOLDINGS
1. Microsoft Corp.
2. Verizon Communications, Inc.
3. Johnson & Johnson
4. Apple, Inc.
5. CenterPoint Energy, Inc.
6. Broadcom, Inc.
7. Home Depot, Inc.
8. Abbott Laboratories
9. PepsiCo, Inc.
10. UnitedHealth Group, Inc.
Based on total net assets as of December 31, 2018. Subject to change.
FUND DIVERSIFICATION
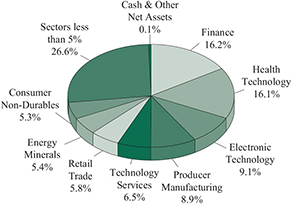
Based on total net assets as of December 31, 2018. Subject to change.
DECEMBER 31, 2018 |
13 |
|
SCHEDULE OF INVESTMENTS (Unaudited)
December 31, 2018
Sit Dividend Growth Fund
| Name of Issuer | Quantity | Fair Value ($) | ||||||
Common Stocks - 99.9% | ||||||||
Commercial Services - 0.6% | ||||||||
S&P Global, Inc. | 16,300 | 2,770,022 | ||||||
|
| |||||||
Communications - 3.6% | ||||||||
CenturyLink, Inc. | 142,225 | 2,154,709 | ||||||
Verizon Communications, Inc. | 261,675 | 14,711,368 | ||||||
|
| |||||||
| 16,866,077 | ||||||||
|
| |||||||
ConsumerNon-Durables - 5.3% | ||||||||
Coca-Cola Co. | 169,425 | 8,022,274 | ||||||
Conagra Brands, Inc. | 209,625 | 4,477,590 | ||||||
Mondelez International, Inc. | 53,850 | 2,155,616 | ||||||
PepsiCo, Inc. | 88,025 | 9,725,002 | ||||||
|
| |||||||
| 24,380,482 | ||||||||
|
| |||||||
Consumer Services - 4.8% | ||||||||
Carnival Corp. | 64,900 | 3,199,570 | ||||||
McDonald’s Corp. | 23,325 | 4,141,820 | ||||||
Visa, Inc. | 51,000 | 6,728,940 | ||||||
Walt Disney Co. | 72,975 | 8,001,709 | ||||||
|
| |||||||
| 22,072,039 | ||||||||
|
| |||||||
Electronic Technology - 9.1% | ||||||||
Apple, Inc. | 78,475 | 12,378,646 | ||||||
Applied Materials, Inc. | 104,625 | 3,425,422 | ||||||
Broadcom, Inc. | 40,035 | 10,180,100 | ||||||
Garmin, Ltd. | 40,850 | 2,586,622 | ||||||
Intel Corp. | 163,775 | 7,685,961 | ||||||
Skyworks Solutions, Inc. | 38,524 | 2,581,878 | ||||||
Xilinx, Inc. | 37,950 | 3,232,202 | ||||||
|
| |||||||
| 42,070,831 | ||||||||
|
| |||||||
Energy Minerals - 5.4% | ||||||||
Chevron Corp. | 75,150 | 8,175,568 | ||||||
Marathon Petroleum Corp. | 102,575 | 6,052,951 | ||||||
Occidental Petroleum Corp. | 113,450 | 6,963,561 | ||||||
Suncor Energy, Inc. | 132,375 | 3,702,529 | ||||||
|
| |||||||
| 24,894,609 | ||||||||
|
| |||||||
Finance - 16.2% | ||||||||
Alexandria Real Estate Equities, Inc. | 27,900 | 3,215,196 | ||||||
Axis Capital Holdings, Ltd. | 81,525 | 4,209,951 | ||||||
Chubb, Ltd. | 36,150 | 4,669,857 | ||||||
CME Group, Inc. | 22,518 | 4,236,086 | ||||||
Hartford Financial Services Group, Inc. | 127,400 | 5,662,930 | ||||||
Healthcare Realty Trust, Inc. | 76,800 | 2,184,192 | ||||||
JPMorgan Chase & Co. | 78,750 | 7,687,575 | ||||||
Legg Mason, Inc. | 108,600 | 2,770,386 | ||||||
Lincoln National Corp. | 135,400 | 6,947,374 | ||||||
Morgan Stanley | 194,150 | 7,698,048 | ||||||
Physicians Realty Trust | 238,914 | 3,829,791 | ||||||
Prudential Financial, Inc. | 55,525 | 4,528,064 | ||||||
Reinsurance Group of America, Inc. | 40,050 | 5,616,212 | ||||||
| Name of Issuer | Quantity | Fair Value ($) | ||||||
Synchrony Financial | 124,250 | 2,914,905 | ||||||
T Rowe Price Group, Inc. | 45,350 | 4,186,712 | ||||||
US Bancorp | 102,425 | 4,680,822 | ||||||
|
| |||||||
| 75,038,101 | ||||||||
|
| |||||||
Health Services - 3.4% | ||||||||
Quest Diagnostics, Inc. | 73,925 | 6,155,735 | ||||||
UnitedHealth Group, Inc. | 38,450 | 9,578,664 | ||||||
|
| |||||||
| 15,734,399 | ||||||||
|
| |||||||
Health Technology - 16.1% | ||||||||
Abbott Laboratories | 135,350 | 9,789,865 | ||||||
AbbVie, Inc. | 78,755 | 7,260,423 | ||||||
Amgen, Inc. | 36,075 | 7,022,720 | ||||||
Baxter International, Inc. | 76,875 | 5,059,912 | ||||||
Becton Dickinson and Co. | 40,700 | 9,170,524 | ||||||
Johnson & Johnson | 113,700 | 14,672,985 | ||||||
Medtronic, PLC | 48,125 | 4,377,450 | ||||||
Merck & Co., Inc. | 92,375 | 7,058,374 | ||||||
Pfizer, Inc. | 181,750 | 7,933,388 | ||||||
Zimmer Biomet Holdings, Inc. | 18,244 | 1,892,268 | ||||||
|
| |||||||
| 74,237,909 | ||||||||
|
| |||||||
Industrial Services - 2.5% | ||||||||
Jacobs Engineering Group, Inc. | 73,750 | 4,311,425 | ||||||
Targa Resources Corp. | 64,275 | 2,315,186 | ||||||
TransCanada Corp. | 142,950 | 5,103,315 | ||||||
|
| |||||||
| 11,729,926 | ||||||||
|
| |||||||
Process Industries - 4.3% | ||||||||
Avery Dennison Corp. | 66,725 | 5,993,907 | ||||||
DowDuPont, Inc. | 140,375 | 7,507,255 | ||||||
International Paper Co. | 71,175 | 2,872,623 | ||||||
Sherwin-Williams Co. | 8,850 | 3,482,121 | ||||||
|
| |||||||
| 19,855,906 | ||||||||
|
| |||||||
Producer Manufacturing - 8.9% | ||||||||
3M Co. | 19,175 | 3,653,604 | ||||||
Boeing Co. | 19,400 | 6,256,500 | ||||||
Deere & Co. | 28,950 | 4,318,471 | ||||||
Emerson Electric Co. | 75,550 | 4,514,112 | ||||||
Honeywell International, Inc. | 45,600 | 6,024,672 | ||||||
Lockheed Martin Corp. | 26,400 | 6,912,576 | ||||||
Parker-Hannifin Corp. | 37,575 | 5,603,936 | ||||||
Raytheon Co. | 25,100 | 3,849,085 | ||||||
|
| |||||||
| 41,132,956 | ||||||||
|
| |||||||
Retail Trade - 5.8% | ||||||||
CVS Health Corp. | 121,300 | 7,947,576 | ||||||
Home Depot, Inc. | 57,640 | 9,903,705 | ||||||
See accompanying notes to financial statements. | ||||
14 |
|
SIT MUTUAL FUNDS SEMI-ANNUAL REPORT |
|
| Name of Issuer | Quantity | Fair Value ($) | ||||||
Target Corp. | 63,825 | 4,218,194 | ||||||
TJX Cos., Inc. | 108,600 | 4,858,764 | ||||||
|
| |||||||
| 26,928,239 | ||||||||
|
| |||||||
Technology Services - 6.5% | ||||||||
Accenture, PLC | 32,450 | 4,575,774 | ||||||
Alphabet, Inc. - Class A* | 3,285 | 3,432,694 | ||||||
Intuit, Inc. | 17,175 | 3,380,899 | ||||||
Microsoft Corp. | 183,550 | 18,643,174 | ||||||
|
| |||||||
| 30,032,541 | ||||||||
|
| |||||||
Transportation - 2.8% | ||||||||
Delta Air Lines, Inc. | 98,350 | 4,907,665 | ||||||
FedEx Corp. | 18,225 | 2,940,239 | ||||||
Union Pacific Corp. | 36,450 | 5,038,484 | ||||||
|
| |||||||
| 12,886,388 | ||||||||
|
| |||||||
| Name of Issuer | Quantity | Fair Value ($) | ||||||
Utilities - 4.6% | ||||||||
CenterPoint Energy, Inc. | 368,175 | 10,393,580 | ||||||
DTE Energy Co. | 33,750 | 3,722,625 | ||||||
NextEra Energy, Inc. | 40,000 | 6,952,800 | ||||||
|
| |||||||
| 21,069,005 | ||||||||
|
| |||||||
Total Common Stocks | 461,699,430 | |||||||
|
| |||||||
Total Investments in Securities - 99.9% | 461,699,430 | |||||||
Other Assets and Liabilities, net - 0.1% | 339,784 | |||||||
|
| |||||||
Total Net Assets - 100.0% | $462,039,214 | |||||||
|
| |||||||
| ||||||||
| * | Non-income producing security. |
Numeric footnotes not disclosed are not applicable to this Schedule of Investments.
PLC — Public Limited Company
A summary of the levels for the Fund’s investments as of December 31, 2018 is as follows (see Note 2- significant accounting policies in the notes to financial statements):
Investment in Securities | ||||||||
| ||||||||
Level 1 Quoted Price ($) | Level 2 Other significant | Level 3 Significant unobservable inputs ($) | Total ($) | |||||
| ||||||||
Common Stocks** | 461,699,430 | — | — | 461,699,430 | ||||
| ||||||||
Total: | 461,699,430 | — | — | 461,699,430 | ||||
| ||||||||
** For equity securities categorized in a single level,refer to the Schedule of Investments for further breakdown.
There were no transfers into or out of level 3 during the reporting period.
See accompanying notes to financial statements. | ||||
DECEMBER 31, 2018 |
|
15 |
|
|
Sit Global Dividend Growth Fund - Class I and Class S
|
OBJECTIVE & STRATEGY
The objective of the Sit Global Dividend Growth Fund is to provide current income that exceeds the dividend yield of the MSCI World Index and that grows over a period of years. Secondarily, the Fund seeks long-term capital appreciation.
The Fund seeks to achieve its objectives by investing, under normal market conditions, at least 80% of its net assets in dividend-paying common stocks issued by U.S. and foreign companies. The Fund may invest the balance of its assets in preferred stocks, convertible bonds, and U.S. Treasury securities.
The Global Dividend Growth Fund outperformed the MSCI World Index for the six-month period ended December 31, 2018. The Fund’s Class I shares declined-5.95% versus a return of -9.10% for the MSCI World Index. Stock selection from both a geographic and industry perspective contributed to the relative outperformance.
Contributing favorably to relative outperformance during the six month period were the Fund’s holdings in the pharmaceutical (Pfizer, Abbott Laboratories and Johnson & Johnson), consumer services (Starbucks and McDonald’s Corp), and food, beverage & tobacco (Nestle and PepsiCo) industries. Conversely, the materials (DS Smith, ScottsMiracle-Gro, Domtar, LyondellBasell and Bayer), and diversified financials (AURELIUS Equity, T. Rowe Price and Goldman Sachs) industries negatively impacted absolute and relative performance.
Geographically, all regions positively contributed to the relative performance. North America was the top contributing region thanks to holdings in Starbucks, Verizon Communications, Pfizer,Abbott Laboratories and Microsoft.
Given evolving macro uncertainties, combined with several potential upside/downside catalysts, we believe a “barbell” investment strategy continues to provide a balanced risk-reward profile for the Fund. Holdings in cyclical sectors largely levered to capital spending, reflation, and the Trump administration’spro-growth policies comprise one side of the “barbell,” while the other side consists of secular/ traditional growth companies with highly visible earnings growth, strong balance sheets, and compelling valuations. We favor insurance and healthcare stocks for defensive exposure over expensively-valued bond proxies. We are constructive on healthcare as demographic trends continue to favor high medical product/service consumption across geographies. Property casualty insurance has sold off with interest rate sensitive financials but does not face the headwinds from sluggish loan growth, flattening yield curve, and potentially higher credit provisions. Cyclical stocks, including transports, refiners, chemicals, and investment banks, also offer compelling investment opportunities as many are currently trading at valuations that discount a much weaker macro environment than we are anticipating.
From a global perspective, we prefer more exposure to the U.S. and Asia(ex-Japan) at the expense of Europe and Japan. While we see modest gains in European economies, we believe the political and
HYPOTHETICAL GROWTH OF $10,000
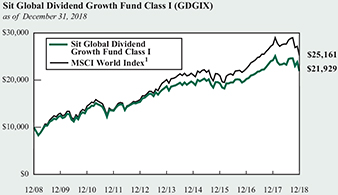
The chart above illustrates the total value of a hypothetical $10,000 investment in the Fund over the past 10 years (or for the life of the Fund if shorter) as compared to the performance of the MSCI World Index. Past performance does not guarantee future results. Returns include the reinvestment of distributions. The chart does not reflect the deduction of taxes that a shareholder would pay on Fund distributions or the redemption of Fund shares.
1 The MSCIWorld Index is a free float-adjusted market capitalization weighted index that is designed to measure the equity market performance of developed markets. It is not possible to invest directly in an index. This is the Fund’s primary index.
monetary headwinds will likely keep equities contained. We prefer mainland companies in Europe versus UK stocks as Brexit uncertainty could loom well into 2019. We anticipate a continued challenging environment for Japanese equities as the growth backdrop becomes more uncertain overseas and the coming consumption tax hike presents notable risks to already sluggish domestic demand.
The Fund’s gross dividend yield (before deduction of Fund expenses) is 3.08% compared to the 2.75% yield of the MSCI World Index. In periods of low absolute returns, the dividend component of the return becomes more significant and this should benefit the dividend paying companies that are the focus of this strategy. The Fund continues to be well diversified and emphasizes high quality, dividend paying growth stocks. We believe the Fund is well positioned to outperform in down markets if financial market volatility picks up, as we believe it will throughout 2019.
Roger J. Sit | Raymond E. Sit Tasha M. Murdoff | |
Kent L. Johnson | Michael J. Stellmacher | |
Portfolio Managers | ||
16 | SIT MUTUAL FUNDS SEMI-ANNUAL REPORT | |
COMPARATIVE RATES OF RETURNS
as of December 31, 2018 | ||||||||||||
| Sit Global Dividend Growth Fund | MSCI World | |||||||||||
| Class I | Class S | Index 1 | ||||||||||
Six Months | -5.95% | -6.08% | -9.10% | |||||||||
One Year | -9.63 | -9.93 | -8.71 | |||||||||
Five Year | 3.20 | 2.93 | 4.56 | |||||||||
Ten Year | 8.17 | 7.89 | 9.67 | |||||||||
Since Inception | 7.39 | 7.12 | 6.82 | |||||||||
(9/30/08) | ||||||||||||
Performance figures are historical and do not guarantee future results. Investment returns and principal value will vary, and you may have a gain or loss when you sell shares. Current performance may be lower or higher than the performance data quoted. Contact the Fund for performance data current to the most recentmonth-end. Returns include changes in share price as well as reinvestment of all dividends and capital gains. Returns do not reflect the deduction of the 2% redemption fee imposed if shares are redeemed or exchanged within 30 calendar days from their date of purchase. If imposed, the fee would reduce the performance quoted. Returns do not reflect the deduction of taxes that a shareholder would pay on Fund distributions or the redemption of Fund shares. Management fees and administrative expenses are included in the Fund’s performance. Returns for periods greater than one year are compounded average annual rates of return.
1 The MSCI World Index is a free float-adjusted market capitalization weighted index that is designed to measure the equity market performance of developed markets. It is not possible to invest directly in an index.
PORTFOLIO SUMMARY
Class I: | ||
Net Asset Value 12/31/18: | $14.13 Per Share | |
Net Asset Value 6/30/18: | $15.24 Per Share | |
Total Net Assets: | $26.7 Million | |
Class S: | ||
Net Asset Value 12/31/18: | $14.12 Per Share | |
Net Asset Value 6/30/18: | $15.22 Per Share | |
Total Net Assets: | $2.8 Million | |
Weighted Average Market Cap: | $165.0 Billion | |
TOP 10 HOLDINGS
1. Microsoft Corp.
2. Verizon Communications, Inc.
3. JPMorgan Chase & Co.
4. Pfizer, Inc.
5. Johnson & Johnson
6. AppVie, Inc.
7. Starbucks Corp.
8. Nestle SA
9. Allianz SE, ADR
10. Abbott Laboratories
Based on total net assets as of December 31, 2018. Subject to change.
FUND DIVERSIFICATION
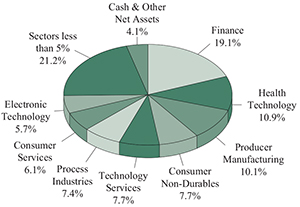
Based on total net assets as of December 31, 2018. Subject to change.
DECEMBER 31, 2018 |
|
17 |
|
|
SCHEDULE OF INVESTMENTS (Unaudited)
December 31, 2018
Sit Global Dividend Growth Fund
| Name of Issuer | Quantity |
Fair Value ($) | ||||||
Common Stocks - 95.9% | ||||||||
Asia - 1.8% | ||||||||
China/Hong Kong - 0.9% | ||||||||
HSBC Holdings, PLC, ADR | 6,475 | 266,187 | ||||||
|
| |||||||
Japan - 0.9% | ||||||||
Mitsubishi UFJ Financial Group, Inc., ADR | 51,300 | 249,831 | ||||||
|
| |||||||
Europe - 22.5% | ||||||||
Germany - 6.5% | ||||||||
adidas AG | 1,385 | 289,444 | ||||||
Allianz SE, ADR | 35,000 | 704,900 | ||||||
Aurelius SE & Co. | 5,500 | 199,888 | ||||||
Bayer AG | 3,725 | 258,465 | ||||||
Siemens AG | 4,100 | 457,450 | ||||||
|
| |||||||
| 1,910,147 | ||||||||
|
| |||||||
Ireland - 2.2% | ||||||||
Accenture, PLC | 2,475 | 349,000 | ||||||
Ingersoll-Rand, PLC | 3,275 | 298,778 | ||||||
|
| |||||||
| 647,778 | ||||||||
|
| |||||||
Netherlands - 2.3% | ||||||||
ING Groep NV, ADR | 38,300 | 408,278 | ||||||
LyondellBasell Industries NV | 3,225 | 268,191 | ||||||
|
| |||||||
| 676,469 | ||||||||
|
| |||||||
Spain - 2.5% | ||||||||
Iberdrola SA | 60,400 | 485,669 | ||||||
Industria de Diseno Textil SA | 9,800 | 250,954 | ||||||
|
| |||||||
| 736,623 | ||||||||
|
| |||||||
Switzerland - 3.2% | ||||||||
Chubb, Ltd. | 1,950 | 251,901 | ||||||
Nestle SA | 8,725 | 708,368 | ||||||
|
| |||||||
| 960,269 | ||||||||
|
| |||||||
United Kingdom - 5.8% | ||||||||
Carnival Corp. | 6,000 | 295,800 | ||||||
Diageo, PLC, ADR | 4,425 | 627,465 | ||||||
DS Smith, PLC | 66,175 | 252,450 | ||||||
RELX, PLC | 25,400 | 522,964 | ||||||
|
| |||||||
| 1,698,679 | ||||||||
|
| |||||||
North America - 71.6% | ||||||||
Canada - 1.7% | ||||||||
Suncor Energy, Inc. | 10,275 | 287,392 | ||||||
TransCanada Corp. | 6,300 | 224,910 | ||||||
|
| |||||||
| 512,302 | ||||||||
|
| |||||||
| Name of Issuer | Quantity |
Fair Value ($) | ||||||
United States - 69.9% | ||||||||
3M Co. | 2,225 | 423,952 | ||||||
Abbott Laboratories | 9,150 | 661,819 | ||||||
AbbVie, Inc. | 8,100 | 746,739 | ||||||
Alphabet, Inc. - Class A* | 450 | 470,232 | ||||||
Apple, Inc. | 4,000 | 630,960 | ||||||
Applied Materials, Inc. | 8,175 | 267,650 | ||||||
Arthur J Gallagher & Co. | 4,875 | 359,288 | ||||||
Bank of America Corp. | 16,300 | 401,632 | ||||||
Broadcom, Inc. | 1,500 | 381,420 | ||||||
CenterPoint Energy, Inc. | 7,400 | 208,902 | ||||||
Chevron Corp. | 2,075 | 225,739 | ||||||
Delta Air Lines, Inc. | 9,450 | 471,555 | ||||||
Domtar Corp. | 5,400 | 189,702 | ||||||
DowDuPont, Inc. | 8,825 | 471,961 | ||||||
Goldman Sachs Group, Inc. | 1,400 | 233,870 | ||||||
Home Depot, Inc. | 3,000 | 515,460 | ||||||
Honeywell International, Inc. | 3,200 | 422,784 | ||||||
Intel Corp. | 8,625 | 404,771 | ||||||
International Paper Co. | 5,900 | 238,124 | ||||||
Johnson & Johnson | 6,925 | 893,671 | ||||||
JPMorgan Chase & Co. | 9,650 | 942,033 | ||||||
KeyCorp | 16,800 | 248,304 | ||||||
Lockheed Martin Corp. | 1,815 | 475,240 | ||||||
Macquarie Infrastructure Corp. | 5,275 | 192,854 | ||||||
Marathon Petroleum Corp. | 7,950 | 469,130 | ||||||
McDonald’s Corp. | 1,525 | 270,794 | ||||||
Microsoft Corp. | 14,400 | 1,462,608 | ||||||
Occidental Petroleum Corp. | 5,975 | 366,746 | ||||||
Parker-Hannifin Corp. | 2,250 | 335,565 | ||||||
PepsiCo, Inc. | 5,775 | 638,022 | ||||||
Pfizer, Inc. | 20,600 | 899,190 | ||||||
Prudential Financial, Inc. | 3,725 | 303,774 | ||||||
Resideo Technologies, Inc.* | 533 | 10,953 | ||||||
Rockwell Automation, Inc. | 1,825 | 274,626 | ||||||
ScottsMiracle-Gro Co. | 3,225 | 198,208 | ||||||
Sherwin-Williams Co. | 800 | 314,768 | ||||||
Starbucks Corp. | 11,050 | 711,620 | ||||||
T Rowe Price Group, Inc. | 4,800 | 443,136 | ||||||
Union Pacific Corp. | 4,600 | 635,858 | ||||||
United Technologies Corp. | 2,675 | 284,834 | ||||||
US Bancorp | 9,475 | 433,008 | ||||||
Verizon Communications, Inc. | 19,300 | 1,085,046 | ||||||
Waste Management, Inc. | 5,900 | 525,041 | ||||||
WEC Energy Group, Inc. | 6,775 | 469,236 | ||||||
|
| |||||||
| 20,610,825 | ||||||||
|
| |||||||
Total Common Stocks | 28,269,110 | |||||||
|
| |||||||
See accompanying notes to financial statements. | ||||
18 |
|
SIT MUTUAL FUNDS SEMI-ANNUAL REPORT |
|
| Name of Issuer | Quantity |
Fair Value ($) | ||||||
Short-Term Securities - 3.9% | ||||||||
Fidelity Inst. Money Mkt. Gvt. Fund, 2.25% | 1,168,660 | 1,168,660 | ||||||
|
| |||||||
(cost: $1,168,660) | ||||||||
Total Investments in Securities - 99.8% | 29,437,770 | |||||||
Other Assets and Liabilities, net - 0.2% | 47,136 | |||||||
|
| |||||||
Total Net Assets - 100.0% | $29,484,906 | |||||||
|
| |||||||
| * | Non-income producing security. |
Numeric footnotes not disclosed are not applicable to this Schedule of Investments.
ADR — American Depositary Receipt
PLC — Public Limited Company
A summary of the levels for the Fund’s investments as of December 31, 2018 is as follows (see Note 2- significant accounting policies in the notes to financial statements):
| Investment in Securities | ||||||||||||||||
| Level 1 Quoted Price ($) | Level 2 Other significant observable inputs ($) | Level 3 Significant unobservable inputs ($) | Total ($) | |||||||||||||
Common Stocks | ||||||||||||||||
Canada | 512,302 | — | — | 512,302 | ||||||||||||
China/Hong Kong | 266,187 | — | — | 266,187 | ||||||||||||
Germany | 1,910,147 | — | — | 1,910,147 | ||||||||||||
Ireland | 647,778 | — | — | 647,778 | ||||||||||||
Japan | 249,831 | — | — | 249,831 | ||||||||||||
Netherlands | 676,469 | — | — | 676,469 | ||||||||||||
Spain | 736,623 | — | — | 736,623 | ||||||||||||
Switzerland | 960,269 | — | — | 960,269 | ||||||||||||
United Kingdom | 1,698,679 | — | — | 1,698,679 | ||||||||||||
United States | 20,610,825 | — | — | 20,610,825 | ||||||||||||
Short-Term Securities | 1,168,660 | — | — | 1,168,660 | ||||||||||||
Total: | 29,437,770 | — | — | 29,437,770 | ||||||||||||
Level 1 securities of foreign issuers are primarily American Depositary Receipts (ADRs), Public Limited Companies (PLCs) or Global Depositary Receipts (GDRs). There were no transfers into or out of level 3 during the reporting period.
See accompanying notes to financial statements. | ||||
DECEMBER 31, 2018 |
|
19 |
|
|
|
OBJECTIVE & STRATEGY
The objective of the Sit Large Cap Growth Fund is to maximize long-term capital appreciation. The Fund pursues this objective by investing at least 80% of its net assets in the common stocks of domestic growth companies with capitalizations of $5 billion or more at the time of purchase.
The Sit Large Cap Growth Fund’ssix-month return was-7.31%, compared to the-8.17% return for the Russell 1000® Growth Index. The S&P 500® Index return for the period was-6.85%.
U.S. stocks sold off sharply in the final months of 2018, as concerns over global growth dominated the investment backdrop. Economic momentum is clearly slipping, but we view recession fears as overblown. The preponderance of data points to merely a slowdown, not an imminent contraction. U.S. consumer and business confidence remain high, the labor market is healthy, capital spending and manufacturing are growing, and there are no clear signs of “excesses” that tend to precede recessions. We expect sentiment to improve as 2019 progresses, likely driven by progress on U.S.-China trade negotiations, a pause in Fed rate increases, and signs of stabilization in the Chinese economy as stimulative government policies take hold.
Regarding investment strategy, we believe that manypro-cyclical groups have been deeply oversold and offer compelling risk/reward opportunities for investors. This includes a diverse group of industries: aerospace, semiconductors, oil refiners, chemicals, airlines, life insurance, and investment banks. Many stocks within these sectors are trading at single-digit P/E multiples, despite healthy dividends and earnings growth prospects. However, based on the likelihood that “end of cycle” fears will result in continued volatility, we believe it is prudent to balance cyclicals against defensive, more stable growth stocks. Attractive groups in this category include pharma/ biotech, medical devices, HMO’s, telecom, P&C insurance and select technology stocks. Within technology, we continue to believe that the outsized performance of “momentum” stocks (including the “FAANG” group) has largely run its course and investors will be more discriminating and sensitive to valuations against a backdrop of moderating growth and increasing regulatory risks. Regardless of sector, our research emphasis remains focused on building a diversified portfolio of attractively valued, high quality companies that compound earnings on a consistent basis.
The Fund outperformed the Russell 1000® Growth Index over the past six months, largely due to stock selection in consumer services, electronic technology, health technology, process industries, and technology services. Outperforming stocks within these sectors included
HYPOTHETICAL GROWTH OF $10,000
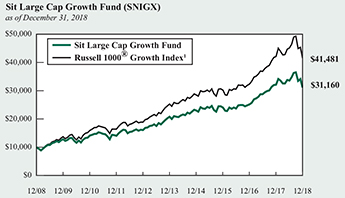
The chart above illustrates the total value of a hypothetical $10,000 investment in the Fund over the past 10 years as compared to the performance of the Russell 1000® Growth Index. Past performance does not guarantee future results. Returns include the reinvestment of distributions. The chart does not reflect the deduction of taxes that a shareholder would pay on Fund distributions or the redemption of Fund shares.
1 Russell 1000® Growth Index is an unmanaged index that measures the performance of those Russell 1000 Index companies with higherprice-to-book ratios and higher forecasted growth values. It is not possible to invest directly in an index. This is the Fund’s primary index.
Starbucks, Ciena, Red Hat, Ecolab, Broadcom, Thermo Fisher Scientific and Boston Scientific. It is notable that each of these stocks posted gains over the period, despite challenging markets. Relative performance was negatively impacted by stock selection in the finance and consumer durables sectors, as well as overweighting the underperforming energy minerals sector. Individual laggards within the portfolio included Applied Materials, Electronic Arts, Raytheon, Goldman Sachs, FedEx and DowDupont.
Despite a challenging second half of 2018 for markets, we remain enthusiastic about the near- and long-term outlooks for companies held in the Fund.
Roger J. Sit
Ronald D. Sit
Michael J. Stellmacher
Portfolio Managers
20 | SIT MUTUAL FUNDS SEMI-ANNUAL REPORT | |
|
|
COMPARATIVE RATES OF RETURNS
as of December 31, 2018
| Sit Large Cap Growth Fund | Russell 1000® Growth Index1 | Russell 1000® Index 2 | ||||||||||
Six Month | -7.31 | % | -8.17 | % | -7.42% | |||||||
One Year | -3.11 | -1.51 | -4.78 | |||||||||
Five Year | 8.42 | 10.40 | 8.21 | |||||||||
Ten Year | 12.04 | 15.29 | 13.28 | |||||||||
Since Inception3 | 9.82 | 11.00 | 11.43 | |||||||||
(9/2/82) | ||||||||||||
Performance figures are historical and do not guarantee future results. Investment returns and principal value will vary, and you may have a gain or loss when you sell shares. Current performance may be lower or higher than the performance data quoted. Contact the Fund for performance data current to the most recentmonth-end. Returns include changes in share price as well as reinvestment of all dividends and capital gains. Returns do not reflect the deduction of the 2% redemption fee imposed if shares are redeemed or exchanged within 30 calendar days from their date of purchase. If imposed, the fee would reduce the performance quoted. Returns do not reflect the deduction of taxes that a shareholder would pay on Fund distributions or the redemption of Fund shares. Management fees and administrative expenses are included in the Fund’s performance. Returns for periods greater than one year are compounded average annual rates of return.
1 Russell 1000® Growth Index is an unmanaged index that measures the performance of those Russell 1000 Index companies with higherprice-to-book ratios and higher forecasted growth values. It is not possible to invest directly in an index.
2 Russell 1000® Index is an unmanaged index that measures the performance of approximately 1,000 of the largest U.S. companies by market capitalization.
3 On 6/6/93, the Fund’s investment objective changed to allow for a portfolio of 100% stocks. Prior to that time, the portfolio was required to contain no more than 80% stocks.
PORTFOLIO SUMMARY
Net Asset Value 12/31/18: | $35.66 Per Share | |
Net Asset Value 6/30/18: | $42.40 Per Share | |
Total Net Assets: | $105.1 Million | |
Weighted Average Market Cap: | $236.6 Billion |
TOP 10 HOLDINGS
1. Alphabet, Inc.
2. Microsoft Corp.
3. Apple, Inc.
4. Visa, Inc.
5. Amazon.com, Inc.
6. UnitedHealth Group, Inc.
7. Adobe, Inc.
8. Home Depot, Inc.
9. Broadcom, Inc.
10. Facebook, Inc.
Based on total net assets as of December 31, 2018. Subject to change.
FUND DIVERSIFICATION
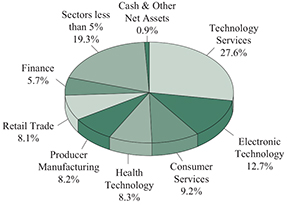
Based on total net assets as of December 31, 2018. Subject to change.
DECEMBER 31, 2018 |
21 |
|
SCHEDULE OF INVESTMENTS (Unaudited)
December 31, 2018
Sit Large Cap Growth Fund
Name of Issuer | Quantity | Fair Value ($) | ||||||
Common Stocks - 99.1% | ||||||||
Communications - 1.1% | ||||||||
Verizon Communications, Inc. | 20,925 | 1,176,404 | ||||||
|
| |||||||
Consumer Durables - 0.7% | ||||||||
Electronic Arts, Inc.* | 9,900 | 781,209 | ||||||
|
| |||||||
ConsumerNon-Durables - 4.4% | ||||||||
Estee Lauder Cos., Inc. - Class A | 14,675 | 1,909,218 | ||||||
PepsiCo, Inc. | 17,300 | 1,911,304 | ||||||
VF Corp. | 11,000 | 784,740 | ||||||
|
| |||||||
| 4,605,262 | ||||||||
|
| |||||||
Consumer Services - 9.2% | ||||||||
Carnival Corp. | 10,700 | 527,510 | ||||||
Marriott International, Inc. | 9,300 | 1,009,608 | ||||||
McDonald’s Corp. | 4,700 | 834,579 | ||||||
Starbucks Corp. | 24,700 | 1,590,680 | ||||||
Visa, Inc. | 31,900 | 4,208,886 | ||||||
Walt Disney Co. | 13,200 | 1,447,380 | ||||||
|
| |||||||
| 9,618,643 | ||||||||
|
| |||||||
Electronic Technology - 12.7% | ||||||||
Apple, Inc. | 42,200 | 6,656,628 | ||||||
Applied Materials, Inc. | 49,700 | 1,627,178 | ||||||
Arista Networks, Inc.* | 2,750 | 579,425 | ||||||
Broadcom, Inc. | 7,800 | 1,983,384 | ||||||
Ciena Corp.* | 21,300 | 722,283 | ||||||
Intel Corp. | 16,800 | 788,424 | ||||||
NVIDIA Corp. | 5,325 | 710,888 | ||||||
Skyworks Solutions, Inc. | 4,700 | 314,994 | ||||||
|
| |||||||
| 13,383,204 | ||||||||
|
| |||||||
Energy Minerals - 1.6% | ||||||||
Chevron Corp. | 2,600 | 282,854 | ||||||
Continental Resources, Inc.* | 4,900 | 196,931 | ||||||
Marathon Petroleum Corp. | 15,500 | 914,655 | ||||||
Pioneer Natural Resources Co. | 2,300 | 302,496 | ||||||
|
| |||||||
| 1,696,936 | ||||||||
|
| |||||||
Finance - 5.7% | ||||||||
Bank of America Corp. | 32,000 | 788,480 | ||||||
Chubb, Ltd. | 8,650 | 1,117,407 | ||||||
Goldman Sachs Group, Inc. | 5,600 | 935,480 | ||||||
JPMorgan Chase & Co. | 16,700 | 1,630,254 | ||||||
Prudential Financial, Inc. | 7,900 | 644,245 | ||||||
T Rowe Price Group, Inc. | 8,900 | 821,648 | ||||||
|
| |||||||
| 5,937,514 | ||||||||
|
| |||||||
Health Services - 3.5% | ||||||||
Centene Corp.* | 8,500 | 980,050 | ||||||
UnitedHealth Group, Inc. | 10,675 | 2,659,356 | ||||||
|
| |||||||
| 3,639,406 | ||||||||
|
| |||||||
|
Name of Issuer | Quantity | Fair Value ($) | ||||||
Health Technology - 8.3% | ||||||||
AbbVie, Inc. | 17,400 | 1,604,106 | ||||||
Boston Scientific Corp.* | 40,300 | 1,424,202 | ||||||
Celgene Corp.* | 7,425 | 475,868 | ||||||
Edwards Lifesciences Corp.* | 3,900 | 597,363 | ||||||
Illumina, Inc.* | 1,800 | 539,874 | ||||||
Intuitive Surgical, Inc.* | 1,800 | 862,056 | ||||||
Johnson & Johnson | 11,000 | 1,419,550 | ||||||
Pfizer, Inc. | 13,200 | 576,180 | ||||||
Thermo Fisher Scientific, Inc. | 5,250 | 1,174,898 | ||||||
|
| |||||||
| 8,674,097 | ||||||||
|
| |||||||
Process Industries - 4.2% | ||||||||
DowDuPont, Inc. | 21,600 | 1,155,168 | ||||||
Ecolab, Inc. | 10,575 | 1,558,226 | ||||||
Sherwin-Williams Co. | 4,300 | 1,691,878 | ||||||
|
| |||||||
| 4,405,272 | ||||||||
|
| |||||||
Producer Manufacturing - 8.2% | ||||||||
3M Co. | 6,350 | 1,209,929 | ||||||
Deere & Co. | 4,200 | 626,514 | ||||||
General Dynamics Corp. | 3,500 | 550,235 | ||||||
Honeywell International, Inc. | 9,925 | 1,311,291 | ||||||
Ingersoll-Rand, PLC | 10,700 | 976,161 | ||||||
Parker-Hannifin Corp. | 8,700 | 1,297,518 | ||||||
Raytheon Co. | 12,125 | 1,859,369 | ||||||
Resideo Technologies, Inc.* | 1,654 | 33,990 | ||||||
United Technologies Corp. | 7,400 | 787,952 | ||||||
|
| |||||||
| 8,652,959 | ||||||||
|
| |||||||
Retail Trade - 8.1% | ||||||||
Amazon.com, Inc.* | 2,750 | 4,130,417 | ||||||
CVS Health Corp. | 5,400 | 353,808 | ||||||
Home Depot, Inc. | 12,600 | 2,164,932 | ||||||
TJX Cos., Inc. | 26,000 | 1,163,240 | ||||||
Ulta Beauty, Inc.* | 3,000 | 734,520 | ||||||
|
| |||||||
| 8,546,917 | ||||||||
|
| |||||||
Technology Services - 27.6% | ||||||||
Accenture, PLC | 12,175 | 1,716,797 | ||||||
Adobe, Inc.* | 10,100 | 2,285,024 | ||||||
Alphabet, Inc. - Class A* | 1,050 | 1,097,208 | ||||||
Alphabet, Inc. - Class C* | 5,966 | 6,178,449 | ||||||
Autodesk, Inc.* | 9,800 | 1,260,378 | ||||||
Booking Holdings, Inc.* | 965 | 1,662,135 | ||||||
Facebook, Inc.* | 14,750 | 1,933,577 | ||||||
Intuit, Inc. | 6,600 | 1,299,210 | ||||||
Microsoft Corp. | 67,400 | 6,845,818 | ||||||
PayPal Holdings, Inc.* | 21,500 | 1,807,935 | ||||||
Red Hat, Inc.* | 6,100 | 1,071,404 | ||||||
salesforce.com, Inc.* | 13,700 | 1,876,489 | ||||||
|
| |||||||
| 29,034,424 | ||||||||
|
| |||||||
See accompanying notes to financial statements. | ||||
22 |
|
SIT MUTUAL FUNDS SEMI-ANNUAL REPORT |
|
Name of Issuer | Quantity | Fair Value ($) | ||||||
Transportation - 3.1% | ||||||||
Delta Air Lines, Inc. | 24,915 | 1,243,258 | ||||||
FedEx Corp. | 5,200 | 838,916 | ||||||
Union Pacific Corp. | 8,800 | 1,216,424 | ||||||
|
| |||||||
| 3,298,598 | ||||||||
|
| |||||||
Utilities - 0.7% | ||||||||
NextEra Energy, Inc. | 4,000 | 695,280 | ||||||
|
| |||||||
Total Common Stocks |
| 104,146,125 | ||||||
|
| |||||||
Name of Issuer | Quantity | Fair Value ($) | ||||||
Short-Term Securities - 0.9% | ||||||||
Fidelity Inst. Money Mkt. Gvt. Fund, 2.25% | 869,624 | 869,624 | ||||||
|
| |||||||
Total Investments in Securities - 100.0% |
| 105,015,749 | ||||||
Other Assets and Liabilities, net - 0.0% |
| 46,835 | ||||||
|
| |||||||
Total Net Assets - 100.0% |
| $105,062,584 | ||||||
|
| |||||||
| * | Non-income producing security. |
Numeric footnotes not disclosed are not applicable to this Schedule of Investments.
PLC — Public Limited Company
A summary of the levels for the Fund’s investments as of December 31, 2018 is as follows (see Note 2- significant accounting policies in the notes to financial statements):
| Investment in Securities | ||||||||||||
| Level 1 Quoted Price ($) | Level 2 Other significant observable inputs ($) | Level 3 Significant unobservable inputs ($) | Total ($) | |||||||||
Common Stocks** | 104,146,125 | — | — | 104,146,125 | ||||||||
Short-Term Securities | 869,624 | — | — | 869,624 | ||||||||
Total: | 105,015,749 | — | — | 105,015,749 | ||||||||
** For equity securities categorized in a single level, refer to the Schedule of Investments for further breakdown.
There were no transfers into or out of level 3 during the reporting period.
See accompanying notes to financial statements. | ||||
DECEMBER 31, 2018 |
|
23 |
|
|
OBJECTIVE & STRATEGY
The objective of the Sit ESG Growth Fund is to maximize long-term capital appreciation. The Fund seeks to achieve its objectives by investing, under normal market conditions, at least 80% of its net assets in companies that the Adviser believes have strong environmental, social and corporate governance (ESG) practices at the time of purchase. The Fund invests in common stocks of U.S. and foreign companies, primarily of large to medium capitalizations (companies with market capitalization in excess of $2 billion).
The Sit ESG Growth Fund outperformed the MSCI World Index for the last six months of 2018. The Fund’s Class I shares declined-6.54% in thesix-month period ended December 31, 2018 compared to the MSCI World Index return of-9.10%. Stock selection, geographic and industry allocation and currency allocation all positively contributed to relative outperformance for the aforementioned period.
Specifically, the industries contributing most favorably to relative performance were food, beverage & tobacco (Coca-Cola European Partners, Nestle and PepsiCo), consumer services (Starbucks and Visa), and (Ingersoll-Rand and 3M)- all due to positive stock selection. The larger than normal cash also contributed to relative performance during thesix-month period. The industries that detracted the most were diversified financials (Goldman Sachs, Legg Mason and T. Rowe Price) and transportation (FedEx).
From a geographic standpoint, the countries of the United States (Starbucks, Verizon Communications, Pfizer, Ingersoll-Rand and Boston Scientific) and the United Kingdom (Coca-Cola European Partners, Diageo and RELX) added value due to positive stock selection, the overweight allocation and currency allocation. However, stock selection in the Euroland (Bayer, ING, Inditex, Siemens and Accenture) negatively impacted the Fund.
Given evolving macro uncertainties, combined with several potential upside/downside catalysts, we believe a “barbell” investment strategy continues to provide a balanced risk-reward profile for the Fund. Holdings in cyclical sectors largely levered to capital spending, reflation, and the Trump administration’spro-growth policies comprise one side of the “barbell,” while the other side consists of secular/traditional growth companies with highly visible earnings growth, strong balance sheets, and compelling valuations. We favor insurance and healthcare stocks for defensive exposure over expensively-valued bond proxies. We are constructive on healthcare as demographic trends continue to favor high medical product/service consumption across geographies. Property casualty insurance has sold off with interest rate sensitive financials but does not face the headwinds from sluggish loan growth, flattening yield curve, and potentially higher credit provisions. Cyclical stocks, including transports, refiners, chemicals, and investment banks, also offer compelling investment opportunities as many are currently trading at valuations that discount a much weaker macro environment than we are anticipating.
HYPOTHETICAL GROWTH OF $10,000
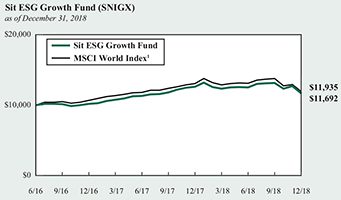
The chart above illustrates the total value of a hypothetical $10,000 investment in the Fund over the past 10 years (or for the life of the Fund if shorter) as compared to the performance of the MSCI World Index. Past performance does not guarantee future results. Returns include the reinvestment of distributions. The chart does not reflect the deduction of taxes that a shareholder would pay on Fund distributions or the redemption of Fund shares.
1 The MSCI World Index is a free float-adjusted market capitalization weighted index that is designed to measure the equity market performance of developed markets. It is not possible to invest directly in an index. This is the Fund’s primary index.
From a global perspective, we prefer more exposure to the U.S. and Asia(ex-Japan) at the expense of Europe and Japan. While we see modest gains in European economies, we believe the political and monetary headwinds will likely keep equities contained. We prefer mainland companies in Europe versus UK stocks as Brexit uncertainty could loom well into 2019. We anticipate a continued challenging environment for Japanese equities as the growth backdrop becomes more uncertain overseas and the coming consumption tax hike presents notable risks to already sluggish domestic demand.
The focus of the Sit ESG Fund is to invest at least 80% of the assets in companies that have strong ESG (environmental, social and corporate governance) practices. We remain positive about the long-term outlook for companies held in the Fund based on attractive valuations and sustainable earnings growth potential.
Roger J. Sit
Ronald D. Sit
Michael J. Stellmacher
Portfolio Managers
24 | SIT MUTUAL FUNDS SEMI-ANNUAL REPORT |
COMPARATIVE RATES OF RETURNS
as of December 31, 2018 | ||||||
| Sit ESG Growth Fund | MSCI World Index 1 | |||||
| Class I | Class S | |||||
Six Month | -6.54% | -6.68% | -9.10% | |||
One Year | -7.36 | -7.65 | -8.71 | |||
Since Inception | 6.44 | 6.17 | 7.32 | |||
(6/30/16) | ||||||
Performance figures are historical and do not guarantee future results. Investment returns and principal value will vary, and you may have a gain or loss when you sell shares. Current performance may be lower or higher than the performance data quoted. Contact the Fund for performance data current to the most recentmonth-end. Returns include changes in share price as well as reinvestment of all dividends and capital gains. Returns do not reflect the deduction of the 2% redemption fee imposed if shares are redeemed or exchanged within 30 calendar days from their date of purchase. If imposed, the fee would reduce the performance quoted. Returns do not reflect the deduction of taxes that a shareholder would pay on Fund distributions or the redemption of Fund shares. Management fees and administrative expenses are included in the Fund’s performance. Returns for periods greater than one year are compounded average annual rates of return.
1 The MSCI World Index is a free float-adjusted market capitalization weighted index that is designed to measure the equity market performance of developed markets. It is not possible to invest directly in an index.
PORTFOLIO SUMMARY
Class I: | ||
Net Asset Value 12/31/18: | $11.40 Per Share | |
Net Asset Value 6/30/18: | $12.37 Per Share | |
Total Net Assets: | $ 2.9 Million | |
Class S: | ||
Net Asset Value 12/31/18: | $11.37 Per Share | |
Net Asset Value 6/30/18: | $12.34 Per Share | |
Total Net Assets: | $ 2.5 Million | |
Weighted Average Market Cap: | $ 162.6 Billion | |
TOP 10 HOLDINGS
1. Verizon Communications, Inc.
2. Microsoft Corp.
3. Allianz SE, ADR
4. Starbucks Corp.
5. JPMorgan Chase & Co.
6. Ingersoll-Rand, PLC
7. Pfizer, Inc.
8. Intel Corp.
9. AbbVie, Inc.
10. Alphabet, Inc. - Class A
Based on total net assets as of December 31, 2018. Subject to change.
FUND DIVERSIFICATION
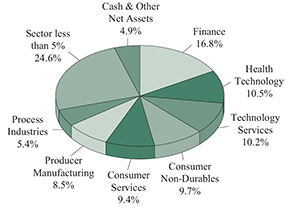
Based on total net assets as of December 31, 2018. Subject to change.
DECEMBER 31, 2018 |
25 |
|
SCHEDULE OF INVESTMENTS (Unaudited)
December 31, 2018
Sit ESG Growth Fund
| Name of Issuer | Quantity | Fair Value ($) | ||||||
Common Stocks - 95.1% | ||||||||
Asia - 2.4% | ||||||||
China/Hong Kong - 1.0% | ||||||||
HSBC Holdings, PLC, ADR | 1,300 | 53,443 | ||||||
|
| |||||||
Japan - 1.4% | ||||||||
Mitsubishi UFJ Financial Group, Inc., ADR | 8,325 | 40,543 | ||||||
Sony Corp., ADR | 800 | 38,624 | ||||||
|
| |||||||
| 79,167 | ||||||||
|
| |||||||
Europe - 25.5% | ||||||||
Germany - 8.2% | ||||||||
adidas AG, ADR | 550 | 57,387 | ||||||
Allianz SE, ADR | 9,900 | 199,386 | ||||||
Bayer AG | 1,290 | 89,509 | ||||||
Siemens AG, ADR | 1,725 | 96,738 | ||||||
|
| |||||||
| 443,020 | ||||||||
|
| |||||||
Ireland - 3.9% | ||||||||
Accenture, PLC | 450 | 63,454 | ||||||
Ingersoll-Rand, PLC | 1,625 | 148,249 | ||||||
|
| |||||||
| 211,703 | ||||||||
|
| |||||||
Netherlands - 1.7% | ||||||||
ING Groep NV, ADR | 8,775 | 93,542 | ||||||
|
| |||||||
Spain - 3.0% | ||||||||
Iberdrola SA, ADR | 2,950 | 94,651 | ||||||
Industria de Diseno Textil SA | 2,575 | 65,939 | ||||||
|
| |||||||
| 160,590 | ||||||||
|
| |||||||
Switzerland - 2.3% | ||||||||
Nestle SA, ADR | 1,550 | 125,488 | ||||||
|
| |||||||
United Kingdom - 6.4% | ||||||||
Coca-Cola European Partners, PLC | 2,100 | 96,285 | ||||||
Diageo, PLC, ADR | 700 | 99,260 | ||||||
RELX, PLC, ADR | 4,700 | 96,444 | ||||||
Royal Dutch Shell, PLC, ADR - Class B | 875 | 52,448 | ||||||
|
| |||||||
| 344,437 | ||||||||
|
| |||||||
North America - 67.2% | ||||||||
Canada - 2.1% | ||||||||
Suncor Energy, Inc. | 4,100 | 114,677 | ||||||
|
| |||||||
United States - 65.1% | ||||||||
3M Co. | 600 | 114,324 | ||||||
AbbVie, Inc. | 1,450 | 133,675 | ||||||
Adobe, Inc.* | 500 | 113,120 | ||||||
Allstate Corp. | 525 | 43,381 | ||||||
Alphabet, Inc. - Class A* | 125 | 130,620 | ||||||
Apple, Inc. | 675 | 106,474 | ||||||
Baxter International, Inc. | 850 | 55,947 | ||||||
Boston Scientific Corp.* | 3,000 | 106,020 | ||||||
Delta Air Lines, Inc. | 1,500 | 74,850 | ||||||
DowDuPont, Inc. | 1,700 | 90,916 | ||||||
Ecolab, Inc. | 775 | 114,196 | ||||||
| Name of Issuer | Quantity | Fair Value ($) | ||||||
Facebook, Inc.* | 320 | 41,949 | ||||||
FedEx Corp. | 485 | 78,245 | ||||||
Goldman Sachs Group, Inc. | 500 | 83,525 | ||||||
Home Depot, Inc. | 745 | 128,006 | ||||||
Intel Corp. | 3,050 | 143,136 | ||||||
Johnson & Johnson | 975 | 125,824 | ||||||
JPMorgan Chase & Co. | 1,725 | 168,394 | ||||||
KeyCorp | 2,500 | 36,950 | ||||||
Legg Mason, Inc. | 1,600 | 40,816 | ||||||
Lockheed Martin Corp. | 185 | 48,440 | ||||||
Marriott International, Inc. | 1,100 | 119,416 | ||||||
Microsoft Corp. | 2,000 | 203,140 | ||||||
NIKE, Inc. | 700 | 51,898 | ||||||
Occidental Petroleum Corp. | 1,200 | 73,656 | ||||||
PepsiCo, Inc. | 875 | 96,670 | ||||||
Pfizer, Inc. | 3,375 | 147,319 | ||||||
Prudential Financial, Inc. | 800 | 65,240 | ||||||
Rockwell Automation, Inc. | 350 | 52,668 | ||||||
Starbucks Corp. | 2,750 | 177,100 | ||||||
T Rowe Price Group, Inc. | 925 | 85,396 | ||||||
TJX Cos., Inc. | 1,380 | 61,741 | ||||||
UnitedHealth Group, Inc. | 375 | 93,420 | ||||||
Verizon Communications, Inc. | 3,625 | 203,798 | ||||||
Visa, Inc. | 875 | 115,448 | ||||||
|
| |||||||
| 3,525,718 | ||||||||
|
| |||||||
Total Common Stocks | 5,151,785 | |||||||
|
| |||||||
Short-Term Securities - 4.8% | ||||||||
Fidelity Inst. Money Mkt. Gvt. Fund, 2.25% | 261,560 | 261,560 | ||||||
|
| |||||||
(cost: $261,560) | ||||||||
Total Investments in Securities - 99.9% | 5,413,345 | |||||||
Other Assets and Liabilities, net - 0.1% | 3,003 | |||||||
|
| |||||||
Total Net Assets - 100.0% | $5,416,348 | |||||||
|
| |||||||
| * | Non-income producing security. |
Numeric footnotes not disclosed are not applicable to this Schedule of Investments
ADR — American Depositary Receipt
PLC — Public Limited Company
See accompanying notes to financial statements. | ||||
26 |
|
SIT MUTUAL FUNDS SEMI-ANNUAL REPORT |
|
|
A summary of the levels for the Fund’s investments as of December 31, 2018 is as follows (see Note 2- significant accounting policies in the notes to financial statements):
| Investment in Securities | ||||||||||||
| Level 1 Quoted Price ($) | Level 2 Other significant observable inputs ($) | Level 3 Significant | Total ($) | |||||||||
Common Stocks | ||||||||||||
Canada | 114,677 | — | — | 114,677 | ||||||||
China/Hong Kong | 53,443 | — | — | 53,443 | ||||||||
Germany | 443,020 | — | — | 443,020 | ||||||||
Ireland | 211,703 | — | — | 211,703 | ||||||||
Japan | 79,167 | — | — | 79,167 | ||||||||
Netherlands | 93,542 | — | — | 93,542 | ||||||||
Spain | 160,590 | — | — | 160,590 | ||||||||
Switzerland | 125,488 | — | — | 125,488 | ||||||||
United Kingdom | 344,437 | — | — | 344,437 | ||||||||
United States | 3,525,718 | — | — | 3,525,718 | ||||||||
Short-Term Securities | 261,560 | — | — | 261,560 | ||||||||
Total: | 5,413,345 | — | — | 5,413,345 | ||||||||
Level 1 securities of foreign issuers are primarily American Depositary Receipts (ADRs), Public Limited Companies (PLCs) or Global Depositary Receipts (GDRs). There were no transfers into or out of level 3 during the reporting period
See accompanying notes to financial statements. | ||||
DECEMBER 31, 2018 |
|
27 |
|
|
|
OBJECTIVE & STRATEGY
The objective of the Sit Mid Cap Growth Fund is to maximize long-term capital appreciation. The Fund pursues this objective by investing at least 80% of its net assets in common stocks that, at the time of purchase, have market capitalizations that fall within the range of companies included in the Russell Midcap® Growth Index during the most recent12-month period. The Russell Midcap® Growth Index ranged from approximately $365 million to $81 billion during the12-month period ended December 31, 2018.
Sit Mid Cap Growth Fund’s return for the second half of 2018 was-10.19%, compared to-9.63% for the Russell Midcap® Growth Index. The S&P Midcap® Index fell-14.08% during the period.
Stock prices turned sharply lower toward the end of 2018, as investors began to discount that a more challenging economic backdrop will begin to impact corporate earnings. Admittedly, earnings growth will moderate this year from robust gains in 2018, which were amplified by aone-off benefit from reduced taxes due to corporate tax reform. However, despite some deceleration in 2019, we expect solid earnings growth for many mid cap companies, particularly in the sectors that we are emphasizing. Specifically, the growth outlook for the technology group remains exceptionally strong based on a multitude of growth drivers, including cloud adoption,e-commerce, artificial intelligence, productivity-enhancing software, and the increasing amount of semiconductor “content” across a wide variety of industries. Technology services and electronic technology remain the heaviest weighted sectors within the Fund, as we believe the overweight (relative to the Russell Midcap Growth Index) is justified by their growth outlooks and increasingly attractive valuations. Despite underperformance in 2018, we maintain a significant allocation to the financial sector. Recession fears have clearly resulted in significant share price declines in 2018, but we believe these concerns are overblown. With many banks, life insurers and asset managers trading at single-digitprice-to-earnings multiples, risk/reward is skewed to the upside, in our view.
Over the past six months, the Fund modestly underperformed the Russell Midcap® Growth Index. Stock selection within the retail trade, finance and consumer durables sectors detracted from performance during the period. In terms of individual stocks, the most significant underperformers included Electronic Arts, Applied Materials, Camping World Holdings, Skyworks Solutions, XPO Logistics and SVB Financial Group. On a positive note, the Fund’s holdings within producer manufacturing, consumer services and industrial services significantly outperformed the benchmark sector, adding to relative returns. The best performing stocks during the second
HYPOTHETICAL GROWTH OF $10,000
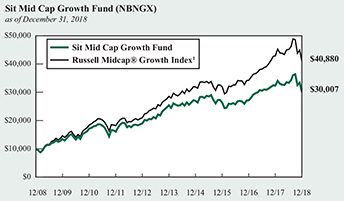
The chart above illustrates the total value of a hypothetical $10,000 investment in the Fund over the past 10 years as compared to the performance of the Russell Midcap® Growth Index. Past performance does not guarantee future results. Returns include the reinvestment of distributions. The chart does not reflect the deduction of taxes that a shareholder would pay on Fund distributions or the redemption of Fund shares.
1 Russell Midcap® Growth Index is an unmanaged index that measures the performance of those Russell Midcap Index companies with higherprice-to-book ratios and higher forecasted growth values. It is not possible to invest directly in an index. This is the Fund’s primary index.
half of 2018 included Atlassian, Ciena, Euronet Worldwide, Coca-Cola European Partners and Service Corporation International. Each of these stocks posted double-digit positive returns over the period.
Our research staff remains highly focused on identifying growth opportunities and using market volatility to improve the risk/reward profile of the Fund. While heightened volatility is understandably unnerving for investors, it does provide active managers with opportunities to “upgrade” holdings during periods of volatility. We appreciate investors’ continued interest in the Fund.
Roger J. Sit
Kent L. Johnson
Robert W. Sit
Portfolio Managers
28 | SIT MUTUAL FUNDS SEMI-ANNUAL REPORT |
COMPARATIVE RATES OF RETURNS
as of December 31, 2018 | ||||||
Sit Mid Cap | Russell Midcap® Growth Index1 | Russell Midcap® Index 2 | ||||
Six Month | -10.19% | -9.63% | -11.14% | |||
One Year | -7.25 | -4.75 | -9.06 | |||
Five Year | 3.36 | 7.42 | 6.26 | |||
Ten Year | 11.61 | 15.12 | 14.03 | |||
Since Inception (9/2/82) | 10.96 | n/a | n/a | |||
Performance figures are historical and do not guarantee future results. Investment returns and principal value will vary, and you may have a gain or loss when you sell shares. Current performance may be lower or higher than the performance data quoted. Contact the Fund for performance data current to the most recentmonth-end. Returns include changes in share price as well as reinvestment of all dividends and capital gains and all fee waivers. Without the fee waivers total return and yield figures would have been lower. Returns do not reflect the deduction of the 2% redemption fee imposed if shares are redeemed or exchanged within 30 calendar days from their date of purchase. If imposed, the fee would reduce the performance quoted. Returns do not reflect the deduction of taxes that a shareholder would pay on Fund distributions or the redemption of Fund shares. Management fees and administrative expenses are included in the Fund’s performance. Returns for periods greater than one year are compounded average annual rates of return.
1 Russell Midcap® Growth Index is an unmanaged index that measures the performance of those Russell Midcap Index companies with higherprice-to-book ratios and higher forecasted growth values. It is not possible to invest directly in an index.
2 Russell Midcap® Index is an unmanaged index that measures the performance of approximately 800 of the smallest companies in the Russell 1000® Index.
PORTFOLIO SUMMARY
Net Asset Value 12/31/18: | $15.14 Per Share | |
Net Asset Value 6/30/18: | $18.96 Per Share | |
Total Net Assets: | $138.5 Million | |
Weighted Average Market Cap: | $21.7 Billion |
TOP 10 HOLDINGS
1. Waste Connections, Inc.
2. TJX Cos., Inc.
3. Arista Networks, Inc.
4. Broadcom, Inc.
5. Ulta Beauty, Inc.
6. Thermo Fisher Scientific, Inc.
7. PTC, Inc.
8. Booking Holdings, Inc.
9. Euronet Worldwide, Inc.
10. Ingersoll-Rand, PLC
Based on total net assets as of December 31, 2018. Subject to change.
FUND DIVERSIFICATION

Based on total net assets as of December 31, 2018. Subject to change.
DECEMBER 31, 2018 |
29 |
|
SCHEDULE OF INVESTMENTS (Unaudited)
December 31, 2018
Sit Mid Cap Growth Fund
Name of Issuer | Quantity | Fair Value ($) | ||||||
Common Stocks - 98.2% | ||||||||
Commercial Services - 2.6% | ||||||||
Booz Allen Hamilton Holding Corp. | 48,200 | 2,172,374 | ||||||
Brink’s Co. | 21,100 | 1,364,115 | ||||||
|
| |||||||
| 3,536,489 | ||||||||
|
| |||||||
Communications - 0.7% | ||||||||
CenturyLink, Inc. | 68,100 | 1,031,715 | ||||||
|
| |||||||
Consumer Durables - 1.1% | ||||||||
Electronic Arts, Inc.* | 20,000 | 1,578,200 | ||||||
|
| |||||||
ConsumerNon-Durables - 1.8% | ||||||||
Coca-Cola European Partners, PLC | 40,700 | 1,866,095 | ||||||
VF Corp. | 8,900 | 634,926 | ||||||
|
| |||||||
| 2,501,021 | ||||||||
|
| |||||||
Consumer Services - 6.9% | ||||||||
Cinemark Holdings, Inc. | 24,100 | 862,780 | ||||||
Dunkin’ Brands Group, Inc. | 23,600 | 1,513,232 | ||||||
Marriott International, Inc. | 17,732 | 1,924,986 | ||||||
Nexstar Media Group, Inc. | 11,600 | 912,224 | ||||||
Service Corp. International | 55,500 | 2,234,430 | ||||||
Strategic Education, Inc. | 10,400 | 1,179,568 | ||||||
Vail Resorts, Inc. | 4,700 | 990,854 | ||||||
|
| |||||||
| 9,618,074 | ||||||||
|
| |||||||
Electronic Technology - 11.0% | ||||||||
Applied Materials, Inc. | 64,400 | 2,108,456 | ||||||
Arista Networks, Inc.* | 17,900 | 3,771,530 | ||||||
Broadcom, Inc. | 13,600 | 3,458,208 | ||||||
Cabot Microelectronics Corp. | 10,825 | 1,032,164 | ||||||
Ciena Corp.* | 27,700 | 939,307 | ||||||
Garmin, Ltd. | 17,600 | 1,114,432 | ||||||
Monolithic Power Systems, Inc. | 3,000 | 348,750 | ||||||
NVIDIA Corp. | 3,200 | 427,200 | ||||||
Skyworks Solutions, Inc. | 30,550 | 2,047,461 | ||||||
|
| |||||||
| 15,247,508 | ||||||||
|
| |||||||
Energy Minerals - 1.9% | ||||||||
Continental Resources, Inc.* | 6,500 | 261,235 | ||||||
Marathon Petroleum Corp. | 39,010 | 2,301,980 | ||||||
|
| |||||||
| 2,563,215 | ||||||||
|
| |||||||
Finance - 10.4% | ||||||||
Ameriprise Financial, Inc. | 7,800 | 814,086 | ||||||
Arthur J Gallagher & Co. | 18,900 | 1,392,930 | ||||||
Axis Capital Holdings, Ltd. | 20,500 | 1,058,620 | ||||||
Carlyle Group LP | 96,800 | 1,524,600 | ||||||
First Republic Bank | 25,800 | 2,242,020 | ||||||
Intercontinental Exchange, Inc. | 28,500 | 2,146,905 | ||||||
Legg Mason, Inc. | 53,000 | 1,352,030 | ||||||
Lincoln National Corp. | 12,200 | 625,982 | ||||||
SVB Financial Group* | 8,800 | 1,671,296 | ||||||
Name of Issuer | Quantity | Fair Value ($) | ||||||
T Rowe Price Group, Inc. | 7,800 | 720,096 | ||||||
United Rentals, Inc.* | 8,100 | 830,493 | ||||||
|
| |||||||
| 14,379,058 | ||||||||
|
| |||||||
Health Services - 3.0% | ||||||||
Centene Corp.* | 23,000 | 2,651,900 | ||||||
Encompass Health Corp. | 24,100 | 1,486,970 | ||||||
|
| |||||||
| 4,138,870 | ||||||||
|
| |||||||
Health Technology - 9.9% | ||||||||
ABIOMED, Inc.* | 3,225 | 1,048,254 | ||||||
Align Technology, Inc.* | 8,900 | 1,863,927 | ||||||
DexCom, Inc.* | 9,900 | 1,186,020 | ||||||
Edwards Lifesciences Corp.* | 7,900 | 1,210,043 | ||||||
Exact Sciences Corp.* | 13,000 | 820,300 | ||||||
Insulet Corp.* | 21,850 | 1,733,142 | ||||||
Jazz Pharmaceuticals, PLC* | 5,700 | 706,572 | ||||||
Neurocrine Biosciences, Inc.* | 13,750 | 981,887 | ||||||
Thermo Fisher Scientific, Inc. | 15,250 | 3,412,797 | ||||||
West Pharmaceutical Services, Inc. | 8,300 | 813,649 | ||||||
|
| |||||||
| 13,776,591 | ||||||||
|
| |||||||
Industrial Services - 3.9% | ||||||||
Jacobs Engineering Group, Inc. | 19,100 | 1,116,586 | ||||||
Waste Connections, Inc. | 57,150 | 4,243,388 | ||||||
|
| |||||||
| 5,359,974 | ||||||||
|
| |||||||
Process Industries - 4.0% | ||||||||
Ecolab, Inc. | 19,100 | 2,814,385 | ||||||
International Paper Co. | 25,100 | 1,013,036 | ||||||
ScottsMiracle-Gro Co. | 27,600 | 1,696,296 | ||||||
|
| |||||||
| 5,523,717 | ||||||||
|
| |||||||
Producer Manufacturing - 9.0% | ||||||||
AMETEK, Inc. | 24,000 | 1,624,800 | ||||||
Anixter International, Inc.* | 21,186 | 1,150,612 | ||||||
Carlisle Cos., Inc. | 17,700 | 1,779,204 | ||||||
Hubbell, Inc. | 16,000 | 1,589,440 | ||||||
Ingersoll-Rand, PLC | 31,700 | 2,891,991 | ||||||
Parker-Hannifin Corp. | 14,600 | 2,177,444 | ||||||
Rockwell Automation, Inc. | 8,000 | 1,203,840 | ||||||
|
| |||||||
| 12,417,331 | ||||||||
|
| |||||||
Retail Trade - 5.7% | ||||||||
Camping World Holdings, Inc. | 53,300 | 611,351 | ||||||
TJX Cos., Inc. | 85,800 | 3,838,692 | ||||||
Ulta Beauty, Inc.* | 14,100 | 3,452,244 | ||||||
|
| |||||||
| 7,902,287 | ||||||||
|
| |||||||
Technology Services - 22.5% | ||||||||
ANSYS, Inc.* | 13,000 | 1,858,220 | ||||||
Aspen Technology, Inc.* | 19,900 | 1,635,382 | ||||||
Atlassian Corp., PLC* | 26,800 | 2,384,664 | ||||||
Autodesk, Inc.* | 17,900 | 2,302,119 | ||||||
See accompanying notes to financial statements. | ||||
30 |
|
SIT MUTUAL FUNDS SEMI-ANNUAL REPORT |
|
Name of Issuer | Quantity | Fair Value ($) | ||||||
Booking Holdings, Inc.* | 1,900 | 3,272,598 | ||||||
Euronet Worldwide, Inc.* | 31,275 | 3,201,934 | ||||||
GoDaddy, Inc.* | 21,600 | 1,417,392 | ||||||
Guidewire Software, Inc.* | 19,300 | 1,548,439 | ||||||
HubSpot, Inc.* | 7,100 | 892,683 | ||||||
PTC, Inc.* | 39,600 | 3,282,840 | ||||||
Qualys, Inc.* | 15,150 | 1,132,311 | ||||||
Red Hat, Inc.* | 11,200 | 1,967,168 | ||||||
Splunk, Inc.* | 25,200 | 2,642,220 | ||||||
Talend SA, ADR* | 22,200 | 823,176 | ||||||
Ultimate Software Group, Inc.* | 11,200 | 2,742,544 | ||||||
|
| |||||||
| 31,103,690 | ||||||||
|
| |||||||
Transportation - 2.4% | ||||||||
Alaska Air Group, Inc. | 26,400 | 1,606,440 | ||||||
Golar LNG, Ltd. | 49,900 | 1,085,824 | ||||||
Knight-Swift Transportation Holdings, Inc. | 27,300 | 684,411 | ||||||
|
| |||||||
| 3,376,675 | ||||||||
|
| |||||||
Name of Issuer | Quantity | Fair Value ($) | ||||||
Utilities - 1.4% | ||||||||
WEC Energy Group, Inc. | 27,800 | 1,925,428 | ||||||
|
| |||||||
Total Common Stocks | 135,979,843 | |||||||
|
| |||||||
Short-Term Securities - 2.0% | ||||||||
Fidelity Inst. Money Mkt. Gvt. Fund, 2.25% | 2,794,860 | 2,794,860 | ||||||
|
| |||||||
(cost: $2,794,860) | ||||||||
Total Investments in Securities - 100.2% (cost: $93,695,429) | 138,774,703 | |||||||
Other Assets and Liabilities, net - (0.2%) | (319,357 | ) | ||||||
|
| |||||||
Total Net Assets - 100.0% | $138,455,346 | |||||||
|
| |||||||
|
| |||||||
| * | Non-income producing security. |
Numeric footnotes not disclosed are not applicable to this Schedule of Investments.
ADR — American Depository Receipt
PLC — Public Limited Company
A summary of the levels for the Fund’s investments as of December 31, 2018 is as follows (see Note 2- significant accounting policies in the notes to financial statements):
| Investment in Securities | ||||||||||||
Level 1 Quoted Price ($) | Level 2 Other significant observable inputs ($) | Level 3 Significant unobservable inputs ($) | Total ($) | |||||||||
Common Stocks** | 135,979,843 | — | — | 135,979,843 | ||||||||
Short-Term Securities | 2,794,860 | — | — | 2,794,860 | ||||||||
Total: | 138,774,703 | — | — | 138,774,703 | ||||||||
| ** | For equity securities categorized in a single level,refer to the Schedule of Investments for further breakdown. |
There were no transfers into or out of level 3 during the reporting period.
See accompanying notes to financial statements. | ||||
DECEMBER 31, 2018 |
|
31 |
|
|
Sit Small Cap Dividend Growth Fund Class I and Class S
|
OBJECTIVE & STRATEGY
The objective of the Sit Small Cap Dividend Growth Fund is to provide current income that exceeds the Fund’s benchmark index and that grows over a period of years. Secondarily the Fund seeks long-term capital appreciation. The Fund seeks to achieve its objectives by investing, under normal market conditions, at least 80% of its net assets in small cap dividend-paying common stocks that have market capitalizations at the time of purchase of up to $3.0 billion, or up to the market capitalization of the largest company included in the Russell 2000® Index measured at the end of the previous twelve months ($17.0 billion as of December 31, 2018). The Fund may invest the balance of its assets in preferred stocks, convertible bonds, U.S. Treasury securities (including Treasury bills, notes and bonds), closedend investment companies, and master limited partnerships.
The Sit Small Cap Dividend Growth Fund Class I posted a-16.13% return over the past six months, compared to the-17.35% return for the Russell 2000® Index. The Fund’s gross yield (before deducting Fund expenses) was 2.68%, compared to 1.61% for the Russell 2000® Index.
The small cap stock rally abruptly came to a halt in the final months of the year, as investors focused on risks associated with higher interest rates, trade conflicts and a more sluggish corporate earnings backdrop, after outsized gains in 2018. As is typically the case in market sell-offs due to greater perceived risks, small cap stocks underperformed larger cap issues in the recent correction. The breadth of thesell-off, which was concentrated in the final three months of the year, was especially notable. Within the benchmark, with the exception of utilities, all economic sectors posted double-digit declines over the second half of the year. We believe thesell-off has resulted in highly attractive valuations for high quality dividend-paying stocks. Finance remains the heaviest weighted sector within the Fund, and we have increased many positions over the last several months. We believe the valuations for banks, brokers and insurance stocks reflect recession fears that are unwarranted. Many REITs are also attractive, offering compelling dividend yields (4%+), well above index averages. In addition, process industries and producer manufacturing also have significant weightings within the Fund. Similar to finance, valuations in these groups are discounting a much weaker macro environment than we are anticipating.
We recognize that compelling valuations alone are unlikely to push small cap stocks meaningfully higher in the year ahead. However, based on our expectation that recession fears will abate, a continuance of earnings growth in 2019 should provide a much-needed catalyst. In addition, the Fund’s relatively high dividend yields give support to returns and may serve to mitigate market volatility. We note that over 75% of the companies held in the Fund increased their dividend in 2018. This compares to just 29% for the stocks in the Russell 2000® Index.
The Fund outperformed the Russell 2000® Index over the past six months. Stock selection in the health technology, producer manu-
HYPOTHETICAL GROWTH OF $10,000
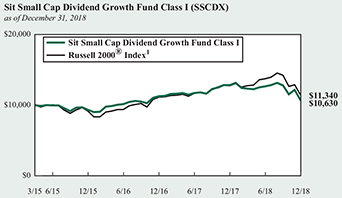
The chart above illustrates the total value of a hypothetical $10,000 investment in the Fund over the past 10 years as compared to the performance of the Russell 2000® Index. Past performance does not guarantee future results. Returns include the reinvestment of distributions. The chart does not reflect the deduction of taxes that a shareholder would pay on Fund distributions or the redemption of Fund shares.
1 Russell 2000® Index is an unmanaged index that measures the performance of the 2,000 smallest companies in the Russell 3000® Index, an index consisting of the 3,000 largest U.S. companies based on market capitalization. It is not possible to invest directly in an index. This is the Fund’s primary index.
facturing, consumer services and communications sectors were key factors. The best performing individual stocks included Shenandoah Communications, Service Corporation International, Casey General Stores, and Nexstar Media Group. The Fund’s returns were adversely impacted by stock selection in technology services, finance, process industries and consumer durables. The most significant individual stock laggards over the period included Camping World Holdings, EastWest Bancorp, Thor Industries, MKS Instruments and PacWest Bancorp.
We strongly believe in the merits of the Sit Small Cap Dividend Growth Fund strategy. Our research staff is highly focused on identifying attractive long-term investments that we expect will deliver both income and growth over the long run.
Roger J. Sit Michael T. Manns
Kent L. Johnson Robert W. Sit
Portfolio Managers
32 | SIT MUTUAL FUNDS SEMI-ANNUAL REPORT | |
|
|
COMPARATIVE RATES OF RETURNS
as of December 31, 2018
| Sit Small Cap Dividend Growth Fund | ||||||||||||
Russell 2000® | ||||||||||||
| Class I | Class S | |||||||||||
Six Month | -16.13 | % | -16.22 | % | -17.35 | % | ||||||
One Year | -17.07 | -17.29 | -11.01 | |||||||||
Since Inception (3/31/15) | 1.64 | 1.39 | 3.41 | |||||||||
Performance figures are historical and do not guarantee future results. Investment returns and principal value will vary, and you may have a gain or loss when you sell shares. Current performance may be lower or higher than the performance data quoted. Contact the Fund for performance data current to the most recentmonth-end. Returns include changes in share price as well as reinvestment of all dividends and capital gains. Returns do not reflect the deduction of the 2% redemption fee imposed if shares are redeemed or exchanged within 30 calendar days from their date of purchase. If imposed, the fee would reduce the performance quoted. Returns do not reflect the deduction of taxes that a shareholder would pay on Fund distributions or the redemption of Fund shares. Management fees and administrative expenses are included in the Fund’s performance. Returns for periods greater than one year are compounded average annual rates of return.
1 Russell 2000® Index is an unmanaged index that measures the performance of the 2,000 smallest companies in the Russell 3000® Index, an index consisting of the 3,000 largest U.S. companies based on market capitalization. It is not possible to directly invest in an index.
PORTFOLIO SUMMARY
Class I: | ||||
Net Asset Value 12/31/18: | $10.06 Per Share | |||
Net Asset Value 6/30/18: | $12.27 Per Share | |||
Total Net Assets: | $11.4 Million | |||
Class S: | ||||
Net Asset Value 12/31/18: | $10.06 Per Share | |||
Net Asset Value 6/30/18: | $12.26 Per Share | |||
Total Net Assets: | $3.3 Million | |||
Weighted Average Market Cap: | $3.7 Billion | |||
TOP 10 HOLDINGS
1. Mesa Laboratories, Inc.
2. Strategic Education, Inc.
3. Monolithic Power Systems, Inc.
4. MKS Instruments, Inc.
5. Booz Allen Hamilton Holding Corp.
6. Encompass Health Corp.
7. Axis Capital Holdings, Ltd.
8. Wintrust Financial Corp.
9. Nexstar Media Group, Inc.
10. Cabot Microelectronics Corp.
Based on total net assets as of December 31, 2018. Subject to change.
FUND DIVERSIFICATION
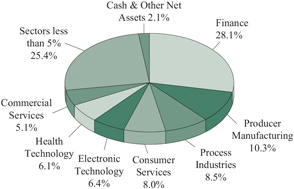
Based on total net assets as of December 31, 2018. Subject to change.
| DECEMBER 31, 2018 | 33 | |
SCHEDULE OF INVESTMENTS (Unaudited)
December 31, 2018
Sit Small Cap Dividend Growth Fund
Name of Issuer | Quantity | Fair Value ($) | ||||||
Common Stocks - 97.1% |
| |||||||
Commercial Services - 5.1% |
| |||||||
Booz Allen Hamilton Holding Corp. | 6,575 | 296,335 | ||||||
Brink’s Co. | 2,750 | 177,788 | ||||||
Deluxe Corp. | 2,700 | 103,788 | ||||||
Herman Miller, Inc. | 5,700 | 172,425 | ||||||
|
| |||||||
| 750,336 | ||||||||
|
| |||||||
Communications - 1.2% |
| |||||||
Shenandoah Telecommunications Co. | 4,100 | 181,425 | ||||||
|
| |||||||
Consumer Durables - 3.2% |
| |||||||
Acushnet Holdings Corp. | 5,200 | 109,564 | ||||||
Ethan Allen Interiors, Inc. | 6,600 | 116,094 | ||||||
National Presto Industries, Inc. | 750 | 87,690 | ||||||
Snap-On, Inc. | 300 | 43,587 | ||||||
Thor Industries, Inc. | 2,300 | 119,600 | ||||||
|
| |||||||
| 476,535 | ||||||||
|
| |||||||
ConsumerNon-Durables - 1.1% |
| |||||||
Sensient Technologies Corp. | 2,800 | 156,380 | ||||||
|
| |||||||
Consumer Services - 8.0% |
| |||||||
Dunkin’ Brands Group, Inc. | 2,625 | 168,315 | ||||||
Nexstar Media Group, Inc. | 3,350 | 263,444 | ||||||
Service Corp. International | 6,250 | 251,625 | ||||||
Strategic Education, Inc. | 2,690 | 305,100 | ||||||
Vail Resorts, Inc. | 900 | 189,738 | ||||||
|
| |||||||
| 1,178,222 | ||||||||
|
| |||||||
Electronic Technology - 6.4% |
| |||||||
Cabot Microelectronics Corp. | 2,700 | 257,445 | ||||||
MKS Instruments, Inc. | 4,600 | 297,206 | ||||||
Monolithic Power Systems, Inc. | 2,575 | 299,344 | ||||||
Power Integrations, Inc. | 1,400 | 85,372 | ||||||
|
| |||||||
| 939,367 | ||||||||
|
| |||||||
Energy Minerals - 1.6% |
| |||||||
Delek US Holdings, Inc. | 3,600 | 117,036 | ||||||
Vermilion Energy, Inc. | 5,625 | 118,519 | ||||||
|
| |||||||
| 235,555 | ||||||||
|
| |||||||
Finance - 28.1% |
| |||||||
American Equity Investment Life Holding Co. | 5,250 | 146,685 | ||||||
American National Insurance Co. | 1,200 | 152,688 | ||||||
Axis Capital Holdings, Ltd. | 5,250 | 271,110 | ||||||
Carlyle Group LP | 10,525 | 165,769 | ||||||
CubeSmart | 3,575 | 102,567 | ||||||
East West Bancorp, Inc. | 5,600 | 243,768 | ||||||
Evercore Partners, Inc. | 2,400 | 171,744 | ||||||
Great Western Bancorp, Inc. | 3,800 | 118,750 | ||||||
Hanover Insurance Group, Inc. | 1,075 | 125,528 | ||||||
HCI Group, Inc. | 2,600 | 132,106 | ||||||
Hercules Capital, Inc. | 9,600 | 106,080 | ||||||
Name of Issuer | Quantity | Fair Value ($) | ||||||
Kingstone Cos, Inc. | 7,600 | 134,444 | ||||||
Legg Mason, Inc. | 7,600 | 193,876 | ||||||
Macquarie Infrastructure Corp. | 4,150 | 151,724 | ||||||
Old National Bancorp | 9,550 | 147,070 | ||||||
PacWest Bancorp | 7,425 | 247,104 | ||||||
People’s United Financial, Inc. | 16,325 | 235,570 | ||||||
Physicians Realty Trust | 13,300 | 213,199 | ||||||
Piper Jaffray Cos | 2,875 | 189,290 | ||||||
Provident Financial Services, Inc. | 4,625 | 111,601 | ||||||
QTS Realty Trust, Inc. | 4,350 | 161,168 | ||||||
Stifel Financial Corp. | 4,000 | 165,680 | ||||||
STORE Capital Corp. | 6,600 | 186,846 | ||||||
Wintrust Financial Corp. | 4,000 | 265,960 | ||||||
|
| |||||||
| 4,140,327 | ||||||||
|
| |||||||
Health Services - 3.0% |
| |||||||
Encompass Health Corp. | 4,750 | 293,075 | ||||||
Healthcare Services Group, Inc. | 3,625 | 145,653 | ||||||
|
| |||||||
| 438,728 | ||||||||
|
| |||||||
Health Technology - 6.1% | ||||||||
Mesa Laboratories, Inc. | 1,600 | 333,424 | ||||||
PerkinElmer, Inc. | 1,675 | 131,571 | ||||||
STERIS, PLC | 1,900 | 203,015 | ||||||
Teleflex, Inc. | 525 | 135,702 | ||||||
West Pharmaceutical Services, Inc. | 950 | 93,128 | ||||||
|
| |||||||
| 896,840 | ||||||||
|
| |||||||
Industrial Services - 2.1% |
| |||||||
EMCOR Group, Inc. | 2,400 | 143,256 | ||||||
KBR, Inc. | 10,775 | 163,564 | ||||||
|
| |||||||
| 306,820 | ||||||||
|
| |||||||
Non-Energy Minerals - 0.9% |
| |||||||
Commercial Metals Co. | 3,950 | 63,279 | ||||||
PotlatchDeltic Corp. | 2,135 | 67,551 | ||||||
|
| |||||||
| 130,830 | ||||||||
|
| |||||||
Process Industries - 8.5% | ||||||||
Apogee Enterprises, Inc. | 4,325 | 129,101 | ||||||
Avery Dennison Corp. | 1,900 | 170,677 | ||||||
Domtar Corp. | 3,575 | 125,590 | ||||||
Huntsman Corp. | 4,650 | 89,698 | ||||||
Ingredion, Inc. | 1,375 | 125,675 | ||||||
Neenah, Inc. | 1,550 | 91,326 | ||||||
Orion Engineered Carbons SA | 9,475 | 239,528 | ||||||
Rayonier Advanced Materials, Inc. | 8,700 | 92,655 | ||||||
ScottsMiracle-Gro Co. | 3,025 | 185,916 | ||||||
|
| |||||||
| 1,250,166 | ||||||||
|
| |||||||
See accompanying notes to financial statements. | ||||
34 |
|
SIT MUTUAL FUNDS SEMI-ANNUAL REPORT |
|
Name of Issuer | Quantity | Fair Value ($) | ||||||
Producer Manufacturing - 10.3% |
| |||||||
Applied Industrial Technologies, Inc. | 3,850 | 207,669 | ||||||
Carlisle Cos, Inc. | 1,700 | 170,884 | ||||||
Crane Co. | 2,400 | 173,232 | ||||||
Hubbell, Inc. | 2,100 | 208,614 | ||||||
Lincoln Electric Holdings, Inc. | 2,050 | 161,642 | ||||||
MSA Safety, Inc. | 2,700 | 254,529 | ||||||
Oshkosh Corp. | 3,600 | 220,716 | ||||||
Watsco, Inc. | 900 | 125,226 | ||||||
|
| |||||||
| 1,522,512 | ||||||||
|
| |||||||
Retail Trade - 1.4% |
| |||||||
Camping World Holdings, Inc. | 9,600 | 110,112 | ||||||
Casey’s General Stores, Inc. | 750 | 96,105 | ||||||
|
| |||||||
| 206,217 | ||||||||
|
| |||||||
Technology Services - 2.5% |
| |||||||
Blackbaud, Inc. | 1,200 | 75,480 | ||||||
ManTech International Corp. | 2,700 | 141,196 | ||||||
Science Applications International Corp. | 2,350 | 149,695 | ||||||
|
| |||||||
| 366,371 | ||||||||
|
| |||||||
Name of Issuer | Quantity | Fair Value ($) | ||||||
Transportation - 3.7% |
| |||||||
Alaska Air Group, Inc. | 3,100 | 188,635 | ||||||
Golar LNG, Ltd. | 6,375 | 138,720 | ||||||
Knight-Swift Transportation Holdings, Inc. | 4,975 | 124,723 | ||||||
Schneider National, Inc. | 5,000 | 93,350 | ||||||
|
| |||||||
| 545,428 | ||||||||
|
| |||||||
Utilities - 3.9% |
| |||||||
Black Hills Corp. | 2,000 | 125,560 | ||||||
Covanta Holding Corp. | 13,400 | 179,828 | ||||||
New Jersey Resources Corp. | 3,775 | 172,404 | ||||||
Spire, Inc. | 1,375 | 101,860 | ||||||
|
| |||||||
| 579,652 | ||||||||
|
| |||||||
Total Common Stocks |
| 14,301,711 | ||||||
|
| |||||||
Investment Companies - 0.8% |
| |||||||
Tortoise Energy Infrastructure Corp. | 6,225 | 123,878 | ||||||
|
| |||||||
(cost: $186,425) |
| |||||||
Short-Term Securities - 2.0% |
| |||||||
Fidelity Inst. Money Mkt. Gvt. Fund, 2.25% | 293,039 | 293,039 | ||||||
|
| |||||||
(cost: $293,039) |
| |||||||
Total Investments in Securities - 99.9% |
| 14,718,628 | ||||||
Other Assets and Liabilities, net - 0.1% |
| 10,449 | ||||||
|
| |||||||
Total Net Assets - 100.0% |
| $ | 14,729,077 | |||||
|
| |||||||
Numeric footnotes not disclosed are not applicable to this Schedule of Investments.
PLC — Public Limited Company
A summary of the levels for the Fund’s investments as of December 31, 2018 is as follows (see Note 2- significant accounting policies in the notes to financial statements):
| Investment in Securities | ||||||||||||
| Level 1 Quoted Price ($) | Level 2 Other significant observable inputs ($) | Level 3 Significant unobservable inputs ($) | Total ($) | |||||||||
Common Stocks** | 14,301,711 | — | — | 14,301,711 | ||||||||
Investment Companies | 123,878 | — | — | 123,878 | ||||||||
Short-Term Securities | 293,039 | — | — | 293,039 | ||||||||
Total: | 14,718,628 | — | — | 14,718,628 | ||||||||
| ** | For equity securities categorized in a single level, refer to the Schedule of Investments for further breakdown. |
There were no transfers into or out of level 3 during the reporting period.
See accompanying notes to financial statements. | ||||
DECEMBER 31, 2018 |
|
35 |
|
|
|
OBJECTIVE & STRATEGY
The objective of the Sit Small Cap Growth Fund is to maximize long-term capital appreciation. The Fund seeks to achieve its objective by investing, under normal market conditions, at least 80% of its net assets in common stocks of companies with market capitalizations at the time of purchase of up to $3.0 billion, or up to the market capitalization of the largest company included in the Russell 2000® Index measured at the end of the previous twelve months ($17.0 billion as of December 31, 2018).
The Adviser invests in a diversified group of growing small companies it believes exhibit the potential for superior growth. The Adviser believes that a company’s earnings growth is the primary determinant of its potential long-term return and evaluates a company’s potential for above average long-term earnings and revenue growth.
The Sit Small Cap Growth Fund returned-14.70% over the past six months. This compares to thesix-month return of-17.33% for the Russell 2000® Growth Index and the-17.35% return for the Russell 2000® Index.
Small capitalization stocks fell sharply, as “risk off” markets prevailed during the second half of 2018. We believe the tightening of financial conditions (via higher short rates and quantitative tightening) and the escalation of trade concerns were the primary reasons for the market retreat – with additional pressure exerted from Brexit concerns, a U.S. government shutdown and a decline in oil prices. While recession fears have gripped markets, we believe that economic data points to merely a slowdown, not an imminent contraction. We believe stocks will rebound as this view is realized as 2019 progresses. Small cap stocks have the potential to rebound significantly for two reasons: first, small growth stocks have underperformed large cap stocks, leading to compelling valuations; and second, with overall corporate earnings growth slowing, investors may gravitate to more idiosyncratic growth companies, which are prevalent within the small cap universe.
From our perspective, while the market declines and related volatility in recent months have been unsettling (to say the least), it has given us the opportunity to add to many attractive existing holdings within the Fund and make new purchases of high quality companies. The mostly heavily weighted groups in the Fund include technology services, health technology and consumer services. With growth trends particularly weak outside the U.S., many companies within these three sectors are relatively insulated, given the domestic orientation of their revenues. Energy minerals, communications and utilities continue to have minimal weightings in the Fund, largely due to sluggish growth prospects for most companies within these sectors.
Although absolute returns were negative, the Fund outperformed the Russell 2000® Growth Index during the second half of 2018, largely due to strong stock selection in several sectors. Relative performance was positively impacted by stock selection in health technology, technology services, producer manufacturing, consumer services and industrial services. Paycom Software, Euronet Worldwide,
HYPOTHETICAL GROWTH OF $10,000
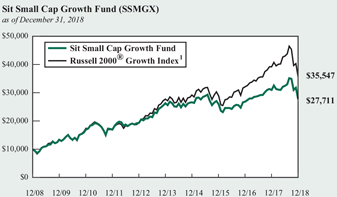
The chart above illustrates the total value of a hypothetical $10,000 investment in the Fund over the past 10 years as compared to the performance of the Russell 2000® Growth Index. Past performance does not guarantee future results. Returns include the reinvestment of distributions. The chart does not reflect the deduction of taxes that a shareholder would pay on Fund distributions or the redemption of Fund shares.
1 Russell 2000® Growth Index is an unmanaged index that measures the performance of those Russell 2000 Index companies with higherprice-to-book ratios and higher forecasted growth values. It is not possible to invest directly in an index. This is the Fund’s primary index.
K2M Group Holdings, BoozAllen Hamilton Holding and Waste Connections were among the individual stocks that outperformed during the second half of 2018. On the negative side, the Fund’s performance was adversely affected by stock selection in the finance, process industries and consumer durables sectors. Individual stock laggards during the period included T2 Biosystems, Align Technology, Camping World Holdings, SVB Financial Group and Thor Industries.
Our research team remains highly focused on identifying the most attractive risk/reward opportunities following the marketsell-off. We strongly believe in the long-term outlook for companies held in the Fund.
Roger J. Sit | Michael J. Stellmacher | |
Kent L. Johnson | Robert W. Sit | |
Portfolio Managers |
36 | SIT MUTUAL FUNDS SEMI-ANNUAL REPORT | |
|
|
| COMPARATIVE RATES OF RETURNS | ||||||
| as of December 31, 2018 | ||||||
Sit Small Cap Growth Fund | Russell 2000® Growth Index1 | Russell 2000® Index2 | ||||
Six Month | -14.70% | -17.33% | -17.35% | |||
One Year | -10.71 | -9.31 | -11.01 | |||
Five Year | 1.11 | 5.13 | 4.41 | |||
Ten Year | 10.73 | 13.52 | 11.97 | |||
Since Inception | 9.28 | 7.55 | 8.73 | |||
(7/1/94) | ||||||
Performance figures are historical and do not guarantee future results. Investment returns and principal value will vary, and you may have a gain or loss when you sell shares. Current performance may be lower or higher than the performance data quoted. Contact the Fund for performance data current to the most recentmonth-end. Returns include changes in share price as well as reinvestment of all dividends and capital gains. Returns do not reflect the deduction of the 2% redemption fee imposed if shares are redeemed or exchanged within 30 calendar days from their date of purchase. If imposed, the fee would reduce the performance quoted. Returns do not reflect the deduction of taxes that a shareholder would pay on Fund distributions or the redemption of Fund shares. Management fees and administrative expenses are included in the Fund’s performance. Returns for periods greater than one year are compounded average annual rates of return.
1 Russell 2000® Growth Index is an unmanaged index that measures the performance of those Russell 2000 Index companies with higherprice-to-book ratios and higher forecasted growth values. It is not possible to invest directly in an index.
2 Russell 2000® Index is an unmanaged index that measures the performance of the 2,000 smallest companies in the Russell 3000® Index, an index consisting of the 3,000 largest U.S. companies based on market capitalization.
| PORTFOLIO SUMMARY | ||
Net Asset Value 12/31/18: | $44.44 Per Share | |
Net Asset Value 6/30/18: | $57.18 Per Share | |
Total Net Assets: | $83.0 Million | |
Weighted Average Market Cap: | $6.3 Billion | |
TOP 10 HOLDINGS
1. Paycom Software, Inc.
2. Waste Connections, Inc.
3. Euronet Worldwide, Inc.
4. Arista Networks, Inc.
5. Booz Allen Hamilton Holding Corp.
6.Take-Two Interactive Software, Inc.
7. Ultimate Software Group, Inc.
8. PTC, Inc.
9. Sarepta Therapeutics, Inc.
10. SVB Financial Group
Based on total net assets as of December 31, 2018. Subject to change.
FUND DIVERSIFICATION
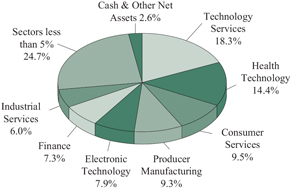
Based on total net assets as of December 31, 2018. Subject to change.
| DECEMBER 31, 2018 | 37 |
SCHEDULE OF INVESTMENTS (Unaudited)
December 31, 2018
Sit Small Cap Growth Fund
| Name of Issuer | Quantity | Fair Value ($) | ||||||
Common Stocks - 97.4% | ||||||||
Commercial Services - 4.8% |
| |||||||
ASGN, Inc.* | 21,250 | 1,158,125 | ||||||
Booz Allen Hamilton Holding Corp. | 40,100 | 1,807,307 | ||||||
Brink’s Co. | 13,300 | 859,845 | ||||||
Deluxe Corp. | 5,000 | 192,200 | ||||||
|
| |||||||
| 4,017,477 | ||||||||
|
| |||||||
Communications - 0.9% |
| |||||||
Shenandoah Telecommunications Co. | 16,100 | 712,425 | ||||||
|
| |||||||
Consumer Durables - 4.4% |
| |||||||
Acushnet Holdings Corp. | 28,200 | 594,174 | ||||||
Ethan Allen Interiors, Inc. | 22,600 | 397,534 | ||||||
Snap-On, Inc. | 2,000 | 290,580 | ||||||
Take-Two Interactive Software, Inc.* | 17,100 | 1,760,274 | ||||||
Thor Industries, Inc. | 11,200 | 582,400 | ||||||
|
| |||||||
| 3,624,962 | ||||||||
|
| |||||||
ConsumerNon-Durables - 0.8% |
| |||||||
Primo Water Corp.* | 49,000 | 686,490 | ||||||
|
| |||||||
Consumer Services - 9.5% |
| |||||||
Adtalem Global Education, Inc.* | 12,725 | 602,147 | ||||||
Cinemark Holdings, Inc. | 25,200 | 902,160 | ||||||
Dunkin’ Brands Group, Inc. | 14,700 | 942,564 | ||||||
Grand Canyon Education, Inc.* | 7,500 | 721,050 | ||||||
Nexstar Media Group, Inc. | 13,775 | 1,083,266 | ||||||
Service Corp. International | 28,600 | 1,151,436 | ||||||
Strategic Education, Inc. | 6,803 | 771,596 | ||||||
Vail Resorts, Inc. | 5,000 | 1,054,100 | ||||||
Weight Watchers International, Inc.* | 16,100 | 620,655 | ||||||
|
| |||||||
| 7,848,974 | ||||||||
|
| |||||||
Electronic Technology - 7.9% |
| |||||||
Arista Networks, Inc.* | 8,700 | 1,833,090 | ||||||
Cabot Microelectronics Corp. | 7,475 | 712,741 | ||||||
Ciena Corp.* | 19,650 | 666,332 | ||||||
MKS Instruments, Inc. | 15,750 | 1,017,608 | ||||||
Monolithic Power Systems, Inc. | 10,200 | 1,185,750 | ||||||
Skyworks Solutions, Inc. | 17,300 | 1,159,446 | ||||||
|
| |||||||
| 6,574,967 | ||||||||
|
| |||||||
Energy Minerals - 1.2% |
| |||||||
Delek US Holdings, Inc. | 9,800 | 318,598 | ||||||
Marathon Petroleum Corp. | 11,926 | 703,753 | ||||||
|
| |||||||
| 1,022,351 | ||||||||
|
| |||||||
Finance - 7.3% |
| |||||||
Affiliated Managers Group, Inc. | 4,300 | 418,992 | ||||||
Axis Capital Holdings, Ltd. | 12,500 | 645,500 | ||||||
East West Bancorp, Inc. | 10,100 | 439,653 | ||||||
First Republic Bank | 6,400 | 556,160 | ||||||
Legg Mason, Inc. | 31,800 | 811,218 | ||||||
| Name of Issuer | Quantity | Fair Value ($) | ||||||
PacWest Bancorp | 23,600 | 785,408 | ||||||
Physicians Realty Trust | 30,500 | 488,915 | ||||||
SVB Financial Group* | 6,400 | 1,215,488 | ||||||
Western Alliance Bancorp* | 8,700 | 343,563 | ||||||
Wintrust Financial Corp. | 5,700 | 378,993 | ||||||
|
| |||||||
| 6,083,890 | ||||||||
|
| |||||||
Health Services - 2.1% |
| |||||||
Encompass Health Corp. | 14,600 | 900,820 | ||||||
Healthcare Services Group, Inc. | 21,690 | 871,504 | ||||||
|
| |||||||
| 1,772,324 | ||||||||
|
| |||||||
Health Technology - 14.4% |
| |||||||
Align Technology, Inc.* | 4,650 | 973,849 | ||||||
Bio-Techne Corp. | 5,400 | 781,488 | ||||||
Catalent, Inc.* | 12,350 | 385,073 | ||||||
Corcept Therapeutics, Inc.* | 68,100 | 909,816 | ||||||
Exact Sciences Corp.* | 18,900 | 1,192,590 | ||||||
Insulet Corp.* | 10,100 | 801,132 | ||||||
iRhythmTechnologies, Inc.* | 8,000 | 555,840 | ||||||
Kindred Biosciences, Inc.* | 49,775 | 545,036 | ||||||
PerkinElmer, Inc. | 8,400 | 659,820 | ||||||
RA Medical Systems, Inc.* | 23,700 | 188,415 | ||||||
Sarepta Therapeutics, Inc.* | 13,400 | 1,462,342 | ||||||
STERIS,PLC | 10,200 | 1,089,870 | ||||||
Supernus Pharmaceuticals, Inc.* | 17,100 | 568,062 | ||||||
T2 Biosystems, Inc.* | 123,000 | 370,230 | ||||||
West Pharmaceutical Services, Inc. | 5,000 | 490,150 | ||||||
Wright Medical Group NV* | 35,900 | 977,198 | ||||||
|
| |||||||
| 11,950,911 | ||||||||
|
| |||||||
Industrial Services - 6.0% |
| |||||||
Advanced Disposal Services, Inc.* | 48,100 | 1,151,514 | ||||||
EMCOR Group, Inc. | 18,700 | 1,116,203 | ||||||
KBR, Inc. | 43,500 | 660,330 | ||||||
Waste Connections, Inc. | 27,400 | 2,034,450 | ||||||
|
| |||||||
| 4,962,497 | ||||||||
|
| |||||||
Process Industries - 3.3% |
| |||||||
Apogee Enterprises, Inc. | 22,100 | 659,685 | ||||||
Domtar Corp. | 15,800 | 555,054 | ||||||
Rayonier Advanced Materials, Inc. | 48,300 | 514,395 | ||||||
ScottsMiracle-Gro Co. | 16,800 | 1,032,528 | ||||||
|
| |||||||
| 2,761,662 | ||||||||
|
| |||||||
Producer Manufacturing - 9.3% |
| |||||||
Anixter International, Inc.* | 13,400 | 727,754 | ||||||
Applied Industrial Technologies, Inc. | 12,115 | 653,483 | ||||||
Crane Co. | 13,600 | 981,648 | ||||||
Hubbell, Inc. | 10,000 | 993,400 | ||||||
IDEX Corp. | 8,100 | 1,022,706 | ||||||
Lincoln Electric Holdings, Inc. | 9,600 | 756,960 | ||||||
MSA Safety, Inc. | 12,700 | 1,197,229 | ||||||
See accompanying notes to financial statements. | ||||
38 |
|
SIT MUTUAL FUNDS SEMI-ANNUAL REPORT |
|
| Name of Issuer | Quantity | Fair Value ($) | ||||||
Oshkosh Corp. | 13,800 | 846,078 | ||||||
Watsco, Inc. | 4,000 | 556,560 | ||||||
|
| |||||||
| 7,735,818 | ||||||||
|
| |||||||
Retail Trade - 2.6% | ||||||||
Camping World Holdings, Inc. | 38,250 | 438,727 | ||||||
Casey’s General Stores, Inc. | 4,300 | 551,002 | ||||||
Ulta Beauty, Inc.* | 4,650 | 1,138,506 | ||||||
|
| |||||||
| 2,128,235 | ||||||||
|
| |||||||
Technology Services - 18.3% | ||||||||
ANSYS, Inc.* | 4,900 | 700,406 | ||||||
Aspen Technology, Inc.* | 14,500 | 1,191,610 | ||||||
Blackbaud, Inc. | 6,700 | 421,430 | ||||||
Euronet Worldwide, Inc.* | 18,300 | 1,873,554 | ||||||
Eventbrite, Inc.* | 15,600 | 433,836 | ||||||
Globant SA* | 17,750 | 999,680 | ||||||
GoDaddy, Inc.* | 12,550 | 823,531 | ||||||
Guidewire Software, Inc.* | 11,700 | 938,691 | ||||||
HubSpot, Inc.* | 8,750 | 1,100,138 | ||||||
Paycom Software, Inc.* | 18,300 | 2,240,835 | ||||||
PTC, Inc.* | 19,300 | 1,599,970 | ||||||
Qualys, Inc.* | 9,450 | 706,293 | ||||||
Talend SA, ADR* | 14,000 | 519,120 | ||||||
Ultimate Software Group, Inc.* | 6,675 | 1,634,507 | ||||||
|
| |||||||
| 15,183,601 | ||||||||
|
| |||||||
| Name of Issuer | Quantity | Fair Value ($) | ||||||
Transportation - 3.0% | ||||||||
Alaska Air Group, Inc. | 11,500 | 699,775 | ||||||
Atlas Air Worldwide Holdings, Inc.* | 14,800 | 624,412 | ||||||
Golar LNG, Ltd. | 30,100 | 654,976 | ||||||
Knight-Swift Transportation Holdings, Inc. | 20,700 | 518,949 | ||||||
|
| |||||||
| 2,498,112 | ||||||||
|
| |||||||
Utilities - 1.6% | ||||||||
Covanta Holding Corp. | 24,600 | 330,132 | ||||||
Fortis, Inc. | 12,107 | 403,890 | ||||||
Spire, Inc. | 7,525 | 557,452 | ||||||
|
| |||||||
| 1,291,474 | ||||||||
|
| |||||||
Total Common Stocks | 80,856,170 | |||||||
|
| |||||||
Short-Term Securities - 2.7% | ||||||||
Fidelity Inst. Money Mkt. Gvt. Fund, 2.25% | 2,258,222 | 2,258,222 | ||||||
|
| |||||||
(cost: $2,258,222) | ||||||||
Total Investments in Securities - 100.1% | 83,114,392 | |||||||
Other Assets and Liabilities, net - (0.1%) | (85,887 | ) | ||||||
|
| |||||||
Total Net Assets - 100.0% | $83,028,505 | |||||||
|
| |||||||
| * | Non-income producing security. |
Numeric footnotes not disclosed are not applicable to this Schedule of Investments.
ADR — American Depositary Receipt
PLC — Public Limited Company
A summary of the levels for the Fund’s investments as of December 31, 2018 is as follows (see Note 2- significant accounting policies in the notes to financial statements):
Investment in Securities | ||||||||||||
| Level 1 Quoted Price ($) | Level 2 Other significant | Level 3 Significant unobservable inputs ($) | Total ($) | |||||||||
Common Stocks** | 80,856,170 | — | — | 80,856,170 | ||||||||
Short-Term Securities | 2,258,222 | — | — | 2,258,222 | ||||||||
Total: | 83,114,392 | — | — | 83,114,392 | ||||||||
| ** | For equity securities categorized in a single level, refer to the Schedule of Investments for further breakdown. |
There were no transfers into or out of level 3 during the reporting period.
See accompanying notes to financial statements. | ||||
DECEMBER 31, 2018 |
|
39 |
|
|
|
OBJECTIVE STRATEGY
The objective of the Sit International Growth Fund is long-term growth. The Fund seeks to achieve its objective by investing at least 90% of its net assets in common stocks of growth companies domiciled outside the United States. In selecting investments for the Fund, the Adviser begins by selecting countries or regions in which to invest by considering several factors affecting the economy and equity market of foreign countries and regions. After the country and regional allocations are determined, the Adviser seeks industries and sectors that it believes have earnings growth prospects that are greater than the average. Within the selected industries and sectors, the Adviser invests in foreign growth-oriented companies it believes exhibit the potential for superior growth.
For thesix-month period ended December 31, 2018, the Sit International Growth Fund generated a return of-13.37% versus the MSCI EAFE Growth Index total return of-12.01%. While stock selection and currency were flat to the Fund’s return, industry allocation detracted from relative performance in last half of 2018. Notably, the over-weight position in the technology and underweight position in the pharmaceutical industries had the largest negative impact on the Fund. This was only partially offset by the cash holding. Regionally, North America was the only positive contributor with Europe being the largest detractor to relative performance.
Decoupled global growth, increased trade tensions, and a stronger euro have contributed to diminished prospects for the Euro Area’s trade-sensitive economy, with GDP growth projected to moderate to +1.9 percent in 2018 and +1.5 percent in 2019. Domestic demand has been buoyed by a tightening labor market, improving wage growth, and elevated consumer confidence. However, elevated policy uncertainty and weaker exports are dampening business optimism and capital spending. Despite benign inflation and slowing growth, the European Central Bank recently ended net asset purchases under its quantitative easing program. Brexit-related and European Parliament election uncertainties are near-term headwinds.
Within the Far East, Japan faces a more challenging economic backdrop in 2019, especially as slowing growth abroad and heightened trade tensions threaten exports. Moderating export data and purchasing managers’ surveys, suggest difficulties abroad are beginning to weigh on the economy. An amicable trade outcome between the U.S. and China, Japan’s two largest trade partners, would considerably improve the outlook. In China, escalating trade tensions, slowing global economic growth, higher interest rates, stronger U.S. dollar, and rising foreign currency debt remain overhangs. The Chinese government is expected to introduce more stimulus and policy support for the slowing economy amid uncertainties on the trade front.
The Fund is underweight Japanese securities as preference lies with European and Asian(ex-Japan) stocks. We see modest gains in European economies but believe the political and monetary headwinds will likely keep equities somewhat contained. We prefer mainland companies in Europe versus UK stocks as Brexit uncertainty could loom well into 2019. We remain cautious on Chinese stocks given ongoing economic and policy uncertainty and despite recent positive developments, U.S.-China trade negotiations remain a significant
HYPOTHETICAL GROWTH OF $10,000
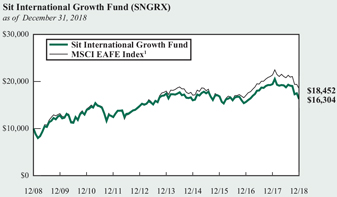
The chart above illustrates the total value of a hypothetical $10,000 investment in the Fund over the past 10 years as compared to the performance of the MSCI EAFE Index and MSCI EAFE Growth Index. The primary index used to compare the Fund’s performance was changed to the MSCI EAFE Index from the MSCI EAFE Growth Index because the Investment Adviser believes that the MSCI EAFE Index more accurately reflects the Fund’s investment objectives and strategies. Past performance does not guarantee future results. Returns include the reinvestment of distributions. The chart does not reflect the deduction of taxes that a shareholder would pay on Fund distributions or the redemption of Fund shares.
1 MSCI EAFE Index (Europe, Australasia, Far East) is an unmanaged free float-adjusted market capitalization index that measures the equity market performance of developed markets, excluding the US & Canada. This is the Fund’s primary index.
cant risk. We anticipate a continued challenging environment for Japanese equities as the growth backdrop becomes more uncertain overseas and the coming consumption tax hike presents notable risks to already sluggish domestic demand.
Given that we are in a period of evolving uncertainty, we believe it is best to maintain diversified portfolios and invest in high-quality growth stocks that have both secular and/or niche growth drivers. With the recent downturn in global equity markets, we are opportunistically increasing exposure to securities where we believe the correction has been overdone. We are hopeful that a trade agreement between the U.S. and China will be positive for all equity markets and believe Asian and U.S. equities will benefit most from an agreement.
Roger J. Sit | Tasha M. Murdoff | |
Portfolio Managers | ||
40 | SIT MUTUAL FUNDSSEMI-ANNUAL REPORT | |
|
|
COMPARATIVE RATES OF RETURNS
| as of December 31, 2018 | ||||||||
| Sit International Growth Fund | MSCI EAFE Index 1 | MSCI EAFE Growth Index 2 | ||||||
Six Month | -13.37% | -11.35% | -12.01% | |||||
One Year | -16.27 | -13.79 | -12.83 | |||||
Five Year | -1.31 | 0.53 | 1.62 | |||||
Ten Year | 5.01 | 6.32 | 7.07 | |||||
Since Inception | 3.36 | 4.85 | 3.97 | |||||
(11/1/91) | ||||||||
Performance figures are historical and do not guarantee future results. Investment returns and principal value will vary, and you may have a gain or loss when you sell shares. Current performance may be lower or higher than the performance data quoted. Contact the Fund for performance data current to the most recentmonth-end. Returns include changes in share price as well as reinvestment of all dividends and capital gains and all fee waivers. Without the fee waivers total return and yield figures would have been lower. Returns do not reflect the deduction of the 2% redemption fee imposed if shares are redeemed or exchanged within 30 calendar days from their date of purchase. If imposed, the fee would reduce the performance quoted. Returns do not reflect the deduction of taxes that a shareholder would pay on Fund distributions or the redemption of Fund shares. Management fees and administrative expenses are included in the Fund’s performance. Returns for periods greater than one year are compounded average annual rates of return.
1 MSCI EAFE Index (Europe, Australasia, Far East) is an unmanaged free float-adjusted market capitalization index that measures the equity market performance of developed markets, excluding the US & Canada.
2 MSCI EAFE Growth Index (Europe, Australasia, Far East) is an unmanaged free float-adjusted market capitalization index that measures the equity market performance of growth oriented stocks of developed markets excluding the US & Canada.
FUND DIVERSIFICATION - BY REGION
| Sit Int’l Growth Fund | MSCI EAFE Index | |||
Europe | 65.0% | 60.2% | ||
Asia | 24.5 | 39.3 | ||
North America | 8.5 | — | ||
Africa/Middle East | — | 0.5 | ||
Cash & Other Net Assets | 2.0 | — | ||
Based on total net assets as of December 31, 2018. Subject to change.
PORTFOLIO SUMMARY
Net Asset Value 12/31/18: | $14.33 Per Share | |
Net Asset Value 6/30/18: | $16.75 Per Share | |
Total Net Assets: | $19.8 Million | |
Weighted Average Market Cap: | $71.7 Billion | |
TOP 10 HOLDINGS
1. Nestle SA
2. Royal Dutch Shell, PLC, ADR
3. Safran SA
4. Allianz SE
5. Reckitt Benckiser Group, PLC
6. Diageo, PLC, ADR
7. Waste Connections, Inc.
8. Iberdrola SA
9. RELX, PLC
10. Suzuki Motor Corp.
Based on total net assets as of December 31, 2018. Subject to change.
FUND DIVERSIFICATION
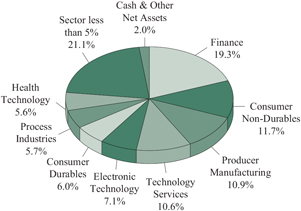
Based on total net assets as of December 31, 2018. Subject to change.
| DECEMBER 31, 2018 | 41 |
|
SCHEDULE OF INVESTMENTS (Unaudited)
December 31, 2018
Sit International Growth Fund
Name of Issuer | Quantity | Fair Value ($) | ||||||
Common Stocks - 96.5% |
| |||||||
Asia - 23.0% | ||||||||
Australia - 2.4% | ||||||||
Amcor, Ltd. | 12,100 | 112,925 | ||||||
Rio Tinto, PLC, ADR | 4,400 | 213,312 | ||||||
Westpac Banking Corp., ADR | 8,300 | 145,001 | ||||||
|
| |||||||
| 471,238 | ||||||||
|
| |||||||
China/Hong Kong - 8.3% | ||||||||
AIA Group, Ltd. | 32,200 | 267,288 | ||||||
Alibaba Group Holding, Ltd., ADR* | 2,350 | 322,115 | ||||||
Baidu, Inc., ADR* | 950 | 150,670 | ||||||
HSBC Holdings, PLC, ADR | 6,225 | 255,910 | ||||||
Ping An Insurance Group Co. of China, Ltd. | 33,500 | 295,834 | ||||||
Tencent Holdings, Ltd. | 9,000 | 360,896 | ||||||
|
| |||||||
| 1,652,713 | ||||||||
|
| |||||||
Japan - 8.8% | ||||||||
Keyence Corp. | 600 | 304,804 | ||||||
Makita Corp. | 5,200 | 185,265 | ||||||
Mitsubishi UFJ Financial Group, Inc., ADR | 43,000 | 209,410 | ||||||
Nintendo Co., Ltd. | 1,000 | 267,187 | ||||||
Secom Co., Ltd. | 1,300 | 108,099 | ||||||
Sony Corp., ADR | 6,300 | 304,164 | ||||||
Suzuki Motor Corp. | 7,300 | 370,778 | ||||||
|
| |||||||
| 1,749,707 | ||||||||
|
| |||||||
Singapore - 1.4% | ||||||||
DBS Group Holdings, Ltd. | 15,600 | 271,150 | ||||||
|
| |||||||
South Korea - 2.1% | ||||||||
LG Chem, Ltd. | 550 | 171,043 | ||||||
Samsung Electronics Co., Ltd., GDR | 285 | 247,095 | ||||||
|
| |||||||
| 418,138 | ||||||||
|
| |||||||
Europe - 65.0% | ||||||||
Belgium - 0.5% | ||||||||
Anheuser-Busch InBev NV, ADR | 1,370 | 90,160 | ||||||
|
| |||||||
Denmark - 1.1% | ||||||||
Coloplast A/S | 1,346 | 124,964 | ||||||
Danske Bank A/S | 5,100 | 100,881 | ||||||
|
| |||||||
| 225,845 | ||||||||
|
| |||||||
Finland - 0.8% | ||||||||
Nokia OYJ, ADR | 28,600 | 166,452 | ||||||
|
| |||||||
France - 8.4% | ||||||||
AXA SA | 11,750 | 253,877 | ||||||
BNP Paribas SA | 5,720 | 258,707 | ||||||
Dassault Systemes SA | 2,925 | 347,532 | ||||||
Safran SA | 3,900 | 470,972 | ||||||
Schneider Electric SE | 5,000 | 342,121 | ||||||
|
| |||||||
| 1,673,209 | ||||||||
|
| |||||||
Name of Issuer | Quantity | Fair Value ($) | ||||||
Germany - 9.1% |
| |||||||
adidas AG | 1,630 | 340,646 | ||||||
Allianz SE | 2,250 | 451,500 | ||||||
Aurelius SE & Co. | 4,660 | 169,359 | ||||||
Bayer AG | 5,300 | 367,749 | ||||||
Deutsche Post AG | 5,400 | 147,932 | ||||||
Siemens AG | 2,900 | 323,562 | ||||||
|
| |||||||
| 1,800,748 | ||||||||
|
| |||||||
Ireland - 1.0% | ||||||||
CRH, PLC, ADR | 7,400 | 194,990 | ||||||
|
| |||||||
Luxembourg - 1.2% | ||||||||
Globant SA* | 4,350 | 244,992 | ||||||
|
| |||||||
Netherlands - 5.3% | ||||||||
ASML Holding NV | 1,700 | 264,554 | ||||||
ING Groep NV | 27,400 | 295,414 | ||||||
Koninklijke Philips NV | 5,750 | 201,883 | ||||||
LyondellBasell Industries NV | 3,500 | 291,060 | ||||||
|
| |||||||
| 1,052,911 | ||||||||
|
| |||||||
Spain - 3.3% | ||||||||
Iberdrola SA | 50,000 | 402,044 | ||||||
Industria de Diseno Textil SA | 9,950 | 254,795 | ||||||
|
| |||||||
| 656,839 | ||||||||
|
| |||||||
Sweden - 1.9% | ||||||||
Hexagon AB | 5,200 | 239,379 | ||||||
Nordea Bank ABP | 17,000 | 143,052 | ||||||
|
| |||||||
| 382,431 | ||||||||
|
| |||||||
Switzerland - 10.1% | ||||||||
Garmin, Ltd. | 2,500 | 158,300 | ||||||
Interroll Holding AG | 120 | 177,271 | ||||||
Nestle SA | 8,200 | 665,744 | ||||||
Novartis AG | 4,325 | 369,797 | ||||||
Partners Group Holding AG | 300 | 181,911 | ||||||
Roche Holding AG | 1,320 | 326,878 | ||||||
Zurich Insurance Group AG | 380 | 113,316 | ||||||
|
| |||||||
| 1,993,217 | ||||||||
|
| |||||||
United Kingdom - 22.3% | ||||||||
Ashtead Group, PLC | 9,600 | 200,306 | ||||||
AstraZeneca, PLC, ADR | 1,300 | 49,374 | ||||||
Atlassian Corp., PLC* | 3,725 | 331,450 | ||||||
Babcock International Group, PLC | 25,300 | 157,786 | ||||||
BAE Systems, PLC | 37,500 | 219,486 | ||||||
British American Tobacco, PLC | 3,100 | 98,781 | ||||||
Carnival Corp. | 4,800 | 236,640 | ||||||
Cineworld Group, PLC | 99,500 | 333,797 | ||||||
Coca-Cola European Partners, PLC | 5,400 | 247,590 | ||||||
Diageo, PLC, ADR | 3,075 | 436,035 | ||||||
DS Smith, PLC | 50,600 | 193,033 | ||||||
See accompanying notes to financial statements. | ||||
42 |
|
SIT MUTUAL FUNDS SEMI-ANNUAL REPORT |
|
Name of Issuer | Quantity | Fair Value ($) | ||||||
Just Eat, PLC* | 18,500 | 138,368 | ||||||
Prudential, PLC | 12,200 | 218,013 | ||||||
Reckitt Benckiser Group, PLC | 5,800 | 444,522 | ||||||
RELX, PLC | 18,400 | 378,840 | ||||||
Royal Dutch Shell, PLC, ADR - Class A | 4,500 | 262,215 | ||||||
Royal Dutch Shell, PLC, ADR - Class B | 3,700 | 221,778 | ||||||
STERIS,PLC | 2,300 | 245,755 | ||||||
|
| |||||||
| 4,413,769 | ||||||||
|
| |||||||
North America - 8.5% |
| |||||||
Canada - 4.5% |
| |||||||
Alimentation Couche-Tard, Inc. | 2,600 | 129,333 | ||||||
Suncor Energy, Inc. | 13,100 | 366,407 | ||||||
Waste Connections, Inc. | 5,450 | 404,662 | ||||||
|
| |||||||
| 900,402 | ||||||||
|
| |||||||
United States - 4.0% |
| |||||||
Booking Holdings, Inc.* | 100 | 172,242 | ||||||
Broadcom, Inc. | 1,025 | 260,637 | ||||||
Euronet Worldwide, Inc.* | 3,475 | 355,771 | ||||||
|
| |||||||
| 788,650 | ||||||||
|
| |||||||
Total Common Stocks (cost: $18,646,830) |
| 19,147,561 | ||||||
|
| |||||||
Investment Companies - 1.5% |
| |||||||
iShares MSCI India ETF | 8,700 | 290,058 | ||||||
|
| |||||||
(cost: $258,887) |
| |||||||
Short-Term Securities - 1.7% |
| |||||||
Fidelity Inst. Money Mkt. Gvt. Fund, 2.25% | 340,677 | 340,677 | ||||||
|
| |||||||
(cost: $340,677) |
| |||||||
Total Investments in Securities - 99.7% (cost: $19,246,394) |
| 19,778,296 | ||||||
Other Assets and Liabilities, net - 0.3% | 62,733 | |||||||
|
| |||||||
Total Net Assets - 100.0% | $19,841,029 | |||||||
|
| |||||||
| * | Non-income producing security. |
Numeric footnotes not disclosed are not applicable to this Schedule of Investments.
ADR — American Depositary Receipt
GDR — Global Depositary Receipt
PLC — Public Limited Company
See accompanying notes to financial statements. | ||||
DECEMBER 31, 2018 |
|
43 |
|
|
SCHEDULE OF INVESTMENTS (Unaudited)
December 31, 2018
Sit International Growth Fund (Continued)
A summary of the levels for the Fund’s investments as of December 31, 2018 is as follows (see Note 2- significant accounting policies in the notes to financial statements):
| Investment in Securities | ||||||||||||||||
|
| |||||||||||||||
Level 1 Price ($)
| Level 2 Other significant observable inputs ($) | Level 3 Significant unobservable inputs ($) | Total ($) | |||||||||||||
|
| |||||||||||||||
Common Stocks | ||||||||||||||||
Australia | 471,238 | — | — | 471,238 | ||||||||||||
Belgium | 90,160 | — | — | 90,160 | ||||||||||||
Canada | 900,402 | — | — | 900,402 | ||||||||||||
China/Hong Kong | 1,652,713 | — | — | 1,652,713 | ||||||||||||
Denmark | 225,845 | — | — | 225,845 | ||||||||||||
Finland | 166,452 | — | — | 166,452 | ||||||||||||
France | 1,673,209 | — | — | 1,673,209 | ||||||||||||
Germany | 1,800,748 | — | — | 1,800,748 | ||||||||||||
Ireland | 194,990 | — | — | 194,990 | ||||||||||||
Japan | 1,749,707 | — | — | 1,749,707 | ||||||||||||
Luxembourg | 244,992 | — | — | 244,992 | ||||||||||||
Netherlands | 1,052,911 | — | — | 1,052,911 | ||||||||||||
Singapore | 271,150 | — | — | 271,150 | ||||||||||||
South Korea | 418,138 | — | — | 418,138 | ||||||||||||
Spain | 656,839 | — | — | 656,839 | ||||||||||||
Sweden | 382,431 | — | — | 382,431 | ||||||||||||
Switzerland | 1,993,217 | — | — | 1,993,217 | ||||||||||||
United Kingdom | 4,413,769 | — | — | 4,413,769 | ||||||||||||
United States | 788,650 | — | — | 788,650 | ||||||||||||
Investment Companies | 290,058 | — | — | 290,058 | ||||||||||||
Short-Term Securities | 340,677 | — | — | 340,677 | ||||||||||||
|
| |||||||||||||||
Total: | 19,778,296 | — | — | 19,778,296 | ||||||||||||
|
| |||||||||||||||
Level 1 securities of foreign issuers are primarily American Depositary Receipts (ADRs), Public Limited Companies (PLCs) or Global Depositary Receipts (GDRs). There were no transfers into or out of level 3 during the reporting period.
See accompanying notes to financial statements. | ||||
44 |
|
SIT MUTUAL FUNDS SEMI-ANNUAL REPORT |
|
[This page intentionally left blank.]
DECEMBER 31, 2018 |
45 |
|
Sit Developing Markets Growth Fund
|
OBJECTIVE & STRATEGY
The objective of the Sit Developing Markets Growth Fund is to maximize long-term capital appreciation. The Fund seeks to achieve its objective by investing at least 80% of its net assets in common stocks of companies domiciled or operating in a developing market. In selecting investments for the Fund, the Adviser begins by selecting countries or regions in which to invest by considering several factors affecting the economy and equity market of foreign countries and regions. After the country and regional allocations are determined, the Adviser seeks industries and sectors that appear to have strong earnings growth prospects. Within the selected industries and sectors, the Adviser invests in foreign growth-oriented companies it believes exhibit the potential for superior growth.
The Sit Developing Markets Growth Fund declined-15.04% for thesix-month period ended December 31, 2018, underperforming the MSCI Emerging Markets Index’s-9.71% return. The information technology (NICE, Broadcom), Funds (iShares MSCI India ETF), and cash sectors helped contribute to relative outperformance. Alternatively, the sectors of energy (GeoPark, China Petroleum), consumer discretionary (Ctrip, TAL Education, JD.com), and health care (CSPC Pharmaceutical) had negative relative contributions. EM stocks were battered on deteriorating PMI data, stronger U.S. dollar, volatile oil prices, tightening financial conditions, expanding current account deficits, and escalating U.S.-China trade tensions.
As China’s economic growth has slowed more than expected, more stimulus is forthcoming. Fiscal policy will involve further tax cuts and a rise in local government bond issuances. Monetary policy will also remain accommodative, with more cuts to the reserve requirement ratio. Our forecast 2019 GDP growth is +6.2%. We are encouraged by China’s efforts tode-escalate trade tensions following theTrump-Xi meeting at the recent G20 summit. India’s GDP is expected to expand +7.2% in fiscal 2019, supported by robust credit growth, consumption, and industrial production. For South Korea, GDP growth has moderated, on weaker investment, consumption, and exports. We expect South Korea’s economy to grow +2.6% this year on consumption and positive U.S.-China trade resolution. In Brazil, President Jair Bolsonaro faces the dual challenges of high public debt and sluggish growth. Given his support in Congress is limited, he may not be able to pass the requisite legislation, resulting in a slow economic recovery of +2.2% in 2019. Mexico economic growth is forecast at +2.0% in 2019, on domestic demand, yet a slower growing U.S. economy could weigh on growth.
For investment strategy, we prefer Asiaex-Japan, on expectations of a favorable U.S.-China trade agreement. We remain cautious on Chinese stocks given ongoing economic and policy uncertainty. We like stocks levered to the “new economy,” where fundamentals are solid. We also own pharmaceutical and gas utility stocks. We are positive on India and have investments in sectors that are economic beneficiaries (consumer, financials, information services, and energy). In South Korea, as export growth has slowed, our holdings are in domestic consumer and secular growth themes. Our investments
HYPOTHETICAL GROWTH OF $10,000
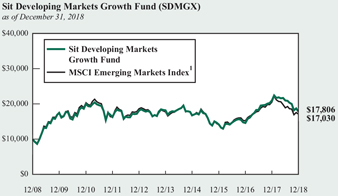
The chart above illustrates the total value of a hypothetical $10,000 investment in the Fund over the past 10 years as compared to the performance of the MSCI Emerging Markets Index. Past performance does not guarantee future results. Returns include the reinvestment of distributions. The chart does not reflect the deduction of taxes that a shareholder would pay on Fund distributions or the redemption of Fund shares.
1 MSCI Emerging Markets Index is an unmanaged free float-adjusted market capitalization index that measures equity market performance of emerging markets. It is not possible to invest directly in an index. This is the Fund’s primary index.
are primarily in the technology, financial, consumer, pharmaceutical, and materials sectors.
In Latin America, we are underweight Brazil and Mexico, as economic growth has been slower-than-expected and there are political risks from the new presidents’ referendums. The Brazil consumer sector should see better results as the economy improves. We also like financials, as earnings will improve as interest rates move upwards. In Maxico, President Andres Manuel Lopez Obrador’s scrapping of the Mexico City $13.3 billion airport shook investor confidence. We favor consumer stocks, which will benefit from the increase in the minimum wage. For the EM portfolio, we prefer companies with solid earnings growth/balance sheets, attractive valuations, and improving fundamentals.
Roger J. Sit Raymond E. Sit
Portfolio Manager
46 | SIT MUTUAL FUNDS SEMI-ANNUAL REPORT | |
|
|
| COMPARATIVE RATES OF RETURN |
| ||||||||||||||
as of December 31, 2018 | |||||||||||||||
| Sit Developing Markets Growth Fund | MSCI Emerging Markets Index1 | MSCI Emerging Markets Growth Index2 | |||||||||||||
Six Month |
|
-15.04 |
% |
|
-9.71 |
% |
|
-13.81 |
% | ||||||
One Year | -14.75 | -16.64 | -19.55 | ||||||||||||
Five Year | -0.38 | -0.75 | 1.02 | ||||||||||||
Ten Year | 5.94 | 5.47 | 7.04 | ||||||||||||
Since Inception (7/1/94) | 3.64 | 2.90 | n/a | ||||||||||||
Performance figures are historical and do not guarantee future results. Investment returns and principal value will vary, and you may have a gain or loss when you sell shares. Current performance may be lower or higher than the performance data quoted. Contact the Fund for performance data current to the most recentmonth-end. Returns include changes in share price as well as reinvestment of all dividends and capital gains. Returns do not reflect the deduction of the 2% redemption fee imposed if shares are redeemed or exchanged within 30 calendar days from their date of purchase. If imposed, the fee would reduce the performance quoted. Returns do not reflect the deduction of taxes that a shareholder would pay on Fund distributions or the redemption of Fund shares. Management fees and administrative expenses are included in the Fund’s performance. Returns for periods greater than one year are compounded average annual rates of return.
1 MSCI Emerging Markets Index is an unmanaged free float-adjusted market capitalization index that measures equity market performance of emerging markets. It is not possible to invest directly in an index.
2 MSCI Emerging Markets Growth Index is an unmanaged free float-adjusted market capitalization index that measures equity market performance of growth oriented emerging market stocks.
| FUND DIVERSIFICATION - BY REGION | ||||
| Sit Developing Markets Growth Fund | MSCI Emerging Markets Index | |||
Asia | 74.8% | 73.3% | ||
Africa/Middle East | 11.4 | 8.2 | ||
Latin America | 7.4 | 12.2 | ||
North America | 2.2 | — | ||
Europe | 0.9 | 6.3 | ||
Cash & Other Net Assets | 3.3 | — | ||
Based on total net assets as of December 31, 2018. Subject to change.
| PORTFOLIO SUMMARY | ||
Net Asset Value 12/31/18: | $14.41 Per Share | |
Net Asset Value 6/30/18: | $17.25 Per Share | |
Total Net Assets: | $9.2 Million | |
Weighted Average Market Cap: | $79.8 Billion | |
| TOP 10 HOLDINGS |
1. Tencent Holdings, Ltd. |
2. Samsung Electronics Co., Ltd. |
3. Alibaba Group Holding, Ltd., ADR |
4. iShares MSCI India ETF |
5. NICE Systems, Ltd., ADR |
6. China Construction Bank Corp. |
7. Naspers, Ltd. |
8. HDFC Bank, Ltd., ADR |
9. Taiwan Semiconductor Co. |
10. TAL Education Group, ADR
|
Based on total net assets as of December 31, 2018. Subject to change.
FUND DIVERSIFICATION
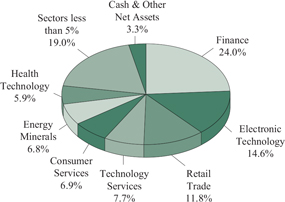
Based on total net assets as of December 31, 2018. Subject to change.
DECEMBER 31, 2018 |
|
47 |
|
|
SCHEDULE OF INVESTMENTS (Unaudited)
December 31, 2018
Sit Developing Markets Growth Fund
| Name of Issuer | Quantity | Fair Value ($) | ||||||
Common Stocks - 92.7% |
| |||||||
Africa/Middle East - 11.4% |
| |||||||
Israel - 3.5% |
| |||||||
NICE Systems, Ltd., ADR* | 3,000 | 324,630 | ||||||
|
| |||||||
South Africa - 7.9% | ||||||||
Bid Corp., Ltd. | 13,200 | 243,128 | ||||||
Bidvest Group, Ltd. | 5,525 | 79,433 | ||||||
Naspers, Ltd. | 1,425 | 286,463 | ||||||
Sasol, Ltd., ADR | 4,200 | 123,018 | ||||||
|
| |||||||
| 732,042 | ||||||||
|
| |||||||
Asia - 70.8% | ||||||||
Australia - 1.3% | ||||||||
Rio Tinto, PLC, ADR | 2,475 | 119,988 | ||||||
|
| |||||||
China/Hong Kong - 36.9% | ||||||||
AIA Group, Ltd. | 21,400 | 177,639 | ||||||
Alibaba Group Holding, Ltd., ADR* | 2,875 | 394,076 | ||||||
Baidu, Inc., ADR* | 1,125 | 178,425 | ||||||
China Construction Bank Corp. | 359,000 | 296,168 | ||||||
China Life Insurance Co., Ltd., ADR | 8,900 | 93,361 | ||||||
China Mengniu Dairy Co., Ltd. | 56,000 | 174,497 | ||||||
China Petroleum & Chemical Corp., ADR | 3,100 | 218,860 | ||||||
CNOOC, Ltd., ADR | 300 | 45,735 | ||||||
CSPC Pharmaceutical Group, Ltd. | 120,000 | 173,169 | ||||||
ENN Energy Holdings, Ltd. | 28,000 | 248,337 | ||||||
Hong Kong Exchanges & Clearing, Ltd. | 4,300 | 124,434 | ||||||
JD.com, Inc., ADR* | 4,450 | 93,138 | ||||||
PetroChina Co., Ltd., ADR | 700 | 43,085 | ||||||
Ping An Insurance Group Co. of China, Ltd. | 17,000 | 150,124 | ||||||
Sinopharm Group Co., Ltd. | 44,900 | 188,648 | ||||||
TAL Education Group, ADR* | 10,300 | 274,804 | ||||||
Tencent Holdings, Ltd. | 11,400 | 457,136 | ||||||
WH Group, Ltd. | 104,000 | 80,087 | ||||||
|
| |||||||
| 3,411,723 | ||||||||
|
| |||||||
India - 3.0% | ||||||||
HDFC Bank, Ltd., ADR | 2,675 | 277,103 | ||||||
|
| |||||||
Indonesia - 2.5% | ||||||||
Astra International Tbk PT | 176,000 | 100,668 | ||||||
XL Axiata Tbk PT* | 948,800 | 130,641 | ||||||
|
| |||||||
| 231,309 | ||||||||
|
| |||||||
Japan - 2.4% | ||||||||
Suzuki Motor Corp. | 4,300 | 218,403 | ||||||
|
| |||||||
Singapore - 2.7% | ||||||||
DBS Group Holdings, Ltd. | 14,500 | 252,031 | ||||||
|
| |||||||
South Korea - 13.0% | ||||||||
E-Mart Co., Inc. | 1,200 | 196,272 | ||||||
LG Chem, Ltd. | 450 | 139,944 | ||||||
Medy-Tox, Inc. | 360 | 186,420 | ||||||
| Name of Issuer | Quantity | Fair Value ($) | ||||||
Samsung Electronics Co., Ltd. | 12,250 | 424,875 | ||||||
Shinhan Financial Group Co., Ltd.* | 7,200 | 255,530 | ||||||
|
| |||||||
| 1,203,041 | ||||||||
|
| |||||||
Taiwan - 7.5% | ||||||||
Cathay Financial Holding Co., Ltd. | 82,085 | 125,516 | ||||||
Hon Hai Precision Industry Co., Ltd., GDR | 22,160 | 103,288 | ||||||
President Chain Store Corp. | 16,000 | 161,890 | ||||||
Taiwan Semiconductor Co. | 37,482 | 274,984 | ||||||
Taiwan Semiconductor Co., ADR | 600 | 22,146 | ||||||
|
| |||||||
| 687,824 | ||||||||
|
| |||||||
Thailand - 1.5% | ||||||||
Bangkok Bank PCL | 21,200 | 134,779 | ||||||
|
| |||||||
Europe - 0.9% | ||||||||
Luxembourg - 0.9% | ||||||||
Globant SA* | 1,400 | 78,848 | ||||||
|
| |||||||
Latin America - 7.4% | ||||||||
Brazil - 2.5% | ||||||||
Ambev SA, ADR | 10,800 | 42,336 | ||||||
Banco Bradesco SA | 19,003 | 189,503 | ||||||
|
| |||||||
| 231,839 | ||||||||
|
| |||||||
Chile - 3.6% | ||||||||
Banco Santander Chile, ADR | 4,700 | 140,530 | ||||||
Geopark, Ltd. * | 14,100 | 194,862 | ||||||
|
| |||||||
| 335,392 | ||||||||
|
| |||||||
Peru - 1.3% | ||||||||
Southern Copper Corp. | 3,900 | 120,003 | ||||||
|
| |||||||
North America - 2.2% | ||||||||
United States - 2.2% | ||||||||
Broadcom, Inc. | 550 | 139,854 | ||||||
Skyworks Solutions, Inc. | 925 | 61,993 | ||||||
|
| |||||||
| 201,847 | ||||||||
|
| |||||||
Total Common Stocks | 8,560,802 | |||||||
|
| |||||||
Investment Companies - 4.0% | ||||||||
iShares MSCI India ETF | 11,100 | 370,074 | ||||||
|
| |||||||
| (cost: $334,045) | ||||||||
See accompanying notes to financial statements. | ||||
48 |
|
SIT MUTUAL FUNDS SEMI-ANNUAL REPORT |
|
| Name of Issuer | Quantity | Fair Value ($) | ||||||
Short-Term Securities - 3.3% | ||||||||
Fidelity Inst. Money Mkt. Gvt. Fund, 2.25% | 304,747 | 304,747 | ||||||
|
| |||||||
(cost: $304,747) | ||||||||
Total Investments in Securities - 100.0% (cost: $7,802,132) | 9,235,623 | |||||||
Other Assets and Liabilities, net - 0.0% | 3,421 | |||||||
|
| |||||||
Total Net Assets - 100.0% | $9,239,044 | |||||||
|
| |||||||
|
| |||||||
| * | Non-income producing security. |
ADR — American Depositary Receipt
GDR — Global Depositary Receipt
Numeric footnotes not disclosed are not applicable to this Schedule of Investments.
A summary of the levels for the Fund’s investments as of December 31, 2018 is as follows (see Note 2- significant accounting policies in the notes to financial statements):
| Investment in Securities |
| ||||||||||||||
| Level 1 Quoted Price ($) | Level 2 Other significant observable inputs ($) | Level 3 Significant unobservable inputs ($) | Total ($) | |||||||||||||
Common Stocks | ||||||||||||||||
Australia | 119,988 | — | — | 119,988 | ||||||||||||
Brazil | 231,839 | — | — | 231,839 | ||||||||||||
Chile | 335,392 | — | — | 335,392 | ||||||||||||
China/Hong Kong | 3,411,723 | — | — | 3,411,723 | ||||||||||||
India | 277,103 | — | — | 277,103 | ||||||||||||
Indonesia | 231,309 | — | — | 231,309 | ||||||||||||
Israel | 324,630 | — | — | 324,630 | ||||||||||||
Japan | 218,403 | — | — | 218,403 | ||||||||||||
Luxembourg | 78,848 | — | — | 78,848 | ||||||||||||
Peru | 120,003 | — | — | 120,003 | ||||||||||||
Singapore | 252,031 | — | — | 252,031 | ||||||||||||
South Africa | 732,042 | — | — | 732,042 | ||||||||||||
South Korea | 1,203,041 | — | — | 1,203,041 | ||||||||||||
Taiwan | 687,824 | — | — | 687,824 | ||||||||||||
Thailand | 134,779 | — | — | 134,779 | ||||||||||||
United States | 201,847 | — | — | 201,847 | ||||||||||||
Investment Companies | 370,074 | — | — | 370,074 | ||||||||||||
Short-Term Securities | 304,747 | — | — | 304,747 | ||||||||||||
Total: | 9,235,623 | — | — | 9,235,623 | ||||||||||||
Level 1 securities of foreign issuers are primarily American Depositary Receipts (ADRs), Public Limited Companies (PLCs) or Global Depositary Receipts (GDRs). There were no transfers into or out of level 3 during the reporting period.
See accompanying notes to financial statements. | ||||
DECEMBER 31, 2018 |
|
49 |
|
|
STATEMENTS OF ASSETS AND LIABILITIES (Unaudited)
December 31, 2018
| Sit Balanced Fund | Sit Dividend Growth Fund | Sit Global Dividend Growth Fund | ||||||||||
ASSETS | ||||||||||||
Investments in securities, at identified cost | $ | 30,093,355 | $ | 445,584,475 | $ | 26,036,545 | ||||||
|
|
|
|
|
| |||||||
Investments in securities, at fair value - see accompanying schedule for detail | $ | 33,300,871 | $ | 461,699,430 | $ | 29,437,770 | ||||||
Cash in bank on demand deposit | 264 | — | — | |||||||||
Accrued interest and dividends receivable | 102,302 | 1,036,913 | 72,614 | |||||||||
Receivable for investment securities sold | — | 4,723,756 | — | |||||||||
Receivable for Fund shares sold | 72,825 | 336,697 | 637 | |||||||||
|
|
|
|
|
| |||||||
Total assets | 33,476,262 | 467,796,796 | 29,511,021 | |||||||||
|
|
|
|
|
| |||||||
LIABILITIES | ||||||||||||
Disbursements in excess of cash balances | — | 1,122,553 | 8 | |||||||||
Payable for investment securities purchased | 461,283 | 903,918 | — | |||||||||
Payable for Fund shares redeemed | 2,927 | 3,307,016 | — | |||||||||
Accrued investment management fees and advisory fees | 30,675 | 414,850 | 25,495 | |||||||||
Accrued12b-1 fees (Class S) | — | 9,245 | 612 | |||||||||
|
|
|
|
|
| |||||||
Total liabilities | 494,885 | 5,757,582 | 26,115 | |||||||||
|
|
|
|
|
| |||||||
Net assets applicable to outstanding capital stock | $ | 32,981,377 | $ | 462,039,214 | $ | 29,484,906 | ||||||
|
|
|
|
|
| |||||||
Net assets consist of: | ||||||||||||
Capital (par value andpaid-in surplus) | $ | 28,354,147 | $ | 413,224,356 | $ | 26,995,267 | ||||||
Total distributable earnings (loss), including unrealized appreciation (depreciation) | 4,627,230 | 48,814,858 | 2,489,639 | |||||||||
|
|
|
|
|
| |||||||
| $ | 32,981,377 | $ | 462,039,214 | $ | 29,484,906 | |||||||
|
|
|
|
|
| |||||||
Outstanding shares: | ||||||||||||
Common Shares (Class I) * | 1,479,238 | 33,586,779 | 1,889,119 | |||||||||
|
|
|
|
|
| |||||||
Common Shares (Class S) * | — | 3,243,051 | 198,128 | |||||||||
|
|
|
|
|
| |||||||
Net assets applicable to outstanding shares: | ||||||||||||
Common Shares (Class I) * | $ | 32,981,377 | $ | 421,530,554 | $ | 26,686,742 | ||||||
|
|
|
|
|
| |||||||
Common Shares (Class S) * | — | 40,508,660 | 2,798,164 | |||||||||
|
|
|
|
|
| |||||||
Net asset value per share of outstanding capital stock: | ||||||||||||
Common Shares (Class I) * | $22.30 | $12.55 | $14.13 | |||||||||
|
|
|
|
|
| |||||||
Common Shares (Class S) * | — | $12.49 | $14.12 | |||||||||
|
|
|
|
|
| |||||||
| * | Dividend Growth, Global Dividend Growth, ESG Growth and Small Cap Dividend Growth Funds offer multiple share classes (I and S). All other Funds offer a single share class. |
See accompanying notes to financial statements. | ||||
50 |
|
SIT MUTUAL FUNDS SEMI-ANNUAL REPORT |
|
| Sit Large Cap Growth Fund | Sit ESG Growth Fund | Sit Mid Cap Growth Fund | Sit Small Cap Dividend Growth Fund | Sit Small Cap Growth Fund | Sit International Growth Fund | Sit Developing Markets Growth Fund | ||||||||||||||||||||
| $62,835,430 | $4,837,835 | $93,695,429 | $15,044,006 | $67,053,116 | $19,246,394 | $7,802,132 | ||||||||||||||||||||
|
|
|
|
|
|
|
|
|
|
|
|
|
| |||||||||||||
| $105,015,749 | $5,413,345 | $138,774,703 | $14,718,628 | $83,114,392 | $19,778,296 | $9,235,623 | ||||||||||||||||||||
| — | — | — | 5 | — | 41 | — | ||||||||||||||||||||
| 59,982 | 8,215 | 66,062 | 27,976 | 70,633 | 78,286 | 19,119 | ||||||||||||||||||||
| 467,428 | — | — | 56,270 | — | 80,224 | — | ||||||||||||||||||||
| 123,234 | 19 | 33,979 | 51 | 6,446 | 1,929 | 2,566 | ||||||||||||||||||||
|
|
|
|
|
|
|
|
|
|
|
|
|
| |||||||||||||
| 105,666,393 | 5,421,579 | 138,874,744 | 14,802,930 | 83,191,471 | 19,938,776 | 9,257,308 | ||||||||||||||||||||
|
|
|
|
|
|
|
|
|
|
|
|
|
| |||||||||||||
| — | — | — | — | — | — | — | ||||||||||||||||||||
| — | — | — | 59,993 | — | 71,839 | — | ||||||||||||||||||||
| 510,735 | — | 267,407 | — | 52,341 | — | 7,176 | ||||||||||||||||||||
| 93,074 | 4,691 | 151,991 | 13,126 | 110,625 | 25,908 | 11,088 | ||||||||||||||||||||
| — | 540 | — | 734 | — | — | — | ||||||||||||||||||||
|
|
|
|
|
|
|
|
|
|
|
|
|
| |||||||||||||
| 603,809 | 5,231 | 419,398 | 73,853 | 162,966 | 97,747 | 18,264 | ||||||||||||||||||||
|
|
|
|
|
|
|
|
|
|
|
|
|
| |||||||||||||
| $105,062,584 | $5,416,348 | $138,455,346 | $14,729,077 | $83,028,505 | $19,841,029 | $9,239,044 | ||||||||||||||||||||
|
|
|
|
|
|
|
|
|
|
|
|
|
| |||||||||||||
| $60,845,771 | $4,882,568 | $91,707,572 | $15,143,804 | $66,120,305 | $19,930,309 | $7,818,409 | ||||||||||||||||||||
| 44,216,813 | 533,780 | 46,747,774 | (414,727 | ) | 16,908,200 | (89,280 | ) | 1,420,635 | ||||||||||||||||||
|
|
|
|
|
|
|
|
|
|
|
|
|
| |||||||||||||
| $105,062,584 | $5,416,348 | $138,455,346 | $14,729,077 | $83,028,505 | $19,841,029 | $9,239,044 | ||||||||||||||||||||
|
|
|
|
|
|
|
|
|
|
|
|
|
| |||||||||||||
| 2,946,004 | 255,931 | 9,144,668 | 1,134,348 | 1,868,291 | 1,384,330 | 641,023 | ||||||||||||||||||||
|
|
|
|
|
|
|
|
|
|
|
|
|
| |||||||||||||
| — | 219,631 | — | 329,709 | — | — | — | ||||||||||||||||||||
|
|
|
|
|
|
|
|
|
|
|
|
|
| |||||||||||||
| $105,062,584 | $2,918,352 | $138,455,346 | $11,412,261 | $83,028,505 | $19,841,029 | $9,239,044 | ||||||||||||||||||||
|
|
|
|
|
|
|
|
|
|
|
|
|
| |||||||||||||
| — | 2,497,996 | — | 3,316,816 | — | — | — | ||||||||||||||||||||
|
|
|
|
|
|
|
|
|
|
|
|
|
| |||||||||||||
| $35.66 | $11.40 | $15.14 | $10.06 | $44.44 | $14.33 | $14.41 | ||||||||||||||||||||
|
|
|
|
|
|
|
|
|
|
|
|
|
| |||||||||||||
| — | $11.37 | — | $10.06 | — | — | — | ||||||||||||||||||||
|
|
|
|
|
|
|
|
|
|
|
|
|
| |||||||||||||
DECEMBER 31, 2018 |
|
51 |
|
|
STATEMENTS OF OPERATIONS (Unaudited)
Six Months Ended December 31, 2018
| Sit Balanced Fund | Sit Dividend Growth Fund | Sit Global Dividend Growth Fund | ||||||||||
Investment income: | ||||||||||||
Income: | ||||||||||||
Dividends* | $205,816 | $15,145,063 | $391,498 | |||||||||
Interest | 249,605 | 72,205 | 11,216 | |||||||||
|
|
|
|
|
| |||||||
Total income | 455,421 | 15,217,268 | 402,714 | |||||||||
|
|
|
|
|
| |||||||
Expenses (note 4): | ||||||||||||
Investment management and advisory service fee | 194,110 | 4,662,242 | 204,490 | |||||||||
12b-1 fees (Class S) | — | 63,326 | 4,040 | |||||||||
|
|
|
|
|
| |||||||
Total expenses | 194,110 | 4,725,568 | 208,530 | |||||||||
|
|
|
|
|
| |||||||
Less fees and expenses waived by investment adviser | — | (1,398,673 | ) | (40,898 | ) | |||||||
|
|
|
|
|
| |||||||
Total net expenses | 194,110 | 3,326,895 | 167,632 | |||||||||
|
|
|
|
|
| |||||||
Net investment income (loss) | 261,311 | 11,890,373 | 235,082 | |||||||||
|
|
|
|
|
| |||||||
Realized and unrealized gain (loss): | ||||||||||||
Net realized gain (loss) on investments | 1,451,796 | 67,774,848 | 28,006 | |||||||||
Net realized gain (loss) on foreign currency transactions | — | — | (1,327 | ) | ||||||||
Net change in unrealized appreciation (depreciation) on investments and foreign currency transactions | (3,416,726 | ) | (127,261,932 | ) | (2,090,819 | ) | ||||||
|
|
|
|
|
| |||||||
Net gain (loss) | (1,964,930 | ) | (59,487,084 | ) | (2,064,140 | ) | ||||||
|
|
|
|
|
| |||||||
Net increase (decrease) in net assets resulting from operations | ($1,703,619 | ) | ($47,596,711 | ) | ($1,829,058 | ) | ||||||
|
|
|
|
|
| |||||||
| ||||||||||||
* Foreign taxes withheld on dividends received | — | $61,886 | $7,961 | |||||||||
See accompanying notes to financial statements. | ||||
52 |
|
SIT MUTUAL FUNDS SEMI-ANNUAL REPORT |
|
| Sit Large Cap Growth Fund | Sit ESG Growth Fund | Sit Mid Cap Growth Fund | Sit Small Cap Dividend Growth Fund | Sit Small Cap Growth Fund | Sit International Growth Fund | Sit Developing Markets Growth Fund | ||||||||||||||||||||
| $830,591 | $57,343 | $870,225 | $203,346 | $490,431 | $163,047 | $94,432 | ||||||||||||||||||||
| 12,240 | 2,250 | 34,935 | 8,125 | 29,726 | 4,537 | 3,402 | ||||||||||||||||||||
|
|
|
|
|
|
|
|
|
|
|
|
|
| |||||||||||||
| 842,831 | 59,593 | 905,160 | 211,471 | 520,157 | 167,584 | 97,834 | ||||||||||||||||||||
|
|
|
|
|
|
|
|
|
|
|
|
|
| |||||||||||||
| 606,512 | 36,785 | 1,002,506 | 112,840 | 746,757 | 171,768 | 103,484 | ||||||||||||||||||||
| — | 3,390 | — | 4,841 | — | — | — | ||||||||||||||||||||
|
|
|
|
|
|
|
|
|
|
|
|
|
| |||||||||||||
| 606,512 | 40,175 | 1,002,506 | 117,681 | 746,757 | 171,768 | 103,484 | ||||||||||||||||||||
|
|
|
|
|
|
|
|
|
|
|
|
|
| |||||||||||||
| — | (7,357 | ) | — | (22,568 | ) | — | — | (31,045 | ) | |||||||||||||||||
|
|
|
|
|
|
|
|
|
|
|
|
|
| |||||||||||||
| 606,512 | 32,818 | 1,002,506 | 95,113 | 746,757 | 171,768 | 72,439 | ||||||||||||||||||||
|
|
|
|
|
|
|
|
|
|
|
|
|
| |||||||||||||
| 236,319 | 26,775 | (97,346 | ) | 116,358 | (226,600 | ) | (4,184 | ) | 25,395 | |||||||||||||||||
|
|
|
|
|
|
|
|
|
|
|
|
|
| |||||||||||||
| 4,951,138 | 5,639 | 8,520,763 | 271,706 | 4,619,947 | 200,285 | 49,433 | ||||||||||||||||||||
| — | 4 | 54 | — | — | (3,538 | ) | 135 | |||||||||||||||||||
| (13,704,691 | ) | (420,291 | ) | (24,306,055 | ) | (3,299,881 | ) | (18,800,909 | ) | (3,311,544 | ) | (1,761,583 | ) | |||||||||||||
|
|
|
|
|
|
|
|
|
|
|
|
|
| |||||||||||||
| (8,753,553 | ) | (414,648 | ) | (15,785,238 | ) | (3,028,175 | ) | (14,180,962 | ) | (3,114,797 | ) | (1,712,015 | ) | |||||||||||||
|
|
|
|
|
|
|
|
|
|
|
|
|
| |||||||||||||
| ($8,517,234 | ) | ($387,873 | ) | ($15,882,584 | ) | ($2,911,817 | ) | ($14,407,562 | ) | ($3,118,981 | ) | ($1,686,620 | ) | |||||||||||||
|
|
|
|
|
|
|
|
|
|
|
|
|
| |||||||||||||
| — | $1,329 | $2,572 | $2,031 | $2,437 | $10,724 | $13,339 | ||||||||||||||||||||
DECEMBER 31, 2018 |
|
53 |
|
STATEMENTS OF CHANGES IN NET ASSETS
| Sit Balanced Fund | Sit Dividend Growth Fund | |||||||||||||||
| Six Months Ended December 31, 2018, (Unaudited) | Year Ended June 30, 2018 | Six Months Ended December 31, 2018, (Unaudited) | Year Ended June 30, 2018 | |||||||||||||
Operations: | ||||||||||||||||
Net investment income | $261,311 | $303,300 | $11,890,373 | $15,673,656 | ||||||||||||
Net realized gain (loss) on investments and foreign currency transactions | 1,451,796 | 715,577 | 67,774,848 | 109,763,327 | ||||||||||||
Net change in unrealized appreciation (depreciation) of investments and foreign currency transactions | (3,416,726) | 1,390,249 | (127,261,932) | (22,458,367 | ) | |||||||||||
|
|
|
|
|
|
|
| |||||||||
Net increase (decrease) in net assets resulting from operations | (1,703,619) | 2,409,126 | (47,596,711) | 102,978,616 | ||||||||||||
|
|
|
|
|
|
|
| |||||||||
Distributions from: | ||||||||||||||||
Net investment income and net realized gains | ||||||||||||||||
Common shares (Class I) | (685,301) | (1,313,844 | ) 1 | (103,879,468) | (105,434,233 | ) 1 | ||||||||||
Common shares (Class S) | — | — | (8,679,181) | (6,712,578 | )1 | |||||||||||
|
|
|
|
|
|
|
| |||||||||
Total distributions | (685,301) | (1,313,844 | ) | (112,558,649) | (112,146,811 | ) | ||||||||||
|
|
|
|
|
|
|
| |||||||||
Capital share transactions: | ||||||||||||||||
Proceeds from shares sold | ||||||||||||||||
Common shares (Class I) | 5,894,719 | 13,977,591 | 55,224,155 | 257,170,063 | ||||||||||||
Common shares (Class S) | — | — | 1,235,225 | 2,307,028 | ||||||||||||
Reinvested distributions | ||||||||||||||||
Common shares (Class I) | 673,361 | 1,299,020 | 100,283,171 | 42,771,565 | ||||||||||||
Common shares (Class S) | — | — | 8,580,189 | 6,677,009 | ||||||||||||
Payments for shares redeemed | ||||||||||||||||
Common shares (Class I) | (8,738,645) | (4,072,712 | ) | (503,990,995) | (388,508,155 | ) | ||||||||||
Common shares (Class S) | — | — | (9,051,901) | (22,533,051 | ) | |||||||||||
|
|
|
|
|
|
|
| |||||||||
Increase (decrease) in net assets from capital transactions | (2,170,565) | 11,203,899 | (347,720,156) | (102,115,541 | ) | |||||||||||
|
|
|
|
|
|
|
| |||||||||
Total increase (decrease) in net assets | (4,559,485) | 12,299,181 | (507,875,516) | (111,283,736 | ) | |||||||||||
Net assets: | ||||||||||||||||
Beginning of period | 37,540,862 | 25,241,681 | 969,914,730 | 1,081,198,466 | ||||||||||||
|
|
|
|
|
|
|
| |||||||||
End of period 2 | $32,981,377 | $37,540,862 | $462,039,214 | $969,914,730 | ||||||||||||
|
|
|
|
|
|
|
| |||||||||
Capital transactions in shares: | ||||||||||||||||
Sold | ||||||||||||||||
Common shares (Class I) | 246,306 | 584,716 | 3,333,229 | 14,996,753 | ||||||||||||
Common shares (Class S) | — | — | 74,406 | 134,409 | ||||||||||||
Reinvested distributions | ||||||||||||||||
Common shares (Class I) | 29,736 | 55,504 | 7,786,512 | 2,542,673 | ||||||||||||
Common shares (Class S) | — | — | 676,535 | 398,231 | ||||||||||||
Redeemed | ||||||||||||||||
Common shares (Class I) | (376,504) | (171,981 | ) | (32,585,989) | (22,672,863 | ) | ||||||||||
Common shares (Class S) | — | — | (598,118) | (1,325,718 | ) | |||||||||||
|
|
|
|
|
|
|
| |||||||||
Net increase (decrease) | (100,462) | 468,239 | (21,313,425) | (5,926,515 | ) | |||||||||||
|
|
|
|
|
|
|
| |||||||||
| 1 | For the year ended June 30, 2018, the distributions to shareholders from net investment income for Balanced Fund was $307,000, Dividend Growth Fund for Class I $14,508,065 and Class S was $767,936, Global Dividend Growth Fund Class I was $431,455 and Class S was $44,545, Large Cap Growth Fund was $460,000 and ESG Growth Fund Class I was $27,776 and Class S was $21,224. Distributions from net realized long-term gains for Balanced Fund was $1,006,844, Dividend Growth Fund for Class I was $90,926,168 and Class S was $5,944,642 and Large Cap Growth Fund was $12,334,121. |
| 2 | Effective December 31, 2018, the Securities and Exchange Commission eliminated the requirement to disclose end of year undistributed (distributions in excess of) net investment income. |
See accompanying notes to financial statements.
| ||
54 |
SIT MUTUAL FUNDS SEMI-ANNUAL REPORT |
| Sit Global Dividend Growth Fund | Sit Large Cap Growth Fund | Sit ESG Growth Fund | ||||||||||||||||||||
| Six Months Ended December 31, 2018, (Unaudited) | Year Ended June 30, 2018 | Six Months Ended December 31, 2018, (Unaudited) | Year Ended June 30, 2018 | Six Months Ended December 31, 2018, (Unaudited) | Year Ended June 30, 2018 | |||||||||||||||||
| $235,082 | $558,373 | $236,319 | $359,089 | $26,775 | $64,388 | |||||||||||||||||
| | 26,679 |
| (27,715 | ) | 4,951,138 | 9,803,393 | 5,643 | 9,914 | ||||||||||||||
| | (2,090,819) |
| 1,347,979 | (13,704,691) | 8,347,786 | (420,291) | 442,491 | |||||||||||||||
|
|
|
|
|
|
|
|
|
|
|
| |||||||||||
| (1,829,058) |
| 1,878,637 | | (8,517,234) | 18,510,268 | (387,873) | 516,793 | ||||||||||||||
|
|
|
|
|
|
|
|
|
|
|
| |||||||||||
| (405,383) | (431,455 | )1 | (9,934,663) | (12,794,121 | ) 1 | (40,551) | (27,776 | )1 | ||||||||||||||
| (38,619) | (44,545 | )1 | — | — | (31,449) | (21,224 | )1 | |||||||||||||||
|
|
|
|
|
|
|
|
|
|
|
| |||||||||||
| (444,002) | (476,000 | ) | (9,934,663) | (12,794,121 | ) | (72,000) | (49,000 | ) | ||||||||||||||
|
|
|
|
|
|
|
|
|
|
|
| |||||||||||
| 1,516,319 | 3,389,268 | 2,844,566 | 4,047,652 | 134,250 | 460,069 | |||||||||||||||||
| 84,282 | 264,488 | — | — | 21,126 | 103,794 | |||||||||||||||||
| 392,873 | 423,025 | 9,726,108 | 12,508,440 | 40,551 | 27,776 | |||||||||||||||||
| 37,603 | 43,351 | — | — | 31,449 | 21,224 | |||||||||||||||||
| (1,938,667) | (1,892,026 | ) | (7,848,540) | (17,099,902 | ) | (46,615) | (39,541 | ) | ||||||||||||||
| (358,212) | (504,237 | ) | — | — | (5,309) | (10,055 | ) | |||||||||||||||
|
|
|
|
|
|
|
|
|
|
|
| |||||||||||
| (265,802) | 1,723,869 | 4,722,134 | (543,810 | ) | 175,452 | 563,267 | ||||||||||||||||
|
|
|
|
|
|
|
|
|
|
|
| |||||||||||
| (2,538,862) | 3,126,506 | (13,729,763) | 5,172,337 | (284,421) | 1,031,060 | |||||||||||||||||
| 32,023,768 | 28,897,262 | 118,792,347 | 113,620,010 | 5,700,769 | 4,669,709 | |||||||||||||||||
|
|
|
|
|
|
|
|
|
|
|
| |||||||||||
| $29,484,906 | $32,023,768 | $105,062,584 | $118,792,347 | $5,416,348 | $5,700,769 | |||||||||||||||||
|
|
|
|
|
|
|
|
|
|
|
| |||||||||||
| 99,006 | 220,714 | 66,212 | 95,043 | 10,362 | 38,636 | |||||||||||||||||
| 5,684 | 17,327 | — | — | 1,765 | 8,819 | |||||||||||||||||
| 26,108 | 27,818 | 272,975 | 305,905 | 3,576 | 2,227 | |||||||||||||||||
| 2,495 | 2,858 | — | — | 2,781 | 1,703 | |||||||||||||||||
| (124,454) | (122,055 | ) | (194,673) | (401,061 | ) | (3,748) | (3,175 | ) | ||||||||||||||
| (23,269) | (32,356 | ) | — | — | (418) | (831 | ) | |||||||||||||||
|
|
|
|
|
|
|
|
|
|
|
| |||||||||||
| (14,430) | 114,306 | 144,514 | (113 | ) | 14,318 | 47,379 | ||||||||||||||||
|
|
|
|
|
|
|
|
|
|
|
| |||||||||||
| ||||
DECEMBER 31, 2018 |
|
55 |
|
STATEMENTS OF CHANGES IN NET ASSETS (Continued)
| Sit Mid Cap Growth Fund | Sit Small Cap Dividend Growth Fund | |||||||||||||||
| Six Months Ended December 31, 2018, (Unaudited) | Year Ended June 30, 2018 | Six Months Ended December 31, 2018, (Unaudited) | Year Ended June 30, 2018 | |||||||||||||
Operations: | ||||||||||||||||
Net investment income (loss) | ($97,346) | ($273,200 | ) | $116,358 | $160,182 | |||||||||||
Net realized gain (loss) on investments and foreign currency transactions | 8,520,817 | 11,316,697 | 271,706 | 147,242 | ||||||||||||
Net change in unrealized appreciation (depreciation) of investments and foreign currency transactions | (24,306,055) | 3,389,179 | (3,299,881) | 1,009,916 | ||||||||||||
|
|
|
|
|
|
|
| |||||||||
Net increase (decrease) in net assets resulting from operations | (15,882,584) | 14,432,676 | (2,911,817) | 1,317,340 | ||||||||||||
|
|
|
|
|
|
|
| |||||||||
Distributions from: | ||||||||||||||||
Net investment income and net realized gains | ||||||||||||||||
Common shares (Class I) | (15,426,149) | (6,522,336 | )3 | (275,162) | (131,227 | )3 | ||||||||||
Common shares (Class S) | — | — | (70,454) | (26,774 | )3 | |||||||||||
|
|
|
|
|
|
|
| |||||||||
Total distributions | (15,426,149) | (6,522,336 | ) | (345,616) | (158,001 | ) | ||||||||||
|
|
|
|
|
|
|
| |||||||||
Capital share transactions: | ||||||||||||||||
Proceeds from shares sold | ||||||||||||||||
Common shares (Class I) | 1,224,873 | 1,789,391 | 290,984 | 2,273,483 | ||||||||||||
Common shares (Class S) | — | — | 197,115 | 401,124 | ||||||||||||
Reinvested distributions | ||||||||||||||||
Common shares (Class I) | 14,750,446 | 6,256,872 | 262,852 | 126,798 | ||||||||||||
Common shares (Class S) | — | — | 66,705 | 25,507 | ||||||||||||
Payments for shares redeemed | ||||||||||||||||
Common shares (Class I) | (4,711,844) | (13,760,901 | ) | (1,197,327) | (1,428,797 | ) | ||||||||||
Common shares (Class S) | — | — | (113,001) | (254,831 | ) | |||||||||||
|
|
|
|
|
|
|
| |||||||||
Increase (decrease) in net assets from capital transactions | 11,263,475 | (5,714,638 | ) | (492,672) | 1,143,284 | |||||||||||
|
|
|
|
|
|
|
| |||||||||
Total increase (decrease) in net assets | (20,045,258) | 2,195,702 | (3,750,105) | 2,302,623 | ||||||||||||
Net assets: | ||||||||||||||||
Beginning of period | 158,500,604 | 156,304,902 | 18,479,182 | 16,176,559 | ||||||||||||
|
|
|
|
|
|
|
| |||||||||
End of period4 | $138,455,346 | $158,500,604 | $14,729,077 | $18,479,182 | ||||||||||||
|
|
|
|
|
|
|
| |||||||||
Capital transactions in shares: | ||||||||||||||||
Sold | ||||||||||||||||
Common shares (Class I) | 64,085 | 95,657 | 23,589 | 188,888 | ||||||||||||
Common shares (Class S) | — | — | 16,474 | 33,509 | ||||||||||||
Reinvested distributions | ||||||||||||||||
Common shares (Class I) | 980,096 | 339,494 | 24,851 | 10,585 | ||||||||||||
Common shares (Class S) | — | — | 6,369 | 2,130 | ||||||||||||
Redeemed | ||||||||||||||||
Common shares (Class I) | (258,989) | (732,496 | ) | (103,675) | (118,928 | ) | ||||||||||
Common shares (Class S) | — | — | (9,725) | (21,133 | ) | |||||||||||
|
|
|
|
|
|
|
| |||||||||
Net increase (decrease) | 785,192 | (297,345 | ) | (42,117) | 95,051 | |||||||||||
|
|
|
|
|
|
|
| |||||||||
| 3 | For the year ended June 30, 2018, the distributions to shareholders from net investment income for Mid Cap Growth Fund was $4,961, Small Cap Dividend Growth Fund for Class I was $131,227 and Class S was $26,774 and International Growth Fund was $197,000. Distributions from net realized long-term gains for Mid Cap Growth Fund was $6,517,375, Small Cap Growth Fund was $6,111,266 and Developing Markets Growth Fund was $159,864. |
| 4 | Effective December 31, 2018, the Securities and Exchange Commission eliminated the requirement to disclose end of year undistributed (distributions in excess of) net investment income. |
See accompanying notes to financial statements.
| ||
56 |
SIT MUTUAL FUNDS SEMI-ANNUAL REPORT |
| Sit Small Cap Growth Fund | Sit International Growth Fund | Sit Developing Markets Growth Fund | ||||||||||||||||||||
| Six Months Ended December 31, 2018, (Unaudited) | Year Ended June 30, 2018 | Six Months Ended December 31, 2018, (Unaudited) | Year Ended June 30, 2018 | Six Months Ended December 31, 2018, (Unaudited) | Year Ended June 30, 2018 | |||||||||||||||||
| ($226,600) | ($492,326 | ) | ($4,184) | $268,511 | $25,395 | $22,333 | ||||||||||||||||
| | 4,619,947 | 7,258,496 | 196,747 | 124,375 | 49,568 | 384,271 | ||||||||||||||||
| | (18,800,909) | 4,613,433 | (3,311,544) | 465,273 | (1,761,583) | 1,009,318 | ||||||||||||||||
|
|
|
|
|
|
|
|
|
|
|
| |||||||||||
| (14,407,562) | 11,379,603 | (3,118,981) | 858,159 | (1,686,620) | 1,415,922 | |||||||||||||||||
|
|
|
|
|
|
|
|
|
|
|
| |||||||||||
| (7,455,033) | (6,111,266 | )3 | (245,338) | (197,000 | )3 | (152,148) | (159,864 | )3 | ||||||||||||||
| — | — | — | — | — | — | |||||||||||||||||
|
|
|
|
|
|
|
|
|
|
|
| |||||||||||
| (7,455,033) | (6,111,266 | ) | (245,338) | (197,000 | ) | (152,148) | (159,864 | ) | ||||||||||||||
|
|
|
|
|
|
|
|
|
|
|
| |||||||||||
| 866,688 | 2,806,691 | 205,586 | 2,071,819 | 556,401 | 3,471,024 | |||||||||||||||||
| �� | — | — | — | — | — | — | ||||||||||||||||
| 7,320,824 | 6,006,115 | 240,593 | 195,219 | 149,028 | 156,935 | |||||||||||||||||
| — | — | — | — | — | — | |||||||||||||||||
| (3,334,639) | (4,859,660 | ) | (1,115,973) | (1,671,069 | ) | (654,999) | (3,417,750 | ) | ||||||||||||||
| — | — | — | — | — | — | |||||||||||||||||
|
|
|
|
|
|
|
|
|
|
|
| |||||||||||
| 4,852,873 | 3,953,146 | (669,794) | 595,969 | 50,430 | 210,209 | |||||||||||||||||
|
|
|
|
|
|
|
|
|
|
|
| |||||||||||
| (17,009,722) | 9,221,483 | (4,034,113) | 1,257,128 | (1,788,338) | 1,466,267 | |||||||||||||||||
| 100,038,227 | 90,816,744 | 23,875,142 | 22,618,014 | 11,027,382 | 9,561,115 | |||||||||||||||||
|
|
|
|
|
|
|
|
|
|
|
| |||||||||||
| $83,028,505 | $100,038,227 | $19,841,029 | $23,875,142 | $9,239,044 | $11,027,382 | |||||||||||||||||
|
|
|
|
|
|
|
|
|
|
|
| |||||||||||
| 15,220 | 49,608 | 12,288 | 117,785 | 33,168 | 203,007 | |||||||||||||||||
| — | — | — | — | — | — | |||||||||||||||||
| 163,960 | 109,659 | 16,872 | 11,344 | 10,495 | 9,353 | |||||||||||||||||
| — | — | — | — | — | — | |||||||||||||||||
| (60,390) | (85,821 | ) | (69,894) | (97,719 | ) | (42,056) | (200,671 | ) | ||||||||||||||
| — | — | — | — | — | — | |||||||||||||||||
|
|
|
|
|
|
|
|
|
|
|
| |||||||||||
| 118,790 | 73,446 | (40,734) | 31,410 | 1,607 | 11,689 | |||||||||||||||||
|
|
|
|
|
|
|
|
|
|
|
| |||||||||||
| ||||
DECEMBER 31, 2018 |
|
57 |
|
|
Per share income and capital changes for a share outstanding throughout the period. See accompanying notes to financial statements.
Sit Balanced Fund
| ||||||||||||||||||||||||
| Six Months Ended | ||||||||||||||||||||||||
| December 31, 2018 | Years Ended June 30, | |||||||||||||||||||||||
| (Unaudited) | 2018 | 2017 | 2016 | 2015 | 2014 | |||||||||||||||||||
| ||||||||||||||||||||||||
Net Asset Value: | ||||||||||||||||||||||||
Beginning of period | $23.76 | $22.71 | $20.40 | $21.54 | $21.01 | $18.42 | ||||||||||||||||||
|
| |||||||||||||||||||||||
Operations: | ||||||||||||||||||||||||
Net investment income1 | 0.16 | 0.25 | 0.25 | 0.26 | 0.25 | 0.27 | ||||||||||||||||||
Net realized and unrealized (losses) | (1.17) | 1.96 | 2.29 | 0.04 | 1.16 | 2.58 | ||||||||||||||||||
|
| |||||||||||||||||||||||
Total from operations | (1.01) | 2.21 | 2.54 | 0.30 | 1.41 | 2.85 | ||||||||||||||||||
|
| |||||||||||||||||||||||
Distributions to Shareholders: | ||||||||||||||||||||||||
From net investment income | (0.22) | (0.27) | (0.23) | (0.45) | (0.24) | (0.26 | ) | |||||||||||||||||
From net realized gains | (0.23) | (0.89) | — | (0.99) | (0.64) | — | ||||||||||||||||||
|
| |||||||||||||||||||||||
Total distributions | (0.45) | (1.16) | (0.23) | (1.44) | (0.88) | (0.26 | ) | |||||||||||||||||
|
| |||||||||||||||||||||||
Net Asset Value: | ||||||||||||||||||||||||
End of period | $22.30 | $23.76 | $22.71 | $20.40 | $21.54 | $21.01 | ||||||||||||||||||
|
| |||||||||||||||||||||||
Total investment return2 | (4.24%) | 9.84% | 12.56% | 1.47% | 6.86% | 15.58% | ||||||||||||||||||
|
| |||||||||||||||||||||||
Net assets at end of period (000’s omitted) | $32,981 | $37,541 | $25,242 | $23,511 | $22,970 | $15,645 | ||||||||||||||||||
Ratios:3 | ||||||||||||||||||||||||
Expenses | 1.00% | 1.00% | 1.00% | 1.00% | 1.00% | 1.00% | ||||||||||||||||||
Net investment income | 1.35% | 1.07% | 1.18% | 1.25% | 1.17% | 1.36% | ||||||||||||||||||
Portfolio turnover rate (excluding short-term securities) | 29.12%4 | 50.49% | 50.31% | 54.46% | 47.49% | 54.52% | ||||||||||||||||||
| 1 | The net investment income per share is based on average shares outstanding for the period. |
| 2 | Total investment return is based on the change in net asset value of a share during the period (not annualized) and assumes reinvestment of distributions at net asset value. |
| 3 | Ratios are annualized for periods less than one year. In addition to fees and expenses which the Fund bears directly, the Fund indirectly bears a pro rata share of the fees and expenses of the acquired funds in which it invests. Such indirect expenses are not included in the above reported expense ratios. |
| 4 | Not annualized. |
58 |
|
SIT MUTUAL FUNDS SEMI-ANNUAL REPORT |
|
|
FINANCIAL HIGHLIGHTS
Per share income and capital changes for a share outstanding throughout the period. See accompanying notes to financial statements.
Sit Dividend Growth Fund
| ||||||||||||||||||||||||
| Class I | Six Months Ended December 31, 2018 | Years Ended June 30, | ||||||||||||||||||||||
| (Unaudited) | 2018 | 2017 | 2016 | 2015 | 2014 | |||||||||||||||||||
| ||||||||||||||||||||||||
Net Asset Value: | ||||||||||||||||||||||||
Beginning of period. | $16.69 | $16.88 | $15.82 | $17.40 | $18.69 | $16.35 | ||||||||||||||||||
|
| |||||||||||||||||||||||
Operations: | ||||||||||||||||||||||||
Net investment income 1 | 0.22 | 0.26 | 0.24 | 0.26 | 0.25 | 0.26 | ||||||||||||||||||
Net realized and unrealized gains (losses) | (1.25) | 1.49 | 2.09 | 0.32 | 0.92 | 2.96 | ||||||||||||||||||
|
| |||||||||||||||||||||||
Total from operations | (1.03) | 1.75 | 2.33 | 0.58 | 1.17 | 3.22 | ||||||||||||||||||
|
| |||||||||||||||||||||||
Redemption fees 2 | — | — | — | — | — | — | ||||||||||||||||||
Distributions to Shareholders: | ||||||||||||||||||||||||
From net investment income | (0.34) | (0.26 | ) | (0.23 | ) | (0.32 | ) | (0.25 | ) | (0.25 | ) | |||||||||||||
From net realized gains | (2.77) | (1.68 | ) | (1.04 | ) | (1.84 | ) | (2.21 | ) | (0.63 | ) | |||||||||||||
|
| |||||||||||||||||||||||
Total distributions | (3.11) | (1.94 | ) | (1.27 | ) | (2.16 | ) | (2.46 | ) | (0.88 | ) | |||||||||||||
|
| |||||||||||||||||||||||
Net Asset Value: | ||||||||||||||||||||||||
End of period | $12.55 | $16.69 | $16.88 | $15.82 | $17.40 | $18.69 | ||||||||||||||||||
|
| |||||||||||||||||||||||
Total investment return 3 | (6.27%) | 10.36% | 15.41% | 3.94% | 6.39% | 20.26% | ||||||||||||||||||
|
| |||||||||||||||||||||||
Net assets at end of period (000’s omitted) | $421,531 | $918,584 | $1,015,920 | $942,244 | $955,460 | $1,017,106 | ||||||||||||||||||
Ratios: 4 | ||||||||||||||||||||||||
Expenses (without waiver) | 1.00%5 | 1.00%5 | 1.00% | 1.00% | 1.00% | 1.00% | ||||||||||||||||||
Expenses (with waiver) | 0.70%5 | 0.78%5 | 1.00% | 1.00% | 1.00% | 1.00% | ||||||||||||||||||
Net investment income (without waiver) | 2.26% | 1.31% | 1.49% | 1.64% | 1.39% | 1.50% | ||||||||||||||||||
Net investment income (with waiver) | 2.56% | 1.53% | 1.49% | 1.64% | 1.39% | 1.50% | ||||||||||||||||||
Portfolio turnover rate (excluding short-term securities) | 27.21%6 | 68.38% | 61.33% | 75.94% | 57.69% | 44.36% | ||||||||||||||||||
| 1 | The net investment income per share is based on average shares outstanding for the period. |
| 2 | Amount represents less than $0.01 per share. |
| 3 | Total investment return is based on the change in net asset value of a share during the period (not annualized) and assumes reinvestment of distributions at net asset value. |
| 4 | Ratios are annualized for periods less than one year. In addition to fees and expenses which the Fund bears directly, the Fund indirectly bears a pro rata share of the fees and expenses of the acquired funds in which it invests. Such indirect expenses are not included in the above reported expense ratios. |
| 5 | Total Fund expenses are limited to 1.00% of average daily net assets. However, during the period above, the investment advisor voluntarily absorbed expenses that were otherwise payable by the Fund. |
| 6 | Not annualized. |
DECEMBER 31, 2018 |
|
59 |
|
|
FINANCIAL HIGHLIGHTS
Per share income and capital changes for a share outstanding throughout the period. See accompanying notes to financial statements. (Continued)
Sit Dividend Growth Fund
| ||||||||||||||||||||||||
| Six Months Ended | ||||||||||||||||||||||||
| Class S | December 31, 2018 | Years Ended June 30, | ||||||||||||||||||||||
| (Unaudited) | 2018 | 2017 | 2016 | 2015 | 2014 | |||||||||||||||||||
| ||||||||||||||||||||||||
Net Asset Value: | ||||||||||||||||||||||||
Beginning of period | $16.61 | $16.81 | $15.76 | $17.34 | $18.63 | $16.29 | ||||||||||||||||||
|
| |||||||||||||||||||||||
Operations: | ||||||||||||||||||||||||
Net investment income 1 | 0.19 | 0.22 | 0.20 | 0.22 | 0.21 | �� | 0.22 | |||||||||||||||||
Net realized and unrealized gains (losses) | (1.23) | 1.47 | 2.08 | 0.32 | 0.91 | 2.96 | ||||||||||||||||||
|
| |||||||||||||||||||||||
Total from operations | (1.04) | 1.69 | 2.28 | 0.54 | 1.12 | 3.18 | ||||||||||||||||||
|
| |||||||||||||||||||||||
Redemption fees 2 | — | — | — | — | — | — | ||||||||||||||||||
|
| |||||||||||||||||||||||
Distributions to Shareholders: | ||||||||||||||||||||||||
From net investment income | (0.31) | (0.21 | ) | (0.19 | ) | (0.28 | ) | (0.20 | ) | (0.21 | ) | |||||||||||||
From net realized gains | (2.77) | (1.68 | ) | (1.04 | ) | (1.84 | ) | (2.21 | ) | (0.63 | ) | |||||||||||||
|
| |||||||||||||||||||||||
Total distributions | (3.08) | (1.89 | ) | (1.23 | ) | (2.12 | ) | (2.41 | ) | (0.84 | ) | |||||||||||||
|
| |||||||||||||||||||||||
Net Asset Value: | ||||||||||||||||||||||||
End of period | $12.49 | $16.61 | $16.81 | $15.76 | $17.34 | $18.63 | ||||||||||||||||||
|
| |||||||||||||||||||||||
Total investment return 3 | (6.37%) | 10.06% | 15.11% | 3.68% | 6.13% | 20.02% | ||||||||||||||||||
|
| |||||||||||||||||||||||
Net assets at end of period (000’s omitted) | $40,509 | $51,331 | $65,278 | $67,620 | $82,959 | $103,433 | ||||||||||||||||||
Ratios: 4 | ||||||||||||||||||||||||
Expenses (without waiver) | 1.25%5 | 1.25%5 | 1.25% | 1.25% | 1.25% | 1.25% | ||||||||||||||||||
Expenses (with waiver) | 0.95%5 | 1.03%5 | 1.25% | 1.25% | 1.25% | 1.25% | ||||||||||||||||||
Net investment income (without waiver) | 2.00% | 1.06% | 1.24% | 1.39% | 1.14% | 1.25% | ||||||||||||||||||
Net investment income (with waiver) | 2.30% | 1.28% | 1.24% | 1.39% | 1.14% | 1.25% | ||||||||||||||||||
Portfolio turnover rate (excluding short-term securities) | 27.21%6 | 68.38% | 61.33% | 75.94% | 57.69% | 44.36% | ||||||||||||||||||
| 1 | The net investment income per share is based on average shares outstanding for the period. |
| 2 | Amount represents less than $0.01 per share. |
| 3 | Total investment return is based on the change in net asset value of a share during the period (not annualized) and assumes reinvestment of distributions at net asset value. |
| 4 | Ratios are annualized for periods less than one year. In addition to fees and expenses which the Fund bears directly, the Fund indirectly bears a pro rata share of the fees and expenses of the acquired funds in which it invests. Such indirect expenses are not included in the above reported expense ratios. |
| 5 | Total Fund expenses are limited to 1.25% of average daily net assets. However, during the period above, the investment advisor voluntarily absorbed expenses that were otherwise payable by the Fund. |
| 6 | Not annualized. |
60 |
|
SIT MUTUAL FUNDS SEMI-ANNUAL REPORT |
|
|
FINANCIAL HIGHLIGHTS
Per share income and capital changes for a share outstanding throughout the period. See accompanying notes to financial statements.
Sit Global Dividend Growth Fund
| ||||||||||||||||||||||||
| Six Months Ended | ||||||||||||||||||||||||
| Class I | December 31, 2018 | Years Ended June 30, | ||||||||||||||||||||||
| (Unaudited) | 2018 | 2017 | 2016 | 2015 | 2014 | |||||||||||||||||||
| ||||||||||||||||||||||||
Net Asset Value: | ||||||||||||||||||||||||
Beginning of period | $15.24 | $14.54 | $13.19 | $14.80 | $15.74 | $14.27 | ||||||||||||||||||
|
| |||||||||||||||||||||||
Operations: | ||||||||||||||||||||||||
Net investment income 1 | 0.11 | 0.27 | 0.22 | 0.21 | 0.20 | 0.23 | ||||||||||||||||||
Net realized and unrealized gains (losses) | (1.00) | 0.67 | 1.34 | (0.48) | 0.13 | 2.09 | ||||||||||||||||||
|
| |||||||||||||||||||||||
Total from operations | (0.89) | 0.94 | 1.56 | (0.27) | 0.33 | 2.32 | ||||||||||||||||||
|
| |||||||||||||||||||||||
Redemption fees | — 2 | — | — | 2 | — | — | — | 2 | ||||||||||||||||
|
| |||||||||||||||||||||||
Distributions to Shareholders: | ||||||||||||||||||||||||
From net investment income | (0.22) | (0.24 | ) | (0.21 | ) | (0.34) | (0.20 | ) | (0.22 | ) | ||||||||||||||
From net realized gains | — | — | — | (1.00) | (1.07 | ) | (0.63 | ) | ||||||||||||||||
|
| |||||||||||||||||||||||
Total distributions | (0.22) | (0.24 | ) | (0.21 | ) | (1.34) | (1.27 | ) | (0.85 | ) | ||||||||||||||
|
| |||||||||||||||||||||||
Net Asset Value: | ||||||||||||||||||||||||
End of period | $14.13 | $15.24 | $14.54 | $13.19 | $14.80 | $15.74 | ||||||||||||||||||
|
| |||||||||||||||||||||||
Total investment return 3 | (5.95%) | 6.46% | 11.94% | (1.67%) | 2.19% | 16.76% | ||||||||||||||||||
|
| |||||||||||||||||||||||
Net assets at end of period (000’s omitted) | $26,687 | $28,778 | $25,623 | $22,333 | $21,424 | $21,467 | ||||||||||||||||||
Ratios: 4 | ||||||||||||||||||||||||
Expenses (without waiver) | 1.25%5 | 1.25%5 | 1.25% | 1.25% | 1.25% | 1.25% | ||||||||||||||||||
Expenses (with waiver) | 1.00%5 | 1.06%5 | 1.25% | 1.25% | 1.25% | 1.25% | ||||||||||||||||||
Net investment income (without waiver) | 1.21% | 1.59% | 1.63% | 1.56% | 1.33% | 1.55% | ||||||||||||||||||
Net investment income (with waiver) | 1.46% | 1.78% | 1.63% | 1.56% | 1.33% | 1.55% | ||||||||||||||||||
Portfolio turnover rate (excluding short-term securities) | 3.66%6 | 19.80% | 32.04% | 48.30% | 75.06% | 48.68% | ||||||||||||||||||
| 1 | The net investment income per share is based on average shares outstanding for the period. |
| 2 | Amount represents less than $0.01 per share. |
| 3 | Total investment return is based on the change in net asset value of a share during the period (not annualized) and assumes reinvestment of distributions at net asset value. |
| 4 | Ratios are annualized for periods less than one year. In addition to fees and expenses which the Fund bears directly, the Fund indirectly bears a pro rata share of the fees and expenses of the acquired funds in which it invests. Such indirect expenses are not included in the above reported expense ratios. |
| 5 | Total Fund expenses are limited to 1.25% of average daily net assets. However, during the period above, the investment advisor voluntarily absorbed expenses that were otherwise payable by the Fund. |
| 6 | Not annualized. |
DECEMBER 31, 2018 |
|
61 |
|
|
FINANCIAL HIGHLIGHTS
Per share income and capital changes for a share outstanding throughout the period. See accompanying notes to financial statements. (Continued)
Sit Global Dividend Growth Fund
| ||||||||||||||||||||||||
| Six Months Ended | ||||||||||||||||||||||||
| Class S | December 31, 2018 | Years Ended June 30, | ||||||||||||||||||||||
| (Unaudited) | 2018 | 2017 | 2016 | 2015 | 2014 | |||||||||||||||||||
| ||||||||||||||||||||||||
Net Asset Value: | ||||||||||||||||||||||||
Beginning of period | $15.22 | $14.53 | $13.18 | $14.78 | $15.72 | $14.25 | ||||||||||||||||||
|
| |||||||||||||||||||||||
Operations: | ||||||||||||||||||||||||
Net investment income 1 | 0.09 | 0.23 | 0.19 | 0.18 | 0.16 | 0.20 | ||||||||||||||||||
Net realized and unrealized gains (losses) | (1.00) | 0.66 | 1.33 | (0.48) | 0.13 | 2.09 | ||||||||||||||||||
|
| |||||||||||||||||||||||
Total from operations | (0.91) | 0.89 | 1.52 | (0.30) | 0.29 | 2.29 | ||||||||||||||||||
|
| |||||||||||||||||||||||
Redemption fees | — | — | — | — | — | — | 2 | |||||||||||||||||
|
| |||||||||||||||||||||||
Distributions to Shareholders: | ||||||||||||||||||||||||
From net investment income | (0.19) | (0.20 | ) | (0.17 | ) | (0.30) | (0.16 | ) | (0.19 | ) | ||||||||||||||
From net realized gains | — | — | — | (1.00) | (1.07 | ) | (0.63 | ) | ||||||||||||||||
|
| |||||||||||||||||||||||
Total distributions | (0.19) | (0.20 | ) | (0.17 | ) | (1.30) | (1.23 | ) | (0.82 | ) | ||||||||||||||
|
| |||||||||||||||||||||||
Net Asset Value: | ||||||||||||||||||||||||
End of period | $14.12 | $15.22 | $14.53 | $13.18 | $14.78 | $15.72 | ||||||||||||||||||
|
| |||||||||||||||||||||||
Total investment return 3 | (6.08%) | 6.13% | 11.67% | (1.89%) | 2.00% | 16.49% | ||||||||||||||||||
|
| |||||||||||||||||||||||
Net assets at end of period (000’s omitted) | $2,798 | $3,246 | $3,274 | $2,861 | $3,451 | $3,323 | ||||||||||||||||||
Ratios: 4 | ||||||||||||||||||||||||
Expenses (without waiver) | 1.50%5 | 1.50%5 | 1.50% | 1.50% | 1.50% | 1.50% | ||||||||||||||||||
Expenses (with waiver) | 1.25%5 | 1.31%5 | 1.50% | 1.50% | 1.50% | 1.50% | ||||||||||||||||||
Net investment income (without waiver) | 0.96% | 1.33% | 1.38% | 1.31% | 1.08% | 1.30% | ||||||||||||||||||
Net investment income (with waiver) | 1.21% | 1.52% | 1.38% | 1.31% | 1.08% | 1.30% | ||||||||||||||||||
Portfolio turnover rate (excluding short-term securities) | 3.66%6 | 19.80% | 32.04% | 48.30% | 75.06% | 48.68% | ||||||||||||||||||
| 1 | The net investment income per share is based on average shares outstanding for the period. |
| 2 | Amount represents less than $0.01 per share. |
| 3 | Total investment return is based on the change in net asset value of a share during the period (not annualized) and assumes reinvestment of distributions at net asset value. |
| 4 | Ratios are annualized for periods less than one year. In addition to fees and expenses which the Fund bears directly, the Fund indirectly bears a pro rata share of the fees and expenses of the acquired funds in which it invests. Such indirect expenses are not included in the above reported expense ratios. |
| 5 | Total Fund expenses are limited to 1.50% of average daily net assets. However, during the period above, the investment advisor voluntarily absorbed expenses that were otherwise payable by the Fund. |
| 6 | Not annualized. |
62 |
|
SIT MUTUAL FUNDS SEMI-ANNUAL REPORT |
|
FINANCIAL HIGHLIGHTS
Per share income and capital changes for a share outstanding throughout the period. See accompanying notes to financial statements.
Sit Large Cap Growth Fund
| ||||||||||||||||||||||||
| Six Months Ended December 31, 2018 | Years Ended June 30, | |||||||||||||||||||||||
| (Unaudited) | 2018 | 2017 | 2016 | 2015 | 2014 | |||||||||||||||||||
| ||||||||||||||||||||||||
Net Asset Value: | ||||||||||||||||||||||||
Beginning of period | $42.40 | $40.56 | $36.02 | $47.21 | $52.51 | $47.53 | ||||||||||||||||||
|
| |||||||||||||||||||||||
Operations: | ||||||||||||||||||||||||
Net investment income 1 | 0.08 | 0.13 | 0.21 | 0.18 | 0.20 | 0.29 | ||||||||||||||||||
Net realized and unrealized gains (losses) | (3.18) | 6.55 | 7.07 | (0.42) | 5.04 | 10.23 | ||||||||||||||||||
|
| |||||||||||||||||||||||
Total from operations | (3.10) | 6.68 | 7.28 | (0.24) | 5.24 | 10.52 | ||||||||||||||||||
|
| |||||||||||||||||||||||
Redemption fees 2 | — | — | — | — | — | — | ||||||||||||||||||
|
| |||||||||||||||||||||||
Distributions to Shareholders: | ||||||||||||||||||||||||
From net investment income | (0.15) | (0.17 | ) | (0.19 | ) | (1.44) | (0.24 | ) | (0.39 | ) | ||||||||||||||
From net realized gains | (3.49) | (4.67 | ) | (2.55 | ) | (9.51) | (10.30 | ) | (5.15 | ) | ||||||||||||||
|
| |||||||||||||||||||||||
Total distributions | (3.64) | (4.84 | ) | (2.74 | ) | (10.95) | (10.54 | ) | (5.54 | ) | ||||||||||||||
|
| |||||||||||||||||||||||
Net Asset Value: | ||||||||||||||||||||||||
End of period | $35.66 | $42.40 | $40.56 | $36.02 | $47.21 | $52.51 | ||||||||||||||||||
|
| |||||||||||||||||||||||
Total investment return 3 | (7.31%) | 16.93% | 21.18% | (0.89%) | 10.62% | 22.92% | ||||||||||||||||||
|
| |||||||||||||||||||||||
Net assets at end of period (000’s omitted) | $105,063 | $118,792 | $113,620 | $117,459 | $144,807 | $188,574 | ||||||||||||||||||
Ratios: 4 | ||||||||||||||||||||||||
Expenses | 1.00% | 1.00% | 1.00% | 1.00% | 1.00% | 1.00% | ||||||||||||||||||
Net investment income | 0.39% | 0.30% | 0.54% | 0.44% | 0.41% | 0.57% | ||||||||||||||||||
Portfolio turnover rate (excluding short-term securities) | 6.72%5 | 15.20% | 17.69% | 20.05% | 24.04% | 27.34% | ||||||||||||||||||
| 1 | The net investment income per share is based on average shares outstanding for the period. |
| 2 | Amount represents less than $0.01 per share. |
| 3 | Total investment return is based on the change in net asset value of a share during the period (not annualized) and assumes reinvestment of distributions at net asset value. |
| 4 | Ratios are annualized for periods less than one year. In addition to fees and expenses which the Fund bears directly, the Fund indirectly bears a pro rata share of the fees and expenses of the acquired funds in which it invests. Such indirect expenses are not included in the above reported expense ratios. |
| 5 | Not annualized. |
| ||||
DECEMBER 31, 2018 |
|
63 |
|
|
FINANCIAL HIGHLIGHTS
Per share income and capital changes for a share outstanding throughout the period. See accompanying notes to financial statements.
Sit ESG Growth Fund
| ||||||||||||
| Class I | Six Months Ended December 31, 2018 | Year Ended | Year Ended | |||||||||
| (Unaudited) | June 30, 2018 | June 30, 2017 * | ||||||||||
| ||||||||||||
Net Asset Value: | ||||||||||||
Beginning of period | $12.37 | $11.29 | $10.00 | |||||||||
|
| |||||||||||
Operations: | ||||||||||||
Net investment income1 | 0.06 | 0.16 | 0.11 | |||||||||
Net realized and unrealized gains (losses) | (0.87) | 1.03 | 1.20 | |||||||||
|
| |||||||||||
Total from operations | (0.81) | 1.19 | 1.31 | |||||||||
|
| |||||||||||
Distributions to Shareholders: | ||||||||||||
From net investment income | (0.16) | (0.11) | (0.02) | |||||||||
|
| |||||||||||
Net Asset Value: | ||||||||||||
End of period | $11.40 | $12.37 | $11.29 | |||||||||
|
| |||||||||||
Total investment return2 | (6.54%) | 10.57% | 13.13% | |||||||||
|
| |||||||||||
Net assets at end of period (000’s omitted) | $2,918 | $3,041 | $2,349 | |||||||||
Ratios:3 | ||||||||||||
Expenses (without waiver) | 1.25%4 | 1.25%4 | 1.25% | |||||||||
Expenses (with waiver) | 1.00%4 | 1.06%4 | 1.25% | |||||||||
Net investment income (without waiver) | 0.77% | 1.10% | 1.01% | |||||||||
Net investment income (with waiver) | 1.02% | 1.29% | 1.01% | |||||||||
Portfolio turnover rate (excluding short-term securities) | 1.60%5 | 14.97% | 27.60% | |||||||||
| * | The Fund commenced investment operations on June 30, 2016. |
| 1 | The net investment income per share is based on average shares outstanding for the period. |
| 2 | Total investment return is based on the change in net asset value of a share during the period (not annualized) and assumes reinvestment of distributions at net asset value. |
| 3 | Ratios are annualized for periods less than one year. In addition to fees and expenses which the Fund bears directly, the Fund indirectly bears a pro rata share of the fees and expenses of the acquired funds in which it invests. Such indirect expenses are not included in the above reported expense ratios. |
| 4 | Total Fund expenses are limited to 1.25% of average daily net assets. However, during the period above, the investment advisor voluntarily absorbed expenses that were otherwise payable by the Fund. |
| 5 | Not annualized. |
64 |
|
SIT MUTUAL FUNDS SEMI-ANNUAL REPORT |
|
FINANCIAL HIGHLIGHTS
Per share income and capital changes for a share outstanding throughout the period. See accompanying notes to financial statements. (Continued)
Sit ESG Growth Fund
| ||||||||||||
| Class S | Six Months Ended December 31, 2018 | Year Ended | Year Ended | |||||||||
| (Unaudited) | June 30, 2018 | June 30, 2017 * | ||||||||||
| ||||||||||||
Net Asset Value: | ||||||||||||
Beginning of period | $12.34 | $11.28 | $10.00 | |||||||||
|
| |||||||||||
Operations: | ||||||||||||
Net investment income1 | 0.05 | 0.13 | 0.08 | |||||||||
Net realized and unrealized gains (losses) | (0.87) | 1.03 | 1.21 | |||||||||
|
| |||||||||||
Total from operations | (0.82) | 1.16 | 1.29 | |||||||||
|
| |||||||||||
Distributions to Shareholders: | ||||||||||||
From net investment income | (0.15) | (0.10) | (0.01) | |||||||||
|
| |||||||||||
Net Asset Value: | ||||||||||||
End of period | $11.37 | $12.34 | $11.28 | |||||||||
|
| |||||||||||
Total investment return2 | (6.68%) | 10.37% | 12.79% | |||||||||
|
| |||||||||||
Net assets at end of period (000’s omitted) | $2,498 | $2,660 | $2,321 | |||||||||
Ratios:3 | ||||||||||||
Expenses (without waiver) | 1.50%4 | 1.50%4 | 1.50% | |||||||||
Expenses (with waiver) | 1.25%4 | 1.31%4 | 1.50% | |||||||||
Net investment income (without waiver) | 0.53% | 0.84% | 0.76% | |||||||||
Net investment income (with waiver) | 0.78% | 1.03% | 0.76% | |||||||||
Portfolio turnover rate (excluding short-term securities) | 1.60%5 | 14.97% | 27.60% | |||||||||
| * | The Fund commenced investment operations on June 30, 2016. |
| 1 | The net investment income per share is based on average shares outstanding for the period. |
| 2 | Total investment return is based on the change in net asset value of a share during the period (not annualized) and assumes reinvestment of distributions at net asset value. |
| 3 | Ratios are annualized for periods less than one year. In addition to fees and expenses which the Fund bears directly, the Fund indirectly bears a pro rata share of the fees and expenses of the acquired funds in which it invests. Such indirect expenses are not included in the above reported expense ratios. |
| 4 | Total Fund expenses are limited to 1.50% of average daily net assets. However, during the period above, the investment advisor voluntarily absorbed expenses that were otherwise payable by the Fund. |
| 5 | Not annualized. |
DECEMBER 31, 2018 |
|
65 |
|
FINANCIAL HIGHLIGHTS
Per share income and capital changes for a share outstanding throughout the period. See accompanying notes to financial statements.
Sit Mid Cap Growth Fund
| ||||||||||||||||||||||||
| Six Months Ended | ||||||||||||||||||||||||
| December 31, 2018 | Years Ended June 30, | |||||||||||||||||||||||
| (Unaudited) | 2018 | 2017 | 2016 | 2015 | 2014 | |||||||||||||||||||
| ||||||||||||||||||||||||
Net Asset Value: | ||||||||||||||||||||||||
Beginning of period | $18.96 | $18.06 | $15.36 | $20.22 | $21.08 | $17.69 | ||||||||||||||||||
|
| |||||||||||||||||||||||
Operations: | ||||||||||||||||||||||||
Net investment loss1 | (0.01) | (0.03) | — | 2 | (0.04) | (0.06) | (0.07) | |||||||||||||||||
Net realized and unrealized gains (losses) | (1.93) | 1.71 | 2.86 | (1.92) | 1.91 | 4.54 | ||||||||||||||||||
|
| |||||||||||||||||||||||
Total from operations | (1.94) | 1.68 | 2.86 | (1.96) | 1.85 | 4.47 | ||||||||||||||||||
|
| |||||||||||||||||||||||
Redemption fees2 | — | — | — | — | — | — | ||||||||||||||||||
|
| |||||||||||||||||||||||
Distributions to Shareholders: | ||||||||||||||||||||||||
From net investment income | — | — | 2 | — | — | — | — | |||||||||||||||||
From net realized gains | (1.88) | (0.78) | (0.16) | (2.90) | (2.71) | (1.08) | ||||||||||||||||||
|
| |||||||||||||||||||||||
Total distributions | (1.88) | (0.78) | (0.16) | (2.90) | (2.71) | (1.08) | ||||||||||||||||||
|
| |||||||||||||||||||||||
Net Asset Value: | ||||||||||||||||||||||||
End of period | $15.14 | $18.96 | $18.06 | $15.36 | $20.22 | $21.08 | ||||||||||||||||||
|
| |||||||||||||||||||||||
Total investment return3 | (10.19%) | 9.42% | 18.74% | (9.97%) | 9.52% | 25.58% | ||||||||||||||||||
|
| |||||||||||||||||||||||
Net assets at end of period (000’s omitted) | $138,455 | $158,501 | $156,305 | $139,523 | $171,854 | $180,276 | ||||||||||||||||||
Ratios:4 | ||||||||||||||||||||||||
Expenses | 1.25% | 1.25% | 1.25% | 1.25% | 1.25% | 1.25% | ||||||||||||||||||
Net investment loss | (0.12%) | (0.17%) | (0.01%) | (0.23%) | (0.30%) | (0.37%) | ||||||||||||||||||
Portfolio turnover rate (excluding short-term securities) | 13.45%5 | 28.89% | 23.02% | 21.57% | 23.39% | 27.65% | ||||||||||||||||||
| 1 | The net investment income (loss) per share is based on average shares outstanding for the period. |
| 2 | Amount represents less than $0.01 per share. |
| 3 | Total investment return is based on the change in net asset value of a share during the period (not annualized) and assumes reinvestment of distributions at net asset value. |
| 4 | Ratios are annualized for periods less than one year. In addition to fees and expenses which the Fund bears directly, the Fund indirectly bears a pro rata share of the fees and expenses of the acquired funds in which it invests. Such indirect expenses are not included in the above reported expense ratios. |
| 5 | Not annualized. |
66 |
|
SIT MUTUAL FUNDS SEMI-ANNUAL REPORT |
|
FINANCIAL HIGHLIGHTS
Per share income and capital changes for a share outstanding throughout the period. See accompanying notes to financial statements.
Sit Small Cap Dividend Growth Fund
| ||||||||||||||||||||
| Class I | Six Months Ended December 31, 2018 | Year Ended | Year Ended | Year Ended | Three Months Ended | |||||||||||||||
| (Unaudited) | June 30, 2018 | June 30, 2017 | June 30, 2016 | June 30, 2015 * | ||||||||||||||||
| ||||||||||||||||||||
Net Asset Value: | ||||||||||||||||||||
Beginning of period | $12.27 | $11.47 | $10.00 | $9.96 | $10.00 | |||||||||||||||
|
| |||||||||||||||||||
Operations: | ||||||||||||||||||||
Net investment income1 | 0.08 | 0.11 | 0.12 | 0.14 | 0.02 | |||||||||||||||
Net realized and unrealized gains (losses) | (2.05) | 0.80 | 1.46 | 0.02 | (0.06) | |||||||||||||||
|
| |||||||||||||||||||
Total from operations | (1.97) | 0.91 | 1.58 | 0.16 | (0.04) | |||||||||||||||
|
| |||||||||||||||||||
Distributions to Shareholders: | ||||||||||||||||||||
From net investment income | (0.11) | (0.11) | (0.11) | (0.12) | — | |||||||||||||||
From net realized gains | (0.13) | — | — | — | 2 | — | ||||||||||||||
|
| |||||||||||||||||||
Total distributions | (0.24) | (0.11) | (0.11) | (0.12) | — | |||||||||||||||
|
| |||||||||||||||||||
Net Asset Value: | ||||||||||||||||||||
End of period | $10.06 | $12.27 | $11.47 | $10.00 | $9.96 | |||||||||||||||
|
| |||||||||||||||||||
Total investment return3 | (16.13%) | 8.00% | 15.84% | 1.71% | (0.40%) | |||||||||||||||
|
| |||||||||||||||||||
Net assets at end of period (000’s omitted) | $11,412 | $14,597 | $12,716 | $5,777 | $3,708 | |||||||||||||||
Ratios:4 | ||||||||||||||||||||
Expenses (without waiver) | 1.25%5 | 1.25%5 | 1.25% | 1.25% | 1.25% | |||||||||||||||
Expenses (with waiver) | 1.00%5 | 1.06%5 | 1.25% | 1.25% | 1.25% | |||||||||||||||
Net investment income (without waiver) | 1.09% | 0.75% | 1.06% | 1.46% | 0.98% | |||||||||||||||
Net investment income (with waiver) | 1.34% | 0.94% | 1.06% | 1.46% | 0.98% | |||||||||||||||
Portfolio turnover rate (excluding short-term securities) | 17.21%6 | 29.74% | 19.57% | 26.43% | 2.63%6 | |||||||||||||||
| * | The Fund commenced investment operations on March 31, 2015. |
| 1 | The net investment income per share is based on average shares outstanding for the period. |
| 2 | Amount represents less than $0.01 per share. |
| 3 | Total investment return is based on the change in net asset value of a share during the period (not annualized) and assumes reinvestment of distributions at net asset value. |
| 4 | Ratios are annualized for periods less than one year. In addition to fees and expenses which the Fund bears directly, the Fund indirectly bears a pro rata share of the fees and expenses of the acquired funds in which it invests. Such indirect expenses are not included in the above reported expense ratios. |
| 5 | Total Fund expenses are limited to 1.25% of average daily net assets. However, during the period above, the investment advisor voluntarily absorbed expenses that were otherwise payable by the Fund. |
| 6 | Not annualized. |
DECEMBER 31, 2018 |
|
67 |
|
|
FINANCIAL HIGHLIGHTS
Per share income and capital changes for a share outstanding throughout the period. See accompanying notes to financial statements. (Continued)
Sit Small Cap Dividend Growth Fund
| ||||||||||||||||||||
| Class S | Six Months Ended December 31, 2018 | Year Ended | Year Ended | Year Ended | Three Months Ended | |||||||||||||||
| (Unaudited) | June 30, 2018 | June 30, 2017 | June 30, 2016 | June 30, 2015 * | ||||||||||||||||
| ||||||||||||||||||||
Net Asset Value: | ||||||||||||||||||||
Beginning of period | $12.26 | $11.46 | $10.00 | $9.96 | $10.00 | |||||||||||||||
|
| |||||||||||||||||||
Operations: | ||||||||||||||||||||
Net investment income1 | 0.07 | 0.08 | 0.09 | 0.11 | 0.02 | |||||||||||||||
Net realized and unrealized gains (losses) | (2.05) | 0.80 | 1.45 | 0.03 | (0.06) | |||||||||||||||
|
| |||||||||||||||||||
Total from operations | (1.98) | 0.88 | 1.54 | 0.14 | (0.04) | |||||||||||||||
|
| |||||||||||||||||||
Distributions to Shareholders: | ||||||||||||||||||||
From net investment income | (0.09) | (0.08) | (0.08) | (0.10) | — | |||||||||||||||
From net realized gains | (0.13) | — | — | — | 2 | — | ||||||||||||||
|
| |||||||||||||||||||
Total distributions | (0.22) | (0.08) | (0.08) | (0.10) | — | |||||||||||||||
|
| |||||||||||||||||||
Net Asset Value: | ||||||||||||||||||||
End of period | $10.06 | $12.26 | $11.46 | $10.00 | $9.96 | |||||||||||||||
|
| |||||||||||||||||||
Total investment return3 | (16.22%) | 7.74% | 15.46% | 1.46% | (0.40%) | |||||||||||||||
|
| |||||||||||||||||||
Net assets at end of period (000’s omitted) | $3,317 | $3,882 | $3,461 | $2,587 | $2,230 | |||||||||||||||
Ratios:4 | ||||||||||||||||||||
Expenses (without waiver) | 1.50%5 | 1.50%5 | 1.50% | 1.50% | 1.50% | |||||||||||||||
Expenses (with waiver) | 1.25%5 | 1.31%5 | 1.50% | 1.50% | 1.50% | |||||||||||||||
Net investment income (without waiver) | 0.85% | 0.51% | 0.81% | 1.21% | 0.73% | |||||||||||||||
Net investment income (with waiver) | 1.10% | 0.70% | 0.81% | 1.21% | 0.73% | |||||||||||||||
Portfolio turnover rate (excluding short-term securities) | 17.21%6 | 29.74% | 19.57% | 26.43% | 2.63%6 | |||||||||||||||
| * | The Fund commenced investment operations on March 31, 2015. |
| 1 | The net investment income per share is based on average shares outstanding for the period. |
| 2 | Amount represents less than $0.01 per share. |
| 3 | Total investment return is based on the change in net asset value of a share during the period (not annualized) and assumes reinvestment of distributions at net asset value. |
| 4 | Ratios are annualized for periods less than one year. In addition to fees and expenses which the Fund bears directly, the Fund indirectly bears a pro rata share of the fees and expenses of the acquired funds in which it invests. Such indirect expenses are not included in the above reported expense ratios. |
| 5 | Total Fund expenses are limited to 1.50% of average daily net assets. However, during the period above, the investment advisor voluntarily absorbed expenses that were otherwise payable by the Fund. |
| 6 | Not annualized. |
68 |
|
SIT MUTUAL FUNDS SEMI-ANNUAL REPORT |
|
FINANCIAL HIGHLIGHTS
Per share income and capital changes for a share outstanding throughout the period. See accompanying notes to financial statements.
Sit Small Cap Growth Fund
| ||||||||||||||||||||||||
| Six Months Ended | ||||||||||||||||||||||||
| December 31, 2018 | Years Ended June 30, | |||||||||||||||||||||||
| (Unaudited) | 2018 | 2017 | 2016 | 2015 | 2014 | |||||||||||||||||||
| ||||||||||||||||||||||||
Net Asset Value: | ||||||||||||||||||||||||
Beginning of period | $57.18 | $54.18 | $45.59 | $60.10 | $61.38 | $50.08 | ||||||||||||||||||
|
| |||||||||||||||||||||||
Operations: | ||||||||||||||||||||||||
Net investment loss1 | (0.13) | (0.29 | ) | (0.24 | ) | (0.33 | ) | (0.48 | ) | (0.55 | ) | |||||||||||||
Net realized and unrealized gains (losses) | (8.26) | 7.01 | 8.91 | (8.97 | ) | 6.26 | 11.85 | |||||||||||||||||
|
| |||||||||||||||||||||||
Total from operations | (8.39) | 6.72 | 8.67 | (9.30 | ) | 5.78 | 11.30 | |||||||||||||||||
|
| |||||||||||||||||||||||
Redemption fees2 | — | — | — | — | — | — | ||||||||||||||||||
|
| |||||||||||||||||||||||
Distributions to Shareholders: | ||||||||||||||||||||||||
From net realized gains | (4.35) | (3.72 | ) | (0.08 | ) | (5.21 | ) | (7.06 | ) | — | ||||||||||||||
|
| |||||||||||||||||||||||
Net Asset Value: | ||||||||||||||||||||||||
End of period | $44.44 | $57.18 | $54.18 | $45.59 | $60.10 | $61.38 | ||||||||||||||||||
|
| |||||||||||||||||||||||
Total investment return3 | (14.70%) | 12.68% | 19.06% | (16.00% | ) | 10.38% | 22.56% | |||||||||||||||||
|
| |||||||||||||||||||||||
Net assets at end of period (000’s omitted) | $83,029 | $100,038 | $90,817 | $81,209 | $103,816 | $99,510 | ||||||||||||||||||
Ratios:4 | ||||||||||||||||||||||||
Expenses | 1.50% | 1.50% | 1.50% | 1.50% | 1.50% | 1.50% | ||||||||||||||||||
Net investment loss | (0.46%) | (0.51% | ) | (0.47% | ) | (0.65% | ) | (0.81% | ) | (0.94% | ) | |||||||||||||
Portfolio turnover rate (excluding short-term securities) | 13.89%5 | 29.01% | 29.08% | 27.37% | 31.07% | 33.38% | ||||||||||||||||||
| 1 | The net investment income (loss) per share is based on average shares outstanding for the period. |
| 2 | Amount represents less than $0.01 per share. |
| 3 | Total investment return is based on the change in net asset value of a share during the period (not annualized) and assumes reinvestment of distributions at net asset value. |
| 4 | Ratios are annualized for periods less than one year. In addition to fees and expenses which the Fund bears directly, the Fund indirectly bears a pro rata share of the fees and expenses of the acquired funds in which it invests. Such indirect expenses are not included in the above reported expense ratios. |
| 5 | Not annualized. |
DECEMBER 31, 2018 |
|
69 |
|
|
FINANCIAL HIGHLIGHTS
Per share income and capital changes for a share outstanding throughout the period. See accompanying notes to financial statements.
Sit International Growth Fund
| ||||||||||||||||||||||||
| Six Months Ended | ||||||||||||||||||||||||
| December 31, 2018 | Years Ended June 30, | |||||||||||||||||||||||
| (Unaudited) | 2018 | 2017 | 2016 | 2015 | 2014 | |||||||||||||||||||
| ||||||||||||||||||||||||
Net Asset Value: | ||||||||||||||||||||||||
Beginning of period. | $16.75 | $16.23 | $14.48 | $16.92 | $17.44 | $15.05 | ||||||||||||||||||
|
| |||||||||||||||||||||||
Operations: | ||||||||||||||||||||||||
Net investment income (loss)1 | —2 | 0.19 | 0.14 | 0.12 | 0.09 | 0.28 | ||||||||||||||||||
Net realized and unrealized gains (losses) | (2.24) | 0.47 | 1.68 | (1.47 | ) | (0.34 | ) | 2.28 | ||||||||||||||||
|
| |||||||||||||||||||||||
Total from operations | (2.24) | 0.66 | 1.82 | (1.35 | ) | (0.25 | ) | 2.56 | ||||||||||||||||
|
| |||||||||||||||||||||||
Redemption fees | — | — | 2 | — | 2 | — | — | — | ||||||||||||||||
|
| |||||||||||||||||||||||
Distributions to Shareholders: | ||||||||||||||||||||||||
From net investment income | (0.18) | (0.14 | ) | (0.07 | ) | (0.09 | ) | (0.27 | ) | (0.17 | ) | |||||||||||||
From net realized gains | — | — | — | (1.00 | ) | — | — | |||||||||||||||||
|
| |||||||||||||||||||||||
Total distributions | (0.18) | (0.14 | ) | (0.07 | ) | (1.09 | ) | (0.27 | ) | (0.17 | ) | |||||||||||||
|
| |||||||||||||||||||||||
Net Asset Value: | ||||||||||||||||||||||||
End of period. | $14.33 | $16.75 | $16.23 | $14.48 | $16.92 | $17.44 | ||||||||||||||||||
|
| |||||||||||||||||||||||
Total investment return3 | (13.37%) | 4.06% | 12.64% | (8.19% | ) | (1.35% | ) | 17.06% | ||||||||||||||||
|
| |||||||||||||||||||||||
Net assets at end of period (000’s omitted) | $19,841 | $23,875 | $22,618 | $20,440 | $22,485 | $24,127 | ||||||||||||||||||
Ratios:4 | ||||||||||||||||||||||||
Expenses | 1.50% | 1.50% | 1.50% | 1.50% | 1.50% | 1.50% | ||||||||||||||||||
Net investment income (loss) | (0.04%) | 1.11% | 0.97% | 0.76% | 0.55% | 1.69% | ||||||||||||||||||
Portfolio turnover rate (excluding short-term securities) | 9.95%5 | 16.35% | 39.23% | 37.94% | 56.97% | 46.91% | ||||||||||||||||||
| 1 | The net investment income per share is based on average shares outstanding for the period. |
| 2 | Amount represents less than $0.01 per share. |
| 3 | Total investment return is based on the change in net asset value of a share during the period (not annualized) and assumes reinvestment of distributions at net asset value. |
| 4 | Ratios are annualized for periods less than one year. In addition to fees and expenses which the Fund bears directly, the Fund indirectly bears a pro rata share of the fees and expenses of the acquired funds in which it invests. Such indirect expenses are not included in the above reported expense ratios. |
| 5 | Not annualized. |
70 |
|
SIT MUTUAL FUNDS SEMI-ANNUAL REPORT |
|
FINANCIAL HIGHLIGHTS
Per share income and capital changes for a share outstanding throughout the period. See accompanying notes to financial statements.
Sit Developing Markets Growth Fund
| ||||||||||||||||||||||||
| Six Months Ended | ||||||||||||||||||||||||
| December 31, 2018 | Years Ended June 30, | |||||||||||||||||||||||
| (Unaudited) | 2018 | 2017 | 2016 | 2015 | 2014 | |||||||||||||||||||
| ||||||||||||||||||||||||
Net Asset Value: | ||||||||||||||||||||||||
Beginning of period | $17.25 | $15.23 | $12.26 | $14.77 | $17.48 | $16.40 | ||||||||||||||||||
|
| |||||||||||||||||||||||
Operations: | ||||||||||||||||||||||||
Net investment income (loss)1 | 0.04 | 0.03 | (0.02 | ) | 0.04 | 0.03 | (0.01 | ) | ||||||||||||||||
Net realized and unrealized gains (losses) | (2.64) | 2.24 | 3.02 | (2.18 | ) | (1.41 | ) | 2.07 | ||||||||||||||||
|
| |||||||||||||||||||||||
Total from operations | (2.60) | 2.27 | 3.00 | (2.14 | ) | (1.38 | ) | 2.06 | ||||||||||||||||
|
| |||||||||||||||||||||||
Redemption fees | — 2 | — | 2 | — | — | 2 | — | — | ||||||||||||||||
|
| |||||||||||||||||||||||
Distributions to Shareholders: | ||||||||||||||||||||||||
From net investment income | (0.08) | — | (0.03 | ) | (0.02 | ) | — | (0.03 | ) | |||||||||||||||
From net realized gains | (0.16) | (0.25 | ) | — | (0.35 | ) | (1.33 | ) | (0.95 | ) | ||||||||||||||
|
| |||||||||||||||||||||||
Total distributions | (0.24) | (0.25 | ) | (0.03 | ) | (0.37 | ) | (1.33 | ) | (0.98 | ) | |||||||||||||
|
| |||||||||||||||||||||||
Net Asset Value: | ||||||||||||||||||||||||
End of period | $14.41 | $17.25 | $15.23 | $12.26 | $14.77 | $17.48 | ||||||||||||||||||
|
| |||||||||||||||||||||||
Total investment return3 | (15.04%) | 14.94% | 24.56% | (14.42% | ) | (7.64% | ) | 12.79% | ||||||||||||||||
|
| |||||||||||||||||||||||
Net assets at end of period (000’s omitted) | $9,239 | $11,027 | $9,561 | $7,297 | $9,192 | $10,808 | ||||||||||||||||||
Ratios:4 | ||||||||||||||||||||||||
Expenses (without waiver) | 2.00%5 | 2.00% | 5 | 2.00% | 2.00% | 2.00% | 2.00% | |||||||||||||||||
Expenses (with waiver) | 1.40%5 | 1.54% | 5 | 2.00% | 2.00% | 2.00% | 2.00% | |||||||||||||||||
Net investment income (loss) (without waiver) | (0.11%) | (0.26% | ) | (0.18% | ) | 0.31% | 0.16% | (0.07% | ) | |||||||||||||||
Net investment income (loss) (with waiver) | 0.49% | 0.20% | (0.18% | ) | 0.31% | 0.16% | (0.07% | ) | ||||||||||||||||
Portfolio turnover rate (excluding short-term securities) | 6.20%6 | 30.30% | 19.67% | 28.14% | 21.51% | 21.45% | ||||||||||||||||||
| 1 | The net investment income (loss) per share is based on average shares outstanding for the period. |
| 2 | Amount represents less than $0.01 per share. |
| 3 | Total investment return is based on the change in net asset value of a share during the period (not annualized) and assumes reinvestment of distributions at net asset value. |
| 4 | Ratios are annualized for periods less than one year. In addition to fees and expenses which the Fund bears directly, the Fund indirectly bears a pro rata share of the fees and expenses of the acquired funds in which it invests. Such indirect expenses are not included in the above reported expense ratios. |
| 5 | Total Fund expenses are limited to 2.00% of average daily net assets. However, during the period above, the investment advisor voluntarily absorbed expenses that were otherwise payable by the Fund. |
| 6 | Not annualized. |
DECEMBER 31, 2018 |
|
71 |
|
|
NOTES TO FINANCIAL STATEMENTS (Unaudited)
Six Months Ended December 31, 2018
| (1) | Organization |
Sit Mutual Funds areno-load funds, and are registered under the Investment Company Act of 1940 (as amended) as diversified,open-end management investment companies, or series thereof. The Sit Balanced, Sit Dividend Growth, Sit Global Dividend Growth, Sit ESG Growth, Sit Small Cap Dividend Growth, Sit Small Cap Growth, Sit International Growth, and Sit Developing Markets Growth are series funds of Sit Mutual Funds, Inc.
This report covers the equity funds of the Sit Mutual Funds (the Funds). Each fund has 10 billion authorized shares of capital stock with a par value of $0.001. The investment objective for each Fund is as follows:
| Fund | Investment Objective | |
Balanced | Long-term growth consistent with the preservation of principal and to provide | |
| regular income. | ||
Dividend Growth | Provide current income that exceeds the dividend yield of the S&P 500® Index | |
| and that grows over a period of years. Secondarily, maximize long-term capital | ||
| appreciation. | ||
Global Dividend Growth | Provide current income that exceeds the dividend yield of the MSCI World Index | |
| that grows over a period of years. Secondarily, maximize long-term capital | ||
| appreciation. | ||
Large Cap Growth | Maximize long-term capital appreciation. | |
ESG Growth | Maximize long-term capital appreciation. | |
Mid Cap Growth | Maximize long-term capital appreciation. | |
Small Cap Dividend Growth | Provide current income that exceeds the yield of the Russell 2000® Index and | |
| that grows over a period of years. Secondarily, maximize long-term capital | ||
| appreciation. | ||
Small Cap Growth | Maximize long-term capital appreciation. | |
International Growth | Maximize long-term growth. | |
Developing Markets Growth | Maximize long-term capital appreciation. |
The Dividend Growth, Global Dividend Growth, ESG Growth and Small Cap Dividend Growth Funds offer Class I and Class S shares. Both classes of shares have identical voting, dividend, and liquidation rights. The distribution fee differs among classes, the Class S shares have a 0.25% distribution fee, whereas Class I has no distribution fee. Income, expenses (other than class specific expenses) and realized and unrealized gains or losses on investments are allocated to each class of shares based upon its relative net assets.
| (2) | Significant Accounting Policies |
The Funds are investment companies and follow accounting and reporting guidance under Financial Accounting Standards Board (“FASB”) Accounting Standards Codification (“ASC”) Topic 946, “Financial Services-Investment Companies”. The following is a summary of significant accounting policies consistently followed by the Funds in the preparation of their financial statements in conformity with U.S. generally accepted accounting principles (“GAAP”).
Investments in Securities
Investments in securities traded on national or international securities exchanges are valued at the last reported sales price prior to the time when assets are valued. Equity Securities traded on theover-the-counter market are valued at the last reported sales price or if the last sales price is not available, at the last reported bid price. The sale and bid prices or prices deemed best to reflect fair value quoted by dealers who make markets in these securities are obtained from independent pricing services. Consistent with the Funds’ valuation policies and procedures, debt securities maturing in more than 60 days are priced by an independent pricing service. The pricing service may use models that price securities based on current yields and relative security characteristics, such as coupon rate, maturity date, issuer credit quality, and prepayment speeds as applicable. When market quotations are not readily available, or when
72 |
|
SIT MUTUAL FUNDS SEMI-ANNUAL REPORT |
|
the Adviser becomes aware that a significant event impacting the value of a security or group of securities has occurred after the closing of the exchange on which the security or securities principally trade, but before the calculation of the daily net asset value, securities are valued at fair value as determined in good faith using procedures established by the Board of Directors. The procedures consider, among others, the following factors to determine a security’s fair value: the nature and pricing history (if any) of the security; whether any dealer quotations for the security are available; and possible valuation methodologies that could be used to determine the fair value of the security. Debt securities of sufficient credit quality maturing in less than 60 days when acquired, or which subsequently are within 60 days of maturity, are valued at amortized cost, which approximates fair value.
Security transactions are accounted for on the date the securities are purchased or sold. Securities gains and losses are calculated on the identified-cost basis. Dividend income is recorded on theex-dividend date or upon the receipt ofex-dividend notification in the case of certain foreign securities. Interest, including level-yield amortization of long-term bond premium and discount, is recorded on the accrual basis.
Fair Value Measurements
The inputs and valuation techniques used to measure fair value of the Funds’ net assets are summarized into three levels as described in the hierarchy below:
• Level 1 – quoted prices in active markets for identical securities. An active market for the security is a market in which transactions occur with sufficient frequency and volume to provide pricing information on an ongoing basis. A quoted price in an active market provides the most reliable evidence of fair value.
• Level 2 – debt securities are valued based on evaluated prices received from independent pricing services or from dealers who make markets in such securities. For corporate bonds, U.S. government and government agency obligations, and municipal securities the pricing services utilize matrix pricing which considers yield or price of bonds of comparable quality, coupon, maturity, and type as well as dealer supplied prices. For asset-backed securities and mortgage-backed securities, the pricing services utilize matrix pricing which considers prepayment speed assumptions, attributes of the collateral, yield or price of bonds of comparable quality, coupon, maturity, and type as well as dealer supplied prices. For foreign equities, the pricing services adjust closing prices by applying a systematic process for events occurring after the close of the foreign exchange by utilizing such inputs as Depositary Receipts, quoted prices for similar securities, exchange rates, and certain indexes. All of these inputs are derived principally from or corroborated by observable market data. An adjustment to any observable input that is significant to the fair value may render the measurement a Level 3 measurement.
• Level 3 – significant unobservable inputs, including the Adviser’s own assumptions in determining the fair value of investments.
The inputs or methodology used for valuing securities are not necessarily an indication of the risk associated with investing in those securities.
A summary of the levels for the Funds’ investments as of December 31, 2018 is included with the Funds’ schedule of investments.
Foreign Currency Translations and Forward Foreign Currency Contracts
The fair value of securities and other assets and liabilities denominated in foreign currencies for Global Dividend Growth, ESG Growth, International Growth and Developing Markets Growth Funds are translated daily into U.S. dollars at the closing rate of exchange (approximately 4:00 p.m. Eastern Time). Purchases and sales of securities, income and expenses are translated at the exchange rate on the transaction date. Dividend and interest income includes currency exchange gains (losses) realized between the accrual and payment dates on such income. Exchange gains (losses) may also be realized between the trade and settlement dates on security and forward contract transactions. For securities denominated in foreign currencies, the effect of changes in foreign exchange rates on realized and unrealized gains or losses is reflected as a component of such gains or losses.
The Global Dividend Growth, ESG Growth, International Growth and Developing Markets Growth Funds may enter into forward foreign currency exchange contracts generally for operational purposes, but the Adviser may occasionally utilize contracts to protect against adverse exchange rate fluctuation. Any gains (losses) generated by these contracts are disclosed separately on the statement of operations. The net U.S. dollar value of foreign currency underlying all contractual commitments held by the Funds and the resulting
DECEMBER 31, 2018 |
|
73 |
|
|
NOTES TO FINANCIAL STATEMENTS (Unaudited)
Six Months Ended December 31, 2018 (Continued)
unrealized appreciation or depreciation is determined using foreign currency exchange rates from an independent pricing service. The Funds are subject to the credit risk that the other party will not complete the obligations of the contract.
Federal Taxes
The Funds’ policy is to comply with the requirements of the Internal Revenue Code applicable to regulated investment companies and to distribute all of their taxable income to shareholders. Therefore, no income tax provision is required. Also, in order to avoid the payment of any federal excise taxes, the Funds will distribute substantially all of their net investment income and net realized gains on a calendar year basis.
Management has analyzed the Funds’ tax positions taken in federal tax returns for all open tax years and has concluded that as of December 31, 2018, no provision for income tax would be required in the Funds’ financial statements. The Funds’ federal and state income and federal excise tax returns remain subject to examination by the Internal Revenue Service and state departments of revenue until such time as the applicable statute of limitations for audit has expired. For example, U.S. tax returns are generally subject to audit for three years from the date they are filed.
At December 31, 2018, the gross unrealized appreciation (depreciation) on investments and cost of securities on a tax basis for federal income tax purposes were as follows:
| Unrealized Appreciation | Unrealized Depreciation | Net Unrealized Appreciation (Depreciation) | Cost of Securities on a Tax Basis | |||||||||||||
Balanced | $4,157,610 | ($950,094) | $3,207,516 | $30,093,355 | ||||||||||||
Dividend Growth | 44,469,384 | (28,354,429) | 16,114,955 | 445,584,475 | ||||||||||||
Global Dividend Growth | 5,014,646 | (1,613,421) | 3,401,225 | 26,036,545 | ||||||||||||
Large Cap Growth | 44,061,678 | (1,881,359) | 42,180,319 | 62,835,430 | ||||||||||||
ESG Growth | 766,103 | (190,593) | 575,510 | 4,837,835 | ||||||||||||
Mid Cap Growth | 52,023,220 | (6,943,946) | 45,079,274 | 93,695,429 | ||||||||||||
Small Cap Dividend Growth | 1,591,478 | (1,916,856) | (325,378) | 15,044,006 | ||||||||||||
Small Cap Growth | 22,881,022 | (6,819,746) | 16,061,276 | 67,053,116 | ||||||||||||
International Growth | 2,687,627 | (2,155,725) | 531,902 | 19,246,394 | ||||||||||||
Developing Markets Growth | 1,946,071 | (512,580) | 1,433,491 | 7,802,132 | ||||||||||||
Net investment income and net realized gains differ for financial statement and tax purposes because of corporate actions on shares held and/or losses deferred due to “wash sale” transactions. A “wash sale” occurs when a Fund sells a security that it has acquired within a period beginning thirty days before and ending thirty days after the date of sale (a sixty one day period). The character of distributions made during the year from net investment income or net realized gains may also differ from its ultimate characterization for tax purposes. Also, due to the timing of dividend distributions, the fiscal year in which amounts are distributed may differ from the year that the income or realized gains (losses) were recorded by the Funds. The tax character of distributions paid during the fiscal years ended June 30, 2018 and 2017 were as follows:
74 |
|
SIT MUTUAL FUNDS SEMI-ANNUAL REPORT |
|
|
Year Ended June 30, 2018:
| Long Term | |||||||||||||||
| Ordinary Income | Capital Gain | Total | |||||||||||||
Balanced | $307,000 | $1,006,844 | $1,313,844 | ||||||||||||
Dividend Growth (Class I) | 31,170,676 | 74,263,557 | 105,434,233 | ||||||||||||
Dividend Growth (Class S) | 1,857,317 | 4,855,261 | 6,712,578 | ||||||||||||
Global Dividend Growth (Class I) | 431,455 | — | 431,455 | ||||||||||||
Global Dividend Growth (Class S) | 44,545 | — | 44,545 | ||||||||||||
Large Cap Growth | 821,351 | 11,972,770 | 12,794,121 | ||||||||||||
ESG Growth (Class I) | 27,776 | — | 27,776 | ||||||||||||
ESG Growth (Class S) | 21,224 | — | 21,224 | ||||||||||||
Mid Cap Growth | 4,961 | 6,517,375 | 6,522,336 | ||||||||||||
Small Cap Dividend Growth (Class I) | 131,227 | — | 131,227 | ||||||||||||
Small Cap Dividend Growth (Class S) | 26,774 | — | 26,774 | ||||||||||||
Small Cap Growth | — | 6,111,266 | 6,111,266 | ||||||||||||
International Growth | 197,000 | — | 197,000 | ||||||||||||
Developing Markets Growth | — | 159,864 | 159,864 | ||||||||||||
Year Ended June 30, 2017:
| Long Term | |||||||||||||||
| Ordinary Income | Capital Gain | Total | |||||||||||||
Balanced | $270,000 | — | $270,000 | ||||||||||||
Dividend Growth (Class I) | 18,184,824 | $56,369,317 | 74,554,141 | ||||||||||||
Dividend Growth (Class S) | 1,047,785 | 3,921,689 | 4,969,474 | ||||||||||||
Global Dividend Growth (Class I) | 354,957 | — | 354,957 | ||||||||||||
Global Dividend Growth (Class S) | 38,043 | — | 38,043 | ||||||||||||
Large Cap Growth | 598,249 | 7,585,453 | 8,183,702 | ||||||||||||
ESG Growth | 6,100 | — | 6,100 | ||||||||||||
Mid Cap Growth | — | 1,410,787 | 1,410,787 | ||||||||||||
Small Cap Dividend Growth (Class I) | 87,515 | — | 87,515 | ||||||||||||
Small Cap Dividend Growth (Class S) | 21,485 | — | 21,485 | ||||||||||||
Small Cap Growth | — | 144,732 | 144,732 | ||||||||||||
International Growth | 97,000 | — | 97,000 | ||||||||||||
Developing Markets Growth | 18,811 | — | 18,811 | ||||||||||||
DECEMBER 31, 2018 |
|
75 |
|
|
NOTES TO FINANCIAL STATEMENTS (Unaudited)
Six Months Ended December 31, 2018 (Continued)
As of June 30, 2018, the components of distributable earnings on a tax basis were as follows:
| Undistributed Ordinary Income | Accumulated Gain | Unrealized Appreciation (Depreciation) | |||||||||||||
Balanced | $78,774 | $310,065 | $6,627,311 | ||||||||||||
Dividend Growth | 5,972,013 | 62,651,127 | 140,347,078 | ||||||||||||
Global Dividend Growth | 220,894 | — | 5,475,379 | ||||||||||||
Large Cap Growth | 179,813 | 6,642,273 | 55,846,624 | ||||||||||||
ESG Growth | 47,490 | — | 995,783 | ||||||||||||
Mid Cap Growth | — | 8,878,657 | 69,291,406 | ||||||||||||
Small Cap Dividend Growth | 45,153 | — | 2,978,150 | ||||||||||||
Small Cap Growth | — | 4,179,299 | 34,859,181 | ||||||||||||
International Growth | 245,338 | — | 3,777,561 | ||||||||||||
Developing Markets Growth | 19,880 | 55,811 | 3,183,712 | ||||||||||||
Net capital loss carryovers and late year losses, if any, as of June 30, 2018, are available to offset future realized capital gains and thereby reduce future capital gains distributions. The Funds’ are permitted to carry forward capital losses for an unlimited period. Capital losses that are carried forward retain their character as either short-term or long-term capital losses. The net capital loss carryovers and the late year losses deferred as of June 30, 2018, were as follows:
| Unlimited Period of Net | Late Year | Accumulated | ||||||||||||
| Capital Loss Carryover | Losses | Capital and | ||||||||||||
| Short-Term | Long-Term | Deferred | Other Losses | |||||||||||
Global Dividend Growth | $933,574 | — | — | $933,574 | ||||||||||
ESG Growth | 49,620 | — | — | 49,620 | ||||||||||
Mid Cap Growth | — | — | $113,556 | — | ||||||||||
Small Cap Dividend Growth | 180,597 | — | — | 180,597 | ||||||||||
Small Cap Growth | — | — | 267,685 | — | ||||||||||
International Growth | 747,860 | — | — | 747,860 | ||||||||||
For the year ended June 30, 2018, the Funds’ utilized capital losses and expired capital losses as follows:
| Utilized | Expired | |||||
Global Dividend Growth | $ | 186,394 | — | |||
ESG Growth | 9,964 | — | ||||
Small Cap Dividend Growth | 141,704 | — | ||||
International Growth | 148,939 | — | ||||
Developing Markets Growth | 182,555 | — | ||||
Distributions
Distributions to shareholders are recorded as of the close of business on the record date. Such distributions are payable in cash or rein-vested in additional shares of the Funds’ capital stock. Distributions from net investment income, if any, are declared and paid quarterly for the Balanced, Dividend Growth, Global Dividend Growth and Small Cap Dividend Growth Funds and declared and paid annually for Developing Markets Growth, Small Cap Growth, International Growth, Mid Cap Growth, Large Cap Growth and ESG Growth Funds. Distributions from net realized gains, if any, will be made annually for each of the Funds.
Concentration of Investments
The Developing Markets Growth Fund may concentrate investments in countries with limited or developing capital markets which may involve greater risks than investments in more developed markets and the prices of such investments may be volatile. The consequences
76 |
|
SIT MUTUAL FUNDS SEMI-ANNUAL REPORT |
|
|
of political, social or economic changes in these markets may have disruptive effects on the market prices of the Fund’s investments and the income it generates, as well as the Fund’s ability to repatriate such amounts.
Use of Estimates
The preparation of financial statements in conformity with U.S. generally accepted accounting principles requires management to make certain estimates and assumptions that affect the reported amounts of assets and liabilities and disclosure of contingent assets and liabilities at the date of the financial statements and the reported results for the respective periods. Actual results could differ from those estimates.
Guarantees and Indemnifications
Under each Fund’s organizational documents, its officers and directors are indemnified against certain liability arising out of the performance of their duties to each Fund. In addition, certain of each Fund’s contracts with its service providers contain general indemnification clauses. Each Fund’s maximum exposure under these arrangements is unknown since the amount of any future claims that may be made against each Fund cannot be determined and each Fund has no historical basis for predicting the likelihood of any such claims.
| (3) | Investment Security Transactions |
The cost of purchases and proceeds from sales and maturities of investment securities, other than short-term securities, for the six months ended December 31, 2018, were as follows:
| Purchases | Proceeds | |||||||||||
| U.S. Government | Other | U.S. Government | Other | |||||||||
Balanced | $4,066,927 | $7,381,656 | $1,493,486 | $9,645,859 | ||||||||
Dividend Growth | — | 241,275,053 | — | 676,832,142 | ||||||||
Global Dividend Growth | — | 1,140,773 | — | 1,725,264 | ||||||||
Large Cap Growth | — | 7,965,276 | — | 11,634,641 | ||||||||
ESG Growth | — | 171,286 | — | 89,813 | ||||||||
Mid Cap Growth | — | 20,828,398 | — | 21,688,664 | ||||||||
Small Cap Dividend Growth | — | 3,155,528 | — | 2,915,841 | ||||||||
Small Cap Growth | — | 13,544,431 | — | 13,514,627 | ||||||||
International Growth | — | 2,205,918 | — | 2,827,876 | ||||||||
Developing Markets Growth | — | 734,693 | — | 619,132 | ||||||||
DECEMBER 31, 2018 |
|
77 |
|
|
NOTES TO FINANCIAL STATEMENTS (Unaudited)
Six Months Ended December 31, 2018 (Continued)
| (4) | Affiliated Fees and Transactions |
Investment Adviser
The Funds each have entered into an investment management agreement with Sit Investment Associates, Inc. (SIA), under which SIA manages the Funds’ assets and provides research, statistical and advisory services, and pays related office rental, executive expenses and executive salaries. The current fee for investment management and advisory services is based on the average daily net assets of the Funds at the annual rate of:
| Management Fee | Net of Adviser’s Voluntary Fee Waiver | ||||||
Balanced | 1.00% | N/A | |||||
Dividend Growth Fund Class I and Class S | 1.00% | 0.70% | |||||
Global Dividend Growth Fund Class I and Class S | 1.25% | 1.00% | |||||
Large Cap Growth | 1.00% | N/A | |||||
ESG Growth Fund Class I and Class S | 1.25% | 1.00% | |||||
Mid Cap Growth | 1.25% | N/A | |||||
Small Cap Dividend Growth Fund Class I and Class S | 1.25% | 1.00% | |||||
Small Cap Growth | 1.50% | N/A | |||||
International Growth | 1.50% | N/A | |||||
Developing Markets Growth | 2.00% | 1.40% | |||||
SIA is obligated to pay all of the Funds’ expenses (excluding extraordinary expenses, stock transfer taxes, interest, brokerage commissions,12b-1 fees and other transaction charges relating to investing activities).
In addition to the annual management fees, the Class S shares of Dividend Growth, Global Dividend Growth, ESG Growth and Small Cap Dividend Growth Funds also have a 0.25% annual distribution(12b-1) fee, which is used to pay for distribution fees related to the sale and distribution of its shares.
Effective October 1, 2017, the Adviser has agreed to limit the management fee of the Dividend Growth Fund to 0.70%, the Global Dividend Growth Fund to 1.00%, the ESG Growth Fund to 1.00%, the Small Cap Dividend Growth Fund to 1.00% and the Developing Markets Growth Fund to 1.40% for the period through June 30, 2019 of the Fund’s daily average net assets, respectively.
Transactions with affiliates
The investment adviser, affiliates of the investment adviser, directors and officers of the Funds as a whole owned the following shares as of December 31, 2018:
| Shares | % Shares Outstanding | |||||
Balanced | 273,332 | 18.5 | ||||
Dividend Growth | 1,430,207 | 3.9 | ||||
Global Dividend Growth | 492,864 | 23.6 | ||||
Large Cap Growth | 694,871 | 23.6 | ||||
ESG Growth | 447,561 | 94.1 | ||||
Mid Cap Growth | 4,181,323 | 45.7 | ||||
Small Cap Dividend Growth | 730,809 | 49.9 | ||||
Small Cap Growth | 1,016,922 | 54.4 | ||||
International Growth | 758,515 | 54.8 | ||||
Developing Markets Growth | 270,559 | 42.2 | ||||
78 |
|
SIT MUTUAL FUNDS SEMI-ANNUAL REPORT |
|
|
| (5) | Capital Share Activity |
Short-Term Trading (Redemption) Fees
The Funds (except Balanced) charge a redemption fee equal to 2.00% of the proceeds on shares held for less than 30 calendar days. The fee is retained by the Fund for the benefit of its long-term shareholders and accounted for as an addition to paid in capital. For the six months ended December 31, 2018, the Funds received the following redemption fees:
| Class I | Class S | |||||||||
Dividend Growth | $7,497 | $666 | ||||||||
Global Dividend Growth | 1 | — | ||||||||
Large Cap Growth | 696 | — | ||||||||
Mid Cap Growth | 103 | — | ||||||||
Small Cap Growth | 319 | — | ||||||||
Developing Markets Growth | 85 | — | ||||||||
DECEMBER 31, 2018 |
|
79 |
|
|
EXPENSE EXAMPLE (Unaudited)
As a shareholder of the Funds, you incur two types of costs: (1) transaction costs, including redemption fees and (2) ongoing costs, including management fees; and other Fund expenses. This Example is intended to help you understand your ongoing costs (in dollars) of investing in the Funds and to compare these costs with the ongoing costs of investing in other mutual funds.
The Example is based on an investment of $1,000 invested at the beginning of the period and held for the entire period July 1, 2018 to December 31, 2018.
Actual Expenses
The first line of the following table provides information about actual account values and actual expenses. You may use the information in this line, together with the amount you invested, to estimate the expenses that you paid over the period. Simply divide your account value by $1,000 (for example, an $8,600 account value divided by $1,000 = 8.6), then multiply the result by the number in the first line under the heading entitled “Expenses Paid During Period” to estimate the expenses you paid on your account during this period.
Hypothetical Example for Comparison Purposes
The second line of the table provides information about hypothetical account values and hypothetical expenses based on the Fund’s actual expense ratio and an assumed rate of return of 5% per year before expenses, which is not the Fund’s actual return. The hypothetical account values and expenses may not be used to estimate the actual ending account balance or expenses you paid for the period. You may use this information to compare the ongoing costs of investing in the Fund and other funds. To do so, compare this 5% hypothetical example with the 5% hypothetical examples that appear in the shareholder reports of the other funds.
Please note that the expenses shown in the table are meant to highlight your ongoing costs only and do not reflect any transactional costs, such as redemption fees. Therefore, the second line of the table is useful in comparing ongoing costs only, and will not help you determine the relative total costs of owning different funds. In addition, if these transactional costs (redemption fees) were included, your costs would have been higher.
| Fund | Beginning Account Value (7/1/18) | Ending Account Value (12/31/18) | Expenses Paid During | |||||||||
| Balanced Fund | ||||||||||||
Actual | $1,000 | $957.60 | $4.93 | |||||||||
Hypothetical | $1,000 | $1,020.16 | $5.09 | |||||||||
| Dividend Growth Fund | ||||||||||||
Actual | ||||||||||||
Class I | $1,000 | $937.30 | $4.88 | |||||||||
Class S | $1,000 | $936.30 | $6.10 | |||||||||
Hypothetical | ||||||||||||
Class I | $1,000 | $1,020.16 | $5.09 | |||||||||
Class S | $1,000 | $1,018.90 | $6.36 | |||||||||
| Global Dividend Growth Fund | ||||||||||||
Actual | ||||||||||||
Class I | $1,000 | $940.50 | $6.11 | |||||||||
Class S | $1,000 | $939.20 | $7.33 | |||||||||
Hypothetical | ||||||||||||
Class I | $1,000 | $1,018.90 | $6.36 | |||||||||
Class S | $1,000 | $1,017.64 | $7.63 | |||||||||
| Large Cap Growth Fund | ||||||||||||
Actual | $1,000 | $926.90 | $4.86 | |||||||||
Hypothetical | $1,000 | $1,020.16 | $5.09 | |||||||||
| ESG Growth Fund | ||||||||||||
Actual | ||||||||||||
Class I | $1,000 | $934.60 | $6.10 | |||||||||
Class S | $1,000 | $933.20 | $7.31 | |||||||||
Hypothetical | ||||||||||||
Class I | $1,000 | $1,018.90 | $6.36 | |||||||||
Class S | $1,000 | $1,017.64 | $7.63 | |||||||||
| Mid Cap Growth Fund | ||||||||||||
Actual | $1,000 | $898.10 | $5.98 | |||||||||
Hypothetical | $1,000 | $1,018.90 | $6.36 | |||||||||
| Small Cap Dividend Growth Fund |
| |||||||||||
Actual | ||||||||||||
Class I | $1,000 | $838.70 | $5.79 | |||||||||
Class S | $1,000 | $837.80 | $6.95 | |||||||||
Hypothetical | ||||||||||||
Class I | $1,000 | $1,018.90 | $6.36 | |||||||||
Class S | $1,000 | $1,017.64 | $7.63 | |||||||||
80 |
|
SIT MUTUAL FUNDS SEMI-ANNUAL REPORT |
|
EXPENSE EXAMPLE (Unaudited) (Continued)
| Fund | Beginning Account Value (7/1/18) | Ending Account Value (12/31/18) | Expenses Paid During Period* (7/1/18- 12/31/18) | |||||||
| Small Cap Growth Fund | ||||||||||
Actual | $1,000 | $853.00 | $7.01 | |||||||
Hypothetical | $1,000 | $1,017.64 | $7.63 | |||||||
| International Growth Fund | ||||||||||
Actual | $1,000 | $866.30 | $7.06 | |||||||
Hypothetical | $1,000 | $1,017.64 | $7.63 | |||||||
| Developing Markets Growth Fund | ||||||||||
Actual | $1,000 | $849.60 | $ 9.32 | |||||||
Hypothetical | $1,000 | $1,015.12 | $10.16 | |||||||
*Expenses are equal to the Fund’s annualized expense ratio of 1.00%, for the Balanced, Dividend Growth, Class I and Large Cap Growth Funds; 1.25% for Dividend Growth, Class S, Global Dividend Growth, Class I, Small Cap Dividend Growth, Class I, Mid Cap Growth, and ESG Growth, Class I Funds; 1.50% for Global Dividend Growth, Class S, Small Cap Dividend Growth, Class S, Small Cap Growth, ESG Growth, Class S and International Growth Funds; and 2.00% for Developing Markets Growth Fund, multiplied by the average account value over the period, multiplied by 184/365 (to reflect theone-half year period.)
DECEMBER 31, 2018 |
|
81 |
|
|
ADDITIONAL INFORMATION (Unaudited)
PROXY VOTING
Each Fund follows certain policies and procedures for voting proxies for securities held in each portfolio. A description of the Funds’ proxy voting policies and procedures is available without charge upon request by calling the Funds at1-800-332-5580.
Information regarding how each Fund voted proxies relating to its portfolio securities during the most recent twelve-month period ended June 30 is available without charge upon request by calling the Funds at1-800-332-5580, and is available on the U.S. Securities and Exchange Commission’s website at www.sec.gov.
AVAILABILITY OF QUARTERLY PORTFOLIO SCHEDULES
The Funds’ file their complete schedules of portfolio holdings with the U.S. Securities and Exchange Commission (SEC) for the first and third quarters of each fiscal year on FormN-Q. The Funds’ FormN-Qs are available without charge upon request by calling the Funds at1-800-332-5580 and are available on the SEC’s website at www.sec.gov. In addition, the Funds’ FormN-Qs may be reviewed and copied at the SEC’s Public Reference Room in Washington, DC. Information on the operation of the Public Reference Room may be obtained by calling1-202-551-8090.
RE-APPROVAL OF INVESTMENT MANAGEMENT AGREEMENTS
At their joint meeting held on October 22, 2018 the Boards of Directors of the Sit Mutual Funds unanimously approved the continuation for another one year period the investment management agreements entered into by and between Sit Investment Associates, Inc. (“SIA”) and Sit Mid Cap Growth Fund, Inc. dated November 1, 1996; Sit Large Cap Growth Fund, Inc. dated November 1, 1996; and Sit Mutual Funds Inc., dated November 1, 1992 (the “Agreements”).
The Boards approved the Agreements after a lengthy discussion and consideration of various factors relating to the Boards’ selection of SIA as the investment adviser, and the Boards’ approval of the fees to be paid under the Agreements.
Investment Adviser Criteria. The Directors began their analysis by discussing their criteria for determining the quality of an investment adviser. The Directors’ noted that their analysis is similar to that used by institutional investors in evaluating and selecting investment advisers. The Directors discussed several factors used to determine the overall quality of an investment adviser and the nature, extent and quality of the services performed by SIA, including the following:
Investment Philosophy and Process. The Directors considered SIA’s philosophy of managing assets. With respect to equity securities, SIA identifies growth-oriented securities issued by companies with the potential for earnings growth at a faster rate than the general economy and market index. SIA believes that earnings growth is the primary determinant of superior long-term returns for equity securities, and invests in companies it believes exhibit above market and consistent growth as well as conservative and cyclical growth companies. SIA’s actively managed portfolios not only concentrate on the best growth opportunities but do so at reasonable valuation levels. The Directors determined that the Stock Funds’ investment objectives are consistent with SIA’s investment philosophy and growth style. The Directors reviewed the Stock Funds’ portfolio characteristics, and noted that SIA has consistently managed the Stock Funds in a growth style and the Directors found no indication of style drift away from growth stocks over market cycles. The Directors noted that in periods during which growth stocks have generally under-performed relative to value stocks, the Stock Funds may not rank favorably in comparisons with other funds investing in value stocks.
The Directors discussed SIA’s consistent and well-defined investment process. With respect to equity securities, SIA utilizes a team basedtop-down andbottom-up investment decision making process.
Investment Professionals. The Directors discussed the experience, knowledge and organizational stability of SIA and its investment professionals. The Directors noted that SIA’s senior professionals are actively involved in the investment process and have significant investment industry experience.
82 |
|
SIT MUTUAL FUNDS SEMI-ANNUAL REPORT |
|
|
ADDITIONAL INFORMATION (Unaudited) (Continued)
The Directors discussed the depth of SIA’s investment staff. The Directors noted that SIA has over 30 investment professionals. Given the investment products offered by SIA and the assets under management, the Directors determined that SIA’s investment staff is well positioned to meet the current needs of its clients, including the Funds, and to accommodate growth in the number of clients and assets under management for the near future. The Directors concluded that the depth of the investment staff, and in particular senior management and investment analysts, is actually greater than the Funds currently require at their present asset size. The Directors noted that SIA has the resources of a $12.8 billion investment firm working for the benefit of the Fund shareholders.
Investment Performance. The Directors reviewed and discussed the Funds’ investment performance on an absolute and comparable basis for various periods as discussed below. The Directors noted that the investment performance of the Funds has generally been competitive with indices and other funds with similar investment styles as the Funds, such as equity growth funds.
Corporate Culture. The Directors discussed SIA’s corporate values to operate under the highest ethical and professional standards. SIA’s culture is set and practiced by senior management who insist that all professionals exhibit honesty and integrity. The Board noted that the firm’s values are evident in all of the services provided to the Funds.
Review of Specific Factors. The Directors continued their analysis by reviewing specific information on SIA and the Funds and specific terms of the Agreements, including the following.
Investment Performance. The Directors reviewed investment performance of each Fund for 1 month, 3 months, 6 months,year-to-date, 1 year, 5 years (as applicable), 10 years (as applicable) and since inception, both on an absolute basis and on a comparative basis to indices and mutual funds within the same investment categories. As noted above, the Directors concluded that the investment performance of the Funds has been competitive in relation to their stated objectives and strategies on a comparable basis with funds with similar objectives and strategies.
Fees and Expenses. The Directors noted that the Funds pay SIA a monthly fee and SIA is responsible for all of the Funds’ expenses, except interest, brokerage commissions and transaction charges, certain extraordinary expenses, and fees paid under a distribution plan adopted pursuant to Rule12b-1 under the Investment Company Act of 1940 for Class S shares of Sit Dividend Growth Fund, Sit Global Dividend Growth Fund, Sit Small Cap Dividend Growth Fund, and Sit ESG Growth Fund. The Directors reviewed fees paid in prior years and the current fees to be paid under the Agreements both before and after fee waivers with respect to Sit Developing Markets Growth Fund, Sit Dividend Growth Fund, Sit Global Dividend Growth Fund, Sit Small Cap Dividend Growth Fund, and Sit ESG Growth Fund.
The Directors compared each Fund’s expense ratio to the average and median expense ratios ofno-load mutual funds within the same Morningstar, Inc. investment category, the average expense ratios for load funds within the Morningstar category, and the average expense ratios for all funds within the Morningstar category. Certain of the Fund’s expense ratios were higher than the averages, and certain of the Fund’s expense ratios were lower than the averages. The Directors noted that the Morningstarno-load categories include funds of various asset sizes, some of which are significantly larger in assets than the Funds. The Directors found each Fund’s total expense ratio to be within an acceptable range compared to the total expense ratios of otherno-load funds within the Fund’s Morningstar category. The Directors concluded that the fees paid by the Funds are reasonable and appropriate.
The Directors reviewed the extent to which the fees to be paid under the Agreements by each Fund may be affected by an increase in the Fund’s assets, which included reviewing each Fund’s current and historical assets and the likelihood and magnitude of future increases in the Fund’s assets. The Directors agreed that it is appropriate that the Funds benefit from improved economies of scale as the Funds’ assets increase. However, the Directors concluded that given the amount of the Funds’ current assets and the likelihood and magnitude of future increases in the Funds’ assets, negotiating a graduated fee structure for each Fund is unnecessary at this time since the fees to be paid under the current Agreements are reasonable and appropriate.
The Directors reviewed the expenses paid by SIA relating to the operations of the Funds, and SIA’s income with respect to the management of the Funds for the past two calendar years. The Directors concluded that the expenses paid were appropriate.
The Directors reviewed SIA’s investment advisory fee schedule for investment management services provided to other clients. The Directors compared the services provided to the Funds and other clients of SIA, and recognized that the Funds’ expenses are borne by SIA
DECEMBER 31, 2018 |
|
83 |
|
|
ADDITIONAL INFORMATION (Unaudited) (Continued)
except as noted above. The Directors concluded that the fees paid by the Funds in relation to the fees paid by other SIA clients were appropriate and reasonable. The Directors also concluded that SIA’s profit margin with respect to the management of the Funds was appropriate.
The Directors discussed the extent to which SIA receives benefits from the relationship with the Funds such as soft dollar arrangements by which brokers provide research services to SIA as a result of brokerage generated by the Funds. The Board concluded that any benefits SIA receives from its relationship with the Funds are well within industry norms and are reflected in the amount of the fees paid by the Funds to SIA and are appropriate and reasonable.
Non-Advisory Services.The Directors considered the quality ofnon-advisory services which SIA provides to the Funds (and their shareholders) and the quality and depth of SIA’snon-investment personnel who provide such services. Directors concluded that the level of such services and the quality and depth of such personnel are consistent with industry standards.
Finally, the Directors considered the compliance staff and the regulatory history of SIA and the Funds, and concluded that both are consistent with industry standards.
Based on these conclusions, without any single conclusion being dispositive, the Directors determined that renewal of the Agreements was in the interest of each Fund and its shareholders.
84 |
|
SIT MUTUAL FUNDS SEMI-ANNUAL REPORT |
|
Semi-Annual Report December 31, 2018 INVESTMENT ADVISER INDEPENDENT REGISTERED PUBLIC Sit Investment Associates, Inc. ACCOUNTING FIRM 80 S. Eighth Street KPMG LLP Suite 3300 Minneapolis, MN Minneapolis, MN 55402 GENERAL COUNSEL CUSTODIAN Dorsey & Whitney LLP The Bank Of New York Mellon Minneapolis, MN 111 Sanders Creek Parkway Syracuse, NY 13057 TRANSFER AGENT AND DISBURSING AGENT BNY Mellon Investment Servicing (US) Inc. 4400 Computer Drive Westborough, MA 01581 Sit Mutual Funds1-800-332-5580 www.sitfunds.com
| Item 2: | Code of Ethics. Not applicable to Semi-Annual Report. |
| Item 3: | Audit Committee Financial Expert. Not applicable to Semi-Annual Report. |
| Item 4: | Principal Accountant Fees and Services. Not applicable to Semi-Annual Report. |
| Item 5: | Audit Committee of Listed Registrants. |
Not applicable toopen-end investment companies.
| Item 6: | Schedule of Investments. |
The schedule of investments is included as part of the report to shareholders filed under Item 1 of this Form.
| Item 7: | Disclosure of Proxy Voting Policies and Procedures forClosed-End Management Investment Companies. |
Not applicable toopen-end investment companies.
| Item 8: | Portfolio Managers ofClosed-End Management Companies. |
Not applicable toopen-end investment companies.
| Item 9: | Purchases of Equity Securities byClosed-End Management Investment Company and Affiliated Purchasers. |
Not applicable toopen-end investment companies.
| Item 10. | Submission of Matters to a vote of Security Holders. |
There have been no material changes to the procedures by which shareholders may recommend nominees to the registrant’s board of directors.
| Item 11: | Controls and Procedures - |
(a) Based on their evaluation of the Registrant’s Disclosure Controls and Procedures as of a date within 90 days of the Filing Date, the Registrant’s Chairman and Treasurer have determined that the Disclosure Controls and Procedures (as defined in Rule30a-2(c) under the Act) are designed to ensure that information required to be disclosed by the Registrant is recorded, processed, summarized and reported by the filing Date, and that information required to be disclosed in the report is communicated to the Registrant’s management, as appropriate, to allow timely decisions regarding required disclosure.
b) There were no changes in the Registrant’s internal control over financial reporting as defined in Rule30a-3(d) under the Act) that occurred during the Registrant’s last fiscal half-year that has materially affected, or is reasonably likely to materially affect, the Registrant’s internal control over financial reporting.
| Item 12: | Exhibits: |
(a) The following exhibits are attached to this FormN-CSR:
(2) A separate certification for each principal executive and principal financial officer of the registrant as required by Rule30a-2(a) under the Act (17 CFR270.30a-2) (certification required by Section 302 of the Sarbanes-Oxley Act of 2002).
(b) Certification required by Rule30a-2(b) under the Act (certification required by Section 906 of the Sarbanes-Oxley Act of 2002).
SIGNATURES
Pursuant to the requirements of the Securities Exchange Act of 1934 and the Investment Company Act of 1940, the registrant has duly caused this report to be signed on its behalf by the undersigned, thereunto duly authorized.
Sit Mutual Funds, Inc.
| By (Signature and Title) | /s/ Paul E. Rasmussen | |||
| Paul E. Rasmussen | ||||
| Vice President, Treasurer |
Date February 26, 2019
Pursuant to the requirements of the Securities Exchange Act of 1934 and the Investment Company Act of 1940, this report has been signed below by the following persons on behalf of the registrant and in the capacities and on the dates indicated.
| By (Signature and Title) | /s/ Paul E. Rasmussen | |||
| Paul E. Rasmussen | ||||
| Vice President, Treasurer |
Date February 26, 2019
| By (Signature and Title) | /s/ Roger J. Sit | |||
| Roger J. Sit | ||||
| Chairman |
Date February 26, 2019