UNITED STATES
SECURITIES AND EXCHANGE COMMISSION
Washington, D.C. 20549
FORMN-CSR
CERTIFIED SHAREHOLDER REPORT OF REGISTERED
MANAGEMENT INVESTMENT COMPANIES
Investment Company Act file number:811-06373
Sit Mutual Funds, Inc.
(Exact name of registrant as specified in charter)
3300 IDS Center
80 South Eighth Street
Minneapolis, MN 55402
(Address of principal executive offices)
Paul E. Rasmussen, VP Treasurer
Sit Mutual Funds, Inc.
3300 IDS Center
80 South Eighth Street
Minneapolis, MN 55402
(Name and address of agent for service)
Copy to:
Mike Radmer, Esq.
Dorsey & Whitney
Suite 1500
50 South Sixth Street
Minneapolis, MN 55402-1498
Registrant’s telephone number, including area code:
(612)332-3223
Date of fiscal year end: June 30, 2019
Date of reporting period: June 30, 2019
| Item 1: | Reports to Stockholders |
Annual Report | ||||||
June 30, 2019
| ||||||
| ||||||
| Balanced Fund | ||||||
| Dividend Growth Fund | ||||||
| Global Dividend Growth Fund | ||||||
| Large Cap Growth Fund | ||||||
| ESG Growth Fund | ||||||
| Mid Cap Growth Fund | ||||||
| Small Cap Dividend Growth Fund | ||||||
| Small Cap Growth Fund | ||||||
| International Growth Fund | ||||||
| Developing Markets Growth Fund | ||||||
Important Information on Paperless Delivery
Beginning on January 1, 2021, as permitted by regulations adopted by the Securities and Exchange Commission, paper copies of the Funds’ shareholder reports will no longer be sent by mail, unless you specifically request paper copies of the reports from Sit Mutual Funds or from your financial intermediary, such as a broker-dealer or bank. Instead, the reports will remain available on the Funds’ website (sitfunds.com) and you will be notified by mail each time a report is posted and provided with a website link to access the report.
If you already elected to receive shareholder reports electronically, you will not be affected by this change and you need not take any action. You may elect to receive shareholder reports electronically from the Fund by calling1-800-332-5580 or by enrolling online at sitfunds.com, or, if you are invested through your financial intermediary, you may contact them directly.
You may elect to receive all future reports in paper free of charge. You can inform the Funds by calling1-800-332-5580, or, if you are invested through your financial intermediary, you may contact them directly. Your election to receive reports in paper will apply to all funds held with Sit Mutual Funds or through your financial intermediary, as applicable.
| ||||||
 Sit Mutual Funds Sit Mutual Funds | ||||||
Sit Mutual Funds STOCK FUNDS ANNUAL REPORT |
| Page | ||||
| 2 | ||||
Fund Reviews and Schedules of Investments | ||||
| 4 | ||||
| 12 | ||||
| 16 | ||||
| 20 | ||||
| 24 | ||||
| 28 | ||||
| 32 | ||||
| 36 | ||||
| 40 | ||||
| 46 | ||||
| 50 | ||||
| 52 | ||||
| 54 | ||||
| 58 | ||||
| 72 | ||||
| 80 | ||||
| 81 | ||||
| 83 | ||||
| 84 | ||||
| 86 | ||||
This document must be preceded or accompanied by a Prospectus.
August 3, 2019
Dear Fellow Shareholders:
Global economic growth has continued to moderate during the first half of 2019, weighed down by a slowdown in the manufacturing sector. Trade policy remains a wild card, but a sharp decline in interest rates provides an important offset to trade uncertainty.
Economic Overview
The downshift in economic momentum that began in late 2018 has intensified in the current year. While first quarter U.S. Gross Domestic Product (GDP) growth of +3.1% was better than expected, the breakdown of U.S.-China trade negotiations in early May and the resumption of earlier-postponed tariff hikes contributed to a notable downtick in industrial activity and business confidence. Job gains have also moderated from the unsustainable levels of 2018, but they remain solid enough to sustain strength in consumer spending, which has stayed resilient. In addition, the recent decline in interest rates may give a near-term boost to housing activity.
We expect U.S. growth to continue to moderate, due to fading fiscal stimulus, the lagged effects of monetary tightening and trade policy uncertainty. With the current expansion officially now the longest on record, at 121 months in length, any slowdown in growth is bound to stoke recession fears. However, we believe that the economy remains in reasonable shape and that the expansion has more room to run, based on the enduring benefits from tax cuts, deregulation, easing financial conditions and healthy consumers. The Federal Reserve will likely do its part to sustain the expansion, as expectations for interest rate cuts have continued to rise, in conjunction with growth concerns amid declining inflation expectations. While legitimate risks to the macro outlook have accumulated–including the upcoming U.S. government budget negotiations that are likely to be contentious and could weigh on market sentiment, if not resolved quickly – the Fed hopes to forestall a negative feedback loop triggered by sinking confidence.None-the-less, given still-solid U.S. macro conditions and increasing policy accommodation outside the U.S., there is a risk that investors pricing in multiple Fed rate cuts may be disappointed.
The U.S. China trade fight ceasefire announced post the recentTrump-Xi meeting at the G20 Summit reduces, at least for now, the economic overhang of an escalating conflict that likely weighed on second quarter economic activity. An eventual trade deal remains our base case, as we believe neither side can withstand the economic pain of a long-term conflict. Within China, recent macro data has largely surprised to the downside and suggests renewed economic weakness. Chinese efforts to boost growth via monetary and fiscal stimulus have been under-whelming, but we expect the government to step up its response in attempt to offset the negative impact from trade. A trade agreement is critical to boosting business and consumer
sentiment, with a positive “second-order effect” on global growth (particularly in emerging economies).
Economic growth in Europe has weakened, as elevated policy uncertainty and softer exports are dampening business optimism and capital spending. Europe is much more dependent on trade relative to the U.S (i.e., 45% of GDP vs. 12% for U.S.), making the region vulnerable to the fallout from trade policy uncertainty and the associated dip in global trade. Conversely, relative strength in the services and construction sectors remains underpinned by a virtuous cycle of improving labor conditions and resilient domestic demand. While European growth is further supported by a combination of favorable fiscal and monetary policies, uncertainty surrounding elevated trade conflict, the Italian economy and Brexit add risks to the outlook. Also, concern around possible rate cuts by an increasingly dovish Fed may put upward pressure on the euro, further crimping growth. European Central Bank (ECB) President Mario Draghi recently hinted at additional easing; however, with rates already at extremely low levels, further easing is likely to produce only a modest economic benefit.
Equity Strategy
Global equities have made a broad-based comeback, following a sharp correction at the end of 2018. Risk/reward is now less attractive with stocks trading at “fair” valuations, but central banks’ easing efforts should provide a strong under-pinning for markets going forward.
We are generally constructive on U.S. equities, given solid underlying growth prospects and supportive policy. However, elevated relative valuation, lingering macro uncertainty, Fed policy ambiguity and rising geopolitical risks (i.e., U.S.-China trade deal, Iran, North Korea, etc.) highlight the importance of diversified portfolios focused on quality growth stocks that provide both upside opportunity and downside protection. We continue to balance investments inpro-cyclical growth stocks that provide compelling risk/reward opportunities with more predictable, secular growth stocks, based on the likelihood that “end of cycle” fears will result in continued bouts of equity market volatility. While we believe a “barbell strategy” approach continues to provide a balanced risk-reward profile, portfolio composition has been shifted toward more stable, visible earnings growth investments. Thus, we reduced exposure to the industrial and transport sectors, given full valuations against a weakening backdrop. We have also reduced our holdings in select technology services stocks that offer less-compelling valuations. Additionally, cash levels have been raised slightly, ahead of anticipated volatility in second quarter corporate earnings reports. Finally, we have added to select investments in healthcare and consumer staples and favor exposure to P&C insurance within the financial sector, due to an improved pricing environment and attractive valuation.
| 2 | SIT MUTUAL FUNDS ANNUAL REPORT |
We remain modestly overweight Europe, but our enthusiasm is tempered by weakening economic data, trade policy uncertainty, Brexit concerns, increased political tensions, and fiscal issues that are creating uncertainty. Much like our U.S. strategy, one side of the barbell is comprised ofpro-growth and cyclical companies that have the potential to benefit from macro improvement driven by increasing global stimulus, while the other side consists of traditional growth stocks that possess visible earnings growth. The Euro Area generally offers more attractive investment prospects than the UK, as Brexit continues to pose significant risks. Within the Euro Area, we have become more positive on industrial companies, notably German industrials, as they will benefit especially from a U.S.-China trade resolution and are trading at compelling valuations. We also prefer companies that generate a larger percentage of their growth from the United States.
Within Asia, we remain cautious on Japan based on its muted long-term growth outlook, an aging population and elevated central government indebtedness. Moderating growth, a coming consumption tax hike, and limited monetary easing options warrant further caution in the near term. Despite elevated U.S.-China trade tensions, we are sticking with our overweight position in China, as we expect its economy to muddle through with the assistance of government stimulus. While there may be additional downside risk to corporate earnings near term, valuations for Chinese equities generally remain attractive. Amid heightened trade talk uncertainty, we take a balanced investment approach, while favoring domestic demand-oriented stocks. We continue to overweight “new economy” names, as they are more exposed to domestic consumption and the industrial
digital upgrade, both of which should be less impacted by trade issues. Investments in consumer staples and utility stocks offer stable earnings and downside protection. We also remain positive on Indian and South Korean equities. Both countries are gaining from structural reforms and attractive stock valuations in those markets provide a “call option” on any improvement in global growth.
Regardless of region, we believe dividend-paying stocks have significant appeal at the present time. Many U.S. stocks now offer dividend yields greater than the10-year Treasury yield, while also providing capital appreciation potential as the market/ economic cycle progresses. Outside the U.S., dividend yields are generally higher and particularly attractive relative to $12 trillion in bonds (largely in Europe) trading at negative interest yields. Higher yields, reasonable valuations, and the opportunity to gain exposure to fast-growing emerging markets are key reasons for investing in international dividend growth stocks. A diversified portfolio of quality, growth-oriented dividend-paying companies can provide investors with the opportunity to participate in market gains, but also provide some downside protection if market fundamentals deteriorate.

Roger J. Sit
Chairman, President, CEO and Global CIO
| JUNE 30, 2019 | 3 |
|
OBJECTIVE & STRATEGY
The dual objectives of the Sit Balanced Fund are to seek long-term growth of capital consistent with the preservation of principal and to provide regular income. It pursues its objectives by investing in a diversified portfolio of stocks and bonds. The Fund may emphasize either equity securities or fixed-income securities, or hold equal amounts of each, dependent upon the Adviser’s analysis of market, financial and economic conditions.
The Fund’s permissible investment allocation is:35-65% in equity securities and35-65% in fixed-income securities. At all times at least 25% of the fixed-income assets will be invested in fixed-income senior securities.
The Sit Balanced Fund’s twelve-month return was +7.98%. The S&P 500® Index return was +10.42% over the period, while the Bloomberg Barclays Aggregate Bond Index gained +7.87%.
Stocks and bonds both posted very solid returns over the past twelve months. A weaker economic backdrop that led to falling interest rates boosted both bond prices and stock valuations, even as the earnings growth outlook became more challenging. Despite the recent slowdown, we believe that the economy remains in reasonable shape and that the expansion has more room to run, based on the enduring benefits from tax cuts, deregulation, easing financial conditions and healthy consumers. The Federal Reserve will likely do its part to sustain the expansion, as expectations for interest rate cuts have risen throughout the current year. Given the strong bounce back in stocks so far in 2019, we expect more muted gains over the near to intermediate term, given the many crosscurrents (e.g., trade, slower growth, Fed policy) facing investors. Within the equity portion of the Fund, we continue to favor a “Barbell” strategy, which includes holding pro-cyclical stocks (e.g., technology, industrials) balanced against holdings that are more defensive in nature (e.g., healthcare, consumer and telecom). Over the past year, the equity component of the Fund lagged the return for the S&P 500® Index, largely due to adverse stock selection in the energy minerals, health services and transportation sectors. Conversely, sectors that contributed positively to relative performance included consumer services, technology services and industrial services.
Returns for the fixed income portion of the portfolio were strongly positive on an absolute basis over the twelve-month period. The Fed had been on a multiyear plan to raise interest rates and remove excess liquidity from the economy, but adopted a more dovish monetary policy during early 2019 in response to slowing growth, moderating inflation, and ongoing trade tensions. Interest rates declined following this policy shift, under the expectation that the Fed may cut its benchmark fed funds rate to prop up the stock market. Despite a strongly positive absolute return, the fixed income portion of the portfolio underperformed its benchmark, primarily due to maintaining a shorter-than-benchmark duration as interest rates declined. However, while the portfolio lagged its benchmark on a price return basis, it outperformed on an income return basis, as a significant yield
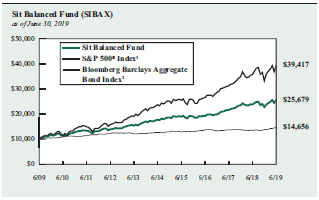
The chart above illustrates the total value of a hypothetical $10,000 investment in the Fund over the past 10 years as compared to the performance of the S&P 500® Index and the Bloomberg Barclays Aggregate Bond Index. Past performance does not guarantee future results. Returns include the reinvestment of distributions. The chart does not reflect the deduction of taxes that a shareholder would pay on Fund distributions or the redemption of Fund shares.
1 S&P 500® Index is an unmanaged capitalization-weighted index that measures the performance of 500 widely held common stocks oflarge-cap companies. It is not possible to invest directly in an index. This is the primary index for the equity portion of the Fund.
2 Bloomberg Barclays Aggregate Bond Index is an unmanaged market value-weighted index, which measures the performance of investment grade debt securities with maturities of at least one year. This is the primary index for the fixed income portion of the Fund.
advantage was sustained throughout the period. Overweights in theclosed-end fund and taxable municipal sectors also helped to offset duration-driven underperformance, as both sectors outperformed the benchmark for the fiscal year.
As of June 30th, the asset allocation of the Fund was 60% equities, 35% fixed income, and 5% cash and equivalents.
Roger J. Sit
Bryce A. Doty
Portfolio Managers
Information on this page is unaudited.
| 4 | SIT MUTUAL FUNDS ANNUAL REPORT |
|
COMPARATIVE RATES OF RETURNS
as of June 30, 2019
| Sit Balanced Fund | S&P 500® Index1 | Bloomberg Barclays Aggregate Bond Index 2 | ||||||||||
One Year | 7.98 | % | 10.42 | % | 7.87 | % | ||||||
Five Year | 7.68 | 10.71 | 2.95 | |||||||||
Ten Year | 9.89 | 14.70 | 3.90 | |||||||||
Since Inception (12/31/93) | 7.10 | 9.61 | 5.23 | |||||||||
Performance figures are historical and do not guarantee future results. Investment returns and principal value will vary, and you may have a gain or loss when you sell shares. Current performance may be lower or higher than the performance data quoted. Contact the Fund for performance data current to the most recentmonth-end. Returns include changes in share price as well as reinvestment of all dividends and capital gains. Returns do not reflect the deduction of taxes that a shareholder would pay on Fund distributions or the redemption of Fund shares. Management fees and administrative expenses are included in the Fund’s performance. Returns for periods greater than one year are compounded average annual rates of return.
1 S&P 500® Index is an unmanaged capitalization-weighted index that measures the performance of 500 widely held common stocks oflarge-cap companies. It is not possible to invest directly in an index.
2 Bloomberg Barclays Aggregate Bond Index is an unmanaged market value-weighted index which measures the performance of investment grade debt securities with maturities of at least one year.
PORTFOLIO SUMMARY
Net Asset Value 6/30/19: | $25.06 | Per Share | ||
Net Asset Value 6/30/18: | $23.76 | Per Share | ||
Total Net Assets: | $34.5 | Million |
TOP HOLDINGS
Top Equity Holdings:
| 1. | Microsoft Corp. |
| 2. | Visa, Inc. |
| 3. | Apple, Inc. |
| 4. | Amazon.com, Inc. |
| 5. | Alphabet, Inc. |
Top Fixed Income Holdings:
| 1. | U.S. Treasury Strip, 3.02%, 11/15/27 |
| 2. | Johnson & Johnson, 5.95%, 8/15/37 |
| 3. | Air Canada2015-1 Trust, 3.60%, 3/15/27 |
| 4. | Government National Mortgage Association, |
2018-147 AM, 7.00%, 10/20/48
| 5. | Central Fidelity Capital Trust I (Subordinated), |
3 Mo. Libor + 1.00, 3.60%, 4/15/27
Based on total net assets as of June 30, 2019. Subject to change.
FUND DIVERSIFICATION
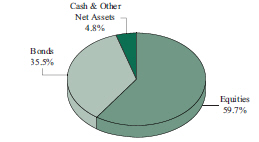
Based on total net assets as of June 30, 2019. Subject to change.
Information on this page is unaudited.
| JUNE 30, 2019 | 5 |
June 30, 2019
Sit Balanced Fund
Investments are grouped by economic sectors.
| Name of Issuer | Quantity | Fair Value ($) | ||||
Common Stocks - 59.7% | ||||||
Communications - 0.9% | ||||||
Verizon Communications, Inc. | 5,700 | 325,641 | ||||
Consumer Durables - 0.2% | ||||||
YETI Holdings, Inc.* | 2,075 | 60,071 | ||||
ConsumerNon-Durables - 3.9% | ||||||
Conagra Brands, Inc. | 5,750 | 152,490 | ||||
Constellation Brands, Inc. | 1,400 | 275,716 | ||||
Estee Lauder Cos., Inc. - Class A | 2,275 | 416,575 | ||||
PepsiCo, Inc. | 2,525 | 331,103 | ||||
VF Corp. | 1,925 | 168,149 | ||||
| ||||||
1,344,033 | ||||||
Consumer Services - 5.7% | ||||||
Marriott International, Inc. | 1,600 | 224,464 | ||||
McDonald’s Corp. | 1,225 | 254,384 | ||||
Starbucks Corp. | 4,550 | 381,427 | ||||
Visa, Inc. | 5,500 | 954,525 | ||||
Walt Disney Co. | 1,200 | 167,568 | ||||
| ||||||
1,982,368 | ||||||
Electronic Technology - 6.7% | ||||||
Advanced Micro Devices, Inc.* | 1,800 | 54,666 | ||||
Apple, Inc. | 4,125 | 816,420 | ||||
Applied Materials, Inc. | 7,575 | 340,193 | ||||
Arista Networks, Inc.* | 525 | 136,301 | ||||
Broadcom, Inc. | 1,460 | 420,276 | ||||
Ciena Corp.* | 4,400 | 180,972 | ||||
Corning, Inc. | 3,425 | 113,813 | ||||
Intel Corp. | 5,575 | 266,875 | ||||
| ||||||
2,329,516 | ||||||
Energy Minerals - 2.1% | ||||||
Chevron Corp. | 2,275 | 283,101 | ||||
EOG Resources, Inc. | 1,025 | 95,489 | ||||
Marathon Petroleum Corp. | 4,600 | 257,048 | ||||
Pioneer Natural Resources Co. | 550 | 84,623 | ||||
| ||||||
720,261 | ||||||
Finance - 5.8% | ||||||
Ameriprise Financial, Inc. | 1,625 | 235,885 | ||||
Chubb, Ltd. | 2,025 | 298,262 | ||||
First Republic Bank | 1,750 | 170,888 | ||||
Goldman Sachs Group, Inc. | 1,375 | 281,325 | ||||
JPMorgan Chase & Co. | 3,300 | 368,940 | ||||
Prudential Financial, Inc. | 2,800 | 282,800 | ||||
T Rowe Price Group, Inc. | 2,075 | 227,648 | ||||
US Bancorp | 2,675 | 140,170 | ||||
| ||||||
2,005,918 | ||||||
| Name of Issuer | Quantity | Fair Value ($) | ||||
Health Services - 1.6% | ||||||
UnitedHealth Group, Inc. | 2,250 | 549,022 | ||||
Health Technology - 4.9% | ||||||
Boston Scientific Corp.* | 6,875 | 295,488 | ||||
Celgene Corp.* | 1,025 | 94,751 | ||||
Illumina, Inc.* | 650 | 239,298 | ||||
Intuitive Surgical, Inc.* | 500 | 262,275 | ||||
Johnson & Johnson | 2,300 | 320,344 | ||||
Pfizer, Inc. | 2,775 | 120,213 | ||||
Thermo Fisher Scientific, Inc. | 1,200 | 352,416 | ||||
| ||||||
1,684,785 | ||||||
Process Industries - 2.1% | ||||||
Ecolab, Inc. | 1,800 | 355,392 | ||||
Sherwin-Williams Co. | 775 | 355,175 | ||||
| ||||||
710,567 | ||||||
Producer Manufacturing - 5.2% | ||||||
3M Co. | 875 | 151,672 | ||||
Boeing Co. | 625 | 227,506 | ||||
Deere & Co. | 775 | 128,425 | ||||
Honeywell International, Inc. | 1,925 | 336,086 | ||||
Ingersoll-Rand, PLC | 2,175 | 275,507 | ||||
Northrop Grumman Corp. | 500 | 161,555 | ||||
Parker-Hannifin Corp. | 1,000 | 170,010 | ||||
Raytheon Co. | 1,175 | 204,309 | ||||
United Technologies Corp. | 950 | 123,690 | ||||
| ||||||
1,778,760 | ||||||
Retail Trade - 4.3% | ||||||
Amazon.com, Inc.* | 410 | 776,388 | ||||
Home Depot, Inc. | 1,875 | 389,944 | ||||
TJX Cos., Inc. | 3,150 | 166,572 | ||||
Ulta Beauty, Inc.* | 480 | 166,507 | ||||
| ||||||
1,499,411 | ||||||
Technology Services - 14.0% | ||||||
Accenture, PLC | 2,025 | 374,159 | ||||
Adobe, Inc.* | 1,525 | 449,341 | ||||
Alphabet, Inc. - Class A* | 475 | 514,330 | ||||
Alphabet, Inc. - Class C* | 205 | 221,587 | ||||
Autodesk, Inc.* | 1,700 | 276,930 | ||||
Booking Holdings, Inc.* | 135 | 253,086 | ||||
Facebook, Inc.* | 1,575 | 303,975 | ||||
Intuit, Inc. | 1,250 | 326,662 | ||||
Microsoft Corp. | 7,375 | 987,955 | ||||
PayPal Holdings, Inc.* | 3,750 | 429,225 | ||||
Red Hat, Inc.* | 1,450 | 272,252 | ||||
salesforce.com, Inc.* | 2,675 | 405,878 | ||||
| ||||||
4,815,380 | ||||||
See accompanying notes to financial statements.
| 6 | SIT MUTUAL FUNDS ANNUAL REPORT |
| Name of Issuer | Quantity /Principal | Fair Value ($) | ||||
Transportation - 1.6% | ||||||
Delta Air Lines, Inc. | 3,400 | 192,950 | ||||
Union Pacific Corp. | 2,050 | 346,676 | ||||
| ||||||
539,626 | ||||||
Utilities - 0.7% | ||||||
NextEra Energy, Inc. | 1,150 | 235,589 | ||||
Total Common Stocks | 20,580,948 | |||||
| ||||||
Bonds - 32.1% | ||||||
Asset-Backed Securities - 2.4% | ||||||
Bayview Opportunity Master Fund, | 64,717 | 66,724 | ||||
Credit Suisse First Boston Mortgage Corp., 2005-AGE1 M3, 1 Mo. Libor + 0.65, 3.05%, 2/25/321 | 74,989 | 74,922 | ||||
Element Rail Leasing II, LLC,2016-1A B1, 5.93%, 3/19/464 | 75,000 | 79,474 | ||||
Irwin Home Equity Corp.,2005-1 M1, 5.92%, 6/25/3514 | 29,176 | 29,753 | ||||
New Century Home Equity Loan Trust,2005-A A4W, 4.68%, 8/25/3514 | 9,167 | 9,346 | ||||
OSCAR US Funding Trust VII, LLC: | ||||||
2017-2A A3, 2.45%, 12/10/214 | 150,000 | 149,899 | ||||
2017-2A A4, 2.76%, 12/10/244 | 100,000 | 100,754 | ||||
Small Business Administration: | ||||||
2008-20A 1, 5.17%, 1/1/28 | 45,295 | 48,409 | ||||
2007-20H 1, 5.78%, 8/1/27 | 46,773 | 50,204 | ||||
Towd Point Mortgage Trust: | ||||||
2019-3 A2, 4.00%, 2/25/591, 4 | 100,000 | 105,557 | ||||
2019-SJ1 A2, 4.17%, 11/25/581,4 | 100,000 | 103,039 | ||||
| ||||||
818,081 | ||||||
Collateralized Mortgage Obligations - 6.8% |
| |||||
Fannie Mae: | ||||||
2017-84 JP, 2.75%, 10/25/47 | 122,525 | 122,114 | ||||
2004-10 ZB, 6.00%, 2/25/34 | 122,039 | 137,045 | ||||
2003-34 A1, 6.00%, 4/25/43 | 39,647 | 45,072 | ||||
2004-T1 1A1, 6.00%, 1/25/44 | 26,231 | 29,522 | ||||
1999-17 C, 6.35%, 4/25/29 | 15,544 | 16,960 | ||||
2001-82 ZA, 6.50%, 1/25/32 | 19,928 | 22,220 | ||||
2009-30 AG, 6.50%, 5/25/39 | 58,006 | 64,282 | ||||
2013-28 WD, 6.50%, 5/25/42 | 57,589 | 66,470 | ||||
2004-T1 1A2, 6.50%, 1/25/44 | 84,402 | 96,393 | ||||
2004-W9 2A1, 6.50%, 2/25/44 | 18,267 | 20,852 | ||||
2015-88 CJ, 6.50%, 7/25/44 | 126,034 | 141,223 | ||||
2010-108 AP, 7.00%, 9/25/40 | 2,985 | 3,516 | ||||
2004-T3, 1A3, 7.00%, 2/25/44 | 8,509 | 9,893 | ||||
1993-21 KA, 7.70%, 3/25/23 | 31,445 | 33,446 | ||||
Freddie Mac: | ||||||
4729 AG, 3.00%, 1/15/44 | 100,000 | 101,898 | ||||
4784 BV, 3.50%, 12/15/32 | 100,000 | 102,984 | ||||
4480 VY, 3.50%, 6/15/35 | 150,000 | 156,767 | ||||
| Name of Issuer | Quantity /Principal | Fair Value ($) | ||||
4293 BA, 5.33%, 10/15/47 1 | 18,840 | 20,649 | ||||
2122 ZE, 6.00%, 2/15/29 | 74,356 | 83,347 | ||||
2126 C, 6.00%, 2/15/29 | 49,190 | 54,437 | ||||
2485 WG, 6.00%, 8/15/32 | 49,193 | 55,425 | ||||
2480 Z, 6.00%, 8/15/32 | 43,338 | 49,454 | ||||
2575 QE, 6.00%, 2/15/33 | 21,272 | 24,251 | ||||
2980 QA, 6.00%, 5/15/35 | 27,164 | 30,971 | ||||
2283 K, 6.50%, 12/15/23 | 7,815 | 8,293 | ||||
2357 ZJ, 6.50%, 9/15/31 | 25,029 | 27,900 | ||||
T-59 1A1, 6.50%, 10/25/43 | 72,327 | 85,868 | ||||
4520 HM, 6.50%, 8/15/45 | 47,423 | 56,772 | ||||
1142 IA, 7.00%, 10/15/21 | 28,247 | 29,058 | ||||
3946 KW, 7.00%, 11/15/29 | 2,706 | 2,774 | ||||
3704 CT, 7.00%, 12/15/36 | 19,804 | 23,188 | ||||
2238 PZ, 7.50%, 6/15/30 | 18,058 | 21,107 | ||||
Government National Mortgage Association: | ||||||
2002-57 BC, 6.00%, 8/20/32 | 27,116 | 27,237 | ||||
2002-57 DC, 6.00%, 8/20/32 | 22,108 | 22,208 | ||||
2015-80 BA, 6.98%, 6/20/451 | 34,772 | 39,996 | ||||
2018-147 AM, 7.00%, 10/20/48 | 146,322 | 169,069 | ||||
2018-160 DA, 7.00%, 11/20/48 | 123,688 | 150,678 | ||||
2014-69 W, 7.23%, 11/20/341 | 35,380 | 40,541 | ||||
2013-133 KQ, 7.30%, 8/20/381 | 33,353 | 38,234 | ||||
2005-74 HA, 7.50%, 9/16/35 | 15,608 | 16,841 | ||||
New Residential Mortgage Loan Trust,2016-2A B3, 5.68%, 11/26/351,4 | 43,753 | 47,967 | ||||
Vendee Mortgage Trust: | ||||||
2008-1 B, 6.62%, 3/15/25 1 | 15,146 | 17,254 | ||||
1994-2 2, 8.64%, 5/15/24 1 | 12,863 | 13,416 | ||||
| ||||||
2,327,592 | ||||||
Corporate Bonds - 11.9% | ||||||
Air Canada2015-1 Trust, 3.60%, 3/15/274 | 167,924 | 172,945 | ||||
Alphabet, Inc., 3.63%, 5/19/21 | 50,000 | 51,501 | ||||
American Airlines2015-2 Trust, 4.00%, 9/22/27 | 98,662 | 102,342 | ||||
American Airlines2016-2 Trust, 3.20%, 6/15/28 | 87,700 | 88,375 | ||||
Barclays Bank, PLC, 2.86%, 3/16/231 | 50,000 | 49,925 | ||||
Brighthouse Financial, Inc., 4.70%, 6/22/47 | 100,000 | 83,554 | ||||
Brown & Brown, Inc., 4.50%, 3/15/29 | 100,000 | 105,048 | ||||
Central Fidelity Capital Trust I (Subordinated), 3 Mo. Libor + 1.00, 3.60%, 4/15/271 | 175,000 | 161,875 | ||||
Charles Schwab Corp., 3.25%, 5/22/29 | 100,000 | 103,348 | ||||
Deere & Co., 6.55%, 10/1/28 | 100,000 | 129,547 | ||||
Doric Nimrod Air Alpha2013-1 Trust, 5.25%, 5/30/234 | 44,796 | 46,045 | ||||
Doric Nimrod Air Finance Alpha2012-1 Trust, 5.13%, 11/30/224 | 35,531 | 36,994 | ||||
Duke Energy Florida, LLC, 2.54%, 9/1/29 | 50,000 | 49,890 | ||||
Fairfax Financial Holdings, 4.85%, 4/17/28 | 100,000 | 105,437 | ||||
See accompanying notes to financial statements.
| JUNE 30, 2019 | 7 |
SCHEDULE OF INVESTMENTS
June 30, 2019
Sit Balanced Fund (Continued)
| Name of Issuer |
Principal | Fair Value ($) | ||||
First Maryland Capital II, 3 Mo. Libor + 0.85, 3.43%, 2/1/271 | 100,000 | 92,000 | ||||
General Mills, Inc., 3 Mo. Libor + 1.01, 3.60%, 10/17/231 | 100,000 | 100,982 | ||||
Guardian Life Insurance Co. of America (Subordinated), 4.85%, 1/24/774 | 38,000 | 42,938 | ||||
Hawaiian Airlines2013-1, 3.90%, 1/15/26 | 144,837 | 147,342 | ||||
HSBC Holdings, PLC, 3 Mo. Libor + 1.00, 3.52%, 5/18/241 | 100,000 | 100,266 | ||||
ITT, LLC, 7.40%, 11/15/25 | 25,000 | 30,893 | ||||
Johnson & Johnson, 5.95%, 8/15/37 | 150,000 | 209,033 | ||||
Kroger Co., 7.50%, 4/1/31 | 100,000 | 133,207 | ||||
Manufacturers & Traders Trust Co. (Subordinated), 3 Mo. Libor + 0.64, 3.16%, 12/1/211 | 150,000 | 149,607 | ||||
MassMutual Global Funding II, 3.40%, 3/8/264 | 50,000 | 52,367 | ||||
Mercury General Corp., 4.40%, 3/15/27 | 125,000 | 128,134 | ||||
Northern Trust Corp. (Subordinated), 3 Mo. Libor + 1.13, 3.38%, 5/8/321 | 150,000 | 151,282 | ||||
Pharmacia, LLC, 6.60%, 12/1/28 | 100,000 | 128,853 | ||||
PNC Bank NA (Subordinated), 4.05%, 7/26/28 | 100,000 | 108,904 | ||||
Principal Financial Group, Inc., 3 Mo. Libor + 3.04, 4.70%, 5/15/551 | 100,000 | 99,043 | ||||
Royal Caribbean Cruises, Ltd., 7.50%, 10/15/27 | 100,000 | 123,839 | ||||
Security Benefit Life Insurance Co. (Subordinated), 7.45%, 10/1/334 | 100,000 | 129,237 | ||||
Spirit AeroSystems, Inc., 4.60%, 6/15/28 | 100,000 | 104,914 | ||||
Spirit Airlines2015-1A Trust, 4.10%, 4/1/28 | 119,712 | 125,159 | ||||
United Airlines2014-1 Class A Pass Through Trust, 4.00%, 4/11/26 | 101,173 | 106,231 | ||||
United Airlines2015-1 Trust, 3.70%, 12/1/22 | 100,000 | 102,390 | ||||
UnitedHealth Group, Inc., 3.88%, 12/15/28 | 100,000 | 109,089 | ||||
US Airways2012-2 Trust, 4.63%, 6/3/25 | 124,406 | 134,399 | ||||
USF&G Capital (Subordinated), 8.31%, 7/1/464 | 100,000 | 153,051 | ||||
Williams Cos, Inc., 7.50%, 1/15/31 | 45,000 | 58,225 | ||||
| ||||||
4,108,211 | ||||||
Federal Home Loan Mortgage Corporation - 0.9% |
| |||||
5.00%, 10/1/43 | 100,460 | 108,547 | ||||
6.50%, 2/1/22 | 16,711 | 17,058 | ||||
7.50%, 7/1/29 | 135,498 | 157,931 | ||||
8.00%, 2/1/34 | 15,983 | 18,938 | ||||
8.38%, 5/17/20 | 122 | 122 | ||||
8.50%, 9/1/24 | 16,281 | 16,998 | ||||
| ||||||
319,594 | ||||||
| Name of Issuer |
Principal | Fair Value ($) | ||||
Federal National Mortgage Association - 2.5% |
| |||||
4.50%, 8/1/40 | 51,389 | 53,028 | ||||
5.00%, 2/1/33 | 29,063 | 30,350 | ||||
5.50%, 10/1/33 | 103,195 | 112,754 | ||||
6.00%, 2/1/38 | 54,782 | 62,646 | ||||
6.06%, 11/1/43 | 32,719 | 36,659 | ||||
6.50%, 2/1/24 | 21,927 | 23,029 | ||||
6.50%, 9/1/27 | 56,856 | 63,064 | ||||
6.50%, 6/1/40 | 132,534 | 149,261 | ||||
7.00%, 1/1/32 | 11,130 | 11,879 | ||||
7.00%, 3/1/33 | 29,476 | 33,385 | ||||
7.00%, 12/1/38 | 54,203 | 60,403 | ||||
8.00%, 6/1/24 | 13,073 | 13,991 | ||||
8.00%, 1/1/31 | 13,017 | 13,152 | ||||
8.00%, 2/1/31 | 19,823 | 24,271 | ||||
8.00%, 9/1/37 | 68,651 | 84,755 | ||||
8.46%, 7/15/26 | 3,548 | 3,775 | ||||
8.50%, 10/1/30 | 27,860 | 32,532 | ||||
10.00%, 6/1/31 | 38,348 | 42,172 | ||||
| ||||||
851,106 | ||||||
Government National Mortgage Association - 2.1% |
| |||||
5.00%, 5/20/48 | 142,236 | 152,463 | ||||
5.75%, 12/15/22 | 37,906 | 39,328 | ||||
6.00%, 4/15/29 | 44,241 | 49,691 | ||||
6.00%, 2/15/36 | 108,873 | 124,420 | ||||
6.00%, 7/15/38 | 60,794 | 69,432 | ||||
6.50%, 2/20/32 | 105,397 | 123,017 | ||||
6.50%, 11/20/38 | 25,895 | 29,846 | ||||
7.00%, 12/15/24 | 11,287 | 11,899 | ||||
7.00%, 11/20/27 | 14,816 | 16,846 | ||||
7.00%, 9/20/29 | 40,075 | 45,792 | ||||
7.00%, 9/20/38 | 13,249 | 15,854 | ||||
7.50%, 4/20/32 | 29,853 | 34,185 | ||||
8.00%, 7/15/24 | 9,252 | 9,724 | ||||
| ||||||
722,497 | ||||||
Taxable Municipal Securities - 3.8% | ||||||
Bucks Co. Industrial Dev. Auth., 4.00%, 10/1/21 | 95,000 | 95,787 | ||||
Illinois Hsg. Dev. Auth, 3.20%, 12/1/43 | 97,411 | 97,683 | ||||
Iowa Student Loan Liq., 3.75%, 12/1/338 | 100,000 | 104,024 | ||||
Kentucky Higher Edu. Student Loan Corp. (Subordinated), 5.27%, 6/1/36 | 100,000 | 106,604 | ||||
Massachusetts Edu. Auth.: | ||||||
4.00%, 1/1/32 | 20,000 | 20,679 | ||||
4.41%, 7/1/34 | 50,000 | 54,360 | ||||
MN Hsg. Fin. Agy., 4.73%, 1/1/49 | 100,000 | 108,610 | ||||
ND Hsg. Fin. Agy., 3.70%, 7/1/33 | 100,000 | 103,204 | ||||
Oklahoma Dev. Fin. Auth., 4.10%, 6/1/37 | 100,000 | 104,930 | ||||
Port of Portland, 4.24%, 7/1/49 | 100,000 | 104,507 | ||||
Public Finance Authority, 4.23%, 7/1/32 | 105,000 | 115,536 | ||||
So. Dakota Hsg. Dev. Auth., 3.89%, 5/1/32 | 15,000 | 15,592 | ||||
See accompanying notes to financial statements.
| 8 | SIT MUTUAL FUNDS ANNUAL REPORT |
| Name of Issuer |
Principal | Fair Value ($) | ||||
Texas Children’s Hospital, 3.37%, 10/1/29 17 | 115,000 | 120,788 | ||||
Texas St. Pub. Fin. Auth. Charter Sch. Fin., 8.75%, 8/15/27 | 60,000 | 61,627 | ||||
Tulane University, 2.82%, 2/15/361 | 95,000 | 89,688 | ||||
| ||||||
1,303,619 | ||||||
U.S. Treasury / Federal Agency Securities - 1.7% |
| |||||
U.S. Treasury Inflation, 0.88%, 1/15/29 | 101,206 | 106,525 | ||||
U.S. Treasury Strip, 2.42%, 11/15/276 | 575,000 | 488,795 | ||||
| ||||||
595,320 | ||||||
Total Bonds | 11,046,020 | |||||
| ||||||
Investment Companies - 3.4% | ||||||
BlackRock Credit Allocation Income Trust | 9,800 | 127,106 | ||||
BlackRock Enhanced Government Fund | 7,197 | 93,993 | ||||
BlackRock Income Trust | 20,900 | 126,445 | ||||
Duff & Phelps Utility and Corp. Bond Trust | 14,400 | 126,000 | ||||
Eaton Vance Short Duration Div. Inc. Fund | 9,500 | 128,630 | ||||
Eaton Vance, Ltd. Duration Inc. Fund | 9,800 | 123,970 | ||||
Franklin, Ltd. Duration, Income Trust | 6,453 | 62,142 | ||||
MFS Intermediate Income Trust | 16,500 | 63,690 | ||||
Nuveen Multi-Market Income Fund, Inc. | 3,953 | 28,975 | ||||
Putnam Master Intermediate Income Trust | 25,502 | 117,054 | ||||
WA Inflation-Linked Opp. & Inc. Fund | 10,600 | 118,614 | ||||
WA Inflation-Linked Sec. & Inc. Fund | 4,600 | 53,590 | ||||
| ||||||
Total Investment Companies | 1,170,209 | |||||
| ||||||
Short-Term Securities - 5.2% | ||||||
Fidelity Inst. Money Mkt. Gvt. Fund, 2.26% | 1,790,010 | 1,790,010 | ||||
| ||||||
(cost: $1,790,010) | ||||||
Total Investments in Securities - 100.4% | 34,587,187 | |||||
Other Assets and Liabilities, net - (0.4%) | (122,322) | |||||
| ||||||
Total Net Assets - 100.0% | $34,464,865 | |||||
| ||||||
| * | Non-income producing security. |
| 1 | Variable rate security. Rate disclosed is as of June 30, 2019. Certain variable rate securities are not based on a published reference rate and spread but are determined by the issuer or agent and are based on current market conditions, or, for mortgage-backed securities, are impacted by the individual mortgages which are paying off over time. These securities do not indicate a reference rate and spread in their descriptions. |
| 4 | 144A Restricted Security. The total value of such securities as of June 30, 2019 was $1,286,991 and represented 3.7% of net assets. These securities have been determined to be liquid by the Adviser in accordance with guidelines established by the Board of Directors. |
| 6 | Zero coupon or convertible capital appreciation bond, for which the rate disclosed is either the effective yield on purchase date or the coupon rate to be paid upon conversion to coupon paying. |
| 8 | Securities the income from which is treated as a tax preference that is included in alternative minimum taxable income for purposes of computing federal alternative minimum tax (AMT). At June 30, 2019, 0.3% of net assets in the Fund was invested in such securities. |
| 14 | Step Coupon: A bond that pays a coupon rate that increases on a specified date(s). Rate disclosed is as of June 30, 2019. |
| 17 | Security that is either an absolute and unconditional obligation of the UnitedStates Government or is collateralized by securities, loans, or leases guaranteed by the U.S. Government or its agencies or instrumentalities. |
LLC — Limited Liability Company |
PLC — Public Limited Company |
Numeric footnotes not disclosed are not applicable to this Schedule of Investments.
See accompanying notes to financial statements.
| JUNE 30, 2019 | 9 |
SCHEDULE OF INVESTMENTS
June 30, 2019
Sit Balanced Fund (Continued)
A summary of the levels for the Fund’s investments as of June 30, 2019 is as follows (see Note 2 - significant accounting policies in the notes to financial statements):
| Investment in Securities | ||||||||||||||
| Level 1 | Level 2 | Level 3 | ||||||||||||
| Quoted | Other significant | Significant | ||||||||||||
| Price ($) | observable inputs ($) | unobservable inputs ($) | Total ($) | |||||||||||
Common Stocks** | 20,580,948 | — | — | 20,580,948 | ||||||||||
Asset-Backed Securities | — | 818,081 | — | 818,081 | ||||||||||
Collateralized Mortgage Obligations | — | 2,327,592 | — | 2,327,592 | ||||||||||
Corporate Bonds | — | 4,108,211 | — | 4,108,211 | ||||||||||
Federal Home Loan Mortgage Corporation | — | 319,594 | — | 319,594 | ||||||||||
Federal National Mortgage Association | — | 851,106 | — | 851,106 | ||||||||||
Government National Mortgage Association | — | 722,497 | — | 722,497 | ||||||||||
Taxable Municipal Securities | — | 1,303,619 | — | 1,303,619 | ||||||||||
U.S. Treasury / Federal Agency Securities | — | 595,320 | — | 595,320 | ||||||||||
Investment Companies | 1,170,209 | — | — | 1,170,209 | ||||||||||
Short-Term Securities | 1,790,010 | — | — | 1,790,010 | ||||||||||
Total: | 23,541,167 | 11,046,020 | — | 34,587,187 | ||||||||||
| ** | For equity securities categorized in a single level, refer to the Schedule of Investments for further breakdown. |
There were no transfers into or out of level 3 during the reporting period.
See accompanying notes to financial statements.
| 10 | SIT MUTUAL FUNDS ANNUAL REPORT |
[This page intentionally left blank.]
| JUNE 30, 2019 | 11 |
Sit Dividend Growth Fund - Class I and Class S
|
OBJECTIVE & STRATEGY
The objective of the Sit Dividend Growth Fund is to provide current income that exceeds the dividend yield of the S&P 500® Index and that grows over a period of years. Secondarily, the Fund seeks long-term capital appreciation.
The Fund seeks to achieve its objectives by investing, under normal market conditions, at least 80% of its net assets in dividend-paying common stocks. The Fund may invest the balance of its assets in preferred stocks, convertible bonds, and U.S. Treasury securities.
The Sit Dividend Growth Fund Class I posted a +8.37% return over the last twelve months, compared to the +10.42% return for the S&P 500® Index. The Fund’s gross dividend yield (before deducting Fund expenses) was 2.45% as of 6/30/19, compared to 1.96% for the S&P 500® Index.
Large cap stocks produced solid gains over the past twelve months, overcoming a significantsell-off occurring at the end of 2018. With valuations for stocks now at “fair” levels, we expect increased volatility as investors grapple with a number of issues, including sluggish corporate earnings, trade negotiations, Federal Reserve policy and upcoming federal budget negotiations. While dividend-paying stocks, as a whole, have struggled to keep up in the technology-driven market in recent years, we believe there are strong prospects for improved performance. First, the lagging performance of dividend-paying stocks has resulted in compelling valuations for many high-quality stocks that provide both growth and income to investors. Second, stock buybacks appear to be peaking, as corporations have increased leverage in this low rate environment to generate incremental returns for investors (i.e., reducing the share count, thereby boosting earnings per share). With corporate debt levels at cycle highs and free cash flow growth moderating, we believe investors will increasingly focus on dividends as buybacks wane. Moreover, stock indices are hovering near record highs against a backdrop of sluggish corporate earnings growth. We believe incremental returns through dividends will take on greater importance, as future market appreciation, in our view, is likely to moderate.
We remain highly focused on firms that generate consistent growth in earnings and cash flow, and that maintain a commitment to increasing dividends to shareholders over the longer term. To this point, 72 out of 79 companies held in the Fund increased their dividends over the past twelve months, with an average increase of just over +11%.
Despite posting solid absolute returns, the Fund’s performance trailed the S&P 500® Index over the past year, largely due to a combination of stock selection and sector overweighting in two lagging sectors, energy minerals and process industries. These sectors were heavily impacted by negative sentiment around global growth and
HYPOTHETICAL GROWTH OF $10,000
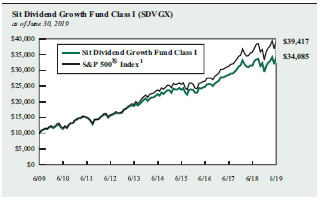
The chart above illustrates the total value of a hypothetical $10,000 investment in the Fund over the past 10 years as compared to the performance of the S&P 500® Index. Past performance does not guarantee future results. Returns include the reinvestment of distributions. The chart does not reflect the deduction of taxes that a shareholder would pay on Fund distributions or the redemption of Fund shares.
1 S&P 500® Index is an unmanaged capitalization-weighted index that measures the performance of 500 widely held common stocks oflarge-cap companies. It is not possible to invest directly in an index. This is the Fund’s primary index.
trade concerns. On a positive note, the Fund benefitted from strong stock selection in the industrial services, technology services and finance sectors. In terms of individual stocks, top performers included Xilinx, Synchrony Financial, Abbott Laboratories and Jacobs Engineering. Laggards over the period included Devon Energy, Occidental Petroleum, DuPont de Nemours and Conagra Brands.
Based on a combination oftop-down andbottom-up considerations, we believe that now is the time for investors to emphasize high quality, dividend-paying growth companies.
Roger J. Sit
Kent L. Johnson
Michael J. Stellmacher
Portfolio Managers
Information on this page is unaudited.
| 12 | SIT MUTUAL FUNDS ANNUAL REPORT |
|
COMPARATIVE RATES OF RETURNS
as of June 30, 2019
| Sit Dividend | ||||||||||||
| Growth Fund | S&P 500® Index 1 | |||||||||||
Class I | Class S | |||||||||||
One Year | 8.37 | % | 8.12 | % | 10.42 | % | ||||||
Five Year | 8.83 | 8.55 | 10.71 | |||||||||
Ten Year | 13.05 | 12.76 | 14.70 | |||||||||
Since Inception - Class I | 9.46 | n/a | 8.69 | |||||||||
(12/31/03) | ||||||||||||
Since Inception - Class S | n/a | 8.78 | 8.65 | |||||||||
(3/31/06) | ||||||||||||
Performance figures are historical and do not guarantee future results. Investment returns and principal value will vary, and you may have a gain or loss when you sell shares. Current performance may be lower or higher than the performance data quoted. Contact the Fund for performance data current to the most recentmonth-end. Returns include changes in share price as well as reinvestment of all dividends and capital gains. Returns do not reflect the deduction of the 2% redemption fee imposed if shares are redeemed or exchanged within 30 calendar days from their date of purchase. If imposed, the fee would reduce the performance quoted. Returns do not reflect the deduction of taxes that a shareholder would pay on Fund distributions or the redemption of Fund shares. Management fees and administrative expenses are included in the Fund’s performance. Returns for periods greater than one year are compounded average annual rates of return.
1 S&P 500® Index is an unmanaged capitalization-weighted index that measures the performance of 500 widely held common stocks oflarge-cap companies. It is not possible to invest directly in an index.
PORTFOLIO SUMMARY
Class I: | ||
Net Asset Value 6/30/19: | $14.45 Per Share | |
Net Asset Value 6/30/18: | $16.69 Per Share | |
Total Net Assets: | $214.2 Million | |
Class S: | ||
Net Asset Value 6/30/19: | $14.37 Per Share | |
Net Asset Value 6/30/18: | $16.61 Per Share | |
Total Net Assets: | $39.7 Million | |
Weighted Average Market Cap: | $182.9 Billion | |
TOP 10 HOLDINGS
1. Microsoft Corp.
2. Johnson & Johnson
3. Verizon Communications, Inc.
4. Apple, Inc.
5. Home Depot, Inc.
6. Broadcom, Inc.
7. Chevron Corp.
8. PepsiCo, Inc.
9. CenterPoint Energy, Inc.
10. Becton Dickinson and Co.
Based on total net assets as of June 30, 2019. Subject to change.
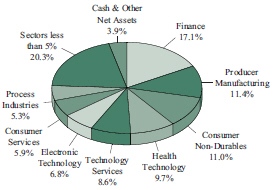
SECTOR ALLOCATION
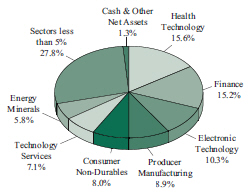
Based on total net assets as of June 30, 2019. Subject to change.
Information on this page is unaudited.
| JUNE 30, 2019 | 13 |
SCHEDULE OF INVESTMENTS
June 30, 2019
Sit Dividend Growth Fund
Investments are grouped by economic sectors.
Name of Issuer | Quantity | Fair Value ($) | ||||
Common Stocks - 98.7% | ||||||
Commercial Services - 0.8% | ||||||
S&P Global, Inc. | 8,675 | 1,976,078 | ||||
| ||||||
Communications - 3.4% | ||||||
American Tower Corp. | 7,075 | 1,446,484 | ||||
Verizon Communications, Inc. | 126,975 | 7,254,082 | ||||
| ||||||
8,700,566 | ||||||
ConsumerNon-Durables - 8.0% | ||||||
Coca-Cola Co. | 74,425 | 3,789,721 | ||||
Conagra Brands, Inc. | 114,300 | 3,031,236 | ||||
Constellation Brands, Inc. | 10,250 | 2,018,635 | ||||
Mondelez International, Inc. | 30,800 | 1,660,120 | ||||
PepsiCo, Inc. | 37,525 | 4,920,653 | ||||
Procter & Gamble Co. | 28,550 | 3,130,508 | ||||
VF Corp. | 21,325 | 1,862,739 | ||||
| ||||||
20,413,612 | ||||||
Consumer Services - 4.4% | ||||||
Comcast Corp. | 71,575 | 3,026,191 | ||||
Visa, Inc. | 23,225 | 4,030,699 | ||||
Walt Disney Co. | 28,450 | 3,972,758 | ||||
| ||||||
11,029,648 | ||||||
Electronic Technology - 10.3% | ||||||
Apple, Inc. | 36,175 | 7,159,756 | ||||
Applied Materials, Inc. | 59,725 | 2,682,250 | ||||
Broadcom, Inc. | 18,000 | 5,181,480 | ||||
Cisco Systems, Inc. | 37,400 | 2,046,902 | ||||
Corning, Inc. | 65,125 | 2,164,104 | ||||
Garmin, Ltd. | 23,525 | 1,877,295 | ||||
Intel Corp. | 64,650 | 3,094,796 | ||||
Skyworks Solutions, Inc. | 25,525 | 1,972,317 | ||||
| ||||||
26,178,900 | ||||||
Energy Minerals - 5.8% | ||||||
Chevron Corp. | 40,525 | 5,042,931 | ||||
ConocoPhillips | 42,275 | 2,578,775 | ||||
Marathon Petroleum Corp. | 12,525 | 699,897 | ||||
Suncor Energy, Inc. | 119,050 | 3,709,598 | ||||
Valero Energy Corp. | 31,975 | 2,737,380 | ||||
| ||||||
14,768,581 | ||||||
Finance - 15.2% | ||||||
Axis Capital Holdings, Ltd. | 27,575 | 1,644,849 | ||||
Chubb, Ltd. | 12,200 | 1,796,938 | ||||
CME Group, Inc. | 9,275 | 1,800,370 | ||||
Everest Re Group, Ltd. | 5,750 | 1,421,285 | ||||
Hartford Financial Services Group, Inc. | 57,850 | 3,223,402 | ||||
JPMorgan Chase & Co. | 38,875 | 4,346,225 | ||||
Lincoln National Corp. | 63,075 | 4,065,184 | ||||
Morgan Stanley | 58,450 | 2,560,694 | ||||
Physicians Realty Trust | 189,422 | 3,303,520 | ||||
Name of Issuer | Quantity | Fair Value ($) | ||||
Prudential Financial, Inc. | 20,950 | 2,115,950 | ||||
Reinsurance Group of America, Inc. | 14,400 | 2,246,832 | ||||
Synchrony Financial | 94,975 | 3,292,783 | ||||
T Rowe Price Group, Inc. | 33,175 | 3,639,629 | ||||
US Bancorp | 59,500 | 3,117,800 | ||||
| ||||||
38,575,461 | ||||||
Health Services - 2.7% | ||||||
Quest Diagnostics, Inc. | 25,325 | 2,578,338 | ||||
UnitedHealth Group, Inc. | 17,800 | 4,343,378 | ||||
| ||||||
6,921,716 | ||||||
Health Technology - 15.6% | ||||||
Abbott Laboratories | 44,600 | 3,750,860 | ||||
Agilent Technologies, Inc. | 29,250 | 2,184,097 | ||||
Amgen, Inc. | 14,325 | 2,639,811 | ||||
AstraZeneca, PLC, ADR | 36,200 | 1,494,336 | ||||
Baxter International, Inc. | 36,475 | 2,987,302 | ||||
Becton Dickinson and Co. | 17,775 | 4,479,478 | ||||
Johnson & Johnson | 53,350 | 7,430,588 | ||||
Medtronic, PLC | 38,825 | 3,781,167 | ||||
Merck & Co., Inc. | 47,650 | 3,995,452 | ||||
Pfizer, Inc. | 84,625 | 3,665,955 | ||||
Zimmer Biomet Holdings, Inc. | 28,008 | 3,297,662 | ||||
| ||||||
39,706,708 | ||||||
Industrial Services - 2.8% | ||||||
Jacobs Engineering Group, Inc. | 30,150 | 2,544,358 | ||||
Targa Resources Corp. | 51,875 | 2,036,612 | ||||
TC Energy Corp. | 49,400 | 2,446,288 | ||||
| ||||||
7,027,258 | ||||||
Process Industries - 2.3% | ||||||
Avery Dennison Corp. | 23,000 | 2,660,640 | ||||
Dow, Inc. | 27,925 | 1,376,982 | ||||
Sherwin-Williams Co. | 4,025 | 1,844,617 | ||||
| ||||||
5,882,239 | ||||||
Producer Manufacturing - 8.9% | ||||||
Boeing Co. | 7,575 | 2,757,376 | ||||
Eaton Corp., PLC | 35,550 | 2,960,604 | ||||
Emerson Electric Co. | 56,000 | 3,736,320 | ||||
Honeywell International, Inc. | 21,350 | 3,727,496 | ||||
Lockheed Martin Corp. | 11,150 | 4,053,471 | ||||
Northrop Grumman Corp. | 6,100 | 1,970,971 | ||||
United Technologies Corp. | 25,275 | 3,290,805 | ||||
| ||||||
22,497,043 | ||||||
Retail Trade - 4.9% | ||||||
CVS Health Corp. | 22,100 | 1,204,229 | ||||
Home Depot, Inc. | 27,100 | 5,635,987 | ||||
See accompanying notes to financial statements.
| 14 | SIT MUTUAL FUNDS ANNUAL REPORT |
Name of Issuer | Quantity | Fair Value ($) | ||||
Target Corp. | 29,975 | 2,596,135 | ||||
TJX Cos., Inc. | 58,425 | 3,089,514 | ||||
12,525,865 | ||||||
Technology Services - 7.1% | ||||||
Accenture, PLC | 15,700 | 2,900,889 | ||||
Alphabet, Inc. - Class A* | 1,625 | 1,759,550 | ||||
Intuit, Inc. | 7,500 | 1,959,975 | ||||
Microsoft Corp. | 84,275 | 11,289,479 | ||||
17,909,893 | ||||||
Transportation - 2.4% | ||||||
Delta Air Lines, Inc. | 41,050 | 2,329,588 | ||||
Union Pacific Corp. | 22,125 | 3,741,559 | ||||
6,071,147 | ||||||
Name of Issuer | Quantity | Fair Value ($) | ||||
Utilities - 4.1% | ||||||
CenterPoint Energy, Inc. | 159,575 | 4,568,632 | ||||
DTE Energy Co. | 18,700 | 2,391,356 | ||||
NextEra Energy, Inc. | 16,875 | 3,457,012 | ||||
10,417,000 | ||||||
Total Common Stocks | 250,601,715 | |||||
| ||||||
Short-Term Securities - 1.0% | ||||||
Fidelity Inst. Money Mkt. Gvt. Fund, 2.26% | 2,690,404 | 2,690,404 | ||||
(cost: $2,690,404) | ||||||
Total Investments in Securities - 99.7% | 253,292,119 | |||||
Other Assets and Liabilities, net - 0.3% | 640,233 | |||||
Total Net Assets - 100.0% | $253,932,352 | |||||
| ||||||
| * | Non-income producing security. |
ADR — American Depositary Receipt
PLC — Public Limited Company
Numeric footnotes not disclosed are not applicable to this Schedule of Investments.
A summary of the levels for the Fund’s investments as of June 30, 2019 is as follows (see Note 2 - significant accounting policies in the notes to financial statements):
| Investment in Securities | ||||||||||||
| Level 1 | Level 2 | Level 3 | ||||||||||
| Quoted | Other significant | Significant | ||||||||||
| Price ($) | observable inputs ($) | unobservable inputs ($) | Total ($) | |||||||||
Common Stocks ** | 250,601,715 | — | — | 250,601,715 | ||||||||
Short-Term Securities | 2,690,404 | — | — | 2,690,404 | ||||||||
Total: | 253,292,119 | — | — | 253,292,119 | ||||||||
| ** | For equity securities categorized in a single level, refer to the Schedule of Investments for further breakdown. |
There were no transfers into or out of level 3 during the reporting period.
See accompanying notes to financial statements.
| JUNE 30, 2019 | 15 |
Sit Global Dividend Growth Fund - Class I and Class S
|
OBJECTIVE & STRATEGY
The objective of the Sit Global Dividend Growth Fund is to provide current income that exceeds the dividend yield of the MSCI World Index and that grows over a period of years. Secondarily, the Fund seeks long-term capital appreciation.
The Fund seeks to achieve its objectives by investing, under normal market conditions, at least 80% of its net assets in dividend-paying common stocks issued by U.S. and foreign companies. The Fund may invest the balance of its assets in preferred stocks, convertible bonds, and U.S. Treasury securities.
The Global Dividend Growth Fund Class I shares outperformed the MSCI World Index for the twelve-month period ended June 30, 2019. The Fund’s Class I shares appreciated +9.18% versus a return of +6.33% for the MSCI World Index. Stock selection from both a geographic and industry perspective contributed to the relative outperformance.
Contributing favorably to relative outperformance during the twelve-month period were the Fund’s holdings in the food, beverage & tobacco (Nestle, PepsiCo, Mondelez and Constellation Brands), consumer services (Starbucks and McDonald’s), and utilities (Iberdrola and WEC Energy) industries. Conversely, the materials (DS Smith, DuPont de Nemours, Bayer, LyondellBassell Industries and Dow) and diversified financials (ARELIUS and T. Rowe Price) detracted from absolute and relative performance.
Geographically, all regions with the exception of Asia(ex-Japan) positively contributed to the relative performance. North America was the top contributing region thanks to holdings in Starbucks, Microsoft, Waste Management, Abbott Laboratories and Ingersoll-Rand.
We are generally constructive on global equities given moderate underlying growth prospects and supportive policy. However, elevated relative valuation, lingering macro uncertainty, Fed policy ambiguity, and rising geopolitical risks (i.e., U.S.-China trade deal, Iran, North Korea, etc.) highlight the importance of diversified portfolios focused on quality growth stocks that provide both upside opportunity and downside protection. We continue to balance investments inpro-cyclical growth stocks that provide compelling risk-reward opportunities with more predictable, secular growth stocks based on the likelihood that “end of cycle” fears will result in continued bouts of equity market volatility. While we believe a barbell-approach continues to provide a balanced risk-reward profile, portfolio composition has been shifted toward more stable, visible earnings growth investments. Thus, we reduced exposure to the industrial and transport sectors given fair valuations against a weakening backdrop. We have also reduced our holdings in select technology services stocks that offer less-compelling valuations. Cash levels have also been raised slightly ahead of anticipated volatility into second quarter corporate earnings reports. Finally, we have added to select investments in healthcare and consumer staples and favor exposure to P&C insurance within the financial sector due to an improved pricing environment and attractive valuation.
From a global perspective, we prefer more exposure to the U.S. and Asia(ex-Japan). We are concerned with Europe as we believe weak-
HYPOTHETICAL GROWTH OF $10,000
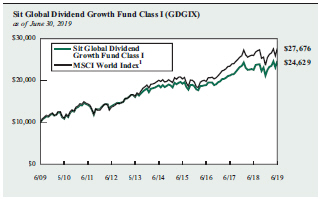
The chart above illustrates the total value of a hypothetical $10,000 investment in the Fund over the past 10 years (or for the life of the Fund if shorter) as compared to the performance of the MSCI World Index. Past performance does not guarantee future results. Returns include the reinvestment of distributions. The chart does not reflect the deduction of taxes that a shareholder would pay on Fund distributions or the redemption of Fund shares.
1 The MSCI World Index is a free float-adjusted market capitalization weighted index that is designed to measure the equity market performance of developed markets. It is not possible to invest directly in an index. This is the Fund’s primary index.
kening economic data, trade policy uncertainty, Brexit concerns, increased political tensions, and fiscal issues will create continued uncertainty. The main continent is preferred over the United Kingdom. We maintain an underweight stance in Japan. Our caution remains centered on Japan’s muted long-term growth outlook given an aging population and elevated central government indebtedness. Moderating growth, a coming consumption tax hike, and limited monetary easing options warrant further caution in the near term.
The Fund’s gross dividend yield (before deduction of Fund expenses) is 2.54% compared to the 2.44% yield of the MSCI World Index. In periods of low absolute returns, the dividend component of the return becomes more significant and this should benefit the dividend paying companies that are the focus of this strategy. The Fund continues to be well diversified and emphasizes high quality, dividend paying growth stocks. We believe the Fund is well positioned to outperform in down markets if financial market volatility picks up, as we believe it will throughout the remainder of 2019.
Roger J. Sit Raymond E. Sit Tasha M. Murdoff
Kent L. Johnson Michael J. Stellmacher
Portfolio Managers
Information on this page is unaudited.
| 16 | SIT MUTUAL FUNDS ANNUAL REPORT |
|
COMPARATIVE RATES OF RETURNS
as of June 30, 2019
| Sit Global | ||||||||||||
| Dividend | MSCI Index 1 | |||||||||||
| Growth Fund | ||||||||||||
Class I | Class S | |||||||||||
One Year | 9.18 | % | 8.98 | % | 6.33 | % | ||||||
Five Year | 5.52 | 5.27 | 6.60 | |||||||||
Ten Year | 9.43 | 9.16 | 10.72 | |||||||||
Since Inception | 8.53 | 8.27 | 8.06 | |||||||||
(9/30/08) | ||||||||||||
Performance figures are historical and do not guarantee future results. Investment returns and principal value will vary, and you may have a gain or loss when you sell shares. Current performance may be lower or higher than the performance data quoted. Contact the Fund for performance data current to the most recentmonth-end. Returns include changes in share price as well as reinvestment of all dividends and capital gains. Returns do not reflect the deduction of the 2% redemption fee imposed if shares are redeemed or exchanged within 30 calendar days from their date of purchase. If imposed, the fee would reduce the performance quoted. Returns do not reflect the deduction of taxes that a shareholder would pay on Fund distributions or the redemption of Fund shares. Management fees and administrative expenses are included in the Fund’s performance. Returns for periods greater than one year are compounded average annual rates of return.
1 The MSCI World Index is a free float-adjusted market capitalization weighted index that is designed to measure the equity market performance of developed markets. It is not possible to invest directly in an index.
PORTFOLIO SUMMARY
Class I: | ||
Net Asset Value 6/30/19: | $16.34 Per Share | |
Net Asset Value 6/30/18: | $15.24 Per Share | |
Total Net Assets: | $30.8 Million | |
Class S: | ||
Net Asset Value 6/30/19: | $16.33 Per Share | |
Net Asset Value 6/30/18: | $15.22 Per Share | |
Total Net Assets: | $3.2 Million | |
Weighted Average Market Cap: | $197.5 Billion | |
TOP 10 HOLDINGS
1. Microsoft Corp.
2. JPMorgan Chase & Co.
3. Verizon Communications, Inc.
4. Johnson & Johnson
5. Starbucks Corp.
6. Nestle SA
7. Allianz SE, ADR
8. Apple, Inc.
9. Union Pacific Corp.
10. PepsiCo, Inc.
Based on total net assets as of June 30, 2019. Subject to change.
SECTOR ALLOCATION
Based on total net assets as of June 30, 2019. Subject to change.
Information on this page is unaudited.
| JUNE 30, 2019 | 17 |
SCHEDULE OF INVESTMENTS
June 30, 2019
Sit Global Dividend Growth Fund
Investments are grouped by geographic region.
| Name of Issuer | Quantity | Fair Value ($) | ||||
Common Stocks - 96.1% | ||||||
Asia - 1.0% | ||||||
Australia - 1.0% | ||||||
Macquarie Group, Ltd. | 3,900 | 343,317 | ||||
| ||||||
Europe - 25.0% | ||||||
Finland - 0.4% | ||||||
Nokia OYJ, ADR | 28,300 | 141,783 | ||||
| ||||||
Germany - 5.9% | ||||||
adidas AG | 1,385 | 427,581 | ||||
Allianz SE, ADR | 35,000 | 842,800 | ||||
Aurelius SE & Co.* | 5,500 | 261,169 | ||||
Siemens AG | 4,100 | 487,657 | ||||
| ||||||
2,019,207 | ||||||
Ireland - 2.8% | ||||||
Accenture, PLC | 2,825 | 521,975 | ||||
Ingersoll-Rand, PLC | 3,275 | 414,844 | ||||
| ||||||
936,819 | ||||||
Netherlands - 2.2% | ||||||
ING Groep NV, ADR | 39,100 | 452,387 | ||||
LyondellBasell Industries NV | 3,225 | 277,769 | ||||
| ||||||
730,156 | ||||||
Spain - 2.6% | ||||||
Iberdrola SA | 60,400 | 602,056 | ||||
Industria de Diseno Textil SA | 9,800 | 294,748 | ||||
| ||||||
896,804 | ||||||
Switzerland - 3.4% | ||||||
Chubb, Ltd. | 1,750 | 257,758 | ||||
Nestle SA | 8,725 | 903,246 | ||||
| ||||||
1,161,004 | ||||||
United Kingdom - 7.7% | ||||||
AstraZeneca, PLC, ADR | 12,800 | 528,384 | ||||
BAE Systems, PLC | 51,500 | 324,005 | ||||
Cineworld Group, PLC | 84,475 | 271,846 | ||||
Diageo, PLC, ADR | 4,025 | 693,588 | ||||
DS Smith, PLC | 66,175 | 304,642 | ||||
RELX, PLC | 21,200 | 512,987 | ||||
| ||||||
2,635,452 | ||||||
North America - 70.1% | ||||||
Canada - 1.9% | ||||||
Suncor Energy, Inc. | 10,275 | 320,169 | ||||
TC Energy Corp. | 6,300 | 311,976 | ||||
| ||||||
632,145 | ||||||
| Name of Issuer | Quantity | Fair Value ($) | ||||
United States - 68.2% | ||||||
3M Co. | 2,225 | 385,682 | ||||
Abbott Laboratories | 8,300 | 698,030 | ||||
AbbVie, Inc. | 5,300 | 385,416 | ||||
Alphabet, Inc. - Class A* | 450 | 487,260 | ||||
Ameriprise Financial, Inc. | 600 | 87,096 | ||||
Apple, Inc. | 4,000 | 791,680 | ||||
Applied Materials, Inc. | 8,175 | 367,139 | ||||
Arthur J Gallagher & Co. | 3,775 | 330,652 | ||||
Bank of America Corp. | 16,300 | 472,700 | ||||
Boeing Co. | 600 | 218,406 | ||||
Broadcom, Inc. | 1,500 | 431,790 | ||||
CenterPoint Energy, Inc. | 5,100 | 146,013 | ||||
Chevron Corp. | 4,150 | 516,426 | ||||
Conagra Brands, Inc. | 11,200 | 297,024 | ||||
Constellation Brands, Inc. | 1,450 | 285,563 | ||||
Corning, Inc. | 5,500 | 182,765 | ||||
Delta Air Lines, Inc. | 8,250 | 468,187 | ||||
Domtar Corp. | 3,500 | 155,855 | ||||
Dow, Inc. | 3,133 | 154,488 | ||||
DuPont de Nemours, Inc. | 3,133 | 235,194 | ||||
Goldman Sachs Group, Inc. | 1,400 | 286,440 | ||||
Home Depot, Inc. | 3,000 | 623,910 | ||||
Honeywell International, Inc. | 3,200 | 558,688 | ||||
Intel Corp. | 8,625 | 412,879 | ||||
Johnson & Johnson | 6,925 | 964,514 | ||||
JPMorgan Chase & Co. | 9,650 | 1,078,870 | ||||
Lockheed Martin Corp. | 1,565 | 568,940 | ||||
Marathon Petroleum Corp. | 7,950 | 444,246 | ||||
McDonald’s Corp. | 1,525 | 316,681 | ||||
Microsoft Corp. | 14,400 | 1,929,024 | ||||
Mondelez International, Inc. | 7,100 | 382,690 | ||||
Parker-Hannifin Corp. | 1,050 | 178,510 | ||||
PepsiCo, Inc. | 5,775 | 757,276 | ||||
Pfizer, Inc. | 16,500 | 714,780 | ||||
Prudential Financial, Inc. | 3,725 | 376,225 | ||||
Rockwell Automation, Inc. | 1,825 | 298,990 | ||||
ScottsMiracle-Gro Co. | 3,225 | 317,662 | ||||
Sherwin-Williams Co. | 800 | 366,632 | ||||
Starbucks Corp. | 11,050 | 926,322 | ||||
T Rowe Price Group, Inc. | 4,800 | 526,608 | ||||
Union Pacific Corp. | 4,600 | 777,906 | ||||
United Technologies Corp. | 3,375 | 439,425 | ||||
UnitedHealth Group, Inc. | 675 | 164,707 | ||||
US Bancorp | 9,475 | 496,490 | ||||
Verizon Communications, Inc. | 17,400 | 994,062 | ||||
Waste Management, Inc. | 5,900 | 680,683 | ||||
WEC Energy Group, Inc. | 6,775 | 564,832 | ||||
| ||||||
23,245,358 | ||||||
Total Common Stocks | 32,742,045 | |||||
| ||||||
See accompanying notes to financial statements.
| 18 | SIT MUTUAL FUNDS ANNUAL REPORT |
| Name of Issuer | Quantity | Fair Value ($) | ||||
Short-Term Securities - 3.7% | ||||||
Fidelity Inst. Money Mkt. Gvt. Fund, 2.26% | 1,243,855 | 1,243,855 | ||||
(cost: $1,243,855) | ||||||
Total Investments in Securities - 99.8% | 33,985,900 | |||||
Other Assets and Liabilities, net - 0.2% | 77,399 | |||||
Total Net Assets - 100.0% | $34,063,299 | |||||
| * | Non-income producing security. |
ADR — American Depositary Receipt
PLC — Public Limited Company
Numeric footnotes not disclosed are not applicable to this Schedule of Investments.
A summary of the levels for the Fund’s investments as of June 30, 2019 is as follows (see Note 2 - significant accounting policies in the notes to financial statements):
| Investment in Securities | ||||||||||||||||
Level 1 |
Level 2 |
Level 3 | ||||||||||||||
| Quoted | Other significant | Significant | ||||||||||||||
| Price ($) | observable inputs ($) | unobservable inputs ($) | Total ($) | |||||||||||||
Common Stocks | ||||||||||||||||
Australia | 343,317 | — | — | 343,317 | ||||||||||||
Canada | 632,145 | — | — | 632,145 | ||||||||||||
Finland | 141,783 | — | — | 141,783 | ||||||||||||
Germany | 2,019,207 | — | — | 2,019,207 | ||||||||||||
Ireland | 936,819 | — | — | 936,819 | ||||||||||||
Netherlands | 730,156 | — | — | 730,156 | ||||||||||||
Spain | 896,804 | — | — | 896,804 | ||||||||||||
Switzerland | 1,161,004 | — | — | 1,161,004 | ||||||||||||
United Kingdom | 2,635,452 | — | — | 2,635,452 | ||||||||||||
United States | 23,245,358 | — | — | 23,245,358 | ||||||||||||
Short-Term Securities | 1,243,855 | — | — | 1,243,855 | ||||||||||||
Total: | 33,985,900 | — | — | 33,985,900 | ||||||||||||
Level 1 securities of foreign issuers are primarily American Depositary Receipts (ADRs), Public Limited Companies (PLCs) or Global Depositary Receipts (GDRs). There were no transfers into or out of level 3 during the reporting period.
See accompanying notes to financial statements.
| JUNE 30, 2019 | 19 |
|
OBJECTIVE & STRATEGY
The objective of the Sit Large Cap Growth Fund is to maximize long-term capital appreciation. The Fund pursues this objective by investing at least 80% of its net assets in the common stocks of domestic growth companies with capitalizations of $5 billion or more at the time of purchase.
The Sit Large Cap Growth Fund’sone-year return was +10.54%, compared to the +11.56% return for the Russell 1000® Growth Index. The S&P 500® Index return for the period was +10.42%.
Despite significant volatility, U.S. stocks posted solid gains over the past twelve months. While there has been some deceleration in economic activity in 2019, we believe the U.S. economy is in solid shape. Moreover, muted inflation has contributed to a precipitous decline in interest rates, with the Federal Reserve likely to cut short-term rates in the near term. While stocks have moved sharply higher following thesell-off at the end of 2018, we do not view valuations as excessive, particularly relative to the level of interest rates. Overall, this is an excellent backdrop for growth companies that can generate earnings growth even in a more challenging macro environment. In terms of strategy, we continue to believe market leadership of the technology sector will persist, as growth drivers (e.g., cloud computing,e-commerce, software artificial intelligence) remain firmly in place. The retail and consumer services sectors also have heavy weightings in the Fund, as the U.S. consumer’s balance sheets and incomes are solid, supporting strong growth for well-positioned companies.
Absolute performance in the Fund was strong over the past twelve months; however, it lagged its relative benchmark due mainly to stock selection in the technology services and finance sectors as well as an overweight position in the energy minerals sector, which was hurt by declining oil prices and souring investor sentiment. Not owning or being underweight high growth technology companies, like Facebook, Xilinx and Advanced Micro Devices, also detracted from relative performance. Conversely, stock selection in the consumernon-durables, consumer services and health technology sectors helped to boost the Fund’s performance. Here, positions in Starbucks (+75%), Thermo Fisher Scientific (+42%), and Visa (+32%) helped to enhance returns. Additionally, avoiding some of the weakest-performing
HYPOTHETICAL GROWTH OF $10,000
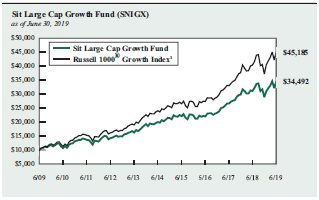
The chart above illustrates the total value of a hypothetical $10,000 investment in the Fund over the past 10 years as compared to the performance of the Russell 1000® Growth Index. Past performance does not guarantee future results. Returns include the reinvestment of distributions. The chart does not reflect the deduction of taxes that a shareholder would pay on Fund distributions or the redemption of Fund shares.
1 Russell 1000® Growth Index is an unmanaged index that measures the performance of those Russell 1000 Index companies with higherprice-to-book ratios and higher forecasted growth values. It is not possible to invest directly in an index. This is the Fund’s primary index.
health technology stocks, like Biogen and Bristol-Meyers Squib, as well as not owning any stocks in the lagging process industries sector added to relative performance.
We continue to be optimistic on the outlook for companies held in the Fund, and we appreciate shareholders’ continued interest.
Roger J. Sit
Ronald D. Sit
Michael J. Stellmacher
Portfolio Managers
Information on this page is unaudited.
| 20 | SIT MUTUAL FUNDS ANNUAL REPORT |
|
COMPARATIVE RATES OF RETURNS
as of June 30, 2019
| Sit Large Cap Growth Fund | Russell 1000® Growth Index 1 | Russell 1000® Index 2 | ||||
One Year | 10.54% | 11.56% | 10.02% | |||
Five Year | 11.42 | 13.39 | 10.45 | |||
Ten Year | 13.18 | 16.28 | 14.77 | |||
Since Inception3 (9/2/82) | 10.21 | 11.44 | 11.79 |
Performance figures are historical and do not guarantee future results. Investment returns and principal value will vary, and you may have a gain or loss when you sell shares. Current performance may be lower or higher than the performance data quoted. Contact the Fund for performance data current to the most recentmonth-end. Returns include changes in share price as well as reinvestment of all dividends and capital gains. Returns do not reflect the deduction of the 2% redemption fee imposed if shares are redeemed or exchanged within 30 calendar days from their date of purchase. If imposed, the fee would reduce the performance quoted. Returns do not reflect the deduction of taxes that a shareholder would pay on Fund distributions or the redemption of Fund shares. Management fees and administrative expenses are included in the Fund’s performance. Returns for periods greater than one year are compounded average annual rates of return.
1 Russell 1000® Growth Index is an unmanaged index that measures the performance of those Russell 1000 Index companies with higherprice-to-book ratios and higher forecasted growth values. It is not possible to invest directly in an index.
2 Russell 1000® Index is an unmanaged index that measures the performance of approximately 1,000 of the largest U.S. companies by market capitalization.
3 On 6/6/93, the Fund’s investment objective changed to allow for a portfolio of 100% stocks. Prior to that time, the portfolio was required to contain no more than 80% stocks.
PORTFOLIO SUMMARY
Net Asset Value 6/30/19: | $ | 42.53 | Per Share | |||
Net Asset Value 6/30/18: | $ | 42.40 | Per Share | |||
Total Net Assets: | $ | 116.6 | Million | |||
Weighted Average Market Cap: | $ | 306.0 | Billion |
TOP 10 HOLDINGS
| 1. Microsoft | Corp. |
| 2. Apple, | Inc. |
| 3. Alphabet, | Inc. |
| 4. Amazon.com, | Inc. |
| 5. Visa, | Inc. |
| 6. UnitedHealth | Group, Inc. |
| 7. Facebook, | Inc. |
| 8. Adobe, | Inc. |
| 9. salesforce.com, | Inc. |
| 10. Home | Depot, Inc. |
Based on total net assets as of June 30, 2019. Subject to change.
SECTOR ALLOCATION
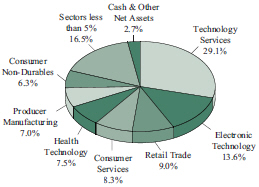
Based on total net assets as of June 30, 2019. Subject to change.
Information on this page is unaudited.
| JUNE 30, 2019 | 21 |
SCHEDULE OF INVESTMENTS
June 30, 2019
Sit Large Cap Growth Fund
Investments are grouped by economic sectors.
Name of Issuer | Quantity | Fair Value ($) | ||||
Common Stocks - 97.3% | ||||||
Communications - 1.0% | ||||||
Verizon Communications, Inc. | 20,925 | 1,195,445 | ||||
Consumer Durables - 0.5% | ||||||
YETI Holdings, Inc.* | 21,325 | 617,359 | ||||
ConsumerNon-Durables - 6.3% | ||||||
Conagra Brands, Inc. | 31,050 | 823,446 | ||||
Constellation Brands, Inc. | 7,425 | 1,462,280 | ||||
Estee Lauder Cos., Inc. - Class A | 13,075 | 2,394,163 | ||||
PepsiCo, Inc. | 15,700 | 2,058,741 | ||||
VF Corp. | 7,300 | 637,655 | ||||
| ||||||
7,376,285 | ||||||
Consumer Services - 8.3% | ||||||
Marriott International, Inc. | 8,600 | 1,206,494 | ||||
McDonald’s Corp. | 4,700 | 976,002 | ||||
Starbucks Corp. | 21,900 | 1,835,877 | ||||
Visa, Inc. | 27,300 | 4,737,915 | ||||
Walt Disney Co. | 6,200 | 865,768 | ||||
| ||||||
9,622,056 | ||||||
Electronic Technology - 13.6% | ||||||
Advanced Micro Devices, Inc.* | 9,400 | 285,478 | ||||
Apple, Inc. | 39,300 | 7,778,256 | ||||
Applied Materials, Inc. | 40,100 | 1,800,891 | ||||
Arista Networks, Inc.* | 2,750 | 713,955 | ||||
Broadcom, Inc. | 7,800 | 2,245,308 | ||||
Ciena Corp.* | 23,500 | 966,555 | ||||
Corning, Inc. | 18,250 | 606,448 | ||||
Intel Corp. | 16,800 | 804,216 | ||||
NVIDIA Corp. | 3,725 | 611,757 | ||||
| ||||||
15,812,864 | ||||||
Energy Minerals - 1.3% | ||||||
Chevron Corp. | 2,600 | 323,544 | ||||
Marathon Petroleum Corp. | 15,500 | 866,140 | ||||
Pioneer Natural Resources Co. | 2,300 | 353,878 | ||||
| ||||||
1,543,562 | ||||||
Finance - 4.8% | ||||||
Bank of America Corp. | 20,400 | 591,600 | ||||
Chubb, Ltd. | 5,050 | 743,814 | ||||
Goldman Sachs Group, Inc. | 5,600 | 1,145,760 | ||||
JPMorgan Chase & Co. | 7,200 | 804,960 | ||||
Prudential Financial, Inc. | 10,600 | 1,070,600 | ||||
T Rowe Price Group, Inc. | 11,125 | 1,220,524 | ||||
| ||||||
5,577,258 | ||||||
Health Services - 2.7% | ||||||
UnitedHealth Group, Inc. | 13,000 | 3,172,130 | ||||
Name of Issuer | Quantity | Fair��Value ($) | ||||
Health Technology - 7.5% | ||||||
AbbVie, Inc. | 5,675 | 412,686 | ||||
Boston Scientific Corp.* | 36,700 | 1,577,366 | ||||
Celgene Corp.* | 4,325 | 399,803 | ||||
Illumina, Inc.* | 3,500 | 1,288,525 | ||||
Intuitive Surgical, Inc.* | 2,600 | 1,363,830 | ||||
Johnson & Johnson | 11,000 | 1,532,080 | ||||
Pfizer, Inc. | 13,200 | 571,824 | ||||
Thermo Fisher Scientific, Inc. | 5,250 | 1,541,820 | ||||
| ||||||
8,687,934 | ||||||
Process Industries - 3.0% | ||||||
Ecolab, Inc. | 8,425 | 1,663,432 | ||||
Sherwin-Williams Co. | 4,000 | 1,833,160 | ||||
| ||||||
3,496,592 | ||||||
Producer Manufacturing - 7.0% | ||||||
3M Co. | 5,450 | 944,703 | ||||
Boeing Co. | 3,250 | 1,183,032 | ||||
Honeywell International, Inc. | 9,925 | 1,732,806 | ||||
Ingersoll-Rand, PLC | 10,700 | 1,355,369 | ||||
Northrop Grumman Corp. | 2,700 | 872,397 | ||||
Parker-Hannifin Corp. | 1,700 | 289,017 | ||||
Raytheon Co. | 6,300 | 1,095,444 | ||||
United Technologies Corp. | 4,900 | 637,980 | ||||
| ||||||
8,110,748 | ||||||
Retail Trade - 9.0% | ||||||
Amazon.com, Inc.* | 3,000 | 5,680,890 | ||||
Home Depot, Inc. | 11,700 | 2,433,249 | ||||
TJX Cos., Inc. | 26,000 | 1,374,880 | ||||
Ulta Beauty, Inc.* | 3,000 | 1,040,670 | ||||
| ||||||
10,529,689 | ||||||
Technology Services - 29.1% | ||||||
Accenture, PLC | 11,425 | 2,110,997 | ||||
Adobe, Inc.* | 9,150 | 2,696,048 | ||||
Alphabet, Inc. - Class A* | 625 | 676,750 | ||||
Alphabet, Inc. - Class C* | 5,966 | 6,448,709 | ||||
Autodesk, Inc.* | 9,800 | 1,596,420 | ||||
Booking Holdings, Inc.* | 890 | 1,668,492 | ||||
Facebook, Inc.* | 15,750 | 3,039,750 | ||||
Intuit, Inc. | 6,600 | 1,724,778 | ||||
Microsoft Corp. | 62,000 | 8,305,520 | ||||
PayPal Holdings, Inc.* | 19,300 | 2,209,078 | ||||
Red Hat, Inc.* | 5,200 | 976,352 | ||||
salesforce.com, Inc.* | 16,325 | 2,476,992 | ||||
| ||||||
33,929,886 | ||||||
See accompanying notes to financial statements.
| 22 | SIT MUTUAL FUNDS ANNUAL REPORT |
Name of Issuer | Quantity | Fair Value ($) | ||||
Transportation - 2.5% | ||||||
Delta Air Lines, Inc. | 18,400 | 1,044,200 | ||||
Union Pacific Corp. | 11,000 | 1,860,210 | ||||
| ||||||
2,904,410 | ||||||
Utilities - 0.7% | ||||||
NextEra Energy, Inc. | 4,000 | 819,440 | ||||
| ||||||
Total Common Stocks | 113,395,658 | |||||
| ||||||
Name of Issuer | Quantity | Fair Value ($) | ||||
Short-Term Securities - 2.8% | ||||||
Fidelity Inst. Money Mkt. Gvt. Fund, 2.26% | 3,312,680 | 3,312,680 | ||||
| ||||||
(cost: $3,312,680) | ||||||
Total Investments in Securities - 100.1% | 116,708,338 | |||||
Other Assets and Liabilities, net - (0.1%) | (126,898) | |||||
| ||||||
Total Net Assets - 100.0% | $116,581,440 | |||||
| ||||||
| * | Non-income producing security. |
PLC — Public Limited Company |
Numeric footnotes not disclosed are not applicable to this Schedule of Investments.
A summary of the levels for the Fund’s investments as of June 30, 2019 is as follows (see Note 2 - significant accounting policies in the notes to financial statements):
| Investment in Securities | ||||||||||||
Level 1 | Level 2 | Level 3 | ||||||||||
| Quoted | Other significant | Significant | ||||||||||
| Price ($) | observable inputs ($) | unobservable inputs ($) | Total ($) | |||||||||
Common Stocks ** | 113,395,658 | — | — | 113,395,658 | ||||||||
Short-Term Securities | 3,312,680 | — | — | 3,312,680 | ||||||||
Total: | 116,708,338 | — | — | 116,708,338 | ||||||||
| ** | For equity securities categorized in a single level, refer to the Schedule of Investments for further breakdown. |
There were no transfers into or out of level 3 during the reporting period.
See accompanying notes to financial statements.
| JUNE 30, 2019 | 23 |
Sit ESG Growth Fund - Class I and Class S
|
OBJECTIVE & STRATEGY
The objective of the Sit ESG Growth Fund is to maximize long-term capital appreciation. The Fund seeks to achieve its objectives by investing, under normal market conditions, at least 80% of its net assets in companies that the Adviser believes have strong environmental, social and corporate governance (ESG) practices at the time of purchase. The Fund invests in common stocks of U.S. and foreign companies, primarily of large to medium capitalizations (companies with market capitalization in excess of $2 billion).
The Sit ESG Growth Fund Class I shares outperformed the MSCI World Index for the twelve-month period ended June 30, 2019. The Fund’s Class I shares appreciated +8.30% versus a return of +6.33% for the MSCI World Index. Stock selection, geographic and industry allocation and currency allocation all positively contributed to relative outperformance for the aforementioned period.
Contributing favorably to relative outperformance during the twelve-month period were the Fund’s holdings in the consumer services (Starbucks and Visa), food, beverage & tobacco (Nestle, PepsiCo, and Coca-Cola European Partners), and capital goods (Ingersoll-Rand and Lockhead Martin) industries. Conversely, the pharmaceutical holding of AbbVie, transportation holding of FedEx, and materials holdings (DuPont de Nemours, Bayer, and Dow) detracted from absolute and relative performance.
From a geographic standpoint, the regions of United Kingdom (Coca-Cola European Partners, Astrazeneca and RELX) and North America (Starbucks, Ingersoll-Rand, Ecolab, Microsoft and Boston Scientific) added value due to positive stock selection, and in the case of Japan, being materially underweight the MSCI World Index. However, the underweight in Asiaex-Japan relative to the MSCI World Index and holding cash negatively impacted the Fund.
We are generally constructive on global equities given solid underlying growth prospects and supportive policy. However, elevated relative valuation, lingering macro uncertainty, Fed policy ambiguity, and rising geopolitical risks (i.e., U.S.-China trade deal, Iran, North Korea, etc.) highlight the importance of diversified portfolios focused on quality growth stocks that provide both upside opportunity and downside protection. We continue to balance investments inpro-cyclical growth stocks that provide compelling risk-reward opportunities with more predictable, secular growth stocks based on the likelihood that “end of cycle” fears will result in continued bouts of equity market volatility. While we believe a barbell-approach continues to provide a balanced risk-reward profile, portfolio composition has been shifted toward more stable, visible earnings growth investments. Thus, we reduced exposure to the industrial and transport sectors given fair valuations against a weakening backdrop. We have also reduced our holdings in select technology services stocks that offer less-compelling valuations. Cash levels have also been raised slightly ahead of anticipated volatility into second quarter corporate earnings reports. Finally, we have added to select investments in healthcare and consumer staples and favor exposure to P&C insurance within the financial sector due to an improved pricing environment and attractive valuation.
HYPOTHETICAL GROWTH OF $10,000
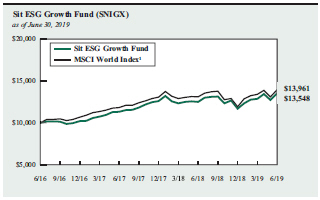
The chart above illustrates the total value of a hypothetical $10,000 investment in the Fund over the past 10 years (or for the life of the Fund if shorter) as compared to the performance of the MSCI World Index. Past performance does not guarantee future results. Returns include the reinvestment of distributions. The chart does not reflect the deduction of taxes that a shareholder would pay on Fund distributions or the redemption of Fund shares.
1 The MSCI World Index is a free float-adjusted market capitalization weighted index that is designed to measure the equity market performance of developed markets. It is not possible to invest directly in an index. This is the Fund’s primary index.
From a global perspective, we prefer more exposure to the U.S. and Asia(ex-Japan). We are concerned with Europe as we believe weakening economic data, trade policy uncertainty, Brexit concerns, increased political tensions, and fiscal issues will create continued uncertainty. The main continent is preferred over the United Kingdom. We maintain an underweight stance in Japan. Our caution remains centered on Japan’s muted long-term growth outlook given an aging population and elevated central government indebtedness. Moderating growth, a coming consumption tax hike, and limited monetary easing options warrant further caution in the near term.
The focus of the Sit ESG Fund is to invest at least 80% of the assets in companies that have strong ESG (environmental, social and corporate governance) practices. We remain positive about the long-term outlook for companies held in the Fund based on attractive valuations and sustainable earnings growth potential.
Roger J. Sit
Ronald D. Sit
Michael J. Stellmacher
Portfolio Managers
Information on this page is unaudited.
| 24 | SIT MUTUAL FUNDS ANNUAL REPORT |
|
COMPARATIVE RATES OF RETURNS
as of June 30, 2019
| Sit ESG | MSCI World Index 1 | |||||||||||
| Growth Fund | ||||||||||||
Class I | Class S | |||||||||||
One Year | 8.30 | % | 8.01 | % | 6.33 | % | ||||||
Since Inception (6/30/16) | 10.65 | 10.37 | 11.77 | |||||||||
Performance figures are historical and do not guarantee future results. Investment returns and principal value will vary, and you may have a gain or loss when you sell shares. Current performance may be lower or higher than the performance data quoted. Contact the Fund for performance data current to the most recentmonth-end. Returns include changes in share price as well as reinvestment of all dividends and capital gains. Returns do not reflect the deduction of the 2% redemption fee imposed if shares are redeemed or exchanged within 30 calendar days from their date of purchase. If imposed, the fee would reduce the performance quoted. Returns do not reflect the deduction of taxes that a shareholder would pay on Fund distributions or the redemption of Fund shares. Management fees and administrative expenses are included in the Fund’s performance. Returns for periods greater than one year are compounded average annual rates of return.
1 The MSCI World Index is a free float-adjusted market capitalization weighted index that is designed to measure the equity market performance of developed markets. It is not possible to invest directly in an index.
PORTFOLIO SUMMARY
Class I: | ||||||
Net Asset Value 6/30/19: | $13.21 | Per Share | ||||
Net Asset Value 6/30/18: | $12.37 | Per Share | ||||
Total Net Assets: | $3.4 | Million | ||||
Class S: | ||||||
Net Asset Value 6/30/19: | $13.16 | Per Share | ||||
Net Asset Value 6/30/18: | $12.34 | Per Share | ||||
Total Net Assets: | $2.9 | Million | ||||
Weighted Average Market Cap: | $196.8 | Billion |
TOP 10 HOLDINGS
| 1. Microsoft | Corp. |
| 2. Allianz | SE, ADR |
| 3. Starbucks | Corp. |
4. Ingersoll-Rand, PLC
| 5. JPMorgan | Chase & Co. |
| 6. Verizon | Communications, Inc. |
| 7. Nestle | SA, ADR |
| 8. Apple, | Inc. |
| 9. Home | Depot, Inc. |
| 10. Ecolab, | Inc. |
Based on total net assets as of June 30, 2019. Subject to change.
SECTOR ALLOCATION
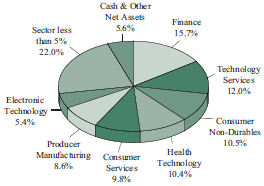
Based on total net assets as of June 30, 2019. Subject to change.
Information on this page is unaudited.
| JUNE 30, 2019 | 25 |
SCHEDULE OF INVESTMENTS
June 30, 2019
Sit ESG Growth Fund
Investments are grouped by geographic region.
| Name of Issuer | Quantity | Fair Value ($) | ||||
Common Stocks - 94.4% | ||||||
Asia - 0.7% | ||||||
Japan - 0.7% | ||||||
Sony Corp., ADR | 800 | 41,912 | ||||
| ||||||
Europe - 26.8% | ||||||
Germany - 6.8% | ||||||
adidas AG, ADR | 550 | 84,816 | ||||
Allianz SE, ADR | 9,900 | 238,392 | ||||
Siemens AG, ADR | 1,725 | 102,914 | ||||
| ||||||
426,122 | ||||||
Ireland - 4.6% | ||||||
Accenture, PLC | 450 | 83,146 | ||||
Ingersoll-Rand, PLC | 1,625 | 205,839 | ||||
| ||||||
288,985 | ||||||
Netherlands - 2.2% | ||||||
ING Groep NV, ADR | 12,075 | 139,708 | ||||
| ||||||
Spain - 3.1% | ||||||
Iberdrola SA, ADR | 2,950 | 117,100 | ||||
Industria de Diseno Textil SA | 2,575 | 77,446 | ||||
| ||||||
194,546 | ||||||
Switzerland - 2.5% | ||||||
Nestle SA, ADR | 1,550 | 160,270 | ||||
| ||||||
United Kingdom - 7.6% | ||||||
AstraZeneca, PLC, ADR | 1,575 | 65,016 | ||||
Coca-Cola European Partners, PLC | 2,100 | 118,650 | ||||
Diageo, PLC, ADR | 700 | 120,624 | ||||
RELX, PLC, ADR | 4,700 | 114,727 | ||||
Royal Dutch Shell, PLC, ADR - Class B | 875 | 57,522 | ||||
| ||||||
476,539 | ||||||
North America - 66.9% | ||||||
Canada - 2.1% | ||||||
Suncor Energy, Inc. | 4,100 | 127,756 | ||||
| ||||||
United States - 64.8% | ||||||
3M Co. | 600 | 104,004 | ||||
AbbVie, Inc. | 1,450 | 105,444 | ||||
Adobe, Inc.* | 500 | 147,325 | ||||
Allstate Corp. | 525 | 53,387 | ||||
Alphabet, Inc. - Class A* | 125 | 135,350 | ||||
Apple, Inc. | 800 | 158,336 | ||||
Baxter International, Inc. | 850 | 69,615 | ||||
Boston Scientific Corp.* | 3,000 | 128,940 | ||||
ConocoPhillips | 1,250 | 76,250 | ||||
Corning, Inc. | 975 | 32,399 | ||||
Delta Air Lines, Inc. | 1,500 | 85,125 | ||||
Dow, Inc. | 566 | 27,909 | ||||
DuPont de Nemours, Inc. | 566 | 42,490 | ||||
Ecolab, Inc. | 775 | 153,016 | ||||
Facebook, Inc.* | 320 | 61,760 | ||||
| Name of Issuer | Quantity | Fair Value ($) | ||||
FedEx Corp. | 250 | 41,048 | ||||
Goldman Sachs Group, Inc. | 600 | 122,760 | ||||
Home Depot, Inc. | 745 | 154,938 | ||||
Intel Corp. | 3,050 | 146,004 | ||||
Johnson &Johnson | 975 | 135,798 | ||||
JPMorgan Chase & Co. | 1,725 | 192,855 | ||||
Lockheed Martin Corp. | 185 | 67,255 | ||||
Marriott International, Inc. | 850 | 119,247 | ||||
Microsoft Corp. | 2,000 | 267,920 | ||||
NIKE, Inc. | 700 | 58,765 | ||||
PepsiCo, Inc. | 875 | 114,739 | ||||
Pfizer, Inc. | 3,375 | 146,205 | ||||
Prudential Financial, Inc. | 1,100 | 111,100 | ||||
Rockwell Automation, Inc. | 350 | 57,341 | ||||
salesforce.com, Inc.* | 400 | 60,692 | ||||
Starbucks Corp. | 2,750 | 230,532 | ||||
T Rowe Price Group, Inc. | 1,175 | 128,909 | ||||
TJX Cos., Inc. | 1,380 | 72,974 | ||||
UnitedHealth Group, Inc. | 500 | 122,005 | ||||
Verizon Communications, Inc. | 3,300 | 188,529 | ||||
Visa, Inc. | 875 | 151,856 | ||||
| ||||||
4,072,822 | ||||||
Total Common Stocks | 5,928,660 | |||||
| ||||||
Short-Term Securities - 5.6% | ||||||
Fidelity Inst. Money Mkt. Gvt. Fund, 2.26% | 351,847 | 351,847 | ||||
| ||||||
(cost: $351,847) | ||||||
Total Investments in Securities - 100.0% | 6,280,507 | |||||
Other Assets and Liabilities, net - 0.0% | 1,607 | |||||
| ||||||
Total Net Assets - 100.0% | $6,282,114 | |||||
| ||||||
| * | Non-income producing security. |
ADR — American Depositary Receipt
PLC — Public Limited Company
Numeric footnotes not disclosed are not applicable to this Schedule of Investments
See accompanying notes to financial statements.
| 26 | SIT MUTUAL FUNDS ANNUAL REPORT |
A summary of the levels for the Fund’s investments as of June 30, 2019 is as follows (see Note 2 - significant accounting policies in the notes to financial statements):
| Investment in Securities | ||||||||||||||||
Level 1 |
Level 2 |
Level 3 | ||||||||||||||
| Quoted | Other significant | Significant | ||||||||||||||
| Price ($) | observable inputs ($) | unobservable inputs ($) | Total ($) | |||||||||||||
Common Stocks | ||||||||||||||||
Canada | 127,756 | — | — | 127,756 | ||||||||||||
Germany | 426,122 | — | — | 426,122 | ||||||||||||
Ireland | 288,985 | — | — | 288,985 | ||||||||||||
Japan | 41,912 | — | — | 41,912 | ||||||||||||
Netherlands | 139,708 | — | — | 139,708 | ||||||||||||
Spain | 194,546 | — | — | 194,546 | ||||||||||||
Switzerland | 160,270 | — | — | 160,270 | ||||||||||||
United Kingdom | 476,539 | — | — | 476,539 | ||||||||||||
United States | 4,072,822 | — | — | 4,072,822 | ||||||||||||
Short-Term Securities | 351,847 | — | — | 351,847 | ||||||||||||
Total: | 6,280,507 | — | — | 6,280,507 | ||||||||||||
Level 1 securities of foreign issuers are primarily American Depositary Receipts (ADRs), Public Limited Companies (PLCs) or Global Depositary Receipts (GDRs). There were no transfers into or out of level 3 during the reporting period
See accompanying notes to financial statements.
| JUNE 30, 2019 | 27 |
|
OBJECTIVE & STRATEGY
The objective of the Sit Mid Cap Growth Fund is to maximize long-term capital appreciation. The Fund pursues this objective by investing at least 80% of its net assets in common stocks that, at the time of purchase, have market capitalizations that fall within the range of companies included in the Russell Midcap® Growth Index during the most recent12-month period. The Russell Midcap® Growth Index ranged from approximately $365 million to $82 billion during the12-month period ended June 30, 2019.
The Sit Mid Cap Growth Fund’s twelve-month return was +11.76%, compared to +13.94% for the Russell Midcap® Growth Index. The Russell Midcap® Index advanced +7.83% during the period.
Mid cap stocks posted solid gains over the past year, even as the weakening economic growth backdrop has become less supportive for corporate earnings. We believe that investor sentiment has been buoyed by lower interest rates, including a likely Federal Reserve interest rate cut, providing a “Goldilocks” environment for stocks that has boosted share prices. While markets, in general, can continue to grind higher from current lofty levels, we believe that companies generating above-average earnings growth will outperform. In this regard, many technology companies are highly attractive, given a multitude of growth drivers (e.g., cloud computing,e-commerce, artificial AI). Additionally, a combination of the aging population and innovation are resulting in strong growth in the health technology sector. And, while financial stocks have lagged as the yield curve has flattened, we see very positive risk/reward in areas relatively immune to low rates, including life insurers, property/casualty companies, and asset managers. Conversely, the Fund has minimal allocations to severallow-growth sectors, such asnon-energy minerals, energy minerals and utilities. Regardless of sector, quality remains the overriding theme, with particular emphases on free cash flow generation, balance sheet strength and earnings visibility.
Although the Fund posted positive absolute returns, it lagged the Russell Midcap® Growth Index, due to a combination of stock selection and sector positioning. Underperformance can be largely attributed to both stock selection and overweighting the finance sector, as well as stock selection in the electronic technology, retail trade and technology services sectors. Good stock selection in the producer manufacturing, process industries and industrial services sectors were key offsets, in addition to an overweight position in the consumernon-durables sector. Some notable positive stock selections were Atlassian (+109%), Euronet Worldwide (+101%), and Ulta Beauty (+49%). Conversely, the Fund’s positions in Electronic Arts
HYPOTHETICAL GROWTH OF $10,000
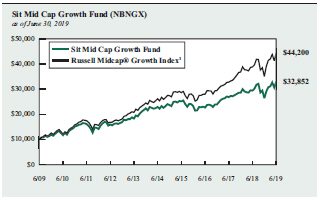
The chart above illustrates the total value of a hypothetical $10,000 investment in the Fund over the past 10 years as compared to the performance of the Russell Midcap® Growth Index. Past performance does not guarantee future results. Returns include the reinvestment of distributions. The chart does not reflect the deduction of taxes that a shareholder would pay on Fund distributions or the redemption of Fund shares.
1 Russell Midcap® Growth Index is an unmanaged index that measures the performance of those Russell Midcap Index companies with higherprice-to-book ratios and higher forecasted growth values. It is not possible to invest directly in an index. This is the Fund’s primary index.
(-34%), Skyworks Solutions(-18%), Marathon Petroleum(-18%) and Camping World(-52%) detracted from performance.
Even after strong performance in recent quarters, we believe that valuations for holdings within the Fund remain attractive relative to both near- and longer-term growth prospects, and that our long-term investment approach will reward our shareholders.
Roger J. Sit
Kent L. Johnson
Robert W. Sit
Portfolio Managers
Information on this page is unaudited.
| 28 | SIT MUTUAL FUNDS ANNUAL REPORT |
|
COMPARATIVE RATES OF RETURNS
as of June 30, 2019
Sit Mid Cap | Russell Midcap® Growth Index 1 | Russell Midcap® Index 2 | |||||||||||||
One Year | 11.76 | % | 13.94 | % | 7.83 | % | |||||||||
Five Year | 7.44 | 11.10 | 8.63 | ||||||||||||
Ten Year | 12.63 | 16.02 | 15.16 | ||||||||||||
Since Inception (9/2/82) | 11.47 | n/a | n/a | ||||||||||||
Performance figures are historical and do not guarantee future results. Investment returns and principal value will vary, and you may have a gain or loss when you sell shares. Current performance may be lower or higher than the performance data quoted. Contact the Fund for performance data current to the most recentmonth-end. Returns include changes in share price as well as reinvestment of all dividends and capital gains and all fee waivers. Without the fee waivers total return and yield figures would have been lower. Returns do not reflect the deduction of the 2% redemption fee imposed if shares are redeemed or exchanged within 30 calendar days from their date of purchase. If imposed, the fee would reduce the performance quoted. Returns do not reflect the deduction of taxes that a shareholder would pay on Fund distributions or the redemption of Fund shares. Management fees and administrative expenses are included in the Fund’s performance. Returns for periods greater than one year are compounded average annual rates of return.
1 Russell Midcap® Growth Index is an unmanaged index that measures the performance of those Russell Midcap Index companies with higherprice-to-book ratios and higher forecasted growth values. It is not possible to invest directly in an index.
2 Russell Midcap® Index is an unmanaged index that measures the performance of approximately 800 of the smallest companies in the Russell 1000® Index.
PORTFOLIO SUMMARY
Net Asset Value 6/30/19: | $18.84 | Per Share | ||
Net Asset Value 6/30/18: | $18.96 | Per Share | ||
Total Net Assets: | $169.1 | Million | ||
Weighted Average Market Cap: | $23.7 | Billion |
TOP 10 HOLDINGS
| 1. | Euronet Worldwide, Inc. |
| 2. | Ulta Beauty, Inc. |
| 3. | Arista Networks, Inc. |
| 4. | TJX Cos., Inc. |
| 5. | Ingersoll-Rand, PLC |
| 6. | Waste Connections, Inc. |
| 7. | Thermo Fisher Scientific, Inc. |
| 8. | Booking Holdings, Inc. |
| 9. | PTC, Inc. |
| 10. | Broadcom, Inc. |
Based on total net assets as of June 30, 2019. Subject to change.
SECTOR ALLOCATION
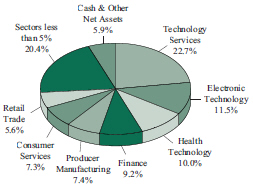
Based on total net assets as of June 30, 2019. Subject to change.
Information on this page is unaudited.
| JUNE 30, 2019 | 29 |
SCHEDULE OF INVESTMENTS
June 30, 2019
Sit Mid Cap Growth Fund
Investments are grouped by economic sectors.
| Name of Issuer | Quantity | Fair Value ($) | ||||
Common Stocks - 94.1% | ||||||
Commercial Services - 3.2% | ||||||
Booz Allen Hamilton Holding Corp. | 48,200 | 3,191,322 | ||||
Brink’s Co. | 26,625 | 2,161,417 | ||||
5,352,739 | ||||||
Consumer Durables - 1.6% | ||||||
YETI Holdings, Inc.* | 91,500 | 2,648,925 | ||||
ConsumerNon-Durables - 1.8% | ||||||
Coca-Cola European Partners, PLC | 40,700 | 2,299,550 | ||||
VF Corp. | 8,900 | 777,415 | ||||
3,076,965 | ||||||
Consumer Services - 7.3% | ||||||
Cinemark Holdings, Inc. | 24,100 | 870,010 | ||||
Dunkin’ Brands Group, Inc. | 21,600 | 1,720,656 | ||||
Grand Canyon Education, Inc.* | 11,200 | 1,310,624 | ||||
Marriott International, Inc. | 12,400 | 1,739,596 | ||||
Nexstar Media Group, Inc. | 11,600 | 1,171,600 | ||||
Service Corp. International | 55,500 | 2,596,290 | ||||
Strategic Education, Inc. | 10,400 | 1,851,200 | ||||
Vail Resorts, Inc. | 4,600 | 1,026,628 | ||||
12,286,604 | ||||||
Electronic Technology - 11.5% | ||||||
Advanced Micro Devices, Inc.* | 55,300 | 1,679,461 | ||||
Applied Materials, Inc. | 64,400 | 2,892,204 | ||||
Arista Networks, Inc.* | 17,900 | 4,647,198 | ||||
Broadcom, Inc. | 11,100 | 3,195,246 | ||||
Cabot Microelectronics Corp. | 10,825 | 1,191,616 | ||||
Ciena Corp.* | 33,800 | 1,390,194 | ||||
Garmin, Ltd. | 26,500 | 2,114,700 | ||||
Monolithic Power Systems, Inc. | 3,000 | 407,340 | ||||
Skyworks Solutions, Inc. | 26,250 | 2,028,338 | ||||
19,546,297 | ||||||
Energy Minerals - 1.3% | ||||||
Marathon Petroleum Corp. | 39,010 | 2,179,879 | ||||
Finance - 9.2% | ||||||
Ameriprise Financial, Inc. | 7,800 | 1,132,248 | ||||
Arthur J Gallagher & Co. | 18,900 | 1,655,451 | ||||
Axis Capital Holdings, Ltd. | 20,500 | 1,222,825 | ||||
Carlyle Group LP | 96,800 | 2,188,648 | ||||
First Republic Bank | 16,550 | 1,616,108 | ||||
Intercontinental Exchange, Inc. | 28,500 | 2,449,290 | ||||
Legg Mason, Inc. | 35,900 | 1,374,252 | ||||
Lincoln National Corp. | 15,300 | 986,085 | ||||
SVB Financial Group* | 7,750 | 1,740,572 | ||||
T Rowe Price Group, Inc. | 11,800 | 1,294,578 | ||||
15,660,057 | ||||||
| Name of Issuer | Quantity | Fair Value ($) | ||||
Health Services - 1.2% | ||||||
Encompass Health Corp. | 24,100 | 1,526,976 | ||||
Teladoc Health, Inc.* | 8,500 | 564,485 | ||||
2,091,461 | ||||||
Health Technology - 10.0% | ||||||
Align Technology, Inc.* | 8,900 | 2,435,930 | ||||
Cronos Group, Inc.* | 52,500 | 838,950 | ||||
DexCom, Inc.* | 14,500 | 2,172,680 | ||||
Edwards Lifesciences Corp.* | 5,500 | 1,016,070 | ||||
Exact Sciences Corp.* | 13,000 | 1,534,520 | ||||
Insulet Corp.* | 21,850 | 2,608,453 | ||||
Jazz Pharmaceuticals, PLC* | 5,700 | 812,592 | ||||
Sarepta Therapeutics, Inc.* | 12,875 | 1,956,356 | ||||
Thermo Fisher Scientific, Inc. | 12,150 | 3,568,212 | ||||
16,943,763 | ||||||
Industrial Services - 3.4% | ||||||
Jacobs Engineering Group, Inc. | 23,900 | 2,016,921 | ||||
Waste Connections, Inc. | 38,950 | 3,722,841 | ||||
5,739,762 | ||||||
Non-Energy Minerals - 1.1% | ||||||
Trex Co., Inc.* | 25,100 | 1,799,670 | ||||
Process Industries - 3.9% | ||||||
Canopy Growth Corp.* | 20,000 | 806,200 | ||||
Ecolab, Inc. | 15,500 | 3,060,320 | ||||
ScottsMiracle-Gro Co. | 27,600 | 2,718,600 | ||||
6,585,120 | ||||||
Producer Manufacturing - 7.4% | ||||||
AMETEK, Inc. | 24,000 | 2,180,160 | ||||
Anixter International, Inc.* | 8,886 | 530,583 | ||||
Carlisle Cos., Inc. | 13,300 | 1,867,453 | ||||
Hubbell, Inc. | 16,000 | 2,086,400 | ||||
Ingersoll-Rand, PLC | 31,700 | 4,015,439 | ||||
Parker-Hannifin Corp. | 2,900 | 493,029 | ||||
Rockwell Automation, Inc. | 8,000 | 1,310,640 | ||||
12,483,704 | ||||||
Retail Trade - 5.6% | ||||||
TJX Cos., Inc. | 85,800 | 4,537,104 | ||||
Ulta Beauty, Inc.* | 14,100 | 4,891,149 | ||||
9,428,253 | ||||||
Technology Services - 22.7% | ||||||
Altair Engineering, Inc.* | 45,600 | 1,841,784 | ||||
ANSYS, Inc.* | 13,000 | 2,662,660 | ||||
Aspen Technology, Inc.* | 19,900 | 2,473,172 | ||||
Atlassian Corp., PLC* | 19,800 | 2,590,632 | ||||
Autodesk, Inc.* | 17,900 | 2,915,910 | ||||
Booking Holdings, Inc.* | 1,900 | 3,561,949 | ||||
Citrix Systems, Inc.* | 7,900 | 775,306 | ||||
Euronet Worldwide, Inc.* | 29,575 | 4,975,698 | ||||
See accompanying notes to financial statements.
| 30 | SIT MUTUAL FUNDS ANNUAL REPORT |
Name of Issuer | Quantity | Fair Value ($) | ||||
GoDaddy, Inc.* | 14,600 | 1,024,190 | ||||
Guidewire Software, Inc.* | 19,300 | 1,956,634 | ||||
HubSpot, Inc.* | 10,300 | 1,756,356 | ||||
PTC, Inc.* | 39,600 | 3,554,496 | ||||
Qualys, Inc.* | 17,050 | 1,484,714 | ||||
Red Hat, Inc.* | 11,200 | 2,102,912 | ||||
Science Applications International Corp. | 25,100 | 2,172,656 | ||||
Splunk, Inc.* | 20,900 | 2,628,175 | ||||
38,477,244 | ||||||
Transportation - 1.5% | ||||||
Alaska Air Group, Inc. | 26,400 | 1,687,224 | ||||
Knight-Swift Transportation Holdings, Inc. | 27,300 | 896,532 | ||||
2,583,756 | ||||||
Name of Issuer | Quantity | Fair Value ($) | ||||
Utilities - 1.4% | ||||||
WEC Energy Group, Inc. | 27,800 | 2,317,686 | ||||
Total Common Stocks | 159,201,885 | |||||
Short-Term Securities - 6.3% | ||||||
Fidelity Inst. Money Mkt. Gvt. Fund, 2.26% | 10,640,972 | 10,640,972 | ||||
(cost: $10,640,972) | ||||||
Total Investments in Securities - 100.4% | 169,842,857 | |||||
Other Assets and Liabilities, net - (0.4%) | (744,148) | |||||
Total Net Assets - 100.0% | $169,098,709 | |||||
| ||||||
| * | Non-income producing security. |
PLC — Public Limited Company
Numeric footnotes not disclosed are not applicable to this Schedule of Investments.
A summary of the levels for the Fund’s investments as of June 30, 2019 is as follows (see Note 2 - significant accounting policies in the notes to financial statements):
Investment in Securities | ||||||||||||
Level 1 |
Level 2 |
Level 3 | ||||||||||
| Quoted Price ($) | Other significant observable inputs ($) | Significant unobservable inputs ($) | Total ($) | |||||||||
Common Stocks** | 159,201,885 | — | — | 159,201,885 | ||||||||
Short-Term Securities | 10,640,972 | — | — | 10,640,972 | ||||||||
Total: | 169,842,857 | — | — | 169,842,857 | ||||||||
| ** | For equity securities categorized in a single level, refer to the Schedule of Investments for further breakdown. |
There were no transfers into or out of level 3 during the reporting period.
See accompanying notes to financial statements.
| JUNE 30, 2019 | 31 |
Sit Small Cap Dividend Growth Fund Class I and Class S
|
OBJECTIVE & STRATEGY
The objective of the Sit Small Cap Dividend Growth Fund is to provide current income that exceeds the Fund’s benchmark index and that grows over a period of years. Secondarily the Fund seeks long-term capital appreciation. The Fund seeks to achieve its objectives by investing, under normal market conditions, at least 80% of its net assets in small cap dividend-paying common stocks that have market capitalizations at the time of purchase of up to $3.0 billion, or up to the market capitalization of the largest company included in the Russell 2000® Index measured at the end of the previous twelve months ($10.3 billion as of June 30, 2019). The Fund may invest the balance of its assets in preferred stocks, convertible bonds, U.S. Treasury securities (including Treasury bills, notes and bonds),closed-end investment companies, and master limited partnerships.
The Sit Small Cap Dividend Growth Fund Class I posted a-0.54% return over the last twelve months, compared to the-3.31% return for the Russell 2000® Index. The Fund’s gross dividend yield (before deducting Fund expenses) was 2.45% as of 6/30/19, compared to 1.38% for the Russell 2000® Index.
Small capitalization stocks struggled to gain ground over the past twelve months, although the sharp decline in the fourth quarter of 2018 accounted for most of the weakness. Volatile interest rates, heightened trade tensions and slower economic growth contributed to“risk-off ” sentiment in the markets, which tends to take a toll particularly on sentiment for small cap stocks. We believe a “lower risk” strategy is prudent within a small cap universe that is currently showing signs of speculation. As of 6/30/19, we estimate that a near record 20% of the Russell 2000 Index capitalization was comprised of companies with negative earnings, with an additional 28% carrying (trailing) P/E ratios exceeding 30x. Fortunately, for dividend investors, we believe there are ample opportunities in attractively valued, dividend-paying small company growth stocks in a wide variety of industries. Financial stocks continue to both raise dividends and repurchase shares at valuations below market averages, even below book value in some cases. Ade-escalation in trade tensions should boost both producer manufacturing and electronic technology shares, particularly attractively valued semiconductor companies. Lastly, many consumer services companies are posting solid growth, as the U.S. consumer’s balance sheet and income are strong, supporting strong growth for well-positioned companies. These four sectors are the most heavily weighted in the Fund. Regardless of sector, we remain focused on quality, with management teams committed to growing dividends over the longer term. We are encouraged by the significant dividend boosts for companies held in the Fund, as 61 out of 79 companies increased their dividend in the past twelve months, with an average increase of +8%.
The Fund outperformed the Russell 2000® Index over the past twelve months. The main driver of outperformance in the Fund was stock selection in the health technology, consumer services and industrial services sectors. Standout performers here were Steris(+43%), KBR(+42%) and Nextstar Media (+40%). Allocations in the energy minerals,
HYPOTHETICAL GROWTH OF $10,000
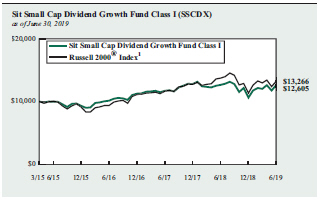
The chart above illustrates the total value of a hypothetical $10,000 investment in the Fund over the past 10 years as compared to the performance of the Russell 2000® Index. Past performance does not guarantee future results. Returns include the reinvestment of distributions. The chart does not reflect the deduction of taxes that a shareholder would pay on Fund distributions or the redemption of Fund shares.
1 Russell 2000® Index is an unmanaged index that measures the performance of the 2,000 smallest companies in the Russell 3000® Index, an index consisting of the 3,000 largest U.S. companies based on market capitalization. It is not possible to invest directly in an index. This is the Fund’s primary index.
retail trade and consumernon-durables sectors also enhanced returns. The main detractor to returns during this period was the Fund’s underallocation to the technology services sector, which contains mainlynon-dividend paying stocks. Additionally, adverse stock selection in the financial sector, including East West Bancorp and Kingstone Companies, weighed on returns.
We believe the Fund offers an attractive option for investors to gain exposure to small cap stocks in a relatively conservative manner, and we appreciate investors’ continued interest.
| Roger J. Sit | Michael T. Manns | |
| Kent L. Johnson | Robert W. Sit | |
| Portfolio Managers |
Information on this page is unaudited.
| 32 | SIT MUTUAL FUNDS ANNUAL REPORT |
|
COMPARATIVE RATES OF RETURNS
as of June 30, 2019
| Sit Small Cap Dividend Growth Fund | Russell Index1 | |||||||||||
Class I |
Class S | |||||||||||
One Year | -0.54 | % | -0.80 | % | -3.31 | % | ||||||
Since Inception | 5.60 | 5.33 | 6.87 | |||||||||
Performance figures are historical and do not guarantee future results. Investment returns and principal value will vary, and you may have a gain or loss when you sell shares. Current performance may be lower or higher than the performance data quoted. Contact the Fund for performance data current to the most recentmonth-end. Returns include changes in share price as well as reinvestment of all dividends and capital gains. Returns do not reflect the deduction of the 2% redemption fee imposed if shares are redeemed or exchanged within 30 calendar days from their date of purchase. If imposed, the fee would reduce the performance quoted. Returns do not reflect the deduction of taxes that a shareholder would pay on Fund distributions or the redemption of Fund shares. Management fees and administrative expenses are included in the Fund’s performance. Returns for periods greater than one year are compounded average annual rates of return.
1 Russell 2000® Index is an unmanaged index that measures the performance of the 2,000 smallest companies in the Russell 3000® Index, an index consisting of the 3,000 largest U.S. companies based on market capitalization. It is not possible to directly invest in an index.
PORTFOLIO SUMMARY
Class I:
| ||||||
Net Asset Value 6/30/19: | $11.89 | Per Share | ||||
Net Asset Value 6/30/18: | $12.27 | Per Share | ||||
Total Net Assets: | $12.6 | Million | ||||
Class S:
| ||||||
Net Asset Value 6/30/19: | $11.88 | Per Share | ||||
Net Asset Value 6/30/18: | $12.26 | Per Share | ||||
Total Net Assets: | $4.0 | Million | ||||
Weighted Average Market Cap: | $4.7 | Billion | ||||
TOP 10 HOLDINGS
1. Strategic Education, Inc.
2. Booz Allen Hamilton Holding Corp.
3. MKS Instruments, Inc.
4. Monolithic Power Systems, Inc.
5. Axis Capital Holdings, Ltd.
6. Encompass Health Corp.
7. ScottsMiracle-Gro Co.
8. Cabot Microelectronics Corp.
9. Wintrust Financial Corp.
10. Service Corp. International
Based on total net assets as of June 30, 2019. Subject to change.
SECTOR ALLOCATION
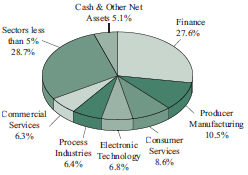
Based on total net assets as of June 30, 2019. Subject to change.
Information on this page is unaudited.
| JUNE 30, 2019 | 33 |
SCHEDULE OF INVESTMENTS
June 30, 2019
Sit Small Cap Dividend Growth Fund
Investments are grouped by economic sectors.
| Name of Issuer | Quantity | Fair Value ($) | ||||
Common Stocks - 93.7% | ||||||
Commercial Services - 6.3% | ||||||
Booz Allen Hamilton Holding Corp. | 6,075 | 402,226 | ||||
Brink’s Co. | 3,400 | 276,012 | ||||
Deluxe Corp. | 2,700 | 109,782 | ||||
Herman Miller, Inc. | 5,700 | 254,790 | ||||
1,042,810 | ||||||
Communications - 1.0% | ||||||
Shenandoah Telecommunications Co. | 4,100 | 157,932 | ||||
Consumer Durables - 3.1% | ||||||
Acushnet Holdings Corp. | 8,200 | 215,332 | ||||
BRP, Inc. | 2,775 | 99,428 | ||||
National Presto Industries, Inc. | 750 | 69,968 | ||||
Thor Industries, Inc. | 2,300 | 134,435 | ||||
519,163 | ||||||
ConsumerNon-Durables - 1.2% | ||||||
Sensient Technologies Corp. | 2,800 | 205,744 | ||||
Consumer Services - 8.6% | ||||||
Dunkin’ Brands Group, Inc. | 2,625 | 209,108 | ||||
Nexstar Media Group, Inc. | 2,850 | 287,850 | ||||
Service Corp. International | 6,250 | 292,375 | ||||
Strategic Education, Inc. | 2,290 | 407,620 | ||||
Vail Resorts, Inc. | 1,000 | 223,180 | ||||
1,420,133 | ||||||
Electronic Technology - 6.8% | ||||||
Cabot Microelectronics Corp. | 2,700 | 297,216 | ||||
MKS Instruments, Inc. | 4,600 | 358,294 | ||||
Monolithic Power Systems, Inc. | 2,575 | 349,634 | ||||
Power Integrations, Inc. | 1,400 | 112,252 | ||||
1,117,396 | ||||||
Energy Minerals - 2.0% | ||||||
Delek US Holdings, Inc. | 5,300 | 214,756 | ||||
Vermilion Energy, Inc. | 5,625 | 122,231 | ||||
336,987 | ||||||
Finance - 27.6% | ||||||
American Equity Investment Life Holding Co. | 5,250 | 142,590 | ||||
American National Insurance Co. | 1,200 | 139,764 | ||||
Axis Capital Holdings, Ltd. | 5,250 | 313,163 | ||||
Carlyle Group LP | 10,525 | 237,970 | ||||
CubeSmart | 6,100 | 203,984 | ||||
Donegal Group, Inc. | 5,900 | 90,093 | ||||
East West Bancorp, Inc. | 4,800 | 224,496 | ||||
Evercore Partners, Inc. | 2,400 | 212,568 | ||||
Great Western Bancorp, Inc. | 3,200 | 114,304 | ||||
Hanover Insurance Group, Inc. | 1,075 | 137,922 | ||||
HCI Group, Inc. | 4,400 | 178,068 | ||||
Hercules Capital, Inc. | 13,100 | 167,942 | ||||
Legg Mason, Inc. | 6,300 | 241,164 | ||||
| Name of Issuer | Quantity | Fair Value ($) | ||||
Macquarie Infrastructure Corp. | 4,150 | 168,241 | ||||
Old National Bancorp | 9,550 | 158,434 | ||||
PacWest Bancorp | 4,100 | 159,203 | ||||
People’s United Financial, Inc. | 16,325 | 273,934 | ||||
Physicians Realty Trust | 13,300 | 231,952 | ||||
Piper Jaffray Cos | 2,875 | 213,526 | ||||
QTS Realty Trust, Inc. | 4,350 | 200,883 | ||||
Stifel Financial Corp. | 4,000 | 236,240 | ||||
STORE Capital Corp. | 6,600 | 219,054 | ||||
Wintrust Financial Corp. | 4,000 | 292,640 | ||||
4,558,135 | ||||||
Health Services - 2.2% | ||||||
Encompass Health Corp. | 4,750 | 300,960 | ||||
Healthcare Services Group, Inc. | 2,025 | 61,398 | ||||
362,358 | ||||||
Health Technology - 3.7% | ||||||
PerkinElmer, Inc. | 1,675 | 161,370 | ||||
STERIS, PLC | 1,900 | 282,872 | ||||
Teleflex, Inc. | 525 | 173,854 | ||||
618,096 | ||||||
Industrial Services - 2.7% | ||||||
EMCOR Group, Inc. | 2,000 | 176,200 | ||||
KBR, Inc. | 10,775 | 268,728 | ||||
444,928 | ||||||
Non-Energy Minerals - 0.9% | ||||||
Commercial Metals Co. | 3,950 | 70,508 | ||||
PotlatchDeltic Corp. | 2,135 | 83,222 | ||||
153,730 | ||||||
Process Industries - 6.4% | ||||||
Apogee Enterprises, Inc. | 2,325 | 100,998 | ||||
Avery Dennison Corp. | 1,900 | 219,792 | ||||
Domtar Corp. | 3,575 | 159,195 | ||||
Huntsman Corp. | 4,650 | 95,046 | ||||
Neenah, Inc. | 1,550 | 104,702 | ||||
Orion Engineered Carbons SA | 3,925 | 84,034 | ||||
ScottsMiracle-Gro Co. | 3,025 | 297,962 | ||||
1,061,729 | ||||||
Producer Manufacturing - 10.5% | ||||||
Applied Industrial Technologies, Inc. | 3,100 | 190,743 | ||||
Carlisle Cos, Inc. | 1,300 | 182,533 | ||||
Crane Co. | 2,675 | 223,202 | ||||
Hubbell, Inc. | 2,100 | 273,840 | ||||
Lincoln Electric Holdings, Inc. | 2,500 | 205,800 | ||||
MSA Safety, Inc. | 2,700 | 284,553 | ||||
Oshkosh Corp. | 2,400 | 200,376 | ||||
Watsco, Inc. | 1,050 | 171,706 | ||||
1,732,753 | ||||||
See accompanying notes to financial statements.
| 34 | SIT MUTUAL FUNDS ANNUAL REPORT |
| Name of Issuer | Quantity | Fair Value ($) | ||||
Retail Trade - 1.7% | ||||||
Camping World Holdings, Inc. | 9,600 | 119,232 | ||||
Casey’s General Stores, Inc. | 1,000 | 155,990 | ||||
275,222 | ||||||
Technology Services - 2.7% | ||||||
ManTech International Corp. | 2,700 | 177,795 | ||||
Science Applications International Corp. | 3,075 | 266,172 | ||||
443,967 | ||||||
Transportation - 2.3% | ||||||
Alaska Air Group, Inc. | 3,100 | 198,121 | ||||
Knight-Swift Transportation Holdings, Inc. | 5,675 | 186,367 | ||||
384,488 | ||||||
| Name of Issuer | Quantity | Fair Value ($) | ||||
Utilities - 4.0% | ||||||
Black Hills Corp. | 2,000 | 156,340 | ||||
Covanta Holding Corp. | 13,400 | 239,994 | ||||
New Jersey Resources Corp. | 3,175 | 158,020 | ||||
Spire, Inc. | 1,375 | 115,390 | ||||
669,744 | ||||||
Total Common Stocks | 15,505,315 | |||||
Investment Companies - 1.2% | ||||||
Tortoise Energy Infrastructure Corp. | 8,625 | 194,494 | ||||
(cost: $241,537) | ||||||
Short-Term Securities - 5.0% | ||||||
Fidelity Inst. Money Mkt. Gvt. Fund, 2.26% | 824,814 | 824,814 | ||||
(cost: $824,814) | ||||||
Total Investments in Securities - 99.9% | 16,524,623 | |||||
Other Assets and Liabilities, net - 0.1% | 14,482 | |||||
Total Net Assets - 100.0% | $16,539,105 | |||||
| ||||||
PLC — Public Limited Company
Numeric footnotes not disclosed are not applicable to this Schedule of Investments.
A summary of the levels for the Fund’s investments as of June 30, 2019 is as follows (see Note 2 - significant accounting policies in the notes to financial statements):
Investment in Securities | ||||||||||||
| Level 1 Quoted Price ($) | Level 2 Other significant | Level 3 Significant unobservable inputs ($) | Total ($) | |||||||||
Common Stocks** | 15,505,315 | — | — | 15,505,315 | ||||||||
Investment Companies | 194,494 | — | — | 194,494 | ||||||||
Short-Term Securities | 824,814 | — | — | 824,814 | ||||||||
Total: | 16,524,623 | — | — | 16,524,623 | ||||||||
| ** | For equity securities categorized in a single level, refer to the Schedule of Investments for further breakdown. |
There were no transfers into or out of level 3 during the reporting period.
See accompanying notes to financial statements.
| JUNE 30, 2019 | 35 |
|
OBJECTIVE & STRATEGY
The objective of the Sit Small Cap Growth Fund is to maximize long-term capital appreciation. The Fund seeks to achieve its objective by investing, under normal market conditions, at least 80% of its net assets in common stocks of companies with market capitalizations at the time of purchase of up to $3.0 billion, or up to the market capitalization of the largest company included in the Russell 2000® Index measured at the end of the previous twelve months ($10.3 billion as of June 30, 2019).
The Adviser invests in a diversified group of growing small companies it believes exhibit the potential for superior growth. The Adviser believes that a company’s earnings growth is the primary determinant of its potential long-term return and evaluates a company’s potential for above average long-term earnings and revenue growth.
The Sit Small Cap Growth Fund return was +6.45% over the past twelve months. This compares to the return of-0.49% for the Russell 2000® Growth Index and-3.31% for the Russell 2000® Index.
Small stocks struggled to gain ground over the past year, as investors became increasingly risk averse in a backdrop of slowing growth and geopolitical risks, including fears over an expanding trade war. With the current economic expansion officially now the longest on record at 121 months in length, we recognize that any slowdown in growth is bound to stoke recession fears. However, we believe that the economy remains in reasonable shape and that the expansion has more room to run based on the residual benefits from tax cuts, deregulation, easing financial conditions and healthy consumers. Importantly, relative to large firms, smaller companies have more exposure to the U.S. economy and less exposure to the key risks currently impacting equity markets, including weaker overseas economies and declines in global trade.
The two most heavily weighted sectors in the Fund are technology services and health technology, as we believe investors will continue to seek out groups with secular, differentiated growth in the prevailing moderate growth economic environment. We also continue to maintain a significant allocation to the producer manufacturing and electronic technology sectors, as further progress in resolving U.S.-China trade tensions will likely boost investor sentiment. Underweighted sectors include communications, transportation andnon-energy minerals, largely due to the absence of growth companies within these sectors.
Strong outperformance in the Fund over this period can be attributed to its overweight allocation to the technology services sector, in addition to strong stock selection in this group combined with favorable stock selection in the health technology and industrial services sectors. Overweight positions in thenon-energy minerals and electronic technology sectors were also contributors to positive relative performance. In terms of stocks, the Fund’s positions in Paycom Software (+129%), Euronet Worldwide (+101%), Exact Sciences
HYPOTHETICAL GROWTH OF $10,000
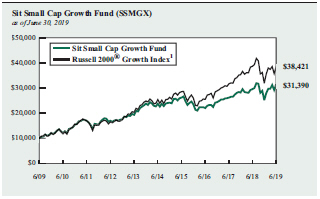
The chart above illustrates the total value of a hypothetical $10,000 investment in the Fund over the past 10 years as compared to the performance of the Russell 2000® Growth Index. Past performance does not guarantee future results. Returns include the reinvestment of distributions. The chart does not reflect the deduction of taxes that a shareholder would pay on Fund distributions or the redemption of Fund shares.
1 Russell 2000® Growth Index is an unmanaged index that measures the performance of those Russell 2000 Index companies with higherprice-to-book ratios and higher forecasted growth values. It is not possible to invest directly in an index. This is the Fund’s primary index.
(+97%) and Globant (+76%) were substantial contributors to outperformance over the past twelve months. Conversely, stock selection in the health services, finance and transportation sectors detracted from performance. The most significant laggards over the period included T2 Biosystems(-79%), Rayonier Advanced Materials(-54%) and Camping World(-52%).
Our research staff remains highly focused on identifying companies that will deliver consistent, long-term earnings growth. We continue to appreciate shareholders’ interest in the Fund.
| Roger J. Sit | Michael J. Stellmacher | |
| Kent L. Johnson | Robert W. Sit | |
| Portfolio Managers | ||
Information on this page is unaudited.
| 36 | SIT MUTUAL FUNDS ANNUAL REPORT |
|
COMPARATIVE RATES OF RETURNS
as of June 30, 2019
| Sit Small Cap Growth Fund | Russell 2000® | Russell 2000® Index2 | ||||||||||
One Year | 6.45 | % | -0.49 | % | -3.31 | % | ||||||
Five Year | 5.77 | 8.63 | 7.06 | |||||||||
Ten Year | 12.12 | 14.41 | 13.45 | |||||||||
Since Inception (7/1/94) | 10.06 | 8.20 | 9.23 | |||||||||
Performance figures are historical and do not guarantee future results. Investment returns and principal value will vary, and you may have a gain or loss when you sell shares. Current performance may be lower or higher than the performance data quoted. Contact the Fund for performance data current to the most recentmonth-end. Returns include changes in share price as well as reinvestment of all dividends and capital gains. Returns do not reflect the deduction of the 2% redemption fee imposed if shares are redeemed or exchanged within 30 calendar days from their date of purchase. If imposed, the fee would reduce the performance quoted. Returns do not reflect the deduction of taxes that a shareholder would pay on Fund distributions or the redemption of Fund shares. Management fees and administrative expenses are included in the Fund’s performance. Returns for periods greater than one year are compounded average annual rates of return.
1 Russell 2000® Growth Index is an unmanaged index that measures the performance of those Russell 2000 Index companies with higherprice-to-book ratios and higher forecasted growth values. It is not possible to invest directly in an index.
2 Russell 2000® Index is an unmanaged index that measures the performance of the 2,000 smallest companies in the Russell 3000® Index, an index consisting of the 3,000 largest U.S. companies based on market capitalization.
PORTFOLIO SUMMARY
Net Asset Value 6/30/19: | $55.46 | Per Share | ||
Net Asset Value 6/30/18: | $57.18 | Per Share | ||
Total Net Assets: | $99.6 | Million | ||
Weighted Average Market Cap: | $8.1 | Billion | ||
TOP 10 HOLDINGS
1. Euronet Worldwide, Inc.
2. Paycom Software, Inc.
3. Booz Allen Hamilton Holding Corp.
4. Waste Connections, Inc.
5. Sarepta Therapeutics, Inc.
6. Arista Networks, Inc.
7.Take-Two Interactive Software, Inc.
8. Exact Sciences Corp.
9. Aspen Technology, Inc.
10. Globant SA
Based on total net assets as of June 30, 2019. Subject to change.
SECTOR ALLOCATION
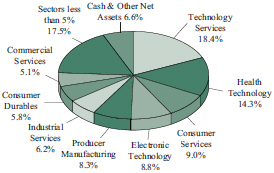
Based on total net assets as of June 30, 2019. Subject to change.
Information on this page is unaudited.
| JUNE 30, 2019 | 37 |
SCHEDULE OF INVESTMENTS
June 30, 2019
Sit Small Cap Growth Fund
Investments are grouped by economic sectors.
| Name of Issuer | Quantity | Fair Value ($) | ||||
Common Stocks - 93.4% | ||||||
Commercial Services - 5.1% | ||||||
ASGN, Inc.* | 25,100 | 1,521,060 | ||||
Booz Allen Hamilton Holding Corp. | 34,700 | 2,297,487 | ||||
Brink’s Co. | 16,000 | 1,298,880 | ||||
| ||||||
| 5,117,427 | ||||||
| ||||||
Communications - 0.6% | ||||||
Shenandoah Telecommunications Co. | 16,100 | 620,172 | ||||
| ||||||
Consumer Durables - 5.8% | ||||||
Acushnet Holdings Corp. | 38,400 | 1,008,384 | ||||
BRP, Inc. | 16,550 | 592,986 | ||||
Take-Two Interactive Software, Inc.* | 17,100 | 1,941,363 | ||||
Thor Industries, Inc. | 11,200 | 654,640 | ||||
YETI Holdings, Inc.* | 53,700 | 1,554,615 | ||||
| ||||||
| 5,751,988 | ||||||
| ||||||
Consumer Services - 9.0% | ||||||
Adtalem Global Education, Inc.* | 12,725 | 573,261 | ||||
Cinemark Holdings, Inc. | 25,200 | 909,720 | ||||
Dunkin’ Brands Group, Inc. | 12,800 | 1,019,648 | ||||
Grand Canyon Education, Inc.* | 10,500 | 1,228,710 | ||||
Nexstar Media Group, Inc. | 13,775 | 1,391,275 | ||||
Service Corp. International | 28,600 | 1,337,908 | ||||
Strategic Education, Inc. | 6,803 | 1,210,934 | ||||
Vail Resorts, Inc. | 5,600 | 1,249,808 | ||||
| ||||||
| 8,921,264 | ||||||
| ||||||
Electronic Technology - 8.8% | ||||||
Arista Networks, Inc.* | 7,800 | 2,025,036 | ||||
Cabot Microelectronics Corp. | 7,475 | 822,848 | ||||
Ciena Corp.* | 20,150 | 828,770 | ||||
Cray, Inc.* | 41,700 | 1,451,994 | ||||
MKS Instruments, Inc. | 15,750 | 1,226,768 | ||||
Monolithic Power Systems, Inc. | 10,200 | 1,384,956 | ||||
Skyworks Solutions, Inc. | 13,200 | 1,019,964 | ||||
| ||||||
| 8,760,336 | ||||||
| ||||||
Energy Minerals - 1.5% | ||||||
Delek US Holdings, Inc. | 21,300 | 863,076 | ||||
Marathon Petroleum Corp. | 11,926 | 666,425 | ||||
| ||||||
| 1,529,501 | ||||||
| ||||||
Finance - 4.8% | ||||||
Axis Capital Holdings, Ltd. | 12,500 | 745,625 | ||||
CubeSmart | 7,400 | 247,456 | ||||
First Republic Bank | 6,400 | 624,960 | ||||
Legg Mason, Inc. | 31,800 | 1,217,304 | ||||
Physicians Realty Trust | 30,500 | 531,920 | ||||
SVB Financial Group* | 4,575 | 1,027,499 | ||||
Wintrust Financial Corp. | 5,700 | 417,012 | ||||
| ||||||
| 4,811,776 | ||||||
| ||||||
| Name of Issuer | Quantity | Fair Value ($) | ||||
Health Services - 2.2% | ||||||
Encompass Health Corp. | 14,600 | 925,056 | ||||
Healthcare Services Group, Inc. | 11,190 | 339,281 | ||||
Teladoc Health, Inc.* | 14,100 | 936,381 | ||||
| ||||||
| 2,200,718 | ||||||
| ||||||
Health Technology - 14.3% | ||||||
Align Technology, Inc.* | 4,650 | 1,272,705 | ||||
Bio-Techne Corp. | 5,400 | 1,125,846 | ||||
Catalent, Inc.* | 12,350 | 669,494 | ||||
Cronos Group, Inc.* | 31,200 | 498,576 | ||||
Exact Sciences Corp.* | 15,700 | 1,853,228 | ||||
Insulet Corp.* | 10,100 | 1,205,738 | ||||
iRhythm Technologies, Inc.* | 11,900 | 941,052 | ||||
Kindred Biosciences, Inc.* | 83,275 | 693,681 | ||||
PerkinElmer, Inc. | 8,400 | 809,256 | ||||
Sarepta Therapeutics, Inc.* | 13,400 | 2,036,130 | ||||
STERIS, PLC | 10,200 | 1,518,576 | ||||
Supernus Pharmaceuticals, Inc.* | 17,100 | 565,839 | ||||
Wright Medical Group NV* | 35,900 | 1,070,538 | ||||
| ||||||
| 14,260,659 | ||||||
| ||||||
Industrial Services - 6.2% | ||||||
Advanced Disposal Services, Inc.* | 48,100 | 1,534,871 | ||||
EMCOR Group, Inc. | 15,800 | 1,391,980 | ||||
KBR, Inc. | 43,500 | 1,084,890 | ||||
Waste Connections, Inc. | 23,100 | 2,207,898 | ||||
| ||||||
| 6,219,639 | ||||||
| ||||||
Non-Energy Minerals - 1.4% | ||||||
Trex Co., Inc.* | 18,700 | 1,340,790 | ||||
| ||||||
Process Industries - 2.4% | ||||||
Domtar Corp. | 15,800 | 703,574 | ||||
ScottsMiracle-Gro Co. | 16,800 | 1,654,800 | ||||
| ||||||
| 2,358,374 | ||||||
| ||||||
Producer Manufacturing - 8.3% | ||||||
Anixter International, Inc.* | 5,100 | 304,521 | ||||
Crane Co. | 13,600 | 1,134,784 | ||||
Hubbell, Inc. | 10,000 | 1,304,000 | ||||
IDEX Corp. | 8,100 | 1,394,334 | ||||
Lincoln Electric Holdings, Inc. | 9,600 | 790,272 | ||||
MSA Safety, Inc. | 12,700 | 1,338,453 | ||||
Oshkosh Corp. | 13,800 | 1,152,162 | ||||
Watsco, Inc. | 5,050 | 825,826 | ||||
| ||||||
| 8,244,352 | ||||||
| ||||||
Retail Trade - 2.3% | ||||||
Casey’s General Stores, Inc. | 4,300 | 670,757 | ||||
Ulta Beauty, Inc.* | 4,650 | 1,613,038 | ||||
| ||||||
| 2,283,795 | ||||||
| ||||||
See accompanying notes to financial statements.
| 38 | SIT MUTUAL FUNDS ANNUAL REPORT |
| Name of Issuer | Quantity | Fair Value ($) | ||||
Technology Services - 18.4% | ||||||
Altair Engineering, Inc.* | 26,283 | 1,061,570 | ||||
ANSYS, Inc.* | 4,900 | 1,003,618 | ||||
Aspen Technology, Inc.* | 14,500 | 1,802,060 | ||||
Euronet Worldwide, Inc.* | 16,600 | 2,792,784 | ||||
Globant SA* | 17,750 | 1,793,638 | ||||
GoDaddy, Inc.* | 15,025 | 1,054,004 | ||||
Guidewire Software, Inc.* | 11,700 | 1,186,146 | ||||
HubSpot, Inc.* | 9,450 | 1,611,414 | ||||
Paycom Software, Inc.* | 10,150 | 2,301,208 | ||||
PTC, Inc.* | 17,600 | 1,579,776 | ||||
Qualys, Inc.* | 10,050 | 875,154 | ||||
Science Applications International Corp. | 14,800 | 1,281,088 | ||||
| ||||||
| 18,342,460 | ||||||
| ||||||
Transportation - 0.7% | ||||||
Alaska Air Group, Inc. | 11,500 | 734,965 | ||||
| ||||||
| Name of Issuer | Quantity | Fair Value ($) | ||||
Utilities - 1.6% | ||||||
Covanta Holding Corp. | 24,600 | 440,586 | ||||
Fortis, Inc. | 12,107 | 477,863 | ||||
Spire, Inc. | 7,525 | 631,498 | ||||
| ||||||
| 1,549,947 | ||||||
| ||||||
Total Common Stocks | ||||||
(cost: $56,075,383) | 93,048,163 | |||||
| ||||||
Short-Term Securities - 6.8% | ||||||
Fidelity Inst. Money Mkt. Gvt. Fund, 2.26% | 6,781,210 | 6,781,210 | ||||
| ||||||
(cost: $6,781,210) | ||||||
Total Investments in Securities - 100.2% | ||||||
(cost: $62,856,593) | 99,829,373 | |||||
Other Assets and Liabilities, net - (0.2%) | (199,758) | |||||
| ||||||
Total Net Assets - 100.0% | $99,629,615 | |||||
| ||||||
| * | Non-income producing security. |
PLC — Public Limited Company
Numeric footnotes not disclosed are not applicable to this Schedule of Investments.
A summary of the levels for the Fund’s investments as of June 30, 2019 is as follows (see Note 2 - significant accounting policies in the notes to financial statements):
| Investment in Securities | ||||||||||||
Level 1 Quoted Price ($) | Level 2 Other significant observable inputs ($) | Level 3 Significant unobservable inputs ($) | Total ($) | |||||||||
Common Stocks** | 93,048,163 | — | — | 93,048,163 | ||||||||
Short-Term Securities | 6,781,210 | — | — | 6,781,210 | ||||||||
Total: | 99,829,373 | — | — | 99,829,373 | ||||||||
| ** | For equity securities categorized in a single level, refer to the Schedule of Investments for further breakdown. |
There were no transfers into or out of level 3 during the reporting period.
See accompanying notes to financial statements.
| JUNE 30, 2019 | 39 |
|
OBJECTIVE STRATEGY
The objective of the Sit International Growth Fund is long-term growth. The Fund seeks to achieve its objective by investing at least 90% of its net assets in common stocks of growth companies domiciled outside the United States. In selecting investments for the Fund, the Adviser begins by selecting countries or regions in which to invest by considering several factors affecting the economy and equity market of foreign countries and regions. After the country and regional allocations are determined, the Adviser seeks industries and sectors that it believes have earnings growth prospects that are greater than the average. Within the selected industries and sectors, the Adviser invests in foreign growth-oriented companies it believes exhibit the potential for superior growth.
For the twelve-month period ended June, 30 2019, the Sit International Growth Fund generated a return of +3.55% versus the MSCI EAFE Index return of +1.08%. Outperformance was notably driven by positive stock selection across a broad range of industries, while exposure to North American stocks also benefited relative performance. Outperformance relative to the benchmark has continued to widen over the last six months, with the Fund gaining +19.54% versus the MSCI EAFE Index’s +14.03%.
In terms of the outlook, the Euro Area continues to suffer the fall-out from trade policy uncertainty and associated dip in global trade, with manufacturing contracting since February per the Markit PMI survey. In contrast, relative strength in the services and construction sectors is underpinned by a virtuous cycle of improving labor conditions and resilient domestic demand. While growth is further supported by a combination of favorable fiscal and monetary policies, elevated trade-, Italy-and Brexit-related uncertainties imply down-side risk to our below-trendline 2019 real GDP forecast of +1.2%. With Boris Johnson becoming the UK’s next prime minister, there is now a greater probability of a no-agreement exit, possibly plunging the UK economy into chaos. However, the deceleration in GDP growth led by unrelenting Brexit uncertainty has diminished recently due to inventory stockpiling, with the composite Purchasing Managers’ Index stabilizing at levels indicative of modest real GDP growth of +1.0% to +1.5% in 2019.
We continue to expect Japan’s GDP to grow a meager +0.5% in calendar 2019, with the coming consumption tax hike a near-term risk. The effectiveness of further monetary easing to support growth is questionable following six years of increasingly aggressive measures. With monetary policy options becoming limited, fiscal policy will take on increased importance. Within China, despite green shoots of an emerging recovery that began to sprout in 1Q19, recent macro data has largely surprised to the downside. In response to reemerging downward pressures, policymakers announced measures to relax auto purchase restrictions and support infrastructure investment. However, incremental stimulus efforts have been relatively modest and unlikely to offset fully the negative impact from trade. Assuming the U.S. refrains from placing a 25% tariff on the remaining $300 billion of imports as threatened, we project China real GDP growth of +6.2% in 2019 and +6.0% in 2020.
The Fund is overweight Europe, but we believe the Euro Area offers more attractive investment prospects, as Brexit is likely to have a much larger impact on the UK economy. Within the Euro Area, we
HYPOTHETICAL GROWTH OF $10,000
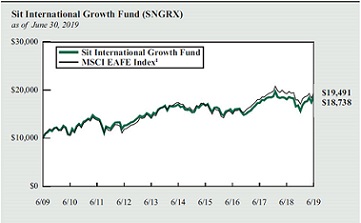
The chart above illustrates the total value of a hypothetical $10,000 investment in the Fund over the past 10 years as compared to the performance of the MSCI EAFE Index and MSCI EAFE Growth Index. The primary index used to compare the Fund’s performance was changed to the MSCI EAFE Index from the MSCI EAFE Growth Index because the Investment Adviser believes that the MSCI EAFE Index more accurately reflects the Fund’s investment objectives and strategies. Past performance does not guarantee future results. Returns include the reinvestment of distributions. The chart does not reflect the deduction of taxes that a shareholder would pay on Fund distributions or the redemption of Fund shares.
1 MSCI EAFE Index (Europe, Australasia, Far East) is an unmanaged free float-adjusted market capitalization index that measures the equity market performance of developed markets, excluding the US & Canada. This is the Fund’s primary index.
have become more positive on industrial companies, notably German industrials, as they will benefit notably from a U.S.-China trade deal and are trading at compelling valuations. We also prefer companies that generate a larger percentage of their growth from the U.S. Despite elevated U.S.-China trade tensions, the Fund is also overweight China as we expect its economy to muddle through with the assistance of government stimulus. We continue to overweight “new economy” names, as they are more exposed to domestic consumption and the industrial digital upgrade, both of which should be less impacted by trade issues. While the Fund is underweight Japanese equities, we see some opportunities within the lagging market. Our preference in Japan continues to be for overseas-exposed exporters and multinationals with links to faster growing areas of the globe.
Roger J. Sit Tasha M. Murdoff
Portfolio Managers
Information on this page is unaudited.
| 40 | SIT MUTUAL FUNDS ANNUAL REPORT |
|
COMPARATIVE RATES OF RETURNS
as of June 30, 2019 | ||||||||||
| Sit International Growth Fund | MSCI EAFE Index 1 | |||||||||
One Year | 3.55 | % | 1.08 | % | ||||||
Five Year | 1.91 | 2.25 | ||||||||
Ten Year | 6.48 | 6.90 | ||||||||
Since Inception | 3.97 | 5.26 | ||||||||
(11/1/91) | ||||||||||
Performance figures are historical and do not guarantee future results. Investment returns and principal value will vary, and you may have a gain or loss when you sell shares. Current performance may be lower or higher than the performance data quoted. Contact the Fund for performance data current to the most recentmonth-end. Returns include changes in share price as well as reinvestment of all dividends and capital gains and all fee waivers. Without the fee waivers total return and yield figures would have been lower. Returns do not reflect the deduction of the 2% redemption fee imposed if shares are redeemed or exchanged within 30 calendar days from their date of purchase. If imposed, the fee would reduce the performance quoted. Returns do not reflect the deduction of taxes that a shareholder would pay on Fund distributions or the redemption of Fund shares. Management fees and administrative expenses are included in the Fund’s performance. Returns for periods greater than one year are compounded average annual rates of return.
1 MSCI EAFE Index (Europe, Australasia, Far East) is an unmanaged free float-adjusted market capitalization index that measures the equity market performance of developed markets, excluding the US & Canada.
FUND DIVERSIFICATION - BY REGION
| Sit Int’l Growth Fund | MSCI EAFE Index | |||||||||
Europe | 59.9 | % | 60.7 | % | ||||||
Asia | 26.7 | 38.7 | ||||||||
North America | 11.0 | — | ||||||||
Africa/Middle East | — | 0.6 | ||||||||
Cash & Other Net Assets
|
| 2.4
|
|
| —
|
| ||||
Based on total net assets as of June 30, 2019. Subject to change.
PORTFOLIO SUMMARY
Net Asset Value 6/30/19: | $17.13 Per Share | |
Net Asset Value 6/30/18: | $16.75 Per Share | |
Total Net Assets: | $23.5 Million | |
Weighted Average Market Cap: | $77.9 Billion |
TOP 10 HOLDINGS
1. Nestle SA
2. Allianz SE
3. Royal Dutch Shell, PLC, ADR
4. Euronet Worldwide, Inc.
5. adidas AG
6. Diageo, PLC, ADR
7. Safran SA
8. Iberdrola SA
9. Schneider Electric SE
10. Globant SA
Based on total net assets as of June 30, 2019. Subject to change.
SECTOR ALLOCATION
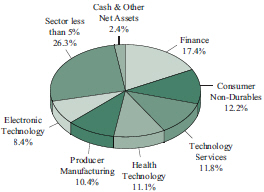
Based on total net assets as of June 30, 2019. Subject to change.
Information on this page is unaudited.
| JUNE 30, 2019 | 41 |
SCHEDULE OF INVESTMENTS
June 30, 2019
Sit International Growth Fund
Investments are grouped by geographic region.
| Name of Issuer | Quantity | Fair Value ($) | ||||
Common Stocks - 96.3% | ||||||
Asia - 25.4% | ||||||
Australia - 3.4% | ||||||
Amcor, Ltd. | 12,100 | 137,531 | ||||
Macquarie Group, Ltd. | 2,600 | 228,878 | ||||
Rio Tinto, PLC, ADR | 4,400 | 274,296 | ||||
Westpac Banking Corp., ADR | 8,300 | 165,419 | ||||
| ||||||
806,124 | ||||||
China/Hong Kong - 10.4% | ||||||
AIA Group, Ltd. | 32,200 | 347,280 | ||||
Alibaba Group Holding, Ltd., ADR* | 2,350 | 398,208 | ||||
Baidu, Inc., ADR* | 950 | 111,492 | ||||
China Tower Corp., Ltd. | 972,000 | 255,079 | ||||
CSPC Pharmaceutical Group, Ltd. | 116,000 | 187,104 | ||||
ENN Energy Holdings, Ltd. | 18,400 | 179,014 | ||||
HSBC Holdings, PLC, ADR | 3,825 | 159,656 | ||||
Ping An Insurance Group Co. of China, Ltd. | 33,500 | 402,256 | ||||
Tencent Holdings, Ltd. | 9,000 | 406,237 | ||||
| ||||||
2,446,326 | ||||||
Japan - 8.4% | ||||||
Astellas Pharma, Inc. | 14,300 | 203,594 | ||||
Keyence Corp. | 600 | 368,019 | ||||
Recruit Holdings Co., Ltd. | 8,700 | 290,013 | ||||
Shiseido Co., Ltd. | 3,300 | 248,567 | ||||
Sony Corp., ADR | 6,300 | 330,057 | ||||
Suzuki Motor Corp. | 4,900 | 230,150 | ||||
Terumo Corp. | 9,700 | 288,800 | ||||
| ||||||
1,959,200 | ||||||
Singapore - 1.3% | ||||||
DBS Group Holdings, Ltd. | 15,600 | 299,317 | ||||
| ||||||
South Korea - 1.9% | ||||||
LG Chem, Ltd. | 825 | 253,291 | ||||
Samsung Electronics Co., Ltd., GDR | 185 | 188,145 | ||||
| ||||||
441,436 | ||||||
Europe - 59.9% | ||||||
Denmark - 0.6% | ||||||
Coloplast A/S | 1,200 | 135,609 | ||||
| ||||||
Finland - 1.0% | ||||||
Nokia OYJ, ADR | 48,300 | 241,983 | ||||
| ||||||
France - 8.3% | ||||||
AXA SA | 11,750 | 308,637 | ||||
BNP Paribas SA | 3,720 | 176,666 | ||||
Dassault Systemes SA | 2,625 | 418,780 | ||||
Safran SA | 3,200 | 468,849 | ||||
Schneider Electric SE | 5,000 | 453,476 | ||||
Talend SA, ADR* | 3,200 | 123,488 | ||||
| ||||||
1,949,896 | ||||||
| Name of Issuer | Quantity | Fair Value ($) | ||||
Germany - 6.9% | ||||||
adidas AG | 1,630 | 503,218 | ||||
Allianz SE | 2,250 | 542,397 | ||||
Aurelius SE & Co.* | 4,660 | 221,282 | ||||
Siemens AG | 2,900 | 344,928 | ||||
| ||||||
1,611,825 | ||||||
Ireland - 2.3% | ||||||
CRH, PLC, ADR | 7,400 | 242,350 | ||||
STERIS, PLC | 1,950 | 290,316 | ||||
| ||||||
532,666 | ||||||
Luxembourg - 1.9% | ||||||
Globant SA* | 4,350 | 439,568 | ||||
| ||||||
Netherlands - 4.8% | ||||||
ASML Holding NV | 1,700 | 353,481 | ||||
ING Groep NV | 27,400 | 317,672 | ||||
Koninklijke Philips NV | 5,750 | 250,585 | ||||
LyondellBasell Industries NV | 2,500 | 215,325 | ||||
| ||||||
1,137,063 | ||||||
Spain - 3.0% | ||||||
Iberdrola SA | 45,900 | 457,523 | ||||
Industria de Diseno Textil SA | 7,900 | 237,603 | ||||
| ||||||
695,126 | ||||||
Sweden - 1.2% | ||||||
Hexagon AB | 5,200 | 288,722 | ||||
| ||||||
Switzerland - 12.8% | ||||||
Alcon, Inc.* | 865 | 53,413 | ||||
Garmin, Ltd. | 3,600 | 287,280 | ||||
Interroll Holding AG | 120 | 301,782 | ||||
Logitech International SA | 5,925 | 235,578 | ||||
Lonza Group AG | 825 | 278,380 | ||||
Nestle SA | 7,000 | 724,667 | ||||
Novartis AG | 4,325 | 395,196 | ||||
Partners Group Holding AG | 300 | 235,710 | ||||
Roche Holding AG | 1,320 | 371,377 | ||||
Zurich Insurance Group AG | 380 | 132,311 | ||||
| ||||||
3,015,694 | ||||||
United Kingdom - 17.1% | ||||||
Ashtead Group, PLC | 9,600 | 274,798 | ||||
AstraZeneca, PLC, ADR | 8,300 | 342,624 | ||||
Atlassian Corp., PLC* | 2,000 | 261,680 | ||||
BAE Systems, PLC | 52,600 | 330,925 | ||||
Cineworld Group, PLC | 86,400 | 278,041 | ||||
Coca-Cola European Partners, PLC | 5,400 | 305,100 | ||||
Diageo, PLC, ADR | 2,775 | 478,188 | ||||
DS Smith, PLC | 50,600 | 232,941 | ||||
Prudential, PLC | 12,200 | 265,867 | ||||
Reckitt Benckiser Group, PLC | 4,400 | 347,226 | ||||
RELX, PLC | 14,700 | 355,703 | ||||
See accompanying notes to financial statements.
| 42 | SIT MUTUAL FUNDS ANNUAL REPORT |
| Name of Issuer | Quantity | Fair Value ($) | ||||
Royal Dutch Shell, PLC, ADR - Class A | 4,500 | 292,815 | ||||
Royal Dutch Shell, PLC, ADR - Class B | 3,700 | 243,238 | ||||
| ||||||
4,009,146 | ||||||
North America - 11.0% | ||||||
Canada - 5.6% | ||||||
Alimentation Couche-Tard, Inc. | 2,600 | 163,618 | ||||
BRP, Inc. | 5,800 | 207,277 | ||||
Canopy Growth Corp.* | 2,800 | 112,868 | ||||
Cronos Group, Inc.* | 7,300 | 116,654 | ||||
Suncor Energy, Inc. | 13,100 | 408,196 | ||||
Waste Connections, Inc. | 3,250 | 310,635 | ||||
| ||||||
1,319,248 | ||||||
United States - 5.4% | ||||||
Booking Holdings, Inc.* | 100 | 187,471 | ||||
Broadcom, Inc. | 1,025 | 295,057 | ||||
Euronet Worldwide, Inc.* | 3,150 | 529,956 | ||||
Mondelez International, Inc. | 4,800 | 258,720 | ||||
| ||||||
1,271,204 | ||||||
Total Common Stocks | 22,600,153 | |||||
| ||||||
Investment Companies - 1.3% | ||||||
iShares MSCI India ETF | 8,700 | 307,110 | ||||
(cost: $258,887) | ||||||
Short-Term Securities - 2.0% | ||||||
Fidelity Inst. Money Mkt. Gvt. Fund, 2.26% | 467,556 | 467,556 | ||||
(cost: $467,556) | ||||||
Total Investments in Securities - 99.6% | ||||||
(cost: $18,725,635) | 23,374,819 | |||||
Other Assets and Liabilities, net - 0.4% | 88,073 | |||||
| ||||||
Total Net Assets - 100.0% | $23,462,892 | |||||
| ||||||
| * | Non-income producing security. |
ADR — American Depositary Receipt
GDR — Global Depositary Receipt
PLC — Public Limited Company
Numeric footnotes not disclosed are not applicable to this Schedule of Investments.
See accompanying notes to financial statements.
| JUNE 30, 2019 | 43 |
SCHEDULE OF INVESTMENTS
June 30, 2019
Sit International Growth Fund (Continued)
A summary of the levels for the Fund’s investments as of June 30, 2019 is as follows (see Note 2 - significant accounting policies in the notes to financial statements):
| Investment in Securities | ||||||||||||||||||||
Level 1 Quoted Price ($) | Level 2 Other significant observable inputs ($) | Level 3 Significant unobservable inputs ($) | Total ($) | |||||||||||||||||
Common Stocks | ||||||||||||||||||||
Australia | 806,124 | — | — | 806,124 | ||||||||||||||||
Canada | 1,319,248 | — | — | 1,319,248 | ||||||||||||||||
China/Hong Kong | 2,446,326 | — | — | 2,446,326 | ||||||||||||||||
Denmark | 135,609 | — | — | 135,609 | ||||||||||||||||
Finland | 241,983 | — | — | 241,983 | ||||||||||||||||
France | 1,949,896 | — | — | 1,949,896 | ||||||||||||||||
Germany | 1,611,825 | — | — | 1,611,825 | ||||||||||||||||
Ireland | 532,666 | — | — | 532,666 | ||||||||||||||||
Japan | 1,959,200 | — | — | 1,959,200 | ||||||||||||||||
Luxembourg | 439,568 | — | — | 439,568 | ||||||||||||||||
Netherlands | 1,137,063 | — | — | 1,137,063 | ||||||||||||||||
Singapore | 299,317 | — | — | 299,317 | ||||||||||||||||
South Korea | 441,436 | — | — | 441,436 | ||||||||||||||||
Spain | 695,126 | — | — | 695,126 | ||||||||||||||||
Sweden | 288,722 | — | — | 288,722 | ||||||||||||||||
Switzerland | 3,015,694 | — | — | 3,015,694 | ||||||||||||||||
United Kingdom | 4,009,146 | — | — | 4,009,146 | ||||||||||||||||
United States | 1,271,204 | — | — | 1,271,204 | ||||||||||||||||
Investment Companies | 307,110 | — | — | 307,110 | ||||||||||||||||
Short-Term Securities | 467,556 | — | — | 467,556 | ||||||||||||||||
Total: | 23,374,819 | — | — | 23,374,819 | ||||||||||||||||
Level 1 securities of foreign issuers are primarily American Depositary Receipts (ADRs), Public Limited Companies (PLCs) or Global Depositary Receipts (GDRs). There were no transfers into or out of level 3 during the reporting period.
See accompanying notes to financial statements.
| 44 | SIT MUTUAL FUNDS ANNUAL REPORT |
[This page intentionally left blank.]
| JUNE 30, 2019 | 45 |
Sit Developing Markets Growth Fund
|
OBJECTIVE & STRATEGY
The objective of the Sit Developing Markets Growth Fund is to maximize long-term capital appreciation. The Fund seeks to achieve its objective by investing at least 80% of its net assets in common stocks of companies domiciled or operating in a developing market. In selecting investments for the Fund, the Adviser begins by selecting countries or regions in which to invest by considering several factors affecting the economy and equity market of foreign countries and regions. After the country and regional allocations are determined, the Adviser seeks industries and sectors that appear to have strong earnings growth prospects. Within the selected industries and sectors, the Adviser invests in foreign growth-oriented companies it believes exhibit the potential for superior growth.
The Sit Developing Markets Growth Fund declined-4.43% versus the MSCI Emerging Markets Index’s-1.37% for the twelve-month period ended June 30, 2019. The sectors of energy (China Petroleum, GeoPark), health care (CSPC Pharmaceutical,Medy-Tox), and food & staples retailing(E-Mart) contributed negatively, whichout-weighed the positive contributions from technology hardware (NICE) and semiconductors (Broadcom). By country, Israel helped with relative outperformance yet China and Brazil hurt performance. EM stocks’ performance were impacted by fears of a global economic recession, moderating economic growth in China, escalating U.S.-China trade tensions, and increasing geopolitical risks.
China’s economy has shown green shoots of a recovery, but recent macro data has largely surprised on the downside. Moreover, there-escalation of U.S.-China trade tensions should result in GDP growth slowing from +6.6% in 2018 to +6.2% in 2019. In response to these downward pressures, policymakers announced measures to relax auto purchase restrictions and support infrastructure investment. Though the relationship between the U.S. and China has deteriorated since the Trump Administration put Huawei Technologies on its blacklist and restricted its access to U.S. technology, anall-out trade war would be painful for both economies. Thus we expect a deal will eventually materialize. In India, Prime Minister Modi’s reelection clears the path for morepro-growth reform. In Brazil, their economic recovery has been the weakest on record following the deepest recession due to political uncertainty, fiscal austerity, and high inflation. However, the upcoming passage of pension reform should bolster Brazil’s fiscal position and provide clarity for business investment. Mexico’s outlook for economic growth is weak, driven by policy uncertainty, moderating global/U.S. economic growth, tightening financial conditions, and fiscal restraint.
For investment strategy, we prefer Asiaex-Japan, especially China, and are underweight Latin America. Despite elevated U.S.-China trade tensions, we expect China’s economy to muddle through with the assistance of government stimulus. We take a balanced investment approach, with an overweight in “new economy” names, as they are more exposed to domestic consumption and the industrial digital upgrade, as well as consumer staples and utility stocks. We remain positive on Indian and South Korean equities. Prime Minister Modi will focus on policy continuity, better implementation of laws, and GDP growth. Therefore, we prefer economically-sensitive sectors
HYPOTHETICAL GROWTH OF $10,000

The chart above illustrates the total value of a hypothetical $10,000 investment in the Fund over the past 10 years as compared to the performance of the MSCI Emerging Markets Index. Past performance does not guarantee future results. Returns include the reinvestment of distributions. The chart does not reflect the deduction of taxes that a shareholder would pay on Fund distributions or the redemption of Fund shares.
1 MSCI Emerging Markets Index is an unmanaged free float-adjusted market capitalization index that measures equity market performance of emerging markets. It is not possible to invest directly in an index. This is the Fund’s primary index.
such as consumer, energy, financials, information services, and industrials. In South Korea, as its economy is largely trade-related, the outlook for stocks remains dependent on a U.S.-China trade deal. Consequently, we own a balanced portfolio of stocks in technology, financial, consumer, pharmaceutical, and materials.
We are underweight Brazil due to subpar economic growth, which will continue if the passage of pension reform is delayed. Hence, we prefer the consumer and financial sectors. Our negative view on Mexico stems from softer global growth prospects and a weak domestic economy. Mexico’s GDP growth will be negatively impacted by President Andres Manuel Lopez Obrador’s decision to reduce federal government salaries and infrastructure spending, in addition to the slowroll-out of social programs. Our strategy for Mexico remains largely defensive, with investments in domestic consumer staples.
Roger J. Sit Raymond E. Sit
Portfolio Managers
Information on this page is unaudited.
| 46 | SIT MUTUAL FUNDS ANNUAL REPORT |
|
COMPARATIVE RATES OF RETURN
as of June 30, 2019
| Sit Developing Markets Growth Fund | MSCI Emerging Markets Index1 | |||||||
One Year | -4.43% | -1.37% | ||||||
Five Year | 1.58 | 0.08 | ||||||
Ten Year | 4.30 | 3.32 | ||||||
Since Inception (7/1/94) | 4.06 | 3.20 | ||||||
Performance figures are historical and do not guarantee future results. Investment returns and principal value will vary, and you may have a gain or loss when you sell shares. Current performance may be lower or higher than the performance data quoted. Contact the Fund for performance data current to the most recentmonth-end. Returns include changes in share price as well as reinvestment of all dividends and capital gains. Returns do not reflect the deduction of the 2% redemption fee imposed if shares are redeemed or exchanged within 30 calendar days from their date of purchase. If imposed, the fee would reduce the performance quoted. Returns do not reflect the deduction of taxes that a shareholder would pay on Fund distributions or the redemption of Fund shares. Management fees and administrative expenses are included in the Fund’s performance. Returns for periods greater than one year are compounded average annual rates of return.
1 MSCI Emerging Markets Index is an unmanaged free float-adjusted market capitalization index that measures equity market performance of emerging markets. It is not possible to invest directly in an index.
FUND DIVERSIFICATION - BY REGION
| Sit Developing Markets Growth Fund | MSCI Emerging Markets Index | |||
Asia | 71.8% | 72.1% | ||
Africa/Middle East | 10.1 | 9.2 | ||
Latin America | 8.3 | 12.3 | ||
North America | 3.3 | — | ||
Europe | 1.4 | 6.4 | ||
Cash & Other Net Assets | 5.1 | — | ||
Based on total net assets as of June 30, 2019. Subject to change.
PORTFOLIO SUMMARY
Net Asset Value 6/30/19: | $16.21 Per Share | |
Net Asset Value 6/30/18: | $17.25 Per Share | |
Total Net Assets: | $10.0 Million | |
Weighted Average Market Cap: | $100.1 Billion |
TOP 10 HOLDINGS
1. Tencent Holdings, Ltd.
2. Samsung Electronics Co., Ltd.
3. Alibaba Group Holding, Ltd., ADR
4. iShares MSCI India ETF
5. HDFC Bank, Ltd., ADR
6. TAL Education Group, ADR
7. Naspers, Ltd.
8. China Construction Bank Corp.
9. NICE Systems, Ltd., ADR
10. Taiwan Semiconductor Co.
Based on total net assets as of June 30, 2019. Subject to change.
SECTOR ALLOCATION
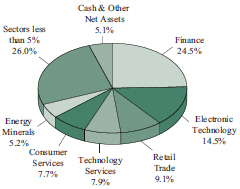
Based on total net assets as of June 30, 2019. Subject to change.
Information on this page is unaudited.
| JUNE 30, 2019 | 47 |
SCHEDULE OF INVESTMENTS
June 30, 2019
Sit Developing Markets Growth Fund
Investments are grouped by geographic region.
| Name of Issuer | Quantity | Fair Value ($) | ||||
Common Stocks - 91.0% | ||||||
Africa/Middle East - 10.1% | ||||||
Israel - 3.0% | ||||||
NICE Systems, Ltd., ADR* | 2,175 | 297,975 | ||||
| ||||||
South Africa - 7.1% | ||||||
Bid Corp., Ltd. | 13,200 | 287,701 | ||||
Bidvest Group, Ltd. | 5,525 | 74,275 | ||||
Naspers, Ltd. | 1,425 | 345,958 | ||||
| ||||||
707,934 | ||||||
Asia - 67.9% | ||||||
Australia - 1.5% | ||||||
Rio Tinto, PLC, ADR | 2,475 | 154,291 | ||||
| ||||||
China/Hong Kong - 38.0% | ||||||
AIA Group, Ltd. | 21,400 | 230,801 | ||||
Alibaba Group Holding, Ltd., ADR* | 2,875 | 487,169 | ||||
Baidu, Inc., ADR* | 1,125 | 132,030 | ||||
China Construction Bank Corp. | 359,000 | 309,289 | ||||
China Mengniu Dairy Co., Ltd. | 48,000 | 185,875 | ||||
China Petroleum & Chemical Corp., ADR | 3,100 | 211,420 | ||||
China Tower Corp., Ltd. | 414,000 | 108,645 | ||||
CNOOC, Ltd., ADR | 300 | 51,105 | ||||
CSPC Pharmaceutical Group, Ltd. | 120,000 | 193,556 | ||||
ENN Energy Holdings, Ltd. | 21,900 | 213,065 | ||||
Hong Kong Exchanges & Clearing, Ltd. | 4,300 | 151,816 | ||||
JD.com, Inc., ADR* | 4,450 | 134,790 | ||||
Ping An Insurance Group Co. of China, Ltd. | 19,900 | 238,952 | ||||
Sinopharm Group Co., Ltd. | 44,900 | 158,064 | ||||
TAL Education Group, ADR* | 9,100 | 346,710 | ||||
Tencent Holdings, Ltd. | 11,400 | 514,567 | ||||
WH Group, Ltd. | 132,500 | 134,337 | ||||
| ||||||
3,802,191 | ||||||
India - 3.5% | ||||||
HDFC Bank, Ltd., ADR | 2,675 | 347,857 | ||||
| ||||||
Indonesia - 2.9% | ||||||
Astra International Tbk PT | 176,000 | 92,812 | ||||
XL Axiata Tbk PT* | 948,800 | 200,136 | ||||
| ||||||
292,948 | ||||||
Japan - 1.6% | ||||||
Suzuki Motor Corp. | 3,400 | 159,696 | ||||
| ||||||
Singapore - 2.8% | ||||||
DBS Group Holdings, Ltd. | 14,500 | 278,211 | ||||
| ||||||
South Korea - 10.8% | ||||||
LG Chem, Ltd. | 525 | 161,185 | ||||
Medy-Tox, Inc. | 360 | 140,302 | ||||
Samsung Electronics Co., Ltd. | 12,250 | 498,636 | ||||
Shinhan Financial Group Co., Ltd. | 7,200 | 279,981 | ||||
| ||||||
1,080,104 | ||||||
| Name of Issuer | Quantity | Fair Value ($) | ||||
Taiwan - 5.4% | ||||||
Cathay Financial Holding Co., Ltd. | 82,085 | 113,642 | ||||
Hon Hai Precision Industry Co., Ltd., GDR | 22,160 | 108,916 | ||||
Taiwan Semiconductor Co. | 37,482 | 288,420 | ||||
Taiwan Semiconductor Co., ADR | 600 | 23,502 | ||||
| ||||||
534,480 | ||||||
Thailand - 1.4% | ||||||
Bangkok Bank PCL | 21,200 | 137,566 | ||||
| ||||||
Europe - 1.4% | ||||||
Luxembourg - 1.4% | ||||||
Globant SA* | 1,400 | 141,470 | ||||
| ||||||
Latin America - 8.3% | ||||||
Brazil - 2.8% | ||||||
Ambev SA, ADR | 10,800 | 50,436 | ||||
Banco Bradesco SA | 22,803 | 224,648 | ||||
| ||||||
275,084 | ||||||
Chile - 4.0% | ||||||
Banco Santander Chile, ADR | 4,700 | 140,624 | ||||
Geopark, Ltd.* | 14,100 | 261,414 | ||||
| ||||||
402,038 | ||||||
Peru - 1.5% | ||||||
Southern Copper Corp. | 3,900 | 151,515 | ||||
| ||||||
North America - 3.3% | ||||||
Mexico - 1.0% | ||||||
Fomento Economico Mexicano, ADR | 1,075 | 104,006 | ||||
| ||||||
United States - 2.3% | ||||||
Broadcom, Inc. | 550 | 158,323 | ||||
Skyworks Solutions, Inc. | 925 | 71,475 | ||||
| ||||||
229,798 | ||||||
Total Common Stocks | 9,097,164 | |||||
| ||||||
Investment Companies - 3.9% | ||||||
iShares MSCI India ETF | 11,100 | 391,830 | ||||
| ||||||
(cost: $334,045) | ||||||
See accompanying notes to financial statements.
| 48 | SIT MUTUAL FUNDS ANNUAL REPORT |
| Name of Issuer | Quantity | Fair Value ($) | ||||
Short-Term Securities - 5.0% | ||||||
Fidelity Inst. Money Mkt. Gvt. Fund, 2.26% | 495,870 | 495,870 | ||||
(cost: $495,870) | ||||||
Total Investments in Securities - 99.9% | 9,984,864 | |||||
Other Assets and Liabilities, net - 0.1% | 10,804 | |||||
Total Net Assets - 100.0% | $9,995,668 | |||||
| ||||||
| * | Non-income producing security. |
ADR — American Depositary Receipt
GDR — Global Depositary Receipt
Numeric footnotes not disclosed are not applicable to this Schedule of Investments.
A summary of the levels for the Fund’s investments as of June 30, 2019 is as follows (see Note 2 - significant accounting policies in the notes to financial statements):
| Investment in Securities | ||||||||||||
Level 1 Quoted Price ($) |
Level 2 Other significant observable inputs ($) |
Level 3 Significant unobservable inputs ($) | Total ($) | |||||||||
Common Stocks | ||||||||||||
Australia | 154,291 | — | — | 154,291 | ||||||||
Brazil | 275,084 | — | — | 275,084 | ||||||||
Chile | 402,038 | — | — | 402,038 | ||||||||
China/Hong Kong | 3,802,191 | — | — | 3,802,191 | ||||||||
India | 347,857 | — | — | 347,857 | ||||||||
Indonesia | 292,948 | — | — | 292,948 | ||||||||
Israel | 297,975 | — | — | 297,975 | ||||||||
Japan | 159,696 | — | — | 159,696 | ||||||||
Luxembourg | 141,470 | — | — | 141,470 | ||||||||
Mexico | 104,006 | — | — | 104,006 | ||||||||
Peru | 151,515 | — | — | 151,515 | ||||||||
Singapore | 278,211 | — | — | 278,211 | ||||||||
South Africa | 707,934 | — | — | 707,934 | ||||||||
South Korea | 1,080,104 | — | — | 1,080,104 | ||||||||
Taiwan | 534,480 | — | — | 534,480 | ||||||||
Thailand | 137,566 | — | — | 137,566 | ||||||||
United States | 229,798 | — | — | 229,798 | ||||||||
Investment Companies | 391,830 | — | — | 391,830 | ||||||||
Short-Term Securities | 495,870 | — | — | 495,870 | ||||||||
Total: | 9,984,864 | — | — | 9,984,864 | ||||||||
Level 1 securities of foreign issuers are primarily American Depositary Receipts (ADRs), Public Limited Companies (PLCs) or Global Depositary Receipts (GDRs). There were no transfers into or out of level 3 during the reporting period.
See accompanying notes to financial statements.
| JUNE 30, 2019 | 49 |
STATEMENTS OF ASSETS AND LIABILITIES
June 30, 2019
| Sit Balanced Fund | Sit Dividend Growth Fund | Sit Global Dividend Growth Fund | |||||||||||||
ASSETS | |||||||||||||||
Investments in securities, at identified cost | $27,634,209 | $218,157,647 | $25,905,572 | ||||||||||||
|
|
|
|
|
| ||||||||||
Investments in securities, at fair value - see accompanying schedule for detail | $34,587,187 | $253,292,119 | $33,985,900 | ||||||||||||
Cash in bank on demand deposit | — | — | — | ||||||||||||
Accrued interest and dividends receivable | 86,987 | 242,968 | 105,439 | ||||||||||||
Receivable for investment securities sold | — | 3,262,548 | — | ||||||||||||
Receivable for Fund shares sold | 2,258 | 29,701 | 311 | ||||||||||||
|
|
|
|
|
| ||||||||||
Total assets | 34,676,432 | 256,827,336 | 34,091,650 | ||||||||||||
|
|
|
|
|
| ||||||||||
LIABILITIES | |||||||||||||||
Disbursements in excess of cash balances | — | — | 1 | ||||||||||||
Payable for investment securities purchased | 170,206 | 2,605,671 | — | ||||||||||||
Payable for Fund shares redeemed | 13,386 | 136,495 | 45 | ||||||||||||
Accrued investment management fees and advisory fees | 27,975 | 144,557 | 27,652 | ||||||||||||
Accrued12b-1 fees (Class S) | — | 8,261 | 653 | ||||||||||||
|
|
|
|
|
| ||||||||||
Total liabilities | 211,567 | 2,894,984 | 28,351 | ||||||||||||
|
|
|
|
|
| ||||||||||
Net assets applicable to outstanding capital stock | $34,464,865 | $253,932,352 | $34,063,299 | ||||||||||||
|
|
|
|
|
| ||||||||||
Net assets consist of: | |||||||||||||||
Capital (par value andpaid-in surplus) | $25,885,880 | $199,314,805 | $26,948,154 | ||||||||||||
Total distributable earnings (loss), including unrealized appreciation (depreciation) | 8,578,985 | 54,617,547 | 7,115,145 | ||||||||||||
|
|
|
|
|
| ||||||||||
| $34,464,865 | $253,932,352 | $34,063,299 | |||||||||||||
|
|
|
|
|
| ||||||||||
Outstanding shares: | |||||||||||||||
Common Shares (Class I) * | 1,375,284 | 14,824,880 | 1,885,944 | ||||||||||||
Common Shares (Class S) * | — | 2,763,921 | 198,463 | ||||||||||||
Net assets applicable to outstanding shares: | |||||||||||||||
Common Shares (Class I) * | $34,464,865 | $214,203,663 | $30,822,737 | ||||||||||||
|
|
|
|
|
| ||||||||||
Common Shares (Class S) * | — | 39,728,689 | 3,240,562 | ||||||||||||
Net asset value per share of outstanding capital stock: | |||||||||||||||
Common Shares (Class I) * | $25.06 | $14.45 | $16.34 | ||||||||||||
Common Shares (Class S) * | — | $14.37 | $16.33 | ||||||||||||
* Dividend Growth, Global Dividend Growth, ESG Growth and Small Cap Dividend Growth Funds offer multiple share classes (I and S). All other Funds offer a single share class. |
| ||||||||||||||
See accompanying notes to financial statements.
| 50 | SIT MUTUAL FUNDS ANNUAL REPORT |
| Sit Large Cap Growth Fund | Sit ESG Growth Fund | Sit Mid Cap Growth Fund | Sit Small Cap Dividend Growth Fund | Sit Small Cap Growth Fund | Sit International Growth Fund | Sit Developing Markets Growth Fund | ||||||||||||||||||||
| $59,944,564 | $4,812,517 | $97,600,321 | $14,150,528 | $62,856,593 | $18,725,635 | $7,419,864 | ||||||||||||||||||||
|
|
|
|
|
|
|
|
|
|
|
|
|
| |||||||||||||
| $116,708,338 | $6,280,507 | $169,842,857 | $16,524,623 | $99,829,373 | $23,374,819 | $9,984,864 | ||||||||||||||||||||
| — | — | — | — | 146,514 | — | 2,842 | ||||||||||||||||||||
| 31,997 | 7,256 | 87,231 | 26,402 | 105,600 | 117,646 | 18,438 | ||||||||||||||||||||
| — | — | — | — | — | — | — | ||||||||||||||||||||
| 2,351 | — | 4,931 | 2,138 | 1,407 | 510 | 775 | ||||||||||||||||||||
|
|
|
|
|
|
|
|
|
|
|
|
|
| |||||||||||||
| 116,742,686 | 6,287,763 | 169,935,019 | 16,553,163 | 100,082,894 | 23,492,975 | 10,006,919 | ||||||||||||||||||||
|
|
|
|
|
|
|
|
|
|
|
|
|
| |||||||||||||
| — | — | — | — | — | 4 | — | ||||||||||||||||||||
| — | — | 537,270 | — | 329,900 | — | — | ||||||||||||||||||||
| 67,234 | — | 129,574 | — | 3,087 | 1,979 | 125 | ||||||||||||||||||||
| 94,012 | 5,065 | 169,466 | 13,265 | 120,292 | 28,100 | 11,126 | ||||||||||||||||||||
| — | 584 | — | 793 | — | — | — | ||||||||||||||||||||
|
|
|
|
|
|
|
|
|
|
|
|
|
| |||||||||||||
| 161,246 | 5,649 | 836,310 | 14,058 | 453,279 | 30,083 | 11,251 | ||||||||||||||||||||
|
|
|
|
|
|
|
|
|
|
|
|
|
| |||||||||||||
| $116,581,440 | $6,282,114 | $169,098,709 | $16,539,105 | $99,629,615 | $23,462,892 | $9,995,668 | ||||||||||||||||||||
|
|
|
|
|
|
|
|
|
|
|
|
|
| |||||||||||||
| $52,810,648 | $4,889,964 | $88,655,342 | $14,305,720 | $61,878,071 | $19,707,064 | $7,413,713 | ||||||||||||||||||||
| 63,770,792 | 1,392,150 | 80,443,367 | 2,233,385 | 37,751,544 | 3,755,828 | 2,581,955 | ||||||||||||||||||||
|
|
|
|
|
|
|
|
|
|
|
|
|
| |||||||||||||
| $116,581,440 | $6,282,114 | $169,098,709 | $16,539,105 | $99,629,615 | $23,462,892 | $9,995,668 | ||||||||||||||||||||
|
|
|
|
|
|
|
|
|
|
|
|
|
| |||||||||||||
| 2,741,458 | 256,320 | 8,973,352 | 1,056,398 | 1,796,528 | 1,369,400 | 616,676 | ||||||||||||||||||||
|
|
|
|
|
|
|
|
|
|
|
|
|
| |||||||||||||
| — | 219,967 | — | 335,086 | — | — | — | ||||||||||||||||||||
|
|
|
|
|
|
|
|
|
|
|
|
|
| |||||||||||||
| $116,581,440 | $3,386,749 | $169,098,709 | $12,558,596 | $99,629,615 | $23,462,892 | $9,995,668 | ||||||||||||||||||||
|
|
|
|
|
|
|
|
|
|
|
|
|
| |||||||||||||
| — | 2,895,365 | — | 3,980,509 | — | — | — | ||||||||||||||||||||
|
|
|
|
|
|
|
|
|
|
|
|
|
| |||||||||||||
| $42.53 | $13.21 | $18.84 | $11.89 | $55.46 | $17.13 | $16.21 | ||||||||||||||||||||
|
|
|
|
|
|
|
|
|
|
|
|
|
| |||||||||||||
| — | $13.16 | — | $11.88 | — | — | — | ||||||||||||||||||||
|
|
|
|
|
|
|
|
|
|
|
|
|
| |||||||||||||
| JUNE 30, 2019 | 51 |
Year Ended June 30, 2019
| Sit Balanced Fund | Sit Dividend Growth Fund | Sit Global Dividend Growth Fund | |||||||||||||
Investment income: | |||||||||||||||
Income: | |||||||||||||||
Dividends* | $375,025 | $18,315,024 | $875,897 | ||||||||||||
Interest | 469,168 | 95,967 | 25,318 | ||||||||||||
|
|
|
|
|
| ||||||||||
Total income | 844,193 | 18,410,991 | 901,215 | ||||||||||||
|
|
|
|
|
| ||||||||||
Expenses (note 4): | |||||||||||||||
Investment management and advisory service fee | 361,740 | 6,055,915 | 405,615 | ||||||||||||
12b-1 fees (Class S) | — | 114,774 | 7,858 | ||||||||||||
|
|
|
|
|
| ||||||||||
Total expenses | 361,740 | 6,170,689 | 413,473 | ||||||||||||
|
|
|
|
|
| ||||||||||
Less fees and expenses waived by investment adviser | — | (1,816,774 | ) | (81,123 | ) | ||||||||||
|
|
|
|
|
| ||||||||||
Total net expenses | 361,740 | 4,353,915 | 332,350 | ||||||||||||
|
|
|
|
|
| ||||||||||
Net investment income (loss) | 482,453 | 14,057,076 | 568,865 | ||||||||||||
|
|
|
|
|
| ||||||||||
Realized and unrealized gain (loss): | |||||||||||||||
Net realized gain (loss) on investments | 1, 552,948 | 91,002,769 | (232,110 | ) | |||||||||||
Net realized gain (loss) on foreign currency transactions | — | — | (2,265 | ) | |||||||||||
Net change in unrealized appreciation (depreciation) on investments and foreign currency transactions | 328,736 | (108,242,415 | ) | 2,588,960 | |||||||||||
|
|
|
|
|
| ||||||||||
Net gain (loss) | 1, 881,684 | (17,239,646 | ) | 2,354,585 | |||||||||||
|
|
|
|
|
| ||||||||||
Net increase (decrease) in net assets resulting from operations | $2,364,137 | ($3,182,570 | ) | $2,923,450 | |||||||||||
|
|
|
|
|
| ||||||||||
* Foreign taxes withheld on dividends received | — | $80,611 | $31,197 | ||||||||||||
See accompanying notes to financial statements.
| 52 | SIT MUTUAL FUNDS ANNUAL REPORT |
| Sit Large Cap Growth Fund | Sit ESG Growth Fund | Sit Mid Cap Growth Fund | Sit Small Cap Dividend Growth Fund | Sit Small Cap Growth Fund | Sit International Growth Fund | Sit Developing Markets Growth Fund | ||||||||||||||||||||
| $1,598,120 | $134,760 | $1,672,143 | $382,933 | $950,828 | $543,955 | $200,324 | ||||||||||||||||||||
| 22,913 | 6,002 | 69,833 | 12,974 | 49,559 | 8,101 | 6,167 | ||||||||||||||||||||
|
|
|
|
|
|
|
|
|
|
|
|
|
| |||||||||||||
| 1,621,033 | 140,762 | 1,741,976 | 395,907 | 1,000,387 | 552,056 | 206,491 | ||||||||||||||||||||
|
|
|
|
|
|
|
|
|
|
|
|
|
| |||||||||||||
| 1,167,721 | 73,739 | 1,993,266 | 213,141 | 1,454,688 | 335,515 | 203,066 | ||||||||||||||||||||
| — | 6,792 | — | 9,498 | — | — | — | ||||||||||||||||||||
|
|
|
|
|
|
|
|
|
|
|
|
|
| |||||||||||||
| 1,167,721 | 80,531 | 1,993,266 | 222,639 | 1,454,688 | 335,515 | 203,066 | ||||||||||||||||||||
|
|
|
|
|
|
|
|
|
|
|
|
|
| |||||||||||||
| — | (14,748 | ) | — | (42,628 | ) | — | — | (60,920 | ) | |||||||||||||||||
|
|
|
|
|
|
|
|
|
|
|
|
|
| |||||||||||||
| 1,167,721 | 65,783 | 1,993,266 | 180,011 | 1,454,688 | 335,515 | 142,146 | ||||||||||||||||||||
|
|
|
|
|
|
|
|
|
|
|
|
|
| |||||||||||||
| 453,312 | 74,979 | (251,290 | ) | 215,896 | (454,301 | ) | 216,541 | 64,345 | ||||||||||||||||||
|
|
|
|
|
|
|
|
|
|
|
|
|
| |||||||||||||
| 9,704,669 | (76,678 | ) | 15,207,100 | 172,807 | 4,285,203 | (291,223 | ) | 41,119 | ||||||||||||||||||
| — | 3 | (8 | ) | — | — | (6,294 | ) | (586 | ) | |||||||||||||||||
| 878,764 | 472,193 | 2,857,207 | (600,408 | ) | 2,110,594 | 807,103 | (630,178 | ) | ||||||||||||||||||
|
|
|
|
|
|
|
|
|
|
|
|
|
| |||||||||||||
| 10,583,433 | 395,518 | 18,064,299 | (427,601 | ) | 6,395,797 | 509,586 | (589,645 | ) | ||||||||||||||||||
|
|
|
|
|
|
|
|
|
|
|
|
|
| |||||||||||||
| $11,036,745 | $470,497 | $17,813,009 | ($211,705 | ) | $5,941,496 | $726,127 | ($525,300 | ) | ||||||||||||||||||
|
|
|
|
|
|
|
|
|
|
|
|
|
| |||||||||||||
| — | $6,697 | $5,209 | $3,919 | $5,158 | $48,770 | $23,041 | ||||||||||||||||||||
| JUNE 30, 2019 | 53 |
STATEMENTS OF CHANGES IN NET ASSETS
| Sit Balanced Fund | Sit Dividend Growth Fund | |||||||||||||||
| Year Ended June 30, 2019 | Year Ended June 30, 2018 | Year Ended June 30, 2019 | Year Ended June 30, 2018 | |||||||||||||
Operations: | ||||||||||||||||
Net investment income | $482,453 | $303,300 | $14,057,076 | $15,673,656 | ||||||||||||
Net realized gain (loss) on investments and foreign currency transactions | 1,552,948 | 715,577 | 91,002,769 | 109,763,327 | ||||||||||||
Net change in unrealized appreciation (depreciation) of investments and foreign currency transactions | 328,736 | 1,390,249 | (108,242,415 | ) | (22,458,367 | ) | ||||||||||
|
|
|
|
|
|
|
| |||||||||
Net increase (decrease) in net assets resulting from operations | 2, 364,137 | 2,409,126 | (3,182,570 | ) | 102,978,616 | |||||||||||
|
|
|
|
|
|
|
| |||||||||
Distributions from: | ||||||||||||||||
Net investment income and net realized gains | ||||||||||||||||
Common shares (Class I) | (801,302 | ) | (1,313,844 | ) 1 | (104,820,743 | ) | (105,434,233 | ) 1 | ||||||||
Common shares (Class S) | — | — | (8, 833,909 | ) | (6,712,578 | )1 | ||||||||||
|
|
|
|
|
|
|
| |||||||||
Total distributions | (801,302 | ) | (1,313,844 | ) | (113,654,652 | ) | (112,146,811 | ) | ||||||||
|
|
|
|
|
|
|
| |||||||||
Capital share transactions: | ||||||||||||||||
Proceeds from shares sold | ||||||||||||||||
Common shares (Class I) | 7,363,030 | 13,977,591 | 70,924,492 | 257,170,063 | ||||||||||||
Common shares (Class S) | — | — | 2,521,662 | 2,307,028 | ||||||||||||
Reinvested distributions | ||||||||||||||||
Common shares (Class I) | 787,611 | 1,299,020 | 101,138,488 | 42,771,565 | ||||||||||||
Common shares (Class S) | — | — | 8,734,436 | 6,677,009 | ||||||||||||
Payments for shares redeemed | ||||||||||||||||
Common shares (Class I) | (12,789,473 | ) | (4,072,712 | ) | (765,396,526 | ) | (388,508,155 | ) | ||||||||
Common shares (Class S) | — | — | (17,067,708 | ) | (22,533,051 | ) | ||||||||||
|
|
|
|
|
|
|
| |||||||||
Increase (decrease) in net assets from capital transactions | (4,638,832 | ) | 11,203,899 | (599,145,156 | ) | (102,115,541 | ) | |||||||||
|
|
|
|
|
|
|
| |||||||||
Total increase (decrease) in net assets | (3,075,997 | ) | 12,299,181 | (715,982,378 | ) | (111,283,736 | ) | |||||||||
Net assets: | ||||||||||||||||
Beginning of period | 37,540,862 | 25,241,681 | 969,914,730 | 1,081,198,466 | ||||||||||||
|
|
|
|
|
|
|
| |||||||||
End of period 2 | $34,464,865 | $37,540,862 | $253,932,352 | $969,914,730 | ||||||||||||
|
|
|
|
|
|
|
| |||||||||
Capital transactions in shares: | ||||||||||||||||
Sold | ||||||||||||||||
Common shares (Class I) | 307,091 | 584,716 | 4,474,113 | 14,996,753 | ||||||||||||
Common shares (Class S) | — | — | 167,274 | 134,409 | ||||||||||||
Reinvested distributions | ||||||||||||||||
Common shares (Class I) | 34,382 | 55,504 | 7, 846,703 | 2,542,673 | ||||||||||||
Common shares (Class S) | — | — | 687,436 | 398,231 | ||||||||||||
Redeemed | ||||||||||||||||
Common shares (Class I) | (545,889 | ) | (171,981 | ) | (52,548,963 | ) | (22,672,863 | ) | ||||||||
Common shares (Class S) | — | — | (1, 181,017 | ) | (1,325,718 | ) | ||||||||||
|
|
|
|
|
|
|
| |||||||||
Net increase (decrease) | (204,416 | ) | 468,239 | (40,554,454 | ) | (5,926,515 | ) | |||||||||
|
|
|
|
|
|
|
| |||||||||
| 1 | For the year ended June 30, 2018, distributions to shareholders were from net investment income and net realized gains for book purposes. During 2018, the Securities and Exchange Commission eliminated the requirement to distinguish between distributions from net investment income and net realized gains for book purposes. The tax character of distributions is disclosed in the notes to the financial statements. |
| 2 | During 2018, the Securities and Exchange Commission eliminated the requirement to disclose end of year undistributed (distributions in excess of) net investment income. |
See accompanying notes to financial statements.
| 54 | SIT MUTUAL FUNDS ANNUAL REPORT |
| Sit Global Dividend Growth Fund | Sit Large Cap Growth Fund | Sit ESG Growth Fund | ||||||||||||||||||||
| Year Ended June 30, 2019 | Year Ended June 30, 2018 | Year Ended June 30, 2019 | Year Ended June 30, 2018 | Year Ended June 30, 2019 | Year Ended June 30, 2018 | |||||||||||||||||
| $568,865 | $558,373 | $453,312 | $359,089 | $74,979 | $64,388 | |||||||||||||||||
| (234,375 | ) | (27,715 | ) | 9,704,669 | 9,803,393 | (76,675 | ) | 9,914 | ||||||||||||||
| 2,588,960 | 1,347,979 | 878,764 | 8,347,786 | 472,193 | 442,491 | |||||||||||||||||
|
|
|
|
|
|
|
|
|
|
|
| |||||||||||
| 2,923,450 | 1,878,637 | 11,036,745 | 18,510,268 | 470,497 | 516,793 | |||||||||||||||||
|
|
|
|
|
|
|
|
|
|
|
| |||||||||||
| (521,860 | ) | (431,455 | )1 | (9,934,663 | ) | (12,794,121 | ) 1 | (40,551 | ) | (27,776 | )1 | |||||||||||
| (49,144 | ) | (44,545 | )1 | — | — | (31,449 | ) | (21,224 | )1 | |||||||||||||
|
|
|
|
|
|
|
|
|
|
|
| |||||||||||
| (571,004 | ) | (476,000 | ) | (9,934,663 | ) | (12,794,121 | ) | (72,000 | ) | (49,000 | ) | |||||||||||
|
|
|
|
|
|
|
|
|
|
|
| |||||||||||
| 2,468,958 | 3,389,268 | 4,477,170 | 4,047,652 | 169,033 | 460,069 | |||||||||||||||||
| 95,183 | 264,488 | — | — | 25,229 | 103,794 | |||||||||||||||||
| 504,463 | 423,025 | 9,726,108 | 12,508,440 | 40,551 | 27,776 | |||||||||||||||||
| 48,033 | 43,351 | — | — | 31,449 | 21,224 | |||||||||||||||||
| (3,055,896 | ) | (1,892,026 | ) | (17,516,267 | ) | (17,099,902 | ) | (78,105 | ) | (39,541 | ) | |||||||||||
| (373,656 | ) | (504,237 | ) | — | — | (5,309 | ) | (10,055 | ) | |||||||||||||
|
|
|
|
|
|
|
|
|
|
|
| |||||||||||
| (312,915 | ) | 1,723,869 | (3,312,989 | ) | (543,810 | ) | 182,848 | 563,267 | ||||||||||||||
|
|
|
|
|
|
|
|
|
|
|
| |||||||||||
| 2,039,531 | 3,126,506 | (2,210,907 | ) | 5,172,337 | 581,345 | 1,031,060 | ||||||||||||||||
| 32,023,768 | 28,897,262 | 118,792,347 | 113,620,010 | 5,700,769 | 4,669,709 | |||||||||||||||||
|
|
|
|
|
|
|
|
|
|
|
| |||||||||||
| $34,063,299 | $32,023,768 | $116,581,440 | $118,792,347 | $6,282,114 | $5,700,769 | |||||||||||||||||
|
|
|
|
|
|
|
|
|
|
|
| |||||||||||
| 159,277 | 220,714 | 106,595 | 95,043 | 13,267 | 38,636 | |||||||||||||||||
| 6,375 | 17,327 | — | — | 2,101 | 8,819 | |||||||||||||||||
| 33,104 | 27,818 | 272,975 | 305,905 | 3,575 | 2,227 | |||||||||||||||||
| 3,149 | 2,858 | — | — | 2,781 | 1,703 | |||||||||||||||||
| (194,896 | ) | (122,055 | ) | (439,602 | ) | (401,061 | ) | (6,263 | ) | (3,175 | ) | |||||||||||
| (24,279 | ) | (32,356 | ) | — | — | (418 | ) | (831 | ) | |||||||||||||
|
|
|
|
|
|
|
|
|
|
|
| |||||||||||
| (17,270 | ) | 114,306 | (60,032 | ) | (113 | ) | 15,043 | 47,379 | ||||||||||||||
|
|
|
|
|
|
|
|
|
|
|
| |||||||||||
| JUNE 30, 2019 | 55 |
STATEMENTS OF CHANGES IN NET ASSETS (Continued)
| Sit Small Cap | ||||||||||||||||
| Sit Mid Cap Growth Fund | Dividend Growth Fund | |||||||||||||||
| Year Ended | Year Ended | Year Ended | Year Ended | |||||||||||||
| June 30, | June 30, | June 30, | June 30, | |||||||||||||
| 2019 | 2018 | 2019 | 2018 | |||||||||||||
Operations: | ||||||||||||||||
Net investment income (loss) | ($251,290 | ) | ($273,200 | ) | $215,896 | $160,182 | ||||||||||
Net realized gain (loss) on investments and foreign currency transactions | 15,207,092 | 11,316,697 | 172,807 | 147,242 | ||||||||||||
Net change in unrealized appreciation (depreciation) of investments and foreign currency transactions | 2, 857,207 | 3,389,179 | (600,408 | ) | 1,009,916 | |||||||||||
|
|
|
|
|
|
|
| |||||||||
Net increase (decrease) in net assets resulting from operations | 17, 813,009 | 14,432,676 | (211,705 | ) | 1,317,340 | |||||||||||
|
|
|
|
|
|
|
| |||||||||
Distributions from: | ||||||||||||||||
Net investment income and net realized gains | ||||||||||||||||
Common shares (Class I) | (15,426,149 | ) | (6,522,336 | )3 | (316,700 | ) | (131,227 | )3 | ||||||||
Common shares (Class S) | — | — | (80,916 | ) | (26,774 | )3 | ||||||||||
|
|
|
|
|
|
|
| |||||||||
Total distributions | (15,426,149 | ) | (6,522,336 | ) | (397,616 | ) | (158,001 | ) | ||||||||
|
|
|
|
|
|
|
| |||||||||
Capital share transactions: | ||||||||||||||||
Proceeds from shares sold | ||||||||||||||||
Common shares (Class I) | 2,026,500 | 1,789,391 | 492,580 | 2,273,483 | ||||||||||||
Common shares (Class S) | — | — | 367,898 | 401,124 | ||||||||||||
Reinvested distributions | ||||||||||||||||
Common shares (Class I) | 14,750,446 | 6,256,872 | 302,420 | 126,798 | ||||||||||||
Common shares (Class S) | — | — | 76,543 | 25,507 | ||||||||||||
Payments for shares redeemed | ||||||||||||||||
Common shares (Class I) | (8,565,701 | ) | (13,760,901 | ) | (2,339,374 | ) | (1,428,797 | ) | ||||||||
Common shares (Class S) | — | — | (230,823 | ) | (254,831 | ) | ||||||||||
|
|
|
|
|
|
|
| |||||||||
Increase (decrease) in net assets from capital transactions | 8,211,245 | (5,714,638 | ) | (1,330,756 | ) | 1,143,284 | ||||||||||
|
|
|
|
|
|
|
| |||||||||
Total increase (decrease) in net assets | 10,598,105 | 2,195,702 | (1,940,077 | ) | 2,302,623 | |||||||||||
Net assets: | ||||||||||||||||
Beginning of period | 158,500,604 | 156,304,902 | 18,479,182 | 16,176,559 | ||||||||||||
|
|
|
|
|
|
|
| |||||||||
End of period 4 | $169,098,709 | $158,500,604 | $16,539,105 | $18,479,182 | ||||||||||||
|
|
|
|
|
|
|
| |||||||||
Capital transactions in shares: | ||||||||||||||||
Sold | ||||||||||||||||
Common shares (Class I) | 109,497 | 95,657 | 41,558 | 188,888 | ||||||||||||
Common shares (Class S) | — | — | 31,277 | 33,509 | ||||||||||||
Reinvested distributions | ||||||||||||||||
Common shares (Class I) | 980,096 | 339,494 | 28,229 | 10,585 | ||||||||||||
Common shares (Class S) | — | — | 7,209 | 2,130 | ||||||||||||
Redeemed | ||||||||||||||||
Common shares (Class I) | (475,717 | ) | (732,496 | ) | (202,972 | ) | (118,928 | ) | ||||||||
Common shares (Class S) | — | — | (19,991 | ) | (21,133 | ) | ||||||||||
|
|
|
|
|
|
|
| |||||||||
Net increase (decrease) | 613,876 | (297,345 | ) | (114,690 | ) | 95,051 | ||||||||||
|
|
|
|
|
|
|
| |||||||||
| 3 | For the year ended June 30, 2018, distributions to shareholders were from net investment income and net realized gains for book purposes. During 2018, the Securities and Exchange Commission eliminated the requirement to distinguish between distributions from net investment income and net realized gains for book purposes. The tax character of distributions is disclosed in the notes to the financial statements. |
| 4 | During 2018, the Securities and Exchange Commission eliminated the requirement to disclose end of year undistributed (distributions in excess of) net investment income. |
See accompanying notes to financial statements.
| 56 | SIT MUTUAL FUNDS ANNUAL REPORT |
| Sit Small Cap Growth Fund | Sit International Growth Fund | Sit Developing Markets Growth Fund | ||||||||||||||||||||
| Year Ended June 30, 2019 | Year Ended June 30, 2018 | Year Ended June 30, 2019 | Year Ended June 30, 2018 | Year Ended June 30, 2019 | Year Ended June 30, 2018 | |||||||||||||||||
| ($454,301 | ) | ($492,326 | ) | $216,541 | $268,511 | $64,345 | $22,333 | |||||||||||||||
| 4,285,203 | 7,258,496 | (297,517 | ) | 124,375 | 40,533 | 384,271 | ||||||||||||||||
| 2,110,594 | 4,613,433 | 807,103 | 465,273 | (630,178 | ) | 1,009,318 | ||||||||||||||||
|
|
|
|
|
|
|
|
|
|
|
|
|
| |||||||||
| 5,941,496 | 11,379,603 | 726,127 | 858,159 | (525,300 | ) | 1,415,922 | ||||||||||||||||
|
|
|
|
|
|
|
|
|
|
|
|
|
| |||||||||
| (7,455,033 | ) | (6,111,266 | )3 | (245,338 | ) | (197,000 | )3 | (152,148 | ) | (159,864 | )3 | |||||||||||
| — | — | — | — | — | — | |||||||||||||||||
|
|
|
|
|
|
|
|
|
|
|
|
|
| |||||||||
| (7,455,033 | ) | (6,111,266 | ) | (245,338 | ) | (197,000 | ) | (152,148 | ) | (159,864 | ) | |||||||||||
|
|
|
|
|
|
|
|
|
|
|
|
|
| |||||||||
| 1,457,035 | 2,806,691 | 446,495 | 2,071,819 | 1,190,290 | 3,471,024 | |||||||||||||||||
| — | — | — | — | — | — | |||||||||||||||||
| 7,320,824 | 6,006,115 | 240,594 | 195,219 | 149,029 | 156,935 | |||||||||||||||||
| — | — | — | — | — | — | |||||||||||||||||
| (7,672,934 | ) | (4,859,660 | ) | (1,580,128 | ) | (1,671,069 | ) | (1,693,585 | ) | (3,417,750 | ) | |||||||||||
| — | — | — | — | — | — | |||||||||||||||||
|
|
|
|
|
|
|
|
|
|
|
|
|
| |||||||||
| 1,104,925 | 3,953,146 | (893,039 | ) | 595,969 | (354,266 | ) | 210,209 | |||||||||||||||
|
|
|
|
|
|
|
|
|
|
|
|
|
| |||||||||
| (408,612 | ) | 9,221,483 | (412,250 | ) | 1,257,128 | (1,031,714 | ) | 1,466,267 | ||||||||||||||
| 100,038,227 | 90,816,744 | 23,875,142 | 22,618,014 | 11,027,382 | 9,561,115 | |||||||||||||||||
|
|
|
|
|
|
|
|
|
|
|
|
|
| |||||||||
| $99,629,615 | $100,038,227 | $23,462,892 | $23,875,142 | $9,995,668 | $11,027,382 | |||||||||||||||||
|
|
|
|
|
|
|
|
|
|
|
|
|
| |||||||||
| 26,846 | 49,608 | 27,320 | 117,785 | 74,310 | 203,007 | |||||||||||||||||
| — | — | — | — | — | — | |||||||||||||||||
| 163,960 | 109,659 | 16,872 | 11,344 | 10,495 | 9,353 | |||||||||||||||||
| — | — | — | — | — | — | |||||||||||||||||
| (143,779 | ) | (85,821 | ) | (99,856 | ) | (97,719 | ) | (107,545 | ) | (200,671 | ) | |||||||||||
| — | — | — | — | — | — | |||||||||||||||||
|
|
|
|
|
|
|
|
|
|
|
|
|
| |||||||||
| 47,027 | 73,446 | (55,664 | ) | 31,410 | (22,740 | ) | 11,689 | |||||||||||||||
|
|
|
|
|
|
|
|
|
|
|
|
|
| |||||||||
| JUNE 30, 2019 | 57 |
Per share income and capital changes for a share outstanding throughout the period. See accompanying notes to financial statements.
Sit Balanced Fund
| Years Ended June 30, | ||||||||||||||||||||
| 2019 | 2018 | 2017 | 2016 | 2015 | ||||||||||||||||
Net Asset Value: | ||||||||||||||||||||
Beginning of period | $23.76 | $22.71 | $20.40 | $21.54 | $21.01 | |||||||||||||||
|
| |||||||||||||||||||
Operations: | ||||||||||||||||||||
Net investment income 1 | 0.32 | 0.25 | 0.25 | 0.26 | 0.25 | |||||||||||||||
Net realized and unrealized gains | 1.52 | 1.96 | 2.29 | 0.04 | 1.16 | |||||||||||||||
|
| |||||||||||||||||||
Total from operations | 1.84 | 2.21 | 2.54 | 0.30 | 1.41 | |||||||||||||||
|
| |||||||||||||||||||
Distributions to Shareholders: | ||||||||||||||||||||
From net investment income | �� | (0.31 | ) | (0.27 | ) | (0.23 | ) | (0.45 | ) | (0.24 | ) | |||||||||
From net realized gains | (0.23 | ) | (0.89 | ) | — | (0.99 | ) | (0.64 | ) | |||||||||||
|
| |||||||||||||||||||
Total distributions | (0.54 | ) | (1.16 | ) | (0.23 | ) | (1.44 | ) | (0.88 | ) | ||||||||||
|
| |||||||||||||||||||
Net Asset Value: | ||||||||||||||||||||
End of period | $25.06 | $23.76 | $22.71 | $20.40 | $21.54 | |||||||||||||||
|
| |||||||||||||||||||
Total investment return 2 | 7.98% | 9.84% | 12.56% | 1.47% | 6.86% | |||||||||||||||
|
| |||||||||||||||||||
Net assets at end of period (000’s omitted) | $34,465 | $37,541 | $25,242 | $23,511 | $22,970 | |||||||||||||||
Ratios: 3 | ||||||||||||||||||||
Expenses | 1.00% | 1.00% | 1.00% | 1.00% | 1.00% | |||||||||||||||
Net investment income | 1.33% | 1.07% | 1.18% | 1.25% | 1.17% | |||||||||||||||
Portfolio turnover rate (excluding short-term securities) | 50.45% | 50.49% | 50.31% | 54.46% | 47.49% | |||||||||||||||
| 1 | The net investment income per share is based on average shares outstanding for the period. |
| 2 | Total investment return is based on the change in net asset value of a share during the period (not annualized) and assumes reinvestment of distributions at net asset value. |
| 3 | Ratios are annualized for periods less than one year. In addition to fees and expenses which the Fund bears directly, the Fund indirectly bears a pro rata share of the fees and expenses of the acquired funds in which it invests. Such indirect expenses are not included in the above reported expense ratios. |
| 58 | SIT MUTUAL FUNDS ANNUAL REPORT |
FINANCIAL HIGHLIGHTS
Per share income and capital changes for a share outstanding throughout the period. See accompanying notes to financial statements.
Sit Dividend Growth Fund
| ||||||||||||||||||||
| Class I | Years Ended June 30, | |||||||||||||||||||
| 2019 | 2018 | 2017 | 2016 | 2015 | ||||||||||||||||
| ||||||||||||||||||||
Net Asset Value: | ||||||||||||||||||||
Beginning of period | $16.69 | $16.88 | $15.82 | $17.40 | $18.69 | |||||||||||||||
|
| |||||||||||||||||||
Operations: | ||||||||||||||||||||
Net investment income 1 | 0.38 | 0.26 | 0.24 | 0.26 | 0.25 | |||||||||||||||
Net realized and unrealized gains | 0.55 | 1.49 | 2.09 | 0.32 | 0.92 | |||||||||||||||
|
| |||||||||||||||||||
Total from operations | 0.93 | 1.75 | 2.33 | 0.58 | 1.17 | |||||||||||||||
|
| |||||||||||||||||||
Redemption fees 2 | — | — | — | — | — | |||||||||||||||
|
| |||||||||||||||||||
Distributions to Shareholders: | ||||||||||||||||||||
From net investment income | (0.40 | ) | (0.26 | ) | (0.23 | ) | (0.32 | ) | (0.25 | ) | ||||||||||
From net realized gains | (2.77 | ) | (1.68 | ) | (1.04 | ) | (1.84 | ) | (2.21 | ) | ||||||||||
|
| |||||||||||||||||||
Total distributions | (3.17 | ) | (1.94 | ) | (1.27 | ) | (2.16 | ) | (2.46 | ) | ||||||||||
|
| |||||||||||||||||||
Net Asset Value: | ||||||||||||||||||||
End of period | $14.45 | $16.69 | $16.88 | $15.82 | $17.40 | |||||||||||||||
|
| |||||||||||||||||||
Total investment return 3 | 8.37% | 10.36% | 15.41% | 3.94% | 6.39% | |||||||||||||||
|
| |||||||||||||||||||
Net assets at end of period (000’s omitted) | $214,204 | $918,584 | $1,015,920 | $942,244 | $955,460 | |||||||||||||||
Ratios: 4 | ||||||||||||||||||||
Expenses (without waiver) | 1.00%5 | 1.00%5 | 1.00% | 1.00% | 1.00% | |||||||||||||||
Expenses (with waiver) | 0.70%5 | 0.78%5 | 1.00% | 1.00% | 1.00% | |||||||||||||||
Net investment income (without waiver) | 2.04% | 1.31% | 1.49% | 1.64% | 1.39% | |||||||||||||||
Net investment income (with waiver) | 2.34% | 1.53% | 1.49% | 1.64% | 1.39% | |||||||||||||||
Portfolio turnover rate (excluding short-term securities) | 51.52% | 68.38% | 61.33% | 75.94% | 57.69% | |||||||||||||||
| 1 | The net investment income per share is based on average shares outstanding for the period. |
| 2 | Amount represents less than $0.01 per share. |
| 3 | Total investment return is based on the change in net asset value of a share during the period (not annualized) and assumes reinvestment of distributions at net asset value. |
| 4 | Ratios are annualized for periods less than one year. In addition to fees and expenses which the Fund bears directly, the Fund indirectly bears a pro rata share of the fees and expenses of the acquired funds in which it invests. Such indirect expenses are not included in the above reported expense ratios. |
| 5 | Total Fund expenses are limited to 1.00% of average daily net assets. However, during the period above, the investment advisor voluntarily absorbed expenses that were otherwise payable by the Fund. |
| JUNE 30, 2019 | 59 |
FINANCIAL HIGHLIGHTS
Per share income and capital changes for a share outstanding throughout the period. See accompanying notes to financial statements. (Continued)
Sit Dividend Growth Fund
|
| Class S | Years Ended June 30, | |||||||||||||||||||
| 2019 | 2018 | 2017 | 2016 | 2015 | ||||||||||||||||
| ||||||||||||||||||||
Net Asset Value: | ||||||||||||||||||||
Beginning of period | $16.61 | $16.81 | $15.76 | $17.34 | $18.63 | |||||||||||||||
|
| |||||||||||||||||||
Operations: | ||||||||||||||||||||
Net investment income 1 | 0.32 | 0.22 | 0.20 | 0.22 | 0.21 | |||||||||||||||
Net realized and unrealized gains | 0.57 | 1.47 | 2.08 | 0.32 | 0.91 | |||||||||||||||
|
| |||||||||||||||||||
Total from operations | 0.89 | 1.69 | 2.28 | 0.54 | 1.12 | |||||||||||||||
|
| |||||||||||||||||||
Redemption fees 2 | — | — | — | — | — | |||||||||||||||
|
| |||||||||||||||||||
Distributions to Shareholders: | ||||||||||||||||||||
From net investment income | (0.36 | ) | (0.21 | ) | (0.19 | ) | (0.28 | ) | (0.20 | ) | ||||||||||
From net realized gains | (2.77 | ) | (1.68 | ) | (1.04 | ) | (1.84 | ) | (2.21 | ) | ||||||||||
|
| |||||||||||||||||||
Total distributions | (3.13 | ) | (1.89 | ) | (1.23 | ) | (2.12 | ) | (2.41 | ) | ||||||||||
|
| |||||||||||||||||||
Net Asset Value: | ||||||||||||||||||||
End of period | $14.37 | $16.61 | $16.81 | $15.76 | $17.34 | |||||||||||||||
|
| |||||||||||||||||||
Total investment return 3 | 8.12% | 10.06% | 15.11% | 3.68% | 6.13% | |||||||||||||||
|
| |||||||||||||||||||
Net assets at end of period (000’s omitted) | $39,729 | $51,331 | $65,278 | $67,620 | $82,959 | |||||||||||||||
Ratios: 4 | ||||||||||||||||||||
Expenses (without waiver) | 1.25%5 | 1.25%5 | 1.25% | 1.25% | 1.25% | |||||||||||||||
Expenses (with waiver) | 0.95%5 | 1.03%5 | 1.25% | 1.25% | 1.25% | |||||||||||||||
Net investment income (without waiver) | 1.80% | 1.06% | 1.24% | 1.39% | 1.14% | |||||||||||||||
Net investment income (with waiver) | 2.10% | 1.28% | 1.24% | 1.39% | 1.14% | |||||||||||||||
Portfolio turnover rate (excluding short-term securities) | 51.52% | 68.38% | 61.33% | 75.94% | 57.69% | |||||||||||||||
| 1 | The net investment income per share is based on average shares outstanding for the period. |
| 2 | Amount represents less than $0.01 per share. |
| 3 | Total investment return is based on the change in net asset value of a share during the period (not annualized) and assumes reinvestment of distributions at net asset value. |
| 4 | Ratios are annualized for periods less than one year. In addition to fees and expenses which the Fund bears directly, the Fund indirectly bears a pro rata share of the fees and expenses of the acquired funds in which it invests. Such indirect expenses are not included in the above reported expense ratios. |
| 5 | Total Fund expenses are limited to 1.25% of average daily net assets. However, during the period above, the investment advisor voluntarily absorbed expenses that were otherwise payable by the Fund. |
| 60 | SIT MUTUAL FUNDS ANNUAL REPORT |
FINANCIAL HIGHLIGHTS
Per share income and capital changes for a share outstanding throughout the period. See accompanying notes to financial statements.
Sit Global Dividend Growth Fund
| ||||||||||
| Class I | Years Ended June 30, | |||||||||||||||||||
| 2019 | 2018 | 2017 | 2016 | 2015 | ||||||||||||||||
| ||||||||||||||||||||
Net Asset Value: | ||||||||||||||||||||
Beginning of period | $15.24 | $14.54 | $13.19 | $14.80 | $15.74 | |||||||||||||||
|
| |||||||||||||||||||
Operations: | ||||||||||||||||||||
Net investment income 1 | 0.28 | 0.27 | 0.22 | 0.21 | 0.20 | |||||||||||||||
Net realized and unrealized gains (losses) | 1.10 | 0.67 | 1.34 | (0.48 | ) | 0.13 | ||||||||||||||
|
| |||||||||||||||||||
Total from operations | 1.38 | 0.94 | 1.56 | (0.27 | ) | 0.33 | ||||||||||||||
|
| |||||||||||||||||||
Redemption fees | — | 2 | — | — | 2 | — | — | |||||||||||||
|
| |||||||||||||||||||
Distributions to Shareholders: | ||||||||||||||||||||
From net investment income | (0.28 | ) | (0.24 | ) | (0.21 | ) | (0.34 | ) | (0.20 | ) | ||||||||||
From net realized gains | — | — | — | (1.00 | ) | (1.07 | ) | |||||||||||||
|
| |||||||||||||||||||
Total distributions | (0.28 | ) | (0.24 | ) | (0.21 | ) | (1.34 | ) | (1.27 | ) | ||||||||||
|
| |||||||||||||||||||
Net Asset Value: | ||||||||||||||||||||
End of period | $16.34 | $15.24 | $14.54 | $13.19 | $14.80 | |||||||||||||||
|
| |||||||||||||||||||
Total investment return 3 | 9.18% | 6.46% | 11.94% | (1.67% | ) | 2.19% | ||||||||||||||
|
| |||||||||||||||||||
Net assets at end of period (000’s omitted) | $30,823 | $28,778 | $25,623 | $22,333 | $21,424 | |||||||||||||||
Ratios: 4 | ||||||||||||||||||||
Expenses (without waiver) | 1.25%5 | 1.25%5 | 1.25% | 1.25% | 1.25% | |||||||||||||||
Expenses (with waiver) | 1.00%5 | 1.06%5 | 1.25% | 1.25% | 1.25% | |||||||||||||||
Net investment income (without waiver) | 1.53% | 1.59% | 1.63% | 1.56% | 1.33% | |||||||||||||||
Net investment income (with waiver) | 1.78% | 1.78% | 1.63% | 1.56% | 1.33% | |||||||||||||||
Portfolio turnover rate (excluding short-term securities) | 15.07% | 19.80% | 32.04% | 48.30% | 75.06% | |||||||||||||||
| 1 | The net investment income per share is based on average shares outstanding for the period. |
| 2 | Amount represents less than $0.01 per share. |
| 3 | Total investment return is based on the change in net asset value of a share during the period (not annualized) and assumes reinvestment of distributions at net asset value. |
| 4 | Ratios are annualized for periods less than one year. In addition to fees and expenses which the Fund bears directly, the Fund indirectly bears a pro rata share of the fees and expenses of the acquired funds in which it invests. Such indirect expenses are not included in the above reported expense ratios. |
| 5 | Total Fund expenses are limited to 1.25% of average daily net assets. However, during the period above, the investment advisor voluntarily absorbed expenses that were otherwise payable by the Fund. |
| JUNE 30, 2019 | 61 |
FINANCIAL HIGHLIGHTS
Per share income and capital changes for a share outstanding throughout the period. See accompanying notes to financial statements. (Continued)
Sit Global Dividend Growth Fund
| ||||||||||||||||||||
| Class S | Years Ended June 30, | |||||||||||||||||||
| 2019 | 2018 | 2017 | 2016 | 2015 | ||||||||||||||||
| ||||||||||||||||||||
Net Asset Value: | ||||||||||||||||||||
Beginning of period | $15.22 | $14.53 | $13.18 | $14.78 | $15.72 | |||||||||||||||
|
| |||||||||||||||||||
Operations: | ||||||||||||||||||||
Net investment income 1 | 0.24 | 0.23 | 0.19 | 0.18 | 0.16 | |||||||||||||||
Net realized and unrealized gains (losses) | 1.11 | 0.66 | 1.33 | (0.48 | ) | 0.13 | ||||||||||||||
|
| |||||||||||||||||||
Total from operations | 1.35 | 0.89 | 1.52 | (0.30 | ) | 0.29 | ||||||||||||||
|
| |||||||||||||||||||
Distributions to Shareholders: | ||||||||||||||||||||
From net investment income | (0.24 | ) | (0.20 | ) | (0.17 | ) | (0.30 | ) | (0.16 | ) | ||||||||||
From net realized gains | — | — | — | (1.00 | ) | (1.07 | ) | |||||||||||||
|
| |||||||||||||||||||
Total distributions | (0.24 | ) | (0.20 | ) | (0.17 | ) | (1.30 | ) | (1.23 | ) | ||||||||||
|
| |||||||||||||||||||
Net Asset Value: | ||||||||||||||||||||
End of period | $16.33 | $15.22 | $14.53 | $13.18 | $14.78 | |||||||||||||||
|
| |||||||||||||||||||
Total investment return 2 | 8.98% | 6.13% | 11.67% | (1.89% | ) | 2.00% | ||||||||||||||
|
| |||||||||||||||||||
Net assets at end of period (000’s omitted) | $3,241 | $3,246 | $3,274 | $2,861 | $3,451 | |||||||||||||||
Ratios: 3 | ||||||||||||||||||||
Expenses (without waiver) | 1.50%4 | 1.50%4 | 1.50% | 1.50% | 1.50% | |||||||||||||||
Expenses (with waiver) | 1.25%4 | 1.31%4 | 1.50% | 1.50% | 1.50% | |||||||||||||||
Net investment income (without waiver) | 1.28% | 1.33% | 1.38% | 1.31% | 1.08% | |||||||||||||||
Net investment income (with waiver) | 1.53% | 1.52% | 1.38% | 1.31% | 1.08% | |||||||||||||||
Portfolio turnover rate (excluding short-term securities) | 15.07% | 19.80% | 32.04% | 48.30% | 75.06% | |||||||||||||||
| 1 | The net investment income per share is based on average shares outstanding for the period. |
| 2 | Total investment return is based on the change in net asset value of a share during the period (not annualized) and assumes reinvestment of distributions at net asset value. |
| 3 | Ratios are annualized for periods less than one year. In addition to fees and expenses which the Fund bears directly, the Fund indirectly bears a pro rata share of the fees and expenses of the acquired funds in which it invests. Such indirect expenses are not included in the above reported expense ratios. |
| 4 | Total Fund expenses are limited to 1.50% of average daily net assets. However, during the period above, the investment advisor voluntarily absorbed expenses that were otherwise payable by the Fund. |
| 62 | SIT MUTUAL FUNDS ANNUAL REPORT |
FINANCIAL HIGHLIGHTS
Per share income and capital changes for a share outstanding throughout the period. See accompanying notes to financial statements.
Sit Large Cap Growth Fund
| ||||||||||||||||||||
| Years Ended June 30, | ||||||||||||||||||||
| 2019 | 2018 | 2017 | 2016 | 2015 | ||||||||||||||||
| ||||||||||||||||||||
Net Asset Value: | ||||||||||||||||||||
Beginning of period | $42.40 | $40.56 | $36.02 | $47.21 | $52.51 | |||||||||||||||
|
| |||||||||||||||||||
Operations: | ||||||||||||||||||||
Net investment income 1 | 0.16 | 0.13 | 0.21 | 0.18 | 0.20 | |||||||||||||||
Net realized and unrealized gains (losses) | 3.61 | 6.55 | 7.07 | (0.42 | ) | 5.04 | ||||||||||||||
|
| |||||||||||||||||||
Total from operations | 3.77 | 6.68 | 7.28 | (0.24 | ) | 5.24 | ||||||||||||||
|
| |||||||||||||||||||
Redemption fees 2 | — | — | — | — | — | |||||||||||||||
|
| |||||||||||||||||||
Distributions to Shareholders: | ||||||||||||||||||||
From net investment income | (0.15 | ) | (0.17 | ) | (0.19 | ) | (1.44 | ) | (0.24 | ) | ||||||||||
From net realized gains | (3.49 | ) | (4.67 | ) | (2.55 | ) | (9.51 | ) | (10.30 | ) | ||||||||||
|
| |||||||||||||||||||
Total distributions | (3.64 | ) | (4.84 | ) | (2.74 | ) | (10.95 | ) | (10.54 | ) | ||||||||||
|
| |||||||||||||||||||
Net Asset Value: | ||||||||||||||||||||
End of period | $42.53 | $42.40 | $40.56 | $36.02 | $47.21 | |||||||||||||||
|
| |||||||||||||||||||
Total investment return 3 | 10.54% | 16.93% | 21.18% | (0.89% | ) | 10.62% | ||||||||||||||
|
| |||||||||||||||||||
Net assets at end of period (000’s omitted) | $116,581 | $118,792 | $113,620 | $117,459 | $144,807 | |||||||||||||||
Ratios: 4 | ||||||||||||||||||||
Expenses | 1.00% | 1.00% | 1.00% | 1.00% | 1.00% | |||||||||||||||
Net investment income | 0.39% | 0.30% | 0.54% | 0.44% | 0.41% | |||||||||||||||
Portfolio turnover rate (excluding short-term securities) | 16.02% | 15.20% | 17.69% | 20.05% | 24.04% | |||||||||||||||
| 1 | The net investment income per share is based on average shares outstanding for the period. |
| 2 | Amount represents less than $0.01 per share. |
| 3 | Total investment return is based on the change in net asset value of a share during the period (not annualized) and assumes reinvestment of distributions at net asset value. |
| 4 | Ratios are annualized for periods less than one year. In addition to fees and expenses which the Fund bears directly, the Fund indirectly bears a pro rata share of the fees and expenses of the acquired funds in which it invests. Such indirect expenses are not included in the above reported expense ratios. |
| JUNE 30, 2019 | 63 |
FINANCIAL HIGHLIGHTS
Per share income and capital changes for a share outstanding throughout the period. See accompanying notes to financial statements.
Sit ESG Growth Fund
| Class I | Year Ended June 30, 2019 | Year Ended June 30, 2018 | Year Ended June 30, 2017 * | ||||||||||||
Net Asset Value: | |||||||||||||||
Beginning of period | $12.37 | $11.29 | $10.00 | ||||||||||||
|
|
| |||||||||||||
Operations: | |||||||||||||||
Net investment income 1 | 0.17 | 0.16 | 0.11 | ||||||||||||
Net realized and unrealized gains | 0.83 | 1.03 | 1.20 | ||||||||||||
|
|
| |||||||||||||
Total from operations | 1.00 | 1.19 | 1.31 | ||||||||||||
|
|
| |||||||||||||
Distributions to Shareholders: | |||||||||||||||
From net investment income | (0.16 | ) | (0.11 | ) | (0.02 | ) | |||||||||
|
|
| |||||||||||||
Net Asset Value: | |||||||||||||||
End of period | $13.21 | $12.37 | $11.29 | ||||||||||||
|
|
| |||||||||||||
Total investment return 2 | 8.30% | 10.57% | 13.13% | ||||||||||||
|
|
| |||||||||||||
Net assets at end of period (000’s omitted) | $3,387 | $3,041 | $2,349 | ||||||||||||
Ratios: 3 | |||||||||||||||
Expenses (without waiver) | 1.25%4 | 1.25%4 | 1.25% | ||||||||||||
Expenses (with waiver) | 1.00%4 | 1.06%4 | 1.25% | ||||||||||||
Net investment income (without waiver) | 1.14% | 1.10% | 1.01% | ||||||||||||
Net investment income (with waiver) | 1.38% | 1.29% | 1.01% | ||||||||||||
Portfolio turnover rate (excluding short-term securities) | 9.26% | 14.97% | 27.60% | ||||||||||||
| * | The Fund commenced investment operations on June 30, 2016. |
| 1 | The net investment income per share is based on average shares outstanding for the period. |
| 2 | Total investment return is based on the change in net asset value of a share during the period (not annualized) and assumes reinvestment of distributions at net asset value. |
| 3 | Ratios are annualized for periods less than one year. In addition to fees and expenses which the Fund bears directly, the Fund indirectly bears a pro rata share of the fees and expenses of the acquired funds in which it invests. Such indirect expenses are not included in the above reported expense ratios. |
| 4 | Total Fund expenses are limited to 1.25% of average daily net assets. However, during the period above, the investment advisor voluntarily absorbed expenses that were otherwise payable by the Fund. |
| 64 | SIT MUTUAL FUNDS ANNUAL REPORT |
FINANCIAL HIGHLIGHTS
Per share income and capital changes for a share outstanding throughout the period. See accompanying notes to financial statements. (Continued)
Sit ESG Growth Fund
| Class S | Year Ended June 30, 2019 | Year Ended June 30, 2018 | Year Ended June 30, 2017 * | ||||||||||||
Net Asset Value: | |||||||||||||||
Beginning of period | $12.34 | $11.28 | $10.00 | ||||||||||||
|
|
| |||||||||||||
Operations: | |||||||||||||||
Net investment income 1 | 0.14 | 0.13 | 0.08 | ||||||||||||
Net realized and unrealized gains | 0.83 | 1.03 | 1.21 | ||||||||||||
|
|
| |||||||||||||
Total from operations | 0.97 | 1.16 | 1.29 | ||||||||||||
|
|
| |||||||||||||
Distributions to Shareholders: | |||||||||||||||
From net investment income | (0.15 | ) | (0.10 | ) | (0.01 | ) | |||||||||
|
|
| |||||||||||||
Net Asset Value: | |||||||||||||||
End of period | $13.16 | $12.34 | $11.28 | ||||||||||||
|
|
| |||||||||||||
Total investment return 2 | 8.01% | 10.37% | 12.79% | ||||||||||||
|
|
| |||||||||||||
Net assets at end of period (000’s omitted) | $2,895 | $2,660 | $2,321 | ||||||||||||
Ratios: 3 | |||||||||||||||
Expenses (without waiver) | 1.50%4 | 1.50%4 | 1.50% | ||||||||||||
Expenses (with waiver) | 1.25%4 | 1.31%4 | 1.50% | ||||||||||||
Net investment income (without waiver) | 0.89% | 0.84% | 0.76% | ||||||||||||
Net investment income (with waiver) | 1.14% | 1.03% | 0.76% | ||||||||||||
Portfolio turnover rate (excluding short-term securities) | 9.26% | 14.97% | 27.60% | ||||||||||||
| * | The Fund commenced investment operations on June 30, 2016. |
| 1 | The net investment income per share is based on average shares outstanding for the period. |
| 2 | Total investment return is based on the change in net asset value of a share during the period (not annualized) and assumes reinvestment of distributions at net asset value. |
| 3 | Ratios are annualized for periods less than one year. In addition to fees and expenses which the Fund bears directly, the Fund indirectly bears a pro rata share of the fees and expenses of the acquired funds in which it invests. Such indirect expenses are not included in the above reported expense ratios. |
| 4 | Total Fund expenses are limited to 1.50% of average daily net assets. However, during the period above, the investment advisor voluntarily absorbed expenses that were otherwise payable by the Fund. |
| JUNE 30, 2019 | 65 |
FINANCIAL HIGHLIGHTS
Per share income and capital changes for a share outstanding throughout the period. See accompanying notes to financial statements.
Sit Mid Cap Growth Fund
| ||||||||||||||||||||
| Years Ended June 30, | ||||||||||||||||||||
| 2019 | 2018 | 2017 | 2016 | 2015 | ||||||||||||||||
| ||||||||||||||||||||
Net Asset Value: | ||||||||||||||||||||
Beginning of period | $18.96 | $18.06 | $15.36 | $20.22 | $21.08 | |||||||||||||||
|
| |||||||||||||||||||
Operations: | ||||||||||||||||||||
Net investment loss 1 | (0.03 | ) | (0.03 | ) | — | 2 | (0.04 | ) | (0.06 | ) | ||||||||||
Net realized and unrealized gains (losses) | 1.79 | 1.71 | 2.86 | (1.92 | ) | 1.91 | ||||||||||||||
|
| |||||||||||||||||||
Total from operations | 1.76 | 1.68 | 2.86 | (1.96 | ) | 1.85 | ||||||||||||||
|
| |||||||||||||||||||
Redemption fees 2 | — | — | — | — | — | |||||||||||||||
|
| |||||||||||||||||||
Distributions to Shareholders: | ||||||||||||||||||||
From net investment income | — | — | 2 | — | — | — | ||||||||||||||
From net realized gains | (1.88 | ) | (0.78 | ) | (0.16 | ) | (2.90 | ) | (2.71 | ) | ||||||||||
|
| |||||||||||||||||||
Total distributions | (1.88 | ) | (0.78 | ) | (0.16 | ) | (2.90 | ) | (2.71 | ) | ||||||||||
|
| |||||||||||||||||||
Net Asset Value: | ||||||||||||||||||||
End of period | $18.84 | $18.96 | $18.06 | $15.36 | $20.22 | |||||||||||||||
|
| |||||||||||||||||||
Total investment return 3 | 11.76% | 9.42% | 18.74% | (9.97% | ) | 9.52% | ||||||||||||||
|
| |||||||||||||||||||
Net assets at end of period (000’s omitted) | $169,099 | $158,501 | $156,305 | $139,523 | $171,854 | |||||||||||||||
Ratios: 4 | ||||||||||||||||||||
Expenses | 1.25% | 1.25% | 1.25% | 1.25% | 1.25% | |||||||||||||||
Net investment loss | (0.16% | ) | (0.17% | ) | (0.01% | ) | (0.23% | ) | (0.30% | ) | ||||||||||
Portfolio turnover rate (excluding short-term securities) | 27.70% | 28.89% | 23.02% | 21.57% | 23.39% | |||||||||||||||
| 1 | The net investment income (loss) per share is based on average shares outstanding for the period. |
| 2 | Amount represents less than $0.01 per share. |
| 3 | Total investment return is based on the change in net asset value of a share during the period (not annualized) and assumes reinvestment of distributions at net asset value. |
| 4 | Ratios are annualized for periods less than one year. In addition to fees and expenses which the Fund bears directly, the Fund indirectly bears a pro rata share of the fees and expenses of the acquired funds in which it invests. Such indirect expenses are not included in the above reported expense ratios. |
| 66 | SIT MUTUAL FUNDS ANNUAL REPORT |
FINANCIAL HIGHLIGHTS
Per share income and capital changes for a share outstanding throughout the period. See accompanying notes to financial statements.
Sit Small Cap Dividend Growth Fund
| Class I | Year Ended June 30, 2019 | Year Ended June 30, 2018 | Year Ended June 30, 2017 | Year Ended June 30, 2016 | Three Months Ended June 30, 2015 * | ||||||||||||||||||||
Net Asset Value: | |||||||||||||||||||||||||
Beginning of period | $12.27 | $11.47 | $10.00 | $9.96 | $10.00 | ||||||||||||||||||||
|
|
| |||||||||||||||||||||||
Operations: | |||||||||||||||||||||||||
Net investment income 1 | 0.15 | 0.11 | 0.12 | 0.14 | 0.02 | ||||||||||||||||||||
Net realized and unrealized gains (losses) | (0.25 | ) | 0.80 | 1.46 | 0.02 | (0.06 | ) | ||||||||||||||||||
|
|
| |||||||||||||||||||||||
Total from operations | (0.10 | ) | 0.91 | 1.58 | 0.16 | (0.04 | ) | ||||||||||||||||||
|
|
| |||||||||||||||||||||||
Distributions to Shareholders: | |||||||||||||||||||||||||
From net investment income | (0.15 | ) | (0.11 | ) | (0.11 | ) | (0.12 | ) | — | ||||||||||||||||
From net realized gains | (0.13 | ) | — | — | — | 2 | — | ||||||||||||||||||
|
|
| |||||||||||||||||||||||
Total distributions | (0.28 | ) | (0.11 | ) | (0.11 | ) | (0.12 | ) | — | ||||||||||||||||
|
|
| |||||||||||||||||||||||
Net Asset Value: | |||||||||||||||||||||||||
End of period | $11.89 | $12.27 | $11.47 | $10.00 | $9.96 | ||||||||||||||||||||
|
|
| |||||||||||||||||||||||
Total investment return 3 | (0.54% | ) | 8.00% | 15.84% | 1.71% | (0.40% | ) | ||||||||||||||||||
|
|
| |||||||||||||||||||||||
Net assets at end of period (000’s omitted) | $12,559 | $14,597 | $12,716 | $5,777 | $3,708 | ||||||||||||||||||||
Ratios: 4 | |||||||||||||||||||||||||
Expenses (without waiver) | 1.25%5 | 1.25%5 | 1.25% | 1.25% | 1.25% | ||||||||||||||||||||
Expenses (with waiver) | 1.00%5 | 1.06%5 | 1.25% | 1.25% | 1.25% | ||||||||||||||||||||
Net investment income (without waiver) | 1.07% | 0.75% | 1.06% | 1.46% | 0.98% | ||||||||||||||||||||
Net investment income (with waiver) | 1.32% | 0.94% | 1.06% | 1.46% | 0.98% | ||||||||||||||||||||
Portfolio turnover rate (excluding short-term securities) | 24.17% | 29.74% | 19.57% | 26.43% | 2.63%6 | ||||||||||||||||||||
| * | The Fund commenced investment operations on March 31, 2015. |
| 1 | The net investment income per share is based on average shares outstanding for the period. |
| 2 | Amount represents less than $0.01 per share. |
| 3 | Total investment return is based on the change in net asset value of a share during the period (not annualized) and assumes reinvestment of distributions at net asset value. |
| 4 | Ratios are annualized for periods less than one year. In addition to fees and expenses which the Fund bears directly, the Fund indirectly bears a pro rata share of the fees and expenses of the acquired funds in which it invests. Such indirect expenses are not included in the above reported expense ratios. |
| 5 | Total Fund expenses are limited to 1.25% of average daily net assets. However, during the period above, the investment advisor voluntarily absorbed expenses that were otherwise payable by the Fund. |
| 6 | Not annualized. |
| JUNE 30, 2019 | 67 |
FINANCIAL HIGHLIGHTS
Per share income and capital changes for a share outstanding throughout the period. See accompanying notes to financial statements. (Continued)
Sit Small Cap Dividend Growth Fund
| Class S | Year Ended June 30, 2019 | Year Ended June 30, 2018 | Year Ended June 30, 2017 | Year Ended June 30, 2016 | Three Months Ended June 30, 2015 * | ||||||||||||||||||||
Net Asset Value: | |||||||||||||||||||||||||
Beginning of period | $12.26 | $11.46 | $10.00 | $9.96 | $10.00 | ||||||||||||||||||||
|
|
| |||||||||||||||||||||||
Operations: | |||||||||||||||||||||||||
Net investment income 1 | 0.12 | 0.08 | 0.09 | 0.11 | 0.02 | ||||||||||||||||||||
Net realized and unrealized gains (losses) | (0.25 | ) | 0.80 | 1.45 | 0.03 | (0.06 | ) | ||||||||||||||||||
|
|
| |||||||||||||||||||||||
Total from operations | (0.13 | ) | 0.88 | 1.54 | 0.14 | (0.04 | ) | ||||||||||||||||||
|
|
| |||||||||||||||||||||||
Distributions to Shareholders: | |||||||||||||||||||||||||
From net investment income | (0.12 | ) | (0.08 | ) | (0.08 | ) | (0.10 | ) | — | ||||||||||||||||
From net realized gains | (0.13 | ) | — | — | — | 2 | — | ||||||||||||||||||
|
|
| |||||||||||||||||||||||
Total distributions | (0.25 | ) | (0.08 | ) | (0.08 | ) | (0.10 | ) | — | ||||||||||||||||
|
|
| |||||||||||||||||||||||
Net Asset Value: | |||||||||||||||||||||||||
End of period | $11.88 | $12.26 | $11.46 | $10.00 | $9.96 | ||||||||||||||||||||
|
|
| |||||||||||||||||||||||
Total investment return 3 | (0.80% | ) | 7.74% | 15.46% | 1.46% | (0.40% | ) | ||||||||||||||||||
|
|
| |||||||||||||||||||||||
Net assets at end of period (000’s omitted) | $3,981 | $3,882 | $3,461 | $2,587 | $2,230 | ||||||||||||||||||||
Ratios: 4 | |||||||||||||||||||||||||
Expenses (without waiver) | 1.50%5 | 1.50%5 | 1.50% | 1.50% | 1.50% | ||||||||||||||||||||
Expenses (with waiver) | 1.25%5 | 1.31%5 | 1.50% | 1.50% | 1.50% | ||||||||||||||||||||
Net investment income (without waiver) | 0.82% | 0.51% | 0.81% | 1.21% | 0.73% | ||||||||||||||||||||
Net investment income (with waiver) | 1.07% | 0.70% | 0.81% | 1.21% | 0.73% | ||||||||||||||||||||
Portfolio turnover rate (excluding short-term securities) | 24.17% | 29.74% | 19.57% | 26.43% | 2.63%6 | ||||||||||||||||||||
| * | The Fund commenced investment operations on March 31, 2015. |
| 1 | The net investment income per share is based on average shares outstanding for the period. |
| 2 | Amount represents less than $0.01 per share. |
| 3 | Total investment return is based on the change in net asset value of a share during the period (not annualized) and assumes reinvestment of distributions at net asset value. |
| 4 | Ratios are annualized for periods less than one year. In addition to fees and expenses which the Fund bears directly, the Fund indirectly bears a pro rata share of the fees and expenses of the acquired funds in which it invests. Such indirect expenses are not included in the above reported expense ratios. |
| 5 | Total Fund expenses are limited to 1.50% of average daily net assets. However, during the period above, the investment advisor voluntarily absorbed expenses that were otherwise payable by the Fund. |
| 6 | Not annualized. |
| 68 | SIT MUTUAL FUNDS ANNUAL REPORT |
FINANCIAL HIGHLIGHTS
Per share income and capital changes for a share outstanding throughout the period. See accompanying notes to financial statements.
Sit Small Cap Growth Fund
| ||||||||||||||||||||
| Years Ended June 30, | ||||||||||||||||||||
| 2019 | 2018 | 2017 | 2016 | 2015 | ||||||||||||||||
| ||||||||||||||||||||
Net Asset Value: | ||||||||||||||||||||
Beginning of period | $57.18 | $54.18 | $45.59 | $60.10 | $61.38 | |||||||||||||||
|
| |||||||||||||||||||
Operations: | ||||||||||||||||||||
Net investment loss 1 | (0.25 | ) | (0.29 | ) | (0.24 | ) | (0.33 | ) | (0.48 | ) | ||||||||||
Net realized and unrealized gains (losses) | 2.88 | 7.01 | 8.91 | (8.97 | ) | 6.26 | ||||||||||||||
|
| |||||||||||||||||||
Total from operations | 2.63 | 6.72 | 8.67 | (9.30 | ) | 5.78 | ||||||||||||||
|
| |||||||||||||||||||
Redemption fees 2 | — | — | — | — | — | |||||||||||||||
|
| |||||||||||||||||||
Distributions to Shareholders: | ||||||||||||||||||||
From net realized gains | (4.35 | ) | (3.72 | ) | (0.08 | ) | (5.21 | ) | (7.06 | ) | ||||||||||
|
| |||||||||||||||||||
Net Asset Value: | ||||||||||||||||||||
End of period | $55.46 | $57.18 | $54.18 | $45.59 | $60.10 | |||||||||||||||
|
| |||||||||||||||||||
Total investment return 3 |
|
6.45% |
| 12.68% | 19.06% | (16.00% | ) | 10.38% | ||||||||||||
|
| |||||||||||||||||||
Net assets at end of period (000’s omitted) | $99,630 | $100,038 | $90,817 | $81,209 | $103,816 | |||||||||||||||
Ratios: 4 | ||||||||||||||||||||
Expenses | 1.50% | 1.50% | 1.50% | 1.50% | 1.50% | |||||||||||||||
Net investment loss | (0.47% | ) | (0.51% | ) | (0.47% | ) | (0.65% | ) | (0.81% | ) | ||||||||||
Portfolio turnover rate (excluding short-term securities) | 26.34% | 29.01% | 29.08% | 27.37% | 31.07% | |||||||||||||||
| 1 | The net investment income (loss) per share is based on average shares outstanding for the period. |
| 2 | Amount represents less than $0.01 per share. |
| 3 | Total investment return is based on the change in net asset value of a share during the period (not annualized) and assumes reinvestment of distributions at net asset value. |
| 4 | Ratios are annualized for periods less than one year. In addition to fees and expenses which the Fund bears directly, the Fund indirectly bears a pro rata share of the fees and expenses of the acquired funds in which it invests. Such indirect expenses are not included in the above reported expense ratios. |
| JUNE 30, 2019 | 69 |
FINANCIAL HIGHLIGHTS
Per share income and capital changes for a share outstanding throughout the period. See accompanying notes to financial statements.
Sit International Growth Fund
| ||||||||||||||||||||
| Years Ended June 30, | ||||||||||||||||||||
| 2019 | 2018 | 2017 | 2016 | 2015 | ||||||||||||||||
| ||||||||||||||||||||
Net Asset Value: | ||||||||||||||||||||
Beginning of period | $16.75 | $16.23 | $14.48 | $16.92 | $17.44 | |||||||||||||||
|
| |||||||||||||||||||
Operations: | ||||||||||||||||||||
Net investment income 1 | 0.16 | 0.19 | 0.14 | 0.12 | 0.09 | |||||||||||||||
Net realized and unrealized gains (losses) | 0.40 | 0.47 | 1.68 | (1.47 | ) | (0.34 | ) | |||||||||||||
|
| |||||||||||||||||||
Total from operations | 0.56 | 0.66 | 1.82 | (1.35 | ) | (0.25 | ) | |||||||||||||
|
| |||||||||||||||||||
Redemption fees | — | — | 2 | — | 2 | — | — | |||||||||||||
|
| |||||||||||||||||||
Distributions to Shareholders: | ||||||||||||||||||||
From net investment income | (0.18 | ) | (0.14 | ) | (0.07 | ) | (0.09 | ) | (0.27 | ) | ||||||||||
From net realized gains | — | — | — | (1.00 | ) | — | ||||||||||||||
|
| |||||||||||||||||||
Total distributions | (0.18 | ) | (0.14 | ) | (0.07 | ) | (1.09 | ) | (0.27 | ) | ||||||||||
|
| |||||||||||||||||||
Net Asset Value: | ||||||||||||||||||||
End of period | $17.13 | $16.75 | $16.23 | $14.48 | $16.92 | |||||||||||||||
|
| |||||||||||||||||||
Total investment return 3 | 3.55% | 4.06% | 12.64% | (8.19% | ) | (1.35% | ) | |||||||||||||
|
| |||||||||||||||||||
Net assets at end of period (000’s omitted) | $23,463 | $23,875 | $22,618 | $20,440 | $22,485 | |||||||||||||||
Ratios: 4 | ||||||||||||||||||||
Expenses | 1.50% | 1.50% | 1.50% | 1.50% | 1.50% | |||||||||||||||
Net investment income | 0.97% | 1.11% | 0.97% | 0.76% | 0.55% | |||||||||||||||
Portfolio turnover rate (excluding short-term securities) | 27.38% | 16.35% | 39.23% | 37.94% | 56.97% | |||||||||||||||
| 1 | The net investment income per share is based on average shares outstanding for the period. |
| 2 | Amount represents less than $0.01 per share. |
| 3 | Total investment return is based on the change in net asset value of a share during the period (not annualized) and assumes reinvestment of distributions at net asset value. |
| 4 | Ratios are annualized for periods less than one year. In addition to fees and expenses which the Fund bears directly, the Fund indirectly bears a pro rata share of the fees and expenses of the acquired funds in which it invests. Such indirect expenses are not included in the above reported expense ratios. |
| 70 | SIT MUTUAL FUNDS ANNUAL REPORT |
FINANCIAL HIGHLIGHTS
Per share income and capital changes for a share outstanding throughout the period. See accompanying notes to financial statements.
Sit Developing Markets Growth Fund
| Years Ended June 30, | ||||||||||||||||||||
| 2019 | 2018 | 2017 | 2016 | 2015 | ||||||||||||||||
Net Asset Value: | ||||||||||||||||||||
Beginning of period | $17.25 | $15.23 | $12.26 | $14.77 | $17.48 | |||||||||||||||
|
| |||||||||||||||||||
Operations: | ||||||||||||||||||||
Net investment income (loss) 1 | 0.10 | 0.03 | (0.02 | ) | 0.04 | 0.03 | ||||||||||||||
Net realized and unrealized gains (losses) | (0.90 | ) | 2.24 | 3.02 | (2.18 | ) | (1.41 | ) | ||||||||||||
|
| |||||||||||||||||||
Total from operations | (0.80 | ) | 2.27 | 3.00 | (2.14 | ) | (1.38 | ) | ||||||||||||
|
| |||||||||||||||||||
Redemption fees | — | — | 2 | — | — | 2 | — | |||||||||||||
|
| |||||||||||||||||||
Distributions to Shareholders: | ||||||||||||||||||||
From net investment income | (0.08 | ) | — | (0.03 | ) | (0.02 | ) | — | ||||||||||||
From net realized gains | (0.16 | ) | (0.25 | ) | — | (0.35 | ) | (1.33 | ) | |||||||||||
|
| |||||||||||||||||||
Total distributions | (0.24 | ) | (0.25 | ) | (0.03 | ) | (0.37 | ) | (1.33 | ) | ||||||||||
|
| |||||||||||||||||||
Net Asset Value: | ||||||||||||||||||||
End of period | $16.21 | $17.25 | $15.23 | $12.26 | $14.77 | |||||||||||||||
|
| |||||||||||||||||||
Total investment return 3 | (4.43% | ) | 14.94% | 24.56% | (14.42% | ) | (7.64% | ) | ||||||||||||
|
| |||||||||||||||||||
Net assets at end of period (000’s omitted) | $9,996 | $11,027 | $9,561 | $7,297 | $9,192 | |||||||||||||||
Ratios: 4 | ||||||||||||||||||||
Expenses (without waiver) | 2.00%5 | 2.00%5 | 2.00% | 2.00% | 2.00% | |||||||||||||||
Expenses (with waiver) | 1.40%5 | 1.54%5 | 2.00% | 2.00% | 2.00% | |||||||||||||||
Net investment income (loss) (without waiver) | 0.03% | (0.26% | ) | (0.18% | ) | 0.31% | 0.16% | |||||||||||||
Net investment income (loss) (with waiver) | 0.63% | 0.20% | (0.18% | ) | 0.31% | 0.16% | ||||||||||||||
Portfolio turnover rate (excluding short-term securities) | 10.28% | 30.30% | 19.67% | 28.14% | 21.51% | |||||||||||||||
| 1 | The net investment income (loss) per share is based on average shares outstanding for the period. |
| 2 | Amount represents less than $0.01 per share. |
| 3 | Total investment return is based on the change in net asset value of a share during the period (not annualized) and assumes reinvestment of distributions at net asset value. |
| 4 | Ratios are annualized for periods less than one year. In addition to fees and expenses which the Fund bears directly, the Fund indirectly bears a pro rata share of the fees and expenses of the acquired funds in which it invests. Such indirect expenses are not included in the above reported expense ratios. |
| 5 | Total Fund expenses are limited to 2.00% of average daily net assets. However, during the period above, the investment advisor voluntarily absorbed expenses that were otherwise payable by the Fund. |
| JUNE 30, 2019 | 71 |
Year Ended June 30, 2019
| (1) | Organization |
Sit Mutual Funds areno-load funds, and are registered under the Investment Company Act of 1940 (as amended) as diversified,open-end management investment companies, or series thereof. The Sit Balanced, Sit Dividend Growth, Sit Global Dividend Growth, Sit ESG Growth, Sit Small Cap Dividend Growth, Sit Small Cap Growth, Sit International Growth, and Sit Developing Markets Growth are series funds of Sit Mutual Funds, Inc.
This report covers the equity funds of the Sit Mutual Funds (the Funds). Each fund has 10 billion authorized shares of capital stock with a par value of $0.001. The investment objective for each Fund is as follows:
| Fund | Investment Objective | |
Balanced | Long-term growth consistent with the preservation of principal and to provide regular income. | |
| Dividend Growth | Provide current income that exceeds the dividend yield of the S&P 500® Index and that grows over a period of years. Secondarily, maximize long-term capital appreciation. | |
| Global Dividend Growth | Provide current income that exceeds the dividend yield of the MSCI World Index that grows over a period of years. Secondarily, maximize long-term capital appreciation. | |
| Large Cap Growth | Maximize long-term capital appreciation. | |
| ESG Growth | Maximize long-term capital appreciation. | |
| Mid Cap Growth | Maximize long-term capital appreciation. | |
| Small Cap Dividend Growth | Provide current income that exceeds the yield of the Russell 2000® Index and that grows over a period of years. Secondarily, maximize long-term capital appreciation. | |
| Small Cap Growth | Maximize long-term capital appreciation. | |
| International Growth | Maximize long-term growth. | |
| Developing Markets Growth | Maximize long-term capital appreciation. |
The Dividend Growth, Global Dividend Growth, ESG Growth and Small Cap Dividend Growth Funds offer Class I and Class S shares. Both classes of shares have identical voting, dividend, and liquidation rights. The distribution fee differs among classes, the Class S shares have a 0.25% distribution fee, whereas Class I has no distribution fee. Income, expenses (other than class specific expenses) and realized and unrealized gains or losses on investments are allocated to each class of shares based upon its relative net assets.
| (2) | Significant Accounting Policies |
The Funds are investment companies and follow accounting and reporting guidance under Financial Accounting Standards Board (“FASB”) Accounting Standards Codification (“ASC”) Topic 946, “Financial Services-Investment Companies”. The following is a summary of significant accounting policies consistently followed by the Funds in the preparation of their financial statements in conformity with U.S. generally accepted accounting principles (“GAAP”).
Investments in Securities
Investments in securities traded on national or international securities exchanges are valued at the last reported sales price prior to the time when assets are valued. Equity securities traded on theover-the-counter market are valued at the last reported sales price or if the last sales price is not available, at the last reported bid price. The sale and bid prices or prices deemed best to reflect fair value quoted by dealers who make markets in these securities are obtained from independent pricing services. Consistent with the Funds’ valuation policies and procedures, debt securities maturing in more than 60 days are priced by an independent pricing service. The pricing service may use models that price securities based on current yields and relative security characteristics, such as coupon rate, maturity date, issuer credit quality, and prepayment speeds as applicable. When market quotations are not readily available, or when the Adviser becomes aware that a significant event impacting the value of a security or group of securities has occurred after the closing of the exchange on which the security or securities principally trade, but before the calculation of the daily net asset value, securities are valued at fair value as determined in good faith using procedures established by the Board of Directors. The procedures consider, among
| 72 | SIT MUTUAL FUNDS ANNUAL REPORT |
others, the following factors to determine a security’s fair value: the nature and pricing history (if any) of the security; whether any dealer quotations for the security are available; and possible valuation methodologies that could be used to determine the fair value of the security. Debt securities of sufficient credit quality maturing in less than 60 days when acquired, or which subsequently are within 60 days of maturity, are valued at amortized cost, which approximates fair value.
Security transactions are accounted for on the date the securities are purchased or sold. Securities gains and losses are calculated on the identified-cost basis. Dividend income is recorded on theex-dividend date or upon the receipt ofex-dividend notification in the case of certain foreign securities. Interest, including level-yield amortization of long-term bond premium and discount, is recorded on the accrual basis.
Fair Value Measurements
The inputs and valuation techniques used to measure fair value of the Funds’ investments are summarized into three levels as described in the hierarchy below:
• Level 1 – quoted prices in active markets for identical securities. An active market for the security is a market in which transactions occur with sufficient frequency and volume to provide pricing information on an ongoing basis. A quoted price in an active market provides the most reliable evidence of fair value.
• Level 2 – debt securities are valued based on evaluated prices received from independent pricing services or from dealers who make markets in such securities. For corporate bonds, U.S. government and government agency obligations, and municipal securities the pricing services utilize matrix pricing which considers yield or price of bonds of comparable quality, coupon, maturity, and type as well as dealer supplied prices. For asset-backed securities and mortgage-backed securities, the pricing services utilize matrix pricing which considers prepayment speed assumptions, attributes of the collateral, yield or price of bonds of comparable quality, coupon, maturity, and type as well as dealer supplied prices. For foreign equities, the pricing services adjust closing prices by applying a systematic process for events occurring after the close of the foreign exchange by utilizing such inputs as Depositary Receipts, quoted prices for similar securities, exchange rates, and certain indexes. All of these inputs are derived principally from or corroborated by observable market data. An adjustment to any observable input that is significant to the fair value may render the measurement a Level 3 measurement.
• Level 3 – significant unobservable inputs, including the Adviser’s own assumptions in determining the fair value of investments.
The inputs or methodology used for valuing securities are not necessarily an indication of the risk associated with investing in those securities.
A summary of the levels for the Funds’ investments as of June 30, 2019 is included with the Funds’ schedule of investments.
Foreign Currency Translations and Forward Foreign Currency Contracts
The fair value of securities and other assets and liabilities denominated in foreign currencies for Global Dividend Growth, ESG Growth, International Growth and Developing Markets Growth Funds are translated daily into U.S. dollars at the closing rate of exchange (approximately 4:00 p.m. Eastern Time). Purchases and sales of securities, income and expenses are translated at the exchange rate on the transaction date. Dividend and interest income includes currency exchange gains (losses) realized between the accrual and payment dates on such income. Exchange gains (losses) may also be realized between the trade and settlement dates on security and forward contract transactions. For securities denominated in foreign currencies, the effect of changes in foreign exchange rates on realized and unrealized gains or losses is reflected as a component of such gains or losses.
The Global Dividend Growth, ESG Growth, International Growth and Developing Markets Growth Funds may enter into forward foreign currency exchange contracts generally for operational purposes, but the Adviser may occasionally utilize contracts to protect against adverse exchange rate fluctuation. Any gains (losses) generated by these contracts are disclosed separately on the statement of operations. The net U.S. dollar value of foreign currency underlying all contractual commitments held by the Funds and the resulting unrealized appreciation or depreciation is determined using foreign currency exchange rates from an independent pricing service. The Funds are subject to the credit risk that the other party will not complete the obligations of the contract.
| JUNE 30, 2019 | 73 |
NOTES TO FINANCIAL STATEMENTS
Year Ended June 30, 2019 (Continued)
Federal Taxes
The Funds’ policy is to comply with the requirements of the Internal Revenue Code applicable to regulated investment companies and to distribute all of their taxable income to shareholders. Therefore, no income tax provision is required. In order to avoid the payment of any federal excise taxes, the Funds will distribute substantially all of their net investment income and net realized gains on a calendar year basis. Also, the Funds may utilize equalization accounting for tax purposes, whereby a portion of redemption payments are treated as distributions of income or gain for income tax purposes.
Management has analyzed the Funds’ tax positions taken in federal tax returns for all open tax years and has concluded that as of June 30, 2019, no provision for income tax would be required in the Funds’ financial statements. The Funds’ federal and state income and federal excise tax returns remain subject to examination by the Internal Revenue Service and state departments of revenue until such time as the applicable statute of limitations for audit has expired. For example, U.S. tax returns are generally subject to audit for three years from the date they are filed.
At June 30, 2019, the gross unrealized appreciation (depreciation) on investments and cost of securities on a tax basis for federal income tax purposes were as follows:
Unrealized Appreciation | Unrealized Depreciation | Net Unrealized Appreciation (Depreciation) | Cost of Securities on a | |||||||||||||||||
Balanced | $7,047,651 | ($95,013 | ) | $6,952,638 | $27,634,549 | |||||||||||||||
Dividend Growth | 36,556,951 | (5,026,754 | ) | 31,530,197 | 221,761,922 | |||||||||||||||
Global Dividend Growth | 8,567,137 | (492,646 | ) | 8,074,491 | 25,911,823 | |||||||||||||||
Large Cap Growth | 56,863,331 | (115,387 | ) | 56,747,944 | 59,960,394 | |||||||||||||||
ESG Growth | 1,513,352 | (45,363 | ) | 1,467,989 | 4,812,517 | |||||||||||||||
Mid Cap Growth | 72,331,222 | (179,927 | ) | 72,151,295 | 97,691,562 | |||||||||||||||
Small Cap Dividend Growth | 3,046,287 | (668,289 | ) | 2,377,998 | 14,146,625 | |||||||||||||||
Small Cap Growth | 37,448,660 | (468,777 | ) | 36,979,883 | 62,849,490 | |||||||||||||||
International Growth | 5,237,035 | (612,561 | ) | 4,624,474 | 18,751,094 | |||||||||||||||
Developing Markets Growth | 2,837,881 | (284,347 | ) | 2,553,534 | 7,431,370 | |||||||||||||||
Net investment income and net realized gains differ for financial statement and tax purposes because of corporate actions on shares held and/or losses deferred due to “wash sale” transactions. A “wash sale” occurs when a Fund sells a security that it has acquired within a period beginning thirty days before and ending thirty days after the date of sale (a sixty one day period). The character of distributions made during the year from net investment income or net realized gains may also differ from its ultimate characterization for tax purposes. Also, due to the timing of dividend distributions, the fiscal year in which amounts are distributed may differ from the year that the income or realized gains (losses) were recorded by the Funds. The tax character of distributions paid during the fiscal years ended June 30, 2019 and 2018 were as follows:
| 74 | SIT MUTUAL FUNDS ANNUAL REPORT |
| Year Ended June 30, 2019: | |||||||||||||||
| Ordinary Income | Long Term Capital Gain | Total | |||||||||||||
Balanced | $459,001 | $342,301 | $801,302 | ||||||||||||
Dividend Growth (Class I) | 17,847,831 | 86,972,912 | 104,820,743 | ||||||||||||
Dividend Growth (Class S) | 1,193,973 | 7,639,936 | 8,833,909 | ||||||||||||
Global Dividend Growth (Class I) | 521,860 | — | 521,860 | ||||||||||||
Global Dividend Growth (Class S) | 49,144 | — | 49,144 | ||||||||||||
Large Cap Growth | 456,987 | 9,477,676 | 9,934,663 | ||||||||||||
ESG Growth (Class I) | 40,551 | — | 40,551 | ||||||||||||
ESG Growth (Class S) | 31,449 | — | 31,449 | ||||||||||||
Mid Cap Growth | 1,152,232 | 14,273,917 | 15,426,149 | ||||||||||||
Small Cap Dividend Growth (Class I) | 169,480 | 147,220 | 316,700 | ||||||||||||
Small Cap Dividend Growth (Class S) | 38,521 | 42,395 | 80,916 | ||||||||||||
Small Cap Growth | — | 7,455,033 | 7,455,033 | ||||||||||||
International Growth | 245,338 | — | 245,338 | ||||||||||||
Developing Markets Growth | 49,252 | 102,896 | 152,148 | ||||||||||||
| Year Ended June 30, 2018: | |||||||||||||||
| Ordinary Income | Long Term Capital Gain | Total | |||||||||||||
Balanced | $307,000 | $1,006,844 | $1,313,844 | ||||||||||||
Dividend Growth (Class I) | 31,170,676 | 74,263,557 | 105,434,233 | ||||||||||||
Dividend Growth (Class S) | 1,857,317 | 4,855,261 | 6,712,578 | ||||||||||||
Global Dividend Growth (Class I) | 431,455 | — | 431,455 | ||||||||||||
Global Dividend Growth (Class S) | 44,545 | — | 44,545 | ||||||||||||
Large Cap Growth | 821,351 | 11,972,770 | 12,794,121 | ||||||||||||
ESG Growth (Class I) | 27,776 | — | 27,776 | ||||||||||||
ESG Growth (Class S) | 21,224 | — | 21,224 | ||||||||||||
Mid Cap Growth | 4,961 | 6,517,375 | 6,522,336 | ||||||||||||
Small Cap Dividend Growth (Class I) | 131,227 | — | 131,227 | ||||||||||||
Small Cap Dividend Growth (Class S) | 26,774 | — | 26,774 | ||||||||||||
Small Cap Growth | — | 6,111,266 | 6,111,266 | ||||||||||||
International Growth | 197,000 | — | 197,000 | ||||||||||||
Developing Markets Growth | — | 159,864 | 159,864 | ||||||||||||
| JUNE 30, 2019 | 75 |
NOTES TO FINANCIAL STATEMENTS
Year Ended June 30, 2019 (Continued)
As of June 30, 2019, the components of distributable earnings on a tax basis were as follows:
Undistributed Ordinary Income | Undistributed Long-Term Capital Gains | Accumulated Capital and Other Losses | Unrealized Appreciation (Depreciation) | |||||||||||||||||
Balanced | $102,226 | $1,524,121 | — | $6,952,638 | ||||||||||||||||
Dividend Growth | 1,068,300 | 22,019,050 | — | 31,530,197 | ||||||||||||||||
Global Dividend Growth | 222,441 | — | $(1,181,787 | ) | 8,074,491 | |||||||||||||||
Large Cap Growth | 176,138 | 6,846,710 | — | 56,747,944 | ||||||||||||||||
ESG Growth | 50,472 | — | (126,311 | ) | 1,467,989 | |||||||||||||||
Mid Cap Growth | — | 11,444,355 | (3,152,283 | ) | 72,151,295 | |||||||||||||||
Small Cap Dividend Growth | 46,837 | — | (191,450 | ) | 2,377,998 | |||||||||||||||
Small Cap Growth | — | 991,788 | (220,127 | ) | 36,979,883 | |||||||||||||||
International Growth | 210,247 | — | (1,078,893 | ) | 4,624,474 | |||||||||||||||
Developing Markets Growth | 34,387 | — | (5,966 | ) | 2,553,534 | |||||||||||||||
On the statement of assets and liabilities, as a result of permanentbook-to-tax differences, reclassification adjustments were made to the following capital accounts:
Distributable Earnings |
| Additional Paid-in Capital | ||||||||||
Dividend Growth | $(37,515,449 | ) | $37,515,449 | |||||||||
Small Cap Growth | 494,286 | (494,286 | ) | |||||||||
These differences were primarily attributable tonon-deductible net operating losses and the utilization of equalization accounting for tax purposes.
Net capital loss carryovers and late year losses, if any, as of June 30, 2019, are available to offset future realized capital gains and thereby reduce future capital gains distributions. The Funds’ are permitted to carry forward capital losses for an unlimited period. Capital losses that are carried forward retain their character as either short-term or long-term capital losses. The net capital loss carryovers and the late year losses deferred as of June 30, 2019, were as follows:
| Unlimited Period of Net Capital Loss Carryover | Late Year Losses Deferred | |||||||||||||||||||
| Short-Term | Long-Term | Ordinary | Capital | |||||||||||||||||
Global Dividend Growth | $1,117,441 | $64,346 | — | — | ||||||||||||||||
ESG Growth | 81,237 | 45,074 | — | — | ||||||||||||||||
Mid Cap Growth | — | — | $108,009 | $3,044,274 | ||||||||||||||||
Small Cap Dividend Growth | — | — | — | 191,450 | ||||||||||||||||
Small Cap Growth | — | — | 220,127 | — | ||||||||||||||||
International Growth | 913,795 | 165,098 | — | — | ||||||||||||||||
Developing Markets Growth | — | — | — | 5,966 | ||||||||||||||||
For the year ended June 30, 2019, the Funds’ utilized capital losses and expired capital losses as follows:
| Utilized | Expired | |||||||||||
Small Cap Dividend Growth | $180,597 | — | ||||||||||
| 76 | SIT MUTUAL FUNDS ANNUAL REPORT |
Distributions
Distributions to shareholders are recorded as of the close of business on the record date. Such distributions are payable in cash or reinvested in additional shares of the Funds’ capital stock. Distributions from net investment income, if any, are declared and paid quarterly for the Balanced, Dividend Growth, Global Dividend Growth and Small Cap Dividend Growth Funds and declared and paid annually for Developing Markets Growth, Small Cap Growth, International Growth, Mid Cap Growth, Large Cap Growth and ESG Growth Funds. Distributions from net realized gains, if any, will be made annually for each of the Funds.
Concentration of Investments
The Developing Markets Growth Fund may concentrate investments in countries with limited or developing capital markets which may involve greater risks than investments in more developed markets and the prices of such investments may be volatile. The consequences of political, social or economic changes in these markets may have disruptive effects on the market prices of the Fund’s investments and the income it generates, as well as the Fund’s ability to repatriate such amounts.
Use of Estimates
The preparation of financial statements in conformity with U.S. generally accepted accounting principles requires management to make certain estimates and assumptions that affect the reported amounts of assets and liabilities and disclosure of contingent assets and liabilities at the date of the financial statements and the reported results for the respective periods. Actual results could differ from those estimates.
Guarantees and Indemnifications
Under each Fund’s organizational documents, its officers and directors are indemnified against certain liability arising out of the performance of their duties to each Fund. In addition, certain of each Fund’s contracts with its service providers contain general indemnification clauses. Each Fund’s maximum exposure under these arrangements is unknown since the amount of any future claims that may be made against each Fund cannot be determined and each Fund has no historical basis for predicting the likelihood of any such claims.
| JUNE 30, 2019 | 77 |
NOTES TO FINANCIAL STATEMENTS
Year Ended June 30, 2019 (Continued)
| (3) | Investment Security Transactions |
The cost of purchases and proceeds from sales and maturities of investment securities, other than short-term securities, for the year ended June 30, 2019, were as follows:
| Purchases | Proceeds | |||||||||||||||
U.S. Government | Other | U.S. Government | Other | |||||||||||||
Balanced | $4,714,751 | $12,612,936 | $3,890,846 | $15,972,193 | ||||||||||||
Dividend Growth | — | 307,440,196 | — | 996,014,819 | ||||||||||||
Global Dividend Growth | — | 4,712,641 | — | 5,226,704 | ||||||||||||
Large Cap Growth | — | 18,538,812 | — | 32,236,244 | ||||||||||||
ESG Growth | — | 568,963 | — | 520,778 | ||||||||||||
Mid Cap Growth | — | 43,208,536 | — | 54,598,851 | ||||||||||||
Small Cap Dividend Growth | — | 3,965,752 | — | 5,015,049 | ||||||||||||
Small Cap Growth | — | 24,965,025 | — | 33,237,766 | ||||||||||||
International Growth | — | 6,034,172 | — | 6,812,259 | ||||||||||||
Developing Markets Growth | — | 1,017,956 | — | 1,464,349 | ||||||||||||
| (4) | Affiliated Fees and Transactions |
Investment Adviser
The Funds each have entered into an investment management agreement with Sit Investment Associates, Inc. (SIA), under which SIA manages the Funds’ assets and provides research, statistical and advisory services, and pays related office rental, executive expenses and executive salaries. The current fee for investment management and advisory services is based on the average daily net assets of the Funds at the annual rate of:
| Management Fee | Net of Adviser’s Voluntary Fee Waiver | |||
| ||||
Balanced | 1.00% | N/A | ||
Dividend Growth Fund Class I and Class S | 1.00% | 0.70% | ||
Global Dividend Growth Fund Class I and Class S | 1.25% | 1.00% | ||
Large Cap Growth | 1.00% | N/A | ||
ESG Growth Fund Class I and Class S | 1.25% | 1.00% | ||
Mid Cap Growth | 1.25% | N/A | ||
Small Cap Dividend Growth Fund Class I and Class S | 1.25% | 1.00% | ||
Small Cap Growth | 1.50% | N/A | ||
International Growth | 1.50% | N/A | ||
Developing Markets Growth | 2.00% | 1.40% | ||
SIA is obligated to pay all of the Funds’ expenses (excluding extraordinary expenses, stock transfer taxes, interest, brokerage commissions,12b-1 fees and other transaction charges relating to investing activities).
In addition to the annual management fees, the Class S shares of Dividend Growth, Global Dividend Growth, ESG Growth and Small Cap Dividend Growth Funds also have a 0.25% annual distribution(12b-1) fee, which is used to pay for distribution fees related to the sale and distribution of its shares.
Effective October 1, 2017, the Adviser has agreed to limit the management fee of the Dividend Growth Fund to 0.70%, the Global Dividend Growth Fund to 1.00%, the ESG Growth Fund to 1.00%, the Small Cap Dividend Growth Fund to 1.00% and the Developing Markets Growth Fund to 1.40% for the period through June 30, 2020 of the Fund’s daily average net assets, respectively.
| 78 | SIT MUTUAL FUNDS ANNUAL REPORT |
Transactions with affiliates
The investment adviser, affiliates of the investment adviser, directors and officers of the Funds as a whole owned the following shares as of June 30, 2019:
| Shares | % Shares Outstanding | |||||||||
Balanced | 275,361 | 20.0 | ||||||||
Dividend Growth | 1,310,792 | 7.5 | ||||||||
Global Dividend Growth |
| 470,179 | 22.6 | |||||||
Large Cap Growth | 677,464 | 24.7 | ||||||||
ESG Growth | 448,919 | 94.3 | ||||||||
Mid Cap Growth | 4,144,459 | 46.2 | ||||||||
Small Cap Dividend Growth |
| 666,269 | 47.9 | |||||||
Small Cap Growth | 989,224 | 55.1 | ||||||||
International Growth | 756,986 | 55.3 | ||||||||
Developing Markets Growth |
| 256,357 | 41.6 | |||||||
| (5) | Capital Share Activity |
Short-Term Trading (Redemption) Fees
The Funds (except Balanced) charge a redemption fee equal to 2.00% of the proceeds on shares held for less than 30 calendar days. The fee is retained by the Fund for the benefit of its long-term shareholders and accounted for as an addition to paid in capital. For the year ended June 30, 2019, the Funds received the following redemption fees:
| Class I | Class S | |||||||
Dividend Growth | $6,190 | $676 | ||||||
Global Dividend Growth | 1 | — | ||||||
Large Cap Growth | 701 | — | ||||||
Mid Cap Growth | 103 | — | ||||||
Small Cap Growth | 319 | — |
| JUNE 30, 2019 | 79 |
REPORT OF INDEPENDENT REGISTERED PUBLIC ACCOUNTING FIRM
To the Shareholders and Board of Directors
Sit Mutual Funds, Inc.
Sit Large Cap Growth Fund, Inc.
Sit Mid Cap Growth Fund, Inc.
Opinion on the Financial Statements
We have audited the accompanying statement of assets and liabilities of Sit Balanced Fund, Sit Dividend Growth Fund, Sit Global Dividend Growth Fund, Sit ESG Growth Fund, Sit Small Cap Dividend Growth Fund, Sit Small Cap Growth Fund, Sit International Growth Fund, Sit Developing Markets Growth Fund (each a series of Sit Mutual Funds, Inc.), Sit Large Cap Growth Fund, Inc., and Sit Mid Cap Growth Fund, Inc. (collectively, the Funds), including the schedules of investments, as of June 30, 2019, the related statements of operations for the year then ended, the statements of changes in net assets for each of the years in the two year period then ended, and the related notes (collectively, the financial statements) and the financial highlights for each of the years or periods in the five year period then ended. In our opinion, the financial statements and financial highlights present fairly, in all material respects, the financial position of the Funds as of June 30, 2019, the results of their operations for the year then ended, the changes in their net assets for each of the years in the two year period then ended, and the financial highlights for each of the years or periods in the five year period then ended, in conformity with U.S. generally accepted accounting principles.
Basis for Opinion
These financial statements and financial highlights are the responsibility of the Funds’ management. Our responsibility is to express an opinion on these financial statements and financial highlights based on our audits. We are a public accounting firm registered with the Public Company Accounting Oversight Board (United States) (PCAOB) and are required to be independent with respect to the Company in accordance with the U.S. federal securities laws and the applicable rules and regulations of the Securities and Exchange Commission and the PCAOB.
We conducted our audits in accordance with the standards of the PCAOB. Those standards require that we plan and perform the audit to obtain reasonable assurance about whether the financial statements and financial highlights are free of material misstatement, whether due to error or fraud. Our audits included performing procedures to assess the risks of material misstatement of the financial statements and financial highlights, whether due to error or fraud, and performing procedures that respond to those risks. Such procedures included examining, on a test basis, evidence regarding the amounts and disclosures in the financial statements and financial highlights. Such procedures also included confirmation of securities owned as of June 30, 2019, by correspondence with custodians and brokers. Our audits also included evaluating the accounting principles used and significant estimates made by management, as well as evaluating the overall presentation of the financial statements and financial highlights. We believe that our audits provide a reasonable basis for our opinion.
/s/KPMG LLP
We have served as the auditor of one or more Sit Mutual Funds investment companies since 1982.
Minneapolis, Minnesota
August 16, 2019
| 80 | SIT MUTUAL FUNDS ANNUAL REPORT |
As a shareholder of the Funds, you incur two types of costs: (1) transaction costs, including redemption fees and (2) ongoing costs, including management fees; and other Fund expenses. This Example is intended to help you understand your ongoing costs (in dollars) of investing in the Funds and to compare these costs with the ongoing costs of investing in other mutual funds.
The Example is based on an investment of $1,000 invested at the beginning of the period and held for the entire period January 1, 2019 to June 30, 2019.
Actual Expenses
The first line of the following table provides information about actual account values and actual expenses. You may use the information in this line, together with the amount you invested, to estimate the expenses that you paid over the period. Simply divide your account value by $1,000 (for example, an $8,600 account value divided by $1,000 = 8.6), then multiply the result by the number in the first line under the heading entitled “Expenses Paid During Period” to estimate the expenses you paid on your account during this period.
Hypothetical Example for Comparison Purposes
The second line of the table provides information about hypothetical account values and hypothetical expenses based on the Fund’s actual expense ratio and an assumed rate of return of 5% per year before expenses, which is not the Fund’s actual return. The hypothetical account values and expenses may not be used to estimate the actual ending account balance or expenses you paid for the period. You may use this information to compare the ongoing costs of investing in the Fund and other funds. To do so, compare this 5% hypothetical example with the 5% hypothetical examples that appear in the shareholder reports of the other funds.
Please note that the expenses shown in the table are meant to highlight your ongoing costs only and do not reflect any transactional costs, such as redemption fees. Therefore, the second line of the table is useful in comparing ongoing costs only, and will not help you determine the relative total costs of owning different funds. In addition, if these transactional costs (redemption fees) were included, your costs would have been higher.
| Fund | Beginning Account Value (1/1/19) | Ending Account Value (6/30/19) | Expenses Paid During Period* (1/1/19- 6/30/19) | |||||||
Balanced Fund | ||||||||||
Actual | $1,000 | $1,127.60 | $5.28 | |||||||
Hypothetical |
| $1,000
|
|
| $1,019.84
|
| $5.01
| |||
Dividend Growth Fund | ||||||||||
Actual | ||||||||||
Class I | $1,000 | $1,156.30 | $3.74 | |||||||
Class S | $1,000 | $1,154.70 | $5.08 | |||||||
Hypothetical | ||||||||||
Class I | $1,000 | $1,021.32 | $3.51 | |||||||
Class S |
| $1,000
|
|
| $1,020.08
|
| $4.76
| |||
Global Dividend Growth Fund | ||||||||||
Actual | ||||||||||
Class I | $1,000 | $1,160.90 | $5.36 | |||||||
Class S | $1,000 | $1,160.40 | $6.70 | |||||||
Hypothetical | ||||||||||
Class I | $1,000 | $1,019.84 | $5.01 | |||||||
Class S |
| $1,000
|
|
| $1,018.60
|
| $6.26
| |||
Large Cap Growth Fund | ||||||||||
Actual | $1,000 | $1,192.70 | $5.44 | |||||||
Hypothetical |
| $1,000
|
|
| $1,019.84
|
| $5.01
| |||
ESG Growth Fund | ||||||||||
Actual | ||||||||||
Class I | $1,000 | $1,158.80 | $5.35 | |||||||
Class S | $1,000 | $1,157.40 | $6.69 | |||||||
Hypothetical | ||||||||||
Class I | $1,000 | $1,019.84 | $5.01 | |||||||
Class S
|
| $1,000
|
|
| $1,018.60
|
| $6.26
| |||
Mid Cap Growth Fund | ||||||||||
Actual | $1,000 | $1,244.40 | $6.96 | |||||||
Hypothetical |
| $1,000
|
|
| $1,018.60
|
| $6.26
| |||
Small Cap Dividend Growth Fund | ||||||||||
Actual | ||||||||||
Class I | $1,000 | $1,185.80 | $5.42 | |||||||
Class S | $1,000 | $1,184.20 | $6.77 | |||||||
Hypothetical | ||||||||||
Class I | $1,000 | $1,019.84 | $5.01 | |||||||
Class S | $1,000 | $1,018.60 | $6.26 | |||||||
| JUNE 30, 2019 | 81 |
EXPENSE EXAMPLE (Unaudited) (Continued)
| Fund | Beginning Account Value (1/1/19) | Ending Account Value (6/30/19) | Expenses Paid During Period* (1/1/19- 6/30/19) | |||||||
Small Cap Growth Fund | ||||||||||
Actual | $1,000 | $1,248.00 | $8.36 | |||||||
Hypothetical |
| $1,000
|
|
| $1,017.36
|
| $7.50
| |||
International Growth Fund | ||||||||||
Actual | $1,000 | $1,195.40 | $8.17 | |||||||
Hypothetical |
| $1,000
|
|
| $1,017.36
|
| $7.50
| |||
Developing Markets Growth Fund | ||||||||||
Actual | $1,000 | $1,124.90 | $7.38 | |||||||
Hypothetical | $1,000 | $1,017.85 | $7.00 | |||||||
*Expenses are equal to the Fund’s annualized expense ratio of 0.70% for the Dividend Growth, Class I Fund; 0.95% for the Dividend Growth, Class S Fund; 1.00%, for the Balanced, Global Dividend Growth, Class I, Large Cap Growth, ESG Growth, Class I, and Small Cap Dividend Growth, Class I Funds; 1.25% for Dividend Growth, Class S, Global Dividend Growth, Class S, ESG Growth, Class S, Mid Cap Growth, and Small Cap Dividend Growth, Class S Funds; 1.40% for Developing Markets Growth Fund and 1.50% for Small Cap Growth, and International Growth Funds, multiplied by the average account value over the period, multiplied by 181/365 (to reflect theone-half year period.)
| 82 | SIT MUTUAL FUNDS ANNUAL REPORT |
FEDERAL TAX INFORMATION (Unaudited)
Sit Equity Funds
For corporate shareholders, the percentage of investment income (dividend income and short-term gains, if any), for each of the Funds that qualify for the Dividends Received Deductions for the period of July 1, 2018 to June 30, 2019 is as follows:
| Fund | Percentage | |||
Balanced Fund | 70.4 | % | ||
Dividend Growth Fund | 99.5 | |||
Global Dividend Growth Fund | 98.3 | |||
Large Cap Growth Fund | 100.0 | |||
ESG Growth Fund | 100.0 | |||
Mid Cap Growth Fund | 100.0 | |||
Small Cap Dividend Growth Fund | 100.0 | |||
International Growth Fund | 0.9 | |||
Developing Markets Growth Fund | 30.6 | |||
For the year ended June 30, 2019, certain dividends paid by the Funds may be subject to a maximum tax rate of 15%, as provided by the Jobs and Growth Tax Relief Reconciliation Act of 2003. Of the distributions made by the following Funds, the corresponding percentages represent the amount of each distribution which may qualify for the 15% dividend income tax rate.
| Fund | Percentage | |||
Balanced Fund | 75.9 | % | ||
Dividend Growth Fund | 100.0 | |||
Global Dividend Growth Fund | 100.0 | |||
Large Cap Growth Fund | 100.0 | |||
ESG Growth Fund | 100.0 | |||
Mid Cap Growth Fund | 100.0 | |||
Small Cap Dividend Growth Fund | 100.0 | |||
International Growth Fund | 100.0 | |||
Developing Markets Growth Fund | 100.0 | |||
The following Funds designated the listed amounts as long-term capital gain dividends during the year ended June 30, 2019. Distributable long-term gains are based on net realized long term gains determined on a tax basis and may differ from such amounts for financial reporting purposes.
| Fund | Amount | |||
Balanced Fund | $1,556,357 | |||
Dividend Growth Fund* | 132,128,297 | |||
Large Cap Growth Fund | 9,682,113 | |||
Mid Cap Growth Fund | 16,839,615 | |||
Small Cap Dividend Growth Fund | 182,632 | |||
Small Cap Growth Fund | 7,455,033 | |||
Developing Markets Growth Fund | 102,896 | |||
* Includes $37,515,449 of equalization.
| JUNE 30, 2019 | 83 |
INFORMATION ABOUT DIRECTORS AND OFFICERS (Unaudited)
The Sit Mutual Funds are a family ofno-load mutual funds. The Stock Funds described in this Annual Report are the Sit Mid Cap Growth Fund, Sit Large Cap Growth Fund, Sit International Growth Fund, Sit Balanced Fund, Sit Developing Markets Growth Fund, Sit Small Cap Growth Fund, Sit Dividend Growth Fund, Sit Global Dividend Growth Fund, Sit Small Cap Dividend Growth Fund, and the Sit ESG Growth Fund (the “Funds” or individually, a “Fund”). The bond funds within the Sit Mutual Fund family are described in a separate Bond Funds’ Annual Report. The Sit Mid Cap Growth Fund and Sit Large Cap Growth Fund, and the corporate issuer of the Sit International Growth Fund, Sit Balanced Fund, Sit Developing Markets Growth Fund, Sit Small Cap Growth Fund, Sit Dividend Growth Fund, Sit Global Dividend Growth Fund, and Sit Small Cap Dividend Growth Fund have a Board of Directors and officers. Pursuant to Minnesota law, the Boards of Directors are responsible for the management of the Funds and the establishment of the Funds’ policies. The officers of the Funds manage theday-to-day operation of the Funds. Information pertaining to the directors and officers of the Funds is set forth below. The business address, unless otherwise noted below, is that of the Funds’ investment adviser – 3300 IDS Center, 80 South Eighth Street, Minneapolis, Minnesota 55402. The Boards have a separate Audit Committee. The Stock Funds’ SAI has additional information about the Funds’ directors and is available without charge upon request by calling the Sit Funds at800-332-5580.
Name, Age, and Position with Funds |
Term of Office (1) and Length of Time Served | Principal Occupations During Past Five Years | Number of Funds Overseen in Fund Complex | Other Directorships Held by Director (3) | ||||
INTERESTED DIRECTORS: | ||||||||
Roger J. Sit (2) Age: 57 Chairman and President | Chairman since 10/08; Officer since 1998. | Chairman, President, CEO and Global CIO of Sit Investment Associates, Inc. (the “Adviser”); Chairman and CEO of Sit Investment Fixed Income Advisors, Inc. (“SF”); Chairman of SIA Securities Corp. (the “Distributor”). | 14 | TCF Financial Corporation. | ||||
INDEPENDENT DIRECTORS: | ||||||||
Edward M. Giles Age: 83 Director | Director since 2012 or the Fund’s inception, if later. | Senior Vice President of Peter B. Cannell & Co., July 2011 to present. | 14 | None. | ||||
Sidney L. Jones Age: 85 Director | Director from 1988 to 1989 and since 1993 or the Fund’s inception, if later. | Lecturer, Washington Campus Consortium of 17 Universities. | 14 | None. | ||||
Bruce C. Lueck Age: 78 Director | Director since 2004 or the Fund’s inception, if later. | Consultant for Zephyr Management, L.P. (investment management) and committee member of several investment funds and foundations. | 14 | None. | ||||
Donald W. Phillips Age: 71 Director | Director of the International Fund since 1993, and since 1990 or the Fund’s inception, if later for all other Funds. | Chairman and CEO of WP Global Partners Inc., July 2005 to present; | 14 | None. | ||||
Barry N. Winslow Age: 71 Director | Director since 2010 or the Fund’s inception, if later. | Vice-Chairman of TCF Financial Corporation, July 2008 to July 2014. | 14 | TCF Financial Corporation. | ||||
| 84 | SIT MUTUAL FUNDS ANNUAL REPORT |
Name, Age, and Position with Funds | Term of Office (1) and Length of Time Served | Principal Occupations During Past Five Years | Number of Funds Overseen in Fund Complex | Other Directorships Held by Director (3) | ||||
OFFICERS: | ||||||||
Mark H. Book Age: 56 Vice President – Investments of Balanced Fund only | Officer since 2002; Re-Elected by the Boards annually. | Vice President and Portfolio Manager of SF. | N/A | N/A | ||||
Kelly K. Boston Age: 50 Assistant Secretary & Assistant Treasurer | Officer since 2000; Re-Elected by the Boards annually. | Staff Attorney of the Adviser; Secretary of the Distributor. | N/A | N/A | ||||
Bryce A. Doty Age: 52 Vice President - Investments of Balanced Fund only. | Officer since 1996; Re-Elected by the Boards annually. | Senior Vice President and Senior Portfolio Manager of SF. | N/A | N/A | ||||
Kent L. Johnson Age: 52 Vice President - Investments | Officer since 2003; Re-Elected by the Boards annually. | Senior Vice President - Research and Investment Management of the Adviser. | N/A | N/A | ||||
Michael J. Radmer 50 S. 6th Street Minneapolis, MN 55402 Age: 74 Secretary | Officer since 1984; Re-Elected by the Boards annually. | Senior Counsel of the Funds’ general counsel, Dorsey & Whitney, LLP since January 2016; Partner from January 1976 to December 2015. | N/A | N/A | ||||
Paul E. Rasmussen Age: 58 Vice President, Treasurer & Chief Compliance Officer | Officer since 1994; Re-Elected by the Boards annually. | Vice President, Secretary, Controller and Chief Compliance Officer of the Adviser; Vice President, Secretary, and Chief Compliance Officer of SF; President and Treasurer of the Distributor. | N/A | N/A | ||||
Carla J. Rose Age: 53 Vice President, Assistant Secretary & Assistant Treasurer | Officer since 2000; Re-Elected by the Boards annually. | Vice President, Administration & Deputy Controller of the Adviser; Vice President, Controller, Treasurer & Assistant Secretary of SF; Vice President and Assistant Secretary of the Distributor. | N/A | N/A | ||||
Robert W. Sit Age: 50 Vice President - Investments | Officer since 1997; Re-Elected by the Boards annually. | Vice President - Research and Investment Management of the Adviser. | N/A | N/A | ||||
Ronald D. Sit Age: 59 Vice President - Investments | Officer since 1985; Re-Elected by the Boards annually. | Vice President - Research and Investment Management of the Adviser. | N/A | N/A | ||||
| 1 | Each Director serves until their resignation, removal or the next meeting of the shareholders at which election of directors is an agenda item and his successor is duly elected and shall qualify. |
| 2 | Directors who are deemed to be “interested persons” of the Funds as that term is defined by the Investment Company Act of 1940. Mr. Sit is considered an “interested person” because he is a an officer of Sit Investment Associates, Inc., the Fund’s investment adviser. |
| 3 | Includes only directorships of companies required to report under the Securities Exchange Act of 1934 (i.e., public companies) or other investment companies registered under the 1940 Act. |
| JUNE 30, 2019 | 85 |
ADDITIONAL INFORMATION (Unaudited)
PROXY VOTING
A description of the policies and procedures that Sit Investment uses to vote proxies related to the Funds’ portfolio securities is set forth in the Funds’ Statement of Additional Information, which is available on the Funds’ website at www.sitfunds.com, without charge by calling800-332-5580 and on the Securities and Exchange Commission’s (SEC) website at www.sec.gov. The Funds’ proxy voting record is available without charge by calling800-332-5580 and on the SEC’s website at www.sec.gov no later than August 31 for the prior 12 months ending June.
QUARTERLY SCHEDULE OF INVESTMENTS SCHEDULES
Each Fund files a complete schedule of investments with the SEC for the first and third quarters of each fiscal year on FormN-PORT. The Funds’ FormN-PORT is available on the SEC’s website at www.sec.gov. Each Fund’s complete schedule of investments, as filed on FormN-PORT, is also available on its website at www.sitfunds.com, or without charge by calling800-332-5580.
| 86 | SIT MUTUAL FUNDS ANNUAL REPORT |
[This page intentionally left blank.]
| JUNE 30, 2019 | 87 |
[This page intentionally left blank.]
| 88 | SIT MUTUAL FUNDS ANNUAL REPORT |
Annual Report June 30, 2019 | ||
INVESTMENT ADVISER | INDEPENDENT REGISTERED PUBLIC | |
Sit Investment Associates, Inc. | ACCOUNTING FIRM | |
80 S. Eighth Street | KPMGLLP | |
Suite 3300 | Minneapolis, MN | |
Minneapolis, MN 55402 | ||
| GENERAL COUNSEL | ||
CUSTODIAN | Dorsey & WhitneyLLP | |
The Bank Of New York Mellon | Minneapolis, MN | |
111 Sanders Creek Parkway | ||
Syracuse, NY 13057 | ||
TRANSFER AGENT AND | ||
DISBURSING AGENT | ||
BNY Mellon Investment Servicing (US) Inc. | ||
4400 Computer Drive | ||
Westborough, MA 01581 | ||
| Sit Mutual Funds
| |
1-800-332-5580 www.sitfunds.com | ||

Sit6-30-19 Stock
| Item 2: | Code of Ethics. |
The registrant has adopted a code of ethics that applies to the registrant’s principal executive officer, principal financial officer, principal accounting officer, and persons performing similar functions. The registrant has not made any amendment to its code of ethics during the period covered by this report which must be described herein pursuant to Item 2. The registrant has not granted any waivers from any provisions of the code of ethics during the period covered by this report.
A copy of the registrant’s code of ethics is available without charge upon request by calling the registrant at612-332-3223 or1-800-332-5580, or by mail at Sit Mutual Funds, 3300 IDS Center, 80 South Eighth Street, Minneapolis, MN 55402.
| Item 3: | Audit Committee Financial Expert. |
The registrant’s Board of Directors has determined that Mr. Edward M. Giles, Mr. Sidney L. Jones, Mr. Bruce C. Lueck, Mr. Donald W. Phillips and Mr. Barry N. Winslow are audit committee financial experts serving on its audit committee. Mr. Giles, Mr. Jones, Mr. Lueck, Mr. Phillips and Mr. Winslow are independent for purposes of this item.
| Item 4: | Principal Accountant Fees and Services. |
(a) – (d) Aggregate fees billed to the registrant for the last two fiscal years for professional services rendered by the registrant’s principal accountant were as follows:
| 2019 | 2018 | |||||||||||||||||||||||||||||||
| Audit | Audit | Tax | Other | Audit | Audit | Tax | Other | |||||||||||||||||||||||||
| Fees | Related | Fees | Fees | Fees | Related | Fees | Fees | |||||||||||||||||||||||||
Fiscal year ended June 30 | ||||||||||||||||||||||||||||||||
Sit Mutual Funds, Inc. | ||||||||||||||||||||||||||||||||
Sit International Growth Fund (series A) | $ | 23,000 | 0 | $ | 5,650 | 0 | $ | 22,000 | 0 | $ | 5,430 | 0 | ||||||||||||||||||||
Sit Balanced Fund (series B) | 25,400 | 0 | 5,650 | 0 | 24,600 | 0 | 5,430 | 0 | ||||||||||||||||||||||||
Sit Developing Markets Growth Fund (series C) | 23,000 | 0 | 5,650 | 0 | 22,200 | 0 | 5,430 | 0 | ||||||||||||||||||||||||
Sit Small Cap Growth Fund (series D) | 23,200 | 0 | 5,650 | 0 | 22,400 | 0 | 5,430 | 0 | ||||||||||||||||||||||||
Sit Dividend Growth Fund (series G) | 28,200 | 0 | 5,650 | 0 | 27,300 | 0 | 5,430 | 0 | ||||||||||||||||||||||||
Sit Global Dividend Growth Fund (series H) | 23,000 | 0 | 5,650 | 0 | 22,200 | 0 | 5,430 | 0 | ||||||||||||||||||||||||
Sit Small Cap Dividend Growth Fund (series I) | 23,000 | 0 | 5,650 | 0 | 22,200 | 0 | 5,430 | 0 | ||||||||||||||||||||||||
Sit ESG Growth Fund (series J) | 23,000 | 0 | 5,650 | 0 | 22,200 | 0 | 5,430 | 0 | ||||||||||||||||||||||||
|
|
|
|
|
|
|
|
|
|
|
|
|
|
|
| |||||||||||||||||
Total Sit Mutual Funds, Inc. | 191,800 | 0 | 45,200 | 0 | 185,300 | 0 | 43,440 | 0 | ||||||||||||||||||||||||
Audit fees include amounts related to the audit of the registrant’s annual financial statements and services normally provided by the accountant in connection with statutory and regulatory filings. Audit-related fees include amounts reasonably related to the performance of the audit of the registrant’s financial statements, and/or are traditionally performed by the auditor. Tax fees include amounts related to tax compliance, tax planning, and tax advice. Other Fees include services provided to review the Fund’s order processing and trading procedures.
(e) (1) The Audit Committee is required topre-approve audit andnon-audit services performed for the registrant by the independent auditor in order to assure that the provision of such services does not impair the auditor’s independence. The audit committee also is required topre-approve certainnon-audit services performed by the registrant’s independent auditor for the registrant’s investment adviser and certain of the adviser’s affiliates if the services relate directly to the operations and financial reporting of the registrant. Services to be provided by the auditor must receive generalpre-approval or specificpre-approval by the audit committee. Any proposed services exceedingpre-approved cost levels will require separatepre-approval by the audit committee.
The audit committee may delegatepre-approval authority to the audit committee chairman. The chairman shall report anypre-approval decisions to the audit committee at its next scheduled meeting. The audit committee does not delegate its responsibility topre-approve services performed by the independent auditor to management.
(2) No services included in (b) – (d) were approved pursuant to paragraph (c)(7)(i)(C) of Rule2-01 of RegulationS-X.
(f) Not applicable.
(g) The aggregate fees billed for the most recent fiscal year and the preceding fiscal year by the registrant’s principal accountant fornon-audit services rendered to the registrant, its investment adviser, and any entity controlling, controlled by, or under common control with the investment adviser that provides ongoing services to the registrant were $0 and $0, respectively.
(h) The registrant’s audit committee has determined that the provision ofnon-audit services rendered to the registrant’s investment adviser, and any entity controlling, controlled by, or under common control with the investment adviser that provides ongoing services to the registrant, that were notpre-approved pursuant to paragraph (c)(7)(ii) of Rule2-01 of RegulationS-X is considered compatible with maintaining the principal accountant’s independence.
| Item 5: | Audit Committee of Listed Registrants. |
Not applicable toopen-end investment companies.
| Item 6: | Schedule of Investments. |
The schedule of investments is included as part of the report to shareholders filed under Item 1 of this Form.
| Item 7: | Disclosure of Proxy Voting Policies and Procedures forClosed-End Management Investment Companies. |
Not applicable toopen-end investment companies.
| Item 8: | Portfolio Managers ofClosed-End Management Investments Companies. |
Not applicable toopen-end investment companies.
| Item 9: | Purchases of Equity Securities byClosed-End Management Investment Company and Affiliated Purchasers. |
Not applicable toopen-end investment companies.
| Item 10. | Submission of Matters to a vote of Security Holders. |
There have been no material changes to the procedures by which shareholders may recommend nominees to the registrant’s board of directors.
| Item 11: | Controls and Procedures. |
(a) Based on their evaluation of the Registrant’s Disclosure Controls and Procedures as of a date within 90 days of the Filing Date, the Registrant’s Chairman and Treasurer have determined that the Disclosure Controls and Procedures (as defined in Rule30a-2(c) under the Act) are designed to ensure that information required to be disclosed by the Registrant is recorded, processed, summarized and reported by the filing Date, and that information required to be disclosed in the report is communicated to the Registrant’s management, as appropriate, to allow timely decisions regarding required disclosure.
(b) There were no significant changes in the Registrant’s internal controls or in other factors that could significantly affect these controls subsequent to the date of their evaluation, and there were no corrective actions with regard to significant deficiencies and material weaknesses.
| Item 12: | Disclosure of Securities Lending Activities forClosed-End Management Investment Companies. |
Not applicable toopen-end investment companies.
| Item 13: | Exhibits: |
(a) The following exhibits are attached to this FormN-CSR:
| (2) | A separate certification for each principal executive and principal financial officer of the registrant as required by Rule30a-2(a) under the Act (17 CFR270.30a-2 (certification required by Section 302 of the Sarbanes-Oxley Act of 2002). |
(b) Certification required by Rule30a-2(b) under the Act (certification required by Section 906 of the Sarbanes-Oxley Act of 2002).
SIGNATURES
Pursuant to the requirements of the Securities Exchange Act of 1934 and the Investment Company Act of 1940, the registrant has duly caused this report to be signed on its behalf by the undersigned, thereunto duly authorized.
Sit Mutual Funds, Inc.
| By (Signature and Title)* | /s/ Paul E. Rasmussen | |||
| Paul E. Rasmussen | ||||
| Vice President, Treasurer | ||||
| Date August 23, 2019 | ||||
Pursuant to the requirements of the Securities Exchange Act of 1934 and the Investment Company Act of 1940, this report has been signed below by the following persons on behalf of the registrant and in the capacities and on the dates indicated.
| By (Signature and Title) | /s/ Paul E. Rasmussen | |||
| Paul E. Rasmussen | ||||
| Vice President, Treasurer | ||||
| Date August 23, 2019 | ||||
| By (Signature and Title) | /s/ Roger J. Sit | |||
| Roger J. Sit | ||||
| Chairman | ||||
| Date August 23, 2019 | ||||