UNITED STATES SECURITIES AND EXCHANGE COMMISSION
Washington, D.C. 20549
FORM N-CSR
CERTIFIED SHAREHOLDER REPORT OF REGISTERED
MANAGEMENT INVESTMENT COMPANIES
Investment Company Act file number: 811-06373
Sit Mutual Funds, Inc.
(Exact name of registrant as specified in charter)
3300 IDS Center
80 South Eighth Street
Minneapolis, MN 55402
(Address of principal executive offices)
Paul E. Rasmussen, VP Treasurer
Sit Mutual Funds, Inc.
3300 IDS Center
80 South Eighth Street
Minneapolis, MN 55402
(Name and address of agent for service)
Copy to:
Mike Radmer, Esq.
Dorsey & Whitney
Suite 1500
50 South Sixth Street
Minneapolis, MN 55402-1498
Registrant’s telephone number, including area code:
(612) 332-3223
Date of fiscal year end: June 30, 2017
Date of reporting period: June 30, 2017
| Item 1: | Reports to Stockholders |
|
Sit Mutual Funds STOCK FUNDS ANNUAL REPORT TABLE OF CONTENTS |
This document must be preceded or accompanied by a Prospectus.
CHAIRMAN’S LETTER
August 4, 2017
Dear Fellow Shareholders:
The U.S economy continues on a pace of modest expansion. Importantly, slow growth has contributed to a notable absence of “excesses” that typically precede a recession. A recent uptick in growth outside the U.S has helped propel markets higher in recent months, but we see some signs of moderation ahead.
Economic Overview
While the U.S. economy is entering its ninth year of expansion, we do not see anything over the near to intermediate term that is likely to derail the status quo of slow growth and moderate inflation. Consumer spending, which accounts for almost 70% of U.S. Gross Domestic Product (GDP), has been resilient, underpinned by steady job growth, modest wage gains, and healthy consumer balance sheets. Importantly, there have been encouraging signs that both manufacturing activity and business spending is picking up after a long slump, which was initiated by a collapse in commodity prices (particularly oil) in late 2014. To be sure, the pace of GDP growth continues to lag that of previous business cycles, but the current expansion could prove to be the longest on U.S. record, given the absence of meaningful excesses that tend to trigger a downturn. Specifically, consumers are saving more, household debt levels are lower (albeit largely mortgage-related), and their debt capacity is high due to low interest rates. Also, businesses are not overinvesting in equipment, inventories or labor. Looking ahead to 2018-19, there is clearly upside if Trump Administration pro-growth policies can gain traction. The combined impact of tax reform (including repatriation), decreased regulation, infrastructure spending and investment incentives will certainly have some positive impact on growth. It remains to be seen, however, whether fiscal constraints, political realities and self-inflicted wounds will limit that potential.
In terms of monetary policy, we anticipate that the Federal Reserve will remain data dependent/market-sensitive as it seeks to “normalize” the fed funds rate and its balance sheet concurrently. The Fed recently increased the fed funds rate by 25 basis points to a range of 100-125 basis points (its fourth increase since 2015) and outlined a plan to gradually reduce the size of the balance sheet, which has swelled over 400% to nearly $4.5 trillion since mid-2007. While investors are understandably concerned that reversing the unprecedented easing actions could have onerous market and economic consequences, we believe that policy changes will be slow and protracted. To this point, one of the more notable trends in recent months has been an unexpected downshift in inflation data, which have been fairly broad-based in nature. While there have been some transitory aspects (e.g., mobile phone prices) that are one-off in nature, we believe the absence of material inflation pressures effectively gives the Fed “cover” to move slowly in normalizing monetary policy.
Outside the U.S., growth has firmed over the past several months. European economic data have surprised on the upside, with measures of business activity and consumer confidence at cycle highs. However, we do not expect further acceleration from here, considering momentum seems to be waning, as the combined impacts of a stronger euro, slower exports (particularly to China), and political uncertainties (i.e., Brexit, 2018 Italian elections) begin to weigh on sentiment and growth comparisons become more difficult. Similarly, we believe growth in China peaked during the first quarter of 2017, and tightening measures will begin to take a toll on industrial and consumption growth and, in particular, frothy property markets. There remains a risk of “disorderly” deleveraging in China, due to an unprecedented buildup in bank loans and corporate debt. Finally, while the Japanese economy continues to expand modestly, structural challenges (e.g., aging population) continue to outweigh pro-growth monetary and government policies.
Equity Strategy
Global equity markets have surged ahead over the past twelve months, with the majority of gains occurring since the U.S. elections last fall. While the prospect of pro-growth U.S. policies were initial catalysts, the rebound in global corporate earnings against a backdrop of low volatility has been key to more recent gains.
With U.S. market valuations hovering at high levels, the rebound in corporate earnings has been welcome news to investors. The broad improvement has been driven by a weaker U.S. dollar, easier comparisons in the beleaguered energy sector, improved capital spending (helping manufacturing and technology, in particular), and higher bank earnings (aided by higher interest rates). Importantly, however, much of this profit improvement has been driven by easier comparisons after a two-year slump, and earnings ahead will likely begin to correlate more closely with moderate nominal GDP growth trends, particularly later this year and into 2018.
One notable characteristic within financial markets has been the remarkably low levels of volatility that have prevailed across geographies and asset classes. We view this as a sign of investor complacency against a backdrop of some notable uncertainties that lie ahead. Prominent causes of this “low vol” environment include investor “faith” in central banks providing a constant backstop if economic flare-ups occur, along with a notable lack of economic volatility that has persisted amidst the slow growth global backdrop. We note, however, that many factors could change to alter this low volatility regime. Most notably, central banks around the world have taken on a more hawkish tone, particularly in terms of balance sheet reduction. In addition, there are ever-present risks around geopolitics (e.g., North Korea, Russia), a massive buildup in global
| | |
| 2 | | SIT MUTUAL FUNDS ANNUAL REPORT |
debt (particularly in China), and emerging risks in Europe, as previously discussed.
Taking all of these factors into consideration, we believe quality, diversification, and differentiated growth are central to portfolio construction. Within U.S. portfolios, we believe a “barbell” strategy offers the most favorable risk/reward for investors. This entails a mix of holdings that are pro-cyclical and potential policy beneficiaries, including banks, technology firms, and transports as well as holdings that are more defensive in nature, such as healthcare, defense, and telecom. We believe fundamentals for the technology sector are especially attractive, as both secular (e-commerce, cloud-based computing) and cyclical (improving capex environment) drivers are contributing to exceptional earnings growth for many companies.
Outside the U.S., we generally remain constructive on European equities over the near term, given the uptick in economic growth and their attractive valuations. We are cognizant of previously-noted risks ahead, however, and have also employed a “barbell” strategy in this region, similar to our U.S. strategy. We continue to meaningfully underweight Japanese equities, due to the country’s lackluster growth outlook. While the valuations of Chinese stocks are generally attractive on a relative basis, we favor secular growers (e.g., the Internet sector) relative to cyclical firms, given the potential for a slowdown in economic growth against a backdrop of high debt levels and tightening monetary policy. Among other emerging markets, we see attractive risk/reward opportunities in India and South Korea, largely based on modest valuations relative to growth trends.
Regardless of region or sector, our research emphasis remains focused on building a diversified portfolio of quality companies that compound earnings and grow dividends on a consistent basis. We strongly believe this will reward investors over the longer term.
With best wishes,
Roger J. Sit
Chairman, President, CEO and Global CIO
OBJECTIVE & STRATEGY
The dual objectives of the Sit Balanced Fund are to seek long-term growth of capital consistent with the preservation of principal and to provide regular income. It pursues its objectives by investing in a diversified portfolio of stocks and bonds. The Fund may emphasize either equity securities or fixed-income securities, or hold equal amounts of each, dependent upon the Adviser’s analysis of market, financial and economic conditions.
The Fund’s permissible investment allocation is: 35-65% in equity securities and 35-65% in fixed-income securities. At all times at least 25% of the fixed-income assets will be invested in fixed-income senior securities.
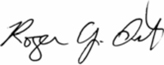
The Sit Balanced Fund’s twelve-month return was +12.56%. The S&P 500® Index return was +17.89% over the period, while the Bloomberg Barclays U.S. Aggregate Bond Index lost -0.31%.
Stocks and bonds performed very differently over the past twelve months, reflecting the prospect for potential pro-growth government policies, an uptick in economic growth trends (particularly outside the U.S.), and a less-accommodative Federal Reserve. In terms of equities, we expect returns to moderate and volatility to increase from exceptionally low levels, given high valuations that are unlikely to expand further due to expectations for somewhat higher interest rates. We believe quality, diversification, and differentiated growth are central to portfolio construction. Within the equity portion of the Fund, we believe a “barbell” strategy offers the most favorable risk/reward for investors. This includes a mix of holdings that are pro-cyclical and potential policy beneficiaries, including banks, technology firms, and transports. This is balanced against holdings that are more defensive in nature, such as healthcare, defense, and telecom. Regarding performance, the Fund’s equities outperformed the S&P 500® Index over the past twelve months primarily due to strong returns generated from the technology services and electronic technology sectors.
Most bonds posted negative returns during the period, with longer-duration investments losing the most despite the flatter yield curve. Looking ahead, we expect the recently-communicated reduction in the size of the Federal Reserve’s balance sheet to continue to push interest rates higher over the next 12 to 18 months. The unwinding process, despite being communicated in advance, is expected to add to volatility and a greater range of interest rates in the coming months. Regarding performance, the fixed income portion of the Fund generated a return of +1.5%, compared to -0.3% for the Bloomberg Barclays U.S. Aggregate Bond Index. The meaningful income advantage relative to the benchmark continues to be the primary driver of returns. The portfolio also benefited from a shorter duration than the benchmark, as interest rates rose. Outperformance within the corporate
HYPOTHETICAL GROWTH OF $10,000
The chart above illustrates the total value of a hypothetical $10,000 investment in the Fund over the past 10 years as compared to the performance of the S&P 500® Index and the Bloomberg Barclays Aggregate Bond Index. Past performance does not guarantee future results. Returns include the reinvestment of distributions. The chart does not reflect the deduction of taxes that a shareholder would pay on Fund distributions or the redemption of Fund shares.
1 S&P 500® Index is an unmanaged capitalization-weighted index that measures the performance of 500 widely held common stocks of large-cap companies. It is not possible to invest directly in an index. This is the primary index for the equity portion of the Fund.
2 Bloomberg Barclays Aggregate Bond Index is an unmanaged market value- weighted index which measures the performance of investment grade debt securities with maturities of at least one year. This is the primary index for the fixed income portion of the Fund.
sector added to relative performance as did a significant underweight in the U.S. Treasury sector, as Treasuries were one of the weakest-performing sectors during the period.
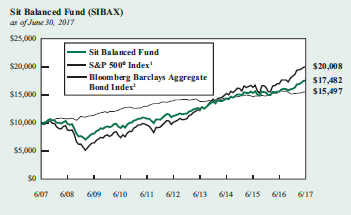
As of June 30th, the asset allocation of the Fund was 62% equities, 36% fixed income, and 2% cash and equivalents.
Roger J. Sit
Bryce A. Doty
Portfolio Managers
| | |
Information on this page is unaudited. | | |
| 4 | | SIT MUTUAL FUNDS ANNUAL REPORT |
COMPARATIVE RATES OF RETURNS
as of June 30, 2017
| | | | | | | | | | | | |
| | | Sit
Balanced
Fund | | | S&P 500®
Index 1 | | | Bloomberg
Barclays
Aggregate
Bond
Index 2 | |
One Year | | | 12.56 | % | | | 17.89 | % | | | -0.31 | % |
Five Year | | | 9.24 | | | | 14.63 | | | | 2.21 | |
Ten Year | | | 5.75 | | | | 7.18 | | | | 4.48 | |
Since Inception | | | 6.95 | | | | 9.38 | | | | 5.36 | |
Performance figures are historical and do not guarantee future results. Investment returns and principal value will vary, and you may have a gain or loss when you sell shares. Current performance may be lower or higher than the performance data quoted. Contact the Fund for performance data current to the most recent month-end. Returns include changes in share price as well as reinvestment of all dividends and capital gains. Returns do not reflect the deduction of taxes that a shareholder would pay on Fund distributions or the redemption of Fund shares. Management fees and administrative expenses are included in the Fund’s performance. Returns for periods greater than one year are compounded average annual rates of return.
1 S&P 500® Index is an unmanaged capitalization-weighted index that measures the performance of 500 widely held common stocks of large-cap companies. It is not possible to invest directly in an index.
2 Bloomberg Barclays Aggregate Bond Index is an unmanaged market value-weighted index which measures the performance of investment grade debt securities with maturities of at least one year.
PORTFOLIO SUMMARY
| | |
Net Asset Value 6/30/17: | | $22.71 Per Share |
Net Asset Value 6/30/16: | | $20.40 Per Share |
Total Net Assets: | | $25.2 Million |
TOP HOLDINGS
Top Equity Holdings:
1. Apple, Inc.
2. Alphabet, Inc.
3. Visa, Inc.
4. Microsoft Corp.
5. Broadcom, Ltd.
Top Fixed Income Holdings:
1. BlackRock Income Trust
2. MFS Intermediate Income Trust
3. FHLMC, 5.00%, 10/1/2043
4. BlackRock Enhanced Government Fund
5. FNMA, 5.50%, 10/1/2033
Based on total net assets as of June 30, 2017. Subject to change.
FUND DIVERSIFICATION
Based on total net assets as of June 30, 2017. Subject to change.
| | |
Information on this page is unaudited. | | |
JUNE 30, 2017 | | 5 |
SCHEDULE OF INVESTMENTS
June 30, 2017
Sit Balanced Fund
| | | | | | |
Quantity | | Name of Issuer | | Fair Value ($) | |
| |
Common Stocks - 62.4% | | | | |
Commercial Services - 0.7% | | | | |
1,225 | | Equifax, Inc. | | | 168,340 | |
| | | | | | |
Communications - 1.1% | | | | |
650 | | SBA Communications Corp. * | | | 87,685 | |
4,150 | | Verizon Communications, Inc. | | | 185,339 | |
| | | | | | |
| | | | | 273,024 | |
| | | | | | |
Consumer Durables - 1.1% | | | | |
1,450 | | Electronic Arts, Inc. * | | | 153,294 | |
1,400 | | Genuine Parts Co. | | | 129,864 | |
| | | | | | |
| | | | | 283,158 | |
| | | | | | |
Consumer Non-Durables - 4.1% | | | | |
2,625 | | Estee Lauder Cos., Inc. - Class A | | | 251,948 | |
2,925 | | NIKE, Inc. | | | 172,575 | |
2,700 | | PepsiCo, Inc. | | | 311,823 | |
1,150 | | Philip Morris International, Inc. | | | 135,068 | |
1,800 | | Procter & Gamble Co. | | | 156,870 | |
| | | | | | |
| | | | | 1,028,284 | |
| | | | | | |
Consumer Services - 5.3% | | | | |
2,450 | | CBS Corp. | | | 156,261 | |
1,900 | | Marriott International, Inc. | | | 190,589 | |
5,350 | | Starbucks Corp. | | | 311,958 | |
5,650 | | Visa, Inc. | | | 529,857 | |
1,400 | | Walt Disney Co. | | | 148,750 | |
| | | | | | |
| | | | | 1,337,415 | |
| | | | | | |
Electronic Technology - 7.2% | | | | |
4,350 | | Apple, Inc. | | | 626,487 | |
8,400 | | Applied Materials, Inc. | | | 347,004 | |
1,875 | | Broadcom, Ltd. | | | 436,969 | |
4,000 | | Ciena Corp. * | | | 100,080 | |
4,450 | | Intel Corp. | | | 150,143 | |
325 | | NVIDIA Corp. | | | 46,982 | |
1,025 | | Skyworks Solutions, Inc. | | | 98,349 | |
| | | | | | |
| | | | | 1,806,014 | |
| | | | | | |
Energy Minerals - 2.2% | | | | |
650 | | Chevron Corp. | | | 67,814 | |
2,250 | | Continental Resources, Inc. * | | | 72,742 | |
850 | | EOG Resources, Inc. | | | 76,942 | |
3,800 | | Marathon Petroleum Corp. | | | 198,854 | |
2,375 | | Occidental Petroleum Corp. | | | 142,191 | |
| | | | | | |
| | | | | 558,543 | |
| | | | | | |
Finance - 6.8% | | | | |
850 | | Ameriprise Financial, Inc. | | | 108,197 | |
1,250 | | Chubb, Ltd. | | | 181,725 | |
1,175 | | Goldman Sachs Group, Inc. | | | 260,732 | |
3,250 | | Invesco, Ltd. | | | 114,368 | |
4,575 | | JPMorgan Chase & Co. | | | 418,155 | |
4,500 | | KeyCorp | | | 84,330 | |
| | | | | | |
Quantity | | Name of Issuer | | Fair Value ($) | |
| | |
1,600 | | Marsh & McLennan Cos., Inc. | | | 124,736 | |
1,050 | | T Rowe Price Group, Inc. | | | 77,920 | |
3,150 | | US Bancorp | | | 163,548 | |
3,100 | | Wells Fargo & Co. | | | 171,771 | |
| | | | | | |
| | | | | 1,705,482 | |
| | | | | | |
Health Services - 2.2% | | | | |
2,000 | | Centene Corp. * | | | 159,760 | |
550 | | Humana, Inc. | | | 132,341 | |
1,400 | | UnitedHealth Group, Inc. | | | 259,588 | |
| | | | | | |
| | | | | 551,689 | |
| | | | | | |
Health Technology - 6.7% | | | | |
2,550 | | AbbVie, Inc. | | | 184,901 | |
550 | | Alexion Pharmaceuticals, Inc. * | | | 66,919 | |
625 | | Allergan, PLC | | | 151,931 | |
1,450 | | Boston Scientific Corp. * | | | 40,194 | |
1,200 | | Celgene Corp. * | | | 155,844 | |
1,000 | | Gilead Sciences, Inc. | | | 70,780 | |
1,350 | | Incyte Corp. * | | | 169,978 | |
2,100 | | Johnson & Johnson | | | 277,809 | |
1,725 | | Medtronic, PLC | | | 153,094 | |
4,000 | | Pfizer, Inc. | | | 134,360 | |
1,000 | | Thermo Fisher Scientific, Inc. | | | 174,470 | |
925 | | Zimmer Biomet Holdings, Inc. | | | 118,770 | |
| | | | | | |
| | | | | 1,699,050 | |
| | | | | | |
Process Industries - 2.0% | | | | |
1,850 | | Dow Chemical Co. | | | 116,680 | |
2,225 | | Ecolab, Inc. | | | 295,369 | |
300 | | Sherwin-Williams Co. | | | 105,288 | |
| | | | | | |
| | | | | 517,337 | |
| | | | | | |
Producer Manufacturing - 4.4% | | | | |
825 | | 3M Co. | | | 171,757 | |
1,850 | | Honeywell International, Inc. | | | 246,586 | |
1,500 | | Ingersoll-Rand, PLC | | | 137,085 | |
1,800 | | Raytheon Co. | | | 290,664 | |
600 | | Rockwell Automation, Inc. | | | 97,176 | |
1,400 | | United Technologies Corp. | | | 170,954 | |
| | | | | | |
| | | | | 1,114,222 | |
| | | | | | |
Retail Trade - 3.0% | | | | |
210 | | Amazon.com, Inc. * | | | 203,280 | |
1,975 | | Home Depot, Inc. | | | 302,965 | |
1,850 | | TJX Cos., Inc. | | | 133,514 | |
390 | | Ulta Beauty, Inc. * | | | 112,063 | |
| | | | | | |
| | | | | 751,822 | |
| | | | | | |
Technology Services - 12.2% | | | | |
1,400 | | Accenture, PLC | | | 173,152 | |
3,075 | | Adobe Systems, Inc. * | | | 434,928 | |
400 | | Alphabet, Inc. - Class A * | | | 371,872 | |
255 | | Alphabet, Inc. - Class C * | | | 231,726 | |
| | |
See accompanying notes to financial statements. | | |
| 6 | | SIT MUTUAL FUNDS ANNUAL REPORT |
| | | | | | |
Quantity
/Principal
Amount ($) | | Name of Issuer | | Fair Value ($) | |
| | |
850 | | ANSYS, Inc. * | | | 103,428 | |
2,725 | | Cognizant Technology Solutions Corp. | | | 180,940 | |
2,875 | | Facebook, Inc. * | | | 434,068 | |
7,575 | | Microsoft Corp. | | | 522,145 | |
2,750 | | Oracle Corp. | | | 137,885 | |
2,750 | | PayPal Holdings, Inc. * | | | 147,592 | |
145 | | priceline.com, Inc. * | | | 271,225 | |
800 | | salesforce.com, Inc. * | | | 69,280 | |
| | | | | | |
| | | | | 3,078,241 | |
| | | | | | |
Transportation - 2.9% | | | | |
5,025 | | Delta Air Lines, Inc. | | | 270,044 | |
925 | | FedEx Corp. | | | 201,030 | |
1,450 | | Union Pacific Corp. | | | 157,920 | |
900 | | United Parcel Service, Inc. | | | 99,531 | |
| | | | | | |
| | | | | 728,525 | |
| | | | | | |
Utilities - 0.5% | | | | |
975 | | NextEra Energy, Inc. | | | 136,627 | |
| | | | | | |
Total Common Stocks
(cost: $10,502,692) | | | 15,737,773 | |
| | | | | | |
Bonds - 33.2% | | | | |
Asset-Backed Securities - 1.0% | | | | |
95,086 | | Bayview Opportunity Master Fund,
2017-SPL1 A, 4.00%, 10/28/64 1, 4 | | | 99,308 | |
2,313 | | Citifinancial Mortgage Securities, Inc.,
2004-1 AF3, 4.27%, 4/25/34 14 | | | 2,314 | |
1,672 | | Conseco Financial Corp.,
1997-7 A6, 6.76%, 7/15/28 | | | 1,677 | |
74,989 | | Credit Suisse First Boston Mortgage Corp.,
2005-AGE1 M3, 1.87%, 2/25/32 1 | | | 74,253 | |
25,000 | | Hertz Vehicle Financing, LLC, Series
2016-3A, Class A, 2.27%, 7/25/20 4 | | | 24,793 | |
10,105 | | HouseHold Home Equity Loan Trust,
2007-2 A4, 1.31%, 7/20/36 1 | | | 10,097 | |
5,671 | | Irwin Home Equity Corp.,
2005-1 M1, 5.92%, 6/25/35 14 | | | 5,723 | |
16,000 | | New Century Home Equity Loan Trust,
2005-A A4W, 4.57%, 8/25/35 14 | | | 16,640 | |
29,086 | | Park Place Securities, Inc.,
2005-WHQ3 M2, 1.89%, 6/25/35 1 | | | 29,079 | |
3,204 | | Residential Funding Mortgage Securities II, Inc., 2003-HI2 A6, 5.26%, 7/25/28 14 | | | 3,209 | |
| | | | | | |
| | | | | 267,093 | |
| | | | | | |
Collateralized Mortgage Obligations - 5.6% | | | | |
| | Fannie Mae: | | | | |
42,476 | | 2004-T1 1A1, 6.00%, 1/25/44 | | | 48,113 | �� |
24,963 | | 1999-17 C, 6.35%, 4/25/29 | | | 27,462 | |
33,411 | | 2001-82 ZA, 6.50%, 1/25/32 | | | 37,461 | |
90,633 | | 2009-30 AG, 6.50%, 5/25/39 | | | 100,464 | |
4,922 | | 2013-28 WD, 6.50%, 5/25/42 | | | 5,567 | |
| | | | | | |
Principal
Amount ($) | | Name of Issuer | | Fair Value ($) | |
| | |
27,035 | | 2004-W9 2A1, 6.50%, 2/25/44 | | | 31,113 | |
70,248 | | 2015-88 CJ, 6.50%, 7/25/44 | | | 79,918 | |
3,829 | | 2010-108 AP, 7.00%, 9/25/40 | | | 4,311 | |
11,348 | | 2004-T3, 1A3, 7.00%, 2/25/44 | | | 13,292 | |
| | Freddie Mac: | | | | |
37,294 | | K014 1A, 2.79%, 10/25/20 | | | 37,802 | |
30,788 | | 4293 BA, 5.34%, 10/15/47 1 | | | 32,745 | |
35,236 | | 2102 Z, 6.00%, 12/15/28 | | | 39,277 | |
37,180 | | 2122 ZE, 6.00%, 2/15/29 | | | 39,905 | |
61,868 | | 2480 Z, 6.00%, 8/15/32 | | | 70,848 | |
43,671 | | 2980 QA, 6.00%, 5/15/35 | | | 49,664 | |
18,507 | | 2283 K, 6.50%, 12/15/23 | | | 20,077 | |
33,013 | | 2357 ZJ, 6.50%, 9/15/31 | | | 36,784 | |
31,738 | | T-59 1A1, 6.50%, 10/25/43 | | | 37,461 | |
65,574 | | 4520 HM, 6.50%, 8/15/45 | | | 78,389 | |
85,452 | | 1142 IA, 7.00%, 10/15/21 | | | 91,722 | |
7,539 | | 3946 KW, 7.00%, 11/15/29 | | | 7,983 | |
34,134 | | 3704 CT, 7.00%, 12/15/36 | | | 39,838 | |
26,416 | | 2238 PZ, 7.50%, 6/15/30 | | | 31,015 | |
| | Government National Mortgage Association: | |
54,837 | | 2015-80 BA, 6.98%, 6/20/45 1 | | | 63,489 | |
54,289 | | 2014-69 W, 7.26%, 11/20/34 1 | | | 62,798 | |
47,876 | | 2013-133 KQ, 7.30%, 8/20/38 1 | | | 56,329 | |
30,081 | | 2005-74 HA, 7.50%, 9/16/35 | | | 33,372 | |
47,959 | | New Residential Mortgage Loan Trust, | | | | |
| | 2016-2A B3, 5.69%, 11/26/35 1, 4 | | | 51,847 | |
| | Sequoia Mortgage Trust: | | | | |
28,867 | | 2013-3 A2, 2.50%, 3/25/43 1 | | | 27,872 | |
14,948 | | 2012-4 A2, 3.00%, 9/25/42 1 | | | 14,829 | |
79,346 | | 2012-1 B1, 4.24%, 1/25/42 1 | | | 81,879 | |
| | Vendee Mortgage Trust: | | | | |
24,555 | | 2008-1 B, 7.24%, 3/15/25 1 | | | 28,575 | |
20,316 | | 1994-2 2, 8.64%, 5/15/24 1 | | | 21,814 | |
| | | | | | |
| | | | | 1,404,015 | |
| | | | | | |
Corporate Bonds - 16.7% | | | | |
50,000 | | Adobe Systems, Inc., 3.25%, 2/1/25 | | | 51,105 | |
25,000 | | Aetna, Inc., 2.80%, 6/15/23 | | | 24,957 | |
25,000 | | Affiliated Managers Group, Inc., 4.25%, 2/15/24 | | | 26,168 | |
50,000 | | Alphabet, Inc., 3.63%, 5/19/21 | | | 52,930 | |
| | Ameriprise Financial, Inc.: | | | | |
50,000 | | 3.70%, 10/15/24 | | | 52,224 | |
50,000 | | 5.30%, 3/15/20 | | | 54,066 | |
50,000 | | Anheuser-Busch InBev Finance, Inc., 4.90%, 2/1/46 | | | 56,432 | |
25,000 | | Apollo Management Holdings LP, 4.40%, 5/27/26 4 | | | 25,921 | |
25,000 | | Apple, Inc., 3.00%, 6/20/27 | | | 24,874 | |
25,000 | | Aspen Insurance Holdings, Ltd., 4.65%, 11/15/23 | | | 26,661 | |
50,000 | | Athene Global Funding, 4.00%, 1/25/22 4 | | | 51,937 | |
50,000 | | Autodesk, Inc., 3.50%, 6/15/27 | | | 49,169 | |
25,000 | | AutoZone, Inc., 3.75%, 6/1/27 | | | 25,007 | |
| | | | |
See accompanying notes to financial statements. | | | | |
JUNE 30, 2017 | | | 7 | |
SCHEDULE OF INVESTMENTS
June 30, 2017
Sit Balanced Fund (Continued)
| | | | | | |
Principal
Amount ($) | | Name of Issuer | | Fair Value ($) | |
| | |
50,000 | | Bank One Corp. (Subordinated), 7.63%, 10/15/26 | | | 64,317 | |
25,000 | | Bank One Michigan (Subordinated), 8.25%, 11/1/24 | | | 32,001 | |
50,000 | | Berkshire Hathaway, Inc., 3.13%, 3/15/26 | | | 50,562 | |
| | BlackRock, Inc.: | | | | |
50,000 | | 3.20%, 3/15/27 | | | 50,608 | |
25,000 | | 3.50%, 3/18/24 | | | 26,283 | |
| | Burlington Northern Santa Fe, LLC: | | | | |
50,000 | | 7.00%, 12/15/25 | | | 63,988 | |
25,000 | | 7.08%, 5/13/29 | | | 32,931 | |
25,000 | | Charles Schwab Corp., 3.20%, 3/2/27 | | | 25,117 | |
50,000 | | Chubb INA Holdings, Inc., 8.88%, 8/15/29 | | | 73,354 | |
100,000 | | Citigroup, Inc. (Subordinated), 5.30%, 5/6/44 | | | 113,158 | |
25,000 | | Coca-Cola Co., 2.50%, 4/1/23 | | | 25,058 | |
25,000 | | Comcast Corp., 2.75%, 3/1/23 | | | 25,244 | |
50,000 | | ConocoPhillips Co., 4.95%, 3/15/26 | | | 55,686 | |
33,976 | | Continental Airlines 2000-1 Class A-1 Trust, 8.05%, 11/1/20 | | | 37,543 | |
20,078 | | Continental Airlines 2012-1 Class A Trust, 4.15%, 4/11/24 | | | 21,082 | |
25,000 | | Cox Enterprises, Inc., 7.38%, 7/15/27 4 | | | 30,689 | |
37,711 | | Delta Air Lines 2007-1 Class A Trust, 6.82%, 8/10/22 | | | 43,273 | |
46,818 | | Delta Air Lines 2015-1 Class AA Trust, 3.63%, 7/30/27 | | | 48,223 | |
50,765 | | Doric Nimrod Air Alpha 2012-1 Class A Trust, 5.13%, 11/30/22 4 | | | 52,686 | |
47,488 | | Doric Nimrod Air Alpha 2013-1 Trust, 5.25%, 5/30/23 4 | | | 49,387 | |
25,000 | | Exxon Mobil Corp., 4.11%, 3/1/46 | | | 26,373 | |
50,000 | | GE Capital Intl. Funding, 4.42%, 11/15/35 | | | 54,419 | |
25,000 | | Gilead Sciences, Inc., 2.50%, 9/1/23 | | | 24,630 | |
83,423 | | Hawaiian Airlines 2013-1 Class A, 3.90%, 1/15/26 | | | 85,300 | |
25,000 | | Heineken NV, 3.50%, 1/29/28 4 | | | 25,371 | |
75,000 | | Home Depot, Inc., 5.95%, 4/1/41 | | | 99,162 | |
25,000 | | Horace Mann Educators Corp., 4.50%, 12/1/25 | | | 25,729 | |
100,000 | | IBM Corp., 3.63%, 2/12/24 | | | 104,527 | |
47,000 | | Ingersoll-Rand Co., 7.20%, 6/1/25 | | | 53,217 | |
100,000 | | Intel Corp., 3.70%, 7/29/25 | | | 104,984 | |
| | Invesco Finance, PLC: | | | | |
25,000 | | 3.13%, 11/30/22 | | | 25,473 | |
50,000 | | 4.00%, 1/30/24 | | | 53,036 | |
25,000 | | ITT, LLC, 7.40%, 11/15/25 | | | 31,691 | |
25,000 | | Jackson National Life, 3.05%, 4/29/26 4 | | | 24,538 | |
50,000 | | Janus Capital Group, Inc., 4.88%, 8/1/25 | | | 53,738 | |
50,000 | | JPMorgan Chase & Co., 2.95%, 10/1/26 | | | 48,255 | |
50,000 | | KKR Group Finance Co., 6.38%,
9/29/20 4 | | | 56,179 | |
75,000 | | Manufacturers & Traders Trust Co. (Subordinated), 1.84%, 12/1/21 1 | | | 73,969 | |
25,000 | | McDonald’s Corp., 3.50%, 3/1/27 | | | 25,412 | |
| | | | | | |
Principal Amount ($) | | Name of Issuer | | Fair Value ($) | |
| | |
25,000 | | MidAmerican Energy Co., 3.95%, 8/1/47 | | | 25,709 | |
50,000 | | Monsanto Co., 2.20%, 7/15/22 | | | 48,275 | |
| | MUFG Americas Holdings Corp.: | | | | |
50,000 | | 3.00%, 2/10/25 | | | 49,161 | |
50,000 | | 3.50%, 6/18/22 | | | 51,505 | |
25,000 | | National Rural Utilities Cooperative Finance Corp., 8.00%, 3/1/32 | | | 36,632 | |
50,000 | | NIKE, Inc., 2.38%, 11/1/26 | | | 47,433 | |
25,000 | | Nordstrom, Inc., 4.00%, 3/15/27 | | | 24,464 | |
25,000 | | Pfizer, Inc., 5.80%, 8/12/23 | | | 29,373 | |
25,000 | | Polar Tankers, Inc., 5.95%, 5/10/37 4 | | | 29,716 | |
75,000 | | Precision Castparts Corp., 2.50%, 1/15/23 | | | 74,802 | |
50,000 | | ProAssurance Corp., 5.30%, 11/15/23 | | | 54,903 | |
25,000 | | Raytheon Co., 4.88%, 10/15/40 | | | 29,170 | |
50,000 | | Reinsurance Group of America, 4.70%, 9/15/23 | | | 54,247 | |
50,000 | | Rockwell Collins, Inc., 3.70%, 12/15/23 | | | 52,037 | |
50,000 | | Ross Stores, Inc., 3.38%, 9/15/24 | | | 50,852 | |
50,000 | | Sammons Financial Group, 4.45%, 5/12/27 4 | | | 50,898 | |
50,000 | | Santander Holdings USA, 3.70%, 3/28/22 4 | | | 50,646 | |
75,000 | | Security Benefit Life Insurance Co. (Subordinated), 7.45%, 10/1/33 4 | | | 86,507 | |
50,000 | | Sierra Pacific Power Co., 3.38%, 8/15/23 | | | 51,361 | |
60,435 | | Spirit Airlines 2015-1A Trust, 4.10%, 4/1/28 | | | 62,852 | |
41,320 | | Spirit Airlines 2015-1B Trust, 4.45%, 4/1/24 | | | 42,403 | |
25,000 | | StanCorp Financial Group, Inc., 5.00%, 8/15/22 | | | 27,009 | |
75,000 | | Symetra Financial Corp., 4.25%, 7/15/24 | | | 76,123 | |
50,000 | | Target Corp., 3.50%, 7/1/24 | | | 51,789 | |
25,000 | | TD Ameritrade Holding Corp., 3.30%, 4/1/27 | | | 24,969 | |
50,000 | | TJX Cos, Inc., 2.25%, 9/15/26 | | | 46,425 | |
25,000 | | UnitedHealth Group, Inc., 3.38%, 4/15/27 | | | 25,545 | |
36,680 | | US Airways 2001-1C Trust (Subordinated), 7.35%, 3/20/22 | | | 40,256 | |
100,000 | | US Bancorp, 3.15%, 4/27/27 | | | 100,167 | |
2,000 | | Verizon Communications, 5.90%, 2/15/54 | | | 53,840 | |
100,000 | | Voya Financial, Inc., 5.70%, 7/15/43 | | | 116,372 | |
50,000 | | Wells Fargo & Co., 3.00%, 10/23/26 | | | 48,688 | |
75,000 | | Westar Energy, Inc., 3.25%, 12/1/25 | | | 75,377 | |
50,000 | | WPP Finance 2010, 3.63%, 9/7/22 | | | 51,897 | |
25,000 | | Wyeth, LLC, 5.95%, 4/1/37 | | | 32,318 | |
| | | | | | |
| | | | | 4,212,365 | |
| | | | | | |
| | | | | | |
Federal Home Loan Mortgage Corporation - 1.2% | | | | |
145,670 | | 5.00%, 10/1/43 | | | 162,104 | |
5,490 | | 6.00%, 10/1/21 | | | 5,728 | |
49,733 | | 6.50%, 2/1/22 | | | 52,918 | |
35,586 | | 7.50%, 7/1/29 | | | 41,245 | |
12,008 | | 7.50%, 11/1/36 | | | 14,514 | |
22,458 | | 8.00%, 2/1/34 | | | 26,761 | |
2,339 | | 8.38%, 5/17/20 | | | 2,398 | |
| | | | | | |
| | | | | 305,668 | |
| | | | | | |
| | |
See accompanying notes to financial statements. | | |
| 8 | | SIT MUTUAL FUNDS ANNUAL REPORT |
| | | | | | | | | | | | | | |
Principal
Amount ($) | | Name of Issuer | | | | | | | Fair Value ($) | |
| |
Federal National Mortgage Association - 2.7% | | | | |
32,406 | | 5.00%, | | | 2/1/33 | | | | | | | | 33,465 | |
112,541 | | 5.50%, | | | 10/1/33 | | | | | | | | 125,723 | |
82,058 | | 6.00%, | | | 2/1/38 | | | | | | | | 94,471 | |
47,738 | | 6.12%, | | | 11/1/43 | | | | | | | | 53,783 | |
55,311 | | 6.50%, | | | 9/1/27 | | | | | | | | 61,177 | |
12,191 | | 7.00%, | | | 1/1/32 | | | | | | | | 12,957 | |
44,309 | | 7.00%, | | | 3/1/33 | | | | | | | | 51,014 | |
88,491 | | 7.00%, | | | 12/1/38 | | | | | | | | 101,303 | |
25,063 | | 8.00%, | | | 6/1/24 | | | | | | | | 27,638 | |
34,863 | | 8.00%, | | | 1/1/31 | | | | | | | | 37,213 | |
27,630 | | 8.00%, | | | 2/1/31 | | | | | | | | 34,036 | |
5,462 | | 8.47%, | | | 7/15/26 | | | | | | | | 6,082 | |
35,287 | | 8.50%, | | | 10/1/30 | | | | | | | | 41,337 | |
| | | | | | | | | | | | | | |
| | | | | | | | | | | | | 680,199 | |
| | | | | | | | | | | | | | |
Government National Mortgage Association - 2.2% | | | | |
67,696 | | 5.75%, | | | 12/15/22 | | | | | | | | 72,926 | |
61,158 | | 6.00%, | | | 4/15/29 | | | | | | | | 69,450 | |
91,278 | | 6.00%, | | | 7/15/38 | | | | | | | | 102,900 | |
42,462 | | 6.50%, | | | 11/20/38 | | | | | | | | 49,350 | |
15,776 | | 7.00%, | | | 12/15/24 | | | | | | | | 17,033 | |
21,814 | | 7.00%, | | | 11/20/27 | | | | | | | | 25,433 | |
54,779 | | 7.00%, | | | 9/20/29 | | | | | | | | 63,669 | |
20,903 | | 7.00%, | | | 9/20/38 | | | | | | | | 24,326 | |
50,822 | | 7.50%, | | | 4/20/32 | | | | | | | | 58,234 | |
19,509 | | 8.00%, | | | 7/15/24 | | | | | | | | 21,157 | |
63,327 | | 8.38%, | | | 3/15/31 | | | | | | | | 65,467 | |
| | | | | | | | | | | | | | |
| | | | | | | | | | | | | 569,945 | |
| | | | | | | | | | | | | | |
Taxable Municipal Securities - 3.1% | | | | |
50,000 | | Alaska Muni Bond Bank Auth., 5.99%, 9/1/25 | | | 53,623 | |
75,000 | | City of Tooele City UT, 2.32%, 12/1/24 | | | 72,125 | |
45,000 | | Kentucky Housing Corp., 3.50%, 1/1/40 | | | 45,771 | |
50,000 | | Los Angeles Comm. Red. Agy., 8.00%, 9/1/38 | | | 63,183 | |
35,622 | | Louisiana Housing Corp., 3.05%, 12/1/38 | | | 35,476 | |
50,000 | | Macomb Interceptor Drain Drainage District, 5.50%, 5/1/30 | | | 50,127 | |
35,000 | | Massachusetts Edu. Fin. Auth., 4.00%, 1/1/32 | | | 36,095 | |
54,000 | | Multistate Liquidating Trust No. 1, 3.11%, 12/15/28 4, 17 | | | 51,671 | |
100,000 | | Oklahoma Dev. Fin. Auth., 4.10%, 6/1/37 | | | 100,630 | |
50,000 | | Soledad Redevelopment Agency, 6.13%, 12/1/32 | | | 51,036 | |
50,000 | | South Dakota Hsg. Dev. Auth., 3.89%, 5/1/32 | | | 51,198 | |
150,000 | | Tennessee Valley Auth., 3.67%, 1/15/30 6 | | | 99,731 | |
65,000 | | Texas St. Pub. Fin. Auth. Charter Sch. Fin., 8.75%, 8/15/27 | | | 69,332 | |
| | | | | | | | | | | | | | |
| | | | | 779,998 | |
| | | | | | | | | | | | | | |
| | | | | | | | | | | | | | |
Principal
Amount ($)/
Quantity | | Name of Issuer | | | | | | Fair Value ($) | |
| |
U.S. Treasury / Federal Agency Securities - 0.7% | | | | |
| | U.S. Treasury Strips: | | | | | | |
150,000 | | 2.45%, 11/15/27 6 | | | | | 117,590 | |
100,000 | | 3.15%, 11/15/45 6 | | | | | 43,624 | |
25,000 | | 3.19%, 5/15/44 6 | | | | | 11,481 | |
| | | | | | | | | | | | | | |
| | | | | | | 172,695 | |
| | | | | | | | | | | | | | |
Total Bonds
(cost: $8,367,094) | | | | | 8,391,978 | |
| | | | | | | | | | | | | | |
Investment Companies - 2.3% | | | | | | |
9,613 | | BlackRock Enhanced Government Fund | | | | | 127,949 | |
27,500 | | BlackRock Income Trust | | | | | 175,175 | |
8,700 | | Duff & Phelps Utility and Corporate Bond Trust | | | | | 79,953 | |
39,300 | | MFS Intermediate Income Trust | | | | | 169,776 | |
2,153 | | Nuveen Multi-Market Income Fund, Inc. | | | | | 16,148 | |
| | | | | | | | | | | | | | |
Total Investment Companies
(cost: $594,973) | | | | | 569,001 | |
| | | | | | | | | | | | | | |
| | |
Short-Term Securities - 1.8% | | | | | | |
456,926 | | Fidelity Instl. Money Mkt. Govt. Fund, 0.81% | | | | | | |
Total Short-Term Securities
(cost: $456,926) | | | | | 456,926 | |
| | | | | | | | | | | | | | |
| | |
Total Investments in Securities - 99.7%
(cost: $19,921,685) | | | | | 25,155,678 | |
Other Assets and Liabilities, net - 0.3% | | | | | 86,003 | |
| | | | | | | | | | | | | | |
| | |
Total Net Assets - 100.0% | | | | | $25,241,681 | |
| | | | | | | | | | | | | | |
| * | Non-income producing security. |
| 1 | Variable rate security. Rate disclosed is as of June 30, 2017. |
| 4 | 144A Restricted Security. The total value of such securities as of June 30, 2017 was $762,094 and represented 3.0% of net assets. These securities have been determined to be liquid by the Adviser in accordance with guidelines established by the Board of Directors. |
| 6 | Zero coupon or convertible capital appreciation bond, for which the rate disclosed is either the effective yield on purchase date or the coupon rate to be paid upon conversion to coupon paying, respectively. |
| 14 | Step Coupon: A bond that pays an initial coupon rate for the first period and then a higher coupon rate for the following periods. Rate disclosed is as of June 30, 2017. |
| 17 | Security that is either an absolute and unconditional obligation of the United States Government or is collateralized by securities, loans, or leases guaranteed by the U.S. Government or its agencies or instrumentalities. |
Numeric footnotes not disclosed are not applicable to this Schedule of Investments.
LLC — Limited Liability Company
PLC — Public Limited Company
| | | | |
See accompanying notes to financial statements. | | | | |
JUNE 30, 2017 | | | 9 | |
SCHEDULE OF INVESTMENTS
June 30, 2017
Sit Balanced Fund (Continued)
A summary of the levels for the Fund’s investments as of June 30, 2017 is as follows (see Note 2 - significant accounting policies in the notes to financial statements):
| | | | | | | | | | | | | | | | | | | | |
| | | Investment in Securities |
| | | Level 1
Quoted
Price ($) | | Level 2
Other significant
observable inputs ($) | | Level 3 Significant
unobservable inputs ($) | | Total ($) |
Common Stocks ** | | | | 15,737,773 | | | | | — | | | | | — | | | | | 15,737,773 | |
Asset-Backed Securities | | | | — | | | | | 267,093 | | | | | — | | | | | 267,093 | |
Collateralized Mortgage Obligations | | | | — | | | | | 1,404,015 | | | | | — | | | | | 1,404,015 | |
Corporate Bonds | | | | — | | | | | 4,212,365 | | | | | — | | | | | 4,212,365 | |
Federal Home Loan Mortgage Corporation | | | | — | | | | | 305,668 | | | | | — | | | | | 305,668 | |
Federal National Mortgage Association | | | | — | | | | | 680,199 | | | | | — | | | | | 680,199 | |
Government National Mortgage Association | | | | — | | | | | 569,945 | | | | | — | | | | | 569,945 | |
Taxable Municipal Securities | | | | — | | | | | 779,998 | | | | | — | | | | | 779,998 | |
U.S. Treasury / Federal Agency Securities | | | | — | | | | | 172,695 | | | | | — | | | | | 172,695 | |
Investment Companies | | | | 569,001 | | | | | — | | | | | — | | | | | 569,001 | |
Short-Term Securities | | | | 456,926 | | | | | — | | | | | — | | | | | 456,926 | |
Total: | | | | 16,763,700 | | | | | 8,391,978 | | | | | — | | | | | 25,155,678 | |
| ** | For equity securities categorized in a single level, refer to the Schedule of Investments for further breakdown. |
For the reporting period, there were no transfers between levels 1, 2 and 3.
| | |
See accompanying notes to financial statements. | | |
| 10 | | SIT MUTUAL FUNDS ANNUAL REPORT |
[This page intentionally left blank.]
|
|
| |
Sit Dividend Growth Fund - Class I and Class S |
OBJECTIVE & STRATEGY
The objective of the Sit Dividend Growth Fund is to provide current income that exceeds the dividend yield of the S&P 500® Index and that grows over a period of years. Secondarily, the Fund seeks long-term capital appreciation.
The Fund seeks to achieve its objectives by investing, under normal market conditions, at least 80% of its net assets in dividend-paying common stocks. The Fund may invest the balance of its assets in preferred stocks, convertible bonds, and U.S. Treasury securities.
The Sit Dividend Growth Fund Class I posted a +15.41% return over the last twelve months, compared to the +17.89% return for the S&P 500® Index. The Fund’s gross dividend yield (before deducting Fund expenses) was 2.48% as of 6/30/17, compared to 1.99% for the S&P 500® Index.
Against a backdrop of low market volatility, U.S. markets posted strong gains, driven by generally solid corporate fundamentals domestically and signs of a more durable synchronized expansion globally. While we continue to see a path for equities to continue to climb higher, we are equally cognizant of risks on the horizon, including higher interest rates, growth concerns in China, and a highly fragile geopolitical environment. Recognizing both the upside and downside potential in this environment, we have adopted a “barbell” strategy within the portfolio, increasing exposure to sectors (e.g., financials, transports, producer manufacturing) most levered to potential government policy change, while maintaining a high-quality bias in more defensive groups (e.g., health care, telecom), which should perform relatively well if volatility picks up from currently depressed levels. Regardless of sector, we remain focused on companies that have strong balance sheets, generate consistent growth in earnings and cash flow, and maintain a commitment to increasing dividends to shareholders over the longer term. To this point, 74 out of 79 companies held in the Fund raised their dividends over the past twelve months, with an average increase of just under 10%.
Despite solid absolute returns, the Fund’s performance trailed the S&P 500® Index over the past year. While we strive to outperform market indices under any market backdrop, there are times when the somewhat conservative nature of this strategy (e.g., underweighting technology sectors) will constrain results, particularly during periods of strong market returns. In this regard, a primary culprit was poor stock selection in the finance sector. The Fund’s more conservative positioning in dividend-paying REITs and property/casualty firms lagged the major banks, which significantly outperformed during the period. Poor stock selection and an over weighted position in
HYPOTHETICAL GROWTH OF $10,000
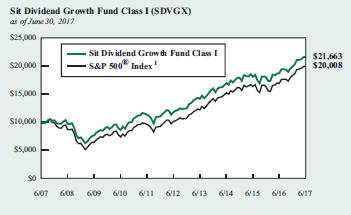
The chart above illustrates the total value of a hypothetical $10,000 investment in the Fund over the past 10 years as compared to the performance of the S&P 500® Index. Past performance does not guarantee future results. Returns include the reinvestment of distributions. The chart does not reflect the deduction of taxes that a shareholder would pay on Fund distributions or the redemption of Fund shares.
1 S&P 500® Index is an unmanaged capitalization-weighted index that measures the performance of 500 widely held common stocks of large-cap companies. It is not possible to invest directly in an index. This is the Fund’s primary index.
the health technology sector also detracted from relative returns. On a positive note, strong stock selection in the energy minerals, process industries, and electronic technology sectors contributed to relative returns over the past year.
Our research effort remains on high-quality companies that can deliver consistent earnings growth and a steady return of excess capital to shareholders, regardless of the economic backdrop.
Roger J. Sit
Kent L. Johnson
Michael J. Stellmacher
Portfolio Managers
| | |
Information on this page is unaudited. | | |
| 12 | | SIT MUTUAL FUNDS ANNUAL REPORT |
COMPARATIVE RATES OF RETURNS
as of June 30, 2017
| | | | | | | | | | | | | | | |
| | | Sit Dividend
Growth Fund | | S&P 500®
Index 1 |
| | | Class I | | Class S | |
One Year | | | | 15.41 | % | | | | 15.11 | % | | | | 17.89 | % |
Five Year | | | | 12.95 | | | | | 12.66 | | | | | 14.63 | |
Ten Year | | | | 8.04 | | | | | 7.77 | | | | | 7.18 | |
Since Inception - Class I | | | | 9.48 | | | | | n/a | | | | | 8.15 | |
(12/31/03) | | | | | | | | | | | | | | | |
Since Inception - Class S | | | | n/a | | | | | 8.72 | | | | | 8.00 | |
(3/31/06) | | | | | | | | | | | | | | | |
Performance figures are historical and do not guarantee future results. Investment returns and principal value will vary, and you may have a gain or loss when you sell shares. Current performance may be lower or higher than the performance data quoted. Contact the Fund for performance data current to the most recent month-end. Returns include changes in share price as well as reinvestment of all dividends and capital gains. Returns do not reflect the deduction of the 2% redemption fee imposed if shares are redeemed or exchanged within 30 calendar days from their date of purchase. If imposed, the fee would reduce the performance quoted. Returns do not reflect the deduction of taxes that a shareholder would pay on Fund distributions or the redemption of Fund shares. Management fees and administrative expenses are included in the Fund’s performance. Returns for periods greater than one year are compounded average annual rates of return.
1 S&P 500® Index is an unmanaged capitalization-weighted index that measures the performance of 500 widely held common stocks of large-cap companies. It is not possible to invest directly in an index.
PORTFOLIO SUMMARY
| | |
Class I: | | |
Net Asset Value 6/30/17: | | $ 16.88 Per Share |
Net Asset Value 6/30/16: | | $ 15.82 Per Share |
Total Net Assets: | | $ 1,015.9 Million |
Class S: | | |
Net Asset Value 6/30/17: | | $ 16.81 Per Share |
Net Asset Value 6/30/16: | | $ 15.76 Per Share |
Total Net Assets: | | $ 65.3 Million |
| |
Weighted Average Market Cap: | | $ 127.1 Billion |
TOP 10 HOLDINGS
1. Microsoft Corp.
2. Johnson & Johnson
3. JPMorgan Chase & Co.
4. Verizon Communications, Inc.
5. Apple, Inc.
6. Dow Chemical Co.
7. Home Depot, Inc.
8. Broadcom, Ltd.
9. PepsiCo, Inc.
10. Becton Dickinson and Co.
Based on total net assets as of June 30, 2017. Subject to change.
FUND DIVERSIFICATION
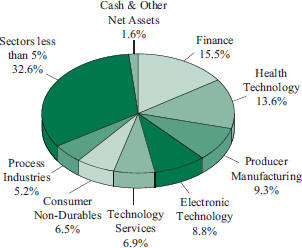
Based on total net assets as of June 30, 2017. Subject to change.
| | |
Information on this page is unaudited. | | |
| JUNE 30, 2017 | | 13 |
SCHEDULE OF INVESTMENTS
June 30, 2017
Sit Dividend Growth Fund
| | | | | | |
Quantity | | Name of Issuer | | Fair Value ($) | |
| |
Common Stocks - 98.4% | | | | |
Communications - 3.8% | | | | |
374,625 | | BT Group, PLC, ADR | | | 7,271,471 | |
305,150 | | CenturyLink, Inc. | | | 7,286,982 | |
605,925 | | Verizon Communications, Inc. | | | 27,060,610 | |
| | | | | | |
| | | | | 41,619,063 | |
| | | | | | |
Consumer Durables - 3.1% | | | | |
156,625 | | Genuine Parts Co. | | | 14,528,535 | |
106,100 | | Newell Brands, Inc. | | | 5,689,082 | |
92,287 | | Stanley Black & Decker, Inc. | | | 12,987,550 | |
| | | | | | |
| | | | | 33,205,167 | |
| | | | | | |
Consumer Non-Durables - 6.5% | | | | |
200,475 | | B&G Foods, Inc. | | | 7,136,910 | |
116,400 | | Dr Pepper Snapple Group, Inc. | | | 10,605,204 | |
166,200 | | Kraft Heinz Co. | | | 14,233,368 | |
182,175 | | PepsiCo, Inc. | | | 21,039,391 | |
144,850 | | Philip Morris International, Inc. | | | 17,012,632 | |
| | | | | | |
| | | | | 70,027,505 | |
| | | | | | |
Consumer Services - 4.9% | | | | |
188,575 | | CBS Corp. | | | 12,027,314 | |
163,450 | | Starbucks Corp. | | | 9,530,770 | |
46,450 | | Time Warner, Inc. | | | 4,664,044 | |
127,525 | | Visa, Inc. | | | 11,959,294 | |
144,100 | | Walt Disney Co. | | | 15,310,625 | |
| | | | | | |
| | | | | 53,492,047 | |
| | | | | | |
Electronic Technology - 8.8% | | | | |
187,525 | | Apple, Inc. | | | 27,007,350 | |
326,950 | | Applied Materials, Inc. | | | 13,506,304 | |
94,875 | | Broadcom, Ltd. | | | 22,110,619 | |
486,425 | | Intel Corp. | | | 16,411,980 | |
110,625 | | Skyworks Solutions, Inc. | | | 10,614,469 | |
90,475 | | Xilinx, Inc. | | | 5,819,352 | |
| | | | | | |
| | | | | 95,470,074 | |
| | | | | | |
Energy Minerals - 3.7% | | | | |
67,500 | | Chevron Corp. | | | 7,042,275 | |
144,100 | | Marathon Petroleum Corp. | | | 7,540,753 | |
134,275 | | Occidental Petroleum Corp. | | | 8,039,044 | |
578,875 | | Suncor Energy, Inc. | | | 16,903,150 | |
| | | | | | |
| | | | | 39,525,222 | |
| | | | | | |
| | | | | | |
Quantity | | Name of Issuer | | Fair Value ($) | |
| |
Finance - 15.5% | | | | |
107,475 | | Allstate Corp. | | | 9,505,089 | |
310,250 | | CubeSmart | | | 7,458,410 | |
202,500 | | East West Bancorp, Inc. | | | 11,862,450 | |
29,800 | | Goldman Sachs Group, Inc. | | | 6,612,620 | |
1,032,225 | | Huntington Bancshares, Inc. | | | 13,955,682 | |
314,375 | | JPMorgan Chase & Co. | | | 28,733,875 | |
479,900 | | KeyCorp | | | 8,993,326 | |
333,350 | | Legg Mason, Inc. | | | 12,720,636 | |
109,725 | | Macquarie Infrastructure Corp. | | | 8,602,440 | |
124,641 | | Marsh & McLennan Cos., Inc. | | | 9,717,012 | |
147,275 | | MetLife, Inc. | | | 8,091,288 | |
648,775 | | Physicians Realty Trust | | | 13,066,328 | |
94,250 | | T Rowe Price Group, Inc. | | | 6,994,292 | |
285,150 | | US Bancorp | | | 14,804,988 | |
136,756 | | XL Group, Ltd. | | | 5,989,913 | |
| | | | | | |
| | | | | 167,108,349 | |
| | | | | | |
Health Services - 3.8% | | | | |
70,475 | | Aetna, Inc. | | | 10,700,219 | |
155,650 | | Cardinal Health, Inc. | | | 12,128,248 | |
99,225 | | UnitedHealth Group, Inc. | | | 18,398,300 | |
| | | | | | |
| | | | | 41,226,767 | |
| | | | | | |
Health Technology - 13.6% | | | | |
373,675 | | Abbott Laboratories | | | 18,164,342 | |
249,125 | | AbbVie, Inc. | | | 18,064,054 | |
61,150 | | Allergan, PLC | | | 14,864,954 | |
101,225 | | Becton Dickinson and Co. | | | 19,750,010 | |
246,250 | | Johnson & Johnson | | | 32,576,412 | |
159,925 | | Medtronic, PLC | | | 14,193,344 | |
229,102 | | Merck & Co., Inc. | | | 14,683,147 | |
445,325 | | Pfizer, Inc. | | | 14,958,467 | |
| | | | | | |
| | | | | 147,254,730 | |
| | | | | | |
Process Industries - 5.2% | | | | |
411,300 | | Dow Chemical Co. | | | 25,940,691 | |
106,450 | | LyondellBasell Industries NV | | | 8,983,316 | |
111,550 | | Scotts Miracle-Gro Co. | | | 9,979,263 | |
33,275 | | Sherwin-Williams Co. | | | 11,678,194 | |
| | | | | | |
| | | | | 56,581,464 | |
| | | | | | |
| | |
See accompanying notes to financial statements. | | |
| 14 | | SIT MUTUAL FUNDS ANNUAL REPORT |
| | | | | | |
Quantity | | Name of Issuer | | Fair Value ($) | |
| |
Producer Manufacturing - 9.3% | | | | |
55,625 | | 3M Co. | | | 11,580,569 | |
127,025 | | Honeywell International, Inc. | | | 16,931,162 | |
66,325 | | Hubbell, Inc. | | | 7,506,000 | |
153,925 | | Ingersoll-Rand, PLC | | | 14,067,206 | |
39,805 | | Lockheed Martin Corp. | | | 11,050,266 | |
104,000 | | Raytheon Co. | | | 16,793,920 | |
71,425 | | Rockwell Automation, Inc. | | | 11,567,993 | |
90,250 | | United Technologies Corp. | | | 11,020,428 | |
| | | | | | |
| | | | | 100,517,544 | |
| | | | | | |
Retail Trade - 4.7% | | | | |
50,350 | | Costco Wholesale Corp. | | | 8,052,476 | |
157,300 | | Home Depot, Inc. | | | 24,129,820 | |
254,900 | | TJX Cos., Inc. | | | 18,396,133 | |
| | | | | | |
| | | | | 50,578,429 | |
| | | | | | |
Technology Services - 6.9% | | | | |
92,825 | | Accenture, PLC | | | 11,480,596 | |
8,825 | | Alphabet, Inc. - Class A * | | | 8,204,426 | |
54,550 | | Intuit, Inc. | | | 7,244,786 | |
517,325 | | Microsoft Corp. | | | 35,659,212 | |
229,125 | | Oracle Corp. | | | 11,488,328 | |
| | | | | | |
| | | | | 74,077,348 | |
| | | | | | |
Transportation - 4.2% | | | | |
98,025 | | Alaska Air Group, Inc. | | | 8,798,724 | |
183,025 | | Delta Air Lines, Inc. | | | 9,835,764 | |
59,050 | | FedEx Corp. | | | 12,833,336 | |
125,900 | | Union Pacific Corp. | | | 13,711,769 | |
| | | | | | |
| | | | | 45,179,593 | |
| | | | | | |
| | | | | | |
Quantity | | Name of Issuer | | Fair Value ($) | |
| |
Utilities - 4.4% | | | | |
137,520 | | DTE Energy Co. | | | 14,548,241 | |
116,850 | | NextEra Energy, Inc. | | | 16,374,190 | |
351,150 | | Southern Co. | | | 16,813,062 | |
| | | | | | |
| | | | | 47,735,493 | |
| | | | | | |
Total Common Stocks
(cost: $897,763,541) | | | 1,063,598,795 | |
| | | | | | |
| |
Short-Term Securities - 1.9% | | | | |
21,242,911 | | Fidelity Instl. Money Mkt. Govt. Fund, 0.81% | | | | |
Total Short-Term Securities
(cost: $21,242,911) | | | 21,242,911 | |
| | | | | | |
| |
Total Investments in Securities - 100.3%
(cost: $919,006,452) | | | 1,084,841,706 | |
Other Assets and Liabilities, net - (0.3%) | | | (3,643,240 | ) |
| | | | | | |
| |
Total Net Assets - 100.0% | | $ | 1,081,198,466 | |
| | | | | | |
| * | Non-income producing security. |
Numeric footnotes not disclosed are not applicable to this Schedule of Investments.
ADR — American Depositary Receipt
PLC — Public Limited Company
A summary of the levels for the Fund’s investments as of June 30, 2017 is as follows (see Note 2 - significant accounting policies in the notes to financial statements):
| | | | | | | | | | | | | | | | |
| | | Investment in Securities | |
| | | Level 1 | | | Level 2 | | | Level 3 | | | | |
| | | Quoted Price ($) | | | Other significant
observable inputs ($) | | | Significant
unobservable inputs ($) | | | Total ($) | |
Common Stocks ** | | | 1,063,598,795 | | | | — | | | | — | | | | 1,063,598,795 | |
Short-Term Securities | | | 21,242,911 | | | | — | | | | — | | | | 21,242,911 | |
| | | | |
Total: | | | 1,084,841,706 | | | | — | | | | — | | | | 1,084,841,706 | |
| | | | |
| ** | For equity securities categorized in a single level, refer to the Schedule of Investments for further breakdown. |
For the reporting period, there were no transfers between levels 1, 2 and 3.
| | | | |
See accompanying notes to financial statements. | | | | |
JUNE 30, 2017 | | | 15 | |
|
|
| |
Sit Global Dividend Growth Fund - Class I and Class S |
OBJECTIVE & STRATEGY
The objective of the Sit Global Dividend Growth Fund is to provide current income that exceeds the dividend yield of the MSCI World Index and that grows over a period of years. Secondarily, the Fund seeks long-term capital appreciation.
The Fund seeks to achieve its objectives by investing, under normal market conditions, at least 80% of its net assets in dividend-paying common stocks issued by U.S. and foreign companies. The Fund may invest the balance of its assets in preferred stocks, convertible bonds, and U.S. Treasury securities.
The Global Dividend Growth Fund Class I generated a return +11.94% for the twelve month period ending June 30, 2017 versus a return of +18.20% for the MSCI World Index. Stock selection along with industry and geographic allocation across a broad range of sectors had a negative impact on performance, particularly in the fourth calendar quarter of 2016, as small capitalization and higher beta stocks meaningfully outperformed around the world subsequent to the U.S. presidential election.
Synchronized global growth, improving corporate earnings, benign inflation, and positive economic surprises have contributed to the solid performance of U.S. and international equities over the past twelve months. In the U.S., the Trump administration’s policies have the potential to provide a boost to economic growth if effectively implemented. However, the range of potential economic outcomes continues to be wide as Washington remains bogged down by partisan conflict and the Federal Reserve begins to unwind its bloated balance sheet. Euro Area economic data has consistently surprised to the upside over the last twelve months. Yet, economic momentum is starting to show some signs of moderation as tailwinds from a weaker euro, Chinese stimulus measures, and easier comparisons fade in the second half of 2017. We are less optimistic on Japan as our concern continues to lie in the country’s subdued economic outlook and, by extension, the limited potential for earnings growth and equity price appreciation.
Therefore, the Fund has a diversified, barbell strategy that provides what we believe is the most favorable risk/reward profile at this stage. The Fund is overweight a mix of holdings that are pro-cyclical, policy beneficiaries to include banks and transports as well as holdings that are noncyclical/defensive such as select healthcare, telecom, and insurance. We believe bank stocks will outperform going forward based on rising rates, better growth, regulatory relief, tax relief, and an M&A cycle. Within the healthcare sector, we are investing in companies that possess an attractive mix of innovation and cost savings, both of which are currently providing attractive growth at reasonable valuations.
Contributing favorably to relative performance during the twelve month period were the Fund’s holdings in insurance (Prudential, XL Group and Allianz), transportation (Delta Air Lines and Union Pacific),
HYPOTHETICAL GROWTH OF $10,000
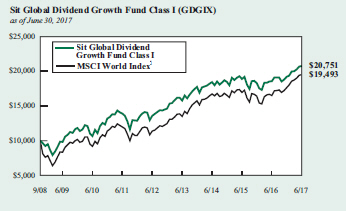
The chart above illustrates the total value of a hypothetical $10,000 investment in the Fund over the past 10 years (or for the life of the Fund if shorter) as compared to the performance of the MSCI World Index. Past performance does not guarantee future results. Returns include the reinvestment of distributions. The chart does not reflect the deduction of taxes that a shareholder would pay on Fund distributions or the redemption of Fund shares.
1 The MSCI World Index is a free float-adjusted market capitalization weighted index that is designed to measure the equity market performance of developed markets. It is not possible to invest directly in an index. This is the Fund’s primary index.
and semiconductors (Applied Materials and Broadcom) industries. Conversely, pharmaceutical (Teva Pharmaceutical and Roche Holding) telecommunications (Verizon), and health care equipment (Medtronic and Cardinal Health) industries negatively impacted absolute and relative performance.
The Fund’s gross dividend yield (before deduction of Fund expenses) was 3.07% as of 6/30/17, compared to the 2.39% yield of the MSCI World Index. In periods of low absolute returns, the dividend component of the return becomes more significant and this should benefit the dividend paying companies that are the focus of this strategy. The portfolio emphasizes high quality, dividend paying growth stocks and continues to be well diversified. We believe the portfolio is well positioned to outperform in down markets if financial market volatility picks up, as we believe it will throughout 2017.
| | |
Roger J. Sit | | Raymond E. Sit Tasha M. Murdoff |
Kent L. Johnson | | Michael J. Stellmacher |
Portfolio Managers | | |
| | |
Information on this page is unaudited. | | |
| 16 | | SIT MUTUAL FUNDS ANNUAL REPORT |
COMPARATIVE RATES OF RETURNS
as of June 30, 2017
| | | | | | | | | | | | | | | |
| | | Sit Global
Dividend
Growth Fund | | MSCI World Index 1 |
| | | Class I | | Class S | |
One Year | | | | 11.94 | % | | | | 11.67 | % | | | | 18.20 | % |
Five Year | | | | 8.87 | | | | | 8.59 | | | | | 11.38 | |
Since Inception | | | | 8.70 | | | | | 8.43 | | | | | 7.92 | |
(9/30/08) | | | | | | | | | | | | | | | |
Performance figures are historical and do not guarantee future results. Investment returns and principal value will vary, and you may have a gain or loss when you sell shares. Current performance may be lower or higher than the performance data quoted. Contact the Fund for performance data current to the most recent month-end. Returns include changes in share price as well as reinvestment of all dividends and capital gains. Returns do not reflect the deduction of the 2% redemption fee imposed if shares are redeemed or exchanged within 30 calendar days from their date of purchase. If imposed, the fee would reduce the performance quoted. Returns do not reflect the deduction of taxes that a shareholder would pay on Fund distributions or the redemption of Fund shares. Management fees and administrative expenses are included in the Fund’s performance. Returns for periods greater than one year are compounded average annual rates of return.
1 The MSCI World Index is a free float-adjusted market capitalization weighted index that is designed to measure the equity market performance of developed markets. It is not possible to invest directly in an index.
PORTFOLIO SUMMARY
| | |
Class I: | | |
Net Asset Value 6/30/17: | | $14.54 Per Share |
Net Asset Value 6/30/16: | | $13.19 Per Share |
Total Net Assets: | | $25.6 Million |
Class S: | | |
Net Asset Value 6/30/17: | | $14.53 Per Share |
Net Asset Value 6/30/16: | | $13.18 Per Share |
Total Net Assets: | | $3.3 Million |
| |
Weighted Average Market Cap: | | $122.9 Billion |
TOP 10 HOLDINGS
1. Microsoft Corp.
2. JPMorgan Chase & Co.
3. Verizon Communications, Inc.
4. Iberdrola SA
5. Pfizer, Inc. 6. Nestle SA
7. ING Groep NV, ADR
8. Apple, Inc.
9. Roche Holding AG
10. Diageo, PLC, ADR
Based on total net assets as of June 30, 2017. Subject to change.
FUND DIVERSIFICATION
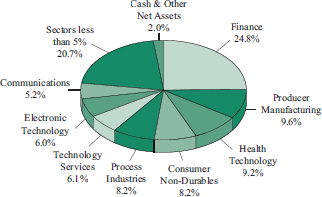
Based on total net assets as of June 30, 2017. Subject to change.
| | |
Information on this page is unaudited. | | |
JUNE 30, 2017 | | 17 |
SCHEDULE OF INVESTMENTS
June 30, 2017
Sit Global Dividend Growth Fund
| | | | | | |
Quantity | | Name of Issuer | | Fair Value ($) | |
| |
Common Stocks - 98.0% | | | | |
Asia - 5.1% | | | | |
Australia - 1.1% | | | | |
24,700 | | Amcor, Ltd. | | | 307,705 | |
| | | | | | |
China/Hong Kong - 1.0% | | | | |
6,475 | | HSBC Holdings, PLC, ADR | | | 300,375 | |
| | | | | | |
Japan - 1.5% | | | | |
61,900 | | Mitsubishi UFJ Financial Group, Inc., ADR | | | 417,825 | |
| | | | | | |
Singapore - 1.5% | | | | |
1,915 | | Broadcom, Ltd. | | | 446,291 | |
| | | | | | |
Europe - 27.1% | | | | |
Belgium - 1.4% | | | | |
3,725 | | Anheuser-Busch InBev NV, ADR | | | 411,091 | |
| | | | | | |
France - 1.5% | | | | |
1,725 | | Unibail-Rodamco SE | | | 434,661 | |
| | | | | | |
Germany - 3.9% | | | | |
16,400 | | Allianz SE, ADR | | | 324,310 | |
5,500 | | Aurelius SE & Co. | | | 295,581 | |
3,675 | | Siemens AG | | | 505,512 | |
| | | | | | |
| | | | | 1,125,403 | |
| | | | | | |
Ireland - 2.0% | | | | |
2,750 | | Accenture, PLC | | | 340,120 | |
2,600 | | Ingersoll-Rand, PLC | | | 237,614 | |
| | | | | | |
| | | | | 577,734 | |
| | | | | | |
Netherlands - 5.2% | | | | |
34,900 | | ING Groep NV, ADR | | | 606,911 | |
4,425 | | LyondellBasell Industries NV | | | 373,426 | |
25,400 | | RELX NV | | | 523,668 | |
| | | | | | |
| | | | | 1,504,005 | |
| | | | | | |
Spain - 2.3% | | | | |
83,100 | | Iberdrola SA | | | 658,521 | |
| | | | | | |
Switzerland - 6.2% | | | | |
1,950 | | Chubb, Ltd. | | | 283,491 | |
7,000 | | Nestle SA | | | 610,524 | |
2,225 | | Roche Holding AG | | | 568,521 | |
1,140 | | Zurich Insurance Group AG | | | 332,708 | |
| | | | | | |
| | | | | 1,795,244 | |
| | | | | | |
United Kingdom - 4.6% | | | | |
4,625 | | Diageo, PLC, ADR | | | 554,214 | |
79,025 | | DS Smith, PLC | | | 487,733 | |
13,300 | | WPP, PLC | | | 280,055 | |
| | | | | | |
| | | | | 1,322,002 | |
| | | | | | |
| | | | | | |
Quantity | | Name of Issuer | | Fair Value ($) | |
| |
North America - 65.8% | | | | |
Bermuda - 0.7% | | | | |
4,700 | | XL Group, Ltd. | | | 205,860 | |
| | | | | | |
Canada - 3.5% | | | | |
11,725 | | BCE, Inc. | | | 528,094 | |
10,275 | | Suncor Energy, Inc. | | | 300,030 | |
5,400 | | Vermilion Energy, Inc. | | | 171,342 | |
| | | | | | |
| | | | | 999,466 | |
| | | | | | |
United States - 61.6% | | | | |
2,225 | | 3M Co. | | | 463,223 | |
8,100 | | Abbott Laboratories | | | 393,741 | |
7,625 | | AbbVie, Inc. | | | 552,889 | |
3,325 | | Allstate Corp. | | | 294,063 | |
450 | | Alphabet, Inc. - Class A * | | | 418,356 | |
4,000 | | Apple, Inc. | | | 576,080 | |
8,175 | | Applied Materials, Inc. | | | 337,709 | |
4,875 | | Arthur J Gallagher & Co. | | | 279,094 | |
7,400 | | CenterPoint Energy, Inc. | | | 202,612 | |
11,625 | | CenturyLink, Inc. | | | 277,605 | |
8,900 | | CubeSmart | | | 213,956 | |
9,450 | | Delta Air Lines, Inc. | | | 507,843 | |
5,400 | | Domtar Corp. | | | 207,468 | |
6,525 | | Dow Chemical Co. | | | 411,532 | |
3,850 | | Genuine Parts Co. | | | 357,126 | |
2,875 | | Home Depot, Inc. | | | 441,025 | |
3,875 | | Honeywell International, Inc. | | | 516,499 | |
10,925 | | Intel Corp. | | | 368,609 | |
5,050 | | International Paper Co. | | | 285,880 | |
4,050 | | Johnson & Johnson | | | 535,774 | |
9,050 | | JPMorgan Chase & Co. | | | 827,170 | |
24,100 | | KeyCorp | | | 451,634 | |
3,300 | | Kraft Heinz Co. | | | 282,612 | |
1,365 | | Lockheed Martin Corp. | | | 378,938 | |
5,275 | | Macquarie Infrastructure Corp. | | | 413,560 | |
6,650 | | Marathon Petroleum Corp. | | | 347,994 | |
14,400 | | Microsoft Corp. | | | 992,592 | |
5,975 | | Occidental Petroleum Corp. | | | 357,723 | |
4,450 | | PepsiCo, Inc. | | | 513,930 | |
18,400 | | Pfizer, Inc. | | | 618,056 | |
18,500 | | Physicians Realty Trust | | | 372,590 | |
3,025 | | Prudential Financial, Inc. | | | 327,124 | |
1,825 | | Rockwell Automation, Inc. | | | 295,577 | |
3,225 | | Scotts Miracle-Gro Co. | | | 288,508 | |
8,250 | | Starbucks Corp. | | | 481,058 | |
4,800 | | T Rowe Price Group, Inc. | | | 356,208 | |
2,050 | | TJX Cos., Inc. | | | 147,948 | |
4,575 | | Union Pacific Corp. | | | 498,263 | |
2,700 | | United Parcel Service, Inc. | | | 298,593 | |
3,000 | | United Technologies Corp. | | | 366,330 | |
8,475 | | US Bancorp | | | 440,022 | |
| | |
See accompanying notes to financial statements. | | |
| 18 | | SIT MUTUAL FUNDS ANNUAL REPORT |
| | | | | | |
Quantity | | Name of Issuer | | Fair Value ($) | |
| | |
15,500 | | Verizon Communications, Inc. | | | 692,230 | |
6,775 | | WEC Energy Group, Inc. | | | 415,850 | |
| | | | | | |
| | | | | 17,805,594 | |
| | | | | | |
Total Common Stocks (cost: $24,167,790) | | | 28,311,777 | |
| | | | | | |
| |
Short-Term Securities - 2.5% | | | | |
743,569 | | Fidelity Instl. Money Mkt. Govt. Fund, 0.81% | | | | |
Total Short-Term Securities (cost: $743,569) | | | 743,569 | |
| | | | | | |
| |
Total Investments in Securities - 100.5% (cost: $24,911,359) | | | 29,055,346 | |
Other Assets and Liabilities, net - (0.5%) | | | (158,084 | ) |
| | | | | | |
| |
Total Net Assets - 100.0% | | | $28,897,262 | |
| | | | | | |
| * | Non-income producing security. |
Numeric footnotes not disclosed are not applicable to this Schedule of Investments
ADR — American Depositary Receipt
PLC — Public Limited Company
| | |
See accompanying notes to financial statements. | | |
JUNE 30, 2017 | | 19 |
SCHEDULE OF INVESTMENTS
June 30, 2017
Sit Global Dividend Growth Fund (Continued)
A summary of the levels for the Fund’s investments as of June 30, 2017 is as follows (see Note 2 - significant accounting policies in the notes to financial statements):
| | | | | | | | | | | | | | | | | | | | |
| | | Investment in Securities |
| | | Level 1
Quoted
Price ($) | | Level 2
Other significant
observable inputs ($) | | Level 3 Significant
unobservable inputs ($) | | Total ($) |
Common Stocks | | | | | | | | | | | | | | | | | | | | |
Australia | | | | — | | | | | 307,705 | | | | | — | | | | | 307,705 | |
Belgium | | | | 411,091 | | | | | — | | | | | — | | | | | 411,091 | |
Bermuda | | | | 205,860 | | | | | — | | | | | — | | | | | 205,860 | |
Canada | | | | 999,466 | | | | | — | | | | | — | | | | | 999,466 | |
China/Hong Kong | | | | 300,375 | | | | | — | | | | | — | | | | | 300,375 | |
France | | | | — | | | | | 434,661 | | | | | — | | | | | 434,661 | |
Germany | | | | 324,310 | | | | | 801,093 | | | | | — | | | | | 1,125,403 | |
Ireland | | | | 577,734 | | | | | — | | | | | — | | | | | 577,734 | |
Japan | | | | 417,825 | | | | | — | | | | | — | | | | | 417,825 | |
Netherlands | | | | 980,337 | | | | | 523,668 | | | | | — | | | | | 1,504,005 | |
Singapore | | | | 446,291 | | | | | — | | | | | — | | | | | 446,291 | |
Spain | | | | — | | | | | 658,521 | | | | | — | | | | | 658,521 | |
Switzerland | | | | 283,491 | | | | | 1,511,753 | | | | | — | | | | | 1,795,244 | |
United Kingdom | | | | 554,214 | | | | | 767,788 | | | | | — | | | | | 1,322,002 | |
United States | | | | 17,805,594 | | | | | — | | | | | — | | | | | 17,805,594 | |
Short-Term Securities | | | | 743,569 | | | | | — | | | | | — | | | | | 743,569 | |
Total: | | | | 24,050,157 | | | | | 5,005,189 | | | | | — | | | | | 29,055,346 | |
The Fund adjusts the closing price of foreign equity securities by applying a systematic process for events occurring after the close of the foreign exchanges. At each reporting period, this process is applied for all foreign securities and therefore all foreign securities are classified as level 2. There are no transfers between level 1 and level 2 between reporting periods as a result of applying this process. Level 1 securities of foreign issuers are primarily American Depositary Receipts (ADRs), Public Limited Companies (PLCs) or Global Depositary Receipts (GDRs). There were no transfers into or out of level 3 during the reporting period.
| | |
See accompanying notes to financial statements. | | |
| 20 | | SIT MUTUAL FUNDS ANNUAL REPORT |
[This page intentionally left blank.]
|
|
| |
Sit Large Cap Growth Fund |
OBJECTIVE & STRATEGY
The objective of the Sit Large Cap Growth Fund is to maximize long-term capital appreciation. The Fund pursues this objective by investing at least 80% of its net assets in the common stocks of domestic growth companies with capitalizations of $5 billion or more at the time of purchase.
The Sit Large Cap Growth Fund’s one-year return was +21.18%, compared to the +20.42% return for the Russell 1000® Growth index. The S&P 500® Index return for the period was +17.89%.
U.S. stocks posted strong gains over the past year, as corporate earnings rebounded following several quarters of lackluster growth. Although optimism over domestic pro-growth policies has faded since the euphoria immediately following the presidential election, growth trends outside the U.S. have broadly improved over the past twelve months. While this pickup in growth has been encouraging, our view for modest global growth with moderate inflation remains intact. With valuations approaching “fair” levels for equities, we strongly believe that emphasizing quality and identifying companies with strong earnings growth prospects will differentiate performance in this environment. To this point, we continue to believe the technology sector offers significant opportunities for investors, as both secular (e.g., cloud computing, software) and cyclical (e.g., semiconductors) groups are generating earnings growth well in excess of market averages. In addition, recognizing relatively high valuations and the potential for increased volatility, the Fund has meaningful exposure to defensive areas as well, particularly healthcare and consumer-related areas.
The Fund’s strong relative and absolute performance during the past twelve months was largely due to strong stock selection and overweighted allocations in the electronic technology and technology services sectors. Strong stock selection in the finance and consumer non-durables sectors also contributed to strong relative returns. In terms of individual stocks, standout performers included Applied Materials (+74% over the past year), Broadcom (+53%), Adobe Systems (+48%), JP Morgan Chase (+51%), and Goldman Sachs (+51%). On the negative side, our holdings in the health technology and commercial services sectors lagged over the period and detracted from
HYPOTHETICAL GROWTH OF $10,000
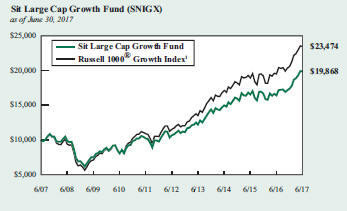
The chart above illustrates the total value of a hypothetical $10,000 investment in the Fund over the past 10 years as compared to the performance of the Russell 1000® Growth Index. Past performance does not guarantee future results. Returns include the reinvestment of distributions. The chart does not reflect the deduction of taxes that a shareholder would pay on Fund distributions or the redemption of Fund shares.
1 Russell 1000® Growth Index is an unmanaged index that measures the performance of those Russell 1000 Index companies with higher price-to-book ratios and higher forecasted growth values. It is not possible to invest directly in an index. This is the Fund’s primary index.
relative returns. Stocks within these sectors that lagged over the period included Medtronic, Pfizer, Gilead Sciences, and Nielsen.
We continue to be optimistic on the outlook for companies held in the Fund and appreciate shareholders’ continued interest.
Roger J. Sit
Ronald D. Sit
Michael J. Stellmacher
Portfolio Managers
| | |
Information on this page is unaudited. | | |
| 22 | | SIT MUTUAL FUNDS ANNUAL REPORT |
COMPARATIVE RATES OF RETURNS
as of June 30, 2017
| | | | | | | | | | | | | | | |
| | | Sit Large
Cap Growth
Fund | | Russell
1000®
Growth
Index 1 | | Russell
1000®
Index 2 |
One Year | | | | 21.18 | % | | | | 20.42 | % | | | | 18.03 | % |
Five Year | | | | 13.27 | | | | | 15.30 | | | | | 14.67 | |
Ten Year | | | | 7.11 | | | | | 8.91 | | | | | 7.29 | |
Since Inception 3 | | | | 10.01 | | | | | 11.13 | | | | | 11.77 | |
(9/2/82) | | | | | | | | | | | | | | | |
Performance figures are historical and do not guarantee future results. Investment returns and principal value will vary, and you may have a gain or loss when you sell shares. Current performance may be lower or higher than the performance data quoted. Contact the Fund for performance data current to the most recent month-end. Returns include changes in share price as well as reinvestment of all dividends and capital gains. Returns do not reflect the deduction of the 2% redemption fee imposed if shares are redeemed or exchanged within 30 calendar days from their date of purchase. If imposed, the fee would reduce the performance quoted. Returns do not reflect the deduction of taxes that a shareholder would pay on Fund distributions or the redemption of Fund shares. Management fees and administrative expenses are included in the Fund’s performance. Returns for periods greater than one year are compounded average annual rates of return.
1 Russell 1000® Growth Index is an unmanaged index that measures the performance of those Russell 1000 Index companies with higher price-to-book ratios and higher forecasted growth values. It is not possible to invest directly in an index.
2 Russell 1000® Index is an unmanaged index that measures the performance of approximately 1,000 of the largest U.S. companies by market capitalization.
3 On 6/6/93, the Fund’s investment objective changed to allow for a portfolio of 100% stocks. Prior to that time, the portfolio was required to contain no more than 80% stocks.
PORTFOLIO SUMMARY
| | |
Net Asset Value 6/30/17: | | $ 40.56 Per Share |
Net Asset Value 6/30/16: | | $ 36.02 Per Share |
Total Net Assets: | | $ 113.6 Million |
Weighted Average Market Cap: | | $ 179.6 Billion |
TOP 10 HOLDINGS
|
|
1. Alphabet, Inc. |
2. Apple, Inc. |
3. Microsoft Corp. |
4. Facebook, Inc. |
5. Visa, Inc. |
6. Adobe Systems, Inc. |
7. Broadcom, Ltd. |
8. PepsiCo, Inc. |
9. Applied Materials, Inc. |
9. priceline.com, Inc. |
Based on total net assets as of June 30, 2017. Subject to change.
FUND DIVERSIFICATION
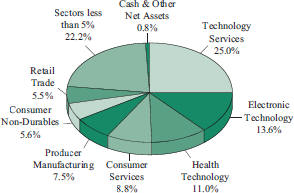
Based on total net assets as of June 30, 2017. Subject to change.
| | |
Information on this page is unaudited. | | |
JUNE 30, 2017 | | 23 |
SCHEDULE OF INVESTMENTS
June 30, 2017
Sit Large Cap Growth Fund
| | | | |
Quantity | | Name of Issuer | | Fair Value ($) |
|
Common Stocks - 99.2% |
|
Commercial Services - 1.0% |
8,300 | | Equifax, Inc. | | 1,140,586 |
| | | | |
Communications - 1.4% | | |
4,600 | | SBA Communications Corp. * | | 620,540 |
20,925 | | Verizon Communications, Inc. | | 934,510 |
| | | | |
| | | | 1,555,050 |
| | | | |
Consumer Durables - 1.7% | | |
10,300 | | Electronic Arts, Inc. * | | 1,088,916 |
9,000 | | Genuine Parts Co. | | 834,840 |
| | | | |
| | | | 1,923,756 |
| | | | |
Consumer Non-Durables - 5.6% | | |
18,675 | | Estee Lauder Cos., Inc. - Class A | | 1,792,426 |
17,650 | | NIKE, Inc. | | 1,041,350 |
23,900 | | PepsiCo, Inc. | | 2,760,211 |
8,800 | | Procter & Gamble Co. | | 766,920 |
| | | | |
| | | | 6,360,907 |
| | | | |
Consumer Services - 8.8% | | |
18,100 | | CBS Corp. | | 1,154,418 |
12,700 | | Marriott International, Inc. | | 1,273,937 |
39,000 | | Starbucks Corp. | | 2,274,090 |
38,600 | | Visa, Inc. | | 3,619,908 |
16,200 | | Walt Disney Co. | | 1,721,250 |
| | | | |
| | | | 10,043,603 |
| | | | |
Electronic Technology - 13.6% | | |
46,325 | | Apple, Inc. | | 6,671,727 |
58,900 | | Applied Materials, Inc. | | 2,433,159 |
13,000 | | Broadcom, Ltd. | | 3,029,650 |
37,000 | | Ciena Corp. * | | 925,740 |
21,100 | | Intel Corp. | | 711,914 |
8,800 | | NVIDIA Corp. | | 1,272,128 |
4,700 | | Skyworks Solutions, Inc. | | 450,965 |
| | | | |
| | | | 15,495,283 |
| | | | |
Energy Minerals - 1.2% | | |
18,600 | | Marathon Petroleum Corp. | | 973,338 |
2,300 | | Pioneer Natural Resources Co. | | 367,034 |
| | | | |
| | | | 1,340,372 |
| | | | |
Finance - 4.7% | | |
5,450 | | Chubb, Ltd. | | 792,321 |
5,400 | | Goldman Sachs Group, Inc. | | 1,198,260 |
20,600 | | JPMorgan Chase & Co. | | 1,882,840 |
18,300 | | Legg Mason, Inc. | | 698,328 |
10,500 | | T Rowe Price Group, Inc. | | 779,205 |
| | | | |
| | | | 5,350,954 |
| | | | |
| | | | |
Quantity | | Name of Issuer | | Fair Value ($) |
| |
Health Services - 3.5% | | |
14,000 | | Centene Corp. * | | 1,118,320 |
3,500 | | Humana, Inc. | | 842,170 |
10,625 | | UnitedHealth Group, Inc. | | 1,970,088 |
| | | | |
| | | | 3,930,578 |
| | | | |
Health Technology - 11.0% | | |
22,500 | | AbbVie, Inc. | | 1,631,475 |
4,700 | | Alexion Pharmaceuticals, Inc. * | | 571,849 |
4,200 | | Allergan, PLC | | 1,020,978 |
31,700 | | Boston Scientific Corp. * | | 878,724 |
8,975 | | Celgene Corp. * | | 1,165,583 |
8,400 | | Gilead Sciences, Inc. | | 594,552 |
7,850 | | Incyte Corp. * | | 988,394 |
13,700 | | Johnson & Johnson | | 1,812,373 |
14,300 | | Medtronic, PLC | | 1,269,125 |
22,600 | | Pfizer, Inc. | | 759,134 |
5,850 | | Thermo Fisher Scientific, Inc. | | 1,020,650 |
6,025 | | Zimmer Biomet Holdings, Inc. | | 773,610 |
| | | | |
| | | | 12,486,447 |
| | | | |
Process Industries - 3.3% | | |
13,800 | | Dow Chemical Co. | | 870,366 |
14,500 | | Ecolab, Inc. | | 1,924,875 |
2,800 | | Sherwin-Williams Co. | | 982,688 |
| | | | |
| | | | 3,777,929 |
| | | | |
Producer Manufacturing - 7.5% | | |
8,050 | | 3M Co. | | 1,675,930 |
13,425 | | Honeywell International, Inc. | | 1,789,418 |
10,100 | | Ingersoll-Rand, PLC | | 923,039 |
13,500 | | Raytheon Co. | | 2,179,980 |
4,125 | | Rockwell Automation, Inc. | | 668,085 |
10,300 | | United Technologies Corp. | | 1,257,733 |
| | | | |
| | | | 8,494,185 |
| | | | |
Retail Trade - 5.5% | | |
1,700 | | Amazon.com, Inc. * | | 1,645,600 |
3,800 | | CVS Health Corp. | | 305,748 |
15,100 | | Home Depot, Inc. | | 2,316,340 |
16,600 | | TJX Cos., Inc. | | 1,198,022 |
2,900 | | Ulta Beauty, Inc. * | | 833,286 |
| | | | |
| | | | 6,298,996 |
| | | | |
Technology Services - 25.0% | | |
12,275 | | Accenture, PLC | | 1,518,172 |
23,800 | | Adobe Systems, Inc. * | | 3,366,272 |
1,850 | | Alphabet, Inc. - Class A * | | 1,719,908 |
5,966 | | Alphabet, Inc. - Class C * | | 5,421,483 |
7,500 | | ANSYS, Inc. * | | 912,600 |
21,800 | | Cognizant Technology Solutions Corp. | | 1,447,520 |
27,800 | | Facebook, Inc. * | | 4,197,244 |
70,600 | | Microsoft Corp. | | 4,866,458 |
19,200 | | Oracle Corp. | | 962,688 |
| | |
See accompanying notes to financial statements. | | |
| 24 | | SIT MUTUAL FUNDS ANNUAL REPORT |
| | | | | | |
Quantity | | Name of Issuer | | Fair Value ($) | |
| | |
21,500 | | PayPal Holdings, Inc. * | | | 1,153,905 | |
1,275 | | priceline.com, Inc. * | | | 2,384,913 | |
5,400 | | salesforce.com, Inc. * | | | 467,640 | |
| | | | | | |
| | | | | 28,418,803 | |
| | | | | | |
Transportation - 4.8% | | | | |
11,900 | | Alaska Air Group, Inc. | | | 1,068,144 | |
21,615 | | Delta Air Lines, Inc. | | | 1,161,590 | |
6,900 | | FedEx Corp. | | | 1,499,577 | |
9,800 | | Union Pacific Corp. | | | 1,067,318 | |
5,400 | | United Parcel Service, Inc. | | | 597,186 | |
| | | | | | |
| | | | | 5,393,815 | |
| | | | | | |
Utilities - 0.6% | | | | |
5,000 | | NextEra Energy, Inc. | | | 700,650 | |
| | | | | | |
Total Common Stocks
(cost: $65,174,690) | | | 112,711,914 | |
| | | | | | |
| | | | | | |
Quantity | | Name of Issuer | | Fair Value ($) | |
| |
Short-Term Securities - 1.3% | | | | |
1,526,296 | | Fidelity Instl. Money Mkt. Govt. Fund, 0.81% | |
Total Short-Term Securities
(cost: $1,526,296) | | | 1,526,296 | |
| | | | | | |
| |
Total Investments in Securities - 100.5%
(cost: $66,700,986) | | | 114,238,210 | |
Other Assets and Liabilities, net - (0.5%) | | | (618,200 | ) |
| | | | | | |
| |
Total Net Assets - 100.0% | | | $113,620,010 | |
| | | | | | |
| * | Non-income producing security. |
Numeric footnotes not disclosed are not applicable to this Schedule of Investments.
PLC — Public Limited Company
A summary of the levels for the Fund’s investments as of June 30, 2017 is as follows (see Note 2 - significant accounting policies in the notes to financial statements):
| | | | | | | | | | | | | | | | | | | | |
| | | Investment in Securities |
| | | Level 1
Quoted
Price ($) | | Level 2
Other significant
observable inputs ($) | | Level 3 Significant
unobservable inputs ($) | | Total ($) |
Common Stocks ** | | | | 112,711,914 | | | | | — | | | | | — | | | | | 112,711,914 | |
Short-Term Securities | | | | 1,526,296 | | | | | — | | | | | — | | | | | 1,526,296 | |
| | | | |
Total: | | | | 114,238,210 | | | | | — | | | | | — | | | | | 114,238,210 | |
| ** | For equity securities categorized in a single level, refer to the Schedule of Investments for further breakdown. |
For the reporting period, there were no transfers between levels 1, 2 and 3.
| | | | |
See accompanying notes to financial statements. | | | | |
JUNE 30, 2017 | | | 25 | |
|
|
| |
Sit ESG Growth Fund - Class I and Class S |
OBJECTIVE & STRATEGY
The objective of the Sit ESG Growth Fund is to maximize long-term capital appreciation. The Fund seeks to achieve its objectives by investing, under normal market conditions, at least 80% of its net assets in companies that the Adviser believes have strong environmental, social and corporate governance (ESG) practices at the time of purchase. The Fund invests in common stocks of U.S. and foreign companies, primarily of large to medium capitalizations (companies with market capitalization in excess of $2 billion).
The Sit ESG Growth Fund Class I generated a return of +13.13% in the twelve-month period ended June 30, 2017 compared to the MSCI World Index return of +18.20%. All of the underperformance occurred during the last six months of 2016. More specifically, just over 70% of the underperformance relative to the Index is attributable to an average cash balance of 17.6% over the last six months of 2016. While the cash balance remained elevated during the first three months of the Fund’s inception as we opportunistically purchased stocks in the uncertain market environment (i.e., Brexit, U.S. political elections), the cash balance is currently at a more normalized level of roughly 3%. More recently, the Fund has outperformed the benchmark for the first six months of 2017, generating a return of +10.90% versus the MSCI World Index return of +10.66%.
Synchronized global growth, improving corporate earnings, benign inflation, and positive economic surprises have contributed to the solid performance of U.S. and international equities over the past twelve months. In the U.S., the Trump administration’s policies have the potential to provide a boost to economic growth if effectively implemented. However, the range of potential economic outcomes continues to be wide as Washington remains bogged down by partisan conflict and the Federal Reserve begins to unwind its bloated balance sheet. Euro Area economic data has consistently surprised to the upside over the last twelve months. Yet, economic momentum is starting to show some signs of moderation as tailwinds from a weaker euro, Chinese stimulus measures, and easier comparisons fade in the second half of 2017. We are less optimistic on Japan as our concern continues to lie in the country’s subdued economic outlook and, by extension, the limited potential for earnings growth and equity price appreciation.
The industries contributing most favorably to relative performance were the insurance (Prudential Financial and Allianz), transportation (Delta Air Lines and FedEx), and health care equipment & services (Humana and UnitedHealth Group). Conversely, cash was the largest detractor, followed by the technology hardware & equipment (Ingenico and Apple) and semiconductors (Intel) industries.
From a geographic standpoint, the countries of Singapore (Broadcom), United Kingdom (DS Smith and BT Group) and Netherlands (ING
HYPOTHETICAL GROWTH OF $10,000
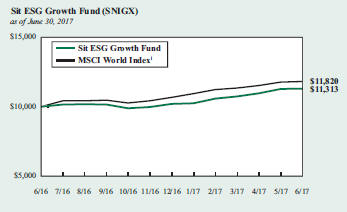
The chart above illustrates the total value of a hypothetical $10,000 investment in the Fund over the past 10 years (or for the life of the Fund if shorter) as compared to the performance of the MSCI World Index. Past performance does not guarantee future results. Returns include the reinvestment of distributions. The chart does not reflect the deduction of taxes that a shareholder would pay on Fund distributions or the redemption of Fund shares.
1 The MSCI World Index is a free float-adjusted market capitalization weighted index that is designed to measure the equity market performance of developed markets. It is not possible to invest directly in an index. This is the Fund’s primary index..
Groep) added value from both an allocation and stock selection perspective. However, stocks election in the United States (Verizon, Brixmor, Occidental Petroleum and Pfizer) and France (Schlumberger and Unibail-Rodamco) negatively impacted the Fund.
The focus of the Sit ESG Fund is to invest at least 80% of the assets in companies that have strong ESG (environmental, social and corporate governance) practices. We remain positive about the long-term outlook for companies held in the Fund based on attractive valuations and sustainable earnings growth potential.
Roger J. Sit
Ronald D. Sit
Michael J. Stellmacher
Portfolio Managers
| | |
Information on this page is unaudited. | | |
| 26 | | SIT MUTUAL FUNDS ANNUAL REPORT |
COMPARATIVE RATES OF RETURNS
as of June 30, 2017
| | | | | | | | | | | | | | | |
| | | Sit ESG
Growth Fund | | MSCI
World Index 1 |
| | | Class I | | Class S | |
One Year | | | | 13.13 | % | | | | 12.79 | % | | | | 18.20 | % |
Since Inception (6/30/16) | | | | 13.13 | | | | | 12.79 | | | | | 18.20 | |
Performance figures are historical and do not guarantee future results. Investment returns and principal value will vary, and you may have a gain or loss when you sell shares. Current performance may be lower or higher than the performance data quoted. Contact the Fund for performance data current to the most recent month-end. Returns include changes in share price as well as reinvestment of all dividends and capital gains. Returns do not reflect the deduction of the 2% redemption fee imposed if shares are redeemed or exchanged within 30 calendar days from their date of purchase. If imposed, the fee would reduce the performance quoted. Returns do not reflect the deduction of taxes that a shareholder would pay on Fund distributions or the redemption of Fund shares. Management fees and administrative expenses are included in the Fund’s performance. Returns for periods greater than one year are compounded average annual rates of return.
1 The MSCI World Index is a free float-adjusted market capitalization weighted index that is designed to measure the equity market performance of developed markets. It is not possible to invest directly in an index.
PORTFOLIO SUMMARY
| | | | | | |
Class I: | | | | | | |
Net Asset Value 6/30/17: | | | $11.29 | | | Per Share |
Net Asset Value 6/30/162: | | | $10.00 | | | Per Share |
Total Net Assets: | | | $2.3 | | | Million |
Class S: | | | | | | |
Net Asset Value 6/30/17: | | | $11.28 | | | Per Share |
Net Asset Value 6/30/162: | | | $10.00 | | | Per Share |
Total Net Assets: | | | $2.3 | | | Million |
| | |
Weighted Average Market Cap: | | | $124.3 | | | Billion |
2 Inception date of the Fund.
TOP 10 HOLDINGS
|
|
1. Johnson & Johnson |
2. 3M Co. |
3. Iberdrola SA, ADR |
4. ING Groep NV, ADR |
5. Ingersoll-Rand, PLC |
6. Microsoft Corp. |
7. Pfizer, Inc. |
8. Marriott International, Inc. |
9. Starbucks Corp. |
10. Intel Corp. |
Based on total net assets as of June 30, 2017. Subject to change.
FUND DIVERSIFICATION
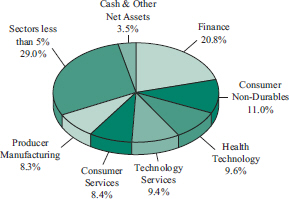
Based on total net assets as of June 30, 2017. Subject to change.
| | |
Information on this page is unaudited. | | |
JUNE 30, 2017 | | 27 |
SCHEDULE OF INVESTMENTS
June 30, 2017
Sit ESG Growth Fund
| | | | | | |
| | | |
| Quantity | | Name of Issuer | | Fair Value ($) | |
| |
Common Stocks - 96.5% | | | | |
Asia - 3.4% | | | | |
China/Hong Kong - 1.3% | | | | |
1,300 | | HSBC Holdings, PLC, ADR | | | 60,307 | |
| | | | | | |
Japan - 2.1% | | | | |
2,400 | | Asics Corp. | | | 44,603 | |
8,325 | | Mitsubishi UFJ Financial Group, Inc., ADR | | | 56,194 | |
| | | | | | |
| | | | | 100,797 | |
| | | | | | |
Europe - 31.1% | | | | |
Belgium - 1.6% | | | | |
700 | | Anheuser-Busch InBev NV, ADR | | | 77,252 | |
| | | | | | |
France - 3.1% | | | | |
685 | | Ingenico Group SA | | | 62,121 | |
3,325 | | Unibail-Rodamco SE, ADR | | | 83,025 | |
| | | | | | |
| | | | | 145,146 | |
| | | | | | |
Germany - 4.1% | | | | |
5,100 | | Allianz SE, ADR | | | 100,853 | |
1,300 | | Siemens AG, ADR | | | 89,895 | |
| | | | | | |
| | | | | 190,748 | |
| | | | | | |
Ireland - 3.8% | | | | |
510 | | Accenture, PLC | | | 63,077 | |
1,250 | | Ingersoll-Rand, PLC | | | 114,238 | |
| | | | | | |
| | | | | 177,315 | |
| | | | | | |
Netherlands - 4.5% | | | | |
6,575 | | ING Groep NV, ADR | | | 114,339 | |
4,700 | | RELX NV, ADR | | | 97,196 | |
| | | | | | |
| | | | | 211,535 | |
| | | | | | |
Spain - 4.6% | | | | |
3,850 | | Iberdrola SA, ADR | | | 122,141 | |
2,375 | | Industria de Diseno Textil SA | | | 91,212 | |
| | | | | | |
| | | | | 213,353 | |
| | | | | | |
Switzerland - 5.3% | | | | |
900 | | Nestle SA, ADR | | | 78,480 | |
2,100 | | Roche Holding AG, ADR | | | 66,780 | |
3,500 | | Zurich Insurance Group AG, ADR | | | 101,955 | |
| | | | | | |
| | | | | 247,215 | |
| | | | | | |
United Kingdom - 4.1% | | | | |
2,100 | | Coca-Cola European Partners, PLC | | | 85,407 | |
600 | | Diageo, PLC, ADR | | | 71,898 | |
600 | | Royal Dutch Shell, PLC, ADR - Class B | | | 32,658 | |
| | | | | | |
| | | | | 189,963 | |
| | | | | | |
| | | | | | |
| | | |
| Quantity | | Name of Issuer | | Fair Value ($) | |
| |
North America - 62.0% | | | | |
Canada - 3.1% | | | | |
950 | | BCE, Inc. | | | 42,788 | |
3,500 | | Suncor Energy, Inc. | | | 102,200 | |
| | | | | | |
| | | | | 144,988 | |
| | | | | | |
United States - 58.9% | | | | |
600 | | 3M Co. | | | 124,914 | |
1,050 | | AbbVie, Inc. | | | 76,136 | |
500 | | Adobe Systems, Inc. * | | | 70,720 | |
525 | | Allstate Corp. | | | 46,431 | |
100 | | Alphabet, Inc. - Class A * | | | 92,968 | |
300 | | Apple, Inc. | | | 43,206 | |
2,225 | | Boston Scientific Corp. * | | | 61,677 | |
750 | | Cognizant Technology Solutions Corp. | | | 49,800 | |
1,500 | | Delta Air Lines, Inc. | | | 80,610 | |
1,300 | | Dow Chemical Co. | | | 81,991 | |
425 | | Ecolab, Inc. | | | 56,419 | |
320 | | Facebook, Inc. * | | | 48,314 | |
450 | | FedEx Corp. | | | 97,799 | |
375 | | Goldman Sachs Group, Inc. | | | 83,212 | |
665 | | Home Depot, Inc. | | | 102,011 | |
250 | | Humana, Inc. | | | 60,155 | |
3,050 | | Intel Corp. | | | 102,907 | |
975 | | Johnson & Johnson | | | 128,983 | |
950 | | JPMorgan Chase & Co. | | | 86,830 | |
2,500 | | KeyCorp | | | 46,850 | |
1,600 | | Legg Mason, Inc. | | | 61,056 | |
1,100 | | Marriott International, Inc. | | | 110,341 | |
1,650 | | Microsoft Corp. | | | 113,734 | |
1,100 | | NIKE, Inc. | | | 64,900 | |
700 | | Occidental Petroleum Corp. | | | 41,909 | |
800 | | PepsiCo, Inc. | | | 92,392 | |
3,375 | | Pfizer, Inc. | | | 113,366 | |
560 | | Prudential Financial, Inc. | | | 60,558 | |
350 | | Rockwell Automation, Inc. | | | 56,686 | |
1,800 | | Starbucks Corp. | | | 104,958 | |
925 | | T Rowe Price Group, Inc. | | | 68,644 | |
1,065 | | TJX Cos., Inc. | | | 76,861 | |
375 | | UnitedHealth Group, Inc. | | | 69,532 | |
2,025 | | Verizon Communications, Inc. | | | 90,436 | |
875 | | Visa, Inc. | | | 82,058 | |
| | | | | | |
| | | | | 2,749,364 | |
| | | | | | |
| |
Total Common Stocks
(cost: $3,954,682) | | | 4,507,983 | |
| | | | | | |
| | |
See accompanying notes to financial statements. | | |
| 28 | | SIT MUTUAL FUNDS ANNUAL REPORT |
| | | | | | |
| | | |
| Quantity | | Name of Issuer | | Fair Value ($) | |
| |
Short-Term Securities - 3.4% | | | | |
159,335 | | Fidelity Instl. Money Mkt. Govt. Fund, 0.81% | | | | |
Total Short-Term Securities
(cost: $159,335) | | | 159,335 | |
| | | | | | |
| |
Total Investments in Securities - 99.9%
(cost: $4,114,017) | | | 4,667,318 | |
Other Assets and Liabilities, net - 0.1% | | | 2,391 | |
| | | | | | |
| |
Total Net Assets - 100.0% | | | $4,669,709 | |
| | | | | | |
| * | Non-income producing security. |
Numeric footnotes not disclosed are not applicable to this Schedule of Investments
ADR — American Depositary Receipt
PLC — Public Limited Company
A summary of the levels for the Fund’s investments as of June 30, 2017 is as follows (see Note 2 - significant accounting policies in the notes to financial statements):
| | | | | | | | | | | | | | | | | | | | |
| | | Investment in Securities |
| | | Level 1
Quoted
Price ($) | | Level 2
Other significant
observable inputs ($) | | Level 3 Significant
unobservable inputs ($) | | Total ($) |
Common Stocks | | | | | | | | | | | | | | | | | | | | |
Belgium | | | | 77,252 | | | | | — | | | | | — | | | | | 77,252 | |
Canada | | | | 144,988 | | | | | — | | | | | — | | | | | 144,988 | |
China/Hong Kong | | | | 60,307 | | | | | — | | | | | — | | | | | 60,307 | |
France | | | | 83,025 | | | | | 62,121 | | | | | — | | | | | 145,146 | |
Germany | | | | 190,748 | | | | | — | | | | | — | | | | | 190,748 | |
Ireland | | | | 177,315 | | | | | — | | | | | — | | | | | 177,315 | |
Japan | | | | 56,194 | | | | | 44,603 | | | | | — | | | | | 100,797 | |
Netherlands | | | | 211,535 | | | | | — | | | | | — | | | | | 211,535 | |
Spain | | | | 122,141 | | | | | 91,212 | | | | | — | | | | | 213,353 | |
Switzerland | | | | 247,215 | | | | | — | | | | | — | | | | | 247,215 | |
United Kingdom | | | | 189,963 | | | | | — | | | | | — | | | | | 189,963 | |
United States | | | | 2,749,364 | | | | | — | | | | | — | | | | | 2,749,364 | |
Short-Term Securities | | | | 159,335 | | | | | — | | | | | — | | | | | 159,335 | |
Total: | | | | 4,469,382 | | | | | 197,936 | | | | | — | | | | | 4,667,318 | |
The Fund adjusts the closing price of foreign equity securities by applying a systematic process for events occurring after the close of the foreign exchanges. At each reporting period, this process is applied for all foreign securities and therefore all foreign securities are classified as level 2. There are no transfers between level 1 and level 2 between reporting periods as a result of applying this process. Level 1 securities of foreign issuers are primarily American Depositary Receipts (ADRs), Public Limited Companies (PLCs) or Global Depositary Receipts (GDRs). There were no transfers into or out of level 3 during the reporting period.
| | | | |
See accompanying notes to financial statements. | | | | |
JUNE 30, 2017 | | | 29 | |
OBJECTIVE & STRATEGY
The objective of the Sit Midcap® Growth Fund is to maximize long-term capital appreciation. The Fund pursues this objective by investing at least 80% of its net assets in common stocks that, at the time of purchase, have market capitalizations that fall within the range of companies included in the Russell Midcap® Growth Index during the most recent 12-month period. The Russell Midcap® Growth Index ranged from approximately $50 million to $86 billion during the 12-month period ended June 30, 2017.
The Sit Mid Cap Growth Fund’s twelve-month return was +18.74%, compared to +17.05% for the Russell Mid Cap® Growth Index and +16.48% for the Russell Mid Cap® Index.
Stocks posted solid gains over the past year, fueled by hopes for pro-growth policy changes following the election and an improvement in corporate earnings growth as drags diminished from weak energy prices, the stronger dollar, and weak economies outside the U.S. We believe stock prices can grind higher, but earnings growth will likely be the key driver, as valuations for stocks remain generally at historically high levels. In this regard, many technology companies remain highly attractive, given the multitude of growth drivers. Additionally, a combination of our aging population and innovation are resulting in strong earnings growth in the health technology sector. Finally, from a more cyclical perspective, we believe producer manufacturing companies are increasingly attractive based on a rebound in industrial activity in most regions of the world. Regardless of sector, quality remains the overriding theme, with a particular emphasis on free cash flow generation, balance sheet strength, and earnings visibility.
The Fund posted strong returns in both absolute terms and relative to the Russell Mid Cap® Growth Index due to a combination of stock selection and sector positioning. Overweighting the strong-performing electronic technology sector, while underweighting the weak-performing consumer non-durables sector, were key positive factors. In terms of individual stocks, the top performers over the period included Arista Networks (+133% one-year return), Align Technology (+86%), Autodesk (+86%), Applied Materials (+74%), and MACOM Technology Solutions (+69%). Conversely, the Fund was hurt by poor stock selection in the health services and health technology sectors. Laggards in these sectors included Envision Healthcare, Acadia Healthcare, Novavax, Allergan and Alexion Pharmaceuticals.
HYPOTHETICAL GROWTH OF $10,000
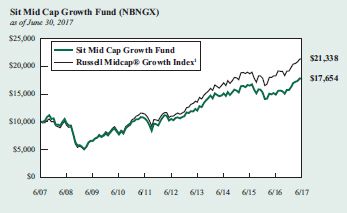
The chart above illustrates the total value of a hypothetical $10,000 investment in the Fund over the past 10 years as compared to the performance of the Russell Midcap® Growth Index. Past performance does not guarantee future results. Returns include the reinvestment of distributions. The chart does not reflect the deduction of taxes that a shareholder would pay on Fund distributions or the redemption of Fund shares.
1 Russell Midcap® Growth Index is an unmanaged index that measures the performance of those Russell Midcap Index companies with higher price-to-book ratios and higher forecasted growth values. It is not possible to invest directly in an index. This is the Fund’s primary index.
Even after strong performance in recent quarters, we believe valuations for holdings within the Fund are attractive relative to both near-and longer-term growth prospects, and that our long-term investment approach will reward shareholders over time.
Roger J. Sit
Kent L. Johnson
Robert W. Sit
Portfolio Managers
| | |
Information on this page is unaudited. | | |
| 30 | | SIT MUTUAL FUNDS ANNUAL REPORT |
COMPARATIVE RATES OF RETURNS
as of June 30, 2017
| | | | | | | | | | | | | | | |
| | | Sit Mid Cap
Growth Fund | | Russell
Midcap®
Growth
Index 1 | | Russell
Midcap®
Index 2 |
One Year | | | | 18.74 | % | | | | 17.05 | % | | | | 16.48 | % |
Five Year | | | | 11.02 | | | | | 14.19 | | | | | 14.72 | |
Ten Year | | | | 5.85 | | | | | 7.87 | | | | | 7.67 | |
Since Inception (9/2/82) | | | | 11.52 | | | | | n/a | | | | | n/a | |
Performance figures are historical and do not guarantee future results. Investment returns and principal value will vary, and you may have a gain or loss when you sell shares. Current performance may be lower or higher than the performance data quoted. Contact the Fund for performance data current to the most recent month-end. Returns include changes in share price as well as reinvestment of all dividends and capital gains and all fee waivers. Without the fee waivers total return and yield figures would have been lower. Returns do not reflect the deduction of the 2% redemption fee imposed if shares are redeemed or exchanged within 30 calendar days from their date of purchase. If imposed, the fee would reduce the performance quoted. Returns do not reflect the deduction of taxes that a shareholder would pay on Fund distributions or the redemption of Fund shares. Management fees and administrative expenses are included in the Fund’s performance. Returns for periods greater than one year are compounded average annual rates of return.
1 Russell Midcap® Growth Index is an unmanaged index that measures the performance of those Russell Midcap Index companies with higher price-to-book ratios and higher forecasted growth values. It is not possible to invest directly in an index.
2 Russell Midcap® Index is an unmanaged index that measures the performance of approximately 800 of the smallest companies in the Russell 1000® Index.
PORTFOLIO SUMMARY
| | |
Net Asset Value 6/30/17: | | $18.06 Per Share |
Net Asset Value 6/30/16: | | $15.36 Per Share |
Total Net Assets: | | $156.3 Million |
Weighted Average Market Cap: | | $25.1 Billion |
TOP 10 HOLDINGS
1. Broadcom, Ltd.
2. Ulta Beauty, Inc.
3. Waste Connections, Inc.
4. Ecolab, Inc.
5. Applied Materials, Inc.
6. priceline.com, Inc.
7. TJX Cos., Inc.
8. Skyworks Solutions, Inc.
9. Alaska Air Group, Inc.
10. Arista Networks, Inc.
Based on total net assets as of June 30, 2017. Subject to change.
FUND DIVERSIFICATION

Based on total net assets as of June 30, 2017. Subject to change.
| | |
Information on this page is unaudited. | | |
JUNE 30, 2017 | | 31 |
SCHEDULE OF INVESTMENTS
June 30, 2017
Sit Mid Cap Growth Fund
| | | | | | |
| | | |
| Quantity | | Name of Issuer | | Fair Value ($) | |
| |
Common Stocks - 95.8% | | | | |
Commercial Services - 2.5% | | | | |
37,900 | | Booz Allen Hamilton Holding Corp. | | | 1,233,266 | |
21,600 | | Cardtronics, PLC * | | | 709,776 | |
15,000 | | Equifax, Inc. | | | 2,061,300 | |
| | | | | | |
| | | | | 4,004,342 | |
| | | | | | |
Communications - 1.3% | | | | |
15,200 | | SBA Communications Corp. * | | | 2,050,480 | |
| | | | | | |
Consumer Durables - 4.6% | | | | |
20,000 | | Electronic Arts, Inc. * | | | 2,114,400 | |
15,100 | | Genuine Parts Co. | | | 1,400,676 | |
23,100 | | Newell Brands, Inc. | | | 1,238,622 | |
12,350 | | Snap-On, Inc. | | | 1,951,300 | |
5,000 | | Thor Industries, Inc. | | | 522,600 | |
| | | | | | |
| | | | | 7,227,598 | |
| | | | | | |
Consumer Non-Durables - 1.3% | | | | |
48,900 | | Coca-Cola European Partners, PLC | | | 1,988,763 | |
| | | | | | |
Consumer Services - 7.0% | | | | |
3,000 | | Chipotle Mexican Grill, Inc. * | | | 1,248,300 | |
43,500 | | Cinemark Holdings, Inc. | | | 1,689,975 | |
53,600 | | Dunkin’ Brands Group, Inc. | | | 2,954,432 | |
33,832 | | Marriott International, Inc. | | | 3,393,688 | |
48,900 | | Service Corp. International | | | 1,635,705 | |
| | | | | | |
| | | | | 10,922,100 | |
| | | | | | |
Electronic Technology - 13.3% | | | | |
17,300 | | Advanced Micro Devices, Inc. * | | | 215,904 | |
98,400 | | Applied Materials, Inc. | | | 4,064,904 | |
22,900 | | Arista Networks, Inc. * | | | 3,430,191 | |
20,700 | | Broadcom, Ltd. | | | 4,824,135 | |
64,800 | | Ciena Corp. * | | | 1,621,296 | |
27,200 | | MACOM Technology Solutions Holdings, Inc. * | | | 1,516,944 | |
9,600 | | NVIDIA Corp. | | | 1,387,776 | |
38,300 | | Skyworks Solutions, Inc. | | | 3,674,885 | |
| | | | | | |
| | | | | 20,736,035 | |
| | | | | | |
Energy Minerals - 1.3% | | | | |
39,010 | | Marathon Petroleum Corp. | | | 2,041,393 | |
| | | | | | |
Finance - 9.3% | | | | |
11,400 | | Affiliated Managers Group, Inc. | | | 1,890,804 | |
7,800 | | Ameriprise Financial, Inc. | | | 992,862 | |
35,300 | | Arthur J Gallagher & Co. | | | 2,020,925 | |
23,600 | | First Republic Bank | | | 2,362,360 | |
28,500 | | Intercontinental Exchange, Inc. | | | 1,878,720 | |
51,600 | | Legg Mason, Inc. | | | 1,969,056 | |
76,400 | | Physicians Realty Trust | | | 1,538,696 | |
8,800 | | SVB Financial Group * | | | 1,546,952 | |
4,900 | | T Rowe Price Group, Inc. | | | 363,629 | |
| | | | | | |
| | | | | 14,564,004 | |
| | | | | | |
| | | | | | |
| | | |
| Quantity | | Name of Issuer | | Fair Value ($) | |
| |
Health Services - 2.9% | | | | |
26,300 | | Centene Corp. * | | | 2,100,844 | |
20,200 | | Envision Healthcare Corp. * | | | 1,265,934 | |
23,100 | | HealthSouth Corp. | | | 1,118,040 | |
| | | | | | |
| | | | | 4,484,818 | |
| | | | | | |
Health Technology - 9.7% | | | | |
7,900 | | Alexion Pharmaceuticals, Inc. * | | | 961,193 | |
12,200 | | Align Technology, Inc. * | | | 1,831,464 | |
8,100 | | Allergan, PLC | | | 1,969,029 | |
12,000 | | Celgene Corp. * | | | 1,558,440 | |
15,800 | | DexCom, Inc. * | | | 1,155,770 | |
11,800 | | Incyte Corp. * | | | 1,485,738 | |
7,900 | | Jazz Pharmaceuticals, PLC * | | | 1,228,450 | |
19,650 | | Thermo Fisher Scientific, Inc. | | | 3,428,336 | |
11,675 | | Zimmer Biomet Holdings, Inc. | | | 1,499,070 | |
| | | | | | |
| | | | | 15,117,490 | |
| | | | | | |
Industrial Services - 2.8% | | | | |
68,250 | | Waste Connections, Inc. | | | 4,396,665 | |
| | | | | | |
Process Industries - 5.1% | | | | |
31,200 | | Ecolab, Inc. | | | 4,141,800 | |
18,800 | | International Paper Co. | | | 1,064,268 | |
30,800 | | Scotts Miracle-Gro Co. | | | 2,755,368 | |
| | | | | | |
| | | | | 7,961,436 | |
| | | | | | |
Producer Manufacturing - 9.7% | | | | |
4,689 | | Adient, PLC | | | 306,567 | |
24,000 | | AMETEK, Inc. | | | 1,453,680 | |
18,700 | | Anixter International, Inc. * | | | 1,462,340 | |
17,700 | | Carlisle Cos., Inc. | | | 1,688,580 | |
9,300 | | Hubbell, Inc. | | | 1,052,481 | |
31,700 | | Ingersoll-Rand, PLC | | | 2,897,063 | |
46,890 | | Johnson Controls International, PLC | | | 2,033,150 | |
18,600 | | Mobileye NV * | | | 1,168,080 | |
20,100 | | Orbital ATK, Inc. | | | 1,977,036 | |
6,600 | | Rockwell Automation, Inc. | | | 1,068,936 | |
| | | | | | |
| | | | | 15,107,913 | |
| | | | | | |
Retail Trade - 6.1% | | | | |
9,900 | | Casey’s General Stores, Inc. | | | 1,060,389 | |
55,300 | | TJX Cos., Inc. | | | 3,991,001 | |
15,600 | | Ulta Beauty, Inc. * | | | 4,482,504 | |
| | | | | | |
| | | | | 9,533,894 | |
| | | | | | |
Technology Services - 14.7% | | | | |
18,700 | | ANSYS, Inc. * | | | 2,275,416 | |
43,500 | | Aspen Technology, Inc. * | | | 2,403,810 | |
17,900 | | Autodesk, Inc. * | | | 1,804,678 | |
36,400 | | Cognizant Technology Solutions Corp. | | | 2,416,960 | |
13,400 | | DST Systems, Inc. | | | 826,780 | |
31,275 | | Euronet Worldwide, Inc. * | | | 2,732,497 | |
30,300 | | Genpact, Ltd. | | | 843,249 | |
2,150 | | priceline.com, Inc. * | | | 4,021,618 | |
| | |
See accompanying notes to financial statements. | | |
| 32 | | SIT MUTUAL FUNDS ANNUAL REPORT |
| | | | | | |
| | | |
| Quantity | | Name of Issuer | | Fair Value ($) | |
| | |
28,900 | | PTC, Inc. * | | | 1,592,968 | |
16,400 | | Splunk, Inc. * | | | 932,996 | |
14,700 | | Ultimate Software Group, Inc. * | | | 3,087,882 | |
| | | | | | |
| | | | | 22,938,854 | |
| | | | | | |
Transportation - 3.1% | | | | |
40,100 | | Alaska Air Group, Inc. | | | 3,599,376 | |
9,400 | | Ryder System, Inc. | | | 676,612 | |
10,200 | | XPO Logistics, Inc. * | | | 659,226 | |
| | | | | | |
| | | | | 4,935,214 | |
| | | | | | |
Utilities - 1.1% | | | | |
27,800 | | WEC Energy Group, Inc. | | | 1,706,364 | |
| | | | | | |
| |
Total Common Stocks
(cost: $83,721,213) | | | 149,717,363 | |
| | | | | | |
| | | | | | |
| | | |
| Quantity | | Name of Issuer | | Fair Value ($) | |
| |
Short-Term Securities - 5.1% | | | | |
7,928,619 | | Fidelity Instl. Money Mkt. Govt. Fund, 0.81% | | | | |
Total Short-Term Securities
(cost: $7,928,619) | | | 7,928,619 | |
| | | | | | |
| |
Total Investments in Securities - 100.9%
(cost: $91,649,832) | | | 157,645,982 | |
Other Assets and Liabilities, net - (0.9%) | | | (1,341,080 | ) |
| | | | | | |
| |
Total Net Assets - 100.0% | | | $156,304,902 | |
| | | | | | |
| * | Non-income producing security. |
Numeric footnotes not disclosed are not applicable to this Schedule of Investments.
PLC — Public Limited Company
A summary of the levels for the Fund’s investments as of June 30, 2017 is as follows (see Note 2 - significant accounting policies in the notes to financial statements):
| | | | | | | | | | | | |
| | | Investment in Securities | |
| | | Level 1
Quoted
Price ($) | | | Level 2
Other significant
observable inputs ($) | | Level 3 Significant
unobservable inputs ($) | | Total ($) | |
Common Stocks ** | | | 149,717,363 | | | — | | — | | | 149,717,363 | |
Short-Term Securities | | | 7,928,619 | | | — | | — | | | 7,928,619 | |
Total: | | | 157,645,982 | | | — | | — | | | 157,645,982 | |
| ** | For equity securities categorized in a single level, refer to the Schedule of Investments for further breakdown. |
For the reporting period, there were no transfers between levels 1, 2 and 3.
| | | | |
See accompanying notes to financial statements. | | | | |
JUNE 30, 2017 | | | 33 | |
|
|
| |
Sit Small Cap Dividend Growth Fund Class I and Class S |
OBJECTIVE & STRATEGY
The objective of the Sit Small Cap Dividend Growth Fund is to provide current income that exceeds the Fund’s benchmark index and that grows over a period of years. Secondarily the Fund seeks long-term capital appreciation. The Fund seeks to achieve its objectives by investing, under normal market conditions, at least 80% of its net assets in small cap dividend-paying common stocks that have market capitalizations at the time of purchase of up to $3.0 billion, or up to the market capitalization of the largest company included in the Russell 2000® Index measured at the end of the previous twelve months ($16.0 billion as of June 30, 2017). The Fund may invest the balance of its assets in preferred stocks, convertible bonds, U.S. Treasury securities (including Treasury bills, notes and bonds), closed-end investment companies, and master limited partnerships.
The Sit Small Cap Dividend Growth Fund Class I posted a +15.84% return over the last past twelve months, comparing unfavorably to the +24.60% return for the Russell 2000® Index. The Fund’s gross dividend yield of 2.10% (before deducting Fund expenses), as of 6/30/17, compared to 1.39% for the Russell 2000® Index.
Small capitalization stocks posted solid gains over the past twelve months, as investor sentiment was boosted by higher corporate earnings and the prospect for pro-growth policies from the Trump Administration. Although progress in Washington, D.C. has been frustratingly slow, we believe there will be some traction on key initiatives, particularly deregulation and tax reductions. This should have a very positive impact on many small companies that tend to be domestically-focused and have relatively high tax burdens. We believe the financial sector, which is the heaviest-weighted group in the Fund, has the most to gain if progress is made. Regardless of sector, we remain focused on quality companies that have strong balance sheets and exhibit consistent growth in earnings, cash flow, and dividends over the longer term. We are encouraged by the significant dividend boosts for companies held in the Fund, as 71 out of 97 companies raised their dividends in the past twelve months, with an average increase of 8%.
The Fund lagged the Russell 2000® Index over the past year for three key reasons. First, we had poor stock selection in the finance (largely due to poor performance of REIT positions) and commercial services sectors. Second, the Fund’s relatively high average cash balance diluted returns amid the strong market return backdrop. Finally, many non-dividend paying stocks (particularly in technology and biotechnology), which are not part of our investment universe for this Fund, did exceptionally well over the period. On a positive note, the Fund did have many strong performers during the period, including Huntsman, Kingstone, East West Bancorp, Capella Education, and Thor Industries. Each of these stocks returned 60% or more during the past year.
HYPOTHETICAL GROWTH OF $10,000
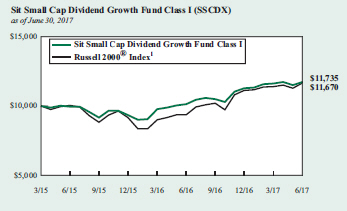
The chart above illustrates the total value of a hypothetical $10,000 investment in the Fund over the past 10 years as compared to the performance of the Russell 2000® Index. Past performance does not guarantee future results. Returns include the reinvestment of distributions. The chart does not reflect the deduction of taxes that a shareholder would pay on Fund distributions or the redemption of Fund shares.
1 Russell 2000® Index is an unmanaged index that measures the performance of the 2,000 smallest companies in the Russell 3000® Index, an index consisting of the 3,000 largest U.S. companies based on market capitalization. It is not possible to invest directly in an index. This is the Fund’s primary index.
We believe the Fund offers an attractive option for investors to gain exposure to small cap stocks in a relatively conservative manner. Although the Fund struggled to keep up with surging small cap indices over the past year, we strongly believe in the long-term merits of this strategy.
| | | | |
Roger J. Sit | | Michael T. Manns | | |
Kent L. Johnson | | Robert W. Sit | | |
| Portfolio Managers | | | | |
| | |
Information on this page is unaudited. | | |
| 34 | | SIT MUTUAL FUNDS ANNUAL REPORT |
COMPARATIVE RATES OF RETURNS
as of June 30, 2017
| | | | | | | | | | | | |
| | | Sit Small Cap
Dividend
Growth Fund | | | Russell
2000® Index 1 | |
| | | Class I | | | Class S | | |
One Year | | | 15.84 | % | | | 15.46 | % | | | 24.60 | % |
Since Inception
(3/31/15) | | | 7.36 | | | | 7.09 | | | | 7.10 | |
Performance figures are historical and do not guarantee future results. Investment returns and principal value will vary, and you may have a gain or loss when you sell shares. Current performance may be lower or higher than the performance data quoted. Contact the Fund for performance data current to the most recent month-end. Returns include changes in share price as well as reinvestment of all dividends and capital gains. Returns do not reflect the deduction of the 2% redemption fee imposed if shares are redeemed or exchanged within 30 calendar days from their date of purchase. If imposed, the fee would reduce the performance quoted. Returns do not reflect the deduction of taxes that a shareholder would pay on Fund distributions or the redemption of Fund shares. Management fees and administrative expenses are included in the Fund’s performance. Returns for periods greater than one year are compounded average annual rates of return.
1 Russell 2000® Index is an unmanaged index that measures the performance of the 2,000 smallest companies in the Russell 3000® Index, an index consisting of the 3,000 largest U.S. companies based on market capitalization. It is not possible to directly invest in an index.
PORTFOLIO SUMMARY
| | | | |
| | |
Class I: | | | | |
Net Asset Value 6/30/17: | | $11.47 | | Per Share |
Net Asset Value 6/30/16: | | $10.00 | | Per Share |
Total Net Assets: | | $12.7 | | Million |
Class S: | | | | |
Net Asset Value 6/30/17: | | $11.46 | | Per Share |
Net Asset Value 6/30/16: | | $10.00 | | Per Share |
Total Net Assets: | | $3.5 | | Million |
| | |
Weighted Average Market Cap: | | $4.3 | | Billion |
TOP 10 HOLDINGS
|
|
1. East West Bancorp, Inc. |
2. MKS Instruments, Inc. |
3. Provident Financial Services, Inc. |
4. Scotts Miracle-Gro Co. |
5. Wintrust Financial Corp. |
6. Dunkin’ Brands Group, Inc. |
7. Physicians Realty Trust |
8. Legg Mason, Inc. |
9. Power Integrations, Inc. |
10. DST Systems, Inc. |
Based on total net assets as of June 30, 2017. Subject to change.
FUND DIVERSIFICATION
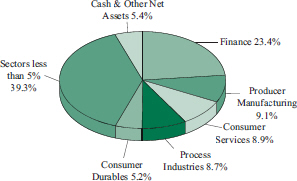
Based on total net assets as of June 30, 2017. Subject to change.
| | |
Information on this page is unaudited. | | |
JUNE 30, 2017 | | 35 |
SCHEDULE OF INVESTMENTS
June 30, 2017
Sit Small Cap Dividend Growth Fund
| | | | | | |
Quantity | | Name of Issuer | | Fair Value ($) | |
| |
Common Stocks - 94.0% | | | | |
Commercial Services - 3.6% | | | | |
6,575 | | Booz Allen Hamilton Holding Corp. | | | 213,951 | |
3,350 | | Deluxe Corp. | | | 231,887 | |
4,725 | | Herman Miller, Inc. | | | 143,640 | |
| | | | | | |
| | | | | 589,478 | |
| | | | | | |
Communications - 1.4% | | | | |
7,200 | | Shenandoah Telecommunications Co. | | | 221,040 | |
| | | | | | |
Consumer Durables - 5.2% | | | | |
5,600 | | Ethan Allen Interiors, Inc. | | | 180,880 | |
800 | | Snap-On, Inc. | | | 126,400 | |
2,300 | | Thor Industries, Inc. | | | 240,396 | |
1,925 | | Toro Co. | | | 133,383 | |
2,350 | | Tupperware Brands Corp. | | | 165,040 | |
| | | | | | |
| | | | | 846,099 | |
| | | | | | |
Consumer Non-Durables - 4.7% | | | | |
5,200 | | B&G Foods, Inc. | | | 185,120 | |
900 | | Carter’s, Inc. | | | 80,055 | |
2,800 | | Fresh Del Monte Produce, Inc. | | | 142,548 | |
2,900 | | Pinnacle Foods, Inc. | | | 172,260 | |
2,300 | | Sensient Technologies Corp. | | | 185,219 | |
| | | | | | |
| | | | | 765,202 | |
| | | | | | |
Consumer Services - 8.9% | | | | |
8,800 | | Bloomin’ Brands, Inc. | | | 186,824 | |
2,625 | | Brinker International, Inc. | | | 100,013 | |
1,600 | | Capella Education Co. | | | 136,960 | |
4,925 | | Cinemark Holdings, Inc. | | | 191,336 | |
4,825 | | Dunkin’ Brands Group, Inc. | | | 265,954 | |
6,250 | | Service Corp. International | | | 209,062 | |
9,900 | | Time, Inc. | | | 142,065 | |
1,025 | | Vail Resorts, Inc. | | | 207,901 | |
| | | | | | |
| | | | | 1,440,115 | |
| | | | | | |
Electronic Technology - 4.8% | | | | |
4,375 | | MKS Instruments, Inc. | | | 294,438 | |
2,425 | | Monolithic Power Systems, Inc. | | | 233,770 | |
3,400 | | Power Integrations, Inc. | | | 247,860 | |
| | | | | | |
| | | | | 776,068 | |
| | | | | | |
Energy Minerals - 1.4% | | | | |
1,339 | | Tesoro Corp. | | | 125,291 | |
3,050 | | Vermilion Energy, Inc. | | | 96,776 | |
| | | | | | |
| | | | | 222,067 | |
| | | | | | |
Finance - 23.4% | | | | |
4,375 | | BankUnited, Inc. | | | 147,481 | |
5,825 | | Berkshire Hills Bancorp, Inc. | |
| 204,749
|
|
5,775 | | CoBiz Financial, Inc. | | | 100,485 | |
3,850 | | Columbia Banking System, Inc. | | | 153,423 | |
3,325 | | CubeSmart | | | 79,933 | |
| | | | | | |
Quantity | | Name of Issuer | | Fair Value ($) | |
| | |
6,200 | | Donegal Group, Inc. | | | 98,580 | |
6,900 | | East West Bancorp, Inc. | | | 404,202 | |
1,300 | | Equity LifeStyle Properties, Inc. | | | 112,242 | |
1,900 | | Evercore Partners, Inc. | | | 133,950 | |
7,275 | | Farmland Partners, Inc. | | | 65,038 | |
5,625 | | Great Western Bancorp, Inc. | | | 229,556 | |
825 | | Hanover Insurance Group, Inc. | | | 73,120 | |
4,778 | | Janus Henderson Group, PLC * | | | 158,199 | |
9,800 | | Kingstone Cos, Inc. | | | 149,940 | |
6,550 | | Legg Mason, Inc. | | | 249,948 | |
2,050 | | Macquarie Infrastructure Corp. | | | 160,720 | |
4,750 | | Old National Bancorp | | | 81,938 | |
1,100 | | PacWest Bancorp | | | 51,370 | |
12,600 | | Physicians Realty Trust | | | 253,764 | |
2,025 | | Piper Jaffray Cos | | | 121,399 | |
11,200 | | Provident Financial Services, Inc. | | | 284,256 | |
3,800 | | STORE Capital Corp. | | | 85,310 | |
2,300 | | Validus Holdings, Ltd. | | | 119,531 | |
3,500 | | Wintrust Financial Corp. | | | 267,540 | |
| | | | | | |
| | | | | 3,786,674 | |
| | | | | | |
Health Services - 2.4% | | | | |
3,625 | | Healthcare Services Group, Inc. | | | 169,759 | |
4,550 | | HealthSouth Corp. | | | 220,220 | |
| | | | | | |
| | | | | 389,979 | |
| | | | | | |
Health Technology - 4.3% | | | | |
1,675 | | PerkinElmer, Inc. | | | 114,134 | |
6,300 | | Phibro Animal Health Corp. | | | 233,415 | |
2,500 | | STERIS, PLC | | | 203,750 | |
725 | | Teleflex, Inc. | | | 150,626 | |
| | | | | | |
| | | | | 701,925 | |
| | | | | | |
Industrial Services - 1.8% | | | | |
1,900 | | EMCOR Group, Inc. | | | 124,222 | |
2,588 | | Waste Connections, Inc. | | | 166,687 | |
| | | | | | |
| | | | | 290,909 | |
| | | | | | |
Non-Energy Minerals - 1.5% | | | | |
3,950 | | Commercial Metals Co. | | | 76,748 | |
2,000 | | Potlatch Corp. | | | 91,400 | |
2,100 | | US Silica Holdings, Inc. | | | 74,529 | |
| | | | | | |
| | | | | 242,677 | |
| | | | | | |
Process Industries - 8.7% | | | | |
2,900 | | Apogee Enterprises, Inc. | | | 164,836 | |
1,900 | | Avery Dennison Corp. | | | 167,903 | |
3,575 | | Domtar Corp. | | | 137,352 | |
3,100 | | Green Plains, Inc. | | | 63,705 | |
4,650 | | Huntsman Corp. | | | 120,156 | |
1,375 | | Ingredion, Inc. | | | 163,914 | |
1,550 | | Neenah Paper, Inc. | | | 124,388 | |
| | |
See accompanying notes to financial statements. | | |
| 36 | | SIT MUTUAL FUNDS ANNUAL REPORT |
| | | | | | |
Quantity | | Name of Issuer | | Fair Value ($) | |
| | |
9,475 | | Orion Engineered Carbons SA | | | 189,026 | |
3,025 | | Scotts Miracle-Gro Co. | | | 270,616 | |
| | | | | | |
| | | | | 1,401,896 | |
| | | | | | |
Producer Manufacturing - 9.1% | | | | |
1,300 | | Applied Industrial Technologies, Inc. | | | 76,765 | |
4,100 | | Atkore International Group, Inc. * | | | 92,455 | |
1,700 | | Carlisle Cos, Inc. | | | 162,180 | |
2,100 | | Crane Co. | | | 166,698 | |
1,500 | | Hubbell, Inc. | | | 169,755 | |
925 | | Lincoln Electric Holdings, Inc. | | | 85,183 | |
1,375 | | MSA Safety, Inc. | | | 111,609 | |
2,250 | | Orbital ATK, Inc. | | | 221,310 | |
3,100 | | Oshkosh Corp. | | | 213,528 | |
1,075 | | Watsco, Inc. | | | 165,765 | |
| | | | | | |
| | | | | 1,465,248 | |
| | | | | | |
Retail Trade - 3.0% | | | | |
2,825 | | Big Lots, Inc. | | | 136,448 | |
6,400 | | Camping World Holdings, Inc. | | | 197,440 | |
1,350 | | Casey’s General Stores, Inc. | | | 144,599 | |
| | | | | | |
| | | | | 478,487 | |
| | | | | | |
Technology Services - 3.4% | | | | |
575 | | Blackbaud, Inc. | | | 49,306 | |
1,800 | | Broadridge Financial Solutions, Inc. | | | 136,008 | |
3,900 | | DST Systems, Inc. | | | 240,630 | |
3,150 | | ManTech International Corp. | | | 130,347 | |
| | | | | | |
| | | | | 556,291 | |
| | | | | | |
| | | | | | |
Quantity | | Name of Issuer | | Fair Value ($) | |
| |
Transportation - 2.6% | | | | |
2,100 | | Alaska Air Group, Inc. | | | 188,497 | |
4,725 | | Golar LNG, Ltd. | | | 105,131 | |
1,700 | | Ryder System, Inc. | | | 122,366 | |
| | | | | | |
| | | | | 415,994 | |
| | | | | | |
Utilities - 3.8% | | | | |
2,000 | | Black Hills Corp. | | | 134,940 | |
1,550 | | Connecticut Water Service, Inc. | | | 86,040 | |
6,300 | | Covanta Holding Corp. | | | 83,160 | |
3,775 | | New Jersey Resources Corp. | | | 149,868 | |
2,350 | | Spire, Inc. | | | 163,912 | |
| | | | | | |
| | | | | 617,920 | |
| | | | | | |
| |
Total Common Stocks
(cost: $13,223,817) | | | 15,208,069 | |
| | | | | | |
| |
Investment Companies - 0.6% | | | | |
2,900 | | Tortoise Energy Infrastructure Corp. | | | 88,131 | |
| | | | | | |
| |
(cost: $107,796) | | | | |
| |
Short-Term Securities - 6.0% | | | | |
976,380 | | Fidelity Instl. Money Mkt. Govt. Fund, 0.81% | | | | |
Total Short-Term Securities
(cost: $976,380) | | | 976,380 | |
| | | | | | |
| |
Total Investments in Securities - 100.6%
(cost: $14,307,993) | | | 16,272,580 | |
Other Assets and Liabilities, net - (0.6%) | | | (96,021 | ) |
| | | | | | |
| |
Total Net Assets - 100.0% | | | $16,176,559 | |
| | | | | | |
| * | Non-income producing security. |
Numeric footnotes not disclosed are not applicable to this Schedule of Investments.
PLC — Public Limited Company
A summary of the levels for the Fund’s investments as of June 30, 2017 is as follows (see Note 2 - significant accounting policies in the notes to financial statements):
| | | | | | | | | | | | |
| | | Investment in Securities | |
| | | Level 1
Quoted
Price ($) | | | Level 2
Other significant
observable inputs ($) | | Level 3 Significant
unobservable inputs ($) | | Total ($) | |
Common Stocks ** | | | 15,208,069 | | | — | | — | | | 15,208,069 | |
Investment Companies | | | 88,131 | | | — | | — | | | 88,131 | |
Short-Term Securities | | | 976,380 | | | — | | — | | | 976,380 | |
| | | | |
Total: | | | 16,272,580 | | | — | | — | | | 16,272,580 | |
| ** | For equity securities categorized in a single level, refer to the Schedule of Investments for further breakdown. |
For the reporting period, there were no transfers between levels 1, 2 and 3.
| | | | |
See accompanying notes to financial statements. | | | | |
JUNE 30, 2017 | | | 37 | |
|
|
| |
Sit Small Cap Growth Fund |
OBJECTIVE & STRATEGY
The objective of the Sit Small Cap Growth Fund is to maximize long-term capital appreciation. The Fund seeks to achieve its objective by investing, under normal market conditions, at least 80% of its net assets in common stocks of companies with market capitalizations at the time of purchase of up to $3.0 billion, or up to the market capitalization of the largest company included in the Russell 2000® Index measured at the end of the previous twelve months ($16.0 billion as of June 30, 2017).
The Adviser invests in a diversified group of growing small companies it believes exhibit the potential for superior growth. The Adviser believes that a company’s earnings growth is the primary determinant of its potential long-term return and evaluates a company’s potential for above average long-term earnings and revenue growth.
The Sit Small Cap Growth Fund returned +19.06% over the past twelve months. This compares to the return of +24.40% for the Russell 2000® Growth Index and the +24.60% return for the Russell 2000® Index.
Small stocks surged over the past year, due to a combination of hopes for policy change (following the U.S. elections last November), an uptick in corporate earnings growth, and a benign inflation/interest rate backdrop. Importantly, breadth has been broad-based, as many sectors have participated in the market rally. Technology and health care (particularly biotech) have fared particularly well, due to investors rotating towards groups with secular, differentiated growth in what remains a sluggish economic environment. With overall equity valuations at historically high levels, we strongly believe quality, growth and diversification must be emphasized, as we expect volatility to pick up (perhaps from a less-accommodative Federal Reserve) over the next several quarters. The heaviest-weighted sectors in the Fund are health technology, technology services, and electronic technology. We also have significant exposure to the finance (particularly banking) and producer manufacturing sectors, as these are cyclical groups that should respond quickly if/when the Trump Administration’s pro-growth policies, particularly tax reform, gain traction. The Fund has only modest exposure to slower-growing groups, such as utilities, energy minerals, and consumer non-durables.
The Fund’s underperformance relative to the Russell 2000® Growth Index could largely be attributed to negative stock selection in three areas: health services, technology services, and health technology. Poor performers within these sectors included Envision Healthcare, Acadia Healthcare, Manhattan Associates, Ultimate Software and Novavax. On the positive side, strong stock selection in the producer manufacturing, consumer services, and energy minerals sectors aided relative returns. Top performers across the portfolio during
HYPOTHETICAL GROWTH OF $10,000
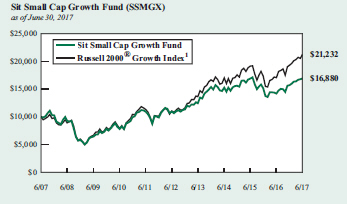
The chart above illustrates the total value of a hypothetical $10,000 investment in the Fund over the past 10 years as compared to the performance of the Russell 2000® Growth Index. Past performance does not guarantee future results. Returns include the reinvestment of distributions. The chart does not reflect the deduction of taxes that a shareholder would pay on Fund distributions or the redemption of Fund shares.
1 Russell 2000® Growth Index is an unmanaged index that measures the performance of those Russell 2000 Index companies with higher price-to-book ratios and higher forecasted growth values. It is not possible to invest directly in an index. This is the Fund’s primary index.
the period included Arista Networks, Ionis Pharmaceuticals, Take-Two Interactive, Align Technology, and Western Refining.
Our research staff remains highly-focused on identifying companies that will deliver consistent long-term earnings growth. We continue to appreciate shareholders’ interest in the Fund.
| | | | |
Roger J. Sit | | Michael J. Stellmacher | | |
Kent L. Johnson | | Robert W. Sit | | |
Portfolio Managers | | | | |
| | |
Information on this page is unaudited. | | |
| 38 | | SIT MUTUAL FUNDS ANNUAL REPORT |
COMPARATIVE RATES OF RETURNS
as of June 30, 2017
| | | | | | | | | | | | |
| | | Sit
Small Cap
Growth
Fund | | | Russell 2000®
Growth Index 1 | | | Russell
2000®
Index 2 | |
One Year | | | 19.06 | % | | | 24.40 | % | | | 24.60 | % |
Five Year | | | 9.07 | | | | 13.98 | | | | 13.70 | |
Ten Year | | | 5.37 | | | | 7.82 | | | | 6.92 | |
Since Inception (7/1/94) | | | 10.10 | | | | 8.03 | | | | 9.46 | |
Performance figures are historical and do not guarantee future results. Investment returns and principal value will vary, and you may have a gain or loss when you sell shares. Current performance may be lower or higher than the performance data quoted. Contact the Fund for performance data current to the most recent month-end. Returns include changes in share price as well as reinvestment of all dividends and capital gains. Returns do not reflect the deduction of the 2% redemption fee imposed if shares are redeemed or exchanged within 30 calendar days from their date of purchase. If imposed, the fee would reduce the performance quoted. Returns do not reflect the deduction of taxes that a shareholder would pay on Fund distributions or the redemption of Fund shares. Management fees and administrative expenses are included in the Fund’s performance. Returns for periods greater than one year are compounded average annual rates of return.
1 Russell 2000® Growth Index is an unmanaged index that measures the performance of those Russell 2000 Index companies with higher price-to-book ratios and higher forecasted growth values. It is not possible to invest directly in an index.
2 Russell 2000® Index is an unmanaged index that measures the performance of the 2,000 smallest companies in the Russell 3000® Index, an index consisting of the 3,000 largest U.S. companies based on market capitalization.
PORTFOLIO SUMMARY
| | | | |
| | |
Net Asset Value 6/30/17: | | $54.18 | | Per Share |
Net Asset Value 6/30/16: | | $45.59 | | Per Share |
Total Net Assets: | | $90.8 | | Million |
Weighted Average Market Cap: | | $7.4 | | Billion |
TOP 10 HOLDINGS
|
|
1. Waste Connections, Inc. |
2. Skyworks Solutions, Inc. |
3. First Republic Bank/CA |
4. Ultimate Software Group, Inc. |
5. Ulta Beauty, Inc. |
6. Dunkin’ Brands Group, Inc. |
7. Arista Networks, Inc. |
8. K2M Group Holdings, Inc. |
9. Euronet Worldwide, Inc. |
10. On Assignment, Inc. |
Based on total net assets as of June 30, 2017. Subject to change.
FUND DIVERSIFICATION
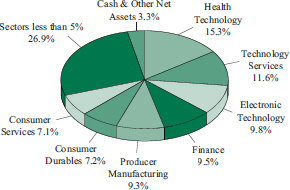
Based on total net assets as of June 30, 2017. Subject to change.
| | |
Information on this page is unaudited. | | |
JUNE 30, 2017 | | 39 |
SCHEDULE OF INVESTMENTS
June 30, 2017
Sit Small Cap Growth Fund
| | | | | | |
| | | |
| Quantity | | Name of Issuer | | Fair Value ($) | |
| |
Common Stocks - 96.7% | | | | |
Commercial Services - 4.3% | | | | |
40,100 | | Booz Allen Hamilton Holding Corp. | | | 1,304,854 | |
12,525 | | Cardtronics, PLC * | | | 411,572 | |
8,800 | | Deluxe Corp. | | | 609,136 | |
29,400 | | On Assignment, Inc. * | | | 1,592,010 | |
| | | | | | |
| | | | | 3,917,572 | |
| | | | | | |
Communications - 1.8% | | | | |
7,000 | | SBA Communications Corp. * | | | 944,300 | |
22,300 | | Shenandoah Telecommunications Co. | | | 684,610 | |
| | | | | | |
| | | | | 1,628,910 | |
| | | | | | |
Consumer Durables - 7.2% | | | | |
23,500 | | Century Communities, Inc. * | | | 582,800 | |
22,600 | | Ethan Allen Interiors, Inc. | | | 729,980 | |
8,500 | | Snap-On, Inc. | | | 1,343,000 | |
20,300 | | Take-Two Interactive Software, Inc. * | | | 1,489,614 | |
12,800 | | Tenneco, Inc. | | | 740,224 | |
11,200 | | Thor Industries, Inc. | | | 1,170,624 | |
6,700 | | Tupperware Brands Corp. | | | 470,541 | |
| | | | | | |
| | | | | 6,526,783 | |
| | | | | | |
Consumer Non-Durables - 0.7% | | | | |
10,200 | | Pinnacle Foods, Inc. | | | 605,880 | |
| | | | | | |
Consumer Services - 7.1% | | | | |
3,000 | | Buffalo Wild Wings, Inc. * | | | 380,100 | |
7,200 | | Capella Education Co. | | | 616,320 | |
25,200 | | Cinemark Holdings, Inc. | | | 979,020 | |
31,000 | | Dunkin’ Brands Group, Inc. | | | 1,708,720 | |
5,900 | | Grand Canyon Education, Inc. * | | | 462,619 | |
28,600 | | Service Corp. International | | | 956,670 | |
6,600 | | Vail Resorts, Inc. | | | 1,338,678 | |
| | | | | | |
| | | | | 6,442,127 | |
| | | | | | |
Electronic Technology - 9.8% | | | | |
5,600 | | Ambarella, Inc. * | | | 271,880 | |
11,200 | | Arista Networks, Inc. * | | | 1,677,648 | |
47,000 | | Ciena Corp. * | | | 1,175,940 | |
19,000 | | MACOM Technology Solutions Holdings, Inc. * | | | 1,059,630 | |
13,700 | | MKS Instruments, Inc. | | | 922,010 | |
9,200 | | Monolithic Power Systems, Inc. | | | 886,880 | |
21,900 | | Skyworks Solutions, Inc. | | | 2,101,305 | |
16,000 | | Synaptics, Inc. * | | | 827,360 | |
| | | | | | |
| | | | | 8,922,653 | |
| | | | | | |
Energy Minerals - 0.8% | | | | |
7,332 | | Tesoro Corp. | | | 686,236 | |
| | | | | | |
Finance - 9.5% | | | | |
6,100 | | Affiliated Managers Group, Inc. | | | 1,011,746 | |
10,100 | | East West Bancorp, Inc. | | | 591,658 | |
18,900 | | First Republic Bank/CA | | | 1,891,890 | |
| | | | | | |
| | | |
| Quantity | | Name of Issuer | | Fair Value ($) | |
| | |
26,600 | | Legg Mason, Inc. | | | 1,015,056 | |
21,200 | | National General Holdings Corp. | | | 447,320 | |
14,900 | | PacWest Bancorp | | | 695,830 | |
55,400 | | Physicians Realty Trust | | | 1,115,756 | |
6,400 | | SVB Financial Group * | | | 1,125,056 | |
14,000 | | Validus Holdings, Ltd. | | | 727,580 | |
| | | | | | |
| | | | | 8,621,892 | |
| | | | | | |
Health Services - 2.8% | | | | |
8,300 | | Acadia Healthcare Co., Inc. * | | | 409,854 | |
11,800 | | Envision Healthcare Corp. * | | | 739,506 | |
21,690 | | Healthcare Services Group, Inc. | | | 1,015,743 | |
8,450 | | HealthSouth Corp. | | | 408,980 | |
| | | | | | |
| | | | | 2,574,083 | |
| | | | | | |
Health Technology - 15.3% | | | | |
4,500 | | Alexion Pharmaceuticals, Inc. * | | | 547,515 | |
7,650 | | Align Technology, Inc. * | | | 1,148,418 | |
5,400 | | Bio-Techne Corp. | | | 634,500 | |
7,000 | | Celgene Corp. * | | | 909,090 | |
43,000 | | Corcept Therapeutics, Inc. * | | | 507,400 | |
13,400 | | DBV Technologies SA * | | | 478,514 | |
9,150 | | DexCom, Inc. * | | | 669,322 | |
7,700 | | Exact Sciences Corp. * | | | 272,349 | |
50,100 | | Halozyme Therapeutics, Inc. * | | | 642,282 | |
17,900 | | Ionis Pharmaceuticals, Inc. * | | | 910,573 | |
66,000 | | K2M Group Holdings, Inc. * | | | 1,607,760 | |
33,000 | | NxStage Medical, Inc. * | | | 827,310 | |
8,400 | | PerkinElmer, Inc. | | | 572,376 | |
32,000 | | Phibro Animal Health Corp. | | | 1,185,600 | |
14,700 | | Sarepta Therapeutics, Inc. * | | | 495,537 | |
15,900 | | STERIS, PLC | | | 1,295,850 | |
34,800 | | VWR Corp. * | | | 1,148,748 | |
| | | | | | |
| | | | | 13,853,144 | |
| | | | | | |
Industrial Services - 4.3% | | | | |
21,400 | | EMCOR Group, Inc. | | | 1,399,132 | |
38,700 | | Waste Connections, Inc. | | | 2,493,054 | |
| | | | | | |
| | | | | 3,892,186 | |
| | | | | | |
Process Industries - 3.8% | | | | |
16,200 | | Apogee Enterprises, Inc. | | | 920,808 | |
15,800 | | Domtar Corp. | | | 607,036 | |
19,600 | | Green Plains, Inc. | | | 402,780 | |
16,800 | | Scotts Miracle-Gro Co. | | | 1,502,928 | |
| | | | | | |
| | | | | 3,433,552 | |
| | | | | | |
Producer Manufacturing - 9.3% | | | | |
10,800 | | Anixter International, Inc. * | | | 844,560 | |
22,325 | | Atkore International Group, Inc. * | | | 503,429 | |
15,800 | | Crane Co. | | | 1,254,204 | |
7,300 | | Hubbell, Inc. | | | 826,141 | |
8,100 | | IDEX Corp. | | | 915,381 | |
| | |
See accompanying notes to financial statements. | | |
| 40 | | SIT MUTUAL FUNDS ANNUAL REPORT |
| | | | | | |
Quantity | | Name of Issuer | | Fair Value ($) | |
| | |
8,300 | | Lincoln Electric Holdings, Inc. | | | 764,347 | |
6,600 | | MSA Safety, Inc. | | | 535,722 | |
11,900 | | Orbital ATK, Inc. | | | 1,170,484 | |
9,900 | | Oshkosh Corp. | | | 681,912 | |
8,400 | | Wabtec Corp. | | | 768,600 | |
1,225 | | Watsco, Inc. | | | 188,895 | |
| | | | | | |
| | | | | 8,453,675 | |
| | | | | | |
Retail Trade - 4.2% | | | | |
3,400 | | Big Lots, Inc. | | | 164,220 | |
33,550 | | Camping World Holdings, Inc. | | | 1,035,017 | |
8,400 | | Casey’s General Stores, Inc. | | | 899,724 | |
5,950 | | Ulta Beauty, Inc. * | | | 1,709,673 | |
| | | | | | |
| | | | | 3,808,634 | |
| | | | | | |
Technology Services - 11.6% | | | | |
9,300 | | ANSYS, Inc. * | | | 1,131,624 | |
25,000 | | Aspen Technology, Inc. * | | | 1,381,500 | |
3,400 | | Blackbaud, Inc. | | | 291,550 | |
21,800 | | DST Systems, Inc. | | | 1,345,060 | |
18,300 | | Euronet Worldwide, Inc. * | | | 1,598,871 | |
12,550 | | GoDaddy, Inc. * | | | 532,371 | |
10,800 | | Manhattan Associates, Inc. * | | | 519,048 | |
13,100 | | Paycom Software, Inc. * | | | 896,171 | |
19,300 | | PTC, Inc. * | | | 1,063,816 | |
8,600 | | Ultimate Software Group, Inc. * | | | 1,806,516 | |
| | | | | | |
| | | | | 10,566,527 | |
| | | | | | |
| | | | | | |
Quantity | | Name of Issuer | | Fair Value ($) | |
| |
Transportation - 3.0% | | | | |
16,200 | | Alaska Air Group, Inc. | | | 1,454,112 | |
6,900 | | Atlas Air Worldwide Holdings, Inc. * | | | 359,835 | |
21,800 | | Marten Transport, Ltd. | | | 597,320 | |
4,800 | | Ryder System, Inc. | | | 345,504 | |
| | | | | | |
| | | | | 2,756,771 | |
| | | | | | |
Utilities - 1.2% | | | | |
12,107 | | Fortis, Inc. | | | 425,561 | |
10,100 | | Spire, Inc. | | | 704,475 | |
| | | | | | |
| | | | | 1,130,036 | |
| | | | | | |
Total Common Stocks
(cost: $57,571,908) | | | 87,820,661 | |
| | | | | | |
| |
Short-Term Securities - 4.3% | | | | |
3,878,475 | | Fidelity Instl. Money Mkt. Govt. Fund, 0.81% | | | | |
Total Short-Term Securities
(cost: $3,878,475) | | | 3,878,475 | |
| | | | | | |
| |
Total Investments in Securities - 101.0%
(cost: $61,450,383) | | | 91,699,136 | |
Other Assets and Liabilities, net - (1.0%) | | | (882,392 | ) |
| | | | | | |
| |
Total Net Assets - 100.0% | | | $90,816,744 | |
| | | | | | |
| * | Non-income producing security. |
Numeric footnotes not disclosed are not applicable to this Schedule of Investments.
PLC — Public Limited Company
A summary of the levels for the Fund’s investments as of June 30, 2017 is as follows (see Note 2 - significant accounting policies in the notes to financial statements):
| | | | | | | | | | | | |
| | | Investment in Securities | |
| | | Level 1 Quoted
Price ($) | | | Level 2 Other significant
observable inputs ($) | | Level 3 Significant
unobservable inputs ($) | | Total ($) | |
Common Stocks ** | | | 87,820,661 | | | — | | — | | | 87,820,661 | |
Short-Term Securities | | | 3,878,475 | | | — | | — | | | 3,878,475 | |
Total: | | | 91,699,136 | | | — | | — | | | 91,699,136 | |
| ** | For equity securities categorized in a single level, refer to the Schedule of Investments for further breakdown. |
For the reporting period, there were no transfers between levels 1, 2 and 3.
| | | | |
See accompanying notes to financial statements. | | | | |
JUNE 30, 2017 | | | 41 | |
|
|
| |
Sit International Growth Fund |
OBJECTIVE STRATEGY
The objective of the Sit International Growth Fund is long-term growth. The Fund seeks to achieve its objective by investing at least 90% of its net assets in common stocks of growth companies domiciled outside the United States. In selecting investments for the Fund, the Adviser begins by selecting countries or regions in which to invest by considering several factors affecting the economy and equity market of foreign countries and regions. After the country and regional allocations are determined, the Adviser seeks industries and sectors that it believes have earnings growth prospects that are greater than the average. Within the selected industries and sectors, the Adviser invests in foreign growth-oriented companies it believes exhibit the potential for superior growth.
For the twelve-month period ended June 30, 2017, the Sit International Growth Fund generated a return of +12.64% versus the MSCI EAFE Index return of +20.27%. Stock selection and allocation across a broad range of sectors had a negative impact on performance, particularly in the fourth calendar quarter of 2016, as small capitalization and high beta stocks meaningfully outperformed subsequent to the U.S. presidential election. However, the Fund has outperformed the benchmark for the most recent six-month period, generating a return of +15.19% versus the MSCI EAFE Index return of +13.81%. Euro Area economic data has consistently surprised to the upside over the last twelve months. Yet, economic momentum is starting to show some signs of moderation as tailwinds from a weaker euro, Chinese stimulus measures, and easier comparisons fade in the second half of 2017. We forecast that Euro Area real GDP growth in 2017 and 2018 will be relatively flat with the +1.7% rate achieved in 2016, but remain well above the +0.8% annualized rate of the last five years. The UK economy has also performed much better than initially feared by many post the EU referendum in June 2016. However, ongoing Brexit-related uncertainty, diminished confidence, weak capital formation, and slowing household spending will likely cap UK GDP growth at +1.5% in 2017 versus its five-year annualized rate of +2.1%.
We remain overweight on European equities heading into the second half of 2017, as a less-impactful political calendar should set the stage for improved political visibility and growth. However, ongoing global growth concerns, elevated equity market valuation, and central bank policies shifts will likely cause some volatility. We place an emphasis on companies that will benefit from a weak euro/ pound, Trump policy beneficiaries, and companies with exposure to the U.S. market. In terms of sector-specific exposure, we are maintaining a barbell strategy, focusing on a combination of cyclical companies that could benefit from pro-growth U.S. policies and less-cyclical companies in telecom, defense, technology, consumer non-durables, and healthcare.
We remain meaningfully underweight in Japanese equities. Our concern continues to lie in the country’s subdued economic outlook and, by extension, the limited potential for earnings growth and equity price appreciation. Where we do have exposure to Japan, we maintain a mix of defensive consumption-focused holdings that should perform well in a weak demand environment and stocks with exposure to select faster growing overseas markets that may also benefit from a cost advantage due to the weak yen.
HYPOTHETICAL GROWTH OF $10,000
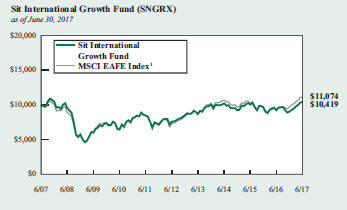
The chart above illustrates the total value of a hypothetical $10,000 investment in the Fund over the past 10 years as compared to the performance of the MSCI EAFE Index and MSCI EAFE Growth Index. The primary index used to compare the Fund’s performance was changed to the MSCI EAFE Index from the MSCI EAFE Growth Index because the Investment Adviser believes that the MSCI EAFE Index more accurately reflects the Fund’s investment objectives and strategies. Past performance does not guarantee future results. Returns include the reinvestment of distributions. The chart does not reflect the deduction of taxes that a shareholder would pay on Fund distributions or the redemption of Fund shares.
1 MSCI EAFE Index (Europe, Australasia, Far East) is an unmanaged free float-adjusted market capitalization index that measures the equity market performance of developed markets, excluding the US & Canada. This is the Fund’s primary index.
China’s real GDP growth rate likely peaked in the first half of 2017 and will moderate as the year proceeds. We expect real GDP growth to achieve the government’s goal of +6.5% in 2017 and slow a tad to +6.3% in 2018. Overall fixed investment growth will moderate as the housing market cools down due to tightening measures, and consumption growth could see a mild slowdown as well. Auto sales will be a drag due to a partial rollback of last year’s tax cuts, but stable household income from a better job market will remain supportive of overall consumption growth. Lastly, net exports will become a positive contributor to GDP growth in 2017 as external demand recovers. We remain selective in our China exposure and are positive on the Internet sector. While we could see short-term trading uncertainty after strong outperformance year-to-date, we believe the outlook for our holdings remains solid.
Roger J. Sit Tasha M. Murdoff
Portfolio Managers
| | |
Information on this page is unaudited. | | |
| 42 | | SIT MUTUAL FUNDS ANNUAL REPORT |
COMPARATIVE RATES OF RETURNS
as of June 30, 2017
| | | | | | | | | | | | |
| | | Sit
International
Growth
Fund | | | MSCI EAFE
Index 1 | | | MSCI EAFE
Growth
Index 2 | |
One Year | | | 12.64% | | | | 20.27% | | | | 15.70% | |
Five Year | | | 6.56 | | | | 8.69 | | | | 9.19 | |
Ten Year | | | 0.41 | | | | 1.03 | | | | 2.06 | |
Since Inception | | | 3.98 | | | | 5.36 | | | | 4.36 | |
(11/1/91) | | | | | | | | | | | | |
Performance figures are historical and do not guarantee future results. Investment returns and principal value will vary, and you may have a gain or loss when you sell shares. Current performance may be lower or higher than the performance data quoted. Contact the Fund for performance data current to the most recent month-end. Returns include changes in share price as well as reinvestment of all dividends and capital gains and all fee waivers. Without the fee waivers total return and yield figures would have been lower. Returns do not reflect the deduction of the 2% redemption fee imposed if shares are redeemed or exchanged within 30 calendar days from their date of purchase. If imposed, the fee would reduce the performance quoted. Returns do not reflect the deduction of taxes that a shareholder would pay on Fund distributions or the redemption of Fund shares. Management fees and administrative expenses are included in the Fund’s performance. Returns for periods greater than one year are compounded average annual rates of return.
1 MSCI EAFE Index (Europe, Australasia, Far East) is an unmanaged free float-adjusted market capitalization index that measures the equity market performance of developed markets, excluding the US & Canada.
2 MSCI EAFE Growth Index (Europe, Australasia, Far East) is an unmanaged free float-adjusted market capitalization index that measures the equity market performance of growth oriented stocks of developed markets excluding the US & Canada.
FUND DIVERSIFICATION - BY REGION
| | | | |
| | | Sit Int’l
Growth Fund | | MSCI EAFE
Index |
Europe | | 69.0% | | 61.8% |
Asia | | 21.4 | | 37.6 |
North America | | 6.2 | | — |
Africa/Middle East | | — | | 0.6 |
Cash & Other Net Assets | | 3.4 | | — |
Based on total net assets as of June 30, 2017. Subject to change.
PORTFOLIO SUMMARY
| | |
Net Asset Value 6/30/17: | | $16.23 Per Share |
Net Asset Value 6/30/16: | | $14.48 Per Share |
Total Net Assets: | | $22.6 Million |
Weighted Average Market Cap: | | $74.6 Billion |
TOP 10 HOLDINGS
|
1. Nestle SA |
2. ING Groep NV |
3. Iberdrola SA |
4. Reckitt Benckiser Group, PLC |
5. Siemens AG |
6. DS Smith, PLC |
7. RELX NV |
8. Royal Dutch Shell, PLC, ADR |
9. British American Tobacco, PLC |
10. Diageo, PLC, ADR |
Based on total net assets as of June 30, 2017. Subject to change.
FUND DIVERSIFICATION
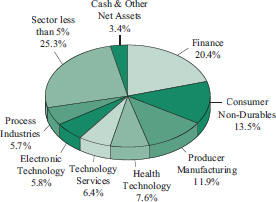
Based on total net assets as of June 30, 2017. Subject to change.
| | |
Information on this page is unaudited. | | |
JUNE 30, 2017 | | 43 |
SCHEDULE OF INVESTMENTS
June 30, 2017
Sit International Growth Fund
| | | | |
| | | |
| Quantity | | Name of Issuer | | Fair Value ($) |
| |
Common Stocks - 95.4% | | |
Asia - 20.2% | | |
Australia - 2.0% | | |
| 19,900 | | Amcor, Ltd. | | 247,908 |
| 8,300 | | Westpac Banking Corp., ADR | | 194,220 |
| | | | |
| | | | 442,128 |
| | | | |
China/Hong Kong - 5.7% | | |
| 32,200 | | AIA Group, Ltd. | | 235,587 |
| 2,350 | | Alibaba Group Holding, Ltd., ADR * | | 331,115 |
| 7,025 | | HSBC Holdings, PLC, ADR | | 325,890 |
| 10,900 | | Tencent Holdings, Ltd. | | 391,037 |
| | | | |
| | | | 1,283,629 |
| | | | |
Japan - 8.0% | | |
| 12,900 | | Asics Corp. | | 239,742 |
| 16,300 | | Daicel Corp. | | 203,730 |
| 600 | | Keyence Corp. | | 264,137 |
| 4,200 | | Makita Corp. | | 155,543 |
| 43,000 | | Mitsubishi UFJ Financial Group, Inc., ADR | | 290,250 |
| 3,500 | | Secom Co., Ltd. | | 266,298 |
| 8,400 | | Suzuki Motor Corp. | | 400,159 |
| | | | |
| | | | 1,819,859 |
| | | | |
Singapore - 2.4% | | |
| 1,600 | | Broadcom, Ltd. | | 372,880 |
| 12,000 | | DBS Group Holdings, Ltd. | | 180,609 |
| | | | |
| | | | 553,489 |
| | | | |
South Korea - 2.1% | | |
| 6,200 | | Korea Electric Power Corp. | | 221,090 |
| 235 | | Samsung Electronics Co., Ltd., GDR * | | 243,640 |
| | | | |
| | | | 464,730 |
| | | | |
| |
Europe - 69.0% | | |
Belgium - 1.4% | | |
| 2,870 | | Anheuser-Busch InBev NV, ADR | | 316,733 |
| | | | |
Denmark - 1.0% | | |
| 5,900 | | Danske Bank A/S | | 226,991 |
| | | | |
France - 10.4% | | |
| 8,250 | | AXA SA | | 225,913 |
| 4,870 | | BNP Paribas SA | | 350,605 |
| 3,225 | | Dassault Systemes SA | | 289,254 |
| 2,506 | | DBV Technologies SA * | | 176,871 |
| 2,200 | | Ingenico Group SA | | 199,513 |
| 4,400 | | Safran SA | | 403,509 |
| 5,000 | | Schneider Electric SE | | 384,248 |
| 1,265 | | Unibail-Rodamco SE | | 318,751 |
| | | | |
| | | | 2,348,664 |
| | | | |
| | | | |
| | | |
| Quantity | | Name of Issuer | | Fair Value ($) |
| |
Germany - 5.1% | | |
| 2,000 | | Allianz SE | | 394,685 |
| 4,160 | | Aurelius SE & Co. | | 223,567 |
| 3,900 | | Siemens AG | | 536,462 |
| | | | |
| | | | 1,154,714 |
| | | | |
Ireland - 2.2% | | |
| 5,800 | | CRH, PLC, ADR | | 205,726 |
| 3,200 | | Medtronic, PLC | | 284,000 |
| | | | |
| | | | 489,726 |
| | | | |
Netherlands - 11.2% | | |
| 1,700 | | ASML Holding NV | | 221,527 |
| 3,725 | | Galapagos NV * | | 284,764 |
| 34,900 | | ING Groep NV | | 602,472 |
| 6,500 | | Koninklijke Philips NV | | 232,830 |
| 4,400 | | LyondellBasell Industries NV | | 371,316 |
| 5,650 | | Mobileye NV * | | 354,820 |
| 22,800 | | RELX NV | | 470,064 |
| | | | |
| | | | 2,537,793 |
| | | | |
Spain - 4.1% | | |
| 70,100 | | Iberdrola SA | | 555,503 |
| 9,900 | | Industria de Diseno Textil SA | | 380,210 |
| | | | |
| | | | 935,713 |
| | | | |
Sweden - 2.0% | | |
| 5,200 | | Hexagon AB | | 247,050 |
| 17,000 | | Nordea Bank AB | | 216,519 |
| | | | |
| | | | 463,569 |
| | | | |
Switzerland - 8.3% | | |
| 120 | | Interroll Holding AG | | 160,184 |
| 7,470 | | Nestle SA | | 651,516 |
| 4,650 | | Novartis AG | | 388,399 |
| 1,470 | | Roche Holding AG | | 375,607 |
| 1,020 | | Zurich Insurance Group AG | | 297,686 |
| | | | |
| | | | 1,873,392 |
| | | | |
United Kingdom - 23.3% | | |
| 12,600 | | Ashtead Group, PLC | | 260,728 |
| 4,275 | | ASOS, PLC * | | 319,985 |
| 25,300 | | Babcock International Group, PLC | | 290,129 |
| 26,500 | | BAE Systems, PLC | | 218,766 |
| 6,400 | | British American Tobacco, PLC | | 436,117 |
| 5,800 | | BT Group, PLC, ADR | | 112,578 |
| 3,400 | | Cardtronics, PLC * | | 111,724 |
| 19,900 | | Cineworld Group, PLC | | 181,879 |
| 5,400 | | Coca-Cola European Partners, PLC | | 219,618 |
| 3,475 | | Diageo, PLC, ADR | | 416,409 |
| 76,700 | | DS Smith, PLC | | 473,383 |
| 66,700 | | Greencore Group, PLC | | 213,788 |
| 29,401 | | Just Eat, PLC * | | 250,960 |
| | |
See accompanying notes to financial statements. | | |
| 44 | | SIT MUTUAL FUNDS ANNUAL REPORT |
| | | | |
| | | |
| Quantity | | Name of Issuer | | Fair Value ($) |
| | |
| 12,200 | | Prudential, PLC | | 280,038 |
| 5,375 | | Reckitt Benckiser Group, PLC | | 544,883 |
| 4,500 | | Royal Dutch Shell, PLC, ADR - Class A | | 239,355 |
| 3,700 | | Royal Dutch Shell, PLC, ADR - Class B | | 201,391 |
| 2,700 | | STERIS, PLC | | 220,050 |
| 13,400 | | WPP, PLC | | 282,161 |
| | | | |
| | | | 5,273,942 |
| | | | |
| |
North America - 6.2% | | |
Canada - 3.9% | | |
| 4,650 | | BCE, Inc. | | 209,436 |
| 13,100 | | Suncor Energy, Inc. | | 382,520 |
| 4,650 | | Waste Connections, Inc. | | 299,553 |
| | | | |
| | | | 891,509 |
| | | | |
United States - 2.3% | | |
| 3,250 | | Euronet Worldwide, Inc. * | | 283,953 |
| 120 | | priceline.com, Inc. * | | 224,462 |
| | | | |
| | | | 508,415 |
| | | | |
Total Common Stocks
(cost: $18,226,169) | | 21,584,996 |
| | | | |
| |
Investment Companies - 1.2% | | |
| 8,700 | | iShares MSCI India ETF | | 279,270 |
| | | | |
(cost: $258,887) | | |
| |
Short-Term Securities - 2.5% | | |
| 553,666 | | Fidelity Instl. Money Mkt. Govt. Fund, 0.81% | | |
Total Short-Term Securities
(cost: $553,666) | | 553,666 |
| | | | |
| |
Total Investments in Securities - 99.1%
(cost: $19,038,722) | | 22,417,932 |
Other Assets and Liabilities, net - 0.9% | | 200,082 |
| | | | |
| |
Total Net Assets - 100.0% | | $22,618,014 |
| | | | |
| * | Non-income producing security. |
Numeric footnotes not disclosed are not applicable to this Schedule of Investments.
ADR — American Depositary Receipt
GDR — Global Depositary Receipt
PLC — Public Limited Company
| | | | |
See accompanying notes to financial statements. | | | | |
JUNE 30, 2017 | | | 45 | |
SCHEDULE OF INVESTMENTS
June 30, 2017
Sit International Growth Fund (Continued)
A summary of the levels for the Fund’s investments as of June 30, 2017 is as follows (see Note 2 - significant accounting policies in the notes to financial statements):
| | | | | | | | | | | | | | | | | | | | |
| | | Investment in Securities |
| | | Level 1
Quoted
Price ($) | | Level 2 Other significant
observable inputs ($) | | Level 3 Significant
unobservable inputs ($) | | Total ($) |
Common Stocks | | | | | | | | | | | | | | | | | | | | |
Australia | | | | 194,220 | | | | | 247,908 | | | | | — | | | | | 442,128 | |
Belgium | | | | 316,733 | | | | | — | | | | | — | | | | | 316,733 | |
Canada | | | | 891,509 | | | | | — | | | | | — | | | | | 891,509 | |
China/Hong Kong | | | | 657,005 | | | | | 626,624 | | | | | — | | | | | 1,283,629 | |
Denmark | | | | — | | | | | 226,991 | | | | | — | | | | | 226,991 | |
France | | | | — | | | | | 2,348,664 | | | | | — | | | | | 2,348,664 | |
Germany | | | | — | | | | | 1,154,714 | | | | | — | | | | | 1,154,714 | |
Ireland | | | | 489,726 | | | | | — | | | | | — | | | | | 489,726 | |
Japan | | | | 290,250 | | | | | 1,529,609 | | | | | — | | | | | 1,819,859 | |
Netherlands | | | | 1,180,493 | | | | | 1,357,300 | | | | | — | | | | | 2,537,793 | |
Singapore | | | | 372,880 | | | | | 180,609 | | | | | — | | | | | 553,489 | |
South Korea | | | | — | | | | | 464,730 | | | | | — | | | | | 464,730 | |
Spain | | | | — | | | | | 935,713 | | | | | — | | | | | 935,713 | |
Sweden | | | | — | | | | | 463,569 | | | | | — | | | | | 463,569 | |
Switzerland | | | | 160,184 | | | | | 1,713,208 | | | | | — | | | | | 1,873,392 | |
United Kingdom | | | | 1,521,125 | | | | | 3,752,817 | | | | | — | | | | | 5,273,942 | |
United States | | | | 508,415 | | | | | — | | | | | — | | | | | 508,415 | |
Investment Companies | | | | 279,270 | | | | | — | | | | | — | | | | | 279,270 | |
Short-Term Securities | | | | 553,666 | | | | | — | | | | | — | | | | | 553,666 | |
Total: | | | | 7,415,476 | | | | | 15,002,456 | | | | | — | | | | | 22,417,932 | |
The Fund adjusts the closing price of foreign equity securities by applying a systematic process for events occurring after the close of the foreign exchanges. At each reporting period, this process is applied for all foreign securities and therefore all foreign securities are classified as level 2. There are no transfers between level 1 and level 2 between reporting periods as a result of applying this process. Level 1 securities of foreign issuers are primarily American Depositary Receipts (ADRs), Public Limited Companies (PLCs) or Global Depositary Receipts (GDRs). There were no transfers into or out of level 3 during the reporting period.
| | |
See accompanying notes to financial statements. | | |
| 46 | | SIT MUTUAL FUNDS ANNUAL REPORT |
[This page intentionally left blank.]
|
|
| |
Sit Developing Markets Growth Fund |
OBJECTIVE & STRATEGY
The objective of the Sit Developing Markets Growth Fund is to maximize long-term capital appreciation. The Fund seeks to achieve its objective by investing at least 80% of its net assets in common stocks of companies domiciled or operating in a developing market. In selecting investments for the Fund, the Adviser begins by selecting countries or regions in which to invest by considering several factors affecting the economy and equity market of foreign countries and regions. After the country and regional allocations are determined, the Adviser seeks industries and sectors that appear to have strong earnings growth prospects. Within the selected industries and sectors, the Adviser invests in foreign growth-oriented companies it believes exhibit the potential for superior growth.
The Sit Developing Markets Growth Fund advanced +24.56% for the twelve-month period ended June 30, 2017, outperforming the MSCI Emerging Markets Index’s +21.18%. The consumer services (TAL Education), pharmaceuticals (CSPC Pharmaceutical), and retailing (JD.com) sectors helped contribute to relative outperformance. However, the sectors of food, beverage & tobacco (Anheuser-Busch InBev, British American Tobacco Malaysia), utilities (Korea Electric Power), and media (CJ CGV) hurt performance. Stock selection in China and South Africa was beneficial to returns. Conversely, stock selection was negative in South Korea.
China’s real GDP growth likely peaked in the first quarter of 2017 and will moderate during the year. We expect GDP growth to achieve the government’s goal of +6.5% in 2017 and slow to +6.3% in 2018. Overall fixed investment growth will moderate as the housing market cools down due to tightening measures, and consumption growth could see a mild slowdown from the rollback of tax cuts on autos. China’s financial deleveraging process will similarly slow growth.
India’s fourth quarter of FY17 growth of +6.1% was weaker than estimated due to the continued effects of the currency demonetization in November 2016, which impacted the construction, financial and real estate sectors. We expect stronger growth in FY18 of +7.4%, as the currency demonetization headwind lessens. In South Korea, fiscal spending should drive the economy, as newly-elected President Moon Jae-in has set aside a $9.8 billion (0.7% of GDP) supplementary budget to raise the minimum wage and create jobs. South Korea’s economy should also benefit from strong export growth (e.g., mobile memory, phones).
In Latin America, Mexico’s and Brazil’s economic growth outlook is uncertain. The United States’ decision to renegotiate the North American Free Trade Agreement (NAFTA) remains an overhang for the Mexican economy. In Brazil, President Michel Temer faces corruption charges from the Supreme Court. We see reforms likely being delayed, resulting in a continued weak economy. Brazil’s GDP fell -0.4% year-over-year in the first quarter of 2017, on falling private consumption and investments.
We are most positive on the China, India, and South Korean markets. In China, better than expected macro data, easing capital outflow concerns, and improving earnings should continue to drive performance.
HYPOTHETICAL GROWTH OF $10,000
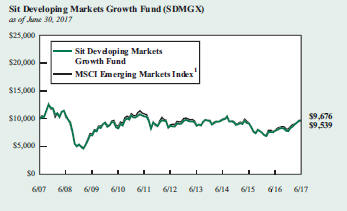
The chart above illustrates the total value of a hypothetical $10,000 investment in the Fund over the past 10 years as compared to the performance of the MSCI Emerging Markets Index. Past performance does not guarantee future results. Returns include the reinvestment of distributions. The chart does not reflect the deduction of taxes that a shareholder would pay on Fund distributions or the redemption of Fund shares.
1 MSCI Emerging Markets Index is an unmanaged free float-adjusted market capitalization index that measures equity market performance of emerging markets. It is not possible to invest directly in an index. This is the Fund’s primary index.
We remain selective in China and are positive on the Internet sector. India’s GDP growth should recover post the currency demonetization, with strength led by the consumer. India will also implement the Goods & Services Tax, which should increase economic growth as it simplifies the tax structure and removes tax cheating. We are positive on India’s economic-driven growth stories (i.e., financials, technology, and consumer stocks). In South Korea, we prefer global technology, utilities, and banks.
In Latin America, we remain underweight Mexico and Brazil, given economic uncertainty from the NAFTA renegotiation impact on Mexico and political paralysis in Brazil. Our investment strategy in Mexico is focused on consumer stocks. In Brazil, we are maintaining a defensive strategy, owning consumer staples and exporters.
Roger J. Sit Raymond E. Sit
Portfolio Managers
| | |
Information on this page is unaudited. | | |
| 48 | | SIT MUTUAL FUNDS ANNUAL REPORT |
| | | | | | | | | | | | | | | |
COMPARATIVE RATES OF RETURN as of June 30, 2017 |
| | | Sit
Developing
Markets
Growth
Fund | | MSCI
Emerging
Markets
Index 1 | | MSCI
Emerging
Markets
Growth
Index 2 |
One Year | | | | 24.56 | % | | | | 21.18 | % | | | | 24.13 | % |
Five Year | | | | 2.19 | | | | | 1.52 | | | | | 4.35 | |
Ten Year | | | | -0.33 | | | | | -0.47 | | | | | 0.35 | |
Since Inception | | | | 3.99 | | | | | 3.30 | | | | | n/a | |
(7/1/94) | | | | | | | | | | | | | | | |
Performance figures are historical and do not guarantee future results. Investment returns and principal value will vary, and you may have a gain or loss when you sell shares. Current performance may be lower or higher than the performance data quoted. Contact the Fund for performance data current to the most recent month-end. Returns include changes in share price as well as reinvestment of all dividends and capital gains. Returns do not reflect the deduction of the 2% redemption fee imposed if shares are redeemed or exchanged within 30 calendar days from their date of purchase. If imposed, the fee would reduce the performance quoted. Returns do not reflect the deduction of taxes that a shareholder would pay on Fund distributions or the redemption of Fund shares. Management fees and administrative expenses are included in the Fund’s performance. Returns for periods greater than one year are compounded average annual rates of return.
1 MSCI Emerging Markets Index is an unmanaged free float-adjusted market capitalization index that measures equity market performance of emerging markets. It is not possible to invest directly in an index.
2 MSCI Emerging Markets Growth Index is an unmanaged free float-adjusted market capitalization index that measures equity market performance of growth oriented emerging market stocks.
FUND DIVERSIFICATION - BY REGION
| | | | | | | | | | |
| | |
| | | Sit
Developing
Markets
Growth
Fund | | MSCI
Emerging
Markets
Index |
Asia | | | | 67.9 | % | | | | 73.1 | % |
Africa/Middle East | | | | 11.0 | | | | | 8.1 | |
Latin America | | | | 9.8 | | | | | 12.3 | |
North America | | | | 3.5 | | | | | — | |
Europe | | | | 3.1 | | | | | 6.5 | |
Cash & Other Net Assets | | | | 4.7 | | | | | — | |
Based on total net assets as of June 30, 2017. Subject to change.
PORTFOLIO SUMMARY
| | |
Net Asset Value 6/30/17: | | $15.23 Per Share |
Net Asset Value 6/30/16: | | $12.26 Per Share |
Total Net Assets: | | $9.6 Million |
Weighted Average Market Cap: | | $84.3 Billion |
TOP 10 HOLDINGS
1. Tencent Holdings, Ltd.
2. Samsung Electronics Co., Ltd.
3. TAL Education Group, ADR
4. Naspers, Ltd.
5. Alibaba Group Holding, Ltd., ADR
6. Shinhan Financial Group Co., Ltd.
7. iShares MSCI India ETF
8. Taiwan Semiconductor Co.
9. China Construction Bank Corp.
10. JD.com, Inc., ADR
Based on total net assets as of June 30, 2017. Subject to change.
FUND DIVERSIFICATION
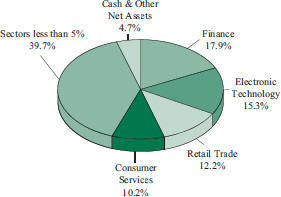
Based on total net assets as of June 30, 2017. Subject to change.
| | |
Information on this page is unaudited. | | |
JUNE 30, 2017 | | 49 |
SCHEDULE OF INVESTMENTS
June 30, 2017
Sit Developing Markets Growth Fund
| | | | |
| | | |
| Quantity | | Name of Issuer | | Fair Value ($) |
| |
Common Stocks - 92.3% | | |
Africa/Middle East - 11.0% | | |
Israel - 2.5% | | |
| 3,050 | | NICE Systems, Ltd., ADR | | 240,096 |
| | | | |
South Africa - 8.5% | | |
| 7,600 | | Bid Corp., Ltd. | | 173,609 |
| 9,775 | | Bidvest Group, Ltd. | | 117,714 |
| 1,925 | | Naspers, Ltd. | | 379,096 |
| 5,000 | | Sasol, Ltd., ADR | | 139,750 |
| | | | |
| | 810,169 |
| | | | |
| |
Asia - 64.9% | | |
| |
China/Hong Kong - 31.5% | | |
| 14,600 | | AIA Group, Ltd. | | 106,819 |
| 2,375 | | Alibaba Group Holding, Ltd., ADR * | | 334,638 |
| 320,000 | | China Construction Bank Corp. | | 248,847 |
| 7,375 | | China Life Insurance Co., Ltd., ADR | | 113,133 |
| 63,000 | | China Mengniu Dairy Co., Ltd. * | | 123,527 |
| 4,450 | | China Mobile, Ltd., ADR | | 236,251 |
| 2,600 | | China Petroleum & Chemical Corp., ADR | | 204,360 |
| 162,000 | | CSPC Pharmaceutical Group, Ltd. | | 236,619 |
| 2,600 | | Ctrip.com International, Ltd., ADR * | | 140,036 |
| 24,000 | | ENN Energy Holdings, Ltd. | | 144,794 |
| 1,600 | | Hong Kong Exchanges & Clearing, Ltd. | | 41,335 |
| 6,150 | | JD.com, Inc., ADR * | | 241,203 |
| 3,400 | | TAL Education Group, ADR | | 415,854 |
| 11,900 | | Tencent Holdings, Ltd. | | 426,912 |
| | | | |
| | | | 3,014,328 |
| | | | |
India - 3.3% | | |
| 2,150 | | HDFC Bank, Ltd., ADR | | 186,986 |
| 3,925 | | Tata Motors, Ltd., ADR | | 129,579 |
| | | | |
| | | | 316,565 |
| | | | |
Indonesia - 1.8% | | |
| 258,500 | | Astra International Tbk PT | | 173,194 |
| | | | |
Japan - 1.8% | | |
| 3,600 | | Suzuki Motor Corp. | | 171,497 |
| | | | |
Singapore - 3.6% | | |
| 675 | | Broadcom, Ltd. | | 157,309 |
| 12,300 | | DBS Group Holdings, Ltd. | | 185,125 |
| | | | |
| | | | 342,434 |
| | | | |
South Korea - 11.1% | | |
| 1,040 | | CJ CGV Co., Ltd. | | 66,928 |
| 3,625 | | Korea Electric Power Corp. | | 129,266 |
| 325 | | Medy-Tox, Inc. | | 159,152 |
| 200 | | Samsung Electronics Co., Ltd. | | 416,564 |
| 6,700 | | Shinhan Financial Group Co., Ltd. | | 289,073 |
| | | | |
| | 1,060,983 |
| | | | |
| | | | |
| | | |
| Quantity | | Name of Issuer | | Fair Value ($) |
| |
Taiwan - 8.8% | | |
| 82,086 | | Cathay Financial Holding Co., Ltd. | | 135,116 |
| 27,148 | | Hon Hai Precision Industry Co., Ltd., GDR | | 209,343 |
| 16,000 | | President Chain Store Corp. | | 143,764 |
| 37,482 | | Taiwan Semiconductor Co. | | 256,085 |
| 2,800 | | Taiwan Semiconductor Co., ADR | | 97,888 |
| | | | |
| | | | 842,196 |
| | | | |
Thailand - 1.7% | | |
| 28,100 | | Bangkok Bank PCL | | 162,843 |
| | | | |
Turkey - 1.3% | | |
| 51,000 | | Kordsa Global Endustriyel Iplik A/S | | 121,438 |
| | | | |
| |
Europe - 3.1% | | |
Belgium - 1.5% | | |
| 1,350 | | Anheuser-Busch InBev NV, ADR | | 148,986 |
| | | | |
Netherlands - 1.6% | | |
| 2,425 | | Mobileye NV * | | 152,290 |
| | | | |
| |
Latin America - 9.8% | | |
Brazil - 5.2% | | |
| 30,725 | | Ambev SA, ADR | | 168,680 |
| 12,076 | | Banco Bradesco SA | | 102,611 |
| 3,400 | | Embraer SA, ADR | | 61,982 |
| 19,000 | | Qualicorp SA | | 165,459 |
| | | | |
| | | | 498,732 |
| | | | |
Chile - 2.6% | | |
| 5,500 | | Banco Santander Chile, ADR | | 139,761 |
| 14,600 | | Geopark, Ltd. * | | 110,230 |
| | | | |
| | | | 249,991 |
| | | | |
Peru - 2.0% | | |
| 5,400 | | Southern Copper Corp. | | 187,005 |
| | | | |
| |
North America - 3.5% | | |
Mexico - 1.4% | | |
| 34,800 | | Alsea SAB de CV | | 131,923 |
| | | | |
United States - 2.1% | | |
| 925 | | Skyworks Solutions, Inc. | | 88,754 |
| 1,575 | | Tupperware Brands Corp. | | 110,612 |
| | | | |
| | | | 199,366 |
| | | | |
Total Common Stocks | | |
(cost: $6,662,637) | | 8,824,036 |
| | | | |
| |
Investment Companies - 3.0% | | |
| 8,900 | | iShares MSCI India ETF | | 285,690 |
| | | | |
(cost: $261,167) | | |
| | |
See accompanying notes to financial statements. | | |
| 50 | | SIT MUTUAL FUNDS ANNUAL REPORT |
| | | | |
| | | |
| Quantity | | Name of Issuer | | Fair Value ($) |
| |
Short-Term Securities - 4.7% | | |
| 453,412 | | Fidelity Instl. Money Mkt. Govt. Fund, 0.81% | | |
Total Short-Term Securities | | |
(cost: $453,412) | | 453,412 |
| | | | |
| |
Total Investments in Securities - 100.0% | | |
(cost: $7,377,216) | | 9,563,138 |
Other Assets and Liabilities, net - 0.0% | | (2,023) |
| | | | |
| |
Total Net Assets - 100.0% | | $9,561,115 |
| | | | |
| * | Non-income producing security. |
ADR — American Depositary Receipt
GDR — Global Depositary Receipt
Numeric footnotes not disclosed are not applicable to this Schedule of Investments.
| | | | |
See accompanying notes to financial statements. | | | | |
JUNE 30, 2017 | | | 51 | |
SCHEDULE OF INVESTMENTS
June 30, 2017
Sit Developing Markets Growth Fund (Continued)
A summary of the levels for the Fund’s investments as of June 30, 2017 is as follows (see Note 2 - significant accounting policies in the notes to financial statements):
| | | | | | | | | | | | | | | | | | | | |
| | | Investment in Securities |
| | | Level 1
Quoted
Price ($) | | Level 2
Other significant
observable inputs ($) | | Level 3 Significant
unobservable inputs ($) | | Total ($) |
Common Stocks | | | | | | | | | | | | | | | | | | | | |
Belgium | | | | 148,986 | | | | | — | | | | | — | | | | | 148,986 | |
Brazil | | | | 498,732 | | | | | — | | | | | — | | | | | 498,732 | |
Chile | | | | 249,991 | | | | | — | | | | | — | | | | | 249,991 | |
China/Hong Kong | | | | 1,685,475 | | | | | 1,328,853 | | | | | — | | | | | 3,014,328 | |
India | | | | 316,565 | | | | | — | | | | | — | | | | | 316,565 | |
Indonesia | | | | — | | | | | 173,194 | | | | | — | | | | | 173,194 | |
Israel | | | | 240,096 | | | | | — | | | | | — | | | | | 240,096 | |
Japan | | | | — | | | | | 171,497 | | | | | — | | | | | 171,497 | |
Mexico | | | | 131,923 | | | | | — | | | | | — | | | | | 131,923 | |
Netherlands | | | | 152,290 | | | | | — | | | | | — | | | | | 152,290 | |
Peru | | | | 187,005 | | | | | — | | | | | — | | | | | 187,005 | |
Singapore | | | | 157,309 | | | | | 185,125 | | | | | — | | | | | 342,434 | |
South Africa | | | | 139,750 | | | | | 670,419 | | | | | — | | | | | 810,169 | |
South Korea | | | | — | | | | | 1,060,983 | | | | | — | | | | | 1,060,983 | |
Taiwan | | | | 97,888 | | | | | 744,308 | | | | | — | | | | | 842,196 | |
Thailand | | | | — | | | | | 162,843 | | | | | — | | | | | 162,843 | |
Turkey | | | | — | | | | | 121,438 | | | | | — | | | | | 121,438 | |
United States | | | | 199,366 | | | | | — | | | | | — | | | | | 199,366 | |
Investment Companies | | | | 285,690 | | | | | — | | | | | — | | | | | 285,690 | |
Short-Term Securities | | | | 453,412 | | | | | — | | | | | — | | | | | 453,412 | |
Total: | | | | 4,944,478 | | | | | 4,618,660 | | | | | — | | | | | 9,563,138 | |
The Fund adjusts the closing price of foreign equity securities by applying a systematic process for events occurring after the close of the foreign exchanges. At each reporting period, this process is applied for all foreign securities and therefore all foreign securities are classified as level 2. There are no transfers between level 1 and level 2 between reporting periods as a result of applying this process. Level 1 securities of foreign issuers are primarily American Depositary Receipts (ADRs), Public Limited Companies (PLCs) or Global Depositary Receipts (GDRs). There were no transfers into or out of level 3 during the reporting period.
| | |
See accompanying notes to financial statements. | | |
| 52 | | SIT MUTUAL FUNDS ANNUAL REPORT |
[This page intentionally left blank.]
STATEMENTS OF ASSETS AND LIABILITIES
June 30, 2017
| | | | | | | | | | | | |
| | | Sit
Balanced
Fund | | | Sit
Dividend
Growth
Fund | | | Sit
Global
Dividend
Growth
Fund | |
ASSETS | | | | | | | | | | | | |
Investments in securities, at identified cost | | | $19,921,685 | | | | $919,006,452 | | | | $24,911,359 | |
| | | | | | | | | | | | |
| | | |
Investments in securities, at fair value - see accompanying schedule for detail | | | $25,155,678 | | | | $1,084,841,706 | | | | $29,055,346 | |
Cash in bank on demand deposit | | | — | | | | — | | | | — | |
Accrued interest and dividends receivable | | | 79,068 | | | | 1,779,501 | | | | 99,879 | |
Receivable for investment securities sold | | | 158,660 | | | | 12,977,543 | | | | 92,019 | |
Receivable for Fund shares sold | | | 28,485 | | | | 2,258,507 | | | | 402 | |
| | | | | | | | | | | | |
| | | |
Total assets | | | 25,421,891 | | | | 1,101,857,257 | | | | 29,247,646 | |
| | | | | | | | | | | | |
| | | |
LIABILITIES | | | | | | | | | | | | |
Payable for investment securities purchased | | | 128,539 | | | | 18,747,574 | | | | 319,933 | |
Payable for Fund shares redeemed | | | 29,588 | | | | 1,013,084 | | | | — | |
Cash portion of dividends payable to shareholders | | | — | | | | 278 | | | | — | |
Accrued investment management fees and advisory fees | | | 22,083 | | | | 884,224 | | | | 29,784 | |
Accrued 12b-1 fees (Class S) | | | — | | | | 13,631 | | | | 667 | |
| | | | | | | | | | | | |
| | | |
Total liabilities | | | 180,210 | | | | 20,658,791 | | | | 350,384 | |
| | | | | | | | | | | | |
| | | |
Net assets applicable to outstanding capital stock | | | $25,241,681 | | | | $1,081,198,466 | | | | $28,897,262 | |
| | | | | | | | | | | | |
Net assets consist of: | | | | | | | | | | | | |
Capital (par value and paid-in surplus) | | | $19,320,813 | | | | $863,060,053 | | | | $25,537,200 | |
Undistributed (distributions in excess of) net investment income (loss) | | | 82,423 | | | | 3,846,558 | | | | 142,589 | |
Accumulated net realized gain (loss) from security transactions and foreign currency transactions | | | 604,452 | | | | 48,456,601 | | | | (926,330) | |
Unrealized appreciation (depreciation) on investments and foreign currency transactions | | | 5,233,993 | | | | 165,835,254 | | | | 4,143,803 | |
| | | | | | | | | | | | |
| | | $25,241,681 | | | | $1,081,198,466 | | | | $28,897,262 | |
| | | | | | | | | | | | |
| | | |
Outstanding shares: | | | | | | | | | | | | |
Common Shares (Class I) * | | | 1,111,461 | | | | 60,186,464 | | | | 1,761,982 | |
| | | | | | | | | | | | |
Common Shares (Class S) * | | | — | | | | 3,883,306 | | | | 225,389 | |
| | | | | | | | | | | | |
| | | |
Net assets applicable to outstanding shares: | | | | | | | | | | | | |
Common Shares (Class I) * | | | $25,241,681 | | | | $1,015,920,109 | | | | $25,622,970 | |
| | | | | | | | | | | | |
Common Shares (Class S) * | | | — | | | | 65,278,357 | | | | 3,274,292 | |
| | | | | | | | | | | | |
| | | |
Net asset value per share of outstanding capital stock: | | | | | | | | | | | | |
Common Shares (Class I) * | | | $22.71 | | | | $16.88 | | | | $14.54 | |
| | | | | | | | | | | | |
Common Shares (Class S) * | | | — | | | | $16.81 | | | | $14.53 | |
| | | | | | | | | | | | |
| * | Dividend Growth, Global Dividend Growth, ESG Growth and Small Cap Dividend Growth Funds offer multiple share classes (I and S). All other Funds offer a single share class. |
| | |
See accompanying notes to financial statements. | | |
| 54 | | SIT MUTUAL FUNDS ANNUAL REPORT |
| | | | | | | | | | | | | | | | | | | | | | | | | | |
Sit
Large Cap
Growth
Fund | | | Sit
ESG
Growth
Fund | | | Sit
Mid Cap
Growth
Fund | | | Sit
Small Cap
Dividend
Growth
Fund | | | Sit
Small Cap
Growth
Fund | | | Sit
International
Growth
Fund | | | Sit
Developing
Markets
Growth
Fund | |
| | | | | | | | | | | | | | | | | | | | | | | | | | | |
| | $66,700,986 | | | | $4,114,017 | | | | $91,649,832 | | | | $14,307,993 | | | | $61,450,383 | | | | $19,038,722 | | | | $7,377,216 | |
| | | | | | | | | | | | | | | | | | | | | | | | | | |
| | | | | | |
| | $114,238,210 | | | | $4,667,318 | | | | $157,645,982 | | | | $16,272,580 | | | | $91,699,136 | | | | $22,417,932 | | | | $9,563,138 | |
| | — | | | | — | | | | — | | | | — | | | | — | | | | — | | | | 745 | |
| | 54,019 | | | | 7,680 | | | | 76,659 | | | | 26,304 | | | | 61,248 | | | | 110,179 | | | | 37,239 | |
| | 2,856,664 | | | | — | | | | — | | | | 46,745 | | | | 200,163 | | | | — | | | | — | |
| | 45,126 | | | | — | | | | 3,324 | | | | 2,274 | | | | 1,449 | | | | 118,735 | | | | 577 | |
| | | | | | | | | | | | | | | | | | | | | | | | | | |
| | | | | | |
| | 117,194,019 | | | | 4,674,998 | | | | 157,725,965 | | | | 16,347,903 | | | | 91,961,996 | | | | 22,646,846 | | | | 9,601,699 | |
| | | | | | | | | | | | | | | | | | | | | | | | | | |
| | | | | | |
| | 730,215 | | | | — | | | | 1,218,513 | | | | 154,170 | | | | 1,031,557 | | | | — | | | | 23,831 | |
| | 2,746,487 | | | | — | | | | 39,819 | | | | — | | | | 736 | | | | 1,101 | | | | 1,406 | |
| | — | | | | — | | | | — | | | | — | | | | — | | | | — | | | | — | |
| | 97,307 | | | | 4,811 | | | | 162,731 | | | | 16,467 | | | | 112,959 | | | | 27,731 | | | | 15,347 | |
| | — | | | | 478 | | | | — | | | | 707 | | | | — | | | | — | | | | — | |
| | | | | | | | | | | | | | | | | | | | | | | | | | |
| | | | | | |
| | 3,574,009 | | | | 5,289 | | | | 1,421,063 | | | | 171,344 | | | | 1,145,252 | | | | 28,832 | | | | 40,584 | |
| | | | | | | | | | | | | | | | | | | | | | | | | | |
| | | | | | |
| | $113,620,010 | | | | $4,669,709 | | | | $156,304,902 | | | | $16,176,559 | | | | $90,816,744 | | | | $22,618,014 | | | | $9,561,115 | |
| | | | | | | | | | | | | | | | | | | | | | | | | | |
| | | | | | |
| | $56,667,447 | | | | $4,143,849 | | | | $86,329,789 | | | | $14,493,192 | | | | $57,543,259 | | | | $20,004,134 | | | | $7,557,770 | |
| | 280,441 | | | | 32,139 | | | | 4,961 | | | | 44,366 | | | | — | | | | 177,221 | | | | — | |
| | | | | | |
| | 9,134,898 | | | | (59,584 | ) | | | 3,974,002 | | | | (325,586 | ) | | | 3,024,732 | | | | (940,898 | ) | | | (182,555 | ) |
| | | | | | |
| | 47,537,224 | | | | 553,305 | | | | 65,996,150 | | | | 1,964,587 | | | | 30,248,753 | | | | 3,377,557 | | | | 2,185,900 | |
| | | | | | | | | | | | | | | | | | | | | | | | | | |
| | $113,620,010 | | | | $4,669,709 | | | | $156,304,902 | | | | $16,176,559 | | | | $90,816,744 | | | | $22,618,014 | | | | $9,561,115 | |
| | | | | | | | | | | | | | | | | | | | | | | | | | |
| | | | | | |
| | 2,801,603 | | | | 208,053 | | | | 8,656,821 | | | | 1,109,038 | | | | 1,676,055 | | | | 1,393,654 | | | | 627,727 | |
| | | | | | | | | | | | | | | | | | | | | | | | | | |
| | — | | | | 205,812 | | | | — | | | | 302,085 | | | | — | | | | — | | | | — | |
| | | | | | | | | | | | | | | | | | | | | | | | | | |
| | | | | | |
| | $113,620,010 | | | | $2,348,987 | | | | $156,304,902 | | | | $12,715,645 | | | | $90,816,744 | | | | $22,618,014 | | | | $9,561,115 | |
| | | | | | | | | | | | | | | | | | | | | | | | | | |
| | — | | | | 2,320,722 | | | | — | | | | 3,460,914 | | | | — | | | | — | | | | — | |
| | | | | | | | | | | | | | | | | | | | | | | | | | |
| | | | | | |
| | $40.56 | | | | $11.29 | | | | $18.06 | | | | $11.47 | | | | $54.18 | | | | $16.23 | | | | $15.23 | |
| | | | | | | | | | | | | | | | | | | | | | | | | | |
| | — | | | | $11.28 | | | | — | | | | $11.46 | | | | — | | | | — | | | | — | |
| | | | | | | | | | | | | | | | | | | | | | | | | | |
STATEMENTS OF OPERATIONS
Year Ended June 30, 2017
| | | | | | | | | | | | |
| | | Sit
Balanced
Fund | | | Sit
Dividend
Growth
Fund | | | Sit
Global
Dividend
Growth
Fund | |
Investment income: | | | | | | | | | | | | |
Income: | | | | | | | | | | | | |
Dividends* | | | $307,990 | | | | $25,589,497 | | | | $764,072 | |
Interest | | | 232,207 | | | | 69,298 | | | | 3,194 | |
| | | | | | | | | | | | |
Total income | | | 540,197 | | | | 25,658,795 | | | | 767,266 | |
| | | | | | | | | | | | |
| | | |
Expenses (note 4): | | | | | | | | | | | | |
Investment management and advisory service fee | | | 248,288 | | | | 10,316,430 | | | | 333,356 | |
12b-1 fees (Class S) | | | — | | | | 167,882 | | | | 7,590 | |
| | | | | | | | | | | | |
Total expenses | | | 248,288 | | | | 10,484,312 | | | | 340,946 | |
| | | | | | | | | | | | |
| | | |
Net investment income (loss) | | | 291,909 | | | | 15,174,483 | | | | 426,320 | |
| | | | | | | | | | | | |
| | | |
Realized and unrealized gain (loss): | | | | | | | | | | | | |
Net realized gain (loss) on investments | | | 681,151 | | | | 72,506,740 | | | | (232,496 | ) |
Net realized gain (loss) on foreign currency transactions | | | — | | | | — | | | | (1,253 | ) |
| | | |
Net change in unrealized appreciation (depreciation) on investments and foreign currency transactions | | | 1,963,274 | | | | 59,079,432 | | | | 2,814,059 | |
| | | | | | | | | | | | |
| | | |
Net gain (loss) | | | 2,644,425 | | | | 131,586,172 | | | | 2,580,310 | |
| | | | | | | | | | | | |
| | | |
Net increase (decrease) in net assets resulting from operations | | | $2,936,334 | | | | $146,760,655 | | | | $3,006,630 | |
| | | | | | | | | | | | |
| | | |
| | | | | | | | | | | | |
| | | |
* Foreign taxes withheld on dividends received | | | — | | | | $97,331 | | | | $36,628 | |
| | |
See accompanying notes to financial statements. | | |
| 56 | | SIT MUTUAL FUNDS ANNUAL REPORT |
| | | | | | | | | | | | | | | | | | | | | | | | | | |
Sit Large Cap
Growth Fund | | | Sit
ESG
Growth
Fund | | | Sit
Mid Cap
Growth
Fund | | | Sit
Small Cap
Dividend
Growth
Fund | | | Sit
Small Cap
Growth
Fund | | | Sit
International
Growth
Fund | | | Sit
Developing
Markets
Growth
Fund | |
| | | | | | | | | | | | | | | | | | | | | | | | | | |
| | | | | | | | | | | | | | | | | | | | | | | | | | |
| | $1,792,827 | | | | $94,660 | | | | $1,809,288 | | | | $292,327 | | | | $882,693 | | | | $511,633 | | | | $140,269 | |
| | 6,131 | | | | 1,714 | | | | 23,927 | | | | 2,713 | | | | 7,082 | | | | 2,104 | | | | 1,040 | |
| | | | | | | | | | | | | | | | | | | | | | | | | | |
| | 1,798,958 | | | | 96,374 | | | | 1,833,215 | | | | 295,040 | | | | 889,775 | | | | 513,737 | | | | 141,309 | |
| | | | | | | | | | | | | | | | | | | | | | | | | | |
| | | | | | |
| | | | | | | | | | | | | | | | | | | | | | | | | | |
| | 1,164,995 | | | | 53,226 | | | | 1,844,093 | | | | 159,341 | | | | 1,301,587 | | | | 312,272 | | | | 155,011 | |
| | — | | | | 5,252 | | | | — | | | | 7,597 | | | | — | | | | — | | | | — | |
| | | | | | | | | | | | | | | | | | | | | | | | | | |
| | 1,164,995 | | | | 58,478 | | | | 1,844,093 | | | | 166,938 | | | | 1,301,587 | | | | 312,272 | | | | 155,011 | |
| | | | | | | | | | | | | | | | | | | | | | | | | | |
| | | | | | |
| | 633,963 | | | | 37,896 | | | | (10,878 | ) | | | 128,102 | | | | (411,812 | ) | | | 201,465 | | | | (13,702 | ) |
| | | | | | | | | | | | | | | | | | | | | | | | | | |
| | | | | | |
| | | | | | | | | | | | | | | | | | | | | | | | | | |
| | | | | | |
| | 11,226,235 | | | | (59,584 | ) | | | 4,151,414 | | | | (155,043 | ) | | | 3,000,251 | | | | (519,662 | ) | | | (17,969 | ) |
| | — | | | | (909 | ) | | | — | | | | 30 | | | | — | | | | (3,788 | ) | | | 1,141 | |
| | | | | | |
| | | | | | | | | | | | | | | | | | | | | | | | | | |
| | | | | | |
| | 10,499,569 | | | | 553,305 | | | | 21,044,515 | | | | 1,772,310 | | | | 12,418,238 | | | | 2,819,488 | | | | 1,716,216 | |
| | | | | | | | | | | | | | | | | | | | | | | | | | |
| | | | | | |
| | 21,725,804 | | | | 492,812 | | | | 25,195,929 | | | | 1,617,297 | | | | 15,418,489 | | | | 2,296,038 | | | | 1,699,388 | |
| | | | | | | | | | | | | | | | | | | | | | | | | | |
| | | | | | |
| | $22,359,767 | | | | $530,708 | | | | $25,185,051 | | | | $1,745,399 | | | | $15,006,677 | | | | $2,497,503 | | | | $1,685,686 | |
| | | | | | | | | | | | | | | | | | | | | | | | | | |
| | | | | | |
| | | | | | | | | | | | | | | | | | | | | | | | | | |
| | | | | | |
| | — | | | | $7,178 | | | | $4,675 | | | | $2,418 | | | | $4,278 | | | | $54,621 | | | | $16,257 | |
STATEMENTS OF CHANGES IN NET ASSETS
| | | | | | | | | | | | | | | | |
| | | Sit Balanced Fund | | | Sit Dividend Growth Fund | |
| | | Year Ended
June 30,
2017 | | | Year Ended
June 30,
2016 | | | Year Ended
June 30,
2017 | | | Year Ended
June 30,
2016 | |
Operations: | | | | | | | | | | | | | | | | |
Net investment income | | | $291,909 | | | | $281,339 | | | | $15,174,483 | | | | $16,810,135 | |
Net realized gain (loss) on investments and foreign currency transactions | | | 681,151 | | | | 405,475 | | | | 72,506,740 | | | | 64,500,977 | |
Net change in unrealized appreciation (depreciation) of investments and foreign currency transactions | | | 1,963,274 | | | | (494,909 | ) | | | 59,079,432 | | | | (40,919,305 | ) |
| | | | | | | | | | | | | | | | |
Net increase (decrease) in net assets resulting from operations | | | 2,936,334 | | | | 191,905 | | | | 146,760,655 | | | | 40,391,807 | |
| | | | | | | | | | | | | | | | |
| | | | |
Distributions from: | | | | | | | | | | | | | | | | |
Net investment income | | | | | | | | | | | | | | | | |
Common shares (Class I) | | | (270,000 | ) | | | (483,000 | ) | | | (13,709,100 | ) | | | (18,773,757 | ) |
Common shares (Class S) | | | — | | | | — | | | | (789,900 | ) | | | (1,221,244 | ) |
Net realized gains on investments | | | | | | | | | | | | | | | | |
Common shares (Class I) | | | — | | | | (1,053,969 | ) | | | (60,795,024 | ) | | | (106,854,655 | ) |
Common shares (Class S) | | | — | | | | — | | | | (4,229,591 | ) | | | (7,776,788 | ) |
| | | | | | | | | | | | | | | | |
Total distributions | | | (270,000 | ) | | | (1,536,969 | ) | | | (79,523,615 | ) | | | (134,626,444 | ) |
| | | | | | | | | | | | | | | | |
| | | | |
Capital share transactions: | | | | | | | | | | | | | | | | |
Proceeds from shares sold | | | | | | | | | | | | | | | | |
Common shares (Class I) | | | 5,470,617 | | | | 8,592,853 | | | | 235,309,300 | | | | 361,580,592 | |
Common shares (Class S) | | | — | | | | — | | | | 4,759,392 | | | | 4,208,565 | |
Reinvested distributions | | | | | | | | | | | | | | | | |
Common shares (Class I) | | | 268,772 | | | | 1,524,296 | | | | 21,753,300 | | | | 40,052,131 | |
Common shares (Class S) | | | — | | | | — | | | | 4,974,693 | | | | 8,936,473 | |
Payments for shares redeemed | | | | | | | | | | | | | | | | |
Common shares (Class I) | | | (6,675,093 | ) | | | (8,230,744 | ) | | | (246,146,918 | ) | | | (327,488,522 | ) |
Common shares (Class S) | | | — | | | | — | | | | (16,552,919 | ) | | | (21,609,224 | ) |
| | | | | | | | | | | | | | | | |
Increase (decrease) in net assets from capital transactions | | | (935,704 | ) | | | 1,886,405 | | | | 4,096,848 | | | | 65,680,015 | |
| | | | | | | | | | | | | | | | |
Total increase (decrease) in net assets | | | 1,730,630 | | | | 541,341 | | | | 71,333,888 | | | | (28,554,622 | ) |
| | | | |
Net assets: | | | | | | | | | | | | | | | | |
Beginning of period | | | 23,511,051 | | | | 22,969,710 | | | | 1,009,864,578 | | | | 1,038,419,200 | |
| | | | | | | | | | | | | | | | |
End of period * | | | $25,241,681 | | | | $23,511,051 | | | | $1,081,198,466 | | | | $1,009,864,578 | |
| | | | | | | | | | | | | | | | |
| | | | |
Capital transactions in shares: | | | | | | | | | | | | | | | | |
Sold | | | | | | | | | | | | | | | | |
Common shares (Class I) | | | 251,315 | | | | 413,544 | | | | 14,366,496 | | | | 22,658,489 | |
Common shares (Class S) | | | — | | | | — | | | | 296,303 | | | | 263,412 | |
Reinvested distributions | | | | | | | | | | | | | | | | |
Common shares (Class I) | | | 12,751 | | | | 74,586 | | | | 1,378,945 | | | | 2,621,435 | |
Common shares (Class S) | | | — | | | | — | | | | 316,539 | | | | 587,079 | |
Redeemed | | | | | | | | | | | | | | | | |
Common shares (Class I) | | | (305,161 | ) | | | (401,816 | ) | | | (15,130,992 | ) | | | (20,620,329 | ) |
Common shares (Class S) | | | — | | | | — | | | | (1,021,341 | ) | | | (1,343,328 | ) |
| | | | | | | | | | | | | | | | |
Net increase (decrease) | | | (41,095 | ) | | | 86,314 | | | | 205,950 | | | | 4,166,758 | |
| | | | | | | | | | | | | | | | |
| | | | |
* includes undistributed (distributions in excess of) net investment income (loss) | | | $82,423 | | | | $60,565 | | | | $3,846,558 | | | | $3,187,293 | |
| | 1 | The Fund commenced investment operations on June 30, 2016. |
| | |
See accompanying notes to financial statements. | | |
58 | | SIT MUTUAL FUNDS ANNUAL REPORT |
| | | | | | | | | | | | | | | | | | |
| Sit Global Dividend Growth Fund | | | Sit Large Cap Growth Fund | | | Sit ESG Growth Fund | |
Year Ended
June 30,
2017 | | | Year Ended
June 30,
2016 | | | Year Ended
June 30,
2017 | | | Year Ended
June 30,
2016 | | | Year Ended
June 30,
2017 1 | |
| | | | | | | | | | | | | | | | | | |
| | $426,320 | | | | $375,267 | | | | $633,963 | | | | $576,725 | | | | $37,896 | |
| (233,749 | ) | | | (610,940 | ) | | | 11,226,235 | | | | 8,600,977 | | | | (60,493 | ) |
| 2,814,059 | | | | (170,944 | ) | | | 10,499,569 | | | | (10,559,412 | ) | | | 553,305 | |
| | | | | | | | | | | | | | | | | | |
| | 3,006,630 | | | | (406,617 | ) | | | 22,359,767 | | | | (1,381,710 | ) | | | 530,708 | |
| | | | | | | | | | | | | | | | | | |
| | | | |
| | | | | | | | | | | | | | | | | | |
| | | | | | | | | | | | | | | | | | |
| | (354,957 | ) | | | (530,057 | ) | | | (571,000 | ) | | | (4,260,000 | ) | | | (4,383 | ) |
| | (38,043 | ) | | | (62,943 | ) | | | — | | | | — | | | | (1,717 | ) |
| | | | | | | | | | | | | | | | | | |
| | — | | | | (1,512,966 | ) | | | (7,612,702 | ) | | | (28,228,978 | ) | | | — | |
| | — | | | | (201,110 | ) | | | — | | | | — | | | | — | |
| | | | | | | | | | | | | | | | | | |
| | (393,000 | ) | | | (2,307,076 | ) | | | (8,183,702 | ) | | | (32,488,978 | ) | | | (6,100 | ) |
| | | | | | | | | | | | | | | | | | |
| | | | |
| | | | | | | | | | | | | | | | | | |
| | | | | | | | | | | | | | | | | | |
| | 2,665,400 | | | | 2,302,443 | | | | 2,592,948 | | | | 6,199,628 | | | | 2,077,200 | |
| | 409,892 | | | | 181,452 | | | | — | | | | — | | | | 2,072,000 | |
| | | | | | | | | | | | | | | | | | |
| | 354,297 | | | | 2,042,797 | | | | 8,064,947 | | | | 32,014,455 | | | | 4,383 | |
| | 37,741 | | | | 264,053 | | | | — | | | | — | | | | 1,717 | |
| | | | | | | | | | | | | | | | | | |
| | (2,041,964 | ) | | | (1,040,365 | ) | | | (28,672,696 | ) | | | (31,691,511 | ) | | | — | |
| | (334,935 | ) | | | (719,020 | ) | | | — | | | | — | | | | (10,199 | ) |
| | | | | | | | | | | | | | | | | | |
| | 1,090,431 | | | | 3,031,360 | | | | (18,014,801 | ) | | | 6,522,572 | | | | 4,145,101 | |
| | | | | | | | | | | | | | | | | | |
| | 3,704,061 | | | | 317,667 | | | | (3,838,736 | ) | | | (27,348,116 | ) | | | 4,669,709 | |
| | | | |
| | | | | | | | | | | | | | | | | | |
| | 25,193,201 | | | | 24,875,534 | | | | 117,458,746 | | | | 144,806,862 | | | | — | |
| | | | | | | | | | | | | | | | | | |
| | $28,897,262 | | | | $25,193,201 | | | | $113,620,010 | | | | $117,458,746 | | | | $4,669,709 | |
| | | | | | | | | | | | | | | | | | |
| | | | |
| | | | | | | | | | | | | | | | | | |
| | | | | | | | | | | | | | | | | | |
| | 194,406 | | | | 164,944 | | | | 66,462 | | | | 145,288 | | | | 207,625 | |
| | 29,646 | | | | 13,425 | | | | — | | | | — | | | | 206,622 | |
| | | | | | | | | | | | | | | | | | |
| | 26,168 | | | | 154,832 | | | | 224,089 | | | | 874,234 | | | | 428 | |
| | 2,789 | | | | 20,031 | | | | — | | | | — | | | | 168 | |
| | | | | | | | | | | | | | | | | | |
| | (151,558 | ) | | | (74,696 | ) | | | (750,228 | ) | | | (825,719 | ) | | | — | |
| | (24,106 | ) | | | (49,928 | ) | | | — | | | | — | | | | (978 | ) |
| | | | | | | | | | | | | | | | | | |
| | 77,345 | | | | 228,608 | | | | (459,677 | ) | | | 193,803 | | | | 413,865 | |
| | | | | | | | | | | | | | | | | | |
| | | | |
| | $142,589 | | | | $113,414 | | | | $280,441 | | | | $217,862 | | | | $32,139 | |
STATEMENTS OF CHANGES IN NET ASSETS (Continued)
| | | | | | | | | | | | | | | | |
| | | Sit Mid Cap Growth Fund | | | Sit Small Cap
Dividend Growth Fund | |
| | | Year Ended
June 30,
2017 | | | Year Ended
June 30,
2016 | | | Year Ended
June 30,
2017 | | | Year Ended
June 30,
2016 | |
Operations: | | | | | | | | | | | | | | | | |
Net investment income (loss) | | | ($10,878 | ) | | | ($340,217 | ) | | | $128,102 | | | | $97,450 | |
Net realized gain (loss) on investments and foreign currency transactions | | | 4,151,414 | | | | 3,828,112 | | | | (155,013 | ) | | | (178,755 | ) |
Net change in unrealized appreciation (depreciation) of investments and foreign currency transactions | | | 21,044,515 | | | | (19,621,396 | ) | | | 1,772,310 | | | | 237,270 | |
| | | | | | | | | | | | | | | | |
Net increase (decrease) in net assets resulting from operations | | | 25,185,051 | | | | (16,133,501 | ) | | | 1,745,399 | | | | 155,965 | |
| | | | | | | | | | | | | | | | |
| | | | |
Distributions from: | | | | | | | | | | | | | | | | |
Net investment income | | | | | | | | | | | | | | | | |
Common shares (Class I) | | | — | | | | — | | | | (87,515 | ) | | | (59,286 | ) |
Common shares (Class S) | | | — | | | | — | | | | (21,485 | ) | | | (24,214 | ) |
Net realized gains on investments | | | | | | | | | | | | | | | | |
Common shares (Class I) | | | (1,410,787 | ) | | | (23,213,056 | ) | | | — | | | | (452 | ) |
Common shares (Class S) | | | — | | | | — | | | | — | | | | (218 | ) |
| | | | | | | | | | | | | | | | |
Total distributions | | | (1,410,787 | ) | | | (23,213,056 | ) | | | (109,000 | ) | | | (84,170 | ) |
| | | | | | | | | | | | | | | | |
| | | | |
Capital share transactions: | | | | | | | | | | | | | | | | |
Proceeds from shares sold | | | | | | | | | | | | | | | | |
Common shares (Class I) | | | 1,746,154 | | | | 1,517,223 | | | | 6,275,456 | | | | 2,301,643 | |
Common shares (Class S) | | | — | | | | — | | | | 876,893 | | | | 312,218 | |
Reinvested distributions | | | | | | | | | | | | | | | | |
Common shares (Class I) | | | 1,364,194 | | | | 22,382,176 | | | | 83,800 | | | | 57,003 | |
Common shares (Class S) | | | — | | | | — | | | | 21,044 | | | | 24,085 | |
Payments for shares redeemed | | | | | | | | | | | | | | | | |
Common shares (Class I) | | | (10,102,829 | ) | | | (16,883,360 | ) | | | (656,383 | ) | | | (338,246 | ) |
Common shares (Class S) | | | — | | | | — | | | | (424,301 | ) | | | (3,034 | ) |
| | | | | | | | | | | | | | | | |
Increase (decrease) in net assets from capital transactions | | | (6,992,481 | ) | | | 7,016,039 | | | | 6,176,509 | | | | 2,353,669 | |
| | | | | | | | | | | | | | | | |
Total increase (decrease) in net assets | | | 16,781,783 | | | | (32,330,518 | ) | | | 7,812,908 | | | | 2,425,464 | |
| | | | |
Net assets: | | | | | | | | | | | | | | | | |
Beginning of period | | | 139,523,119 | | | | 171,853,637 | | | | 8,363,651 | | | | 5,938,187 | |
| | | | | | | | | | | | | | | | |
End of period* | | | $156,304,902 | | | | $139,523,119 | | | | $16,176,559 | | | | $8,363,651 | |
| | | | | | | | | | | | | | | | |
| | | | |
Capital transactions in shares: | | | | | | | | | | | | | | | | |
Sold | | | | | | | | | | | | | | | | |
Common shares (Class I) | | | 102,473 | | | | 84,771 | | | | 582,458 | | | | 234,507 | |
Common shares (Class S) | | | — | | | | — | | | | 79,594 | | | | 32,561 | |
Reinvested distributions | | | | | | | | | | | | | | | | |
Common shares (Class I) | | | 83,899 | | | | 1,427,435 | | | | 7,829 | | | | 5,975 | |
Common shares (Class S) | | | — | | | | — | | | | 1,981 | | | | 2,522 | |
Redeemed | | | | | | | | | | | | | | | | |
Common shares (Class I) | | | (613,095 | ) | | | (928,645 | ) | | | (58,652 | ) | | | (35,249 | ) |
Common shares (Class S) | | | — | | | | — | | | | (38,205 | ) | | | (304 | ) |
| | | | | | | | | | | | | | | | |
Net increase (decrease) | | | (426,723 | ) | | | 583,561 | | | | 575,005 | | | | 240,012 | |
| | | | | | | | | | | | | | | | |
*includes undistributed (distributions in excess of) net investment income (loss) | | | $4,961 | | | | — | | | | $44,366 | | | | $24,963 | |
| | |
See accompanying notes to financial statements. | | |
| 60 | | SIT MUTUAL FUNDS ANNUAL REPORT |
| | | | | | | | | | | | | | | | | | | | | | |
| Sit Small Cap Growth Fund | | | Sit International Growth Fund | | | Sit Developing Markets Growth Fund | |
Year Ended
June 30,
2017 | | | Year Ended
June 30,
2016 | | | Year Ended
June 30,
2017 | | | Year Ended
June 30,
2016 | | | Year Ended
June 30,
2017 | | | Year Ended
June 30,
2016 | |
| | | | | | | | | | | | | | | | | | | | | | |
| | ($411,812 | ) | | | ($586,514 | ) | | | $201,465 | | | | $162,017 | | | | ($13,702 | ) | | | $22,985 | |
| 3,000,251 | | | | 144,734 | | | | (523,450 | ) | | | (236,287 | ) | | | (16,828 | ) | | | (86,530 | ) |
| 12,418,238 | | | | (16,063,945 | ) | | | 2,819,488 | | | | (1,782,725 | ) | | | 1,716,216 | | | | (1,286,835 | ) |
| | | | | | | | | | | | | | | | | | | | | | |
| | 15,006,677 | | | | (16,505,725 | ) | | | 2,497,503 | | | | (1,856,995 | ) | | | 1,685,686 | | | | (1,350,380 | ) |
| | | | | | | | | | | | | | | | | | | | | | |
| | | | | |
| | | | | | | | | | | | | | | | | | | | | | |
| | | | | | | | | | | | | | | | | | | | | | |
| | — | | | | — | | | | (97,000 | ) | | | (121,000 | ) | | | (18,811 | ) | | | (12,000 | ) |
| | — | | | | — | | | | — | | | | — | | | | — | | | | — | |
| | | | | | | | | | | | | | | | | | | | | | |
| | (144,732 | ) | | | (8,910,218 | ) | | | — | | | | (1,330,288 | ) | | | — | | | | (211,867 | ) |
| | — | | | | — | | | | — | | | | — | | | | — | | | | — | |
| | | | | | | | | | | | | | | | | | | | | | |
| | (144,732 | ) | | | (8,910,218 | ) | | | (97,000 | ) | | | (1,451,288 | ) | | | (18,811 | ) | | | (223,867 | ) |
| | | | | | | | | | | | | | | | | | | | | | |
| | | | | |
| | | | | | | | | | | | | | | | | | | | | | |
| | | | | | | | | | | | | | | | | | | | | | |
| | 1,705,891 | | | | 2,774,375 | | | | 739,301 | | | | 833,973 | | | | 1,191,396 | | | | 274,576 | |
| | — | | | | — | | | | — | | | | — | | | | — | | | | — | |
| | | | | | | | | | | | | | | | | | | | | | |
| | 142,196 | | | | 8,733,559 | | | | 96,669 | | | | 1,443,980 | | | | 18,429 | | | | 219,826 | |
| | — | | | | — | | | | — | | | | — | | | | — | | | | — | |
| | | | | | | | | | | | | | | | | | | | | | |
| | (7,102,157 | ) | | | (8,698,957 | ) | | | (1,058,121 | ) | | | (1,015,370 | ) | | | (612,094 | ) | | | (815,737 | ) |
| | — | | | | — | | | | — | | | | — | | | | — | | | | — | |
| | | | | | | | | | | | | | | | | | | | | | |
| | (5,254,070 | ) | | | 2,808,977 | | | | (222,151 | ) | | | 1,262,583 | | | | 597,731 | | | | (321,335 | ) |
| | | | | | | | | | | | | | | | | | | | | | |
| | 9,607,875 | | | | (22,606,966 | ) | | | 2,178,352 | | | | (2,045,700 | ) | | | 2,264,606 | | | | (1,895,582 | ) |
| | | | | |
| | | | | | | | | | | | | | | | | | | | | | |
| | 81,208,869 | | | | 103,815,835 | | | | 20,439,662 | | | | 22,485,362 | | | | 7,296,509 | | | | 9,192,091 | |
| | | | | | | | | | | | | | | | | | | | | | |
| | $90,816,744 | | | | $81,208,869 | | | | $22,618,014 | | | | $20,439,662 | | | | $9,561,115 | | | | $7,296,509 | |
| | | | | | | | | | | | | | | | | | | | | | |
| | | | | |
| | | | | | | | | | | | | | | | | | | | | | |
| | | | | | | | | | | | | | | | | | | | | | |
| | 33,242 | | | | 51,321 | | | | 47,796 | | | | 51,877 | | | | 79,312 | | | | 21,675 | |
| | — | | | | — | | | | — | | | | — | | | | — | | | | — | |
| | | | | | | | | | | | | | | | | | | | | | |
| | 2,793 | | | | 180,036 | | | | 6,875 | | | | 95,946 | | | | 1,517 | | | | 18,458 | |
| | — | | | | — | | | | — | | | | — | | | | — | | | | — | |
| | | | | | | | | | | | | | | | | | | | | | |
| | (141,431 | ) | | | (177,213 | ) | | | (72,598 | ) | | | (64,900 | ) | | | (48,216 | ) | | | (67,398 | ) |
| | — | | | | — | | | | — | | | | — | | | | — | | | | — | |
| | | | | | | | | | | | | | | | | | | | | | |
| | (105,396 | ) | | | 54,144 | | | | (17,927 | ) | | | 82,923 | | | | 32,613 | | | | (27,265 | ) |
| | | | | | | | | | | | | | | | | | | | | | |
| | — | | | | — | | | | $177,221 | | | | $76,544 | | | | — | | | | $18,811 | |
FINANCIAL HIGHLIGHTS
Per share income and capital changes for a share outstanding throughout the period. See accompanying notes to financial statements.
Sit Balanced Fund
| | | | | | | | | | | | | | | | | | | | |
| |
| | | Years Ended June 30, | |
| | | 2017 | | | 2016 | | | 2015 | | | 2014 | | | 2013 | |
| |
Net Asset Value: | | | | | | | | | | | | | | | | | | | | |
Beginning of period | | | $20.40 | | | | $21.54 | | | | $21.01 | | | | $18.42 | | | | $16.97 | |
| | | | |
Operations: | | | | | | | | | | | | | | | | | | | | |
Net investment income 1 | | | 0.25 | | | | 0.26 | | | | 0.25 | | | | 0.27 | | | | 0.27 | |
Net realized and unrealized gains | | | 2.29 | | | | 0.04 | | | | 1.16 | | | | 2.58 | | | | 1.46 | |
| | | | |
Total from operations | | | 2.54 | | | | 0.30 | | | | 1.41 | | | | 2.85 | | | | 1.73 | |
| | | | |
Distributions to Shareholders: | | | | | | | | | | | | | | | | | | | | |
From net investment income | | | (0.23) | | | | (0.45) | | | | (0.24) | | | | (0.26) | | | | (0.28 | ) |
From net realized gains | | | — | | | | (0.99) | | | | (0.64) | | | | — | | | | — | |
| | | | |
Total distributions | | | (0.23) | | | | (1.44) | | | | (0.88) | | | | (0.26) | | | | (0.28 | ) |
| | | | |
Net Asset Value: | | | | | | | | | | | | | | | | | | | | |
End of period | | | $22.71 | | | | $20.40 | | | | $21.54 | | | | $21.01 | | | | $18.42 | |
| | | | |
Total investment return 2 | | | 12.56% | | | | 1.47% | | | | 6.86% | | | | 15.58% | | | | 10.26% | |
| | | | |
Net assets at end of period (000’s omitted) | | | $25,242 | | | | $23,511 | | | | $22,970 | | | | $15,645 | | | | $13,492 | |
| | | | | |
Ratios: 3 | | | | | | | | | | | | | | | | | | | | |
Expenses | | | 1.00% | | | | 1.00% | | | | 1.00% | | | | 1.00% | | | | 1.00% | |
Net investment income | | | 1.18% | | | | 1.25% | | | | 1.17% | | | | 1.36% | | | | 1.52% | |
| | | | | |
Portfolio turnover rate (excluding short-term securities) | | | 50.31% | | | | 54.46% | | | | 47.49% | | | | 54.52% | | | | 30.86% | |
| 1 | The net investment income per share is based on average shares outstanding for the period. |
| 2 | Total investment return is based on the change in net asset value of a share during the period (not annualized) and assumes reinvestment of distributions at net asset value. |
| 3 | Ratios are annualized for periods less than one year. In addition to fees and expenses which the Fund bears directly, the Fund indirectly bears a pro rata share of the fees and expenses of the acquired funds in which it invests. Such indirect expenses are not included in the above reported expense ratios. |
| | |
| 62 | | SIT MUTUAL FUNDS ANNUAL REPORT |
FINANCIAL HIGHLIGHTS
Per share income and capital changes for a share outstanding throughout the period. See accompanying notes to financial statements.
Sit Dividend Growth Fund
| | | | | | | | | | | | | | | | | | | | |
| |
| Class I | | Years Ended June 30, | |
| | 2017 | | | 2016 | | | 2015 | | | 2014 | | | 2013 | |
| |
Net Asset Value: | | | | | | | | | | | | | | | | | | | | |
Beginning of period | | | $15.82 | | | | $17.40 | | | | $18.69 | | | | $16.35 | | | | $14.10 | |
| | | | |
Operations: | | | | | | | | | | | | | | | | | | | | |
Net investment income 1 | | | 0.24 | | | | 0.26 | | | | 0.25 | | | | 0.26 | | | | 0.27 | |
Net realized and unrealized gains | | | 2.09 | | | | 0.32 | | | | 0.92 | | | | 2.96 | | | | 2.46 | |
| | | | |
Total from operations | | | 2.33 | | | | 0.58 | | | | 1.17 | | | | 3.22 | | | | 2.73 | |
| | | | |
Redemption fees 2 | | | — | | | | — | | | | — | | | | — | | | | — | |
| | | | |
Distributions to Shareholders: | | | | | | | | | | | | | | | | | | | | |
From net investment income | | | (0.23 | ) | | | (0.32 | ) | | | (0.25 | ) | | | (0.25 | ) | | | (0.26 | ) |
From net realized gains | | | (1.04 | ) | | | (1.84 | ) | | | (2.21 | ) | | | (0.63 | ) | | | (0.22 | ) |
| | | | |
Total distributions | | | (1.27 | ) | | | (2.16 | ) | | | (2.46 | ) | | | (0.88 | ) | | | (0.48 | ) |
| | | | |
Net Asset Value: | | | | | | | | | | | | | | | | | | | | |
End of period | | | $16.88 | | | | $15.82 | | | | $17.40 | | | | $18.69 | | | | $16.35 | |
| | | | |
Total investment return 3 | | | 15.41% | | | | 3.94% | | | | 6.39% | | | | 20.26% | | | | 19.77% | |
| | | | |
Net assets at end of period (000’s omitted) | | | $1,015,920 | | | | $942,244 | | | | $955,460 | | | | $1,017,106 | | | | $920,324 | |
Ratios: 4 | | | | | | | | | | | | | | | | | | | | |
Expenses | | | 1.00% | | | | 1.00% | | | | 1.00% | | | | 1.00% | | | | 1.00% | |
Net investment income | | | 1.49% | | | | 1.64% | | | | 1.39% | | | | 1.50% | | | | 1.78% | |
Portfolio turnover rate (excluding short-term securities) | | | 61.33% | | | | 75.94% | | | | 57.69% | | | | 44.36% | | | | 26.58% | |
| |
| Class S | | Years Ended June 30, | |
| | 2017 | | | 2016 | | | 2015 | | | 2014 | | | 2013 | |
| |
Net Asset Value: | | | | | | | | | | | | | | | | | | | | |
Beginning of period | | | $15.76 | | | | $17.34 | | | | $18.63 | | | | $16.29 | | | | $14.06 | |
| | | | |
Operations: | | | | | | | | | | | | | | | | | | | | |
Net investment income 1 | | | 0.20 | | | | 0.22 | | | | 0.21 | | | | 0.22 | | | | 0.23 | |
Net realized and unrealized gains | | | 2.08 | | | | 0.32 | | | | 0.91 | | | | 2.96 | | | | 2.44 | |
| | | | |
Total from operations | | | 2.28 | | | | 0.54 | | | | 1.12 | | | | 3.18 | | | | 2.67 | |
| | | | |
Redemption fees 2 | | | — | | | | — | | | | — | | | | — | | | | — | |
| | | | |
Distributions to Shareholders: | | | | | | | | | | | | | | | | | | | | |
From net investment income | | | (0.19 | ) | | | (0.28 | ) | | | (0.20 | ) | | | (0.21 | ) | | | (0.22 | ) |
From net realized gains | | | (1.04 | ) | | | (1.84 | ) | | | (2.21 | ) | | | (0.63 | ) | | | (0.22 | ) |
| | | | |
Total distributions | | | (1.23 | ) | | | (2.12 | ) | | | (2.41 | ) | | | (0.84 | ) | | | (0.44 | ) |
| | | | |
Net Asset Value: | | | | | | | | | | | | | | | | | | | | |
End of period | | | $16.81 | | | | $15.76 | | | | $17.34 | | | | $18.63 | | | | $16.29 | |
| | | | |
Total investment return 3 | | | 15.11% | | | | 3.68% | | | | 6.13% | | | | 20.02% | | | | 19.39% | |
| | | | |
Net assets at end of period (000’s omitted) | | | $65,278 | | | | $67,620 | | | | $82,959 | | | | $103,433 | | | | $134,498 | |
Ratios: 4 | | | | | | | | | | | | | | | | | | | | |
Expenses | | | 1.25% | | | | 1.25% | | | | 1.25% | | | | 1.25% | | | | 1.25% | |
Net investment income | | | 1.24% | | | | 1.39% | | | | 1.14% | | | | 1.25% | | | | 1.53% | |
Portfolio turnover rate (excluding short-term securities) | | | 61.33% | | | | 75.94% | | | | 57.69% | | | | 44.36% | | | | 26.58% | |
| 1 | The net investment income per share is based on average shares outstanding for the period. |
| 2 | Amount represents less than $0.01 per share. |
| 3 | Total investment return is based on the change in net asset value of a share during the period (not annualized) and assumes reinvestment of distributions at net asset value. |
| 4 | Ratios are annualized for periods less than one year. In addition to fees and expenses which the Fund bears directly, the Fund indirectly bears a pro rata share of the fees and expenses of the acquired funds in which it invests. Such indirect expenses are not included in the above reported expense ratios. |
FINANCIAL HIGHLIGHTS
Per share income and capital changes for a share outstanding throughout the period. See accompanying notes to financial statements.
Sit Global Dividend Growth Fund
| | | | | | | | | | | | | | | | | | | | |
| |
| Class I | | Years Ended June 30, | |
| | 2017 | | | 2016 | | | 2015 | | | 2014 | | | 2013 | |
| |
Net Asset Value: | | | | | | | | | | | | | | | | | | | | |
Beginning of period | | | $13.19 | | | | $14.80 | | | | $15.74 | | | | $14.27 | | | | $12.55 | |
| | | | |
Operations: | | | | | | | | | | | | | | | | | | | | |
Net investment income 1 | | | 0.22 | | | | 0.21 | | | | 0.20 | | | | 0.23 | | | | 0.25 | |
Net realized and unrealized gains (losses) | | | 1.34 | | | | (0.48 | ) | | | 0.13 | | | | 2.09 | | | | 1.78 | |
| | | | |
Total from operations | | | 1.56 | | | | (0.27 | ) | | | 0.33 | | | | 2.32 | | | | 2.03 | |
| | | | |
Redemption fees | | | — | 2 | | | — | | | | — | | | | — | 2 | | | — | 2 |
| | | | |
Distributions to Shareholders: | | | | | | | | | | | | | | | | | | | | |
From net investment income | | | (0.21 | ) | | | (0.34 | ) | | | (0.20 | ) | | | (0.22 | ) | | | (0.23 | ) |
From net realized gains | | | — | | | | (1.00 | ) | | | (1.07 | ) | | | (0.63 | ) | | | (0.08 | ) |
| | | | |
Total distributions | | | (0.21 | ) | | | (1.34 | ) | | | (1.27 | ) | | | (0.85 | ) | | | (0.31 | ) |
| | | | |
Net Asset Value: | | | | | | | | | | | | | | | | | | | | |
End of period | | | $14.54 | | | | $13.19 | | | | $14.80 | | | | $15.74 | | | | $14.27 | |
| | | | |
Total investment return 3 | | | 11.94% | | | | (1.67% | ) | | | 2.19% | | | | 16.76% | | | | 16.36% | |
| | | | |
Net assets at end of period (000’s omitted) | | | $25,623 | | | | $22,333 | | | | $21,424 | | | | $21,467 | | | | $14,196 | |
Ratios: 4 | | | | | | | | | | | | | | | | | | | | |
Expenses | | | 1.25% | | | | 1.25% | | | | 1.25% | | | | 1.25% | | | | 1.25% | |
Net investment income | | | 1.63% | | | | 1.56% | | | | 1.33% | | | | 1.55% | | | | 1.81% | |
Portfolio turnover rate (excluding short-term securities) | | | 32.04% | | | | 48.30% | | | | 75.06% | | | | 48.68% | | | | 26.15% | |
| |
| Class S | | Years Ended June 30, | |
| | 2017 | | | 2016 | | | 2015 | | | 2014 | | | 2013 | |
| |
Net Asset Value: | | | | | | | | | | | | | | | | | | | | |
Beginning of period | | | $13.18 | | | | $14.78 | | | | $15.72 | | | | $14.25 | | | | $12.54 | |
| | | | |
Operations: | | | | | | | | | | | | | | | | | | | | |
Net investment income 1 | | | 0.19 | | | | 0.18 | | | | 0.16 | | | | 0.20 | | | | 0.21 | |
Net realized and unrealized gains (losses) | | | 1.33 | | | | (0.48 | ) | | | 0.13 | | | | 2.09 | | | | 1.78 | |
| | | | |
Total from operations | | | 1.52 | | | | (0.30 | ) | | | 0.29 | | | | 2.29 | | | | 1.99 | |
| | | | |
Redemption fees | | | — | | | | — | | | | — | | | | — | 2 | | | — | |
| | | | |
Distributions to Shareholders: | | | | | | | | | | | | | | | | | | | | |
From net investment income | | | (0.17 | ) | | | (0.30 | ) | | | (0.16 | ) | | | (0.19 | ) | | | (0.20 | ) |
From net realized gains | | | — | | | | (1.00 | ) | | | (1.07 | ) | | | (0.63 | ) | | | (0.08 | ) |
| | | | |
Total distributions | | | (0.17 | ) | | | (1.30 | ) | | | (1.23 | ) | | | (0.82 | ) | | | (0.28 | ) |
| | | | |
Net Asset Value: | | | | | | | | | | | | | | | | | | | | |
End of period | | | $14.53 | | | | $13.18 | | | | $14.78 | | | | $15.72 | | | | $14.25 | |
| | | | |
Total investment return 3 | | | 11.67% | | | | (1.89% | ) | | | 2.00% | | | | 16.49% | | | | 16.01% | |
| | | | |
Net assets at end of period (000’s omitted) | | | $3,274 | | | | $2,861 | | | | $3,451 | | | | $3,323 | | | | $3,257 | |
Ratios: 4 | | | | | | | | | | | | | | | | | | | | |
Expenses | | | 1.50% | | | | 1.50% | | | | 1.50% | | | | 1.50% | | | | 1.50% | |
Net investment income | | | 1.38% | | | | 1.31% | | | | 1.08% | | | | 1.30% | | | | 1.56% | |
Portfolio turnover rate (excluding short-term securities) | | | 32.04% | | | | 48.30% | | | | 75.06% | | | | 48.68% | | | | 26.15% | |
| 1 | The net investment income per share is based on average shares outstanding for the period. |
| 2 | Amount represents less than $0.01 per share. |
| 3 | Total investment return is based on the change in net asset value of a share during the period (not annualized) and assumes reinvestment of distributions at net asset value. |
| 4 | Ratios are annualized for periods less than one year. In addition to fees and expenses which the Fund bears directly, the Fund indirectly bears a pro rata share of the fees and expenses of the acquired funds in which it invests. Such indirect expenses are not included in the above reported expense ratios. |
| | |
| 64 | | SIT MUTUAL FUNDS ANNUAL REPORT |
FINANCIAL HIGHLIGHTS
Per share income and capital changes for a share outstanding throughout the period. See accompanying notes to financial statements.
Sit Large Cap Growth Fund
| | | | | | | | | | | | | | | | | | | | |
| |
| | | Years Ended June 30, | |
| | 2017 | | | 2016 | | | 2015 | | | 2014 | | | 2013 | |
| |
Net Asset Value: | | | | | | | | | | | | | | | | | | | | |
Beginning of period | | | $36.02 | | | | $47.21 | | | | $52.51 | | | | $47.53 | | | | $45.53 | |
| | | | |
Operations: | | | | | | | | | | | | | | | | | | | | |
Net investment income 1 | | | 0.21 | | | | 0.18 | | | | 0.20 | | | | 0.29 | | | | 0.43 | |
Net realized and unrealized gains (losses) | | | 7.07 | | | | (0.42 | ) | | | 5.04 | | | | 10.23 | | | | 5.69 | |
| | | | |
Total from operations | | | 7.28 | | | | (0.24 | ) | | | 5.24 | | | | 10.52 | | | | 6.12 | |
| | | | |
Redemption fees 2 | | | — | | | | — | | | | — | | | | — | | | | — | |
| | | | |
Distributions to Shareholders: | | | | | | | | | | | | | | | | | | | | |
From net investment income | | | (0.19 | ) | | | (1.44 | ) | | | (0.24 | ) | | | (0.39 | ) | | | (0.46 | ) |
From net realized gains | | | (2.55 | ) | | | (9.51 | ) | | | (10.30 | ) | | | (5.15 | ) | | | (3.66 | ) |
| | | | |
Total distributions | | | (2.74 | ) | | | (10.95 | ) | | | (10.54 | ) | | | (5.54 | ) | | | (4.12 | ) |
| | | | |
Net Asset Value: | | | | | | | | | | | | | | | | | | | | |
End of period | | | $40.56 | | | | $36.02 | | | | $47.21 | | | | $52.51 | | | | $47.53 | |
| | | | |
Total investment return 3 | | | 21.18% | | | | (0.89% | ) | | | 10.62% | | | | 22.92% | | | | 14.18% | |
| | | | |
Net assets at end of period (000’s omitted) | | | $113,620 | | | | $117,459 | | | | $144,807 | | | | $188,574 | | | | $196,285 | |
| | | | | |
Ratios: 4 | | | | | | | | | | | | | | | | | | | | |
Expenses | | | 1.00% | | | | 1.00% | | | | 1.00% | | | | 1.00% | | | | 1.00% | |
Net investment income | | | 0.54% | | | | 0.44% | | | | 0.41% | | | | 0.57% | | | | 0.92% | |
| | | | | |
Portfolio turnover rate (excluding short-term securities) | | | 17.69% | | | | 20.05% | | | | 24.04% | | | | 27.34% | | | | 13.42% | |
| 1 | The net investment income per share is based on average shares outstanding for the period. |
| 2 | Amount represents less than $0.01 per share. |
| 3 | Total investment return is based on the change in net asset value of a share during the period (not annualized) and assumes reinvestment of distributions at net asset value. |
| 4 | Ratios are annualized for periods less than one year. In addition to fees and expenses which the Fund bears directly, the Fund indirectly bears a pro rata share of the fees and expenses of the acquired funds in which it invests. Such indirect expenses are not included in the above reported expense ratios. |
FINANCIAL HIGHLIGHTS
Per share income and capital changes for a share outstanding throughout the period. See accompanying notes to financial statements.
Sit ESG Growth Fund
| | | | |
| Class I | | Year Ended
June 30,
2017 * | |
| |
Net Asset Value: | | | | |
Beginning of period | | | $10.00 | |
| | | | |
Operations: | | | | |
Net investment income 1 | | | 0.11 | |
Net realized and unrealized gains | | | 1.20 | |
| | | | |
Total from operations | | | 1.31 | |
| | | | |
Distributions to Shareholders: | | | | |
From net investment income | | | (0.02 | ) |
| | | | |
Net Asset Value: | | | | |
End of period | | | $11.29 | |
| | | | |
Total investment return 2 | | | 13.13% | |
| | | | |
Net assets at end of period (000’s omitted) | | | $2,349 | |
Ratios: 3 | | | | |
Expenses | | | 1.25% | |
Net investment income | | | 1.01% | |
Portfolio turnover rate (excluding short-term securities) | | | 27.60% | |
| Class S | | Year Ended
June 30,
2017 * | |
| |
Net Asset Value: | | | | |
Beginning of period | | | $10.00 | |
| | | | |
Operations: | | | | |
Net investment income 1 | | | 0.08 | |
Net realized and unrealized gains | | | 1.21 | |
| | | | |
Total from operations | | | 1.29 | |
| | | | |
Distributions to Shareholders: | | | | |
From net investment income | | | (0.01 | ) |
| | | | |
Net Asset Value: | | | | |
End of period | | | $11.28 | |
| | | | |
Total investment return 2 | | | 12.79% | |
| | | | |
Net assets at end of period (000’s omitted) | | | $2,321 | |
Ratios: 3 | | | | |
Expenses | | | 1.50% | |
Net investment income | | | 0.76% | |
Portfolio turnover rate (excluding short-term securities) | | | 27.60% | |
| * | The Fund commenced investment operations on June 30, 2016. |
| 1 | The net investment income per share is based on average shares outstanding for the period. |
| 2 | Total investment return is based on the change in net asset value of a share during the period (not annualized) and assumes reinvestment of distributions at net asset value. |
| 3 | Ratios are annualized for periods less than one year. In addition to fees and expenses which the Fund bears directly, the Fund indirectly bears a pro rata share of the fees and expenses of the acquired funds in which it invests. Such indirect expenses are not included in the above reported expense ratios. |
| | |
| 66 | | SIT MUTUAL FUNDS ANNUAL REPORT |
FINANCIAL HIGHLIGHTS
Per share income and capital changes for a share outstanding throughout the period. See accompanying notes to financial statements.
Sit Mid Cap Growth Fund
| | | | | | | | | | | | | | | | | | | | |
| |
| | | Years Ended June 30, | |
| | 2017 | | | 2016 | | | 2015 | | | 2014 | | | 2013 | |
| |
Net Asset Value: | | | | | | | | | | | | | | | | | | | | |
Beginning of period | | | $15.36 | | | | $20.22 | | | | $21.08 | | | | $17.69 | | | | $15.77 | |
| | | | |
Operations: | | | | | | | | | | | | | | | | | | | | |
Net investment loss 1 | | | — | 2 | | | (0.04 | ) | | | (0.06 | ) | | | (0.07 | ) | | | (0.03 | ) |
Net realized and unrealized gains (losses) | | | 2.86 | | | | (1.92 | ) | | | 1.91 | | | | 4.54 | | | | 2.32 | |
| | | | |
Total from operations | | | 2.86 | | | | (1.96 | ) | | | 1.85 | | | | 4.47 | | | | 2.29 | |
| | | | |
Redemption fees 2 | | | — | | | | — | | | | — | | | | — | | | | — | |
| | | | |
Distributions to Shareholders: | | | | | | | | | | | | | | | | | | | | |
From net realized gains | | | (0.16 | ) | | | (2.90 | ) | | | (2.71 | ) | | | (1.08 | ) | | | (0.37 | ) |
| | | | |
Net Asset Value: | | | | | | | | | | | | | | | | | | | | |
End of period | | | $18.06 | | | | $15.36 | | | | $20.22 | | | | $21.08 | | | | $17.69 | |
| | | | |
Total investment return 3 | | | 18.74% | | | | (9.97% | ) | | | 9.52% | | | | 25.58% | | | | 14.70% | |
| | | | |
Net assets at end of period (000’s omitted) | | | $156,305 | | | | $139,523 | | | | $171,854 | | | | $180,276 | | | | $152,129 | |
| | | | | |
Ratios: 4 | | | | | | | | | | | | | | | | | | | | |
Expenses | | | 1.25% | | | | 1.25% | | | | 1.25% | | | | 1.25% | | | | 1.25% | |
Net investment loss | | | (0.01% | ) | | | (0.23% | ) | | | (0.30% | ) | | | (0.37% | ) | | | (0.17% | ) |
| | | | | |
Portfolio turnover rate (excluding short-term securities) | | | 23.02% | | | | 21.57% | | | | 23.39% | | | | 27.65% | | | | 16.91% | |
| 1 | The net investment income (loss) per share is based on average shares outstanding for the period. |
| 2 | Amount represents less than $0.01 per share. |
| 3 | Total investment return is based on the change in net asset value of a share during the period (not annualized) and assumes reinvestment of distributions at net asset value. |
| 4 | Ratios are annualized for periods less than one year. In addition to fees and expenses which the Fund bears directly, the Fund indirectly bears a pro rata share of the fees and expenses of the acquired funds in which it invests. Such indirect expenses are not included in the above reported expense ratios. |
FINANCIAL HIGHLIGHTS
Per share income and capital changes for a share outstanding throughout the period. See accompanying notes to financial statements.
Sit Small Cap Dividend Growth Fund
| | | | | | | | | | | | |
| Class I | | Year Ended
June 30, 2017 | | | Year Ended
June 30, 2016 | | | Three
Months Ended
June 30, 2015 * | |
| | | |
Net Asset Value: | | | | | | | | | | | | |
Beginning of period | | | $10.00 | | | | $9.96 | | | | $10.00 | |
| | | | |
Operations: | | | | | | | | | | | | |
Net investment income 1 | | | 0.12 | | | | 0.14 | | | | 0.02 | |
Net realized and unrealized gains (losses) | | | 1.46 | | | | 0.02 | | | | (0.06 | ) |
| | | | |
Total from operations | | | 1.58 | | | | 0.16 | | | | (0.04 | ) |
| | | | |
Distributions to Shareholders: | | | | | | | | | | | | |
From net investment income | | | (0.11 | ) | | | (0.12 | ) | | | — | |
From net realized gains | | | — | | | | — | 2 | | | — | |
| | | | |
Total distributions | | | (0.11 | ) | | | (0.12 | ) | | | — | |
| | | | |
Net Asset Value: | | | | | | | | | | | | |
End of period | | | $11.47 | | | | $10.00 | | | | $9.96 | |
| | | | |
Total investment return 3 | | | 15.84% | | | | 1.71% | | | | (0.40% | ) |
| | | | |
Net assets at end of period (000’s omitted) | | | $12,716 | | | | $5,777 | | | | $3,708 | |
Ratios: 4 | | | | | | | | | | | | |
Expenses | | | 1.25% | | | | 1.25% | | | | 1.25% | |
Net investment income | | | 1.06% | | | | 1.46% | | | | 0.98% | |
Portfolio turnover rate (excluding short-term securities) | | | 19.57% | | | | 26.43% | | | | 2.63% | 5 |
| Class S | | Year Ended
June 30, 2017 | | | Year Ended
June 30, 2016 | | | Three Months Ended
June 30, 2015 * | |
| | | |
Net Asset Value: | | | | | | | | | | | | |
Beginning of period | | | $10.00 | | | | $9.96 | | | | $10.00 | |
| | | | |
Operations: | | | | | | | | | | | | |
Net investment income 1 | | | 0.09 | | | | 0.11 | | | | 0.02 | |
Net realized and unrealized gains (losses) | | | 1.45 | | | | 0.03 | | | | (0.06 | ) |
| | | | |
Total from operations | | | 1.54 | | | | 0.14 | | | | (0.04 | ) |
| | | | |
Distributions to Shareholders: | | | | | | | | | | | | |
From net investment income | | | (0.08 | ) | | | (0.10 | ) | | | — | |
From net realized gains | | | — | | | | — | 2 | | | — | |
| | | | |
Total distributions | | | (0.08 | ) | | | (0.10 | ) | | | — | |
| | | | |
Net Asset Value: | | | | | | | | | | | | |
End of period | | | $11.46 | | | | $10.00 | | | | $9.96 | |
| | | | |
Total investment return 3 | | | 15.46% | | | | 1.46% | | | | (0.40% | ) |
| | | | |
Net assets at end of period (000’s omitted) | | | $3,461 | | | | $2,587 | | | | $2,230 | |
Ratios: 4 | | | | | | | | | | | | |
Expenses | | | 1.50% | | | | 1.50% | | | | 1.50% | |
Net investment income | | | 0.81% | | | | 1.21% | | | | 0.73% | |
Portfolio turnover rate (excluding short-term securities) | | | 19.57% | | | | 26.43% | | | | 2.63% | 5 |
| * | The Fund commenced investment operations on March 31, 2015. |
| 1 | The net investment income per share is based on average shares outstanding for the period. |
| 2 | Amount represents less than $0.01 per share. |
| 3 | Total investment return is based on the change in net asset value of a share during the period (not annualized) and assumes reinvestment of distributions at net asset value. |
| 4 | Ratios are annualized for periods less than one year. In addition to fees and expenses which the Fund bears directly, the Fund indirectly bears a pro rata share of the fees and expenses of the acquired funds in which it invests. Such indirect expenses are not included in the above reported expense ratios. |
| | |
| 68 | | SIT MUTUAL FUNDS ANNUAL REPORT |
FINANCIAL HIGHLIGHTS
Per share income and capital changes for a share outstanding throughout the period. See accompanying notes to financial statements.
Sit Small Cap Growth Fund
| | | | | | | | | | | | | | | | | | | | |
| |
| | | Years Ended June 30, | |
| | 2017 | | | 2016 | | | 2015 | | | 2014 | | | 2013 | |
| |
Net Asset Value: | | | | | | | | | | | | | | | | | | | | |
Beginning of period | | | $45.59 | | | | $60.10 | | | | $61.38 | | | | $50.08 | | | | $43.90 | |
| | | | |
Operations: | | | | | | | | | | | | | | | | | | | | |
Net investment loss 1 | | | (0.24 | ) | | | (0.33 | ) | | | (0.48 | ) | | | (0.55 | ) | | | (0.30 | ) |
Net realized and unrealized gains (losses) | | | 8.91 | | | | (8.97 | ) | | | 6.26 | | | | 11.85 | | | | 6.48 | |
| | | | |
Total from operations | | | 8.67 | | | | (9.30 | ) | | | 5.78 | | | | 11.30 | | | | 6.18 | |
| | | | |
Redemption fees 2 | | | — | | | | — | | | | — | | | | — | | | | — | |
| | | | |
Distributions to Shareholders: | | | | | | | | | | | | | | | | | | | | |
From net realized gains | | | (0.08 | ) | | | (5.21 | ) | | | (7.06 | ) | | | — | | | | — | |
| | | | |
Net Asset Value: | | | | | | | | | | | | | | | | | | | | |
End of period | | | $54.18 | | | | $45.59 | | | | $60.10 | | | | $61.38 | | | | $50.08 | |
| | | | |
Total investment return 3 | | | 19.06% | | | | (16.00% | ) | | | 10.38% | | | | 22.56% | | | | 14.08% | |
| | | | |
Net assets at end of period (000’s omitted) | | | $90,817 | | | | $81,209 | | | | $103,816 | | | | $99,510 | | | | $84,793 | |
| | | | | |
Ratios: 4 | | | | | | | | | | | | | | | | | | | | |
Expenses | | | 1.50% | | | | 1.50% | | | | 1.50% | | | | 1.50% | | | | 1.50% | |
Net investment loss | | | (0.47% | ) | | | (0.65% | ) | | | (0.81% | ) | | | (0.94% | ) | | | (0.64% | ) |
| | | | | |
Portfolio turnover rate (excluding short-term securities) | | | 29.08% | | | | 27.37% | | | | 31.07% | | | | 33.38% | | | | 28.36% | |
| 1 | The net investment income (loss) per share is based on average shares outstanding for the period. |
| 2 | Amount represents less than $0.01 per share. |
| 3 | Total investment return is based on the change in net asset value of a share during the period (not annualized) and assumes reinvestment of distributions at net asset value. |
| 4 | Ratios are annualized for periods less than one year. In addition to fees and expenses which the Fund bears directly, the Fund indirectly bears a pro rata share of the fees and expenses of the acquired funds in which it invests. Such indirect expenses are not included in the above reported expense ratios. |
FINANCIAL HIGHLIGHTS
Per share income and capital changes for a share outstanding throughout the period. See accompanying notes to financial statements.
Sit International Growth Fund
| | | | | | | | | | | | | | | | | | | | |
| |
| | | Years Ended June 30, | |
| | 2017 | | | 2016 | | | 2015 | | | 2014 | | | 2013 | |
| |
Net Asset Value: | | | | | | | | | | | | |
Beginning of period | | | $14.48 | | | | $16.92 | | | | $17.44 | | | | $15.05 | | | | $13.29 | |
| | | | |
Operations: | | | | | | | | | | | | |
Net investment income 1 | | | 0.14 | | | | 0.12 | | | | 0.09 | | | | 0.28 | | | | 0.20 | |
Net realized and unrealized gains (losses) | | | 1.68 | | | | (1.47 | ) | | | (0.34 | ) | | | 2.28 | | | | 1.80 | |
| | | | |
Total from operations | | | 1.82 | | | | (1.35 | ) | | | (0.25 | ) | | | 2.56 | | | | 2.00 | |
| | | | |
Redemption fees | | | — | 2 | | | — | | | | — | | | | — | | | | — | |
| | | | |
Distributions to Shareholders: | | | | | | | | | | | | | | | | | | | | |
From net investment income | | | (0.07 | ) | | | (0.09 | ) | | | (0.27 | ) | | | (0.17 | ) | | | (0.24 | ) |
From net realized gains | | | — | | | | (1.00 | ) | | | — | | | | — | | | | — | |
| | | | |
Total distributions | | | (0.07 | ) | | | (1.09 | ) | | | (0.27 | ) | | | (0.17 | ) | | | (0.24 | ) |
| | | | |
Net Asset Value: | | | | | | | | | | | | | | | | | | | | |
End of period | | | $16.23 | | | | $14.48 | | | | $16.92 | | | | $17.44 | | | | $15.05 | |
| | | | |
Total investment return 3 | | | 12.64% | | | | (8.19% | ) | | | (1.35% | ) | | | 17.06% | | | | 15.06% | |
| | | | |
Net assets at end of period (000’s omitted) | | | $22,618 | | | | $20,440 | | | | $22,485 | | | | $24,127 | | | | $20,890 | |
| | | | | |
Ratios: 4 | | | | | | | | | | | | | | | | | | | | |
Expenses | | | 1.50% | | | | 1.50% | | | | 1.50% | | | | 1.50% | | | | 1.50% | |
Net investment income | | | 0.97% | | | | 0.76% | | | | 0.55% | | | | 1.69% | | | | 1.39% | |
| | | | | |
Portfolio turnover rate (excluding short-term securities) | | | 39.23% | | | | 37.94% | | | | 56.97% | | | | 46.91% | | | | 27.93% | |
| 1 | The net investment income per share is based on average shares outstanding for the period. |
| 2 | Amount represents less than $0.01 per share. |
| 3 | Total investment return is based on the change in net asset value of a share during the period (not annualized) and assumes reinvestment of distributions at net asset value. |
| 4 | Ratios are annualized for periods less than one year. In addition to fees and expenses which the Fund bears directly, the Fund indirectly bears a pro rata share of the fees and expenses of the acquired funds in which it invests. Such indirect expenses are not included in the above reported expense ratios. |
| | |
| 70 | | SIT MUTUAL FUNDS ANNUAL REPORT |
FINANCIAL HIGHLIGHTS
Per share income and capital changes for a share outstanding throughout the period. See accompanying notes to financial statements.
Sit Developing Markets Growth Fund
| | | | | | | | | | | | | | | | | | | | |
| |
| | | Years Ended June 30, | |
| | 2017 | | | 2016 | | | 2015 | | | 2014 | | | 2013 | |
| |
Net Asset Value: | | | | | | | | | | | | | | | | |
Beginning of period | | | $12.26 | | | | $14.77 | | | | $17.48 | | | | $16.40 | | | | $17.70 | |
| | | | |
Operations: | | | | | | | | | | | | | | | | |
Net investment income (loss) 1 | | | (0.02 | ) | | | 0.04 | | | | 0.03 | | | | (0.01 | ) | | | 0.04 | |
Net realized and unrealized gains (losses) | | | 3.02 | | | | (2.18 | ) | | | (1.41 | ) | | | 2.07 | | | | 0.14 | |
| | | | |
Total from operations | | | 3.00 | | | | (2.14 | ) | | | (1.38 | ) | | | 2.06 | | | | 0.18 | |
| | | | |
Redemption fees | | | — | | | | — | 2 | | | — | | | | — | | | | — | |
| | | | |
Distributions to Shareholders: | | | | | | | | | | | | | | | | |
From net investment income | | | (0.03 | ) | | | (0.02 | ) | | | — | | | | (0.03 | ) | | | (0.06 | ) |
From net realized gains | | | — | | | | (0.35 | ) | | | (1.33 | ) | | | (0.95 | ) | | | (1.42 | ) |
| | | | |
Total distributions | | | (0.03 | ) | | | (0.37 | ) | | | (1.33 | ) | | | (0.98 | ) | | | (1.48 | ) |
| | | | |
Net Asset Value: | | | | | | | | | | | | | | | | |
End of period | | | $15.23 | | | | $12.26 | | | | $14.77 | | | | $17.48 | | | | $16.40 | |
| | | | |
Total investment return 3 | | | 24.56% | | | | (14.42% | ) | | | (7.64% | ) | | | 12.79% | | | | 0.36% | |
| | | | |
Net assets at end of period (000’s omitted) | | | $9,561 | | | | $7,297 | | | | $9,192 | | | | $10,808 | | | | $10,615 | |
| | | | |
Ratios: 4 | | | | | | | | | | | | | | | | |
Expenses | | | 2.00% | | | | 2.00% | | | | 2.00% | | | | 2.00% | | | | 2.00% | |
Net investment income (loss) | | | (0.18% | ) | | | 0.31% | | | | 0.16% | | | | (0.07% | ) | | | 0.24% | |
| | | | | |
Portfolio turnover rate (excluding short-term securities) | | | 19.67% | | | | 28.14% | | | | 21.51% | | | | 21.45% | | | | 15.48% | |
| 1 | The net investment income (loss) per share is based on average shares outstanding for the period. |
| 2 | Amount represents less than $0.01 per share. |
| 3 | Total investment return is based on the change in net asset value of a share during the period (not annualized) and assumes reinvestment of distributions at net asset value. |
| 4 | Ratios are annualized for periods less than one year. In addition to fees and expenses which the Fund bears directly, the Fund indirectly bears a pro rata share of the fees and expenses of the acquired funds in which it invests. Such indirect expenses are not included in the above reported expense ratios. |
NOTES TO FINANCIAL STATEMENTS
Year Ended June 30, 2017
Sit Mutual Funds are no-load funds, and are registered under the Investment Company Act of 1940 (as amended) as diversified, open-end management investment companies, or series thereof. The Sit Balanced, Sit Dividend Growth, Sit Global Dividend Growth, Sit ESG Growth, Sit Small Cap Dividend Growth, Sit Small Cap Growth, Sit International Growth, and Sit Developing Markets Growth are series funds of Sit Mutual Funds, Inc.
This report covers the equity funds of the Sit Mutual Funds (the Funds). Each fund has 10 billion authorized shares of capital stock with a par value of $0.001. The investment objective for each Fund is as follows:
| | |
Fund | | Investment Objective |
Balanced | | Long-term growth consistent with the preservation of principal and to provide regular income. |
Dividend Growth | | Provide current income that exceeds the dividend yield of the S&P 500® Index and that grows over a period of years. Secondarily, maximize long-term capital appreciation. |
Global Dividend Growth | | Provide current income that exceeds the dividend yield of the MSCI World Index that grows over a period of years. Secondarily, maximize long-term capital appreciation. |
Large Cap Growth | | Maximize long-term capital appreciation. |
ESG Growth | | Maximize long-term capital appreciation. |
Mid Cap Growth | | Maximize long-term capital appreciation. |
Small Cap Dividend Growth | | Provide current income that exceeds the yield of the Russell 2000® Index and that grows over a period of years. Secondarily, maximize long-term capital appreciation. |
Small Cap Growth | | Maximize long-term capital appreciation. |
International Growth | | Maximize long-term growth. |
Developing Markets Growth | | Maximize long-term capital appreciation. |
The Dividend Growth, Global Dividend Growth, ESG Growth and Small Cap Dividend Growth Funds offer Class I and Class S shares. Both classes of shares have identical voting, dividend, and liquidation rights. The distribution fee differs among classes, the Class S shares have a 0.25% distribution fee, whereas Class I has no distribution fee. Income, expenses (other than class specific expenses) and realized and unrealized gains or losses on investments are allocated to each class of shares based upon its relative net assets.
| (2) | Significant Accounting Policies |
The Funds are investment companies and follow accounting and reporting guidance under Financial Accounting Standards Board (“FASB”) Accounting Standards Codification (“ASC”) Topic 946, “Financial Services-Investment Companies”. The following is a summary of significant accounting policies consistently followed by the Funds in the preparation of their financial statements in conformity with U.S. generally accepted accounting principles (“GAAP”).
Investments in Securities
Investments in securities traded on national or international securities exchanges are valued at the last reported sales price prior to the time when assets are valued. Securities traded on the over-the-counter market are valued at the last reported sales price or if the last sales price is not available at the last reported bid price. The sale and bid prices or prices deemed best to reflect fair value quoted by dealers who make markets in these securities are obtained from independent pricing services. Consistent with the Funds’ valuation policies and procedures, debt securities maturing in more than 60 days are priced by an independent pricing service. The pricing service may use models that price securities based on current yields and relative security characteristics, such as coupon rate, maturity date, issuer credit quality, and prepayment speeds as applicable. When market quotations are not readily available, or when the Adviser becomes aware that a significant event impacting the value of a security or group of securities has occurred after the closing of the exchange on which the security or securities principally trade, but before the calculation of the daily net asset value, securities are valued at fair value as determined in good faith using procedures established by the Board of Directors. The procedures consider, among
| | |
| 72 | | SIT MUTUAL FUNDS ANNUAL REPORT |
others, the following factors to determine a security’s fair value: the nature and pricing history (if any) of the security; whether any dealer quotations for the security are available; and possible valuation methodologies that could be used to determine the fair value of the security. Debt securities of sufficient credit quality maturing in less than 60 days when acquired, or which subsequently are within 60 days of maturity, are valued at amortized cost, which approximates fair value.
Security transactions are accounted for on the date the securities are purchased or sold. Securities gains and losses are calculated on the identified-cost basis. Dividend income is recorded on the ex-dividend date or upon the receipt of ex-dividend notification in the case of certain foreign securities. Interest, including level-yield amortization of long-term bond premium and discount, is recorded on the accrual basis.
Fair Value Measurements
The inputs and valuation techniques used to measure fair value of the Funds’ net assets are summarized into three levels as described in the hierarchy below:
• Level 1 – quoted prices in active markets for identical securities. An active market for the security is a market in which transactions occur with sufficient frequency and volume to provide pricing information on an ongoing basis. A quoted price in an active market provides the most reliable evidence of fair value.
• Level 2 – debt securities are valued based on evaluated prices received from independent pricing services or from dealers who make markets in such securities. For corporate bonds, U.S. government and government agency obligations, and municipal securities the pricing services utilize matrix pricing which considers yield or price of bonds of comparable quality, coupon, maturity, and type as well as dealer supplied prices. For asset-backed securities and mortgage-backed securities, the pricing services utilize matrix pricing which considers prepayment speed assumptions, attributes of the collateral, yield or price of bonds of comparable quality, coupon, maturity, and type as well as dealer supplied prices. For foreign equities, the pricing services adjust closing prices by applying a systematic process for events occurring after the close of the foreign exchange by utilizing such inputs as Depositary Receipts, quoted prices for similar securities, exchange rates, and certain indexes. All of these inputs are derived principally from or corroborated by observable market data. An adjustment to any observable input that is significant to the fair value may render the measurement a Level 3 measurement.
• Level 3 – significant unobservable inputs, including the Adviser’s own assumptions in determining the fair value of investments.
The inputs or methodology used for valuing securities are not necessarily an indication of the risk associated with investing in those securities.
A summary of the levels for the Funds’ investments as of June 30, 2017 is included with the Funds’ schedule of investments.
Foreign Currency Translations and Forward Foreign Currency Contracts
The fair value of securities and other assets and liabilities denominated in foreign currencies for Global Dividend Growth, International Growth and Developing Markets Growth Funds are translated daily into U.S. dollars at the closing rate of exchange (approximately 4:00 p.m. Eastern Time). Purchases and sales of securities, income and expenses are translated at the exchange rate on the transaction date. Dividend and interest income includes currency exchange gains (losses) realized between the accrual and payment dates on such income. Exchange gains (losses) may also be realized between the trade and settlement dates on security and forward contract transactions. For securities denominated in foreign currencies, the effect of changes in foreign exchange rates on realized and unrealized gains or losses is reflected as a component of such gains or losses.
The Global Dividend Growth, International Growth and Developing Markets Growth Funds may enter into forward foreign currency exchange contracts generally for operational purposes, but the Adviser may occasionally utilize contracts to protect against adverse exchange rate fluctuation. Any gains (losses) generated by these contracts are disclosed separately on the statement of operations. The net U.S. dollar value of foreign currency underlying all contractual commitments held by the Funds and the resulting unrealized appreciation or depreciation is determined using foreign currency exchange rates from an independent pricing service. The Funds are subject to the credit risk that the other party will not complete the obligations of the contract.
NOTES TO FINANCIAL STATEMENTS
Year Ended June 30, 2017 (Continued)
Federal Taxes
The Funds’ policy is to comply with the requirements of the Internal Revenue Code applicable to regulated investment companies and to distribute all of their taxable income to shareholders. Therefore, no income tax provision is required. Also, in order to avoid the payment of any federal excise taxes, the Funds will distribute substantially all of their net investment income and net realized gains on a calendar year basis.
Management has analyzed the Funds’ tax positions taken in federal tax returns for all open tax years and has concluded that as of June 30, 2017, no provision for income tax would be required in the Funds’ financial statements. The Funds’ federal and state income and federal excise tax returns remain subject to examination by the Internal Revenue Service and state departments of revenue until such time as the applicable statute of limitations for audit has expired. For example, U.S. tax returns are generally subject to audit for three years from the date they are filed.
At June 30, 2017, the gross unrealized appreciation (depreciation) on investments and cost of securities on a tax basis for federal income tax purposes were as follows:
| | | | | | | | | | | | | | | | |
| | | Unrealized
Appreciation | | | Unrealized
Depreciation | | | Net Unrealized
Appreciation
(Depreciation) | | | Cost of
Securities on a
Tax Basis | |
Balanced | | | $5,406,507 | | | | ($173,653 | ) | | | $5,232,854 | | | | $19,922,824 | |
Dividend Growth | | | 173,385,025 | | | | (10,386,332 | ) | | | 162,998,693 | | | | 921,843,013 | |
Global Dividend Growth | | | 4,505,051 | | | | (382,260 | ) | | | 4,122,791 | | | | 24,932,555 | |
Large Cap Growth | | | 47,872,526 | | | | (403,983 | ) | | | 47,468,543 | | | | 66,769,667 | |
ESG Growth | | | 616,846 | | | | (63,545 | ) | | | 553,301 | | | | 4,114,017 | |
Mid Cap Growth | | | 66,750,329 | | | | (842,410 | ) | | | 65,907,919 | | | | 91,738,063 | |
Small Cap Dividend Growth | | | 2,310,493 | | | | (349,191 | ) | | | 1,961,302 | | | | 14,311,278 | |
Small Cap Growth | | | 30,467,669 | | | | (194,334 | ) | | | 30,273,335 | | | | 61,425,801 | |
International Growth | | | 3,858,500 | | | | (547,673 | ) | | | 3,310,827 | | | | 19,107,105 | |
Developing Markets Growth | | | 2,452,273 | | | | (266,351 | ) | | | 2,185,922 | | | | 7,377,216 | |
Net investment income and net realized gains differ for financial statement and tax purposes because of corporate actions on shares held and/or losses deferred due to “wash sale” transactions. A “wash sale” occurs when a Fund sells a security that it has acquired within a period beginning thirty days before and ending thirty days after the date of sale (a sixty one day period). The character of distributions made during the year from net investment income or net realized gains may also differ from its ultimate characterization for tax purposes. Also, due to the timing of dividend distributions, the fiscal year in which amounts are distributed may differ from the year that the income or realized gains (losses) were recorded by the Funds. The tax character of distributions paid during the fiscal years ended June 30, 2017 and 2016 were as follows:
| | |
| 74 | | SIT MUTUAL FUNDS ANNUAL REPORT |
| | | | | | | | | | | | |
| Year Ended June 30, 2017: | | | | | | | | | |
| | | |
| | | Ordinary Income | | | Long Term
Capital Gain | | | Total | |
Balanced | | | $270,000 | | | | — | | | | $270,000 | |
Dividend Growth (Class I) | | | 18,184,824 | | | | $56,369,317 | | | | 74,554,141 | |
Dividend Growth (Class S) | | | 1,047,785 | | | | 3,921,689 | | | | 4,969,474 | |
Global Dividend Growth (Class I) | | | 354,957 | | | | — | | | | 354,957 | |
Global Dividend Growth (Class S) | | | 38,043 | | | | — | | | | 38,043 | |
Large Cap Growth | | | 598,249 | | | | 7,585,453 | | | | 8,183,702 | |
ESG Growth | | | 6,100 | | | | — | | | | 6,100 | |
Mid Cap Growth | | | — | | | | 1,410,787 | | | | 1,410,787 | |
Small Cap Dividend Growth (Class I) | | | 87,515 | | | | — | | | | 87,515 | |
Small Cap Dividend Growth (Class S) | | | 21,485 | | | | — | | | | 21,485 | |
Small Cap Growth | | | — | | | | 144,732 | | | | 144,732 | |
International Growth | | | 97,000 | | | | — | | | | 97,000 | |
Developing Markets Growth | | | 18,811 | | | | — | | | | 18,811 | |
| | | |
Year Ended June 30, 2016: | | | | | | | | | | | | |
| | | |
| | | Ordinary Income | | | Long Term
Capital Gain | | | Total | |
Balanced | | | $508,889 | | | | $1,028,080 | | | | $1,536,969 | |
Dividend Growth (Class I) | | | 23,739,125 | | | | 101,891,044 | | | | 125,630,169 | |
Dividend Growth (Class S) | | | 1,582,606 | | | | 7,415,541 | | | | 8,998,147 | |
Global Dividend Growth (Class I) | | | 530,149 | | | | 1,512,875 | | | | 2,043,024 | |
Global Dividend Growth (Class S) | | | 62,954 | | | | 201,098 | | | | 264,052 | |
Large Cap Growth | | | 4,558,215 | | | | 27,930,763 | | | | 32,488,978 | |
Mid Cap Growth | | | — | | | | 23,213,056 | | | | 23,213,056 | |
Small Cap Dividend Growth (Class I) | | | 59,292 | | | | 446 | | | | 59,738 | |
Small Cap Dividend Growth (Class S) | | | 24,216 | | | | 216 | | | | 24,432 | |
Small Cap Growth | | | — | | | | 8,910,218 | | | | 8,910,218 | |
International Growth | | | 205,203 | | | | 1,246,085 | | | | 1,451,288 | |
Developing Markets Growth | | | 12,000 | | | | 211,867 | | | | 223,867 | |
As of June 30, 2017, the components of distributable earnings on a tax basis were as follows:
| | | | | | | | | | | | |
| | | |
| | | Undistributed
Ordinary
Income | | | Accumulated
Gain | | | Unrealized
Appreciation
(Depreciation) | |
Balanced | | | $82,423 | | | | $605,591 | | | $ | 5,232,854 | |
Dividend Growth | | | 17,604,115 | | | | 37,535,605 | | | | 162,998,693 | |
Global Dividend Growth | | | 142,589 | | | | — | | | | 4,122,607 | |
Large Cap Growth | | | 641,691 | | | | 8,842,329 | | | | 47,468,543 | |
ESG Growth | | | 32,139 | | | | — | | | | 553,305 | |
Mid Cap Growth | | | 4,961 | | | | 4,062,233 | | | | 65,907,919 | |
Small Cap Dividend Growth | | | 44,366 | | | | — | | | | 1,961,302 | |
Small Cap Growth | | | — | | | | 3,000,150 | | | | 30,273,335 | |
International Growth | | | 177,221 | | | | — | | | | 3,309,174 | |
Developing Markets Growth | | | — | | | | — | | | | 2,185,900 | |
NOTES TO FINANCIAL STATEMENTS
Year Ended June 30, 2017 (Continued)
On the statement of assets and liabilities, as a result of permanent book-to-tax differences, reclassification adjustments were made to the following capital accounts:
| | | | | | | | | | | | |
| | | Undistributed
Net Investment
Income | | | Accumulated
Net Realized
Gain (Loss) | | | Additional
Paid-in Capital | |
Balanced | | | ($51) | | | | $51 | | | | — | |
Dividend Growth | | | (16,218) | | | | 16,218 | | | | — | |
Global Dividend Growth | | | (4,145) | | | | 4,145 | | | | — | |
Large Cap Growth | | | (384) | | | | 384 | | | | — | |
ESG Growth | | | 343 | | | | 909 | | | | ($1,252) | |
Mid Cap Growth | | | 15,839 | | | | (15,839) | | | | — | |
Small Cap Dividend Growth | | | 301 | | | | (300) | | | | (1) | |
Small Cap Growth | | | 411,812 | | | | (6,393) | | | | (405,419) | |
International Growth | | | (3,788) | | | | 3,788 | | | | — | |
Developing Markets Growth | | | 13,702 | | | | (1,141) | | | | (12,561) | |
These differences were primarily attributable to return of capital dividends received, 988 reclassifications, non-deductible net operating losses and corporate actions on shares held.
Net capital loss carryovers and late year losses, if any, as of June 30, 2017, are available to offset future realized capital gains and thereby reduce future capital gains distributions. The Funds’ are permitted to carry forward capital losses for an unlimited period. Capital losses that are carried forward retain their character as either short-term or long-term capital losses. The net capital loss carryovers and the late year losses deferred as of June 30, 2017, were as follows:
| | | | | | | | | | | | | | |
| | | Unlimited Period of Net Capital Loss Carryover | | | Late Year Losses Deferred | | Accumulated Capital and Other Losses | |
| | | Short-Term | | | Long-Term | | | |
Global Dividend Growth | | | $718,740 | | | | $186,394 | | | — | | | $905,134 | |
ESG Growth | | | 59,584 | | | | — | | | — | | | 59,584 | |
Small Cap Dividend Growth | | | 234,504 | | | | 87,797 | | | — | | | 322,301 | |
International Growth | | | 723,576 | | | | 148,939 | | | — | | | 872,515 | |
Developing Markets Growth | | | 90,015 | | | | 92,540 | | | — | | | 182,555 | |
Distributions
Distributions to shareholders are recorded as of the close of business on the record date. Such distributions are payable in cash or reinvested in additional shares of the Funds’ capital stock. Distributions from net investment income, if any, are declared and paid quarterly for the Balanced, Dividend Growth, Global Dividend Growth and Small Cap Dividend Growth Funds and declared and paid annually for Developing Markets Growth, Small Cap Growth, International Growth, Mid Cap Growth, Large Cap Growth and ESG Growth Funds. Distributions from net realized gains, if any, will be made annually for each of the Funds.
Concentration of Investments
The Developing Markets Growth Fund may concentrate investments in countries with limited or developing capital markets which may involve greater risks than investments in more developed markets and the prices of such investments may be volatile. The consequences of political, social or economic changes in these markets may have disruptive effects on the market prices of the Fund’s investments and the income it generates, as well as the Fund’s ability to repatriate such amounts.
Use of Estimates
The preparation of financial statements in conformity with U.S. generally accepted accounting principles requires management to make certain estimates and assumptions that affect the reported amounts of assets and liabilities and disclosure of contingent assets and liabilities at the date of the financial statements and the reported results for the respective periods. Actual results could differ from those estimates.
| | |
| 76 | | SIT MUTUAL FUNDS ANNUAL REPORT |
Guarantees and Indemnifications
Under each Fund’s organizational documents, its officers and directors are indemnified against certain liability arising out of the performance of their duties to each Fund. In addition, certain of each Fund’s contracts with its service providers contain general indemnification clauses. Each Fund’s maximum exposure under these arrangements is unknown since the amount of any future claims that may be made against each Fund cannot be determined and each Fund has no historical basis for predicting the likelihood of any such claims.
| (3) | Investment Security Transactions |
The cost of purchases and proceeds from sales and maturities of investment securities, other than short-term securities, for the year ended June 30, 2017, were as follows:
| | | | | | | | | | | | | | | | |
| | | Purchases | | | Proceeds | |
| | | U.S. Government | | | Other | | | U.S. Government | | | Other | |
Balanced | | | $1,450,388 | | | | $10,626,343 | | | | $2,127,958 | | | | $10,227,021 | |
Dividend Growth | | | — | | | | 622,697,319 | | | | — | | | | 682,271,432 | |
Global Dividend Growth | | | — | | | | 9,840,443 | | | | — | | | | 8,308,800 | |
Large Cap Growth | | | — | | | | 20,196,670 | | | | — | | | | 41,516,206 | |
ESG Growth | | | — | | | | 5,031,712 | | | | — | | | | 1,017,446 | |
Mid Cap Growth | | | — | | | | 32,532,723 | | | | — | | | | 38,011,844 | |
Small Cap Dividend Growth | | | — | | | | 8,182,055 | | | | — | | | | 2,353,789 | |
Small Cap Growth | | | — | | | | 24,632,222 | | | | — | | | | 32,077,558 | |
International Growth | | | — | | | | 7,964,494 | | | | — | | | | 8,108,552 | |
Developing Markets Growth | | | — | | | | 1,839,559 | | | | — | | | | 1,489,703 | |
NOTES TO FINANCIAL STATEMENTS
Year Ended June 30, 2017 (Continued)
| (4) | Affiliated Fees and Transactions |
Investment Adviser
The Funds each have entered into an investment management agreement with Sit Investment Associates, Inc. (SIA), under which SIA manages the Funds’ assets and provides research, statistical and advisory services, and pays related office rental, executive expenses and executive salaries. The current fee for investment management and advisory services is based on the average daily net assets of the Funds at the annual rate of:
| | | | | | |
| | | | | | |
Balanced | | | 1.00 | % | |
Dividend Growth Class I and Class S | | | 1.00 | % | |
Global Dividend Growth Class I and Class S | | | 1.25 | % | |
Large Cap Growth | | | 1.00 | % | |
ESG Growth Class I and Class S | | | 1.25 | % | |
Mid Cap Growth | | | 1.25 | % | |
Small Cap Dividend Growth Class I and Class S | | | 1.25 | % | |
Small Cap Growth | | | 1.50 | % | |
International Growth | | | 1.50 | % | |
Developing Markets Growth | | | 2.00 | % | |
SIA is obligated to pay all of the Funds’ expenses (excluding extraordinary expenses, stock transfer taxes, interest, brokerage commissions, 12b-1 fees and other transaction charges relating to investing activities).
In addition to the annual management fees, the Class S shares of Dividend Growth, Global Dividend Growth, ESG Growth and Small Cap Dividend Growth Funds also have a 0.25% annual distribution (12b-1) fee, which is used to pay for distribution fees related to the sale and distribution of its shares.
Transactions with affiliates
The investment adviser, affiliates of the investment adviser, directors and officers of the Funds as a whole owned the following shares as of June 30, 2017:
| | | | | | | | | | | | |
| | | Shares | | % Shares
Outstanding | | |
Balanced | | | | 254,934 | | | | | 22.9 | | |
Dividend Growth | | | | 1,251,753 | | | | | 2.0 | | |
Global Dividend Growth | | | | 753,321 | | | | | 37.9 | | |
Large Cap Growth | | | | 614,026 | | | | | 21.9 | | |
ESG Growth | | | | 408,219 | | | | | 98.6 | | |
Mid Cap Growth | | | | 3,847,057 | | | | | 44.4 | | |
Small Cap Dividend Growth | | | | 832,807 | | | | | 59.0 | | |
Small Cap Growth | | | | 912,292 | | | | | 54.4 | | |
International Growth | | | | 813,417 | | | | | 58.4 | | |
Developing Markets Growth | | | | 260,519 | | | | | 41.5 | | |
| | |
| | |
| 78 | | SIT MUTUAL FUNDS ANNUAL REPORT |
| (5) | Capital Share Activity |
Short-Term Trading (Redemption) Fees
The Funds (except Balanced) charge a redemption fee equal to 2.00% of the proceeds on shares held for less than 30 calendar days. The fee is retained by the Fund for the benefit of its long-term shareholders and accounted for as an addition to paid in capital. For the year ended June 30, 2017, the Funds received the following redemption fees:
| | | | | | | | | | | | |
| | | Class I | | | | | | Class S | |
Dividend Growth | | | $65 | | | | | | | | $259 | |
Global Dividend Growth | | | 13 | | | | | | | | — | |
Large Cap Growth | | | 307 | | | | | | | | — | |
Mid Cap Growth | | | 4 | | | | | | | | — | |
Small Cap Growth | | | 1,333 | | | | | | | | — | |
International Growth | | | 35 | | | | | | | | — | |
In October 2016, the SEC amended existing rules intended to modernize reporting and disclosure information. These amendments relate to Regulation S-X which sets forth the form and content of financial statements. The amendments will result in certain additional or revised disclosures in the financial statements and accompanying notes.
Management has evaluated the impact of all subsequent events on the Funds through the date the financial statements were issued, and has determined that there were no subsequent events that would require disclosure in or adjustments to the financial statements.
REPORT OF INDEPENDENT REGISTERED PUBLIC ACCOUNTING FIRM
The Board of Directors and Shareholders:
Sit Mutual Funds, Inc.
Sit Large Cap Growth Fund, Inc.
Sit Mid Cap Growth Fund, Inc.
We have audited the accompanying statements of assets and liabilities of Sit Balanced Fund, Sit Dividend Growth Fund, Sit Global Dividend Growth Fund, Sit ESG Growth Fund, Sit Small Cap Dividend Growth Fund, Sit Small Cap Growth Fund, Sit International Growth Fund, Sit Developing Markets Growth Fund, (each a series of Sit Mutual Funds, Inc.), Sit Large Cap Growth Fund, Inc., and Sit Mid Cap Growth Fund, Inc. (collectively, the Funds), including the schedules of investments, as of June 30, 2017, and the related statements of operations for the year then ended, the statements of changes in net assets for each of the years or periods in the two-year period then ended, and the financial highlights for each of the years or periods in the five-year period then ended. These financial statements and financial highlights are the responsibility of the Funds’ management. Our responsibility is to express an opinion on these financial statements and financial highlights based on our audits.
We conducted our audits in accordance with the standards of the Public Company Accounting Oversight Board (United States). Those standards require that we plan and perform the audits to obtain reasonable assurance about whether the financial statements and financial highlights are free of material misstatement. An audit includes examining, on a test basis, evidence supporting the amounts and disclosures in the financial statements. Our procedures included confirmation of securities owned as of June 30, 2017, by correspondence with custodians and brokers or by performing other appropriate auditing procedures. An audit also includes assessing the accounting principles used and significant estimates made by management, as well as evaluating the overall financial statement presentation. We believe that our audits provide a reasonable basis for our opinion.
In our opinion, the financial statements and financial highlights referred to above present fairly, in all material respects, the financial position of Sit Balanced Fund, Sit Dividend Growth Fund, Sit Global Dividend Growth Fund, Sit ESG Growth Fund, Sit Small Cap Dividend Growth Fund, Sit Small Cap Growth Fund, Sit International Growth Fund, Sit Developing Markets Growth Fund, Sit Large Cap Growth Fund, and Sit Mid Cap Growth Fund as of June 30, 2017, and the results of their operations, the changes in their net assets, and the financial highlights for the periods stated in the first paragraph above, in conformity with U.S. generally accepted accounting principles.
KPMG LLP
Minneapolis, Minnesota
August 18, 2017
| | |
| 80 | | SIT MUTUAL FUNDS ANNUAL REPORT |
EXPENSE EXAMPLE (Unaudited)
As a shareholder of the Funds, you incur two types of costs: (1) transaction costs, including redemption fees and (2) ongoing costs, including management fees; and other Fund expenses. This Example is intended to help you understand your ongoing costs (in dollars) of investing in the Funds and to compare these costs with the ongoing costs of investing in other mutual funds.
The Example is based on an investment of $1,000 invested at the beginning of the period and held for the entire period January 1, 2017 to June 30, 2017.
Actual Expenses
The first line of the following table provides information about actual account values and actual expenses. You may use the information in this line, together with the amount you invested, to estimate the expenses that you paid over the period. Simply divide your account value by $1,000 (for example, an $8,600 account value divided by $1,000 = 8.6), then multiply the result by the number in the first line under the heading entitled “Expenses Paid During Period” to estimate the expenses you paid on your account during this period.
Hypothetical Example for Comparison Purposes
The second line of the table provides information about hypothetical account values and hypothetical expenses based on the Fund’s actual expense ratio and an assumed rate of return of 5% per year before expenses, which is not the Fund’s actual return. The hypothetical account values and expenses may not be used to estimate the actual ending account balance or expenses you paid for the period. You may use this information to compare the ongoing costs of investing in the Fund and other funds. To do so, compare this 5% hypothetical example with the 5% hypothetical examples that appear in the shareholder reports of the other funds.
Please note that the expenses shown in the table are meant to highlight your ongoing costs only and do not reflect any transactional costs, such as redemption fees. Therefore, the second line of the table is useful in comparing ongoing costs only, and will not help you determine the relative total costs of owning different funds. In addition, if these transactional costs (redemption fees) were included, your costs would have been higher.
| | | | | | | | | | |
| Fund | | | | | Beginning Account Value (1/1/17) | | Ending Account Value (6/30/17) | | Expenses
Paid During
Period*
(1/1/17-
6/30/17) |
| Balanced Fund |
Actual | | | | | | $1,000 | | $1,088.90 | | $5.18 |
Hypothetical | | | | | | $1,000 | | $1,019.84 | | $5.01 |
| | | | | | | | | | | |
| Dividend Growth Fund |
Actual | | | | | | | | | | |
Class I | | | | | | $1,000 | | $1,086.10 | | $5.17 |
Class S | | | | | | $1,000 | | $1,084.40 | | $6.46 |
Hypothetical | | | | | | | | | | |
Class I | | | | | | $1,000 | | $1,019.84 | | $5.01 |
Class S | | | | | | $1,000 | | $1,018.60 | | $6.26 |
| | | | | | | | | | | |
| Global Dividend Growth Fund |
Actual | | | | | | | | | | |
Class I | | | | | | $1,000 | | $1,080.80 | | $6.45 |
Class S | | | | | | $1,000 | | $1,080.20 | | $7.74 |
Hypothetical | | | | | | | | | | |
Class I | | | | | | $1,000 | | $1,018.60 | | $6.26 |
Class S | | | | | | $1,000 | | $1,017.36 | | $7.50 |
| | | | | | | | | | | |
| Large Cap Growth Fund |
Actual | | | | | | $1,000 | | $1,142.90 | | $5.31 |
Hypothetical | | | | | | $1,000 | | $1,019.84 | | $5.01 |
| | | | | | | | | | | |
| ESG Growth Fund |
Actual | | | | | | | | | | |
Class I | | | | | | $1,000 | | $1,109.00 | | $6.54 |
Class S | | | | | | $1,000 | | $1,107.10 | | $7.84 |
Hypothetical | | | | | | | | | | |
Class I | | | | | | $1,000 | | $1,018.60 | | $6.26 |
Class S | | | | | | $1,000 | | $1,017.36 | | $7.50 |
| | | | | | | | | | | |
| Mid Cap Growth Fund |
Actual | | | | | | $1,000 | | $1,123.10 | | $6.58 |
Hypothetical | | | | | | $1,000 | | $1,018.60 | | $6.26 |
| | | | | | | | | | | |
| Small Cap Dividend Growth Fund |
Actual | | | | | | | | | | |
Class I | | | | | | $1,000 | | $1,040.90 | | $6.33 |
Class S | | | | | | $1,000 | | $1,039.40 | | $7.58 |
Hypothetical | | | | | | | | | | |
Class I | | | | | | $1,000 | | $1,018.60 | | $6.26 |
Class S | | | | | | $1,000 | | $1,017.36 | | $7.50 |
EXPENSE EXAMPLE (Unaudited) (Continued)
| | | | | | | | | | | | | | | | | |
| Fund | | | | Beginning
Account Value (1/1/17) | | Ending Account Value (6/30/17) | | Expenses
Paid During
Period*
(1/1/17-
6/30/17) |
Small Cap Growth Fund | |
Actual | | | | | | | | $ | 1,000 | | | $1,075.00 | | | | $7.72 | |
Hypothetical | | | | | | | | $ | 1,000 | | | $1,017.36 | | | | $7.50 | |
| | | | | | | | | | | | | | | | | | |
International Growth Fund | |
Actual | | | | | | | | $ | 1,000 | | | $1,151.90 | | | | $8.00 | |
Hypothetical | | | | | | | | $ | 1,000 | | | $1,017.36 | | | | $7.50 | |
| | | | | | | | | | | | | | | | | | |
Developing Markets Growth Fund | |
Actual | | | | | | | | $ | 1,000 | | | $1,250.40 | | | | $11.16 | |
Hypothetical | | | | | | | | $ | 1,000 | | | $1,014.88 | | | | $9.99 | |
*Expenses are equal to the Fund’s annualized expense ratio of 1.00%, for the Balanced, Dividend Growth, Class I and Large Cap Growth Funds; 1.25% for Dividend Growth, Class S, Global Dividend Growth, Class I, Small Cap Dividend Growth, Class I, Mid Cap Growth, and ESG Growth, Class I Funds; 1.50% for Global Dividend Growth, Class S, Small Cap Dividend Growth, Class S, Small Cap Growth, ESG Growth, Class S and International Growth Funds; and 2.00% for Developing Markets Growth Fund, multiplied by the average account value over the period, multiplied by 181/365 (to reflect the one-half year period.)
| | |
| 82 | | SIT MUTUAL FUNDS ANNUAL REPORT |
FEDERAL TAX INFORMATION (Unaudited)
Sit Equity Funds
For corporate shareholders, the percentage of investment income (dividend income and short-term gains, if any), for each of the Funds that qualify for the Dividends Received Deductions for the period of July 1, 2016 to June 30, 2017 is as follows:
| | |
Fund | | Percentage |
Balanced Fund | | 80.4% |
Dividend Growth Fund | | 100.0 |
Global Dividend Growth Fund | | 99.3 |
Large Cap Growth Fund | | 100.0 |
ESG Growth Fund | | 100.0 |
Small Cap Dividend Growth Fund | | 100.0 |
International Growth Fund | | 3.4 |
Developing Markets Growth Fund | | 18.5 |
For the year ended June 30, 2017, certain dividends paid by the Funds may be subject to a maximum tax rate of 15%, as provided by the Jobs and Growth Tax Relief Reconciliation Act of 2003. Of the distributions made by the following Funds, the corresponding percentages represent the amount of each distribution which may qualify for the 15% dividend income tax rate.
| | |
Fund | | Percentage |
Balanced Fund | | 91.6% |
Dividend Growth Fund | | 100.0 |
Global Dividend Growth Fund | | 100.0 |
Large Cap Growth Fund | | 100.0 |
ESG Growth Fund | | 100.0 |
Small Cap Dividend Growth Fund | | 100.0 |
International Growth Fund | | 100.0 |
Developing Markets Growth Fund | | 100.0 |
The following Funds designated the listed amounts as long-term capital gain dividends during the year ended June 30, 2017. Distributable long-term gains are based on net realized long term gains determined on a tax basis and may differ from such amounts for financial reporting purposes.
| | | | |
Fund | | | Amount | |
Balanced Fund | | | $605,591 | |
Dividend Growth Fund | | | 60,291,006 | |
Large Cap Growth Fund | | | 10,880,874 | |
Mid Cap Growth Fund | | | 4,062,337 | |
Small Cap Growth Fund | | | 3,000,251 | |
INFORMATION ABOUT DIRECTORS AND OFFICERS (Unaudited)
The Sit Mutual Funds are a family of no-load mutual funds. The Stock Funds described in this Annual Report are the Sit Mid Cap Growth Fund, Sit Large Cap Growth Fund, Sit International Growth Fund, Sit Balanced Fund, Sit Developing Markets Growth Fund, Sit Small Cap Growth Fund, Sit Dividend Growth Fund, Sit Global Dividend Growth Fund, Sit Small Cap Dividend Growth Fund, and the Sit ESG Growth Fund (the “Funds” or individually, a “Fund”). The bond funds within the Sit Mutual Fund family are described in a separate Bond Funds’ Annual Report. The Sit Mid Cap Growth Fund and Sit Large Cap Growth Fund, and the corporate issuer of the Sit International Growth Fund, Sit Balanced Fund, Sit Developing Markets Growth Fund, Sit Small Cap Growth Fund, Sit Dividend Growth Fund, Sit Global Dividend Growth Fund, and Sit Small Cap Dividend Growth Fund have a Board of Directors and officers. Pursuant to Minnesota law, the Boards of Directors are responsible for the management of the Funds and the establishment of the Funds’ policies. The officers of the Funds manage the day-to-day operation of the Funds. Information pertaining to the directors and officers of the Funds is set forth below. The business address, unless otherwise noted below, is that of the Funds’ investment adviser – 3300 IDS Center, 80 South Eighth Street, Minneapolis, Minnesota 55402. The Boards have a separate Audit Committee. The Stock Funds’ SAI has additional information about the Funds’ directors and is available without charge upon request by calling the Sit Funds at 800-332-5580.
| | | | | | | | |
Name, Age, and Position with Funds | | Term of Office (1) and Length of Time Served | | Principal Occupations During
Past Five Years | | Number of Funds
Overseen in Fund Complex | | Other Directorships
Held by Director (3) |
INTERESTED DIRECTORS: |
Roger J. Sit (2) Age: 55 Chairman and President | | Chairman since 10/08; Officer since 1998. | | Chairman, President, CEO and Global CIO of Sit Investment Associates, Inc. (the “Adviser”); Chairman and CEO of Sit Investment Fixed Income Advisors, Inc. (“SF”); Chairman of SIA Securities Corp. (the “Distributor”). | | 14 | | TCF Financial Corporation. |
INDEPENDENT DIRECTORS: |
Edward M. Giles Age: 81 Director | | Director since 2012 or the Fund’s inception, if later. | | Senior Vice President of Peter B. Cannell & Co., July 2011 to present. | | 14 | | None. |
Sidney L. Jones Age: 83 Director | | Director from 1988 to 1989 and since 1993 or the Fund’s inception, if later. | | Lecturer, Washington Campus Consortium of 17 Universities. | | 14 | | None. |
Bruce C. Lueck Age: 76 Director | | Director since 2004 or the Fund’s inception, if later. | | Consultant for Zephyr Management, L.P. (investment management) and committee member of several investment funds and foundations. | | 14 | | None. |
Donald W. Phillips Age: 69 Director | | Director of the International Fund since 1993, and since 1990 or the Fund’s inception, if later for all other Funds. | | Chairman and CEO of WP Global Partners Inc., July 2005 to present; Partner of Ranieri Partners, 2007 to December 2012. | | 14 | | None. |
Barry N. Winslow Age: 69 Director | | Director since 2010 or the Fund’s inception, if later. | | Vice-Chairman of TCF Financial Corporation, July 2008 to July 2014. | | 14 | | TCF Financial Corporation. |
| | |
| | |
| 84 | | SIT MUTUAL FUNDS ANNUAL REPORT |
| | | | | | | | |
Name, Age, and Position with Funds | | Term of Office (1) and Length of Time Served | | Principal Occupations During
Past Five Years | | Number of Funds
Overseen in Fund Complex | | Other Directorships
Held by Director (3) |
OFFICERS: |
Mark H. Book Age: 54 Vice President – Investments of Balanced Fund only | | Officer since 2002; Re-Elected by the Boards annually. | | Vice President and Portfolio Manager of SF. | | N/A | | N/A |
Kelly K. Boston Age: 48 Assistant Secretary & Assistant Treasurer | | Officer since 2000; Re-Elected by the Boards annually. | | Staff Attorney of the Adviser; Secretary of the Distributor. | | N/A | | N/A |
Bryce A. Doty Age: 50 Vice President - Investments of Balanced Fund only. | | Officer since 1996; Re-Elected by the Boards annually. | | Senior Vice President and Senior Portfolio Manager of SF. | | N/A | | N/A |
Kent L. Johnson Age: 51 Vice President - Investments | | Officer since 2003; Re-Elected by the Boards annually. | | Senior Vice President - Research and Investment Management of the Adviser. | | N/A | | N/A |
Michael J. Radmer 50 S. 6th Street Minneapolis, MN 55402 Age: 72 Secretary | | Officer since 1984; Re-Elected by the Boards annually. | | Senior Counsel of the Funds’ general counsel, Dorsey & Whitney, LLP since January 2016; Partner from January 1976 to December 2015. | | N/A | | N/A |
Paul E. Rasmussen Age: 56 Vice President, Treasurer & Chief Compliance Officer | | Officer since 1994; Re-Elected by the Boards annually. | | Vice President, Secretary, Controller and Chief Compliance Officer of the Adviser; Vice President, Secretary, and Chief Compliance Officer of SF; President and Treasurer of the Distributor. | | N/A | | N/A |
Carla J. Rose Age: 51 Vice President, Assistant Secretary & Assistant Treasurer | | Officer since 2000; Re-Elected by the Boards annually. | | Vice President, Administration & Deputy Controller of the Adviser; Vice President, Controller, Treasurer & Assistant Secretary of SF; Vice President and Assistant Secretary of the Distributor. | | N/A | | N/A |
Robert W. Sit Age: 48 Vice President - Investments | | Officer since 1997; Re-Elected by the Boards annually. | | Vice President - Research and Investment Management of the Adviser. | | N/A | | N/A |
Ronald D. Sit Age: 57 Vice President - Investments | | Officer since 1985; Re-Elected by the Boards annually. | | Vice President - Research and Investment Management of the Adviser. | | N/A | | N/A |
| 1 | Each Director serves until their resignation, removal or the next meeting of the shareholders at which election of directors is an agenda item and his successor is duly elected and shall qualify. |
| 2 | Directors who are deemed to be “interested persons” of the Funds as that term is defined by the Investment Company Act of 1940. Mr. Sit is considered an “interested person” because he is a an officer of Sit Investment Associates, Inc., the Fund’s investment adviser. |
| 3 | Includes only directorships of companies required to report under the Securities Exchange Act of 1934 (i.e., public companies) or other investment companies registered under the 1940 Act. |
ADDITIONAL INFORMATION (Unaudited)
PROXY VOTING
Each Fund follows certain policies and procedures for voting proxies for securities held in each portfolio. A description of the Funds’ proxy voting policies and procedures is available without charge upon request by calling the Funds at 1-800-332-5580.
Information regarding how each Fund voted proxies relating to its portfolio securities during the most recent twelve-month period ended June 30 is available without charge upon request by calling the Funds at 1-800-332-5580, and is available on the U.S. Securities and Exchange Commission’s website at www.sec.gov.
AVAILABILITY OF QUARTERLY PORTFOLIO SCHEDULES
The Funds’ file their complete schedules of portfolio holdings with the U.S. Securities and Exchange Commission (SEC) for the first and third quarters of each fiscal year on Form N-Q. The Funds’ Form N-Qs are available without charge upon request by calling the Funds at 1-800-332-5580 and are available on the SEC’s website at www.sec.gov. In addition, the Funds’ Form N-Qs may be reviewed and copied at the SEC’s Public Reference Room in Washington, DC. Information on the operation of the Public Reference Room may be obtained by calling 1-202-551-8090.
| | |
| | |
| 86 | | SIT MUTUAL FUNDS ANNUAL REPORT |
[This page intentionally left blank.]
[This page intentionally left blank.]
| | |
| | |
| 88 | | SIT MUTUAL FUNDS ANNUAL REPORT |
The registrant has adopted a code of ethics that applies to the registrant’s principal executive officer, principal financial officer, principal accounting officer, and persons performing similar functions. The registrant has not made any amendment to its code of ethics during the period covered by this report which must be described herein pursuant to Item 2. The registrant has not granted any waivers from any provisions of the code of ethics during the period covered by this report.
A copy of the registrant’s code of ethics is available without charge upon request by calling the registrant at 612-332-3223 or 1-800-332-5580, or by mail at Sit Mutual Funds, 3300 IDS Center, 80 South Eighth Street, Minneapolis, MN 55402.
| Item 3: | Audit Committee Financial Expert. |
The registrant’s Board of Directors has determined that Mr. Edward M. Giles, Mr. Sidney L. Jones, Mr. Bruce C. Lueck, Mr. Donald W. Phillips and Mr. Barry N. Winslow are audit committee financial experts serving on its audit committee. Mr. Giles, Mr. Jones, Mr. Lueck, Mr. Phillips and Mr. Winslow are independent for purposes of this item.
| Item 4: | Principal Accountant Fees and Services. |
(a) – (d) Aggregate fees billed to the registrant for the last two fiscal years for professional services rendered by the registrant’s principal accountant were as follows:
| | | | | | | | | | | | | | | | | | | | | | | | | | | | | | | | |
| | | 2017 | | | 2016 | |
| | | Audit
Fees | | | Audit
Related | | | Tax
Fees | | | Other
Fees | | | Audit
Fees | | | Audit
Related | | | Tax
Fees | | | Other
Fees | |
Fiscal year ended June 30 | | | | | | | | | | | | | | | | | | | | | | | | | | | | | | | | |
Sit Mutual Funds, Inc. | | | | | | | | | | | | | | | | | | | | | | | | | | | | | | | | |
Sit International Growth Fund (series A) | | | 21,300 | | | | 0 | | | | 5,175 | | | | 0 | | | | 20,700 | | | | 0 | | | | 4,925 | | | | 0 | |
Sit Balanced Fund (series B) | | | 23,700 | | | | 0 | | | | 5,175 | | | | 0 | | | | 23,000 | | | | 0 | | | | 4,925 | | | | 0 | |
Sit Developing Markets Growth Fund (series C) | | | 21,300 | | | | 0 | | | | 5,175 | | | | 0 | | | | 20,700 | | | | 0 | | | | 4,925 | | | | 0 | |
Sit Small Cap Growth Fund (series D) | | | 21,500 | | | | 0 | | | | 5,175 | | | | 0 | | | | 20,900 | | | | 0 | | | | 4,925 | | | | 0 | |
Sit Dividend Growth Fund (series G) | | | 26,400 | | | | 0 | | | | 5,175 | | | | 0 | | | | 25,600 | | | | 0 | | | | 4,925 | | | | 0 | |
Sit Global Dividend Growth Fund (series H) | | | 21,300 | | | | 0 | | | | 5,175 | | | | 0 | | | | 20,700 | | | | 0 | | | | 4,925 | | | | 0 | |
Sit Small Cap Dividend Growth Fund (series I) | | | 21,300 | | | | 0 | | | | 5,175 | | | | 0 | | | | 20,700 | | | | 0 | | | | 4,925 | | | | 0 | |
Sit ESG Growth Fund (series J) | | | 21,300 | | | | 0 | | | | 5,175 | | | | 0 | | | | 0 | | | | 0 | | | | 1,800 | | | | 0 | |
| | | | | | | | | | | | | | | | | | | | | | | | | | | | | | | | |
Total Mutual Funds, Inc. | | | 178,100 | | | | 0 | | | | 41,400 | | | | 0 | | | | 152,300 | | | | 0 | | | | 36,275 | | | | 0 | |
Audit fees include amounts related to the audit of the registrant’s annual financial statements and services normally provided by the accountant in connection with statutory and regulatory filings. Audit-related fees include amounts reasonably related to the performance of the audit of the registrant’s financial statements, and/or are traditionally performed by the auditor. Tax fees include amounts related to tax compliance, tax planning, and tax advice. Other Fees include services provided to review the Fund’s order processing and trading procedures.
(e) (1) The Audit Committee is required to pre-approve audit and non-audit services performed for the registrant by the independent auditor in order to assure that the provision of such services does not impair the auditor’s independence. The audit committee also is required to pre-approve certain non-audit services performed by the registrant’s independent auditor for the registrant’s investment adviser and certain of the adviser’s affiliates if the services relate directly to the operations and financial reporting of the registrant. Services to be provided by the auditor must receive general pre-approval or specific pre-approval by the audit committee. Any proposed services exceeding pre-approved cost levels will require separate pre-approval by the audit committee.
The audit committee may delegate pre-approval authority to the audit committee chairman. The chairman shall report any pre-approval decisions to the audit committee at its next scheduled meeting. The audit committee does not delegate its responsibility to pre-approve services performed by the independent auditor to management.
| (2) | No services included in (b) – (d) were approved pursuant to paragraph (c)(7)(i)(C) of Rule 2-01 of Regulation S-X. |
(f) Not applicable.
(g) The aggregate fees billed for the most recent fiscal year and the preceding fiscal year by the registrant’s principal accountant for non-audit services rendered to the registrant, its investment adviser, and any entity controlling, controlled by, or under common control with the investment adviser that provides ongoing services to the registrant were $0 and $0, respectively.
(h) The registrant’s audit committee has determined that the provision of non-audit services rendered to the registrant’s investment adviser, and any entity controlling, controlled by, or under common control with the investment adviser that provides ongoing services to the registrant, that were not pre-approved pursuant to paragraph (c)(7)(ii) of Rule 2-01 of Regulation S-X is considered compatible with maintaining the principal accountant’s independence.
| Item 5: | Audit Committee of Listed Registrants. |
Not applicable to open-end investment companies.
| Item 6: | Schedule of Investments. |
The schedule of investments is included as part of the report to shareholders filed under Item 1 of this Form.
| Item 7: | Disclosure of Proxy Voting Policies and Procedures for Closed-End Management Investment Companies. |
Not applicable to open-end investment companies.
| Item 8: | Portfolio Managers of Closed-End Management Investments Companies. |
Not applicable to open-end investment companies.
| Item 9: | Purchases of Equity Securities by Closed-End Management Investment Company and Affiliated Purchasers. |
Not applicable to open-end investment companies.
| Item 10. | Submission of Matters to a vote of Security Holders. |
There have been no material changes to the procedures by which shareholders may recommend nominees to the registrant’s board of directors.
| Item 11: | Controls and Procedures - |
(a) Based on their evaluation of the Registrant’s Disclosure Controls and Procedures as of a date within 90 days of the Filing Date, the Registrant’s Chairman and Treasurer have determined that the Disclosure Controls and Procedures (as defined in Rule 30a-2(c) under the Act) are designed to ensure that information required to be disclosed by the Registrant is recorded, processed, summarized and reported by the filing Date, and that information required to be disclosed in the report is communicated to the Registrant’s management, as appropriate, to allow timely decisions regarding required disclosure.
(b) There were no significant changes in the Registrant’s internal controls or in other factors that could significantly affect these controls subsequent to the date of their evaluation, and there were no corrective actions with regard to significant deficiencies and material weaknesses.
| (a) | The following exhibits are attached to this Form N-CSR: |
(2) A separate certification for each principal executive and principal financial officer of the registrant as required by Rule 30a-2(a) under the Act (17 CFR 270.30a-2) (certification required by Section 302 of the Sarbanes-Oxley Act of 2002).
(b) Certification required by Rule 30a-2(b) under the Act (certification required by Section 906 of the Sarbanes-Oxley Act of 2002).
SIGNATURES
Pursuant to the requirements of the Securities Exchange Act of 1934 and the Investment Company Act of 1940, the registrant has duly caused this report to be signed on its behalf by the undersigned, thereunto duly authorized.
| | |
| Sit Mutual Funds, Inc. |
| |
| By (Signature and Title)* | | /s/ Paul E. Rasmussen |
| | Paul E. Rasmussen |
| | Vice President, Treasurer |
| Date August 25, 2017 | | |
Pursuant to the requirements of the Securities Exchange Act of 1934 and the Investment Company Act of 1940, this report has been signed below by the following persons on behalf of the registrant and in the capacities and on the dates indicated.
| | |
| |
| By (Signature and Title) | | /s/ Paul E. Rasmussen |
| | Paul E. Rasmussen |
| | Vice President, Treasurer |
| Date August 25, 2017 | | |
| | |
| |
| By (Signature and Title) | | /s/ Roger J. Sit |
| | Roger J. Sit |
| | Chairman |
| Date August 25, 2017 | | |