UNITED STATES SECURITIES AND EXCHANGE COMMISSION
Washington, D.C. 20549
FORM N-CSR
CERTIFIED SHAREHOLDER REPORT OF REGISTERED
MANAGEMENT INVESTMENT COMPANIES
Investment Company Act file number: 811-06373
Sit Mutual Funds, Inc.
(Exact name of registrant as specified in charter)
3300 IDS Center
80 South Eighth Street
Minneapolis, MN 55402
(Address of principal executive offices)
Paul E. Rasmussen, VP Treasurer
Sit Mutual Funds, Inc.
3300 IDS Center
80 South Eighth Street
Minneapolis, MN 55402
(Name and address of agent for service)
Copy to:
Mike Radmer, Esq.
Dorsey & Whitney
Suite 1500
50 South Sixth Street
Minneapolis, MN 55402-1498
Registrant’s telephone number, including area code:
(612) 332-3223
Date of fiscal year end: June 30, 2014
Date of reporting period: June 30, 2014
| Item 1: | Reports to Stockholders |
STOCK FUNDS ANNUAL REPORT TABLE OF CONTENTS |
| Page | |||||
| 2 | |||||
Fund Reviews and Schedules of Investments | |||||
| 4 | |||||
| 12 | |||||
| 16 | |||||
| 22 | |||||
| 26 | |||||
| 30 | |||||
| 34 | |||||
| 40 | |||||
| 46 | |||||
| 48 | |||||
| 50 | |||||
| 54 | |||||
| 62 | |||||
| 69 | |||||
| 70 | |||||
| 71 | |||||
| 72 | |||||
| 74 | |||||
This document must be preceded or accompanied by a Prospectus.
August 6, 2014
Dear Fellow Shareholders:
Despite uneven economic activity in most regions of the world, global equity prices surged ahead over the past twelve months. Potential headwinds are emerging, but we see a path to continued market gains in the year ahead.
In terms of the U.S. economy, as expected, the first estimate of second quarter 2014 real GDP saw it rebounding to a +4.0% annualized rate from a revised -2.1% pace in the first quarter. Data in the year’s initial quarter was unusually volatile due to a combination of mostly transitory factors, particularly poor weather and a big drop in health care spending. The first quarter figure was not indicative of underlying economic trends, as consumer spending has remained relatively steady and labor market reports have been encouraging, with nonfarm payroll gains averaging 272,000 over the past three months. Also, auto sales have continued to trend higher and manufacturing activity, provided by the Institute for Supply Management (ISM), has shown readings consistently above 50 since the recession ended in the summer of 2009, indicating steady expansion in the U.S. manufacturing sector. In addition, the drag from reduced government spending continues to abate, although fiscal restraint will serve to limit any material contribution to growth.
This underlying growth thesis was borne out in the second quarter 2014 report, as gains in both consumer spending and business investment spurred a rebound in growth. Durable goods spending grew at double-digit rate, indicating an increase in capital spending after a soft first quarter. In addition, there was a sharp bounce back in inventory accumulation during the second quarter, as this data can often exhibit significant volatility on a quarterly basis. In summary, despite the significant “noise” in the data, our interpretation of it points to the continuation of a “subpar” economic recovery in the U.S.
Despite this sequential quarterly improvement, the anemic first quarter led us to reduce our annual GDP forecast for the year, which now stands at +2.0%, compared to our projection in early April of +2.6%. This subdued level of economic growth, combined with benign inflation trends in recent quarters, points to a continuation of the low interest rate environment that has prevailed over the last several years. Investors are concerned that a sharp increase in interest rates may occur as the Federal Reserve reduces its level of security purchases (i.e., QE, or quantitative easing), as 2014 progresses. Conversely, we believe that, while interest rates are likely to increase somewhat, sharply higher rates are unlikely given the still-moderate level of growth and, importantly, muted inflation trends. To this point, recent Consumer Price Index (CPI) data has accelerated modestly to just over +2% (year-over-year) in recent months, indicating inflation pressures are not yet problematic for the economy. However, it is clear that the Federal Reserve will be monitoring inflation data very closely, with significant increases potentially pulling forward short-term rate hikes sooner than what is currently projected.
Outside the United States, we are becoming more concerned that growth in the European region may be stalling, after showing some promising signs through the end of last year. Our concerns center on the moderating manufacturing and services data, disinflationary trends in the region, and the European Central Bank’s (ECB) commentary on the necessity of additional easing and stimulus, perhaps reflecting their own concerns over slowing growth. High levels of unemployment continue to weigh on the region, and an undercapitalized banking system is making it difficult for small and mid-sized companies, in particular, to have access to credit. In Japan, Prime Minister Abe’s push for pro-growth reform has picked up pace in recent months, with a number of important reforms (e.g., lowering corporate tax rates) that have potential to boost economic growth in the years ahead. While the longer-term success of these reforms is far from certain, there are encouraging changes underway. China remains a major wild card for global growth, as GDP growth has slowed in recent quarters. However, we believe that recently introduced government stimulus measures, together with improved export demand, have stabilized growth. A weak property market continues to pressure the economy, perhaps resulting in more policy measures over the next several quarters.
Equity Strategy
Global stocks overcame sluggish economic activity and a moderation in corporate earnings growth to post strong gains over the past twelve months. Although we believe U.S. stocks can move higher from here, we caution investors not to extrapolate the strong recent returns into the future for three key reasons. First, stock valuations (i.e., P/E ratios) are now “fair”, in our view, given the sharp increase in prices over the past several quarters. Second, corporate earnings growth will likely be rather subdued based on our economic forecasts and the fact that profit margins are already at record highs. And finally, investors may be concerned over a somewhat less accommodative Federal Reserve, as it begins to pull back on its quantitative easing (QE) program in the coming months. This will likely be accompanied by an uptick in interest rates, representing a potential headwind for stocks as bonds may finally begin to offer more attractive yields to investors. In sum, our “base” expectation for the year ahead is for market gains to reflect the gains in corporate profits, which are currently growing at a mid-single digit rate.
A notable characteristic of the strong market gains has been the “low quality” nature of the rally, as more speculative stocks have materially outperformed the broader indices. We believe strongly that this can be directly tied to the Federal Reserve’s aggressive policy actions. Investors have been less risk averse, as quantitative easing has been viewed as a “safety net” for both the economy and financial markets. This has encouraged
2 | SIT MUTUAL FUNDS ANNUAL REPORT |
investors to take risk and focus on higher beta, lower quality companies because of this perceived safety net. Most measures of volatility (e.g., VIX index) are near record lows, indicative of investor complacency with regard to risk.
Against this backdrop, we believe it is more important than ever to focus on high quality companies that are able to generate earnings growth even in a sluggish economy. Quality, as we define it, refers to companies with strong balance sheets, predictable earnings growth, consistent cash flow generation, and management teams that focus on improving returns on capital. From a sector perspective, it has been encouraging to see an uptick in corporate capital spending, after several years of underinvestment. Activity is picking up in diverse areas, such as commercial construction, automation, aerospace, and many areas within technology. In addition, increased domestic oil production is creating the need for significant capital spending on infrastructure. In this regard, energy, industrials and technology have significant weight within the Funds. From a defensive perspective, we continue to favor healthcare, as we believe there are attractive valuations in many parts of the sector. Overall, we believe this focus on quality and portfolio diversification will offer investors some downside protection when volatility eventually returns to the equity markets.
Outside the United States, we have become slightly more cautious on the European region in light of the fragile economies, as previously discussed. Within Europe, we have reduced exposure in the UK, as rising interest rates are a potential head-wind for the country. In Japan, we have modestly increased our exposure, given the improved outlook amid pro-growth structural reforms. We continue to have significant exposure to China based on our view that growth, while moderating, is still quite strong relative to the rest of the world. Across all economic regions, our investment team remains focused on identifying well managed, high quality growth companies than can deliver results for our shareholders over the long term.
With best wishes,

Roger J. Sit
Chairman, President, CEO and Global CIO
JUNE 30, 2014 |
3 |
|
OBJECTIVE & STRATEGY
The Sit Balanced Fund’s dual objectives are to seek long-term growth of capital consistent with the preservation of principal and to provide regular income. It pursues its objectives by investing in a diversified portfolio of stocks and bonds. The Fund may emphasize either equity securities or fixed-income securities, or hold equal amounts of each, dependent upon the Adviser’s analysis of market, financial and economic conditions.
The Fund’s permissible investment allocation is: 35-65% in equity securities and 35-65% in fixed-income securities. At all times at least 25% of the fixed-income assets will be invested in fixed-income senior securities.
The Sit Balanced Fund’s twelve-month return was +15.58%. The S&P 500® Index’s return was +24.61% over the period, while the Barclays Aggregate Bond Index gained +4.37%. The Lipper Balanced Fund Index advanced +16.25% over the period.
Despite uneven economic conditions, stocks and bonds moved solidly higher over the past twelve months, as both inflation and interest rates remained at moderate levels and the Federal Reserve continued its highly accommodative monetary policy. In terms of the equity portion of the Fund, we continue to believe that an emphasis on “quality” is particularly important as markets are at record highs and volatility could very well pick up in the months ahead, given heightened geopolitical tensions (particularly in the Middle East) and concerns over the end of the Federal Reserve’s quantitative easing program. It is our belief that companies with stable earnings growth, strong cash flow generation and minimal debt levels will outperform the overall market, as economic growth remains sluggish and investors seek firms that have financial flexibility to return capital through either share repurchases or increased dividends. In terms of performance, the equity portion of the Fund lagged the S&P 500® Index return over the past twelve months. This was largely due to negative stock selection in the retail trade, consumer services and technology sectors. Conversely, strong stock selection in both the finance and health technology sectors helped relative returns over the period.
During the period, we estimate that the fixed income portion of the Fund outperformed the Barclays Aggregate Bond Index. Interest rates rose during the period, particularly for shorter maturities, resulting in weakness in price returns for the Fund. However, this was more than offset by the Fund’s significant yield advantage. Returns particularly benefitted from the Fund’s position in corporate and taxable municipal securities, both due to the attractive income advantage produced by those sectors and strong price appreciation in the underlying bonds. We expect higher interest rates over the near to intermediate term, as the Federal Reserve continues to decrease the quantity of bonds it purchases every month as part of their quantitative easing (QE) program.
HYPOTHETICAL GROWTH OF $10,000
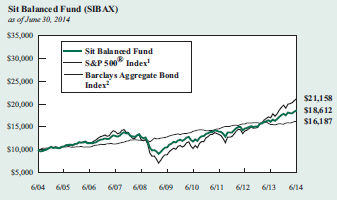
The chart above illustrates the total value of a hypothetical $10,000 investment in the Fund over the past 10 years as compared to the performance of the S&P 500® Index and the Barclays Aggregate Bond Index. Past performance does not guarantee future results. Returns include the reinvestment of distributions. The chart does not reflect the deduction of taxes that a shareholder would pay on Fund distributions or the redemption of Fund shares.
1 S&P 500® Index is an unmanaged capitalization-weighted index that measures the performance of 500 widely held common stocks of large-cap companies. It is not possible to invest directly in an index. This is the primary index for the equity portion of the Fund.
2 Barclays Aggregate Bond Index is an unmanaged market value-weighted index which measures the performance of investment grade debt securities with maturities of at least one year. This is the primary index for the fixed income portion of the Fund.
We are underweighted in the U.S. Treasury bond sector, as we believe U.S. Treasury securities will underperform as the Fed continues to buy fewer of them each month. We prefer higher quality corporate bonds and mortgage-backed securities, as the yield advantage available in these sectors boosts their return potential.
As of June 30, the asset allocation of the Fund was 65% equities, 33% fixed income, and 2% cash and equivalents.
Roger J. Sit
Bryce A. Doty
John M. Bernstein
Portfolio Managers
Information on this page is unaudited. | ||
4 | SIT MUTUAL FUNDS ANNUAL REPORT | |
|
COMPARATIVE RATES OF RETURNS
as of June 30, 2014
| Sit Balanced Fund | S&P 500® Index 1 | Barclays Aggregate Bond Index 2 | |||||||||||||
One Year | 15.58 | % | 24.61 | % | 4.37 | % | |||||||||
Five Year | 12.15 | 18.83 | 4.85 | ||||||||||||
Ten Year | 6.41 | 7.78 | 4.93 | ||||||||||||
Since Inception (12/31/93) | 6.96 | 9.35 | 5.79 | ||||||||||||
Performance figures are historical and do not guarantee future results. Investment returns and principal value will vary, and you may have a gain or loss when you sell shares. Current performance may be lower or higher than the performance data quoted. Contact the Fund for performance data current to the most recent month-end. Returns include changes in share price as well as reinvestment of all dividends and capital gains. Returns do not reflect the deduction of taxes that a shareholder would pay on Fund distributions or the redemption of Fund shares. Management fees and administrative expenses are included in the Fund’s performance. Returns for periods greater than one year are compounded average annual rates of return.
1 S&P 500® Index is an unmanaged capitalization-weighted index that measures the performance of 500 widely held common stocks of large-cap companies. It is not possible to invest directly in an index.
2 Barclays Aggregate Bond Index is an unmanaged market value-weighted index which measures the performance of investment grade debt securities with maturities of at least one year.
PORTFOLIO SUMMARY
Net Asset Value 6/30/14: | $21.01 PerShare | |
Net Asset Value 6/30/13: | $18.42 Per Share | |
Total Net Assets: | $15.6 Million |
TOP HOLDINGS
Top Equity Holdings:
1. Apple, Inc.
2. Google, Inc.
3. Visa, Inc.
4. PepsiCo, Inc.
5. JPMorgan Chase & Co.
Top Fixed Income Holdings:
1. GNMA, 4.50%, 6/15/40
2. U.S. Treasury Strips, 2.85%, 11/15/23
3. GNMA, 7.29%, 11/20/34
4. Microsoft Corp., 5.20%, 6/1/39
5. U.S. Treasury Note, 2.75%, 11/15/42
Based on total net assets as of June 30, 2014. Subject to change.
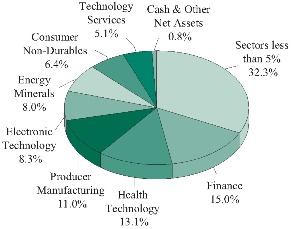
FUND DIVERSIFICATION

Based on total net assets as of June 30, 2014. Subject to change.
Information on this page is unaudited. | ||
JUNE 30, 2014 |
5 |
SCHEDULE OF INVESTMENTS
June 30, 2014
Sit Balanced Fund
| Quantity |
Name of Issuer | Fair Value ($) | ||||
Common Stocks - 65.4% | ||||||
Commercial Services - 1.0% | ||||||
900 | Equifax, Inc. | 65,286 | ||||
1,950 | Robert Half International, Inc. | 93,093 | ||||
|
| |||||
| 158,379 | ||||||
|
| |||||
Communications - 1.8% | ||||||
1,100 | SBA Communications Corp. * | 112,530 | ||||
3,500 | Verizon Communications, Inc. | 171,255 | ||||
|
| |||||
| 283,785 | ||||||
|
| |||||
Consumer Durables - 0.5% | ||||||
600 | Polaris Industries, Inc. | 78,144 | ||||
|
| |||||
Consumer Non-Durables - 4.5% | ||||||
1,475 | Michael Kors Holdings, Ltd. * | 130,759 | ||||
1,300 | NIKE, Inc. | 100,815 | ||||
2,475 | PepsiCo, Inc. | 221,117 | ||||
1,250 | Philip Morris International, Inc. | 105,388 | ||||
1,900 | Procter & Gamble Co. | 149,321 | ||||
|
| |||||
| 707,400 | ||||||
|
| |||||
Consumer Services - 3.3% | ||||||
1,350 | Starbucks Corp. | 104,463 | ||||
1,150 | Time Warner, Inc. | 80,787 | ||||
3,000 | Twenty-First Century Fox, Inc. | 105,450 | ||||
1,075 | Visa, Inc. | 226,513 | ||||
|
| |||||
| 517,213 | ||||||
|
| |||||
Electronic Technology - 6.9% | ||||||
1,500 | 3D Systems Corp. * | 89,700 | ||||
3,220 | Apple, Inc. | 299,235 | ||||
5,100 | Applied Materials, Inc. | 115,005 | ||||
1,550 | Avago Technologies, Ltd. | 111,708 | ||||
4,650 | Ciena Corp. * | 100,719 | ||||
2,425 | EMC Corp. | 63,874 | ||||
3,450 | Intel Corp. | 106,605 | ||||
275 | International Business Machines Corp. | 49,849 | ||||
1,800 | Qualcomm, Inc. | 142,560 | ||||
|
| |||||
| 1,079,255 | ||||||
|
| |||||
Energy Minerals - 4.3% | ||||||
1,300 | Chevron Corp. | 169,715 | ||||
925 | Continental Resources, Inc. * | 146,187 | ||||
950 | Gulfport Energy Corp. * | 59,660 | ||||
1,425 | Marathon Petroleum Corp. | 111,250 | ||||
1,800 | Occidental Petroleum Corp. | 184,734 | ||||
|
| |||||
| 671,546 | ||||||
|
| |||||
Finance - 6.7% | ||||||
500 | ACE, Ltd. | 51,850 | ||||
1,500 | Ameriprise Financial, Inc. | 180,000 | ||||
1,325 | Discover Financial Services | 82,123 | ||||
1,950 | Franklin Resources, Inc. | 112,788 | ||||
760 | Goldman Sachs Group, Inc. | 127,254 | ||||
| Quantity |
Name of Issuer | Fair Value ($) | ||||
3,525 | JPMorgan Chase & Co. | 203,111 | ||||
1,550 | Marsh & McLennan Cos., Inc. | 80,321 | ||||
1,900 | US Bancorp | 82,308 | ||||
2,300 | Wells Fargo & Co. | 120,888 | ||||
|
| |||||
| 1,040,643 | ||||||
|
| |||||
Health Services - 3.0% | ||||||
800 | Aetna, Inc. | 64,864 | ||||
755 | Express Scripts Holding Co. * | 52,344 | ||||
1,300 | HCA Holdings, Inc. * | 73,294 | ||||
650 | McKesson Corp. | 121,037 | ||||
1,875 | UnitedHealth Group, Inc. | 153,281 | ||||
|
| |||||
| 464,820 | ||||||
|
| |||||
Health Technology - 8.8% | ||||||
375 | Actavis, PLC * | 83,644 | ||||
425 | Alexion Pharmaceuticals, Inc. * | 66,406 | ||||
775 | Allergan, Inc. | 131,145 | ||||
1,650 | Bristol-Myers Squibb Co. | 80,042 | ||||
1,480 | Celgene Corp. * | 127,102 | ||||
1,775 | Covidien, PLC | 160,069 | ||||
2,200 | Gilead Sciences, Inc. * | 182,402 | ||||
1,350 | Johnson & Johnson | 141,237 | ||||
1,600 | Medtronic, Inc. | 102,016 | ||||
1,050 | Mylan, Inc. * | 54,138 | ||||
125 | Regeneron Pharmaceuticals, Inc. * | 35,309 | ||||
1,600 | St. Jude Medical, Inc. | 110,800 | ||||
900 | Thermo Fisher Scientific, Inc. | 106,200 | ||||
|
| |||||
| 1,380,510 | ||||||
|
| |||||
Industrial Services - 1.5% | ||||||
750 | Fluor Corp. | 57,675 | ||||
1,475 | Schlumberger, Ltd. | 173,976 | ||||
|
| |||||
| 231,651 | ||||||
|
| |||||
Process Industries - 2.2% | ||||||
115 | CF Industries Holdings, Inc. | 27,661 | ||||
1,650 | Ecolab, Inc. | 183,711 | ||||
1,425 | International Paper Co. | 71,920 | ||||
475 | Praxair, Inc. | 63,099 | ||||
|
| |||||
| 346,391 | ||||||
|
| |||||
Producer Manufacturing - 7.1% | ||||||
650 | 3M Co. | 93,106 | ||||
875 | Caterpillar, Inc. | 95,086 | ||||
2,075 | Danaher Corp. | 163,365 | ||||
1,000 | Delphi Automotive, PLC | 68,740 | ||||
1,350 | Eaton Corp., PLC | 104,193 | ||||
1,200 | Emerson Electric Co. | 79,632 | ||||
900 | Flowserve Corp. | 66,915 | ||||
1,575 | Honeywell International, Inc. | 146,396 | ||||
325 | Precision Castparts Corp. | 82,030 | ||||
2,000 | Trinity Industries, Inc. | 87,440 | ||||
See accompanying notes to financial statements | ||||
6 | SIT MUTUAL FUNDS ANNUAL REPORT |
| Quantity/ Principal Amount ($) | Name of Issuer | Fair Value ($) | ||||
1,050 | United Technologies Corp. | 121,223 | ||||
|
| |||||
| 1,108,126 | ||||||
|
| |||||
Retail Trade - 4.7% | ||||||
245 | Amazon.com, Inc. * | 79,571 | ||||
2,150 | CVS Caremark Corp. | 162,046 | ||||
1,850 | Dick’s Sporting Goods, Inc. | 86,136 | ||||
1,050 | eBay, Inc. * | 52,563 | ||||
2,125 | Home Depot, Inc. | 172,040 | ||||
1,200 | Target Corp. | 69,540 | ||||
2,250 | TJX Cos., Inc. | 119,588 | ||||
|
| |||||
| 741,484 | ||||||
|
| |||||
Technology Services - 7.6% | ||||||
1,425 | Accenture, PLC | 115,197 | ||||
1,550 | Adobe Systems, Inc. * | 112,158 | ||||
675 | ANSYS, Inc. * | 51,178 | ||||
2,000 | Cognizant Technology Solutions Corp. * | 97,820 | ||||
255 | Google, Inc. - Class A * | 149,091 | ||||
255 | Google, Inc. - Class C * | 146,696 | ||||
1,900 | Informatica Corp. * | 67,735 | ||||
4,325 | Microsoft Corp. | 180,353 | ||||
2,700 | Oracle Corp. | 109,431 | ||||
135 | priceline.com, Inc. * | 162,405 | ||||
|
| |||||
| 1,192,064 | ||||||
|
| |||||
Transportation - 1.5% | ||||||
1,600 | Union Pacific Corp. | 159,600 | ||||
775 | United Parcel Service, Inc. | 79,561 | ||||
|
| |||||
| 239,161 | ||||||
|
| |||||
Total Common Stocks (cost: $6,422,765) | 10,240,572 | |||||
|
| |||||
Bonds - 32.4% | ||||||
Asset-Backed Securities - 2.9% | ||||||
10,643 | Bayview Financial Acquisition Trust, 2006-D 1A2, 5.66%, 12/28/36 14 | 10,650 | ||||
63,344 | Centex Home Equity, | 65,326 | ||||
22,100 | Citifinancial Mortgage Securities, Inc.: 2004-1 AF3, 3.77%, 4/25/34 14 | 22,481 | ||||
51,377 | 2003-1 AF5, 4.78%, 1/25/33 14 | 52,738 | ||||
46,534 | Conseco Finance, | 45,260 | ||||
15,544 | First Franklin Mtge. Loan | 15,526 | ||||
41,830 | Green Tree Financial Corp., | 43,630 | ||||
50,000 | HouseHold Home Equity Loan Trust, 2007-2 A4, 0.45%, 7/20/36 1 | 48,888 | ||||
12,909 | Irwin Home Equity Corp., | 12,976 | ||||
Principal | Name of Issuer | Fair Value ($) | ||||
28,001 | New Century Home Equity Loan Trust, | 29,179 | ||||
48,739 | RAAC Series, | 47,601 | ||||
45,179 | Residential Asset Mortgage Products, Inc., | 45,179 | ||||
11,199 | Residential Funding Mortgage | 11,343 | ||||
|
| |||||
| 450,777 | ||||||
|
| |||||
Collateralized Mortgage Obligations - 5.6% | ||||||
68,431 | Fannie Mae Grantor Trust: | 77,511 | ||||
16,895 | 2004-T3, 1A3, 7.00%, 2/25/44 | 19,222 | ||||
25,856 | Fannie Mae REMIC: | 28,142 | ||||
12,049 | 2013-28 WD, 6.50%, 5/25/42 | 13,689 | ||||
77,390 | 2012-68 GW, 7.00%, 5/25/31 | 94,531 | ||||
11,592 | 2010-108 AP, 7.00%, 9/25/40 | 12,865 | ||||
95,952 | Freddie Mac REMIC: | 94,557 | ||||
88,699 | 5.33%, 10/15/47 1 | 95,526 | ||||
23,068 | 7.00%, 11/15/29 | 25,499 | ||||
44,509 | 7.50%, 6/15/30 | 51,574 | ||||
98,473 | Government National Mortgage Association: | 114,459 | ||||
63,487 | 2005-74 HA, 7.50%, 9/16/35 | 72,047 | ||||
23,160 | Sequoia Mortgage Trust: | 21,296 | ||||
39,522 | 2013-1 2A1, 1.86%, 2/25/43 1 | 35,715 | ||||
45,139 | 2013-3 A2, 2.50%, 3/25/43 1 | 41,888 | ||||
33,233 | 2012-4 A2, 3.00%, 9/25/42 1 | 32,202 | ||||
42,799 | Vendee Mortgage Trust, | 49,281 | ||||
|
| |||||
| 880,004 | ||||||
|
| |||||
Corporate Bonds - 10.6% | ||||||
100,000 | Airgas, Inc., | 100,935 | ||||
72,167 | America West Airlines 2000-1 Trust, | 83,172 | ||||
35,000 | American Express Bank FSB, | 39,998 | ||||
50,000 | Assured Guaranty US Holdings, Inc., | 56,202 | ||||
75,000 | Bank of America Corp., | 85,671 | ||||
50,000 | Bank One Corp., | 62,318 | ||||
50,000 | Caterpillar Financial Services Corp., | 49,974 | ||||
See accompanying notes to financial statements. | ||
JUNE 30, 2014 |
7 |
SCHEDULE OF INVESTMENTS
June 30, 2014
Sit Balanced Fund (Continued)
Principal | Name of Issuer | Fair Value ($) | ||||
25,000 | Coca-Cola Refreshments USA, Inc., | 32,669 | ||||
100,000 | Entergy Arkansas, Inc., | 100,104 | ||||
50,000 | Florida Power & Light Co., | 50,395 | ||||
50,000 | General Electric Capital Corp., | 50,179 | ||||
50,000 | Google, Inc., | 53,594 | ||||
50,000 | HSBC USA, Inc., | 65,451 | ||||
50,000 | Johnson & Johnson, | 52,214 | ||||
40,000 | Manufacturers & Traders Trust Co. (Subordinated), | 41,600 | ||||
100,000 | Microsoft Corp., | 113,678 | ||||
40,000 | Northern States Power Co., | 52,427 | ||||
48,982 | Northwest Airlines 1999-2 A Trust, | 55,227 | ||||
20,121 | Northwest Airlines 2007-1 A Trust, | 23,139 | ||||
50,000 | Oracle Corp., | 49,980 | ||||
63,989 | Procter & Gamble ESOP, | 80,567 | ||||
50,000 | Prudential Financial, Inc., | 49,850 | ||||
50,000 | Southern California Edison Co., | 59,896 | ||||
50,000 | State Street Corp., | 63,776 | ||||
50,000 | Statoil ASA, | 51,095 | ||||
25,000 | Target Corp., | 33,363 | ||||
50,000 | Tosco Corp., | 73,856 | ||||
21,000 | Validus Holdings, Ltd., | 30,176 | ||||
|
| |||||
| 1,661,506 | ||||||
|
| |||||
Federal Home Loan Mortgage Corporation - 1.5% |
| |||||
57,061 | 2.50%, 4/1/27 | 57,980 | ||||
32,290 | 3.00%, 5/1/27 | 33,143 | ||||
18,006 | 6.00%, 10/1/21 | 19,354 | ||||
38,074 | 7.00%, 7/1/32 | 41,592 | ||||
8,134 | 7.00%, 5/1/34 | 9,220 | ||||
16,628 | 7.00%, 11/1/37 | 18,408 | ||||
11,263 | 7.00%, 1/1/39 | 13,048 | ||||
Principal | Name of Issuer | Fair Value ($) | ||||
20,229 | 7.50%, 11/1/36 | 24,036 | ||||
3,475 | 8.00%, 9/1/15 | 3,568 | ||||
8,831 | 8.38%, 5/17/20 | 9,623 | ||||
|
| |||||
| 229,972 | ||||||
|
| |||||
Federal National Mortgage Association - 2.5% | ||||||
25,169 | 6.50%, 5/1/36 | 28,414 | ||||
58,979 | 6.63%, 11/1/30 | 61,885 | ||||
46,759 | 6.63%, 1/1/31 | 48,737 | ||||
16,644 | 7.00%, 12/1/32 | 18,953 | ||||
35,232 | 7.00%, 3/1/33 | 40,405 | ||||
23,228 | 7.00%, 12/1/36 | 26,716 | ||||
10,941 | 7.00%, 11/1/38 | 12,453 | ||||
17,519 | 7.50%, 4/1/33 | 20,488 | ||||
18,394 | 7.50%, 11/1/33 | 22,041 | ||||
26,042 | 7.50%, 1/1/34 | 31,389 | ||||
8,708 | 7.50%, 4/1/38 | 10,006 | ||||
38,653 | 8.00%, 2/1/31 | 47,601 | ||||
8,963 | 8.43%, 7/15/26 | 9,624 | ||||
6,827 | 9.50%, 5/1/27 | 8,018 | ||||
|
| |||||
| 386,730 | ||||||
|
| |||||
Government National Mortgage Association - 3.2% |
| |||||
280,311 | 4.50%, 6/15/40 | 309,590 | ||||
26,256 | 7.00%, 12/15/24 | 30,040 | ||||
45,465 | 7.00%, 9/20/38 | 51,401 | ||||
37,381 | 8.00%, 7/15/24 | 42,036 | ||||
70,102 | 8.38%, 3/15/31 | 73,198 | ||||
|
| |||||
| 506,265 | ||||||
|
| |||||
Taxable Municipal Securities - 1.9% | ||||||
65,000 | City of Tucson AZ, | 65,675 | ||||
85,000 | County of St Clair IL, | 89,318 | ||||
50,000 | Macomb Interceptor Drain Drainage District, | 52,434 | ||||
80,000 | Texas St. Pub. Fin. Auth. Charter Sch. Fin. Rev., | 89,479 | ||||
|
| |||||
| 296,906 | ||||||
|
| |||||
See accompanying notes to financial statements. | ||||
8 | SIT MUTUAL FUNDS ANNUAL REPORT |
Principal Amount ($)/ Quantity | Name of Issuer | Fair Value ($) | ||||
U.S. Government / Federal Agency Securities - 3.1% |
| |||||
100,000 | U.S. Treasury Note: | 99,998 | ||||
50,000 | 1.13%, 4/30/20 | 47,977 | ||||
125,000 | 2.75%, 11/15/42 | 111,582 | ||||
200,000 | U.S. Treasury Strips: | 156,233 | ||||
150,000 | 4.22%, 2/15/36 6 | 73,856 | ||||
|
| |||||
| 489,646 | ||||||
|
| |||||
Foreign Government Bonds - 1.1% | ||||||
100,000 | Province of Manitoba, | 95,502 | ||||
50,000 | Province of Saskatchewan, | 69,423 | ||||
|
| |||||
| 164,925 | ||||||
|
| |||||
Total Bonds (cost: $4,954,165) | 5,066,731 | |||||
|
| |||||
Investment Companies - 0.6% | ||||||
4,300 | American Strategic Income Portfolio, Inc. II | 37,754 | ||||
1,100 | Blackrock Build America Bond Trust | 23,870 | ||||
1,300 | Nuveen Build American Bond Term Fund | 26,650 | ||||
|
| |||||
Total Investment Companies (cost: $89,916) | 88,274 | |||||
|
| |||||
Total Investments in Securities - 98.4% (cost: $11,466,846) | 15,395,577 | |||||
Other Assets and Liabilities, net - 1.6% | 249,521 | |||||
|
| |||||
Total Net Assets - 100.0% | $15,645,098 | |||||
|
| |||||
| * | Non-income producing security. |
| 1 | Variable rate security. Rate disclosed is as of June 30, 2014. |
| 6 | Zero coupon or convertible capital appreciation bond, for which the rate disclosed is either the effective yield on purchase date or the coupon rate to be paid upon conversion to coupon paying, respectively. |
| 14 | Step Coupon: A bond that pays an initial coupon rate for the first period and then a higher coupon rate for the following periods. Rate disclosed is as of June 30, 2014. |
Numeric footnotes not disclosed are not applicable to this Schedule of Investments.
PLC — Public Limited Company
REMIC — Real Estate Mortgage Investment Conduit
See accompanying notes to financial statements. | ||
JUNE 30, 2014 |
9 |
SCHEDULE OF INVESTMENTS
June 30, 2014
Sit Balanced Fund (Continued)
A summary of the levels for the Fund’s investments as of June 30, 2014 is as follows (see Note 2 - significant accounting policies in the notes to financial statements):
| Investment in Securities | ||||||||||||||
| Level 1 Quoted Price ($) | Level 2 Other significant observable inputs ($) | Level 3 Significant | Total ($) | |||||||||||
Common Stocks ** | 10,240,572 | — | — | 10,240,572 | ||||||||||
Asset-Backed Securities | — | 450,777 | — | 450,777 | ||||||||||
Collateralized Mortgage Obligations | — | 880,004 | — | 880,004 | ||||||||||
Corporate Bonds | — | 1,661,506 | — | 1,661,506 | ||||||||||
Federal Home Loan Mortgage Corporation | — | 229,972 | — | 229,972 | ||||||||||
Federal National Mortgage Association | — | 386,730 | — | 386,730 | ||||||||||
Government National Mortgage Association | — | 506,265 | — | 506,265 | ||||||||||
Taxable Municipal Securities | — | 296,906 | — | 296,906 | ||||||||||
U.S. Government / Federal Agency Securities | — | 489,646 | — | 489,646 | ||||||||||
Foreign Government Bonds | — | 164,925 | — | 164,925 | ||||||||||
Investment Companies | 88,274 | — | — | 88,274 | ||||||||||
Total: | 10,328,846 | 5,066,731 | — | 15,395,577 | ||||||||||
| ** | For equity securities categorized in a single level, refer to the Schedule of Investments for further breakdown. |
For the reporting period, there were no transfers between levels 1, 2 and 3.
See accompanying notes to financial statements. | ||||
10 | SIT MUTUAL FUNDS ANNUAL REPORT |
[This page intentionally left blank.]
JUNE 30, 2014 |
11 |
Sit Dividend Growth Fund - Class I and Class S
|
OBJECTIVE & STRATEGY
The objective of the Dividend Growth Fund is to provide current income that exceeds the dividend yield of the S&P 500® Index and that grows over a period of years. Secondarily, the Fund seeks long-term capital appreciation.
The Fund seeks to achieve its objectives by investing, under normal market conditions, at least 80% of its net assets in dividend-paying common stocks. The Fund may invest the balance of its assets in preferred stocks, convertible bonds, and U.S. Treasury securities.
The Sit Dividend Growth Fund Class I posted a +20.26% return over the last twelve months, compared to the +24.61% return for the S&P 500® Index.
Despite uneven economic growth in most regions of the world, equities surged to record highs in recent months, as the U.S. Federal Reserve and other global central banks continue to maintain highly accommodative monetary policies. While we believe that these policies have bolstered financial markets globally, we continue to maintain our risk management discipline, particularly with markets now at elevated levels. Therefore, we continue to focus on well-managed, established companies with relatively stable business models and exceptional financial strength, which, in turn, will drive consistent dividend growth. It remains encouraging to see corporations respond to investors’ desire for higher dividends. For example, over the past twelve months, 90 companies within the Fund (out of 93 current holdings) have increased their dividends, with a median increase of nearly +14%. In terms of portfolio structure, the Fund remains well-diversified. The largest sector weightings are in finance, health technology and producer manufacturing.
We believe the Fund’s underperformance, compared to the strong S&P 500® Index return, can be attributed to the relatively conservative nature (e.g., low “beta”) of the Fund and relatively weak performance of holdings within the industrial services and energy minerals sectors, with positions in Seadrill, Oceaneering International, Chevron and Marathon Petroleum lagging the benchmark sector returns. The technology services sector also lagged, as holdings of Accenture and Automatic Data Processing trailed the performance of many non-dividend payers within the benchmark sector, such as Facebook, Priceline, and Adobe Systems, which are not held within the Fund. On the positive side, strong performance of holdings within the health services, finance and commercial services sectors contributed positively to returns over the past six months. Key outperformers within
HYPOTHETICAL GROWTH OF $10,000
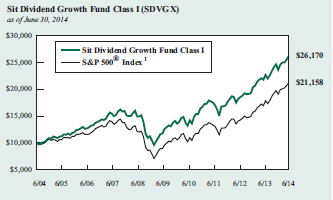 |
The chart above illustrates the total value of a hypothetical $10,000 investment in the Fund over the past 10 years as compared to the performance of the S&P 500® Index. Past performance does not guarantee future results. Returns include the reinvestment of distributions. The chart does not reflect the deduction of taxes that a shareholder would pay on Fund distributions or the redemption of Fund shares.
1 S&P 500® Index is an unmanaged capitalization-weighted index that measures the performance of 500 widely held common stocks of large-cap companies. It is not possible to invest directly in an index. This is the Fund’s primary index.
these sectors included Cardinal Health, McKesson, Ameriprise Financial, First Republic Bank, Moody’s and Nielsen Holdings. Each of these positions rose more than +40% over the past twelve months.
Our research effort is highly focused on companies with strong financial characteristics, growth prospects, and management teams committed to returning excess capital back to shareholders over the long term.
Roger J. Sit
Kent L. Johnson
Michael J. Stellmacher
Portfolio Managers
| Information on this page is unaudited. | ||
12 | SIT MUTUAL FUNDS ANNUAL REPORT | |
|
COMPARATIVE RATES OF RETURNS
as of June 30, 2014
| Sit Dividend Growth Fund | |||||||||||||||
| Class I | Class S | S&P 500® Index 1 | |||||||||||||
One Year | 20.26 | % | 20.02 | % | 24.61 | % | |||||||||
Five Year | 17.43 | 17.13 | 18.83 | ||||||||||||
Ten Year | 10.10 | n/a | 7.78 | ||||||||||||
Since Inception - Class I (12/31/03) | 9.77 | n/a | 7.74 | ||||||||||||
Since Inception - Class S (3/31/06) | n/a | 8.92 | 7.42 | ||||||||||||
Performance figures are historical and do not guarantee future results. Investment returns and principal value will vary, and you may have a gain or loss when you sell shares. Current performance may be lower or higher than the performance data quoted. Contact the Fund for performance data current to the most recent month-end. Returns include changes in share price as well as reinvestment of all dividends and capital gains. Returns do not reflect the deduction of the 2% redemption fee imposed if shares are redeemed or exchanged within 30 calendar days from their date of purchase. If imposed, the fee would reduce the performance quoted. Returns do not reflect the deduction of taxes that a shareholder would pay on Fund distributions or the redemption of Fund shares. Management fees and administrative expenses are included in the Fund’s performance. Returns for periods greater than one year are compounded average annual rates of return.
1 S&P 500® Index is an unmanaged capitalization-weighted index that measures the performance of 500 widely held common stocks of large-cap companies. It is not possible to invest directly in an index.
PORTFOLIO SUMMARY
Class I: | ||
Net Asset Value 6/30/14: | $18.69 Per Share | |
Net Asset Value 6/30/13: | $16.35 Per Share | |
Total Net Assets: | $1,017.1 Million | |
Class S: | ||
Net Asset Value 6/30/14: | $18.63 Per Share | |
Net Asset Value 6/30/13: | $16.29 Per Share | |
Total Net Assets: | $103.4 Million | |
Weighted Average Market Cap: | $92.5 Billion | |
TOP 10 HOLDINGS
1. Johnson & Johnson
2. Chevron Corp.
3. Microsoft Corp.
4. Verizon Communications, Inc.
5. JPMorgan Chase & Co.
6. Honeywell International, Inc.
7. PepsiCo, Inc.
8. Occidental Petroleum Corp.
9. Merck & Co., Inc.
| 10. Procter | & Gamble Co. |
Based on total net assets as of June 30, 2014. Subject to change.
FUND DIVERSIFICATION
Based on total net assets as of June 30, 2014. Subject to change.
| Information on this page is unaudited. | ||
JUNE 30, 2014 | 13 | |
SCHEDULE OF INVESTMENTS
June 30, 2014
Sit Dividend Growth Fund
Quantity | Name of Issuer | Fair Value ($) | ||||
Common Stocks - 97.4% | ||||||
Commercial Services - 3.0% | ||||||
116,310 | Equifax, Inc. | 8,437,127 | ||||
119,100 | Moody’s Corp. | 10,440,306 | ||||
161,400 | Nielsen Holdings NV | 7,813,374 | ||||
146,850 | Robert Half International, Inc. | 7,010,619 | ||||
|
| |||||
| 33,701,426 | ||||||
|
| |||||
Communications - 2.3% | ||||||
529,800 | Verizon Communications, Inc. | 25,923,114 | ||||
|
| |||||
Consumer Durables - 1.9% | ||||||
79,384 | Genuine Parts Co. | 6,969,915 | ||||
122,000 | Snap-On, Inc. | 14,459,440 | ||||
|
| |||||
| 21,429,355 | ||||||
|
| |||||
Consumer Non-Durables - 6.4% | ||||||
80,250 | Colgate-Palmolive Co. | 5,471,445 | ||||
55,800 | Diageo, PLC, ADR | 7,101,666 | ||||
127,850 | NIKE, Inc. | 9,914,767 | ||||
259,900 | PepsiCo, Inc. | 23,219,466 | ||||
88,875 | Philip Morris International, Inc. | 7,493,051 | ||||
234,700 | Procter & Gamble Co. | 18,445,073 | ||||
|
| |||||
| 71,645,468 | ||||||
|
| |||||
Consumer Services - 2.8% | ||||||
58,850 | McDonald’s Corp. | 5,928,549 | ||||
206,100 | Time Warner, Inc. | 14,478,525 | ||||
128,300 | Viacom, Inc. | 11,127,459 | ||||
|
| |||||
| 31,534,533 | ||||||
|
| |||||
Electronic Technology - 8.3% | ||||||
142,660 | Apple, Inc. | 13,257,394 | ||||
493,300 | Applied Materials, Inc. | 11,123,915 | ||||
206,250 | Avago Technologies, Ltd. | 14,864,437 | ||||
560,300 | Intel Corp. | 17,313,270 | ||||
69,940 | International Business Machines Corp. | 12,678,024 | ||||
216,500 | Qualcomm, Inc. | 17,146,800 | ||||
148,400 | Xilinx, Inc. | 7,020,804 | ||||
|
| |||||
| 93,404,644 | ||||||
|
| |||||
Energy Minerals - 8.0% | ||||||
241,700 | Chevron Corp. | 31,553,935 | ||||
133,350 | Devon Energy Corp. | 10,587,990 | ||||
126,900 | Marathon Petroleum Corp. | 9,907,083 | ||||
221,000 | Occidental Petroleum Corp. | 22,681,230 | ||||
358,100 | Suncor Energy, Inc. | 15,265,803 | ||||
|
| |||||
| 89,996,041 | ||||||
|
| |||||
Finance - 15.0% | ||||||
76,600 | ACE, Ltd. | 7,943,420 | ||||
125,017 | Ameriprise Financial, Inc. | 15,002,040 | ||||
297,050 | Ares Capital Corp. | 5,305,313 | ||||
180,200 | Arthur J Gallagher & Co. | 8,397,320 | ||||
194,675 | Discover Financial Services | 12,065,957 | ||||
Quantity | Name of Issuer | Fair Value ($) | ||||
142,900 | First Republic Bank | 7,858,071 | ||||
115,500 | Franklin Resources, Inc. | 6,680,520 | ||||
58,825 | Goldman Sachs Group, Inc. | 9,849,658 | ||||
439,500 | JPMorgan Chase & Co. | 25,323,990 | ||||
114,622 | Macquarie Infrastructure Co., LLC | 7,148,974 | ||||
240,500 | Marsh & McLennan Cos., Inc. | 12,462,710 | ||||
73,800 | PNC Financial Services Group, Inc. | 6,571,890 | ||||
163,700 | T Rowe Price Group, Inc. | 13,817,917 | ||||
317,500 | US Bancorp | 13,754,100 | ||||
148,100 | Validus Holdings, Ltd. | 5,663,344 | ||||
296,400 | XL Group, PLC | 9,701,172 | ||||
|
| |||||
| 167,546,396 | ||||||
|
| |||||
Health Services - 3.0% | ||||||
111,000 | Aetna, Inc. | 8,999,880 | ||||
230,500 | Cardinal Health, Inc. | 15,803,080 | ||||
111,700 | UnitedHealth Group, Inc. | 9,131,475 | ||||
|
| �� | ||||
| 33,934,435 | ||||||
|
| |||||
Health Technology - 13.1% | ||||||
212,350 | Abbott Laboratories | 8,685,115 | ||||
95,700 | Becton Dickinson and Co. | 11,321,310 | ||||
203,650 | Bristol-Myers Squibb Co. | 9,879,062 | ||||
147,500 | Covidien, PLC | 13,301,550 | ||||
320,200 | Johnson & Johnson | 33,499,324 | ||||
271,000 | Medtronic, Inc. | 17,278,960 | ||||
321,575 | Merck & Co., Inc. | 18,603,114 | ||||
520,200 | Pfizer, Inc. | 15,439,536 | ||||
157,300 | St. Jude Medical, Inc. | 10,893,025 | ||||
97,200 | Stryker Corp. | 8,195,904 | ||||
|
| |||||
| 147,096,900 | ||||||
|
| |||||
Industrial Services - 3.2% | ||||||
105,850 | Fluor Corp. | 8,139,865 | ||||
99,100 | Halliburton Co. | 7,037,091 | ||||
57,500 | Helmerich & Payne, Inc. | 6,676,325 | ||||
109,300 | Oceaneering International, Inc. | 8,539,609 | ||||
133,800 | Seadrill, Ltd. | 5,345,310 | ||||
|
| |||||
| 35,738,200 | ||||||
|
| |||||
Process Industries - 3.0% | ||||||
201,400 | Archer-Daniels-Midland Co. | 8,883,754 | ||||
257,300 | International Paper Co. | 12,985,931 | ||||
115,200 | LyondellBasell Industries NV | 11,249,280 | ||||
|
| |||||
| 33,118,965 | ||||||
|
| |||||
See accompanying notes to financial statements. | ||||
14 | SIT MUTUAL FUNDS ANNUAL REPORT |
Quantity | Name of Issuer | Fair Value ($) | ||||
Producer Manufacturing - 11.0% | ||||||
82,325 | 3M Co. | 11,792,233 | ||||
52,000 | Caterpillar, Inc. | 5,650,840 | ||||
33,375 | Cummins, Inc. | 5,149,429 | ||||
121,450 | Delphi Automotive, PLC | 8,348,473 | ||||
156,500 | Eaton Corp., PLC | 12,078,670 | ||||
162,800 | Emerson Electric Co. | 10,803,408 | ||||
271,600 | Honeywell International, Inc. | 25,245,220 | ||||
52,900 | Lockheed Martin Corp. | 8,502,617 | ||||
278,850 | Tyco International, Ltd. | 12,715,560 | ||||
147,700 | United Technologies Corp. | 17,051,965 | ||||
21,165 | WW Grainger, Inc. | 5,381,625 | ||||
|
| |||||
| 122,720,040 | ||||||
|
| |||||
Retail Trade - 4.9% | ||||||
219,600 | CVS Caremark Corp. | 16,551,252 | ||||
213,550 | Home Depot, Inc. | 17,289,008 | ||||
199,800 | Macy’s, Inc. | 11,592,396 | ||||
185,800 | TJX Cos., Inc. | 9,875,270 | ||||
|
| |||||
| 55,307,926 | ||||||
|
| |||||
Technology Services - 5.1% | ||||||
155,300 | Accenture, PLC | 12,554,452 | ||||
124,150 | Automatic Data Processing, Inc. | 9,842,612 | ||||
671,375 | Microsoft Corp. | 27,996,337 | ||||
171,375 | Oracle Corp. | 6,945,829 | ||||
|
| |||||
| 57,339,230 | ||||||
|
| |||||
Transportation - 2.8% | ||||||
96,900 | Ryder System, Inc. | 8,535,921 | ||||
145,850 | Union Pacific Corp. | 14,548,537 | ||||
79,050 | United Parcel Service, Inc. | 8,115,273 | ||||
|
| |||||
| 31,199,731 | ||||||
|
| |||||
Quantity | Name of Issuer | Fair Value ($) | ||||
Utilities - 3.6% | ||||||
327,600 | Kinder Morgan, Inc. | 11,878,776 | ||||
117,680 | Laclede Group, Inc. | 5,713,364 | ||||
121,550 | NextEra Energy, Inc. | 12,456,444 | ||||
207,225 | Wisconsin Energy Corp. | 9,722,997 | ||||
|
| |||||
| 39,771,581 | ||||||
|
| |||||
Total Common Stocks | 1,091,407,985 | |||||
|
| |||||
Investment Companies - 1.8% | ||||||
357,100 | Kayne Anderson MLP Investment Co. | 14,073,311 | ||||
124,944 | Tortoise Energy Infrastructure Corp. | 6,178,501 | ||||
|
| |||||
Total Investment Companies | 20,251,812 | |||||
|
| |||||
Total Investments in Securities - 99.2% | 1,111,659,797 | |||||
Other Assets and Liabilities, net - 0.8% | 8,879,772 | |||||
|
| |||||
Total Net Assets - 100.0% | $ | 1,120,539,569 | ||||
|
| |||||
Numeric footnotes not disclosed are not applicable to this Schedule of Investments.
ADR — American Depositary Receipt
LLP — Limited Liability Company
MLP — Master Limited Partnership
PLC — Public Limited Company
A summary of the levels for the Fund’s investments as of June 30, 2014 is as follows (see Note 2 - significant accounting policies in the notes to financial statements):
| Investment in Securities | ||||||||||||
Level 1 Price ($) | Level 2 Other significant observable inputs ($) | Level 3 Significant | Total ($) | |||||||||
Common Stocks ** | 1,091,407,985 | — | — | 1,091,407,985 | ||||||||
Investment Companies | 20,251,812 | — | — | 20,251,812 | ||||||||
Total: | 1,111,659,797 | — | — | 1,111,659,797 | ||||||||
| ** | For equity securities categorized in a single level, refer to the Schedule of Investments for further breakdown. |
For the reporting period, there were no transfers between levels 1, 2 and 3.
See accompanying notes to financial statements. | ||
JUNE 30, 2014 |
15 |
Sit Global Dividend Growth Fund - Class I and Class S
|
OBJECTIVE & STRATEGY
The objective of the Global Dividend Growth Fund is to provide current income that exceeds the dividend yield of the MSCI World Index and that grows over a period of years. Secondarily, the Fund seeks long-term capital appreciation.
The Fund seeks to achieve its objectives by investing, under normal market conditions, at least 80% of its net assets in dividend-paying common stocks issued by U.S. and foreign companies. The Fund may invest the balance of its assets in preferred stocks, convertible bonds, and U.S. Treasury securities.
The Sit Global Dividend Growth Fund Class I trailed the MSCI World Index for the last twelve months, appreciating +16.76% versus a rise of +24.05% for the Index. The last twelve months can be described as a very volatile period. Generally, the non-dividend paying, smaller cap, and lower quality stocks outperformed in this market environment. The Fund’s high quality and dividend focus contributed to the underperformance over the last twelve-month period. Unlike the last fiscal year, the Fund’s meaningful underweight in Japanese securities significantly helped the portfolio on a relative basis; however, the negative stock selection in the United States and United Kingdom more than offset the positive relative contribution from Japan.
Geographically, the regions of Japan and Asia Pacific ex-Japan were the top contributing sectors on a relative basis. The significant underweight in Japan meaningfully added value while the slight underweight and positive stock selection in Asia Pacific ex-Japan contributed positively to relative performance. Conversely, stock selection in the United States and United Kingdom offset most of the positive relative performance.
On a sector basis, the energy (Seadrill, Marathon Petroleum, and Chevron), industrial (Komatsu, no longer held, and SGS), and utilities (Centrica, no longer held, and Kinder Morgan) were the largest detractors to relative performance.
The top five contributing stocks to the Fund’s relative performance were Avago Technologies, Covidien, Schlumberger, Cardinal Health, and BBVA. The five largest detractors to relative performance included: Verizon Communications, Centrica, Kinder Morgan, Syngenta, and McDonald’s Corporation.
The Fund continues to maintain a high quality bias as measured by historical dividend growth, free cash flow yield, earnings stability, return on invested capital, free cash flow margins and debt levels. Importantly, despite this high quality bias, the portfolio is attractively valued compared to the Index. Thematically, the Fund is positioned for acceleration in corporate capital spending, as companies appear to be investing more after several depressed years. The Fund’s largest sector overweights are in the industrial, health care, and consumer staples sectors. The Fund’s largest sector underweights are in the consumer discretionary and information technology sectors.
HYPOTHETICAL GROWTH OF $10,000
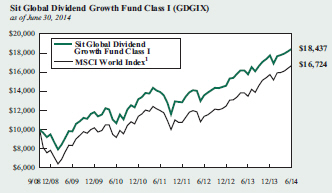
The chart above illustrates the total value of a hypothetical $10,000 investment in the Fund over the past 10 years (or for the life of the Fund if shorter) as compared to the performance of the MSCI World Index. Past performance does not guarantee future results. Returns include the reinvestment of distributions. The chart does not reflect the deduction of taxes that a shareholder would pay on Fund distributions or the redemption of Fund shares.
1 The MSCI World Index is a free float-adjusted market capitalization weighted index that is designed to measure the equity market performance of developed markets. It is not possible to invest directly in an index. This is the Fund’s primary index.
We believe the focus on companies with strong operational and financial characteristics will generate solid and predictable earnings along with growing dividends, and thus should reward shareholders over the longer term. The Fund emphasizes high quality, dividend paying growth stocks and continues to be well diversified. While the Fund is participating in the market upside, we believe the portfolio is adequately positioned to outperform in down markets when volatility eventually returns to the equity markets. Finally, over the past twelve months, dividend increases continue with nearly 95% (76 out of 80) of the companies within the Fund increasing their dividends over the period. The average dividend increase was 12.7%.
Roger J. Sit Raymond E. Sit Tasha M. Murdoff
Kent L. Johnson Michael J. Stellmacher
Portfolio Managers
Information on this page is unaudited. | ||
16 | SIT MUTUAL FUNDS ANNUAL REPORT | |
|
COMPARATIVE RATES OF RETURNS
as of June 30, 2014
Sit Global Dividend Growth Fund | MSCI World Index 1 | |||||||||||
| Class I | Class S | |||||||||||
One Year | 16.76% | 16.49% | 24.05% | |||||||||
Five Year | 13.49 | 13.19 | 14.99 | |||||||||
Since Inception (9/30/ 08) | 11.22 | 10.95 | 9.35 | |||||||||
Performance figures are historical and do not guarantee future results. Investment returns and principal value will vary, and you may have a gain or loss when you sell shares. Current performance may be lower or higher than the performance data quoted. Contact the Fund for performance data current to the most recent month-end. Returns include changes in share price as well as reinvestment of all dividends and capital gains. Returns do not reflect the deduction of the 2% redemption fee imposed if shares are redeemed or exchanged within 30 calendar days from their date of purchase. If imposed, the fee would reduce the performance quoted. Returns do not reflect the deduction of taxes that a shareholder would pay on Fund distributions or the redemption of Fund shares. Management fees and administrative expenses are included in the Fund’s performance. Returns for periods greater than one year are compounded average annual rates of return.
1 The MSCI World Index is a free float-adjusted market capitalization weighted index that is designed to measure the equity market performance of developed markets. It is not possible to invest directly in an index.
PORTFOLIO SUMMARY
| Class I: | ||
Net Asset Value 6/30/14: | $ 15.74 Per Share | |
Net Asset Value 6/30/13: | $ 14.27 Per Share | |
Total Net Assets: | $ 21.5 Million | |
| Class S: | ||
Net Asset Value 6/30/14: | $ 15.72 Per Share | |
Net Asset Value 6/30/13: | $ 14.25 Per Share | |
Total Net Assets: | $ 3.3 Million | |
Weighted Average Market Cap: | $ 97.0 Billion | |
TOP 10 HOLDINGS
1. Johnson & Johnson
2. Chrevron Corp.
3. SGS SA
4. Diageo, PLC, ADR
5. GlaxoSmithKline, PLC, ADR
6. Schlumberger, Ltd.
7. Adecco SA
8. Seven & I Holdings Co., Ltd.
9. Nestle SA
10. JPMorgan Chase & Co.
Based on total net assets as of June 30, 2014. Subject to change.
FUND DIVERSIFICATION
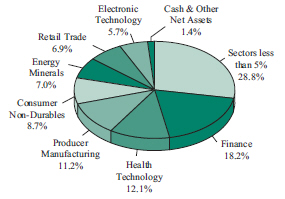
Based on total net assets as of June 30, 2014. Subject to change.
Information on this page is unaudited. | ||
JUNE 30, 2014 |
17 |
SCHEDULE OF INVESTMENTS
June 30, 2014
Sit Global Dividend Growth Fund
Quantity | Name of Issuer | Fair Value ($) | ||||
Common Stocks - 97.6% | ||||||
Asia - 6.7% | ||||||
Australia - 2.5% | ||||||
4,700 | BHP Billiton, Ltd., ADR | 321,715 | ||||
9,150 | Westpac Banking Corp., ADR | 293,898 | ||||
|
| |||||
| 615,613 | ||||||
|
| |||||
China/Hong Kong - 0.9% | ||||||
4,500 | HSBC Holdings, PLC, ADR | 228,600 | ||||
|
| |||||
Japan - 1.8% | ||||||
10,800 | Seven & I Holdings Co., Ltd. | 455,218 | ||||
|
| |||||
Singapore - 1.5% | ||||||
5,100 | Avago Technologies, Ltd. | 367,557 | ||||
|
| |||||
Europe - 35.5% | ||||||
France - 4.1% | ||||||
5,120 | BNP Paribas SA | 347,949 | ||||
6,600 | GDF Suez | 181,840 | ||||
4,125 | Schlumberger, Ltd. | 486,544 | ||||
|
| |||||
| 1,016,333 | ||||||
|
| |||||
Germany - 3.0% | ||||||
2,600 | Allianz SE | 433,976 | ||||
2,400 | Siemens AG | 316,882 | ||||
|
| |||||
| 750,858 | ||||||
|
| |||||
Ireland - 3.7% | ||||||
3,500 | Accenture, PLC | 282,940 | �� | |||
4,800 | Covidien, PLC | 432,864 | ||||
2,425 | Eaton Corp., PLC | 187,161 | ||||
|
| |||||
| 902,965 | ||||||
|
| |||||
Italy - 2.6% | ||||||
13,415 | Azimut Holding SpA | 345,317 | ||||
11,200 | Eni SpA | 306,316 | ||||
|
| |||||
| 651,633 | ||||||
|
| |||||
Netherlands - 0.9% | ||||||
2,300 | LyondellBasell Industries NV | 224,595 | ||||
|
| |||||
Norway - 1.2% | ||||||
7,100 | Seadrill, Ltd. | 283,645 | ||||
|
| |||||
Spain - 3.2% | ||||||
33,300 | Banco Bilbao Vizcaya Argentaria SA, ADR | 425,241 | ||||
2,400 | Inditex SA | 369,372 | ||||
|
| |||||
| 794,613 | ||||||
|
| |||||
Switzerland - 7.4% | ||||||
1,200 | ACE, Ltd. | 124,440 | ||||
5,615 | Adecco SA | 462,080 | ||||
5,810 | Nestle SA | 450,199 | ||||
235 | SGS SA | 562,337 | ||||
3,250 | Syngenta AG, ADR | 243,100 | ||||
|
| |||||
| 1,842,156 | ||||||
|
| |||||
Quantity | Name of Issuer | Fair Value ($) | ||||
United Kingdom - 9.4% | ||||||
67,500 | Barclays, PLC | 245,886 | ||||
15,930 | Burberry Group, PLC | 404,318 | ||||
4,500 | Delphi Automotive, PLC | 309,330 | ||||
4,150 | Diageo, PLC, ADR | 528,171 | ||||
66,640 | DS Smith, PLC | 315,578 | ||||
9,700 | GlaxoSmithKline, PLC, ADR | 518,756 | ||||
|
| |||||
| 2,322,039 | ||||||
|
| |||||
North America - 55.4% | ||||||
Canada - 1.4% | ||||||
8,000 | Suncor Energy, Inc. | 341,040 | ||||
|
| |||||
United States - 54.0% | ||||||
2,000 | 3M Co. | 286,480 | ||||
2,000 | Ameriprise Financial, Inc. | 240,000 | ||||
4,200 | Apple, Inc. | 390,306 | ||||
5,300 | Arthur J Gallagher & Co. | 246,980 | ||||
2,850 | Automatic Data Processing, Inc. | 225,948 | ||||
4,800 | Bristol-Myers Squibb Co. | 232,848 | ||||
5,700 | Cardinal Health, Inc. | 390,792 | ||||
1,650 | Caterpillar, Inc. | 179,306 | ||||
4,600 | Chevron Corp. | 600,530 | ||||
1,225 | Cummins, Inc. | 189,005 | ||||
4,700 | CVS Caremark Corp. | 354,239 | ||||
4,825 | Discover Financial Services | 299,054 | ||||
3,775 | Emerson Electric Co. | 250,509 | ||||
3,150 | Franklin Resources, Inc. | 182,196 | ||||
900 | Goldman Sachs Group, Inc. | 150,696 | ||||
3,800 | Home Depot, Inc. | 307,648 | ||||
4,500 | Honeywell International, Inc. | 418,275 | ||||
6,300 | Intel Corp. | 194,670 | ||||
1,050 | International Business Machines Corp. | 190,334 | ||||
7,500 | International Paper Co. | 378,525 | ||||
5,800 | Johnson & Johnson | 606,796 | ||||
7,800 | JPMorgan Chase & Co. | 449,436 | ||||
7,250 | Kinder Morgan, Inc. | 262,885 | ||||
1,125 | Lockheed Martin Corp. | 180,821 | ||||
3,000 | Marathon Petroleum Corp. | 234,210 | ||||
4,600 | Marsh & McLennan Cos., Inc. | 238,372 | ||||
1,750 | McDonald’s Corp. | 176,295 | ||||
6,900 | Medtronic, Inc. | 439,944 | ||||
5,400 | Merck & Co., Inc. | 312,390 | ||||
5,600 | Microsoft Corp. | 233,520 | ||||
1,950 | Moody’s Corp. | 170,937 | ||||
3,300 | NIKE, Inc. | 255,915 | ||||
2,500 | Occidental Petroleum Corp. | 256,575 | ||||
4,000 | PepsiCo, Inc. | 357,360 | ||||
6,300 | Pfizer, Inc. | 186,984 | ||||
2,800 | Philip Morris International, Inc. | 236,068 | ||||
4,175 | Procter & Gamble Co. | 328,113 | ||||
3,400 | Qualcomm, Inc. | 269,280 | ||||
1,525 | Snap-On, Inc. | 180,743 | ||||
See accompanying notes to financial statements. | ||||
18 | SIT MUTUAL FUNDS ANNUAL REPORT |
Quantity | Name of Issuer | Fair Value ($) | ||||
3,800 | St. Jude Medical, Inc. | 263,150 | ||||
3,525 | Time Warner, Inc. | 247,631 | ||||
3,350 | TJX Cos., Inc. | 178,053 | ||||
2,400 | Union Pacific Corp. | 239,400 | ||||
2,300 | United Parcel Service, Inc. | 236,118 | ||||
2,550 | United Technologies Corp. | 294,398 | ||||
5,800 | US Bancorp | 251,256 | ||||
8,500 | Verizon Communications, Inc. | 415,905 | ||||
675 | WW Grainger, Inc. | 171,632 | ||||
|
| |||||
| 13,382,528 | ||||||
|
| |||||
Total Common Stocks | 24,179,393 | |||||
|
| |||||
Investment Companies - 1.0% | ||||||
6,400 | Kayne Anderson MLP Investment Co. | 252,224 | ||||
|
| |||||
(cost: $193,488) | ||||||
Total Investments in Securities - 98.6% | 24,431,617 | |||||
Other Assets and Liabilities, net - 1.4% | 358,709 | |||||
|
| |||||
Total Net Assets - 100.0% | $24,790,326 | |||||
|
| |||||
Numeric footnotes not disclosed are not applicable to this Schedule of Investments
ADR — American Depositary Receipt
MLP — Master Limited Partnership
PLC — Public Limited Company
See accompanying notes to financial statements. | ||
JUNE 30, 2014 |
19 |
SCHEDULE OF INVESTMENTS
June 30, 2014
Sit Global Dividend Growth Fund (Continued)
A summary of the levels for the Fund’s investments as of June 30, 2014 is as follows (see Note 2 - significant accounting policies in the notes to financial statements):
| Investment in Securities | ||||||||||||||
Level 1 Quoted | Level 2 Other significant | Level 3 Significant unobservable inputs ($) | Total ($) | |||||||||||
Common Stocks | ||||||||||||||
Australia | 615,613 | — | — | 615,613 | ||||||||||
Canada | 341,040 | — | — | 341,040 | ||||||||||
China/Hong Kong | 228,600 | — | — | 228,600 | ||||||||||
France | 486,544 | 529,789 | — | 1,016,333 | ||||||||||
Germany | — | 750,858 | — | 750,858 | ||||||||||
Ireland | 902,965 | — | — | 902,965 | ||||||||||
Italy | — | 651,633 | — | 651,633 | ||||||||||
Japan | — | 455,218 | — | 455,218 | ||||||||||
Netherlands | 224,595 | — | — | 224,595 | ||||||||||
Norway | 283,645 | — | — | 283,645 | ||||||||||
Singapore | 367,557 | — | — | 367,557 | ||||||||||
Spain | 425,241 | 369,372 | — | 794,613 | ||||||||||
Switzerland | 367,540 | 1,474,616 | — | 1,842,156 | ||||||||||
United Kingdom | 1,356,257 | 965,782 | — | 2,322,039 | ||||||||||
United States | 13,382,528 | — | — | 13,382,528 | ||||||||||
| 18,982,125 | 5,197,268 | — | 24,179,393 | |||||||||||
Investment Companies | 252,224 | — | — | 252,224 | ||||||||||
Total: | 19,234,349 | 5,197,268 | — | 24,431,617 | ||||||||||
The Fund adjusts the closing price of foreign equity securities by applying a systematic process for events occurring after the close of the foreign exchanges. At each reporting period, this process is applied for all foreign securities and therefore all foreign securities are classified as level 2. There are no transfers between level 1 and level 2 between reporting periods as a result of applying this process. Level 1 securities of foreign issuers are primarily American Depositary Receipts (ADRs) or Global Depositary Receipts (GDRs). There were no transfers into or out of level 3 during the reporting period.
See accompanying notes to financial statements. | ||||
20 | SIT MUTUAL FUNDS ANNUAL REPORT |
[This page intentionally left blank.]
JUNE 30, 2014 |
21 |
|
OBJECTIVE & STRATEGY
The objective of the Large Cap Growth Fund is to maximize long-term capital appreciation. The Fund pursues this objective by investing at least 80% of its net assets in the common stocks of domestic growth companies with capitalizations of $5 billion or more at the time of purchase.
The Sit Large Cap Growth Fund’s one-year return was +22.92%, compared to the +26.92% return for the Russell 1000® Growth Index.
U.S. stocks overcame sluggish economic activity and a moderation in corporate earnings growth to post exceptional gains over the past twelve months. Although we believe stocks can move higher from here, we caution investors not to extrapolate the strong recent returns into the future for three key reasons. First, stock valuations (i.e., P/E ratios) are now “fair” in our view, given the sharp increase in prices in recent months. Second, corporate earnings growth will likely be rather subdued based on our economic forecasts and the fact that profit margins are already at record highs. And, finally, investors may become concerned over a somewhat less accommodative Federal Reserve, as it begins to pull back on its quantitative easing (QE) program in the coming months. In terms of our investment strategy, we continue to focus on high-quality, large capitalization growth companies that are able to generate earnings growth even in a sluggish economy. Importantly, we believe this focus on quality and portfolio diversification will offer investors some downside protection when volatility eventually returns to the equity markets.
Relative to the Russell 1000® Growth Index, performance over the past year was negatively impacted by stock selection in the retail trade, technology services and consumer services sectors. Laggards in these sectors included Dick’s Sporting Goods, Target, Teradata and Sirius XM. In addition, performance was hurt by the absence of Facebook within the Fund, which is a large weight within the Russell 1000® Growth Index and rose +170% over the period. On the positive side, strong stock selection in the health technology, health services and commercial services sectors aided performance over the past twelve months. Allergan, Covidien, Gilead Sciences, McKesson and Robert Half International were among the key outperformers in these sectors, with each stock posting a total return of +45% or greater over the period.
HYPOTHETICAL GROWTH OF $10,000
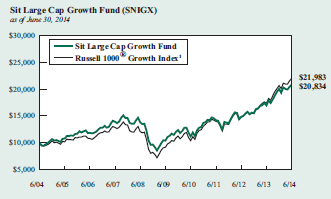
The chart above illustrates the total value of a hypothetical $10,000 investment in the Fund over the past 10 years as compared to the performance of the Russell 1000® Growth Index. Past performance does not guarantee future results. Returns include the reinvestment of distributions. The chart does not reflect the deduction of taxes that a shareholder would pay on Fund distributions or the redemption of Fund shares.
1 Russell 1000® Growth Index is an unmanaged index that measures the performance of those Russell 1000 Index companies with higher price-to-book ratios and higher forecasted growth values. It is not possible to invest directly in an index. This is the Fund’s primary index.
Our research staff remains focused on well-managed companies with strong business fundamental and attractive valuations. We continue to be optimistic on the outlook for companies held in the Fund. The single best performing stock over the period was 3D Systems (+96% six-month gain), while Broadcom (-20%) was the Fund’s worst performer.
We remain enthusiastic about the long-term outlook for companies held in the Fund, based on attractive valuations and sustainable earnings growth potential.
Roger J. Sit
Ronald D. Sit
Michael J. Stellmacher
Portfolio Managers
| Information on this page is unaudited. | ||
22 | SIT MUTUAL FUNDS ANNUAL REPORT | |
|
COMPARATIVE RATES OF RETURNS
as of June 30, 2014
| Sit Large Cap Growth Fund | Russell 1000® Growth Index 1 | Russell 1000® Index 2 | ||||||||||
One Year | 22.92 | % | 26.92 | % | 25.35 | % | ||||||
Five Year | 14.97 | 19.24 | 19.25 | |||||||||
Ten Year | 7.62 | 8.20 | 8.19 | |||||||||
Since Inception 3 (9/2/82) | 10.02 | 11.13 | 12.01 | |||||||||
Performance figures are historical and do not guarantee future results. Investment returns and principal value will vary, and you may have a gain or loss when you sell shares. Current performance may be lower or higher than the performance data quoted. Contact the Fund for performance data current to the most recent month-end. Returns include changes in share price as well as reinvestment of all dividends and capital gains. Returns do not reflect the deduction of the 2% redemption fee imposed if shares are redeemed or exchanged within 30 calendar days from their date of purchase. If imposed, the fee would reduce the performance quoted. Returns do not reflect the deduction of taxes that a shareholder would pay on Fund distributions or the redemption of Fund shares. Management fees and administrative expenses are included in the Fund’s performance. Returns for periods greater than one year are compounded average annual rates of return.
1 Russell 1000® Growth Index is an unmanaged index that measures the performance of those Russell 1000 Index companies with higher price-to-book ratios and higher forecasted growth values. It is not possible to invest directly in an index.
2 Russell 1000® Index is an unmanaged index that measures the performance of approximately 1,000 of the largest U.S. companies by market capitalization.
3 On 6/6/93, the Fund’s investment objective changed to allow for a portfolio of 100% stocks. Prior to that time, the portfolio was required to contain no more than 80% stocks.
PORTFOLIO SUMMARY
Net Asset Value 6/30/14: | $52.51 Per Share | |
Net Asset Value 6/30/13: | $47.53 Per Share | |
Total Net Assets: | $188.6 Million | |
Weighted Average Market Cap: | $105.5 Billion |
TOP 10 HOLDINGS
1. Google, Inc.
2. Apple, Inc.
3. Microsoft Corp.
4. Visa, Inc.
5. Gilead Sciences, Inc.
6. PepsiCo, Inc.
7. Schlumberger, Ltd.
8. Home Depot, Inc.
9. Ecolab, Inc.
10. priceline.com, Inc.
Based on total net assets as of June 30, 2014. Subject to change.
FUND DIVERSIFICATION
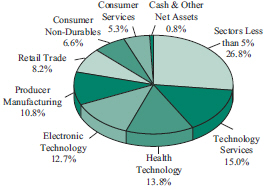
Based on total net assets as of June 30, 2014. Subject to change.
| Information on this page is unaudited. | ||
JUNE 30, 2014 | 23 | |
SCHEDULE OF INVESTMENTS
June 30, 2014
Sit Large Cap Growth Fund
Quantity | Name of Issuer | Fair Value ($) | ||||
Common Stocks - 99.2% | ||||||
Commercial Services - 1.5% | ||||||
17,100 | Equifax, Inc. | 1,240,434 | ||||
35,100 | Robert Half International, Inc. | 1,675,674 | ||||
|
| |||||
| 2,916,108 | ||||||
|
| |||||
Communications - 2.8% | ||||||
18,700 | SBA Communications Corp. * | 1,913,010 | ||||
67,300 | Verizon Communications, Inc. | 3,292,989 | ||||
|
| |||||
| 5,205,999 | ||||||
|
| |||||
Consumer Durables - 0.8% | ||||||
11,900 | Polaris Industries, Inc. | 1,549,856 | ||||
|
| |||||
Consumer Non-Durables - 6.6% | ||||||
23,900 | Michael Kors Holdings, Ltd. * | 2,118,735 | ||||
27,500 | NIKE, Inc. | 2,132,625 | ||||
45,000 | PepsiCo, Inc. | 4,020,300 | ||||
18,600 | Philip Morris International, Inc. | 1,568,166 | ||||
34,200 | Procter & Gamble Co. | 2,687,778 | ||||
|
| |||||
| 12,527,604 | ||||||
|
| |||||
Consumer Services - 5.3% | ||||||
26,200 | Starbucks Corp. | 2,027,356 | ||||
22,075 | Time Warner, Inc. | 1,550,769 | ||||
54,300 | Twenty-First Century Fox, Inc. | 1,908,645 | ||||
21,000 | Visa, Inc. | 4,424,910 | ||||
|
| |||||
| 9,911,680 | ||||||
|
| |||||
Electronic Technology - 12.7% | ||||||
29,900 | 3D Systems Corp. * | 1,788,020 | ||||
80,675 | Apple, Inc. | 7,497,128 | ||||
94,800 | Applied Materials, Inc. | 2,137,740 | ||||
26,900 | Avago Technologies, Ltd. | 1,938,683 | ||||
91,400 | Ciena Corp. * | 1,979,724 | ||||
58,600 | EMC Corp. | 1,543,524 | ||||
63,300 | Intel Corp. | 1,955,970 | ||||
10,400 | International Business Machines Corp. | 1,885,208 | ||||
41,500 | Qualcomm, Inc. | 3,286,800 | ||||
|
| |||||
| 24,012,797 | ||||||
|
| |||||
Energy Minerals - 4.1% | ||||||
8,500 | Chevron Corp. | 1,109,675 | ||||
15,100 | Continental Resources, Inc. * | 2,386,404 | ||||
18,900 | Gulfport Energy Corp. * | 1,186,920 | ||||
15,830 | Marathon Petroleum Corp. | 1,235,848 | ||||
16,800 | Occidental Petroleum Corp. | 1,724,184 | ||||
|
| |||||
| 7,643,031 | ||||||
|
| |||||
Finance - 4.1% | ||||||
27,200 | Franklin Resources, Inc. | 1,573,248 | ||||
9,300 | Goldman Sachs Group, Inc. | 1,557,192 | ||||
35,700 | JPMorgan Chase & Co. | 2,057,034 | ||||
Quantity | Name of Issuer | Fair Value ($) | ||||
21,400 | Marsh & McLennan Cos., Inc. | 1,108,948 | ||||
17,400 | T Rowe Price Group, Inc. | 1,468,734 | ||||
|
| |||||
| 7,765,156 | ||||||
|
| |||||
Health Services - 4.7% | ||||||
15,400 | Aetna, Inc. | 1,248,632 | ||||
22,800 | Express Scripts Holding Co. * | 1,580,724 | ||||
14,600 | HCA Holdings, Inc. * | 823,148 | ||||
11,900 | McKesson Corp. | 2,215,899 | ||||
36,000 | UnitedHealth Group, Inc. | 2,943,000 | ||||
|
| |||||
| 8,811,403 | ||||||
|
| |||||
Health Technology - 13.8% | ||||||
8,500 | Actavis, PLC * | 1,895,925 | ||||
9,700 | Alexion Pharmaceuticals, Inc. * | 1,515,625 | ||||
14,600 | Allergan, Inc. | 2,470,612 | ||||
28,800 | Bristol-Myers Squibb Co. | 1,397,088 | ||||
25,600 | Celgene Corp. * | 2,198,528 | ||||
32,500 | Covidien, PLC | 2,930,850 | ||||
50,900 | Gilead Sciences, Inc. * | 4,220,119 | ||||
18,800 | Johnson & Johnson | 1,966,856 | ||||
29,300 | Medtronic, Inc. | 1,868,168 | ||||
20,200 | Mylan, Inc./PA * | 1,041,512 | ||||
2,600 | Regeneron Pharmaceuticals, Inc. * | 734,422 | ||||
29,900 | St. Jude Medical, Inc. | 2,070,575 | ||||
15,000 | Thermo Fisher Scientific, Inc. | 1,770,000 | ||||
|
| |||||
| 26,080,280 | ||||||
|
| |||||
Industrial Services - 2.5% | ||||||
15,400 | Fluor Corp. | 1,184,260 | ||||
29,700 | Schlumberger, Ltd. | 3,503,115 | ||||
|
| |||||
| 4,687,375 | ||||||
|
| |||||
Process Industries - 3.8% | ||||||
4,700 | CF Industries Holdings, Inc. | 1,130,491 | ||||
29,900 | Ecolab, Inc. | 3,329,066 | ||||
24,400 | International Paper Co. | 1,231,468 | ||||
10,900 | Praxair, Inc. | 1,447,956 | ||||
|
| |||||
| 7,138,981 | ||||||
|
| |||||
Producer Manufacturing - 10.8% | ||||||
14,800 | 3M Co. | 2,119,952 | ||||
5,500 | Caterpillar, Inc. | 597,685 | ||||
4,800 | Cummins, Inc. | 740,592 | ||||
35,500 | Danaher Corp. | 2,794,915 | ||||
18,500 | Delphi Automotive, PLC | 1,271,690 | ||||
25,400 | Eaton Corp., PLC | 1,960,372 | ||||
22,400 | Emerson Electric Co. | 1,486,464 | ||||
15,200 | Flowserve Corp. | 1,130,120 | ||||
29,200 | Honeywell International, Inc. | 2,714,140 | ||||
5,800 | Precision Castparts Corp. | 1,463,920 | ||||
37,600 | Trinity Industries, Inc. | 1,643,872 | ||||
See accompanying notes to financial statements. | ||||
24 | SIT MUTUAL FUNDS ANNUAL REPORT |
Quantity | Name of Issuer | Fair Value ($) | ||||
21,100 | United Technologies Corp. | 2,435,995 | ||||
|
| |||||
| 20,359,717 | ||||||
|
| |||||
Retail Trade - 8.2% |
| |||||
6,800 | Amazon.com, Inc. * | 2,208,504 | ||||
43,100 | CVS Caremark Corp. | 3,248,447 | ||||
33,500 | Dick’s Sporting Goods, Inc. | 1,559,760 | ||||
30,700 | eBay, Inc. * | 1,536,842 | ||||
42,300 | Home Depot, Inc. | 3,424,608 | ||||
20,900 | Target Corp. | 1,211,155 | ||||
41,900 | TJX Cos., Inc. | 2,226,985 | ||||
|
| |||||
| 15,416,301 | ||||||
|
| |||||
Technology Services - 15.0% |
| |||||
38,400 | Accenture, PLC | 3,104,256 | ||||
29,500 | Adobe Systems, Inc. * | 2,134,620 | ||||
14,400 | ANSYS, Inc. * | 1,091,808 | ||||
46,800 | Cognizant Technology Solutions Corp. * | 2,288,988 | ||||
6,800 | Google, Inc.-Class A * | 3,975,756 | ||||
6,800 | Google, Inc.-Class C * | 3,911,904 | ||||
23,900 | Informatica Corp. * | 852,035 | ||||
108,600 | Microsoft Corp. | 4,528,620 | ||||
76,800 | Oracle Corp. | 3,112,704 | ||||
2,750 | priceline.com, Inc. * | 3,308,250 | ||||
|
| |||||
| 28,308,941 | ||||||
|
| |||||
Quantity | Name of Issuer | Fair Value ($) | ||||
Transportation - 2.5% | ||||||
31,200 | Union Pacific Corp. | 3,112,200 | ||||
15,400 | United Parcel Service, Inc. | 1,580,964 | ||||
|
| |||||
| 4,693,164 | ||||||
|
| |||||
Total Common Stocks | 187,028,393 | |||||
|
| |||||
Total Investments in Securities - 99.2% | 187,028,393 | |||||
|
| |||||
Other Assets and Liabilities, net - 0.8% | 1,545,570 | |||||
|
| |||||
Total Net Assets - 100.0% | $ | 188,573,963 | ||||
|
| |||||
| * | Non-income producing security. |
Numeric footnotes not disclosed are not applicable to this Schedule of Investments.
PLC — Public Limited Company
A summary of the levels for the Fund’s investments as of June 30, 2014 is as follows (see Note 2 - significant accounting policies in the notes to financial statements):
| Investment in Securities | ||||||||||||||
| Level 1 Quoted Price ($) | Level 2 Other significant observable inputs ($) | Level 3 Significant unobservable inputs ($) | Total ($) | |||||||||||
Common Stocks ** | 187,028,393 | — | — | 187,028,393 | ||||||||||
Total: | 187,028,393 | — | — | 187,028,393 | ||||||||||
| ** | For equity securities categorized in a single level, refer to the Schedule of Investments for further breakdown. |
For the reporting period, there were no transfers between levels 1, 2 and 3.
See accompanying notes to financial statements.
JUNE 30, 2014 |
25 |
|
OBJECTIVE & STRATEGY
The objective of the Sit Mid Cap Growth Fund is to maximize long-term capital appreciation. The Fund pursues this objective by investing at least 80% of its net assets in the common stocks of growth companies with capitalizations of $2 billion to $15 billion at the time of purchase.
The Sit Mid Cap Growth Fund’s twelve-month return was +25.58%, compared to +26.04% for the Russell MidCap® Growth Index. The Russell MidCap® Index advanced +26.85% during the period.
Stocks posted very strong gains over the past year, driven by a confluence of factors including surging mergers and acquisitions activity and the continuation of highly accommodative Federal Reserve monetary policy. And, while the strong market gains over the past year are not likely to be repeated in the year ahead, we believe stocks will probably grind higher, even though the economic backdrop will make it difficult for corporate earnings growth to reaccelerate. In this environment, our research focus remains on companies that can generate above average earnings growth, while having some “defensive” characteristics, such as strong balance sheets and free cash flow generation. In this regard, we are currently finding the most attractive opportunities in the producer manufacturing, health technology and finance sectors, which are the most heavily weighted groups within the Fund at the present time. In contrast, slow growth sectors, such as utilities, communications and non-energy minerals, have minimal weightings.
The Fund’s strong return over the past twelve months came very close to matching that of the Russell MidCap® Growth Index, although there we some notable variances in sector performance. The Fund’s one-year relative performance was positively impacted by stock selection in the consumer non-durables, electronic technology and finance sectors. Strong individual performers in these in these sectors included Iconix Brand Group, Skyworks Solutions, Avago Technologies, Ameriprise Financial and Signature Bank. These positives were largely offset by negative stock selection in the retail trade sector, as the Fund’s positions in Lululemon Athletica and Dick’s Sporting Goods detracted from returns during the period. Our research effort is high-
HYPOTHETICAL GROWTH OF $10,000
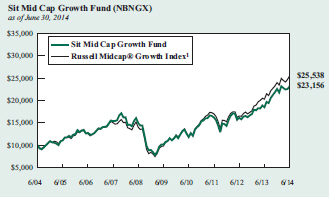
The chart above illustrates the total value of a hypothetical $10,000 investment in the Fund over the past 10 years as compared to the performance of the Russell Midcap® Growth Index. Past performance does not guarantee future results. Returns include the reinvestment of distributions. The chart does not reflect the deduction of taxes that a shareholder would pay on Fund distributions or the redemption of Fund shares.
1 Russell Midcap® Growth Index is an unmanaged index that measures the performance of those Russell Midcap Index companies with higher price-to-book ratios and higher forecasted growth values. It is not possible to invest directly in an index. This is the Fund’s primary index.
ly focused on companies with strong, experienced management teams, sound balance sheets, and sustainable earnings growth potential. We strongly believe that this focus will reward our shareholders over time. We continue to appreciate your interest in the Fund.
Roger J. Sit
Kent L. Johnson
Robert W. Sit
Portfolio Managers
| Information on this page is unaudited. | ||
26 | SIT MUTUAL FUNDS ANNUAL REPORT | |
|
COMPARATIVE RATES OF RETURNS
as of June 30, 2014
Sit Mid Cap | Russell Midcap® Growth Index 1 | Russell Midcap® Index 2 | |||||||||||||
One Year | 25.58 | % | 26.04 | % | 26.85 | % | |||||||||
Five Year | 18.07 | 21.16 | 22.07 | ||||||||||||
Ten Year | 8.76 | 9.83 | 10.43 | ||||||||||||
Since Inception (9/2/82) | 12.12 | n/a | n/a | ||||||||||||
Performance figures are historical and do not guarantee future results. Investment returns and principal value will vary, and you may have a gain or loss when you sell shares. Current performance may be lower or higher than the performance data quoted. Contact the Fund for performance data current to the most recent month-end. Returns include changes in share price as well as reinvestment of all dividends and capital gains and all fee waivers. Without the fee waivers total return and yield figures would have been lower. Returns do not reflect the deduction of the 2% redemption fee imposed if shares are redeemed or exchanged within 30 calendar days from their date of purchase. If imposed, the fee would reduce the performance quoted. Returns do not reflect the deduction of taxes that a shareholder would pay on Fund distributions or the redemption of Fund shares. Management fees and administrative expenses are included in the Fund’s performance. Returns for periods greater than one year are compounded average annual rates of return.
1 Russell Midcap® Growth Index is an unmanaged index that measures the performance of those Russell Midcap Index companies with higher price-to-book ratios and higher forecasted growth values. It is not possible to invest directly in an index.
2 Russell Midcap® Index is an unmanaged index that measures the performance of approximately 800 of the smallest companies in the Russell 1000® Index.
PORTFOLIO SUMMARY
Net Asset Value 6/30/14: | $21.08 Per Share | |
Net Asset Value 6/30/13: | $17.69 Per Share | |
Total Net Assets: | $180.3 Million | |
Weighted Average Market Cap: | $17.8 Billion |
TOP 10 HOLDINGS
1. Skyworks Solutions, Inc.
2. Ecolab, Inc.
3. Iconix Brand Group, Inc.
4. priceline.com, Inc.
5. TJX Cos., Inc.
6. Chipotle Mexican Grill, Inc.
7. Macy’s, Inc.
8. Allergan, Inc.
9. Dunkin’ Brands Group, Inc.
10. Ameriprise Financial, Inc.
Based on total net assets as of June 30, 2014. Subject to change.
FUND DIVERSIFICATION
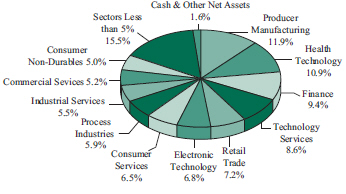
Based on total net assets as of June 30, 2014. Subject to change.
| Information on this page is unaudited. | ||
JUNE 30, 2014 | 27 | |
SCHEDULE OF INVESTMENTS
June 30, 2014
Sit Mid Cap Growth Fund
Quantity | Name of Issuer | Fair Value ($) | ||||
Common Stocks - 98.4% |
| |||||
Commercial Services - 5.2% | ||||||
59,100 | Cardtronics, Inc. * | 2,014,128 | ||||
15,700 | Equifax, Inc. | 1,138,878 | ||||
19,100 | Moody’s Corp. | 1,674,306 | ||||
31,200 | Nielsen Holdings NV | 1,510,392 | ||||
31,500 | Robert Half International, Inc. | 1,503,810 | ||||
13,900 | Towers Watson & Co. | 1,448,797 | ||||
|
| |||||
| 9,290,311 | ||||||
|
| |||||
Communications - 1.1% | ||||||
19,500 | SBA Communications Corp. * | 1,994,850 | ||||
|
| |||||
Consumer Durables - 2.7% | ||||||
15,900 | Polaris Industries, Inc. | 2,070,816 | ||||
23,600 | Snap-On, Inc. | 2,797,072 | ||||
|
| |||||
| 4,867,888 | ||||||
|
| |||||
Consumer Non-Durables - 5.0% | ||||||
52,200 | Coca-Cola Enterprises, Inc. | 2,494,116 | ||||
5,500 | G-III Apparel Group, Ltd. * | 449,130 | ||||
82,300 | Iconix Brand Group, Inc. * | 3,533,962 | ||||
28,900 | Michael Kors Holdings, Ltd. * | 2,561,985 | ||||
|
| |||||
| 9,039,193 | ||||||
|
| |||||
Consumer Services - 6.5% | ||||||
22,900 | AMC Networks, Inc. * | 1,408,121 | ||||
5,300 | Chipotle Mexican Grill, Inc. * | 3,140,303 | ||||
67,100 | Dunkin’ Brands Group, Inc. | 3,073,851 | ||||
53,600 | Lions Gate Entertainment Corp. | 1,531,888 | ||||
39,532 | Marriott International, Inc. | 2,534,001 | ||||
|
| |||||
| 11,688,164 | ||||||
|
| |||||
Electronic Technology - 6.8% | ||||||
26,600 | 3D Systems Corp. * | 1,590,680 | ||||
38,600 | Avago Technologies, Ltd. | 2,781,902 | ||||
102,400 | Ciena Corp. * | 2,217,984 | ||||
11,100 | F5 Networks, Inc. * | 1,236,984 | ||||
80,800 | Skyworks Solutions, Inc. | 3,794,368 | ||||
15,100 | Xilinx, Inc. | 714,381 | ||||
|
| |||||
| 12,336,299 | ||||||
|
| |||||
Energy Minerals - 4.3% | ||||||
12,700 | Continental Resources, Inc. * | 2,007,108 | ||||
44,700 | Gulfport Energy Corp. * | 2,807,160 | ||||
25,405 | Marathon Petroleum Corp. | 1,983,368 | ||||
20,400 | Southwestern Energy Co. * | 927,996 | ||||
|
| |||||
| 7,725,632 | ||||||
|
| |||||
Finance - 9.4% | ||||||
13,000 | Affiliated Managers Group, Inc. * | 2,670,200 | ||||
24,600 | Ameriprise Financial, Inc. | 2,952,000 | ||||
19,800 | Arthur J Gallagher & Co. | 922,680 | ||||
24,700 | Discover Financial Services | 1,530,906 | ||||
29,700 | First Republic Bank | 1,633,203 | ||||
Quantity | Name of Issuer | Fair Value ($) | ||||
7,200 | Intercontinentalexchange Group, Inc. | 1,360,080 | ||||
32,200 | Marsh & McLennan Cos., Inc. | 1,668,604 | ||||
15,600 | Signature Bank/New York NY * | 1,968,408 | ||||
26,200 | T Rowe Price Group, Inc. | 2,211,542 | ||||
|
| |||||
| 16,917,623 | ||||||
|
| |||||
Health Services - 2.3% | ||||||
13,800 | Acadia Healthcare Co., Inc. * | 627,900 | ||||
25,000 | Express Scripts Holding Co. * | 1,733,250 | ||||
14,500 | Stericycle, Inc. * | 1,717,090 | ||||
|
| |||||
| 4,078,240 | ||||||
|
| |||||
Health Technology - 10.9% | ||||||
10,900 | Actavis, PLC * | 2,431,245 | ||||
12,800 | Alexion Pharmaceuticals, Inc. * | 2,000,000 | ||||
6,400 | Align Technology, Inc. * | 358,656 | ||||
18,300 | Allergan, Inc. | 3,096,726 | ||||
19,400 | Celgene Corp. * | 1,666,072 | ||||
7,900 | Cubist Pharmaceuticals, Inc. * | 551,578 | ||||
9,600 | IDEXX Laboratories, Inc. * | 1,282,272 | ||||
10,300 | Jazz Pharmaceuticals, PLC * | 1,514,203 | ||||
18,700 | Mylan, Inc. * | 964,172 | ||||
27,400 | St. Jude Medical, Inc. | 1,897,450 | ||||
20,950 | Thermo Fisher Scientific, Inc. | 2,472,100 | ||||
14,200 | Vertex Pharmaceuticals, Inc. * | 1,344,456 | ||||
|
| |||||
| 19,578,930 | ||||||
|
| |||||
Industrial Services - 5.5% | ||||||
14,600 | Chicago Bridge & Iron Co. NV | 995,720 | ||||
18,000 | Fluor Corp. | 1,384,200 | ||||
22,900 | Jacobs Engineering Group, Inc. * | 1,220,112 | ||||
7,100 | Oceaneering International, Inc. | 554,723 | ||||
14,950 | Schlumberger, Ltd. | 1,763,353 | ||||
37,500 | Seadrill, Ltd. | 1,498,125 | ||||
52,600 | Waste Connections, Inc. | 2,553,730 | ||||
|
| |||||
| 9,969,963 | ||||||
|
| |||||
Non-Energy Minerals - 0.7% | ||||||
13,900 | Eagle Materials, Inc. | 1,310,492 | ||||
|
| |||||
Process Industries - 5.9% | ||||||
8,400 | Airgas, Inc. | 914,844 | ||||
3,700 | CF Industries Holdings, Inc. | 889,961 | ||||
33,300 | Ecolab, Inc. | 3,707,622 | ||||
37,300 | FMC Corp. | 2,655,387 | ||||
20,100 | International Paper Co. | 1,014,447 | ||||
27,000 | Scotts Miracle-Gro Co. | 1,535,220 | ||||
|
| |||||
| 10,717,481 | ||||||
|
| |||||
Producer Manufacturing - 11.9% | ||||||
15,600 | AGCO Corp. | 877,032 | ||||
41,100 | AMETEK, Inc. | 2,148,708 | ||||
16,700 | Cummins, Inc. | 2,576,643 | ||||
19,600 | Delphi Automotive, PLC | 1,347,304 | ||||
28,800 | Flowserve Corp. | 2,141,280 | ||||
See accompanying notes to financial statements. | ||||
28 | SIT MUTUAL FUNDS ANNUAL REPORT |
| Quantity | Name of Issuer | Fair Value ($) | ||||
49,600 | Hexcel Corp. * | 2,028,640 | ||||
15,000 | Ingersoll-Rand, PLC | 937,650 | ||||
15,500 | MSC Industrial Direct Co., Inc. | 1,482,420 | ||||
8,700 | Precision Castparts Corp. | 2,195,880 | ||||
17,400 | SPX Corp. | 1,882,854 | ||||
54,100 | Trimble Navigation, Ltd. * | 1,998,995 | ||||
22,400 | Trinity Industries, Inc. | 979,328 | ||||
3,500 | WW Grainger, Inc. | 889,945 | ||||
|
| |||||
| 21,486,679 | ||||||
|
| |||||
Retail Trade - 7.2% | ||||||
56,900 | Dick’s Sporting Goods, Inc. | 2,649,264 | ||||
26,600 | Lululemon Athletica, Inc. * | 1,076,768 | ||||
53,700 | Macy’s, Inc. | 3,115,674 | ||||
18,300 | Nordstrom, Inc. | 1,243,119 | ||||
59,100 | TJX Cos., Inc. | 3,141,165 | ||||
19,500 | Ulta Salon Cosmetics & Fragrance, Inc. * | 1,782,495 | ||||
|
| |||||
| 13,008,485 | ||||||
|
| |||||
Technology Services - 8.6% | ||||||
33,300 | ANSYS, Inc. * | 2,524,806 | ||||
31,100 | Aspen Technology, Inc. * | 1,443,040 | ||||
54,600 | Cognizant Technology Solutions Corp. * | 2,670,486 | ||||
19,200 | CommVault Systems, Inc. * | 944,064 | ||||
12,400 | Concur Technologies, Inc. * | 1,157,416 | ||||
20,400 | Informatica Corp. * | 727,260 | ||||
2,650 | priceline.com, Inc. * | 3,187,950 | ||||
20,700 | Ultimate Software Group, Inc. * | 2,860,119 | ||||
|
| |||||
| 15,515,141 | ||||||
|
| |||||
| Quantity | Name of Issuer | Fair Value ($) | ||||
Transportation - 2.9% | ||||||
19,800 | Alaska Air Group, Inc. | 1,881,990 | ||||
23,700 | Ryder System, Inc. | 2,087,733 | ||||
52,300 | Swift Transportation Co. * | 1,319,529 | ||||
|
| |||||
| 5,289,252 | ||||||
|
| |||||
Utilities - 1.5% | ||||||
51,500 | Calpine Corp. * | 1,226,215 | ||||
29,700 | Wisconsin Energy Corp. | 1,393,524 | ||||
|
| |||||
| 2,619,739 | ||||||
|
| |||||
Total Common Stocks | 177,434,362 | |||||
|
| |||||
Total Investments in Securities - 98.4% | 177,434,362 | |||||
Other Assets and Liabilities, net - 1.6% | 2,841,206 | |||||
|
| |||||
Total Net Assets - 100.0% | $ | 180,275,568 | ||||
|
| |||||
| * | Non-income producing security. |
Numeric footnotes not disclosed are not applicable to this Schedule of Investments.
PLC — Public Limited Company
A summary of the levels for the Fund’s investments as of June 30, 2014 is as follows (see Note 2 - significant accounting policies in the notes to financial statements):
| Investment in Securities | ||||||||||||
Level 1 Quoted | Level 2 Other significant | Level 3 Significant | Total ($) | |||||||||
Common Stocks ** | 177,434,362 | — | — | 177,434,362 | ||||||||
Total: | 177,434,362 | — | — | 177,434,362 | ||||||||
| ** | For equity securities categorized in a single level, refer to the Schedule of Investments for further breakdown. |
For the reporting period, there were no transfers between levels 1, 2 and 3.
See accompanying notes to financial statements. | ||
JUNE 30, 2014 |
29 |
|
OBJECTIVE & STRATEGY
The objective of the Sit Small Cap Growth Fund is to maximize long-term capital appreciation. The Fund seeks to achieve its objective by investing, under normal market conditions, at least 80% of its net assets in common stocks of companies with capitalizations at the time of purchase of up to $3.0 billion, or up to the market capitalization of the largest company included in the Russell 2000® Index measured at the end of the previous twelve months ($10.6 billion as of June 30, 2014).
The Adviser invests in a diversified group of growing small companies it believes exhibit the potential for superior growth. The Adviser believes that a company’s earnings growth is the primary determinant of its potential long-term return and evaluates a company’s potential for above average long-term earnings and revenue growth.
The Sit Small Cap Growth Fund return was +22.56% over the past twelve months. This compares to the return of +24.73% for the Rus-sell 2000® Growth Index and the +23.64% gain for the Russell 2000® Index.
Despite uneven economic growth and, more recently, an increase in geopolitical tensions in the Middle East and Ukraine, small capitalization stocks posted strong returns over the past year. We believe, however, that returns are likely to be more modest in the year ahead, as valuations have moved significantly higher and the corporate earnings growth is likely to remain fairly subdued. Given higher valuations and our expectation that volatility will likely increase in the coming months (from currently exceptionally low levels), we continue to believe that a focus on quality growth companies is appropriate. In addition, from a cyclical standpoint, there are many data points that indicate there is finally a pickup in corporate capital spending after years of restrained spending. This has led us to hold significant sector weights in the producer manufacturing and technology (both services and hardware) sectors, which should be key beneficiaries as the capital spending cycle plays out over the next several quarters. While this “cyclical” bet carries risks if economic conditions deteriorate, the Fund is well diversified as we continue to maintain positions in more defensive sectors, such as health technology and finance.
The Fund underperformed the Russell 2000® Growth Index over the past twelve months. Relative performance was negatively impacted by stock selection in several sectors, including health technology, technology services and retail trade. In terms of individual stocks, Celldex Therapeutics, Intuitive Surgical, CommVault Systems, Lululemon Athletica and Dick’s Sporting Goods most negatively impacted relative returns. Conversely, the Fund’s electronic technology holdings performed well over the period, as positions in Synaptics
HYPOTHETICAL GROWTH OF $10,000
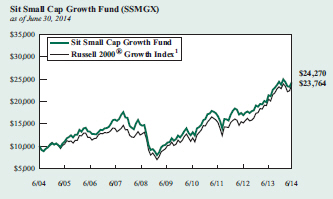
The chart above illustrates the total value of a hypothetical $10,000 investment in the Fund over the past 10 years as compared to the performance of the Russell 2000® Growth Index. Past performance does not guarantee future results. Returns include the reinvestment of distributions. The chart does not reflect the deduction of taxes that a shareholder would pay on Fund distributions or the redemption of Fund shares.
1 Russell 2000® Growth Index is an unmanaged index that measures the performance of those Russell 2000 Index companies with higher price-to-book ratios and higher forecasted growth values. It is not possible to invest directly in an index. This is the Fund’s primary index.
and Skyworks Solutions rose over 100% during the past year. In addition, holdings in the consumer services and transportation sectors added to relative returns over the period. Our research remains focused on identifying small cap companies with secular growth prospects that are trading at attractive valuations. We continue to appreciate shareholders’ interest in the Fund.
| Roger J. Sit | Michael J. Stellmacher | |
| Kent L. Johnson | Robert W. Sit | |
| Portfolio Managers |
| Information on this page is unaudited. | ||
30 | SIT MUTUAL FUNDS ANNUAL REPORT | |
|
COMPARATIVE RATES OF RETURNS
as of June 30, 2014
| Sit Small Cap Growth Fund | Russell 2000® | Russell 2000® Index 2 | |||||||||||||
One Year | 22.56 | % | 24.73 | % | 23.64 | % | |||||||||
Five Year | 18.84 | 20.50 | 20.21 | ||||||||||||
Ten Year | 9.27 | 9.04 | 8.70 | ||||||||||||
Since Inception (7/1/94) | 11.15 | 8.09 | 9.78 | ||||||||||||
Performance figures are historical and do not guarantee future results. Investment returns and principal value will vary, and you may have a gain or loss when you sell shares. Current performance may be lower or higher than the performance data quoted. Contact the Fund for performance data current to the most recent month-end. Returns include changes in share price as well as reinvestment of all dividends and capital gains. Returns do not reflect the deduction of the 2% redemption fee imposed if shares are redeemed or exchanged within 30 calendar days from their date of purchase. If imposed, the fee would reduce the performance quoted. Returns do not reflect the deduction of taxes that a shareholder would pay on Fund distributions or the redemption of Fund shares. Management fees and administrative expenses are included in the Fund’s performance. Returns for periods greater than one year are compounded average annual rates of return.
1 Russell 2000® Growth Index is an unmanaged index that measures the performance of those Russell 2000 Index companies with higher price-to-book ratios and higher forecasted growth values. It is not possible to invest directly in an index.
2 Russell 2000® Index is an unmanaged index that measures the performance of the 2,000 smallest companies in the Russell 3000® Index, an index consisting of the 3,000 largest U.S. companies based on market capitalization.
PORTFOLIO SUMMARY
Net Asset Value 6/30/14: | $61.38 Per Share | |
Net Asset Value 6/30/13: | $50.08 Per Share | |
Total Net Assets: | $99.5 Million | |
Weighted Average Market Cap: | $6.3 Billion |
TOP 10 HOLDINGS
1. Synaptics, Inc.
2. Gulfport Energy Corp.
3. Iconix Brand Group, Inc.
4. First Republic Bank/CA
5. Skyworks Solutions, Inc.
6. Buffalo Wild Wings, Inc.
7. Ultimate Software Group, Inc.
8. Snap-On, Inc.
9. IDEX Corp.
10. Alexion Pharmaceuticals, Inc.
Based on total net assets as of June 30, 2014. Subject to change.
FUND DIVERSIFICATION
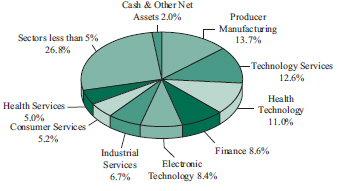
Based on total net assets as of June 30, 2014. Subject to change.
| Information on this page is unaudited. | ||
JUNE 30, 2014 | 31 | |
SCHEDULE OF INVESTMENTS
June 30, 2014
Sit Small Cap Growth Fund
| Quantity |
Name of Issuer | Fair Value ($) | ||||
Common Stocks - 98.0% | ||||||
Commercial Services - 3.2% | ||||||
32,600 | Cardtronics, Inc. * | 1,111,008 | ||||
19,400 | DigitalGlobe, Inc. * | 539,320 | ||||
41,700 | On Assignment, Inc. * | 1,483,269 | ||||
|
| |||||
| 3,133,597 | ||||||
|
| |||||
Communications - 1.1% | ||||||
11,050 | SBA Communications Corp. * | 1,130,415 | ||||
|
| |||||
Consumer Durables - 4.4% | ||||||
5,400 | Fossil Group, Inc. * | 564,408 | ||||
14,400 | Polaris Industries, Inc. | 1,875,456 | ||||
16,700 | Snap-On, Inc. | 1,979,284 | ||||
|
| |||||
| 4,419,148 | ||||||
|
| |||||
Consumer Non-Durables - 3.2% | ||||||
8,490 | G-III Apparel Group, Ltd. * | 693,293 | ||||
51,200 | Iconix Brand Group, Inc. * | 2,198,528 | ||||
7,300 | Prestige Brands Holdings, Inc. * | 247,397 | ||||
|
| |||||
| 3,139,218 | ||||||
|
| |||||
Consumer Services - 5.2% | ||||||
12,100 | Buffalo Wild Wings, Inc. * | 2,005,091 | ||||
9,900 | Capella Education Co. | 538,461 | ||||
38,200 | Dunkin’ Brands Group, Inc. | 1,749,942 | ||||
30,700 | Lions Gate Entertainment Corp. | 877,406 | ||||
|
| |||||
| 5,170,900 | ||||||
|
| |||||
Electronic Technology - 8.4% | ||||||
15,250 | 3D Systems Corp. * | 911,950 | ||||
55,500 | Ciena Corp. * | 1,202,130 | ||||
5,600 | F5 Networks, Inc. * | 624,064 | ||||
45,500 | Invensense, Inc. * | 1,032,395 | ||||
42,900 | Skyworks Solutions, Inc. | 2,014,584 | ||||
28,800 | Synaptics, Inc. * | 2,610,432 | ||||
|
| |||||
| 8,395,555 | ||||||
|
| |||||
Energy Minerals - 3.4% | ||||||
7,665 | Energy XXI Bermuda, Ltd. | 181,124 | ||||
37,000 | Gulfport Energy Corp. * | 2,323,600 | ||||
23,200 | Western Refining, Inc. | 871,160 | ||||
|
| |||||
| 3,375,884 | ||||||
|
| |||||
Finance - 8.6% | ||||||
9,000 | Affiliated Managers Group, Inc. * | 1,848,600 | ||||
37,600 | First Republic Bank/CA | 2,067,624 | ||||
13,000 | Signature Bank/New York NY * | 1,640,340 | ||||
| Quantity |
Name of Issuer | Fair Value ($) | ||||
14,750 | Stifel Financial Corp. * | 698,413 | ||||
30,500 | TCF Financial Corp. | 499,285 | ||||
15,000 | Texas Capital Bancshares, Inc. * | 809,250 | ||||
25,800 | Validus Holdings, Ltd. | 986,592 | ||||
|
| |||||
| 8,550,104 | ||||||
|
| |||||
Health Services - 5.0% | ||||||
7,600 | Acadia Healthcare Co., Inc. * | 345,800 | ||||
22,600 | Advisory Board Co. * | 1,170,680 | ||||
12,200 | Air Methods Corp. * | 630,130 | ||||
3,800 | Athenahealth, Inc. * | 475,494 | ||||
39,000 | Healthcare Services Group, Inc. | 1,148,160 | ||||
10,500 | Stericycle, Inc. * | 1,243,410 | ||||
|
| |||||
| 5,013,674 | ||||||
|
| |||||
Health Technology - 11.0% | ||||||
12,100 | Alexion Pharmaceuticals, Inc. * | 1,890,625 | ||||
13,400 | Align Technology, Inc. * | 750,936 | ||||
4,700 | Cardiovascular Systems, Inc. * | 146,452 | ||||
17,800 | Celgene Corp. * | 1,528,664 | ||||
39,000 | Celldex Therapeutics, Inc. * | 636,480 | ||||
3,700 | Clovis Oncology, Inc. * | 153,217 | ||||
13,600 | Cubist Pharmaceuticals, Inc. * | 949,552 | ||||
25,600 | Isis Pharmaceuticals, Inc. * | 881,920 | ||||
17,100 | PerkinElmer, Inc. | 800,964 | ||||
2,200 | Puma Biotechnology, Inc. * | 145,200 | ||||
16,600 | Sangamo BioSciences, Inc. * | 253,482 | ||||
17,900 | STERIS Corp. | 957,292 | ||||
3,600 | Synageva BioPharma Corp. * | 377,280 | ||||
7,700 | Techne Corp. | 712,789 | ||||
21,300 | Thoratec Corp. * | 742,518 | ||||
|
| |||||
| 10,927,371 | ||||||
|
| |||||
Industrial Services - 6.7% | ||||||
21,000 | Atwood Oceanics, Inc. * | 1,102,080 | ||||
8,000 | Chicago Bridge & Iron Co. NV | 545,600 | ||||
3,800 | Core Laboratories NV | 634,828 | ||||
24,600 | EMCOR Group, Inc. | 1,095,438 | ||||
26,200 | Tetra Tech, Inc. | 720,500 | ||||
33,200 | Tutor Perini Corp. * | 1,053,768 | ||||
31,800 | Waste Connections, Inc. | 1,543,890 | ||||
|
| |||||
| 6,696,104 | ||||||
|
| |||||
Non-Energy Minerals - 0.8% | ||||||
8,700 | Eagle Materials, Inc. | 820,236 | ||||
|
| |||||
Process Industries - 1.6% | ||||||
3,100 | CF Industries Holdings, Inc. | 745,643 | ||||
14,900 | Scotts Miracle-Gro Co. | 847,214 | ||||
|
| |||||
| 1,592,857 | ||||||
|
| |||||
See accompanying notes to financial statements. | ||||
32 | SIT MUTUAL FUNDS ANNUAL REPORT |
Quantity | Name of Issuer | Fair Value ($) | ||||
Producer Manufacturing - 13.7% | ||||||
9,300 | AGCO Corp. | 522,846 | ||||
25,600 | AMETEK, Inc. | 1,338,368 | ||||
14,000 | CLARCOR, Inc. | 865,900 | ||||
14,400 | Crane Co. | 1,070,784 | ||||
26,800 | Hexcel Corp. * | 1,096,120 | ||||
23,600 | IDEX Corp. | 1,905,464 | ||||
28,100 | ITT Corp. | 1,351,610 | ||||
12,500 | Lincoln Electric Holdings, Inc. | 873,500 | ||||
7,200 | MSC Industrial Direct Co., Inc. | 688,608 | ||||
12,100 | Proto Labs, Inc. * | 991,232 | ||||
9,120 | RBC Bearings, Inc. | 584,136 | ||||
24,300 | Trimble Navigation, Ltd. * | 897,885 | ||||
17,200 | Wabtec Corp. | 1,420,548 | ||||
|
| |||||
| 13,607,001 | ||||||
|
| |||||
Retail Trade - 3.7% | ||||||
10,900 | Casey’s General Stores, Inc. | 766,161 | ||||
32,700 | Dick’s Sporting Goods, Inc. | 1,522,512 | ||||
14,800 | Lululemon Athletica, Inc. * | 599,104 | ||||
8,200 | Ulta Salon Cosmetics & Fragrance, Inc. * | 749,562 | ||||
|
| |||||
| 3,637,339 | ||||||
|
| |||||
Technology Services - 12.6% | ||||||
15,700 | ANSYS, Inc. * | 1,190,374 | ||||
18,300 | Aspen Technology, Inc. * | 849,120 | ||||
16,300 | CommVault Systems, Inc. * | 801,471 | ||||
17,300 | Concur Technologies, Inc. * | 1,614,782 | ||||
8,100 | Dealertrack Technologies, Inc. * | 367,254 | ||||
28,400 | Informatica Corp. * | 1,012,460 | ||||
28,900 | Manhattan Associates, Inc. * | 995,027 | ||||
Quantity | Name of Issuer | Fair Value ($) | ||||
15,100 | Solera Holdings, Inc. | 1,013,965 | ||||
18,000 | Syntel, Inc. * | 1,547,280 | ||||
14,400 | Ultimate Software Group, Inc. * | 1,989,648 | ||||
40,500 | Web.com Group, Inc. * | 1,169,235 | ||||
|
| |||||
| 12,550,616 | ||||||
|
| |||||
Transportation - 4.7% | ||||||
13,800 | Alaska Air Group, Inc. | 1,311,690 | ||||
38,100 | Knight Transportation, Inc. | 905,637 | ||||
14,700 | Ryder System, Inc. | 1,294,923 | ||||
47,500 | Swift Transportation Co. * | 1,198,425 | ||||
|
| |||||
| 4,710,675 | ||||||
|
| |||||
Utilities - 0.7% | ||||||
18,900 | ITC Holdings Corp. | 689,472 | ||||
|
| |||||
Total Common Stocks (cost: $63,109,984) | 97,560,166 | |||||
|
| |||||
Total Investments in Securities - 98.0% (cost: $63,109,984) | 97,560,166 | |||||
Other Assets and Liabilities, net - 2.0% | 1,949,617 | |||||
|
| |||||
Total Net Assets - 100.0% | $ | 99,509,783 | ||||
|
| |||||
| * | Non-income producing security. |
Numeric footnotes not disclosed are not applicable to this Schedule of Investments.
A summary of the levels for the Fund’s investments as of June 30, 2014 is as follows (see Note 2 - significant accounting policies in the notes to financial statements):
| Investment in Securities | ||||||||
| Level 1 Quoted Price ($) | Level 2 Other significant observable inputs ($) | Level 3 Significant | Total ($) | |||||
Common Stocks ** |
97,560,166 |
— |
— |
97,560,166 | ||||
Total: |
97,560,166 |
— |
— |
97,560,166 | ||||
| ** | For equity securities categorized in a single level, refer to the Schedule of Investments for further breakdown. |
For the reporting period, there were no transfers between levels 1, 2 and 3.
See accompanying notes to financial statements. | ||
JUNE 30, 2014 |
33 |
|
OBJECTIVE & STRATEGY
The objective of the International Growth Fund is long-term growth. The Fund seeks to achieve its objective by investing at least 90% of its net assets in common stocks of growth companies domiciled outside the United States. In selecting investments for the Fund, the Adviser begins by selecting countries or regions in which to invest by considering several factors affecting the economy and equity market of foreign countries and regions. After the country and regional allocations are determined, the Adviser seeks industries and sectors that it believes have earnings growth prospects that are greater than the average. Within the selected industries and sectors, the Adviser invests in foreign growth-oriented companies it believes exhibit the potential for superior growth.
The Sit International Growth Fund appreciated +17.06% for the twelvemonth period ended June 30, 2014, but modestly underperformed the MSCI EAFE Growth Index, which appreciated+20.33%. The top two industries contributing to relative performance were health care and energy. The combination of good stock selection and the overweight position in both sectors relative to the Index led to the strong relative performance. The information technology sector also contributed positively to relative performance due to good stock selection. While the aforementioned sectors had a positive effect on the Fund, stock selection in the industrial, consumer discretionary, and materials sectors had a negative impact.
On a regional basis, Japanese stocks contributed the most to relative performance due the underweight position and a positive currency effect. Non-Euro Area stocks detracted the most to relative performance due to negative stock selection.
The European economic recovery appears more fragile than it did last year at this same time, as the Purchasing Managers Index has turned down thus far in 2014. Within a potentially weaker market environment, the strategy remains focused on high quality, cash generative companies that have strong sales and earnings growth. Attractive stocks include higher beta companies that can capitalize on a global recovery. Some of the preferred groups include: cyclicals, financials, and domestic consumption sectors. Within this context, Europe continues to have the largest regional exposure in the Fund. Emphasis remains on companies with exposure outside of Europe.
Japanese equities have lagged developed market peers for the majority of the first half of 2014 over frustration with the slow pace of reform measures, concern over the impact of the consumption tax hike, and disappointment with the lack of additional easing by the Bank of Japan. In what we believe to be a continued environment of slow and modest domestic growth, we continue to favor multinational and export-oriented companies that benefit from stronger demand in overseas markets, as well as defensive consumption stocks that will likely perform well in a subdued demand environment. We are moderately increasing our exposure to Japanese equities given the renewed progress on pro-growth reforms, signs of economic stabil-
HYPOTHETICAL GROWTH OF $10,000
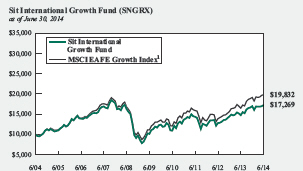
The chart above illustrates the total value of a hypothetical $10,000 investment in the Fund over the past 10 years as compared to the performance of the MSCI EAFE Growth Index. Past performance does not guarantee future results. Returns include the reinvestment of distributions. The chart does not reflect the deduction of taxes that a shareholder would pay on Fund distributions or the redemption of Fund shares.
1 MSCI EAFE Growth Index (Europe, Australasia, Far East) is an unmanaged free float-adjusted market capitalization index that measures the equity market performance of growth oriented developed market stocks within Europe, Australasia and the Far East. It is not possible to invest directly in an index. This is the Fund’s primary index.
ity, and modestly attractive valuations. However, we remain significantly underweight overall due to our continued concern about the health of the Japanese economy in the longer run.
In China, the investment strategy remains focused on high quality companies with strong sales and earnings growth, leading market positions, and strong balance sheets. Favored sectors include: consumer stocks, banks, and commodity-related companies. China’s economy is showing signs of stabilization, and boosted by the supportive policy measures, Chinese stocks should slowly begin to reverse their underperformance. On a fundamental basis, though earnings revision sentiment has trended down notably since the end of last year, the deterioration has slowed recently.
Roger J. Sit Tasha M. Murdoff
Portfolio Managers
| Information on this page is unaudited. | ||
34 | SIT MUTUAL FUNDS ANNUAL REPORT | |
| COMPARATIVE RATES OF RETURNS | ||||||
as of June 30, 2014
| Sit International Growth Fund | MSCI EAFE Growth Index 1 | MSCI EAFE Index 2 | |||||||||||||
One Year | 17.06 | % | 20.33 | % | 23.57 | % | |||||||||
Five Year | 11.25 | 12.22 | 11.77 | ||||||||||||
Ten Year | 5.62 | 7.09 | 6.93 | ||||||||||||
Since Inception | 4.43 | 4.57 | 5.93 | ||||||||||||
(11/1/91) | |||||||||||||||
Performance figures are historical and do not guarantee future results. Investment returns and principal value will vary, and you may have a gain or loss when you sell shares. Current performance may be lower or higher than the performance data quoted. Contact the Fund for performance data current to the most recent month-end. Returns include changes in share price as well as reinvestment of all dividends and capital gains and all fee waivers. Without the fee waivers total return and yield figures would have been lower. Returns do not reflect the deduction of the 2% redemption fee imposed if shares are redeemed or exchanged within 30 calendar days from their date of purchase. If imposed, the fee would reduce the performance quoted. Returns do not reflect the deduction of taxes that a shareholder would pay on Fund distributions or the redemption of Fund shares. Management fees and administrative expenses are included in the Fund’s performance. Returns for periods greater than one year are compounded average annual rates of return.
1 MSCI EAFE Growth Index (Europe, Australasia, Far East) is an unmanaged free float-adjusted market capitalization index that measures the equity market performance of growth oriented developed market stocks within Europe, Australasia and the Far East. It is not possible to invest directly in an index.
2 MSCI EAFE Index (Europe, Australasia, Far East) is an unmanaged free float-adjusted market capitalization index that measures the equity market performance of developed markets, excluding the US & Canada.
| FUND DIVERSIFICATION - BY REGION | ||||||||||
| Sit Int’l Growth Fund | MSCI EAFE Growth Index | |||||||||
Europe | 72.2 | % | 64.4 | % | ||||||
Asia | 23.6 | % | 35.1 | % | ||||||
Other | 2.6 | % | 0.5 | % | ||||||
Cash & Other Net Assets | 1.6 | % | — | |||||||
Based on total net assets as of June 30, 2014. Subject to change.
| PORTFOLIO SUMMARY | ||
Net Asset Value 6/30/14: | $17.44 Per Share | |
Net Asset Value 6/30/13: | $15.05 Per Share | |
Total Net Assets: | $ 24.1 Million | |
Weighted Average Market Cap: | $ 65.2 Billion | |
TOP 10 HOLDINGS
| 1. | Nestle SA |
| 2. | Diageo, PLC, ADR |
| 3. | British American Tobacco, PLC |
| 4. | SGS SA |
| 5. | BHP Billiton, Ltd. |
| 6. | Adecco SA |
| 7. | Schlumberger, Ltd. |
| 8. | Covidien, PLC |
| 9. | Allianz SE |
| 10. | Inditex SA |
Based on total net assets as of June 30, 2014. Subject to change.
FUND DIVERSIFICATION
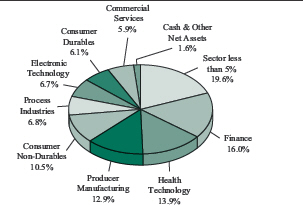
Based on total net assets as of June 30, 2014. Subject to change.
Information on this page is unaudited.
JUNE 30, 2014
|
35 |
SCHEDULE OF INVESTMENTS
June 30, 2014
Sit International Growth Fund
Quantity | Name of Issuer | Fair Value ($) | ||||
Common Stocks - 97.8% | ||||||
Africa/Middle East - 1.9% | ||||||
South Africa - 1.9% | ||||||
8,850 | MTN Group, Ltd. | 186,415 | ||||
4,400 | Sasol, Ltd., ADR | 260,128 | ||||
|
| |||||
| 446,543 | ||||||
|
| |||||
Asia - 23.0% | ||||||
Australia - 4.7% | ||||||
7,575 | Australia & New Zealand Banking Group, Ltd. | 238,193 | ||||
16,050 | BHP Billiton, Ltd. | 547,381 | ||||
10,800 | Westpac Banking Corp., ADR | 346,896 | ||||
|
| |||||
| 1,132,470 | ||||||
|
| |||||
China/Hong Kong - 4.9% | ||||||
160,000 | CIMC Enric Holdings, Ltd. | 210,752 | ||||
22,150 | HSBC Holdings, PLC | 225,259 | ||||
27,000 | Hutchison Whampoa, Ltd. | 369,267 | ||||
6,900 | New Oriental Education & Tech. Group, ADR | 183,333 | ||||
13,000 | Tencent Holdings, Ltd. | 197,770 | ||||
|
| |||||
| 1,186,381 | ||||||
|
| |||||
Japan - 9.5% | ||||||
5,600 | Asics Corp. | 130,770 | ||||
33,000 | Daicel Corp. | 315,522 | ||||
10,700 | Honda Motor Co., Ltd. | 373,374 | ||||
16,400 | Inpex Corp. | 249,480 | ||||
5,500 | Makita Corp. | 339,922 | ||||
10,700 | Seven & I Holdings Co., Ltd. | 451,003 | ||||
1,000 | SMC Corp. | 267,962 | ||||
2,300 | Softbank Corp. | 171,403 | ||||
|
| |||||
| 2,299,436 | ||||||
|
| |||||
Singapore - 2.3% | ||||||
5,100 | Avago Technologies, Ltd. | 367,557 | ||||
80,000 | OSIM International, Ltd. | 172,666 | ||||
|
| |||||
| 540,223 | ||||||
|
| |||||
South Korea - 1.6% | ||||||
285 | Samsung Electronics Co., Ltd., GDR | 183,981 | ||||
4,250 | Shinhan Financial Group Co., Ltd. | 196,079 | ||||
|
| |||||
| 380,060 | ||||||
|
| |||||
Europe - 72.2% | ||||||
Denmark - 1.4% | ||||||
2,100 | GN Store Nord A/S | 60,183 | ||||
6,070 | Novo Nordisk A/S | 280,148 | ||||
|
| |||||
| 340,331 | ||||||
|
| |||||
France - 9.1% | ||||||
6,800 | BNP Paribas SA | 462,120 | ||||
2,315 | Dassault Systemes SA | 297,665 | ||||
6,400 | GDF Suez | 176,330 | ||||
Quantity | Name of Issuer | Fair Value ($) | ||||
4,310 | Ingenico | 374,849 | ||||
3,270 | Sanofi | 347,567 | ||||
4,550 | Schlumberger, Ltd. | 536,672 | ||||
|
| |||||
| 2,195,203 | ||||||
|
| |||||
Germany - 9.4% | ||||||
3,640 | Adidas AG | 368,063 | ||||
3,180 | Allianz SE | 530,786 | ||||
1,660 | Linde AG | 352,744 | ||||
4,200 | Norma Group SE | 231,718 | ||||
1,145 | Rational AG | 369,540 | ||||
3,050 | Siemens AG | 402,704 | ||||
|
| |||||
| 2,255,555 | ||||||
|
| |||||
Ireland - 3.5% | ||||||
1,375 | Actavis, PLC * | 306,694 | ||||
5,950 | Covidien, PLC | 536,571 | ||||
|
| |||||
| 843,265 | ||||||
|
| |||||
Italy - 3.1% | ||||||
14,350 | Azimut Holding SpA | 369,385 | ||||
9,750 | Eni SpA | 266,659 | ||||
2,600 | Tenaris SA, ADR | 122,590 | ||||
|
| |||||
| 758,634 | ||||||
|
| |||||
Netherlands - 6.0% | ||||||
3,450 | ASML Holding NV | 321,781 | ||||
3,635 | Gemalto NV | 377,332 | ||||
33,430 | ING Groep NV * | 469,106 | ||||
2,975 | LyondellBasell Industries NV | 290,509 | ||||
|
| |||||
| 1,458,728 | ||||||
|
| |||||
Norway - 1.1% | ||||||
6,400 | Seadrill, Ltd. | 255,680 | ||||
|
| |||||
Spain - 4.9% | ||||||
37,100 | Banco Bilbao Vizcaya Argentaria SA, ADR | 473,767 | ||||
5,200 | Grifols SA, ADR | 229,060 | ||||
3,180 | Inditex SA | 489,418 | ||||
|
| |||||
| 1,192,245 | ||||||
|
| |||||
Switzerland - 15.2% | ||||||
6,625 | Adecco SA | 545,197 | ||||
9,995 | Credit Suisse Group AG, ADR | 283,558 | ||||
9,480 | Nestle SA | 734,576 | ||||
5,275 | Novartis AG | 477,695 | ||||
1,620 | Roche Holding AG | 482,690 | ||||
229 | SGS SA | 547,980 | ||||
360 | Swatch Group AG | 217,068 | ||||
1,030 | Syngenta AG | 380,533 | ||||
|
| |||||
| 3,669,297 | ||||||
|
| |||||
See accompanying notes to financial statements. | ||||
36 | SIT MUTUAL FUNDS ANNUAL REPORT |
Quantity | Name of Issuer | Fair Value ($) | ||||
United Kingdom - 18.5% | ||||||
72,000 | Barclays, PLC | 262,279 | ||||
14,850 | Bellway, PLC | 397,802 | ||||
9,910 | British American Tobacco, PLC | 589,664 | ||||
13,570 | Burberry Group, PLC | 344,419 | ||||
5,300 | Delphi Automotive, PLC | 364,322 | ||||
5,100 | Diageo, PLC, ADR | 649,077 | ||||
66,145 | DS Smith, PLC | 313,234 | ||||
24,700 | Essentra, PLC | 322,519 | ||||
4,350 | GlaxoSmithKline, PLC, ADR | 232,638 | ||||
3,070 | Reckitt Benckiser Group, PLC | 267,688 | ||||
2,200 | Royal Dutch Shell, PLC, ADR | 191,422 | ||||
1,600 | Royal Dutch Shell, PLC, ADR | 131,792 | ||||
4,985 | Shire, PLC | 391,037 | ||||
|
| |||||
| 4,457,893 | ||||||
|
| |||||
Latin America - 0.7% | ||||||
Brazil - 0.7% | ||||||
3,100 | AGCO Corp. | 174,282 | ||||
|
| |||||
Total Common Stocks (cost: $18,467,979) | 23,586,226 | |||||
|
| |||||
Investment Companies - 0.6% | ||||||
4,900 | iShares MSCI India ETF | 145,701 | ||||
|
| |||||
(cost: $144,766) | ||||||
Total Investments in Securities - 98.4% (cost: $18,612,745) | 23,731,927 | |||||
Other Assets and Liabilities, net - 1.6% | 395,489 | |||||
|
| |||||
Total Net Assets - 100.0% | $24,127,416 | |||||
|
| |||||
| * | Non-income producing security. |
Numeric footnotes not disclosed are not applicable to this Schedule of Investments.
ADR — American Depositary Receipt
GDR — Global Depositary Receipt
PLC — Public Limited Company
See accompanying notes to financial statements. | ||
JUNE 30, 2014 |
37 |
SCHEDULE OF INVESTMENTS
June 30, 2014
Sit International Growth Fund (Continued)
A summary of the levels for the Fund’s investments as of June 30, 2014 is as follows (see Note 2 - significant accounting policies in the notes to financial statements):
| Investment in Securities | ||||||||||||||
| Level 1 Quoted Price ($) | Level 2 Other significant observable inputs ($) | Level 3 Significant | Total ($) | |||||||||||
Common Stocks | ||||||||||||||
Australia | 346,896 | 785,574 | — | 1,132,470 | ||||||||||
Brazil | 174,282 | — | — | 174,282 | ||||||||||
China/Hong Kong | 183,333 | 1,003,048 | — | 1,186,381 | ||||||||||
Denmark | — | 340,331 | — | 340,331 | ||||||||||
France | 536,672 | 1,658,531 | — | 2,195,203 | ||||||||||
Germany | — | 2,255,555 | — | 2,255,555 | ||||||||||
Ireland | 843,265 | — | — | 843,265 | ||||||||||
Italy | 122,590 | 636,044 | — | 758,634 | ||||||||||
Japan | — | 2,299,436 | — | 2,299,436 | ||||||||||
Netherlands | 612,290 | 846,438 | — | 1,458,728 | ||||||||||
Norway | 255,680 | — | — | 255,680 | ||||||||||
Singapore | 367,557 | 172,666 | — | 540,223 | ||||||||||
South Africa | 260,128 | 186,415 | — | 446,543 | ||||||||||
South Korea | 183,981 | 196,079 | — | 380,060 | ||||||||||
Spain | 702,827 | 489,418 | — | 1,192,245 | ||||||||||
Switzerland | 283,558 | 3,385,739 | — | 3,669,297 | ||||||||||
United Kingdom | 1,569,251 | 2,888,642 | — | 4,457,893 | ||||||||||
Investment Companies | 145,701 | — | — | 145,701 | ||||||||||
Total: | 6,588,011 | 17,143,916 | — | 23,731,927 | ||||||||||
The Fund adjusts the closing price of foreign equity securities by applying a systematic process for events occurring after the close of the foreign exchanges. At each reporting period, this process is applied for all foreign securities and therefore all foreign securities are classified as level 2. There are no transfers between level 1 and level 2 between reporting periods as a result of applying this process. Level 1 securities of foreign issuers are primarily American Depositary Receipts (ADRs) or Global Depositary Receipts (GDRs). There were no transfers into or out of level 3 during the reporting period.
See accompanying notes to financial statements. | ||||
38 | SIT MUTUAL FUNDS ANNUAL REPORT |
[This page intentionally left blank.]
JUNE 30, 2014 |
39 |
Sit Developing Markets Growth Fund
|
OBJECTIVE & STRATEGY
The Fund seeks to maximize long-term capital appreciation. The Fund seeks to achieve its objective by investing at least 80% of its net assets in common stocks of companies domiciled or operating in a developing market. In selecting investments for the Fund, the Adviser begins by selecting countries or regions in which to invest by considering several factors affecting the economy and equity market of foreign countries and regions. After the country and regional allocations are determined, the Adviser seeks industries and sectors that appear to have strong earnings growth prospects. Within the selected industries and sectors, the Adviser invests in foreign growth-oriented companies it believes exhibit the potential for superior growth.
The Sit Developing Markets Growth Fund slightly outperformed the MSCI Emerging Markets Index, rising +12.79% versus +11.75% for the Index. Performance among emerging market countries varied meaningfully. India was the strongest performing region driven by the recent election and prospect of reforms. South Korea also exhibited strong performance, as the economic growth has been better than other regions in Asia. Chile lagged as the commodity- dependent economy was hurt by lower consumption and lower global demand for commodities. The Fund continues to be more conservative/high quality in nature than the Index and is comprised of companies with experienced management teams, sound balance sheets, cash flow generation, and sustainable earnings and revenue growth.
The financial, energy, information technology, and materials sectors meaningfully contributed to the relative outperformance over the last twelve months due to stock selection. Health care also positively contributed, given the underweight position of the Fund relative to the Index. The consumer discretionary sector had the largest negative impact to the Fund given the significant overweight position and stock selection. The industrial sector also took away from relative performance as the Fund is underweight and the sector weight in the Index outperformed the Index as a whole.
On a country basis, China and South Africa were the largest contributors to relative outperformance. The stock selection in both countries was the main contributing factor. In addition, the underweight in Turkey and Russia boosted the positive relative performance. On the negative side, Thailand (overweight and negative stock selection) and Brazil (negative stock selection) hurt relative performance.
In China, our investment strategy remains focused on high quality companies with strong sales and earnings growth, leading market positions, and strong balance sheets. Our favored sectors include: consumer stocks, banks, and commodity-related companies. China’s economy is showing signs of stabilization. Boosted by the supportive policy measures, Chinese stocks should slowly begin to reverse their underperformance. On a fundamental basis, though earnings revision sentiment has trended down notably since the end of last year, the deterioration has slowed recently. In addition, we also like
HYPOTHETICAL GROWTH OF $10,000
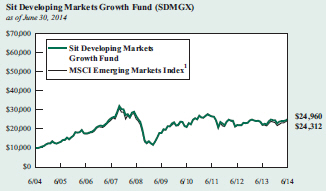
The chart above illustrates the total value of a hypothetical $10,000 investment in the Fund over the past 10 years as compared to the performance of the MSCI Emerging Markets Index. Past performance does not guarantee future results. Returns include the reinvestment of distributions. The chart does not reflect the deduction of taxes that a shareholder would pay on Fund distributions or the redemption of Fund shares.
1 MSCI Emerging Markets Index is an unmanaged free float-adjusted market capitalization index that measures equity market performance of emerging markets. It is not possible to invest directly in an index. This is the Fund’s primary index.
investments in India, Indonesia, Malaysia, the Philippines, and Thailand given the strong growth prospects of each respective country.
Mexico and Brazil’s economic recoveries continue to be slow. Mexico’s recently had weak first quarter GDP that was hindered by manufacturing, as consumer spending and exports have declined (especially to the United States). Banco de Mexico continues to cut its key interest rates to try to stimulate growth. Brazil’s economic data continues to be dismal. Brazil’s GDP growth has been anemic and inflation remains elevated, which will keep interest rates high. In Latin America, the holdings in the Fund are centered on consumer stocks, which will benefit from the World Cup in Brazil, along with export beneficiaries with strong financials and fundamentals.
Roger J. Sit
Raymond E. Sit
Portfolio Managers
| Information on this page is unaudited. | ||
40 | SIT MUTUAL FUNDS ANNUAL REPORT | |
|
| COMPARATIVE RATES OF RETURN | |||||||||||||||
as of June 30, 2014 | |||||||||||||||
| Sit Developing Markets Growth Fund | MSCI Emerging Markets Index 1 | MSCI Emerging Markets Growth Index 2 | |||||||||||||
One Year |
|
12.79 |
% |
|
11.75 |
% |
|
12.16 |
% | ||||||
Five Year | 7.10 | 6.66 | 8.01 | ||||||||||||
Ten Year | 9.58 | 9.29 | 9.17 | ||||||||||||
Since Inception (7/1/94)
| 4.69 | 4.00 | n/a | ||||||||||||
Performance figures are historical and do not guarantee future results. Investment returns and principal value will vary, and you may have a gain or loss when you sell shares. Current performance may be lower or higher than the performance data quoted. Contact the Fund for performance data current to the most recent month-end. Returns include changes in share price as well as reinvestment of all dividends and capital gains. Returns do not reflect the deduction of the 2% redemption fee imposed if shares are redeemed or exchanged within 30 calendar days from their date of purchase. If imposed, the fee would reduce the performance quoted. Returns do not reflect the deduction of taxes that a shareholder would pay on Fund distributions or the redemption of Fund shares. Management fees and administrative expenses are included in the Fund’s performance. Returns for periods greater than one year are compounded average annual rates of return.
1 MSCI Emerging Markets Index is an unmanaged free float-adjusted market capitalization index that measures equity market performance of emerging markets. It is not possible to invest directly in an index.
2 MSCI Emerging Markets Growth Index is an unmanaged free float-adjusted market capitalization index that measures equity market performance of growth oriented emerging market stocks.
| FUND DIVERSIFICATION - BY REGION | ||||
| Sit Developing Markets Growth Fund | MSCI Emerging Markets Index | |||
Asia |
63.5% |
62.4% | ||
Latin America | 22.9% | 19.0% | ||
Africa/Middle East | 10.5% | 8.6% | ||
Europe | 1.3% | 10.0% | ||
Cash & Other Net Assets
| 1.8% | — | ||
Based on total net assets as of June 30, 2014. Subject to change.
| PORTFOLIO SUMMARY | ||
Net Asset Value 6/30/14: | $17.48 Per Share | |
Net Asset Value 6/30/13: | $16.40 Per Share | |
Total Net Assets: | $10.8 Million | |
Weighted Average Market Cap: | $38.1 Billion | |
| TOP 10 HOLDINGS |
1. Samsung Electronics Co., Ltd. |
2. Tencent Holdings, Ltd. |
3. Shinhan Financial Group Co., Ltd. |
4. Naspers, Ltd. |
5. Ambev SA, ADR |
6. Embraer SA, ADR |
7. CNOOC, Ltd., ADR |
8. Banco Bradesco SA |
9. Taiwan Semiconductor Co. |
10. Hengan International Group Co., Ltd.
|
Based on total net assets as of June 30, 2014. Subject to change.
FUND DIVERSIFICATION

Based on total net assets as of June 30, 2014. Subject to change.
Information on this page is unaudited. | ||
JUNE 30, 2014 |
41 |
SCHEDULE OF INVESTMENTS
June 30, 2014
Sit Developing Markets Growth Fund
Quantity | Name of Issuer | Fair Value ($) | ||||
Common Stocks - 97.0% | ||||||
Africa/Middle East - 10.5% | ||||||
Israel - 1.1% | ||||||
2,800 | NICE Systems, Ltd., ADR | 114,268 | ||||
|
| |||||
South Africa - 9.4% | ||||||
5,570 | Bidvest Group, Ltd. | 148,031 | ||||
10,450 | MTN Group, Ltd. | 220,117 | ||||
3,375 | Naspers, Ltd. | 397,382 | ||||
4,300 | Sasol, Ltd., ADR | 254,216 | ||||
|
| |||||
| 1,019,746 | ||||||
|
| |||||
Asia - 62.3% | ||||||
Australia - 3.3% | ||||||
3,950 | BHP Billiton, Ltd., ADR | 270,377 | ||||
1,625 | Rio Tinto, Ltd. | 91,163 | ||||
|
| |||||
| 361,540 | ||||||
|
| |||||
China/Hong Kong - 26.3% | ||||||
2,600 | Bitauto Holdings, Ltd., ADR * | 126,620 | ||||
5,400 | China Life Insurance Co., Ltd., ADR | 211,734 | ||||
34,000 | China Mengniu Dairy Co., Ltd. | 157,168 | ||||
80,000 | China Oilfield Services, Ltd. | 192,395 | ||||
3,600 | China Unicom Hong Kong, Ltd., ADR | 55,188 | ||||
389,500 | China ZhengTong Auto Services, Ltd. | 218,093 | ||||
90,000 | CIMC Enric Holdings, Ltd. | 118,548 | ||||
1,775 | CNOOC, Ltd., ADR | 318,240 | ||||
34,000 | ENN Energy Holdings, Ltd. | 244,144 | ||||
27,000 | Hengan International Group Co., Ltd. | 284,326 | ||||
2,000 | JD.com, Inc., ADR * | 57,020 | ||||
60,000 | Kunlun Energy Co., Ltd. | 98,914 | ||||
7,200 | New Oriental Education & Tech. Group, ADR | 191,304 | ||||
52,000 | PetroChina Co., Ltd. | 65,415 | ||||
33,000 | Tencent Holdings, Ltd. | 502,031 | ||||
|
| |||||
| 2,841,140 | ||||||
|
| |||||
India - 3.4% | ||||||
5,200 | ICICI Bank, Ltd., ADR | 259,480 | ||||
2,800 | Tata Motors, Ltd., ADR | 109,368 | ||||
|
| |||||
| 368,848 | ||||||
|
| |||||
Indonesia - 2.3% | ||||||
398,500 | Astra International Tbk PT | 244,666 | ||||
|
| |||||
Malaysia - 1.0% | ||||||
5,100 | British American Tobacco Malaysia | 104,106 | ||||
|
| |||||
Singapore - 2.4% | ||||||
9,000 | DBS Group Holdings, Ltd. | 121,047 | ||||
62,000 | OSIM International, Ltd. | 133,816 | ||||
|
| |||||
| 254,863 | ||||||
|
| |||||
Quantity | Name of Issuer | Fair Value ($) | ||||
South Korea - 13.9% | ||||||
11,685 | Cheil Worldwide, Inc. * | 263,427 | ||||
570 | E-Mart Co., Ltd. | 130,724 | ||||
4,787 | Industrial Bank of Korea | 63,859 | ||||
1,100 | POSCO, ADR | 81,884 | ||||
404 | Samsung Electronics Co., Ltd. | 527,604 | ||||
9,510 | Shinhan Financial Group Co., Ltd. | 438,756 | ||||
|
| |||||
| 1,506,254 | ||||||
|
| |||||
Taiwan - 5.4% | ||||||
78,177 | Cathay Financial Holding Co., Ltd. | 122,109 | ||||
27,250 | Hon Hai Precision Industry Co., Ltd., GDR | 181,212 | ||||
67,482 | Taiwan Semiconductor Co. | 285,553 | ||||
|
| |||||
| 588,874 | ||||||
|
| |||||
Thailand - 2.9% | ||||||
14,000 | Advanced Info Service PCL | 94,908 | ||||
36,800 | Bangkok Bank PCL | 219,385 | ||||
|
| |||||
| 314,293 | ||||||
|
| |||||
Turkey - 1.4% | ||||||
6,700 | BIM Birlesik Magazalar A/S | 153,715 | ||||
|
| |||||
Europe - 1.3% | ||||||
Russia - 1.3% | ||||||
15,800 | Gazprom OAO, ADR * | 137,286 | ||||
|
| |||||
Latin America - 22.9% | ||||||
Brazil - 19.3% | ||||||
3,400 | AGCO Corp. | 191,148 | ||||
53,700 | Ambev SA, ADR | 378,048 | ||||
19,801 | Banco Bradesco SA | 287,668 | ||||
5,000 | Cia Brasileira de Distribuicao Grupo Pao de Acucar, ADR | 231,650 | ||||
10,250 | Embraer SA, ADR | 373,407 | ||||
15,800 | Petrobras | 123,640 | ||||
20,500 | Qualicorp SA * | 242,344 | ||||
5,350 | Telefonica Brasil SA, ADR | 109,728 | ||||
11,400 | Vale SA, ADR | 150,822 | ||||
|
| |||||
| 2,088,455 | ||||||
|
| |||||
Chile - 1.5% | ||||||
5,950 | Banco Santander Chile, ADR | 157,384 | ||||
|
| |||||
Mexico - 1.0% | ||||||
3,300 | Grupo Televisa SA, ADR | 113,223 | ||||
|
| |||||
See accompanying notes to financial statements. | ||||
42 | SIT MUTUAL FUNDS ANNUAL REPORT |
Quantity | Name of Issuer | Fair Value ($) | ||||
Peru - 1.1% | ||||||
3,800 | Southern Copper Corp. | 115,409 | ||||
|
| |||||
Total Common Stocks | 10,484,070 | |||||
|
| |||||
Investment Companies - 1.2% | ||||||
4,500 | iShares MSCI India ETF | 133,807 | ||||
|
| |||||
(cost: $131,435) | ||||||
Total Investments in Securities - 98.2% | 10,617,877 | |||||
Other Assets and Liabilities, net - 1.8% | 189,838 | |||||
|
| |||||
Total Net Assets - 100.0% | $10,807,715 | |||||
|
| |||||
| * | Non-income producing security. |
Numeric footnotes not disclosed are not applicable to this Schedule of Investments.
ADR — American Depositary Receipt
GDR — Global Depositary Receipt
See accompanying notes to financial statements. | ||
JUNE 30, 2014 |
43 |
SCHEDULE OF INVESTMENTS
June 30, 2014
Sit Developing Markets Growth Fund (Continued)
A summary of the levels for the Fund’s investments as of June 30, 2014 is as follows (see Note 2 - significant accounting policies in the notes to financial statements):
| Investment in Securities | ||||||||||||||
Level 1 Quoted | Level 2 Other significant | Level 3 Significant | Total ($) | |||||||||||
Common Stocks | ||||||||||||||
Australia | 270,377 | 91,163 | — | 361,540 | ||||||||||
Brazil | 2,088,455 | — | — | 2,088,455 | ||||||||||
Chile | 157,384 | — | — | 157,384 | ||||||||||
China/Hong Kong | 960,106 | 1,881,034 | — | 2,841,140 | ||||||||||
India | 368,848 | — | — | 368,848 | ||||||||||
Indonesia | — | 244,666 | — | 244,666 | ||||||||||
Israel | 114,268 | — | — | 114,268 | ||||||||||
Malaysia | — | 104,106 | — | 104,106 | ||||||||||
Mexico | 113,223 | — | — | 113,223 | ||||||||||
Peru | 115,409 | — | — | 115,409 | ||||||||||
Russia | — | 137,286 | — | 137,286 | ||||||||||
Singapore | — | 254,863 | — | 254,863 | ||||||||||
South Africa | 254,216 | 765,530 | — | 1,019,746 | ||||||||||
South Korea | 81,884 | 1,424,370 | — | 1,506,254 | ||||||||||
Taiwan | 181,212 | 407,662 | — | 588,874 | ||||||||||
Thailand | — | 314,293 | — | 314,293 | ||||||||||
Turkey | — | 153,715 | — | 153,715 | ||||||||||
Investment Companies | 133,807 | — | — | 133,807 | ||||||||||
Total: | 4,839,189 | 5,778,688 | — | 10,617,877 | ||||||||||
The Fund adjusts the closing price of foreign equity securities by applying a systematic process for events occurring after the close of the foreign exchanges. At each reporting period, this process is applied for all foreign securities and therefore all foreign securities are classified as level 2. There are no transfers between level 1 and level 2 between reporting periods as a result of applying this process. Level 1 securities of foreign issuers are primarily American Depositary Receipts (ADRs) or Global Depositary Receipts (GDRs). There were no transfers into or out of level 3 during the reporting period.
See accompanying notes to financial statements. | ||||
44 | SIT MUTUAL FUNDS ANNUAL REPORT |
[This page intentionally left blank.]
JUNE 30, 2014 |
45 |
STATEMENTS OF ASSETS AND LIABILITIES
June 30, 2014
| Sit Balanced Fund | Sit Dividend Growth Fund | Sit Global Dividend Growth Fund | ||||||||||
ASSETS | ||||||||||||
Investments in securities, at identified cost | $ | 11,466,846 | $ | 889,151,209 | $ | 20,665,985 | ||||||
|
|
|
|
|
| |||||||
Investments in securities, at fair value - see accompanying schedule for detail | $ | 15,395,577 | $ | 1,111,659,797 | $ | 24,431,617 | ||||||
Cash in bank on demand deposit | 371,396 | 4,810,049 | 510,671 | |||||||||
Accrued interest and dividends receivable | 44,577 | 994,891 | 49,730 | |||||||||
Receivable for investment securities sold | 82,166 | 12,620,197 | — | |||||||||
Receivable for Fund shares sold | 385 | 2,987,219 | 25,000 | |||||||||
|
|
|
|
|
| |||||||
Total assets | 15,894,101 | 1,133,072,153 | 25,017,018 | |||||||||
|
|
|
|
|
| |||||||
LIABILITIES | ||||||||||||
Payable for investment securities purchased | 236,257 | 10,762,153 | 201,031 | |||||||||
Payable for Fund shares redeemed | — | 831,123 | — | |||||||||
Cash portion of dividends payable to shareholders | — | 293 | — | |||||||||
Accrued investment management fees and advisory fees | 12,746 | 917,793 | 24,979 | |||||||||
Accrued 12b-1 fees (Class S) | — | 21,222 | 682 | |||||||||
|
|
|
|
|
| |||||||
Total liabilities | 249,003 | 12,532,584 | 226,692 | |||||||||
|
|
|
|
|
| |||||||
Net assets applicable to outstanding capital stock | $ | 15,645,098 | $ | 1,120,539,569 | $ | 24,790,326 | ||||||
|
|
|
|
|
| |||||||
Net assets consist of: | ||||||||||||
Capital (par value and paid-in surplus) | $ | 11,547,082 | $ | 800,586,859 | $ | 19,835,075 | ||||||
Undistributed (distributions in excess of) net investment income | 55,722 | 3,646,772 | 120,563 | |||||||||
Accumulated net realized gain (loss) from security transactions and foreign currency transactions | 113,563 | 93,797,350 | 1,068,766 | |||||||||
Unrealized appreciation (depreciation) on investments and foreign currency transactions | 3,928,731 | 222,508,588 | 3,765,922 | |||||||||
|
|
|
|
|
| |||||||
| $ | 15,645,098 | $ | 1,120,539,569 | $ | 24,790,326 | |||||||
|
|
|
|
|
| |||||||
Outstanding shares: | ||||||||||||
Common Shares (Class I) * | 744,618 | 54,429,898 | 1,363,830 | |||||||||
|
|
|
|
|
| |||||||
Common Shares (Class S) * | — | 5,553,035 | 211,394 | |||||||||
|
|
|
|
|
| |||||||
Net assets applicable to outstanding shares: | ||||||||||||
Common Shares (Class I) * | $ | 15,645,098 | $ | 1,017,106,312 | $ | 21,467,420 | ||||||
|
|
|
|
|
| |||||||
Common Shares (Class S) * | — | 103,433,257 | 3,322,906 | |||||||||
|
|
|
|
|
| |||||||
Net asset value per share of outstanding capital stock: | ||||||||||||
Common Shares (Class I) * | $21.01 | $18.69 | $15.74 | |||||||||
|
|
|
|
|
| |||||||
Common Shares (Class S) * | — | $ | 18.63 | $ | 15.72 | |||||||
|
|
|
|
|
| |||||||
| * | Dividend Growth and Global Dividend Growth Funds offer multiple share classes (I and S). All other Funds offer a single share class. |
See accompanying notes to financial statements. | ||||
46 | SIT MUTUAL FUNDS ANNUAL REPORT |
| Sit Large Cap Growth Fund | Sit Mid Cap Growth Fund | Sit Small Cap Growth Fund | Sit International Growth Fund | Sit Developing Markets Growth Fund | ||||||||||||||
| $121,532,787 | $104,527,358 | $63,109,984 | $18,612,745 | $7,754,873 | ||||||||||||||
|
|
|
|
|
|
|
|
|
| |||||||||
| $187,028,393 | $177,434,362 | $97,560,166 | $23,731,927 | $10,617,877 | ||||||||||||||
| 2,012,532 | 1,596,021 | 1,315,750 | 315,594 | 199,386 | ||||||||||||||
| 103,693 | 68,581 | 10,871 | 107,407 | 19,456 | ||||||||||||||
| 345,695 | 2,278,387 | 2,231,721 | 63,714 | — | ||||||||||||||
| 21,250 | 3,224 | 6,154 | — | 298 | ||||||||||||||
|
|
|
|
|
|
|
|
|
| |||||||||
| 189,511,563 | 181,380,575 | 101,124,662 | 24,218,642 | 10,837,017 | ||||||||||||||
|
|
|
|
|
|
|
|
|
| |||||||||
| 346,906 | 895,659 | 1,433,813 | 59,729 | — | ||||||||||||||
| 435,711 | 24,932 | 60,109 | 2,115 | 11,713 | ||||||||||||||
| — | — | — | — | — | ||||||||||||||
| 154,983 | 184,416 | 120,957 | 29,382 | 17,589 | ||||||||||||||
| — | — | — | — | — | ||||||||||||||
|
|
|
|
|
|
|
|
|
| |||||||||
| 937,600 | 1,105,007 | 1,614,879 | 91,226 | 29,302 | ||||||||||||||
|
|
|
|
|
|
|
|
|
| |||||||||
| $188,573,963 | $180,275,568 | $99,509,783 | $24,127,416 | $10,807,715 | ||||||||||||||
|
|
|
|
|
|
|
|
|
| |||||||||
| $99,070,889 | $88,883,448 | $56,253,831 | $19,869,867 | $7,289,886 | ||||||||||||||
| 455,556 | — | — | 354,576 | — | ||||||||||||||
|
| 23,551,912 |
| 18,485,116 | 8,805,770 | (1,218,324 | ) | 654,819 | |||||||||||
|
| 65,495,606 |
| 72,907,004 | 34,450,182 | 5,121,297 | 2,863,010 | ||||||||||||
|
|
|
|
|
|
|
|
|
| |||||||||
| $188,573,963 | $180,275,568 | $99,509,783 | $24,127,416 | $10,807,715 | ||||||||||||||
|
|
|
|
|
|
|
|
|
| |||||||||
| 3,591,178 | 8,550,381 | 1,621,239 | 1,383,794 | 618,383 | ||||||||||||||
|
|
|
|
|
|
|
|
|
| |||||||||
| — | — | — | — | — | ||||||||||||||
|
|
|
|
|
|
|
|
|
| |||||||||
| $188,573,963 | $180,275,568 | $99,509,783 | $24,127,416 | $10,807,715 | ||||||||||||||
|
|
|
|
|
|
|
|
|
| |||||||||
| — | — | — | — | — | ||||||||||||||
|
|
|
|
|
|
|
|
|
| |||||||||
| $52.51 | $21.08 | $61.38 | $17.44 | $17.48 | ||||||||||||||
|
|
|
|
|
|
|
|
|
| |||||||||
| — | — | — | — | — | ||||||||||||||
|
|
|
|
|
|
|
|
|
| |||||||||
JUNE 30, 2014 | 47 |
Year Ended June 30, 2014
| Sit Balanced Fund | Sit Dividend Growth Fund | Sit Global Dividend Growth Fund | ||||||||||
Investment income: | ||||||||||||
Income: | ||||||||||||
Dividends* | $168,967 | $27,365,141 | $622,206 | |||||||||
Interest | 178,942 | — | — | |||||||||
|
|
|
|
|
| |||||||
Total income | 347,909 | 27,365,141 | 622,206 | |||||||||
|
|
|
|
|
| |||||||
Expenses (note 4): | ||||||||||||
Investment management and advisory service fee | 147,655 | 10,960,422 | 277,454 | |||||||||
12b-1 fees (Class S) | — | 325,806 | 9,084 | |||||||||
|
|
|
|
|
| |||||||
Total expenses | 147,655 | 11,286,228 | 286,538 | |||||||||
|
|
|
|
|
| |||||||
Net investment income (loss) | 200,254 | 16,078,913 | 335,668 | |||||||||
|
|
|
|
|
| |||||||
Realized and unrealized gain (loss): | ||||||||||||
Net realized gain (loss) on investments | 788,842 | 120,808,574 | 1,364,387 | |||||||||
Net realized gain (loss) on foreign currency transactions | — | — | (421 | ) | ||||||||
Net change in unrealized appreciation (depreciation) on investmentsand foreign currency transactions | 1,132,195 | 64,724,930 | 1,616,209 | |||||||||
|
|
|
|
|
| |||||||
Net gain (loss) | 1,921,037 | 185,533,504 | 2,980,175 | |||||||||
|
|
|
|
|
| |||||||
Net increase (decrease) in net assets resulting from operations | $2,121,291 | $201,612,417 | $3,315,843 | |||||||||
|
|
|
|
|
| |||||||
| ||||||||||||
* Foreign taxes withheld on dividends received | $85 | $114,176 | $25,310 | |||||||||
See accompanying notes to financial statements. |
48 | SIT MUTUAL FUNDS ANNUAL REPORT |
| Sit Large Cap Growth Fund | Sit Mid Cap Growth Fund | Sit Small Cap Growth Fund | Sit International Growth Fund | Sit Developing Markets Growth Fund | ||||||||||||||
| $3,099,906 | $1,508,604 | $547,246 | $738,897 | $210,241 | ||||||||||||||
| — | — | — | — | — | ||||||||||||||
|
|
|
|
|
|
|
|
|
| |||||||||
| 3,099,906 | 1,508,604 | 547,246 | 738,897 | 210,241 | ||||||||||||||
|
|
|
|
|
|
|
|
|
| |||||||||
| 1,978,793 | 2,144,723 | 1,456,372 | 347,507 | 217,916 | ||||||||||||||
| — | — | — | — | — | ||||||||||||||
|
|
|
|
|
|
|
|
|
| |||||||||
| 1,978,793 | 2,144,723 | 1,456,372 | 347,507 | 217,916 | ||||||||||||||
|
|
|
|
|
|
|
|
|
| |||||||||
| 1,121,113 | (636,119 | ) | (909,126 | ) | 391,390 | (7,675 | ) | |||||||||||
|
|
|
|
|
|
|
|
|
| |||||||||
| 31,100,027 | 19,973,360 | 10,433,876 | 1,837,344 | 654,838 | ||||||||||||||
| — | — | — | (3,295 | ) | (751 | ) | ||||||||||||
|
| 8,823,262 |
| 18,652,542 | 9,402,621 | 1,342,866 | 641,337 | ||||||||||||
|
|
|
|
|
|
|
|
|
| |||||||||
| 39,923,289 | 38,625,902 | 19,836,497 | 3,176,915 | 1,295,424 | ||||||||||||||
|
|
|
|
|
|
|
|
|
| |||||||||
| $41,044,402 | $37,989,783 | $18,927,371 | $3,568,305 | $1,287,749 | ||||||||||||||
|
|
|
|
|
|
|
|
|
| |||||||||
| $1,210 | $6,493 | $2,689 | $52,534 | $26,600 | ||||||||||||||
JUNE 30, 2014 |
49 |
STATEMENTS OF CHANGES IN NET ASSETS
| Sit Balanced Fund | Sit Dividend Growth Fund | |||||||||||||||
| Year Ended June 30, 2014 | Year Ended June 30, 2013 | Year Ended June 30, 2014 | Year Ended June 30, 2013 | |||||||||||||
Operations: | ||||||||||||||||
Net investment income (loss) | $200,254 | $193,642 | $16,078,913 | $14,804,432 | ||||||||||||
Net realized gain (loss) on investments and foreign currency transactions | 788,842 | 102,059 | 120,808,574 | 22,700,812 | ||||||||||||
Net change in unrealized appreciation (depreciation) on investments and foreign currency transactions | 1,132,195 | 923,868 | 64,724,930 | 111,370,988 | ||||||||||||
|
|
|
|
|
|
|
| |||||||||
Net increase in net assets resulting from operations | 2,121,291 | 1,219,569 | 201,612,417 | 148,876,232 | ||||||||||||
|
|
|
|
|
|
|
| |||||||||
Distributions from: | ||||||||||||||||
Net investment income | ||||||||||||||||
Common shares (Class I) | (190,000 | ) | (196,000 | ) | (14,116,740 | ) | (11,965,578 | ) | ||||||||
Common shares (Class S) | — | — | (1,647,273 | ) | (1,731,523 | ) | ||||||||||
Net realized gains on investments | ||||||||||||||||
Common shares (Class I) | — | — | (34,547,857 | ) | (10,089,890 | ) | ||||||||||
Common shares (Class S) | — | — | (5,368,982 | ) | (1,708,350 | ) | ||||||||||
|
|
|
|
|
|
|
| |||||||||
Total distributions | (190,000 | ) | (196,000 | ) | (55,680,852 | ) | (25,495,341 | ) | ||||||||
|
|
|
|
|
|
|
| |||||||||
Capital share transactions: | ||||||||||||||||
Proceeds from shares sold | ||||||||||||||||
Common shares (Class I) | 1,552,785 | 2,160,216 | 215,015,927 | 391,479,786 | ||||||||||||
Common shares (Class S) | — | — | 24,916,784 | 45,123,682 | ||||||||||||
Reinvested distributions | ||||||||||||||||
Common shares (Class I) | 188,535 | 194,442 | 17,771,240 | 8,486,434 | ||||||||||||
Common shares (Class S) | — | — | 6,951,326 | 3,416,911 | ||||||||||||
Payments for shares redeemed | ||||||||||||||||
Common shares (Class I) | (1,519,254 | ) | (1,707,960 | ) | (266,221,111 | ) | (205,257,111 | ) | ||||||||
Common shares (Class S) | — | — | (78,648,123 | ) | (32,353,411 | ) | ||||||||||
|
|
|
|
|
|
|
| |||||||||
Increase (decrease) in net assets from capital transactions. | 222,066 | 646,698 | (80,213,957 | ) | 210,896,291 | |||||||||||
|
|
|
|
|
|
|
| |||||||||
Total increase (decrease) in net assets | 2,153,357 | 1,670,267 | 65,717,608 | 334,277,182 | ||||||||||||
Net assets: | ||||||||||||||||
Beginning of period | 13,491,741 | 11,821,474 | 1,054,821,961 | 720,544,779 | ||||||||||||
|
|
|
|
|
|
|
| |||||||||
End of period * | $15,645,098 | $13,491,741 | $1,120,539,569 | $1,054,821,961 | ||||||||||||
|
|
|
|
|
|
|
| |||||||||
Capital transactions in shares: | ||||||||||||||||
Sold | ||||||||||||||||
Common shares (Class I) | 79,403 | 119,571 | 12,312,665 | 25,170,642 | ||||||||||||
Common shares (Class S) | — | — | 1,452,954 | 2,958,887 | ||||||||||||
Reinvested distributions | ||||||||||||||||
Common shares (Class I) | 9,775 | 11,088 | 1,033,969 | 574,182 | ||||||||||||
Common shares (Class S) | — | — | 405,516 | 232,216 | ||||||||||||
Redeemed | ||||||||||||||||
Common shares (Class I) | (77,091 | ) | (94,923 | ) | (15,216,805 | ) | (13,377,883 | ) | ||||||||
Common shares (Class S) | — | — | (4,559,813 | ) | (2,112,078 | ) | ||||||||||
|
|
|
|
|
|
|
| |||||||||
Net increase (decrease) | 12,087 | 35,736 | (4,571,514 | ) | 13,445,966 | |||||||||||
|
|
|
|
|
|
|
| |||||||||
* includes undistributed (distributions in excess) net investment income (loss) | $55,722 | $45,468 | $3,646,772 | $3,697,176 | ||||||||||||
See accompanying notes to financial statements. |
50 | SIT MUTUAL FUNDS ANNUAL REPORT |
| Sit Global Dividend Growth Fund | Sit Large Cap Growth Fund | Sit Mid Cap Growth Fund | ||||||||||||||||||||
| Year Ended June 30, 2014 | Year Ended June 30, 2013 | Year Ended June 30, 2014 | Year Ended June 30, 2013 | Year Ended June 30, 2014 | Year Ended June 30, 2013 | |||||||||||||||||
| $335,668 | $266,836 | $1,121,113 | $2,045,780 | ($636,119 | ) | ($246,882 | ) | |||||||||||||||
|
| 1,363,966 |
| 681,970 | 31,100,027 | 30,360,515 | 19,973,360 | 7,449,677 | |||||||||||||||
|
| 1,616,209 |
| 1,238,541 | 8,823,262 | (2,912,175 | ) | 18,652,542 | 12,813,030 | ||||||||||||||
|
|
|
|
|
|
|
|
|
|
|
| |||||||||||
| 3,315,843 | 2,187,347 | 41,044,402 | 29,494,120 | 37,989,783 | 20,015,825 | |||||||||||||||||
|
|
|
|
|
|
|
|
|
|
|
| |||||||||||
| (263,794 | ) | (196,378 | ) | (1,460,025 | ) | (2,065,000 | ) | — | — | |||||||||||||
| (43,211 | ) | (39,623 | ) | — | — | — | — | |||||||||||||||
| (736,258 | ) | (68,213 | ) | (19,160,085 | ) | (16,571,341 | ) | (8,937,914 | ) | (3,183,573 | ) | |||||||||||
| (153,131 | ) | (15,464 | ) | — | — | — | — | |||||||||||||||
|
|
|
|
|
|
|
|
|
|
|
| |||||||||||
| (1,196,394 | ) | (319,678 | ) | (20,620,110 | ) | (18,636,341 | ) | (8,937,914 | ) | (3,183,573 | ) | |||||||||||
|
|
|
|
|
|
|
|
|
|
|
| |||||||||||
| 5,465,390 | 3,225,955 | 5,430,647 | 10,446,065 | 2,174,926 | 5,582,140 | |||||||||||||||||
| 1,326,440 | 829,670 | — | — | — | — | |||||||||||||||||
| 999,990 | 259,962 | 20,300,124 | 18,309,598 | 8,666,217 | 3,080,881 | |||||||||||||||||
| 196,343 | 55,002 | — | — | — | — | |||||||||||||||||
| (1,000,114 | ) | (1,247,399 | ) | (53,865,750 | ) | (97,585,147 | ) | (11,746,192 | ) | (17,967,678 | ) | |||||||||||
| (1,770,346 | ) | (567,072 | ) | — | — | — | — | |||||||||||||||
|
|
|
|
|
|
|
|
|
|
|
| |||||||||||
|
| 5,217,703 |
| 2,556,118 | (28,134,979 | ) | (68,829,484 | ) | (905,049 | ) | (9,304,657 | ) | |||||||||||
|
|
|
|
|
|
|
|
|
|
|
| |||||||||||
| 7,337,152 | 4,423,787 | (7,710,687 | ) | (57,971,705 | ) | 28,146,820 | 7,527,595 | |||||||||||||||
| 17,453,174 | 13,029,387 | 196,284,650 | 254,256,355 | 152,128,748 | 144,601,153 | |||||||||||||||||
|
|
|
|
|
|
|
|
|
|
|
| |||||||||||
| $24,790,326 | $17,453,174 | $188,573,963 | $196,284,650 | $180,275,568 | $152,128,748 | |||||||||||||||||
|
|
|
|
|
|
|
|
|
|
|
| |||||||||||
| 366,646 | 232,699 | 107,350 | 223,599 | 108,717 | 330,997 | |||||||||||||||||
| 87,386 | 59,328 | — | — | — | — | |||||||||||||||||
| 67,695 | 19,646 | 412,688 | 417,360 | 433,962 | 189,127 | |||||||||||||||||
| 13,301 | 4,174 | — | — | — | — | |||||||||||||||||
| (65,214 | ) | (87,696 | ) | (1,058,721 | ) | (2,094,980 | ) | (592,470 | ) | (1,089,062 | ) | |||||||||||
| (117,825 | ) | (43,011 | ) | — | — | — | — | |||||||||||||||
|
|
|
|
|
|
|
|
|
|
|
| |||||||||||
| 351,989 | 185,140 | (538,683 | ) | (1,454,021 | ) | (49,791 | ) | (568,938 | ) | |||||||||||||
|
|
|
|
|
|
|
|
|
|
|
| |||||||||||
|
| $120,563 |
| $96,078 | $455,556 | $794,468 | — | — | |||||||||||||||
| ||
JUNE 30, 2014 |
51 |
STATEMENTS OF CHANGES IN NET ASSETS (Continued)
| Sit Small Cap Growth Fund | Sit International Growth Fund | |||||||||||||||
| Year Ended June 30, 2014 | Year Ended June 30, 2013 | Year Ended June 30, 2014 | Year Ended June 30, 2013 | |||||||||||||
Operations: | ||||||||||||||||
Net investment income (loss) | ($909,126 | ) | ($514,321 | ) | $391,390 | $285,688 | ||||||||||
Net realized gain (loss) on investments and foreign currency transactions | 10,433,876 | 4,028,160 | 1,834,049 | 1,313,937 | ||||||||||||
Net change in unrealized appreciation (depreciation) of investments and foreign currency transactions | 9,402,621 | 7,149,264 | 1,342,866 | 1,196,714 | ||||||||||||
|
|
|
|
|
|
|
| |||||||||
Net increase in net assets resulting from operations | 18,927,371 | 10,663,103 | 3,568,305 | 2,796,339 | ||||||||||||
|
|
|
|
|
|
|
| |||||||||
Distributions from: | ||||||||||||||||
Net investment income | ||||||||||||||||
Common shares (Class I) | — | — | (231,001 | ) | (323,000 | ) | ||||||||||
Net realized gains on investments | ||||||||||||||||
Common shares (Class I) | — | — | — | — | ||||||||||||
|
|
|
|
|
|
|
| |||||||||
Total distributions | — | — | (231,001 | ) | (323,000 | ) | ||||||||||
|
|
|
|
|
|
|
| |||||||||
Capital share transactions: | ||||||||||||||||
Proceeds from shares sold | ||||||||||||||||
Common shares (Class I) | 4,035,232 | 2,569,401 | 1,784,889 | 691,966 | ||||||||||||
Reinvested distributions | ||||||||||||||||
Common shares (Class I) | — | — | 229,662 | 321,167 | ||||||||||||
Payments for shares redeemed | ||||||||||||||||
Common shares (Class I) | (8,245,564 | ) | (6,642,060 | ) | (2,114,470 | ) | (1,892,538 | ) | ||||||||
|
|
|
|
|
|
|
| |||||||||
Decrease in net assets from capital transactions | (4,210,332 | ) | (4,072,659 | ) | (99,919 | ) | (879,405 | ) | ||||||||
|
|
|
|
|
|
|
| |||||||||
Total increase (decrease) in net assets | 14,717,039 | 6,590,444 | 3,237,385 | 1,593,934 | ||||||||||||
Net assets: | ||||||||||||||||
Beginning of period | 84,792,744 | 78,202,300 | 20,890,031 | 19,296,097 | ||||||||||||
|
|
|
|
|
|
|
| |||||||||
End of period* | $99,509,783 | $84,792,744 | $24,127,416 | $20,890,031 | ||||||||||||
|
|
|
|
|
|
|
| |||||||||
Capital transactions in shares: | ||||||||||||||||
Sold | ||||||||||||||||
Common shares (Class I) | 70,531 | 54,522 | 108,905 | 45,368 | ||||||||||||
Reinvested distributions | ||||||||||||||||
Common shares (Class I) | — | — | 13,868 | 21,759 | ||||||||||||
Redeemed | ||||||||||||||||
Common shares (Class I) | (142,415 | ) | (142,873 | ) | (127,374 | ) | (130,179 | ) | ||||||||
|
|
|
|
|
|
|
| |||||||||
Net decrease | (71,884 | ) | (88,351 | ) | (4,601 | ) | (63,052 | ) | ||||||||
|
|
|
|
|
|
|
| |||||||||
*includes undistributed (distributions in excess) net investment income (loss) | — | — | $354,576 | $197,482 | ||||||||||||
See accompanying notes to financial statements. |
52 | SIT MUTUAL FUNDS ANNUAL REPORT |
| Sit Developing Markets Growth Fund | ||||||
| Year Ended June 30, 2014 | Year Ended June 30, 2013 | |||||
| ($7,675 | ) | $27,935 | ||||
|
| 654,087 |
| 825,847 | |||
|
| 641,337 |
| (765,583 | ) | ||
|
|
|
| |||
| 1,287,749 | 88,199 | |||||
|
|
|
| |||
| (16,575 | ) | (36,001 | ) | |||
| (596,525 | ) | (881,318 | ) | |||
|
|
|
| |||
| (613,100 | ) | (917,319 | ) | |||
|
|
|
| |||
| 876,017 | 882,833 | |||||
| 602,798 | 901,850 | |||||
| (1,961,000 | ) | (1,974,407 | ) | |||
|
|
|
| |||
| (482,185 | ) | (189,724 | ) | |||
|
|
|
| |||
| 192,464 | (1,018,844 | ) | ||||
| 10,615,251 | 11,634,095 | |||||
|
|
|
| |||
| $10,807,715 | $10,615,251 | |||||
|
|
|
| |||
| 50,956 | 48,716 | |||||
| 35,859 | 50,552 | |||||
| (115,884 | ) | (109,173 | ) | |||
|
|
|
| |||
| (29,069 | ) | (9,905 | ) | |||
|
|
|
| |||
|
| — |
| $16,575 | |||
| ||
JUNE 30, 2014 |
53 |
Per share income and capital changes for a share outstanding throughout the period. See accompanying notes to financial statements.
Sit Balanced Fund
| Years Ended June 30, | ||||||||||||||||||||
| 2014 | 2013 | 2012 | 2011 | 2010 | ||||||||||||||||
Net Asset Value: | ||||||||||||||||||||
Beginning of period | $18.42 | $16.97 | $16.47 | $14.18 | $12.96 | |||||||||||||||
Operations: | ||||||||||||||||||||
Net investment income 1 | 0.27 | 0.27 | 0.29 | 0.27 | 0.35 | |||||||||||||||
Net realized and unrealized gains | 2.58 | 1.46 | 0.46 | 2.32 | 1.24 | |||||||||||||||
Total from operations | 2.85 | 1.73 | 0.75 | 2.59 | 1.59 | |||||||||||||||
Distributions to Shareholders: | ||||||||||||||||||||
From net investment income | (0.26 | ) | (0.28 | ) | (0.25 | ) | (0.30 | ) | (0.37 | ) | ||||||||||
Net Asset Value: | ||||||||||||||||||||
End of period | $21.01 | $18.42 | $16.97 | $16.47 | $14.18 | |||||||||||||||
Total investment return 2 | 15.58% | 10.26% | 4.61% | 18.46% | 12.33% | |||||||||||||||
Net assets at end of period (000’s omitted) | $15,645 | $13,492 | $11,821 | $11,150 | $10,550 | |||||||||||||||
Ratios: 3 | ||||||||||||||||||||
Expenses | 1.00% | 1.00% | 1.00% | 1.00% | 1.00% | |||||||||||||||
Net investment income | 1.36% | 1.52% | 1.75% | 1.75% | 2.44% | |||||||||||||||
Portfolio turnover rate (excluding short-term securities) | 54.52% | 30.86% | 47.01% | 40.84% | 46.79% | |||||||||||||||
| 1 | The net investment income per share is based on average shares outstanding for the period. |
| 2 | Total investment return is based on the change in net asset value of a share during the period (not annualized) and assumes reinvestment of distributions at net asset value. |
| 3 | Ratios are annualized for periods less than one year. In addition to fees and expenses which the Fund bears directly, the Fund indirectly bears a pro rata share of the fees and expenses of the acquired funds in which it invests. Such indirect expenses are not included in the above reported expense ratios. |
54 | SIT MUTUAL FUNDS ANNUAL REPORT |
FINANCIAL HIGHLIGHTS
Per share income and capital changes for a share outstanding throughout the period. See accompanying notes to financial statements.
Sit Dividend Growth Fund
| Class I | Years Ended June 30, | |||||||||||||||||||
| 2014 | 2013 | 2012 | 2011 | 2010 | ||||||||||||||||
Net Asset Value: | ||||||||||||||||||||
Beginning of period | $16.35 | $14.10 | $13.91 | $10.64 | $9.60 | |||||||||||||||
Operations: | ||||||||||||||||||||
Net investment income 1 | 0.26 | 0.27 | 0.24 | 0.21 | 0.19 | |||||||||||||||
Net realized and unrealized gains | 2.96 | 2.46 | 0.26 | 3.23 | 1.03 | |||||||||||||||
Total from operations | 3.22 | 2.73 | 0.50 | 3.44 | 1.22 | |||||||||||||||
Redemption fees 2 | — | — | — | — | — | |||||||||||||||
Distributions to Shareholders: | ||||||||||||||||||||
From net investment income | (0.25) | (0.26 | ) | (0.21 | ) | (0.17 | ) | (0.18 | ) | |||||||||||
From net realized gains | (0.63) | (0.22 | ) | (0.10 | ) | — | — | |||||||||||||
Total distributions | (0.88) | (0.48 | ) | (0.31 | ) | (0.17 | ) | (0.18 | ) | |||||||||||
Net Asset Value: | ||||||||||||||||||||
End of period | $18.69 | $16.35 | $14.10 | $13.91 | $10.64 | |||||||||||||||
Total investment return 3 | 20.26% | 19.77% | 3.76% | 32.58% | 12.71% | |||||||||||||||
Net assets at end of period (000’s omitted) | $1,017,106 | $920,324 | $619,667 | $328,057 | $39,430 | |||||||||||||||
Ratios: 4 | ||||||||||||||||||||
Expenses | 1.00% | 1.00% | 1.00% | 1.00% | 1.00% | |||||||||||||||
Net investment income | 1.50% | 1.78% | 1.79% | 1.59% | 1.70% | |||||||||||||||
Portfolio turnover rate (excluding short-term securities) | 44.36% | 26.58% | 26.84% | 14.67% | 31.84% | |||||||||||||||
| Class S | Years Ended June 30, | |||||||||||||||||||
| 2014 | 2013 | 2012 | 2011 | 2010 | ||||||||||||||||
Net Asset Value: | ||||||||||||||||||||
Beginning of period | $16.29 | $14.06 | $13.87 | $10.61 | $9.58 | |||||||||||||||
Operations: | ||||||||||||||||||||
Net investment income 1 | 0.22 | 0.23 | 0.21 | 0.17 | 0.16 | |||||||||||||||
Net realized and unrealized gains | 2.96 | 2.44 | 0.26 | 3.23 | 1.02 | |||||||||||||||
Total from operations | 3.18 | 2.67 | 0.47 | 3.40 | 1.18 | |||||||||||||||
Redemption fees 2 | — | — | — | — | — | |||||||||||||||
Distributions to Shareholders: | ||||||||||||||||||||
From net investment income | (0.21 | ) | (0.22 | ) | (0.18 | ) | (0.14 | ) | (0.15 | ) | ||||||||||
From net realized gains | (0.63 | ) | (0.22 | ) | (0.10 | ) | — | — | ||||||||||||
Total distributions | (0.84 | ) | (0.44 | ) | (0.28 | ) | (0.14 | ) | (0.15 | ) | ||||||||||
Net Asset Value: | ||||||||||||||||||||
End of period | $18.63 | $16.29 | $14.06 | $13.87 | $10.61 | |||||||||||||||
Total investment return 3 | 20.02% | 19.39% | 3.53% | 32.27% | 12.37% | |||||||||||||||
Net assets at end of period (000’s omitted) | $103,433 | $134,498 | $100,878 | $56,280 | $24,894 | |||||||||||||||
Ratios: 4 | ||||||||||||||||||||
Expenses | 1.25% | 1.25% | 1.25% | 1.25% | 1.25% | |||||||||||||||
Net investment income | 1.25% | 1.53% | 1.54% | 1.34% | 1.45% | |||||||||||||||
Portfolio turnover rate (excluding short-term securities) | 44.36% | 26.58% | 26.84% | 14.67% | 31.84% | |||||||||||||||
| 1 | The net investment income per share is based on average shares outstanding for the period. |
| 2 | Amount represents less than $0.01 per share. |
| 3 | Total investment return is based on the change in net asset value of a share during the period (not annualized) and assumes reinvestment of distributions at net asset value. |
| 4 | Ratios are annualized for periods less than one year. In addition to fees and expenses which the Fund bears directly, the Fund indirectly bears a pro rata share of the fees and expenses of the acquired funds in which it invests. Such indirect expenses are not included in the above reported expense ratios. |
JUNE 30, 2014 |
55 |
FINANCIAL HIGHLIGHTS
Per share income and capital changes for a share outstanding throughout the period. See accompanying notes to financial statements.
Sit Global Dividend Growth Fund
| Class I | Years Ended June 30, | |||||||||||||||||||
| 2014 | 2013 | 2012 | 2011 | 2010 | ||||||||||||||||
Net Asset Value: | ||||||||||||||||||||
Beginning of period | $14.27 | $12.55 | $13.26 | $10.41 | $9.70 | |||||||||||||||
Operations: | ||||||||||||||||||||
Net investment income 1 | 0.23 | 0.25 | 0.24 | 0.20 | 0.17 | |||||||||||||||
Net realized and unrealized gains (losses) | 2.09 | 1.78 | (0.58 | ) | 2.95 | 0.68 | ||||||||||||||
Total from operations | 2.32 | 2.03 | (0.34 | ) | 3.15 | 0.85 | ||||||||||||||
Redemption fees 2 | — | — | — | — | — | |||||||||||||||
Distributions to Shareholders: | ||||||||||||||||||||
From net investment income | (0.22 | ) | (0.23 | ) | (0.22 | ) | (0.17 | ) | (0.14 | ) | ||||||||||
From net realized gains | (0.63 | ) | (0.08 | ) | (0.15 | ) | (0.13 | ) | — | |||||||||||
Total distributions | (0.85 | ) | (0.31 | ) | (0.37 | ) | (0.30 | ) | (0.14 | ) | ||||||||||
Net Asset Value: | ||||||||||||||||||||
End of period | $15.74 | $14.27 | $12.55 | $13.26 | $10.41 | |||||||||||||||
Total investment return 3 | 16.76% | 16.36% | (2.44% | ) | 30.55% | 8.79% | ||||||||||||||
Net assets at end of period (000’s omitted) | $21,467 | $14,196 | $10,421 | $7,834 | $2,832 | |||||||||||||||
Ratios: 4 | ||||||||||||||||||||
Expenses | 1.25% | 1.25% | 1.25% | 1.25% | 1.25% | |||||||||||||||
Net investment income | 1.55% | 1.81% | 1.97% | 1.57% | 1.48% | |||||||||||||||
Portfolio turnover rate (excluding short-term securities)
|
| 48.68%
|
|
| 26.15%
|
|
| 26.65%
|
|
| 21.84%
|
|
| 21.60%
|
| |||||
| Class S | Years Ended June 30, | |||||||||||||||||||
| 2014 | 2013 | 2012 | 2011 | 2010 | ||||||||||||||||
Net Asset Value: | ||||||||||||||||||||
Beginning of period | $14.25 | $12.54 | $13.24 | $10.40 | $9.70 | |||||||||||||||
Operations: | ||||||||||||||||||||
Net investment income 1 | 0.20 | 0.21 | 0.21 | 0.16 | 0.14 | |||||||||||||||
Net realized and unrealized gains (losses) | 2.09 | 1.78 | (0.57 | ) | 2.95 | 0.68 | ||||||||||||||
Total from operations | 2.29 | 1.99 | (0.36 | ) | 3.11 | 0.82 | ||||||||||||||
Redemption fees | — | 2 | — | — | — | — | ||||||||||||||
Distributions to Shareholders: | ||||||||||||||||||||
From net investment income | (0.19 | ) | (0.20 | ) | (0.19 | ) | (0.14 | ) | (0.12 | ) | ||||||||||
From net realized gains | (0.63 | ) | (0.08 | ) | (0.15 | ) | (0.13 | ) | — | |||||||||||
Total distributions | (0.82 | ) | (0.28 | ) | (0.34 | ) | (0.27 | ) | (0.12 | ) | ||||||||||
Net Asset Value: | ||||||||||||||||||||
End of period | $15.72 | $14.25 | $12.54 | $13.24 | $10.40 | |||||||||||||||
Total investment return 3 | 16.49% | 16.01% | (2.60% | ) | 30.17% | 8.47% | ||||||||||||||
Net assets at end of period (000’s omitted) | $3,323 | $3,257 | $2,608 | $1,444 | $882 | |||||||||||||||
Ratios: 4 | ||||||||||||||||||||
Expenses | 1.50% | 1.50% | 1.50% | 1.50% | 1.50% | |||||||||||||||
Net investment income | 1.30% | 1.56% | 1.72% | 1.32% | 1.23% | |||||||||||||||
Portfolio turnover rate (excluding short-term securities) | 48.68% | 26.15% | 26.65% | 21.84% | 21.60% | |||||||||||||||
| 1 | The net investment income per share is based on average shares outstanding for the period. |
| 2 | Amount represents less than $0.01 per share. |
| 3 | Total investment return is based on the change in net asset value of a share during the period (not annualized) and assumes reinvestment of distributions at net asset value. |
| 4 | Ratios are annualized for periods less than one year. In addition to fees and expenses which the Fund bears directly, the Fund indirectly bears a pro rata share of the fees and expenses of the acquired funds in which it invests. Such indirect expenses are not included in the above reported expense ratios. |
56 | SIT MUTUAL FUNDS ANNUAL REPORT |
FINANCIAL HIGHLIGHTS
Per share income and capital changes for a share outstanding throughout the period. See accompanying notes to financial statements.
Sit Large Cap Growth Fund
Years Ended June 30, | ||||||||||||||||||||
| 2014 | 2013 | 2012 | 2011 | 2010 | ||||||||||||||||
Net Asset Value: | ||||||||||||||||||||
Beginning of period | $47.53 | $45.53 | $43.96 | $34.75 | $32.42 | |||||||||||||||
Operations: | ||||||||||||||||||||
Net investment income 1 | 0.29 | 0.43 | 0.26 | 0.22 | 0.22 | |||||||||||||||
Net realized and unrealized gains | 10.23 | 5.69 | 1.63 | 9.21 | 2.33 | |||||||||||||||
Total from operations | 10.52 | 6.12 | 1.89 | 9.43 | 2.55 | |||||||||||||||
Redemption fees 2 | — | — | — | — | — | |||||||||||||||
Distributions to Shareholders: | ||||||||||||||||||||
From net investment income | (0.39 | ) | (0.46 | ) | (0.32 | ) | (0.22 | ) | (0.22 | ) | ||||||||||
From net realized gains | (5.15 | ) | (3.66 | ) | — | — | — | |||||||||||||
Total distributions | (5.54 | ) | (4.12 | ) | (0.32 | ) | (0.22 | ) | (0.22 | ) | ||||||||||
Net Asset Value: | ||||||||||||||||||||
End of period | $52.51 | $47.53 | $45.53 | $43.96 | $34.75 | |||||||||||||||
Total investment return 3 | 22.92% | 14.18% | 4.39% | 27.18% | 7.80% | |||||||||||||||
Net assets at end of period (000’s omitted) | $188,574 | $196,285 | $254,256 | $365,045 | $407,359 | |||||||||||||||
Ratios: 4 | ||||||||||||||||||||
Expenses | 1.00% | 1.00% | 1.00% | 1.00% | 1.00% | |||||||||||||||
Net investment income | 0.57% | 0.92% | 0.61% | 0.54% | 0.58% | |||||||||||||||
Portfolio turnover rate (excluding short-term securities) | 27.34% | 13.42% | 15.06% | 25.36% | 15.93% | |||||||||||||||
| 1 | The net investment income per share is based on average shares outstanding for the period. |
| 2 | Amount represents less than $0.01 per share. |
| 3 | Total investment return is based on the change in net asset value of a share during the period (not annualized) and assumes reinvestment of distributions at net asset value. |
| 4 | Ratios are annualized for periods less than one year. In addition to fees and expenses which the Fund bears directly, the Fund indirectly bears a pro rata share of the fees and expenses of the acquired funds in which it invests. Such indirect expenses are not included in the above reported expense ratios. |
See accompanying notes to financial statements. | ||
JUNE 30, 2014 |
57 |
FINANCIAL HIGHLIGHTS
Per share income and capital changes for a share outstanding throughout the period. See accompanying notes to financial statements.
Sit Mid Cap Growth Fund
| Years Ended June 30, | ||||||||||||||||||||
| 2014 | 2013 | 2012 | 2011 | 2010 | ||||||||||||||||
Net Asset Value: | ||||||||||||||||||||
Beginning of period | $17.69 | $15.77 | $15.88 | $11.57 | $9.90 | |||||||||||||||
Operations: | ||||||||||||||||||||
Net investment loss 1 | (0.07 | ) | (0.03 | ) | (0.05 | ) | (0.06 | ) | (0.05 | ) | ||||||||||
Net realized and unrealized gains (losses) | 4.54 | 2.32 | (0.06 | ) | 4.37 | 1.72 | ||||||||||||||
Total from operations | 4.47 | 2.29 | (0.11 | ) | 4.31 | 1.67 | ||||||||||||||
Capital share proceeds | — | — | — | — | 2,3 | — | ||||||||||||||
Redemption fees 2 | — | — | — | — | — | |||||||||||||||
Distributions to Shareholders: | ||||||||||||||||||||
From net realized gains | (1.08 | ) | (0.37 | ) | — | — | — | |||||||||||||
Net Asset Value: | ||||||||||||||||||||
End of period | $21.08 | $17.69 | $15.77 | $15.88 | $11.57 | |||||||||||||||
Total investment return 4 | 25.58% | 14.70% | (0.69% | ) | 37.25%5 | 16.87% | ||||||||||||||
Net assets at end of period (000’s omitted) | $180,276 | $152,129 | $144,601 | $165,288 | $130,258 | |||||||||||||||
Ratios: 6, 7 | ||||||||||||||||||||
Expenses (without waiver) | 1.25% | 1.25% | 1.25% | 1.25% | 1.25% | |||||||||||||||
Expenses (with waiver) | 1.25% | 1.25% | 1.25% | 1.20% | 1.15% | |||||||||||||||
Net investment loss (without waiver) | (0.37% | ) | (0.17% | ) | (0.33% | ) | (0.49% | ) | (0.52% | ) | ||||||||||
Net investment loss (with waiver) | (0.37% | ) | (0.17% | ) | (0.33% | ) | (0.44% | ) | (0.42% | ) | ||||||||||
Portfolio turnover rate (excluding short-term securities) | 27.65% | 16.91% | 16.23% | 26.98% | 20.39% | |||||||||||||||
| 1 | The net investment income (loss) per share is based on average shares outstanding for the period. |
| 2 | Amount represents less than $0.01 per share. |
| 3 | The Fund accounted for proceeds during the year from market timing settlements. |
| 4 | Total investment return is based on the change in net asset value of a share during the period (not annualized) and assumes reinvestment of distributions at net asset value. |
| 5 | Impact on total return from capital share proceeds was less than 0.01%. |
| 6 | Ratios are annualized for periods less than one year. In addition to fees and expenses which the Fund bears directly, the Fund indirectly bears a pro rata share of the fees and expenses of the acquired funds in which it invests. Such indirect expenses are not included in the above reported expense ratios. |
| 7 | Total Fund expenses are calculated at 1.25% of average daily net assets. The investment adviser voluntarily limited expenses to 1.15% of average daily net assets through December 31, 2010 at which time the agreement was terminated. |
58 | SIT MUTUAL FUNDS ANNUAL REPORT |
FINANCIAL HIGHLIGHTS
Per share income and capital changes for a share outstanding throughout the period. See accompanying notes to financial statements.
Sit Small Cap Growth Fund
| Years Ended June 30, | ||||||||||||||||||||
| 2014 | 2013 | 2012 | 2011 | 2010 | ||||||||||||||||
Net Asset Value: | ||||||||||||||||||||
Beginning of period | $50.08 | $43.90 | $43.86 | $31.32 | $25.89 | |||||||||||||||
Operations: | ||||||||||||||||||||
Net investment loss 1 | (0.55 | ) | (0.30 | ) | (0.34 | ) | (0.36 | ) | (0.24 | ) | ||||||||||
Net realized and unrealized gains | 11.85 | 6.48 | 0.38 | 12.89 | 5.67 | |||||||||||||||
Total from operations | 11.30 | 6.18 | 0.04 | 12.53 | 5.43 | |||||||||||||||
Capital share proceeds | — | — | — | 0.01 | 2 | — | ||||||||||||||
Redemption fees 3 | — | — | — | — | — | |||||||||||||||
Net Asset Value: | ||||||||||||||||||||
End of period | $61.38 | $50.08 | $43.90 | $43.86 | $31.32 | |||||||||||||||
Total investment return 4 | 22.56% | 14.08% | 0.09% | 40.04% | 5 | 20.97% | ||||||||||||||
Net assets at end of period (000’s omitted) | $99,510 | $84,793 | $78,202 | $94,744 | $59,848 | |||||||||||||||
Ratios: 6 | ||||||||||||||||||||
Expenses | 1.50% | 1.50% | 1.50% | 1.50% | 1.50% | |||||||||||||||
Net investment loss | (0.94% | ) | (0.64% | ) | (0.82% | ) | (0.91% | ) | (0.80% | ) | ||||||||||
Portfolio turnover rate (excluding short-term securities) | 33.38% | 28.36% | 22.32% | 30.33% | 22.41% | |||||||||||||||
| 1 | The net investment income (loss) per share is based on average shares outstanding for the period. |
| 2 | The Fund accounted for proceeds during the year from market timing settlements. |
| 3 | Amount represents less than $0.01 per share. |
| 4 | Total investment return is based on the change in net asset value of a share during the period (not annualized) and assumes reinvestment of distributions at net asset value. |
| 5 | Impact on total return from capital share proceeds was 0.03%. |
| 6 | Ratios are annualized for periods less than one year. In addition to fees and expenses which the Fund bears directly, the Fund indirectly bears a pro rata share of the fees and expenses of the acquired funds in which it invests. Such indirect expenses are not included in the above reported expense ratios. |
JUNE 30, 2014 | 59 |
FINANCIAL HIGHLIGHTS
Per share income and capital changes for a share outstanding throughout the period. See accompanying notes to financial statements.
Sit International Growth Fund
| Years Ended June 30, | ||||||||||||||||||||
| 2014 | 2013 | 2012 | 2011 | 2010 | ||||||||||||||||
Net Asset Value: | ||||||||||||||||||||
Beginning of period | $15.05 | $13.29 | $15.16 | $11.67 | $10.90 | |||||||||||||||
Operations: | ||||||||||||||||||||
Net investment income 1 | 0.28 | 0.20 | 0.22 | 0.16 | 0.11 | |||||||||||||||
Net realized and unrealized gains (losses) | 2.28 | 1.80 | (1.86 | ) | 3.39 | 0.65 | ||||||||||||||
Total from operations | 2.56 | 2.00 | (1.64 | ) | 3.55 | 0.76 | ||||||||||||||
Capital share proceeds | — | — | — | 0.07 | 2 | 0.13 | 2 | |||||||||||||
Redemption fees | — | — | — | 3 | — | 3 | — | 3 | ||||||||||||
Distributions to Shareholders: | ||||||||||||||||||||
From net investment income | (0.17 | ) | (0.24 | ) | (0.23 | ) | (0.13 | ) | (0.12 | ) | ||||||||||
Net Asset Value: | ||||||||||||||||||||
End of period | $17.44 | $15.05 | $13.29 | $15.16 | $11.67 | |||||||||||||||
Total investment return 4 | 17.06% | 15.06% | (10.69% | ) | 31.08% | 5 | 8.10% | 5 | ||||||||||||
Net assets at end of period (000’s omitted) | $24,127 | $20,890 | $19,296 | $24,823 | $20,586 | |||||||||||||||
Ratios: 6, 7 | ||||||||||||||||||||
Expenses (without waiver) | 1.50% | 1.50% | 1.50% | 1.61% | 1.85% | |||||||||||||||
Expenses (with waiver) | 1.50% | 1.50% | 1.50% | 1.50% | 1.50% | |||||||||||||||
Net investment income (without waiver) | 1.69% | 1.39% | 1.62% | 1.01% | 0.50% | |||||||||||||||
Net investment income (with waiver) | 1.69% | 1.39% | 1.62% | 1.12% | 0.85% | |||||||||||||||
Portfolio turnover rate (excluding short-term securities) | 46.91% | 27.93% | 27.82% | 35.95% | 25.09% | |||||||||||||||
| 1 | The net investment income per share is based on average shares outstanding for the period. |
| 2 | The Fund accounted for proceeds during the year from market timing settlements. |
| 3 | Amount represents less than $0.01 per share. |
| 4 | Total investment return is based on the change in net asset value of a share during the period (not annualized) and assumes reinvestment of distributions at net asset value. |
| 5 | Impact on total return from capital share proceeds was 0.60% and 1.20% for the years ended June 30, 2011 and 2010, respectively. |
| 6 | Ratios are annualized for periods less than one year. In addition to fees and expenses which the Fund bears directly, the Fund indirectly bears a pro rata share of the fees and expenses of the acquired funds in which it invests. Such indirect expenses are not included in the above reported expense ratios. |
| 7 | Effective November 1, 2010, total Fund expenses are limited to 1.50% of average daily net assets. Prior to this date, expenses were calculated at a higher rate, and the investment adviser voluntarily absorbed expenses that were otherwise payable by the Fund. |
60 | SIT MUTUAL FUNDS ANNUAL REPORT |
FINANCIAL HIGHLIGHTS
Per share income and capital changes for a share outstanding throughout the period. See accompanying notes to financial statements.
Sit Developing Markets Growth Fund
| Years Ended June 30, | ||||||||||||||||||||
| 2014 | 2013 | 2012 | 2011 | 2010 | ||||||||||||||||
Net Asset Value: | ||||||||||||||||||||
Beginning of period | $16.40 | $17.70 | $23.24 | $19.00 | $16.13 | |||||||||||||||
Operations: | ||||||||||||||||||||
Net investment income (loss) 1 | (0.01 | ) | 0.04 | 0.06 | 0.03 | 0.01 | ||||||||||||||
Net realized and unrealized gains (losses) | 2.07 | 0.14 | (3.89 | ) | 4.90 | 2.90 | ||||||||||||||
Total from operations | 2.06 | 0.18 | (3.83 | ) | 4.93 | 2.91 | ||||||||||||||
Redemption fees | — | — | — | 2 | — | — | 2 | |||||||||||||
Distributions to Shareholders: | ||||||||||||||||||||
From net investment income | (0.03 | ) | (0.06 | ) | (0.06 | ) | (0.02 | ) | (0.04 | ) | ||||||||||
From net realized gains | (0.95 | ) | (1.42 | ) | (1.65 | ) | (0.67 | ) | — | |||||||||||
Total distributions | (0.98 | ) | (1.48 | ) | (1.71 | ) | (0.69 | ) | (0.04 | ) | ||||||||||
Net Asset Value: | ||||||||||||||||||||
End of period | $17.48 | $16.40 | $17.70 | $23.24 | $19.00 | |||||||||||||||
Total investment return 3 | 12.79% | 0.36% | (16.29% | ) | 25.95% | 18.05% | ||||||||||||||
Net assets at end of period (000’s omitted) | $10,808 | $10,615 | $11,634 | $15,420 | $14,043 | |||||||||||||||
Ratios: 4 | ||||||||||||||||||||
Expenses | 2.00% | 2.00% | 2.00% | 2.00% | 2.00% | |||||||||||||||
Net investment income (loss) | (0.07% | ) | 0.24% | 0.29% | 0.15% | 0.06% | ||||||||||||||
Portfolio turnover rate (excluding short-term securities) | 21.45% | 15.48% | 22.56% | 19.14% | 19.90% | |||||||||||||||
| 1 | The net investment income per share is based on average shares outstanding for the period. |
| 2 | Amount represents less than $0.01 per share. |
| 3 | Total investment return is based on the change in net asset value of a share during the period (not annualized) and assumes reinvestment of distributions at net asset value. |
| 4 | Ratios are annualized for periods less than one year. In addition to fees and expenses which the Fund bears directly, the Fund indirectly bears a pro rata share of the fees and expenses of the acquired funds in which it invests. Such indirect expenses are not included in the above reported expense ratios. |
JUNE 30, 2014 | 61 |
Year Ended June 30, 2014
| (1) | Organization |
Sit Mutual Funds are no-load funds, and are registered under the Investment Company Act of 1940 (as amended) as diversified, openend management investment companies, or series thereof. The Sit Balanced, Sit Dividend Growth, Sit Global Dividend Growth, Sit Small Cap Growth, Sit International Growth, and Sit Developing Markets Growth are series funds of Sit Mutual Funds, Inc.
This report covers the equity funds of the Sit Mutual Funds (the Funds). Each fund has 10 billion authorized shares of capital stock with a par value of $0.001. The investment objective for each Fund is as follows:
Fund | Investment Objective | |
Balanced | Long-term growth consistent with the preservation of principal and to provide regular income. | |
Dividend Growth | Provide current income that exceeds the dividend yield of the S&P 500® Index and that grows over a period of years. Secondarily, maximize long-term capital appreciation. | |
Global Dividend Growth | Provide current income that exceeds the dividend yield of the MSCI World Index that grows over a period of years. Secondarily, maximize long-term capital appreciation. | |
Large Cap Growth Fund | Maximize long-term capital appreciation. | |
Mid Cap Growth Fund | Maximize long-term capital appreciation. | |
Small Cap Growth | Maximize long-term capital appreciation. | |
International Growth | Maximize long-term growth. | |
Developing Markets Growth | Maximize long-term capital appreciation. |
The Dividend Growth and Global Dividend Growth Funds offer Class I and Class S shares. Both classes of shares have identical voting, dividend, and liquidation rights. The distribution fee differs among classes, the Class S shares have a 0.25% distribution fee, whereas Class I has no distribution fee. Income, expenses (other than class specific expenses) and realized and unrealized gains or losses on investments are allocated to each class of shares based upon its relative net assets.
| (2) | Significant Accounting Policies |
Investments in Securities
Investments in securities traded on national or international securities exchanges are valued at the last reported sales price prior to the time when assets are valued. Securities traded on the over-the-counter market are valued at the last reported sales price or if the last sales price is not available at the last reported bid price. The sale and bid prices or prices deemed best to reflect fair value quoted by dealers who make markets in these securities are obtained from independent pricing services. Consistent with the Funds’ valuation policies and procedures, debt securities maturing in more than 60 days are priced by an independent pricing service. The pricing service may use models that price securities based on current yields and relative security characteristics, such as coupon rate, maturity date, issuer credit quality, and prepayment speeds as applicable. When market quotations are not readily available, or when the Adviser becomes aware that a significant event impacting the value of a security or group of securities has occurred after the closing of the exchange on which the security or securities principally trade, but before the calculation of the daily net asset value, securities are valued at fair value as determined in good faith using procedures established by the Board of Directors. The procedures consider, among others, the following factors to determine a security’s fair value: the nature and pricing history (if any) of the security; whether any dealer quotations for the security are available; and possible valuation methodologies that could be used to determine the fair value of the security. Debt securities of sufficient credit quality maturing in less than 60 days when acquired, or which subsequently are within 60 days of maturity, are valued at amortized cost, which approximates fair value.
Security transactions are accounted for on the date the securities are purchased or sold. Securities gains and losses are calculated on the identified-cost basis. Dividend income is recorded on the ex-dividend date or upon the receipt of ex-dividend notification in the case of certain foreign securities. Interest, including level-yield amortization of long-term bond premium and discount, is recorded on the accrual basis.
62 | SIT MUTUAL FUNDS ANNUAL REPORT |
Fair Value Measurements
The inputs and valuations techniques used to measure fair value of the Funds’ net assets are summarized into three levels as described in the hierarchy below:
Ÿ Level 1 – quoted prices for active markets for identical securities. An active market for the security is a market in which transactions occur with sufficient frequency and volume to provide pricing information on an ongoing basis. A quoted price in an active market provides the most reliable evidence of fair value.
Ÿ Level 2 – debt securities are valued based on evaluated prices received from independent pricing services or from dealers who make markets in such securities. For corporate bonds, U.S. government and government agency obligations, and municipal securities the pricing services utilize matrix pricing which considers yield or price of bonds of comparable quality, coupon, maturity, and type as well as dealer supplied prices. For asset-backed securities and mortgage-backed securities, the pricing services utilize matrix pricing which considers prepayment speed assumptions, attributes of the collateral, yield or price of bonds of comparable quality, coupon, maturity, and type as well as dealer supplied prices. For foreign equities, the pricing services adjust closing prices by applying a systematic process for events occurring after the close of the foreign exchange by utilizing such inputs as Depositary Receipts, quoted prices for similar securities, exchange rates, and certain indexes. All of these inputs are derived principally from or corroborated by observable market data. An adjustment to any observable input that is significant to the fair value may render the measurement a Level 3 measurement.
Ÿ Level 3 – significant unobservable inputs, including the Adviser’s own assumptions in determining the fair value of investments.
The inputs or methodology used for valuing securities are not necessarily an indication of the risk associated with investing in those securities.
A summary of the levels for the Funds’ investments as of June 30, 2014 is included with the Funds’ schedule of investments.
Foreign Currency Translations and Forward Foreign Currency Contracts
The fair value of securities and other assets and liabilities denominated in foreign currencies for Global Dividend Growth, International Growth and Developing Markets Growth Funds are translated daily into U.S. dollars at the closing rate of exchange (approximately 4:00 p.m. E.S.T). Purchases and sales of securities, income and expenses are translated at the exchange rate on the transaction date. Dividend and interest income includes currency exchange gains (losses) realized between the accrual and payment dates on such income. Exchange gains (losses) may also be realized between the trade and settlement dates on security and forward contract transactions. For securities denominated in foreign currencies, the effect of changes in foreign exchange rates on realized and unrealized gains or losses is reflected as a component of such gains or losses.
The Global Dividend Growth, International Growth and Developing Markets Growth Funds may enter into forward foreign currency exchange contracts generally for operational purposes, but the Adviser may occasionally utilize contracts to protect against adverse exchange rate fluctuation. Any gains (losses) generated by these contracts are disclosed separately on the statement of operations. The net U.S. dollar value of foreign currency underlying all contractual commitments held by the Funds and the resulting unrealized appreciation or depreciation is determined using foreign currency exchange rates from an independent pricing service. The Funds are subject to the credit risk that the other party will not complete the obligations of the contract.
Federal Taxes
The Funds’ policy is to comply with the requirements of the Internal Revenue Code applicable to regulated investment companies and to distribute all of their taxable income to shareholders. Therefore, no income tax provision is required. Also, in order to avoid the payment of any federal excise taxes, the Funds will distribute substantially all of their net investment income and net realized gains on a calendar year basis.
Management has analyzed the Funds’ tax positions taken in federal tax returns for all open tax years and has concluded that as of June 30, 2014, no provision for income would be required in the Funds’ financial statements. The Funds’ federal and state income and federal excise returns for the 2011, 2012 and 2013 tax years for which the applicable statutes of limitations have not expired remain subject to examination by the Internal Revenue Service and state departments of revenue.
JUNE 30, 2014 |
63 |
NOTES TO FINANCIAL STATEMENTS
Year Ended June 30, 2014 (Continued)
At June 30, 2014, the gross unrealized appreciation (depreciation) on investments and cost of securities on a tax basis for federal income tax purposes were as follows:
| Net Unrealized | Cost of | |||||||||||||||
| Unrealized | Unrealized | Appreciation | Securities on a | |||||||||||||
| Appreciation | Depreciation | (Depreciation) | Tax Basis | |||||||||||||
Balanced | $3,986,987 | ($57,831 | ) | $3,929,156 | $11,466,421 | |||||||||||
Dividend Growth | 224,268,234 | (1,991,026 | ) | 222,277,208 | 889,382,589 | |||||||||||
Global Dividend Growth | 3,971,626 | (215,727 | ) | 3,755,899 | 20,675,718 | |||||||||||
Large Cap Growth | 65,781,410 | (303,889 | ) | 65,477,521 | 121,550,872 | |||||||||||
Mid Cap Growth | 74,458,039 | (1,551,035 | ) | 72,907,004 | 104,527,358 | |||||||||||
Small Cap Growth | 36,166,280 | (1,719,103 | ) | 34,447,177 | 63,112,989 | |||||||||||
International Growth | 5,472,813 | (490,895 | ) | 4,981,918 | 18,750,009 | |||||||||||
Developing Markets Growth | 3,280,145 | (417,886 | ) | 2,862,259 | 7,755,618 | |||||||||||
Net investment income and net realized gains differ for financial statement and tax purposes because of losses deferred due to “wash sale” transactions. A “wash sale” occurs when a Fund sells a security that it has acquired within a period beginning thirty days before and ending thirty days after the date of sale (a sixty one day period). The character of distributions made during the year from net investment income or net realized gains may also differ from its ultimate characterization for tax purposes. Also, due to the timing of dividend distributions, the fiscal year in which amounts are distributed may differ from the year that the income or realized gains (losses) were recorded by the Funds. The tax character of distributions paid during the fiscal years ended June 30, 2014 and 2013 were as follows:
Year Ended June 30, 2014:
| Long Term | |||||||||||||||
| Ordinary Income | Capital Gain | Total | |||||||||||||
Balanced | $190,000 | — | $190,000 | ||||||||||||
Dividend Growth (Class I) | 17,289,602 | $31,374,733 | 48,664,335 | ||||||||||||
Dividend Growth (Class S) | 2,140,368 | 4,875,856 | 7,016,224 | ||||||||||||
Global Dividend Growth (Class I) | 263,794 | 736,258 | 1,000,052 | ||||||||||||
Global Dividend Growth (Class S) | 43,211 | 153,131 | 196,342 | ||||||||||||
Large Cap Growth | 1,617,540 | 19,002,570 | 20,620,110 | ||||||||||||
Mid Cap Growth | — | 8,937,914 | 8,937,914 | ||||||||||||
Small Cap Growth | — | — | — | ||||||||||||
International Growth | 231,001 | — | 231,001 | ||||||||||||
Developing Markets Growth | 16,575 | 596,525 | 613,100 | ||||||||||||
Year Ended June 30, 2013:
| Long Term | |||||||||||||||
| Ordinary Income | Capital Gain | Total | |||||||||||||
Balanced | $196,000 | — | $196,000 | ||||||||||||
Dividend Growth (Class I) | 12,385,536 | $9,669,932 | 22,055,468 | ||||||||||||
Dividend Growth (Class S) | 1,802,627 | 1,637,246 | 3,439,873 | ||||||||||||
Global Dividend Growth (Class I) | 196,378 | 68,213 | 264,591 | ||||||||||||
Global Dividend Growth (Class S) | 39,623 | 15,464 | 55,087 | ||||||||||||
Large Cap Growth | 2,065,000 | 16,571,341 | 18,636,341 | ||||||||||||
Mid Cap Growth | — | 3,183,573 | 3,183,573 | ||||||||||||
Small Cap Growth | — | — | — | ||||||||||||
International Growth | 323,000 | — | 323,000 | ||||||||||||
Developing Markets Growth | 36,001 | 881,318 | 917,319 | ||||||||||||
64 | SIT MUTUAL FUNDS ANNUAL REPORT |
As of June 30, 2014, the components of distributable earnings on a tax basis were as follows:
| Undistributed Ordinary Income | Accumulated Gain (Loss) | Unrealized Appreciation (Depreciation) | |||||||||||||
Balanced | $55,722 | $113,138 | $3,929,156 | ||||||||||||
Dividend Growth | 7,869,583 | 89,806,212 | 222,277,208 | ||||||||||||
Global Dividend Growth | 157,119 | 1,041,943 | 3,756,189 | ||||||||||||
Large Cap Growth | 646,669 | 23,378,884 | 65,477,521 | ||||||||||||
Mid Cap Growth | — | 18,485,116 | 72,907,004 | ||||||||||||
Small Cap Growth | — | 8,808,775 | 34,447,177 | ||||||||||||
International Growth | 354,576 | (1,081,060 | ) | 4,984,033 | |||||||||||
Developing Markets Growth | — | 655,564 | 2,862,265 | ||||||||||||
On the statement of assets and liabilities, as a result of permanent book-to-tax differences, reclassification adjustments were made to the following capital accounts:
| Undistributed Net Investment Income | Accumulated Net Realized Gain (Loss) | Additional Paid-in Capital | |||||||||||||
Dividend Growth | ($365,304 | ) | $365,304 | — | |||||||||||
Global Dividend Growth | (4,178 | ) | 4,178 | — | |||||||||||
Mid Cap Growth | 636,119 | — | ($636,119 | ) | |||||||||||
Small Cap Growth | 909,126 | — | (909,126 | ) | |||||||||||
International Growth | (3,295 | ) | 3,295 | — | |||||||||||
Developing Markets Growth | 7,675 | 751 | (8,426 | ) | |||||||||||
These differences were primarily attributable to return of capital dividends received, 988 reclassifications, non-deductible net operating losses and capital loss carryforwards expiring.
Net capital loss carryovers and late year losses, if any, as of June 30, 2014, available to offset future realized capital gains and thereby reduce future capital gains distributions. Under the Regulated Investment Company Modernization Act of 2010 (“Act”), the Funds’ are permitted to carry forward capital losses incurred in taxable years beginning after December 22, 2010 for an unlimited period. Any losses incurred during those future taxable years will be required to be utilized prior to any losses incurred in pre-enactment taxable years. Additionally, post-enactment capital losses that are carried forward will retain their character as either short-term or long-term capital losses, and will not be considered exclusively short-term as under previous law. The Funds’ first fiscal year end subject to the Modernization Act was June 30, 2012. The net capital loss carryovers and the expiration dates for capital losses carryover from pre-enactment taxable years and the late year losses deferred as of June 30, 2014, were as follows:
| Pre-Enactment Net Capital Loss Carryover Expiring in: | Post-Enactment Unlimited Period of Net Capital Loss Carryover | Late Year Losses | Accumulated Capital and | |||||||||
| 2014 | 2015-2019 | Short-Term | Long-Term | Deferred | Other Losses | |||||||
International Growth | — | $1,081,060 | — | — | — | $1,081,060 | ||||||
JUNE 30, 2014 |
65 |
NOTES TO FINANCIAL STATEMENTS
Year Ended June 30, 2014 (Continued)
For the year ended June 30, 2014, the Funds’ utilized pre-enactment capital losses and expired capital losses as follows:
| Utilized | Expiring In | Expired | ||||||
Balanced | $95,283 | 2017 | $— | |||||
| 565,841 | 2018 | — | ||||||
Small Cap Growth | 1,528,246 | 2018 | — | |||||
International Growth | 1,832,899 | 2018 | — | |||||
Distributions
Distributions to shareholders are recorded as of the close of business on the record date. Such distributions are payable in cash or reinvested in additional shares of the Funds’ capital stock. Distributions from net investment income, if any, are declared and paid quarterly for the Balanced, Dividend Growth and Global Dividend Growth Funds and declared and paid annually for Developing Markets Growth, Small Cap Growth, International Growth, Mid Cap Growth, and Large Cap Growth Funds. Distributions from net realized gains, if any, will be made annually for each of the Funds.
Concentration of Investments
The Developing Markets Growth Fund may concentrate investments in countries with limited or developing capital markets which may involve greater risks than investments in more developed markets and the prices of such investments may be volatile. The consequences of political, social or economic changes in these markets may have disruptive effects on the market prices of the Fund’s investments and the income it generates, as well as the Fund’s ability to repatriate such amounts.
Use of Estimates
The preparation of financial statements in conformity with U.S. generally accepted accounting principles requires management to make certain estimates and assumptions that affect the reported amounts of assets and liabilities and disclosure of contingent assets and liabilities at the date of the financial statements and the reported results for the respective periods. Actual results could differ from those estimates.
Guarantees and Indemnifications
Under each Fund’s organizational documents, its officers and directors are indemnified against certain liability arising out of the performance of their duties to each Fund. In addition, certain of each Fund’s contracts with its service providers contain general indemnification clauses. Each Fund’s maximum exposure under these arrangements is unknown since the amount of any future claims that may be made against each Fund cannot be determined and each Fund has no historical basis for predicting the likelihood of any such claims.
66 | SIT MUTUAL FUNDS ANNUAL REPORT |
| (3) | Investment Security Transactions |
The cost of purchases and proceeds from sales and maturities of investment securities, other than short-term securities, for the year ended June 30, 2014, were as follows:
| Purchases | Proceeds | |||||||||||
| U.S. Government | Other | U.S. Government | Other | |||||||||
Balanced | $1,582,100 | $6,729,888 | $1,394,875 | $6,473,740 | ||||||||
Dividend Growth | — | 480,800,263 | — | 591,796,247 | ||||||||
Global Dividend Growth | — | 14,983,250 | — | 10,494,070 | ||||||||
Large Cap Growth | — | 53,350,153 | — | 99,732,031 | ||||||||
Mid Cap Growth | — | 46,768,446 | — | 56,538,471 | ||||||||
Small Cap Growth | — | 31,802,625 | — | 38,117,525 | ||||||||
International Growth | — | 10,972,698 | — | 10,598,797 | ||||||||
Developing Markets Growth | — | 2,295,434 | — | 3,453,685 | ||||||||
| (4) | Affiliated Fees and Transactions |
Investment Adviser
The Funds each have entered into an investment management agreement with Sit Investment Associates, Inc. (SIA), under which SIA manages the Funds’ assets and provides research, statistical and advisory services, and pays related office rental, executive expenses and executive salaries. The current fee for investment management and advisory services is based on the average daily net assets of the Funds at the annual rate of:
Balanced | 1.00 | % | ||||||
Dividend Growth Fund Class I and Class S | 1.00 | % | ||||||
Global Dividend Growth Fund Class I and Class S | 1.25 | % | ||||||
Large Cap Growth | 1.00 | % | ||||||
Mid Cap Growth | 1.25 | % | ||||||
Small Cap Growth | 1.50 | % | ||||||
International Growth | 1.50 | % | ||||||
Developing Markets Growth | 2.00 | % |
SIA is obligated to pay all of the Funds’ expenses (excluding extraordinary expenses, stock transfer taxes, interest, brokerage commissions, 12b-1 fees and other transaction charges relating to investing activities).
In addition to the annual management fees, the Class S shares of Global Dividend Growth and Dividend Growth Funds also have a 0.25% annual distribution (12b-1) fee, which is used to pay for distribution fees related to the sale and distribution of its shares.
JUNE 30, 2014 |
67 |
NOTES TO FINANCIAL STATEMENTS
Year Ended June 30, 2014 (Continued)
Transactions with affiliates
The investment adviser, affiliates of the investment adviser, directors and officers of the Funds as a whole owned the following shares as of June 30, 2014:
| Shares | % Shares Outstanding | |||||||||||
Balanced | 223,810 | 30.1 | ||||||||||
Dividend Growth | 927,794 | 1.5 | ||||||||||
Global Dividend Growth | 579,506 | 36.8 | ||||||||||
Large Cap Growth | 318,436 | 8.9 | ||||||||||
Mid Cap Growth | 3,006,999 | 35.2 | ||||||||||
Small Cap Growth | 775,261 | 47.8 | ||||||||||
International Growth | 773,001 | 55.9 | ||||||||||
Developing Markets Growth | 250,584 | 40.5 | ||||||||||
| (5) | Capital Share Activity |
Short-Term Trading (Redemption) Fees
The Funds (except Balanced) charge a redemption fee equal to 2.00% of the proceeds on shares held for less than 30 calendar days. The fee is retained by the Fund for the benefit of its long-term shareholders and accounted for as an addition to paid in capital. For the year ended June 30, 2014, the Funds received the following redemption fees:
| Class I | Class S | |||||||||
Dividend Growth | $7,288 | $2,716 | ||||||||
Global Dividend Growth | 13 | 2 | ||||||||
Large Cap Growth | 1,827 | — | ||||||||
Mid Cap Growth | 134 | — | ||||||||
Small Cap Growth | 1,396 | — | ||||||||
| (6) | Subsequent Events |
Management has evaluated the impact of all subsequent events on the Funds through the date the financial statements were issued, and has determined that there were no subsequent events that would require disclosure in or adjustments to the financial statements.
68 | SIT MUTUAL FUNDS ANNUAL REPORT |
REPORT OF INDEPENDENT REGISTERED PUBLIC ACCOUNTING FIRM
The Board of Directors and Shareholders:
Sit Mutual Funds, Inc.
Sit Large Cap Growth Fund, Inc.
Sit Mid Cap Growth Fund, Inc.
We have audited the accompanying statements of assets and liabilities of Sit Balanced Fund, Sit Dividend Growth Fund, Sit Global Dividend Growth Fund, Sit Small Cap Growth Fund, Sit International Growth Fund, Sit Developing Markets Growth Fund (each a series of Sit Mutual Funds, Inc.), Sit Large Cap Growth Fund, Inc., and Sit Mid Cap Growth Fund, Inc., (collectively, the “Funds”) including the schedules of investments, as of June 30, 2014, and the related statements of operations for the year then ended, the statements of changes in net assets for each of the years in the two-year period then ended, and the financial highlights for each of the years in the five-year period then ended. These financial statements and financial highlights are the responsibility of the Funds’ management. Our responsibility is to express an opinion on these financial statements and financial highlights based on our audits.
We conducted our audits in accordance with the standards of the Public Company Accounting Oversight Board (United States). Those standards require that we plan and perform the audit to obtain reasonable assurance about whether the financial statements and financial highlights are free of material misstatement. An audit includes examining, on a test basis, evidence supporting the amounts and disclosures in the financial statements. Our procedures included confirmation of securities owned as of June 30, 2014, by correspondence with the custodian and brokers or by performing other appropriate auditing procedures. An audit also includes assessing the accounting principles used and significant estimates made by management, as well as evaluating the overall financial statement presentation. We believe that our audits provide a reasonable basis for our opinion.
In our opinion, the financial statements and financial highlights referred to above present fairly, in all material respects, the financial position of Sit Balanced Fund, Sit Dividend Growth Fund, Sit Global Dividend Growth Fund, Sit Small Cap Growth Fund, Sit International Growth Fund, Sit Developing Markets Growth Fund, Sit Large Cap Growth Fund, and Sit Mid Cap Growth Fund as of June 30, 2014, the results of their operations for the year then ended, the changes in their net assets for each of the years in the two-year period then ended, and the financial highlights for each of the years or periods in the five-year period then ended, in conformity with U.S. generally accepted accounting principles.
KPMG LLP
Minneapolis, Minnesota
August 20, 2014
JUNE 30, 2014 |
69 |
As a shareholder of the Funds, you incur two types of costs: (1) transaction costs, including redemption fees and (2) ongoing costs, including management fees; and other Fund expenses. This Example is intended to help you understand your ongoing costs (in dollars) of investing in the Funds and to compare these costs with the ongoing costs of investing in other mutual funds.
The Example is based on an investment of $1,000 invested at the beginning of the period and held for the entire period January 1, 2014 to June 30, 2014.
Actual Expenses
The first line of the following table provides information about actual account values and actual expenses.You may use the information in this line, together with the amount you invested, to estimate the expenses that you paid over the period. Simply divide your account value by $1,000 (for example, an $8,600 account value divided by $1,000 = 8.6), then multiply the result by the number in the first line under the heading entitled “Expenses Paid During Period” to estimate the expenses you paid on your account during this period.
Hypothetical Example for Comparison Purposes
The second line of the table provides information about hypothetical account values and hypothetical expenses based on the Fund’s actual expense ratio and an assumed rate of return of 5% per year before expenses, which is not the Fund’s actual return. The hypothetical account values and expenses may not be used to estimate the actual ending account balance or expenses you paid for the period. You may use this information to compare the ongoing costs of investing in the Fund and other funds. To do so, compare this 5% hypothetical example with the 5% hypothetical examples that appear in the shareholder reports of the other funds.
Please note that the expenses shown in the table are meant to highlight your ongoing costs only and do not reflect any transactional costs, such as redemption fees. Therefore, the second line of the table is useful in comparing ongoing costs only, and will not help you determine the relative total costs of owning different funds. In addition, if these transactional costs (redemption fees) were included, your costs would have been higher.
| Fund | Beginning Value (1/1/14) | Ending Account Value (6/30/14) | Expenses Paid During Period* (1/1/14- 6/30/14) | |||||||||
Balanced Fund |
| |||||||||||
Actual | $1,000 | $1,041.50 | $5.06 | |||||||||
Hypothetical | $1,000 | $1,019.84 | $5.01 | |||||||||
Dividend Growth Fund |
| |||||||||||
Actual | ||||||||||||
Class I | $1,000 | $1,061.90 | $5.11 | |||||||||
Class S | $1,000 | $1,060.00 | $6.38 | |||||||||
Hypothetical | ||||||||||||
Class I | $1,000 | $1,019.84 | $5.01 | |||||||||
Class S | $1,000 | $1,018.60 | $6.26 | |||||||||
Global Dividend Growth Fund |
| |||||||||||
Actual | ||||||||||||
Class I | $1,000 | $1,038.70 | $6.32 | |||||||||
Class S | $1,000 | $1,037.30 | $7.58 | |||||||||
Hypothetical | ||||||||||||
Class I | $1,000 | $1,018.60 | $6.26 | |||||||||
Class S | $1,000 | $1,017.36 | $7.50 | |||||||||
Large Cap Growth |
| |||||||||||
Actual | $1,000 | $1,040.60 | $5.06 | |||||||||
Hypothetical | $1,000 | $1,019.84 | $5.01 | |||||||||
Mid Cap Growth Fund |
| |||||||||||
Actual | $1,000 | $1,025.30 | $6.28 | |||||||||
Hypothetical | $1,000 | $1,018.60 | $6.26 | |||||||||
Small Cap Growth Fund |
| |||||||||||
Actual | $1,000 | $995.94 | $7.42 | |||||||||
Hypothetical | $1,000 | $1,017.36 | $7.50 | |||||||||
International Growth Fund |
| |||||||||||
Actual | $1,000 | $1,018.10 | $7.51 | |||||||||
Hypothetical | $1,000 | $1,017.36 | $7.50 | |||||||||
Developing Markets Growth Fund |
| |||||||||||
Actual | $1,000 | $1,020.40 | $10.02 | |||||||||
Hypothetical | $1,000 | $1,014.88 | $9.99 | |||||||||
*Expenses are equal to the Fund’s annualized expense ratio of 1.00%, for the Balanced, Dividend Growth, Class I and Large Cap Growth Funds; 1.25% for Dividend Growth Fund, Class S, Global Dividend Growth, Class I and Mid Cap Growth Funds; 1.50% for Global Dividend Growth, Class S, Small Cap Growth and International Growth Funds; and 2.00% for Developing Markets Growth Fund, multiplied by the average account value over the period, multiplied by 181/365 (to reflect the one-half year period.)
70 | SIT MUTUAL FUNDS ANNUAL REPORT |
FEDERAL TAX INFORMATION (Unaudited)
Sit Equity Funds
For corporate shareholders, the percentage of investment income (dividend income and short-term gains, if any), for each of the Funds that qualify for the Dividends Received Deductions for the period of July 1, 2013 to June 30, 2014 is as follows:
| Fund | Percentage | ||||
Balanced Fund | 75.9 | % | |||
Dividend Growth Fund | 100.0 | ||||
Global Dividend Growth Fund | 88.4 | ||||
Large Cap Growth Fund | 100.0 | ||||
Mid Cap Growth Fund | — | ||||
Small Cap Growth Fund | — | ||||
International Growth Fund | 8.3 | ||||
Developing Markets Growth Fund | 71.6 | ||||
For the year ended June 30, 2014, certain dividends paid by the Funds may be subject to a maximum tax rate of 15%, as provided by the Jobs and Growth Tax Relief Reconciliation Act of 2003. Of the distributions made by the following Funds, the corresponding percentages represent the amount of each distribution which may qualify for the 15% dividend income tax rate.
| Fund | Percentage | ||||
Balanced Fund | 79.5 | % | |||
Dividend Growth Fund | 100.0 | ||||
Global Dividend Growth Fund | 100.0 | ||||
Large Cap Growth Fund | 100.0 | ||||
Mid Cap Growth Fund | — | ||||
Small Cap Growth Fund | — | ||||
International Growth Fund | 100.0 | ||||
Developing Markets Growth Fund | 100.0 | ||||
The following Funds designated the listed amounts as long-term capital gain dividends during the year ended June 30, 2014. Distributable long-term gains are based on net realized long term gains determined on a tax basis and may differ from such amounts for financial reporting purposes.
| Fund | Amount | |||
Balanced Fund | $113,138 | |||
Dividend Growth Fund | 113,600,958 | |||
Global Dividend Growth Fund | 1,343,896 | |||
Large Cap Growth Fund | 30,766,084 | |||
Mid Cap Growth Fund | 19,973,360 | |||
Small Cap Growth Fund | 8,808,775 | |||
International Growth Fund | — | |||
Developing Markets Growth Fund | 655,564 | |||
JUNE 30, 2014 |
71 |
INFORMATION ABOUT DIRECTORS AND OFFICERS (Unaudited)
The Sit Mutual Funds are a family of no-load mutual funds. The Stock Funds described in this Annual Report are the Sit Mid Cap Growth Fund, Sit Large Cap Growth Fund, Sit International Growth Fund, Sit Balanced Fund, Sit Developing Markets Growth Fund, Sit Small Cap Growth Fund, Sit Dividend Growth Fund, and the Sit Global Dividend Growth Fund (the “Funds” or individually, a “Fund”). The bond funds within the Sit Mutual Fund family are described in a separate Bond Funds’ Annual Report. The Sit Mid Cap Growth Fund and Sit Large Cap Growth Fund, and the corporate issuer of the Sit International Growth Fund, Sit Balanced Fund, Sit Developing Markets Growth Fund, Sit Small Cap Growth Fund, Sit Dividend Growth Fund, and Sit Global Dividend Growth Fund have a Board of Directors and officers. Pursuant to Minnesota law, the Boards of Directors are responsible for the management of the Funds and the establishment of the Funds’ policies. The officers of the Funds manage the day-to-day operation of the Funds. Information pertaining to the directors and officers of the Funds is set forth below. The business address, unless otherwise noted below, is that of the Funds’ investment adviser – 3300 IDS Center, 80 South Eighth Street, Minneapolis, Minnesota 55402. The Boards have a separate Audit Committee. The Stock Funds’ SAI has additional information about the Funds’ directors and is available without charge upon request by calling the Sit Funds at 800-332-5580.
Name, Age, and Position with Funds |
Term of Office (1) and Length of Time Served | Principal Occupations During Past Five Years | Number of Funds Fund Complex | Other Directorships Held by Director (3) | ||||
INTERESTED DIRECTORS:
| ||||||||
Roger J. Sit (2) Age:52 Chairman and President | Chairman since 10/08; Officer since 1998. | Chairman, President, CEO and Global CIO of Sit Investment Associates, Inc. (the “Adviser”); Chairman and CEO of Sit Investment Fixed Income Advisors, Inc. (“SF”); Chairman of SIA Securities Corp. (the “Distributor”). | 12 | None. | ||||
William E. Frenzel (2) Age: 85 Director | Director since 1991 or the Fund’s inception if later. | Guest Scholar at The Brookings Institution and member of several government policy committees, foundations and organizations; Director of the Adviser; Director of SF. | 12 | None. | ||||
INDEPENDENT DIRECTORS: | ||||||||
Edward M. Giles Age: 78 Director | Director since 2012 or the Fund’s inception, if later. | Senior Vice President of Peter B. Cannell & Co., 7/11 to present; Managing Member of GME Capital, 2005 to 2011; Advisory Director of Sit Investment Associates, Inc. 1/08 to 12/11. | 12 | None. | ||||
Sidney L. Jones Age: 80 Director | Director from 1988 to 1989 and since 1993 or the Fund’s inception if later. | Lecturer, Washington Campus Consortium of 17 Universities. | 12 | None. | ||||
Bruce C. Lueck Age: 73 Director | Director since 2004 or the Fund’s inception, if later. | Consultant for Zephyr Management, L.P. (investment management) and committee member of several investment funds and foundations. | 12 | None. | ||||
Donald W. Phillips Age: 66 Director | Director of the International Fund since1993, and since 1990 for all other Funds or the Fund’s inception, if later. | Chairman and CEO of WP Global Partners Inc., 7/05 to present; Partner of Ranieri Partners, 2007 to present. | 12 | None. | ||||
Barry N. Winslow Age: 66 Director | Director since 2010 or the Fund’s inception, if later. | Vice-Chairman of TCF Financial Corporation, 7/08 to present. | 12 | TCF Financial Corporation. | ||||
72 | SIT MUTUAL FUNDS ANNUAL REPORT |
Name, Age, and Position with Funds | Term of Office (1) and Length of Time Served | Principal Occupations During Past Five Years | Number of Funds Fund Complex | Other Directorships Held by Director (3) | ||||
OFFICERS: | ||||||||
Mark H. Book Age: 51 Vice President – Investments of Balanced Fund only | Officer since 2002; Re-Elected by the Boards annually. | Vice President and Portfolio Manager of SF. | N/A | N/A | ||||
Kelly K. Boston Age: 45 Assistant Secretary & Assistant Treasurer | Officer since 2000; Re-Elected by the Boards annually. | Staff Attorney of the Adviser; Secretary of the Distributor. | N/A | N/A | ||||
Bryce A. Doty Age: 47 Vice President - Investments of Balanced Fund only. | Officer since 1996; Re-Elected by the Boards annually. | Senior Vice President and Senior Portfolio Manager of SF. | N/A | N/A | ||||
Kent L. Johnson Age: 48 Vice President - Investments | Officer since 2003; Re-Elected by the Boards annually. | Senior Vice President - Research and Investment Management of the Adviser. | N/A | N/A | ||||
Michael J. Radmer 50 S. 6th Street Minneapolis, MN 55402 Age: 69 Secretary | Officer since 1984; Re-Elected by the Boards annually. | Partner of the Funds’ general counsel, Dorsey & Whitney, LLP. | N/A | N/A | ||||
Paul E. Rasmussen Age: 53 Vice President, Treasurer & Chief Compliance Officer | Officer since 1994; Re-Elected by the Boards annually. | Vice President, Secretary, Controller and Chief Compliance Officer of the Adviser; Vice President, Secretary, and Chief Compliance Officer of SF; President and Treasurer of the Distributor. | N/A | N/A | ||||
Carla J. Rose Age: 48 Vice President, Assistant Secretary & Assistant Treasurer | Officer since 2000; Re-Elected by the Boards annually. | Vice President, Administration & Deputy Controller of the Adviser; Vice President, Controller, Treasurer & Assistant Secretary of SF; Vice President and Assistant Secretary of the Distributor. | N/A | N/A | ||||
Robert W. Sit Age: 45 Vice President - Investments | Officer since 1997; Re-Elected by the Boards annually. | Vice President - Research and Investment Management of the Adviser. | N/A | N/A | ||||
Ronald D. Sit Age: 54 Vice President - Investments | Officer since 1985; Re-Elected by the Boards annually. | Vice President - Research and Investment Management of the Adviser. | N/A | N/A |
| 1 | Each Director serves until their resignation, removal or the next meeting of the shareholders at which election of directors is an agenda item and his successor is duly elected and shall qualify. |
| 2 | Directors who are deemed to be “interested persons” of the Funds as that term is defined by the Investment Company Act of 1940. Mr. Sit is considered an “interested person” because he is a an officer of Sit Investment Associates, Inc., the Fund’s investment adviser. Mr. Frenzel is considered an interested person because he is a director and shareholder of the Fund’s investment adviser. |
| 3 | Includes only directorships of companies required to report under the Securities Exchange Act of 1934 (i.e., public companies) or other investment companies registered under the 1940 Act. |
JUNE 30, 2014 |
73 |
ADDITIONAL INFORMATION (Unaudited)
PROXY VOTING
Each fund follows certain policies and procedures for voting proxies for securities held in each portfolio. A description of the Funds’ proxy voting policies and procedures is available without charge upon request by calling the Funds at 1-800-332-5580.
Information regarding how each Fund voted proxies relating to its portfolio securities during the most recent twelve-month period ended June 30 is available without charge upon request by calling the Funds at 1-800-332-5580, and is available on the U.S. Securities and Exchange Commission’s website at www.sec.gov.
AVAILABILITY OF QUARTERLY PORTFOLIO SCHEDULES
The Funds’ file their complete schedules of portfolio holdings with the U.S. Securities and Exchange Commission (SEC) for the first and third quarters of each fiscal year on Form N-Q. The Funds’ Form N-Qs are available without charge upon request by calling the Funds at 1-800-332-5580 and are available on the SEC’s website at www.sec.gov. In addition, the Funds’ Form N-Qs may be reviewed and copied at the SEC’s Public Reference Room in Washington, DC. Information on the operation of the Public Reference Room may be obtained by calling 1-202-551-8090.
74 | SIT MUTUAL FUNDS ANNUAL REPORT |
[This page intentionally left blank.]
JUNE 30, 2014 |
75 |
[This page intentionally left blank.]
76 | ||
| Item 2: | Code of Ethics. |
The registrant has adopted a code of ethics that applies to the registrant’s principal executive officer, principal financial officer, principal accounting officer, and persons performing similar functions. The registrant has not made any amendment to its code of ethics during the period covered by this report which must be described herein pursuant to Item 2. The registrant has not granted any waivers from any provisions of the code of ethics during the period covered by this report.
A copy of the registrant’s code of ethics is available without charge upon request by calling the registrant at 612-332-3223 or 1-800-332-5580, or by mail at Sit Mutual Funds, 3300 IDS Center, 80 South Eighth Street, Minneapolis, MN 55402.
Item 3: Audit Committee Financial Expert.
The registrant’s Board of Directors has determined that Mr. Edward M. Giles, Mr. Sidney L. Jones, Mr. Bruce C. Lueck, Mr. Donald W. Phillips and Mr. Barry N. Winslow are audit committee financial experts serving on its audit committee. Mr. Giles, Mr. Jones, Mr. Lueck, Mr. Phillips and Mr. Winslow are independent for purposes of this item.
Item 4: Principal Accountant Fees and Services.
(a) – (d) Aggregate fees billed to the registrant for the last two fiscal years for professional services rendered by the registrant’s principal accountant were as follows:
| 2014 | 2013 | |||||||||||||||||||||||||||||||||
| Audit Fees | Audit | Tax | Other | Audit | Audit | Tax | Other | |||||||||||||||||||||||||||
Fiscal year ended June 30 | ||||||||||||||||||||||||||||||||||
Sit Mutual Funds, Inc. | ||||||||||||||||||||||||||||||||||
Sit International Growth Fund (series A) | 19,700 | 0 | 4,425 | 0 | 19,000 | 0 | 4,250 | 0 | ||||||||||||||||||||||||||
Sit Balanced Fund (series B) | 21,700 | 0 | 4,425 | 0 | 21,000 | 0 | 4,250 | 0 | ||||||||||||||||||||||||||
Sit Developing Markets Growth Fund (series C) | 19,700 | 0 | 4,425 | 0 | 19,000 | 0 | 4,250 | 0 | ||||||||||||||||||||||||||
Sit Small Cap Growth Fund (series D) | 19,700 | 0 | 4,425 | 0 | 19,000 | 0 | 4,250 | 0 | ||||||||||||||||||||||||||
Sit Dividend Growth Fund (series G) | 24,000 | 0 | 4,425 | 0 | 23,000 | 0 | 4,250 | 0 | ||||||||||||||||||||||||||
Sit Global Dividend Growth Fund (series H) | 19,700 | 0 | 4,425 | 0 | 19,000 | 0 | 4,250 | 0 | ||||||||||||||||||||||||||
|
|
|
|
|
|
|
|
|
|
|
|
|
|
|
| |||||||||||||||||||
Total Mutual Funds, Inc. | 124,500 | 0 | 26,550 | 0 | 120,000 | 0 | 25,500 | 0 | ||||||||||||||||||||||||||
Audit fees include amounts related to the audit of the registrant’s annual financial statements and services normally provided by the accountant in connection with statutory and regulatory filings. Audit-related fees include amounts reasonably related to the performance of the audit of the registrant’s financial statements, and/or are traditionally performed by the auditor. Tax fees include amounts related to tax compliance, tax planning, and tax advice. Other Fees include services provided to review the Fund’s order processing and trading procedures.
(e) (1) The Audit Committee is required to pre-approve audit and non-audit services performed for the registrant by the independent auditor in order to assure that the provision of such services does not impair the auditor’s independence. The audit committee also is required to pre-approve certain non-audit services performed by the registrant’s independent auditor for the registrant’s investment adviser and certain of the adviser’s affiliates if the services relate directly to the operations and financial reporting of the registrant. Services to be provided by the auditor must receive general pre-approval or specific pre-approval by the audit committee. Any proposed services exceeding pre-approved cost levels will require separate pre-approval by the audit committee.
The audit committee may delegate pre-approval authority to the audit committee chairman. The chairman shall report any pre-approval decisions to the audit committee at its next scheduled meeting. The audit committee does not delegate its responsibility to pre-approve services performed by the independent auditor to management.
(2) No services included in (b) – (d) were approved pursuant to paragraph (c)(7)(i)(C) of Rule 2-01 of Regulation S-X.
(f) Not applicable.
(g) The aggregate fees billed for the most recent fiscal year and the preceding fiscal year by the registrant’s principal accountant for non-audit services rendered to the
registrant, its investment adviser, and any entity controlling, controlled by, or under common control with the investment adviser that provides ongoing services to the registrant were $0 and $4,000, respectively.
(h) The registrant’s audit committee has determined that the provision of non-audit services rendered to the registrant’s investment adviser, and any entity controlling, controlled by, or under common control with the investment adviser that provides ongoing services to the registrant, that were not pre-approved pursuant to paragraph (c)(7)(ii) of Rule 2-01 of Regulation S-X is considered compatible with maintaining the principal accountant’s independence.
Item 5: Audit Committee of Listed Registrants.
Not applicable to open-end investment companies.
Item 6: Schedule of Investments.
The schedule of investments is included as part of the report to shareholders filed under Item 1 of this Form.
Item 7: Disclosure of Proxy Voting Policies and Procedures for Closed-End Management Investment Companies.
Not applicable to open-end investment companies.
Item 8: Portfolio Managers of Closed-End Management Investments Companies.
Not applicable to open-end investment companies.
Item 9: Purchases of Equity Securities by Closed-End Management Investment Company and Affiliated Purchasers.
Not applicable to open-end investment companies.
Item 10. Submission of Matters to a vote of Security Holders.
There have been no material changes to the procedures by which shareholders may recommend nominees to the registrant’s board of directors.
Item 11: Controls and Procedures -
(a) Based on their evaluation of the Registrant’s Disclosure Controls and Procedures as of a date within 90 days of the Filing Date, the Registrant’s Chairman and Treasurer have determined that the Disclosure Controls and Procedures (as defined in Rule 30a-2(c) under the Act) are designed to ensure that information required to be disclosed by the Registrant is recorded, processed, summarized and reported by the filing Date, and that information required to be disclosed in the report is communicated to the Registrant’s management, as appropriate, to allow timely decisions regarding required disclosure.
(b) There were no significant changes in the Registrant’s internal controls or in other factors that could significantly affect these controls subsequent to the date of their evaluation, and there were no corrective actions with regard to significant deficiencies and material weaknesses.
Item 12: Exhibits:
| (a) | The following exhibits are attached to this Form N-CSR: |
(2) A separate certification for each principal executive and principal financial officer of the registrant as required by Rule 30a-2(a) under the Act (17 CFR 270.30a-2) (certification required by Section 302 of the Sarbanes-Oxley Act of 2002).
(b) Certification required by Rule 30a-2(b) under the Act (certification required by Section 906 of the Sarbanes-Oxley Act of 2002).
SIGNATURES
Pursuant to the requirements of the Securities Exchange Act of 1934 and the Investment Company Act of 1940, the registrant has duly caused this report to be signed on its behalf by the undersigned, thereunto duly authorized.
Sit Mutual Funds, Inc.
| By (Signature and Title)* | /s/ Paul E. Rasmussen | |
| Paul E. Rasmussen | ||
| Vice President, Treasurer |
Date August 29, 2014
Pursuant to the requirements of the Securities Exchange Act of 1934 and the Investment Company Act of 1940, this report has been signed below by the following persons on behalf of the registrant and in the capacities and on the dates indicated.
| By (Signature and Title) | /s/ Paul E. Rasmussen | |
| Paul E. Rasmussen | ||
| Vice President, Treasurer |
Date August 29, 2014
| By (Signature and Title) | /s/ Roger J. Sit | |
| Roger J. Sit | ||
| Chairman |
Date August 29, 2014