UNITED STATES
SECURITIES AND EXCHANGE COMMISSION
Washington, D.C. 20549
FORM N-CSRS
CERTIFIED SHAREHOLDER REPORT OF REGISTERED MANAGEMENT INVESTMENT COMPANIES
Investment Company Act file number 811-06378
Templeton Developing Markets Trust
(Exact name of registrant as specified in charter)
500 East Broward Blvd., Suite 2100, Fort Lauderdale, FL 33394-3091
(Address of principal executive offices) (Zip code)
Craig S. Tyle, One Franklin Parkway, San Mateo, CA 94403-1906
(Name and address of agent for service)
Registrant's telephone number, including area code: (954) 527-7500
Date of fiscal year end: _12/31__
Date of reporting period: 06/30/10_
Item 1. Reports to Stockholders.

Templeton Developing Markets Trust
SPECIALIZED EXPERTISE
TRUE DIVERSIFICATION
RELIABILITY YOU CAN TRUST
MUTUAL FUNDS |
Franklin Templeton Investments
Gain From Our Perspective®
Franklin Templeton’s distinct multi-manager structure combines the specialized expertise of three world-class investment management groups—Franklin, Templeton and Mutual Series.
Each of our portfolio management groups operates autonomously, relying on its own research and staying true to the unique investment disciplines that underlie its success.
Franklin. Founded in 1947, Franklin is a recognized leader in fixed income investing and also brings expertise in growth- and value-style U.S. equity investing.
Templeton. Founded in 1940, Templeton pioneered international investing and, in 1954, launched what has become the industry’s oldest global fund. Today, with offices in over 25 countries, Templeton offers investors a truly global perspective.
Mutual Series. Founded in 1949, Mutual Series is dedicated to a unique style of value investing, searching aggressively for opportunity among what it believes are undervalued stocks, as well as arbitrage situations and distressed securities.
Because our management groups work independently and adhere to different investment approaches, Franklin, Templeton and Mutual Series funds typically have distinct portfolios. That’s why our funds can be used to build truly diversified allocation plans covering every major asset class.
At Franklin Templeton Investments, we seek to consistently provide investors with exceptional risk-adjusted returns over the long term, as well as the reliable, accurate and personal service that has helped us become one of the most trusted names in financial services.
| | 529 COLLEGE SAVINGS PLANS |

| Not part of the semiannual report |
Templeton Developing Markets Trust
Your Fund’s Goal and Main Investments: Templeton Developing Markets Trust seeks long-term capital appreciation. Under normal market conditions, the Fund invests at least 80% of its net assets in securities of “developing market countries,” as defined in the Fund’s prospectus.
Performance data represent past performance, which does not guarantee future results. Investment return and principal value will fluctuate, and you may have a gain or loss when you sell your shares. Current performance may differ from figures shown. Please visit franklintempleton.com or call (800) 342-5236 for most recent month-end performance.
This semiannual report for Templeton Developing Markets Trust covers the period ended June 30, 2010.
Performance Overview
Templeton Developing Markets Trust – Class A had a -8.89% cumulative total return for the six months ended June 30, 2010. The Fund underperformed its benchmarks, the Morgan Stanley Capital International (MSCI) Emerging Markets (EM) Index and the Standard & Poor’s/International Finance Corporation Investable (S&P/IFCI) Composite Index, which had total returns of -6.04% and -5.54% for the same period.1 Please note that index performance is purely
1. Source: © 2010 Morningstar. All Rights Reserved. The information contained herein: (1) is proprietary to Morningstar and/or its content providers; (2) may not be copied or distributed; and (3) is not warranted to be accurate, complete or timely. Neither Morningstar nor its content providers are responsible for any damages or losses arising from any use of this information. The MSCI EM Index is a free float-adjusted, market capitalization-weighted index designed to measure equity market performance in global emerging markets. Regional and country returns are from subindexes of the MSCI EM Index. The S&P/IFCI Composite Index is a free float-adjusted, market capitalization-weighted index designed to measure equity performance of global emerging markets. STANDARD & POOR’S®, S&P® and S&P 500® are registered trademarks of Standard & Poor’s Financial Services LLC. Standard & Poor’s does not sponsor, endorse, sell or promote any S&P index-based product. The indexes are unmanaged and include reinvested dividends. One cannot invest directly in an index, and an index is not representative of the Fund’s portfolio.
The dollar value, number of shares or principal amount, and names of all portfolio holdings are listed in the Fund’s Statement of Investments (SOI). The SOI begins on page 17.
for reference and that we do not attempt to track any index, but rather undertake investments on the basis of fundamental research. You can find the Fund’s long-term performance data in the Performance Summary beginning on page 7.
Economic and Market Overview
In the first half of 2010, emerging market countries continued to display solid financial and economic fundamentals. Robust domestic demand and stimulus measures drove strong first-quarter gross domestic product growth rates in many countries. Foreign reserves also remained high, which provided governments a safety net to help weather external financial shocks. Emerging stock markets recorded a minor correction as the European sovereign debt crisis gained momentum and concerns escalated regarding the fiscal health of Greece, Spain, Portugal, Ireland and other countries on the continent. China’s tightening measures further heightened uncertainty surrounding the global economic recovery, and lower commodity prices led investors to lock in gains from last year’s strong performances.
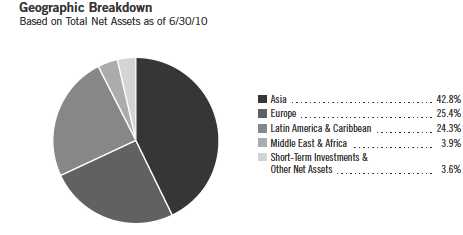
From a regional perspective, Asia was the top performing emerging market during the reporting period. Southeast Asian stock markets Indonesia and Thailand posted double-digit returns, while Malaysia and the Philippines also outperformed their counterparts. Latin America had mixed results. Colombia, Peru and Chile ended the period with positive returns, while Brazil underper-formed largely because of overheating economic concerns and lower commodity prices. In contrast, Eastern European stocks as a whole suffered the largest decline due to contagion from Greece’s financial woes and a weaker euro. Turkey fared better as Standard & Poor’s upgraded the country’s credit rating and its economy grew strongly in the fourth quarter of 2009, which bolstered investor confidence there.
Investment Strategy
We employ a bottom-up, value-oriented, long-term investment approach. We focus on the market price of a company’s securities relative to our evaluation of its long-term (typically five years) earnings, asset value and cash flow potential. We also consider a company’s price/earnings ratio, profit margins and liquidation value. In choosing investments, we strongly believe in on-site visits to issuers of prospective investments to assess critical factors such as management strength and local conditions.
Manager’s Discussion
During the six months under review, some of the largest detractors from the Fund’s absolute performance included Brazil’s Petrobras (Petroleo Brasileiro),
4 | Semiannual Report
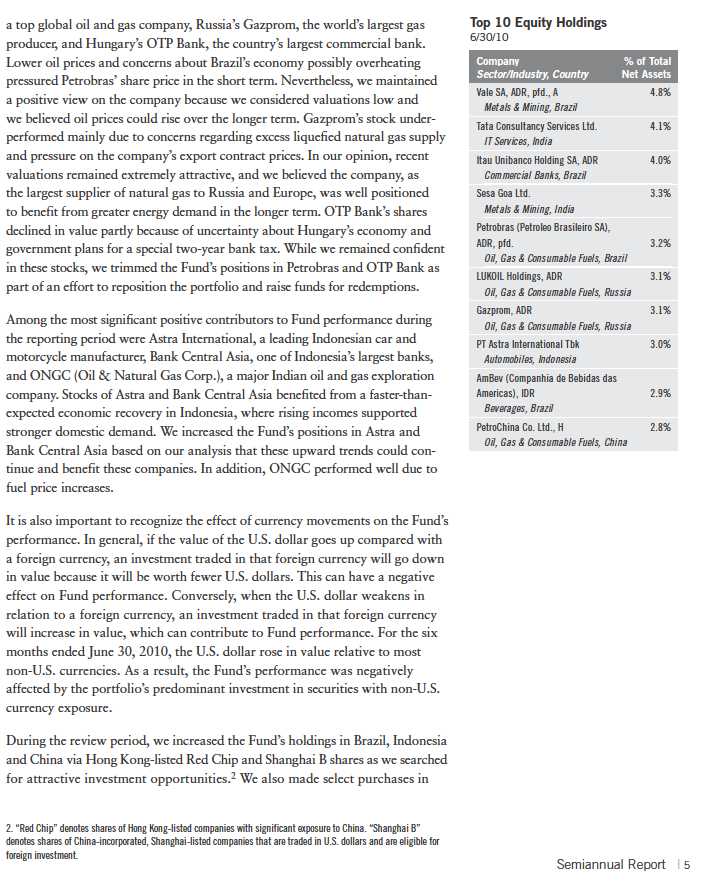
Pakistan, India and Hong Kong due to their attractive fundamentals in our view. Significant purchases included Itau Unibanco Holding, one of Brazil’s largest financial conglomerates, Sesa Goa, one of India’s largest iron ore exporters, and China’s Denway Motors, a leading car manufacturer and distributor.
By industry, we made key investments in diversified metals and mining, automobile manufacturing and IT consulting companies, including Brazil’s Vale, a top global iron ore producer, and India’s Tata Consultancy Services, a major IT consulting company. Based on our analysis, consumer-related industries remained attractive due to large populations in emerging markets, where a growing middle class and greater domestic demand for goods and services could have an increasingly positive effect on these companies. We also had a favorable assessment of the IT consulting industry, which could continue to gain from the services outsourcing trend to emerging markets. Moreover, our outlook for commodity-related industries remained positive, and we believed commodity prices could maintain a long-term upward trend based on ongoing infrastructure development in emerging markets and continued demand for hard commodities.
Conversely, we reduced the Fund’s exposure to Austria, South Korea, Russia and South Africa, which allowed us to focus on stocks we deemed to be relatively more attractively valued within our investment universe and raise funds for redemptions. Some Fund holdings reached their target sale prices, and we sold them by period-end. Industry-wise, we made large sales of holdings in diversified banks, integrated oil and gas, and broadcasting and cable television. Key sales included shares of oil and gas giant PetroChina, Austrian bank Erste Group Bank, and South African diversified media group Naspers. The Fund no longer had any exposure to Erste Group Bank and Naspers by period-end.
We thank you for your continued participation in Templeton Developing Markets Trust and look forward to serving your future investment needs.
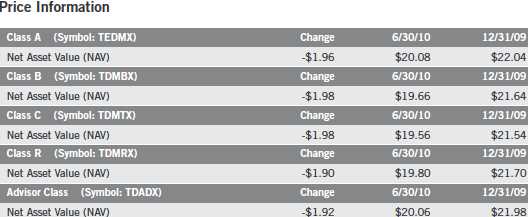
Performance Summary as of 6/30/10
Your dividend income will vary depending on dividends or interest paid by securities in the Fund’s portfolio, adjusted for operating expenses of each class. Capital gain distributions are net profits realized from the sale of portfolio securities. The performance table does not reflect any taxes that a shareholder would pay on Fund dividends, capital gain distributions, if any, or any realized gains on the sale of Fund shares. Total return reflects reinvestment of the Fund’s dividends and capital gain distributions, if any, and any unrealized gains or losses.
Semiannual Report | 7
Performance Summary (continued)
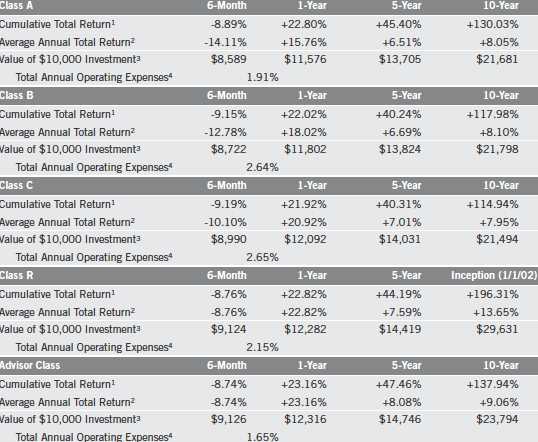
Performance
Cumulative total return excludes sales charges. Average annual total return and value of $10,000 investment include maximum sales charges. Class A: 5.75% maximum initial sales charge; Class B: contingent deferred sales charge (CDSC) declining from 4% to 1% over six years, and eliminated thereafter; Class C: 1% CDSC in first year only; Class R/Advisor Class: no sales charges.
Performance data represent past performance, which does not guarantee future results. Investment return and principal value will fluctuate, and you may have a gain or loss when you sell your shares. Current performance may differ from figures shown. For most recent month-end performance, go to franklintempleton.com or call (800) 342-5236.
8 | Semiannual Report
Performance Summary (continued)
Endnotes
Special risks are associated with foreign investing, including currency fluctuations, economic instability and political developments. Investments in developing markets involve heightened risks related to the same factors, in addition to those associated with these markets’ smaller size and lesser liquidity. The Fund is designed for the aggressive portion of a well-diversified portfolio. The Fund’s prospectus also includes a description of the main investment risks.
| |
Class B: Class C: | These shares have higher annual fees and expenses than Class A shares. Prior to 1/1/04, these shares were offered with an initial sales charge; thus actual total returns would have differed. These shares have higher annual fees and expenses than Class A shares. |
Class R: | Shares are available to certain eligible investors as described in the prospectus. These shares have higher annual fees and expenses than Class A shares. |
Advisor Class: | Shares are available to certain eligible investors as described in the prospectus. |
1. Cumulative total return represents the change in value of an investment over the periods indicated.
2. Average annual total return represents the average annual change in value of an investment over the periods indicated. Six-month return has not been annualized.
3. These figures represent the value of a hypothetical $10,000 investment in the Fund over the periods indicated.
4. Figures are as stated in the Fund’s prospectus current as of the date of this report. In periods of market volatility, assets may decline significantly, causing total annual Fund operating expenses to become higher than the figures shown.
Semiannual Report | 9
Your Fund’s Expenses
As a Fund shareholder, you can incur two types of costs:
Transaction costs, including sales charges (loads) on Fund purchases; and
Ongoing Fund costs, including management fees, distribution and service (12b-1) fees, and other Fund expenses. All mutual funds have ongoing costs, sometimes referred to as operating expenses.
The following table shows ongoing costs of investing in the Fund and can help you understand these costs and compare them with those of other mutual funds. The table assumes a $1,000 investment held for the six months indicated.
Actual Fund Expenses
The first line (Actual) for each share class listed in the table provides actual account values and expenses. The “Ending Account Value” is derived from the Fund’s actual return, which includes the effect of Fund expenses.
You can estimate the expenses you paid during the period by following these steps. Of course, your account value and expenses will differ from those in this illustration:
| 1. | Divide your account value by $1,000. |
| | If an account had an $8,600 value, then $8,600 ÷ $1,000 = 8.6. |
| 2. | Multiply the result by the number under the heading “Expenses Paid During Period.” |
| | If Expenses Paid During Period were $7.50, then 8.6 x $7.50 = $64.50. |
In this illustration, the estimated expenses paid this period are $64.50.
Hypothetical Example for Comparison with Other Funds
Information in the second line (Hypothetical) for each class in the table can help you compare ongoing costs of investing in the Fund with those of other mutual funds. This information may not be used to estimate the actual ending account balance or expenses you paid during the period. The hypothetical “Ending Account Value” is based on the actual expense ratio for each class and an assumed 5% annual rate of return before expenses, which does not represent the Fund’s actual return. The figure under the heading “Expenses Paid During Period” shows the hypothetical expenses your account would have incurred under this scenario. You can compare this figure with the 5% hypothetical examples that appear in shareholder reports of other funds.
10 | Semiannual Report
Your Fund’s Expenses (continued)
Please note that expenses shown in the table are meant to highlight ongoing costs and do not reflect any transaction costs, such as sales charges. Therefore, the second line for each class is useful in comparing ongoing costs only, and will not help you compare total costs of owning different funds. In addition, if transaction costs were included, your total costs would have been higher. Please refer to the Fund prospectus for additional information on operating expenses.

*Expenses are calculated using the most recent six-month expense ratio, annualized for each class (A: 1.85%; B: 2.57%; C: 2.57%; R: 2.07%; and Advisor: 1.57%), multiplied by the average account value over the period, multiplied by 181/365 to reflect the one-half year period.
Semiannual Report | 11
Templeton Developing Markets Trust
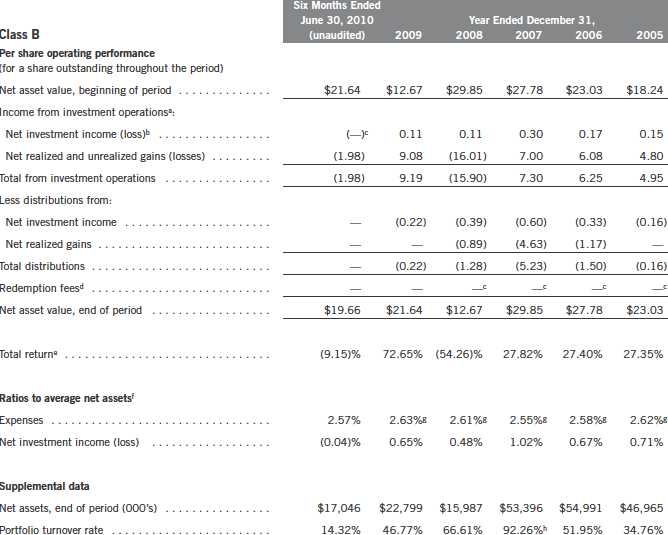
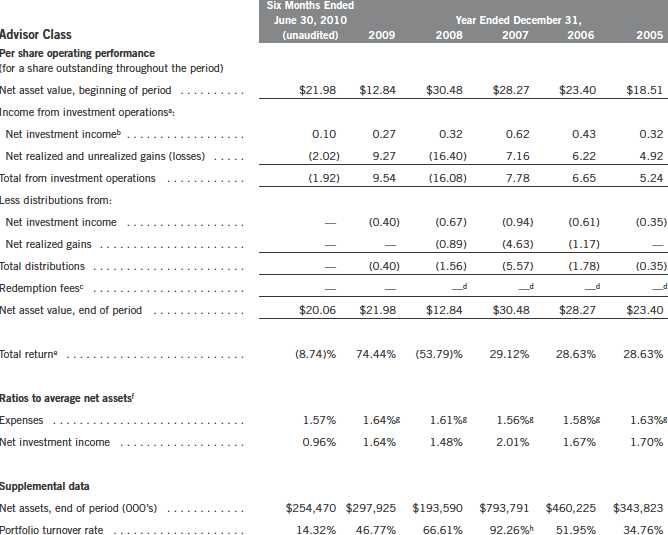
Financial Highlights

aThe amount shown for a share outstanding throughout the period may not correlate with the Statement of Operations for the period due to the timing of sales and repurchases of the Fund shares in relation to income earned and/or fluctuating market value of the investments of the Fund. bBased on average daily shares outstanding. cEffective September 1, 2008, the redemption fee was eliminated. dAmount rounds to less than $0.01 per share. eTotal return does not reflect sales commissions or contingent deferred sales charges, if applicable, and is not annualized for periods less than one year. fRatios are annualized for periods less than one year. gBenefit of expense reduction rounds to less than 0.01%. hExcludes the value of portfolio securities delivered as a result of a redemption in-kind.
12 | The accompanying notes are an integral part of these financial statements. | Semiannual Report
Templeton Developing Markets Trust
Financial Highlights (continued)
aThe amount shown for a share outstanding throughout the period may not correlate with the Statement of Operations for the period due to the timing of sales and repurchases of the Fund shares in relation to income earned and/or fluctuating market value of the investments of the Fund. bBased on average daily shares outstanding. cAmount rounds to less than $0.01 per share. dEffective September 1, 2008, the redemption fee was eliminated. eTotal return does not reflect sales commissions or contingent deferred sales charges, if applicable, and is not annualized for periods less than one year. fRatios are annualized for periods less than one year. gBenefit of expense reduction rounds to less than 0.01%. hExcludes the value of portfolio securities delivered as a result of a redemption in-kind.
Semiannual Report | The accompanying notes are an integral part of these financial statements. | 13
Templeton Developing Markets Trust
Financial Highlights (continued)

aThe amount shown for a share outstanding throughout the period may not correlate with the Statement of Operations for the period due to the timing of sales and repurchases of the Fund shares in relation to income earned and/or fluctuating market value of the investments of the Fund. bBased on average daily shares outstanding. cAmount rounds to less than $0.01 per share. dEffective September 1, 2008, the redemption fee was eliminated. eTotal return does not reflect sales commissions or contingent deferred sales charges, if applicable, and is not annualized for periods less than one year. fRatios are annualized for periods less than one year. gBenefit of expense reduction rounds to less than 0.01%. hExcludes the value of portfolio securities delivered as a result of a redemption in-kind.
14 | The accompanying notes are an integral part of these financial statements. | Semiannual Report
Templeton Developing Markets Trust
Financial Highlights (continued)

aThe amount shown for a share outstanding throughout the period may not correlate with the Statement of Operations for the period due to the timing of sales and repurchases of the Fund shares in relation to income earned and/or fluctuating market value of the investments of the Fund. bBased on average daily shares outstanding. cEffective September 1, 2008, the redemption fee was eliminated. dAmount rounds to less than $0.01 per share. eTotal return does not reflect sales commissions or contingent deferred sales charges, if applicable, and is not annualized for periods less than one year. fRatios are annualized for periods less than one year. gBenefit of expense reduction rounds to less than 0.01%. hExcludes the value of portfolio securities delivered as a result of a redemption in-kind.
Semiannual Report | The accompanying notes are an integral part of these financial statements. | 15
Templeton Developing Markets Trust
Financial Highlights (continued)
aThe amount shown for a share outstanding throughout the period may not correlate with the Statement of Operations for the period due to the timing of sales and repurchases of the Fund shares in relation to income earned and/or fluctuating market value of the investments of the Fund. bBased on average daily shares outstanding. cEffective September 1, 2008, the redemption fee was eliminated. dAmount rounds to less than $0.01 per share. eTotal return is not annualized for periods less than one year. fRatios are annualized for periods less than one year. gBenefit of expense reduction rounds to less than 0.01%. hExcludes the value of portfolio securities delivered as a result of a redemption in-kind.
16 | The accompanying notes are an integral part of these financial statements. | Semiannual Report
Templeton Developing Markets Trust
Statement of Investments, June 30, 2010 (unaudited)

Semiannual Report | 17
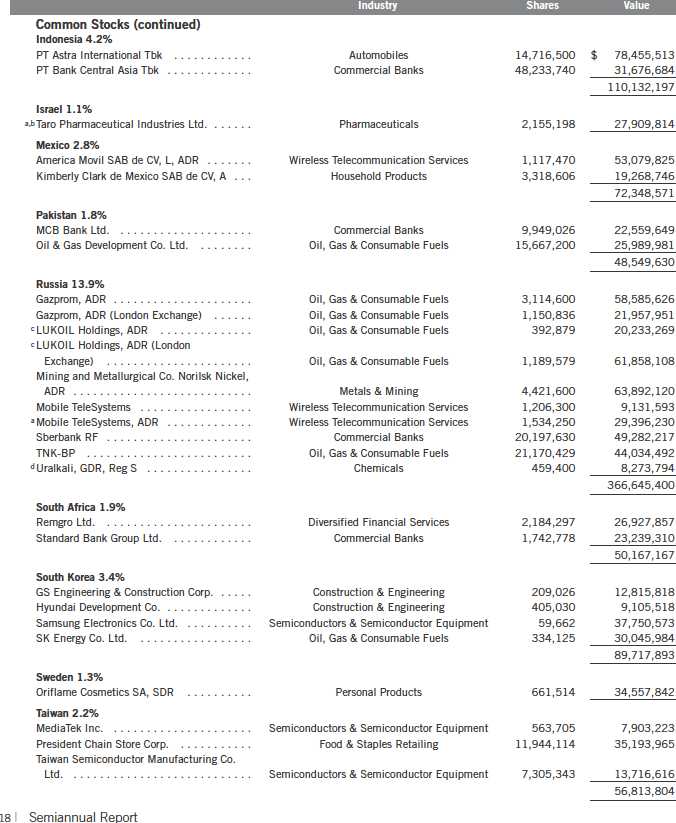
Templeton Developing Markets Trust
Statement of Investments, June 30, 2010 (unaudited) (continued)
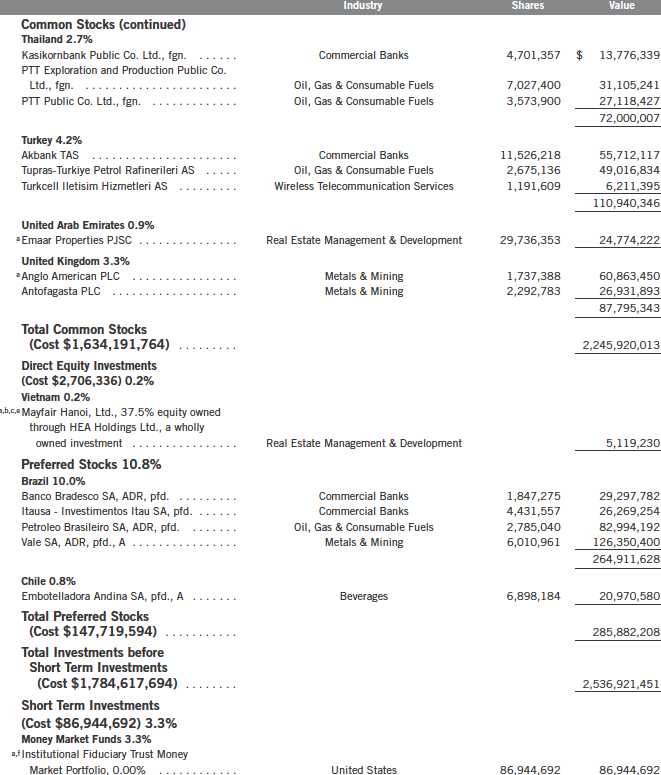
Templeton Developing Markets Trust
Statement of Investments, June 30, 2010 (unaudited) (continued)
Semiannual Report | 19
Templeton Developing Markets Trust
Statement of Investments, June 30, 2010 (unaudited) (continued)
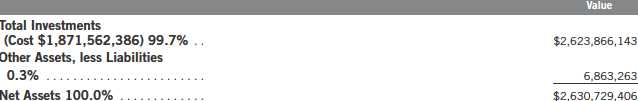
See Abbreviations on page 35.
aNon-income producing.
bSee Note 10 regarding holdings of 5% voting securities.
cSee Note 11 regarding other considerations. |
dSecurity was purchased pursuant to Regulation S under the Securities Act of 1933, which exempts from registration securities offered and sold outside of the United States. Such a security cannot be sold in the United States without either an effective registration statement filed pursuant to the Securities Act of 1933, or pursuant to an exemption from registration. This security has been deemed liquid under guidelines approved by the Trust’s Board of Trustees. At June 30, 2010, the value of this security was $8,273,794, representing 0.31% of net assets. eSee Note 9 regarding restricted securities. fSee Note 7 regarding investments in the Institutional Fiduciary Trust Money Market Portfolio. The rate shown is the annualized seven-day yield at period end.
20 | The accompanying notes are an integral part of these financial statements. | Semiannual Report
Templeton Developing Markets Trust
Financial Statements
Statement of Assets and Liabilities
June 30, 2010 (unaudited) |
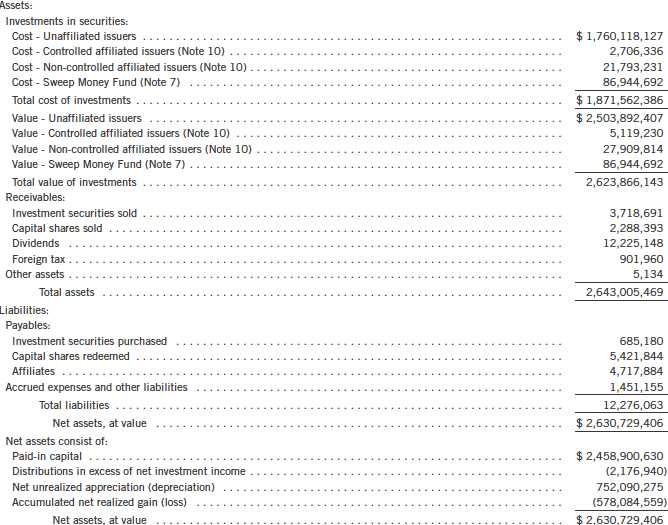
Semiannual Report | The accompanying notes are an integral part of these financial statements. | 21
Templeton Developing Markets Trust
Financial Statements (continued)
Statement of Assets and Liabilities (continued)
June 30, 2010 (unaudited) |
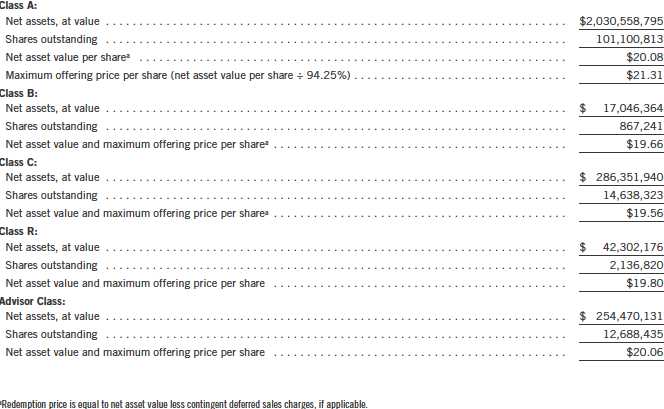
22 | The accompanying notes are an integral part of these financial statements. | Semiannual Report
Templeton Developing Markets Trust
Financial Statements (continued)
Statement of Operations
for the six months ended June 30, 2010 (unaudited) |
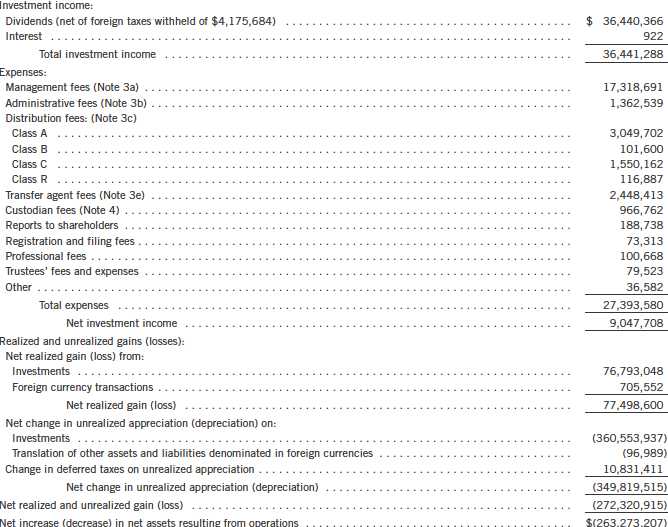
Semiannual Report | The accompanying notes are an integral part of these financial statements. | 23
Templeton Developing Markets Trust
Financial Statements (continued)
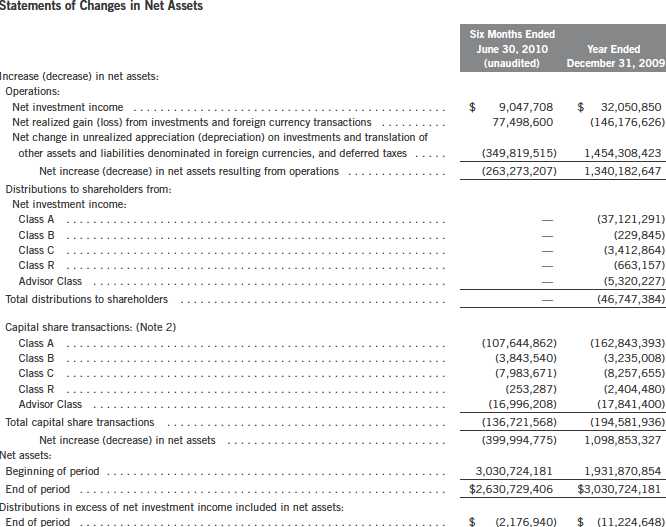
24 | The accompanying notes are an integral part of these financial statements. | Semiannual Report
Templeton Developing Markets Trust
Notes to Financial Statements (unaudited)
1. ORGANIZATION AND SIGNIFICANT ACCOUNTING POLICIES
Templeton Developing Markets Trust (Fund) is registered under the Investment Company Act of 1940, as amended, (1940 Act) as an open-end investment company. The Fund offers five classes of shares: Class A, Class B, Class C, Class R, and Advisor Class. Each class of shares differs by its initial sales load, contingent deferred sales charges, distribution fees, voting rights on matters affecting a single class and its exchange privilege.
The following summarizes the Fund’s significant accounting policies.
a. Financial Instrument Valuation
The Fund values its investments in securities and other assets and liabilities carried at fair value daily. Fair value is the price that would be received to sell an asset or paid to transfer a liability in an orderly transaction between market participants on the measurement date. Under procedures approved by the Fund’s Board of Trustees, the Fund may utilize independent pricing services, quotations from securities and financial instrument dealers, and other market sources to determine fair value.
Equity securities listed on an exchange or on the NASDAQ National Market System are valued at the last quoted sale price or the official closing price of the day, respectively. Foreign equity securities are valued as of the close of trading on the foreign stock exchange on which the security is primarily traded, or the NYSE, whichever is earlier. The value is then converted into its U.S. dollar equivalent at the foreign exchange rate in effect at the close of the NYSE on the day that the value of the security is determined. Over-the-counter securities are valued within the range of the most recent quoted bid and ask prices. Securities that trade in multiple markets or on multiple exchanges are valued according to the broadest and most representative market. Certain equity securities are valued based upon fundamental characteristics or relationships to similar securities. Investments in open-end mutual funds are valued at the closing net asset value.
The Fund has procedures to determine the fair value of securities and other financial instruments for which market prices are not readily available or which may not be reliably priced. Under these procedures, the Fund primarily employs a market-based approach which may use related or comparable assets or liabilities, recent transactions, market multiples, book values, and other relevant information for the investment to determine the fair value of the investment. The Fund may also use an income-based valuation approach in which the anticipated future cash flows of the investment are discounted to calculate fair value. Discounts may also be applied due to the nature or duration of any restrictions on the disposition of the investments. Due to the inherent uncertainty of valuations of such investments, the fair values may differ significantly from the values that would have been used had an active market existed.
Semiannual Report | 25
Templeton Developing Markets Trust
Notes to Financial Statements (unaudited) (continued)
| 1. | ORGANIZATION AND SIGNIFICANT ACCOUNTING POLICIES (continued) |
| a. | Financial Instrument Valuation (continued) |
Trading in securities on foreign exchanges and over-the-counter markets may be completed before the daily close of business on the NYSE. Occasionally, events occur between the time at which trading in a foreign security is completed and the close of the NYSE that might call into question the reliability of the value of a portfolio security held by the Fund. As a result, differences may arise between the value of the Fund’s portfolio securities as determined at the foreign market close and the latest indications of value at the close of the NYSE. In order to minimize the potential for these differences, the investment manager monitors price movements following the close of trading in foreign stock markets through a series of country specific market proxies (such as baskets of American Depository Receipts, futures contracts and exchange traded funds). These price movements are measured against established trigger thresholds for each specific mark et proxy to assist in determining if an event has occurred that may call into question the reliability of the values of the foreign securities held by the Fund. If such an event occurs, the securities may be valued using fair value procedures, which may include the use of independent pricing services.
b. Foreign Currency Translation
Portfolio securities and other assets and liabilities denominated in foreign currencies are translated into U.S. dollars based on the exchange rate of such currencies against U.S. dollars on the date of valuation. The Fund may enter into foreign currency exchange contracts to facilitate transactions denominated in a foreign currency. Purchases and sales of securities, income and expense items denominated in foreign currencies are translated into U.S. dollars at the exchange rate in effect on the transaction date. Occasionally, events may impact the availability or reliability of foreign exchange rates used to convert the U.S. dollar equivalent value. If such an event occurs, the foreign exchange rate will be valued at fair value using procedures established and approved by the Fund’s Board of Trustees.
The Fund does not separately report the effect of changes in foreign exchange rates from changes in market prices on securities held. Such changes are included in net realized and unrealized gain or loss from investments on the Statement of Operations.
Realized foreign exchange gains or losses arise from sales of foreign currencies, currency gains or losses realized between the trade and settlement dates on securities transactions and the difference between the recorded amounts of dividends, interest, and foreign withholding taxes and the U.S. dollar equivalent of the amounts actually received or paid. Net unrealized foreign exchange gains and losses arise from changes in foreign exchange rates on foreign denominated assets and liabilities other than investments in securities held at the end of the reporting period.
26 | Semiannual Report
Templeton Developing Markets Trust
Notes to Financial Statements (unaudited) (continued)
| 1. | ORGANIZATION AND SIGNIFICANT ACCOUNTING POLICIES (continued) |
| c. | Income and Deferred Taxes |
It is the Fund’s policy to qualify as a regulated investment company under the Internal Revenue Code and to distribute to shareholders substantially all of its taxable income and net realized gains. As a result, no provision for federal income taxes is required. The Fund files U.S. income tax returns as well as tax returns in certain other jurisdictions. As of June 30, 2010, and for all open tax years, the Fund has determined that no provision for income tax is required in the Fund’s financial statements. Open tax years are those that remain subject to examination by such taxing authorities, which in the case of the U.S. is three years after the filing of a fund’s tax return.
Foreign securities held by the Fund may be subject to foreign taxation on dividend and interest income received. Foreign taxes, if any, are recorded based on the tax regulations and rates that exist in the foreign markets in which the Fund invests.
The Fund may be subject to a tax imposed on net realized gains on securities of certain foreign countries. The Fund records an estimated deferred tax liability for net unrealized gains on these securities in an amount that would be payable if the securities were disposed of on the valuation date.
d. Security Transactions, Investment Income, Expenses and Distributions
Security transactions are accounted for on trade date. Realized gains and losses on security transactions are determined on a specific identification basis. Estimated expenses are accrued daily. Dividend income is recorded on the ex-dividend date except that certain dividends from foreign securities are recognized as soon as the Fund is notified of the ex-dividend date. Distributions to shareholders are recorded on the ex-dividend date and are determined according to income tax regulations (tax basis). Distributable earnings determined on a tax basis may differ from earnings recorded in accordance with accounting principles generally accepted in the United States of America. These differences may be permanent or temporary. Permanent differences are reclassified among capital accounts to reflect their tax character. These reclassifications have no impact on net assets or the results of operations. Temporary differences are not reclassified, as they m ay reverse in subsequent periods.
Realized and unrealized gains and losses and net investment income, not including class specific expenses, are allocated daily to each class of shares based upon the relative proportion of net assets of each class. Differences in per share distributions, by class, are generally due to differences in class specific expenses.
Semiannual Report | 27
Templeton Developing Markets Trust
Notes to Financial Statements (unaudited) (continued)
| 1. | ORGANIZATION AND SIGNIFICANT ACCOUNTING POLICIES (continued) |
| e. | Accounting Estimates |
The preparation of financial statements in accordance with accounting principles generally accepted in the United States of America requires management to make estimates and assumptions that affect the reported amounts of assets and liabilities at the date of the financial statements and the amounts of income and expenses during the reporting period. Actual results could differ from those estimates.
f. Guarantees and Indemnifications
Under the Fund’s organizational documents, its officers and trustees are indemnified by the Fund against certain liabilities arising out of the performance of their duties to the Fund. Additionally, in the normal course of business, the Fund, enters into contracts with service providers that contain general indemnification clauses. The Fund’s maximum exposure under these arrangements is unknown as this would involve future claims that may be made against the Fund that have not yet occurred. Currently, the Fund expects the risk of loss to be remote.
2. SHARES OF BENEFICIAL INTEREST
At June 30, 2010, there were an unlimited number of shares authorized (without par value).
Transactions in the Fund’s shares were as follows:

28 | Semiannual Report
Templeton Developing Markets Trust
Notes to Financial Statements (unaudited) (continued)

3. TRANSACTIONS WITH AFFILIATES
Franklin Resources, Inc. is the holding company for various subsidiaries that together are referred to as Franklin Templeton Investments. Certain officers and trustees of the Fund are also officers and/or directors of the following subsidiaries:
| |
Subsidiary Templeton Asset Management Ltd. (TAML) Franklin Templeton Services, LLC (FT Services) Franklin Templeton Distributors, Inc. (Distributors) Franklin Templeton Investor Services, LLC (Investor Services) | Affiliation Investment manager Administrative manager Principal underwriter Transfer agent |
a. Management Fees
Effective May 1, 2010, the Fund pays an investment management fee to TAML based on the average daily net assets of the Fund as follows:
Semiannual Report | 29
Templeton Developing Markets Trust
Notes to Financial Statements (unaudited) (continued)
| 3. | TRANSACTIONS WITH AFFILIATES (continued) |
| a. | Management Fees (continued) |
Prior to May 1, 2010, the Fund paid fees to TAML based on the average daily net assets of the fund as follows:

b. Administrative Fees
The Fund pays an administrative fee to FT Services based on the Fund’s average daily net assets as follows:

c. Distribution Fees
The Fund’s Board of Trustees has adopted distribution plans for each share class, with the exception of Advisor Class shares, pursuant to Rule 12b-1 under the 1940 Act. Under the Fund’s Class A reimbursement distribution plan, the Fund reimburses Distributors for costs incurred in connection with the servicing, sale and distribution of the Fund’s shares up to the maximum annual plan rate. Under the Class A reimbursement distribution plan, costs exceeding the maximum for the current plan year cannot be reimbursed in subsequent periods.
In addition, under the Fund’s Class B, C, and R compensation distribution plans, the Fund pays Distributors for costs incurred in connection with the servicing, sale and distribution of the Fund’s shares up to the maximum annual plan rate for each class.
The maximum annual plan rates, based on the average daily net assets, for each class, are as follows:

The Board of Trustees has set the current rate at 0.30% per year for Class A shares until further notice and approval by the Board.
30 | Semiannual Report
Templeton Developing Markets Trust
Notes to Financial Statements (unaudited) (continued)
| 3. | TRANSACTIONS WITH AFFILIATES (continued) |
| d. | Sales Charges/Underwriting Agreements |
Distributors has advised the Fund of the following commission transactions related to the sales and redemptions of the Fund’s shares for the period:

e. Transfer Agent Fees
For the period ended June 30, 2010, the Fund paid transfer agent fees of $2,448,413, of which $1,489,567 was retained by Investor Services.
4. EXPENSE OFFSET ARRANGEMENT
The Fund has entered into an arrangement with its custodian whereby credits realized as a result of uninvested cash balances are used to reduce a portion of the Fund’s custodian expenses. During the period ended June 30, 2010, there were no credits earned.
5. INCOME TAXES
For tax purposes, capital losses may be carried over to offset future capital gains, if any. At December 31, 2009, the Fund had tax basis capital losses of $641,833,936 expiring in 2017.
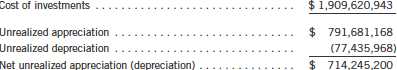
At June 30, 2010, the cost of investments and net unrealized appreciation (depreciation) for income tax purposes were as follows:
Net investment income differs for financial statement and tax purposes primarily due to differing treatments of foreign currency transactions, passive foreign investment company shares, corporate actions, and non-deductible excise tax expense.
Net realized gains (losses) differ for financial statement and tax purposes primarily due to differing treatments of wash sales, foreign currency transactions, passive foreign investment company shares, and corporate actions.
Semiannual Report | 31
Templeton Developing Markets Trust
Notes to Financial Statements (unaudited) (continued)
6. INVESTMENT TRANSACTIONS
Purchases and sales of investments (excluding short term securities) for the period ended June 30, 2010, aggregated $394,243,757 and $583,433,460, respectively.
7. INVESTMENTS IN INSTITUTIONAL FIDUCIARY TRUST MONEY MARKET PORTFOLIO
The Fund may invest in the Institutional Fiduciary Trust Money Market Portfolio (Sweep Money Fund), an open-end investment company managed by Franklin Advisers, Inc. (an affiliate of the investment manager). Pursuant to a SEC exemptive order specific to the Fund’s investment in the Sweep Money Fund, management fees paid by the Fund are reduced on assets invested in the Sweep Money Fund, in an amount not to exceed the management and administrative fees paid by the Sweep Money Fund.
8. CONCENTRATION OF RISK
Investing in foreign securities may include certain risks and considerations not typically associated with investing in U.S. securities, such as fluctuating currency values and changing local and regional economic, political and social conditions, which may result in greater market volatility. In addition, certain foreign securities may not be as liquid as U.S. securities.
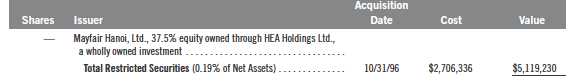
9. RESTRICTED SECURITIES
The Fund may invest in securities that are restricted under the Securities Act of 1933 (1933 Act) or which are subject to legal, contractual, or other agreed upon restrictions on resale. Restricted securities are often purchased in private placement transactions, and cannot be sold without prior registration unless the sale is pursuant to an exemption under the 1933 Act. Disposal of these securities may require greater effort and expense, and prompt sale at an acceptable price may be difficult. The Fund may have registration rights for restricted securities. The issuer generally incurs all registration costs.
At June 30, 2010, the Fund held investments in restricted securities, excluding certain securities exempt from registration under the 1933 Act deemed to be liquid, as follows:
32 | Semiannual Report
Templeton Developing Markets Trust
Notes to Financial Statements (unaudited) (continued)
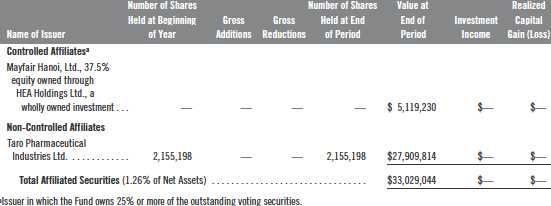
10. HOLDINGS OF 5% VOTING SECURITIES OF PORTFOLIO COMPANIES
The 1940 Act defines “affiliated companies” to include investments in portfolio companies in which a fund owns 5% or more of the outstanding voting securities. Investments in “affiliated companies” for the Fund for the period ended June 30, 2010, were as shown below.
11. OTHER CONSIDERATIONS
Officers, directors or employees of the Fund’s Investment Manager, may serve from time to time as members of boards of directors of companies in which the Fund invests. Such participation may result in the possession by the Investment Manager of material non-public information which, pursuant to the Fund’s policies and the requirements of applicable securities laws, could prevent the Fund from trading in the securities of such companies for limited or extended periods of time.
12. CREDIT FACILITY
The Fund, together with other U.S. registered and foreign investment funds (collectively “Borrowers”), managed by Franklin Templeton Investments, are borrowers in a joint syndicated senior unsecured credit facility totaling $750 million (Global Credit Facility) which matures on January 21, 2011. This Global Credit Facility provides a source of funds to the Borrowers for temporary and emergency purposes, including the ability to meet future unanticipated or unusually large redemption requests.
Semiannual Report | 33
Templeton Developing Markets Trust
Notes to Financial Statements (unaudited) (continued)
12. CREDIT FACILITY (continued)
Under the terms of the Global Credit Facility, the Fund shall, in addition to interest charged on any borrowings made by the Fund and other costs incurred by the Fund, pay its share of fees and expenses incurred in connection with the implementation and maintenance of the Global Credit Facility, based upon its relative share of the aggregate net assets of all of the Borrowers, including an annual commitment fee of 0.10% based upon the unused portion of the Global Credit Facility, which is reflected in other expenses on the Statement of Operations. During the period ended June 30, 2010, the Fund did not use the Global Credit Facility.
13. REGULATORY AND LITIGATION MATTERS
During the period ended June 30, 2010, the Fund received $1,212,814 resulting from a settlement between the SEC and Franklin Advisers, Inc. (an affiliate of the investment manager) relating to market-timing activities, as previously reported in the Fund’s financial statements during the years ended December 31, 2003 through December 31, 2008. This payment is included in capital shares transactions on the Statements of Changes in Net Assets.
14. FAIR VALUE MEASUREMENTS
The Fund follows a fair value hierarchy that distinguishes between market data obtained from independent sources (observable inputs) and the Fund’s own market assumptions (unobservable inputs). These inputs are used in determining the value of the Fund’s investments and are summarized in the following fair value hierarchy:
Level 1 – quoted prices in active markets for identical securities
Level 2 – other significant observable inputs (including quoted prices for similar securities, interest rates, prepayment speed, credit risk, etc.)
Level 3 – significant unobservable inputs (including the Fund’s own assumptions in deter- mining the fair value of investments)
The inputs or methodology used for valuing securities are not an indication of the risk associated with investing in those securities.
For movements between the levels within the fair value hierarchy, the Fund has adopted a policy of recognizing the transfers as of the date of the underlying event which caused the movement.
34 | Semiannual Report
Templeton Developing Markets Trust
Notes to Financial Statements (unaudited) (continued)
14. FAIR VALUE MEASUREMENTS (continued)
The following is a summary of the inputs used as of June 30, 2010, in valuing the Fund’s assets and liabilities carried at fair value:
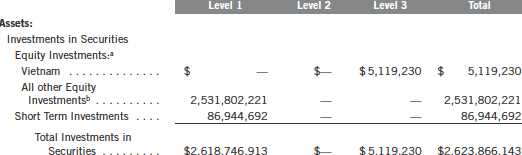
aIncludes common and preferred stock as well as other equity investments. bFor detailed country descriptions, see the accompanying Statement of Investments.
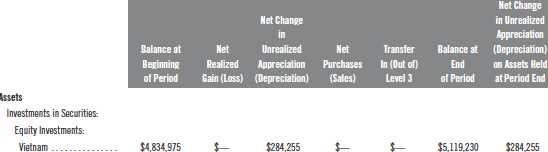
At June 30, 2010, the reconciliation of assets in which significant unobservable inputs (Level 3) were used in determining fair value, is as follows:
15. SUBSEQUENT EVENTS
The Fund has evaluated subsequent events through the issuance of the financial statements and determined that no events have occurred that require disclosure.
ABBREVIATIONS
Selected Portfolio
ADR - American Depository Receipt
GDR - Global Depository Receipt
IDR - International Depository Receipt
SDR - Swedish Depository Receipt |
Semiannual Report | 35
Templeton Developing Markets Trust
Shareholder Information
Board Review of Investment Management Agreement
At a meeting held February 23, 2010, the Board of Trustees (Board), including a majority of non-interested or independent Trustees, approved renewal of the investment management agreement for the Fund. In reaching this decision, the Board took into account information furnished throughout the year at regular Board meetings, as well as information prepared specifically in connection with the annual renewal review process. Information furnished and discussed throughout the year included investment performance reports and related financial information for the Fund, as well as periodic reports on shareholder services, legal, compliance, pricing, brokerage commissions and execution and other services provided by the Investment Manager (Manager) and its affiliates. Information furnished specifically in connection with the renewal process included a report for the Fund prepared by Lipper, Inc. (Lipper), an independent organization, as well as additional ma terial, including a Fund profitability analysis report prepared by management. The Lipper report compared the Fund’s investment performance and expenses with those of other mutual funds deemed comparable to the Fund as selected by Lipper. The Fund profitability analysis report discussed the profitability to Franklin Templeton Investments from its overall U.S. fund operations, as well as on an individual fund-by-fund basis. Included with such profitability analysis report was information on a fund-by-fund basis listing portfolio managers and other accounts they manage, as well as information on management fees charged by the Manager and its affiliates to U.S. mutual funds and other accounts, including management’s explanation of differences where relevant and a three-year expense analysis with an explanation for any increase in expense ratios. Additional material accompanying such report was a memorandum prepared by management describing project initiatives and capital investments relating to the se rvices provided to the Fund by the Franklin Templeton Investments organization, as well as a memorandum relating to economies of scale and a comparative analysis concerning transfer agent fees charged the Fund.
In considering such materials, the independent Trustees received assistance and advice from and met separately with independent counsel. In approving continuance of the investment management agreement for the Fund, the Board, including a majority of independent Trustees, determined that the existing management fee structure was fair and reasonable and that continuance of the investment management agreement was in the best interests of the Fund and its shareholders. While attention was given to all information furnished, the following discusses some primary factors relevant to the Board’s decision.
NATURE, EXTENT AND QUALITY OF SERVICES. The Board was satisfied with the nature and quality of the overall services provided by the Manager and its affiliates to the Fund and its shareholders. In addition to investment performance and expenses discussed later, the Board’s opinion was based, in part, upon periodic reports furnished it showing that the investment policies and restrictions for the Fund were consistently complied with as well as other reports periodically furnished the Board covering matters such as the compliance of portfolio managers and other management personnel with the code of ethics adopted throughout the Franklin Templeton fund complex, the adherence to fair value pricing procedures established by the Board, and the accuracy
36 | Semiannual Report
Templeton Developing Markets Trust
Shareholder Information (continued)
Board Review of Investment Management Agreement (continued)
of net asset value calculations. The Board also noted the extent of benefits provided Fund shareholders from being part of the Franklin Templeton family of funds, including the right to exchange investments between the same class of funds without a sales charge, the ability to reinvest Fund dividends into other funds and the right to combine holdings in other funds to obtain a reduced sales charge. Favorable consideration was given to management’s continuous efforts and expenditures in establishing back-up systems and recovery procedures to function in the event of a natural disaster, it being noted that such systems and procedures had functioned smoothly during the Florida hurricanes and blackouts experienced in recent years. Among other factors taken into account by the Board were the Manager’s best execution trading policies, including a favorable report by an independent portfolio trading analytical firm. Consideration was also given t o the experience of each Fund’s portfolio management team, the number of accounts managed and general method of compensation. In this latter respect, the Board noted that a primary factor in management’s determination of a portfolio manager’s bonus compensation was the relative investment performance of the funds he or she managed and that a portion of such bonus was required to be invested in a predesignated list of funds within such person’s fund management area so as to be aligned with the interests of Fund shareholders. The Board also took into account the quality of transfer agent and shareholder services provided Fund shareholders by an affiliate of the Manager, noting continuing expenditures by management to increase and improve the scope of such services, periodic favorable reports on such service conducted by third parties, and the continuous enhancements to and high industry ranking given the Franklin Templeton website. Particular attention was given to management’s conserv ative approach and diligent risk management procedures, including continuous monitoring of counterparty credit risk and attention given to derivatives and other complex instruments. The Board also took into account, among other things, management’s efforts in establishing a global credit facility for the benefit of the Fund and other accounts managed by Franklin Templeton Investments to provide a source of cash for temporary and emergency purposes or to meet unusual redemption requests as well as the strong financial position of the Manager’s parent company and its commitment to the mutual fund business as evidenced by its subsidization of money market funds. The Board also noted management’s efforts to minimize any negative impact on the nature and quality of services provided the Fund arising from Franklin Templeton Investments’ implementation of a hiring freeze and employee reductions in response to market conditions during the latter part of 2008 and early 2009.
INVESTMENT PERFORMANCE. The Board placed significant emphasis on the investment performance of the Fund in view of its importance to shareholders. While consideration was given to performance reports and discussions with portfolio managers at Board meetings during the year, particular attention in assessing performance was given to the Lipper report furnished for the agreement renewal. The Lipper report prepared for the Fund showed the investment performance of its Class A shares during 2009, as well as during the previous 10 years ended December 31, 2009, in comparison to a performance universe consisting of all retail and institutional emerging market funds as selected by Lipper. The Lipper report showed the Fund’s total return during 2009
Semiannual Report | 37
Templeton Developing Markets Trust
Shareholder Information (continued)
Board Review of Investment Management Agreement (continued)
to be in the middle quintile of its Lipper performance universe, and that its total return on an annualized basis was either in the lowest or second-lowest quintile of such universe for the previous three-, five- and 10-year periods. In discussing such performance, management set forth steps being taken to improve the Fund’s investment portfolio process while emphasizing the Fund’s conservative investment approach, which was reflected in the fact that its total return during the market turmoil existing in 2008 was in the second-highest quintile of its performance universe. The Board also noted that the Fund’s total return during 2009 exceeded 73% as shown in the Lipper report. While intending to continuously monitor future performance, the Board believed the Fund’s comparative performance, as set forth in the Lipper report, did not warrant any change in portfolio management or overall investment approach.
COMPARATIVE EXPENSES. Consideration was given to a comparative analysis of the management fees and total expense ratios of the Fund compared with those of a group of other funds selected by Lipper as its appropriate Lipper expense group. Lipper expense data is based upon information taken from each fund’s most recent annual report, which reflects historical asset levels that may be quite different from those currently existing, particularly in a period of market volatility. While recognizing such inherent limitation and the fact that expense ratios generally increase as assets decline and decrease as assets grow, the Board believed the independent analysis conducted by Lipper to be an appropriate measure of comparative expenses. In reviewing comparative costs, Lipper provides information on the Fund’s contractual investment management fee in comparison with the contra ctual investment management fee that would have been charged by other funds within its Lipper expense group assuming they were similar in size to the Fund, as well as the actual total expenses of the Fund in comparison with those of its Lipper expense group. The Lipper contractual investment management fee analysis includes administrative charges as being part of a management fee, and actual total expenses, for comparative consistency, are shown by Lipper for Fund Class A shares. The results of such expense comparisons showed that the contractual investment management fee rate for the Fund was 15.1 basis points above the median for the Lipper expense group, and its actual total expense ratio was seven basis points above the median of such expense group. The Board found such fee and expenses in comparison to those of its Lipper expense group to be acceptable in view of factors relating to the Fund’s operations, such as the quality and experience of its portfolio managers and research staff, and the depth of the Manager’s physical presence and coverage in emerging markets geographical areas, but believed it appropriate to add an additional breakpoint reduction to the Fund’s investment management fee as discussed under “Economies of Scale.”
MANAGEMENT PROFITABILITY. The Board also considered the level of profits realized by the Manager and its affiliates in connection with the operation of the Fund. In this respect, the Board reviewed the Fund profitability analysis that addresses the overall profitability of Franklin Templeton’s U.S. fund business, as well as its profits in providing management and other services to the Fund during the 12-month period ended September 30, 2009, being the most recent fiscal
38 | Semiannual Report
Templeton Developing Markets Trust
Shareholder Information (continued)
Board Review of Investment Management Agreement (continued)
year-end for Franklin Resources, Inc., the Manager’s parent. In reviewing the analysis, attention was given to the methodology followed in allocating costs to the Fund, it being recognized that allocation methodologies are inherently subjective and various allocation methodologies may each be reasonable while producing different results. In this respect, the Board noted that, while being continuously refined and reflecting changes in the Manager’s own cost accounting, the cost allocation methodology was consistent with that followed in profitability report presentations for the Fund made in prior years and that the Fund’s independent registered public accounting firm had been engaged by the Manager to review the reasonableness of the allocation methodologies solely for use by the Fund’s Board in reference to the profitability analysis. In reviewing and discussing such analysis, management discussed with the Board its belief that costs incurred in establishing the infrastructure necessary for the type of mutual fund operations conducted by the Manager and its affiliates may not be fully reflected in the expenses allocated to the Fund in determining its profitability, as well as the fact that the level of profits, to a certain extent, reflected operational cost savings and efficiencies initiated by management. The Board also took into account management’s expenditures in improving shareholder services provided the Fund, as well as the need to meet additional regulatory and compliance requirements resulting from the Sarbanes-Oxley Act and recent SEC and other regulatory requirements. In addition, the Board considered a third-party study comparing the profitability of the Manager’s parent on an overall basis to other publicly held managers broken down to show profitability from management operations exclusive of distribution expenses, as well as profitability including distribution expenses. The Board also considered the exten t to which the Manager and its affiliates might derive ancillary benefits from fund operations, including its interest in a joint venture entity that financed up-front commissions paid to brokers/dealers who sold fund Class B shares prior to February 2005 when the offering of such shares was discontinued, as well as potential benefits resulting from allocation of fund brokerage and the use of commission dollars to pay for research. Based upon its consideration of all these factors, the Board determined that the level of profits realized by the Manager and its affiliates from providing services to the Fund was not excessive in view of the nature, quality and extent of services provided.
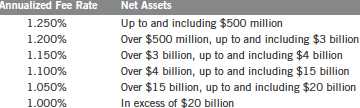
ECONOMIES OF SCALE. The Board also considered whether economies of scale are realized by the Manager and its affiliates as the Fund grows larger and the extent to which this is reflected in the level of management fees charged. While recognizing that any precise determination is inherently subjective, the Board noted that based upon the Fund profitability analysis, it appears that as some funds get larger, at some point economies of scale do result in the Manager realizing a larger profit margin on management services provided such a fund. The Board also noted that economies of scale are shared with a fund and its shareholders through management fee breakpoints so that as a fund grows in size, its effective management fee rate declines. The Fund’s current management advisory fee schedule, reflecting reductions implemented effective May 1, 2009, provides a rate of 1.25% on the first $1 billion of Fund net assets; 1.20% on the next $2 billion of Fund net assets; 1.15% on the next $1 billion of Fund net assets; 1.10% on the next $11 billion of Fund net assets;
Semiannual Report | 39
Templeton Developing Markets Trust
Shareholder Information (continued)
Board Review of Investment Management Agreement (continued)
1.05% on the next $5 billion of Fund net assets; and 1.00% on net assets in excess of $20 billion. The Board negotiated with management to add an additional breakpoint to such fee reducing it to 1.20% at the $500 million to $1 billion asset level effective May 1, 2010. The Fund is also charged a separate fee for administrative services that starts at 0.15% on the first $200 million of Fund net assets, and declines through breakpoints to a fixed rate of 0.075% after net assets reach the $1.2 billion level. At the end of 2009, the Fund’s net assets were approximately $3 billion, and to the extent economies of scale may be realized by the Manager and its affiliates, the Board believes the schedules of management advisory and administrative fees provide a sharing of benefits with the Fund and its shareholders.
Proxy Voting Policies and Procedures
The Trust’s investment manager has established Proxy Voting Policies and Procedures (Policies) that the Trust uses to determine how to vote proxies relating to portfolio securities. Shareholders may view the Trust’s complete Policies online at franklintempleton.com. Alternatively, shareholders may request copies of the Policies free of charge by calling the Proxy Group collect at (954) 527-7678 or by sending a written request to: Franklin Templeton Companies, LLC, 500 East Broward Boulevard, Suite 1500, Fort Lauderdale, FL 33394, Attention: Proxy Group. Copies of the Trust’s proxy voting records are also made available online at franklintempleton.com and posted on the U.S. Securities and Exchange Commission’s website at sec.gov and reflect the most recent 12-month period ended June 30.
Quarterly Statement of Investments
The Trust files a complete statement of investments with the U.S. Securities and Exchange Commission for the first and third quarters for each fiscal year on Form N-Q. Shareholders may view the filed Form N-Q by visiting the Commission’s website at sec.gov. The filed form may also be viewed and copied at the Commission’s Public Reference Room in Washington, DC. Information regarding the operations of the Public Reference Room may be obtained by calling (800) SEC-0330.
40 | Semiannual Report

| | Sign up for electronic delivery
on franklintempleton. com |
Semiannual Report and Shareholder Letter
Templeton
Developing Markets Trust
| | Investment Manager
Templeton Asset Management Ltd.
Principal Underwriter
Franklin Templeton Distributors, Inc.
(800) DIAL BEN®
franklintempleton. com
Shareholder Services
(800) 632-2301 |
Authorized for distribution only when accompanied or preceded by a summary prospectus and/or prospectus. Investors should carefully consider a fund’s investment goals, risks, charges and expenses before investing. Like any investment in securities, the value of the Fund’s portfolio will be subject to the risk of loss from market, currency, economic, political and other factors. The Fund and its investors are not protected from such losses by the investment manager. Therefore, investors who cannot accept this risk s hould not invest in shares of the Fund. A prospectus contains this and other information; please read it carefully before investing.
To ensure the highest quality of service, telephone calls to or from our service departments may be monitored, recorded and accessed. These calls can be identified by the presence of a regular beeping tone.
Item 2. Code of Ethics.
(a) The Registrant has adopted a code of ethics that applies to its principal executive officers and principal financial and accounting officer.
(c) N/A
(d) N/A
(f) Pursuant to Item 12(a)(1), the Registrant is attaching as an exhibit a copy of its code of ethics that applies to its principal executive officers and principal financial and accounting officer.
Item 3. Audit Committee Financial Expert.
(a)(1) The Registrant has an audit committee financial expert serving on its audit committee.
(2) The audit committee financial expert is David W. Niemiec and he is "independent" as defined under the relevant Securities and Exchange Commission Rules and Releases.
Item 4. Principal Accountant Fees and Services. N/A
Item 5. Audit Committee of Listed Registrants. N/A
Item 6. Schedule of Investments. N/A
Item 7. Disclosure of Proxy Voting Policies and Procedures for
Closed-End Management Investment Companies. N/A
Item 8. Portfolio Managers of Closed-End Management Investment Companies. N/A
Item 9. Purchases of Equity Securities by Closed-End Management Investment Company and Affiliated Purchasers. N/A
Item 10. Submission of Matters to a Vote of Security Holders.
There have been no changes to the procedures by which shareholders may recommend nominees to the Registrant's Board of Trustees that would require disclosure herein.
Item 11. Controls and Procedures.
(a) Evaluation of Disclosure Controls and Procedures. The Registrant maintains disclosure controls and procedures that are designed to ensure that information required to be disclosed in the Registrant’s filings under the Securities Exchange Act of 1934 and the Investment Company Act of 1940 is recorded, processed, summarized and reported within the periods specified in the rules and forms of the Securities and Exchange Commission. Such information is accumulated and communicated to the Registrant’s management, including its principal executive officer and principal financial officer, as appropriate, to allow timely decisions regarding required disclosure. The Registrant’s management, including the principal executive officer and the principal financial officer, recognizes that any set of controls and procedures, no matter how well designed and operated, can provide only reasonable assurance of achieving the desired control objectives.
Within 90 days prior to the filing date of this Shareholder Report on Form N-CSR, the Registrant had carried out an evaluation, under the supervision and with the participation of the Registrant’s management, including the Registrant’s principal executive officer and the Registrant’s principal financial officer, of the effectiveness of the design and operation of the Registrant’s disclosure controls and procedures. Based on such evaluation, the Registrant’s principal executive officer and principal financial officer concluded that the Registrant’s disclosure controls and procedures are effective.
(b) Changes in Internal Controls. There have been no significant changes in the Registrant’s internal controls or in other factors that could significantly affect the internal controls subsequent to the date of their evaluation in connection with the preparation of this Shareholder Report on Form N-CSR.
Item 12. Exhibits.
(a)(1) Code of Ethics
(a)(2) Certifications pursuant to Section 302 of the Sarbanes-Oxley Act of 2002 of Laura F. Fergerson, Chief Executive Officer - Finance and Administration, and Mark H. Otani, Chief Financial Officer and Chief Accounting Officer
(b) Certifications pursuant to Section 906 of the Sarbanes-Oxley Act of 2002 of Laura F. Fergerson, Chief Executive Officer - Finance and Administration, and Mark H. Otani, Chief Financial Officer and Chief Accounting Officer
SIGNATURES
Pursuant to the requirements of the Securities Exchange Act of 1934 and the Investment Company Act of 1940, the registrant has duly caused this report to be signed on its behalf by the undersigned, thereunto duly authorized.
TEMPLETON DEVELOPING MARKETS TRUST
By /s/ LAURA F. FERGERSON
Laura F. Fergerson
Chief Executive Officer –
Finance and Administration
Date August 26, 2010
Pursuant to the requirements of the Securities Exchange Act of 1934 and the Investment Company Act of 1940, this report has been signed below by the following persons on behalf of the registrant and in the capacities and on the dates indicated.
By /s/ LAURA F. FERGERSON
Laura F. Fergerson
Chief Executive Officer –
Finance and Administration
Date August 26, 2010
By /s/ MARK H. OTANI
Mark H. Otani
Chief Financial Officer and
Chief Accounting Officer
Date August 26, 2010