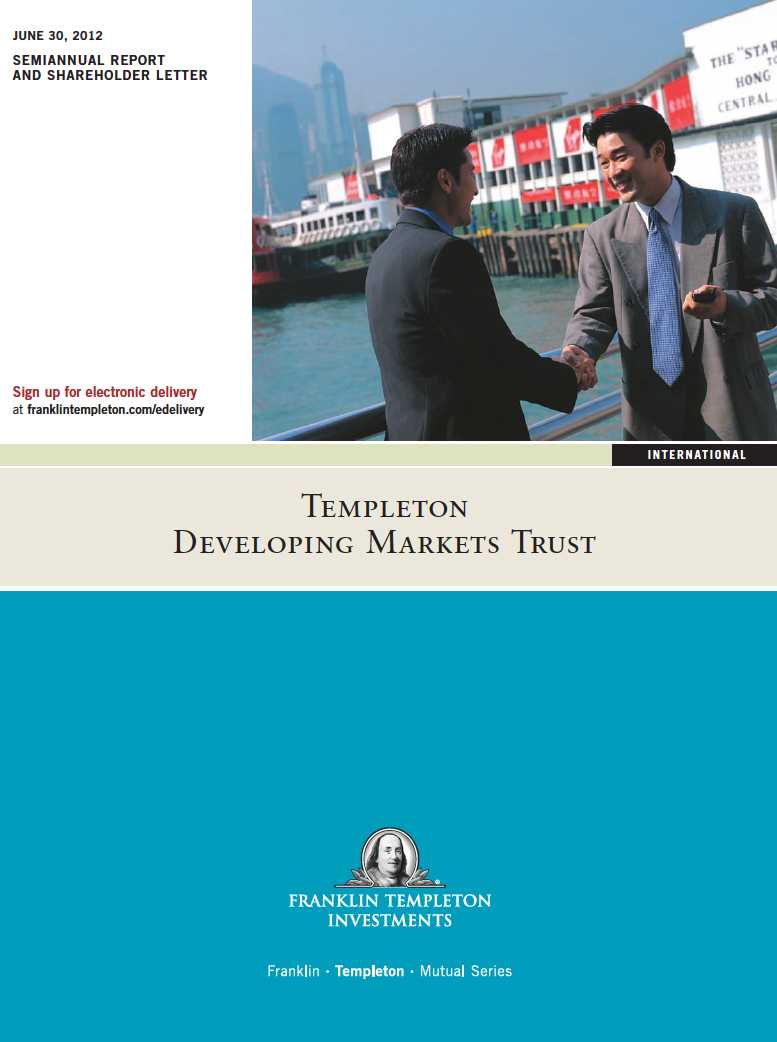

Semiannual Report
Templeton Developing Markets Trust
Your Fund’s Goal and Main Investments: Templeton Developing Markets Trust seeks
long-term capital appreciation. Under normal market conditions, the Fund invests at least 80% of its
net assets in securities of companies located or operating in “developing market countries,” as defined
in the Fund’s prospectus.

This semiannual report for Templeton Developing Markets Trust covers the
period ended June 30, 2012.
Economic and Market Overview
Emerging market economies generally continued to grow faster than developed
market economies during the six months under review. Emerging market stocks
had a solid start to 2012 as improved economic data, government and central
bank efforts to stimulate growth and substantial investment inflows drove mar-
ket performance. The European Union’s approval of a second bailout package
for Greece and the European Central Bank’s additional issuance of low interest
loans to the region’s banks worth more than 529 billion euros (approximately
US$700 billion) to ease the credit crunch and contain the debt crisis provided
investors with additional reasons to remain positive.
The tide changed in April, however, as it became evident the eurozone sovereign
debt crisis was far from contained. Record-high unemployment in the region,
speculation on Greece’s exit from the European Union and concerns about
Spanish banks’ solvency worsened. Weaker-than-expected U.S. economic data
raised fears of another recession in the world’s largest economy. Major emerging
economies including China and India reported slowing gross domestic product
growth. News that the Chinese government had no plans to implement a wide-
scale stimulus package also weighed on investor confidence.
Global stock prices rebounded in the first three weeks of June as optimism
on the victory of the pro-bailout New Democracy party in Greece and
expectations of a third quantitative easing (QE3) program from the U.S.
Federal Reserve Board (Fed) fueled stock market performance. However,
sentiment turned sour as investors focused on Spain’s banking crisis and the
The dollar value, number of shares or principal amount, and names of all portfolio holdings are listed in the Fund’s
Statement of Investments (SOI). The SOI begins on page 17.
Semiannual Report | 3


Fed’s decision to extend the maturity extension program, dubbed Operation Twist, rather than to implement QE3.
Financial markets received good news on the last trading day of June when European leaders agreed to directly recapitalize the region’s struggling banks and work toward budgetary and political union. Global stocks rallied, leading emerging market stocks, as measured by the MSCI Emerging Markets (EM) Index, to post a +4.12% total return in U.S. dollar terms for the six-month period.1
Investment Strategy
We employ a fundamental research, value-oriented, long-term investment approach. We focus on the market price of a company’s securities relative to our evaluation of its long-term earnings, asset value and cash flow potential. We also consider a company’s profit and loss outlook, balance sheet strength, cash flow trends and asset value in relation to the current price. Our analysis considers the company’s corporate governance behavior as well as its position in its sector, the economic framework and political environment. We invest in securities without regard to benchmark comparisons.
Performance Overview
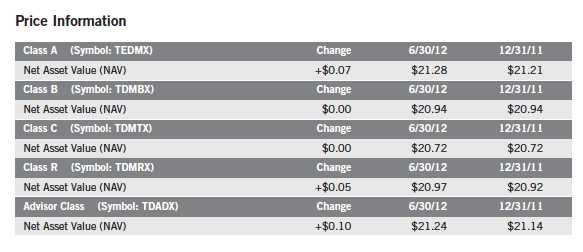
Templeton Developing Markets Trust – Class A had a +0.33% cumulative total return for the six months ended June 30, 2012. In comparison, the MSCI EM Index and the Standard & Poor’s®/International Finance Corporation Investable Composite Index, which track global emerging market stock performance, had total returns of +4.12% and +4.48% for the same period.1, 2 Please note index performance is provided for reference and we do not attempt to track any index but rather undertake investments on the basis of fundamental research. In addition, the Fund’s return reflects the effect of fees and expenses for professional management, while an index does not have such costs. You can find the Fund’s long-term performance data in the Performance Summary beginning on page 7.
1. Source: © 2012 Morningstar. All rights reserved. The information contained herein: (1) is proprietary to Morningstar and/or its content providers; (2) may not be copied or distributed; and (3) is not warranted to be accurate, complete or timely. Neither Morningstar nor its content providers are responsible for any damages or losses arising from any use of this information. The indexes are unmanaged and include reinvested dividends. One cannot invest directly in an index, and an index is not representative of the Fund’s portfolio.
2. STANDARD & POOR’S®, S&P® and S&P 500® are registered trademarks of Standard & Poor’s Financial Services LLC.
4 | Semiannual Report
Manager’s Discussion
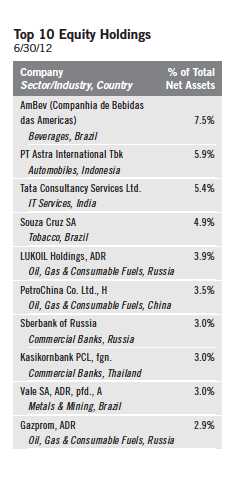
During the six months under review, key contributors to the Fund’s absolute performance were Souza Cruz, a major Brazilian cigarette company; Brazil-based AmBev (Companhia de Bebidas das Americas), one of the world’s largest beer and soft drink producers; and Kasikornbank, one of Thailand’s leading commercial banks. The strong market positions of Souza Cruz and AmBev have allowed their businesses to achieve superior returns and build market share as consumers become wealthier and more discerning. In our view, the companies’ strong operations, low debt levels, good dividend yields and popular brands made them attractive investments. We believe Kasikornbank is well positioned to benefit from Thailand’s potentially strong economic growth as the country recovers from last year’s floods and the government’s fiscal stimulus measures, including minimum wage increases, work through the economy. The bank enjoyed strong earnings in the second half of 2012 as it benefited from strong loan growth.
In contrast, key detractors from absolute performance during the reporting period included Itau Unibanco Holding, one of Brazil’s largest financial conglomerates; Luk Fook Holdings (International), a major jewelry retail chain in Hong Kong and mainland China; and Astra International, Indonesia’s leading car and motorcycle company. Itau Unibanco’s share price weakened as ongoing central bank interest rate cuts threatened to hurt the bank’s profit margins. In our long-term view, the bank could benefit from its strong market position as Brazil’s economy grows and consumer wealth increases. Luk Fook’s sales growth eased recently as China’s slowing economic growth led Chinese tourists to cut spending on luxury items such as jewelry. However, we maintained a positive view of the company due to its solid market position, high return on equity, strong balance sheet and increasing presence in mainland China. Astra’s share price corrected largely due to investor expectations that new rules in Indonesia, which increased the minimum down payment required for vehicle purchases, could impact sales. As a leader in the Indonesian car and motorcycle markets, which have been enjoying strong secular growth trends, Astra could benefit from the country’s robust economic growth, higher incomes and affordable credit in the long term.
It is important to recognize the effect of currency movements on the Fund’s performance. In general, if the value of the U.S. dollar goes up compared with a foreign currency, an investment traded in that foreign currency will go down in value because it will be worth fewer U.S. dollars. This can have a negative effect on Fund performance. Conversely, when the U.S. dollar weakens in relation to a foreign currency, an investment traded in that foreign currency will increase in value, which can contribute to Fund performance. For the six months ended
Semiannual Report | 5
June 30, 2012, the U.S. dollar rose in value relative to many currencies in which the Fund’s investments were traded. As a result, the Fund’s performance was negatively affected by the portfolio’s investment predominantly in securities with non-U.S. currency exposure.
In the past six months, we initiated positions in Colombia and Kenya and increased our holdings in Hong Kong, South Africa and South Korea as we continued to search for what we considered to be attractive investment opportunities. We added to casinos and gaming, catalog retail and specialty retail companies. Key purchases included additional shares of SJM Holdings, one of Macau’s largest casino operators, and the aforementioned Luk Fook, as well as a new position in South Korea-based Samsung Electronics, one of the world’s largest electronics manufacturers.
As certain stocks reached our sale targets, we reduced the Fund’s investments in Brazil, Indonesia, India and Mexico to focus on stocks we considered to be more attractively valued within our investment universe. We reduced the Fund’s holdings largely in diversified metals and mining, diversified banking and integrated telecommunication services companies. Key reductions included Brazilian iron ore and nickel producer Vale, Indonesia-based Bank Central Asia and Mexico-based telecommunication services provider America Movil.
We thank you for your continued participation in Templeton Developing Markets Trust and look forward to serving your future investment needs.
Sincerely,


Mark Mobius
Executive Chairman
Templeton Emerging Markets Group
The foregoing information reflects our analysis, opinions and portfolio holdings as of June 30, 2012, the end of the reporting period. The way we implement our main investment strategies and the resulting portfolio holdings may change depending on factors such as market and economic conditions. These opinions may not be relied upon as investment advice or an offer for a particular security. The information is not a complete analysis of every aspect of any market, country, industry, security or the Fund. Statements of fact are from sources considered reliable, but the investment manager makes no representation or warranty as to their completeness or accuracy. Although historical performance is no guarantee of future results, these insights may help you understand our investment management philosophy.
6 | Semiannual Report
Performance Summary as of 6/30/12
Your dividend income will vary depending on dividends or interest paid by securities in the Fund’s portfolio, adjusted for operating expenses of each class. Capital gain distributions are net profits realized from the sale of portfolio securities. The performance table does not reflect any taxes that a shareholder would pay on Fund dividends, capital gain distributions, if any, or any realized gains on the sale of Fund shares. Total return reflects reinvestment of the Fund’s dividends and capital gain distributions, if any, and any unrealized gains or losses.
Semiannual Report | 7
Performance Summary (continued)
Performance
Cumulative total return excludes sales charges. Average annual total return and value of $10,000 investment include
maximum sales charges. Class A: 5.75% maximum initial sales charge; Class B: contingent deferred sales charge
(CDSC) declining from 4% to 1% over six years, and eliminated thereafter; Class C: 1% CDSC in first year only;
Class R/Advisor Class: no sales charges.
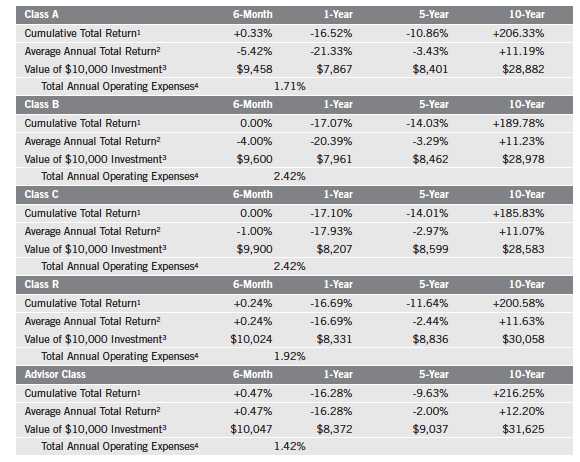
Performance data represent past performance, which does not guarantee future results. Investment return and principal
value will fluctuate, and you may have a gain or loss when you sell your shares. Current performance may differ from
figures shown. For most recent month-end performance, go to franklintempleton.com or call (800) 342-5236.
8 | Semiannual Report
Performance Summary (continued)
Endnotes
All investments involve risks, including possible loss of principal. Special risks are associated with foreign investing, including currency fluctu-
ations, economic instability and political developments. Investments in developing markets involve heightened risks related to the same factors,
in addition to those associated with these markets’ smaller size and lesser liquidity. The Fund is designed for the aggressive portion of a well-
diversified portfolio. The Fund is actively managed but there is no guarantee that the manager’s investment decisions will produce the desired
results. The Fund’s prospectus also includes a description of the main investment risks.
1. Cumulative total return represents the change in value of an investment over the periods indicated.
2. Average annual total return represents the average annual change in value of an investment over the periods indicated. Six-month return has not
been annualized.
3. These figures represent the value of a hypothetical $10,000 investment in the Fund over the periods indicated.
4. Figures are as stated in the Fund’s prospectus current as of the date of this report. In periods of market volatility, assets may decline significantly,
causing total annual Fund operating expenses to become higher than the figures shown.
Semiannual Report | 9
Your Fund’s Expenses
As a Fund shareholder, you can incur two types of costs:
- Transaction costs, including sales charges (loads) on Fund purchases; and
- Ongoing Fund costs, including management fees, distribution and service (12b-1) fees, and other Fund expenses. All mutual funds have ongoing costs, sometimes referred to as operating expenses.
The following table shows ongoing costs of investing in the Fund and can help you understand these costs and compare them with those of other mutual funds. The table assumes a $1,000 investment held for the six months indicated.
Actual Fund Expenses
The first line (Actual) for each share class listed in the table provides actual account values and expenses. The “Ending Account Value” is derived from the Fund’s actual return, which includes the effect of Fund expenses.
You can estimate the expenses you paid during the period by following these steps. Of course, your account value and expenses will differ from those in this illustration:
| 1. | Divide your account value by $1,000. |
| | If an account had an $8,600 value, then $8,600 ÷ $1,000 = 8.6. |
| 2. | Multiply the result by the number under the heading “Expenses Paid During Period.” |
| | If Expenses Paid During Period were $7.50, then 8.6 x $7.50 = $64.50. |
In this illustration, the estimated expenses paid this period are $64.50.
Hypothetical Example for Comparison with Other Funds
Information in the second line (Hypothetical) for each class in the table can help you compare ongoing costs of investing in the Fund with those of other mutual funds. This information may not be used to estimate the actual ending account balance or expenses you paid during the period. The hypothetical “Ending Account Value” is based on the actual expense ratio for each class and an assumed 5% annual rate of return before expenses, which does not represent the Fund’s actual return. The figure under the heading “Expenses Paid During Period” shows the hypothetical expenses your account would have incurred under this scenario. You can compare this figure with the 5% hypothetical examples that appear in shareholder reports of other funds.
10 | Semiannual Report
Your Fund’s Expenses (continued)
Please note that expenses shown in the table are meant to highlight ongoing costs and do not reflect any transaction costs, such as sales charges. Therefore, the second line for each class is useful in comparing ongoing costs only, and will not help you compare total costs of owning different funds. In addition, if transaction costs were included, your total costs would have been higher. Please refer to the Fund prospectus for additional information on operating expenses.

*Expenses are calculated using the most recent six-month expense ratio, annualized for each class (A: 1.73%; B: 2.44%; C: 2.45%; R: 1.95%; and Advisor: 1.45%), multiplied by the average account value over the period, multiplied by 182/366 to reflect the one-half year period.
Semiannual Report | 11
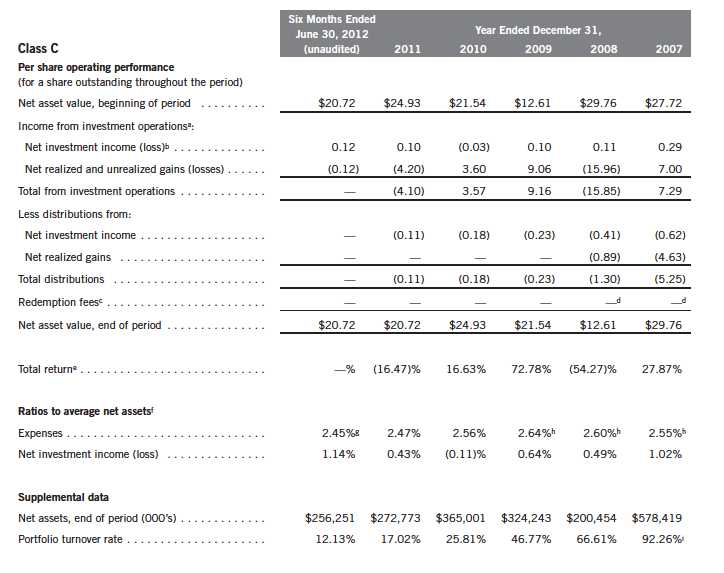
Templeton Developing Markets Trust
Financial Highlights
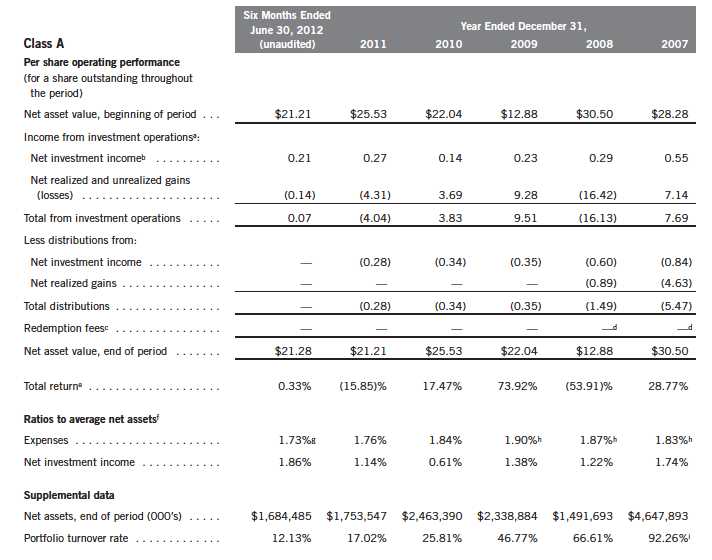
aThe amount shown for a share outstanding throughout the period may not correlate with the Statement of Operations for the period due to the timing of sales and repurchases of
the Fund shares in relation to income earned and/or fluctuating market value of the investments of the Fund.
bBased on average daily shares outstanding.
cEffective September 1, 2008, the redemption fee was eliminated.
dAmount rounds to less than $0.01 per share.
eTotal return does not reflect sales commissions or contingent deferred sales charges, if applicable, and is not annualized for periods less than one year.
fRatios are annualized for periods less than one year.
gBenefit of expense reimbursement rounds to less than 0.01%.
hBenefit of expense reduction rounds to less than 0.01%.
iExcludes the value of portfolio securities delivered as a result of a redemption in-kind.
12 | The accompanying notes are an integral part of these financial statements. | Semiannual Report
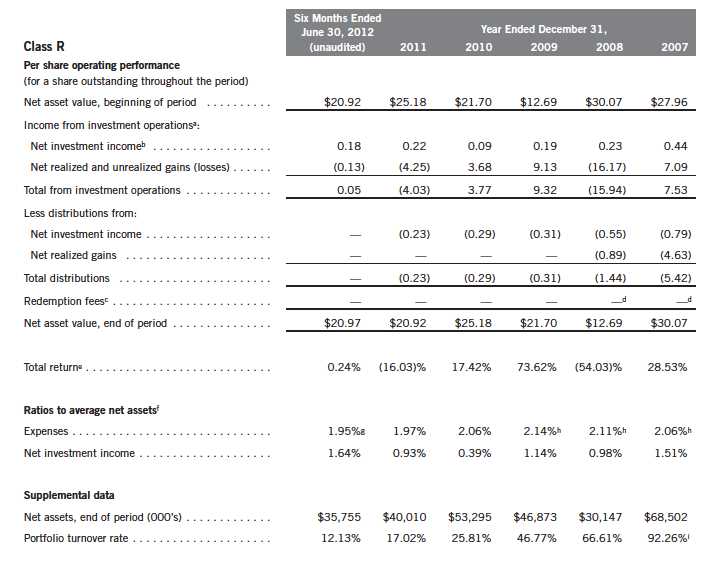
Templeton Developing Markets Trust
Financial Highlights (continued)
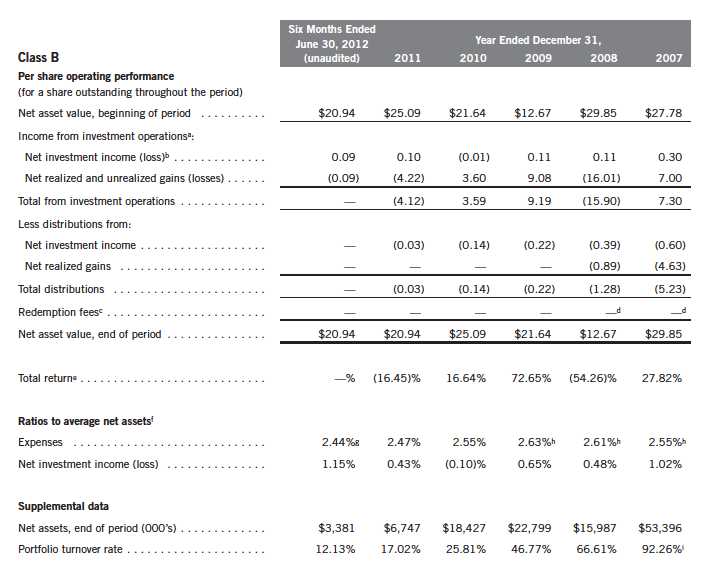
aThe amount shown for a share outstanding throughout the period may not correlate with the Statement of Operations for the period due to the timing of sales and repurchases of
the Fund shares in relation to income earned and/or fluctuating market value of the investments of the Fund.
bBased on average daily shares outstanding.
cEffective September 1, 2008, the redemption fee was eliminated.
dAmount rounds to less than $0.01 per share.
eTotal return does not reflect sales commissions or contingent deferred sales charges, if applicable, and is not annualized for periods less than one year.
fRatios are annualized for periods less than one year.
gBenefit of expense reimbursement rounds to less than 0.01%.
hBenefit of expense reduction rounds to less than 0.01%.
iExcludes the value of portfolio securities delivered as a result of a redemption in-kind.
Semiannual Report | The accompanying notes are an integral part of these financial statements. | 13
Templeton Developing Markets Trust
Financial Highlights (continued)
aThe amount shown for a share outstanding throughout the period may not correlate with the Statement of Operations for the period due to the timing of sales and repurchases of
the Fund shares in relation to income earned and/or fluctuating market value of the investments of the Fund.
bBased on average daily shares outstanding.
cEffective September 1, 2008, the redemption fee was eliminated.
dAmount rounds to less than $0.01 per share.
eTotal return does not reflect sales commissions or contingent deferred sales charges, if applicable, and is not annualized for periods less than one year.
fRatios are annualized for periods less than one year.
gBenefit of expense reimbursement rounds to less than 0.01%.
hBenefit of expense reduction rounds to less than 0.01%.
iExcludes the value of portfolio securities delivered as a result of a redemption in-kind.
14 | The accompanying notes are an integral part of these financial statements. | Semiannual Report
Templeton Developing Markets Trust
Financial Highlights (continued)
aThe amount shown for a share outstanding throughout the period may not correlate with the Statement of Operations for the period due to the timing of sales and repurchases of
the Fund shares in relation to income earned and/or fluctuating market value of the investments of the Fund.
bBased on average daily shares outstanding.
cEffective September 1, 2008, the redemption fee was eliminated.
dAmount rounds to less than $0.01 per share.
eTotal return does not reflect sales commissions or contingent deferred sales charges, if applicable, and is not annualized for periods less than one year.
fRatios are annualized for periods less than one year.
gBenefit of expense reimbursement rounds to less than 0.01%.
hBenefit of expense reduction rounds to less than 0.01%.
iExcludes the value of portfolio securities delivered as a result of a redemption in-kind.
Semiannual Report | The accompanying notes are an integral part of these financial statements. | 15
Templeton Developing Markets Trust
Financial Highlights (continued)
aThe amount shown for a share outstanding throughout the period may not correlate with the Statement of Operations for the period due to the timing of sales and repurchases of
the Fund shares in relation to income earned and/or fluctuating market value of the investments of the Fund.
bBased on average daily shares outstanding.
cEffective September 1, 2008, the redemption fee was eliminated.
dAmount rounds to less than $0.01 per share.
eTotal return is not annualized for periods less than one year.
fRatios are annualized for periods less than one year.
gBenefit of expense reimbursement rounds to less than 0.01%.
hBenefit of expense reduction rounds to less than 0.01%.
iExcludes the value of portfolio securities delivered as a result of a redemption in-kind.
16 | The accompanying notes are an integral part of these financial statements. | Semiannual Report
Templeton Developing Markets Trust
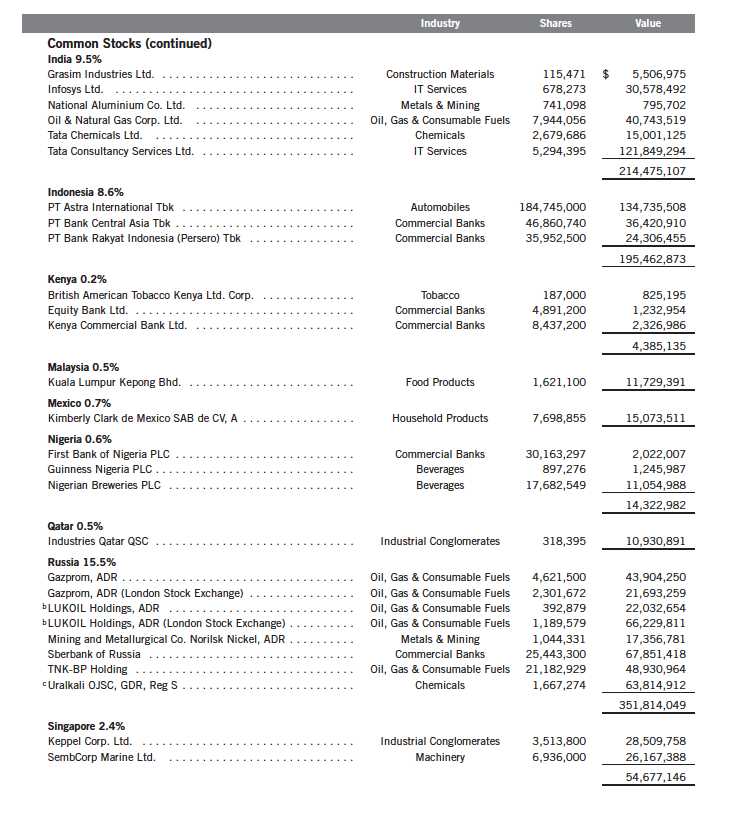
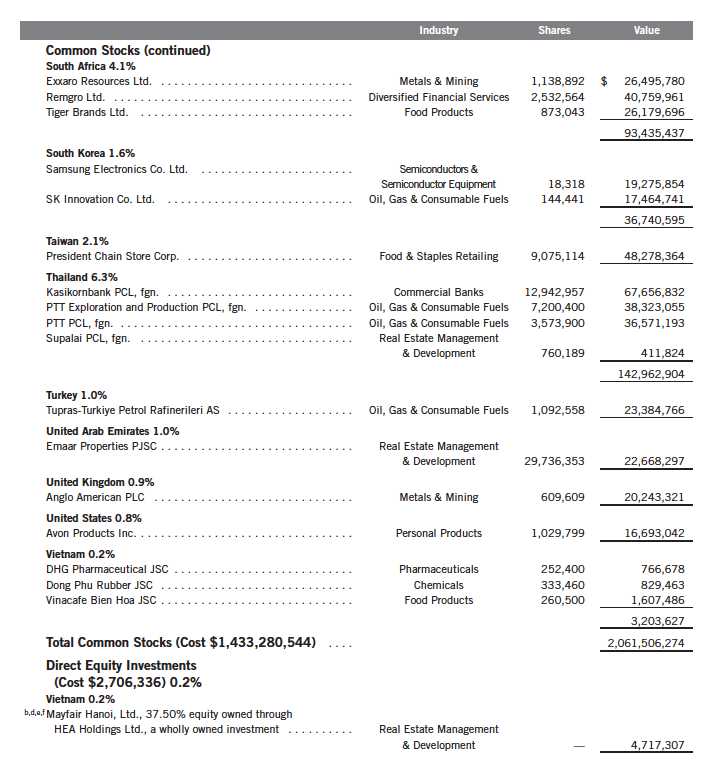
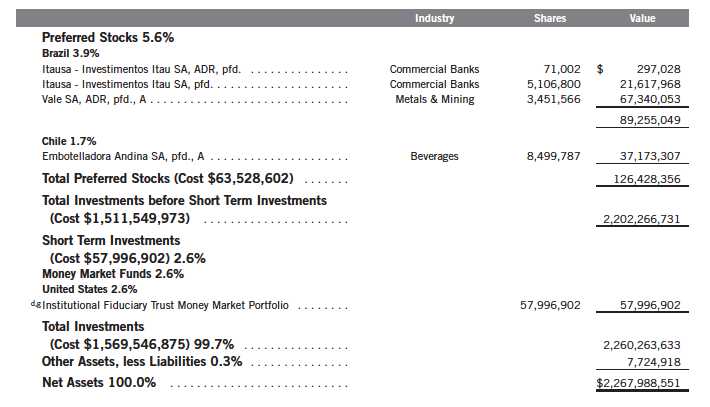
Statement of Investments, June 30, 2012 (unaudited)
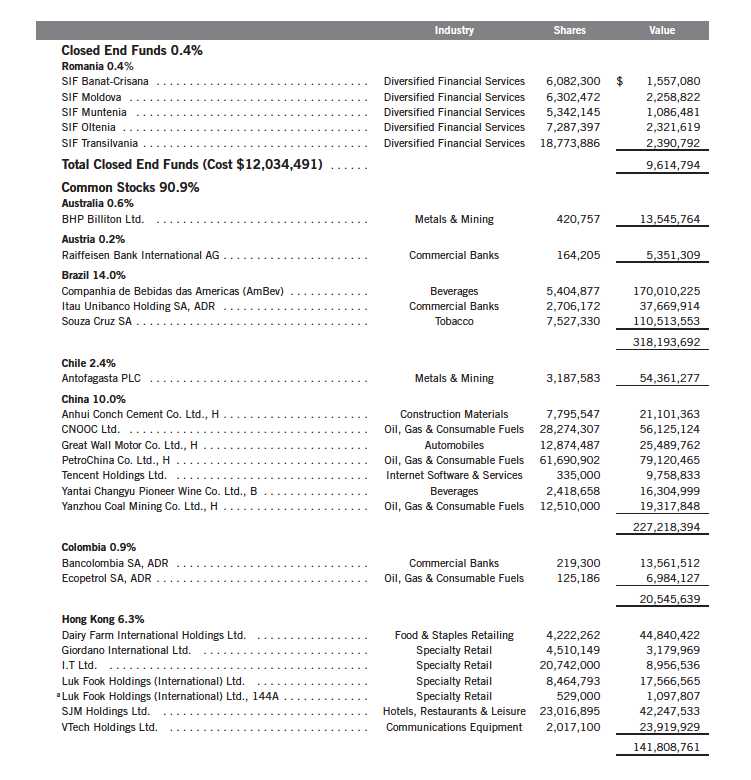
Semiannual Report | 17
Templeton Developing Markets Trust
Statement of Investments, June 30, 2012 (unaudited) (continued)
18 | Semiannual Report
Templeton Developing Markets Trust
Statement of Investments, June 30, 2012 (unaudited) (continued)
Semiannual Report | 19
Templeton Developing Markets Trust
Statement of Investments, June 30, 2012 (unaudited) (continued)
See Abbreviations on page 35.
aSecurity was purchased pursuant to Rule 144A under the Securities Act of 1933 and may be sold in transactions exempt from registration only to qualified institutional buyers or in
a public offering registered under the Securities Act of 1933. This security has been deemed liquid under guidelines approved by the Fund’s Board of Trustees. At June 30, 2012, the
value of this security was $1,097,807, representing 0.05% of net assets.
bAt June 30, 2012, pursuant to the Fund’s policies and the requirements of applicable securities law, the Fund may be restricted from trading these securities for a limited or
extended period of time due to ownership limits and/or potential possession of material non-public information.
cSecurity was purchased pursuant to Regulation S under the Securities Act of 1933, which exempts from registration securities offered and sold outside of the United States.
Such a security cannot be sold in the United States without either an effective registration statement filed pursuant to the Securities Act of 1933, or pursuant to an exemption
from registration. This security has been deemed liquid under guidelines approved by the Fund’s Board of Trustees. At June 30, 2012, the value of this security was $63,814,912,
representing 2.81%of net assets.
dNon-income producing.
eSee Note 9 regarding restricted securities.
fSee Note 10 regarding holdings of 5% voting securities.
gSee Note 7 regarding investments in the Institutional Fiduciary Trust Money Market Portfolio.
20 | The accompanying notes are an integral part of these financial statements. | Semiannual Report
Templeton Developing Markets Trust
Financial Statements
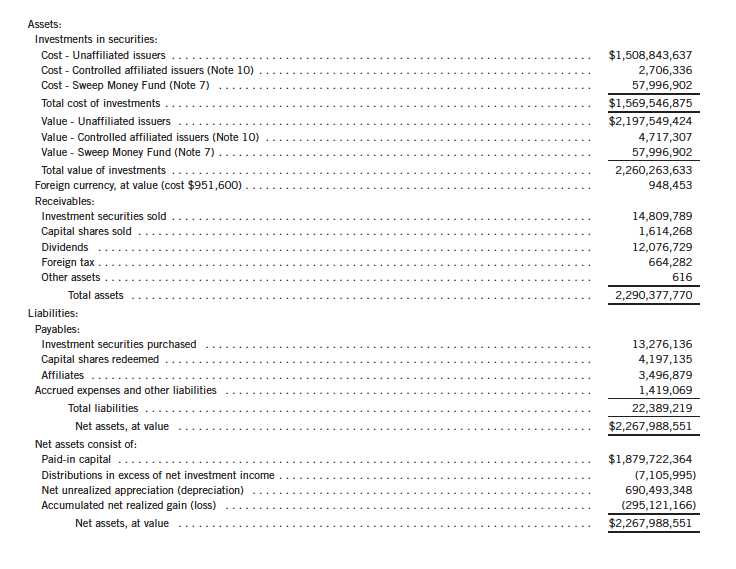
Statement of Assets and Liabilities
June 30, 2012 (unaudited)
Semiannual Report | The accompanying notes are an integral part of these financial statements. | 21
Templeton Developing Markets Trust
Financial Statements (continued)
Statement of Assets and Liabilities (continued)
June 30, 2012 (unaudited)

22 | The accompanying notes are an integral part of these financial statements. | Semiannual Report
Templeton Developing Markets Trust
Financial Statements (continued)
Statement of Operations
for the six months ended June 30, 2012 (unaudited)
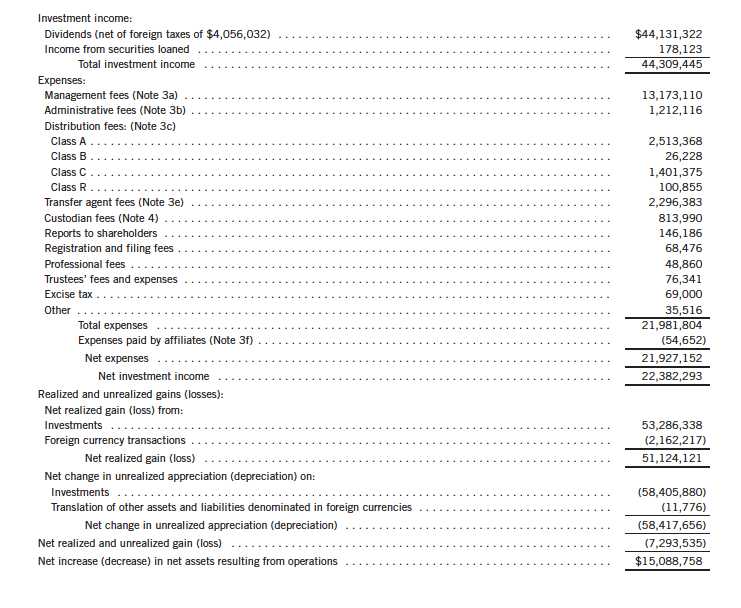
Semiannual Report | The accompanying notes are an integral part of these financial statements. | 23
Templeton Developing Markets Trust
Financial Statements (continued)

24 | The accompanying notes are an integral part of these financial statements. | Semiannual Report
Templeton Developing Markets Trust
Notes to Financial Statements (unaudited)
1. ORGANIZATION AND SIGNIFICANT ACCOUNTING POLICIES
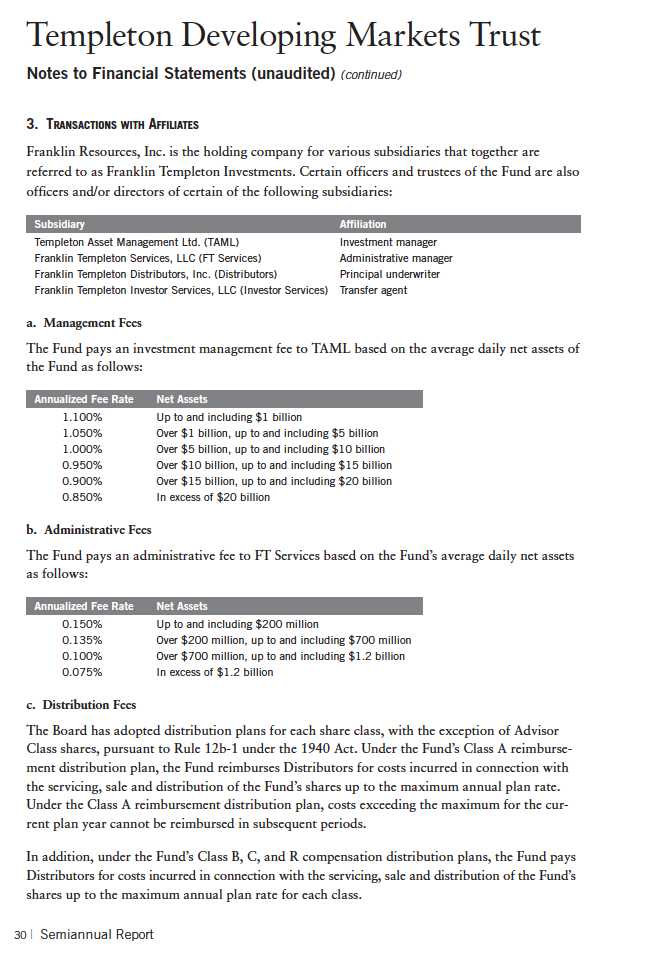
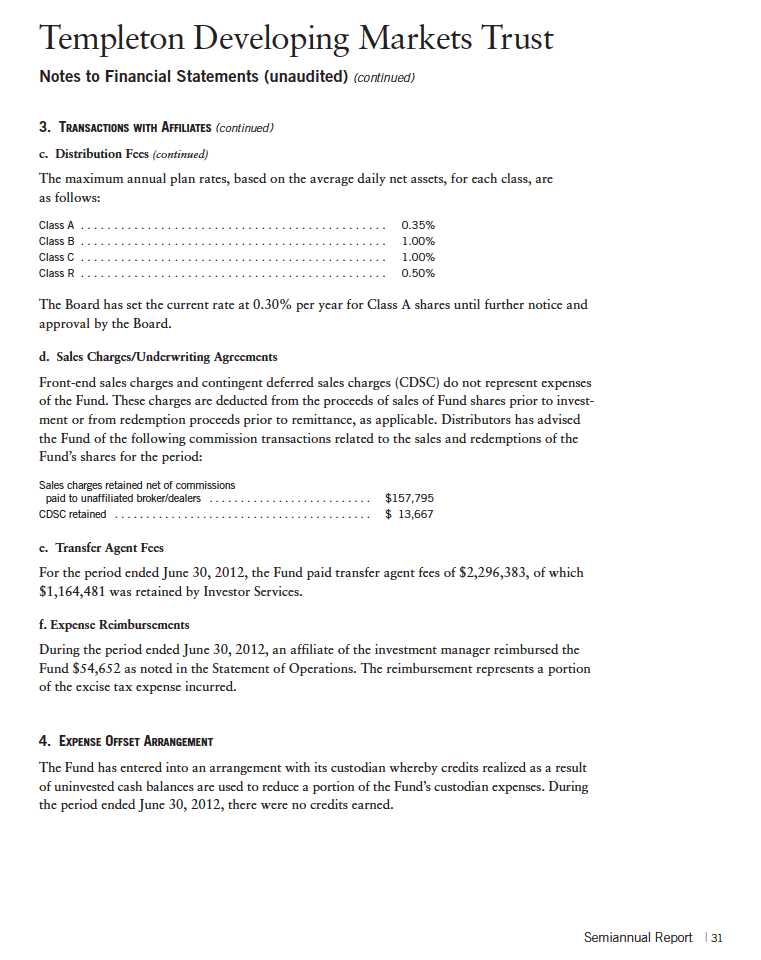
Templeton Developing Markets Trust (Fund) is registered under the Investment Company Act of 1940, as amended, (1940 Act) as an open-end investment company. The Fund offers five classes of shares: Class A, Class B, Class C, Class R, and Advisor Class. Each class of shares differs by its initial sales load, contingent deferred sales charges, distribution fees, voting rights on matters affecting a single class and its exchange privilege.
The following summarizes the Fund’s significant accounting policies.
a. Financial Instrument Valuation
The Fund’s investments in financial instruments are carried at fair value daily. Fair value is the price that would be received to sell an asset or paid to transfer a liability in an orderly transaction between market participants on the measurement date. Under procedures approved by the Fund’s Board of Trustees (the Board), the Fund’s administrator, investment manager and other affiliates have formed the Valuation and Liquidity Oversight Committee (VLOC). The VLOC provides administration and oversight of the Fund’s valuation policies and procedures, which are approved annually by the Board. Among other things, these procedures allow the Fund to utilize independent pricing services, quotations from securities and financial instrument dealers, and other market sources to determine fair value.
Equity securities and exchange traded funds listed on an exchange or on the NASDAQ National Market System are valued at the last quoted sale price or the official closing price of the day, respectively. Foreign equity securities are valued as of the close of trading on the foreign stock exchange on which the security is primarily traded, or the NYSE, whichever is earlier. The value is then converted into its U.S. dollar equivalent at the foreign exchange rate in effect at the close of the NYSE on the day that the value of the security is determined. Over-the-counter (OTC) securities are valued within the range of the most recent quoted bid and ask prices. Securities that trade in multiple markets or on multiple exchanges are valued according to the broadest and most representative market. Certain equity securities are valued based upon fundamental characteristics or relationships to similar securities. Investments in open-end mutual funds are valued at the closing net asset value.
The Fund has procedures to determine the fair value of financial instruments for which market prices are not reliable or readily available. Under these procedures, the VLOC convenes on a regular basis to review such financial instruments and considers a number of factors, including significant unobservable valuation inputs, when arriving at fair value. The VLOC primarily employs a market-based approach which may use related or comparable assets or liabilities, recent transactions, market multiples, book values, and other relevant information for the investment to determine the fair value of the investment. An income-based valuation approach may also be used in which the anticipated future cash flows of the investment are discounted to calculate fair value. Discounts may also be applied due to the nature or duration of any restrictions on the disposition of the investments. Due to the inherent uncertainty of valuations of such investments, the fair values may differ significantly from the values that would have been used had an active
Semiannual Report | 25
Templeton Developing Markets Trust
Notes to Financial Statements (unaudited) (continued)
| 1. | ORGANIZATION AND SIGNIFICANT ACCOUNTING POLICIES (continued) |
| a. | Financial Instrument Valuation (continued) |
market existed. The VLOC employs various methods for calibrating these valuation approaches including a regular review of key inputs and assumptions, transactional back-testing or disposition analysis, and reviews of any related market activity.
Trading in securities on foreign securities stock exchanges and OTC markets may be completed before the daily close of business on the NYSE. Occasionally, events occur between the time at which trading in a foreign security is completed and the close of the NYSE that might call into question the reliability of the value of a portfolio security held by the Fund. As a result, differences may arise between the value of the Fund’s portfolio securities as determined at the foreign market close and the latest indications of value at the close of the NYSE. In order to minimize the potential for these differences, the VLOC monitors price movements following the close of trading in foreign stock markets through a series of country specific market proxies (such as baskets of American Depositary Receipts, futures contracts and exchange traded funds). These price movements are measured against established trigger thresholds for each specific market proxy to assist in determining if an event has occurred that may call into question the reliability of the values of the foreign securities held by the Fund. If such an event occurs, the securities may be valued using fair value procedures, which may include the use of independent pricing services.
b. Foreign Currency Translation
Portfolio securities and other assets and liabilities denominated in foreign currencies are translated into U.S. dollars based on the exchange rate of such currencies against U.S. dollars on the date of valuation. The Fund may enter into foreign currency exchange contracts to facilitate transactions denominated in a foreign currency. Purchases and sales of securities, income and expense items denominated in foreign currencies are translated into U.S. dollars at the exchange rate in effect on the transaction date. Portfolio securities and assets and liabilities denominated in foreign currencies contain risks that those currencies will decline in value relative to the U.S. dollar. Occasionally, events may impact the availability or reliability of foreign exchange rates used to convert the U.S. dollar equivalent value. If such an event occurs, the foreign exchange rate will be valued at fair value using procedures established and approved by the Board.
The Fund does not separately report the effect of changes in foreign exchange rates from changes in market prices on securities held. Such changes are included in net realized and unrealized gain or loss from investments on the Statement of Operations.
Realized foreign exchange gains or losses arise from sales of foreign currencies, currency gains or losses realized between the trade and settlement dates on securities transactions and the difference between the recorded amounts of dividends, interest, and foreign withholding taxes and the U.S. dollar equivalent of the amounts actually received or paid. Net unrealized foreign exchange gains and losses arise from changes in foreign exchange rates on foreign denominated assets and liabilities other than investments in securities held at the end of the reporting period.
26 | Semiannual Report
Templeton Developing Markets Trust
Notes to Financial Statements (unaudited) (continued)
| 1. | ORGANIZATION AND SIGNIFICANT ACCOUNTING POLICIES (continued) |
| c. | Securities Lending |
The Fund participates in an agency based securities lending program. The fund receives cash collateral against the loaned securities in an amount equal to at least 102% of the market value of the loaned securities. Collateral is maintained over the life of the loan in an amount not less than 100% of the market value of loaned securities, as determined at the close of fund business each day; any additional collateral required due to changes in security values is delivered to the fund on the next business day. The collateral is invested in a non-registered money fund. The fund receives income from the investment of cash collateral, in addition to lending fees and rebates paid by the borrower. The fund bears the market risk with respect to the collateral investment, securities loaned, and the risk that the agent may default on its obligations to the fund. The securities lending agent has agreed to indemnify the fund in the event of default by a third party borrower. At June 30, 2012, the Fund had no securities on loan.
d. Income and Deferred Taxes
It is the Fund’s policy to qualify as a regulated investment company under the Internal Revenue Code. The Fund intends to distribute to shareholders substantially all of its taxable income and net realized gains to relieve it from federal income and excise taxes. However, during the period the Fund retained a portion of its taxable income and net realized gains and as a result incurred an excise tax of $69,000 as noted in the Statement of Operations. No further provision for U.S. federal income taxes is required.
The Fund may be subject to foreign taxation related to income received, capital gains on the sale of securities and certain foreign currency transactions in the foreign jurisdictions in which it invests. Foreign taxes, if any, are recorded based on the tax regulations and rates that exist in the foreign markets in which the Fund invests. When a capital gain tax is determined to apply the Fund records an estimated deferred tax liability in an amount that would be payable if the securities were disposed of on the valuation date.
The Fund recognizes the tax benefits of uncertain tax positions only when the position is “more likely than not” to be sustained upon examination by the tax authorities based on the technical merits of the tax position. As of June 30, 2012, and for all open tax years, the Fund has determined that no liability for unrecognized tax benefits is required in the Fund’s financial statements related to uncertain tax positions taken on a tax return (or expected to be taken on future tax returns). Open tax years are those that remain subject to examination and are based on each tax jurisdiction statute of limitation.
Semiannual Report | 27
Templeton Developing Markets Trust
Notes to Financial Statements (unaudited) (continued)
| 1. | ORGANIZATION AND SIGNIFICANT ACCOUNTING POLICIES (continued) |
| e. | Security Transactions, Investment Income, Expenses and Distributions |
Security transactions are accounted for on trade date. Realized gains and losses on security transactions are determined on a specific identification basis. Estimated expenses are accrued daily. Dividend income is recorded on the ex-dividend date except that certain dividends from foreign securities are recognized as soon as the Fund is notified of the ex-dividend date. Distributions to shareholders are recorded on the ex-dividend date and are determined according to income tax regulations (tax basis). Distributable earnings determined on a tax basis may differ from earnings recorded in accordance with accounting principles generally accepted in the United States of America. These differences may be permanent or temporary. Permanent differences are reclassified among capital accounts to reflect their tax character. These reclassifications have no impact on net assets or the results of operations. Temporary differences are not reclassified, as they may reverse in subsequent periods.
Realized and unrealized gains and losses and net investment income, not including class specific expenses, are allocated daily to each class of shares based upon the relative proportion of net assets of each class. Differences in per share distributions, by class, are generally due to differences in class specific expenses.
f. Accounting Estimates
The preparation of financial statements in accordance with accounting principles generally accepted in the United States of America requires management to make estimates and assumptions that affect the reported amounts of assets and liabilities at the date of the financial statements and the amounts of income and expenses during the reporting period. Actual results could differ from those estimates.
g. Guarantees and Indemnifications
Under the Fund’s organizational documents, its officers and trustees are indemnified by the Fund against certain liabilities arising out of the performance of their duties to the Fund. Additionally, in the normal course of business, the Fund enters into contracts with service providers that contain general indemnification clauses. The Fund’s maximum exposure under these arrangements is unknown as this would involve future claims that may be made against the Fund that have not yet occurred. Currently, the Fund expects the risk of loss to be remote.
28 | Semiannual Report
Templeton Developing Markets Trust
Notes to Financial Statements (unaudited) (continued)
2. SHARES OF BENEFICIAL INTEREST
At June 30, 2012, there were an unlimited number of shares authorized (without par value).
Transactions in the Fund’s shares were as follows:

Semiannual Report | 29
Templeton Developing Markets Trust
Notes to Financial Statements (unaudited) (continued)
5. INCOME TAXES
For tax purposes, capital losses may be carried over to offset future capital gains, if any. Capital loss carryforwards with no expiration, if any, must be fully utilized before those losses with expiration dates.
At December 31, 2011, the Fund had capital loss carryforwards of $324,047,217 expiring in 2017.
For tax purposes, the Fund may elect to defer any portion of a post-October capital loss to the first day of the following fiscal year. At December 31, 2011, the Fund deferred post-October capital losses of $14,959,865.
At June 30, 2012, the cost of investments and net unrealized appreciation (depreciation) for income tax purposes were as follows:

Differences between income and/or capital gains as determined on a book basis and a tax basis are primarily due to differing treatments of foreign currency transactions, passive foreign investment company shares, and corporate actions.
6. INVESTMENT TRANSACTIONS
Purchases and sales of investments (excluding short term securities) for the period ended June 30, 2012, aggregated $290,347,088 and $332,434,168, respectively.
7. INVESTMENTS IN INSTITUTIONAL FIDUCIARY TRUST MONEY MARKET PORTFOLIO
The Fund invests in the Institutional Fiduciary Trust Money Market Portfolio (Sweep Money Fund), an open-end investment company managed by Franklin Advisers, Inc. (an affiliate of the investment manager). Management fees paid by the Fund are reduced on assets invested in the Sweep Money Fund, in an amount not to exceed the management and administrative fees paid by the Sweep Money Fund.
8. CONCENTRATION OF RISK
Investing in foreign securities may include certain risks and considerations not typically associated with investing in U.S. securities, such as fluctuating currency values and changing local and regional economic, political and social conditions, which may result in greater market volatility. In addition, certain foreign securities may not be as liquid as U.S. securities.
32 | Semiannual Report
Templeton Developing Markets Trust
Notes to Financial Statements (unaudited) (continued)
9. RESTRICTED SECURITIES
The Fund invests in securities that are restricted under the Securities Act of 1933 (1933 Act) or
which are subject to legal, contractual, or other agreed upon restrictions on resale. Restricted
securities are often purchased in private placement transactions, and cannot be sold without
prior registration unless the sale is pursuant to an exemption under the 1933 Act. Disposal of
these securities may require greater effort and expense, and prompt sale at an acceptable price
may be difficult. The Fund may have registration rights for restricted securities. The issuer gen-
erally incurs all registration costs.
At June 30, 2012, the Fund held investments in restricted securities, excluding certain securities
exempt from registration under the 1933 Act deemed to be liquid, as follows:

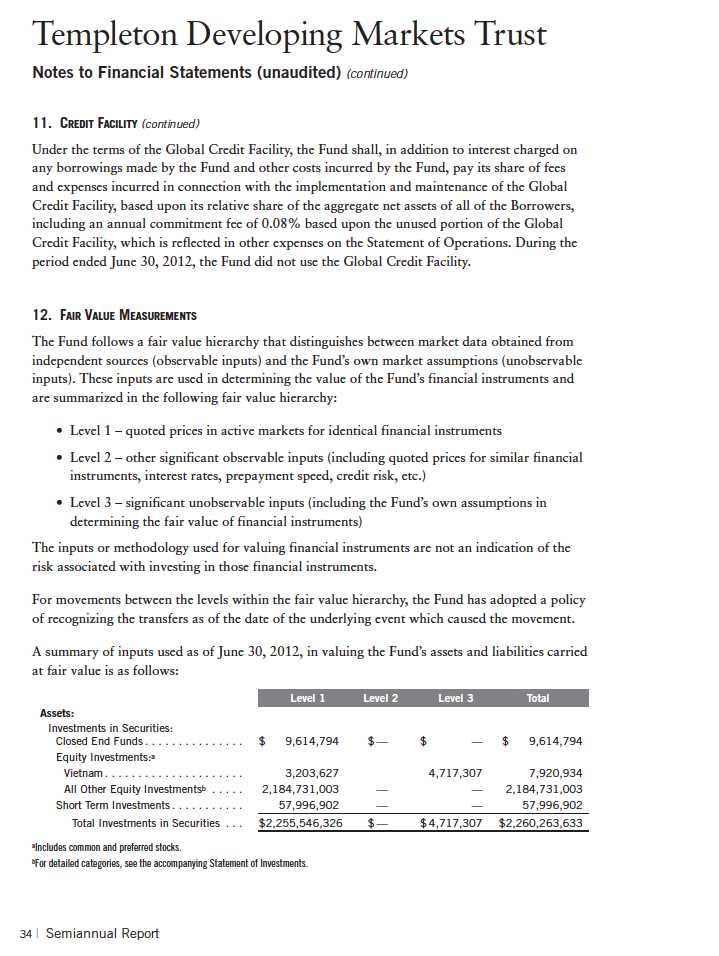
11. CREDIT FACILITY
The Fund, together with other U.S. registered and foreign investment funds (collectively,
Borrowers), managed by Franklin Templeton Investments, are borrowers in a joint syndicated
senior unsecured credit facility totaling $1.5 billion (Global Credit Facility) which matures on
January 18, 2013. This Global Credit Facility provides a source of funds to the Borrowers for
temporary and emergency purposes, including the ability to meet future unanticipated or unusu-
ally large redemption requests.
Semiannual Report | 33
Templeton Developing Markets Trust
Notes to Financial Statements (unaudited) (continued)
12. FAIR VALUE MEASUREMENTS (continued)
A reconciliation of assets in which Level 3 inputs are used in determining fair value is presented
when there are significant Level 3 investments at the end of the period.
13. NEW ACCOUNTING PRONOUNCEMENTS
In December 2011, the Financial Accounting Standards Board issued Accounting Standards Update (ASU) No. 2011-11, Balance Sheet (Topic 210): Disclosures about Offsetting Assets and Liabilities. The amendments in the ASU enhance disclosures about offsetting of financial assets and liabilities to enable investors to understand the effect of these arrangements on a fund’s financial position. The ASU is effective for interim and annual reporting periods beginning on or after January 1, 2013. The Fund believes the adoption of this ASU will not have a material impact on its financial statements.
14. SUBSEQUENT EVENTS
The Fund has evaluated subsequent events through the issuance of the financial statements and determined that no events have occurred that require disclosure.
ABBREVIATIONS
Selected Portfolio
ADR - American Depositary Receipt
GDR - Global Depositary Receipt
Semiannual Report | 35
Templeton Developing Markets Trust
Shareholder Information
Board Review of Investment Management Agreement
At a meeting held February 28, 2012, the Board of Trustees (Board), including a majority of non-interested or independent Trustees, approved renewal of the investment management agreement for the Fund. In reaching this decision, the Board took into account information furnished throughout the year at regular Board meetings, as well as information prepared specifically in connection with the annual renewal review process. Information furnished and discussed throughout the year included investment performance reports and related financial information for the Fund, as well as periodic reports on expenses, shareholder services, legal and compliance matters, pricing, brokerage commissions and execution and other services provided by the Investment Manager (Manager) and its affiliates. Information furnished specifically in connection with the renewal process included a report for the Fund prepared by Lipper, Inc. (Lipper), an independent organization, as well as additional material, including a Fund profitability analysis prepared by management. The Lipper reports compared the Fund’s investment performance and expenses with those of other mutual funds deemed comparable to the Fund as selected by Lipper. The Fund profitability analysis discussed the profitability to Franklin Templeton Investments from its overall U.S. fund operations, as well as on an individual fund-by-fund basis. Additional material accompanying such profitability analysis included information on a fund-by-fund basis listing portfolio managers and other accounts they manage, as well as information on management fees charged by the Manager and its affiliates to U.S. mutual funds and other accounts, including management’s explanation of differences where relevant. Such material also included a memorandum prepared by management describing project initiatives and capital investments relating to the services provided to the Fund by the Franklin Templeton Investments organization, as well as a memorandum relating to economies of scale and an analysis concerning transfer agent fees charged by an affiliate of the Manager.
In considering such materials, the independent Trustees received assistance and advice from and met separately with independent counsel. In approving continuance of the investment management agreement for the Fund, the Board, including a majority of independent Trustees, determined that the management fee structure was fair and reasonable and that continuance of the investment management agreement was in the best interests of the Fund and its shareholders. While attention was given to all information furnished, the following discusses some primary factors relevant to the Board’s decision.
NATURE, EXTENT AND QUALITY OF SERVICES. The Board was satisfied with the nature and quality of the overall services provided by the Manager and its affiliates to the Fund and its shareholders. In addition to investment performance and expenses discussed later, the Board’s opinion was based, in part, upon periodic reports furnished it showing that the investment policies and restrictions for the Fund were consistently complied with as well as other reports periodically furnished the Board covering matters such as the compliance of portfolio managers and other management personnel with the code of ethics adopted throughout the Franklin Templeton fund complex, the adherence to fair value pricing procedures established by the Board, and the accuracy of net asset value calculations. The Board also noted the extent of benefits provided Fund shareholders from being part of the Franklin Templeton family of funds, including the right to exchange
36 | Semiannual Report
Templeton Developing Markets Trust
Shareholder Information (continued)
Board Review of Investment Management Agreement (continued)
investments between the same class of funds without a sales charge, the ability to reinvest Fund dividends into other funds and the right to combine holdings in other funds to obtain a reduced sales charge. Favorable consideration was given to management’s continuous efforts and expenditures in establishing back-up systems and recovery procedures to function in the event of a natural disaster, it being noted that such systems and procedures had functioned smoothly during the Florida hurricanes and blackouts experienced in previous years. Among other factors taken into account by the Board were the Manager’s best execution trading policies, including a favorable report by an independent portfolio trading analytical firm, which also covered FOREX transactions. Consideration was also given to the experience of each Fund’s portfolio management team, the number of accounts managed and general method of compensation. In this latter respect, the Board noted that a primary factor in management’s determination of a portfolio manager’s bonus compensation was the relative investment performance of the funds he or she managed and that a portion of such bonus was required to be invested in a predesignated list of funds within such person’s fund management area so as to be aligned with the interests of shareholders. The Board also took into account the quality of transfer agent and shareholder services provided Fund shareholders by an affiliate of the Manager and the continuous enhancements to the Franklin Templeton website. Particular attention was given to management’s conservative approach and diligent risk management procedures, including continuous monitoring of counterparty credit risk and attention given to derivatives and other complex instruments including expanded collateralization requirements. The Board also took into account, among other things, management’s efforts in establishing a global credit facility for the benefit of the Fund and other accounts managed by Franklin Templeton Investments to provide a source of cash for temporary and emergency purposes or to meet unusual redemption requests as well as the strong financial position of the Manager’s parent company and its commitment to the mutual fund business as evidenced by its subsidization of money market funds.
INVESTMENT PERFORMANCE. The Board placed significant emphasis on the investment performance of the Fund in view of its importance to shareholders. While consideration was given to performance reports and discussions with portfolio managers at Board meetings during the year, particular attention in assessing performance was given to the Lipper report furnished for the agreement renewal. The Lipper report prepared for the Fund showed the investment performance of its Class A shares during 2011, as well as during the previous 10 years ended December 31, 2011, in comparison to a performance universe consisting of all retail and institutional emerging market funds as selected by Lipper. While the Fund, along with most other funds in such performance universe, experienced a loss in 2011, the Lipper report showed the Fund’s total return for such year to be in the highest or best performing quintile of its Lipper performance universe. The Lipper report also showed the Fund’s total return on an annualized basis to be in the second-highest quin-tile of such universe for the previous three-year period, and in the middle quintile of such universe for the previous five- and 10-year periods. The Board was satisfied with the comparative performance of the Fund as shown in the Lipper report.
Semiannual Report | 37
Templeton Developing Markets Trust
Shareholder Information (continued)
Board Review of Investment Management Agreement (continued)
COMPARATIVE EXPENSES. Consideration was given to a comparative analysis of the management fees and total expense ratio of the Fund compared with those of a group of other funds selected by Lipper as its appropriate Lipper expense group. Lipper expense data is based upon information taken from each fund’s most recent annual report, which reflects historical asset levels that may be quite different from those currently existing, particularly in a period of market volatility. While recognizing such inherent limitation and the fact that expense ratios generally increase as assets decline and decrease as assets grow, the Board believed the independent analysis conducted by Lipper to be an appropriate measure of comparative expenses. In reviewing comparative costs, Lipper provides information on the Fund’s contractual investment management fee in comparison with the contractual investment management fee that would have been charged by other funds within its Lipper expense group assuming they were similar in size to the Fund, as well as the actual total expenses of the Fund in comparison with those of its Lipper expense group. The Lipper contractual investment management fee analysis includes administrative charges as being part of a management fee, and actual total expenses, for comparative consistency, are shown by Lipper for Fund Class A shares. The results of such expense comparisons showed that the contractual investment management fee rate for the Fund was less than six basis points above the median for the Lipper expense group, while its total actual expense ratio was slightly below the median of such expense group. The Board found the comparative expenses of the Fund as shown in the Lipper report to be acceptable.
MANAGEMENT PROFITABILITY. The Board also considered the level of profits realized by the Manager and its affiliates in connection with the operation of the Fund. In this respect, the Board reviewed the Fund profitability analysis that addresses the overall profitability of Franklin Templeton’s U.S. fund business, as well as its profits in providing management and other services to the Fund during the 12-month period ended September 30, 2011, being the most recent fiscal year-end for Franklin Resources, Inc., the Manager’s parent. In reviewing the analysis, attention was given to the methodology followed in allocating costs to the Fund, it being recognized that allocation methodologies are inherently subjective and various allocation methodologies may each be reasonable while producing different results. In this respect, the Board noted that, while being continuously refined and reflecting changes in the Manager’s own cost accounting, the cost allocation methodology was consistent with that followed in profitability report presentations for the Fund made in prior years and that the Fund’s independent registered public accounting firm had been engaged by the Manager to review the reasonableness of the allocation methodologies solely for use by the Fund’s Board in reference to the profitability analysis. In reviewing and discussing such analysis, management discussed with the Board its belief that costs incurred in establishing the infrastructure necessary for the type of mutual fund operations conducted by the Manager and its affiliates may not be fully reflected in the expenses allocated to the Fund in determining its profitability, as well as the fact that the level of profits, to a certain extent, reflected operational cost savings and efficiencies initiated by management. The Board also took into account management’s expenditures in improving shareholder services provided the Fund, as well as the need to implement systems and meet additional regulatory and compliance requirements resulting from statutes such
38 | Semiannual Report
Templeton Developing Markets Trust
Shareholder Information (continued)
Board Review of Investment Management Agreement (continued)
as the Sarbanes-Oxley and Dodd-Frank Acts and recent SEC and other regulatory requirements. In addition, the Board considered a third-party study comparing the profitability of the Manager’s parent on an overall basis to other publicly held managers broken down to show profitability from management operations exclusive of distribution expenses, as well as profitability including distribution expenses. The Board also considered the extent to which the Manager and its affiliates might derive ancillary benefits from fund operations, including revenues generated from transfer agent services and potential benefits resulting from allocation of fund brokerage and the use of commission dollars to pay for research. Based upon its consideration of all these factors, the Board determined that the level of profits realized by the Manager and its affiliates from providing services to the Fund was not excessive in view of the nature, quality and extent of services provided.
ECONOMIES OF SCALE. The Board also considered whether economies of scale are realized by the Manager and its affiliates as the Fund grows larger and the extent to which this is reflected in the level of management fees charged. While recognizing that any precise determination is inherently subjective, the Board noted that based upon the Fund profitability analysis, it appears that as some funds get larger, at some point economies of scale do result in the Manager realizing a larger profit margin on management services provided such a fund. The Board also noted that economies of scale are shared with a fund and its shareholders through management fee breakpoints so that as a fund grows in size, its effective management fee rate declines. The Fund’s current management advisory fee schedule, reflecting reductions implemented during the previous year, provides a rate of 1.10% on the first $1 billion of Fund net assets; 1.05% on the next $4 billion of Fund net assets; 1.00% on the next $5 billion of Fund net assets; 0.95% on the next $5 billion of Fund net assets; 0.90% on the next $5 billion of Fund net assets; and 0.85% on Fund net assets in excess of $20 billion. The Fund is also charged a separate fee for administrative services that starts at 0.15% on the first $200 million of Fund net assets, and declines through breakpoints to a fixed rate of 0.075% after net assets reach the $1.2 billion level. At the end of 2011, the Fund’s net assets were approximately $2.39 billion, and to the extent economies of scale may be realized by the Manager and its affiliates, the Board believes the schedules of management advisory and administrative fees provide a sharing of benefits with the Fund and its shareholders.
Proxy Voting Policies and Procedures
The Trust’s investment manager has established Proxy Voting Policies and Procedures (Policies) that the Trust uses to determine how to vote proxies relating to portfolio securities. Shareholders may view the Trust’s complete Policies online at franklintempleton.com. Alternatively, shareholders may request copies of the Policies free of charge by calling the Proxy Group collect at (954) 527-7678 or by sending a written request to: Franklin Templeton Companies, LLC, 300 S.E. 2nd Street, Fort Lauderdale, FL 33301, Attention: Proxy Group. Copies of the Trust’s proxy voting records are also made available online at franklintempleton.com and posted on the U.S. Securities and Exchange Commission’s website at sec.gov and reflect the most recent 12-month period ended June 30.
Semiannual Report | 39
Templeton Developing Markets Trust
Shareholder Information (continued)
Quarterly Statement of Investments
The Trust files a complete statement of investments with the U.S. Securities and Exchange Commission for the first and third quarters for each fiscal year on Form N-Q. Shareholders may view the filed Form N-Q by visiting the Commission’s website at sec.gov. The filed form may also be viewed and copied at the Commission’s Public Reference Room in Washington, DC. Information regarding the operations of the Public Reference Room may be obtained by calling (800) SEC-0330.
40 | Semiannual Report
This page intentionally left blank.
This page intentionally left blank.

Item 2. Code of Ethics.
(a) The Registrant has adopted a code of ethics that applies to its
principal executive officers and principal financial and accounting
officer.
(c) N/A
(d) N/A
(f) Pursuant to Item 12(a)(1), the Registrant is attaching as an
exhibit a copy of its code of ethics that applies to its principal
executive officers and principal financial and accounting officer.
Item 3. Audit Committee Financial Expert.
(a)(1) The Registrant has an audit committee financial expert serving
on its audit committee.
(2) The audit committee financial expert is David W. Niemiec and he is
"independent" as defined under the relevant Securities and Exchange
Commission Rules and Releases.
Item 4. Principal Accountant Fees and Services. N/A
Item 5. Audit Committee of Listed Registrants. N/A
Item 6. Schedule of Investments. N/A
Item 7. Disclosure of Proxy Voting Policies and Procedures for
Closed-End Management Investment Companies. N/A
Item 8. Portfolio Managers of Closed-End Management Investment
Companies. N/A
Item 9. Purchases of Equity Securities by Closed-End Management
Investment Company and Affiliated Purchasers. N/A
Item 10. Submission of Matters to a Vote of Security Holders.
There have been no changes to the procedures by which shareholders may
recommend nominees to the Registrant's Board of Trustees that would
require disclosure herein.
Item 11. Controls and Procedures.
(a) Evaluation of Disclosure Controls and Procedures. The Registrant
maintains disclosure controls and procedures that are designed to
ensure that information required to be disclosed in the Registrant’s
filings under the Securities Exchange Act of 1934 and the Investment
Company Act of 1940 is recorded, processed, summarized and reported
within the periods specified in the rules and forms of the Securities
and Exchange Commission. Such information is accumulated and
communicated to the Registrant’s management, including its principal
executive officer and principal financial officer, as appropriate, to
allow timely decisions regarding required disclosure. The Registrant’s
management, including the principal executive officer and the principal
financial officer, recognizes that any set of controls and procedures,
no matter how well designed and operated, can provide only reasonable
assurance of achieving the desired control objectives.
Within 90 days prior to the filing date of this Shareholder Report on
Form N-CSR, the Registrant had carried out an evaluation, under the
supervision and with the participation of the Registrant’s management,
including the Registrant’s principal executive officer and the
Registrant’s principal financial officer, of the effectiveness of the
design and operation of the Registrant’s disclosure controls and
procedures. Based on such evaluation, the Registrant’s principal
executive officer and principal financial officer concluded that the
Registrant’s disclosure controls and procedures are effective.
(b) Changes in Internal Controls. There have been no significant
changes in the Registrant’s internal controls or in other factors that
could significantly affect the internal controls subsequent to the date
of their evaluation in connection with the preparation of this
Shareholder Report on Form N-CSR.
Item 12. Exhibits.
(a)(1) Code of Ethics
(a)(2) Certifications pursuant to Section 302 of the Sarbanes-Oxley Act
of 2002 of Laura F. Fergerson, Chief Executive Officer - Finance and
Administration, and Mark H. Otani, Chief Financial Officer and Chief
Accounting Officer
(b) Certifications pursuant to Section 906 of the Sarbanes-Oxley Act of
2002 of Laura F. Fergerson, Chief Executive Officer - Finance and
Administration, and Mark H. Otani, Chief Financial Officer and Chief
Accounting Officer