Annual Report
Templeton Developing Markets Trust
Your Fund’s Goal and Main Investments: Templeton Developing Markets Trust seeks
long-term capital appreciation. Under normal market conditions, the Fund invests at least 80% of its net
assets in securities of “developing market countries,” as defined in the Fund’s prospectus.
This annual report for Templeton Developing Markets Trust covers the fiscal
year ended December 31, 2011.
Economic and Market Overview
The fundamental and financial strength of emerging markets was evident in
2011, as emerging market countries continued to report generally strong
economic data, albeit a moderation from 2010. This strength, however, was
not reflected in emerging market equity prices as the eurozone sovereign debt
crisis and U.S. fiscal concerns led many investors to hold cash, shying away
from many investments in developed and emerging markets.
Global stock prices were largely range bound in the first half of 2011. Markets,
however, declined in August, largely due to Standard & Poor’s downgrade of
the U.S. long-term sovereign credit rating to AA+ from AAA, and then again
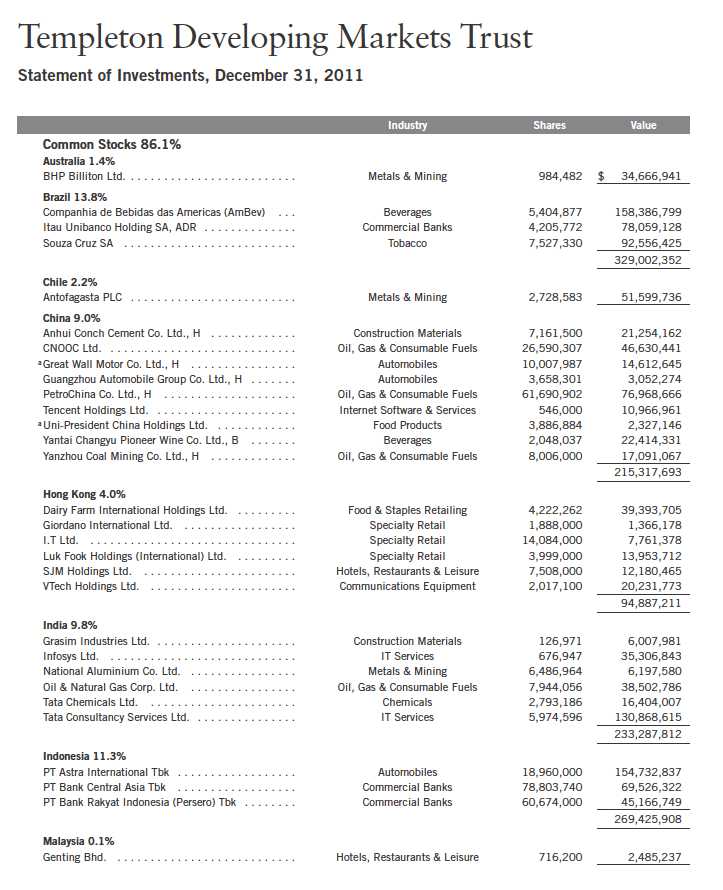
The dollar value, number of shares or principal amount, and names of all portfolio holdings are listed in the
Fund’s Statement of Investments (SOI). The SOI begins on page 20.
Annual Report | 3
in September, as the prolonged eurozone sovereign debt crisis and lack of a
comprehensive solution created significant confusion and volatility in global
financial markets.
In October, however, global equity prices rallied, and emerging markets as
measured by the MSCI Emerging Markets (EM) Index recorded a double-digit
return for the month. Investors welcomed strong corporate earnings reports,
the release of positive U.S. economic data, and the European Union’s plans to
recapitalize its banks and leverage the European Financial Stability Facility.
This rally proved to be short-lived, and global equity markets corrected again
in the final two months of 2011, largely due to the slow progress by European
leaders to resolve the eurozone debt crisis.
Heightened volatility and increased uncertainty also gave investors reasons to
lock in profits from 2009 and 2010, when many emerging markets returned
more than 100% in U.S. dollar (USD) terms, as measured by the components
of the MSCI EM Index.1 Against this backdrop, emerging markets, as repre-
sented by the MSCI EM Index, declined -18.17% in USD terms in 2011.1
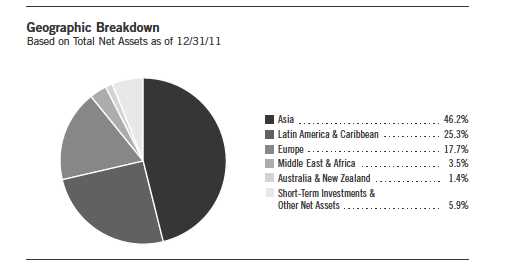
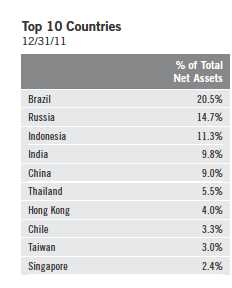
Within emerging markets, Southeast Asian stocks were among the better
performers in 2011. Strong domestic demand, rising disposable incomes and
relatively low unemployment made the region’s economies more resilient to
global uncertainties. Relatively more export-dependent markets such as China
and Taiwan, however, underperformed their regional peers. India was among
the worst emerging market performers for the year due to high inflation and
interest rates, a weak rupee and global economic uncertainties. Generally
weaker emerging market currencies and a global commodity price correction
adversely impacted Latin American markets.
Eastern European markets were among the poorest performers, largely due to
their proximity to their western counterparts and a weaker euro rather than a
significant deterioration in the region’s economies. South Africa significantly
outperformed most of its emerging market counterparts in local currency
terms but ended the period with double-digit declines in USD terms due to a
weaker rand.
1. Source: © 2012 Morningstar. All rights reserved. The information contained herein: (1) is proprietary to Morningstar
and/or its content providers; (2) may not be copied or distributed; and (3) is not warranted to be accurate, complete or
timely. Neither Morningstar nor its content providers are responsible for any damages or losses arising from any use of
this information. The index is unmanaged and includes reinvested dividends. One cannot invest directly in an index,
and an index is not representative of the Fund’s portfolio.
4 | Annual Report
Investment Strategy
We employ a fundamental research, value-oriented, long-term investment
approach. We focus on the market price of a company’s securities relative to
our evaluation of its long-term earnings, asset value and cash flow potential.
We also consider a company’s profit and loss outlook, balance sheet strength,
cash flow trends and asset value in relation to the current price. Our analysis
considers the company’s corporate governance behavior as well as its position
in its sector, the economic framework and political environment. We invest in
securities without regard to benchmark comparisons.
Performance Overview
Templeton Developing Markets Trust – Class A had a -15.85% cumulative total
return for the 12 months ended December 31, 2011. In comparison, the MSCI
EM Index and the Standard & Poor’s®/International Finance Corporation
Investable (S&P®/IFCI) Composite Index, which track global emerging market
stock performance, had total returns of -18.17% and -19.03% for the same
period.1, 2 Please note that index performance is provided for reference and
that we do not attempt to track any index but rather undertake investments
on the basis of fundamental research. In addition, the Fund’s return reflects the
effect of fees and expenses for professional management, while an index does
not have such costs. You can find the Fund’s long-term performance data in
the Performance Summary beginning on page 8.
Manager’s Discussion
During the 12 months under review, major detractors from the Fund’s absolute
performance were Brazil-based Vale, the world’s largest iron ore producer and
second-largest nickel producer; Norilsk Nickel (Mining and Metallurgical Co.
Norilsk Nickel), a Russia-based major producer of nickel, palladium, and other
base and precious metals; and Tata Consultancy Services, one of India’s largest
information technology consulting and services firms, with outsourcing services
primarily in the Americas, Europe and India. Weak commodity metal prices and
higher raw material costs weighed on Vale’s share price. However, at year-end
we believed Vale could benefit from the long-term uptrend in commodity
demand due to emerging market industrialization. Vale’s strong cash flow and
attractive valuations, in our view, underscored our belief in its long-term
potential. Investor concerns that Norilsk Nickel could become embroiled in
Russian domestic politics after a major shareholder’s December announcement
2. STANDARD & POOR’S®, S&P® and S&P 500® are registered trademarks of Standard & Poor’s Financial Services LLC.
Standard & Poor’s does not sponsor, endorse, sell or promote any S&P index-based product.
Annual Report | 5

of his intention to run in the presidential election added to the adverse effects of
metal price weakness on the company’s shares. In our long-term view, Norilsk
Nickel’s strong global market share in base metal and platinum group metal
production, huge reserves and low-cost nickel production put the company
in a strong position. Tata’s share price performed poorly in USD terms due to
weakness in the Indian rupee, which reached a record low against the dollar
in December. Based on our analysis, we believed Tata remained well positioned
to benefit from the global outsourcing trend of services to Indian consulting
companies.
Major contributors to absolute performance during the reporting period were
Astra International, Indonesia’s leading car and motorcycle company; Brazil-
based AmBev (Companhia de Bebidas das Americas), one of the world’s largest
beer and soft drink producers; and Souza Cruz, Brazil’s major cigarette com-
pany. Astra is a leader in the Indonesian car and motorcycle markets, which
have been enjoying strong secular growth trends. The company continued to
benefit from Indonesia’s robust economic growth, higher incomes and affordable
credit. The strong market positions of AmBev and Souza Cruz have allowed their
businesses to achieve superior returns and build market share as consumers
become wealthier and more discerning. In our view, the companies’ strong
operations, low debt levels, good dividend yield and strong brands made them
attractive investments.
It is important to recognize the effect of currency movements on the Fund’s
performance. In general, if the value of the U.S. dollar goes up compared with
a foreign currency, an investment traded in that foreign currency will go down
in value because it will be worth fewer U.S. dollars. This can have a negative
effect on Fund performance. Conversely, when the U.S. dollar weakens in
relation to a foreign currency, an investment traded in that foreign currency
will increase in value, which can contribute to Fund performance. For the
12 months ended December 31, 2011, the U.S. dollar rose in value relative to
most currencies. As a result, the Fund’s performance was negatively affected
by the portfolio’s investment predominantly in securities with non-U.S.
currency exposure.
During the 12-month reporting period, we initiated a position in Australia
and increased the Fund’s holdings in Indonesia, Singapore, Hong Kong and
Thailand as we continued to search for what we considered to be attractive
investment opportunities. We added industrial conglomerates and construc-
tion, fertilizer and agricultural chemicals, and tobacco companies. Key
purchases included new positions in Australia-based BHP Billiton, a major
diversified natural resources company with significant sales in emerging markets,
and Singapore-based SembCorp Marine, a premier global marine and
6 | Annual Report
offshore engineering group, as well as additional shares of Uralkali, Russia’s
leading potash fertilizer producer.
Conversely, we reduced the Fund’s investments in India, Brazil, China via Hong
Kong-listed China H shares and Turkey to focus on stocks we considered to
be more attractively valued within our investment universe and raise funds for
redemptions.3 We reduced the Fund’s holdings largely in diversified banks, oil
and gas, diversified metals and mining, and fashion apparel and accessories
retail companies. Additionally, we sold our holdings in select companies that
reached their target prices during the reporting period. Key sales included
reduction of our position in Chinese automobile manufacturer Guangzhou
Automobile Group, as well as elimination of our holdings in Brazilian cosmetics
company Natura Cosmeticos and Indian iron ore producer Sesa Goa.
We thank you for your continued participation in Templeton Developing
Markets Trust and look forward to serving your future investment needs.

The foregoing information reflects our analysis, opinions and portfolio holdings as of December 31, 2011, the end
of the reporting period. The way we implement our main investment strategies and the resulting portfolio holdings
may change depending on factors such as market and economic conditions. These opinions may not be relied upon
as investment advice or an offer for a particular security. The information is not a complete analysis of every
aspect of any market, country, industry, security or the Fund. Statements of fact are from sources considered
reliable, but the investment manager makes no representation or warranty as to their completeness or accuracy.
Although historical performance is no guarantee of future results, these insights may help you understand our
investment management philosophy.
3. “China H” denotes shares of China-incorporated, Hong Kong Stock Exchange-listed companies with most businesses
in China.
Annual Report | 7
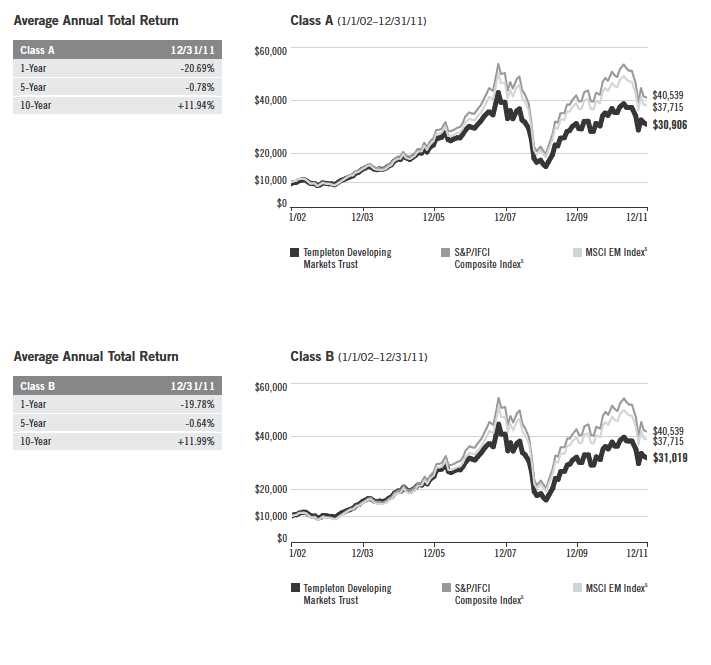
Performance Summary as of 12/31/11
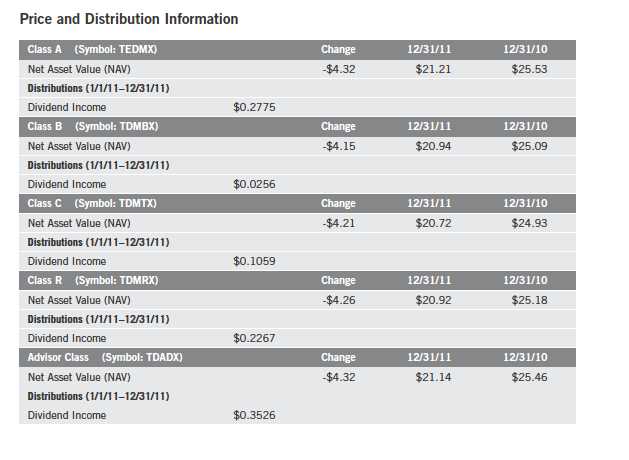
Your dividend income will vary depending on dividends or interest paid by securities in the Fund’s
portfolio, adjusted for operating expenses of each class. Capital gain distributions are net profits
realized from the sale of portfolio securities. The performance table and graphs do not reflect any
taxes that a shareholder would pay on Fund dividends, capital gain distributions, if any, or any
realized gains on the sale of Fund shares. Total return reflects reinvestment of the Fund’s dividends
and capital gain distributions, if any, and any unrealized gains or losses.
8 | Annual Report
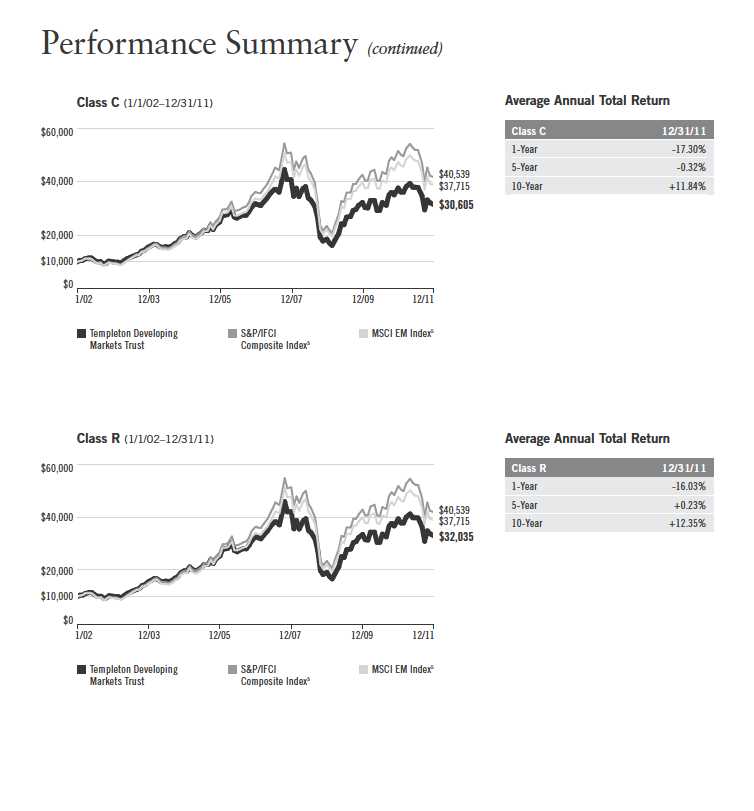
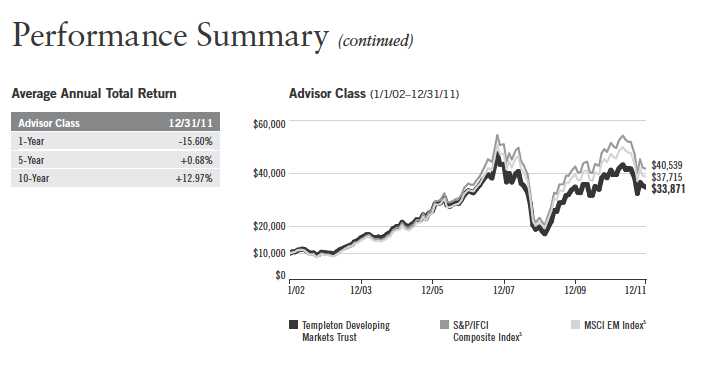
Performance Summary (continued)
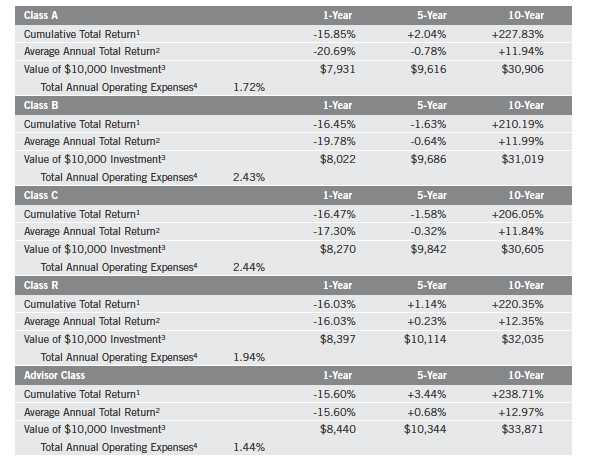
Performance
Cumulative total return excludes sales charges. Average annual total return and value of $10,000 investment include
maximum sales charges. Class A: 5.75% maximum initial sales charge; Class B: contingent deferred sales charge
(CDSC) declining from 4% to 1% over six years, and eliminated thereafter; Class C: 1% CDSC in first year only;
Class R/Advisor Class: no sales charges.
Performance data represent past performance, which does not guarantee future results. Investment return and principal
value will fluctuate, and you may have a gain or loss when you sell your shares. Current performance may differ from
figures shown. For most recent month-end performance, go to franklintempleton.com or call (800) 342-5236.
Annual Report | 9
Performance Summary (continued)
Total Return Index Comparison for a Hypothetical $10,000 Investment
Total return represents the change in value of an investment over the periods shown. It includes
any current, applicable, maximum sales charge, Fund expenses, account fees and reinvested distri-
butions. The unmanaged indexes include reinvestment of any income or distributions. They differ
from the Fund in composition and do not pay management fees or expenses. One cannot invest
directly in an index.
10 | Annual Report
Annual Report | 11
Endnotes
All investments involve risks. Special risks are associated with foreign investing, including currency fluctuations,
economic instability and political developments. Investments in developing markets involve heightened risks
related to the same factors, in addition to those associated with these markets’ smaller size and lesser liquidity.
The Fund is designed for the aggressive portion of a well-diversified portfolio. The Fund is actively managed but
there is no guarantee that the manager’s investment decisions will produce the desired results. The Fund’s
prospectus also includes a description of the main investment risks.
Class B: These shares have higher annual fees and expenses than Class A shares.
Class C: Prior to 1/1/04, these shares were offered with an initial sales charge; thus actual total returns
would have differed. These shares have higher annual fees and expenses than Class A shares.
Class R: Shares are available to certain eligible investors as described in the prospectus. These shares have
higher annual fees and expenses than Class A shares.
Advisor Class: Shares are available to certain eligible investors as described in the prospectus.
1. Cumulative total return represents the change in value of an investment over the periods indicated.
2. Average annual total return represents the average annual change in value of an investment over the periods
indicated.
3. These figures represent the value of a hypothetical $10,000 investment in the Fund over the periods indicated.
4. Figures are as stated in the Fund’s prospectus current as of the date of this report. In periods of market volatility,
assets may decline significantly, causing total annual Fund operating expenses to become higher than the figures
shown.
5. Source: © 2012 Morningstar. The S&P/IFCI Composite Index is a free float-adjusted, market capitalization-
weighted index designed to measure equity performance of global emerging markets. The MSCI EM Index is a free
float-adjusted, market capitalization-weighted index designed to measure equity market performance of global
emerging markets.
12 | Annual Report
Your Fund’s Expenses
As a Fund shareholder, you can incur two types of costs:
• Transaction costs, including sales charges (loads) on Fund purchases; and
• Ongoing Fund costs, including management fees, distribution and service (12b-1) fees, and other
Fund expenses. All mutual funds have ongoing costs, sometimes referred to as operating expenses.
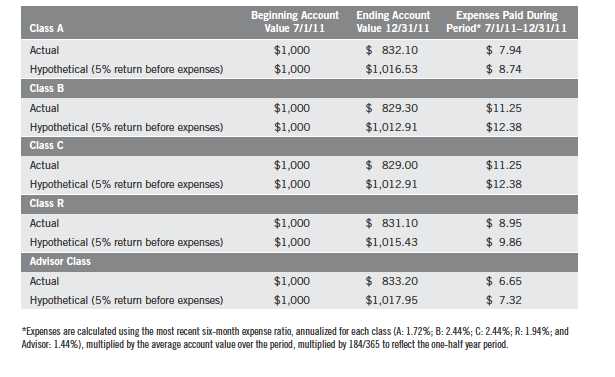
The following table shows ongoing costs of investing in the Fund and can help you understand
these costs and compare them with those of other mutual funds. The table assumes a $1,000
investment held for the six months indicated.
Actual Fund Expenses
The first line (Actual) for each share class listed in the table provides actual account values and
expenses. The “Ending Account Value” is derived from the Fund’s actual return, which includes
the effect of Fund expenses.
You can estimate the expenses you paid during the period by following these steps. Of course, your
account value and expenses will differ from those in this illustration:
1. Divide your account value by $1,000.
If an account had an $8,600 value, then $8,600 ÷ $1,000 = 8.6.
2. Multiply the result by the number under the heading “Expenses Paid During Period.”
If Expenses Paid During Period were $7.50, then 8.6 x $7.50 = $64.50.
In this illustration, the estimated expenses paid this period are $64.50.
Hypothetical Example for Comparison with Other Funds
Information in the second line (Hypothetical) for each class in the table can help you compare
ongoing costs of investing in the Fund with those of other mutual funds. This information may not
be used to estimate the actual ending account balance or expenses you paid during the period. The
hypothetical “Ending Account Value” is based on the actual expense ratio for each class and an
assumed 5% annual rate of return before expenses, which does not represent the Fund’s actual return.
The figure under the heading “Expenses Paid During Period” shows the hypothetical expenses
your account would have incurred under this scenario. You can compare this figure with the 5%
hypothetical examples that appear in shareholder reports of other funds.
Annual Report | 13
Your Fund’s Expenses (continued)
Please note that expenses shown in the table are meant to highlight ongoing costs and do not reflect
any transaction costs, such as sales charges. Therefore, the second line for each class is useful in
comparing ongoing costs only, and will not help you compare total costs of owning different funds.
In addition, if transaction costs were included, your total costs would have been higher. Please refer
to the Fund prospectus for additional information on operating expenses.
14 | Annual Report
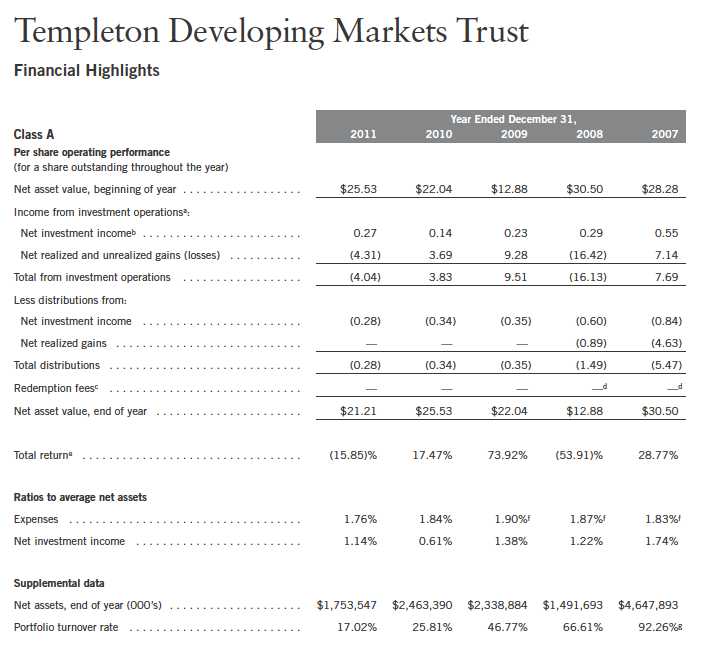
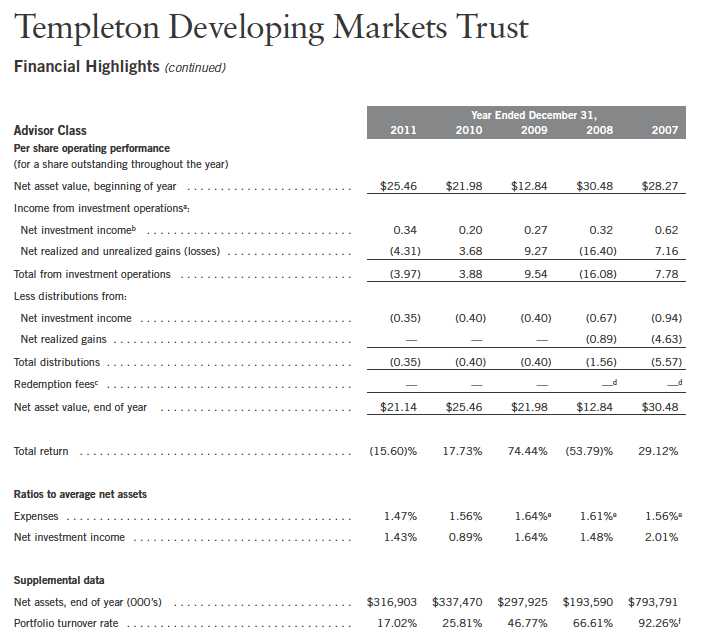
aThe amount shown for a share outstanding throughout the period may not correlate with the Statement of Operations for the period due to the timing of sales and repurchases of
the Fund shares in relation to income earned and/or fluctuating market value of the investments of the Fund.
bBased on average daily shares outstanding.
cEffective September 1, 2008, the redemption fee was eliminated.
dAmount rounds to less than $0.01 per share.
eTotal return does not reflect sales commissions or contingent deferred sales charges, if applicable.
fBenefit of expense reduction rounds to less than 0.01%.
gExcludes the value of portfolio securities delivered as a result of a redemption in-kind.
Annual Report | The accompanying notes are an integral part of these financial statements. | 15
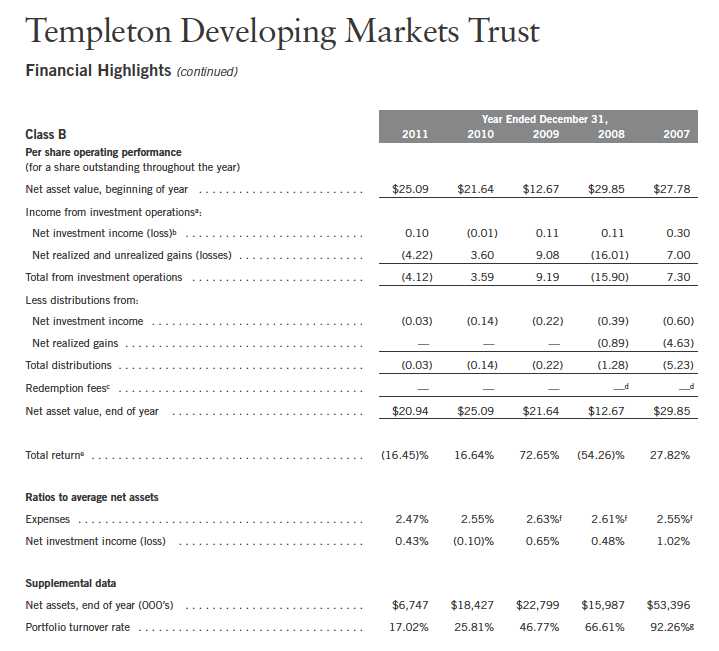
aThe amount shown for a share outstanding throughout the period may not correlate with the Statement of Operations for the period due to the timing of sales and repurchases of
the Fund shares in relation to income earned and/or fluctuating market value of the investments of the Fund.
bBased on average daily shares outstanding.
cEffective September 1, 2008, the redemption fee was eliminated.
dAmount rounds to less than $0.01 per share.
eTotal return does not reflect sales commissions or contingent deferred sales charges, if applicable.
fBenefit of expense reduction rounds to less than 0.01%.
gExcludes the value of portfolio securities delivered as a result of a redemption in-kind.
16 | The accompanying notes are an integral part of these financial statements. | Annual Report
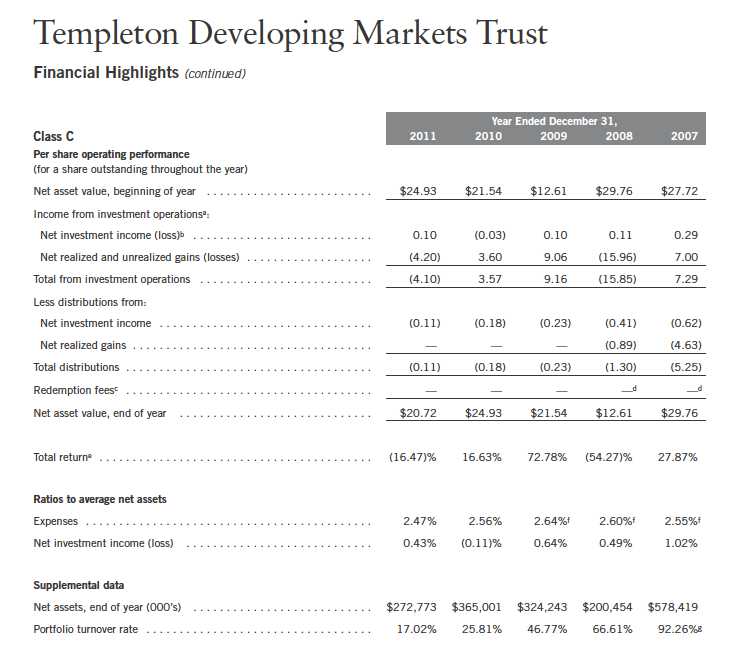
aThe amount shown for a share outstanding throughout the period may not correlate with the Statement of Operations for the period due to the timing of sales and repurchases of
the Fund shares in relation to income earned and/or fluctuating market value of the investments of the Fund.
bBased on average daily shares outstanding.
cEffective September 1, 2008, the redemption fee was eliminated.
dAmount rounds to less than $0.01 per share.
eTotal return does not reflect sales commissions or contingent deferred sales charges, if applicable.
fBenefit of expense reduction rounds to less than 0.01%.
gExcludes the value of portfolio securities delivered as a result of a redemption in-kind.
Annual Report | The accompanying notes are an integral part of these financial statements. | 17
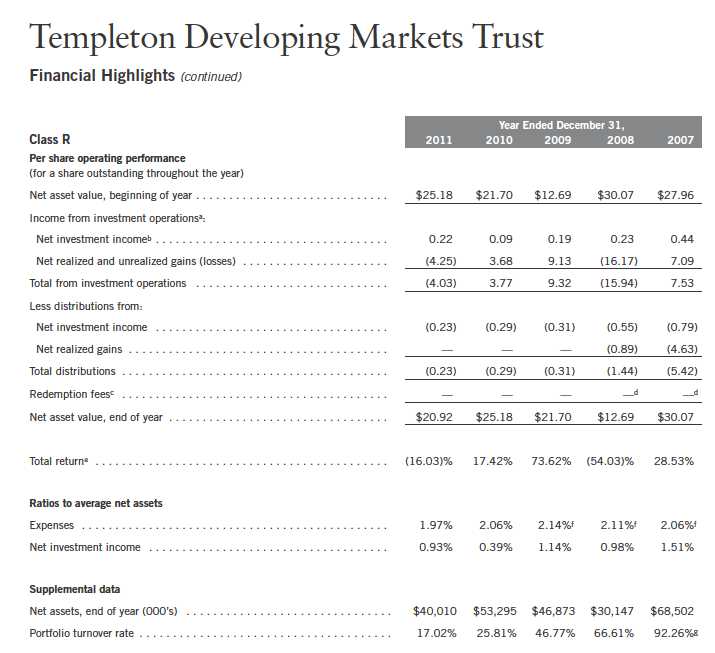
aThe amount shown for a share outstanding throughout the period may not correlate with the Statement of Operations for the period due to the timing of sales and repurchases of
the Fund shares in relation to income earned and/or fluctuating market value of the investments of the Fund.
bBased on average daily shares outstanding.
cEffective September 1, 2008, the redemption fee was eliminated.
dAmount rounds to less than $0.01 per share.
eTotal return does not reflect sales commissions or contingent deferred sales charges, if applicable.
fBenefit of expense reduction rounds to less than 0.01%.
gExcludes the value of portfolio securities delivered as a result of a redemption in-kind.
18 | The accompanying notes are an integral part of these financial statements. | Annual Report
aThe amount shown for a share outstanding throughout the period may not correlate with the Statement of Operations for the period due to the timing of sales and repurchases of
the Fund shares in relation to income earned and/or fluctuating market value of the investments of the Fund.
bBased on average daily shares outstanding.
cEffective September 1, 2008, the redemption fee was eliminated.
dAmount rounds to less than $0.01 per share.
eBenefit of expense reduction rounds to less than 0.01%.
fExcludes the value of portfolio securities delivered as a result of a redemption in-kind.
Annual Report | The accompanying notes are an integral part of these financial statements. | 19
20 | Annual Report
Annual Report | 21
22 | Annual Report
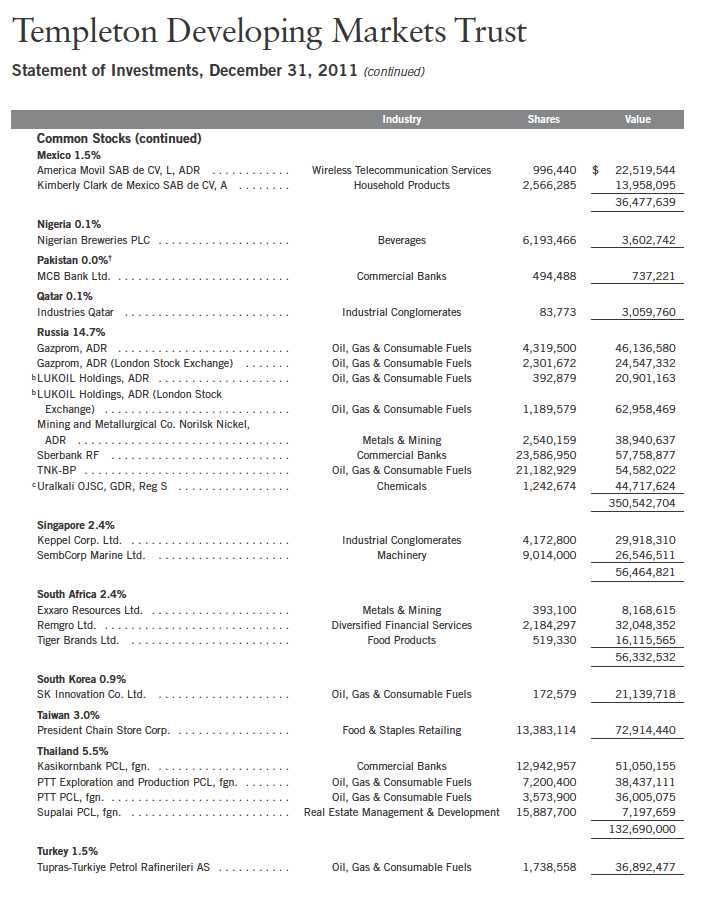
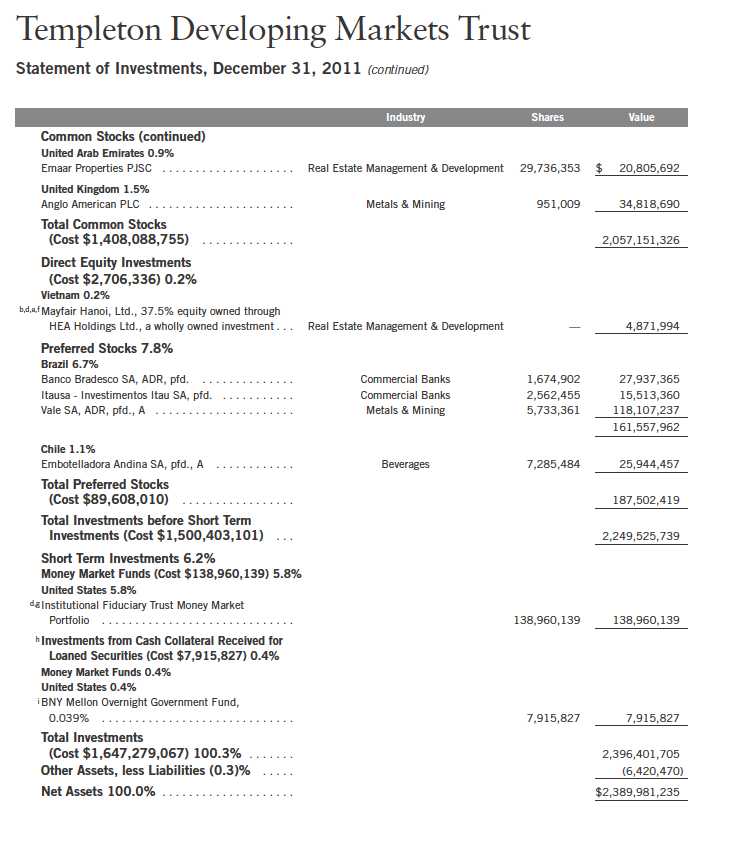
Templeton Developing Markets Trust
Statement of Investments, December 31, 2011 (continued)
See Abbreviations on page 38.
†Rounds to less than 0.1% of net assets.
aA portion or all of the security is on loan at December 31, 2011. See Note 1(c).
bAt December 31, 2011, pursuant to the Fund’s policies and the requirements of applicable securities law, the Fund may be restricted from trading this security for a limited or
extended period of time due to ownership limits and/or potential possession of material non-public information.
cSecurity was purchased pursuant to Regulation S under the Securities Act of 1933, which exempts from registration securities offered and sold outside of the United States. Such
a security cannot be sold in the United States without either an effective registration statement filed pursuant to the Securities Act of 1933, or pursuant to an exemption from
registration. This security has been deemed liquid under guidelines approved by the Fund’s Board of Trustees. At December 31, 2011, the value of this security was $44,717,624,
representing 1.87% of net assets.
dNon-income producing.
eSee Note 9 regarding restricted securities.
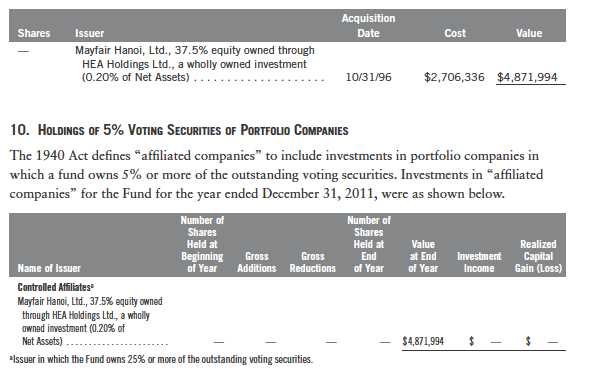
fSee Note 10 regarding holdings of 5% voting securities.
gSee Note 7 regarding investments in the Institutional Fiduciary Trust Money Market Portfolio.
hSee Note 1(c) regarding securities on loan.
iThe rate shown is the annualized seven-day yield at period end.
Annual Report | The accompanying notes are an integral part of these financial statements. | 23
24 | The accompanying notes are an integral part of these financial statements. | Annual Report
Annual Report | The accompanying notes are an integral part of these financial statements. | 25
26 | The accompanying notes are an integral part of these financial statements. | Annual Report
Annual Report | The accompanying notes are an integral part of these financial statements. | 27
Templeton Developing Markets Trust
Notes to Financial Statements
1. ORGANIZATION AND SIGNIFICANT ACCOUNTING POLICIES
Templeton Developing Markets Trust (Fund) is registered under the Investment Company Act of
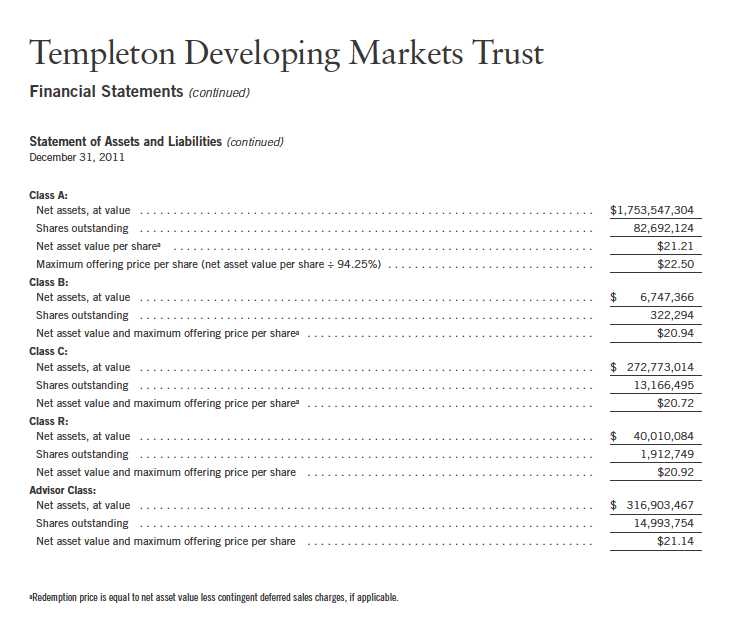
1940, as amended, (1940 Act) as an open-end investment company. The Fund offers five classes
of shares: Class A, Class B, Class C, Class R, and Advisor Class. Each class of shares differs by its
initial sales load, contingent deferred sales charges, distribution fees, voting rights on matters
affecting a single class and its exchange privilege.
The following summarizes the Fund’s significant accounting policies.
a. Financial Instrument Valuation
The Fund’s investments in securities and other financial instruments are carried at fair value daily.
Fair value is the price that would be received to sell an asset or paid to transfer a liability in an
orderly transaction between market participants on the measurement date. Under procedures
approved by the Fund’s Board of Trustees, the Fund may utilize independent pricing services,
quotations from securities and financial instrument dealers, and other market sources to deter-
mine fair value.
Equity securities listed on an exchange or on the NASDAQ National Market System are valued
at the last quoted sale price or the official closing price of the day, respectively. Foreign equity
securities are valued as of the close of trading on the foreign stock exchange on which the security
is primarily traded, or the NYSE, whichever is earlier. The value is then converted into its U.S.
dollar equivalent at the foreign exchange rate in effect at the close of the NYSE on the day that
the value of the security is determined. Over-the-counter securities are valued within the range of
the most recent quoted bid and ask prices. Securities that trade in multiple markets or on multiple
exchanges are valued according to the broadest and most representative market. Certain equity
securities are valued based upon fundamental characteristics or relationships to similar securities.
Investments in open-end mutual funds and non-registered money market funds are valued at the
closing net asset value.
The Fund has procedures to determine the fair value of securities and other financial instruments
for which market prices are not readily available or which may not be reliably priced. Under
these procedures, the Fund primarily employs a market-based approach which may use related or
comparable assets or liabilities, recent transactions, market multiples, book values, and other rel-
evant information for the investment to determine the fair value of the investment. The Fund may
also use an income-based valuation approach in which the anticipated future cash flows of the
investment are discounted to calculate fair value. Discounts may also be applied due to the nature
or duration of any restrictions on the disposition of the investments. Due to the inherent uncer-
tainty of valuations of such investments, the fair values may differ significantly from the values
that would have been used had an active market existed.
Trading in securities on foreign securities stock exchanges and over-the-counter markets may be
completed before the daily close of business on the NYSE. Occasionally, events occur between
the time at which trading in a foreign security is completed and the close of the NYSE that might
28 | Annual Report
Templeton Developing Markets Trust
Notes to Financial Statements (continued)
1. ORGANIZATION AND SIGNIFICANT ACCOUNTING POLICIES (continued)
a. Financial Instrument Valuation (continued)
call into question the reliability of the value of a portfolio security held by the Fund. As a result,
differences may arise between the value of the Fund’s portfolio securities as determined at the
foreign market close and the latest indications of value at the close of the NYSE. In order to
minimize the potential for these differences, the investment manager monitors price movements
following the close of trading in foreign stock markets through a series of country specific market
proxies (such as baskets of American Depositary Receipts, futures contracts and exchange traded
funds). These price movements are measured against established trigger thresholds for each spe-
cific market proxy to assist in determining if an event has occurred that may call into question the
reliability of the values of the foreign securities held by the Fund. If such an event occurs, the
securities may be valued using fair value procedures, which may include the use of independent
pricing services.
b. Foreign Currency Translation
Portfolio securities and other assets and liabilities denominated in foreign currencies are trans-
lated into U.S. dollars based on the exchange rate of such currencies against U.S. dollars on the
date of valuation. The Fund may enter into foreign currency exchange contracts to facilitate
transactions denominated in a foreign currency. Purchases and sales of securities, income and
expense items denominated in foreign currencies are translated into U.S. dollars at the exchange
rate in effect on the transaction date. Portfolio securities and assets and liabilities denominated
in foreign currencies contain risks that those currencies will decline in value relative to the U.S.
dollar. Occasionally, events may impact the availability or reliability of foreign exchange rates
used to convert the U.S. dollar equivalent value. If such an event occurs, the foreign exchange
rate will be valued at fair value using procedures established and approved by the Fund’s Board
of Trustees.
The Fund does not separately report the effect of changes in foreign exchange rates from changes
in market prices on securities held. Such changes are included in net realized and unrealized gain
or loss from investments on the Statement of Operations.
Realized foreign exchange gains or losses arise from sales of foreign currencies, currency gains or
losses realized between the trade and settlement dates on securities transactions and the difference
between the recorded amounts of dividends, interest, and foreign withholding taxes and the U.S.
dollar equivalent of the amounts actually received or paid. Net unrealized foreign exchange gains
and losses arise from changes in foreign exchange rates on foreign denominated assets and liabili-
ties other than investments in securities held at the end of the reporting period.
c. Securities Lending
The Fund participates in an agency based security lending program. The fund receives cash collat-
eral against the loaned securities in an amount equal to at least 102% of the market value of the
loaned securities. Collateral is maintained over the life of the loan in an amount not less than
Annual Report | 29
Templeton Developing Markets Trust
Notes to Financial Statements (continued)
1. ORGANIZATION AND SIGNIFICANT ACCOUNTING POLICIES (continued)
c. Securities Lending (continued)
100% of the market value of loaned securities, as determined at the close of fund business each
day; any additional collateral required due to changes in security values is delivered to the fund
on the next business day. The collateral is invested in a non-registered money fund by the fund’s
custodian on the fund’s behalf. The fund receives income from the investment of cash collateral,
in addition to lending fees and rebates paid by the borrower. The fund bears the market risk with
respect to the collateral investment, securities loaned, and the risk that the agent may default on
its obligations to the fund. The securities lending agent has agreed to indemnify the fund in the
event of default by a third party borrower.
d. Income and Deferred Taxes
It is the Fund’s policy to qualify as a regulated investment company under the Internal Revenue
Code. The Fund intends to distribute to shareholders substantially all of its taxable income and
net realized gains to relieve it from federal income and excise taxes. As a result, no provision for
U.S. federal income taxes is required.
The Fund may be subject to foreign taxation related to income received, capital gains on the sale
of securities and certain foreign currency transactions in the foreign jurisdictions in which it
invests. Foreign taxes, if any, are recorded based on the tax regulations and rates that exist in the
foreign markets in which the Fund invests. When a capital gain tax is determined to apply the
Fund records an estimated deferred tax liability in an amount that would be payable if the securi-
ties were disposed of on the valuation date.
The Fund recognizes the tax benefits of uncertain tax positions only when the position is “more
likely than not” to be sustained upon examination by the tax authorities based on the technical
merits of the tax position. As of December 31, 2011, and for all open tax years, the Fund has
determined that no liability for unrecognized tax benefits is required in the Fund’s financial
statements related to uncertain tax positions taken on a tax return (or expected to be taken on
future tax returns). Open tax years are those that remain subject to examination and are based
on each tax jurisdiction statute of limitation.
e. Security Transactions, Investment Income, Expenses and Distributions
Security transactions are accounted for on trade date. Realized gains and losses on security trans-
actions are determined on a specific identification basis. Estimated expenses are accrued daily.
Dividend income is recorded on the ex-dividend date except that certain dividends from foreign
securities are recognized as soon as the Fund is notified of the ex-dividend date. Distributions to
shareholders are recorded on the ex-dividend date and are determined according to income tax
regulations (tax basis). Distributable earnings determined on a tax basis may differ from earnings
recorded in accordance with accounting principles generally accepted in the United States of
America. These differences may be permanent or temporary. Permanent differences are reclassi-
fied among capital accounts to reflect their tax character. These reclassifications have no impact
on net assets or the results of operations. Temporary differences are not reclassified, as they may
reverse in subsequent periods.
30 | Annual Report
Templeton Developing Markets Trust
Notes to Financial Statements (continued)
1. ORGANIZATION AND SIGNIFICANT ACCOUNTING POLICIES (continued)
e. Security Transactions, Investment Income, Expenses and Distributions (continued)
Realized and unrealized gains and losses and net investment income, not including class specific
expenses, are allocated daily to each class of shares based upon the relative proportion of net
assets of each class. Differences in per share distributions, by class, are generally due to differ-
ences in class specific expenses.
f. Accounting Estimates
The preparation of financial statements in accordance with accounting principles generally
accepted in the United States of America requires management to make estimates and assump-
tions that affect the reported amounts of assets and liabilities at the date of the financial
statements and the amounts of income and expenses during the reporting period. Actual results
could differ from those estimates.
g. Guarantees and Indemnifications
Under the Fund’s organizational documents, its officers and trustees are indemnified by the Fund
against certain liabilities arising out of the performance of their duties to the Fund. Additionally,
in the normal course of business, the Fund enters into contracts with service providers that con-
tain general indemnification clauses. The Fund’s maximum exposure under these arrangements is
unknown as this would involve future claims that may be made against the Fund that have not
yet occurred. Currently, the Fund expects the risk of loss to be remote.
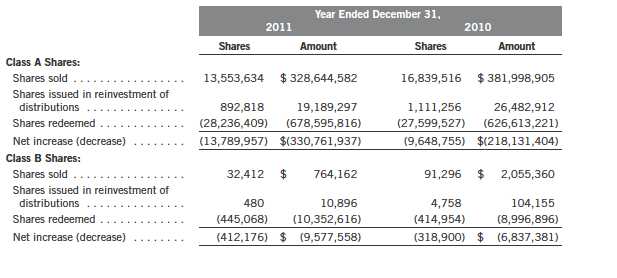
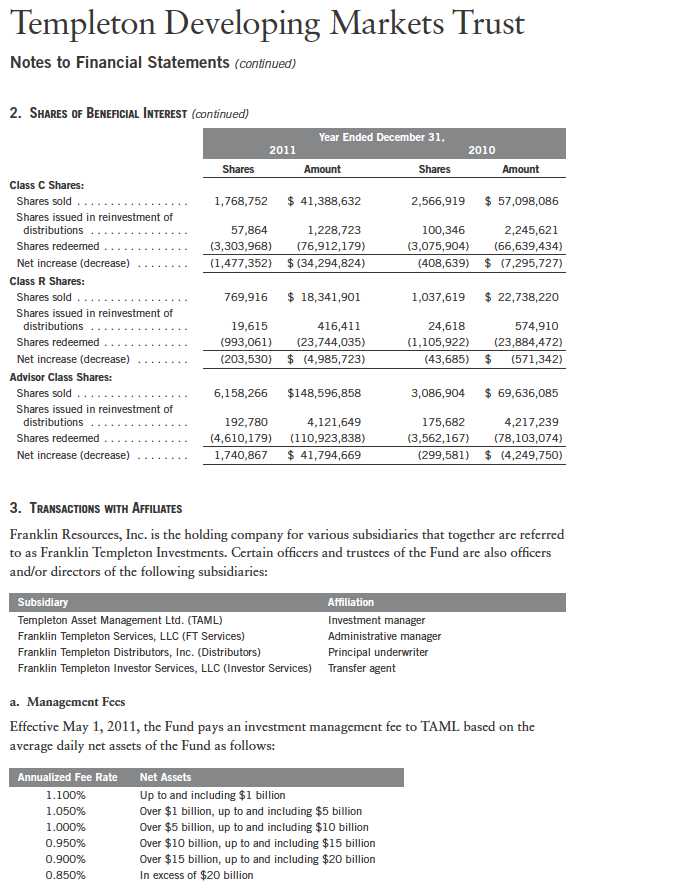
2. SHARES OF BENEFICIAL INTEREST
At December 31, 2011, there were an unlimited number of shares authorized (without par value).
Transactions in the Fund’s shares were as follows:
Annual Report | 31
32 | Annual Report
Templeton Developing Markets Trust
Notes to Financial Statements (continued)
3. TRANSACTIONS WITH AFFILIATES (continued)
a. Management Fees (continued)
Prior to May 1, 2011, the Fund paid fees to TAML based on the average daily net assets of the
Fund as follows:

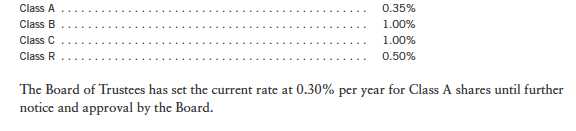
c. Distribution Fees
The Fund’s Board of Trustees has adopted distribution plans for each share class, with the excep-
tion of Advisor Class shares, pursuant to Rule 12b-1 under the 1940 Act. Under the Fund’s Class A
reimbursement distribution plan, the Fund reimburses Distributors for costs incurred in connec-
tion with the servicing, sale and distribution of the Fund’s shares up to the maximum annual plan
rate. Under the Class A reimbursement distribution plan, costs exceeding the maximum for the
current plan year cannot be reimbursed in subsequent periods.
In addition, under the Fund’s Class B, C and R compensation distribution plans, the Fund pays
Distributors for costs incurred in connection with the servicing, sale and distribution of the
Fund’s shares up to the maximum annual plan rate for each class.
The maximum annual plan rates, based on the average daily net assets, for each class, are as
follows:
Annual Report | 33
Templeton Developing Markets Trust
Notes to Financial Statements (continued)
3. TRANSACTIONS WITH AFFILIATES (continued)
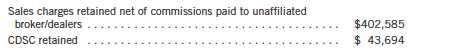
d. Sales Charges/Underwriting Agreements
Front-end sales charges and contingent deferred sales charges (CDSC) do not represent expenses
of the Fund. These charges are deducted from the proceeds of sales of Fund shares prior to invest-
ment or from redemption proceeds prior to remittance, as applicable. Distributors has advised the
Fund of the following commission transactions related to the sales and redemptions of the Fund’s
shares for the year:
e. Transfer Agent Fees
For the year ended December 31, 2011, the Fund paid transfer agent fees of $4,775,808, of which
$2,523,829 was retained by Investor Services.
4. EXPENSE OFFSET ARRANGEMENT
The Fund has entered into an arrangement with its custodian whereby credits realized as a result
of uninvested cash balances are used to reduce a portion of the Fund’s custodian expenses. During
the year ended December 31, 2011, there were no credits earned.
5. INCOME TAXES
For tax purposes, capital losses may be carried over to offset future capital gains, if any. Under
the Regulated Investment Company Modernization Act of 2010, capital losses incurred by the
Fund in taxable years beginning after December 22, 2010 are not subject to expiration and such
losses retain their character as either short-term or long-term, rather than being considered short-
term as under previous law. Post-enactment capital losses must be fully utilized prior to utilizing
any losses incurred in pre-enactment tax years.
At December 31, 2011, the Fund had capital loss carryforwards of $324,047,217 expiring in
2017. During the year ended December 31, 2011, the Fund utilized $146,840,220 of capital
loss carryforwards.
For tax purposes, the Fund may elect to defer any portion of a post-October capital loss to the
first day of the following fiscal year. At December 31, 2011, the Fund deferred post-October
capital losses of $14,959,865.
34 | Annual Report
Templeton Developing Markets Trust
Notes to Financial Statements (continued)
5. INCOME TAXES (continued)
The tax character of distributions paid during the years ended December 31, 2011 and 2010, was
as follows:
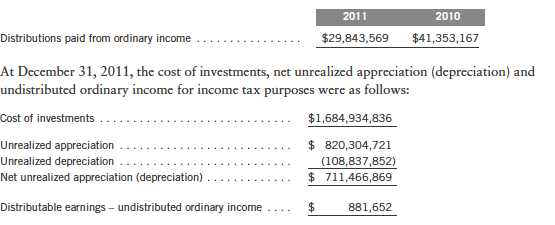
Differences between income and/or capital gains as determined on a book basis and a tax basis
are primarily due to differing treatments of foreign currency transactions, passive foreign
investment company shares, and corporate actions.
6. INVESTMENT TRANSACTIONS
Purchases and sales of investments (excluding short term securities) for the year ended December 31,
2011, aggregated $481,433,587 and $938,899,748, respectively.
7. INVESTMENTS IN INSTITUTIONAL FIDUCIARY TRUST MONEY MARKET PORTFOLIO
The Fund invests in the Institutional Fiduciary Trust Money Market Portfolio (Sweep Money
Fund), an open-end investment company managed by Franklin Advisers, Inc. (an affiliate of the
investment manager). Management fees paid by the Fund are reduced on assets invested in the
Sweep Money Fund, in an amount not to exceed the management and administrative fees paid by
the Sweep Money Fund.
8. CONCENTRATION OF RISK
Investing in foreign securities may include certain risks and considerations not typically associ-
ated with investing in U.S. securities, such as fluctuating currency values and changing local and
regional economic, political and social conditions, which may result in greater market volatility.
In addition, certain foreign securities may not be as liquid as U.S. securities.
Annual Report | 35
Templeton Developing Markets Trust
Notes to Financial Statements (continued)
9. RESTRICTED SECURITIES
The Fund invests in securities that are restricted under the Securities Act of 1933 (1933 Act) or
which are subject to legal, contractual, or other agreed upon restrictions on resale. Restricted
securities are often purchased in private placement transactions, and cannot be sold without prior
registration unless the sale is pursuant to an exemption under the 1933 Act. Disposal of these
securities may require greater effort and expense, and prompt sale at an acceptable price may be
difficult. The Fund may have registration rights for restricted securities. The issuer generally
incurs all registration costs.
At December 31, 2011, the Fund held investments in restricted securities, excluding certain secu-
rities exempt from registration under the 1933 Act deemed to be liquid, as follows:
11. CREDIT FACILITY
The Fund, together with other U.S. registered and foreign investment funds (collectively,
Borrowers), managed by Franklin Templeton Investments, are borrowers in a joint syndicated
senior unsecured credit facility totaling $750 million (Global Credit Facility) which matured on
January 20, 2012. This Global Credit Facility provides a source of funds to the Borrowers for
temporary and emergency purposes, including the ability to meet future unanticipated or unusu-
ally large redemption requests. Effective January 20, 2012, the Borrowers renewed the Global
Credit Facility for a total of $1.5 billion, maturing January 18, 2013.
36 | Annual Report
Templeton Developing Markets Trust
Notes to Financial Statements (continued)
11. CREDIT FACILITY (continued)
Under the terms of the Global Credit Facility, the Fund shall, in addition to interest charged on
any borrowings made by the Fund and other costs incurred by the Fund, pay its share of fees and
expenses incurred in connection with the implementation and maintenance of the Global Credit
Facility, based upon its relative share of the aggregate net assets of all of the Borrowers, including
an annual commitment fee of 0.08% based upon the unused portion of the Global Credit Facility,
which is reflected in other expenses on the Statement of Operations. During the year ended
December 31, 2011, the Fund did not use the Global Credit Facility.
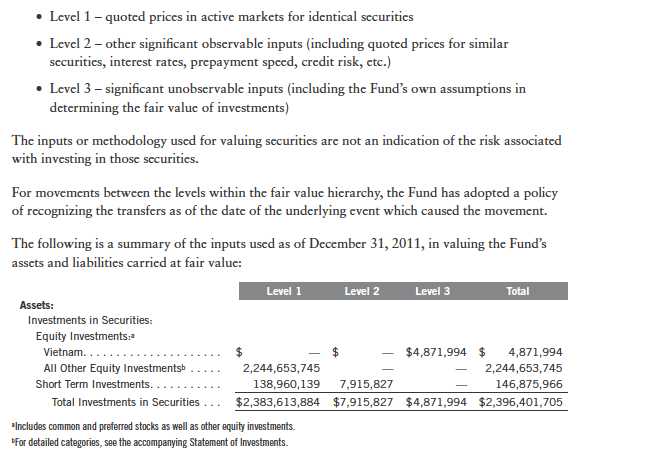
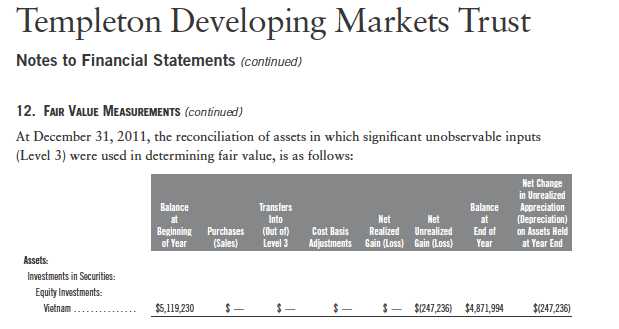
12. FAIR VALUE MEASUREMENTS
The Fund follows a fair value hierarchy that distinguishes between market data obtained from
independent sources (observable inputs) and the Fund’s own market assumptions (unobservable
inputs). These inputs are used in determining the value of the Fund’s investments and are summa-
rized in the following fair value hierarchy:
Annual Report | 37
13. NEW ACCOUNTING PRONOUNCEMENTS
In May 2011, the Financial Accounting Standards Board (FASB) issued Accounting Standards
Update (ASU) No. 2011-04, Fair Value Measurement (Topic 820): Amendments to Achieve
Common Fair Value Measurement and Disclosure Requirements in U.S. GAAP and IFRSs. The
amendments in the ASU will improve the comparability of fair value measurements presented and
disclosed in financial statements prepared in accordance with U.S. GAAP (Generally Accepted
Accounting Principles) and IFRS (International Financial Reporting Standards) and include new
guidance for certain fair value measurement principles and disclosure requirements. The ASU is
effective for interim and annual periods beginning after December 15, 2011. The Fund believes
the adoption of this ASU will not have a material impact on its financial statements.
14. SUBSEQUENT EVENTS
The Fund has evaluated subsequent events through the issuance of the financial statements and
determined that no events have occurred that require disclosure other than those already dis-
closed in the financial statements.
ABBREVIATIONS
Selected Portfolio
ADR - American Depositary Receipt
GDR - Global Depositary Receipt
38 | Annual Report
Templeton Developing Markets Trust
Report of Independent Registered Public Accounting Firm
To the Board of Trustees and Shareholders of Templeton Developing Markets Trust
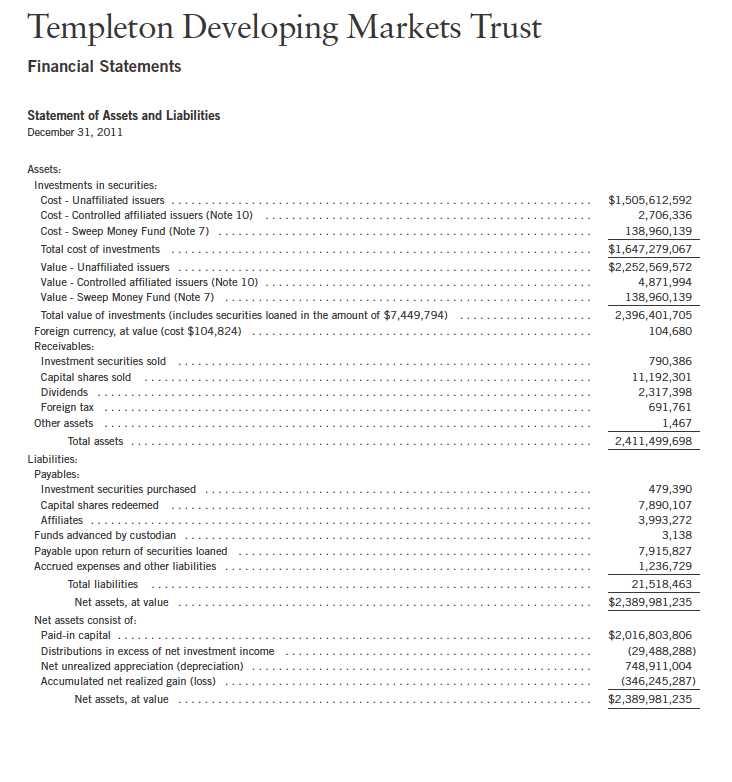
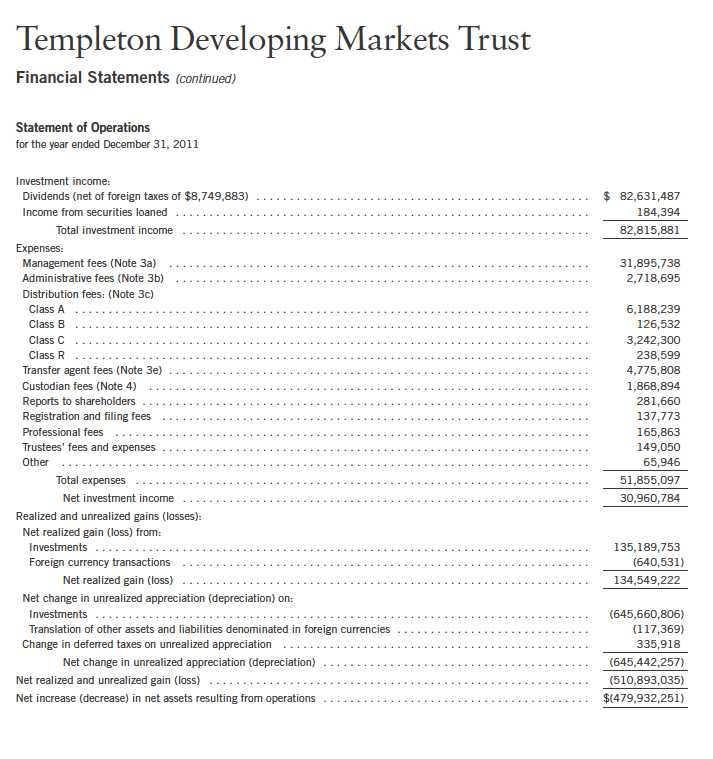
In our opinion, the accompanying statement of assets and liabilities, including the statement of
investments, and the related statements of operations and of changes in net assets and the
financial highlights present fairly, in all material respects, the financial position of Templeton
Developing Markets Trust (the “Fund”) at December 31, 2011, the results of its operations for
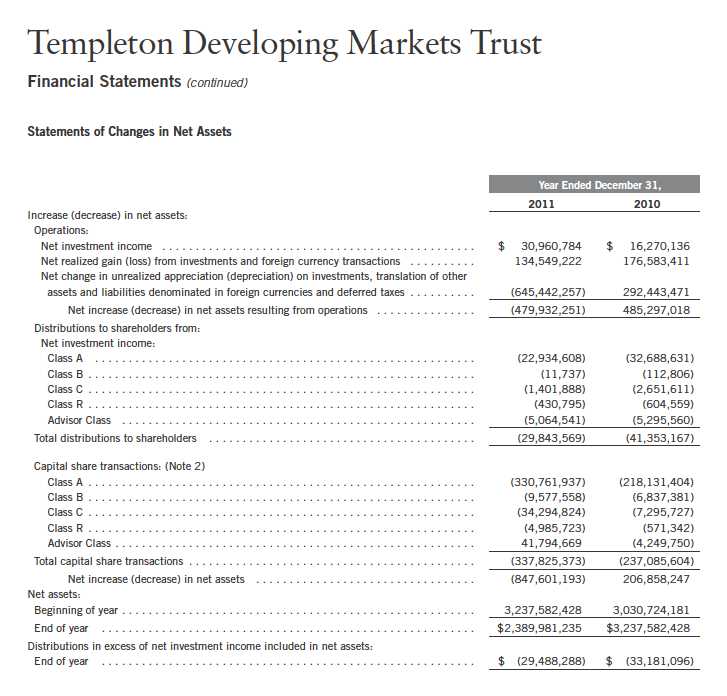
the year then ended, the changes in its net assets for each of the two years in the period then
ended and the financial highlights for each of the five years in the period then ended, in
conformity with accounting principles generally accepted in the United States of America. These
financial statements and financial highlights (hereafter referred to as “financial statements”) are
the responsibility of the Fund’s management. Our responsibility is to express an opinion on these
financial statements based on our audits. We conducted our audits of these financial statements
in accordance with the standards of the Public Company Accounting Oversight Board (United
States). Those standards require that we plan and perform the audit to obtain reasonable
assurance about whether the financial statements are free of material misstatement. An audit
includes examining, on a test basis, evidence supporting the amounts and disclosures in the
financial statements, assessing the accounting principles used and significant estimates made by
management, and evaluating the overall financial statement presentation. We believe that our
audits, which included confirmation of securities at December 31, 2011 by correspondence with
the custodian and brokers, provide a reasonable basis for our opinion.
PricewaterhouseCoopers LLP
San Francisco, California
February 15, 2012
Annual Report | 39
Templeton Developing Markets Trust
Tax Information (unaudited)
Under Section 854(b)(1)(B) of the Internal Revenue Code (Code), the Fund hereby reports the
maximum amount allowable but no less than $42,428,954 as qualified dividends for purposes of
the maximum rate under Section 1(h)(11) of the Code for the fiscal year ended December 31,
2011. Distributions, including qualified dividend income, paid during calendar year 2011 will be
reported to shareholders on Form 1099-DIV by mid-February 2012. Shareholders are advised
to check with their tax advisors for information on the treatment of these amounts on their indi-
vidual income tax returns.
At December 31, 2011, more than 50% of the Fund’s total assets were invested in securities of
foreign issuers. In most instances, foreign taxes were withheld from income paid to the Fund on
these investments. As shown in the table below, the Fund hereby reports to shareholders the
foreign source income and foreign taxes paid, pursuant to Section 853 of the Code. This written
statement will allow shareholders of record on December 22, 2011, to treat their proportionate
share of foreign taxes paid by the Fund, as having been paid directly by them. The shareholder
shall consider these amounts as foreign taxes paid in the tax year in which they receive the Fund
distribution.
The following table provides a detailed analysis of foreign tax paid, foreign source income, and
foreign qualified dividends as reported by the Fund, to Class A, Class B, Class C, Class R, and
Advisor Class shareholders of record.
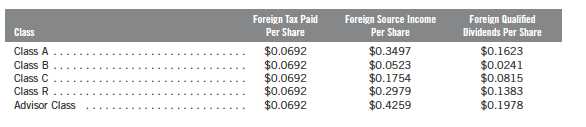
Foreign Tax Paid Per Share (Column 1) is the amount per share available to you, as a tax credit
(assuming you held your shares in the Fund for a minimum of 16 days during the 31-day period
beginning 15 days before the ex-dividend date of the Fund’s distribution to which the foreign
taxes relate), or, as a tax deduction.
Foreign Source Income Per Share (Column 2) is the amount per share of income dividends
attributable to foreign securities held by the Fund, plus any foreign taxes withheld on these divi-
dends. The amounts reported include foreign source qualified dividends that have not been
adjusted for the rate differential applicable to such dividend income.1
Foreign Qualified Dividends Per Share (Column 3) is the amount per share of foreign source
qualified dividends, plus any foreign taxes withheld on these dividends. These amounts represent
the portion of the Foreign Source Income reported to you in column 2 that were derived from
qualified foreign securities held by the Fund.1
40 | Annual Report
Templeton Developing Markets Trust
Tax Information (unaudited) (continued)
By mid-February 2012, shareholders will receive Form 1099-DIV which will include their share
of taxes paid and foreign source income distributed during the calendar year 2011. The Foreign
Source Income reported on Form 1099-DIV has not been adjusted for the rate differential on
foreign source qualified dividend income. Shareholders are advised to check with their tax
advisors for information on the treatment of these amounts on their 2011 individual income
tax returns.
1 Qualified dividends are taxed at reduced long term capital gains tax rates. In determining the amount of foreign tax credit that may be applied
against the U.S. tax liability of individuals receiving foreign source qualified dividends, adjustments may be required to the foreign tax credit limita-
tion calculation to reflect the rate differential applicable to such dividend income. The rules however permit certain individuals to elect not to apply
the rate differential adjustments for capital gains and/or dividends for any taxable year. Please consult your tax advisor and the instructions to
Form 1116 for more information.
Annual Report | 41
46 | Annual Report
Templeton Developing Markets Trust
Shareholder Information
Proxy Voting Policies and Procedures
The Trust’s investment manager has established Proxy Voting Policies and Procedures (Policies) that
the Trust uses to determine how to vote proxies relating to portfolio securities. Shareholders may
view the Trust’s complete Policies online at franklintempleton.com. Alternatively, shareholders may
request copies of the Policies free of charge by calling the Proxy Group collect at (954) 527-7678
or by sending a written request to: Franklin Templeton Companies, LLC, 300 S.E. 2nd Street,
Fort Lauderdale, FL 33301, Attention: Proxy Group. Copies of the Trust’s proxy voting records are
also made available online at franklintempleton.com and posted on the U.S. Securities and Exchange
Commission’s website at sec.gov and reflect the most recent 12-month period ended June 30.
Quarterly Statement of Investments
The Trust files a complete statement of investments with the U.S. Securities and Exchange Commission
for the first and third quarters for each fiscal year on Form N-Q. Shareholders may view the filed
Form N-Q by visiting the Commission’s website at sec.gov. The filed form may also be viewed and
copied at the Commission’s Public Reference Room in Washington, DC. Information regarding the
operations of the Public Reference Room may be obtained by calling (800) SEC-0330.
Householding of Reports and Prospectuses
You will receive the Fund’s financial reports every six months as well as an annual updated summary
prospectus (prospectus available upon request). To reduce Fund expenses, we try to identify related
shareholders in a household and send only one copy of the financial reports and summary prospectus.
This process, called “householding,” will continue indefinitely unless you instruct us otherwise. If
you prefer not to have these documents householded, please call us at (800) 632-2301. At any time
you may view current prospectuses/summary prospectuses and financial reports on our website. If
you choose, you may receive these documents through electronic delivery.
Annual Report | 47
This page intentionally left blank.
This page intentionally left blank.
This page intentionally left blank.
Item 2. Code of Ethics.
(a) The Registrant has adopted a code of ethics that applies to its principal executive officers and principal financial and accounting officer.
| (c) | N/A |
| (d) | N/A |
| (f) | Pursuant to Item 12(a)(1), the Registrant is attaching as an |
exhibit a copy of its code of ethics that applies to its principal executive officers and principal financial and accounting officer.
Item 3. Audit Committee Financial Expert.
(a)(1) The Registrant has an audit committee financial expert serving on its audit committee.
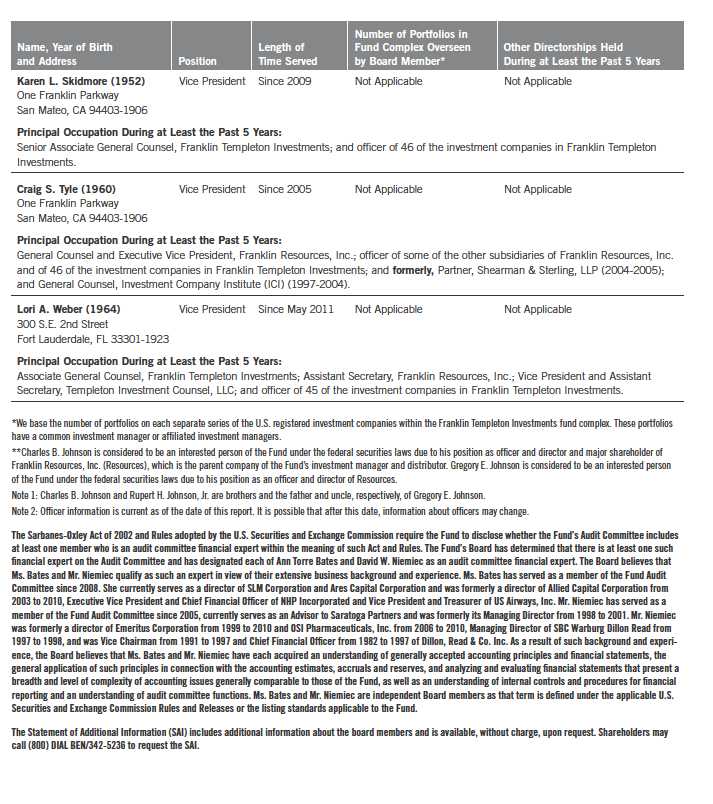
(2) The audit committee financial expert is David W. Niemiec and he is "independent" as defined under the relevant Securities and Exchange Commission Rules and Releases.
ITEM 4. Principal Accountant Fees and Services.
(a) Audit Fees
The aggregate fees paid to the principal accountant for professional services rendered by the principal accountant for the audit of the registrant’s annual financial statements or for services that are normally provided by the principal accountant in connection with statutory and regulatory filings or engagements were $48,262 for the fiscal year ended December 31, 2011 and $48,715 for the fiscal year ended December 31, 2010.
(b) Audit-Related Fees
There were no fees paid to the principal accountant for assurance and related services rendered by the principal accountant to the registrant that are reasonably related to the performance of the audit of the registrant's financial statements and are not reported under paragraph (a) of Item 4.
There were no fees paid to the principal accountant for assurance and related services rendered by the principal accountant to the registrant's investment adviser and any entity controlling, controlled by or under common control with the investment adviser that provides ongoing services to the registrant that are reasonably related to the performance of the audit of their financial statements.
(c) Tax Fees
The aggregate fees paid to the principal accountant for professional services rendered by the principal accountant to the registrant for tax compliance, tax advice and tax planning were $1,305 the fiscal year ended December 31, 2011 and $1,290 for the fiscal year ended December
31, 2010. The services for which these fees were paid included preparation of tax returns for foreign governments.
The aggregate fees paid to the principal accountant for professional services rendered by the principal accountant to the registrant’s investment adviser and any entity controlling, controlled by or under common control with the investment adviser that provides ongoing services to the registrant for tax compliance, tax advice and tax planning were $100,000 for the fiscal year ended December 31, 2011 and $35,000 for the fiscal year ended December 31, 2010. The services for which these fees were paid included technical tax consultation for capital gain tax reporting to foreign governments and derivative instruments.
(d) All Other Fees
The aggregate fees paid to the principal accountant for products and services rendered by the principal accountant to the registrant not reported in paragraphs (a)-(c) of Item 4 were $0 for the fiscal year ended December 31, 2011 and $1,150 for the fiscal year ended December 31, 2010. The services for which these fees were paid include review of materials provided to the fund Board in connection with the investment management contract renewal process.
The aggregate fees paid to the principal accountant for products and services rendered by the principal accountant to the registrant’s investment adviser and any entity controlling, controlled by or under common control with the investment adviser that provides ongoing services to the registrant other than services reported in paragraphs (a)-(c) of Item 4 were $0 for the fiscal year ended December 31, 2011 and $143,650 for the fiscal year ended December 31, 2010. The services for which these fees were paid include review of materials provided to the fund Board in connection with the investment management contract renewal process.
(e) (1) The registrant’s audit committee is directly responsible for approving the services to be provided by the auditors, including:
| (i) | pre-approval of all audit and audit related services; |
| (ii) | pre-approval of all non-audit related services to be |
provided to the Fund by the auditors;
(iii) pre-approval of all non-audit related services to be provided to the registrant by the auditors to the registrant’s investment adviser or to any entity that controls, is controlled by or is under common control with the registrant’s investment adviser and that provides ongoing services to the registrant where the non-audit services relate directly to the operations or financial reporting of the registrant; and
(iv) establishment by the audit committee, if deemed necessary or appropriate, as an alternative to committee pre-approval of services to be provided by the auditors, as required by paragraphs (ii) and (iii) above, of policies and procedures to permit such services to be pre-approved by other means, such as through establishment of guidelines or by action of a designated member or members of the committee; provided the policies and procedures are detailed as to the
particular service and the committee is informed of each service and
such policies and procedures do not include delegation of audit
committee responsibilities, as contemplated under the Securities
Exchange Act of 1934, to management; subject, in the case of (ii)
through (iv), to any waivers, exceptions or exemptions that may be
available under applicable law or rules.
(e) (2) None of the services provided to the registrant described in
paragraphs (b)-(d) of Item 4 were approved by the audit committee
pursuant to paragraph (c)(7)(i)(C) of Rule 2-01 of regulation S-X.
(f) No disclosures are required by this Item 4(f).
(g) The aggregate non-audit fees paid to the principal accountant for
services rendered by the principal accountant to the registrant and the
registrant’s investment adviser and any entity controlling, controlled
by or under common control with the investment adviser that provides
ongoing services to the registrant were $101,305 for the fiscal year
ended December 31, 2011 and $181,090 for the fiscal year ended December
31, 2010.
(h) The registrant’s audit committee of the board has considered
whether the provision of non-audit services that were rendered to the
registrant’s investment adviser (not including any sub-adviser whose
role is primarily portfolio management and is subcontracted with or
overseen by another investment adviser), and any entity controlling,
controlled by, or under common control with the investment adviser that
provides ongoing services to the registrant that were not pre-approved
pursuant to paragraph (c)(7)(ii) of Rule 2-01 of Regulation S-X is
compatible with maintaining the principal accountant’s independence.
Item 5. Audit Committee of Listed Registrants. N/A
Item 6. Schedule of Investments. N/A
Item 7. Disclosure of Proxy Voting Policies and Procedures for
Closed-End Management Investment Companies. N/A
Item 8. Portfolio Managers of Closed-End Management Investment
Companies. N/A
Item 9. Purchases of Equity Securities by Closed-End Management
Investment Company and Affiliated Purchasers. N/A
Item 10. Submission of Matters to a Vote of Security Holders.
There have been no changes to the procedures by which shareholders may
recommend nominees to the Registrant's Board of Trustees that would
require disclosure herein.
Item 11. Controls and Procedures.
(a) Evaluation of Disclosure Controls and Procedures. The Registrant maintains disclosure controls and procedures that are designed to ensure that information required to be disclosed in the Registrant’s filings under the Securities Exchange Act of 1934 and the Investment Company Act of 1940 is recorded, processed, summarized and reported within the periods specified in the rules and forms of the Securities and Exchange Commission. Such information is accumulated and communicated to the Registrant’s management, including its principal executive officer and principal financial officer, as appropriate, to allow timely decisions regarding required disclosure. The Registrant’s management, including the principal executive officer and the principal financial officer, recognizes that any set of controls and procedures, no matter how well designed and operated, can provide only reasonable assurance of achieving the desired control objectives.
Within 90 days prior to the filing date of this Shareholder Report on Form N-CSR, the Registrant had carried out an evaluation, under the supervision and with the participation of the Registrant’s management, including the Registrant’s principal executive officer and the Registrant’s principal financial officer, of the effectiveness of the design and operation of the Registrant’s disclosure controls and procedures. Based on such evaluation, the Registrant’s principal executive officer and principal financial officer concluded that the Registrant’s disclosure controls and procedures are effective.
(b) Changes in Internal Controls. There have been no significant changes in the Registrant’s internal controls or in other factors that could significantly affect the internal controls subsequent to the date of their evaluation in connection with the preparation of this Shareholder Report on Form N-CSR.
Item 12. Exhibits.
(a)(1) Code of Ethics
(a)(2) Certifications pursuant to Section 302 of the Sarbanes-Oxley Act of 2002 of Laura F. Fergerson, Chief Executive Officer - Finance and Administration, and Mark H. Otani, Chief Financial Officer and Chief Accounting Officer
(b) Certifications pursuant to Section 906 of the Sarbanes-Oxley Act of 2002 of Laura F. Fergerson, Chief Executive Officer - Finance and Administration, and Mark H. Otani, Chief Financial Officer and Chief Accounting Officer
SIGNATURES
Pursuant to the requirements of the Securities Exchange Act of 1934 and the Investment Company Act of 1940, the registrant has duly caused this report to be signed on its behalf by the undersigned, thereunto duly authorized.
TEMPLETON DEVELOPING MARKETS TRUST
By /s/ LAURA F. FERGERSON
Laura F. Fergerson
Chief Executive Officer –
Finance and Administration
Date February 24, 2012
Pursuant to the requirements of the Securities Exchange Act of 1934 and the Investment Company Act of 1940, this report has been signed below by the following persons on behalf of the registrant and in the capacities and on the dates indicated.
By /s/ LAURA F. FERGERSON
Laura F. Fergerson
Chief Executive Officer –
Finance and Administration
Date February 24, 2012
By /s/ MARK H. OTANI
Mark H. Otani
Chief Financial Officer and
Chief Accounting Officer
Date February 24, 2012