UNITED STATES
SECURITIES AND EXCHANGE COMMISSION
Washington, DC 20549
FORM N-CSR
CERTIFIED SHAREHOLDER REPORT OF REGISTERED MANAGEMENT INVESTMENT COMPANIES
Investment Company Act file number 811-06378
Templeton Developing Markets Trust
(Exact name of registrant as specified in charter)
300 S.E. 2nd Street, Fort Lauderdale, FL 33301-1923
(Address of principal executive offices) (Zip code)
Craig S. Tyle, One Franklin Parkway, San Mateo, CA 94403-1906
(Name and address of agent for service)
Registrant's telephone number, including area code: (954) 527-7500
Date of fiscal year end: _12/31__
Date of reporting period: 12/31/14_
Item 1. Reports to Stockholders.

Annual Report and Shareholder Letter
December 31, 2014
Templeton Developing Markets Trust

Sign up for electronic delivery at franklintempleton.com/edelivery
Franklin Templeton Investments
Gain From Our Perspective®
At Franklin Templeton Investments, we’re dedicated to one goal: delivering exceptional asset management for our clients. By bringing together multiple, world-class investment teams in a single firm, we’re able to offer specialized expertise across styles and asset classes, all supported by the strength and resources of one of the world’s largest asset managers. This has helped us to become a trusted partner to individual and institutional investors across the globe.
Focus on Investment Excellence
At the core of our firm, you’ll find multiple independent investment teams—each with a focused area of expertise—from traditional to alternative strategies and multi-asset solutions. And because our portfolio groups operate autonomously, their strategies can be combined to deliver true style and asset class diversification.
All of our investment teams share a common commitment to excellence grounded in rigorous, fundamental research and robust, disciplined risk management. Decade after decade, our consistent, research-driven processes have helped Franklin Templeton earn an impressive record of strong, long-term results.
Global Perspective Shaped by Local Expertise
In today’s complex and interconnected world, smart investing demands a global perspective. Franklin Templeton pioneered international investing over 60 years ago, and our expertise in emerging markets spans more than a quarter of a century. Today, our investment professionals are on the ground across the globe, spotting investment ideas and potential risks firsthand. These locally based teams bring in-depth understanding of local companies, economies and cultural nuances, and share their best thinking across our global research network.
Strength and Experience
Franklin Templeton is a global leader in asset management serving clients in over 150 countries.1 We run our business with the same prudence we apply to asset management, staying focused on delivering relevant investment solutions, strong long-term results and reliable, personal service. This approach, focused on putting clients first, has helped us to become one of the most trusted names in financial services.
1. As of 12/31/13. Clients are represented by the total number of shareholder accounts.
Not FDIC Insured | May Lose Value | No Bank Guarantee
| |
| Contents | |
| |
| Shareholder Letter | 1 |
| Annual Report | |
| Templeton Developing Markets Trust | 3 |
| Performance Summary | 7 |
| Your Fund’s Expenses | 12 |
| Financial Highlights and | |
| Statement of Investments | 14 |
| Financial Statements | 22 |
| Notes to Financial Statements | 26 |
| Report of Independent Registered | |
| Public Accounting Firm | 35 |
| Tax Information | 36 |
| Board Members and Officers | 37 |
| Shareholder Information | 42 |
Annual Report
Templeton Developing Markets Trust
This annual report for Templeton Developing Markets Trust covers the fiscal year ended December 31, 2014.
Your Fund’s Goal and Main Investments
The Fund seeks long-term capital appreciation. Under normal market conditions, the Fund invests at least 80% of its net assets in securities of companies located or operating in “developing market countries,” as defined in the Fund’s prospectus.
Economic and Market Overview
The global economy grew moderately during the 12 months under review as many developed markets continued to recover and many emerging markets continued to expand. Although several emerging market countries faced headwinds such as soft domestic demand, weak exports and geopolitical crises, emerging market economies overall continued to grow faster than developed market economies. China’s economy stabilized in 2014 as fiscal and monetary stimulus measures implemented in the year’s second half gained traction. Strength in production and consumer spending offset weakness in fixed-asset investment. Domestic demand continued to account for a greater portion of China’s gross domestic product, as the government’s market friendly policies supported new economic drivers. Emerging market countries showing signs of economic improvement included India, Poland and Mexico, while others, including Russia, South Africa and South Korea, showed signs of moderation. Although Brazil exited recession as government spending drove third-quarter economic growth, it continued to face headwinds such as lower commodity prices.
Central bank actions varied across emerging markets. Several central banks, including those of Russia, Brazil and South Africa, raised interest rates in response to rising inflation and weakening currencies. In contrast, the central banks of Chile, Mexico and South Korea lowered interest rates to promote economic growth. After raising interest rates early in the year to support the Turkish lira, Turkey’s central bank began easing monetary policy to boost economic growth. The People’s Bank of China cut its benchmark interest rate for the first time since July 2012.

Emerging markets experienced volatility in 2014 amid concerns about the U.S. Federal Reserve Board’s (Fed’s) timing of interest rate increases, moderating global economic growth and geopolitical tensions in several regions. Also weighing on investor sentiment was a sharp decline in crude oil prices, which pressured several oil-producing countries’ financial positions and currencies. However, India’s and Indonesia’s announced economic reforms following their national elections, China’s fiscal and monetary stimulus measures, the European Central Bank’s monetary easing and the Fed’s accommodative policy provided investors with some optimism.
For the 12 months ended December 31, 2014, emerging market stocks, as measured by the MSCI Emerging Markets (EM) Index, rose 5.57% in local currency terms, as many investors seemed to focus on the relatively attractive valuations of many emerging market stocks.1 However, weak local currencies led to a 1.82% decline in U.S. dollar terms.1 European emerging markets overall underperformed, as did Latin America. Asia generally performed well, as many countries in the region delivered double-digit gains. In addition, the Middle East and Africa region produced solid returns.
1. Source: Morningstar.
The indexes are unmanaged and include reinvested dividends. One cannot invest directly in an index, and an index is not representative of the Fund’s portfolio.
The dollar value, number of shares or principal amount, and names of all portfolio holdings are listed in the Fund’s Statement of Investments (SOI).
The SOI begins on page 19.
franklintempleton.com
Annual Report
| 3
TEMPLETON DEVELOPING MARKETS TRUST
Investment Strategy
We employ a fundamental research, value-oriented, long-term investment approach. We focus on the market price of a company’s securities relative to our evaluation of its long-term earnings, asset value and cash flow potential. We also consider a company’s profit and loss outlook, balance sheet strength, cash flow trends and asset value in relation to the current price. Our analysis considers the company’s corporate governance behavior as well as its position in its sector, the economic framework and political environment. We invest in securities without regard to benchmark comparisons.
Performance Overview
The Fund’s Class A shares had a -8.11% cumulative total return for the 12 months ended December 31, 2014. In comparison, the MSCI EM Index had a -1.82% total return, and the Standard & Poor’s®/International Finance Corporation Investable (S&P®/IFCI) Composite Index had a -1.12% total return for the same period.1 The indexes measure global emerging market stock performance. Please note index performance is provided for reference and we do not attempt to track an index but rather undertake investments on the basis of fundamental research. In addition, the Fund’s return reflects the effect of fees and expenses for professional management, while an index does not have such costs. You can find the Fund’s long-term performance data in the Performance Summary beginning on page 7.
Performance data represent past performance, which does not guarantee future results. Investment return and principal value will fluctuate, and you may have a gain or loss when you sell your shares. Current performance may differ from figures shown. Please visit franklintempleton.com or call (800) 342-5236 for most recent month-end performance.
Manager’s Discussion
During the year under review, key contributors to the Fund’s absolute performance included Emaar Properties, Remgro and TSMC (Taiwan Semiconductor Manufacturing Co.).
Emaar Properties is a major property developer and manager with operations throughout the Middle East, notably in Dubai, United Arab Emirates (UAE). Dubai’s rising tourism boosted Emaar’s hotel and retail operations, and a property sector recovery in the earlier part of the year also supported the company’s operations. The UAE’s inclusion in the MSCI EM Index in June further boosted Emaar’s share price. However, signs of a property price decline in the emirate during the final months of 2014 led to a share price correction.
| | |
| Top 10 Countries | | |
| 12/31/14 | | |
| | % of Total | |
| | Net Assets | |
| China | 21.1 | % |
| South Africa | 12.2 | % |
| Thailand | 11.2 | % |
| India | 11.2 | % |
| Brazil | 8.2 | % |
| Belgium | 3.8 | % |
| U.K. | 3.6 | % |
| Indonesia | 3.6 | % |
| Taiwan | 3.2 | % |
| South Korea | 3.1 | % |
Remgro is a South African conglomerate with a diversified portfolio of financial and industrial assets that we believe provides an attractive means to address growth in the South African and broader African economies. The share price appreciation during the year, in our view, reflected investors’ confidence in Africa’s financials and industrials sectors, while sentiment in the commodity sector remained relatively weaker.
TSMC, the world’s largest independent integrated circuit foundry, showed strong growth in the past few years, resulting from increased demand for chips used in mobile devices such as smartphones and tablets. Strong corporate results, management updates suggesting rising market share and progress in the commercialization of the most advanced technology supported the company’s share price performance.
In contrast, key detractors from the Fund’s absolute performance included Petrobras (Petroleo Brasileiro), Avon Products and SJM Holdings.
Petrobras, a new holding this period, is Brazil’s main oil and gas producer, refiner and distributor. The company’s links with government and political figures were scrutinized in the final quarter of 2014 amid accusations of bribery and corrupt practices. Delays in the release of third-quarter results and the sharp decline in oil and gas prices also weighed on sentiment. The decision of the Organization of the Petroleum Exporting Countries to maintain oil production levels despite a global oversupply led prices to fall more than 40% in 2014’s fourth quarter.
Avon Products is a U.S.-listed global cosmetics company with substantial operations in various emerging market countries, most notably Brazil. Its third-quarter corporate results,
4 | Annual Report
franklintempleton.com
impacted by Brazil’s sluggish economy, disappointed investors. Concerns about the company’s ability to service its substantial debts in a weak market environment led two major rating agencies to downgrade the company’s debt rating to below investment grade, further weighing on investor sentiment. Also pressuring shares were the economic and currency crises in Russia, another substantial market for the company.
SJM Holdings, a Hong Kong-listed, Macau-based gaming and entertainment company, lost ground in 2014 after strong stock performance in 2013, as the Chinese government’s anti-corruption and anti-extravagance policies negatively affected casino revenues. Macau’s annual gambling revenues declined in 2014 for the first time since China liberalized the administrative region’s casinos in 2001.
It is important to recognize the effect of currency movements on the Fund’s performance. In general, if the value of the U.S. dollar goes up compared with a foreign currency, an investment traded in that foreign currency will go down in value because it will be worth fewer U.S. dollars. This can have a negative effect on Fund performance. Conversely, when the U.S. dollar weakens in relation to a foreign currency, an investment traded in that foreign currency will increase in value, which can contribute to Fund performance. For the 12 months ended December 31, 2014, the U.S. dollar rose in value relative to most currencies. As a result, the Fund’s performance was negatively affected by the portfolio’s investment predominantly in securities with non-U.S. currency exposure.
In the past 12 months, we increased the Fund’s holdings largely in Thailand, South Africa, India, Indonesia and China via China H, Red Chip and P Chip shares as we continued to search for investment opportunities we considered to be attractive.2 We initiated investments in several markets, including Greece and Peru, and made some purchases in other emerging markets, including Turkey and Taiwan. Additionally, we made some purchases in developed market countries, such as the U.S. and Belgium, where we identified select companies with significant emerging market operations. In sector terms, we increased the Fund’s holdings mainly in materials, energy, financials and health care.3 Key purchases included new
TEMPLETON DEVELOPING MARKETS TRUST
| | |
| Top 10 Holdings | | |
| 12/31/14 | | |
| Company | % of Total | |
| Sector/Industry, Country | Net Assets | |
| Remgro Ltd. | 5.3 | % |
| Diversified Financial Services, South Africa | | |
| Tata Consultancy Services Ltd. | 4.8 | % |
| IT Services, India | | |
| Naspers Ltd., N | 4.5 | % |
| Media, South Africa | | |
| Siam Commercial Bank PCL, fgn. | 4.3 | % |
| Banks, Thailand | | |
| Brilliance China Automotive Holdings Ltd. | 4.2 | % |
| Automobiles, China | | |
| Itau Unibanco Holding SA, ADR | 3.8 | % |
| Banks, Brazil | | |
| Anheuser-Busch InBev NV | 3.8 | % |
| Beverages, Belgium | | |
| Unilever PLC | 3.6 | % |
| Food Products, U.K. | | |
| TSMC (Taiwan Semiconductor Manufacturing Co.) Ltd. | 3.2 | % |
| Semiconductors & Semiconductor Equipment, Taiwan | | |
| China Construction Bank Corp., H | 3.2 | % |
| Banks, China | | |
positions in Itau Unibanco Holding, a leading Brazilian commercial bank; Brilliance China Automotive Holdings, a major Chinese automobile manufacturer with a joint venture with BMW; and Naspers, a South Africa-based multinational media group.
Conversely, we reduced the Fund’s investments in Hong Kong, the UAE, Macau and Brazil to focus on stocks we considered to be more attractively valued within our investment universe. We also eliminated exposures to several countries, including Nigeria and Singapore. In sector terms, some of the largest sales were in consumer staples and consumer discretionary.4 Key sales included a reduction of the Fund’s holding in Emaar Properties. We closed the Fund’s positions in Ambev, a Brazil-based global beer and soft drink producer, and British American Tobacco, a U.K.-listed global tobacco company. Additionally, we closed the Fund’s positions in a number of Macau casino resort operators, including Sands China, Melco Crown Entertainment and SJM Holdings, mentioned earlier.
2. “China H” denotes shares of China-incorporated, Hong Kong Stock Exchange-listed companies with most businesses in China. “Red Chip” denotes shares of Hong Kong
Stock Exchange-listed companies substantially owned by Chinese mainland state entities, with significant exposure to China. “P Chip” denotes shares of Hong Kong Stock
Exchange-listed companies controlled by Chinese mainland individuals and incorporated outside of China, with a majority of their business in China.
3. The materials sector comprises chemicals, construction materials, and metals and mining in the SOI. The energy sector comprises oil, gas and consumable fuels in the
SOI. The financials sector comprises banks, diversified financial services, insurance, and real estate management and development in the SOI. The health care sector
comprises biotechnology and pharmaceuticals in the SOI.
4. The consumer staples sector comprises beverages, food products, food and staples retailing, personal products and tobacco in the SOI. The consumer discretionary
sector comprises automobiles; hotels, restaurants and leisure; media; specialty retail; and textiles, apparel and luxury goods in the SOI.
See www.franklintempletondatasources.com for additional data provider information.
franklintempleton.com
Annual Report
| 5
TEMPLETON DEVELOPING MARKETS TRUST
We thank you for your continued participation in Templeton Developing Markets Trust and look forward to serving your future investment needs.


Mark Mobius Executive Chairman Templeton Emerging Markets Group
Tom Wu
Dennis Lim
Allan Lam, CPA
Portfolio Management Team
The foregoing information reflects our analysis, opinions and portfolio holdings as of December 31, 2014, the end of the reporting period. The way we implement our main investment strategies and the resulting portfolio holdings may change depending on factors such as market and economic conditions. These opinions may not be relied upon as investment advice or an offer for a particular security. The information is not a complete analysis of every aspect of any market, country, industry, security or the Fund. Statements of fact are from sources considered reliable, but the investment manager makes no representation or warranty as to their completeness or accuracy. Although historical performance is no guarantee of future results, these insights may help you understand our investment management philosophy.
6 | Annual Report
franklintempleton.com
TEMPLETON DEVELOPING MARKETS TRUST
Performance Summary as of December 31, 2014
Your dividend income will vary depending on dividends or interest paid by securities in the Fund’s portfolio, adjusted for operating expenses of each class. Capital gain distributions are net profits realized from the sale of portfolio securities. The performance table and graphs do not reflect any taxes that a shareholder would pay on Fund dividends, capital gain distributions, if any, or any realized gains on the sale of Fund shares. Total return reflects reinvestment of the Fund’s dividends and capital gain distributions, if any, and any unrealized gains or losses.
| | | | | | |
| Net Asset Value | | | | | | |
| Share Class (Symbol) | | 12/31/14 | | 12/31/13 | | Change |
| A (TEDMX) | $ | 17.09 | $ | 22.86 | -$ | 5.77 |
| C (TDMTX) | $ | 16.62 | $ | 22.32 | -$ | 5.70 |
| R (TDMRX) | $ | 16.80 | $ | 22.55 | -$ | 5.75 |
| R6 (FDEVX) | $ | 16.99 | $ | 22.76 | -$ | 5.77 |
| Advisor (TDADX) | $ | 17.01 | $ | 22.77 | -$ | 5.76 |
| |
| |
| Distributions (1/1/14–12/31/14) | | | | | | |
| | | Dividend | | Long-Term | | |
| | | Income | | Capital Gain | | Total |
| A | $ | 0.3274 | $ | 3.6201 | $ | 3.9475 |
| C | $ | 0.1668 | $ | 3.6201 | $ | 3.7869 |
| R | $ | 0.2845 | $ | 3.6201 | $ | 3.9046 |
| R6 | $ | 0.4351 | $ | 3.6201 | $ | 4.0552 |
| Advisor | $ | 0.3947 | $ | 3.6201 | $ | 4.0148 |
franklintempleton.com
Annual Report
| 7
TEMPLETON DEVELOPING MARKETS TRUST
PERFORMANCE SUMMARY
Performance as of 12/31/141
Cumulative total return excludes sales charges. Average annual total returns and value of $10,000 investment include maximum sales charges. Class A: 5.75% maximum initial sales charge; Class C: 1% contingent deferred sales charge in first year only; Class R/R6/Advisor Class: no sales charges.
| | | | | | | | | | | | |
| | | Cumulative | | | Average Annual | | | Value of $10,000 | Total Annual Operating Expenses5 | |
| Share Class | | Total Return2 | | | Total Return3 | | | Investment4 | (with waiver) | | (without waiver) | |
| A | | | | | | | | | 1.71 | % | 1.71 | % |
| 1-Year | | -8.11 | % | | -13.37 | % | $ | 8,663 | | | | |
| 5-Year | + | 1.46 | % | | -0.89 | % | $ | 9,565 | | | | |
| 10-Year | + | 72.25 | % | + | 4.96 | % | $ | 16,235 | | | | |
| C | | | | | | | | | 2.44 | % | 2.44 | % |
| 1-Year | | -8.71 | % | | -9.46 | % | $ | 9,054 | | | | |
| 5-Year | | -2.11 | % | | -0.43 | % | $ | 9,789 | | | | |
| 10-Year | + | 60.38 | % | + | 4.84 | % | $ | 16,038 | | | | |
| R | | | | | | | | | 1.94 | % | 1.94 | % |
| 1-Year | | -8.32 | % | | -8.32 | % | $ | 9,168 | | | | |
| 5-Year | + | 0.52 | % | + | 0.10 | % | $ | 10,052 | | | | |
| 10-Year | + | 68.97 | % | + | 5.39 | % | $ | 16,897 | | | | |
| R6 | | | | | | | | | 1.28 | % | 1.30 | % |
| 1-Year | | -7.66 | % | | -7.66 | % | $ | 9,234 | | | | |
| Since Inception (5/1/13) | | -9.40 | % | | -5.74 | % | $ | 9,060 | | | | |
| Advisor | | | | | | | | | 1.44 | % | 1.44 | % |
| 1-Year | | -7.79 | % | | -7.79 | % | $ | 9,221 | | | | |
| 5-Year | + | 2.89 | % | + | 0.57 | % | $ | 10,289 | | | | |
| 10-Year | + | 77.20 | % | + | 5.89 | % | $ | 17,720 | | | | |
Performance data represent past performance, which does not guarantee future results. Investment return and principal value will
fluctuate, and you may have a gain or loss when you sell your shares. Current performance may differ from figures shown. For most
recent month-end performance, go to franklintempleton.com or call (800) 342-5236.
8 | Annual Report
franklintempleton.com
TEMPLETON DEVELOPING MARKETS TRUST
PERFORMANCE SUMMARY
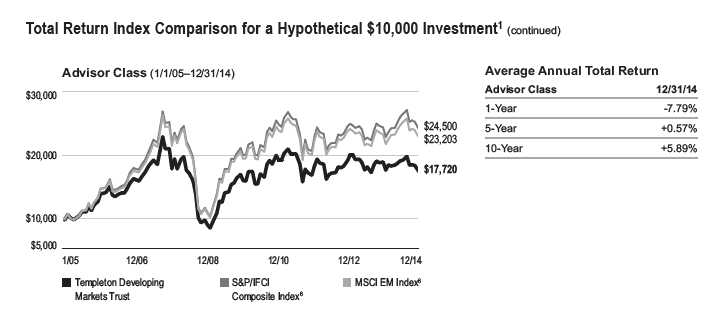
Total Return Index Comparison for a Hypothetical $10,000 Investment1
Total return represents the change in value of an investment over the periods shown. It includes any applicable maximum sales charge, Fund expenses, account fees and reinvested distributions. The unmanaged indexes include reinvestment of any income or distributions. They differ from the Fund in composition and do not pay management fees or expenses. One cannot invest directly in an index.

franklintempleton.com Annual Report | 9
TEMPLETON DEVELOPING MARKETS TRUST
PERFORMANCE SUMMARY
Total Return Index Comparison for a Hypothetical $10,000 Investment1 (continued)

10 | Annual Report franklintempleton.com
TEMPLETON DEVELOPING MARKETS TRUST
PERFORMANCE SUMMARY
All investments involve risks, including possible loss of principal. Special risks are associated with foreign investing, including currency fluctuations, economic
instability and political developments. Investments in developing markets, of which frontier markets are a subset, involve heightened risks related to the same
factors, in addition to those associated with these markets’ smaller size, lesser liquidity and lack of established legal, political, business and social frameworks
to support securities markets. Because these frameworks are typically even less developed in frontier markets, as well as various factors including the increased
potential for extreme price volatility, illiquidity, trade barriers and exchange controls, the risks associated with developing markets are magnified in frontier mar-
kets. The Fund is designed for the aggressive portion of a well-diversified portfolio. The Fund is actively managed but there is no guarantee that the manager’s
investment decisions will produce the desired results. The Fund’s prospectus also includes a description of the main investment risks.
Class C: These shares have higher annual fees and expenses than Class A shares.
Class R: Shares are available to certain eligible investors as described in the prospectus. These shares have higher annual fees and expenses than Class A shares.
Class R6: Shares are available to certain eligible investors as described in the prospectus.
Advisor Class: Shares are available to certain eligible investors as described in the prospectus.
1. The Fund has a fee waiver associated with its investments in a Franklin Templeton money fund, contractually guaranteed through at least its current fiscal year-end.
Class R6 shares have a fee waiver contractually guaranteed through at least 4/30/15. Fund investment results reflect the fee waivers, to the extent applicable; without these
reductions, the results would have been lower.
2. Cumulative total return represents the change in value of an investment over the periods indicated.
3. Average annual total return represents the average annual change in value of an investment over the periods indicated.
4. These figures represent the value of a hypothetical $10,000 investment in the Fund over the periods indicated.
5. Figures are as stated in the Fund’s current prospectus. In periods of market volatility, assets may decline significantly, causing total annual Fund operating expenses to
become higher than the figures shown.
6. Source: Morningstar. The S&P/IFCI Composite Index is a free float-adjusted, market capitalization-weighted index designed to measure equity performance of global
emerging markets. The MSCI EM Index is a free float-adjusted, market capitalization-weighted index designed to measure equity market performance of global emerging
markets.
See www.franklintempletondatasources.com for additional data provider information.
franklintempleton.com Annual Report | 11
TEMPLETON DEVELOPING MARKETS TRUST
Your Fund’s Expenses
As a Fund shareholder, you can incur two types of costs:
- Transaction costs, including sales charges (loads) on Fund purchases; and
- Ongoing Fund costs, including management fees, distribution and service (12b-1) fees, and other Fund expenses. All mutual funds have ongoing costs, sometimes referred to as operating expenses.
The following table shows ongoing costs of investing in the Fund and can help you understand these costs and compare them with those of other mutual funds. The table assumes a $1,000 investment held for the six months indicated.
Actual Fund Expenses
The first line (Actual) for each share class listed in the table provides actual account values and expenses. The “Ending Account Value” is derived from the Fund’s actual return, which includes the effect of Fund expenses.
You can estimate the expenses you paid during the period by following these steps. Of course, your account value and expenses will differ from those in this illustration:
| 1. | Divide your account value by $1,000. |
| | If an account had an $8,600 value, then $8,600 ÷ $1,000 = 8.6. |
| 2. | Multiply the result by the number under the heading “Expenses Paid During Period.” |
| | If Expenses Paid During Period were $7.50, then 8.6 x $7.50 = $64.50. |
In this illustration, the estimated expenses paid this period are $64.50.
Hypothetical Example for Comparison with Other Funds
Information in the second line (Hypothetical) for each class in the table can help you compare ongoing costs of investing in the Fund with those of other mutual funds. This information may not be used to estimate the actual ending account balance or expenses you paid during the period. The hypothetical “Ending Account Value” is based on the actual expense ratio for each class and an assumed 5% annual rate of return before expenses, which does not represent the Fund’s actual return. The figure under the heading “Expenses Paid During Period” shows the hypothetical expenses your account would have incurred under this scenario. You can compare this figure with the 5% hypothetical examples that appear in shareholder reports of other funds.
Please note that expenses shown in the table are meant to highlight ongoing costs and do not reflect any transaction costs, such as sales charges. Therefore, the second line for each class is useful in comparing ongoing costs only, and will not help you compare total costs of owning different funds. In addition, if transaction costs were included, your total costs would have been higher. Please refer to the Fund prospectus for additional information on operating expenses.
12 | Annual Report
franklintempleton.com
TEMPLETON DEVELOPING MARKETS TRUST
YOUR FUND’S EXPENSES
| | | | | | |
| | | Beginning Account | | Ending Account | | Expenses Paid During |
| Share Class | | Value 7/1/14 | | Value 12/31/14 | | Period* 7/1/14–12/31/14 |
| A | | | | | | |
| Actual | $ | 1,000 | $ | 911.30 | $ | 8.09 |
| Hypothetical (5% return before expenses) | $ | 1,000 | $ | 1,016.74 | $ | 8.54 |
| C | | | | | | |
| Actual | $ | 1,000 | $ | 908.40 | $ | 11.59 |
| Hypothetical (5% return before expenses) | $ | 1,000 | $ | 1,013.06 | $ | 12.23 |
| R | | | | | | |
| Actual | $ | 1,000 | $ | 910.30 | $ | 9.20 |
| Hypothetical (5% return before expenses) | $ | 1,000 | $ | 1,015.58 | $ | 9.70 |
| R6 | | | | | | |
| Actual | $ | 1,000 | $ | 913.40 | $ | 5.98 |
| Hypothetical (5% return before expenses) | $ | 1,000 | $ | 1,018.95 | $ | 6.31 |
| Advisor | | | | | | |
| Actual | $ | 1,000 | $ | 912.90 | $ | 6.80 |
| Hypothetical (5% return before expenses) | $ | 1,000 | $ | 1,018.10 | $ | 7.17 |
*Expenses are calculated using the most recent six-month expense ratio, net of expense waivers, annualized for each class (A: 1.68%; C: 2.41%; R: 1.91%; R6: 1.24%; and Advisor: 1.41%), multiplied by the average account value over the period, multiplied by 184/365 to reflect the one-half year period.
franklintempleton.com
Annual Report
| 13
TEMPLETON DEVELOPING MARKETS TRUST
| | | | | | | | | | | | | | | |
| Financial Highlights | | | | | | | | | | | | | | | |
| | | | | | Year Ended December 31, | | | | |
| | | 2014 | | | 2013 | | | 2012 | | | 2011 | | | 2010 | |
| Class A | | | | | | | | | | | | | | | |
| Per share operating performance | | | | | | | | | | | | | | | |
| (for a share outstanding throughout the year) | | | | | | | | | | | | | | | |
| Net asset value, beginning of year | $ | 22.86 | | $ | 23.61 | | $ | 21.21 | | $ | 25.53 | | $ | 22.04 | |
| Income from investment operationsa: | | | | | | | | | | | | | | | |
| Net investment incomeb | | 0.27 | c | | 0.20 | | | 0.37 | | | 0.27 | | | 0.14 | |
| Net realized and unrealized gains (losses) | | (2.09 | ) | | (0.51 | ) | | 2.41 | | | (4.31 | ) | | 3.69 | |
| Total from investment operations | | (1.82 | ) | | (0.31 | ) | | 2.78 | | | (4.04 | ) | | 3.83 | |
| Less distributions from: | | | | | | | | | | | | | | | |
| Net investment income | | (0.33 | ) | | (0.30 | ) | | (0.38 | ) | | (0.28 | ) | | (0.34 | ) |
| Net realized gains | | (3.62 | ) | | (0.14 | ) | | — | | | — | | | — | |
| Total distributions | | (3.95 | ) | | (0.44 | ) | | (0.38 | ) | | (0.28 | ) | | (0.34 | ) |
| Net asset value, end of year | $ | 17.09 | | $ | 22.86 | | $ | 23.61 | | $ | 21.21 | | $ | 25.53 | |
| |
| Total returnd | | (8.11 | )% | | (1.26 | )% | | 13.12 | % | | (15.85 | )% | | 17.47 | % |
| |
| Ratios to average net assets | | | | | | | | | | | | | | | |
| Expenses | | 1.72 | %e | | 1.71 | % | | 1.70 | %f | | 1.76 | % | | 1.84 | % |
| Net investment income | | 1.20 | %c | | 0.85 | % | | 1.65 | % | | 1.14 | % | | 0.61 | % |
| |
| Supplemental data | | | | | | | | | | | | | | | |
| Net assets, end of year (000’s) | $ | 1,187,072 | | $ | 1,536,714 | | $ | 1,773,204 | | $ | 1,753,547 | | $ | 2,463,390 | |
| Portfolio turnover rate | | 83.92 | % | | 48.35 | % | | 25.92 | % | | 17.02 | % | | 25.81 | % |
aThe amount shown for a share outstanding throughout the period may not correlate with the Statement of Operations for the period due to the timing of sales and
repurchases of the Fund shares in relation to income earned and/or fluctuating fair value of the investments of the Fund.
bBased on average daily shares outstanding.
cNet investment income per share includes approximately $0.07 per share received in the form of special dividends. Excluding these amounts, the ratio of net investment
income to average net assets would have been 0.87%.
dTotal return does not reflect sales commissions or contingent deferred sales charges, if applicable.
eBenefit of waiver and payments by affiliates rounds to less than 0.01%.
fBenefit of expense reimbursement rounds to less than 0.01%.
14 | Annual Report | The accompanying notes are an integral part of these financial statements.
franklintempleton.com
TEMPLETON DEVELOPING MARKETS TRUST
FINANCIAL HIGHLIGHTS
| | | | | | | | | | | | | | | |
| | | | | | Year Ended December 31, | | | | |
| | | 2014 | | | 2013 | | | 2012 | | | 2011 | | | 2010 | |
| Class C | | | | | | | | | | | | | | | |
| Per share operating performance | | | | | | | | | | | | | | | |
| (for a share outstanding throughout the year) | | | | | | | | | | | | | | | |
| Net asset value, beginning of year | $ | 22.32 | | $ | 23.06 | | $ | 20.72 | | $ | 24.93 | | $ | 21.54 | |
| Income from investment operationsa: | | | | | | | | | | | | | | | |
| Net investment income (loss)b | | 0.10 | c | | 0.03 | | | 0.20 | | | 0.10 | | | (0.03 | ) |
| Net realized and unrealized gains (losses) | | (2.01 | ) | | (0.50 | ) | | 2.35 | | | (4.20 | ) | | 3.60 | |
| Total from investment operations | | (1.91 | ) | | (0.47 | ) | | 2.55 | | | (4.10 | ) | | 3.57 | |
| Less distributions from: | | | | | | | | | | | | | | | |
| Net investment income | | (0.17 | ) | | (0.13 | ) | | (0.21 | ) | | (0.11 | ) | | (0.18 | ) |
| Net realized gains | | (3.62 | ) | | (0.14 | ) | | — | | | — | | | — | |
| Total distributions | | (3.79 | ) | | (0.27 | ) | | (0.21 | ) | | (0.11 | ) | | (0.18 | ) |
| Net asset value, end of year | $ | 16.62 | | $ | 22.32 | | $ | 23.06 | | $ | 20.72 | | $ | 24.93 | |
| |
| Total returnd | | (8.71 | )% | | (1.99 | )% | | 12.31 | % | | (16.47 | )% | | 16.63 | % |
| |
| Ratios to average net assets | | | | | | | | | | | | | | | |
| Expenses | | 2.44 | %e | | 2.44 | % | | 2.43 | %f | | 2.47 | % | | 2.56 | % |
| Net investment income (loss) | | 0.48 | %c | | 0.12 | % | | 0.92 | % | | 0.43 | % | | (0.11 | )% |
| |
| Supplemental data | | | | | | | | | | | | | | | |
| Net assets, end of year (000’s) | $ | 186,356 | | $ | 238,366 | | $ | 266,206 | | $ | 272,773 | | $ | 365,001 | |
| Portfolio turnover rate | | 83.92 | % | | 48.35 | % | | 25.92 | % | | 17.02 | % | | 25.81 | % |
aThe amount shown for a share outstanding throughout the period may not correlate with the Statement of Operations for the period due to the timing of sales and
repurchases of the Fund shares in relation to income earned and/or fluctuating fair value of the investments of the Fund.
bBased on average daily shares outstanding.
cNet investment income per share includes approximately $0.07 per share received in the form of special dividends. Excluding these amounts, the ratio of net investment
income to average net assets would have been 0.15%.
dTotal return does not reflect sales commissions or contingent deferred sales charges, if applicable.
eBenefit of waiver and payments by affiliates rounds to less than 0.01%.
fBenefit of expense reimbursement rounds to less than 0.01%.
franklintempleton.com
The accompanying notes are an integral part of these financial statements. | Annual Report | 15
TEMPLETON DEVELOPING MARKETS TRUST
FINANCIAL HIGHLIGHTS
| | | | | | | | | | | | | | | |
| | | | | | Year Ended December 31, | | | | |
| | | 2014 | | | 2013 | | | 2012 | | | 2011 | | | 2010 | |
| Class R | | | | | | | | | | | | | | | |
| Per share operating performance | | | | | | | | | | | | | | | |
| (for a share outstanding throughout the year) | | | | | | | | | | | | | | | |
| Net asset value, beginning of year | $ | 22.55 | | $ | 23.30 | | $ | 20.92 | | $ | 25.18 | | $ | 21.70 | |
| Income from investment operationsa: | | | | | | | | | | | | | | | |
| Net investment incomeb | | 0.21 | c | | 0.14 | | | 0.31 | | | 0.22 | | | 0.09 | |
| Net realized and unrealized gains (losses) | | (2.06 | ) | | (0.50 | ) | | 2.38 | | | (4.25 | ) | | 3.68 | |
| Total from investment operations | | (1.85 | ) | | (0.36 | ) | | 2.69 | | | (4.03 | ) | | 3.77 | |
| Less distributions from: | | | | | | | | | | | | | | | |
| Net investment income | | (0.28 | ) | | (0.25 | ) | | (0.31 | ) | | (0.23 | ) | | (0.29 | ) |
| Net realized gains | | (3.62 | ) | | (0.14 | ) | | — | | | — | | | — | |
| Total distributions | | (3.90 | ) | | (0.39 | ) | | (0.31 | ) | | (0.23 | ) | | (0.29 | ) |
| Net asset value, end of year | $ | 16.80 | | $ | 22.55 | | $ | 23.30 | | $ | 20.92 | | $ | 25.18 | |
| |
| Total return | | (8.32 | )% | | (1.50 | )% | | 12.90 | % | | (16.03 | )% | | 17.42 | % |
| |
| Ratios to average net assets | | | | | | | | | | | | | | | |
| Expenses | | 1.94 | %d | | 1.94 | % | | 1.93 | %e | | 1.97 | % | | 2.06 | % |
| Net investment income | | 0.98 | %c | | 0.62 | % | | 1.42 | % | | 0.93 | % | | 0.39 | % |
| |
| Supplemental data | | | | | | | | | | | | | | | |
| Net assets, end of year (000’s) | $ | 26,123 | | $ | 30,123 | | $ | 33,109 | | $ | 40,010 | | $ | 53,295 | |
| Portfolio turnover rate | | 83.92 | % | | 48.35 | % | | 25.92 | % | | 17.02 | % | | 25.81 | % |
aThe amount shown for a share outstanding throughout the period may not correlate with the Statement of Operations for the period due to the timing of sales and
repurchases of the Fund shares in relation to income earned and/or fluctuating fair value of the investments of the Fund.
bBased on average daily shares outstanding.
cNet investment income per share includes approximately $0.07 per share received in the form of special dividends. Excluding these amounts, the ratio of net investment
income to average net assets would have been 0.65%.
dBenefit of waiver and payments by affiliates rounds to less than 0.01%.
eBenefit of expense reimbursement rounds to less than 0.01%.
16 | Annual Report | The accompanying notes are an integral part of these financial statements.
franklintempleton.com
TEMPLETON DEVELOPING MARKETS TRUST
FINANCIAL HIGHLIGHTS
| | | | | | |
| | | Year Ended December 31, | |
| | | 2014 | | | 2013 | a |
| Class R6 | | | | | | |
| Per share operating performance | | | | | | |
| (for a share outstanding throughout the year) | | | | | | |
| Net asset value, beginning of year | $ | 22.76 | | $ | 23.77 | |
| Income from investment operationsb: | | | | | | |
| Net investment incomec | | 0.34 | d | | 0.12 | |
| Net realized and unrealized gains (losses) | | (2.05 | ) | | (0.58 | ) |
| Total from investment operations | | (1.71 | ) | | (0.46 | ) |
| Less distributions from: | | | | | | |
| Net investment income | | (0.44 | ) | | (0.41 | ) |
| Net realized gains | | (3.62 | ) | | (0.14 | ) |
| Total distributions | | (4.06 | ) | | (0.55 | ) |
| Net asset value, end of year | $ | 16.99 | | $ | 22.76 | |
| |
| Total returne | | (7.66 | )% | | (1.89 | )% |
| |
| Ratios to average net assetsf | | | | | | |
| Expenses before waiver and payments by affiliates | | 1.26 | % | | 1.30 | % |
| Expenses net of waiver and payments by affiliates | | 1.26 | % | | 1.28 | % |
| Net investment income | | 1.65 | %d | | 1.28 | % |
| |
| Supplemental data | | | | | | |
| Net assets, end of year (000’s) | $ | 52,185 | | $ | 299 | |
| Portfolio turnover rate | | 83.92 | % | | 48.35 | % |
aFor the period May 1, 2013 (effective date) to December 31, 2013.
bThe amount shown for a share outstanding throughout the period may not correlate with the Statement of Operations for the period due to the timing of sales and
repurchases of the Fund shares in relation to income earned a nd/or fluctuating fair value of the investments of the Fund.
cBased on average daily shares outstanding.
dNet investment income per share includes approximately $0.07 per share received in the form of special dividends. Excluding these amounts, the ratio of net investment
income to average net assets would have been 1.32%.
eTotal return is not annualized for periods less than one year.
fRatios are annualized for periods less than one year.
franklintempleton.com
The accompanying notes are an integral part of these financial statements. | Annual Report | 17
TEMPLETON DEVELOPING MARKETS TRUST
FINANCIAL HIGHLIGHTS
| | | | | | | | | | | | | | | |
| | | | | | Year Ended December 31, | | | | |
| | | 2014 | | | 2013 | | | 2012 | | | 2011 | | | 2010 | |
| Advisor Class | | | | | | | | | | | | | | | |
| Per share operating performance | | | | | | | | | | | | | | | |
| (for a share outstanding throughout the year) | | | | | | | | | | | | | | | |
| Net asset value, beginning of year | $ | 22.77 | | $ | 23.53 | | $ | 21.14 | | $ | 25.46 | | $ | 21.98 | |
| Income from investment operationsa: | | | | | | | | | | | | | | | |
| Net investment incomeb | | 0.33 | c | | 0.26 | | | 0.43 | | | 0.34 | | | 0.20 | |
| Net realized and unrealized gains (losses) | | (2.08 | ) | | (0.51 | ) | | 2.40 | | | (4.31 | ) | | 3.68 | |
| Total from investment operations | | (1.75 | ) | | (0.25 | ) | | 2.83 | | | (3.97 | ) | | 3.88 | |
| Less distributions from: | | | | | | | | | | | | | | | |
| Net investment income | | (0.39 | ) | | (0.37 | ) | | (0.44 | ) | | (0.35 | ) | | (0.40 | ) |
| Net realized gains | | (3.62 | ) | | (0.14 | ) | | — | | | — | | | — | |
| Total distributions | | (4.01 | ) | | (0.51 | ) | | (0.44 | ) | | (0.35 | ) | | (0.40 | ) |
| Net asset value, end of year | $ | 17.01 | | $ | 22.77 | | $ | 23.53 | | $ | 21.14 | | $ | 25.46 | |
| |
| Total return | | (7.79 | )% | | (1.02 | )% | | 13.44 | % | | (15.60 | )% | | 17.73 | % |
| |
| Ratios to average net assets | | | | | | | | | | | | | | | |
| Expenses | | 1.44 | %d | | 1.44 | % | | 1.43 | %e | | 1.47 | % | | 1.56 | % |
| Net investment income | | 1.48 | %c | | 1.12 | % | | 1.92 | % | | 1.43 | % | | 0.89 | % |
| |
| Supplemental data | | | | | | | | | | | | | | | |
| Net assets, end of year (000’s) | $ | 175,503 | | $ | 283,063 | | $ | 306,995 | | $ | 316,903 | | $ | 337,470 | |
| Portfolio turnover rate | | 83.92 | % | | 48.35 | % | | 25.92 | % | | 17.02 | % | | 25.81 | % |
aThe amount shown for a share outstanding throughout the period may not correlate with the Statement of Operations for the period due to the timing of sales and
repurchases of the Fund shares in relation to income earned and/or fluctuating fair value of the investments of the Fund.
bBased on average daily shares outstanding.
cNet investment income per share includes approximately $0.07 per share received in the form of special dividends. Excluding these amounts, the ratio of net investment
income to average net assets would have been 1.15%.
dBenefit of waiver and payments by affiliates rounds to less than 0.01%.
eBenefit of expense reimbursement rounds to less than 0.01%.
18 | Annual Report | The accompanying notes are an integral part of these financial statements.
franklintempleton.com
TEMPLETON DEVELOPING MARKETS TRUST
| | | | |
| Statement of Investments, December 31, 2014 | | | |
| | Industry | Shares | | Value |
| Common Stocks 91.2% | | | | |
| Argentina 0.2% | | | | |
| aGrupo Clarin SA, B, GDR, Reg S | Media | 314,942 | $ | 2,991,949 |
| Austria 0.2% | | | | |
| OMV AG | Oil, Gas & Consumable Fuels | 94,840 | | 2,525,788 |
| Belgium 3.8% | | | | |
| Anheuser-Busch InBev NV | Beverages | 538,060 | | 61,107,796 |
| Brazil 5.6% | | | | |
| Itau Unibanco Holding SA, ADR | Banks | 4,785,290 | | 62,256,623 |
| M Dias Branco SA | Food Products | 508,600 | | 17,415,842 |
| Souza Cruz SA | Tobacco | 1,675,196 | | 12,178,659 |
| | | | | 91,851,124 |
| Chile 0.6% | | | | |
| Sociedad Quimica Y Minera de Chile SA | | | | |
| Soquimich, ADR | Chemicals | 418,085 | | 9,983,870 |
| China 21.1% | | | | |
| bAluminum Corp. of China Ltd., H | Metals & Mining | 17,408,800 | | 8,015,194 |
| b,cBAIC Motor Corp. Ltd., 144A | Automobiles | 6,062,500 | | 6,997,643 |
| Brilliance China Automotive Holdings Ltd. | Automobiles | 42,996,900 | | 68,759,995 |
| China Construction Bank Corp., H | Banks | 62,743,700 | | 51,383,165 |
| China Life Insurance Co. Ltd., H | Insurance | 6,924,000 | | 27,056,816 |
| China Mobile Ltd. | Wireless Telecommunication Services | 1,991,000 | | 23,289,253 |
| China Petroleum and Chemical Corp., H | Oil, Gas & Consumable Fuels | 33,700,000 | | 27,163,575 |
| bChina Shipping Development Co. Ltd., H | Marine | 34,612,800 | | 23,703,270 |
| Industrial and Commercial Bank of China | | | | |
| Ltd., H | Banks | 30,715,800 | | 22,421,015 |
| NetEase Inc., ADR | Internet Software & Services | 141,900 | | 14,067,966 |
| PetroChina Co. Ltd., H | Oil, Gas & Consumable Fuels | 31,171,800 | | 34,492,619 |
| Tencent Holdings Ltd. | Internet Software & Services | 1,128,000 | | 16,365,852 |
| Yanzhou Coal Mining Co. Ltd., H | Oil, Gas & Consumable Fuels | 23,370,900 | | 19,832,539 |
| | | | | 343,548,902 |
| Greece 0.3% | | | | |
| bNational Bank of Greece SA | Banks | 2,965,481 | | 5,274,701 |
| Hong Kong 0.7% | | | | |
| Dairy Farm International Holdings Ltd. | Food & Staples Retailing | 818,062 | | 7,362,558 |
| Giordano International Ltd. | Specialty Retail | 1,370,100 | | 609,605 |
| MGM China Holdings Ltd. | Hotels, Restaurants & Leisure | 1,498,000 | | 3,809,743 |
| | | | | 11,781,906 |
| India 11.2% | | | | |
| Biocon Ltd. | Biotechnology | 2,497,396 | | 16,859,949 |
| Dr. Reddy’s Laboratories Ltd. | Pharmaceuticals | 298,129 | | 15,353,159 |
| Infosys Ltd. | IT Services | 583,200 | | 18,250,038 |
| Reliance Industries Ltd. | Oil, Gas & Consumable Fuels | 634,200 | | 8,965,929 |
| Tata Consultancy Services Ltd. | IT Services | 1,922,567 | | 78,026,605 |
| Tata Motors Ltd. | Automobiles | 5,657,000 | | 44,472,536 |
| | | | | 181,928,216 |
| Indonesia 3.6% | | | | |
| Astra International Tbk PT | Automobiles | 56,654,500 | | 33,965,253 |
| Bank Danamon Indonesia Tbk PT | Banks | 17,544,100 | | 6,409,936 |
| Semen Indonesia (Persero) Tbk PT | Construction Materials | 13,516,500 | | 17,680,040 |
| | | | | 58,055,229 |
| |
| franklintempleton.com | | Annual Report | 19 |
TEMPLETON DEVELOPING MARKETS TRUST
STATEMENT OF INVESTMENTS
| | | | |
| | Industry | Shares | | Value |
| Common Stocks (continued) | | | | |
| Kenya 0.7% | | | | |
| Equity Bank Ltd. | Banks | 4,153,408 | $ | 2,293,433 |
| Kenya Commercial Bank Ltd. | Banks | 14,258,600 | | 8,896,863 |
| | | | | 11,190,296 |
| Pakistan 0.7% | | | | |
| United Bank Ltd. | Banks | 6,429,900 | | 11,146,434 |
| Peru 0.4% | | | | |
| Compania de Minas Buenaventura SA, ADR | Metals & Mining | 682,764 | | 6,527,224 |
| Philippines 2.4% | | | | |
| Ayala Corp. | Diversified Financial Services | 1,161,940 | | 18,005,724 |
| bBloomberry Resorts Corp. | Hotels, Restaurants & Leisure | 61,779,200 | | 17,105,327 |
| bMelco Crown Philippines Resorts Corp. | Hotels, Restaurants & Leisure | 15,107,200 | | 4,580,904 |
| | | | | 39,691,955 |
| Qatar 2.2% | | | | |
| Industries Qatar QSC | Industrial Conglomerates | 760,514 | | 35,084,261 |
| South Africa 12.2% | | | | |
| Kumba Iron Ore Ltd. | Metals & Mining | 135,052 | | 2,801,589 |
| MTN Group Ltd. | Wireless Telecommunication Services | 1,714,636 | | 32,827,840 |
| Naspers Ltd., N | Media | 556,580 | | 72,920,186 |
| Remgro Ltd. | Diversified Financial Services | 3,935,194 | | 86,428,287 |
| Truworths International Ltd. | Specialty Retail | 639,645 | | 4,274,440 |
| | | | | 199,252,342 |
| South Korea 3.1% | | | | |
| Hyundai Development Co. | Construction & Engineering | 398,501 | | 14,099,975 |
| Samsung Electronics Co. Ltd. | Technology Hardware, Storage & Peripherals | 16,032 | | 19,450,761 |
| SK Innovation Co. Ltd. | Oil, Gas & Consumable Fuels | 213,401 | | 16,603,665 |
| | | | | 50,154,401 |
| Switzerland 0.5% | | | | |
| Compagnie Financiere Richemont SA | Textiles, Apparel & Luxury Goods | 98,713 | | 8,816,852 |
| Taiwan 3.2% | | | | |
| Taiwan Semiconductor Manufacturing Co. Ltd. | Semiconductors & Semiconductor Equipment | 11,650,000 | | 51,898,834 |
| Thailand 11.2% | | | | |
| Kasikornbank PCL, fgn. | Banks | 2,795,900 | | 19,472,661 |
| Land and Houses PCL, fgn. | Real Estate Management & Development | 75,407,200 | | 20,755,327 |
| PTT Exploration and Production PCL, fgn. | Oil, Gas & Consumable Fuels | 2,861,900 | | 9,748,565 |
| PTT PCL, fgn. | Oil, Gas & Consumable Fuels | 2,605,100 | | 25,670,693 |
| Quality Houses PCL, fgn. | Real Estate Management & Development | 22,187,800 | | 2,469,810 |
| Siam Commercial Bank PCL, fgn. | Banks | 12,569,500 | | 69,575,700 |
| Thai Beverage PCL, fgn. | Beverages | 65,889,200 | | 34,317,291 |
| | | | | 182,010,047 |
| Turkey 1.7% | | | | |
| Akbank TAS | Banks | 4,992,000 | | 18,524,541 |
| Tupras-Turkiye Petrol Rafinerileri AS | Oil, Gas & Consumable Fuels | 402,780 | | 9,544,386 |
| | | | | 28,068,927 |
| United Arab Emirates 0.5% | | | | |
| Emaar Properties PJSC | Real Estate Management & Development | 4,269,006 | | 8,437,942 |
| United Kingdom 3.6% | | | | |
| Unilever PLC | Food Products | 1,424,618 | | 58,356,106 |
| |
| |
| 20 | Annual Report | | franklintempleton.com |
TEMPLETON DEVELOPING MARKETS TRUST
STATEMENT OF INVESTMENTS
| | | | | |
| | Industry | Shares | | Value | |
| Common Stocks (continued) | | | | | |
| United States 1.5% | | | | | |
| Avon Products Inc. | Personal Products | 2,562,042 | $ | 24,057,574 | |
| Total Common Stocks | | | | | |
| (Cost $1,324,201,992) | | | | 1,483,742,676 | |
| d Participatory Notes 1.2% | | | | | |
| Saudi Arabia 1.2% | | | | | |
| cDeutsche Bank AG/London, | | | | | |
| Etihad Etisalat Co., 144A, 9/27/16 | Wireless Telecommunication Services | 302,398 | | 3,561,937 | |
| Saudi Basic Industries Corp., 144A, 9/27/16 | Chemicals | 450,028 | | 10,074,046 | |
| cHSBC Bank PLC, Etihad Etisalat Co., 144A, | | | | | |
| 11/20/17 | Wireless Telecommunication Services | 451,577 | | 5,319,112 | |
| Total Participatory Notes | | | | | |
| (Cost $22,031,684) | | | | 18,955,095 | |
| Preferred Stocks 3.5% | | | | | |
| Brazil 2.6% | | | | | |
| Petroleo Brasileiro SA, ADR, pfd. | Oil, Gas & Consumable Fuels | 2,629,700 | | 19,933,126 | |
| Vale SA, ADR, pfd., A | Metals & Mining | 3,058,850 | | 22,207,251 | |
| | | | | 42,140,377 | |
| Chile 0.9% | | | | | |
| Embotelladora Andina SA, pfd., A | Beverages | 5,951,364 | | 14,434,681 | |
| Total Preferred Stocks | | | | | |
| (Cost $93,183,747) | | | | 56,575,058 | |
| Total Investments before Short Term | | | | | |
| Investments (Cost $1,439,417,423) | | | | 1,559,272,829 | |
| Short Term Investments | | | | | |
| (Cost $72,157,833) 4.4% | | | | | |
| Money Market Funds 4.4% | | | | | |
| United States 4.4% | | | | | |
| b,eInstitutional Fiduciary Trust Money Market | | | | | |
| Portfolio | | 72,157,833 | | 72,157,833 | |
| Total Investments | | | | | |
| (Cost $1,511,575,256) 100.3% | | | | 1,631,430,662 | |
| Other Assets, less Liabilities (0.3)% | | | | (4,191,766 | ) |
| Net Assets 100.0% | | | $ | 1,627,238,896 | |
See Abbreviations on page 34.
aSecurity was purchased pursuant to Regulation S under the Securities Act of 1933, which exempts from registration securities offered and sold outside of the United States.
Such a security cannot be sold in the United States without either an effective registration statement filed pursuant to the Securities Act of 1933, or pursuant to an exemption
from registration. This security has been deemed liquid under guidelines approved by the Fund’s Board of Trustees.
bNon-income producing.
cSecurity was purchased pursuant to Rule 144A under the Securities Act of 1933 and may be sold in transactions exempt from registration only to qualified institutional buyers
or in a public offering registered under the Securities Act of 1933. These securities have been deemed liquid under guidelines approved by the Fund’s Board of Trustees. At
December 31, 2014, the aggregate value of these securities was $25,952,738, representing 1.59% of net assets.
dSee Note 1(c) regarding Participatory Notes.
eSee Note 3(f) regarding investments in Institutional Fiduciary Trust Money Market Portfolio.
franklintempleton.com
The accompanying notes are an integral part of these financial statements. | Annual Report | 21
TEMPLETON DEVELOPING MARKETS TRUST
Financial Statements
Statement of Assets and Liabilities
December 31, 2014
| | | |
| Assets: | | | |
| Investments in securities: | | | |
| Cost - Unaffiliated issuers | $ | 1,439,417,423 | |
| Cost - Sweep Money Fund (Note 3f) | | 72,157,833 | |
| Total cost of investments | $ | 1,511,575,256 | |
| Value - Unaffiliated issuers | $ | 1,559,272,829 | |
| Value - Sweep Money Fund (Note 3f) | | 72,157,833 | |
| Total value of investments | | 1,631,430,662 | |
| Receivables: | | | |
| Investment securities sold | | 5,291,862 | |
| Capital shares sold | | 1,640,659 | |
| Dividends | | 988,681 | |
| Foreign tax | | 586,439 | |
| Other assets | | 170 | |
| Total assets | | 1,639,938,473 | |
| Liabilities: | | | |
| Payables: | | | |
| Investment securities purchased | | 1,675,465 | |
| Capital shares redeemed | | 7,216,974 | |
| Management fees | | 1,689,455 | |
| Distribution fees | | 871,403 | |
| Transfer agent fees | | 612,703 | |
| Deferred tax | | 129,009 | |
| Accrued expenses and other liabilities | | 504,568 | |
| Total liabilities | | 12,699,577 | |
| Net assets, at value | $ | 1,627,238,896 | |
| Net assets consist of: | | | |
| Paid-in capital | $ | 1,548,732,564 | |
| Distributions in excess of net investment income | | (32,766,880 | ) |
| Net unrealized appreciation (depreciation) | | 119,372,938 | |
| Accumulated net realized gain (loss) | | (8,099,726 | ) |
| Net assets, at value | $ | 1,627,238,896 | |
22 | Annual Report | The accompanying notes are an integral part of these financial statements.
franklintempleton.com
TEMPLETON DEVELOPING MARKETS TRUST
FINANCIAL STATEMENTS
| | |
| Statement of Assets and Liabilities (continued) | | |
| December 31, 2014 | | |
| |
| Class A: | | |
| Net assets, at value | $ | 1,187,071,833 |
| Shares outstanding | | 69,445,695 |
| Net asset value per sharea | $ | 17.09 |
| Maximum offering price per share (net asset value per share ÷ 94.25%) | $ | 18.13 |
| Class C: | | |
| Net assets, at value | $ | 186,355,865 |
| Shares outstanding | | 11,215,289 |
| Net asset value and maximum offering price per sharea | $ | 16.62 |
| Class R: | | |
| Net assets, at value | $ | 26,123,289 |
| Shares outstanding | | 1,554,590 |
| Net asset value and maximum offering price per share | $ | 16.80 |
| Class R6: | | |
| Net assets, at value | $ | 52,185,339 |
| Shares outstanding | | 3,071,871 |
| Net asset value and maximum offering price per share | $ | 16.99 |
| Advisor Class: | | |
| Net assets, at value | $ | 175,502,570 |
| Shares outstanding | | 10,320,437 |
| Net asset value and maximum offering price per share | $ | 17.01 |
| | | |
| aRedemption price is equal to net asset value less contingent deferred sales charges, if applicable. | | |
| franklintempleton.com | The accompanying notes are an integral part of these financial statements. | Annual Report | | | 23 |
TEMPLETON DEVELOPING MARKETS TRUST
FINANCIAL STATEMENTS
| | | |
| Statement of Operations | | | |
| for the year ended December 31, 2014 | | | |
| |
| |
| Investment income: | | | |
| Dividends: (net of foreign taxes of $4,050,315) | | | |
| Unaffiliated issuers | $ | 55,079,555 | |
| Controlled affiliated issuers (Note 8) | | 913,800 | |
| Income from securities loaned | | 154,166 | |
| Total investment income | | 56,147,521 | |
| Expenses: | | | |
| Management fees (Note 3a) | | 22,104,709 | |
| Administrative fees (Note 3b) | | 676,912 | |
| Distribution fees: (Note 3c) | | | |
| Class A | | 3,944,173 | |
| Class C | | 2,190,247 | |
| Class R | | 143,801 | |
| Transfer agent fees: (Note 3e) | | | |
| Class A | | 2,464,714 | |
| Class C | | 382,485 | |
| Class R | | 50,219 | |
| Class R6 | | 346 | |
| Advisor Class | | 375,444 | |
| Custodian fees (Note 4) | | 912,122 | |
| Reports to shareholders | | 238,227 | |
| Registration and filing fees | | 123,971 | |
| Professional fees | | 90,434 | |
| Trustees’ fees and expenses | | 131,597 | |
| Other | | 46,242 | |
| Total expenses | | 33,875,643 | |
| Expenses waived/paid by affiliates (Note 3f) | | (75,465 | ) |
| Net expenses | | 33,800,178 | |
| Net investment income | | 22,347,343 | |
| Realized and unrealized gains (losses): | | | |
| Net realized gain (loss) from: | | | |
| Investments: | | | |
| Unaffiliated issuers | | 269,552,442 | |
| Controlled affiliated issuers (Note 8) | | (1,594,668 | ) |
| Foreign currency transactions | | 237,427 | |
| Net realized gain (loss) | | 268,195,201 | |
| Net change in unrealized appreciation (depreciation) on: | | | |
| Investments | | (445,827,944 | ) |
| Translation of other assets and liabilities denominated in foreign currencies | | (62,357 | ) |
| Change in deferred taxes on unrealized appreciation | | (129,009 | ) |
| Net change in unrealized appreciation (depreciation) | | (446,019,310 | ) |
| Net realized and unrealized gain (loss) | | (177,824,109 | ) |
| Net increase (decrease) in net assets resulting from operations | $ | (155,476,766 | ) |
24 | Annual Report | The accompanying notes are an integral part of these financial statements.
franklintempleton.com
| | | | | | |
| | | TEMPLETON DEVELOPING MARKETS TRUST | |
| | | FINANCIAL STATEMENTS | |
| |
| |
| |
| |
| Statements of Changes in Net Assets | | | | | | |
| | | Year Ended December 31, | |
| | | 2014 | | | 2013 | |
| Increase (decrease) in net assets: | | | | | | |
| Operations: | | | | | | |
| Net investment income | $ | 22,347,343 | | $ | 17,681,627 | |
| Net realized gain (loss) from investments and foreign currency transactions | | 268,195,201 | | | 243,743,181 | |
| Net change in unrealized appreciation (depreciation) on investments, translation of other | | | | |
| assets and liabilities denominated in foreign currencies and deferred taxes | | (446,019,310 | ) | | (295,001,951 | ) |
| Net increase (decrease) in net assets resulting from operations | | (155,476,766 | ) | | (33,577,143 | ) |
| Distributions to shareholders from: | | | | | | |
| Net investment income: | | | | | | |
| Class A | | (19,476,819 | ) | | (19,968,320 | ) |
| Class C | | (1,598,494 | ) | | (1,397,743 | ) |
| Class R | | (363,909 | ) | | (327,119 | ) |
| Class R6 | | (1,097,572 | ) | | (5,215 | ) |
| Advisor Class | | (3,551,774 | ) | | (4,496,788 | ) |
| Net realized gains: | | | | | | |
| Class A | | (215,593,770 | ) | | (9,559,158 | ) |
| Class C | | (34,715,396 | ) | | (1,522,307 | ) |
| Class R | | (4,637,904 | ) | | (188,146 | ) |
| Class R6 | | (9,124,148 | ) | | (1,842 | ) |
| Advisor Class | | (32,731,579 | ) | | (1,755,400 | ) |
| Total distributions to shareholders | | (322,891,365 | ) | | (39,222,038 | ) |
| Capital share transactions: (Note 2) | | | | | | |
| Class A | | (3,029,377 | ) | | (183,316,761 | ) |
| Class B | | — | | | (1,156,581 | ) |
| Class C | | 3,783,446 | | | (19,463,720 | ) |
| Class R | | 3,416,932 | | | (2,012,612 | ) |
| Class R6 | | 66,030,185 | | | 305,711 | |
| Advisor Class | | (53,159,366 | ) | | (13,618,359 | ) |
| Total capital share transactions | | 17,041,820 | | | (219,262,322 | ) |
| Net increase (decrease) in net assets | | (461,326,311 | ) | | (292,061,503 | ) |
| Net assets: | | | | | | |
| Beginning of year | | 2,088,565,207 | | | 2,380,626,710 | |
| End of year | $ | 1,627,238,896 | | $ | 2,088,565,207 | |
| Distributions in excess of net investment income included in net assets: | | | | | | |
| End of year | $ | (32,766,880 | ) | $ | (33,349,719 | ) |
franklintempleton.com
The accompanying notes are an integral part of these financial statements. | Annual Report | 25
TEMPLETON DEVELOPING MARKETS TRUST
Notes to Financial Statements
1. Organization and Significant Accounting Policies
Templeton Developing Markets Trust (Fund) is registered under the Investment Company Act of 1940, as amended, (1940 Act) as an open-end management investment company and applies the specialized accounting and reporting guidance in U.S. Generally Accepted Accounting Principles (U.S. GAAP). The Fund offers five classes of shares: Class A, Class C, Class R, Class R6, and Advisor Class. Each class of shares differs by its initial sales load, contingent deferred sales charges, voting rights on matters affecting a single class, its exchange privilege and fees primarily due to differing arrangements for distribution and transfer agent fees.
The following summarizes the Fund’s significant accounting policies.
a. Financial Instrument Valuation
The Fund’s investments in financial instruments are carried at fair value daily. Fair value is the price that would be received to sell an asset or paid to transfer a liability in an orderly transaction between market participants on the measurement date. The Fund calculates the net asset value (NAV) per share at the close of the New York Stock Exchange (NYSE), generally at 4 p.m. Eastern time (NYSE close) on each day the NYSE is open for trading. Under compliance policies and procedures approved by the Fund’s Board of Trustees (the Board), the Fund’s administrator has responsibility for oversight of valuation, including leading the cross-functional Valuation and Liquidity Oversight Committee (VLOC). The VLOC provides administration and oversight of the Fund’s valuation policies and procedures, which are approved annually by the Board. Among other things, these procedures allow the Fund to utilize independent pricing services, quotations from securities and financial instrument dealers, and other market sources to determine fair value.
Equity securities listed on an exchange or on the NASDAQ National Market System are valued at the last quoted sale price or the official closing price of the day, respectively. Foreign equity securities are valued as of the close of trading on the foreign stock exchange on which the security is primarily traded or as of the NYSE close, whichever is earlier. The value is then converted into its U.S. dollar equivalent at the foreign exchange rate in effect at the NYSE close on the day that the value of the security is determined. Over-the-counter (OTC) securities are valued within the range of the most recent quoted bid and ask prices. Securities that trade in multiple markets or on multiple exchanges are valued according to the broadest and most representative market. Certain equity securities are valued based upon fundamental characteristics or relationships to similar securities. Investments in open-end mutual funds are valued at the closing NAV.
The Fund has procedures to determine the fair value of financial instruments for which market prices are not reliable or readily available. Under these procedures, the VLOC convenes on a regular basis to review such financial instruments and considers a number of factors, including significant unobservable valuation inputs, when arriving at fair value. The VLOC primarily employs a market-based approach which may use related or comparable assets or liabilities, recent transactions, market multiples, book values, and other relevant information for the investment to determine the fair value of the investment. An income-based valuation approach may also be used in which the anticipated future cash flows of the investment are discounted to calculate fair value. Discounts may also be applied due to the nature or duration of any restrictions on the disposition of the investments. Due to the inherent uncertainty of valuations of such investments, the fair values may differ significantly from the values that would have been used had an active market existed. The VLOC employs various methods for calibrating these valuation approaches including a regular review of key inputs and assumptions, transactional back-testing or disposition analysis, and reviews of any related market activity.
Trading in securities on foreign securities stock exchanges and OTC markets may be completed before the daily NYSE close. In addition, trading in certain foreign markets may not take place on every NYSE business day. Occasionally, events occur between the time at which trading in a foreign security is completed and the close of the NYSE that might call into question the reliability of the value of a portfolio security held by the Fund. As a result, differences may arise between the value of the Fund’s portfolio securities as determined at the foreign market close and the latest indications of value at the close of the NYSE. In order to minimize the potential for these differences, the VLOC monitors price movements following the close of trading in foreign stock markets through a series of country specific market proxies (such as baskets of American Depositary Receipts, futures contracts and exchange traded funds). These price movements are measured against established trigger thresholds for each specific market proxy to assist in determining if an event has occurred that may call into question the reliability of the values of the foreign securities held by the Fund. If such an event occurs, the securities may be valued using fair value procedures, which may include the use of independent pricing services.
26 | Annual Report
franklintempleton.com
TEMPLETON DEVELOPING MARKETS TRUST
NOTES TO FINANCIAL STATEMENTS
Also, when the last day of the reporting period is a non-business day, certain foreign markets may be open on those days that the NYSE is closed, which could result in differences between the value of the Fund’s portfolio securities on the last business day and the last calendar day of the reporting period. Any significant security valuation changes due to an open foreign market are adjusted and reflected by the Fund for financial reporting purposes.
b. Foreign Currency Translation
Portfolio securities and other assets and liabilities denominated in foreign currencies are translated into U.S. dollars based on the exchange rate of such currencies against U.S. dollars on the date of valuation. The Fund may enter into foreign currency exchange contracts to facilitate transactions denominated in a foreign currency. Purchases and sales of securities, income and expense items denominated in foreign currencies are translated into U.S. dollars at the exchange rate in effect on the transaction date. Portfolio securities and assets and liabilities denominated in foreign currencies contain risks that those currencies will decline in value relative to the U.S. dollar. Occasionally, events may impact the availability or reliability of foreign exchange rates used to convert the U.S. dollar equivalent value. If such an event occurs, the foreign exchange rate will be valued at fair value using procedures established and approved by the Board.
The Fund does not separately report the effect of changes in foreign exchange rates from changes in market prices on securities held. Such changes are included in net realized and unrealized gain or loss from investments on the Statement of Operations.
Realized foreign exchange gains or losses arise from sales of foreign currencies, currency gains or losses realized between the trade and settlement dates on securities transactions and the difference between the recorded amounts of dividends, interest, and foreign withholding taxes and the U.S. dollar equivalent of the amounts actually received or paid. Net unrealized foreign exchange gains and losses arise from changes in foreign exchange rates on foreign denominated assets and liabilities other than investments in securities held at the end of the reporting period.
c. Participatory Notes
The Fund invests in Participatory Notes (P-Notes). P-notes are promissory notes that are designed to offer a return linked to the performance of a particular underlying equity security or market. P-Notes are issued by banks or broker-dealers and allow the fund to gain exposure to common stocks in markets where direct investment is not allowed. Income received from P-Notes is recorded as dividend income in the Statement of Operations. P-Notes may contain various risks including the potential inability of the counterparty to fulfill their obligations under the terms of the contract. These securities may be more volatile and less liquid than other investments held by the Fund.
d. Securities Lending
The Fund participates in an agency based securities lending program. The Fund receives cash collateral against the loaned securities in an amount equal to at least 102% of the fair value of the loaned securities. Collateral is maintained over the life of the loan in an amount not less than 100% of the fair value of loaned securities, as determined at the close of fund business each day; any additional collateral required due to changes in security values is delivered to the Fund on the next business day. The collateral is invested in a non-registered money fund. The Fund receives income from the investment of cash collateral, in addition to lending fees and rebates paid by the borrower. The Fund bears the market risk with respect to the collateral investment, securities loaned, and the risk that the agent may default on its obligations to the Fund. The securities lending agent has agreed to indemnify the Fund in the event of default by a third party borrower. At December 31, 2014, the Fund had no securities on loan.
e. Income and Deferred Taxes
It is the Fund’s policy to qualify as a regulated investment company under the Internal Revenue Code. The Fund intends to distribute to shareholders substantially all of its taxable income and net realized gains to relieve it from federal income and excise taxes. As a result, no provision for U.S. federal income taxes is required.
The Fund may be subject to foreign taxation related to income received, capital gains on the sale of securities and certain foreign currency transactions in the foreign jurisdictions in which it invests. Foreign taxes, if any, are recorded based on the tax regulations and rates that exist in the foreign markets in which the Fund invests. When a capital gain tax is determined to apply the Fund records an estimated deferred tax liability in an amount that would be payable if the securities were disposed of on the valuation date. As a result of several court cases, in certain countries across the European Union, the Fund has filed additional tax reclaims for previously withheld taxes on dividends earned in those countries. These additional filings are subject to various
franklintempleton.com Annual Report | 27
TEMPLETON DEVELOPING MARKETS TRUST
NOTES TO FINANCIAL STATEMENTS
1. Organization and Significant Accounting
Policies (continued)
e. Income and Deferred Taxes (continued)
administrative proceedings by the local jurisdictions’ tax authorities within the European Union, as well as a number of related judicial proceedings. At this time, uncertainty exists as to the ultimate resolution of these proceedings, the likelihood of receipt of these reclaims, and the potential timing of payment, and accordingly, no amounts are reflected in the financial statements.
The Fund recognizes the tax benefits of uncertain tax positions only when the position is “more likely than not” to be sustained upon examination by the tax authorities based on the technical merits of the tax position. As of December 31, 2014, and for all open tax years, the Fund has determined that no liability for unrecognized tax benefits is required in the Fund’s financial statements related to uncertain tax positions taken on a tax return (or expected to be taken on future tax returns). Open tax years are those that remain subject to examination and are based on each tax jurisdiction statute of limitation.
f. Security Transactions, Investment Income, Expenses and Distributions
Security transactions are accounted for on trade date. Realized gains and losses on security transactions are determined on a specific identification basis. Estimated expenses are accrued daily. Dividend income recorded on the ex-dividend date except for certain foreign securities where the dividend rate is not available. In such cases, the dividend is recorded as soon as the information is received by the Fund. Distributions to shareholders are recorded on the ex-dividend date and are determined according to income tax regulations (tax basis).
Distributable earnings determined on a tax basis may differ from earnings recorded in accordance with U.S. GAAP. These differences may be permanent or temporary. Permanent differences are reclassified among capital accounts to reflect their tax character. These reclassifications have no impact on net assets or the results of operations. Temporary differences are not reclassified, as they may reverse in subsequent periods.
Realized and unrealized gains and losses and net investment income, not including class specific expenses, are allocated daily to each class of shares based upon the relative proportion of net assets of each class. Differences in per share distributions, by class, are generally due to differences in class specific expenses.
g. Accounting Estimates
The preparation of financial statements in accordance with U.S. GAAP requires management to make estimates and assumptions that affect the reported amounts of assets and liabilities at the date of the financial statements and the amounts of income and expenses during the reporting period. Actual results could differ from those estimates.
h. Guarantees and Indemnifications
Under the Fund’s organizational documents, its officers and trustees are indemnified by the Fund against certain liabilities arising out of the performance of their duties to the Fund. Additionally, in the normal course of business, the Fund enters into contracts with service providers that contain general indemnification clauses. The Fund’s maximum exposure under these arrangements is unknown as this would involve future claims that may be made against the Fund that have not yet occurred. Currently, the Fund expects the risk of loss to be remote.
2. Shares of Beneficial Interest
At December 31, 2014, there were an unlimited number of shares authorized (without par value). Transactions in the Fund’s shares were as follows:
| | | | | | | | | | |
| | | | | Year Ended December 31, | | | | |
| | 2014 | | | | | | | | 2013 | |
| | Shares | | | Amount | | Shares | | | Amount | |
| |
| Class A Shares: | | | | | | | | | | |
| Shares sold | 6,099,247 | | $ | 133,593,175 | | 9,168,081 | | $ | 213,661,198 | |
| Shares issued in reinvestment of distributions | 11,785,303 | | | 206,031,823 | | 1,119,094 | | | 25,105,417 | |
| Shares redeemed | (15,661,408 | ) | | (342,654,375 | ) | (18,160,918 | ) | | (422,083,376 | ) |
| Net increase (decrease) | 2,223,142 | | $ | (3,029,377 | ) | (7,873,743 | ) | $ | (183,316,761 | ) |
28 | Annual Report
franklintempleton.com
TEMPLETON DEVELOPING MARKETS TRUST
NOTES TO FINANCIAL STATEMENTS
| | | | | | | | | | | |
| | | | | Year Ended December 31, | | | | | |
| | 2014 | | | | | | | | 2013 | | |
| | Shares | | | Amount | | Shares | | | | Amount | |
| |
| Class B Shares:a | | | | | | | | | | | |
| Shares sold | | | | | | 707 | | | $ | 17,084 | |
| Shares redeemed | | | | | | (48,018 | ) | | | (1,173,665 | ) |
| Net increase (decrease) | | | | | | (47,311 | ) | $ | (1,156,581 | ) |
| Class C Shares: | | | | | | | | | | | |
| Shares sold | 1,151,399 | | $ | 24,237,673 | | 1,389,995 | | $ | 31,641,300 | |
| Shares issued in reinvestment of distributions | 1,946,064 | | | 33,111,665 | | 120,499 | | | | 2,632,493 | |
| Shares redeemed | (2,559,653 | ) | | (53,565,892 | ) | (2,375,579 | ) | | (53,737,513 | ) |
| Net increase (decrease) | 537,810 | | $ | 3,783,446 | | (865,085 | ) | $ | (19,463,720 | ) |
| Class R Shares: | | | | | | | | | | | |
| Shares sold | 410,122 | | $ | 8,834,064 | | 418,966 | | $ | 9,558,699 | |
| Shares issued in reinvestment of distributions | 274,258 | | | 4,713,982 | | 22,271 | | | | 492,496 | |
| Shares redeemed | (465,721 | ) | | (10,131,114 | ) | (526,398 | ) | | (12,063,807 | ) |
| Net increase (decrease) | 218,659 | | $ | 3,416,932 | | (85,161 | ) | $ | (2,012,612 | ) |
| Class R6 Shares:b | | | | | | | | | | | |
| Shares sold | 3,381,719 | | $ | 73,122,140 | | 13,031 | | | $ | 303,304 | |
| Shares issued in reinvestment of distributions | 2,975 | | | 52,338 | | 316 | | | | 7,058 | |
| Shares redeemed | (325,960 | ) | | (7,144,293 | ) | (210 | ) | | | (4,651 | ) |
| Net increase (decrease) | 3,058,734 | | $ | 66,030,185 | | 13,137 | | | $ | 305,711 | |
| Advisor Class Shares: | | | | | | | | | | | |
| Shares sold | 2,078,957 | | $ | 46,418,036 | | 2,332,850 | | $ | 54,353,951 | |
| Shares issued in reinvestment of distributions | 1,864,150 | | | 32,455,224 | | 253,745 | | | | 5,673,295 | |
| Shares redeemed | (6,051,881 | ) | | (132,032,626 | ) | (3,203,336 | ) | | (73,645,605 | ) |
| Net increase (decrease) | (2,108,774 | ) | $ | (53,159,366 | ) | (616,741 | ) | $ | (13,618,359 | ) |
| |
| aEffective March 22, 2013, all Class B Shares were converted to Class A. | | | | | | | | | | | |
| bFor the period May 1, 2013 (effective date) to December 31, 2013. | | | | | | | | | | | |
3. Transactions with Affiliates
Franklin Resources, Inc. is the holding company for various subsidiaries that together are referred to as Franklin Templeton
Investments. Certain officers and trustees of the Fund are also officers and/or directors of the following subsidiaries:
| |
| Subsidiary | Affiliation |
| Templeton Asset Management Ltd. (TAML) | Investment manager |
| Franklin Templeton Services, LLC (FT Services) | Administrative manager |
| Franklin Templeton Distributors, Inc. (Distributors) | Principal underwriter |
| Franklin Templeton Investor Services, LLC (Investor Services) | Transfer agent |
franklintempleton.com
Annual Report
| 29
TEMPLETON DEVELOPING MARKETS TRUST
NOTES TO FINANCIAL STATEMENTS
3. Transactions with Affiliates (continued)
a. Management Fees
The Fund pays an investment management fee to TAML based on the average daily net assets of the Fund as follows:
| | |
| Annualized Fee Rate | | Net Assets |
| 1.250 | % | Up to and including $200 million |
| 1.235 | % | Over $200 million, up to and including $700 million |
| 1.200 | % | Over $700 million, up to and including $1 billion |
| 1.150 | % | Over $1 billion, up to and including $1.2 billion |
| 1.125 | % | Over $1.2 billion, up to and including $5 billion |
| 1.075 | % | Over $5 billion, up to and including $10 billion |
| 1.025 | % | Over $10 billion, up to and including $15 billion |
| 0.975 | % | Over $15 billion, up to and including $20 billion |
| 0.925 | % | In excess of $20 billion |
Effective May 1, 2014, the Fund combined its investment management and administration agreements as approved by the Board.
The fees paid under the combined agreement do not exceed the aggregate fees that were paid under the separate agreements.
| | |
| Prior to May 1, 2014, the Fund paid fees to TAML based on the average daily net assets of the Fund as follows: |
| Annualized Fee Rate | | Net Assets |
| 1.100 | % | Up to and including $1 billion |
| 1.050 | % | Over $1 billion, up to and including $5 billion |
| 1.000 | % | Over $5 billion, up to and including $10 billion |
| 0.950 | % | Over $10 billion, up to and including $15 billion |
| 0.900 | % | Over $15 billion, up to and including $20 billion |
| 0.850 | % | In excess of $20 billion |
b. Administrative Fees
Effective May 1, 2014, under an agreement with TAML, FT Services provides administrative services to the Fund. The fee is paid by TAML based on the Fund’s average daily net assets, and is not an additional expense of the Fund.
Prior to May 1, 2014, the Fund paid administrative fees to FT Services based on the average daily net assets of the Fund as follows:
| | |
| Annualized Fee Rate | | Net Assets |
| 0.150 | % | Up to and including $200 million |
| 0.135 | % | Over $200 million, up to and including $700 million |
| 0.100 | % | Over $700 million, up to and including $1.2 billion |
| 0.075 | % | In excess of $1.2 billion |
30 | Annual Report
franklintempleton.com
TEMPLETON DEVELOPING MARKETS TRUST
NOTES TO FINANCIAL STATEMENTS
c. Distribution Fees
The Board has adopted distribution plans for each share class, with the exception of Class R6 and Advisor Class shares, pursuant to Rule 12b-1 under the 1940 Act. Distribution fees are not charged on shares held by affiliates. Under the Fund’s Class A reimbursement distribution plan, the Fund reimburses Distributors for costs incurred in connection with the servicing, sale and distribution of the Fund’s shares up to the maximum annual plan rate. Under the Class A reimbursement distribution plan, costs exceeding the maximum for the current plan year cannot be reimbursed in subsequent periods. In addition, under the Fund’s Class C and R compensation distribution plans, the Fund pays Distributors for costs incurred in connection with the servicing, sale and distribution of the Fund’s shares up to the maximum annual plan rate for each class. The plan year, for purposes of monitoring compliance with the maximum annual plan rates, is February 1 through January 31.
The maximum annual plan rates, based on the average daily net assets, for each class, are as follows:
| | |
| Class A | 0.35 | % |
| Class C | 1.00 | % |
| Class R | 0.50 | % |
The Board has set the current rate at 0.30% per year for Class A shares until further notice and approval by the Board.
d. Sales Charges/Underwriting Agreements
Front-end sales charges and contingent deferred sales charges (CDSC) do not represent expenses of the Fund. These charges are deducted from the proceeds of sales of Fund shares prior to investment or from redemption proceeds prior to remittance, as applicable. Distributors has advised the Fund of the following commission transactions related to the sales and redemptions of the Fund’s shares for the year:
| | |
| Sales charges retained net of commissions paid to unaffiliated | | |
| broker/dealers | $ | 162,296 |
| CDSC retained | $ | 19,649 |
e. Transfer Agent Fees
Each class of shares, except for Class R6, pays transfer agent fees to Investor Services for its performance of shareholder servicing obligations and reimburses Investor Services for out of pocket expenses incurred, including shareholding servicing fees paid to third parties. These fees are allocated daily based upon their relative proportion of such classes’ aggregate net assets. Class R6 pays Investor Services transfer agent fees specific to that class.
For the year ended December 31, 2014, the Fund paid transfer agent fees of $3,273,208, of which $1,694,105 was retained by Investor Services.
f. Investments in Institutional Fiduciary Trust Money Market Portfolio
The Fund invests in Institutional Fiduciary Trust Money Market Portfolio (Sweep Money Fund), an affiliated open-end management investment company. Management fees paid by the Fund are waived on assets invested in the Sweep Money Fund, as noted on the Statement of Operations, in an amount not to exceed the management and administrative fees paid directly or indirectly by the Sweep Money Fund. Prior to January 1, 2014, the waiver was accounted for as a reduction to management fees.
g. Waiver and Expense Reimbursements
Effective January 1, 2015, TAML and Investor Services have contractually agreed in advance to waive or limit their respective fees and to assume as their own expense certain expenses otherwise payable by the Fund so that the expenses (excluding distribution fees and acquired fund fees and expenses) for Class A, Class C, Class R and Advisor Class of the Fund do not exceed 1.40%, and
franklintempleton.com
Annual Report
| 31
TEMPLETON DEVELOPING MARKETS TRUST
NOTES TO FINANCIAL STATEMENTS
3. Transactions with Affiliates (continued)
g. Waiver and Expense Reimbursements (continued)
Class R6 does not exceed 1.22% based on the average net assets of each class (other than certain non-routine expenses or costs, including those relating to litigation, indemnification, reorganizations, and liquidations) until April 30, 2016.
Additionally, Investor Services has contractually agreed in advance to waive or limit its fees so that the Class R6 transfer agent fees do not exceed 0.01% until April 30, 2015. There were no Class R6 transfer agent fees waived during the year ended December 31, 2014.
4. Expense Offset Arrangement
The Fund has entered into an arrangement with its custodian whereby credits realized as a result of uninvested cash balances are used to reduce a portion of the Fund’s custodian expenses. During the year ended December 31, 2014, there were no credits earned.
5. Income Taxes
For tax purposes, the Fund may elect to defer any portion of a post-October capital loss on the first day of the following fiscal year. At December 31, 2014, the Fund deferred post-October capital losses of $3,785,235.
The tax character of distributions paid during the years ended December 31, 2014 and 2013, was as follows:
| | | | |
| | | 2014 | | 2013 |
| Distributions paid from: | | | | |
| Ordinary income | $ | 26,088,568 | $ | 26,195,185 |
| Long term capital gain | | 296,802,797 | | 13,026,853 |
| | $ | 322,891,365 | $ | 39,222,038 |
At December 31, 2014, the cost of investments, net unrealized appreciation (depreciation) and undistributed ordinary income for income tax purposes were as follows:
| | | |
| Cost of investments | $ | 1,551,310,227 | |
| |
| Unrealized appreciation | $ | 205,516,904 | |
| Unrealized depreciation | | (125,396,469 | ) |
| Net unrealized appreciation (depreciation) | $ | 80,120,435 | |
| |
| Distributable earnings - undistributed ordinary income | $ | 2,605,971 | |
Differences between income and/or capital gains as determined on a book basis and a tax basis are primarily due to differing treatments of foreign currency transactions, passive foreign investment company shares, corporate actions and wash sales.
6. Investment Transactions
Purchases and sales of investments (excluding short term securities) for the year ended December 31, 2014, aggregated $1,534,340,578 and $1,794,667,150, respectively.
7. Concentration of Risk
Investing in foreign securities may include certain risks and considerations not typically associated with investing in U.S. securities, such as fluctuating currency values and changing local and regional economic, political and social conditions, which may result in greater market volatility. In addition, certain foreign securities may not be as liquid as U.S. securities.
32 | Annual Report
franklintempleton.com
TEMPLETON DEVELOPING MARKETS TRUST
NOTES TO FINANCIAL STATEMENTS
| | | | | | | | | | |
| 8. Holdings of 5% Voting Securities of Portfolio Companies | | | | | | | |
| |
| The 1940 Act defines “affiliated companies” to include investments in portfolio companies in which a fund owns 5% or more of | |
| the outstanding voting securities. Investments in “affiliated companies” for the Fund for the year ended December 31, 2014, were | |
| as shown below. | | | | | | | | | | |
| |
| | Number of | | | Number of | | | | | | |
| | Shares Held | | | Shares Held | | | | | Realized | |
| | at Beginning | Gross | Gross | at End | Value at End | | Investment | | Capital | |
| Name of Issuer | of Year | Additions | Reductions | of Year | of Year | | Income | | Gain (Loss) | |
| Controlled Affiliatesa | | | | | | | | | | |
| Mayfair Hanoi, Ltd., 37.50% | | | | | | | | | | |
| equity owned through HEA | | | | | | | | | | |
| Holdings Ltd., a wholly owned | | | | | | | | | | |
| investment | — | — | —b | — | $ — | $ | 913,800 | $ | (1,594,668 | ) |
| |
| aIssuer in which the Fund owns 25% or more of the outstanding voting securities. | | | | | | | |
| bThe investment was sold during the year. | | | | | | | | | | |
9. Credit Facility
The Fund, together with other U.S. registered and foreign investment funds (collectively, Borrowers), managed by Franklin Templeton Investments, are borrowers in a joint syndicated senior unsecured credit facility totaling $1.5 billion (Global Credit Facility) which matured on February 13, 2015. This Global Credit Facility provides a source of funds to the Borrowers for temporary and emergency purposes, including the ability to meet future unanticipated or unusually large redemption requests. Effective February 13, 2015, the Borrowers renewed the Global Credit Facility for a total of $2 billion, which matures on February 12, 2016.
Under the terms of the Global Credit Facility, the Fund shall, in addition to interest charged on any borrowings made by the Fund and other costs incurred by the Fund, pay its share of fees and expenses incurred in connection with the implementation and maintenance of the Global Credit Facility, based upon its relative share of the aggregate net assets of all of the Borrowers, including an annual commitment fee of 0.07% based upon the unused portion of the Global Credit Facility. These fees are reflected in other expenses on the Statement of Operations. During the year ended December 31, 2014, the Fund did not use the Global Credit Facility.
10. Fair Value Measurements
The Fund follows a fair value hierarchy that distinguishes between market data obtained from independent sources (observable inputs) and the Fund’s own market assumptions (unobservable inputs). These inputs are used in determining the value of the Fund’s financial instruments and are summarized in the following fair value hierarchy:
• Level 1 – quoted prices in active markets for identical financial instruments
• Level 2 – other significant observable inputs (including quoted prices for similar financial instruments, interest rates, prepayment speed, credit risk, etc.)
• Level 3 – significant unobservable inputs (including the Fund’s own assumptions in determining the fair value of financial instruments)
The input levels are not necessarily an indication of the risk or liquidity associated with financial instruments at that level.
For movements between the levels within the fair value hierarchy, the Fund has adopted a policy of recognizing the transfers as of the date of the underlying event which caused the movement.
franklintempleton.com Annual Report | 33
TEMPLETON DEVELOPING MARKETS TRUST
NOTES TO FINANCIAL STATEMENTS
| | | | | | | | |
| 10. Fair Value Measurements (continued) | | | | | | | | |
| |
| A summary of inputs used as of December 31, 2014, in valuing the Fund’s assets carried at fair value, is as follows: | | |
| |
| | | Level 1 | | Level 2 | | Level 3 | | Total |
| Assets: | | | | | | | | |
| Investments in Securities: | | | | | | | | |
| Equity Investmentsa,b | $ | 1,540,317,734 | $ | — | $ | — | $ | 1,540,317,734 |
| Participatory Notes | | — | | 18,955,095 | | — | | 18,955,095 |
| Short Term Investments | | 72,157,833 | | — | | — | | 72,157,833 |
| Total Investments in Securities | $ | 1,612,475,567 | $ | 18,955,095 | $ | — | $ | 1,631,430,662 |
| |
| alncludes common and preferred stocks. | | | | | | | | |
| bFor detailed categories, see the accompanying Statement of Investments. | | | | | | | | |
| |
| 11. New Accounting Pronouncements |
| In June 2014, the Financial Accounting Standards Board issued Accounting Standards Update (ASU) No. 2014-11, Transfers and |
| Servicing (Topic 860), Repurchase-to-Maturity Transactions, Repurchase Financings, and Disclosures. The ASU changes the |
| accounting for certain repurchase agreements and expands disclosure requirements related to repurchase agreements, securities |
| lending, repurchase-to-maturity and similar transactions. The ASU is effective for interim and annual reporting periods beginning |
| after December 15, 2014. Management has reviewed the requirements and believes the adoption of this ASU will not have a mate- |
| rial impact on the financial statements. |
| |
| 12. Subsequent Events |
| The Fund has evaluated subsequent events through the issuance of the financial statements and determined that no events have |
| occurred that require disclosure other than those already disclosed in the financial statements. |
| |
| |
| Abbreviations |
| Selected Portfolio |
| ADR | American Depositary Receipt |
| GDR | Global Depositary Receipt |

TEMPLETON DEVELOPING MARKETS TRUST
Report of Independent Registered Public Accounting Firm
To the Board of Trustees and Shareholders of Templeton Developing Markets Trust
In our opinion, the accompanying statement of assets and liabilities, including the statement of investments, and the related statements of operations and of changes in net assets and the financial highlights present fairly, in all material respects, the financial position of Templeton Developing Markets Trust (the “Fund”) at December 31, 2014, the results of its operations for the year then ended, the changes in its net assets for each of the two years in the period then ended and the financial highlights for each of the periods presented, in conformity with accounting principles generally accepted in the United States of America. These financial statements and financial highlights (hereafter referred to as “financial statement”) are the responsibility of the Fund’s management. Our responsibility is to express an opinion on these financial statements based on our audits. We conducted our audits of these financial statements in accordance with the standards of the Public Company Accounting Oversight Board (United States). Those standards require that we plan and perform the audit to obtain reasonable assurance about whether the financial statements are free of material misstatement. An audit includes examining, on a test basis, evidence supporting the amounts and disclosures in the financial statements, assessing the accounting principles used and significant estimates made by management, and evaluating the overall financial statement presentation. We believe that our audits, which included confirmation of securities at December 31, 2014 by correspondence with the custodian, transfer agent and brokers, provide a reasonable basis for our opinion.
PricewaterhouseCoopers LLP
San Francisco, California
February 18, 2015
franklintempleton.com
Annual Report
| 35
TEMPLETON DEVELOPING MARKETS TRUST
Tax Information (unaudited)
Under Section 852(b)(3)(C) of the Internal Revenue Code (Code), the Fund hereby reports the maximum amount allowable but no less than $296,802,796 as a long term capital gain dividend for the fiscal year ended December 31, 2014.
Under Section 854(b)(1)(A) of the Code, the Fund hereby reports 1.96% of the ordinary income dividends as income qualifying for the dividends received deduction for the fiscal year ended December 31, 2014.
Under Section 854(b)(1)(B) of the Code, the Fund hereby reports the maximum amount allowable but no less than $28,045,200 as qualified dividends for purposes of the maximum rate under Section 1(h)(11) of the Code for the fiscal year ended December 31, 2014. Distributions, including qualified dividend income, paid during calendar year 2014 will be reported to shareholders on Form 1099-DIV by mid-February 2015. Shareholders are advised to check with their tax advisors for information on the treatment of these amounts on their individual income tax returns.
At December 31, 2014, more than 50% of the Fund’s total assets were invested in securities of foreign issuers. In most instances, foreign taxes were withheld from income paid to the Fund on these investments. As shown in the table below, the Fund hereby reports to shareholders the foreign source income and foreign taxes paid, pursuant to Section 853 of the Code. This written statement will allow shareholders of record on December 22, 2014, to treat their proportionate share of foreign taxes paid by the Fund as having been paid directly by them. The shareholder shall consider these amounts as foreign taxes paid in the tax year in which they receive the Fund distribution.
The following table provides a detailed analysis of foreign tax paid, foreign source income, and foreign source qualified dividends as reported by the Fund, to Class A, Class C, Class R, Class R6 and Advisor Class shareholders of record.
| | | | | | |
| | | Foreign Tax Paid | | Foreign Source | | Foreign Source Qualified |
| Class | | Per Share | | Income Per Share | | Dividends Per Share |
| Class A | $ | 0.0472 | $ | 0.3904 | $ | 0.1667 |
| Class C | $ | 0.0472 | $ | 0.2326 | $ | 0.0993 |
| Class R | $ | 0.0472 | $ | 0.3474 | $ | 0.1482 |
| Class R6 | $ | 0.0472 | $ | 0.4960 | $ | 0.2115 |
| Advisor Class | $ | 0.0472 | $ | 0.4550 | $ | 0.1942 |
Foreign Tax Paid Per Share (Column 1) is the amount per share available to you, as a tax credit (assuming you held your shares in the Fund for a minimum of 16 days during the 31-day period beginning 15 days before the ex-dividend date of the Fund’s distribution to which the foreign taxes relate), or, as a tax deduction.
Foreign Source Income Per Share (Column 2) is the amount per share of income dividends attributable to foreign securities held by the Fund, plus any foreign taxes withheld on these dividends. The amounts reported include foreign source qualified dividends that have not been adjusted for the rate differential applicable to such dividend income.1
Foreign Source Qualified Dividends Per Share (Column 3) is the amount per share of foreign source qualified dividends, plus any foreign taxes withheld on these dividends. These amounts represent the portion of the Foreign Source Income reported to you in column 2 that were derived from qualified foreign securities held by the Fund.1
By mid-February 2015, shareholders will receive Form 1099-DIV which will include their share of taxes paid and foreign source income distributed during the calendar year 2014. The Foreign Source Income reported on Form 1099-DIV has not been adjusted for the rate differential on foreign source qualified dividend income. Shareholders are advised to check with their tax advisors for information on the treatment of these amounts on their 2014 individual income tax returns.
1Qualified dividends are taxed at reduced long term capital gains tax rates. In determining the amount of foreign tax credit that may be applied against the U.S. tax liability of individuals receiving foreign source qualified dividends, adjustments may be required to the foreign tax credit limitation calculation to reflect the rate differential applicable to such dividend income. The rules however permit certain individuals to elect not to apply the rate differential adjustments for capital gains and/or dividends for any taxable year. Please consult your tax advisor and the instructions to Form 1116 for more information.
36 | Annual Report
franklintempleton.com
TEMPLETON DEVELOPING MARKETS TRUST
| | | | |
| Board Members and Officers | | |
| |
| The name, year of birth and address of the officers and board members, as well as their affiliations, positions held with the Trust, |
| principal occupations during at least the past five years and number of portfolios overseen in the Franklin Templeton Investments |
| fund complex are shown below. Generally, each board member serves until that person’s successor is elected and qualified. |
| |
| |
| Independent Board Members | | | |
| |
| | | | Number of Portfolios in | |
| Name, Year of Birth | | Length of | Fund Complex Overseen | Other Directorships Held During |
| and Address | Position | Time Served | by Board Member* | at Least the Past 5 Years |
| |
| |
| Harris J. Ashton (1932) | Trustee | Since 1992 | 137 | Bar-S Foods (meat packing company) |
| 300 S.E. 2nd Street | | | | (1981-2010). |
| Fort Lauderdale, FL 33301-1923 | | | | |
| Principal Occupation During at Least the Past 5 Years: | | |
| Director of various companies; and formerly, Director, RBC Holdings, Inc. (bank holding company) (until 2002); and President, Chief |
| Executive Officer and Chairman of the Board, General Host Corporation (nursery and craft centers) (until 1998). |
| |
| Ann Torre Bates (1958) | Trustee | Since 2008 | 36 | Navient Corporation (loan |
| 300 S.E. 2nd Street | | | | management, servicing and asset |
| Fort Lauderdale, FL 33301-1923 | | | | recovery) (May 2014), Ares Capital |
| | | | | Corporation (specialty finance |
| | | | | company) (2010-present), United |
| | | | | Natural Foods, Inc. (distributor of |
| | | | | natural, organic and specialty foods) |
| | | | | (2013-present), Allied Capital |
| | | | | Corporation (financial services) |
| | | | | (2003-2010) and SLM Corporation |
| | | | | (Sallie Mae) (1997-2014). |
| Principal Occupation During at Least the Past 5 Years: | | |
| Director of various companies; and formerly, Executive Vice President and Chief Financial Officer, NHP Incorporated (manager of multifamily |
| housing) (1995-1997); and Vice President and Treasurer, US Airways, Inc. (until 1995). | |
| |
| Frank J. Crothers (1944) | Trustee | Since 1991 | 26 | Talon Metals Corp. (mining |
| 300 S.E. 2nd Street | | | | exploration), Fortis, Inc. (utility holding |
| Fort Lauderdale, FL 33301-1923 | | | | company) and AML Foods Limited |
| | | | | (retail distributors). |
| |
| Principal Occupation During at Least the Past 5 Years: | | |
| Director and Vice Chairman, Caribbean Utilities Company, Ltd.; director of various other private business and nonprofit organizations; and |
| formerly, Chairman, Atlantic Equipment and Power Ltd. (1977-2003). | | |
| |
| Edith E. Holiday (1952) | Lead | Trustee since | 137 | Hess Corporation (exploration and |
| 300 S.E. 2nd Street | Independent | 1996 and Lead | | refining of oil and gas), H.J. Heinz |
| Fort Lauderdale, FL 33301-1923 | Trustee | Independent | | Company (processed foods and |
| | | Trustee since | | allied products) (1994-2013), RTI |
| | | 2007 | | International Metals, Inc. (manufacture |
| | | | | and distribution of titanium), Canadian |
| | | | | National Railway (railroad) and White |
| | | | | Mountains Insurance Group, Ltd. |
| | | | | (holding company). |
| Principal Occupation During at Least the Past 5 Years: | | |
| Director or Trustee of various companies and trusts; and formerly, Assistant to the President of the United States and Secretary of the Cabinet |
| (1990-1993); General Counsel to the United States Treasury Department (1989-1990); and Counselor to the Secretary and Assistant |
| Secretary for Public Affairs and Public Liaison – United States Treasury Department (1988-1989). | |

TEMPLETON DEVELOPING MARKETS TRUST
| | | | | |
| Independent Board Members (continued) | | |
| |
| | | | | Number of Portfolios in | |
| Name, Year of Birth | | | Length of | Fund Complex Overseen | Other Directorships Held During |
| and Address | | Position | Time Served | by Board Member* | at Least the Past 5 Years |
| |
| J. Michael Luttig (1954) | | Trustee | Since 2009 | 137 | Boeing Capital Corporation |
| 300 S.E. 2nd Street | | | | | (aircraft financing) 2006-2013). |
| Fort Lauderdale, FL 33301-1923 | | | | | |
| Principal Occupation During at Least the Past 5 Years: | | |
| Executive Vice President, General Counsel and member of the Executive Council, The Boeing Company (aerospace company); and formerly, |
| Federal Appeals Court Judge, U.S. Court of Appeals for the Fourth Circuit (1991-2006). | |
| |
| David W. Niemiec (1949) | | Trustee | Since 2005 | 33 | Emeritus Corporation (assisted |
| 300 S.E. 2nd Street | | | | | living) (1999-2010) and OSI |
| Fort Lauderdale, FL 33301-1923 | | | | | Pharmaceuticals, Inc. (pharmaceutical |
| | | | | | products) (2006-2010). |
| Principal Occupation During at Least the Past 5 Years: | | |
| Advisor, Saratoga Partners (private equity fund); and formerly, Managing Director, Saratoga Partners (1998-2001) and SBC Warburg Dillon |
| Read (investment banking) (1997-1998); Vice Chairman, Dillon, Read & Co. Inc. (investment banking) (1991-1997); and Chief Financial |
| Officer, Dillon, Read & Co. Inc. (1982-1997). | | | |
| |
| Frank A. Olson (1932) | | Trustee | Since 2003 | 137 | Hess Corporation (exploration and |
| 300 S.E. 2nd Street | | | | | refining of oil and gas) (1998-2013). |
| Fort Lauderdale, FL 33301-1923 | | | | | |
| Principal Occupation During at Least the Past 5 Years: | | |
| Director of various companies; and formerly, Chairman of the Board, The Hertz Corporation (car rental) (1980-2000) and Chief Executive |
| Officer (1977-1999); and Chairman of the Board, President and Chief Executive Officer, UAL Corporation (airlines) (June-December 1987). |
| |
| Larry D. Thompson (1945) | | Trustee | Since 2005 | 137 | Cbeyond, Inc. (business communi- |
| 300 S.E. 2nd Street | | | | | cations provider) (2010-2012), |
| Fort Lauderdale, FL 33301-1923 | | | | | The Southern Company (energy |
| | | | | | company) (December 2014; pre- |
| | | | | | viously 2010-2012) and Graham |
| | | | | | Holdings Company (education and |
| | | | | | media organization) (2011-present). |
| Principal Occupation During at Least the Past 5 Years: | | |
| Executive Vice President – Government Affairs, General Counsel and Corporate Secretary, PepsiCo, Inc. (consumer products) (2012-present); |
| and formerly, John A. Sibley Professor of Corporate and Business Law, University of Georgia School of Law (2011-2012); Senior Vice |
| President – Government Affairs, General Counsel and Secretary, PepsiCo, Inc. (2004-2011); Senior Fellow of The Brookings Institution |
| (2003-2004); Visiting Professor, University of Georgia School of Law (2004); and Deputy Attorney General, U.S. Department of Justice |
| (2001-2003). | | | | | |
| |
| Constantine D. Tseretopoulos Trustee | Since 1991 | 26 | None |
| (1954 | ) | | | | |
| 300 S.E. 2nd Street | | | | | |
| Fort Lauderdale, FL 33301-1923 | | | | | |
| Principal Occupation During at Least the Past 5 Years: | | |
| Physician, Chief of Staff, owner and operator of the Lyford Cay Hospital (1987-present); director of various nonprofit organizations; and |
| formerly, Cardiology Fellow, University of Maryland (1985-1987); and Internal Medicine Resident, Greater Baltimore Medical Center |
| (1982-1985). | | | | | |
| |
| Robert E. Wade (1946) | | Trustee | Since 2006 | 43 | El Oro Ltd (investments). |
| 300 S.E. 2nd Street | | | | | |
| Fort Lauderdale, FL 33301-1923 | | | | | |
| Principal Occupation During at Least the Past 5 Years: | | |
| Attorney at law engaged in private practice (1972-2008) and member of various boards. | |
| |
| |
| 38 | Annual Report | | | | | franklintempleton.com |
TEMPLETON DEVELOPING MARKETS TRUST
| | | | |
| Interested Board Members and Officers | | |
| |
| | | | Number of Portfolios in | |
| Name, Year of Birth | | Length of | Fund Complex Overseen | Other Directorships Held During |
| and Address | Position | Time Served | by Board Member* | at Least the Past 5 Years |
| |
| **Gregory E. Johnson (1961) | Trustee | Since 2007 | 147 | None |
| One Franklin Parkway | | | | |
| San Mateo, CA 94403-1906 | | | | |
| Principal Occupation During at Least the Past 5 Years: | | |
| Chairman of the Board, Member – Office of the Chairman, Director, President and Chief Executive Officer, Franklin Resources, Inc.; officer |
| and/or director or trustee, as the case may be, of some of the other subsidiaries of Franklin Resources, Inc. and of 44 of the investment |
| companies in Franklin Templeton Investments; and Chairman, Investment Company Institute. | |
| |
| **Rupert H. Johnson, Jr. (1940) Chairman of | Chairman of the | 137 | None |
| One Franklin Parkway | the Board, | Board and Trustee | | |
| San Mateo, CA 94403-1906 | Trustee and | since 2013, and | | |
| | Vice President | Vice President | | |
| | | since 1996 | | |
| Principal Occupation During at Least the Past 5 Years: | | |
| Vice Chairman, Member – Office of the Chairman and Director, Franklin Resources, Inc.; Director, Franklin Advisers, Inc.; Senior Vice |
| President, Franklin Advisory Services, LLC; and officer and/or director or trustee, as the case may be, of some of the other subsidiaries of |
| Franklin Resources, Inc. and of 43 of the investment companies in Franklin Templeton Investments. | |
| |
| Alison E. Baur (1964) | Vice President | Since 2012 | Not Applicable | Not Applicable |
| One Franklin Parkway | | | | |
| San Mateo, CA 94403-1906 | | | | |
| Principal Occupation During at Least the Past 5 Years: | | |
| Deputy General Counsel, Franklin Templeton Investments; and officer of some of the other subsidiaries of Franklin Resources, Inc. and of 46 |
| of the investment companies in Franklin Templeton Investments. | | |
| |
| Laura F. Fergerson (1962) | Chief Executive Since 2009 | Not Applicable | Not Applicable |
| One Franklin Parkway | Officer – | | | |
| San Mateo, CA 94403-1906 | Finance and | | | |
| | Administration | | | |
| Principal Occupation During at Least the Past 5 Years: | | |
| Senior Vice President, Franklin Templeton Services, LLC; and officer of 46 of the investment companies in Franklin Templeton Investments. |
| |
| Aliya S. Gordon (1973) | Vice President | Since 2009 | Not Applicable | Not Applicable |
| One Franklin Parkway | | | | |
| San Mateo, CA 94403-1906 | | | | |
| Principal Occupation During at Least the Past 5 Years: | | |
| Senior Associate General Counsel, Franklin Templeton Investments; officer of 46 of the investment companies in Franklin Templeton |
| Investments; and formerly, Litigation Associate, Steefel, Levitt & Weiss, LLP (2000-2004). | |
| |
| Steven J. Gray (1955) | Vice President | Since 2009 | Not Applicable | Not Applicable |
| One Franklin Parkway | | | | |
| San Mateo, CA 94403-1906 | | | | |
| Principal Occupation During at Least the Past 5 Years: | | |
| Senior Associate General Counsel, Franklin Templeton Investments; Vice President, Franklin Templeton Distributors, Inc. and Franklin |
| Alternative Strategies Advisers, LLC; and officer of 46 of the investment companies in Franklin Templeton Investments. |
franklintempleton.com Annual Report | 39
TEMPLETON DEVELOPING MARKETS TRUST
| | | | |
| Interested Board Members and Officers (continued) | |
| |
| | | | Number of Portfolios in | |
| Name, Year of Birth | | Length of | Fund Complex Overseen | Other Directorships Held During |
| and Address | Position | Time Served | by Board Member* | at Least the Past 5 Years |
| |
| Selena L. Holmes (1965) | Vice President | Since 2012 | Not Applicable | Not Applicable |
| 100 Fountain Parkway | – AML | | | |
| St. Petersburg, FL 33716-1205 | Compliance | | | |
| Principal Occupation During at Least the Past 5 Years: | | |
| Director, Global Compliance Monitoring; Chief Compliance Officer, Franklin Alternative Strategies Advisers, LLC; Vice President, Franklin |
| Templeton Companies, LLC; and officer of 46 of the investment companies in Franklin Templeton Investments. |
| |
| Mark Mobius (1936) | President and | President since | Not Applicable | Not Applicable |
| 17th Floor, | Chief Executive 1991 and Chief | | |
| The Chater House | Officer – | Executive Officer | | |
| 8 Connaught Road | Investment | – Investment | | |
| Central Hong Kong | Management | Management | | |
| | | since 2002 | | |
| Principal Occupation During at Least the Past 5 Years: | | |
| Portfolio Manager of various Templeton advisory affiliates; Executive Chairman, Templeton Emerging Markets Group; and officer and/or |
| director, as the case may be, of some of the other subsidiaries of Franklin Resources, Inc. and of six of the investment companies in Franklin |
| Templeton Investments. | | | | |
| |
| Kimberly H. Novotny (1972) | Vice President | Since 2013 | Not Applicable | Not Applicable |
| 300 S.E. 2nd Street | | | | |
| Fort Lauderdale, FL 33301-1923 | | | | |
| Principal Occupation During at Least the Past 5 Years: | | |
| Associate General Counsel, Franklin Templeton Investments; Vice President and Secretary, Fiduciary Trust International of the South; Vice |
| President, Templeton Investment Counsel, LLC; Assistant Secretary, Franklin Resources, Inc.; and officer of 46 of the investment companies |
| in Franklin Templeton Investments. | | | |
| |
| Mark H. Otani (1968) | Treasurer, | Since 2009 | Not Applicable | Not Applicable |
| One Franklin Parkway | Chief Financial | | | |
| San Mateo, CA 94403-1906 | Officer and | | | |
| | Chief | | | |
| | Accounting | | | |
| | Officer | | | |
| Principal Occupation During at Least the Past 5 Years: | | |
| Director, Global Fund Accounting Operations, Franklin Templeton Investments; and officer of 14 of the investment companies in Franklin |
| Templeton Investments. | | | | |
| |
| Robert C. Rosselot (1960) | Chief | Since 2013 | Not Applicable | Not Applicable |
| 300 S.E. 2nd Street | Compliance | | | |
| Fort Lauderdale, FL 33301-1923 | Officer | | | |
| Principal Occupation During at Least the Past 5 Years: | | |
| Director, Global Compliance, Franklin Templeton Investments; Vice President, Franklin Templeton Companies, LLC; officer of 46 of the |
| investment companies in Franklin Templeton Investments; and formerly, Senior Associate General Counsel, Franklin Templeton Investments |
| (2007-2013); and Secretary and Vice President, Templeton Group of Funds (2004-2013). | |
40 | Annual Report franklintempleton.com
TEMPLETON DEVELOPING MARKETS TRUST
| | | | |
| Interested Board Members and Officers (continued) | |
| |
| | | | Number of Portfolios in | |
| Name, Year of Birth | | Length of | Fund Complex Overseen | Other Directorships Held During |
| and Address | Position | Time Served | by Board Member* | at Least the Past 5 Years |
| |
| Karen L. Skidmore (1952) | Vice President | Since 2009 | Not Applicable | Not Applicable |
| One Franklin Parkway | | | | |
| San Mateo, CA 94403-1906 | | | | |
| Principal Occupation During at Least the Past 5 Years: | | |
| Senior Associate General Counsel, Franklin Templeton Investments; and officer of 46 of the investment companies in Franklin Templeton |
| Investments. | | | | |
| |
| Craig S. Tyle (1960) | Vice President | Since 2005 | Not Applicable | Not Applicable |
| One Franklin Parkway | | | | |
| San Mateo, CA 94403-1906 | | | | |
| Principal Occupation During at Least the Past 5 Years: | | |
| General Counsel and Executive Vice President, Franklin Resources, Inc.; and officer of some of the other subsidiaries of Franklin Resources, |
| Inc. and of 46 of the investment companies in Franklin Templeton Investments. | |
| |
| Lori A. Weber (1964) | Secretary and | Secretary since | Not Applicable | Not Applicable |
| 300 S.E. 2nd Street | Vice President | 2013 and Vice | | |
| Fort Lauderdale, FL 33301-1923 | | President since | | |
| | | 2011 | | |
| Principal Occupation During at Least the Past 5 Years: | | |
| Senior Associate General Counsel, Franklin Templeton Investments; Assistant Secretary, Franklin Resources, Inc.; Vice President and |
| Secretary, Templeton Investment Counsel, LLC; Vice President, Fiduciary Trust International of the South; and officer of 46 of the investment |
| companies in Franklin Templeton Investments. | | | |
*We base the number of portfolios on each separate series of the U.S. registered investment companies within the Franklin Templeton Investments fund complex.
These portfolios have a common investment manager or affiliated investment managers.
**Gregory E. Johnson is considered to be an interested person of the Fund under the federal securities laws due to his position as an officer and director of Franklin
Resources, Inc. (Resources), which is the parent company of the Fund’s investment manager and distributor. Rupert H. Johnson, Jr. is considered to be an interested
person of the Fund under the federal securities laws due to his position as officer and director and major shareholder of Resources.
Note 1: Rupert H. Johnson, Jr. is the uncle of Gregory E. Johnson.
Note 2: Officer information is current as of the date of this report. It is possible that after this date, information about officers may change.
The Sarbanes-Oxley Act of 2002 and Rules adopted by the U.S. Securities and Exchange Commission require the Fund to disclose whether the Fund’s Audit
Committee includes at least one member who is an audit committee financial expert within the meaning of such Act and Rules. The Fund’s Board has determined
that there is at least one such financial expert on the Audit Committee and has designated each of Ann Torre Bates and David W. Niemiec as an audit committee
financial expert. The Board believes that Ms. Bates and Mr. Niemiec qualify as such an expert in view of their extensive business background and experience.
Ms. Bates has served as a member of the Fund Audit Committee since 2008. She currently serves as a director of Navient Corporation (May 2014), Ares Capital
Corporation and United Natural Foods, Inc. and was formerly a director of SLM Corporation from 1997 to 2014 and Allied Capital Corporation from 2003 to 2010,
Executive Vice President and Chief Financial Officer of NHP Incorporated and Vice President and Treasurer of US Airways, Inc. Mr. Niemiec has served as a
member of the Fund Audit Committee since 2005, currently serves as an Advisor to Saratoga Partners and was formerly its Managing Director from 1998 to 2001.
Mr. Niemiec was formerly a director of Emeritus Corporation from 1999 to 2010 and OSI Pharmaceuticals, Inc. from 2006 to 2010, Managing Director of SBC
Warburg Dillon Read from 1997 to 1998, and was Vice Chairman from 1991 to 1997 and Chief Financial Officer from 1982 to 1997 of Dillon, Read & Co. Inc. As
a result of such background and experience, the Board believes that Ms. Bates and Mr. Niemiec have each acquired an understanding of generally accepted
accounting principles and financial statements, the general application of such principles in connection with the accounting estimates, accruals and reserves,
and analyzing and evaluating financial statements that present a breadth and level of complexity of accounting issues generally comparable to those of the
Fund, as well as an understanding of internal controls and procedures for financial reporting and an understanding of audit committee functions. Ms. Bates and
Mr. Niemiec are independent Board members as that term is defined under the applicable U.S. Securities and Exchange Commission Rules and Releases or the
listing standards applicable to the Fund.
The Statement of Additional Information (SAI) includes additional information about the board members and is available, without charge, upon request.
Shareholders may call (800) DIAL BEN/342-5236 to request the SAI.
TEMPLETON DEVELOPING MARKETS TRUST
Shareholder Information
Proxy Voting Policies and Procedures
The Trust’s investment manager has established Proxy Voting Policies and Procedures (Policies) that the Trust uses to determine how to vote proxies relating to portfolio securities. Shareholders may view the Trust’s complete Policies online at franklintempleton.com. Alternatively, shareholders may request copies of the Policies free of charge by calling the Proxy Group collect at (954) 527-7678 or by sending a written request to: Franklin Templeton Companies, LLC, 300 S.E. 2nd Street, Fort Lauderdale, FL 33301, Attention: Proxy Group. Copies of the Trust’s proxy voting records are also made available online at franklintempleton.com and posted on the U.S. Securities and Exchange Commission’s website at sec.gov and reflect the most recent 12-month period ended June 30.
Quarterly Statement of Investments
The Trust files a complete statement of investments with the U.S. Securities and Exchange Commission for the first and third quarters for each fiscal year on Form N-Q. Shareholders may view the filed Form N-Q by visiting the Commission’s website at sec.gov. The filed form may also be viewed and copied at the Commission’s Public Reference Room in Washington, DC. Information regarding the operations of the Public Reference Room may be obtained by calling (800) SEC-0330.
Householding of Reports and Prospectuses
You will receive the Fund’s financial reports every six months as well as an annual updated summary prospectus (prospectus available upon request). To reduce Fund expenses, we try to identify related shareholders in a household and send only one copy of the financial reports and summary prospectus. This process, called “householding,” will continue indefinitely unless you instruct us otherwise. If you prefer not to have these documents householded, please call us at (800) 632-2301. At any time you may view current prospectuses/summary prospectuses and financial reports on our website. If you choose, you may receive these documents through electronic delivery.
42 | Annual Report
franklintempleton.com
This page intentionally left blank.
This page intentionally left blank.

Annual Report and Shareholder Letter
Templeton Developing Markets Trust
Investment Manager
Templeton Asset Management Ltd.
Distributor
Franklin Templeton Distributors, Inc.
(800) DIAL BEN® / 342-5236
franklintempleton.com
Shareholder Services
(800) 632-2301
Authorized for distribution only when accompanied or preceded by a summary prospectus and/or prospectus. Investors should carefully consider a fund’s investment goals, risks, charges and expenses before investing. A prospectus contains this and other information; please read it carefully before investing.
To help ensure we provide you with quality service, all calls to and from our service areas are monitored and/or recorded.
| |
| © 2015 Franklin Templeton Investments. All rights reserved. | 711 A 02/15 |
Item 2. Code of Ethics.
(a) The Registrant has adopted a code of ethics that applies to its principal executive officers and principal financial and accounting officer.
(c) N/A
(d) N/A
(f) Pursuant to Item 12(a)(1), the Registrant is attaching as an exhibit a copy of its code of ethics that applies to its principal executive officers and principal financial and accounting officer.
Item 3. Audit Committee Financial Expert.
(a)(1) The Registrant has an audit committee financial expert serving on its audit committee.
(2) The audit committee financial expert is David W. Niemiec and he is "independent" as defined under the relevant Securities and Exchange Commission Rules and Releases.
Item 4. Principal Accountant Fees and Services.
(a) Audit Fees
The aggregate fees paid to the principal accountant for professional services rendered by the principal accountant for the audit of the registrant’s annual financial statements or for services that are normally provided by the principal accountant in connection with statutory and regulatory filings or engagements were $48,699 for the fiscal year ended December 31, 2014 and $50,734 for the fiscal year ended December 31, 2013.
(b) Audit-Related Fees
There were no fees paid to the principal accountant for assurance and related services rendered by the principal accountant to the registrant that are reasonably related to the performance of the audit of the registrant's financial statements and are not reported under paragraph (a) of Item 4.
There were no fees paid to the principal accountant for assurance and related services rendered by the principal accountant to the registrant's investment adviser and any entity controlling, controlled by or under common control with the investment adviser that provides ongoing services to the registrant that are reasonably related to the performance of the audit of their financial statements.
(c) Tax Fees
There were no fees paid to the principal accountant for professional services rendered by the principal accountant to the registrant for tax compliance, tax advice and tax planning.
The aggregate fees paid to the principal accountant for professional services rendered by the principal accountant to the registrant’s investment adviser and any entity controlling, controlled by or under common control with the investment adviser that provides ongoing services to the registrant for tax compliance, tax advice and tax planning were $0 for the fiscal year ended December 31, 2014 and $6,930 for the fiscal year ended December 31, 2013. The services for which these fees were paid included technical tax consultation for capital gain tax and withholding tax reporting for foreign governments and requirements on local country’s self-certification forms.
(d) All Other Fees
The aggregate fees paid to the principal accountant for products and services rendered by the principal accountant to the registrant not reported in paragraphs (a)-(c) of Item 4 were $594 for the fiscal year ended December 31, 2014 and $0 for the fiscal year ended December 31, 2013. The services for which these fees were paid include review of materials provided to the fund Board in connection with the investment management contract renewal process.
The aggregate fees paid to the principal accountant for products and services rendered by the principal accountant to the registrant’s investment adviser and any entity controlling, controlled by or under common control with the investment adviser that provides ongoing services to the registrant other than services reported in paragraphs (a)-(c) of Item 4 were $165,087 for the fiscal year ended December 31, 2014 and $44,069 for the fiscal year ended December 31, 2013. The services for which these fees were paid included preparation and review of materials provided to the fund Board in connection with the investment management contract renewal process and certifying asset under management.
(e) (1) The registrant’s audit committee is directly responsible for approving the services to be provided by the auditors, including:
(i) pre-approval of all audit and audit related services;
(ii) pre-approval of all non-audit related services to be provided to the Fund by the auditors;
(iii) pre-approval of all non-audit related services to be provided to the registrant by the auditors to the registrant’s investment adviser or to any entity that controls, is controlled by or is under common control with the registrant’s investment adviser and that provides ongoing services to the registrant where the non-audit services relate directly to the operations or financial reporting of the registrant; and
(iv) establishment by the audit committee, if deemed necessary or appropriate, as an alternative to committee pre-approval of services to be provided by the auditors, as required by paragraphs (ii) and (iii) above, of policies and procedures to permit such services to be pre-approved by other means, such as through establishment of guidelines or by action of a designated member or members of the committee; provided the policies and procedures are detailed as to the particular service and the committee is informed of each service and such policies and procedures do not include delegation of audit committee responsibilities, as contemplated under the Securities Exchange Act of 1934, to management; subject, in the case of (ii) through (iv), to any waivers, exceptions or exemptions that may be available under applicable law or rules.
(e) (2) None of the services provided to the registrant described in paragraphs (b)-(d) of Item 4 were approved by the audit committee pursuant to paragraph (c)(7)(i)(C) of Rule 2-01 of regulation S-X.
(f) No disclosures are required by this Item 4(f).
(g) The aggregate non-audit fees paid to the principal accountant for services rendered by the principal accountant to the registrant and the registrant’s investment adviser and any entity controlling, controlled by or under common control with the investment adviser that provides ongoing services to the registrant were $165,681 for the fiscal year ended December 31, 2014 and $50,999 for the fiscal year ended December 31, 2013.
(h) The registrant’s audit committee of the board has considered whether the provision of non-audit services that were rendered to the registrant’s investment adviser (not including any sub-adviser whose role is primarily portfolio management and is subcontracted with or overseen by another investment adviser), and any entity controlling, controlled by, or under common control with the investment adviser that provides ongoing services to the registrant that were not pre-approved pursuant to paragraph (c)(7)(ii) of Rule 2-01 of Regulation S-X is compatible with maintaining the principal accountant’s independence.
Item 5. Audit Committee of Listed Registrants. N/A
Item 6. Schedule of Investments. N/A
Item 7. Disclosure of Proxy Voting Policies and Procedures for
Closed-End Management Investment Companies. N/A
Item 8. Portfolio Managers of Closed-End Management Investment Companies. N/A
Item 9. Purchases of Equity Securities by Closed-End Management Investment Company and Affiliated Purchasers. N/A
Item 10. Submission of Matters to a Vote of Security Holders.
There have been no changes to the procedures by which shareholders may recommend nominees to the Registrant's Board of Trustees that would require disclosure herein.
Item 11. Controls and Procedures.
(a) Evaluation of Disclosure Controls and Procedures. The Registrant maintains disclosure controls and procedures that are designed to ensure that information required to be disclosed in the Registrant’s filings under the Securities Exchange Act of 1934 and the Investment Company Act of 1940 is recorded, processed, summarized and reported within the periods specified in the rules and forms of the Securities and Exchange Commission. Such information is accumulated and communicated to the Registrant’s management, including its principal executive officer and principal financial officer, as appropriate, to allow timely decisions regarding required disclosure. The Registrant’s management, including the principal executive officer and the principal financial officer, recognizes that any set of controls and procedures, no matter how well designed and operated, can provide only reasonable assurance of achieving the desired control objectives.
Within 90 days prior to the filing date of this Shareholder Report on Form N-CSR, the Registrant had carried out an evaluation, under the supervision and with the participation of the Registrant’s management, including the Registrant’s principal executive officer and the Registrant’s principal financial officer, of the effectiveness of the design and operation of the Registrant’s disclosure controls and procedures. Based on such evaluation, the Registrant’s principal executive officer and principal financial officer concluded that the Registrant’s disclosure controls and procedures are effective.
(b) Changes in Internal Controls. There have been no changes in the Registrant’s internal controls or in other factors that could materially affect the internal controls over financial reporting subsequent to the date of their evaluation in connection with the preparation of this Shareholder Report on Form N-CSR.
Item 12. Exhibits.
(a)(1) Code of Ethics
(a)(2) Certifications pursuant to Section 302 of the Sarbanes-Oxley Act of 2002 of Laura F. Fergerson, Chief Executive Officer - Finance and Administration, and Mark H. Otani, Chief Financial Officer and Chief Accounting Officer
(b) Certifications pursuant to Section 906 of the Sarbanes-Oxley Act of 2002 of Laura F. Fergerson, Chief Executive Officer - Finance and Administration, and Mark H. Otani, Chief Financial Officer and Chief Accounting Officer
SIGNATURES
Pursuant to the requirements of the Securities Exchange Act of 1934 and the Investment Company Act of 1940, the registrant has duly caused this report to be signed on its behalf by the undersigned, thereunto duly authorized.
TEMPLETON DEVELOPING MARKETS TRUST
By /s/ LAURA F. FERGERSON
Laura F. Fergerson
Chief Executive Officer –
Finance and Administration
Date February 26, 2015
Pursuant to the requirements of the Securities Exchange Act of 1934 and the Investment Company Act of 1940, this report has been signed below by the following persons on behalf of the registrant and in the capacities and on the dates indicated.
By /s/ LAURA F. FERGERSON
Laura F. Fergerson
Chief Executive Officer –
Finance and Administration
Date February 26, 2015
By /s/ MARK H. OTANI
Mark H. Otani
Chief Financial Officer and
Chief Accounting Officer
Date February 26, 2015