UNITED STATES
SECURITIES AND EXCHANGE COMMISSION
Washington, DC 20549
FORM N-CSR
CERTIFIED SHAREHOLDER REPORT OF REGISTERED
MANAGEMENT INVESTMENT COMPANIES
Investment Company Act file number 811-06378
Templeton Developing Markets Trust
(Exact name of registrant as specified in charter)
300 S.E. 2nd Street, Fort Lauderdale, FL 33301-1923
(Address of principal executive offices) (Zip code)
Craig S. Tyle, One Franklin Parkway, San Mateo, CA 94403-1906
(Name and address of agent for service)
Registrant’s telephone number, including area code: (954) 527-7500
Date of fiscal year end: 12/31
Date of reporting period: 12/31/17
| Item 1. | Reports to Stockholders. |
| | | | |
| | 
| | Annual Report and Shareholder Letter December 31, 2017 |
|
Templeton Developing Markets Trust |
|

Sign up for electronic delivery at franklintempleton.com/edelivery
Franklin Templeton Investments
Gain From Our Perspective®
At Franklin Templeton Investments, we’re dedicated to one goal: delivering exceptional asset management for our clients. By bringing together multiple, world-class investment teams in a single firm, we’re able to offer specialized expertise across styles and asset classes, all supported by the strength and resources of one of the world’s largest asset managers. This has helped us to become a trusted partner to individual and institutional investors across the globe.
Dear Shareholder:
During the 12 months ended December 31, 2017, the global economy continued to expand, with emerging market economies overall growing faster than developed market economies. Encouraging economic data from many emerging market countries and corporate earnings growth helped offset investor concerns about interest rate increases in the US and geopolitical tensions in the Korean peninsula and other regions. Further supporting investor sentiment were a rebound in global commodities, emerging market currencies’ overall strength against the US dollar and investment inflows. In this environment, emerging market stocks generated a +37.75% total return, as measured by the MSCI Emerging Markets Index.1
We are committed to our long-term perspective and disciplined investment approach as we conduct a rigorous, fundamental analysis of securities with a regular emphasis on investment risk management.
Historically, patient investors have achieved rewarding results by evaluating their goals, diversifying their assets globally and maintaining a disciplined investment program, all hallmarks of the Templeton investment philosophy developed more than 60 years ago. We continue to recommend investors consult their financial advisors and review their portfolios to design a long-term strategy and portfolio allocation that meet their individual needs, goals and risk tolerance.
Templeton Developing Markets Trust’s annual report includes more detail about prevailing conditions and a discussion about investment decisions during the period. Please remember all securities markets fluctuate, as do mutual fund share prices.
We thank you for investing with Franklin Templeton, welcome your questions and comments, and look forward to serving your investment needs in the years ahead.
After more than three decades with Franklin Templeton, I will retire effective January 31, 2018. It has been a pleasure serving your investment needs.
Sincerely,

Mark Mobius
Executive Chairman
Templeton Emerging Markets Group
This letter reflects our analysis and opinions as of December 31, 2017, unless otherwise indicated. The information is not a complete analysis of every aspect of any market, country, industry, security or fund. Statements of fact are from sources considered reliable.
1. Source: Morningstar.
See www.franklintempletondatasources.com for additional data provider information.
| | | | | | | | |
| Not FDIC Insured | | | | | May Lose Value | | | | | No Bank Guarantee |
| | | | | | |
franklintempleton.com | | Not part of the annual report | | | 1 | |
Contents
Annual Report
Visit franklintempleton.com for fund updates, to access your account, or to find helpful financial planning tools.
| | | | | | |
| 2 | | | Annual Report | | franklintempleton.com |
Annual Report
Templeton Developing Markets Trust
We are pleased to bring you Templeton Developing Markets Trust’s annual report for the fiscal year ended December 31, 2017.
Your Fund’s Goal and Main Investments
The Fund seeks long-term capital appreciation. Under normal market conditions, the Fund invests at least 80% of its net assets in securities of companies located or operating in “developing market countries,” as defined in the Fund’s prospectus.
Performance Overview
The Fund’s Class A shares delivered a +40.20% cumulative total return for the 12 months under review. In comparison, the MSCI Emerging Markets (EM) Index generated a +37.75% total return, and the Standard & Poor’s®/International Finance Corporation Investable (S&P®/IFCI) Composite Index produced a +37.89% total return for the same period.1 The indexes measure global emerging market stock performance. Please note, index performance is provided for reference and we do not attempt to track an index but rather undertake investments on the basis of fundamental research. In addition, the Fund’s return reflects the effect of fees and expenses for professional management, while an index does not have such costs. You can find the Fund’s long-term performance data in the Performance Summary beginning on page 7.
Performance data represent past performance, which does not guarantee future results. Investment return and principal value will fluctuate, and you may have a gain or loss when you sell your shares. Current performance may differ from figures shown. For most recent month-end performance, go to franklintempleton.com or call (800) 342-5236.
Economic and Market Overview
Emerging market economies in general continued to grow faster than developed market economies during the 12 months under review. China’s economy grew faster in 2017 compared to the previous year, driven by solid growth in industrial production, services, fixed-asset investment, retail sales, and
Geographic Composition
Based on Total Net Assets as of 12/31/17
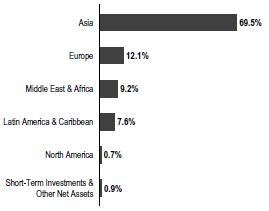
imports and exports. After moderating for two quarters, India’s economy grew faster in 2017’s third quarter compared to the prior-year period, as investment and inventory growth offset private and public spending slowdowns. Russia’s economy grew at the fastest annualized rate in nearly five years in 2017’s second quarter, but it grew slower in the third quarter as industrial production declined. Brazil’s economy grew in 2017’s third quarter compared to the prior-year period, supported by growth in household spending and exports. South Africa’s economic growth moderated in 2017’s third quarter compared to the prior-year period amid faster mining growth and manufacturing decline. South Korea’s economy grew in 2017’s fourth quarter compared to the prior-year period; however, it contracted compared to the third quarter due to declines in manufacturing and construction.
Several central banks, including those of South Korea and Mexico, raised their benchmark interest rates during the 12-month period, while some, including those of South Africa and Chile, lowered their benchmark interest rates. Russia’s central bank reduced its key rate several times as the inflation rate continued to miss its target. Brazil’s central bank cut its benchmark interest rate several times during the period to support economic growth. India’s central bank reduced its
1. Source: Morningstar.
The indexes are unmanaged and include reinvestment of any income or distributions. They do not reflect any fees, expenses or sales charges. One cannot invest directly in an index and an index is not representative of the Fund’s portfolio.
The dollar value, number of shares or principal amount, and names of all portfolio holdings are listed in the Fund’s Statement of Investments (SOI). The SOI begins on page 16.
| | | | | | |
franklintempleton.com | | Annual Report | | | 3 | |
TEMPLETON DEVELOPING MARKETS TRUST
benchmark interest rate in August due to slower inflation growth. China’s central bank left its benchmark interest rate unchanged during the period.
Emerging market stocks rose significantly during the 12 months under review, as improving corporate earnings growth and encouraging economic data from China and other emerging market countries helped offset investor concerns about the US Federal Reserve’s interest rate increases and geopolitical tensions in the Korean peninsula and other regions. Further supporting emerging market stocks were generally higher commodity prices, subsiding concerns about the potential for a protectionist US trade policy, emerging market currencies’ overall strength against the US dollar, and robust investment inflows. In this environment, emerging market stocks, as measured by the MSCI EM Index, generated a +37.75% total return for the 12 months ended December 31, 2017.1
Investment Strategy
We employ a fundamental research, value-oriented, long-term investment strategy. We focus on the market price of a company’s securities relative to our evaluation of its long-term earnings, asset value and cash flow potential. We also consider a company’s profit and loss outlook, balance sheet strength, cash flow trends and asset value in relation to the current price of the company’s securities. Our analysis considers the company’s corporate governance behavior as well as its position in its sector, the economic framework and political environment. We invest in securities without regard to benchmark comparisons.
Manager’s Discussion
During the 12 months under review, key contributors to the Fund’s absolute performance included investments in Naspers, Samsung Electronics and Brilliance China Automotive Holdings.
Naspers is an internet and media group based in South Africa. It has sizable investments in some of the world’s leading technology companies, including China-based Tencent Holdings2 and Russia-based Mail.Ru Group.2 Shares of Naspers rose during the 12-month period, largely driven by positive sentiment in Tencent, one of the world’s largest and most widely used internet service portals. Tencent reported strong year-over-year growth in quarterly earnings throughout 2017, driven by its online gaming, advertising and social
2. Also a Fund holding.
3. Not a Fund holding.
| | | | |
| Top 10 Countries | |
| 12/31/17 | |
| | | % of Total
Net Assets | |
China | | | 23.4% | |
South Korea | | | 17.3% | |
Taiwan | | | 10.3% | |
South Africa | | | 8.2% | |
India | | | 6.8% | |
Russia | | | 6.4% | |
Brazil | | | 5.1% | |
Thailand | | | 3.8% | |
UK | | | 3.2% | |
Indonesia | | | 3.1% | |
networking segments. Investors also viewed positively Naspers’s addition of new investments in the online food delivery segment in 2017.
Samsung Electronics is a major South Korea-based manufacturer of consumer electronics. It is one of the world’s largest manufacturers of mobile phones, smartphones, tablets and televisions. The company is also a leading supplier of memory chips for high-end phones and is a key provider of OLED (organic light-emitting diode) displays. Its share price increase was driven by solid quarterly corporate sales and earnings results reported in 2017, a new shareholder return policy for 2018-2020, including plans to boost its dividends, and a cancelation of existing company-held treasury shares. News that Samsung Electronics dethroned Intel3 to become the world’s largest chip producer in 2017 in revenue terms also contributed to investor sentiment
Brilliance China Automotive manufactures and sells automobiles for the Chinese domestic market, predominantly through its joint venture with BMW,3 a German luxury car manufacturer. The company reported strong sales volume and profit growth in 2017, supported by generally robust demand. The rise of China’s upper middle class has continued to drive luxury car demand in the country, as buyers pay more attention to vehicle performance and product quality. The announcement of a joint venture between Brilliance China Automotive and French automobile manufacturer Groupe Renault3 to manufacture and sell light commercial vehicles under the Jinbei, Renault and Huasong brands further supported share price performance.
| | | | |
4 | | Annual Report | | franklintempleton.com |
TEMPLETON DEVELOPING MARKETS TRUST
In contrast, key detractors from the Fund’s absolute performance included positions in Habib Bank, IMAX and Glenmark Pharmaceuticals.
Habib Bank is Pakistan’s biggest bank and one of the country’s largest companies in asset terms. News of a significant fine by the New York State Department of Financial Services on the bank’s New York branch for failure to comply with New York laws and regulations designed to combat money laundering, terrorist financing and other illicit financial transactions weighed on the bank’s profits and share price. Additionally, following Pakistan’s upgrade from the MSCI Frontier Markets Index to the MSCI EM Index, the Pakistani market corrected sharply due to political turmoil and weaker-than-expected foreign investment inflows.
IMAX is one of the world’s leading entertainment technology companies, specializing in immersive motion picture technologies. Its systems are used globally, and it has a notable market position in China. Disappointing corporate results for the first two quarters of 2017 pressured the US-based company’s shares. Revenues and gross profit margin declined in the second quarter compared to the year-ago period, following a decline in first-quarter gross margin. Third-quarter results, however, were better than expected, with revenue, earnings and gross margin all exceeding market forecasts, driven by a successful cost-cutting program and higher sales, leading its share price to rebound from period lows. The company also announced a new share-repurchase program to enhance shareholder value.
Glenmark Pharmaceuticals is an India-based manufacturer of generic drugs and pharmaceutical ingredients. Glenmark produces formulation products in areas such as oncology, respiratory and cardiology. It also researches and develops its own chemical and biological entities. In addition to India, the US is its main market. Its share price declined significantly in May 2017 as the company announced a weaker-than-expected first-quarter operating performance with disappointing revenue growth. Sales in India were impacted by the government’s demonetization efforts (recall of large-denominated currency notes from circulation), with price pressures also evident in other key markets. Better-than-expected second-quarter results and approval from the US Food & Drug Administration for a birth control pill in late 2017 provided investors with some reasons to remain optimistic.
| | | | |
| Top 10 Holdings | | | |
| 12/31/17 | | | |
| |
Company
Sector/Industry, Country | | % of Total
Net Assets | |
Samsung Electronics Co. Ltd.
Technology Hardware, Storage & Peripherals,
South Korea | | | 7.9% | |
Naspers Ltd.
Media, South Africa | | | 7.1% | |
Brilliance China Automotive Holdings Ltd.
Automobiles, China | | | 6.1% | |
Taiwan Semiconductor Manufacturing Co. Ltd.
Semiconductors & Semiconductor Equipment, Taiwan | | | 6.1% | |
Alibaba Group Holding Ltd.
Internet Software & Services, China | | | 3.8% | |
Tencent Holdings Ltd.
Internet Software & Services, China | | | 3.4% | |
Unilever PLC
Personal Products, UK | | | 3.2% | |
ICICI Bank Ltd.
Banks, India | | | 2.4% | |
Itau Unibanco Holding SA
Banks, Brazil | | | 2.0% | |
Hon Hai Precision Industry Co. Ltd.
Electronic Equipment, Instruments & Components,
Taiwan | | | 1.9% | |
It is important to recognize the effect of currency movements on the Fund’s performance. In general, if the value of the US dollar goes up compared with a foreign currency, an investment traded in that foreign currency will go down in value because it will be worth fewer US dollars. This can have a negative effect on Fund performance. Conversely, when the US dollar weakens in relation to a foreign currency, an investment traded in that foreign currency will increase in value, which can contribute to Fund performance. For the 12 months ended December 31, 2017, the US dollar declined in value relative to most currencies. As a result, the Fund’s performance was positively affected by the portfolio’s investment predominantly in securities with non-US currency exposure. However, one cannot expect the same result in future periods.
During the 12-month period, we increased the Fund’s holdings in Russia, South Korea, Mexico and Peru as we identified companies in these countries with what we considered solid fundamentals. In sector terms, we increased holdings in financials and made some purchases in materials.4 Key purchases included a new investment in Sberbank of Russia, Russia’s leading bank. We also increased the Fund’s holdings
4. The financials sector comprises banks, diversified financial services and insurance in the SOI. The materials sector comprises chemicals, construction materials, and metals and mining in the SOI.
| | | | | | |
franklintempleton.com | | Annual Report | | | 5 | |
TEMPLETON DEVELOPING MARKETS TRUST
in South Korea-based POSCO, one of the world’s biggest steel producers; Alibaba Group Holding, China’s largest e-commerce company; and Grupo Financiero Santander Mexico, a major financial services company in Mexico.
Conversely, we reduced the Fund’s investments in India and Brazil to focus on securities we considered to be more attractively valued within our investment universe. We also made some sales in China and South Africa. In sector terms, we reduced holdings in industrials and consumer staples and made some sales in information technology (IT).5 Key sales included closing the Fund’s position in Remgro, a South African holding company with interests in food, finance and health care. We also reduced investments in the aforementioned Tencent Holdings and in Brazilian financial conglomerate Itau Unibanco Holding.
We thank you for your continued participation in Templeton Developing Markets Trust and look forward to serving your future investment needs.
| | |
 | | 
Chetan Sehgal, CFA Portfolio Manager |
The foregoing information reflects our analysis, opinions and portfolio holdings as of December 31, 2017, the end of the reporting period. The way we implement our main investment strategies and the resulting portfolio holdings may change depending on factors such as market and economic conditions. These opinions may not be relied upon as investment advice or an offer for a particular security. The information is not a complete analysis of every aspect of any market, country, industry, security or the Fund. Statements of fact are from sources considered reliable, but the investment manager makes no representation or warranty as to their completeness or accuracy. Although historical performance is no guarantee of future results, these insights may help you understand our investment management philosophy.
CFA® is a trademark owned by CFA Institute.
5. The industrials sector comprises construction and engineering, industrial conglomerates, trading companies and distributors, and transportation infrastructure in the SOI. The consumer staples sector comprises beverages, food and staples retailing, food products and personal products in the SOI. The IT sector comprises electronic equipment, instruments and components; internet software and services; IT services; semiconductors and semiconductor equipment; software; and technology hardware, storage and peripherals in the SOI.
See www.franklintempletondatasources.com for additional data provider information.
| | | | |
6 | | Annual Report | | franklintempleton.com |
TEMPLETON DEVELOPING MARKETS TRUST
Performance Summary as of December 31, 2017
The performance table and graphs do not reflect any taxes that a shareholder would pay on Fund dividends, capital gain distributions, if any, or any realized gains on the sale of Fund shares. Total return reflects reinvestment of the Fund’s dividends and capital gain distributions, if any, and any unrealized gains or losses. Your dividend income will vary depending on dividends or interest paid by securities in the Fund’s portfolio, adjusted for operating expenses of each class. Capital gain distributions are net profits realized from the sale of portfolio securities.
Performance as of 12/31/171
Cumulative total return excludes sales charges. Average annual total return includes maximum sales charges. Sales charges will vary depending on the size of the investment and the class of share purchased. The maximum is 5.75% and the minimum is 0%. Class A: 5.75% maximum initial sales charge; Advisor Class: no sales charges. For other share classes, visit franklintempleton.com.
| | | | | | | | |
| Share Class | | Cumulative Total Return2 | | | Average Annual Total Return3 | |
| | |
| A | | | | | | | | |
1-Year | | | +40.20% | | | | +32.10% | |
5-Year | | | +20.41% | | | | +2.56% | |
10-Year | | | +7.94% | | | | +0.17% | |
| | |
| Advisor | | | | | | | | |
1-Year | | | +40.59% | | | | +40.59% | |
5-Year | | | +22.03% | | | | +4.06% | |
10-Year | | | +10.89% | | | | +1.04% | |
Performance data represent past performance, which does not guarantee future results. Investment return and principal value will fluctuate, and you may have a gain or loss when you sell your shares. Current performance may differ from figures shown. For most recent month-end performance, go to franklintempleton.com or call (800) 342-5236.
See page 9 for Performance Summary footnotes.
| | | | | | |
franklintempleton.com | | Annual Report | | | 7 | |
TEMPLETON DEVELOPING MARKETS TRUST
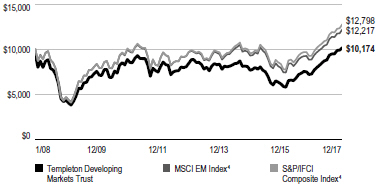
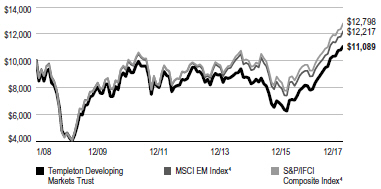
PERFORMANCE SUMMARY
Total Return Index Comparison for a Hypothetical $10,000 Investment1
Total return represents the change in value of an investment over the periods shown. It includes any applicable maximum sales charge, Fund expenses, account fees and reinvested distributions. The unmanaged indexes include reinvestment of any income or distributions. They differ from the Fund in composition and do not pay management fees or expenses. One cannot invest directly in an index.
Class A (1/1/08–12/31/17)
Advisor Class (1/1/08–12/31/17)
See page 9 for Performance Summary footnotes.
| | | | |
8 | | Annual Report | | franklintempleton.com |
TEMPLETON DEVELOPING MARKETS TRUST
PERFORMANCE SUMMARY
Distributions (1/1/17–12/31/17)
| | | | |
Share Class | | Net Investment Income | |
| A | | | $0.1968 | |
| C | | | $0.0524 | |
| R | | | $0.1549 | |
| R6 | | | $0.2923 | |
| Advisor | | | $0.2500 | |
Total Annual Operating Expenses5
| | | | | | | | |
| Share Class | | With Waiver | | | Without Waiver | |
A | | | 1.58% | | | | 1.80% | |
Advisor | | | 1.33% | | | | 1.55% | |
Each class of shares is available to certain eligible investors and has different annual fees and expenses, as described in the prospectus.
All investments involve risks, including possible loss of principal. Special risks are associated with foreign investing, including currency fluctuations, economic instability and political developments. Investments in developing markets, of which frontier markets are a subset, involve heightened risks related to the same factors, in addition to those associated with these markets’ smaller size, lesser liquidity and lack of established legal, political, business and social frameworks to support securities markets. Because these frameworks are typically even less developed in frontier markets, as well as various factors including the increased potential for extreme price volatility, illiquidity, trade barriers and exchange controls, the risks associated with developing markets are magnified in frontier markets. The Fund is designed for the aggressive portion of a well-diversified portfolio. The Fund is actively managed but there is no guarantee that the manager’s investment decisions will produce the desired results. The Fund’s prospectus also includes a description of the main investment risks.
1. The Fund has an expense reduction and a fee waiver associated with any investments it makes in a Franklin Templeton money fund and/or other Franklin Templeton fund, contractually guaranteed through 4/30/18. Fund investment results reflect the expense reduction and fee waiver; without these reductions, the results would have been lower.
2. Cumulative total return represents the change in value of an investment over the periods indicated.
3. Average annual total return represents the average annual change in value of an investment over the periods indicated. Return for less than one year, if any, has not been annualized.
4. Source: Morningstar. The MSCI EM Index is a free float-adjusted, market capitalization-weighted index designed to measure equity market performance of global emerging markets. The S&P/IFCI Composite Index is a free float-adjusted, market capitalization-weighted index designed to measure equity performance of global emerging markets.
5. Figures are as stated in the Fund’s current prospectus and may differ from the expense ratios disclosed in the Your Fund’s Expenses and Financial Highlights sections in this report. In periods of market volatility, assets may decline significantly, causing total annual Fund operating expenses to become higher than the figures shown.
See www.franklintempletondatasources.com for additional data provider information.
| | | | | | |
franklintempleton.com | | Annual Report | | | 9 | |
TEMPLETON DEVELOPING MARKETS TRUST
Your Fund’s Expenses
As a Fund shareholder, you can incur two types of costs: (1) transaction costs, including sales charges (loads) on Fund purchases and redemptions; and (2) ongoing Fund costs, including management fees, distribution and service (12b-1) fees, and other Fund expenses. All mutual funds have ongoing costs, sometimes referred to as operating expenses. The table below shows ongoing costs of investing in the Fund and can help you understand these costs and compare them with those of other mutual funds. The table assumes a $1,000 investment held for the six months indicated.
Actual Fund Expenses
The table below provides information about actual account values and actual expenses in the columns under the heading “Actual.” In these columns the Fund’s actual return, which includes the effect of Fund expenses, is used to calculate the “Ending Account Value” for each class of shares. You can estimate the expenses you paid during the period by following these steps (of course, your account value and expenses will differ from those in this illustration): Divide your account value by $1,000 (if your account had an $8,600 value, then $8,600 ÷ $1,000 = 8.6). Then multiply the result by the number in the row for your class of shares under the headings “Actual” and “Expenses Paid During Period” (if Actual Expenses Paid During Period were $7.50, then 8.6 x $7.50 = $64.50). In this illustration, the actual expenses paid this period are $64.50.
Hypothetical Example for Comparison with Other Funds
Under the heading “Hypothetical” in the table, information is provided about hypothetical account values and hypothetical expenses based on the Fund’s actual expense ratio and an assumed rate of return of 5% per year before expenses, which is not the Fund’s actual return. This information may not be used to estimate the actual ending account balance or expenses you paid for the period, but it can help you compare ongoing costs of investing in the Fund with those of other funds. To do so, compare this 5% hypothetical example for the class of shares you hold with the 5% hypothetical examples that appear in the shareholder reports of other funds.
Please note that expenses shown in the table are meant to highlight ongoing costs and do not reflect any transactional costs. Therefore, information under the heading “Hypothetical” is useful in comparing ongoing costs only, and will not help you compare total costs of owning different funds. In addition, if transactional costs were included, your total costs would have been higher.
| | | | | | | | | | | | | | | | | | | | |
| | | | | | | Actual
(actual return after expenses) | | | | Hypothetical
(5% annual return before expenses) | | | | |
Share Class | | Beginning
Account
Value 7/1/17 | | | | Ending Account
Value 12/31/17 | | Expenses Paid During Period
7/1/17–12/31/171,2 | | | | Ending
Account
Value 12/31/17 | | Expenses Paid During Period 7/1/17–12/31/171,2 | | | | Net Annualized Expense Ratio2 |
A | | $1,000 | | | | $1,155.20 | | | | $ 8.42 | | | | $1,017.39 | | $ 7.88 | | | | 1.55% |
C | | $1,000 | | | | $1,150.80 | | | | $12.47 | | | | $1,013.61 | | $11.67 | | | | 2.30% |
R | | $1,000 | | | | $1,153.60 | | | | $ 9.77 | | | | $1,016.13 | | $ 9.15 | | | | 1.80% |
R6 | | $1,000 | | | | $1,157.40 | | | | $ 5.87 | | | | $1,019.76 | | $ 5.50 | | | | 1.08% |
Advisor | | $1,000 | | | | $1,156.60 | | | | $ 7.07 | | | | $1,018.65 | | $ 6.61 | | | | 1.30% |
1. Expenses are equal to the annualized expense ratio for the six-month period as indicated above - in the far right column - multiplied by the simple average account value over the period indicated, and then multiplied by 184/365 to reflect the one-half year period.
2. Reflects expenses after fee waivers and expense reimbursements. Does not include acquired fund fees and expenses.
| | | | |
10 | | Annual Report | | franklintempleton.com |
TEMPLETON DEVELOPING MARKETS TRUST
Financial Highlights
| | | | | | | | | | | | | | | | | | | | |
| | | Year Ended December 31, | |
| | | 2017 | | | 2016 | | | 2015 | | | 2014 | | | 2013 | |
| | | | | |
| Class A | | | | | | | | | | | | | | | | | | | | |
| | | | | |
Per share operating performance (for a share outstanding throughout the year) | | | | | | | | | | | | | | | | | | | | |
Net asset value, beginning of year | | | $15.82 | | | | $13.59 | | | | $17.09 | | | | $22.86 | | | | $23.61 | |
| | | | |
| | | | | |
| Income from investment operationsa: | | | | | | | | | | | | | | | | | | | | |
| | | | | |
Net investment incomeb | | | 0.15 | | | | 0.10 | | | | 0.07 | | | | 0.27c | | | | 0.20 | |
| | | | | |
Net realized and unrealized gains (losses) | | | 6.21 | | | | 2.32 | | | | (3.43 | ) | | | (2.09 | ) | | | (0.51 | ) |
| | | | |
| | | | | |
Total from investment operations | | | 6.36 | | | | 2.42 | | | | (3.36) | | | | (1.82) | | | | (0.31 | ) |
| | | | |
| | | | | |
| Less distributions from: | | | | | | | | | | | | | | | | | | | | |
| | | | | |
Net investment income | | | (0.20 | ) | | | (0.19 | ) | | | (0.14 | ) | | | (0.33 | ) | | | (0.30 | ) |
| | | | | |
Net realized gains | | | — | | | | — | | | | — | | | | (3.62 | ) | | | (0.14 | ) |
| | | | |
| | | | | |
Total distributions | | | (0.20 | ) | | | (0.19 | ) | | | (0.14 | ) | | | (3.95 | ) | | | (0.44 | ) |
| | | | |
| | | | | |
Net asset value, end of year | | | $21.98 | | | | $15.82 | | | | $13.59 | | | | $17.09 | | | | $22.86 | |
| | | | |
| | | | | |
Total returnd | | | 40.20% | | | | 17.84% | | | | (19.67 | )% | | | (8.11 | )% | | | (1.26)% | |
| | | | | |
| Ratios to average net assets | | | | | | | | | | | | | | | | | | | | |
| | | | | |
Expenses before waiver and payments by affiliates | | | 1.73% | | | | 1.79% | | | | 1.75% | | | | 1.72% | | | | 1.71% | |
| | | | | |
Expenses net of waiver and payments by affiliates | | | 1.55%e | | | | 1.58% | | | | 1.68% | | | | 1.72%f | | | | 1.71% | |
| | | | | |
Net investment income | | | 0.76% | | | | 0.64% | | | | 0.44% | | | | 1.20%c | | | | 0.85% | |
| | | | | |
| Supplemental data | | | | | | | | | | | | | | | | | | | | |
| | | | | |
Net assets, end of year (000’s) | | | $1,178,838 | | | | $961,888 | | | | $822,399 | | | | $1,187,072 | | | | $1,536,714 | |
| | | | | |
Portfolio turnover rate | | | 8.89% | | | | 27.40% | | | | 67.52% | | | | 83.92% | | | | 48.35% | |
aThe amount shown for a share outstanding throughout the period may not correlate with the Statement of Operations for the period due to the timing of sales and repurchases of the Fund’s shares in relation to income earned and/or fluctuating fair value of the investments of the Fund.
bBased on average daily shares outstanding.
cNet investment income per share includes approximately $0.07 per share related to income received in the form of special dividends in connection with certain Fund holdings. Excluding this amount, the ratio of net investment income to average net assets would have been 0.87%.
dTotal return does not reflect sales commissions or contingent deferred sales charges, if applicable.
eBenefit of expense reduction rounds to less than 0.01%.
fBenefit of waiver and payments by affiliates rounds to less than 0.01%.
| | | | | | |
franklintempleton.com | | The accompanying notes are an integral part of these financial statements. | Annual Report | | | 11 | |
TEMPLETON DEVELOPING MARKETS TRUST
FINANCIAL HIGHLIGHTS
| | | | | | | | | | | | | | | | | | | | |
| | | Year Ended December 31, | |
| | | 2017 | | | 2016 | | | 2015 | | | 2014 | | | 2013 | |
| | | | | |
Class C | | | | | | | | | | | | | | | | | | | | |
| | | | | |
Per share operating performance (for a share outstanding throughout the year) | | | | | | | | | | | | | | | | | | | | |
| | | | | |
Net asset value, beginning of year | | | $15.38 | | | | $13.22 | | | | $16.62 | | | | $22.32 | | | | $23.06 | |
| | | | |
| | | | | |
| Income from investment operationsa: | | | | | | | | | | | | | | | | | | | | |
| | | | | |
Net investment income (loss)b | | | —c | | | | (0.02) | | | | (0.04) | | | | 0.10 | d | | | 0.03 | |
| | | | | |
Net realized and unrealized gains (losses) | | | 6.01 | | | | 2.26 | | | | (3.33) | | | | (2.01) | | | | (0.50) | |
| | | | |
| | | | | |
Total from investment operations | | | 6.01 | | | | 2.24 | | | | (3.37) | | | | (1.91) | | | | (0.47) | |
| | | | |
| | | | | |
| Less distributions from: | | | | | | | | | | | | | | | | | | | | |
| | | | | |
Net investment income | | | (0.05) | | | | (0.08) | | | | (0.03) | | | | (0.17) | | | | (0.13) | |
| | | | | |
Net realized gains | | | — | | | | — | | | | — | | | | (3.62) | | | | (0.14) | |
| | | | |
| | | | | |
Total distributions | | | (0.05) | | | | (0.08) | | | | (0.03) | | | | (3.79) | | | | (0.27) | |
| | | | |
| | | | | |
Net asset value, end of year | | | $21.34 | | | | $15.38 | | | | $13.22 | | | | $16.62 | | | | $22.32 | |
| | | | |
| | | | | |
Total returne | | | 39.19% | | | | 16.90% | | | | (20.28)% | | | | (8.71)% | | | | (1.99)% | |
| | | | | |
| Ratios to average net assets | | | | | | | | | | | | | | | | | | | | |
| | | | | |
Expenses before waiver and payments by affiliates | | | 2.48% | | | | 2.54% | | | | 2.47% | | | | 2.44% | | | | 2.44% | |
| | | | | |
Expenses net of waiver and payments by affiliates | | | 2.30% | f | | | 2.33% | | | | 2.40% | | | | 2.44% | g | | | 2.44% | |
| | | | | |
Net investment income (loss) | | | 0.01% | | | | (0.11)% | | | | (0.28)% | | | | 0.48% | d | | | 0.12% | |
| | | | | |
Supplemental data | | | | | | | | | | | | | | | | | | | | |
| | | | | |
Net assets, end of year (000’s) | | | $172,523 | | | | $141,100 | | | | $117,379 | | | | $186,356 | | | | $238,366 | |
| | | | | |
Portfolio turnover rate | | | 8.89% | | | | 27.40% | | | | 67.52% | | | | 83.92% | | | | 48.35% | |
a The amount shown for a share outstanding throughout the period may not correlate with the Statement of Operations for the period due to the timing of sales and repurchases of the Fund’s shares in relation to income earned and/or fluctuating fair value of the investments of the Fund.
b Based on average daily shares outstanding.
c Amount rounds to less than $0.01 per share.
d Net investment income per share includes approximately $0.07 per share related to income received in the form of special dividends in connection with certain Fund holdings. Excluding this amount, the ratio of net investment income to average net assets would have been 0.15%.
e Total return does not reflect sales commissions or contingent deferred sales charges, if applicable.
f Benefit of expense reduction rounds to less than 0.01%.
g Benefit of waiver and payments by affiliates rounds to less than 0.01%.
| | | | |
12 | | Annual Report | The accompanying notes are an integral part of these financial statements. | | franklintempleton.com |
TEMPLETON DEVELOPING MARKETS TRUST
FINANCIAL HIGHLIGHTS
| | | | | | | | | | | | | | | | | | | | |
| | | Year Ended December 31, | |
| | | 2017 | | | 2016 | | | 2015 | | | 2014 | | | 2013 | |
| | | | | |
| Class R | | | | | | | | | | | | | | | | | | | | |
| | | | | |
| Per share operating performance | | | | | | | | | | | | | | | | | | | | |
| (for a share outstanding throughout the year) | | | | | | | | | | | | | | | | | | | | |
| | | | | |
Net asset value, beginning of year | | | $15.57 | | | | $13.37 | | | | $16.80 | | | | $22.55 | | | | $23.30 | |
| | | | |
| | | | | |
Income from investment operationsa: | | | | | | | | | | | | | | | | | | | | |
| | | | | |
Net investment incomeb | | | 0.10 | | | | 0.07 | | | | 0.03 | | | | 0.21 | c | | | 0.14 | |
| | | | | |
Net realized and unrealized gains (losses) | | | 6.09 | | | | 2.27 | | | | (3.36) | | | | (2.06) | | | | (0.50) | |
| | | | |
| | | | | |
Total from investment operations | | | 6.19 | | | | 2.34 | | | | (3.33) | | | | (1.85) | | | | (0.36) | |
| | | | |
| | | | | |
| Less distributions from: | | | | | | | | | | | | | | | | | | | | |
| | | | | |
Net investment income | | | (0.15) | | | | (0.14) | | | | (0.10) | | | | (0.28) | | | | (0.25) | |
| | | | | |
Net realized gains | | | — | | | | — | | | | — | | | | (3.62) | | | | (0.14) | |
| | | | |
| | | | | |
Total distributions | | | (0.15) | | | | (0.14) | | | | (0.10) | | | | (3.90) | | | | (0.39) | |
| | | | |
| | | | | |
Net asset value, end of year | | | $21.61 | | | | $15.57 | | | | $13.37 | | | | $16.80 | | | | $22.55 | |
| | | | |
| | | | | |
Total return | | | 39.90% | | | | 17.48% | | | | (19.83)% | | | | (8.32)% | | | | (1.50)% | |
| | | | | |
| Ratios to average net assets | | | | | | | | | | | | | | | | | | | | |
| | | | | |
Expenses before waiver and payments by affiliates | | | 1.98% | | | | 2.04% | | | | 1.97% | | | | 1.94% | | | | 1.94% | |
| | | | | |
Expenses net of waiver and payments by affiliates | | | 1.80% | d | | | 1.83% | | | | 1.90% | | | | 1.94% | e | | | 1.94% | |
| | | | | |
Net investment income | | | 0.51% | | | | 0.39% | | | | 0.22% | | | | 0.98% | c | | | 0.62% | |
| | | | | |
| Supplemental data | | | | | | | | | | | | | | | | | | | | |
| | | | | |
Net assets, end of year (000’s) | | | $22,512 | | | | $16,628 | | | | $17,657 | | | | $26,123 | | | | $30,123 | |
| | | | | |
Portfolio turnover rate | | | 8.89% | | | | 27.40% | | | | 67.52% | | | | 83.92% | | | | 48.35% | |
aThe amount shown for a share outstanding throughout the period may not correlate with the Statement of Operations for the period due to the timing of sales and repurchases of the Fund’s shares in relation to income earned and/or fluctuating fair value of the investments of the Fund.
bBased on average daily shares outstanding.
cNet investment income per share includes approximately $0.07 per share related to income received in the form of special dividends in connection with certain Fund holdings. Excluding this amount, the ratio of net investment income to average net assets would have been 0.65%.
dBenefit of expense reduction rounds to less than 0.01%.
eBenefit of waiver and payments by affiliates rounds to less than 0.01%.
| | | | | | |
franklintempleton.com | | The accompanying notes are an integral part of these financial statements. | Annual Report | | | 13 | |
TEMPLETON DEVELOPING MARKETS TRUST
FINANCIAL HIGHLIGHTS
| | | | | | | | | | | | | | | | | | | | |
| | | Year Ended December 31, | |
| | | 2017 | | | 2016 | | | 2015 | | | 2014 | | | 2013a | |
| | | | | |
| Class R6 | | | | | | | | | | | | | | | | | | | | |
| | | | | |
| Per share operating performance | | | | | | | | | | | | | | | | | | | | |
| (for a share outstanding throughout the year) | | | | | | | | | | | | | | | | | | | | |
| | | | | |
Net asset value, beginning of year | | | $15.70 | | | | $13.49 | | | | $16.99 | | | | $22.76 | | | | $23.77 | |
| | | | |
| | | | | |
Income from investment operationsb: | | | | | | | | | | | | | | | | | | | | |
| | | | | |
Net investment incomec | | | 0.22 | | | | 0.19 | | | | 0.12 | | | | 0.34 | d | | | 0.12 | |
| | | | | |
Net realized and unrealized gains (losses) | | | 6.19 | | | | 2.28 | | | | (3.40) | | | | (2.05) | | | | (0.58) | |
| | | | |
| | | | | |
Total from investment operations | | | 6.41 | | | | 2.47 | | | | (3.28) | | | | (1.71) | | | | (0.46) | |
| | | | |
| | | | | |
| Less distributions from: | | | | | | | | | | | | | | | | | | | | |
| | | | | |
Net investment income | | | (0.29) | | | | (0.26) | | | | (0.22) | | | | (0.44) | | | | (0.41) | |
| | | | | |
Net realized gains | | | — | | | | — | | | | — | | | | (3.62) | | | | (0.14) | |
| | | | |
| | | | | |
Total distributions | | | (0.29) | | | | (0.26) | | | | (0.22) | | | | (4.06) | | | | (0.55) | |
| | | | |
| | | | | |
Net asset value, end of year | | | $21.82 | | | | $15.70 | | | | $13.49 | | | | $16.99 | | | | $22.76 | |
| | | | |
| | | | | |
Total returne | | | 40.88% | | | | 18.34% | | | | (19.34)% | | | | (7.66)% | | | | (1.89)% | |
| | | | | |
| Ratios to average net assetsf | | | | | | | | | | | | | | | | | | | | |
| | | | | |
Expenses before waiver and payments by affiliates | | | 1.28% | | | | 1.30% | | | | 1.27% | | | | 1.26% | | | | 1.30% | |
| | | | | |
Expenses net of waiver and payments by affiliates | | | 1.09% | g | | | 1.13% | | | | 1.22% | | | | 1.26% | h | | | 1.28% | |
| | | | | |
Net investment income | | | 1.22% | | | | 1.09% | | | | 0.90% | | | | 1.65% | d | | | 1.28% | |
| | | | | |
| Supplemental data | | | | | | | | | | | | | | | | | | | | |
| | | | | |
Net assets, end of year (000’s) | | | $103,734 | | | | $57,153 | | | | $48,263 | | | | $52,185 | | | | $299 | |
| | | | | |
Portfolio turnover rate | | | 8.89% | | | | 27.40% | | | | 67.52% | | | | 83.92% | | | | 48.35% | |
aFor the period May 1, 2013 (effective date) to December 31, 2013.
bThe amount shown for a share outstanding throughout the period may not correlate with the Statement of Operations for the period due to the timing of sales and repurchases of the Fund’s shares in relation to income earned and/or fluctuating fair value of the investments of the Fund.
cBased on average daily shares outstanding.
dNet investment income per share includes approximately $0.07 per share related to income received in the form of special dividends in connection with certain Fund holdings. Excluding this amount, the ratio of net investment income to average net assets would have been 1.32%.
eTotal return is not annualized for periods less than one year.
fRatios are annualized for periods less than one year.
gBenefit of expense reduction rounds to less than 0.01%.
hBenefit of waiver and payments by affiliates rounds to less than 0.01%.
| | | | |
14 | | Annual Report | The accompanying notes are an integral part of these financial statements. | | franklintempleton.com |
TEMPLETON DEVELOPING MARKETS TRUST
FINANCIAL HIGHLIGHTS
| | | | | | | | | | | | | | | | | | | | |
| | | Year Ended December 31, | |
| | | 2017 | | | 2016 | | | 2015 | | | 2014 | | | 2013 | |
| | | | | |
| Advisor Class | | | | | | | | | | | | | | | | | | | | |
| | | | | |
| Per share operating performance | | | | | | | | | | | | | | | | | | | | |
| (for a share outstanding throughout the year) | | | | | | | | | | | | | | | | | | | | |
| | | | | |
Net asset value, beginning of year | | | $15.73 | | | | $13.52 | | | | $17.01 | | | | $22.77 | | | | $23.53 | |
| | | | |
| | | | | |
Income from investment operationsa: | | | | | | | | | | | | | | | | | | | | |
| | | | | |
Net investment incomeb | | | 0.20 | | | | 0.13 | | | | 0.12 | | | | 0.33 | c | | | 0.26 | |
| | | | | |
Net realized and unrealized gains (losses) | | | 6.18 | | | | 2.31 | | | | (3.43) | | | | (2.08) | | | | (0.51) | |
| | | | |
| | | | | |
Total from investment operations | | | 6.38 | | | | 2.44 | | | | (3.31) | | | | (1.75) | | | | (0.25) | |
| | | | |
| | | | | |
| Less distributions from: | | | | | | | | | | | | | | | | | | | | |
| | | | | |
Net investment income | | | (0.25) | | | | (0.23) | | | | (0.18) | | | | (0.39) | | | | (0.37) | |
| | | | | |
Net realized gains | | | — | | | | — | | | | — | | | | (3.62) | | | | (0.14) | |
| | | | |
| | | | | |
Total distributions | | | (0.25) | | | | (0.23) | | | | (0.18) | | | | (4.01) | | | | (0.51) | |
| | | | |
| | | | | |
Net asset value, end of year | | | $21.86 | | | | $15.73 | | | | $13.52 | | | | $17.01 | | | | $22.77 | |
| | | | |
| | | | | |
Total return | | | 40.59% | | | | 18.08% | | | | (19.47)% | | | | (7.79)% | | | | (1.02)% | |
| | | | | |
| Ratios to average net assets | | | | | | | | | | | | | | | | | | | | |
| | | | | |
Expenses before waiver and payments by affiliates | | | 1.48% | | | | 1.54% | | | | 1.47% | | | | 1.44% | | | | 1.44% | |
| | | | | |
Expenses net of waiver and payments by affiliates | | | 1.30% | d | | | 1.33% | | | | 1.40% | | | | 1.44% | e | | | 1.44% | |
| | | | | |
Net investment income | | | 1.01% | | | | 0.89% | | | | 0.72% | | | | 1.48% | c | | | 1.12% | |
| | | | | |
| Supplemental data | | | | | | | | | | | | | | | | | | | | |
| | | | | |
Net assets, end of year (000’s) | | | $179,125 | | | | $117,914 | | | | $101,900 | | | | $175,503 | | | | $283,063 | |
| | | | | |
Portfolio turnover rate | | | 8.89% | | | | 27.40% | | | | 67.52% | | | | 83.92% | | | | 48.35% | |
aThe amount shown for a share outstanding throughout the period may not correlate with the Statement of Operations for the period due to the timing of sales and repurchases of the Fund’s shares in relation to income earned and/or fluctuating fair value of the investments of the Fund.
bBased on average daily shares outstanding.
cNet investment income per share includes approximately $0.07 per share related to income received in the form of special dividends in connection with certain Fund holdings. Excluding this amount, the ratio of net investment income to average net assets would have been 1.15%.
dBenefit of expense reduction rounds to less than 0.01%.
eBenefit of waiver and payments by affiliates rounds to less than 0.01%.
| | | | | | |
franklintempleton.com | | The accompanying notes are an integral part of these financial statements. | Annual Report | | | 15 | |
TEMPLETON DEVELOPING MARKETS TRUST
Statement of Investments, December 31, 2017
| | | | | | | | | | | | | | |
| | | | | Industry | | | Shares | | | Value | |
| | | Common Stocks 94.8% | | | | | | | | | |
| | Argentina 0.1% | | | | | | | | | | | | |
a | | Cablevision Holding SA, ADR | | | Media | | | | 50,168 | | | $ | 1,269,394 | |
b | | Grupo Clarin SA, GDR, Reg S | | | Media | | | | 14,826 | | | | 89,697 | |
| | | | | | | | | | | | | | |
| | | | | | | | | | | | | 1,359,091 | |
| | | | | | | | | | | | | | |
| | Belgium 0.9% | | | | | | | | | | | | |
| | Anheuser-Busch InBev SA/NV | | | Beverages | | | | 138,428 | | | | 15,467,582 | |
| | | | | | | | | | | | | | |
| | Brazil 1.4% | | | | | | | | | | | | |
a | | B2W Cia Digital | | | Internet & Direct Marketing Retail | | | | 641,200 | | | | 3,968,241 | |
| | M. Dias Branco SA | | | Food Products | | | | 591,300 | | | | 9,300,285 | |
| | Mahle-Metal Leve SA | | | Auto Components | | | | 550,300 | | | | 3,965,542 | |
| | Totvs SA | | | Software | | | | 577,100 | | | | 5,207,481 | |
| | | | | | | | | | | | | | |
| | | | | | | | | | | | | 22,441,549 | |
| | | | | | | | | | | | | | |
| | Cambodia 1.0% | | | | | | | | | | | | |
| | NagaCorp Ltd. | | | Hotels, Restaurants & Leisure | | | | 20,778,000 | | | | 16,116,357 | |
| | | | | | | | | | | | | | |
| | China 23.4% | | | | | | | | | | | | |
a | | Alibaba Group Holding Ltd., ADR | | | Internet Software & Services | | | | 362,492 | | | | 62,504,496 | |
| | BAIC Motor Corp. Ltd., H | | | Automobiles | | | | 5,916,900 | | | | 7,709,612 | |
a | | Baidu Inc., ADR | | | Internet Software & Services | | | | 62,995 | | | | 14,754,059 | |
| | Brilliance China Automotive Holdings Ltd. | | | Automobiles | | | | 37,682,400 | | | | 100,803,441 | |
| | China Life Insurance Co. Ltd., H | | | Insurance | | | | 2,367,000 | | | | 7,437,728 | |
| | China Mobile Ltd. | | | Wireless Telecommunication Services | | | | 2,678,859 | | | | 27,173,128 | |
| | China Petroleum & Chemical Corp., H | | | Oil, Gas & Consumable Fuels | | | | 25,760,392 | | | | 18,892,855 | |
| | CNOOC Ltd. | | | Oil, Gas & Consumable Fuels | | | | 9,468,200 | | | | 13,597,241 | |
| | COSCO Shipping Ports Ltd. | | | Transportation Infrastructure | | | | 4,420,919 | | | | 4,600,379 | |
| | Dah Chong Hong Holdings Ltd. | | | Distributors | | | | 7,473,500 | | | | 3,462,766 | |
| | Inner Mongolia Yitai Coal Co. Ltd., B | | | Oil, Gas & Consumable Fuels | | | | 1,902,660 | | | | 2,741,733 | |
a | | Leju Holdings Ltd., ADR | | | Internet Software & Services | | | | 76,576 | | | | 110,269 | |
| | NetEase Inc., ADR | | | Internet Software & Services | | | | 56,955 | | | | 19,653,462 | |
| | Ping An Bank Co. Ltd., A | | | Banks | | | | 3,755,336 | | | | 7,676,142 | |
| | Ping An Insurance Group Co. of China Ltd., A | | | Insurance | | | | 2,259,490 | | | | 24,304,628 | |
| | Poly Culture Group Corp. Ltd., H. | | | Media | | | | 984,800 | | | | 1,989,049 | |
| | Tencent Holdings Ltd. | | | Internet Software & Services | | | | 1,090,095 | | | | 56,647,519 | |
| | Uni-President China Holdings Ltd. | | | Food Products | | | | 12,646,600 | | | | 10,586,247 | |
| | Weifu High-Technology Co. Ltd., B | | | Auto Components | | | | 1,348,863 | | | | 2,884,927 | |
| | | | | | | | | | | | | | |
| | | | | | | | | | | | | 387,529,681 | |
| | | | | | | | | | | | | | |
| | Czech Republic 0.4% | | | | | | | | | | | | |
| | Moneta Money Bank AS | | | Banks | | | | 1,701,603 | | | | 6,584,891 | |
| | | | | | | | | | | | | | |
| | Hong Kong 2.8% | | | | | | | | | | | | |
| | Dairy Farm International Holdings Ltd. | | | Food & Staples Retailing | | | | 640,862 | | | | 5,037,175 | |
| | MGM China Holdings Ltd. | | | Hotels, Restaurants & Leisure | | | | 7,584,200 | | | | 22,957,862 | |
| | Sands China Ltd. | | | Hotels, Restaurants & Leisure | | | | 3,472,800 | | | | 17,935,514 | |
| | | | | | | | | | | | | | |
| | | | | | | | | | | | | 45,930,551 | |
| | | | | | | | | | | | | | |
| | Hungary 1.2% | | | | | | | | | | | | |
| | Richter Gedeon Nyrt | | | Pharmaceuticals | | | | 765,719 | | | | 20,041,595 | |
| | | | | | | | | | | | | | |
| | India 6.8% | | | | | | | | | | | | |
| | Bajaj Holdings & Investment Ltd. | | | Diversified Financial Services | | | | 197,008 | | | | 8,848,541 | |
| | Biocon Ltd. | | | Biotechnology | | | | 2,381,186 | | | | 20,040,903 | |
| | Coal India Ltd. | | | Oil, Gas & Consumable Fuels | | | | 1,114,080 | | | | 4,588,774 | |
| | Glenmark Pharmaceuticals Ltd. | | | Pharmaceuticals | | | | 1,138,844 | | | | 10,609,766 | |
| | ICICI Bank Ltd. | | | Banks | | | | 8,171,501 | | | | 40,191,907 | |
| | Infosys Ltd. | | | IT Services | | | | 515,631 | | | | 8,416,561 | |
| | | | |
16 | | Annual Report | | franklintempleton.com |
TEMPLETON DEVELOPING MARKETS TRUST
STATEMENT OF INVESTMENTS
| | | | | | | | | | | | | | |
| | | | | Industry | | | Shares | | | Value | |
| | | Common Stocks (continued) | | | | | | | | | |
| | | India (continued) | | | | | | | | | |
| | National Aluminium Co. Ltd. | | | Metals & Mining | | | | 200 | | | $ | 269 | |
| | Reliance Industries Ltd. | | | Oil, Gas & Consumable Fuels | | | | 385,652 | | | | 5,563,985 | |
| | Tata Chemicals Ltd. | | | Chemicals | | | | 735,000 | | | | 8,422,451 | |
a | | Tata Motors Ltd., A | | | Automobiles | | | | 1,727,029 | | | | 6,603,505 | |
| | | | | | | | | | | | | | |
| | | | | | | | | | | | | 113,286,662 | |
| | | | | | | | | | | | | | |
| | Indonesia 3.1% | | | | | | | | | | | | |
| | Astra International Tbk PT | | | Automobiles | | | | 41,999,100 | | | | 25,693,203 | |
| | Bank Danamon Indonesia Tbk PT | | | Banks | | | | 24,485,600 | | | | 12,542,835 | |
| | Perusahaan Gas Negara (Persero) Tbk PT | | | Gas Utilities | | | | 28,341,700 | | | | 3,655,646 | |
| | Semen Indonesia (Persero) Tbk PT | | | Construction Materials | | | | 11,931,200 | | | | 8,706,017 | |
| | | | | | | | | | | | | | |
| | | | | | | | | | | | | 50,597,701 | |
| | | | | | | | | | | | | | |
| | | Kenya 0.4% | | | | | | | | | |
| | Equity Group Holdings Ltd. | | | Banks | | | | 15,975,300 | | | | 6,191,977 | |
| | | | | | | | | | | | | | |
| | | Mexico 1.3% | | | | | | | | | |
| | Grupo Financiero Santander Mexico SAB de CV, B, ADR | | | Banks | | | | 2,364,703 | | | | 17,285,979 | |
| | Nemak SAB de CV | | | Auto Components | | | | 6,053,243 | | | | 4,393,123 | |
| | | | | | | | | | | | | | |
| | | | | | | | | | | | | 21,679,102 | |
| | | | | | | | | | | | | | |
| | | Nigeria 0.0%† | | | | | | | | | |
| | Nigerian Breweries PLC | | | Beverages | | | | 677,413 | | | | 254,030 | |
| | | | | | | | | | | | | | |
| | | Pakistan 0.6% | | | | | | | | | |
| | Habib Bank Ltd. | | | Banks | | | | 6,640,200 | | | | 10,017,284 | |
| | | | | | | | | | | | | | |
| | | Peru 1.1% | | | | | | | | | |
| | Compania de Minas Buenaventura SA, ADR | | | Metals & Mining | | | | 1,257,150 | | | | 17,700,672 | |
| | | | | | | | | | | | | | |
| | | Philippines 0.3% | | | | | | | | | |
| | BDO Unibank Inc. | | | Banks | | | | 1,411,517 | | | | 4,628,434 | |
| | Security Bank Corp. | | | Banks | | | | 6,300 | | | | 31,667 | |
| | | | | | | | | | | | | | |
| | | | | | | | | | | | | 4,660,101 | |
| | | | | | | | | | | | | | |
| | | Russia 6.4% | | | | | | | | | |
| | Gazprom PJSC, ADR | | | Oil, Gas & Consumable Fuels | | | | 1,492,646 | | | | 6,582,569 | |
| | LUKOIL PJSC, ADR | | | Oil, Gas & Consumable Fuels | | | | 350,812 | | | | 20,073,463 | |
a,b | | Mail.Ru Group Ltd., GDR, Reg S | | | Internet Software & Services | | | | 773,728 | | | | 22,360,739 | |
| | MMC Norilsk Nickel PJSC, ADR | | | Metals & Mining | | | | 608,200 | | | | 11,397,668 | |
| | Sberbank of Russia PJSC, ADR | | | Banks | | | | 1,527,302 | | | | 25,857,223 | |
a | | Yandex NV, A | | | Internet Software & Services | | | | 600,167 | | | | 19,655,469 | |
| | | | | | | | | | | | | | |
| | | | | | | | | | | | | 105,927,131 | |
| | | | | | | | | | | | | | |
| | | Singapore 0.1% | | | | | | | | | |
| | DBS Group Holdings Ltd. | | | Banks | | | | 109,798 | | | | 2,039,985 | |
| | | | | | | | | | | | | | |
| | | South Africa 8.2% | | | | | | | | | |
| | Massmart Holdings Ltd. | | | Food & Staples Retailing | | | | 1,280,951 | | | | 14,446,987 | |
| | MTN Group Ltd. | | | Wireless Telecommunication Services | | | | 348,302 | | | | 3,845,499 | |
| | Naspers Ltd., N | | | Media | | | | 422,559 | | | | 117,863,237 | |
| | | | | | | | | | | | | | |
| | | | | | | | | | | | | 136,155,723 | |
| | | | | | | | | | | | | | |
| | | South Korea 17.3% | | | | | | | | | |
| | Daelim Industrial Co. Ltd. | | | Construction & Engineering | | | | 213,485 | | | | 16,480,772 | |
| | Fila Korea Ltd. | | | Textiles, Apparel & Luxury Goods | | | | 143,527 | | | | 10,972,529 | |
| | Hankook Tire Co. Ltd. | | | Auto Components | | | | 89,556 | | | | 4,581,106 | |
| | Hanon Systems | | | Auto Components | | | | 1,253,688 | | | | 16,326,280 | |
| | Hite Jinro Co. Ltd. | | | Beverages | | | | 277,870 | | | | 6,273,959 | |
| | Hyundai Development Co-Engineering & Construction | | | Construction & Engineering | | | | 550,924 | | | | 19,897,525 | |
| | | | | | |
franklintempleton.com | | Annual Report | | | 17 | |
TEMPLETON DEVELOPING MARKETS TRUST
STATEMENT OF INVESTMENTS
| | | | | | | | | | | | | | |
| | | | | Industry | | | Shares | | | Value | |
| | | Common Stocks (continued) | | | | | | | | | |
| | South Korea (continued) | | | | | | | | | | | | |
| | iMarketKorea Inc. | | | Trading Companies & Distributors | | | | 281,660 | | | $ | 2,377,568 | |
| | Interpark Holdings Corp. | | | Internet & Direct Marketing Retail | | | | 613,554 | | | | 2,264,811 | |
| | KT Skylife Co. Ltd. | | | Media | | | | 758,178 | | | | 9,553,806 | |
| | LG Corp. | | | Industrial Conglomerates | | | | 63,038 | | | | 5,374,360 | |
| | Naver Corp. | | | Internet Software & Services | | | | 11,099 | | | | 9,046,614 | |
| | POSCO | | | Metals & Mining | | | | 66,214 | | | | 20,626,448 | |
| | Samsung Electronics Co. Ltd. | | | Technology Hardware, Storage & Peripherals | | | | 54,792 | | | | 130,797,532 | |
| | SK Hynix Inc. | | | Semiconductors & Semiconductor Equipment | | | | 416,940 | | | | 29,882,572 | |
| | Youngone Corp. | | | Textiles, Apparel & Luxury Goods | | | | 88,180 | | | | 2,602,338 | |
| | | | | | | | | | | | | | |
| | | | | | | | | | | | | 287,058,220 | |
| | | | | | | | | | | | | | |
| | Taiwan 10.3% | | | | | | | | | | | | |
| | Catcher Technology Co. Ltd. | | | Technology Hardware, Storage & Peripherals | | | | 1,421,000 | | | | 15,710,655 | |
| | FIT Hon Teng Ltd. | | | Electronic Equipment, Instruments & Components | | | | 7,883,100 | | | | 5,337,566 | |
| | Hon Hai Precision Industry Co. Ltd. | | | Electronic Equipment, Instruments & Components | | | | 9,785,240 | | | | 31,400,372 | |
| | Largan Precision Co. Ltd. | | | Electronic Equipment, Instruments & Components | | | | 58,000 | | | | 7,859,238 | |
| | Pegatron Corp. | | | Technology Hardware, Storage & Peripherals | | | | 3,956,300 | | | | 9,601,699 | |
| | Taiwan Semiconductor Manufacturing Co. Ltd. | | | Semiconductors & Semiconductor Equipment | | | | 13,003,000 | | | | 100,589,493 | |
| | | | | | | | | | | | | | |
| | | | | | | | | | | | | 170,499,023 | |
| | | | | | | | | | | | | | |
| | Thailand 3.8% | | | | | | | | | | | | |
| | Kasikornbank PCL, fgn | | | Banks | | | | 2,502,700 | | | | 18,364,916 | |
| | Kiatnakin Bank PCL, fgn | | | Banks | | | | 4,178,300 | | | | 10,166,726 | |
| | Land and Houses PCL, fgn | | | Real Estate Management & Development | | | | 20,067,600 | | | | 6,469,444 | |
| | PTT Exploration and Production PCL, fgn | | | Oil, Gas & Consumable Fuels | | | | 2,418,700 | | | | 7,426,159 | |
| | Siam Commercial Bank PCL, fgn | | | Banks | | | | 1,268,000 | | | | 5,839,730 | |
| | Thai Beverage PCL, fgn | | | Beverages | | | | 20,825,900 | | | | 14,325,105 | |
| | | | | | | | | | | | | | |
| | | | | | | | | | | | | 62,592,080 | |
| | | | | | | | | | | | | | |
| | United Kingdom 3.2% | | | | | | | | | | | | |
| | Unilever PLC. | | | Personal Products | | | | 961,560 | | | | 53,571,215 | |
| | | | | | | | | | | | | | |
| | United States 0.7% | | | | | | | | | | | | |
a | | IMAX Corp. | | | Media | | | | 533,106 | | | | 12,341,404 | |
| | | | | | | | | | | | | | |
| | | Total Common Stocks
(Cost $1,034,991,447). | | | | | | | | 1,570,043,607 | |
| | | | | | | | | | | | | | |
| c | | Participatory Notes 0.6% | | | | | | | | | |
| | Saudi Arabia 0.6% | | | | | | | | | | | | |
| | Deutsche Bank AG/London, Samba Financial Group, 8/03/20 | | | Banks | | | | 379,970 | | | | 2,356,639 | |
| | HSBC Bank PLC, Saudi Basic Industries Corp., 1/22/18 | | | Chemicals | | | | 289,119 | | | | 7,863,408 | |
| | | | | | | | | | | | | | |
| | Total Participatory Notes (Cost $8,362,809) | | | | | | | | | | | 10,220,047 | |
| | | | | | | | | | | | | | |
| | Preferred Stocks 3.7% | | | | | | | | | | | | |
| | Brazil 3.7% | | | | | | | | | | | | |
d | | Banco Bradesco SA, 3.687%, ADR, pfd | | | Banks | | | | 2,712,784 | | | | 27,778,908 | |
d | | Itau Unibanco Holding SA, 3.67%, ADR, pfd | | | Banks | | | | 2,538,573 | | | | 33,001,449 | |
| | | | | | | | | | | | | | |
| | | Total Preferred Stocks (Cost $27,629,194) | | | | | | | | 60,780,357 | |
| | | | | | | | | | | | | | |
| | | Total Investments before Short Term
Investments (Cost $1,070,983,450) | | | | | | | | 1,641,044,011 | |
| | | | | | | | | | | | | | |
| | | | |
18 | | Annual Report | | franklintempleton.com |
TEMPLETON DEVELOPING MARKETS TRUST
STATEMENT OF INVESTMENTS
| | | | | | | | | | | | | | |
| | | | | | | | Shares | | | Value | |
| | | | |
| | Short Term Investments (Cost $16,800,410) 1.0% | | | | | | | | | | | | |
| | | | |
| | Money Market Funds 1.0% | | | | | | | | | | | | |
| | United States 1.0% | | | | | | | | | | | | |
e,f | | Institutional Fiduciary Trust Money Market Portfolio, 0.89% | | | | | | | 16,800,410 | | | $ | 16,800,410 | |
| | | | | | | | | | | | | | |
| | Total Investments (Cost $1,087,783,860) 100.1% | | | | | | | | | | | 1,657,844,421 | |
| | Other Assets, less Liabilities (0.1)% | | | | | | | | | | | (1,111,729 | ) |
| | | | | | | | | | | | | | |
| | Net Assets 100.0% | | | | | | | | | | $ | 1,656,732,692 | |
| | | | | | | | | | | | | | |
See Abbreviations on page 32.
†Rounds to less than 0.1% of net assets.
aNon-income producing.
bSecurity was purchased pursuant to Regulation S under the Securities Act of 1933, which exempts from registration securities offered and sold outside of the United States. Such a security cannot be sold in the United States without either an effective registration statement filed pursuant to the Securities Act of 1933, or pursuant to an exemption from registration. These securities have been deemed liquid under guidelines approved by the Fund’s Board of Trustees. At December 31, 2017, the aggregate value of these securities was $22,450,436, representing 1.4% of net assets.
cSee Note 1(c) regarding Participatory Notes.
dVariable rate security. The rate shown represents the yield at period end.
eSee Note 3(f) regarding investments in affiliated management investment companies.
fThe rate shown is the annualized seven-day yield at period end.
| | | | | | |
franklintempleton.com | | The accompanying notes are an integral part of these financial statements. | Annual Report | | | 19 | |
TEMPLETON DEVELOPING MARKETS TRUST
Financial Statements
Statement of Assets and Liabilities
December 31, 2017
| | | | |
Assets: | | | | |
Investments in securities: | | | | |
Cost - Unaffiliated issuers | | $ | 1,070,983,450 | |
Cost - Non-controlled affiliates (Note 3f) | | | 16,800,410 | |
| | | | |
Value - Unaffiliated issuers | | $ | 1,641,044,011 | |
Value - Non-controlled affiliates (Note 3f) | | | 16,800,410 | |
Receivables: | | | | |
Capital shares sold | | | 1,893,304 | |
Dividends. | | | 4,745,110 | |
Foreign tax refund | | | 975,682 | |
Other assets | | | 159 | |
| | | | |
| |
Total assets | | | 1,665,458,676 | |
| | | | |
Liabilities: | | | | |
Payables: | | | | |
Investment securities purchased | | | 377,864 | |
Capital shares redeemed | | | 1,831,057 | |
Management fees | | | 1,358,981 | |
Distribution fees | | | 794,173 | |
Transfer agent fees | | | 637,358 | |
Deferred tax | | | 3,345,593 | |
Accrued expenses and other liabilities | | | 380,958 | |
| | | | |
| |
Total liabilities | | | 8,725,984 | |
| | | | |
| |
Net assets, at value | | $ | 1,656,732,692 | |
| | | | |
Net assets consist of: | | | | |
Paid-in capital | | $ | 1,268,608,717 | |
Distributions in excess of net investment income | | | (6,311,593 | ) |
Net unrealized appreciation (depreciation) | | | 566,368,615 | |
Accumulated net realized gain (loss) | | | (171,933,047 | ) |
| | | | |
| |
Net assets, at value | | $ | 1,656,732,692 | |
| | | | |
| | | | |
20 | | Annual Report | The accompanying notes are an integral part of these financial statements. | | franklintempleton.com |
TEMPLETON DEVELOPING MARKETS TRUST
FINANCIAL STATEMENTS
Statement of Assets and Liabilities (continued)
December 31, 2017
| | | | |
| Class A: | | | | |
Net assets, at value | | $ | 1,178,838,391 | |
| | | | |
Shares outstanding | | | 53,634,026 | |
| | | | |
Net asset value per sharea | | | $21.98 | |
| | | | |
Maximum offering price per share (net asset value per share ÷ 94.25%) | | | $23.32 | |
| | | | |
| Class C: | | | | |
Net assets, at value | | $ | 172,523,404 | |
| | | | |
Shares outstanding | | | 8,082,839 | |
| | | | |
Net asset value and maximum offering price per sharea | | | $21.34 | |
| | | | |
| Class R: | | | | |
Net assets, at value | | $ | 22,511,946 | |
| | | | |
Shares outstanding | | | 1,041,609 | |
| | | | |
Net asset value and maximum offering price per share | | | $21.61 | |
| | | | |
| Class R6: | | | | |
Net assets, at value | | $ | 103,733,691 | |
| | | | |
Shares outstanding | | | 4,753,713 | |
| | | | |
Net asset value and maximum offering price per share | | | $21.82 | |
| | | | |
| Advisor Class: | | | | |
Net assets, at value | | $ | 179,125,260 | |
| | | | |
Shares outstanding | | | 8,194,653 | |
| | | | |
Net asset value and maximum offering price per share | | | $21.86 | |
| | | | |
aRedemption price is equal to net asset value less contingent deferred sales charges, if applicable.
| | | | | | |
franklintempleton.com | | The accompanying notes are an integral part of these financial statements. | Annual Report | | | 21 | |
TEMPLETON DEVELOPING MARKETS TRUST
FINANCIAL STATEMENTS
Statement of Operations
for the year ended December 31, 2017
| | | | |
Investment income: | | | | |
Dividends: (net of foreign taxes)* | | | | |
Unaffiliated issuers | | $ | 35,015,276 | |
Non-controlled affiliates (Note 3f) | | | 71,433 | |
| | | | |
Total investment income | | | 35,086,709 | |
| | | | |
Expenses: | | | | |
Management fees (Note 3a) | | | 18,150,504 | |
Distribution fees: (Note 3c) | | | | |
Class A | | | 2,755,735 | |
Class C | | | 1,598,061 | |
Class R | | | 100,723 | |
Transfer agent fees: (Note 3e) | | | | |
Class A | | | 2,345,347 | |
Class C | | | 340,015 | |
Class R | | | 42,987 | |
Class R6 | | | 5,418 | |
Advisor Class | | | 344,201 | |
Custodian fees (Note 4) | | | 478,053 | |
Reports to shareholders | | | 200,648 | |
Registration and filing fees | | | 133,108 | |
Professional fees | | | 142,096 | |
Trustees’ fees and expenses | | | 119,863 | |
Other | | | 41,556 | |
| | | | |
Total expenses | | | 26,798,315 | |
Expense reductions (Note 4) | | | (367 | ) |
Expenses waived/paid by affiliates (Note 3f and 3g) | | | (2,803,342 | ) |
| | | | |
Net expenses | | | 23,994,606 | |
| | | | |
Net investment income | | | 11,092,103 | |
| | | | |
Realized and unrealized gains (losses): | | | | |
Net realized gain (loss) from: | | | | |
Investments: | | | | |
Unaffiliated issuers | | | 67,715,179 | |
Foreign currency transactions | | | 285,402 | |
| | | | |
Net realized gain (loss) | | | 68,000,581 | |
| | | | |
Net change in unrealized appreciation (depreciation) on: | | | | |
Investments: | | | | |
Unaffiliated issuers | | | 423,104,587 | |
Translation of other assets and liabilities denominated in foreign currencies | | | 92,930 | |
Change in deferred taxes on unrealized appreciation | | | (2,090,385 | ) |
| | | | |
Net change in unrealized appreciation (depreciation) | | | 421,107,132 | |
| | | | |
Net realized and unrealized gain (loss) | | | 489,107,713 | |
| | | | |
Net increase (decrease) in net assets resulting from operations | | $ | 500,199,816 | |
| | | | |
| | | | |
*Foreign taxes withheld on dividends | | $ | 4,838,176 | |
| | | | |
22 | | Annual Report | The accompanying notes are an integral part of these financial statements. | | franklintempleton.com |
TEMPLETON DEVELOPING MARKETS TRUST
FINANCIAL STATEMENTS
Statements of Changes in Net Assets
| | | | | | | | |
| | | Year Ended December 31, | |
| | | 2017 | | | 2016 | |
Increase (decrease) in net assets: | | | | | | | | |
Operations: | | | | | | | | |
Net investment income | | $ | 11,092,103 | | | $ | 7,401,194 | |
Net realized gain (loss) | | | 68,000,581 | | | | 42,107,152 | |
Net change in unrealized appreciation (depreciation) | | | 421,107,132 | | | | 154,346,665 | |
| | | | |
Net increase (decrease) in net assets resulting from operations | | | 500,199,816 | | | | 203,855,011 | |
| | | | |
Distributions to shareholders from: | | | | | | | | |
Net investment income: | | | | | | | | |
Class A | | | (10,529,265 | ) | | | (11,517,193 | ) |
Class C | | | (424,247 | ) | | | (759,420 | ) |
Class R | | | (162,493 | ) | | | (152,701 | ) |
Class R6 | | | (1,360,463 | ) | | | (925,944 | ) |
Advisor Class | | | (2,031,475 | ) | | | (1,706,642 | ) |
| | | | |
Total distributions to shareholders | | | (14,507,943 | ) | | | (15,061,900 | ) |
| | | | |
Capital share transactions: (Note 2) | | | | | | | | |
Class A | | | (137,774,815 | ) | | | (1,900,554 | ) |
Class C | | | (19,972,580 | ) | | | 2,556,104 | |
Class R | | | (522,417 | ) | | | (3,762,151 | ) |
Class R6 | | | 24,065,340 | | | | 1,219,445 | |
Advisor Class | | | 10,561,021 | | | | 180,083 | |
| | | | |
Total capital share transactions | | | (123,643,451 | ) | | | (1,707,073 | ) |
| | | | |
Net increase (decrease) in net assets | | | 362,048,422 | | | | 187,086,038 | |
Net assets: | | | | | | | | |
Beginning of year | | | 1,294,684,270 | | | | 1,107,598,232 | |
| | | | |
End of year | | $ | 1,656,732,692 | | | $ | 1,294,684,270 | |
| | | | |
Distributions in excess of net investment income included in net assets: | | | | | | | | |
End of year | | $ | (6,311,593 | ) | | $ | (22,485,202 | ) |
| | | | |
| | | | | | |
franklintempleton.com | | The accompanying notes are an integral part of these financial statements. | Annual Report | | | 23 | |
TEMPLETON DEVELOPING MARKETS TRUST
Notes to Financial Statements
1. Organization and Significant Accounting Policies
Templeton Developing Markets Trust (Fund) is registered under the Investment Company Act of 1940 (1940 Act) as an open-end management investment company and applies the specialized accounting and reporting guidance in U.S. Generally Accepted Accounting Principles (U.S. GAAP). The Fund offers five classes of shares: Class A, Class C, Class R, Class R6, and Advisor Class. Each class of shares may differ by its initial sales load, contingent deferred sales charges, voting rights on matters affecting a single class, its exchange privilege and fees due to differing arrangements for distribution and transfer agent fees.
The following summarizes the Fund’s significant accounting policies.
a. Financial Instrument Valuation
The Fund’s investments in financial instruments are carried at fair value daily. Fair value is the price that would be received to sell an asset or paid to transfer a liability in an orderly transaction between market participants on the measurement date. The Fund calculates the net asset value (NAV) per share as of 4 p.m. Eastern time each day the New York Stock Exchange (NYSE) is open for trading. Under compliance policies and procedures approved by the Fund’s Board of Trustees (the Board), the Fund’s administrator has responsibility for oversight of valuation, including leading the cross-functional Valuation Committee (VC). The VC provides administration and oversight of the Fund’s valuation policies and procedures, which are approved annually by the Board. Among other things, these procedures allow the Fund to utilize independent pricing services, quotations from securities and financial instrument dealers, and other market sources to determine fair value.
Equity securities listed on an exchange or on the NASDAQ National Market System are valued at the last quoted sale price or the official closing price of the day, respectively. Foreign equity securities are valued as of the close of trading on the foreign stock exchange on which the security is primarily traded, or as of 4 p.m. Eastern time. The value is then converted into its U.S. dollar equivalent at the foreign exchange rate in effect at 4 p.m. Eastern time on the day that the value of the security is determined. Over-the-counter (OTC) securities are valued within the range of the most recent quoted bid and ask prices. Securities that trade in multiple markets or on multiple
exchanges are valued according to the broadest and most representative market. Certain equity securities are valued based upon fundamental characteristics or relationships to similar securities.
Investments in open-end mutual funds are valued at the closing NAV.
The Fund has procedures to determine the fair value of financial instruments for which market prices are not reliable or readily available. Under these procedures, the VC convenes on a regular basis to review such financial instruments and considers a number of factors, including significant unobservable valuation inputs, when arriving at fair value. The VC primarily employs a market-based approach which may use related or comparable assets or liabilities, recent transactions, market multiples, book values, and other relevant information for the investment to determine the fair value of the investment. An income-based valuation approach may also be used in which the anticipated future cash flows of the investment are discounted to calculate fair value. Discounts may also be applied due to the nature or duration of any restrictions on the disposition of the investments. Due to the inherent uncertainty of valuations of such investments, the fair values may differ significantly from the values that would have been used had an active market existed. The VC employs various methods for calibrating these valuation approaches including a regular review of key inputs and assumptions, transactional back-testing or disposition analysis, and reviews of any related market activity.
Trading in securities on foreign securities stock exchanges and OTC markets may be completed before 4 p.m. Eastern time. In addition, trading in certain foreign markets may not take place on every Fund’s business day. Occasionally, events occur between the time at which trading in a foreign security is completed and 4 p.m. Eastern time that might call into question the reliability of the value of a portfolio security held by the Fund. As a result, differences may arise between the value of the Fund’s portfolio securities as determined at the foreign market close and the latest indications of value at 4 p.m. Eastern time. In order to minimize the potential for these differences, the VC monitors price movements following the close of trading in foreign stock markets through a series of country specific market proxies (such as baskets of American Depositary Receipts, futures contracts and exchange traded funds). These price movements are measured against established trigger thresholds for each specific market proxy to assist in determining if an event has occurred that may call into
| | | | |
24 | | Annual Report | | franklintempleton.com |
TEMPLETON DEVELOPING MARKETS TRUST
NOTES TO FINANCIAL STATEMENTS
question the reliability of the values of the foreign securities held by the Fund. If such an event occurs, the securities may be valued using fair value procedures, which may include the use of independent pricing services.
When the last day of the reporting period is a non-business day, certain foreign markets may be open on those days that the Fund’s NAV is not calculated, which could result in differences between the value of the Fund’s portfolio securities on the last business day and the last calendar day of the reporting period. Any significant security valuation changes due to an open foreign market are adjusted and reflected by the Fund for financial reporting purposes.
b. Foreign Currency Translation
Portfolio securities and other assets and liabilities denominated in foreign currencies are translated into U.S. dollars based on the exchange rate of such currencies against U.S. dollars on the date of valuation. The Fund may enter into foreign currency exchange contracts to facilitate transactions denominated in a foreign currency. Purchases and sales of securities, income and expense items denominated in foreign currencies are translated into U.S. dollars at the exchange rate in effect on the transaction date. Portfolio securities and assets and liabilities denominated in foreign currencies contain risks that those currencies will decline in value relative to the U.S. dollar. Occasionally, events may impact the availability or reliability of foreign exchange rates used to convert the U.S. dollar equivalent value. If such an event occurs, the foreign exchange rate will be valued at fair value using procedures established and approved by the Board.
The Fund does not separately report the effect of changes in foreign exchange rates from changes in market prices on securities held. Such changes are included in net realized and unrealized gain or loss from investments in the Statement of Operations.
Realized foreign exchange gains or losses arise from sales of foreign currencies, currency gains or losses realized between the trade and settlement dates on securities transactions and the difference between the recorded amounts of dividends, interest, and foreign withholding taxes and the U.S. dollar equivalent of the amounts actually received or paid. Net unrealized foreign exchange gains and losses arise from changes in foreign exchange rates on foreign denominated assets and liabilities other than investments in securities held at the end of the reporting period.
c. Participatory Notes
The Fund invests in Participatory Notes (P-Notes). P-Notes are promissory notes that are designed to offer a return linked to the performance of a particular underlying equity security or market. P-Notes are issued by banks or broker-dealers and allow the Fund to gain exposure to common stocks in certain foreign markets without registering with the market regulator. Income received from P-Notes is recorded as dividend income in the Statement of Operations. P-Notes may contain various risks including the potential inability of the counterparty to fulfill their obligations under the terms of the contract. These securities may be more volatile and less liquid than other investments held by the Fund.
d. Income and Deferred Taxes
It is the Fund’s policy to qualify as a regulated investment company under the Internal Revenue Code. The Fund intends to distribute to shareholders substantially all of its taxable income and net realized gains to relieve it from federal income and excise taxes. As a result, no provision for U.S. federal income taxes is required.
The Fund may be subject to foreign taxation related to income received, capital gains on the sale of securities and certain foreign currency transactions in the foreign jurisdictions in which it invests. Foreign taxes, if any, are recorded based on the tax regulations and rates that exist in the foreign markets in which the Fund invests. When a capital gain tax is determined to apply, the Fund records an estimated deferred tax liability in an amount that would be payable if the securities were disposed of on the valuation date.
As a result of several court cases, in certain countries across the European Union, the Fund filed additional tax reclaims for previously withheld taxes on dividends earned in those countries (EU reclaims). These additional filings are subject to various administrative proceedings by the local jurisdictions’ tax authorities within the European Union, as well as a number of related judicial proceedings. Income recognized, if any, for EU reclaims is reflected as other income in the Statement of Operations and any related receivable, if any, is reflected as European Union tax reclaims in the Statement of Assets and Liabilities. When uncertainty exists as to the ultimate resolution of these proceedings, the likelihood of receipt of these EU reclaims, and the potential timing of payment, no amounts are reflected in the financial statements. For U.S. income tax
| | | | | | |
franklintempleton.com | | Annual Report | | | 25 | |
TEMPLETON DEVELOPING MARKETS TRUST
NOTES TO FINANCIAL STATEMENTS
1. Organization and Significant Accounting Policies (continued)
d. Income and Deferred Taxes (continued)
purposes, EU reclaims received by the Fund, if any, reduce the amounts of foreign taxes Fund shareholders can use as tax credits in their individual income tax returns.
The Fund may recognize an income tax liability related to its uncertain tax positions under U.S. GAAP when the uncertain tax position has a less than 50% probability that it will be sustained upon examination by the tax authorities based on its technical merits. As of December 31, 2017, the Fund has determined that no tax liability is required in its financial statements related to uncertain tax positions for any open tax years (or expected to be taken in future tax years). Open tax years are those that remain subject to examination and are based on the statute of limitations in each jurisdiction in which the Fund invests.
e. Security Transactions, Investment Income, Expenses and Distributions
Security transactions are accounted for on trade date. Realized gains and losses on security transactions are determined on a specific identification basis. Estimated expenses are accrued daily. Dividend income is recorded on the ex-dividend date except for certain dividends from securities where the dividend rate is not available. In such cases, the dividend is recorded as soon as the information is received by the Fund. Distributions to shareholders are recorded on the ex-dividend date. Distributable earnings are determined according to income tax regulations (tax basis) and may differ from earnings recorded in accordance with U.S. GAAP. These differences may be permanent or
temporary. Permanent differences are reclassified among capital accounts to reflect their tax character. These reclassifications have no impact on net assets or the results of operations. Temporary differences are not reclassified, as they may reverse in subsequent periods.
Realized and unrealized gains and losses and net investment income, excluding class specific expenses, are allocated daily to each class of shares based upon the relative proportion of net assets of each class. Differences in per share distributions by class are generally due to differences in class specific expenses.
f. Accounting Estimates
The preparation of financial statements in accordance with U.S. GAAP requires management to make estimates and assumptions that affect the reported amounts of assets and liabilities at the date of the financial statements and the amounts of income and expenses during the reporting period. Actual results could differ from those estimates.
g. Guarantees and Indemnifications
Under the Fund’s organizational documents, its officers and trustees are indemnified by the Fund against certain liabilities arising out of the performance of their duties to the Fund. Additionally, in the normal course of business, the Fund enters into contracts with service providers that contain general indemnification clauses. The Fund’s maximum exposure under these arrangements is unknown as this would involve future claims that may be made against the Fund that have not yet occurred. Currently, the Fund expects the risk of loss to be remote.
2. Shares of Beneficial Interest
At December 31, 2017, there were an unlimited number of shares authorized (without par value). Transactions in the Fund’s shares were as follows:
| | | | | | | | | | | | | | | | |
| | | Year Ended December 31, | |
| | | 2017 | | | 2016 | |
| | | Shares | | | Amount | | | Shares | | | Amount | |
| | | | |
| Class A Shares: | | | | | | | | | | | | | | | | |
Shares sold | | | 7,431,493 | | | $ | 143,339,969 | | | | 7,489,500 | | | $ | 113,234,893 | |
Shares issued in reinvestment of distributions | | | 426,514 | | | | 9,210,781 | | | | 638,476 | | | | 9,848,647 | |
Shares issued on reorganization | | | — | | | | — | | | | 6,345,718 | | | | 87,413,868 | |
Shares redeemed | | | (15,028,543 | ) | | | (290,325,565 | ) | | | (14,182,070 | ) | | | (212,397,962 | ) |
| | | | |
Net increase (decrease) | | | (7,170,536 | ) | | $ | (137,774,815 | ) | | | 291,624 | | | $ | (1,900,554 | ) |
| | | | |
26 | | Annual Report | | franklintempleton.com |
TEMPLETON DEVELOPING MARKETS TRUST
NOTES TO FINANCIAL STATEMENTS
| | | | | | | | | | | | | | | | |
| | | Year Ended December 31, | |
| | | 2017 | | | 2016 | |
| | | Shares | | | Amount | | | Shares | | | Amount | |
| | | | |
| Class C Shares: | | | | | | | | | | | | | | | | |
Shares sold | | | 1,171,959 | | | $ | 22,298,742 | | | | 744,363 | | | $ | 11,160,408 | |
Shares issued in reinvestment of distributions | | | 19,873 | | | | 414,917 | | | | 46,873 | | | | 700,090 | |
Shares issued on reorganization | | | — | | | | — | | | | 1,879,982 | | | | 25,114,916 | |
Shares redeemed | | | (2,285,942 | ) | | | (42,686,239 | ) | | | (2,373,175 | ) | | | (34,419,310 | ) |
Net increase (decrease) | | | (1,094,110 | ) | | $ | (19,972,580 | ) | | | 298,043 | | | $ | 2,556,104 | |
| Class R Shares: | | | | | | | | | | | | | | | | |
Shares sold | | | 431,809 | | | $ | 8,262,312 | | | | 320,719 | | | $ | 4,698,402 | |
Shares issued in reinvestment of distributions | | | 7,092 | | | | 150,579 | | | | 9,394 | | | | 142,558 | |
Shares redeemed | | | (465,563 | ) | | | (8,935,308 | ) | | | (582,783 | ) | | | (8,603,111 | ) |
Net increase (decrease) | | | (26,662 | ) | | $ | (522,417 | ) | | | (252,670 | ) | | $ | (3,762,151 | ) |
| Class R6 Shares: | | | | | | | | | | | | | | | | |
Shares sold | | | 1,855,631 | | | $ | 38,531,980 | | | | 737,878 | | | $ | 11,204,197 | |
Shares issued in reinvestment of distributions | | | 25,243 | | | | 541,740 | | | | 13,686 | | | | 208,603 | |
Shares redeemed | | | (766,583 | ) | | | (15,008,380 | ) | | | (689,699 | ) | | | (10,193,355 | ) |
Net increase (decrease) | | | 1,114,291 | | | $ | 24,065,340 | | | | 61,865 | | | $ | 1,219,445 | |
| Advisor Class Shares: | | | | | | | | | | | | | | | | |
Shares sold | | | 3,938,388 | | | $ | 74,290,203 | | | | 2,570,319 | | | $ | 40,211,772 | |
Shares issued in reinvestment of distributions | | | 87,266 | | | | 1,874,919 | | | | 100,872 | | | | 1,549,140 | |
Shares issued on reorganization | | | — | | | | — | | | | 292,708 | | | | 4,014,734 | |
Shares redeemed | | | (3,325,649 | ) | | | (65,604,101 | ) | | | (3,008,250 | ) | | | (45,595,563 | ) |
Net increase (decrease) | | | 700,005 | | | $ | 10,561,021 | | | | (44,351 | ) | | $ | 180,083 | |
3. Transactions with Affiliates
Franklin Resources, Inc. is the holding company for various subsidiaries that together are referred to as Franklin Templeton Investments. Certain officers and trustees of the Fund are also officers and/or directors of the following subsidiaries:
| | |
| Subsidiary | | Affiliation |
Templeton Asset Management Ltd. (TAML) | | Investment manager |
Franklin Templeton Services, LLC (FT Services) | | Administrative manager |
Franklin Templeton Distributors, Inc. (Distributors) | | Principal underwriter |
Franklin Templeton Investor Services, LLC (Investor Services) | | Transfer agent |
| | | | | | |
franklintempleton.com | | Annual Report | | | 27 | |
TEMPLETON DEVELOPING MARKETS TRUST
NOTES TO FINANCIAL STATEMENTS
3. Transactions with Affiliates (continued)
a. Management Fees
The Fund pays an investment management fee to TAML based on the average daily net assets of the Fund as follows:
| | |
| Annualized Fee Rate | | Net Assets |
1.250% | | Up to and including $200 million |
1.235% | | Over $200 million, up to and including $700 million |
1.200% | | Over $700 million, up to and including $1 billion |
1.150% | | Over $1 billion, up to and including $1.2 billion |
1.125% | | Over $1.2 billion, up to and including $5 billion |
1.075% | | Over $5 billion, up to and including $10 billion |
1.025% | | Over $10 billion, up to and including $15 billion |
0.975% | | Over $15 billion, up to and including $20 billion |
0.925% | | In excess of $20 billion |
For the year ended December 31, 2017, the gross effective investment management fee rate was 1.195% of the Fund’s average daily net assets.
b. Administrative Fees
Under an agreement with TAML, FT Services provides administrative services to the Fund. The fee is paid by TAML based on the Fund’s average daily net assets, and is not an additional expense of the Fund.
c. Distribution Fees
The Board has adopted distribution plans for each share class, with the exception of Class R6 and Advisor Class shares, pursuant to Rule 12b-1 under the 1940 Act. Under the Fund’s Class A reimbursement distribution plan, the Fund reimburses Distributors for costs incurred in connection with the servicing, sale and distribution of the Fund’s shares up to the maximum annual plan rate. Under the Class A reimbursement distribution plan, costs exceeding the maximum for the current plan year cannot be reimbursed in subsequent periods. In addition, under the Fund’s Class C and R compensation distribution plans, the Fund pays Distributors for costs incurred in connection with the servicing, sale and distribution of the Fund’s shares up to the maximum annual plan rate for each class. The plan year, for purposes of monitoring compliance with the maximum annual plan rates, is February 1 through January 31.
The maximum annual plan rates, based on the average daily net assets, for each class, are as follows:
| | | | |
Class A | | | 0.35 | % |
Class C | | | 1.00 | % |
Class R | | | 0.50 | % |
The Board has set the current rate at 0.25% per year for Class A shares until further notice and approval by the Board.
| | | | |
28 | | Annual Report | | franklintempleton.com |
TEMPLETON DEVELOPING MARKETS TRUST
NOTES TO FINANCIAL STATEMENTS
d. Sales Charges/Underwriting Agreements
Front-end sales charges and contingent deferred sales charges (CDSC) do not represent expenses of the Fund. These charges are deducted from the proceeds of sales of Fund shares prior to investment or from redemption proceeds prior to remittance, as applicable. Distributors has advised the Fund of the following commission transactions related to the sales and redemptions of the Fund’s shares for the year:
| | | | |
Sales charges retained net of commissions paid to unaffiliated brokers/dealers | | $ | 144,218 | |
| |
CDSC retained | | $ | 13,365 | |
e. Transfer Agent Fees
Each class of shares pays transfer agent fees to Investor Services for its performance of shareholder servicing obligations. Effective November 1, 2017, the fees are based on an annualized asset based fee of 0.02% plus a transaction based fee. Prior to November 1, 2017, the fees were account based fees that varied based on fund or account type. In addition, each class reimburses Investor Services for out of pocket expenses incurred and, except for Class R6, reimburses shareholder servicing fees paid to third parties. These fees are allocated daily based upon their relative proportion of such classes’ aggregate net assets. Class R6 pays Investor Services transfer agent fees specific to that class.
For the year ended December 31, 2017, the Fund paid transfer agent fees of $3,077,968, of which $1,270,006 was retained by Investor Services.
f. Investments in Affiliated Management Investment Companies
The Fund invests in one or more affiliated management investment companies for purposes other than exercising a controlling influence over the management or policies. Management fees paid by the Fund are waived on assets invested in the affiliated management investment companies, as noted in the Statement of Operations, in an amount not to exceed the management and administrative fees paid directly or indirectly by each affiliate. Prior to January 1, 2014, the waiver was accounted for as a reduction to management fees. During the year ended December 31, 2017, the Fund held investments in affiliated management investment companies as follows:
| | | | | | | | | | | | | | | | | | | | | | | | | | | | | | | | |
| | | Number of
Shares Held at Beginning of Year | | | Gross
Additions | | | Gross
Reductions | | | Number of
Shares
Held at End of Year | | | Value at
End of Year | | | Dividend
Income | | | Realized
Gain
(Loss) | | | Net Change
in Unrealized
Appreciation
(Depreciation) | |
| Non-Controlled Affiliates | | | | | | | | | | | | | |
Institutional Fiduciary Trust Money Market Portfolio, 0.89% | | | 22,362,941 | | | | 206,475,413 | | | | (212,037,944 | ) | | | 16,800,410 | | | $ | 16,800,410 | | | | $71,433 | | | $ | — | | | $ | — | |
| | | | | | | | | | | | | | | | | | | | |
g. Waiver and Expense Reimbursements
TAML and Investor Services have contractually agreed in advance to waive or limit their respective fees and to assume as their own expense certain expenses otherwise payable by the Fund so that the expenses (excluding distribution fees, and acquired fund fees and expenses) for Class A, Class C, Class R and Advisor Class of the Fund do not exceed 1.31%, and Class R6 does not exceed 1.08% based on the average net assets of each class (other than certain non-routine expenses or costs, including those relating to litigation, indemnification, reorganizations, and liquidations). Effective February 1, 2018, the expenses for each class of the Fund will be limited to 1.13% and Class R6 will be limited to 0.89% until April 30, 2018. Total expenses waived or paid are not subject to recapture subsequent to the Fund’s fiscal year end. Prior to May 1, 2017, expenses for Class R6 were limited to 1.11%.
In addition to the waiver above, TAML has contractually agreed in advance to limit the investment management fees to 1.05% of the average daily net assets of the Fund until April 30, 2018.
| | | | | | |
franklintempleton.com | | Annual Report | | | 29 | |
TEMPLETON DEVELOPING MARKETS TRUST
NOTES TO FINANCIAL STATEMENTS
4. Expense Offset Arrangement
The Fund has entered into an arrangement with its custodian whereby credits realized as a result of uninvested cash balances are used to reduce a portion of the Fund’s custodian expenses. During the year ended December 31, 2017, the custodian fees were reduced as noted in the Statement of Operations.
5. Income Taxes
For tax purposes, capital losses may be carried over to offset future capital gains. Capital loss carryforwards with no expiration, if any, must be fully utilized before those losses with expiration dates.
At December 31, 2017, the capital loss carryforwards were as follows:
| | | | |
Capital loss carryforwards subject to expiration: | | | | |
2018 | | $ | 12,538,988 | |
Capital loss carryforwards not subject to expiration: | | | | |
Short term | | | 105,901,182 | |
Long term | | | 40,560,178 | |
| | | | |
Total capital loss carryforwards | | $ | 159,000,348a | |
| | | | |
aIncludes $57,344,507 from the acquired Templeton BRIC Fund, which may be carried over to offset future capital gains, subject to certain limitations.
During the year ended December 31, 2017, the Fund utilized $48,368,847 of capital loss carryforwards.
On December 31, 2017, the Fund had expired capital loss carryforwards of $170,308,709.
For tax purposes, the Fund may elect to defer any portion of a late-year ordinary loss to the first day of the following fiscal year. At December 31, 2017, the Fund deferred late-year ordinary losses of $198,291.
The tax character of distributions paid during the years ended December 31, 2017 and 2016, was as follows:
| | | | | | | | |
| | | 2017 | | | 2016 | |
Distributions paid from ordinary income | | $ | 14,507,943 | | | $ | 15,061,900 | |
| | | | |
At December 31, 2017, the cost of investments and net unrealized appreciation (depreciation) for income tax purposes were as follows:
| | | | |
Cost of investments. | | $ | 1,106,829,861 | |
| | | | |
Unrealized appreciation | | $ | 609,812,239 | |
Unrealized depreciation | | | (58,797,679 | ) |
| | | | |
Net unrealized appreciation (depreciation) | | $ | 551,014,560 | |
| | | | |
Differences between income and/or capital gains as determined on a book basis and a tax basis are primarily due to differing treatment of corporate actions.
6. Investment Transactions
Purchases and sales of investments (excluding short term securities) for the year ended December 31, 2017, aggregated $132,707,225 and $262,872,683, respectively.
| | | | |
30 | | Annual Report | | franklintempleton.com |
TEMPLETON DEVELOPING MARKETS TRUST
NOTES TO FINANCIAL STATEMENTS
7. Concentration of Risk
Investing in foreign securities may include certain risks and considerations not typically associated with investing in U.S. securities, such as fluctuating currency values and changing local and regional economic, political and social conditions, which may result in greater market volatility. In addition, certain foreign securities may not be as liquid as U.S. securities.
The United States and other nations have imposed and could impose additional sanctions on certain issuers in Russia due to regional conflicts. These sanctions could result in the devaluation of Russia’s currency, a downgrade in Russian issuers’ credit ratings, or a decline in the value and liquidity of Russian stocks or other securities. Such sanctions could also adversely affect Russia’s economy, possibly forcing the economy into a recession. The Fund may be prohibited from investing in securities issued by companies subject to such sanctions. In addition, if the Fund holds the securities of an issuer that is subject to such sanctions, an immediate freeze of that issuer’s securities could result, impairing the ability of the Fund to buy, sell, receive or deliver those securities. There is also the risk that countermeasures could be taken by Russia’s government, which could involve the seizure of the Fund’s assets. These risks could affect the value of the Fund’s portfolio. While the Fund holds securities of certain issuers impacted by the sanctions, existing investments satisfy the applicable terms and conditions of the sanctions. At December 31, 2017, the Fund had 6.4% of its net assets invested in Russia.
8. Credit Facility
The Fund, together with other U.S. registered and foreign investment funds (collectively, Borrowers), managed by Franklin Templeton Investments, are borrowers in a joint syndicated senior unsecured credit facility totaling $2 billion (Global Credit Facility) which matured on February 9, 2018. This Global Credit Facility provides a source of funds to the Borrowers for temporary and emergency purposes, including the ability to meet future unanticipated or unusually large redemption requests. Effective February 9, 2018, the Borrowers renewed the Global Credit Facility for a one year term, maturing February 8, 2019, for a total of $2 billion.
Under the terms of the Global Credit Facility, the Fund shall, in addition to interest charged on any borrowings made by the Fund and other costs incurred by the Fund, pay its share of fees and expenses incurred in connection with the implementation and maintenance of the Global Credit Facility, based upon its relative share of the aggregate net assets of all of the Borrowers, including an annual commitment fee of 0.15% based upon the unused portion of the Global Credit Facility. These fees are reflected in other expenses in the Statement of Operations. During the year ended December 31, 2017, the Fund did not use the Global Credit Facility.
9. Fair Value Measurements
The Fund follows a fair value hierarchy that distinguishes between market data obtained from independent sources (observable inputs) and the Fund’s own market assumptions (unobservable inputs). These inputs are used in determining the value of the Fund’s financial instruments and are summarized in the following fair value hierarchy:
| | • | | Level 1 – quoted prices in active markets for identical financial instruments |
| | • | | Level 2 – other significant observable inputs (including quoted prices for similar financial instruments, interest rates, prepayment speed, credit risk, etc.) |
| | • | | Level 3 – significant unobservable inputs (including the Fund’s own assumptions in determining the fair value of financial instruments) |
The input levels are not necessarily an indication of the risk or liquidity associated with financial instruments at that level.
| | | | | | |
franklintempleton.com | | Annual Report | | | 31 | |
TEMPLETON DEVELOPING MARKETS TRUST
NOTES TO FINANCIAL STATEMENTS
9. Fair Value Measurements (continued)
For movements between the levels within the fair value hierarchy, the Fund has adopted a policy of recognizing the transfers as of the date of the underlying event which caused the movement.
A summary of inputs used as of December 31, 2017, in valuing the Fund’s assets carried at fair value, is as follows:
| | | | | | | | | | | | | | | | |
| | | Level 1 | | | Level 2 | | | Level 3 | | | Total | |
| Assets: | | | | | | | | | | | | | | | | |
Investments in Securities:a | | | | | | | | | | | | | | | | |
Equity Investmentsb | | $ | 1,630,823,964 | | | $ | — | | | $ | — | | | $ | 1,630,823,964 | |
Participatory Notes | | | — | | | | 10,220,047 | | | | — | | | | 10,220,047 | |
Short Term Investments | | | 16,800,410 | | | | — | | | | — | | | | 16,800,410 | |
Total Investments in Securities | | $ | 1,647,624,374 | | | $ | 10,220,047 | | | $ | — | | | $ | 1,657,844,421 | |
aFor detailed categories, see the accompanying Statement of Investments.
bIncludes common and preferred stocks.
10. Subsequent Events
The Fund has evaluated subsequent events through the issuance of the financial statements and determined that no events have occurred that require disclosure other than those already disclosed in the financial statements.
Abbreviations
| | |
| Selected Portfolio |
| ADR | | American Depositary Receipt |
| GDR | | Global Depositary Receipt |
| | | | |
32 | | Annual Report | | franklintempleton.com |
TEMPLETON DEVELOPING MARKETS TRUST
Report of Independent Registered Public Accounting Firm
To the Board of Trustees and Shareholders of Templeton Developing Markets Trust
Opinion on the Financial Statements
We have audited the accompanying statement of assets and liabilities, including the statement of investments, of Templeton Developing Markets Trust (the “Fund”) as of December 31, 2017, the related statement of operations for the year ended December 31, 2017, the statement of changes in net assets for each of the two years in the period ended December 31, 2017, including the related notes, and the financial highlights for each of the periods indicated therein (collectively referred to as the “financial statements”). In our opinion, the financial statements present fairly, in all material respects, the financial position of the Fund as of December 31, 2017, the results of its operations for the year then ended, the changes in its net assets for each of the two years in the period ended December 31, 2017 and the financial highlights for each of the periods indicated therein in conformity with accounting principles generally accepted in the United States of America.
Basis for Opinion
These financial statements are the responsibility of the Fund’s management. Our responsibility is to express an opinion on the Fund’s financial statements based on our audits. We are a public accounting firm registered with the Public Company Accounting Oversight Board (United States) (“PCAOB”) and are required to be independent with respect to the Fund in accordance with the U.S. federal securities laws and the applicable rules and regulations of the Securities and Exchange Commission and the PCAOB.
We conducted our audits of these financial statements in accordance with the standards of the PCAOB. Those standards require that we plan and perform the audit to obtain reasonable assurance about whether the financial statements are free of material misstatement, whether due to error or fraud.
Our audits included performing procedures to assess the risks of material misstatement of the financial statements, whether due to error or fraud, and performing procedures that respond to those risks. Such procedures included examining, on a test basis, evidence regarding the amounts and disclosures in the financial statements. Our audits also included evaluating the accounting principles used and significant estimates made by management, as well as evaluating the overall presentation of the financial statements. Our procedures included confirmation of securities owned as of December 31, 2017 by correspondence with the custodian, transfer agent, and brokers; when replies were not received from brokers, we performed other auditing procedures. We believe that our audits provide a reasonable basis for our opinion.
PricewaterhouseCoopers LLP
San Francisco, California
February 20, 2018
We have served as the auditor of one or more investment companies in the Franklin Templeton Group of Funds since 1948.
| | | | | | |
franklintempleton.com | | Annual Report | | | 33 | |
TEMPLETON DEVELOPING MARKETS TRUST
Tax Information (unaudited)
Under Section 854(b)(1)(B) of the Internal Revenue Code (Code), the Fund hereby reports the maximum amount allowable but no less than $22,498,338 as qualified dividends for purposes of the maximum rate under Section 1(h)(11) of the Code for the fiscal year ended December 31, 2017. Distributions, including qualified dividend income, paid during calendar year 2017 will be reported to shareholders on Form 1099-DIV by mid-February 2018. Shareholders are advised to check with their tax advisors for information on the treatment of these amounts on their individual income tax returns.
At December 31, 2017, more than 50% of the Fund’s total assets were invested in securities of foreign issuers. In most instances, foreign taxes were withheld from income paid to the Fund on these investments. As shown in the table below, the Fund hereby report to shareholders the foreign source income and foreign taxes paid, pursuant to Section 853 of the Code. This written statement will allow shareholders of record on December 21, 2017, to treat their proportionate share of foreign taxes paid by the Fund as having been paid directly by them. The shareholder shall consider these amounts as foreign taxes paid in the tax year in which they receive the Fund distribution.
The following table provide a detailed analysis of foreign tax paid, foreign source income, and foreign source qualified dividends as reported by the Fund, to Class A, Class C, Class R, Class R6 and Advisor Class shareholders of record.
| | | | | | | | | | | | |
| Class | | Foreign Tax Paid Per Share | | | Foreign Source Income Per Share | | | Foreign Source Qualified Dividends Per Share | |
| | | |
Class A | | | $0.0601 | | | | $0.2480 | | | | $0.1337 | |
Class C | | | $0.0601 | | | | $0.1057 | | | | $0.0570 | |
Class R | | | $0.0601 | | | | $0.2072 | | | | $0.1116 | |
Class R6 | | | $0.0601 | | | | $0.3418 | | | | $0.1842 | |
Advisor Class | | | $0.0601 | | | | $0.3000 | | | | $0.1617 | |
Foreign Tax Paid Per Share (Column 1) is the amount per share available to you, as a tax credit (assuming you held your shares in the Fund for a minimum of 16 days during the 31-day period beginning 15 days before the ex-dividend date of the Fund’s distribution to which the foreign taxes relate), or, as a tax deduction.
Foreign Source Income Per Share (Column 2) is the amount per share of income dividends attributable to foreign securities held by the Fund, plus any foreign taxes withheld on these dividends. The amounts reported include foreign source qualified dividends that have not been adjusted for the rate differential applicable to such dividend income.1
Foreign Source Qualified Dividends Per Share (Column 3) is the amount per share of foreign source qualified dividends, plus any foreign taxes withheld on these dividends. These amounts represent the portion of the Foreign Source Income reported to you in column 2 that were derived from qualified foreign securities held by the Fund.1
By mid-February 2018, shareholders will receive Form 1099-DIV which will include their share of taxes paid and foreign source income distributed during the calendar year 2017. The Foreign Source Income reported on Form 1099-DIV has not been adjusted for the rate differential on foreign source qualified dividend income. Shareholders are advised to check with their tax advisors for information on the treatment of these amounts on their 2017 individual income tax returns.
1. Qualified dividends are taxed at reduced long term capital gains tax rates. In determining the amount of foreign tax credit that may be applied against the U.S. tax liability of individuals receiving foreign source qualified dividends, adjustments may be required to the foreign tax credit limitation calculation to reflect the rate differential applicable to such dividend income. The rules however permit certain individuals to elect not to apply the rate differential adjustments for capital gains and/or dividends for any taxable year. Please consult your tax advisor and the instructions to Form 1116 for more information.
| | | | |
34 | | Annual Report | | franklintempleton.com |
TEMPLETON DEVELOPING MARKETS TRUST
Special Meeting of Shareholders
MEETING OF SHAREHOLDERS: OCTOBER 30, 2017 AND RECONVENED ON DECEMBER 15, 2017 AND DECEMBER 29, 2017
(UNAUDITED)
A Special Meeting of Shareholders of Templeton Developing Markets Trust was held at the offices of Franklin Templeton Investments, One Franklin Parkway, San Mateo, California on October 30, 2017 and reconvened on December 15, 2017 and December 29, 2017. The purpose of the meeting was to elect Trustees of Templeton Developing Markets Trust and to vote on the following proposals: to approve the use of a “manager of managers” structure whereby the Fund’s investment manager would be able to hire and replace subadvisers without shareholder approval; to approve a new Subadvisory Agreement with Franklin Templeton Investment Management Limited for the Fund; and to approve an amended fundamental investment restriction regarding investments in commodities for the Fund At the meeting, (i) the following persons were elected by the shareholders to serve as Trustees of the Templeton Developing Markets Trust: Harris J. Ashton, Ann Torre Bates, Mary C. Choksi, Edith E. Holiday, Gregory E. Johnson, Rupert H. Johnson, Jr., J. Michael Luttig, David W. Niemiec, Larry D. Thompson, Constantine D. Tseretopoulos, and Robert E. Wade; (ii) the proposal to approve a new Subadvisory Agreement with Franklin Templeton Investment Management Limited was approved by shareholders; and (iii) sufficient votes were not received to pass the proposals to use a “manager of managers” structure and to approve the amended fundamental investment restriction regarding investments in commodities. No other business was transacted at the meeting.
The results of the voting at the meeting are as follows:
Proposal 1. To elect a Board of Trustees:
| | | | | | | | |
| Name | | For | | | Withheld | |
| | |
Harris J. Ashton | | | 33,166,525 | | | | 1,708,426 | |
| | |
Ann Torre Bates | | | 38,237,463 | | | | 1,637,488 | |
| | |
Mary C. Choksi | | | 38,205,513 | | | | 1,669,439 | |
| | |
Edith E. Holiday | | | 38,219,641 | | | | 1,655,311 | |
| | |
Gregory E. Johnson | | | 38,238,066 | | | | 1,636,885 | |
| | |
Rupert H. Johnson, Jr | | | 38,153,709 | | | | 1,721,243 | |
| | |
J. Michael Luttig | | | 38,112,646 | | | | 1,762,305 | |
| | |
David W. Niemiec | | | 38,214,856 | | | | 1,660,096 | |
| | |
Larry D. Thompson | | | 38,195,256 | | | | 1,679,695 | |
| | |
Constantine D. Tseretopoulos | | | 38,210,385 | | | | 1,664,567 | |
| | |
Robert E. Wade | | | 38,226,205 | | | | 1,648,747 | |
Total Trust Shares Outstanding*: 77,216,327
* As of the record date.
| | | | | | |
franklintempleton.com | | Annual Report | | | 35 | |
TEMPLETON DEVELOPING MARKETS TRUST
SPECIAL MEETING OF SHAREHOLDERS
| Proposal 2. | To approve the use of a “manager of managers” structure whereby the Fund’s investment manager would be able to hire and replace subadvisers without shareholder approval: |
| | | | |
| | | Shares | |
| |
For | | | 26,383,896 | |
| |
Against | | | 1,639,462 | |
| |
Abstain | | | 1,102,875 | |
| |
Broker Non-Votes | | | 10,748,717 | |
| |
Total Fund Shares Voted | | | 39,874,952 | |
| |
Total Fund Shares Outstanding* | | | 77,216,327 | |
| Proposal 3. | To approve a new Subadvisory Agreement with Franklin Templeton Investment Management Limited: |
| | | | |
| | | Shares | |
| |
For | | | 26,995,505 | |
| |
Against | | | 992,015 | |
| |
Abstain | | | 1,138,714 | |
| |
Broker Non-Votes | | | 10,748,717 | |
| |
Total Fund Shares Voted | | | 39,874,952 | |
| |
Total Fund Shares Outstanding* | | | 77,216,327 | |
| Proposal 4. | To approve an amended fundamental investment restriction regarding investments in commodities: |
| | | | |
| | | Shares | |
| |
For | | | 26,646,854 | |
| |
Against | | | 1,281,617 | |
| |
Abstain | | | 1,197,765 | |
| |
Broker Non-Votes | | | 10,748,714 | |
| |
Total Fund Shares Voted | | | 39,874,952 | |
| |
Total Fund Shares Outstanding* | | | 77,216,327 | |
| | | | |
36 | | Annual Report | | franklintempleton.com |
TEMPLETON DEVELOPING MARKETS TRUST
Board Members and Officers
The name, year of birth and address of the officers and board members, as well as their affiliations, positions held with the Trust, principal occupations during at least the past five years and number of US registered portfolios overseen in the Franklin Templeton Investments fund complex, are shown below. Generally, each board member serves until that person’s successor is elected and qualified.
Independent Board Members
| | | | | | | | |
Name, Year of Birth and Address | | Position | | Length of Time Served | | Number of Portfolios in Fund Complex Overseen by Board Member* | | Other Directorships Held During at Least the Past 5 Years |
| | | | |
Harris J. Ashton (1932) 300 S.E. 2nd Street Fort Lauderdale, FL 33301-1923 | | Trustee | | Since 1992 | | 139 | | Bar-S Foods (meat packing company) (1981-2010). |
| | |
| Principal Occupation During at Least the Past 5 Years: | | | | |
Director of various companies; and formerly, Director, RBC Holdings, Inc. (bank holding company) (until 2002); and President, Chief Executive Officer and Chairman of the Board, General Host Corporation (nursery and craft centers) (until 1998). |
| | | | |
Ann Torre Bates (1958) 300 S.E. 2nd Street Fort Lauderdale, FL 33301-1923 | | Trustee | | Since 2008 | | 40 | | Ares Capital Corporation (specialty finance company) (2010-present), United Natural Foods, Inc. (distributor of natural, organic and specialty foods) (2013-present), Allied Capital Corporation (financial services) (2003-2010), SLM Corporation (Sallie Mae) (1997-2014) and Navient Corporation (loan management, servicing and asset recovery) (2014-2016). |
| | |
| Principal Occupation During at Least the Past 5 Years: | | | | |
Director of various companies; and formerly, Executive Vice President and Chief Financial Officer, NHP Incorporated (manager of multifamily housing) (1995-1997); and Vice President and Treasurer, US Airways, Inc. (until 1995). |
| | | | |
Mary C. Choksi (1950) 300 S.E. 2nd Street Fort Lauderdale, FL 33301-1923 | | Trustee | | Since 2016 | | 139 | | Avis Budget Group Inc. (car rental) (2007-present), Omnicom group Inc. (advertising and marketing communications services) (2011-present) and White Mountains Insurance Group, Ltd. (holding company (2017-present). |
| | |
| Principal Occupation During at Least the Past 5 Years: | | | | |
Director of various companies; and formerly, Founder and Senior Advisor, Strategic Investment Group (investment management group) (2015-2017); Founding Partner and Managing Director, Emerging Markets Management LLC (investment management firm) (1987-2011); and Loan Officer/Senior Loan Officer/Senior Pension Investment Officer, World Bank Group (international financial institution) (1977-1987). |
| | | | |
Edith E. Holiday (1952) 300 S.E. 2nd Street Fort Lauderdale, FL 33301-1923 | | Lead
Independent
Trustee | | Trustee since
1996 and Lead Independent Trustee since 2007 | | 139 | | Hess Corporation (exploration of oil and gas) (1993-present), Canadian National Railway (railroad) (2001-present), White Mountains Insurance Group, Ltd. (holding company) (2004-present), Santander Consumer USA Holdings, Inc. (consumer finance) (2016-present), RTI International Metals, Inc. (manufacture and distribution of titanium (1999-2015) and H.J. Heinz Company (processed foods and allied products) (1994-2013). |
| | |
| Principal Occupation During at Least the Past 5 Years: | | | | |
| Director or Trustee of various companies and trusts; and formerly, Assistant to the President of the United States and Secretary of the Cabinet (1990-1993); General Counsel to the United States Treasury Department (1989-1990); and Counselor to the Secretary and Assistant Secretary for Public Affairs and Public Liaison-United States Treasury Department (1988-1989). |
| | | | | | |
franklintempleton.com | | Annual Report | | | 37 | |
TEMPLETON DEVELOPING MARKETS TRUST
Independent Board Members (continued)
| | | | | | | | |
Name, Year of Birth and Address | | Position | | Length of
Time Served | | Number of Portfolios in Fund Complex Overseen by Board Member* | | Other Directorships Held During at Least the Past 5 Years |
| | | | |
J. Michael Luttig (1954) 300 S.E. 2nd Street Fort Lauderdale, FL 33301-1923 | | Trustee | | Since 2009 | | 139 | | Boeing Capital Corporation (aircraft financing) (2006-2013). |
|
| Principal Occupation During at Least the Past 5 Years: |
Executive Vice President, General Counsel and member of the Executive Council, The Boeing Company (aerospace company) (2006-present); and formerly, Federal Appeals Court Judge, U.S. Court of Appeals for the Fourth Circuit (1991-2006). |
| | | | |
David W. Niemiec (1949) 300 S.E. 2nd Street Fort Lauderdale, FL 33301-1923 | | Trustee | | Since 2005 | | 40 | | Hess Midstream Partners LP (oil and gas midstream infrastructure) (2017-present). |
|
| Principal Occupation During at Least the Past 5 Years: |
Advisor, Saratoga Partners (private equity fund); and formerly, Managing Director, Saratoga Partners (1998-2001) and SBC Warburg Dillon Read (investment banking) (1997-1998); Vice Chairman, Dillon, Read & Co. Inc. (investment banking) (1991-1997); and Chief Financial Officer, Dillon, Read & Co. Inc. (1982-1997). |
| | | | |
Larry D. Thompson (1945) 300 S.E. 2nd Street Fort Lauderdale, FL 33301-1923 | | Trustee | | Since 2005 | | 139 | | The Southern Company (energy company) (2014-present; previously 2010-2012), Graham Holdings Company (education and media organization) (2011-present) and Cbeyond, Inc. (business communications provider) (2010-2012). |
|
| Principal Occupation During at Least the Past 5 Years: |
Director of various companies; Counsel, Finch McCranie, LLP (law firm) (2015-preent); Independent Compliance Monitor and Auditor, Volkswagen AG (manufacturer of automobiles and commercial vehicles) (2017-present); John A. Sibley Professor of Corporate and Business Law, University of Georgia School of Law (2015-present; previously 2011-2012); and formerly, Executive Vice President - Government Affairs, General Counsel and Corporate Secretary, PepsiCo, Inc. (consumer products) (2012-2014); Senior Vice President - Government Affairs, General Counsel and Secretary, PepsiCo, Inc. (2004-2011); Senior Fellow of The Brookings Institution (2003-2004); Visiting Professor, University of Georgia School of Law (2004); and Deputy Attorney General, U.S. Department of Justice (2001-2003). |
| | | | |
Constantine D. Tseretopoulos (1954) 300 S.E. 2nd Street Fort Lauderdale, FL 33301-1923 | | Trustee | | Since 1991 | | 26 | | None |
|
| Principal Occupation During at Least the Past 5 Years: |
Physician, Chief of Staff, owner and operator of the Lyford Cay Hospital (1987-present); director of various nonprofit organizations; and formerly, Cardiology Fellow, University of Maryland (1985-1987); and Internal Medicine Resident, Greater Baltimore Medical Center (1982-1985). |
| | | | |
Robert E. Wade (1946) 300 S.E. 2nd Street Fort Lauderdale, FL 33301-1923 | | Trustee | | Since 2006 | | 40 | | El Oro Ltd (investments) (2003-present). |
|
| Principal Occupation During at Least the Past 5 Years: |
Attorney at law engaged in private practice as a sole practitioner (1972-2008) and member of various boards. |
| | | | |
38 | | Annual Report | | franklintempleton.com |
TEMPLETON DEVELOPING MARKETS TRUST
Interested Board Members and Officers
| | | | | | | | |
Name, Year of Birth and Address | | Position | | Length of
Time Served | | Number of Portfolios in Fund Complex Overseen by Board Member* | | Other Directorships Held During at Least the Past 5 Years |
| | | | |
**Gregory E. Johnson (1961) One Franklin Parkway San Mateo, CA 94403-1906 | | Trustee | | Since 2007 | | 153 | | None |
|
| Principal Occupation During at Least the Past 5 Years: |
Chairman of the Board, Member - Office of the Chairman, Director and Chief Executive Officer, Franklin Resources, Inc.; officer and/or director or trustee, as the case may be, of some of the other subsidiaries of Franklin Resources, Inc. and of 43 of the investment companies in Franklin Templeton Investments; Vice Chairman, Investment Company Institute; and formerly, President, Franklin Resources, Inc. (1994-2015). |
| | | | |
**Rupert H. Johnson, Jr. (1940) One Franklin Parkway San Mateo, CA 94403-1906 | | Chairman of
the Board,
Trustee and
Vice President | | Chairman of the
Board and
Trustee since
2013 and Vice
President since
1996 | | 139 | | None |
|
| Principal Occupation During at Least the Past 5 Years: |
Vice Chairman, Member - Office of the Chairman and Director, Franklin Resources, Inc.; Director, Franklin Advisers, Inc.; Senior Vice President, Franklin Advisory Services, LLC; and officer and/or director or trustee, as the case may be, of some of the other subsidiaries of Franklin Resources, Inc. and of 41 of the investment companies in Franklin Templeton Investments. |
| | | | |
Alison E. Baur (1964) One Franklin Parkway San Mateo, CA 94403-1906 | | Vice President | | Since 2012 | | Not Applicable | | Not Applicable |
|
| Principal Occupation During at Least the Past 5 Years: |
Deputy General Counsel, Franklin Templeton Investments; and officer of some of the other subsidiaries of Franklin Resources, Inc. and of 45 of the investment companies in Franklin Templeton Investments. |
| | | | |
Stephen H. Dover (1961) One Franklin Parkway San Mateo, CA 94403-1906 | | President and
Chief Executive
Officer –
Investment
Management | | Since June 2017 | | Not Applicable | | Not Applicable |
|
| Principal Occupation During at Least the Past 5 Years: |
Chief Investment Officer, Templeton Emerging Market Group; Executive Vice President, Franklin Advisers, Inc.; and officer of four of the investment companies in Franklin Templeton Investments. |
| | | | |
Aliya S. Gordon (1973) One Franklin Parkway San Mateo, CA 94403-1906 | | Vice President | | Since 2009 | | Not Applicable | | Not Applicable |
|
| Principal Occupation During at Least the Past 5 Years: |
Senior Associate General Counsel, Franklin Templeton Investments; and officer of 45 of the investment companies in Franklin Templeton Investments. |
| | | | |
Steven J. Gray (1955) One Franklin Parkway San Mateo, CA 94403-1906 | | Vice President | | Since 2009 | | Not Applicable | | Not Applicable |
|
| Principal Occupation During at Least the Past 5 Years: |
Senior Associate General Counsel, Franklin Templeton Investments; Vice President, Franklin Templeton Distributors, Inc. and FASA, LLC; and officer of 45 of the investment companies in Franklin Templeton Investments. |
| | | | |
Matthew T. Hinkle (1971) One Franklin Parkway San Mateo, CA 94403-1906 | | Chief Executive
Officer –
Finance and
Administration | | Since June 2017 | | Not Applicable | | Not Applicable |
|
| Principal Occupation During at Least the Past 5 Years: |
Senior Vice President, Franklin Templeton Services, LLC; officer of 45 of the investment companies in Franklin Templeton Investments; and formerly, Vice President, Global Tax (2012-April 2017) and Treasurer/Assistant Treasurer, Franklin Templeton Investments (2009-2017). |
| | | | | | |
franklintempleton.com | | Annual Report | | | 39 | |
TEMPLETON DEVELOPING MARKETS TRUST
Interested Board Members and Officers (continued)
| | | | | | | | |
Name,Year of Birth and Address | | Position | | Length of Time Served | | Number of Portfolios in Fund Complex Overseen by Board Member* | | Other Directorships Held During at Least the Past 5 Years |
| | | | |
Robert G. Kubilis (1973) 300 S.E. 2nd Street Fort Lauderdale, FL 33301-1923 | | Chief Financial
Officer and
Chief
Accounting
Officer and
Treasurer | | Since June 2017 | | Not Applicable | | Not Applicable |
|
| Principal Occupation During at Least the Past 5 Years: |
Treasurer, U.S. Fund Administration & Reporting, Franklin Templeton Investments; and officer of 17 of the investment companies in Franklin Templeton Investments. |
| | | | |
Robert Lim (1948) One Franklin Parkway San Mateo, CA 94403-1906 | | Vice President
–AML
Compliance | | Since 2016 | | Not Applicable | | Not Applicable |
|
| Principal Occupation During at Least the Past 5 Years: |
Vice President, Franklin Templeton Companies, LLC; Chief Compliance Officer, Franklin Templeton Distributors, Inc. and Franklin Templeton Investor Services, LLC; and officer of 45 of the investment companies in Franklin Templeton Investments. |
| | | | |
Kimberly H. Novotny (1972) 300 S.E. 2nd Street Fort Lauderdale, FL 33301-1923 | | Vice President | | Since 2013 | | Not Applicable | | Not Applicable |
|
| Principal Occupation During at Least the Past 5 Years: |
Associate General Counsel, Franklin Templeton Investments; Vice President and Corporate Secretary, Fiduciary Trust International of the South; Vice President, Templeton Investment Counsel, LLC; Assistant Secretary, Franklin Resources, Inc.; and officer of 45 of the investment companies in Franklin Templeton Investments. |
| | | | |
Robert C. Rosselot (1960) 300 S.E. 2nd Street Fort Lauderdale, FL 33301-1923 | | Chief
Compliance
Officer | | Since 2013 | | Not Applicable | | Not Applicable |
|
| Principal Occupation During at Least the Past 5 Years: |
Director, Global Compliance, Franklin Templeton Investments; Vice President, Franklin Templeton Companies, LLC; officer of 45 of the investment companies in Franklin Templeton Investments; and formerly, Senior Associate General Counsel, Franklin Templeton Investments (2007-2013); and Secretary and Vice President, Templeton Group of Funds (2004-2013). |
| | | | |
Karen L. Skidmore (1952) One Franklin Parkway San Mateo, CA 94403-1906 | | Vice President | | Since 2009 | | Not Applicable | | Not Applicable |
|
| Principal Occupation During at Least the Past 5 Years: |
Senior Associate General Counsel, Franklin Templeton Investments; and officer of 45 of the investment companies in Franklin Templeton Investments. |
| | | | |
Navid J. Tofigh (1972) One Franklin Parkway San Mateo, CA 94403-1906 | | Vice President | | Since 2015 | | Not Applicable | | Not Applicable |
|
| Principal Occupation During at Least the Past 5 Years: |
Associate General Counsel, Franklin Templeton Investments; and officer of 45 of the investment companies in Franklin Templeton Investments. |
| | | | |
Craig S. Tyle (1960) One Franklin Parkway San Mateo, CA 94403-1906 | | Vice President | | Since 2005 | | Not Applicable | | Not Applicable |
|
| Principal Occupation During at Least the Past 5 Years: |
General Counsel and Executive Vice President, Franklin Resources, Inc.; and officer of some of the other subsidiaries of Franklin Resources, Inc. and of 45 of the investment companies in Franklin Templeton Investments. |
| | | | |
40 | | Annual Report | | franklintempleton.com |
TEMPLETON DEVELOPING MARKETS TRUST
Interested Board Members and Officers (continued)
| | | | | | | | |
Name, Year of Birth and Address | | Position | | Length of Time Served | | Number of Portfolios in Fund Complex Overseen by Board Member* | | Other Directorships Held During at Least the Past 5 Years |
| | | | |
Lori A. Weber (1964) 300 S.E. 2nd Street Fort Lauderdale, FL 33301-1923 | | Secretary and
Vice President | | Secretary since
2013 and Vice
President since
2011 | | Not Applicable | | Not Applicable |
|
| Principal Occupation During at Least the Past 5 Years: |
Senior Associate General Counsel, Franklin Templeton Investments; Assistant Secretary, Franklin Resources, Inc.; Vice President and Secretary, Templeton Investment Counsel, LLC; and officer of 45 of the investment companies in Franklin Templeton Investments. |
*We base the number of portfolios on each separate series of the US registered investment companies within the Franklin Templeton Investments fund complex. These portfolios have a common investment manager or affiliated investment managers.
**Gregory E. Johnson is considered to be an interested person of the Fund under the federal securities laws due to his position as an officer and director of Franklin Resources, Inc. (Resources), which is the parent company of the Fund’s investment manager and distributor. Rupert H. Johnson, Jr. is considered to be an interested person of the Fund under the federal securities laws due to his position as officer and director and major shareholder of Resources.
Note 1: Rupert H. Johnson, Jr. is the uncle of Gregory E. Johnson.
Note 2: Officer information is current as of the date of this report. It is possible that after this date, information about officers may change.
The Sarbanes-Oxley Act of 2002 and Rules adopted by the US Securities and Exchange Commission require the Fund to disclose whether the Fund’s Audit Committee includes at least one member who is an audit committee financial expert within the meaning of such Act and Rules. The Fund’s Board has determined that there is at least one such financial expert on the Audit Committee and has designated each of Ann Torre Bates and David W. Niemiec as an audit committee financial expert. The Board believes that Ms. Bates and Mr. Niemiec qualify as such an expert in view of their extensive business background and experience. Ms. Bates has served as a member of the Fund Audit Committee since 2008. She currently serves as a director of Ares Capital Corporation (2010-present) and United Natural Foods, Inc. (2013-present) and was formerly a director of Navient Corporation from 2014 to 2016, SLM Corporation from 1997 to 2014 and Allied Capital Corporation from 2003 to 2010, Executive Vice President and Chief Financial Officer of NHP Incorporated from 1995 to 1997 and Vice President and Treasurer of US Airways, Inc. until 1995. Mr. Niemiec has served as a member of the Fund Audit Committee since 2005, currently serves as an Advisor to Saratoga Partners and was formerly its Managing Director from 1998 to 2001 and serves as a director of Hess Midstream Partners LP (2017-present). Mr. Niemiec was formerly a director of Emeritus Corporation from 1999 to 2010 and OSI Pharmaceuticals, Inc. from 2006 to 2010, Managing Director of SBC Warburg Dillon Read from 1997 to 1998, and was Vice Chairman from 1991 to 1997 and Chief Financial Officer from 1982 to 1997 of Dillon, Read & Co. Inc. As a result of such background and experience, the Board believes that Ms. Bates and Mr. Niemiec have each acquired an understanding of generally accepted accounting principles and financial statements, the general application of such principles in connection with the accounting estimates, accruals and reserves, and analyzing and evaluating financial statements that present a breadth and level of complexity of accounting issues generally comparable to those of the Fund, as well as an understanding of internal controls and procedures for financial reporting and an understanding of audit committee functions. Ms. Bates and Mr. Niemiec are independent Board members as that term is defined under the applicable US Securities and Exchange Commission Rules and Releases.
The Statement of Additional Information (SAI) includes additional information about the board members and is available, without charge, upon request. Shareholders may call (800) DIAL BEN/342-5236 to request the SAI.
| | | | | | |
franklintempleton.com | | Annual Report | | | 41 | |
TEMPLETON DEVELOPING MARKETS TRUST
Shareholder Information
Proxy Voting Policies and Procedures
The Trust’s investment manager has established Proxy Voting Policies and Procedures (Policies) that the Trust uses to determine how to vote proxies relating to portfolio securities. Shareholders may view the Trust’s complete Policies online at franklintempleton.com. Alternatively, shareholders may request copies of the Policies free of charge by calling the Proxy Group collect at (954) 527-7678 or by sending a written request to: Franklin Templeton Companies, LLC, 300 S.E. 2nd Street, Fort Lauderdale, FL 33301, Attention: Proxy Group. Copies of the Trust’s proxy voting records are also made available online at franklintempleton.com and posted on the US Securities and Exchange Commission’s website at sec.gov and reflect the most recent 12-month period ended June 30.
Quarterly Statement of Investments
The Trust files a complete statement of investments with the US Securities and Exchange Commission for the first and third quarters for each fiscal year on Form N-Q. Shareholders may view the filed Form N-Q by visiting the Commission’s website at sec.gov. The filed form may also be viewed and copied at the Commission’s Public Reference Room in Washington, DC. Information regarding the operations of the Public Reference Room may be obtained by calling (800) SEC-0330.
Householding of Reports and Prospectuses
You will receive the Fund’s financial reports every six months as well as an annual updated summary prospectus (prospectus available upon request). To reduce Fund expenses, we try to identify related shareholders in a household and send only one copy of the financial reports and summary prospectus. This process, called “householding,” will continue indefinitely unless you instruct us otherwise. If you prefer not to have these documents householded, please call us at (800) 632-2301. At any time you may view current prospectuses/summary prospectuses and financial reports on our website. If you choose, you may receive these documents through electronic delivery.
| | | | |
42 | | Annual Report | | franklintempleton.com |
This page intentionally left blank.
This page intentionally left blank.
| | |
| |

| | Annual Report and Shareholder Letter Templeton Developing Markets Trust Investment Manager Templeton Asset Management Ltd. Distributor Franklin Templeton Distributors, Inc. (800) DIAL BEN® / 342-5236 franklintempleton.com Shareholder Services (800) 632-2301 |
| |
| |
| |
| |
| |
| |
| |
| |
| |
Authorized for distribution only when accompanied or preceded by a summary prospectus and/or prospectus. Investors should carefully consider a fund’s investment goals, risks, charges and expenses before investing. A prospectus contains this and other information; please read it carefully before investing.
To help ensure we provide you with quality service, all calls to and from our service areas are monitored and/or recorded.
| | | | |
| | © 2018 Franklin Templeton Investments. All rights reserved. | | 711 A 02/18 |
(a) The Registrant has adopted a code of ethics that applies to its principal executive officers and principal financial and accounting officer.
(c) N/A
(d) N/A
(f) Pursuant to Item 12(a)(1), the Registrant is attaching as an exhibit a copy of its code of ethics that applies to its principal executive officers and principal financial and accounting officer.
| Item 3. | Audit Committee Financial Expert. |
(a)(1) The Registrant has an audit committee financial expert serving on its audit committee.
(2) The audit committee financial expert is David W. Niemiec and he is “independent” as defined under the relevant Securities and Exchange Commission Rules and Releases.
| Item 4. | Principal Accountant Fees and Services. |
(a) Audit Fees
The aggregate fees paid to the principal accountant for professional services rendered by the principal accountant for the audit of the registrant’s annual financial statements or for services that are normally provided by the principal accountant in connection with statutory and regulatory filings or engagements were $50,929 for the fiscal year ended December 31, 2017 and $97,488 for the fiscal year ended December 31, 2016.
(b) Audit-Related Fees
There were no fees paid to the principal accountant for assurance and related services rendered by the principal accountant to the registrant that are reasonably related to the performance of the audit of the registrant’s financial statements and are not reported under paragraph (a) of Item 4.
There were no fees paid to the principal accountant for assurance and related services rendered by the principal accountant to the registrant’s investment adviser and any entity controlling, controlled by or under common control with the investment adviser that provides ongoing services to the registrant that are reasonably related to the performance of the audit of their financial statements.
(c) Tax Fees
There were no fees paid to the principal accountant for professional services rendered by the principal accountant to the registrant for tax compliance, tax advice and tax planning.
There were no fees paid to the principal accountant for professional services rendered by the principal accountant to the registrant’s investment adviser and any entity controlling, controlled by or under
common control with the investment adviser that provides ongoing services to the registrant for tax compliance, tax advice and tax planning.
(d) All Other Fees
There were no fees paid to the principal accountant for products and services rendered by the principal accountant to the registrant not reported in paragraphs (a)-(c) of Item 4.
The aggregate fees paid to the principal accountant for products and services rendered by the principal accountant to the registrant’s investment adviser and any entity controlling, controlled by or under common control with the investment adviser that provides ongoing services to the registrant other than services reported in paragraphs (a)-(c) of Item 4 were $14,000 for the fiscal year ended December 31, 2017 and $0 for the fiscal year ended December 31, 2016. The services for which these fees were paid included benchmarking services in connection with the 2015 ICI TA Survey.
(e) (1) The registrant’s audit committee is directly responsible for approving the services to be provided by the auditors, including:
(i) pre-approval of all audit and audit related services;
(ii) pre-approval of all non-audit related services to be provided to the Fund by the auditors;
(iii) pre-approval of all non-audit related services to be provided to the registrant by the auditors to the registrant’s investment adviser or to any entity that controls, is controlled by or is under common control with the registrant’s investment adviser and that provides ongoing services to the registrant where the non-audit services relate directly to the operations or financial reporting of the registrant; and
(iv) establishment by the audit committee, if deemed necessary or appropriate, as an alternative to committee pre-approval of services to be provided by the auditors, as required by paragraphs (ii) and (iii) above, of policies and procedures to permit such services to be pre-approved by other means, such as through establishment of guidelines or by action of a designated member or members of the committee; provided the policies and procedures are detailed as to the particular service and the committee is informed of each service and such policies and procedures do not include delegation of audit committee responsibilities, as contemplated under the Securities Exchange Act of 1934, to management; subject, in the case of (ii) through (iv), to any waivers, exceptions or exemptions that may be available under applicable law or rules.
(e) (2) None of the services provided to the registrant described in paragraphs (b)-(d) of Item 4 were approved by the audit committee pursuant to paragraph (c)(7)(i)(C) of Rule 2-01 of regulation S-X.
(f) No disclosures are required by this Item 4(f).
(g) The aggregate non-audit fees paid to the principal accountant for services rendered by the principal accountant to the registrant and the registrant’s investment adviser and any entity controlling, controlled by or under common control with the investment adviser that provides ongoing services to the registrant were $14,000 for the fiscal year ended December 31, 2017 and $0 for the fiscal year ended December 31, 2016.
(h) The registrant’s audit committee of the board has considered whether the provision of non-audit services that were rendered to the registrant’s investment adviser (not including any sub-adviser whose role is primarily portfolio management and is subcontracted with or overseen by another investment adviser), and any entity controlling, controlled by, or under common control with the investment adviser that provides ongoing services to the registrant that were not pre-approved pursuant to paragraph (c)(7)(ii) of Rule 2-01 of Regulation S-X is compatible with maintaining the principal accountant’s independence.
| Item 5. | Audit Committee of Listed Registrants. N/A |
| Item 6. | Schedule of Investments. N/A |
| Item 7. | Disclosure of Proxy Voting Policies and Procedures for Closed-End Management Investment Companies. N/A |
| Item 8. | Portfolio Managers of Closed-End Management Investment Companies. N/A |
| Item 9. | Purchases of Equity Securities by Closed-End Management Investment Company and Affiliated Purchasers. N/A |
| Item 10. | Submission of Matters to a Vote of Security Holders. |
There have been no changes to the procedures by which shareholders may recommend nominees to the Registrant’s Board of Trustees that would require disclosure herein.
| Item 11. | Controls and Procedures. |
(a) Evaluation of Disclosure Controls and Procedures. The Registrant maintains disclosure controls and procedures that are designed to ensure that information required to be disclosed in the Registrant’s filings under the Securities Exchange Act of 1934 and the Investment Company Act of 1940 is recorded, processed, summarized and reported within the periods specified in the rules and forms of the Securities and Exchange Commission. Such information is accumulated and communicated to the Registrant’s management, including its principal executive officer and principal financial officer, as appropriate, to allow timely decisions regarding required disclosure. The Registrant’s management, including the principal executive officer and the principal
financial officer, recognizes that any set of controls and procedures, no matter how well designed and operated, can provide only reasonable assurance of achieving the desired control objectives.
Within 90 days prior to the filing date of this Shareholder Report on Form N-CSR, the Registrant had carried out an evaluation, under the supervision and with the participation of the Registrant’s management, including the Registrant’s principal executive officer and the Registrant’s principal financial officer, of the effectiveness of the design and operation of the Registrant’s disclosure controls and procedures. Based on such evaluation, the Registrant’s principal executive officer and principal financial officer concluded that the Registrant’s disclosure controls and procedures are effective.
(b) Changes in Internal Controls. There have been no changes in the Registrant’s internal controls or in other factors that could materially affect the internal controls over financial reporting subsequent to the date of their evaluation in connection with the preparation of this Shareholder Report on Form N-CSR.
(a)(1) Code of Ethics
(a)(2) Certifications pursuant to Section 302 of the Sarbanes-Oxley Act of 2002 of Matthew T. Hinkle, Chief Executive Officer - Finance and Administration, and Robert G. Kubilis, Chief Financial Officer and Chief Accounting Officer
(b) Certifications pursuant to Section 906 of the Sarbanes-Oxley Act of 2002 of Matthew T. Hinkle, Chief Executive Officer - Finance and Administration, and Robert G. Kubilis, Chief Financial Officer and Chief Accounting Officer
SIGNATURES
Pursuant to the requirements of the Securities Exchange Act of 1934 and the Investment Company Act of 1940, the registrant has duly caused this report to be signed on its behalf by the undersigned, thereunto duly authorized.
TEMPLETON DEVELOPING MARKETS TRUST
| | |
| |
| By | | /s/ MATTHEW T. HINKLE |
| | Matthew T. Hinkle |
| | Chief Executive Officer – |
| | Finance and Administration |
Pursuant to the requirements of the Securities Exchange Act of 1934 and the Investment Company Act of 1940, this report has been signed below by the following persons on behalf of the registrant and in the capacities and on the dates indicated.
| | |
| |
| By | | /s/ MATTHEW T. HINKLE |
| | Matthew T. Hinkle |
| | Chief Executive Officer – |
| | Finance and Administration |
| | |
| |
| By | | /s/ ROBERT G. KUBILIS |
| | Robert G. Kubilis |
| | Chief Financial Officer and |
| | Chief Accounting Officer |