UNITED STATES
SECURITIES AND EXCHANGE COMMISSION
Washington, DC 20549
FORMN-CSRS
CERTIFIED SHAREHOLDER REPORT OF REGISTERED
MANAGEMENT INVESTMENT COMPANIES
Investment Company Act file number811-06378
Templeton Developing Markets Trust
(Exact name of registrant as specified in charter)
300 S.E. 2nd Street, Fort Lauderdale, FL 33301-1923
(Address of principal executive offices) (Zip code)
Craig S. Tyle, One Franklin Parkway, San Mateo, CA 94403-1906
(Name and address of agent for service)
Registrant’s telephone number, including area code: (954) 527-7500
Date of fiscal year end: 12/31
Date of reporting period: 6/30/19
| Item 1. | Reports to Stockholders. |
Sign up for electronic delivery at franklintempleton.com/edelivery
Internet Delivery of Fund Reports Unless You Request Paper Copies: Effective January 1, 2021, as permitted by the SEC, paper copies of the Fund’s shareholder reports will no longer be sent by mail, unless you specifically request them from the Fund or your financial intermediary. Instead, the reports will be made available on a website, and you will be notified by mail each time a report is posted and provided with a website link to access the report.
If you already elected to receive shareholder reports electronically, you will not be affected by this change and you need not take any action. If you have not signed up for electronic delivery, we would encourage you to join fellow shareholders who have. You may elect to receive shareholder reports and other communications electronically from the Fund by calling (800)632-2301 or by contacting your financial intermediary.
You may elect to continue to receive paper copies of all your future shareholder reports free of charge by contacting your financial intermediary or, if you invest directly with a Fund, calling (800)632-2301 to let the Fund know of your request. Your election to receive reports in paper will apply to all funds held in your account.
FRANKLIN TEMPLETON
Successful investing begins with ambition. And achievement only comes when you reach for it. That’s why we continually strive to deliver better outcomes for investors. No matter what your goals are, our deep, global investment expertise allows us to offer solutions that can help.
During our more than 70 years of experience, we’ve managed through all kinds of markets—up, down and those in between. We’re always preparing for what may come next. It’s because of this, combined with our strength as one of the world’s largest asset managers that we’ve earned the trust of millions of investors around the world.
Dear Shareholder:
During the six months ended June 30, 2019, emerging market economies’ growth moderated, though in aggregate remained higher than that of developed market economies. U.S.-China trade tensions and a broader weakening of global trade contributed to the economic slowdown. Despite this environment, emerging market equities rose, as measured by the MSCI Emerging Markets Index, although less than developed and frontier market equities.
It was a volatile period for emerging market equities, bolstered in the first quarter of 2019 by the U.S. Federal Reserve indicating it would pause interest rate hikes and through perceived progress in U.S.-China trade talks. Investor confidence fell in the second quarter, however, largely due to a sharp rise in U.S.-China trade tensions and general concerns about China’s economy—before rallying in June due to renewed optimism about trade negotiations. Regionally, emerging market equities in Europe performed best, followed by Latin America and Asia. Russian and Brazilian equities performed significantly well, while Indian and South Korean equities lagged.
We are committed to our long-term perspective and disciplined investment approach as we conduct a rigorous, fundamental analysis of securities with a regular emphasis on investment risk management.
Historically, patient investors have achieved rewarding results by evaluating their goals, diversifying their assets globally and maintaining a disciplined investment program, all hallmarks of the Templeton investment philosophy developed more than 60 years ago. We continue to recommend investors consult their financial advisors and
CFA® is a trademark owned by CFA Institute.
review their portfolios to design a long-term strategy and portfolio allocation that meet their individual needs, goals and risk tolerance.
Templeton Developing Market Trust’s semiannual report includes more detail about prevailing conditions and a discussion about investment decisions during the period. Please remember all securities markets fluctuate, as do mutual fund share prices.
We thank you for investing with Franklin Templeton, welcome your questions and comments, and look forward to serving your investment needs in the years ahead.
Sincerely,

Manraj S. Sekhon, CFA
Chief Investment Officer
Franklin Templeton Emerging Markets Equity
This letter reflects our analysis and opinions as of June 30, 2019, unless otherwise indicated. The information is not a complete analysis of every aspect of any market, country, industry, security or fund. Statements of fact are from sources considered reliable.
|
Not FDIC Insured | May Lose Value | No Bank Guarantee |
| | | | |
| | | |
| franklintempleton.com | | Not part of the semiannual report | | 1 |
| | | | |
| | | |
2 | | Semiannual Report | | franklintempleton.com |
SEMIANNUAL REPORT
Templeton Developing Markets Trust
This semiannual report for Templeton Developing Markets Trust covers the period ended June 30, 2019.
Your Fund’s Goal and Main Investments
The Fund seeks long-term capital appreciation. Under normal market conditions, the Fund invests at least 80% of its net assets in securities of companies located or operating in “developing market countries,” as defined in the Fund’s prospectus.
Performance Overview
The Fund’s Class A shares posted a +13.87% cumulative total return for the six months under review. In comparison, the MSCI Emerging Markets (EM) Index posted a +10.78% total return, and the Standard & Poor’s®/International Finance Corporation Investable Composite Index posted a +10.49% total return for the same period.1 The indexes measure global emerging market stock performance. Please note, index performance is provided for reference and we do not attempt to track an index but rather undertake investments on the basis of fundamental research. In addition, the Fund’s return reflects the effect of fees and expenses for professional management, while an index does not have such costs. You can find the Fund’s long-term performance data in the Performance Summary beginning on page 7.
Performance data represent past performance, which does not guarantee future results. Investment return and principal value will fluctuate, and you may have a gain or loss when you sell your shares. Current performance may differ from figures shown. For most recentmonth-end performance, go tofranklintempleton.comor call(800)342-5236.
Economic and Market Overview
Emerging market economic growth moderated during the six months ended June 30, 2019, with many countries’ growth rates dipping to multi-year lows. However, emerging market economies in general continued to grow faster than their developed market counterparts. China’s annual growth rate held steady in the first quarter of 2019 before moderating in the second quarter to its lowest level since 1992. Trade
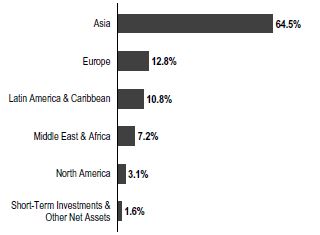
Geographic Composition
Based on Total Net Assets as of 6/30/19
tensions with the U.S. and weak global demand hurt China’s economy, though industrial production growth and strong consumer demand, stimulated by government policies, were bright spots. Elsewhere in Asia, South Korea’s first-quarter annual growth rate was the lowest since 2009, due to weak growth in manufacturing and a contraction in construction. Taiwan’s first-quarter annual growth rate also hit a multi-year low, as the global slowdown hurt the country’s export-driven economy. In India, weak consumer demand and fixed investment drove first-quarter annual growth to its lowest level since 2014. Turning to Europe, Russia’s annual growth rate slowed in the first quarter due to weakness in information, communication, financial and insurance sectors, as well as contractions in other sectors, significantly real estate. In Latin America, Brazil’s first-quarter annual growth moderated due to weak consumer demand and fixed investment.
Monetary policies varied among emerging market central banks. The People’s Bank of China left its benchmark interest rate unchanged during the period, but it took measures to improve financial liquidity to mitigate the negative effects of the U.S.-China trade dispute and support economic growth. South Korea’s and Taiwan’s central banks also held their benchmark interest rates steady, despite
1. Source: Morningstar.
The indexes are unmanaged and include reinvestment of any income or distributions. They do not reflect any fees, expenses or sales charges. One cannot invest directly in an index, and an index is not representative of the Fund’s portfolio.
The dollar value, number of shares or principal amount, and names of all portfolio holdings are listed in the Fund’s Statement of Investments (SOI).
The SOI begins on page 15.
| | | | |
| | | |
| franklintempleton.com | | Semiannual Report | | 3 |
TEMPLETON DEVELOPING MARKETS TRUST
concerns about the negative effects of the U.S.-China trade dispute on the countries’ economies. India’s central bank unexpectedly cut its benchmark interest rate in February to boost a slowing economy amid low inflation, and made further cuts in April and June amid continued economic concerns. Russia’s central bank cut its key rate in June due to slowing inflation growth and weaker-than-expected economic growth. In Latin America, Brazil and Mexico’s central banks held their benchmark rates steady.
Emerging market equities rose during thesix-month period, though they lagged developed and frontier market stocks. Emerging market equities, led by Asia, posted significant gains in the first quarter of 2019, aided by the U.S. Federal Reserve’s decision to halt interest rate hikes and easing U.S.-China trade tensions. In contrast, emerging market equities posted modest gains in the second quarter, as Asian emerging market equities declined due to a spike in U.S.-China tensions in May (though tensions eased again in late June) that included further tariff impositions and fears China would decrease stimulus policies. For thesix-month period, all major regions posted positive returns, although Europe was the only region where emerging market equities outpaced overall developed market equites. Russia benefited from higher oil prices, an appreciating ruble and its perceived relative insulation from the U.S.-China trade dispute. Latin American equities advanced, led by Colombia and Brazil, despite concerns about Brazil’s slowing economic growth. Asian emerging market stocks lagged other regions, though Chinese equities still outpaced overall emerging market stocks. In this environment, global emerging market stocks, as measured by the MSCI EM Index, posted a +10.78% total return for thesix-month period.1
Investment Strategy
We employ a fundamental research, value-oriented, long-term investment strategy. We focus on the market price of a company’s securities relative to our evaluation of its long-term earnings, asset value and cash flow potential. This includes an assessment of the potential impacts of material environmental, social and governance factors on the long-term risk and return profile of a company. We also consider a company’s profit and loss outlook, balance sheet strength, cash flow trends and asset value in relation to the current price of the company’s securities. Our analysis considers the company’s position in its sector, the economic framework and political environment.
Top 10 Countries
6/30/19
| | | | |
| | | % of Total
Net Assets | |
| |
| |
China | | | 25.3% | |
| |
| |
South Korea | | | 16.1% | |
| |
| |
Taiwan | | | 8.9% | |
| |
| |
Russia | | | 8.3% | |
| |
| |
India | | | 8.0% | |
| |
| |
Brazil | | | 7.8% | |
| |
| |
South Africa | | | 6.9% | |
| |
| |
U.K. | | | 3.1% | |
| |
| |
U.S. | | | 3.1% | |
| |
| |
Thailand | | | 2.9% | |
| |
Manager’s Discussion
During the six months under review, key stock contributors to absolute performance included Naspers, Samsung Electronics and Brilliance China Automotive.
Naspers is an internet and media group based in South Africa. It also has sizable investments in some of the world’s leading technology companies, including China-based Tencent and Russia-based Mail.Ru (both Fund holdings). The first quarter of 2019 saw a broad recovery in the information technology (IT) sector driven by improved investor confidence.2 Sentiment in Naspers further benefited from Tencent’s above-consensus fourth quarter 2018 revenue and earnings. Investors also reacted positively to Naspers’ creation of a new company listing in Amsterdam, which management expects to unlock value and reduce the discount to net asset value.
Samsung is a South Korea-based consumer electronics and semiconductor manufacturer. It is one of the world’s largest smartphone and memory chip producers as well as a key supplier of organic light-emitting diode (LED) displays. Following weakness in the second half of 2018, Samsung’s share price rebounded due to improved sentiment in the technology sector in general. Although the company reported weak first-quarter operating profits, largely due to weakness in the semiconductor and display segments, management expectations for a recovery in the second half of 2019 provided investors with some comfort.
Brilliance China manufactures and sells automobiles for the Chinese domestic market, predominantly through its joint
2. The IT sector comprises electronic equipment, instruments and components; IT services; semiconductors and semiconductor equipment; software; and technology hardware, storage and peripherals in the SOI.
| | | | |
| | | |
4 | | Semiannual Report | | franklintempleton.com |
TEMPLETON DEVELOPING MARKETS TRUST
venture (JV) with German luxury car maker BMW (not a Fund holding). Brilliance China’s share price rebounded in the first half of 2019, as investors saw value emerge following a steep decline in the second half of 2018 after BMW announced plans to increase its JV stake to a majority share. The sale of part of Brilliance’s stake to BMW was approved by shareholders in early 2019, and the company is expected to distribute a special dividend from sale proceeds. However, completion of the deal is pending approval from Chinese regulators in 2022, when a change in regulations on foreign ownership comes into effect. Sentiment in the stock also benefited from Chinese government measures to support car sales.
In contrast, key detractors from absolute performance included Massmart, Glenmark Pharmaceuticals and Naver.
Massmart is a leading South African wholesaler, distributor and retailer of food products, general merchandise, alcohol, home improvement equipment and supplies. U.S.-based Walmart (not a Fund holding), the world’s largest retailer, owns a controlling stake in the company. Disappointing 2018 corporate results gave rise to a correction of Massmart’s share price. 2018 earnings declined largely due to weak sales growth and a contraction in the operating margin in two divisions. The company also released a profit decline warning for the first half of 2019. The resignation of the chief executive officer and chief financial officer further impacted sentiment.
Glenmark Pharmaceuticals is amid-size Indian pharmaceutical company with a presence in generics and research and development. While fourth-quarter 2018 corporate results generally met market expectations, sentiment was hurt by weaker-than-expected growth in U.S. revenues along with earnings pressure from foreign exchange losses and higher research and development expenditures. A delay in U.S. approval and launch of an investigational product for the treatment of seasonal allergic rhinitis also caused shares to fall sharply in June.
Naver is South Korea’s largest web search engine, as well as a global information and communication technology brand that provides services including LINE messenger, currently with more than 200 million users around the world. Although lower marketing costs supported earnings, concerns that competition from U.S. search platforms have impacted key business areas hurt its share price. Losses at Naver’s Japanese subsidiary LINE were due to aggressive efforts to
Top 10 Holdings
6/30/19
| | | | |
Company Sector/Industry, Country | | % of Total
Net Assets | |
| |
Samsung Electronics Co. Ltd. Technology Hardware, Storage & Peripherals,South Korea | | | 7.5% | |
| |
Taiwan Semiconductor Manufacturing Co. Ltd. Semiconductors & Semiconductor Equipment, Taiwan | | | 6.6% | |
| |
Naspers Ltd. Internet & Direct Marketing Retail, South Africa | | | 6.0% | |
| |
Alibaba Group Holding Ltd. Internet & Direct Marketing Retail, China | | | 5.0% | |
| |
ICICI Bank Ltd. Banks, India | | | 3.8% | |
| |
Brilliance China Automotive Holdings Ltd. Automobiles, China | | | 3.4% | |
| |
Unilever PLC Personal Products, U.K. | | | 3.1% | |
| |
Tencent Holdings Ltd. Interactive Media & Services, China | | | 2.9% | |
| |
Banco Bradesco SA Banks, Brazil | | | 2.6% | |
| |
Sberbank of Russia PJSC Banks, Russia | | | 2.5% | |
expand the service into fintech and also raised investor concerns.
In the past six months, we increased the Fund’s holdings in China, Brazil and Russia due to their solid fundamentals. Investments in companies that are listed in the U.S. but have significant exposure to emerging markets were also increased. In terms of sectors, additions were undertaken in IT, industrials and financials.3 New additions to the portfolio included Cognizant Technology, a major global information technology services company, Sunny Optical, a prominent manufacturer of optical-related products in China, and Health & Happiness H&H International, a leading family nutrition product company in China. Existing positions in China Resources Cement and LG, a major Korean conglomerate, were increased.
We reduced the Fund’s investments in Taiwan, Peru and Indonesia in favor of stocks we deemed to be more attractively valued within our investment universe. Sectors that experienced the largest sales were materials, consumer
3. The industrials sector comprises construction and engineering, industrial conglomerates and transportation infrastructure in the SOI. The financials sector comprises banks, capital markets, diversified financial services and insurance in the SOI.
| | | | |
| | | |
| franklintempleton.com | | Semiannual Report | | 5 |
TEMPLETON DEVELOPING MARKETS TRUST
discretionary and communication services.4 Key reductions included Naspers and Compania De Minas Buenaventura, a Peruvian precious metals company, while the positions in cement producer Semen Indonesia and Bank Danamon Indonesia were liquidated.
We thank you for your continued participation in Templeton Developing Markets Trust and look forward to serving your future investment needs.
| | |
 | | 
Chetan Sehgal, CFA Portfolio Manager |
The foregoing information reflects our analysis, opinions and portfolio holdings as of June 30, 2019, the end of the reporting period. The way we implement our main investment strategies and the resulting portfolio holdings may change depending on factors such as market and economic conditions. These opinions may not be relied upon as investment advice or an offer for a particular security. The information is not a complete analysis of every aspect of any market, country, industry, security or the Fund. Statements of fact are from sources considered reliable, but the investment manager makes no representation or warranty as to their completeness or accuracy. Although historical performance is no guarantee of future results, these insights may help you understand our investment management philosophy.
4. The materials sector comprises chemicals, construction materials, and metals and mining in the SOI. The consumer discretionary sector comprises auto components; automobiles; distributors; hotels, restaurants and leisure; internet and direct marketing retail; multiline retail; and textiles, apparel and luxury goods in the SOI. The communication services sector comprises entertainment, interactive media and services, media and wireless telecommunication services in the SOI.
See www.franklintempletondatasources.com for additional data provider information.
| | | | |
| | | |
6 | | Semiannual Report | | franklintempleton.com |
TEMPLETON DEVELOPING MARKETS TRUST
Performance Summary as of June 30, 2019
The performance table does not reflect any taxes that a shareholder would pay on Fund dividends, capital gain distributions, if any, or any realized gains on the sale of Fund shares. Total return reflects reinvestment of the Fund’s dividends and capital gain distributions, if any, and any unrealized gains or losses. Your dividend income will vary depending on dividends or interest paid by securities in the Fund’s portfolio, adjusted for operating expenses of each class. Capital gain distributions are net profits realized from the sale of portfolio securities.
Performance as of 6/30/191
Cumulative total return excludes sales charges. Average annual total return includes maximum sales charges. Sales charges will vary depending on the size of the investment and the class of share purchased. The maximum is 5.50% and the minimum is 0%.Class A:5.50% maximum initial sales charge;Advisor Class:no sales charges. For other share classes, visitfranklintempleton.com.
| | | | | | | | | | | | |
Share Class | | Cumulative
Total Return2 | | | | | | Average Annual
Total Return3 | |
| | | |
A4 | | | | | | | | | | | | |
6-Month | | | +13.87% | | | | | | | | +7.59% | |
| | | |
1-Year | | | +3.53% | | | | | | | | -2.17% | |
| | | |
5-Year | | | +15.42% | | | | | | | | +1.75% | |
| | | |
10-Year | | | +73.19% | | | | | | | | +5.05% | |
| | | |
Advisor | | | | | | | | | | | | |
6-Month | | | +14.01% | | | | | | | | +14.01% | |
| | | |
1-Year | | | +3.75% | | | | | | | | +3.75% | |
| | | |
5-Year | | | +16.89% | | | | | | | | +3.17% | |
| | | |
10-Year | | | +77.86% | | | | | | | | +5.93% | |
Performance data represent past performance, which does not guarantee future results. Investment return and principal value will fluctuate, and you may have a gain or loss when you sell your shares. Current performance may differ from figures shown. For most recentmonth-end performance, go tofranklintempleton.comor call(800)342-5236.
See page 8 for Performance Summary footnotes.
| | | | |
| | | |
| franklintempleton.com | | Semiannual Report | | 7 |
TEMPLETON DEVELOPING MARKETS TRUST
PERFORMANCE SUMMARY
Total Annual Operating Expenses5
| | | | | | | | | | | | |
Share Class | | With Fee
Waiver | | | | | | Without Fee
Waiver | |
A | | | 1.39% | | | | | | | | 1.52% | |
Advisor | | | 1.14% | | | | | | | | 1.27% | |
Each class of shares is available to certain eligible investors and has different annual fees and expenses, as described in the prospectus.
All investments involve risks, including possible loss of principal. Special risks are associated with foreign investing, including currency fluctuations, economic instability and political developments. Investments in developing markets, of which frontier markets are a subset, involve heightened risks related to the same factors, in addition to those associated with these markets’ smaller size, lesser liquidity and lack of established legal, political, business and social frameworks to support securities markets. Because these frameworks are typically even less developed in frontier markets, as well as various factors including the increased potential for extreme price volatility, illiquidity, trade barriers and exchange controls, the risks associated with developing markets are magnified in frontier markets. The Fund is designed for the aggressive portion of a well-diversified portfolio. The Fund is actively managed but there is no guarantee that the manager’s investment decisions will produce the desired results. The Fund’s prospectus also includes a description of the main investment risks.
1. The Fund has an expense reduction and a fee waiver associated with any investment it makes in a Franklin Templeton money fund and/or other Franklin Templeton fund, contractually guaranteed through 4/30/20. Fund investment results reflect the fee waiver; without this waiver, the results would have been lower.
2. Cumulative total return represents the change in value of an investment over the periods indicated.
3. Average annual total return represents the average annual change in value of an investment over the periods indicated. Return for less than one year, if any, has not been annualized.
4. Prior to 9/10/18, these shares were offered at a higher initial sales charge of 5.75%, thus actual returns (with sales charges) would have differed. Average annual total returns (with sales charges) have been restated to reflect the current maximum initial sales charge of 5.50%.
5. Figures are as stated in the Fund’s current prospectus and may differ from the expense ratios disclosed in the Your Fund’s Expenses and Financial Highlights sections in this report. In periods of market volatility, assets may decline significantly, causing total annual Fund operating expenses to become higher than the figures shown.
| | | | |
| | | |
8 | | Semiannual Report | | franklintempleton.com |
TEMPLETON DEVELOPING MARKETS TRUST
Your Fund’s Expenses
As a Fund shareholder, you can incur two types of costs: (1) transaction costs, including sales charges (loads) on Fund purchases and redemptions; and (2) ongoing Fund costs, including management fees, distribution and service(12b-1) fees, and other Fund expenses. All mutual funds have ongoing costs, sometimes referred to as operating expenses. The table below shows ongoing costs of investing in the Fund and can help you understand these costs and compare them with those of other mutual funds. The table assumes a $1,000 investment held for the six months indicated.
Actual Fund Expenses
The table below provides information about actual account values and actual expenses in the columns under the heading “Actual.” In these columns the Fund’s actual return, which includes the effect of Fund expenses, is used to calculate the “Ending Account Value” for each class of shares. You can estimate the expenses you paid during the period by following these steps (of course, your account value and expenses will differ from those in this illustration): Divide your account value by $1,000 (if your account had an $8,600 value, then $8,600÷ $1,000 = 8.6). Then multiply the result by the number in the row for your class of shares under the headings “Actual” and “Expenses Paid During Period” (if Actual Expenses Paid During Period were $7.50, then 8.6 x $7.50 = $64.50). In this illustration, the actual expenses paid this period are $64.50.
Hypothetical Example for Comparison with Other Funds
Under the heading “Hypothetical” in the table, information is provided about hypothetical account values and hypothetical expenses based on the Fund’s actual expense ratio and an assumed rate of return of 5% per year before expenses, which is not the Fund’s actual return. This information may not be used to estimate the actual ending account balance or expenses you paid for the period, but it can help you compare ongoing costs of investing in the Fund with those of other funds. To do so, compare this 5% hypothetical example for the class of shares you hold with the 5% hypothetical examples that appear in the shareholder reports of other funds.
Please note that expenses shown in the table are meant to highlight ongoing costs and do not reflect any transactional costs. Therefore, information under the heading “Hypothetical” is useful in comparing ongoing costs only, and will not help you compare total costs of owning different funds. In addition, if transactional costs were included, your total costs would have been higher.
| | | | | | | | | | | | |
| | | | | Actual
(actual return after expenses) | | Hypothetical
(5% annual return before expenses) | | |
Share
Class | | Beginning Account Value 1/1/19 | | Ending Account Value 6/30/19 | | Expenses Paid During
Period 1/1/19–6/30/191, 2 | | Ending
Account
Value 6/30/19 | | Expenses Paid During
Period 1/1/19–6/30/191, 2 | | Net
Annualized
Expense
Ratio2 |
| | | | | | |
| A | | $1,000 | | $1,138.70 | | $ 7.32 | | $1,017.95 | | $ 6.90 | | 1.38% |
| C | | $1,000 | | $1,134.60 | | $11.27 | | $1,014.23 | | $10.64 | | 2.13% |
| R | | $1,000 | | $1,137.10 | | $ 8.64 | | $1,016.71 | | $ 8.15 | | 1.63% |
| R6 | | $1,000 | | $1,141.50 | | $ 5.26 | | $1,019.89 | | $ 4.96 | | 0.99% |
| Advisor | | $1,000 | | $1,140.10 | | $ 6.00 | | $1,019.19 | | $ 5.66 | | 1.13% |
1. Expenses are equal to the annualized expense ratio for thesix-month period as indicated above—in the far right column—multiplied by the simple average account value over the period indicated, and then multiplied by 181/365 to reflect theone-half year period.
2. Reflects expenses after fee waivers and expense reimbursements. Does not include acquired fund fees and expenses.
| | | | |
| | | |
| franklintempleton.com | | Semiannual Report | | 9 |
TEMPLETON DEVELOPING MARKETS TRUST
Financial Highlights
| | | | | | | | | | | | | | | | | | | | | | | | |
| | | Six Months Ended June 30, 2019 | | | Year Ended December 31, | |
| | | (unaudited) | | | 2018 | | | 2017 | | | 2016 | | | 2015 | | | 2014 | |
| | | | | | |
Class A | | | | | | | | | | | | | | | | | | | | | | | | |
| | | | | | |
Per share operating performance | | | | | | | | | | | | | | | | | | | | | | | | |
(for a share outstanding throughout the period) | | | | | | | | | | | | | | | | | | | | | | | | |
| | | | | | |
Net asset value, beginning of period | | | $18.17 | | | | $21.98 | | | | $15.82 | | | | $13.59 | | | | $17.09 | | | | $22.86 | |
| | | | | | |
Income from investment operationsa: | | | | | | | | | | | | | | | | | | | | | | | | |
| | | | | | |
Net investment incomeb | | | 0.12 | | | | 0.20 | | | | 0.15 | | | | 0.10 | | | | 0.07 | | | | 0.27 | c |
| | | | | | |
Net realized and unrealized gains (losses) | | | 2.40 | | | | (3.76 | ) | | | 6.21 | | | | 2.32 | | | | (3.43 | ) | | | (2.09 | ) |
| | | | | | |
Total from investment operations | | | 2.52 | | | | (3.56 | ) | | | 6.36 | | | | 2.42 | | | | (3.36 | ) | | | (1.82 | ) |
| | | | | | |
Less distributions from: | | | | | | | | | | | | | | | | | | | | | | | | |
| | | | | | |
Net investment income | | | — | | | | (0.25 | ) | | | (0.20 | ) | | | (0.19 | ) | | | (0.14 | ) | | | (0.33 | ) |
| | | | | | |
Net realized gains | | | — | | | | — | | | | — | | | | — | | | | — | | | | (3.62 | ) |
| | | | | | |
Total distributions | | | — | | | | (0.25 | ) | | | (0.20 | ) | | | (0.19 | ) | | | (0.14 | ) | | | (3.95 | ) |
| | | | | | |
Net asset value, end of period | | | $20.69 | | | | $18.17 | | | | $21.98 | | | | $15.82 | | | | $13.59 | | | | $17.09 | |
| | | | | | |
Total returnd | | | 13.87% | | | | (16.20)% | | | | 40.20% | | | | 17.84% | | | | (19.67)% | | | | (8.11)% | |
| | | | | | |
Ratios to average net assetse | | | | | | | | | | | | | | | | | | | | | | | | |
| | | | | | |
Expenses before waiver and payments by affiliates | | | 1.53% | | | | 1.56% | | | | 1.73% | | | | 1.79% | | | | 1.75% | | | | 1.72% | |
| | | | | | |
Expenses net of waiver and payments by affiliates | | | 1.38% | | | | 1.34% | | | | 1.55% | f | | | 1.58% | | | | 1.68% | | | | 1.72% | g |
| | | | | | |
Net investment income | | | 1.24% | | | | 0.99% | | | | 0.76% | | | | 0.64% | | | | 0.44% | | | | 1.20% | c |
| | | | | | |
Supplemental data | | | | | | | | | | | | | | | | | | | | | | | | |
| | | | | | |
Net assets, end of period (000’s) | | | $1,000,517 | | | | $917,488 | | | | $1,178,838 | | | | $961,888 | | | | $822,399 | | | | $1,187,072 | |
| | | | | | |
Portfolio turnover rate | | | 8.78% | | | | 9.96% | | | | 8.89% | | | | 27.40% | | | | 67.52% | | | | 83.92% | |
aThe amount shown for a share outstanding throughout the period may not correlate with the Statement of Operations for the period due to the timing of sales and repurchases of the Fund’s shares in relation to income earned and/or fluctuating fair value of the investments of the Fund.
bBased on average daily shares outstanding.
cNet investment income per share includes approximately $0.07 per share related to income received in the form of special dividends in connection with certain Fund holdings. Excluding this amount, the ratio of net investment income to average net assets would have been 0.87%.
dTotal return does not reflect sales commissions or contingent deferred sales charges, if applicable, and is not annualized for periods less than one year.
eRatios are annualized for periods less than one year.
fBenefit of expense reduction rounds to less than 0.01%.
gBenefit of waiver and payments by affiliates rounds to less than 0.01%.
| | | | |
| | | |
10 | | Semiannual Report | The accompanying notes are an integral part of these financial statements. | | franklintempleton.com |
TEMPLETON DEVELOPING MARKETS TRUST
FINANCIAL HIGHLIGHTS
| | | | | | | | | | | | | | | | | | | | | | | | |
| | | Six Months Ended June 30, 2019 | | | Year Ended December 31, | |
| | | (unaudited) | | | 2018 | | | 2017 | | | 2016 | | | 2015 | | | 2014 | |
| | | | | | |
Class C | | | | | | | | | | | | | | | | | | | | | | | | |
| | | | | | |
Per share operating performance | | | | | | | | | | | | | | | | | | | | | | | | |
(for a share outstanding throughout the period) | | | | | | | | | | | | | | | | | | | | | | | | |
| | | | | | |
Net asset value, beginning of period | | | $17.75 | | | | $21.34 | | | | $15.38 | | | | $13.22 | | | | $16.62 | | | | $22.32 | |
| | | | | | |
Income from investment operationsa: | | | | | | | | | | | | | | | | | | | | | | | | |
| | | | | | |
Net investment income (loss)b | | | 0.05 | | | | 0.08 | | | | — | c | | | (0.02) | | | | (0.04) | | | | 0.10 | d |
| | | | | | |
Net realized and unrealized gains (losses) | | | 2.35 | | | | (3.67) | | | | 6.01 | | | | 2.26 | | | | (3.33) | | | | (2.01) | |
| | | | | | |
Total from investment operations | | | 2.40 | | | | (3.59) | | | | 6.01 | | | | 2.24 | | | | (3.37) | | | | (1.91) | |
| | | | | | |
Less distributions from: | | | | | | | | | | | | | | | | | | | | | | | | |
| | | | | | |
Net investment income | | | — | | | | — | | | | (0.05) | | | | (0.08) | | | | (0.03) | | | | (0.17) | |
| | | | | | |
Net realized gains | | | — | | | | — | | | | — | | | | — | | | | — | | | | (3.62) | |
| | | | | | |
Total distributions | | | — | | | | — | | | | (0.05) | | | | (0.08) | | | | (0.03) | | | | (3.79) | |
| | | | | | |
Net asset value, end of period | | | $20.15 | | | | $17.75 | | | | $21.34 | | | | $15.38 | | | | $13.22 | | | | $16.62 | |
| | | | | | |
Total returne | | | 13.46% | | | | (16.78)% | | | | 39.19% | | | | 16.90% | | | | (20.28)% | | | | (8.71)% | |
| | | | | | |
Ratios to average net assetsf | | | | | | | | | | | | | | | | | | | | | | | | |
| | | | | | |
Expenses before waiver and payments by affiliates | | | 2.28% | | | | 2.31% | | | | 2.48% | | | | 2.54% | | | | 2.47% | | | | 2.44% | |
| | | | | | |
Expenses net of waiver and payments by affiliates | | | 2.13% | | | | 2.09% | | | | 2.30% | g | | | 2.33% | | | | 2.40% | | | | 2.44% | h |
| | | | | | |
Net investment income (loss) | | | 0.49% | | | | 0.24% | | | | 0.01% | | | | (0.11)% | | | | (0.28)% | | | | 0.48% | d |
| | | | | | |
Supplemental data | | | | | | | | | | | | | | | | | | | | | | | | |
| | | | | | |
Net assets, end of period (000’s) | | | $62,973 | | | | $63,116 | | | | $172,523 | | | | $141,100 | | | | $117,379 | | | | $186,356 | |
| | | | | | |
Portfolio turnover rate | | | 8.78% | | | | 9.96% | | | | 8.89% | | | | 27.40% | | | | 67.52% | | | | 83.92% | |
aThe amount shown for a share outstanding throughout the period may not correlate with the Statement of Operations for the period due to the timing of sales and repurchases of the Fund’s shares in relation to income earned and/or fluctuating fair value of the investments of the Fund.
bBased on average daily shares outstanding.
cAmount rounds to less than $0.01 per share.
dNet investment income per share includes approximately $0.07 per share related to income received in the form of special dividends in connection with certain Fund holdings. Excluding this amount, the ratio of net investment income to average net assets would have been 0.15%.
eTotal return does not reflect sales commissions or contingent deferred sales charges, if applicable, and is not annualized for periods less than one year.
fRatios are annualized for periods less than one year.
gBenefit of expense reduction rounds to less than 0.01%.
hBenefit of waiver and payments by affiliates rounds to less than 0.01%.
| | | | |
| | | |
| franklintempleton.com | | The accompanying notes are an integral part of these financial statements. | Semiannual Report | | 11 |
TEMPLETON DEVELOPING MARKETS TRUST
FINANCIAL HIGHLIGHTS
| | | | | | | | | | | | | | | | | | | | | | | | |
| | | Six Months Ended
June 30, 2019 | | | | | | Year Ended December 31, | | | | |
| | | (unaudited) | | | 2018 | | | 2017 | | | 2016 | | | 2015 | | | 2014 | |
| | | | | | |
Class R | | | | | | | | | | | | | | | | | | | | | | | | |
| | | | | | |
Per share operating performance | | | | | | | | | | | | | | | | | | | | | | | | |
(for a share outstanding throughout the period) | | | | | | | | | | | | | | | | | | | | | | | | |
| | | | | | |
Net asset value, beginning of period | | | $17.86 | | | | $21.61 | | | | $15.57 | | | | $13.37 | | | | $16.80 | | | | $22.55 | |
| | | | | | |
Income from investment operationsa: | | | | | | | | | | | | | | | | | | | | | | | | |
| | | | | | |
Net investment incomeb | | | 0.10 | | | | 0.15 | | | | 0.10 | | | | 0.07 | | | | 0.03 | | | | 0.21 | c |
| | | | | | |
Net realized and unrealized gains (losses) | | | 2.36 | | | | (3.70 | ) | | | 6.09 | | | | 2.27 | | | | (3.36 | ) | | | (2.06 | ) |
| | | | | | |
Total from investment operations | | | 2.46 | | | | (3.55 | ) | | | 6.19 | | | | 2.34 | | | | (3.33 | ) | | | (1.85 | ) |
| | | | | | |
Less distributions from: | | | | | | | | | | | | | | | | | | | | | | | | |
| | | | | | |
Net investment income | | | — | | | | (0.20 | ) | | | (0.15 | ) | | | (0.14 | ) | | | (0.10 | ) | | | (0.28 | ) |
| | | | | | |
Net realized gains | | | — | | | | — | | | | — | | | | — | | | | — | | | | (3.62 | ) |
| | | | | | |
Total distributions | | | — | | | | (0.20 | ) | | | (0.15 | ) | | | (0.14 | ) | | | (0.10 | ) | | | (3.90 | ) |
| | | | | | |
Net asset value, end of period | | | $20.32 | | | | $17.86 | | | | $21.61 | | | | $15.57 | | | | $13.37 | | | | $16.80 | |
| | | | | | |
Total returnd | | | 13.71% | | | | (16.38)% | | | | 39.90% | | | | 17.48% | | | | (19.83)% | | | | (8.32)% | |
| | | | | | |
Ratios to average net assetse | | | | | | | | | | | | | | | | | | | | | | | | |
| | | | | | |
Expenses before waiver and payments by affiliates | | | 1.78% | | | | 1.81% | | | | 1.98% | | | | 2.04% | | | | 1.97% | | | | 1.94% | |
| | | | | | |
Expenses net of waiver and payments by affiliates | | | 1.63% | | | | 1.59% | | | | 1.80% | f | | | 1.83% | | | | 1.90% | | | | 1.94% | g |
| | | | | | |
Net investment income | | | 0.99% | | | | 0.74% | | | | 0.51% | | | | 0.39% | | | | 0.22% | | | | 0.98% | c |
| | | | | | |
Supplemental data | | | | | | | | | | | | | | | | | | | | | | | | |
| | | | | | |
Net assets, end of period (000’s) | | | $19,999 | | | | $18,025 | | | | $22,512 | | | | $16,628 | | | | $17,657 | | | | $26,123 | |
| | | | | | |
Portfolio turnover rate | | | 8.78% | | | | 9.96% | | | | 8.89% | | | | 27.40% | | | | 67.52% | | | | 83.92% | |
aThe amount shown for a share outstanding throughout the period may not correlate with the Statement of Operations for the period due to the timing of sales and repurchases of the Fund’s shares in relation to income earned and/or fluctuating fair value of the investments of the Fund.
bBased on average daily shares outstanding.
cNet investment income per share includes approximately $0.07 per share related to income received in the form of special dividends in connection with certain Fund holdings. Excluding this amount, the ratio of net investment income to average net assets would have been 0.65%.
dTotal return is not annualized for periods less than one year.
eRatios are annualized for periods less than one year.
fBenefit of expense reduction rounds to less than 0.01%.
gBenefit of waiver and payments by affiliates rounds to less than 0.01%.
| | | | |
| | | |
12 | | Semiannual Report | The accompanying notes are an integral part of these financial statements. | | franklintempleton.com |
TEMPLETON DEVELOPING MARKETS TRUST
FINANCIAL HIGHLIGHTS
| | | | | | | | | | | | | | | | | | | | | | | | |
| | | Six Months Ended
June 30, 2019 | | | | | | Year Ended December 31, | | | | |
| | | (unaudited) | | | 2018 | | | 2017 | | | 2016 | | | 2015 | | | 2014 | |
| | | | | | |
Class R6 | | | | | | | | | | | | | | | | | | | | | | | | |
| | | | | | |
Per share operating performance | | | | | | | | | | | | | | | | | | | | | | | | |
(for a share outstanding throughout the period) | | | | | | | | | | | | | | | | | | | | | | | | |
| | | | | | |
Net asset value, beginning of period | | | $18.02 | | | | $21.82 | | | | $15.70 | | | | $13.49 | | | | $16.99 | | | | $22.76 | |
| | | | | | |
Income from investment operationsa: | | | | | | | | | | | | | | | | | | | | | | | | |
| | | | | | |
Net investment incomeb | | | 0.17 | | | | 0.28 | | | | 0.22 | | | | 0.19 | | | | 0.12 | | | | 0.34 | c |
| | | | | | |
Net realized and unrealized gains (losses) | | | 2.38 | | | | (3.75 | ) | | | 6.19 | | | | 2.28 | | | | (3.40 | ) | | | (2.05 | ) |
| | | | | | |
Total from investment operations | | | 2.55 | | | | (3.47 | ) | | | 6.41 | | | | 2.47 | | | | (3.28 | ) | | | (1.71 | ) |
| | | | | | |
Less distributions from: | | | | | | | | | | | | | | | | | | | | | | | | |
| | | | | | |
Net investment income | | | — | | | | (0.33 | ) | | | (0.29 | ) | | | (0.26 | ) | | | (0.22 | ) | | | (0.44 | ) |
| | | | | | |
Net realized gains | | | — | | | | — | | | | — | | | | — | | | | — | | | | (3.62 | ) |
| | | | | | |
Total distributions | | | — | | | | (0.33 | ) | | | (0.29 | ) | | | (0.26 | ) | | | (0.22 | ) | | | (4.06 | ) |
| | | | | | |
Net asset value, end of period | | | $20.57 | | | | $18.02 | | | | $21.82 | | | | $15.70 | | | | $13.49 | | | | $16.99 | |
| | | | | | |
Total returnd | | | 14.15% | | | | (15.90)% | | | | 40.88% | | | | 18.34% | | | | (19.34)% | | | | (7.66)% | |
| | | | | | |
Ratios to average net assetse | | | | | | | | | | | | | | | | | | | | | | | | |
| | | | | | |
Expenses before waiver and payments by affiliates | | | 1.16% | | | | 1.21% | | | | 1.28% | | | | 1.30% | | | | 1.27% | | | | 1.26% | |
| | | | | | |
Expenses net of waiver and payments by affiliates | | | 0.99% | | | | 0.96% | | | | 1.09% | f | | | 1.13% | | | | 1.22% | | | | 1.26% | g |
| | | | | | |
Net investment income | | | 1.63% | | | | 1.37% | | | | 1.22% | | | | 1.09% | | | | 0.90% | | | | 1.65% | c |
| | | | | | |
Supplemental data | | | | | | | | | | | | | | | | | | | | | | | | |
| | | | | | |
Net assets, end of period (000’s) | | | $109,404 | | | | $94,344 | | | | $103,734 | | | | $57,153 | | | | $48,263 | | | | $52,185 | |
| | | | | | |
Portfolio turnover rate | | | 8.78% | | | | 9.96% | | | | 8.89% | | | | 27.40% | | | | 67.52% | | | | 83.92% | |
aThe amount shown for a share outstanding throughout the period may not correlate with the Statement of Operations for the period due to the timing of sales and repurchases of the Fund’s shares in relation to income earned and/or fluctuating fair value of the investments of the Fund.
bBased on average daily shares outstanding.
cNet investment income per share includes approximately $0.07 per share related to income received in the form of special dividends in connection with certain Fund holdings. Excluding this amount, the ratio of net investment income to average net assets would have been 1.32%.
dTotal return is not annualized for periods less than one year.
eRatios are annualized for periods less than one year.
fBenefit of expense reduction rounds to less than 0.01%.
gBenefit of waiver and payments by affiliates rounds to less than 0.01%.
| | | | |
| | | |
| franklintempleton.com | | The accompanying notes are an integral part of these financial statements. | Semiannual Report | | 13 |
TEMPLETON DEVELOPING MARKETS TRUST
FINANCIAL HIGHLIGHTS
| | | | | | | | | | | | | | | | | | | | | | | | |
| | | Six Months Ended
June 30, 2019 | | | | | | Year Ended December 31, | | | | |
| | | (unaudited) | | | 2018 | | | 2017 | | | 2016 | | | 2015 | | | 2014 | |
| | | | | | |
Advisor Class | | | | | | | | | | | | | | | | | | | | | | | | |
| | | | | | |
Per share operating performance | | | | | | | | | | | | | | | | | | | | | | | | |
(for a share outstanding throughout the period) | | | | | | | | | | | | | | | | | | | | | | | | |
| | | | | | |
Net asset value, beginning of period | | | $18.06 | | | | $21.86 | | | | $15.73 | | | | $13.52 | | | | $17.01 | | | | $22.77 | |
| | | | | | |
Income from investment operationsa: | | | | | | | | | | | | | | | | | | | | | | | | |
| | | | | | |
Net investment incomeb | | | 0.15 | | | | 0.25 | | | | 0.20 | | | | 0.13 | | | | 0.12 | | | | 0.33 | c |
| | | | | | |
Net realized and unrealized gains (losses) | | | 2.38 | | | | (3.75 | ) | | | 6.18 | | | | 2.31 | | | | (3.43 | ) | | | (2.08 | ) |
| | | | | | |
Total from investment operations | | | 2.53 | | | | (3.50 | ) | | | 6.38 | | | | 2.44 | | | | (3.31 | ) | | | (1.75 | ) |
| | | | | | |
Less distributions from: | | | | | | | | | | | | | | | | | | | | | | | | |
| | | | | | |
Net investment income | | | — | | | | (0.30 | ) | | | (0.25 | ) | | | (0.23 | ) | | | (0.18 | ) | | | (0.39 | ) |
| | | | | | |
Net realized gains | | | — | | | | — | | | | — | | | | — | | | | — | | | | (3.62 | ) |
| | | | | | |
Total distributions | | | — | | | | (0.30 | ) | | | (0.25 | ) | | | (0.23 | ) | | | (0.18 | ) | | | (4.01 | ) |
| | | | | | |
Net asset value, end of period | | | $20.59 | | | | $18.06 | | | | $21.86 | | | | $15.73 | | | | $13.52 | | | | $17.01 | |
| | | | | | |
Total returnd | | | 14.01% | | | | (15.99)% | | | | 40.59% | | | | 18.08% | | | | (19.47)% | | | | (7.79)% | |
| | | | | | |
Ratios to average net assetse | | | | | | | | | | | | | | | | | | | | | | | | |
| | | | | | |
Expenses before waiver and payments by affiliates | | | 1.28% | | | | 1.31% | | | | 1.48% | | | | 1.54% | | | | 1.47% | | | | 1.44% | |
| | | | | | |
Expenses net of waiver and payments by affiliates | | | 1.13% | | | | 1.09% | | | | 1.30% | f | | | 1.33% | | | | 1.40% | | | | 1.44% | g |
| | | | | | |
Net investment income | | | 1.49% | | | | 1.24% | | | | 1.01% | | | | 0.89% | | | | 0.72% | | | | 1.48% | c |
| | | | | | |
Supplemental data | | | | | | | | | | | | | | | | | | | | | | | | |
| | | | | | |
Net assets, end of period (000’s) | | | $180,547 | | | | $156,766 | | | | $179,125 | | | | $117,914 | | | | $101,900 | | | | $175,503 | |
| | | | | | |
Portfolio turnover rate | | | 8.78% | | | | 9.96% | | | | 8.89% | | | | 27.40% | | | | 67.52% | | | | 83.92% | |
aThe amount shown for a share outstanding throughout the period may not correlate with the Statement of Operations for the period due to the timing of sales and repurchases of the Fund’s shares in relation to income earned and/or fluctuating fair value of the investments of the Fund.
bBased on average daily shares outstanding.
cNet investment income per share includes approximately $0.07 per share related to income received in the form of special dividends in connection with certain Fund holdings. Excluding this amount, the ratio of net investment income to average net assets would have been 1.15%.
dTotal return is not annualized for periods less than one year.
eRatios are annualized for periods less than one year.
fBenefit of expense reduction rounds to less than 0.01%.
gBenefit of waiver and payments by affiliates rounds to less than 0.01%.
| | | | |
| | | |
14 | | Semiannual Report | The accompanying notes are an integral part of these financial statements. | | franklintempleton.com |
TEMPLETON DEVELOPING MARKETS TRUST
Statement of Investments, June 30, 2019 (unaudited)
| | | | | | | | | | |
| | | Industry | | Shares | | | Value | |
| | | |
Common Stocks 93.0% | | | | | | | | | | |
| | | |
Argentina 0.0%† | | | | | | | | | | |
aCablevision Holding SA, GDR | | Media | | | 50,168 | | | $ | 260,874 | |
| | | | | | | | | | |
| | | |
Brazil 2.4% | | | | | | | | | | |
aB2W Cia Digital | | Internet & Direct Marketing Retail | | | 502,700 | | | | 4,278,966 | |
B3 SA - Brasil Bolsa Balcao | | Capital Markets | | | 1,089,000 | | | | 10,612,367 | |
Lojas Americanas SA | | Multiline Retail | | | 500,800 | | | | 1,717,103 | |
M. Dias Branco SA | | Food Products | | | 591,300 | | | | 5,992,989 | |
Mahle-Metal Leve SA | | Auto Components | | | 550,300 | | | | 3,538,870 | |
Totvs SA | | Software | | | 577,100 | | | | 6,601,219 | |
| | | | | | | | | | |
| | | | | | | | | 32,741,514 | |
| | | | | | | | | | |
| | | |
Cambodia 1.1% | | | | | | | | | | |
NagaCorp Ltd. | | Hotels, Restaurants & Leisure | | | 12,475,700 | | | | 15,346,797 | |
| | | | | | | | | | |
| | | |
China 25.3% | | | | | | | | | | |
aAlibaba Group Holding Ltd., ADR | | Internet & Direct Marketing Retail | | | 409,500 | | | | 69,389,775 | |
BAIC Motor Corp. Ltd., H | | Automobiles | | | 5,961,900 | | | | 3,739,471 | |
aBaidu Inc., ADR | | Interactive Media & Services | | | 72,659 | | | | 8,527,260 | |
Brilliance China Automotive Holdings Ltd. | | Automobiles | | | 41,901,800 | | | | 46,342,115 | |
China Construction Bank Corp., H | | Banks | | | 27,340,200 | | | | 23,552,997 | |
China Merchants Bank Co. Ltd., A | | Banks | | | 1,441,400 | | | | 7,552,509 | |
China Mobile Ltd. | | Wireless Telecommunication Services | | | 1,952,359 | | | | 17,781,321 | |
China Petroleum & Chemical Corp., H | | Oil, Gas & Consumable Fuels | | | 10,729,492 | | | | 7,292,948 | |
China Resources Cement Holdings Ltd. | | Construction Materials | | | 10,008,600 | | | | 9,698,368 | |
CNOOC Ltd. | | Oil, Gas & Consumable Fuels | | | 9,468,200 | | | | 16,192,105 | |
COSCO Shipping Ports Ltd. | | Transportation Infrastructure | | | 3,448,019 | | | | 3,402,933 | |
Dah Chong Hong Holdings Ltd. | | Distributors | | | 7,473,500 | | | | 2,496,859 | |
Dairy Farm International Holdings Ltd. | | Food & Staples Retailing | | | 435,562 | | | | 3,114,268 | |
Health & Happiness H&H International Holdings Ltd. | | Food Products | | | 1,588,500 | | | | 9,018,001 | |
MGM China Holdings Ltd. | | Hotels, Restaurants & Leisure | | | 4,303,400 | | | | 7,315,419 | |
NetEase Inc., ADR | | Entertainment | | | 32,523 | | | | 8,318,408 | |
Ping An Bank Co. Ltd., A | | Banks | | | 8,758,938 | | | | 17,577,062 | |
Ping An Insurance Group Co. of China Ltd., A | | Insurance | | | 1,173,759 | | | | 15,146,325 | |
Poly Culture Group Corp. Ltd., H | | Entertainment | | | 984,800 | | | | 995,874 | |
Sands China Ltd. | | Hotels, Restaurants & Leisure | | | 1,448,400 | | | | 6,924,821 | |
Sunny Optical Technology Group Co. Ltd. | | Electronic Equipment, Instruments & Components | | | 1,051,000 | | | | 10,856,896 | |
Tencent Holdings Ltd. | | Interactive Media & Services | | | 888,595 | | | | 40,106,577 | |
Uni-President China Holdings Ltd. | | Food Products | | | 8,589,300 | | | | 9,565,473 | |
Weifu High-Technology Co. Ltd., B | | Auto Components | | | 1,348,863 | | | | 2,432,810 | |
| | | | | | | | | | |
| | | | | | | | | 347,340,595 | |
| | | | | | | | | | |
| | | |
Czech Republic 0.4% | | | | | | | | | | |
Moneta Money Bank AS | | Banks | | | 1,701,603 | | | | 5,826,548 | |
| | | | | | | | | | |
| | | |
Hungary 1.0% | | | | | | | | | | |
Richter Gedeon Nyrt | | Pharmaceuticals | | | 718,019 | | | | 13,225,768 | |
| | | | | | | | | | |
| | | |
India 8.0% | | | | | | | | | | |
Bajaj Holdings & Investment Ltd. | | Diversified Financial Services | | | 197,008 | | | | 10,281,132 | |
Biocon Ltd. | | Biotechnology | | | 2,600,808 | | | | 9,450,797 | |
Coal India Ltd. | | Oil, Gas & Consumable Fuels | | | 1,356,548 | | | | 4,993,356 | |
Glenmark Pharmaceuticals Ltd. | | Pharmaceuticals | | | 1,138,844 | | | | 7,322,791 | |
| | | | |
| | | |
| franklintempleton.com | | Semiannual Report | | 15 |
TEMPLETON DEVELOPING MARKETS TRUST
STATEMENT OF INVESTMENTS (UNAUDITED)
| | | | | | | | | | | | |
| | | Industry | | | Shares | | | Value | |
| | | |
Common Stocks(continued) | | | | | | | | | | | | |
India(continued) | | | | | | | | | | | | |
ICICI Bank Ltd. | | | Banks | | | | 8,171,501 | | | $ | 51,802,220 | |
Infosys Ltd. | | | IT Services | | | | 1,342,256 | | | | 14,249,911 | |
Reliance Industries Ltd. | | | Oil, Gas & Consumable Fuels | | | | 177,252 | | | | 3,221,385 | |
Tata Chemicals Ltd. | | | Chemicals | | | | 762,300 | | | | 6,927,588 | |
aTata Motors Ltd., A | | | Automobiles | | | | 1,710,029 | | | | 1,975,400 | |
| | | | | | | | | | | | |
| | | | | | | | | | | 110,224,580 | |
| | | | | | | | | | | | |
| | | |
Indonesia 1.4% | | | | | | | | | | | | |
Astra International Tbk PT | | | Automobiles | | | | 35,262,500 | | | | 18,595,337 | |
| | | | | | | | | | | | |
| | | |
Kenya 0.3% | | | | | | | | | | | | |
Equity Group Holdings PLC | | | Banks | | | | 10,013,923 | | | | 3,815,760 | |
| | | | | | | | | | | | |
| | | |
Mexico 2.3% | | | | | | | | | | | | |
Banco Santander Mexico SA Institucion de Banca Multiple Grupo Financiero Santander, ADR | | | Banks | | | | 3,726,457 | | | | 28,507,396 | |
Nemak SAB de CV | | | Auto Components | | | | 7,467,736 | | | | 3,503,679 | |
| | | | | | | | | | | | |
| | | | | | | | | | | 32,011,075 | |
| | | | | | | | | | | | |
| | | |
Nigeria 0.0%† | | | | | | | | | | | | |
Nigerian Breweries PLC | | | Beverages | | | | 677,413 | | | | 118,389 | |
| | | | | | | | | | | | |
| | | |
Pakistan 0.3% | | | | | | | | | | | | |
Habib Bank Ltd. | | | Banks | | | | 6,343,100 | | | | 4,356,276 | |
| | | | | | | | | | | | |
| | | |
Peru 0.7% | | | | | | | | | | | | |
Compania de Minas Buenaventura SA, ADR | | | Metals & Mining | | | | 204,812 | | | | 3,414,216 | |
Intercorp Financial Services Inc. | | | Banks | | | | 123,460 | | | | 5,617,430 | |
| | | | | | | | | | | | |
| | | | | | | | | | | 9,031,646 | |
| | | | | | | | | | | | |
| | | |
Philippines 0.3% | | | | | | | | | | | | |
BDO Unibank Inc. | | | Banks | | | | 1,411,517 | | | | 3,857,356 | |
Security Bank Corp. | | | Banks | | | | 6,300 | | | | 20,906 | |
| | | | | | | | | | | | |
| | | | | | | | | | | 3,878,262 | |
| | | | | | | | | | | | |
| | | |
Russia 8.3% | | | | | | | | | | | | |
Gazprom PJSC, ADR | | | Oil, Gas & Consumable Fuels | | | | 1,492,646 | | | | 10,935,125 | |
LUKOIL PJSC, ADR | | | Oil, Gas & Consumable Fuels | | | | 350,812 | | | | 29,615,549 | |
a,bMail.Ru Group Ltd., GDR, Reg S | | | Interactive Media & Services | | | | 510,466 | | | | 13,027,092 | |
MMC Norilsk Nickel PJSC, ADR | | | Metals & Mining | | | | 168,800 | | | | 3,833,448 | |
Sberbank of Russia PJSC, ADR | | | Banks | | | | 2,190,447 | | | | 33,689,075 | |
aYandex NV, A | | | Interactive Media & Services | | | | 600,167 | | | | 22,806,346 | |
| | | | | | | | | | | | |
| | | | | | | | | | | 113,906,635 | |
| | | | | | | | | | | | |
| | | |
Singapore 0.2% | | | | | | | | | | | | |
DBS Group Holdings Ltd. | | | Banks | | | | 109,798 | | | | 2,106,304 | |
| | | | | | | | | | | | |
| | | |
South Africa 6.9% | | | | | | | | | | | | |
Massmart Holdings Ltd. | | | Food & Staples Retailing | | | | 1,982,547 | | | | 8,752,936 | |
aMultiChoice Group Ltd. | | | Media | | | | 396,460 | | | | 3,770,047 | |
Naspers Ltd., N | | | Internet & Direct Marketing Retail | | | | 339,664 | | | | 82,443,142 | |
| | | | | | | | | | | | |
| | | | | | | | | | | 94,966,125 | |
| | | | | | | | | | | | |
| | | | |
| | | |
16 | | Semiannual Report | | franklintempleton.com |
TEMPLETON DEVELOPING MARKETS TRUST
STATEMENT OF INVESTMENTS (UNAUDITED)
| | | | | | | | | | |
| | | Industry | | Shares | | | Value | |
| | | |
Common Stocks(continued) | | | | | | | | | | |
South Korea 16.1% | | | | | | | | | | |
Fila Korea Ltd. | | Textiles, Apparel & Luxury Goods | | | 259,425 | | | $ | 17,198,729 | |
Hankook Tire & Technology Co. Ltd. | | Auto Components | | | 89,556 | | | | 2,717,008 | |
Hanon Systems | | Auto Components | | | 419,862 | | | | 4,227,870 | |
HDC Hyundai DevelopmentCo-Engineering & Construction | | Construction & Engineering | | | 245,826 | | | | 9,242,857 | |
Hite Jinro Co. Ltd. | | Beverages | | | 126,480 | | | | 2,224,720 | |
Interpark Holdings Corp. | | Internet & Direct Marketing Retail | | | 613,554 | | | | 1,280,735 | |
KT Skylife Co. Ltd. | | Media | | | 716,862 | | | | 6,536,981 | |
LG Corp. | | Industrial Conglomerates | | | 374,932 | | | | 24,921,146 | |
Naver Corp. | | Interactive Media & Services | | | 269,238 | | | | 26,529,580 | |
POSCO | | Metals & Mining | | | 54,414 | | | | 11,499,493 | |
Samsung Electronics Co. Ltd. | | Technology Hardware, Storage & Peripherals | | | 2,548,921 | | | | 103,548,401 | |
SK Hynix Inc. | | Semiconductors & Semiconductor Equipment | | | 177,310 | | | | 10,651,412 | |
| | | | | | | | | | |
| | | |
| | | | | | | | | 220,578,932 | |
| | | | | | | | | | |
Taiwan 8.9% | | | | | | | | | | |
Catcher Technology Co. Ltd. | | Technology Hardware, Storage & Peripherals | | | 1,055,000 | | | | 7,577,555 | |
CTBC Financial Holding Co. Ltd. | | Banks | | | 10,910,000 | | | | 7,519,159 | |
FIT Hon Teng Ltd. | | Electronic Equipment, Instruments & Components | | | 7,883,100 | | | | 3,188,699 | |
Hon Hai Precision Industry Co. Ltd. | | Electronic Equipment, Instruments & Components | | | 3,913,192 | | | | 9,777,295 | |
Largan Precision Co. Ltd. | | Electronic Equipment, Instruments & Components | | | 31,900 | | | | 3,969,737 | |
Taiwan Semiconductor Manufacturing Co. Ltd. | | Semiconductors & Semiconductor Equipment | | | 11,785,000 | | | | 90,923,074 | |
| | | | | | | | | | |
| | | |
| | | | | | | | | 122,955,519 | |
| | | | | | | | | | |
Thailand 2.9% | | | | | | | | | | |
Kasikornbank PCL, fgn | | Banks | | | 2,502,700 | | | | 15,453,296 | |
Kiatnakin Bank PCL, fgn | | Banks | | | 4,178,300 | | | | 9,462,100 | |
Siam Commercial Bank PCL, fgn | | Banks | | | 1,268,000 | | | | 5,763,636 | |
Thai Beverage PCL, fgn | | Beverages | | | 15,081,200 | | | | 9,249,877 | |
| | | | | | | | | | |
| | | |
| | | | | | | | | 39,928,909 | |
| | | | | | | | | | |
United Kingdom 3.1% | | | | | | | | | | |
Unilever PLC | | Personal Products | | | 692,182 | | | | 43,024,442 | |
| | | | | | | | | | |
| | | |
United States 3.1% | | | | | | | | | | |
Cognizant Technology Solutions Corp., A | | IT Services | | | 509,931 | | | | 32,324,526 | |
aIMAX Corp. | | Entertainment | | | 507,604 | | | | 10,253,601 | |
| | | | | | | | | | |
| | | |
| | | | | | | | | 42,578,127 | |
| | | | | | | | | | |
| | | |
Total Common Stocks (Cost $952,110,902) | | | | | | | | | 1,276,818,414 | |
| | | | | | | | | | |
| | | |
Preferred Stocks 5.4% | | | | | | | | | | |
| | | |
Brazil 5.4% | | | | | | | | | | |
cBanco Bradesco SA, 3.053%, ADR, pfd | | Banks | | | 3,580,874 | | | | 35,164,182 | |
cItau Unibanco Holding SA, 7.589%, ADR, pfd | | Banks | | | 3,448,959 | | | | 32,489,194 | |
cPetroleo Brasileiro SA, 0.599%, ADR, pfd | | Oil, Gas & Consumable Fuels | | | 505,700 | | | | 7,180,940 | |
| | | | | | | | | | |
| | | |
Total Preferred Stocks (Cost $32,708,947) | | | | | | | | | 74,834,316 | |
| | | | | | | | | | |
| | | |
Total Investments before Short Term Investments (Cost $984,819,849) | | | | | | | | | 1,351,652,730 | |
| | | | | | | | | | |
| | | | |
| �� | | |
| franklintempleton.com | | Semiannual Report | | 17 |
TEMPLETON DEVELOPING MARKETS TRUST
STATEMENT OF INVESTMENTS (UNAUDITED)
| | | | | | | | |
| | | Shares | | | Value | |
Short Term Investments (Cost $20,254,028) 1.5% | | | | | | | | |
| | |
Money Market Funds 1.5% | | | | | | | | |
| | |
United States 1.5% | | | | | | | | |
d,eInstitutional Fiduciary Trust Money Market Portfolio, 2.05% | | | 20,254,028 | | | $ | 20,254,028 | |
| | | | | | | | |
| | |
Total Investments (Cost $1,005,073,877) 99.9% | | | | | | | 1,371,906,758 | |
| | |
Other Assets, less Liabilities 0.1% | | | | | | | 1,532,967 | |
| | | | | | | | |
| | |
Net Assets 100.0% | | | | | | $ | 1,373,439,725 | |
| | | | | | | | |
See Abbreviations on page 30.
†Rounds to less than 0.1% of net assets.
aNon-income producing.
bSecurity was purchased pursuant to Regulation S under the Securities Act of 1933, which exempts from registration securities offered and sold outside of the United States. Such a security cannot be sold in the United States without either an effective registration statement filed pursuant to the Securities Act of 1933, or pursuant to an exemption from registration. This security has been deemed liquid under guidelines approved by the Fund’s Board of Trustees. At June 30, 2019, the value of this security was $13,027,092, representing 0.9% of net assets.
cVariable rate security. The rate shown represents the yield at period end.
dSee Note 3(f) regarding investments in affiliated management investment companies.
eThe rate shown is the annualizedseven-day effective yield at period end.
| | | | |
| | | |
18 | | Semiannual Report | The accompanying notes are an integral part of these financial statements. | | franklintempleton.com |
TEMPLETON DEVELOPING MARKETS TRUST
FINANCIAL STATEMENTS
Statement of Assets and Liabilities
June 30, 2019 (unaudited)
| | | | |
Assets: | | | | |
Investments in securities: | | | | |
Cost - Unaffiliated issuers | | | $ 984,819,849 | |
Cost -Non-controlled affiliates (Note 3f) | | | 20,254,028 | |
| | | | |
Value - Unaffiliated issuers | | | $1,351,652,730 | |
Value -Non-controlled affiliates (Note 3f) | | | 20,254,028 | |
Receivables: | | | | |
Capital shares sold | | | 798,834 | |
Dividends | | | 7,367,574 | |
Foreign tax refund | | | 14,939 | |
Other assets | | | 970 | |
| | | | |
Total assets | | | 1,380,089,075 | |
| | | | |
| |
Liabilities: | | | | |
Payables: | | | | |
Capital shares redeemed | | | 1,178,061 | |
Management fees | | | 981,731 | |
Distribution fees | | | 528,147 | |
Transfer agent fees | | | 299,128 | |
Trustees’ fees and expenses | | | 5,695 | |
Deferred tax | | | 3,399,900 | |
Accrued expenses and other liabilities | | | 256,688 | |
| | | | |
Total liabilities | | | 6,649,350 | |
| | | | |
Net assets, at value | | | $1,373,439,725 | |
| | | | |
| |
Net assets consist of: | | | | |
Paid-in capital | | | $1,073,275,775 | |
Total distributable earnings (loss) | | | 300,163,950 | |
| | | | |
Net assets, at value | | | $1,373,439,725 | |
| | | | |
| | | | |
| | | |
| franklintempleton.com | | The accompanying notes are an integral part of these financial statements. | Semiannual Report | | 19 |
TEMPLETON DEVELOPING MARKETS TRUST
FINANCIAL STATEMENTS
Statement of Assets and Liabilities (continued)
June 30, 2019 (unaudited)
| | | | |
Class A: | | | | |
Net assets, at value | | $ | 1,000,516,706 | |
| | | | |
Shares outstanding | | | 48,351,736 | |
| | | | |
Net asset value per sharea | | | $20.69 | |
| | | | |
Maximum offering price per share (net asset value per share ÷ 94.50%) | | | $21.89 | |
| | | | |
Class C: | | | | |
Net assets, at value | | $ | 62,973,171 | |
| | | | |
Shares outstanding | | | 3,125,449 | |
| | | | |
Net asset value and maximum offering price per sharea | | | $20.15 | |
| | | | |
Class R: | | | | |
Net assets, at value | | $ | 19,999,354 | |
| | | | |
Shares outstanding | | | 984,070 | |
| | | | |
Net asset value and maximum offering price per share | | | $20.32 | |
| | | | |
Class R6: | | | | |
Net assets, at value | | $ | 109,403,649 | |
| | | | |
Shares outstanding | | | 5,319,279 | |
| | | | |
Net asset value and maximum offering price per share | | | $20.57 | |
| | | | |
Advisor Class: | | | | |
Net assets, at value | | $ | 180,546,845 | |
| | | | |
Shares outstanding | | | 8,767,137 | |
| | | | |
Net asset value and maximum offering price per share | | | $20.59 | |
| | | | |
aRedemption price is equal to net asset value less contingent deferred sales charges, if applicable.
| | | | |
| | | |
20 | | Semiannual Report | The accompanying notes are an integral part of these financial statements. | | franklintempleton.com |
TEMPLETON DEVELOPING MARKETS TRUST
FINANCIAL STATEMENTS
Statement of Operations
for the six months ended June 30, 2019 (unaudited)
| | | | |
Investment income: | | | | |
Dividends: (net of foreign taxes)* | | | | |
Unaffiliated issuers | | $ | 17,432,200 | |
Non-controlled affiliates (Note 3f) | | | 184,894 | |
Interest: (net of foreign taxes)~ | | | | |
Unaffiliated issuers | | | 34,009 | |
| | | | |
| |
Total investment income | | | 17,651,103 | |
| | | | |
| |
Expenses: | | | | |
Management fees (Note 3a) | | | 6,983,193 | |
Distribution fees: (Note 3c) | | | | |
Class A | | | 1,228,985 | |
Class C | | | 325,963 | |
Class R | | | 47,100 | |
Transfer agent fees: (Note 3e) | | | | |
Class A | | | 779,119 | |
Class C | | | 51,661 | |
Class R | | | 15,003 | |
Class R6 | | | 19,076 | |
Advisor Class | | | 140,777 | |
Custodian fees (Note 4) | | | 201,562 | |
Reports to shareholders | | | 95,451 | |
Registration and filing fees | | | 70,806 | |
Professional fees | | | 69,370 | |
Trustees’ fees and expenses | | | 96,342 | |
Other | | | 22,257 | |
| | | | |
Total expenses | | | 10,146,665 | |
Expenses waived/paid by affiliates (Note 3f and 3g) | | | (1,065,907 | ) |
| | | | |
| |
Net expenses | | | 9,080,758 | |
| | | | |
| |
Net investment income | | | 8,570,345 | |
| | | | |
| |
Realized and unrealized gains (losses): | | | | |
Net realized gain (loss) from: | | | | |
Investments:# | | | | |
Unaffiliated issuers | | | 31,920,148 | |
Foreign currency transactions | | | (652,289 | ) |
| | | | |
| |
Net realized gain (loss) | | | 31,267,859 | |
| | | | |
| |
Net change in unrealized appreciation (depreciation) on: | | | | |
Investments: | | | | |
Unaffiliated issuers | | | 133,543,674 | |
Translation of other assets and liabilities denominated in foreign currencies | | | 389,106 | |
Change in deferred taxes on unrealized appreciation | | | (1,210,686 | ) |
| | | | |
| |
Net change in unrealized appreciation (depreciation) | | | 132,722,094 | |
| | | | |
| |
Net realized and unrealized gain (loss) | | | 163,989,953 | |
| | | | |
| |
Net increase (decrease) in net assets resulting from operations | | $ | 172,560,298 | |
| | | | |
*Foreign taxes withheld on dividends | | $ | 2,383,274 | |
~Foreign taxes withheld on interest | | $ | 24,272 | |
#Net of foreign taxes | | $ | 282,973 | |
| | | | |
| | | |
| franklintempleton.com | | The accompanying notes are an integral part of these financial statements. | Semiannual Report | | 21 |
TEMPLETON DEVELOPING MARKETS TRUST
FINANCIAL STATEMENTS
Statements of Changes in Net Assets
| | | | | | | | |
| | | Six Months
Ended June 30,
2019 (unaudited) | | | Year Ended
December 31, 2018 | |
| | |
Increase (decrease) in net assets: | | | | | | | | |
Operations: | | | | | | | | |
Net investment income | | | $ 8,570,345 | | | | $ 14,619,520 | |
Net realized gain (loss) | | | 31,267,859 | | | | 64,714,220 | |
Net change in unrealized appreciation (depreciation) | | | 132,722,094 | | | | (335,669,083 | ) |
| | | | |
| | |
Net increase (decrease) in net assets resulting from operations | | | 172,560,298 | | | | (256,335,343 | ) |
| | | | |
| | |
Distributions to shareholders: | | | | | | | | |
Class A | | | — | | | | (12,287,764 | ) |
Class R | | | — | | | | (197,582 | ) |
Class R6 | | | — | | | | (1,676,225 | ) |
Advisor Class | | | — | | | | (2,562,397 | ) |
| | | | |
| | |
Total distributions to shareholders | | | — | | | | (16,723,968 | ) |
| | | | |
| | |
Capital share transactions: (Note 2) | | | | | | | | |
Class A | | | (43,410,293 | ) | | | (71,662,980 | ) |
Class C | | | (8,366,647 | ) | | | (83,676,819 | ) |
Class R | | | (471,645 | ) | | | (652,516 | ) |
Class R6 | | | 1,527,725 | | | | 10,972,208 | |
Advisor Class | | | 1,860,573 | | | | 11,086,440 | |
| | | | |
Total capital share transactions | | | (48,860,287 | ) | | | (133,933,667 | ) |
| | | | |
| | |
Net increase (decrease) in net assets | | | 123,700,011 | | | | (406,992,978 | ) |
Net assets: | | | | | | | | |
Beginning of period | | | 1,249,739,714 | | | | 1,656,732,692 | |
| | | | |
| | |
End of period | | | $1,373,439,725 | | | | $1,249,739,714 | |
| | | | |
| | | | |
| | | |
22 | | Semiannual Report | The accompanying notes are an integral part of these financial statements. | | franklintempleton.com |
TEMPLETON DEVELOPING MARKETS TRUST
Notes to Financial Statements (unaudited)
1. Organization and Significant Accounting Policies
Templeton Developing Markets Trust (Fund) is registered under the Investment Company Act of 1940 (1940 Act) as anopen-end management investment company and applies the specialized accounting and reporting guidance in U.S. Generally Accepted Accounting Principles (U.S. GAAP). The Fund offers five classes of shares: Class A, Class C, Class R, Class R6 and Advisor Class. Class C shares automatically convert to Class A shares after they have been held for 10 years. Each class of shares may differ by its initial sales load, contingent deferred sales charges, voting rights on matters affecting a single class, its exchange privilege and fees due to differing arrangements for distribution and transfer agent fees.
The following summarizes the Fund’s significant accounting policies.
a. Financial Instrument Valuation
The Fund’s investments in financial instruments are carried at fair value daily. Fair value is the price that would be received to sell an asset or paid to transfer a liability in an orderly transaction between market participants on the measurement date. The Fund calculates the net asset value (NAV) per share each business day as of 4 p.m. Eastern time or the regularly scheduled close of the New York Stock Exchange (NYSE), whichever is earlier. Under compliance policies and procedures approved by the Fund’s Board of Trustees (the Board), the Fund’s administrator has responsibility for oversight of valuation, including leading the cross-functional Valuation Committee (VC). The Fund may utilize independent pricing services, quotations from securities and financial instrument dealers, and other market sources to determine fair value.
Equity securities listed on an exchange or on the NASDAQ National Market System are valued at the last quoted sale price or the official closing price of the day, respectively. Foreign equity securities are valued as of the close of trading on the foreign stock exchange on which the security is primarily traded, or as of 4 p.m. Eastern time. The value is then converted into its U.S. dollar equivalent at the foreign exchange rate in effect at 4 p.m. Eastern time on the day that the value of the security is determined.Over-the-counter (OTC) securities are valued within the range of the most recent quoted bid and ask prices. Securities that trade in multiple markets or on multiple exchanges are valued
according to the broadest and most representative market. Certain equity securities are valued based upon fundamental characteristics or relationships to similar securities.
Investments inopen-end mutual funds are valued at the closing NAV.
The Fund has procedures to determine the fair value of financial instruments for which market prices are not reliable or readily available. Under these procedures, the Fund primarily employs a market-based approach which may use related or comparable assets or liabilities, recent transactions, market multiples, book values, and other relevant information for the investment to determine the fair value of the investment. An income-based valuation approach may also be used in which the anticipated future cash flows of the investment are discounted to calculate fair value. Discounts may also be applied due to the nature or duration of any restrictions on the disposition of the investments. Due to the inherent uncertainty of valuations of such investments, the fair values may differ significantly from the values that would have been used had an active market existed.
Trading in securities on foreign securities stock exchanges and OTC markets may be completed before 4 p.m. Eastern time. In addition, trading in certain foreign markets may not take place on every Fund’s business day. Occasionally, events occur between the time at which trading in a foreign security is completed and 4 p.m. Eastern time that might call into question the reliability of the value of a portfolio security held by the Fund. As a result, differences may arise between the value of the Fund’s portfolio securities as determined at the foreign market close and the latest indications of value at 4 p.m. Eastern time. In order to minimize the potential for these differences, the VC monitors price movements following the close of trading in foreign stock markets through a series of country specific market proxies (such as baskets of American Depositary Receipts, futures contracts and exchange traded funds). These price movements are measured against established trigger thresholds for each specific market proxy to assist in determining if an event has occurred that may call into question the reliability of the values of the foreign securities held by the Fund. If such an event occurs, the securities may be valued using fair value procedures, which may include the use of independent pricing services.
| | | | |
| | | |
| franklintempleton.com | | Semiannual Report | | 23 |
TEMPLETON DEVELOPING MARKETS TRUST
NOTES TO FINANCIAL STATEMENTS (UNAUDITED)
1. Organization and Significant Accounting Policies(continued)
a. Financial Instrument Valuation(continued)
When the last day of the reporting period is anon-business day, certain foreign markets may be open on those days that the Fund’s NAV is not calculated, which could result in differences between the value of the Fund’s portfolio securities on the last business day and the last calendar day of the reporting period. Any significant security valuation changes due to an open foreign market are adjusted and reflected by the Fund for financial reporting purposes.
b. Foreign Currency Translation
Portfolio securities and other assets and liabilities denominated in foreign currencies are translated into U.S. dollars based on the exchange rate of such currencies against U.S. dollars on the date of valuation. The Fund may enter into foreign currency exchange contracts to facilitate transactions denominated in a foreign currency. Purchases and sales of securities, income and expense items denominated in foreign currencies are translated into U.S. dollars at the exchange rate in effect on the transaction date. Portfolio securities and assets and liabilities denominated in foreign currencies contain risks that those currencies will decline in value relative to the U.S. dollar. Occasionally, events may impact the availability or reliability of foreign exchange rates used to convert the U.S. dollar equivalent value. If such an event occurs, the foreign exchange rate will be valued at fair value using procedures established and approved by the Board.
The Fund does not separately report the effect of changes in foreign exchange rates from changes in market prices on securities held. Such changes are included in net realized and unrealized gain or loss from investments in the Statement of Operations.
Realized foreign exchange gains or losses arise from sales of foreign currencies, currency gains or losses realized between the trade and settlement dates on securities transactions and the difference between the recorded amounts of dividends, interest, and foreign withholding taxes and the U.S. dollar equivalent of the amounts actually received or paid. Net unrealized foreign exchange gains and losses arise from changes in foreign exchange rates on foreign denominated assets and liabilities other than investments in securities held at the end of the reporting period.
c. Income and Deferred Taxes
It is the Fund’s policy to qualify as a regulated investment company under the Internal Revenue Code. The Fund intends to distribute to shareholders substantially all of its taxable income and net realized gains to relieve it from federal income and excise taxes. As a result, no provision for U.S. federal income taxes is required.
The Fund may be subject to foreign taxation related to income received, capital gains on the sale of securities and certain foreign currency transactions in the foreign jurisdictions in which it invests. Foreign taxes, if any, are recorded based on the tax regulations and rates that exist in the foreign markets in which the Fund invests. When a capital gain tax is determined to apply, the Fund records an estimated deferred tax liability in an amount that would be payable if the securities were disposed of on the valuation date.
The Fund may recognize an income tax liability related to its uncertain tax positions under U.S. GAAP when the uncertain tax position has a less than 50% probability that it will be sustained upon examination by the tax authorities based on its technical merits. As of June 30, 2019, the Fund has determined that no tax liability is required in its financial statements related to uncertain tax positions for any open tax years (or expected to be taken in future tax years). Open tax years are those that remain subject to examination and are based on the statute of limitations in each jurisdiction in which the Fund invests.
d. Security Transactions, Investment Income, Expenses and Distributions
Security transactions are accounted for on trade date. Realized gains and losses on security transactions are determined on a specific identification basis. Estimated expenses are accrued daily. Dividend income is recorded on theex-dividend date except for certain dividends from securities where the dividend rate is not available. In such cases, the dividend is recorded as soon as the information is received by the Fund. Distributions to shareholders are recorded on theex-dividend date. Distributable earnings are determined according to income tax regulations (tax basis) and may differ from earnings recorded in accordance with U.S. GAAP. These differences may be permanent or temporary. Permanent differences are reclassified among capital accounts to reflect their tax character. These
| | | | |
| | | |
24 | | Semiannual Report | | franklintempleton.com |
TEMPLETON DEVELOPING MARKETS TRUST
NOTES TO FINANCIAL STATEMENTS (UNAUDITED)
reclassifications have no impact on net assets or the results of operations. Temporary differences are not reclassified, as they may reverse in subsequent periods.
Realized and unrealized gains and losses and net investment income, excluding class specific expenses, are allocated daily to each class of shares based upon the relative proportion of net assets of each class. Differences in per share distributions by class are generally due to differences in class specific expenses.
e. Accounting Estimates
The preparation of financial statements in accordance with U.S. GAAP requires management to make estimates and assumptions that affect the reported amounts of assets and liabilities at the date of the financial statements and the amounts of income and expenses during the reporting period. Actual results could differ from those estimates.
f. Guarantees and Indemnifications
Under the Fund’s organizational documents, its officers and trustees are indemnified by the Fund against certain liabilities arising out of the performance of their duties to the Fund. Additionally, in the normal course of business, the Fund enters into contracts with service providers that contain general indemnification clauses. The Fund’s maximum exposure under these arrangements is unknown as this would involve future claims that may be made against the Fund that have not yet occurred. Currently, the Fund expects the risk of loss to be remote.
2. Shares of Beneficial Interest
At June 30, 2019, there were an unlimited number of shares authorized (without par value). Transactions in the Fund’s shares were as follows:
| | | | | | | | | | | | | | | | |
| | | Six Months Ended June 30, 2019 | | | Year Ended December 31, 2018 | |
| | | | |
| | | Shares | | | Amount | | | Shares | | | Amount | |
| |
| | | | |
Class A Shares: | | | | | | | | | | | | | | | | |
Shares solda | | | 1,705,914 | | | $ | 34,212,100 | | | | 7,871,601 | | | $ | 157,528,775 | |
Shares issued in reinvestment of distributions | | | — | | | | — | | | | 603,651 | | | | 10,787,233 | |
Shares redeemed | | | (3,857,994 | ) | | | (77,622,393 | ) | �� | | (11,605,462 | ) | | | (239,978,988 | ) |
| | | | |
| | | | |
Net increase (decrease) | | | (2,152,080 | ) | | $ | (43,410,293 | ) | | | (3,130,210 | ) | | $ | (71,662,980 | ) |
| | | | |
| | | | |
Class C Shares: | | | | | | | | | | | | | | | | |
Shares sold | | | 169,254 | | | $ | 3,323,537 | | | | 728,900 | | | $ | 14,876,040 | |
Shares redeemeda | | | (598,777 | ) | | | (11,690,184 | ) | | | (5,256,767 | ) | | | (98,552,859 | ) |
| | | | |
| | | | |
Net increase (decrease) | | | (429,523 | ) | | $ | (8,366,647 | ) | | | (4,527,867 | ) | | $ | (83,676,819 | ) |
| | | | |
| | | | |
Class R Shares: | | | | | | | | | | | | | | | | |
Shares sold | | | 146,601 | | | $ | 2,877,670 | | | | 408,112 | | | $ | 8,398,931 | |
Shares issued in reinvestment of distributions | | | — | | | | — | | | | 10,678 | | | | 187,617 | |
Shares redeemed | | | (171,545 | ) | | | (3,349,315 | ) | | | (451,385 | ) | | | (9,239,064 | ) |
| | | | |
| | | | |
Net increase (decrease) | | | (24,944 | ) | | $ | (471,645 | ) | | | (32,595 | ) | | $ | (652,516 | ) |
| | | | |
| | | | |
Class R6 Shares: | | | | | | | | | | | | | | | | |
Shares sold | | | 646,392 | | | $ | 12,772,944 | | | | 1,579,435 | | | $ | 33,626,359 | |
Shares issued in reinvestment of distributions | | | — | | | | — | | | | 42,681 | | | | 756,740 | |
Shares redeemed | | | (561,925 | ) | | | (11,245,219 | ) | | | (1,141,017 | ) | | | (23,410,891 | ) |
| | | | |
| | | | |
Net increase (decrease) | | | 84,467 | | | $ | 1,527,725 | | | | 481,099 | | | $ | 10,972,208 | |
| | | | |
| | | | |
| | | |
| franklintempleton.com | | Semiannual Report | | 25 |
TEMPLETON DEVELOPING MARKETS TRUST
NOTES TO FINANCIAL STATEMENTS (UNAUDITED)
2. Shares of Beneficial Interest(continued)
| | | | | | | | | | | | | | | | |
| | | Six Months Ended June 30, 2019 | | | Year Ended December 31, 2018 | |
| | | | |
| | | Shares | | | Amount | | | Shares | | | Amount | |
| |
| | | | |
Advisor Class Shares: | | | | | | | | | | | | | | | | |
Shares sold | | | 1,318,713 | | | $ | 26,348,806 | | | | 3,797,213 | | | $ | 78,509,855 | |
Shares issued in reinvestment of distributions | | | — | | | | — | | | | 136,441 | | | | 2,423,201 | |
Shares redeemed | | | (1,233,026 | ) | | | (24,488,233 | ) | | | (3,446,857 | ) | | | (69,846,616) | |
| | | | |
| | | | |
Net increase (decrease) | | | 85,687 | | | $ | 1,860,573 | | | | 486,797 | | | $ | 11,086,440 | |
| | | | |
aMay include a portion of Class C shares that were automatically converted to Class A.
3. Transactions with Affiliates
Franklin Resources, Inc. is the holding company for various subsidiaries that together are referred to as Franklin Templeton. Certain officers and trustees of the Fund are also officers, and/or directors of the following subsidiaries:
| | | | |
| Subsidiary | | Affiliation | | |
| | |
Templeton Asset Management Ltd. (Asset Management) | | Investment manager | | |
| | |
Franklin Templeton Services, LLC (FT Services) | | Administrative manager | | |
| | |
Franklin Templeton Distributors, Inc. (Distributors) | | Principal underwriter | | |
| | |
Franklin Templeton Investor Services, LLC (Investor Services) | | Transfer agent | | |
a. Management Fees
The Fund pays an investment management fee to Asset Management based on the average daily net assets of the Fund as follows:
| | | | |
| Annualized Fee Rate | | Net Assets | | |
| | |
1.050% | | Up to and including $1 billion | | |
| | |
1.000% | | Over $1 billion, up to and including $5 billion | | |
| | |
0.950% | | Over $5 billion, up to and including $10 billion | | |
| | |
0.900% | | Over $10 billion, up to and including $15 billion | | |
| | |
0.850% | | Over $15 billion, up to and including $20 billion | | |
| | |
0.800% | | In excess of $20 billion | | |
For the period ended June 30, 2019, the annualized gross effective investment management fee rate was 1.036% of the Fund’s average daily net assets.
b. Administrative Fees
Under an agreement with Asset Management, FT Services provides administrative services to the Fund. The fee is paid by Asset Management based on the Fund’s average daily net assets, and is not an additional expense of the Fund.
| | | | |
| | | |
26 | | Semiannual Report | | franklintempleton.com |
TEMPLETON DEVELOPING MARKETS TRUST
NOTES TO FINANCIAL STATEMENTS (UNAUDITED)
c. Distribution Fees
The Board has adopted distribution plans for each share class, with the exception of Class R6 and Advisor Class shares, pursuant to Rule12b-1 under the 1940 Act. Under the Fund’s Class A reimbursement distribution plan, the Fund reimburses Distributors for costs incurred in connection with the servicing, sale and distribution of the Fund’s shares up to the maximum annual plan rate. Under the Class A reimbursement distribution plan, costs exceeding the maximum for the current plan year cannot be reimbursed in subsequent periods. In addition, under the Fund’s Class C and R compensation distribution plans, the Fund pays Distributors for costs incurred in connection with the servicing, sale and distribution of the Fund’s shares up to the maximum annual plan rate for each class. The plan year, for purposes of monitoring compliance with the maximum annual plan rates, is February 1 through January 31.
The maximum annual plan rates, based on the average daily net assets, for each class, are as follows:
| | | | |
Class A | | | 0.35% | |
| |
Class C | | | 1.00% | |
| |
Class R | | | 0.50% | |
The Board has set the current rate at 0.25% per year for Class A shares until further notice and approval by the Board.
d. Sales Charges/Underwriting Agreements
Front-end sales charges and contingent deferred sales charges (CDSC) do not represent expenses of the Fund. These charges are deducted from the proceeds of sales of Fund shares prior to investment or from redemption proceeds prior to remittance, as applicable. Distributors has advised the Fund of the following commission transactions related to the sales and redemptions of the Fund’s shares for the period:
| | | | |
Sales charges retained net of commissions paid to unaffiliated brokers/dealers | | $ | 21,476 | |
| |
CDSC retained | | $ | 3,068 | |
e. Transfer Agent Fees
Each class of shares pays transfer agent fees to Investor Services for its performance of shareholder servicing obligations. The fees are based on an annualized asset based fee of 0.02% plus a transaction based fee. In addition, each class reimburses Investor Services for out of pocket expenses incurred and, except for Class R6 reimburses shareholder servicing fees paid to third parties. These fees are allocated daily based upon their relative proportion of such classes’ aggregate net assets. Class R6 pays Investor Services transfer agent fees specific to that class.
For the period ended June 30, 2019, the Fund paid transfer agent fees of $1,005,636, of which $446,601 was retained by Investor Services.
| | | | |
| | | |
| franklintempleton.com | | Semiannual Report | | 27 |
TEMPLETON DEVELOPING MARKETS TRUST
NOTES TO FINANCIAL STATEMENTS (UNAUDITED)
3. Transactions with Affiliates(continued)
f. Investments in Affiliated Management Investment Companies
The Fund invests in one or more affiliated management investment companies for purposes other than exercising a controlling influence over the management or policies. Management fees paid by the Fund are waived on assets invested in the affiliated management investment companies, as noted in the Statement of Operations, in an amount not to exceed the management and administrative fees paid directly or indirectly by each affiliate. During the period ended June 30, 2019, the Fund held investments in affiliated management investment companies as follows:
| | | | | | | | | | | | | | | | | | | | | | | | | | | | | | | | |
| | | Value at Beginning of Period | | | Purchases | | | Sales | | | Realized Gain (Loss) | | | Net Change in Unrealized Appreciation (Depreciation) | | | Value at End of Period | | | Number of Shares Held at End of Period | | | Dividend
Income | |
Non-Controlled Affiliates | | | | | | | | | | | | | | | | | | | | | | | | | | | | | | | | |
Institutional Fiduciary Trust Money Market Portfolio, 2.05% | | $ | 16,054,337 | | | $ | 115,130,453 | | | $ | (110,930,762 | ) | | | $ — | | | | $ — | | | $ | 20,254,028 | | | | 20,254,028 | | | $ | 184,894 | |
g. Waiver and Expense Reimbursements
Asset Management and Investor Services have contractually agreed in advance to waive or limit their respective fees and to assume as their own expense certain expenses otherwise payable by the Fund so that the expenses (excluding distribution fees, acquired fund fees and expenses, and certainnon-routine expenses or costs, including those relating to litigation, indemnification, reorganizations, and liquidations) for Class A, Class C, Class R and Advisor Class of the Fund do not exceed 1.13% and for Class R6 do not exceed 1.00%, based on the average net assets of each class until April 30, 2020. Total expenses waived or paid are not subject to recapture subsequent to the Fund’s fiscal year end.
Prior to May 1, 2019, the expenses (excluding certain fees and expenses as previously disclosed) for Class R6 were limited to 0.98% based on the average net assets of the class.
4. Expense Offset Arrangement
The Fund has entered into an arrangement with its custodian whereby credits realized as a result of uninvested cash balances are used to reduce a portion of the Fund’s custodian expenses. During the period ended June 30, 2019, there were no credits earned.
5. Income Taxes
For tax purposes, capital losses may be carried over to offset future capital gains.
At December 31, 2018, the capital loss carryforwards were as follows:
| | | | |
Capital loss carryforwards not subject to expiration: | | | | |
Short term | | $ | 52,177,624 | |
Long term | | | 34,909,918 | |
Total capital loss carryforwards | | $ | 87,087,542 | a |
aIncludes $42,136,018 from the acquired Templeton BRIC Fund, which may be carried over to offset future capital gains, subject to certain limitations.
| | | | |
| | | |
28 | | Semiannual Report | | franklintempleton.com |
TEMPLETON DEVELOPING MARKETS TRUST
NOTES TO FINANCIAL STATEMENTS (UNAUDITED)
At June 30, 2019, the cost of investments and net unrealized appreciation (depreciation) for income tax purposes were as follows:
| | | | |
Cost of investments | | $ | 1,018,110,087 | |
| | | | |
Unrealized appreciation | | $ | 438,489,961 | |
Unrealized depreciation | | | (84,693,290 | ) |
| | | | |
Net unrealized appreciation (depreciation) | | $ | 353,796,671 | |
| | | | |
Differences between income and/or capital gains as determined on a book basis and a tax basis are primarily due to differing treatment of corporate actions.
6. Investment Transactions
Purchases and sales (excluding short term securities) for the period ended June 30, 2019, aggregated $117,492,655 and $166,857,226, respectively.
7. Concentration of Risk
Investing in foreign securities may include certain risks and considerations not typically associated with investing in U.S. securities, such as fluctuating currency values and changing local and regional economic, political and social conditions, which may result in greater market volatility. Current political and financial uncertainty surrounding the European Union may increase market volatility and the economic risk of investing in securities in Europe. In addition, certain foreign securities may not be as liquid as U.S. securities.
The United States and other nations have imposed and could impose additional sanctions on certain issuers in Russia due to regional conflicts. These sanctions could result in the devaluation of Russia’s currency, a downgrade in Russian issuers’ credit ratings, or a decline in the value and liquidity of Russian stocks or other securities. Such sanctions could also adversely affect Russia’s economy. The Fund may be prohibited from investing in securities issued by companies subject to such sanctions. In addition, if the Fund holds the securities of an issuer that is subject to such sanctions, an immediate freeze of that issuer’s securities could result, impairing the ability of the Fund to buy, sell, receive or deliver those securities. There is also the risk that countermeasures could be taken by Russia’s government, which could involve the seizure of the Fund’s assets. These risks could affect the value of the Fund’s portfolio. While the Fund holds securities of certain issuers impacted by the sanctions, existing investments do not presently violate the applicable terms and conditions of the sanctions. The sanctions currently do not affect the Fund’s ability to sell these securities. At June 30, 2019, the Fund had 8.3% of its net assets invested in Russia.
8. Credit Facility
The Fund, together with other U.S. registered and foreign investment funds (collectively, Borrowers), managed by Franklin Templeton, are borrowers in a joint syndicated senior unsecured credit facility totaling $2 billion (Global Credit Facility) which matures on February 7, 2020. This Global Credit Facility provides a source of funds to the Borrowers for temporary and emergency purposes, including the ability to meet future unanticipated or unusually large redemption requests.
Under the terms of the Global Credit Facility, the Fund shall, in addition to interest charged on any borrowings made by the Fund and other costs incurred by the Fund, pay its share of fees and expenses incurred in connection with the implementation and maintenance of the Global Credit Facility, based upon its relative share of the aggregate net assets of all of the
| | | | |
| | | |
| franklintempleton.com | | Semiannual Report | | 29 |
TEMPLETON DEVELOPING MARKETS TRUST
NOTES TO FINANCIAL STATEMENTS (UNAUDITED)
8. Credit Facility(continued)
Borrowers, including an annual commitment fee of 0.15% based upon the unused portion of the Global Credit Facility. These fees are reflected in other expenses in the Statement of Operations. During the period ended June 30, 2019, the Fund did not use the Global Credit Facility.
9. Fair Value Measurements
The Fund follows a fair value hierarchy that distinguishes between market data obtained from independent sources (observable inputs) and the Fund’s own market assumptions (unobservable inputs). These inputs are used in determining the value of the Fund’s financial instruments and are summarized in the following fair value hierarchy:
| | • | | Level 1 – quoted prices in active markets for identical financial instruments |
| | • | | Level 2 – other significant observable inputs (including quoted prices for similar financial instruments, interest rates, prepayment speed, credit risk, etc.) |
| | • | | Level 3 – significant unobservable inputs (including the Fund’s own assumptions in determining the fair value of financial instruments) |
The input levels are not necessarily an indication of the risk or liquidity associated with financial instruments at that level.
At June 30, 2019, all of the Fund’s investments in financial instruments carried at fair value were valued using Level 1 inputs. For detailed categories, see the accompanying Statement of Investments.
10. Subsequent Events
The Fund has evaluated subsequent events through the issuance of the financial statements and determined that no events have occurred that require disclosure.
Abbreviations
| | |
| Selected Portfolio | | |
ADR American Depositary Receipt | | |
GDR Global Depositary Receipt | | |
| | | | |
| | | |
30 | | Semiannual Report | | franklintempleton.com |
TEMPLETON DEVELOPING MARKETS TRUST
Shareholder Information
Board Approval of Investment
Management Agreements
TEMPLETON DEVELOPING MARKETS TRUST(Fund)
At anin-person meeting held on February 26, 2019 (Meeting), the Board of Trustees (Board) of the Fund, including a majority of the trustees who are not “interested persons” as defined in the Investment Company Act of 1940 (Independent Trustees), reviewed and approved the continuance of the investment management agreement between Templeton Asset Management Ltd. (Manager) and the Fund (Management Agreement) for an additionalone-year period. The Independent Trustees received advice from and met separately with Independent Trustee counsel in considering whether to approve the continuation of the Management Agreement.
In considering the continuation of the Management Agreement, the Board reviewed and considered information provided by the Manager at the Meeting and throughout the year at meetings of the Board and its committees. The Board also reviewed and considered information provided in response to a detailed set of requests for information submitted to the Manager by Independent Trustee counsel on behalf of the Independent Trustees in connection with the annual contract renewal process. In addition, prior to the Meeting, the Independent Trustees held a telephonic contract renewal meeting at which the Independent Trustees conferred amongst themselves and Independent Trustee counsel about contract renewal matters. The Board reviewed and considered all of the factors it deemed relevant in approving the continuance of the Management Agreement, including, but not limited to: (i) the nature, extent and quality of the services provided by the Manager; (ii) the investment performance of the Fund; (iii) the costs of the services provided and profits realized by the Manager and its affiliates from the relationship with the Fund; (iv) the extent to which economies of scale are realized as the Fund grows; and (v) whether fee levels reflect these economies of scale for the benefit of Fund investors.
In approving the continuance of the Management Agreement, the Board, including a majority of the Independent Trustees, determined that the terms of the Management Agreement are fair and reasonable and that the continuance of such Management Agreement is in the interests of the Fund and its shareholders. While attention was given to all information furnished, the following
discusses some primary factors relevant to the Board’s determination.
Nature, Extent and Quality of Services
The Board reviewed and considered information regarding the nature, extent and quality of investment management services provided by the Manager and its affiliates to the Fund and its shareholders. This information included, among other things, the qualifications, background and experience of the senior management and investment personnel of the Manager; the structure of investment personnel compensation; oversight of third-party service providers; investment performance reports and related financial information for the Fund; reports on expenses, shareholder services, marketing support payments made to financial intermediaries and third party servicing arrangements; legal and compliance matters; risk controls; pricing and other services provided by the Manager and its affiliates; and management fees charged by the Manager and its affiliates to US funds and other accounts, including management’s explanation of differences among accounts where relevant. The Board also reviewed and considered an annual report on payments made by Franklin Templeton Investments (FTI) or the Fund to financial intermediaries, as well as a memorandum relating to third-party servicing arrangements in response to a guidance update in 2016 from the US Securities and Exchange Commission (SEC) relating to mutual fund distribution andsub-accounting fees. The Board noted management’s continuing efforts and expenditures in establishing effective business continuity plans and developing strategies to address areas of heightened concern in the mutual fund industry, such as cybersecurity and liquidity risk management. The Board also recognized management’s commitment to facilitating Board oversight of liquidity through the designation of a liquidity/risk administrator and the development of reports that highlight the amount of illiquid investments for the Fund.
The Board also reviewed and considered the benefits provided to Fund shareholders of investing in a fund that is part of the Franklin Templeton family of funds. The Board noted the financial position of Franklin Resources, Inc. (FRI), the Manager’s parent, and its commitment to the mutual fund business as evidenced by its continued introduction of new funds, reassessment of the fund offerings in response to the market environment and project initiatives and capital investments relating to the services provided to the Fund by the FTI organization.
| | | | |
| | | |
| franklintempleton.com | | Semiannual Report | | 31 |
TEMPLETON DEVELOPING MARKETS TRUST
SHAREHOLDER INFORMATION
Following consideration of such information, the Board was satisfied with the nature, extent and quality of services provided by the Manager and its affiliates to the Fund and its shareholders.
Fund Performance
The Board reviewed and considered the performance results of the Fund over various time periods ended December 31, 2018. The Board considered the performance returns for the Fund in comparison to the performance returns of mutual funds deemed comparable to the Fund included in a universe (Performance Universe) selected by Broadridge Financial Solutions, Inc. (Broadridge), an independent provider of investment company data. The Board received a description of the methodology used by Broadridge to select the mutual funds included in a Performance Universe. The Board also reviewed and considered Fund performance reports provided and discussions that occurred with portfolio managers at Board meetings throughout the year. A summary of the Fund’s performance results is below.
The Performance Universe for the Fund included the Fund and all retail and institutional emerging markets funds. The Board noted that the Fund’s annualized total return for theone- and three-year periods was above the median of its Performance Universe, but for the five- and10-year periods was below the median of its Performance Universe. The Board concluded that the Fund’s performance was satisfactory, noting that the strong shorter-term performance reflects the meaningful actions management has taken to enhance the Fund’s portfolio management team and processes.
Comparative Fees and Expenses
The Board reviewed and considered information regarding the Fund’s actual total expense ratio and its various components, including, as applicable, management fees; transfer agent expenses; underlying fund expenses; Rule12b-1 andnon-Rule12b-1 service fees; and othernon-management fees. The Board also noted the quarterly and annual reports it receives on all marketing support payments made by FTI to financial intermediaries. The Board considered the actual total expense ratio and, separately, the contractual management fee rate, without the effect of fee waivers, if any (Management Rate) of the Fund in comparison to the median expense ratio and median Management Rate, respectively, of other mutual funds deemed comparable to and with a similar expense structure to the Fund selected by Broadridge (Expense Group). Broadridge fee and expense data is based upon information
taken from each fund’s most recent annual report, which reflects historical asset levels that may be quite different from those currently existing, particularly in a period of market volatility. While recognizing such inherent limitation and the fact that expense ratios and Management Rates generally increase as assets decline and decrease as assets grow, the Board believed the independent analysis conducted by Broadridge to be an appropriate measure of comparative fees and expenses. The Broadridge Management Rate includes administrative charges, and the actual total expense ratio, for comparative consistency, was shown for Class A shares for funds with multiple classes of shares. The Board received a description of the methodology used by Broadridge to select the mutual funds included in an Expense Group.
The Expense Group for the Fund included the Fund and 16 other emerging markets funds. The Board noted that the Management Rate for the Fund was slightly above the median of its Expense Group. The Board also noted that the actual total expense ratio for the Fund was below the median and in the first quintile (least expensive) of its Expense Group. The Board concluded that the Management Rate charged to the Fund is reasonable.
Profitability
The Board reviewed and considered information regarding the profits realized by the Manager and its affiliates in connection with the operation of the Fund. In this respect, the Board considered the Fund profitability analysis provided by the Manager that addresses the overall profitability of FTI’s US fund business, as well as its profits in providing investment management and other services to each of the individual funds during the12-month period ended September 30, 2018, being the most recent fiscalyear-end for FRI. The Board noted that although management continually makes refinements to its methodologies used in calculating profitability in response to organizational and product-related changes, the overall methodology has remained consistent with that used in the Fund’s profitability report presentations from prior years. Additionally, PricewaterhouseCoopers LLP, auditor to FRI and certain Franklin Templeton funds, has been engaged by the Manager to periodically review and assess the allocation methodologies to be used solely by the Fund’s Board with respect to the profitability analysis.
The Board noted management’s belief that costs incurred in establishing the infrastructure necessary for the type of mutual fund operations conducted by the Manager and its
| | | | |
| | | |
32 | | Semiannual Report | | franklintempleton.com |
TEMPLETON DEVELOPING MARKETS TRUST
SHAREHOLDER INFORMATION
affiliates may not be fully reflected in the expenses allocated to the Fund in determining its profitability, as well as the fact that the level of profits, to a certain extent, reflected operational cost savings and efficiencies initiated by management. The Board also noted management’s expenditures in improving shareholder services provided to the Fund, as well as the need to implement systems and meet additional regulatory and compliance requirements resulting from recent SEC and other regulatory requirements.
The Board also considered the extent to which the Manager and its affiliates might derive ancillary benefits from fund operations, including revenues generated from transfer agent services, potential benefits resulting from personnel and systems enhancements necessitated by fund growth, as well as increased leverage with service providers and counterparties. Based upon its consideration of all these factors, the Board concluded that the level of profits realized by the Manager and its affiliates from providing services to the Fund was not excessive in view of the nature, extent and quality of services provided to the Fund.
Economies of Scale
The Board reviewed and considered the extent to which the Manager may realize economies of scale, if any, as the Fund grows larger and whether the Fund’s management fee structure reflects any economies of scale for the benefit of shareholders. With respect to possible economies of scale, the Board noted the existence of management fee breakpoints, which operate generally to share any economies of scale with the Fund’s shareholders by reducing the Fund’s effective management fees as the Fund grows in size. The Board considered the Manager’s view that any analyses of potential economies of scale in managing a particular fund are inherently limited in light of the joint and common costs and investments the Manager incurs across the Franklin Templeton family of funds as a whole. The Board concluded that, to the extent economies of scale may be realized by the Manager and its affiliates, the Fund’s management fee structure provided a sharing of benefits with the Fund and its shareholders as the Fund grows.
Conclusion
Based on its review, consideration and evaluation of all factors it believed relevant, including the above-described factors and conclusions, the Board unanimously approved the continuation of the Management Agreement for an additionalone-year period.
Proxy Voting Policies and Procedures
The Trust’s investment manager has established Proxy Voting Policies and Procedures (Policies) that the Trust uses to determine how to vote proxies relating to portfolio securities. Shareholders may view the Trust’s complete Policies online at franklintempleton.com. Alternatively, shareholders may request copies of the Policies free of charge by calling the Proxy Group collect at (954)527-7678 or by sending a written request to: Franklin Templeton Companies, LLC, 300 S.E. 2nd Street, Fort Lauderdale, FL 33301, Attention: Proxy Group. Copies of the Trust’s proxy voting records are also made available online at franklintempleton.com and posted on the U.S. Securities and Exchange Commission’s website at sec.gov and reflect the most recent12-month period ended June 30.
Quarterly Statement of Investments
The Trust files a complete statement of investments with the U.S. Securities and Exchange Commission for the first and third quarters for each fiscal year as an exhibit to its report on FormN-PORT. Shareholders may view the filed FormN-PORT by visiting the Commission’s website at sec.gov. The filed form may also be viewed and copied at the Commission’s Public Reference Room in Washington, DC. Information regarding the operations of the Public Reference Room may be obtained by calling(800) SEC-0330.
| | | | |
| | | |
| franklintempleton.com | | Semiannual Report | | 33 |
This page intentionally left blank.
This page intentionally left blank.
This page intentionally left blank.
Authorized for distribution only when accompanied or preceded by a summary prospectus and/or prospectus. Investors should carefully consider a fund’s investment goals, risks, charges and expenses before investing. A prospectus contains this and other information; please read it carefully before investing.
To help ensure we provide you with quality service, all calls to and from our service areas are monitored and/or recorded.
| | | | | | | | |
 | | | | Semiannual Report and Shareholder Letter Templeton Developing Markets Trust |
| | | | |
| | | | Investment Manager Templeton Asset Management Ltd. | | Distributor Franklin Templeton Distributors, Inc. (800) DIAL BEN®/342-5236 franklintempleton.com | | Shareholder Services (800)632-2301 |
| | |
© 2019 Franklin Templeton Investments. All rights reserved. | | 711 S 08/19 |
(a) The Registrant has adopted a code of ethics that applies to its principal executive officers and principal financial and accounting officer.
(c) N/A
(d) N/A
(f) Pursuant to Item 13(a)(1), the Registrant is attaching as an exhibit a copy of its code of ethics that applies to its principal executive officers and principal financial and accounting officer.
| Item 3. | Audit Committee Financial Expert. |
(a)(1) The Registrant has an audit committee financial expert serving on its audit committee.
(2) The audit committee financial expert is David W. Niemiec and he is “independent” as defined under the relevant Securities and Exchange Commission Rules and Releases.
| Item 4. | Principal Accountant Fees and Services. N/A |
| Item 5. | Audit Committee of Listed Registrants. N/A |
| Item 6. | Schedule of Investments. N/A |
| Item 7. | Disclosure of Proxy Voting Policies and Procedures forClosed-End Management Investment Companies. N/A |
| Item 8. | Portfolio Managers ofClosed-End Management Investment Companies. N/A |
| Item 9. | Purchases of Equity Securities byClosed-End Management Investment Company and Affiliated Purchasers. N/A |
| Item 10. | Submission of Matters to a Vote of Security Holders. |
There have been no changes to the procedures by which shareholders may recommend nominees to the Registrant’s Board of Trustees that would require disclosure herein.
| Item 11. | Controls and Procedures. |
(a) Evaluation of Disclosure Controls and Procedures. The Registrant maintains disclosure controls and procedures that are designed to provide reasonable assurance that information required to be disclosed
in the Registrant’s filings under the Securities Exchange Act of 1934, as amended, and the Investment Company Act of 1940 is recorded, processed, summarized and reported within the periods specified in the rules and forms of the Securities and Exchange Commission. Such information is accumulated and communicated to the Registrant’s management, including its principal executive officer and principal financial officer, as appropriate, to allow timely decisions regarding required disclosure. The Registrant’s management, including the principal executive officer and the principal financial officer, recognizes that any set of controls and procedures, no matter how well designed and operated, can provide only reasonable assurance of achieving the desired control objectives.
Within 90 days prior to the filing date of this Shareholder Report on FormN-CSRS, the Registrant had carried out an evaluation, under the supervision and with the participation of the Registrant’s management, including the Registrant’s principal executive officer and the Registrant’s principal financial officer, of the effectiveness of the design and operation of the Registrant’s disclosure controls and procedures. Based on such evaluation, the Registrant’s principal executive officer and principal financial officer concluded that the Registrant’s disclosure controls and procedures are effective.
(b) Changes in Internal Controls. There have been no changes in the Registrant’s internal control over financial reporting that occurred during the period covered by this report that has materially affected, or is reasonably likely to materially affect the internal control over financial reporting.
| Item 12. | Disclosure of Securities Lending Activities forClosed-End Management Investment Company. N/A |
(a)(1)Code of Ethics
(a)(2) Certifications pursuant to Section 302 of the Sarbanes-Oxley Act of 2002 of Matthew T. Hinkle, ChiefExecutive Officer - Finance and Administration, and Robert G. Kubilis, Chief Financial Officer and Chief Accounting Officer
(b)Certifications pursuant to Section 906 of the Sarbanes-Oxley Act of 2002 of Matthew T. Hinkle,Chief Executive Officer - Finance and Administration, and Robert G. Kubilis, Chief Financial Officer and Chief Accounting Officer
SIGNATURES
Pursuant to the requirements of the Securities Exchange Act of 1934 and the Investment Company Act of 1940, the registrant has duly caused this report to be signed on its behalf by the undersigned, thereunto duly authorized.
TEMPLETON DEVELOPING MARKETS TRUST
| | |
| By | | /S/ MATTHEW T. HINKLE |
| | Matthew T. Hinkle |
| | Chief Executive Officer – Finance and Administration |
| Date | | August 30, 2019 |
Pursuant to the requirements of the Securities Exchange Act of 1934 and the Investment Company Act of 1940, this report has been signed below by the following persons on behalf of the registrant and in the capacities and on the dates indicated.
| | |
| By | | /S/ MATTHEW T. HINKLE |
| | Matthew T. Hinkle |
| | Chief Executive Officer – Finance and Administration |
| Date | | August 30, 2019 |
| |
| By | | /S/ ROBERT G. KUBILIS |
| | Robert G. Kubilis |
| | Chief Financial Officer and Chief Accounting Officer |
| Date | | August 30, 2019 |