 Fourth Quarter Fiscal 2014 SWS Group Conference Call September 3, 2014 1 Filed by SWS Group, Inc. Pursuant to Rule 425 of the Securities Act of 1933 and deemed filed pursuant to Rule 14a-12 of the Securities Exchange Act of 1934 Subject Company: Hilltop Holdings, Inc. (Commission File No. for Registration Statement on Form S-4: 333-196367) The following Earnings Presentation was used in SWS Group, Inc.’s quarterly earnings conference call on Wednesday, September 3, 2014 at 10:00 a.m. Eastern Time (9:00 a.m. Central Time): |
 Forward-Looking Statements This presentation contains forward-looking statements. Readers are cautioned that any forward- looking statements, including those predicting or forecasting future events or results, which depend on future events for their accuracy, embody projections or assumptions, or express the intent, belief or current expectations of the company or management, are not guarantees of future performance and involve risks and uncertainties. Actual results may differ materially as a result of various factors, some of which are out of our control, including, but not limited to, volume of trading in securities, volatility and general level of securities prices and interest rates, liquidity in capital markets, availability of borrowings under broker loan lines, credit agreements and credit facilities, customer margin loan activity, credit-worthiness of our correspondents, trading counterparties and customers, the ability of our borrowers to meet their contractual obligations, the value of the collateral securing the loans that we hold, demand for real estate and investment banking services, general economic conditions, especially in Texas and New Mexico, changes in the commercial lending and regulatory environments, the ability to meet regulatory capital requirements, the failure to consummate or delay in consummating the proposed transaction with Hilltop Holdings Inc. (“Hilltop”) for other reasons, the risk that a regulatory approval that may be required for the proposed transaction is delayed, is not obtained or is obtained subject to conditions that are not anticipated, and other factors discussed in our most recent Annual Report on Form 10-K, Quarterly Report on Form 10-Q, and in our other reports filed with and available from the Securities and Exchange Commission. 2 |
 Use of Non-GAAP Measures (Slides 4, 8, 9 & 16) 3 SWS Group, Inc. (“SWS” or the “Company”) has included presentations of Fully Diluted Tangible Book Value Per Share (Slide #4 and #8), Adjusted Pre-tax Loss (Slide #9) and Adjusted Compensation Ratio (Slide #16). Fully Diluted Tangible Book Value Per Share reflects book value per share, less goodwill, assuming exercise of all the Company’s outstanding warrants and resulting repayment of the $100 million loan from Hilltop and Oak Hill. Adjusted Pre-tax Loss is income (loss) before income tax expense, excluding the impact of the valuation adjustment for the warrants held by Hilltop and Oak Hill, the impact of legal and financial advisory fee expenses associated with the proposed merger with Hilltop Holdings, Inc. and the impact of the loan loss recapture for the banking segment. The Adjusted Compensation Ratio is the ratio of commissions and other employee compensation to net revenues adjusted for the exclusion of interest expense on the $100 million loan from Hilltop and Oak Hill. Fully Diluted Tangible Book Value Per Share, Adjusted Pre-tax Loss and the Adjusted Compensation Ratio are non-GAAP financial measures as defined in Item 10(e) of Regulation S-K. SWS believes that the presentation of these non-GAAP financial measures provides useful information by excluding these items, which SWS believes may not be indicative of the Company’s core operating results. While management believes these non-GAAP financial measures are useful in evaluating SWS, this information should be considered as supplemental in nature and not as a substitute for, or superior to, the related financial information prepared in accordance with GAAP. |
 4 Fully Diluted Tangible Book Value (Non-GAAP)* *See discussion of Non-GAAP reconciliation on Slide #3 (in thousands) 6/30/14 6/30/13 Book Value 309,872 315,286 Less: Goodwill (7,552) (7,552) Tangible Book Value 302,320 307,734 Pro-forma Adjustments: New equity from full warrant exercise 100,000 100,000 Total recorded value of debt and warrants 115,565 107,299 Less: Extinguishment of debt and warrants (100,000) (100,000) Less: Unamortized debt issuance costs (1,025) (1,517) Embedded gain on exercise before tax 14,540 5,782 Less: Taxes (at 35%) (5,089) (2,024) Embedded gain after tax 9,451 3,758 Pro-forma Tangible Book Value 411,771 411,492 Shares Outstanding 32,757 32,629 Deferred compensation shares 311 302 Warrant shares 17,391 17,391 Pro-forma shares outstanding 50,459 50,322 Pro-forma Tangible Book Value per Share $8.16 $8.18 |
 Presenters Presenters: James H. Ross President & CEO SWS Group, Inc. J. Michael Edge SVP & CFO SWS Group, Inc. 5 |
 Agenda Opening Remarks Chief Financial Officer’s Report Questions 6 |
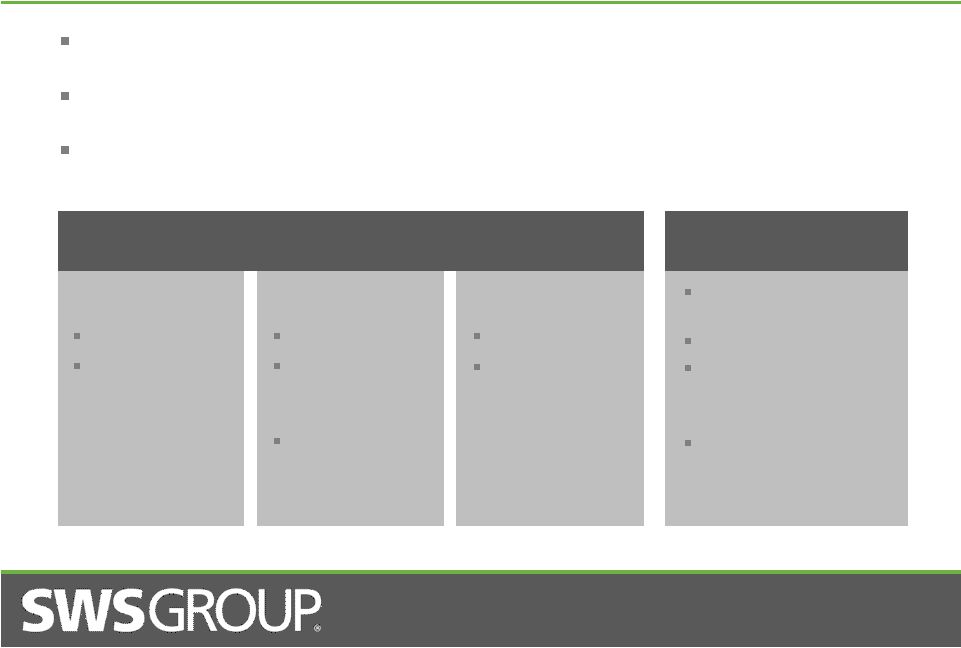 Opening Remarks Merger with Hilltop Holdings Business segments posted pre-tax profits for quarter and year Continued Bank improvement Broker (87% of Q4 Revenues) Bank (13% of Q4 Revenues) Retail 153 Reps $15.4 billion in customer assets Institutional 46 Reps $2.1 billion daily average stock loan book $7.3 billion municipal new issue volume Clearing 159,816 tickets $16.9 billion in assets under custody 2.91% net interest margin $1.3 billion in assets 25.5% total risk-based capital and 14.1 % core capital ratios $41.3 million classified assets including $22.9 million non-performing assets 7 |
 Fourth Quarter & Fiscal 2014 Overview 8 Three Months Ended Twelve Months Ended ($ in thousands, except per share amounts) 6/30/14 6/30/13 6/30/14 6/30/13 Revenues $73,822 $68,578 $311,288 $318,114 Net Revenues 63,207 55,445 266,362 271,653 Pre-tax Income (Loss) 637 (3,712) (6,110) (6,690) Net Loss (304) (32,452) (7,078) (33,445) Diluted EPS – Loss (0.01) (0.99) (0.21) (1.02) Book Value Per Share 9.46 9.66 Fully Diluted Tangible Book Value Per Share* 8.16 8.18 *See discussion of Non-GAAP reconciliation on Slides #3 and calculation on Slide #4 |
 9 Adjusted Pre-tax Loss (Non-GAAP)* *See discussion of Non-GAAP reconciliation on Slide #3 Three Months Ended Twelve Months Ended (in thousands) 6/30/14 6/30/13 Change 6/30/14 6/30/13 Change Income (loss) before income tax expense $ 637 $ (3,712) $ 4,349 $ (6,110) $ (6,690) $ 580 Valuation adjustment for warrants (3,237) (3,877) 640 3,599 (3,613) 7,212 Merger-related expenses 1,431 -- 1,431 3,787 -- 3,787 Loan loss recapture (492) (6,268) 5,776 (5,361) (7,718) 2,357 Adjusted Pre-tax Loss (Non-GAAP) $(1,661) $(13,857) $12,196 $(4,085) $(18,021) $13,936 |
 SWS Priorities 10 Improve operating results Address impact of challenging markets Continue improvement at Bank |
 11 Chief Financial Officer’s Report * * * * * * * |
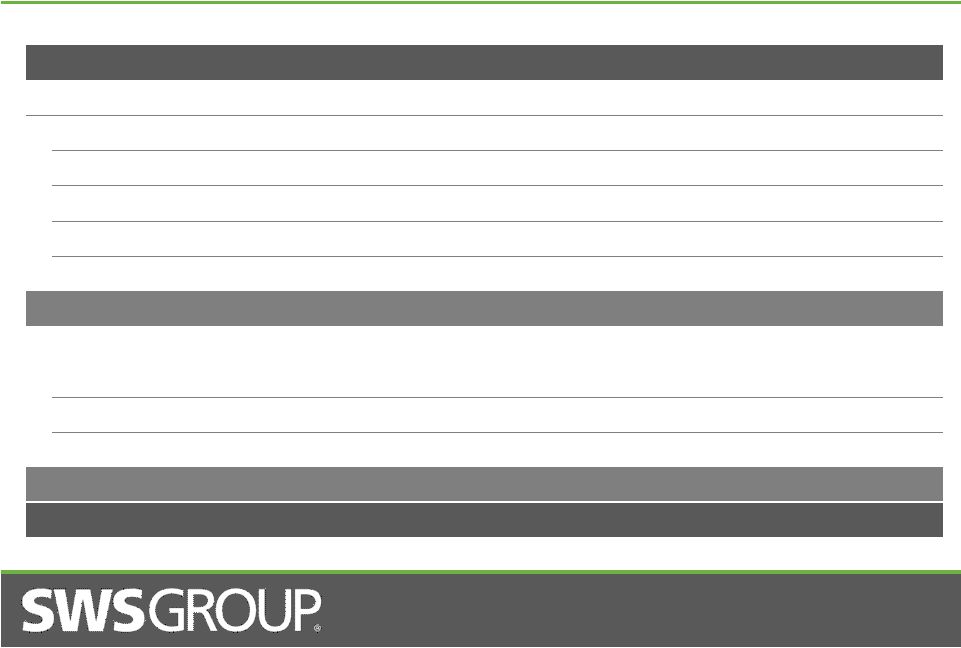 12 6/30/14 3/31/14 %Change 6/30/13 %Change Operating Revenues: Clearing Operations $ 2,163 $ 2,170 (0.3) $ 2,321 (6.8) Commissions 28,976 30,247 (4.2) 30,655 (5.5) Investment Banking & Advisory 8,918 9,704 (8.1) 13,894 (35.8) Net Gains on Principal Transactions 5,812 8,203 (29.1) (7,768) >100 Other 6,387 4,891 30.6 4,822 32.5 Total Operating Revenues $52,256 $55,215 (5.4) $43,924 19.0 Net Interest Income: Brokerage $ 5,300 $ 5,150 2.9 $ 5,406 (2.0) SWS Group, Inc. (3,255) (3,221) (1.1) (3,186) (2.2) Bank 8,906 8,530 4.4 9,301 (4.2) Total Interest Income 10,951 10,459 4.7 11,521 (4.9) Total Net Revenue $63,207 $65,674 (3.8) $55,445 14.0 Fourth Quarter Fiscal 2014 Net Revenues ($ in Thousands) |
 13 Fiscal 2014 Net Revenues ($ in Thousands) 12 Months Ended 6/30/14 6/30/13 Change % Change Operating Revenues: Clearing Operations $ 8,839 $ 8,719 $ 120 1.4 Commissions 119,534 125,620 (6,086) (4.8) Investment Banking & Advisory 40,021 45,255 (5,234) (11.6) Net Gains on Principal Transactions 29,655 17,395 12,260 70.5 Other 26,172 23,775 2,397 10.1 Total Operating Revenues $224,221 $220,764 $ 3,457 1.6 Net Interest Income: Brokerage $ 19,994 $ 21,773 $(1,779) (8.2) SWS Group, Inc. (12,967) (12,307) (660) (5.4) Bank 35,114 41,423 (6,309) (15.2) Total Interest Income 42,141 50,889 (8,748) (17.2) Total Net Revenue $266,362 $271,653 $(5,291) (1.9) |
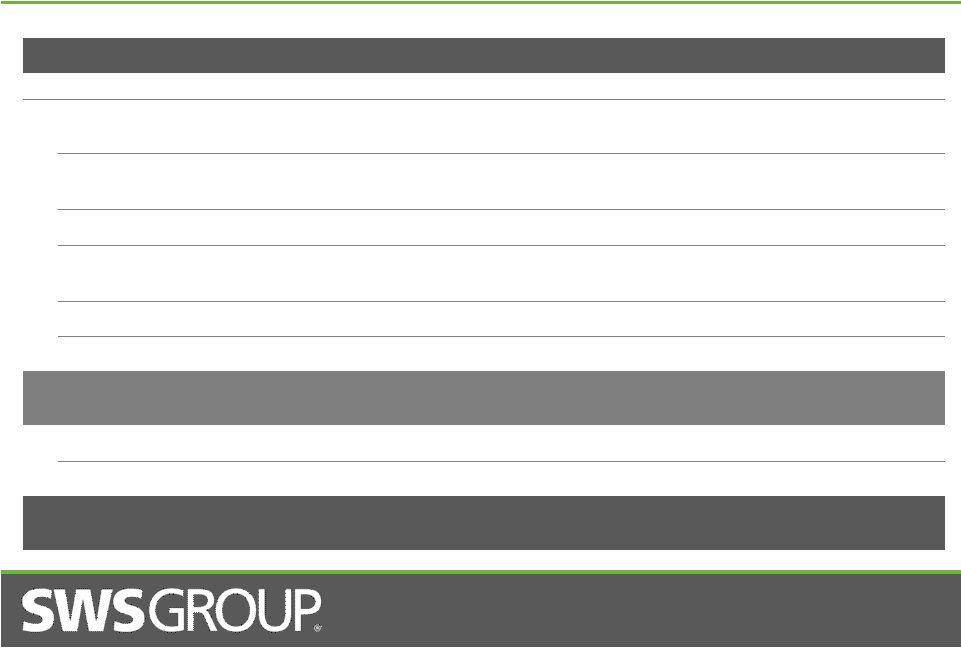 14 6/30/14 3/31/14 %Change 6/30/13 %Change Operating Expenses: Commissions and Other Employee Compensation $46,388 $48,753 (4.9) $48,908 (5.2) Occupancy, Equipment and Computer Service Costs 7,457 7,676 (2.9) 8,189 (8.9) Communications 3,341 3,384 (1.3) 3,352 (0.3) Floor Brokerage and Clearing Organization Charges 1,121 1,189 (5.7) 1,027 9.2 Advertising and Promotional 530 459 15.5 714 (25.8) Other 7,462 7,217 3.4 7,112 4.9 Total Non-provision Operating Expenses $66,299 $68,678 (3.5) $69,302 (4.3) Loan Loss Recapture (492) (1,578) (68.8) (6,268) (92.2) Valuation Adjustment for Warrants (3,237) 6,745 >100 (3,877) (16.5) Total Operating Expenses and Valuation Adjustment for Warrants $62,570 $73,845 (15.3) $59,157 5.8 Fourth Quarter Fiscal 2014 Expenses ($ in Thousands) |
 15 Fiscal 2014 Expenses ($ in Thousands) 12 Months Ended 6/30/14 6/30/13 Change %Change Operating Expenses: Commissions and Other Employee Compensation $196,470 $207,246 $(10,776) (5.2) Occupancy, Equipment and Computer Service Costs 30,614 31,278 (664) (2.1) Communications 13,435 13,277 158 1.2 Floor Brokerage and Clearing Organization Charges 4,495 3,940 555 14.1 Advertising and Promotional 2,251 3,041 (790) (26.0) Other 26,969 30,892 (3,923) (12.7) Total Non-provision Operating Expenses $274,234 $289,674 $(15,440) (5.3) Loan Loss Recapture (5,361) (7,718) 2,357 30.5 Valuation Adjustment for Warrants 3,599 (3,613) 7,212 >100 Total Operating Expenses and Valuation Adjustment for Warrants $272,472 $278,343 $ (5,871) (2.1) |
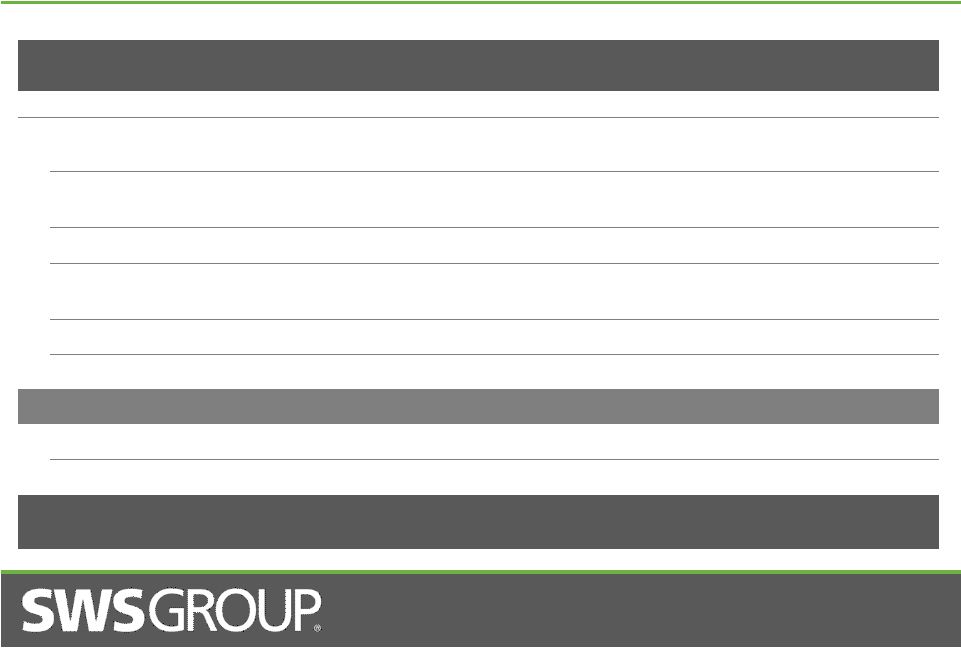
 16 Compensation Ratios ($ in Thousands) Three Months Ended 6/30/14 3/31/14 6/30/13 Commissions and Other Employee Compensation $46,388 $48,753 $48,908 Net Revenues $63,207 $65,674 $55,445 GAAP Compensation Ratio 73.4% 74.2% 88.2% Adjusted Compensation Ratio (Non-GAAP)*: Three Months Ended 6/30/14 3/31/14 6/30/13 Commissions and Other Employee Compensation $46,388 $48,753 $48,908 Net Revenues $63,207 $65,674 $55,445 Interest Expense on Hilltop/Oak Hill Loan $ 3,355 $ 3,310 $ 3,186 Adjusted Net Revenues (Non-GAAP)* $66,562 $68,984 $58,631 Adjusted Compensation Ratio (Non-GAAP)* 69.7% 70.7% 83.4% *See discussion of Non-GAAP reconciliation on Slide #3 |
 Warrant Valuation 6/30/14 3/31/14 6/30/13 Derived Volatility 28% 30% 51% Price $ 7.28 $ 7.48 $ 5.45 Valuation (in millions) $ 27.8 $ 31.0 $ 24.2 Adjustment (in millions) $ (3.2) $ 6.7 $ (3.9) 17 |
 Segment Results (In Thousands) 18 3 Months Ended % Change 12 Months Ended % Change 6/30/14 6/30/13 6/30/14 6/30/13 Clearing Net Revenues $ 5,151 $ 4,748 8.5 $ 20,244 $ 18,938 6.9 Pre-Tax $ 1,195 $ 56 >100 $ 3,286 $ (481) >100 Retail Net Revenues $26,826 $28,453 (5.7) $112,457 $110,440 1.8 Pre-Tax $ 1,984 $ 1,343 47.7 $ 9,593 $ 2,498 >100 Institutional Net Revenues $25,094 $16,329 53.7 $108,211 $107,947 0.2 Pre-Tax $ 5,275 $(3,229) >100 $ 23,515 $ 20,866 12.7 Bank Net Revenues $ 9,205 $10,157 (9.4) $ 37,051 $ 44,101 (16.0) Pre-Tax $ 2,168 $ 7,303 (70.3) $ 10,754 $ 12,742 (15.6) |
 Key Metrics 19 6/30/14 3/31/14 %Change 6/30/13 %Change Clearing Transactions Processed 159,816 186,059 (14.1) 197,423 (19.0) Representatives: PCG 153 157 (2.5) 167 (8.4) Fixed Income 46 50 (8.0) 64 (28.1) Independent Contractors 278 279 (0.4) 297 (6.4) Correspondents 141 145 (2.8) 151 (6.6) Total Loan Officers 20 22 (9.1) 32 (37.5) Total Employees 892 923 (3.4) 1,055 (15.5) Retail Client Assets ($ in billions) $15.4 $15.0 2.7 $14.3 7.7 Balances ($ in millions): Avg. Margin Balances $236.9 $238.9 (0.8) $232.2 2.0 Avg. Credit Balances $317.9 $335.5 (5.2) $309.7 2.6 Avg. Stock Loan Balances $2,106.8 $1,914.3 10.1 $1,648.7 27.8 Net Capital ($ in millions) $156.4 $148.2 5.5 $141.1 10.8 |
 Classified Assets 20 ($ in Thousands) 6/30/14 3/31/14 6/30/13 Non-accrual Loans $14,321 $14,388 $22,446 Performing Troubled Debt Restructurings 3,673 4,819 5,349 REO & Other Repossessed Assets 4,875 5,880 10,165 Total Non-performing Assets $22,869 $25,087 $37,960 Current Classified Assets 18,466 15,835 29,610 Total Classified Assets $41,335 $40,922 $67,570 Non-performing Assets / Assets 1.82% 1.98% 2.99% Classified Assets / Capital + Reserve 22.7% 22.9% 37.4% |
 Key Bank Statistics – Fourth Quarter Fiscal 2014 21 ($ in Thousands) 6/30/14 3/31/14 6/30/13 Total Loan Loss Recapture $(492) $(1,578) $ (6,268) Net Recovery / (Charge-offs) 342 222 (155) Allowance for Loan Losses 7,942 8,092 12,343 Reserve / Loan Ratio* 1.82% 1.83% 2.85% Yield on Earning Assets 3.10% 3.02% 3.23% Cost of Funds 0.23% 0.27% 0.29% Net Interest Margin 2.91% 2.79% 2.99% *Excludes purchased mortgage loans held for investment and loans measured at fair value |
 Bank Balances 22 ($ in Millions) 6/30/14 3/31/14 %Change 6/30/13 %Change Investment Portfolio $ 514.6 $ 596.9 (13.8) $ 529.1 (2.7) Loans Held for Investment – Gross 622.3 566.1 9.9 620.9 0.2 Total Core Deposits 1,000.6 995.9 0.5 993.9 0.7 Capital 174.1 170.3 2.2 168.2 3.5 Core Capital 14.1% 13.9% 13.5% Total Risk-based Capital 25.5% 27.4% 24.9% Deposits Provided by Brokerage Clients $ 873.1 $ 878.3 (0.6) $ 878.4 (0.6) |
 Bank Loans by Type 23 ($ in Millions) 6/30/14 3/31/14 %Change 6/30/13 %Change Residential Real Estate Purchased Mortgage – HFI $ 133.9 $ 72.5 84.7 $ 174.0 (23.0) 1-4 Family 83.3 92.4 (9.8) 59.9 39.1 Construction Residential Construction 0.6 0.8 (25.0) 1.4 (57.1) Commercial Construction 9.7 5.5 76.4 1.7 >100 Lot & Land Development Residential Land 1.6 0.6 >100 3.1 (48.4) Commercial Land 3.6 5.4 (33.3) 5.9 (39.0) Commercial Real Estate 183.6 182.8 0.4 214.4 (14.4) Multi-family 141.1 133.7 5.5 99.8 41.4 Commercial Loans 61.4 69.7 (11.9) 58.7 4.6 Consumer Loans 3.5 2.7 29.6 2.0 75.0 Total Loans $ 622.3 $ 566.1 9.9 $ 620.9 0.2 |
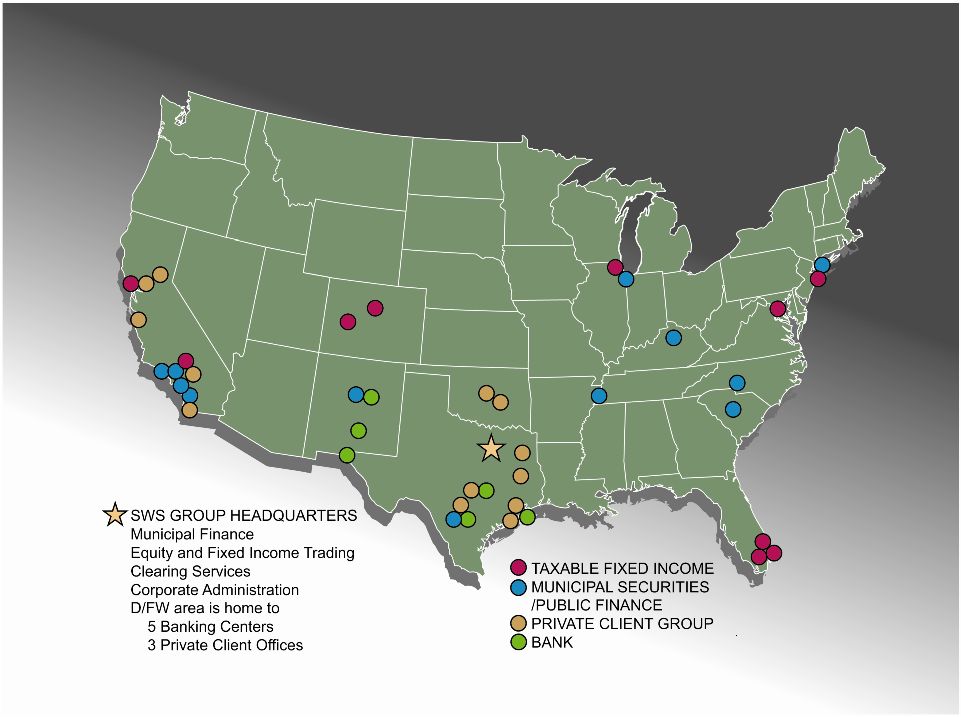 SWS Office Locations 24 |
 25 Important Information for Investors & Shareholders This communication does not constitute an offer to sell or the solicitation of an offer to buy any securities or a solicitation of any vote or approval, nor shall there be any sale of securities in any jurisdiction in which such offer, solicitation or sale would be unlawful prior to registration or qualification under the securities laws of such jurisdiction. Hilltop has filed with the Securities and Exchange Commission (“SEC”) a registration statement on Form S-4 containing a proxy statement/prospectus of SWS and Hilltop, and SWS and Hilltop will each file other documents with respect to the proposed transaction and a definitive proxy statement/prospectus will be mailed to shareholders of SWS after the registration statement on Form S-4 has been declared effective. INVESTORS AND SECURITY HOLDERS OF SWS ARE URGED TO READ THE PROXY STATEMENT/PROSPECTUS AND OTHER DOCUMENTS THAT WILL BE FILED WITH THE SEC CAREFULLY AND IN THEIR ENTIRETY WHEN THEY BECOME AVAILABLE BECAUSE THEY WILL CONTAIN IMPORTANT INFORMATION. Investors and security holders of SWS will be able to obtain free copies of the registration statement and the proxy statement/prospectus (when available) and other documents filed with the SEC by SWS or Hilltop through the website maintained by the SEC at www.sec.gov. Copies of the documents filed with the SEC by SWS will be available free of charge on SWS’s internet website at www.swst.com or by contacting SWS’s Investor Relations Department at (214) 859-1800. Copies of the documents filed with the SEC by Hilltop will be available free of charge on Hilltop’s internet website at www.hilltop-holdings.com or by contacting Hilltop’s Investor Relations Department at (214) 252-4029. SWS, Hilltop, their respective directors and certain of their executive officers and other members of management and employees may be considered participants in the solicitation of proxies in connection with the proposed transaction. Information about the directors and executive officers of SWS is set forth in its Annual Report on Form 10-K for the year ended June 30, 2013, which was filed with the SEC on September 6, 2013, its proxy statement for its 2013 annual meeting of shareholders, which was filed with the SEC on October 3, 2013, and its Current Reports on Form 8-K, which were filed with the SEC on September 17, 2013 and October 1, 2013. Information about the directors and executive officers of Hilltop is set forth in its most recent proxy statement, which was filed with the SEC on May 2, 2014. Other information regarding the participants in the proxy solicitations and a description of their direct and indirect interests, by security holdings or otherwise, will be contained in the proxy statement/prospectus and other relevant materials to be filed with the SEC when they become available. |
 26 Questions & Answers * * * * * * * |